International College Hong Kong - COMPASS GROUP HONG KONG ...
Upload
oliver-lau-pmpCategory
view
2.874download
0
Hong Kong Mobile Adver0sing Sta0s0cs & Trends
2016 Quarter1

Vpon Ad Inventory in Asia Pacific Vpon reaches 12+ billion biddable inventory per day in Asia Pacific. In Greater China region we receive 7+ billion daily ad requests, reach over 100,000+ Chinese Apps and 450 million unique devices per month.
Daily Biddable Inventory
<billion>
Vpon - Leading Mobile Branding Advertising Expert for More than 1,500 Advertisers

360 Mobile Marketing Solution Premium Media Resource, Best Coverage in Asia

Content A.I Performance Solution for M-Commerce at Best ROI Hong Kong Mobile Market Users Behavioral Pattern

A.I Performance Solution for M-Commerce at Best ROI

Rising Stars of E-Commerce APAC E-Commerce is undertaking a rocket speed growth and will soon outpace worldwide average.
Retail E-Commerce Sales in APAC and Worldwide

Rising Stars of E-Commerce India, Indonesia and China are expected to be stars in E-commerce race.
Fast Grow Region on E-Commerce From 2014-2018 [billions (USD)]

Mobile Commerce in Hong Kong
Hong Kong’s User Penetration in M-Commerce
Hong Kong as an open market enjoys the advantages of facing international E-commerce opportunity and by looking at the users’ online purchase behavior, it shed lights on the significant increase in mobile commerce penetration in Hong Kong in the coming years.
Source: Unique User -‐ Vpon
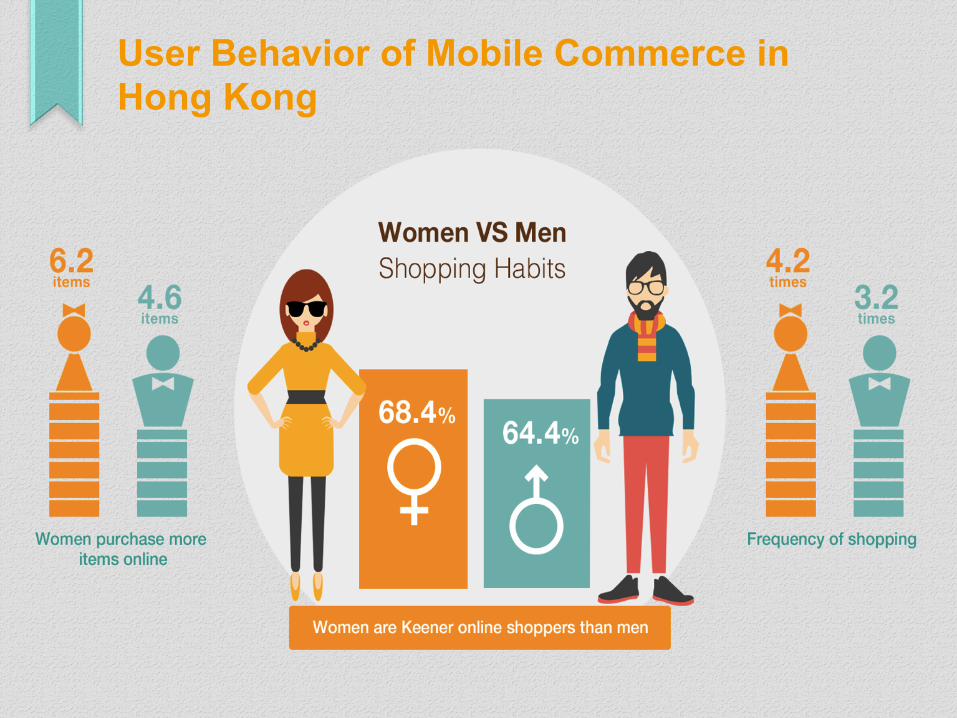
User Behavior of Mobile Commerce in Hong Kong

User Behavior of Mobile Commerce in Hong Kong
HK ONLINE SHOPPER VS US SHOPPER

Artificial Intelligence for The Best ROI
The beauty of M-Commerce marketing strategies lies in the finding the sweet spot of marketing budget so that the business can grow at scale, speed and manageable profit margin
Mobile channels for reaching M-commerce customer become more and more fragmented and it increase the complexity of the mobile user behavior. Powerful tool with artificial intelligence becomes critical to standout from the rivalry.
Cost VS Revenue AI

360 Monetization Solutions
Looking for enlarging customer base at the best ROI and Then you will need to look at Customer Acquisition Cost(CAC) and the Life Time Value(LTV).
Looking for driving repurchase of your existing customers to increase the purchase and order amount in a period of time. Then you will be looking at the Cost Per Order(CPO) and Average Order Value(AOV)
New User Acquisition Existing User Re-purchase

Bidding Engine in Artificial Intelligence approach to offer you the best programmatic ROI
Bidding Engine is a real time automatic optimization process that learns according to the conversion pattern for the best bidding ROI in the context of programmatic ad trading. Each campaign is unique and we will have to find the golden rule for real time bidding in the two aspect: Data Mining and Machine Learning
Data Mining Machine Learning

Data Mining: Programmatic Targeting Data is the nutrients for learning and the below highlight the key parameters for programmatic optimization

Machine Learning: Self-Evolving Optimization
The approach may varies on demand according to specific campaign, and algorithm of classification, clustering, association detection, dimension reduction, anomaly detection and regression are involved

Hero Audience Find your hero audience who are most have the highest conversion motivation and they are the key members to drive you more revenue

Optimization Roadmap The A.I optimization happens in four phases and once the machine started roll, we can kick back and observe the changes. In order to capture the best result by maximizing the ROI, the spending should sync with the conversion rate until saturated

Fast Fashion E-Commerce Case Study 1 :

Power of Machine Learning Reaching more new potential customers with the same marketing budget

Highlight of Tactic- Dynamic Creative Strategy
Dynamic creative strategy was mainly constructed by two parts – performance (CVR in this case) and bidding price. The machine has learnt that the conversion rate of each audience type towards a creative were varied. Hence, different creative would be only delivered to those audience type who were more likely to have high conversion rate. At the same time, real-time bidding price was automatically adjusted to target the high potential audience type, ensuring the ad was successfully exposed to them.

Performance Customer Acquisition Cost (CAC)

Sport E-Commerce Case Study 2 :
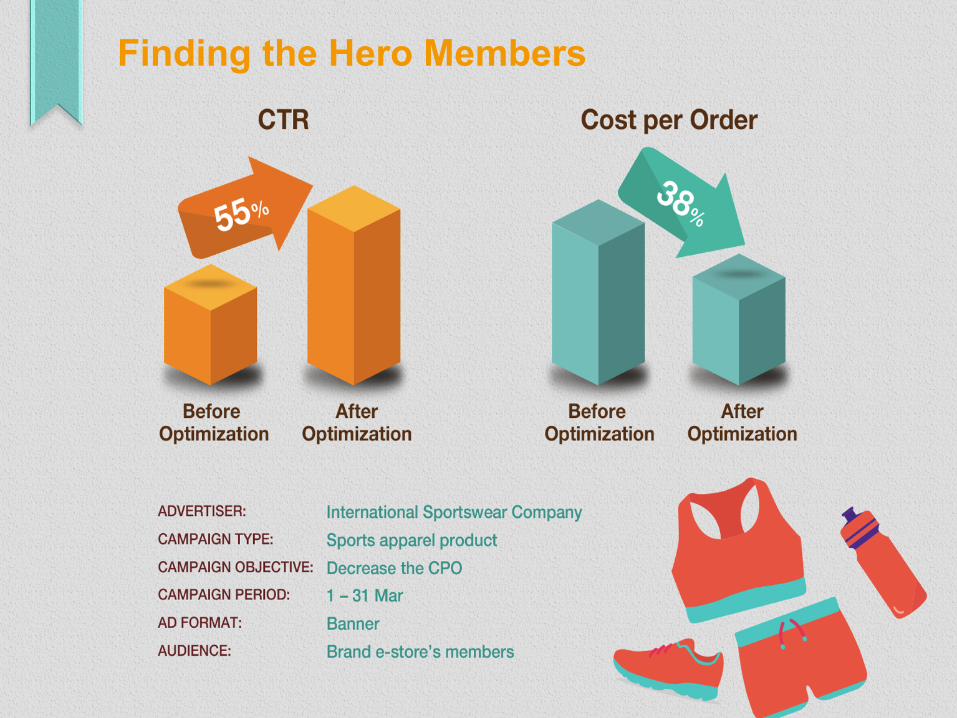
Finding the Hero Members

Highlight of Tactic – RFM Analysis To allocate more resources to retain high value customers, RFM analysis was adopted to analyze which group of members were worth-spending to.

Performance
Decrease Cost per Order

Hong Kong Mobile Market

Unique Users Reached Number of monthly active unique mobile users reached by Vpon is 6M+ In general. Due to the festive activities in January and February, more travelers in Hong Kong were found in terms of mobile devices.

Android vs iOS: 68.5% Android
Hong Kong market is dominated by Android phones with more than 2/3 of market share.

46.6% Phablet Phablet (screen size between 5.3” to 6.9”) dominates among Android users. More iOS users prefer phone screen size than phablet screen size.

46.6% Phablet Phablet (screen size between 5.3” to 6.9”) dominates among Android users. More iOS users prefer phone screen size than phablet screen size.

Top 10 Devices: iPhone 6 Top 10 are dominated by Apple and Samsung with iPhone 6 the most popular phone model in the mobile market.
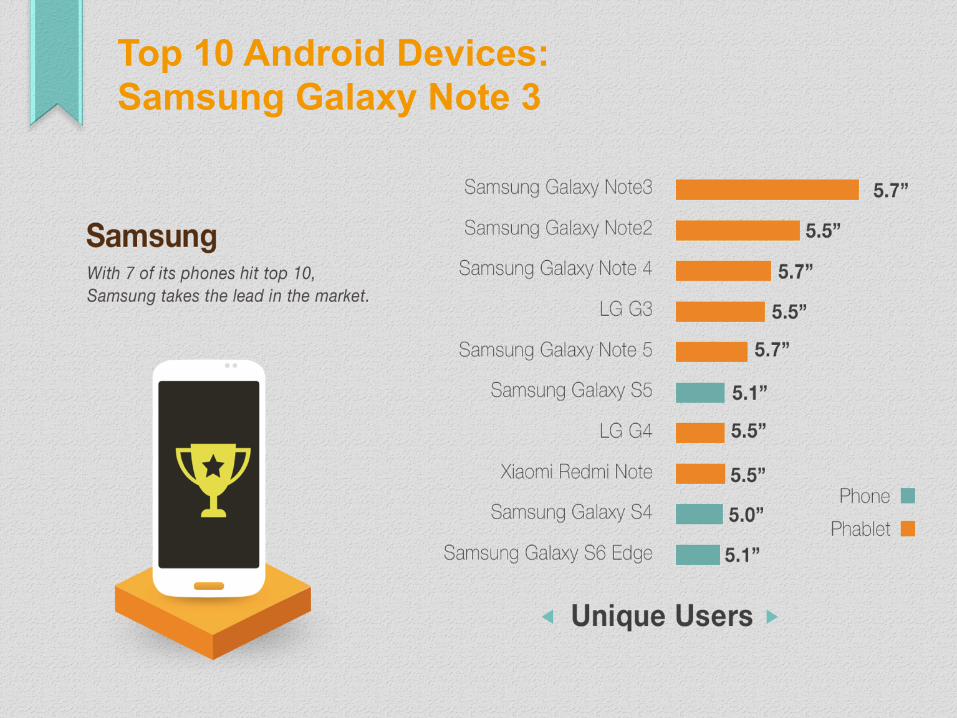
Top 10 Android Devices: Samsung Galaxy Note 3

iOS Devices: 64% iPhone 6/6+ iPhone 6 & 6 plus remains the two most popular Apple products.

Mobile Browsers: Chrome 43.8% Chrome is the most popular mobile browser among Android users.
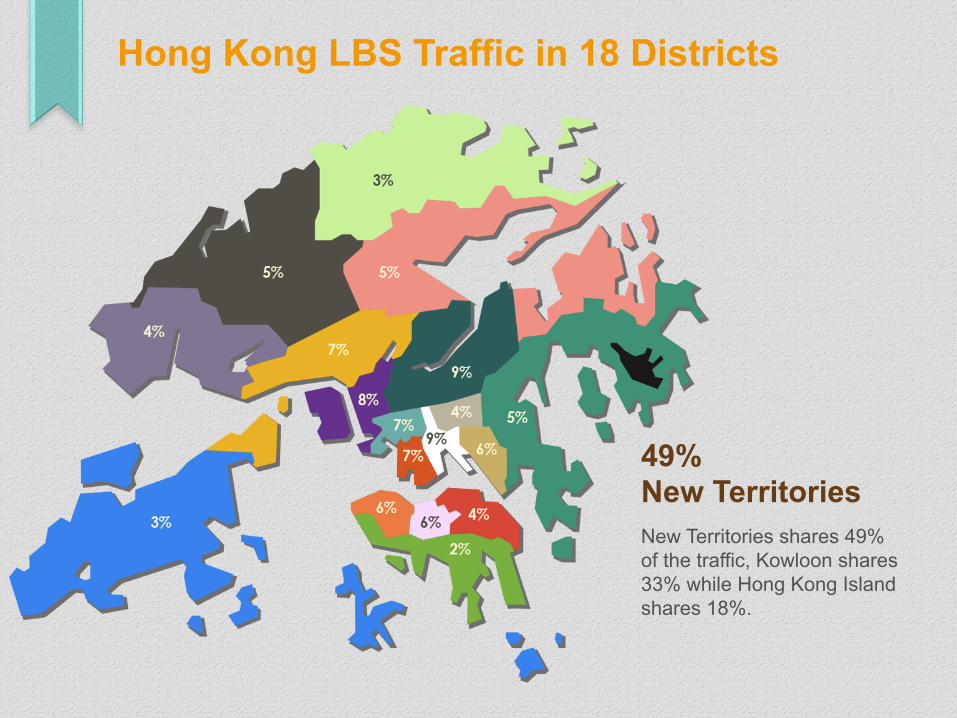
Hong Kong LBS Traffic in 18 Districts
49% New Territories New Territories shares 49% of the traffic, Kowloon shares 33% while Hong Kong Island shares 18%.

Network Operators: csl. 38.1% Hong Kong market is divided by the four strong players with csl. takes the lead.

Users Behavioral Pattern

Wifi vs Cellular: 60.3% Wifi Users prefer using wifi than cellular.

Mobile Internet Access Wifi is more preferred when using video, technology and finance apps. More cellular are used for life and news apps.
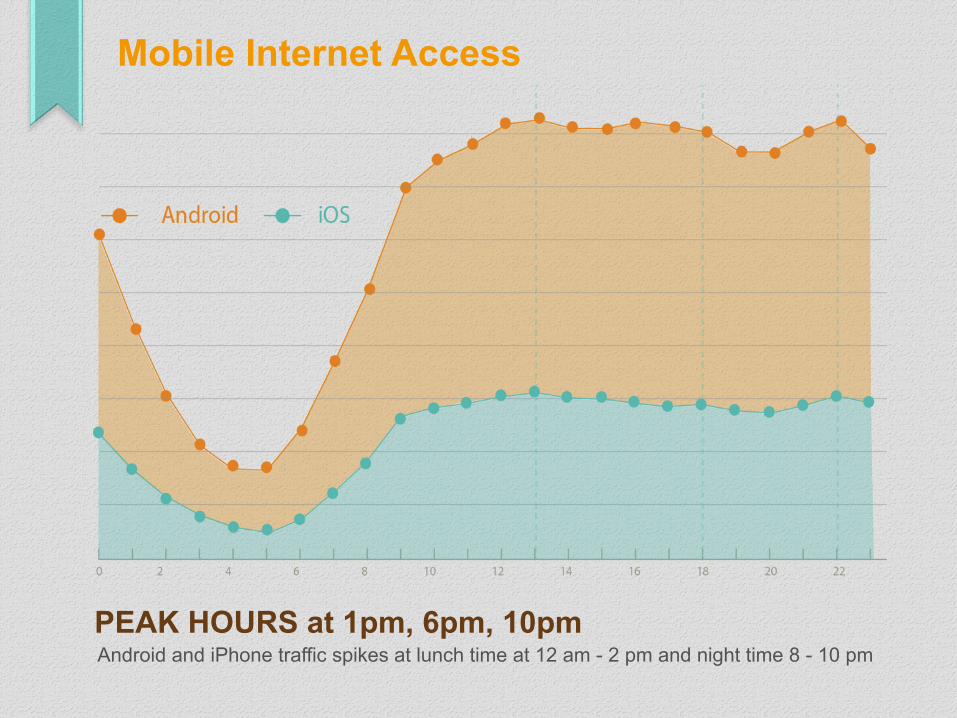
Mobile Internet Access
PEAK HOURS at 1pm, 6pm, 10pm Android and iPhone traffic spikes at lunch time at 12 am - 2 pm and night time 8 - 10 pm

Android Apps Categories Traffic
Finance, news & videos app categories are top three among users. The popularity of finance and news apps is highly related to the unrest stock market.

iPhone Apps Categories Traffic
Similar to Android, videos & finance apps take the largest share with news apps follow up. The fluctuation of the stock market contributes to the growth of finance apps.

For publishers:[email protected] For advertisers:[email protected]
Call us at +852 2748 7376 for more informa0on
www.vpon.com