2016 Private Equity Outlook - County of Fresno€¦ · Private Equity Outlook ... future returns by...
37
JULY 2016 Private Equity Outlook
Transcript of 2016 Private Equity Outlook - County of Fresno€¦ · Private Equity Outlook ... future returns by...

JULY 2016Private Equity Outlook
VERUSINVESTMENTS.COM
SEATTLE 206‐622‐3700LOS ANGELES 310‐297‐1777
SAN FRANCISCO 415‐362‐3484
Table of contents
2
Executive summary 3
Drive towards increased transparency
7
Market update: United States
11
Market update: Europe 15
Market update: Other 19
Historical returns by geography & approach
25

Executive summary
July 2016Private Equity Outlook 3

Manger selection continues to drive performance in private equity
July 2016Private Equity Outlook
PRIVATE EQUITY IS INCREASINGLY MORE EFFICIENT IN THE U.S.
Historically, private equity investment has generated higher returns relative to public markets. Over the last 10‐year period, U.S. private equity outperformed the Russell 3000 by 3.9% per year. While significant, outperformance has declined from 6.5% per year over the last 20‐year period indicating market efficiencies.
Notwithstanding the trajectory towards increased market efficiency, we continue to see significant dispersion in manager returns in venture capital / growth and buyout. Thus, regardless of market behavior, we believe that careful manager selection will continue to drive portfolio performance in private equity.
INTERNATIONAL EXPOSURE IN PRIVATE EQUITY CAN CREATE MORE RESILIENT PORTFOLIOS
As in the U.S., private equity investments in Europe and Asia have produced higher relative returns to their respective public markets. Yet, the performance is more robust given the wider margins and stability of outperformance over the last 10‐ and 20‐year periods (9.7% and 9.2% in Asia, 7.3% and 7.7% in Europe).
4
WE BELIEVE THAT SIGNIFICANT TACTICAL SHIFTS IN A PORTFOLIO ARE NOT EASILY DEPLOYED
Private equity is a long term asset class. Funds deploy capital into new investments over a three‐ to five‐year period. After investment, portfolio companies are held for a period of four to seven years on average prior to exit. This typical investment course drives discrete fund lives to often last beyond 10 years, during which significant changes can occur. To address this phenomenon, investors generally “average in” to the market by building portfolios of discrete private equity funds over multiple vintage years.
Our top‐down review of the asset class incorporates current trends with significant shifts that potentially impact returns over the long term.
REDUCING COSTS TO OPTIMIZE RETURNS
We advise institutional investors with adequate size to adopt an implementation approach whereby the bulk of their commitments are invested directly into funds, rather than through fund‐of‐funds. For larger and experienced investors, other options to reduce fees include negotiating preferential terms with investment managers, as well as co‐investments into portfolio companies on a no‐ or reduced‐fee and carry basis. For smaller clients, a potentially lower cost alternative to fund‐of‐funds can be dedicated secondary funds.
Verus private equity philosophy Outlook
Observations driving Verus outlook
July 2016Private Equity Outlook 5
TRENDS INDICATE MIXED RESULTS FOR BUYOUTS
Current market trends point towards downward pressure on future U.S. buyout returns.
The outlook for European buyout returns is more mixed. While pricing is more stable and attractive at 9.2x EBITDA than in the U.S., record setting capital raised by European managers has led pricing to increase by approximately 2x EBITDA from 2006‐07 pricing levels.
LATE‐STAGE VENTURE CAPITAL REMAINS NEGATIVE
Unicorns (privately held companies valued above $1 billion) continue to dominate the news cycles. Some companies have clearly created innovative products with economic benefits for early investors. But investors in late‐stage financing rounds have paid up for growth and have no clear exit with the down IPO market.
While we are positive on the prospects of proven and disciplined early‐stage venture managers, we take note that frothy late stage valuations have driven up the values of unrealized portfolio companies broadly.
ASIA BUILDING AN INSTITUTIONAL MARKET
Over the last 10‐year period, Asian private equity has outperformed returns in the U.S. and Europe. While market dynamics vary widely across the region by country, Asia is an increasingly institutional market, as evidenced by a buildup of capital targeting the region, some $160 billion.
DEDICATED SECONDARY FUND AS A STRAIGHTFORWARD OPTION FOR EUROPEAN EXPOSURE
Transaction volume persists at near record levels ($40 billion), with pricing generally in the high‐80s, close to record levels post‐GFC. That said, we highlight the 10‐ and 20‐year returns of European secondary funds: 10.6% and 13.0% per year, respectively; nearly in line with returns from direct investment in European funds: 10.7% and 14.0%. U.S. secondaries are a potentially viable option relative to fund of funds.
PRIVATE EQUITY FACING SCRUTINY THAT COMES WITH MATURITY
Continued maturing of private equity as an asset class has led to increased scrutiny of GPs by regulatory bodies, as well to LPs seeking ways to optimize future returns by reducing fees, both pre‐investment when negotiating terms and post‐investments via co‐investment activities.
Summary of findings
July 2016Private Equity Outlook 6
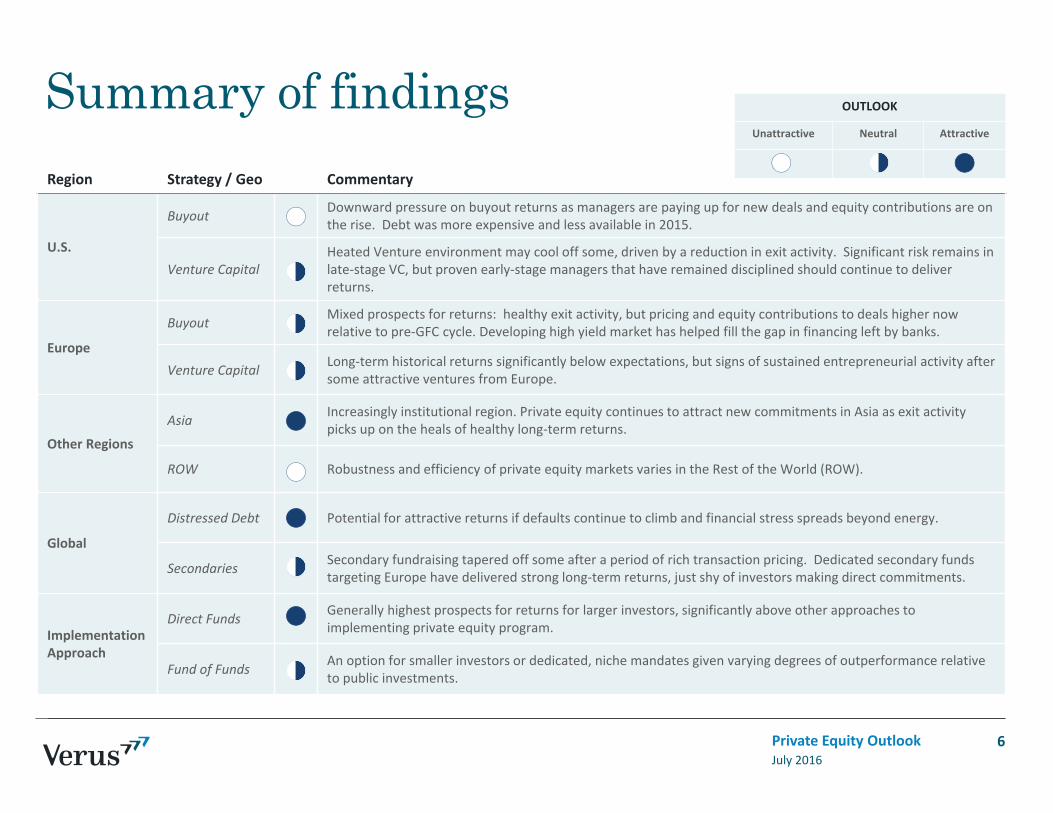
OUTLOOK
Unattractive Neutral Attractive
Region Strategy / Geo Commentary
U.S.
Buyout Downward pressure on buyout returns as managers are paying up for new deals and equity contributions are on the rise. Debt was more expensive and less available in 2015.
Venture CapitalHeated Venture environment may cool off some, driven by a reduction in exit activity. Significant risk remains in late‐stage VC, but proven early‐stage managers that have remained disciplined should continue to deliver returns.
Europe
Buyout Mixed prospects for returns: healthy exit activity, but pricing and equity contributions to deals higher now relative to pre‐GFC cycle. Developing high yield market has helped fill the gap in financing left by banks.
Venture Capital Long‐term historical returns significantly below expectations, but signs of sustained entrepreneurial activity after some attractive ventures from Europe.
Other Regions
Asia Increasingly institutional region. Private equity continues to attract new commitments in Asia as exit activity picks up on the heals of healthy long‐term returns.
ROW Robustness and efficiency of private equity markets varies in the Rest of the World (ROW).
Global
Distressed Debt Potential for attractive returns if defaults continue to climb and financial stress spreads beyond energy.
Secondaries Secondary fundraising tapered off some after a period of rich transaction pricing. Dedicated secondary fundstargeting Europe have delivered strong long‐term returns, just shy of investors making direct commitments.
Implementation Approach
Direct Funds Generally highest prospects for returns for larger investors, significantly above other approaches to implementing private equity program.
Fund of Funds An option for smaller investors or dedicated, niche mandates given varying degrees of outperformance relative to public investments.
Drive toward increased transparency
July 2016Private Equity Outlook 7

Need for increased transparency
Regulatory activity
— Dodd‐Frank Act required non‐VC private fund advisers with more than $110‐150 million AUM to register with the SEC by Q1 2012.
— October 2012, the SEC’s Office of Compliance Inspections and Examinations began its Presence Exam Initiative to assess the private equity industry’s business model.
― Areas of concern for the SEC:
Payments to consultants of portfolio companies
Expenses shifted from a fund manager to the fund
Hidden fees
July 2016Private Equity Outlook
Findings
— A number of private equity firms have faced enforcement action due to improper fees being levied or collected by General Partners.
Not allocating “broken deal fees” properly
Accelerated “monitoring fees” charged to portfolio companies
Accepting disparate legal fee discounts.
8
Source: Dow Jones, SEC.gov
SEC has examined disclosure of fee and expense allocations to private equity investors

Industry reacts to regulatory oversight
Industry reaction to scrutiny on fees:
― Re‐evaluation of expense allocation policies and procedures
― Increased transparency on fees charged to portfolio companies
― Heightened internal reviews to adhere to regulatory and investor expectations
Top SEC examination priorities for 2016:
― Cybersecurity
― Performance metrics and valuation disclosures in marketing materials
― “Zombie fund” restructurings
9July 2016Private Equity Outlook
SEC oversight continues

Verus endorses ILPA’s initiatives
― The proposed template is aimed to establish more robust and consistent standards for fee and expense reporting.
― Currently there are no enforceable guidelines for itemized fee and expense details from GPs. In 2015, comptrollers and treasurers from multiple states requested the SEC to demand private‐equity funds make disclosures of fees and expenses more frequently.
― The expectation for GPs to adopt the reporting template is gaining traction and two large managers (TPG and Carlyle) have endorsed it.
― The transparency and understanding around the economics of funds will help the industry overall and align GP and LP interests towards maximizing profit rather than fee generation.
Nearly 100 organizations were involved in the creation of the ILPA reporting template including LPs, fund administrators, advisers, and industry participants
10
Source: ILPA
July 2016Private Equity Outlook
Initiative recently released a reporting template in response to the lack of adequate fee disclosures

Market update: United States
July 2016Private Equity Outlook 11

NEW ISSUANCES OF U.S. LBO LOANS AND HIGH YIELD ($B)
BOFA MERRILL LYNCH US HIGH YIELD OPTION‐ADJUSTED SPREAD CREDIT RATIOS
Lower debt issuance slows buyouts
July 2016Private Equity Outlook 12
$0$100$200$300$400$500$600$700$800
'06 '07 '08 '09 '10 '11 '12 '13 '14 '15
LBO Loans High Yield0
100200300400500600700800900
1,000
'11 '12 '13 '14 '15
0.0x1.0x2.0x3.0x4.0x5.0x6.0x7.0x
'01 '03 '05 '07 '09 '11 '13 '15
Debt / EBITDAEBITDA / Cash InterestEBITDA ‐ Mainten. Capex / Interest
New debt issuances declines as appetite for riskier debt abates. While spreads have widened, interest coverage (EBITDA/Cash Interest) is above its 10 year rolling average suggesting that companies have ample ability to make interest payments.
—New issuance volume: New issuances of U.S. LBO loans and high yield totaled $472 billion in 2015, a decrease of 15% from prior year. New issuance volume is below its all time peak reached in 2013 of $677 billion.
— Spreads: U.S. high yield spreads continue to widen reaching 695 bps at the end of the year. The last time spreads had hit this level was in 2012.
— LBO terms: Total leverage (Debt/EBITDA) declined to 5.61x versus 5.73x in 2014. Interest coverage (EBITDA/Cash Interest) continued to exhibit healthy levels at 3.06x, more than its 10 year rolling average of 2.9x.
Source: S&P/LCD Source: FRED Source: S&P LCD
U.S. performing credit

U.S. BUYOUT DRY POWDER ($B)U.S. BUYOUT PRICING MULTIPLES AND EQUITY CONTRIBUTION
AGGREGATE U.S. BUYOUT EXIT VALUE VS. CAPITAL INVESTED ($B)
Equity contributions pressure returns
July 2016Private Equity Outlook 13
$0
$50
$100
$150
$200
$250
$300
'06 '07 '08 '09 '10 '11 '12 '13 '14 '15
$0$50
$100$150$200$250$300$350$400$450
'06 '07 '08 '09 '10 '11 '12 '13 '14 '15
Exit Value Capital Invested
0.0x
2.0x
4.0x
6.0x
8.0x
10.0x
12.0x
0.00%
10.00%
20.00%
30.00%
40.00%
50.00%
60.00%
'02 '04 '06 '08 '10 '12 '14
Total Equity Contribution Purchase Price Multiple
Dry powder for U.S. buyout firms continue to increase resulting in record high purchase prices. This coupled with increasing equity contributionswill likely place downward pressure on future returns.
— Capital overhang: While below its all time high in 2009 of $268 billion, U.S. buyout dry powder increased by 6% to $260 billion in 2015 from $245 billion 2014.
— Pricing multiples: Average purchase multiples hit all‐time highs of 10.26x in 2015. However, with overall leverage not increasing, much of the price expansion was facilitated by equity contributions which averaged 42.37% per transaction. The combination of record high multiples and increasing equity contributions are likely to negatively impact future returns.
— Exit activity: U.S. buyout aggregate exit value equaled $218 billion for 2015, a slight decrease from $220 billion recorded last year. Capital Invested equaled $255 billion, an increase from $189 billion invested last year. While a larger investment capital relative to aggregate exit value has historically reflected an overpriced market environment, aggregate exit value only exceeded invested capital in 2015 by $37 billion. This is a fraction of the amount recorded in 2006 when invested capital exceeded aggregate exit value by $330 billion.
Source: Preqin Source: S&P/LCD Source: Preqin
U.S. buyout

CAPITAL OVERHANG & ENTRY VALUATIONS1 EXIT ACTIVITY ($B)2 UNICORN ACTIVITY2
Venture cooling as exit activity slows
July 2016Private Equity Outlook 14
1) Capital Overhang: Preqin. Entry Valuations Pitchbook 2) Pitchbook 3) The Wall Street Journal. The Startup Stock Tracker. As of 4/30/16.
0
50
100
150
200
0
20
40
60
80
100
2006
2007
2008
2009
2010
2011
2012
2013
2014
2015
Millions
Billion
s
Dry Powder Seed Series ASeries B Series C Series D+
‐ 200 400 600 800 1,000 1,200 1,400 1,600 1,800
$‐
$20.0
$40.0
$60.0
$80.0
$100.0
$120.0
2006
2007
2008
2009
2010
2011
2012
2013
2014
2015
Acquisition IPO Buyout Count
‐
20
40
60
80
100
# of $1B+ Valued Exits # of $1B+ Valued VC Deals
Unicorns continue to dominate the venture capital news cycle. While seed and early stages remain attractive, elevated dry powder, record late stage valuations and muted exit activity point toward a heated VC environment.
—Capital overhang & entry valuations: After another strong year of fundraising, VC dry powder reached $85 billion by year‐end 2015. Pre‐money valuations have crept up across all stages with late stages valuations nearly doubling over the past three years. Since 2012, Venture capital managers have raised an aggregate $108 billion and invested $202 billon over the same period.
—Exit activity: 2015 VC exits totaled $63 billion, well shy of the $103 billion recorded in 2014. Corporate acquisitions remained the favored exit route accounting for 72% of the total.
—Unicorn effect: The total number of unicorns, or those VC backed companies valued greater than $1 billion, continued to grow. However, exits remain challenged with an increasing separation between the number of unicorns funded versus those exited. Ofthe 49 unicorns held by mutual funds, 29% are marked below the initial value of the mutual fund’s investment3.
U.S. venture & growth

Market update: Europe
July 2016Private Equity Outlook 15

EUROPEAN LBO LOANS (€B)BOFA MERRILL LYNCH EUROPEAN HIGH YIELD OPTION‐ADJUSTED SPREAD CREDIT RATIOS
LBO debt sourcing capital from high yield
July 2016Private Equity Outlook 16
€0€20€40€60€80€100€120€140€160€180
'06 '07 '08 '09 '10 '11 '12 '13 '14 '15
LBO Loans High Yield0
200
400
600
800
1000
1200
'11 '12 '13 '14 '15
0.0x1.0x2.0x3.0x4.0x5.0x6.0x7.0x
'01 '03 '05 '07 '09 '11 '13 '15
Debt/EBITDAEBITDA/Cash InterestEBITDA ‐ Mainten. Capex/Cash Interest
Similar to the U.S., new debt issuances also declined. While spreads have widened, European LBO terms are much more conservative than in the U.S. as European banks, the major source of LBO credit, continue to limit lending due to tighter banking regulations.
—New issuance volume: New issuances of European LBO loans and high yield totaled €137 billion in 2015, a decrease of 19% from prior year. The current volume of new issuance is close to the peak reached last year. However, even at its peak, the volume of new issuances don’t approach the current magnitude of new issuance in the US. Unlike 2006/2007, most of the new issuances come from the high yield market as bank lending have been stymied by increasing regulation.
— Spreads: European high yield spreads continue to widen reaching 535 bps at the end of the year. The current levels were last reached in 2013.
— LBO terms: Total leverage (Debt/EBITDA) declined slightly to 5.01x versus 5.09x in 2014. Interest coverage (EBITDA/Cash Interest) continued to exhibit healthy levels at 3.83x, more than its 10 year rolling average of 3.4x.
Source: S&P/LCD Source: FRED Source: S&P LCD
Europe performing credit

EUROPEAN BUYOUT DRY POWDER (€B)EUROPEAN BUYOUT PRICING MULTIPLES AND EQUITY CONTRIBUTION
AGGREGATE EUROPEAN BUYOUT EXIT VALUE VS. CAPITAL INVESTED (€B)
Buyouts facing mixed return prospect
July 2016Private Equity Outlook 17
$0
$20
$40
$60
$80
$100
$120
$140
$160
$180
'06 '07 '08 '09 '10 '11 '12 '13 '14 '15
0.0x
2.0x
4.0x
6.0x
8.0x
10.0x
12.0x
0.00%
10.00%
20.00%
30.00%
40.00%
50.00%
60.00%
'02 '04 '06 '08 '10 '12 '14
Total Equity Contribution Purchase Price Multiple
€0
€50
€100
€150
€200
€250
'06 '07 '08 '09 '10 '11 '12 '13 '14 '15
Exit Value Capital Invested
Dry powder for European buyout firms have remained flat unlike in the U.S. This coupled with much lower purchase price multiples in Europe than in the U.S. might suggest an attractive investment environment. However, weaker economic conditions and more limited lending will continue to hamper investor appetite.
— Capital overhang: Europe buyout dry powder remained unchanged at €143.1 billion, the same as last year. The amount is below the all time high of €170.6 billion in dry powder recorded in 2008.
— Pricing multiples: Average purchase multiples fell to 9.15x in 2015 from 9.68x in 2014. Equity contribution inched up to 40.45% from 36.96% in 2014. The lower purchase price multiples observed in Europe are reflective of a weaker economic environment coupled with more limited credit availability when compared to the U.S.
— Exit activity: European buyout aggregate exit value equaled €143 billion for 2015, a decrease from €173 billion recorded last year. Total invested capital was €90 billion, a decrease from €95 billion recorded last year. Unlike in the U.S., the aggregate exit value in Europe continued to exceed total invested capital for the sixth straight year.
Source: Preqin Source: S&P/LCD Source: Preqin
European buyout

CAPITAL OVERHANG ($B) & CAPITAL INVESTED BY DEAL SIZE (€B) EXIT ACTIVITY (€B)
Exit activity supporting fundraising
July 2016Private Equity Outlook 18
Source: Capital Overhang: Preqin. Entry Valuations Pitchbook Source: Pitchbook
€0
€2
€4
€6
€8
€10
$0
$5
$10
$15
$20
$25
2006 2007 2008 2009 2010 2011 2012 2013 2014 2015
Dry Powder Under €500K €500K‐€1M €1M‐€5M
€5M‐€10M €10M‐€25M €25M+
€0
€2
€4
€6
€8
€10
€12
€14
2006 2007 2008 2009 2010 2011 2012 2013 2014 2015
Acquisition (€M) IPO (€M) Buyout (€M)
The European venture capital market has booked, with the exception of 2012, six years of expanding exit activity. With a relatively stable capital overhang and a consistent investment pace across seed and early stages, the European venture capital market may be further from a peak than that of the U.S. market.
—Capital overhang & deal size: The European venture capital community ended 2015 with €20 billion in dry powder, €4.3 billion more than YE 2014. While the volume of late stage investments has expanded, capital invested into the other stages have remained relatively constant. Since 2012, venture capital managers have raised an aggregate $20 billion and invested $39 billon over the same period.
—Exit activity: 2015 European venture capital exit activity reached €12.4 billion, as compared to the 2009 post‐crisis low of €1.9 billion and the €10.8 billion recorded in 2014. Corporate acquisitions accounted for 49% of dollars exited in 2015.
European venture & growth
Market update: Other
July 2016Private Equity Outlook 19
GLOBAL DISTRESSED PRIVATE EQUITY RETURNS FOR MATURE VINTAGE YEARS(1) VS. DEFAULT RATES(2)
CAPITAL RAISED VS. CAPITAL INVESTED FOR GLOBAL DISTRESSED PE ($B)
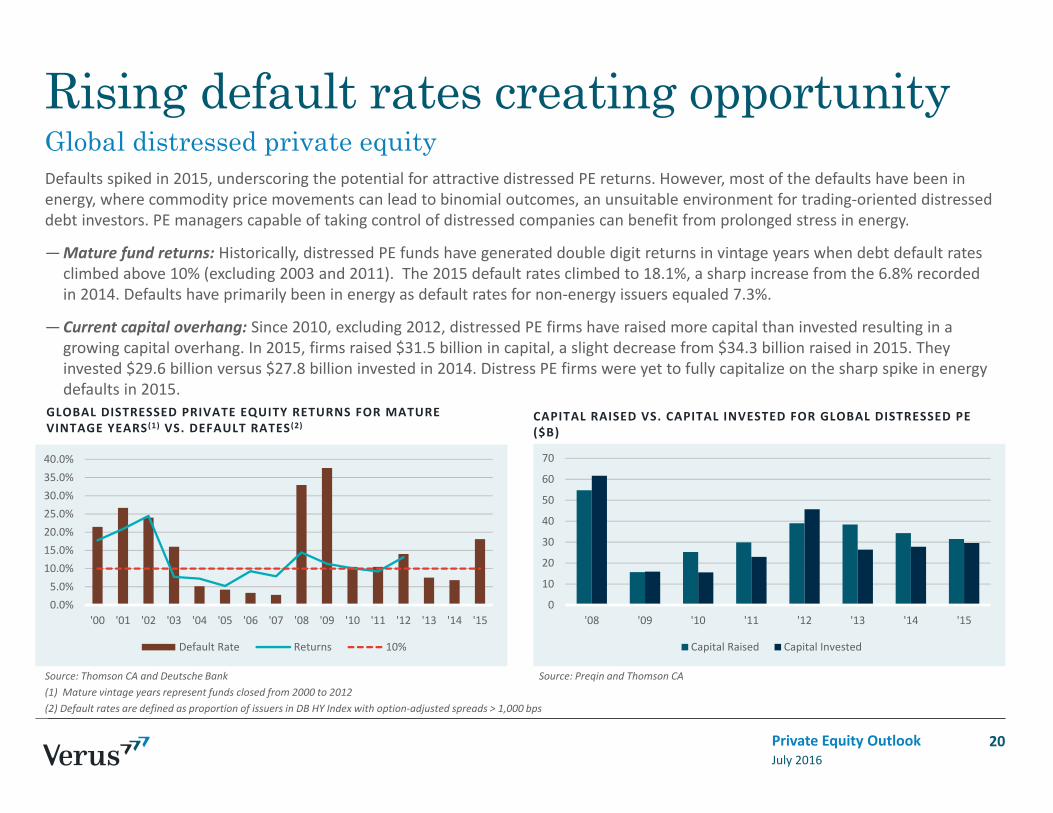
Rising default rates creating opportunity
July 2016Private Equity Outlook 20
Source: Thomson CA and Deutsche Bank Source: Preqin and Thomson CA(1) Mature vintage years represent funds closed from 2000 to 2012(2) Default rates are defined as proportion of issuers in DB HY Index with option‐adjusted spreads > 1,000 bps
0
10
20
30
40
50
60
70
'08 '09 '10 '11 '12 '13 '14 '15
Capital Raised Capital Invested
0.0%5.0%10.0%15.0%20.0%25.0%30.0%35.0%40.0%
'00 '01 '02 '03 '04 '05 '06 '07 '08 '09 '10 '11 '12 '13 '14 '15
Default Rate Returns 10%
Defaults spiked in 2015, underscoring the potential for attractive distressed PE returns. However, most of the defaults have been in energy, where commodity price movements can lead to binomial outcomes, an unsuitable environment for trading‐oriented distresseddebt investors. PE managers capable of taking control of distressed companies can benefit from prolonged stress in energy.
—Mature fund returns: Historically, distressed PE funds have generated double digit returns in vintage years when debt default rates climbed above 10% (excluding 2003 and 2011). The 2015 default rates climbed to 18.1%, a sharp increase from the 6.8% recorded in 2014. Defaults have primarily been in energy as default rates for non‐energy issuers equaled 7.3%.
—Current capital overhang: Since 2010, excluding 2012, distressed PE firms have raised more capital than invested resulting in a growing capital overhang. In 2015, firms raised $31.5 billion in capital, a slight decrease from $34.3 billion raised in 2015. They invested $29.6 billion versus $27.8 billion invested in 2014. Distress PE firms were yet to fully capitalize on the sharp spike in energy defaults in 2015.
Global distressed private equity
CAPITAL OVERHANG ($B) FUNDRAISING ($B) INVESTMENT & EXIT ACTIVITY ($B)
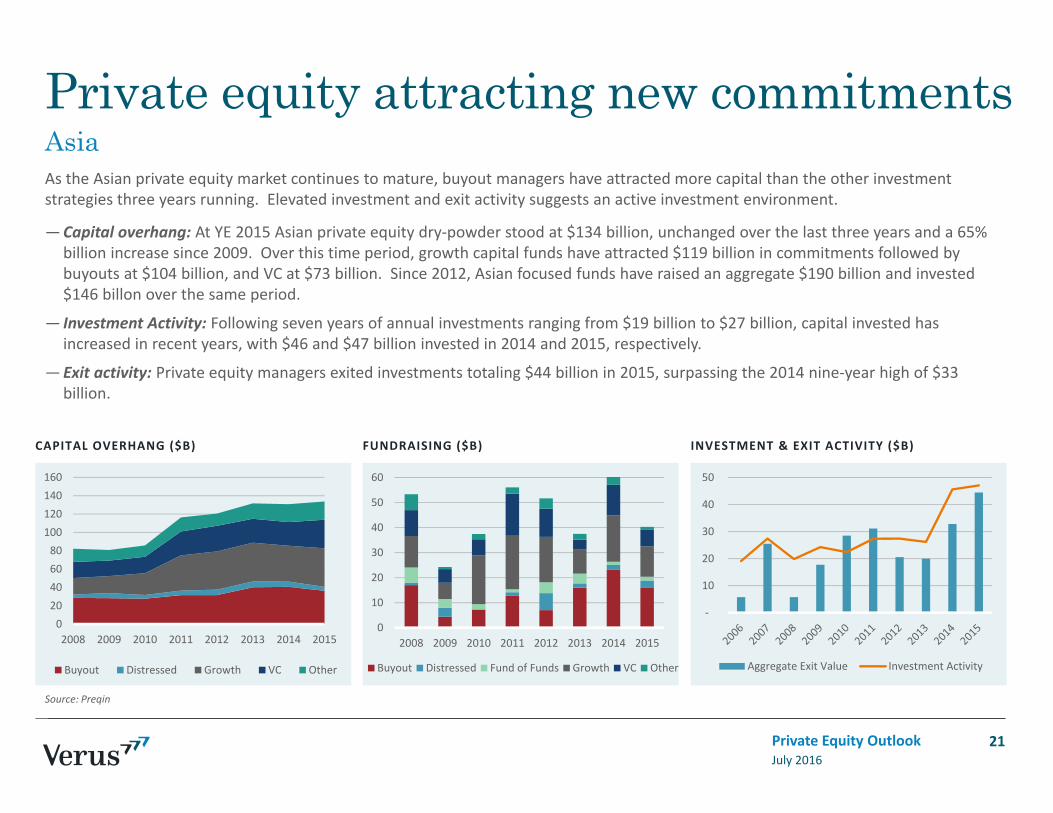
Private equity attracting new commitments
July 2016Private Equity Outlook 21
Source: Preqin
‐
10
20
30
40
50
Aggregate Exit Value Investment Activity
0
10
20
30
40
50
60
2008 2009 2010 2011 2012 2013 2014 2015
Buyout Distressed Fund of Funds Growth VC Other
020406080100120140160
2008 2009 2010 2011 2012 2013 2014 2015
Buyout Distressed Growth VC Other
As the Asian private equity market continues to mature, buyout managers have attracted more capital than the other investmentstrategies three years running. Elevated investment and exit activity suggests an active investment environment.
—Capital overhang: At YE 2015 Asian private equity dry‐powder stood at $134 billion, unchanged over the last three years and a 65% billion increase since 2009. Over this time period, growth capital funds have attracted $119 billion in commitments followed bybuyouts at $104 billion, and VC at $73 billion. Since 2012, Asian focused funds have raised an aggregate $190 billion and invested $146 billon over the same period.
— Investment Activity: Following seven years of annual investments ranging from $19 billion to $27 billion, capital invested has increased in recent years, with $46 and $47 billion invested in 2014 and 2015, respectively.
—Exit activity: Private equity managers exited investments totaling $44 billion in 2015, surpassing the 2014 nine‐year high of $33 billion.
Asia

CAPITAL OVERHANG ($B) FUNDRAISING ($B) INVESTMENT & EXIT ACTIVITY ($B)
Private markets encountering varied signals
July 2016Private Equity Outlook 22
Source: Preqin
0.0
10.0
20.0
30.0
40.0
2008 2009 2010 2011 2012 2013 2014 2015Africa AustralasiaMiddle East & Israel Latin AmericaDiversified Multi‐Regional
‐ 5
10 15 20 25 30 35 40
Aggregate Exit Value Investment Activity
0
10
20
30
40
50
60
70
2008 2009 2010 2011 2012 2013 2014 2015
Buyout Distressed Growth VC Other
Latin American, the dominant ROW fundraising market in recent years, attracted significantly less capital in 2015. Exit activity across the ROW normalized following an outsized 2014.
—Capital overhang: At YE 2015, ROW private equity dry‐powder stood at $64 billion, a slight increase over the last two years and a 40% increase since 2009. Over this time period, Latin American funds have attracted $76 billion in commitments followed by diversified multi‐regional funds at $58 billion, and Australasia at $33 billion. Since 2012, ROW focused funds have raised an aggregate $105 billion and invested $66 billon over the same period.
— Investment Activity: The $19 billion invested in 2015 is the largest yearly total since the $5 billion invested in 2009, but below the $24 billion invested in both 2006 and 2007.
—Exit activity: Private equity managers exited investments totaling $10 billion in 2015, well below the $35 billion exited in 2014.
Rest of world (ROW)

TRANSACTION VOLUME ($B) CAPITAL RAISED ($B) PRICING (% OF NAV)
Near record volumes tapering in secondary
July 2016Private Equity Outlook 23
Source: Greenhill Cogent Source: Preain Source: Greenhill Cogent
‐ 5
10 15 20 25 30 35 40 45
2011 2012 2013 2014 2015
Transaction Volume
‐
5
10
15
20
25
30
2011 2012 2013 2014 2015
Aggregate Capital Raised
50%
60%
70%
80%
90%
100%
110%
All Strategies Buyout Venture
Secondary prices are high and transaction volume near record levels. Some participants believe the market is balanced with capital raised sufficient to meet transaction volume. However, others are more skeptical suggesting that the capital raised only includes funds and the inclusion of direct secondary mandates significantly increases the total capital in the market.
— Secondary fund transaction volume & capital raised: 2015 transaction volume of $40 billion was slightly less than the $42 billion recorded in 2014. Secondary fund managers raised $19 billion in 2015, $8 billion less than what was raised in 2014 and in‐line with the annual amount raised in 2012 and 2013. Of the funds in market, 41% target a fund size less than $250 million, 34% between $250 million and $1 billion, and 24% in excess of $1 billion.
—Pricing: Secondary pricing remains elevated, with all strategies ending 2015 at an average 88% of NAV (compared to an 83% historical average since 2007). However, increased public market volatility and depressed commodity prices moved prices lower in the second half of 2015.
Global secondaries

LP INTEREST IN CO‐INVESTMENTS GP CO‐INVESTMENT PLANS
LP’s seeking lower costs
July 2016Private Equity Outlook 24
Source: Preqin survey of 222 LPs and 320 GPs, November 2015
49%
23%
2%
26%Increase Co‐Investment Activity
Maintain Level of Co‐Investment Activity
Decrease Co‐Investment Activity
Uncertain on Future Co‐Investment Plans
34%
44%
3%
19% Offer More Opportunities
Offer Same Number ofOpportunities
Offer Fewer Opportunities
Uncertain
LP interest in co‐investments appears to be strong with nearly half of the 222 LPs surveyed planning to increase their co‐investment activity in 2016. GPs are responding to LP demand, with 78% of the 320 GPs surveyed looking to either increase or maintain their co‐investment offerings.
— LP interest: Half of LPs surveyed plan to increase their co‐investment activity. Furthermore, most LPs are looking to either increase or maintain their exposure to co‐investments in the future.
—GP interest: 34% of GPs surveyed plan to increase their co‐investment offerings while 44% plan to maintain their co‐investment offerings.
Global co-investments
Historical returns by geography & approach
July 2016Private Equity Outlook 25

Commentary on historical returns
July 2016Private Equity Outlook
— Secondary funds may be a good alternative to direct fund investments outside the U.S., as evidenced by solid returns and outperformance of the European secondary funds. Universe capitalizations suggests a much shallower penetration of secondary funds in Europe as compared to that in the U.S., suggesting a less efficient secondary market. The Asian secondary market is still nascent – we have seen less than a handful of secondary funds targeting Asia specifically.
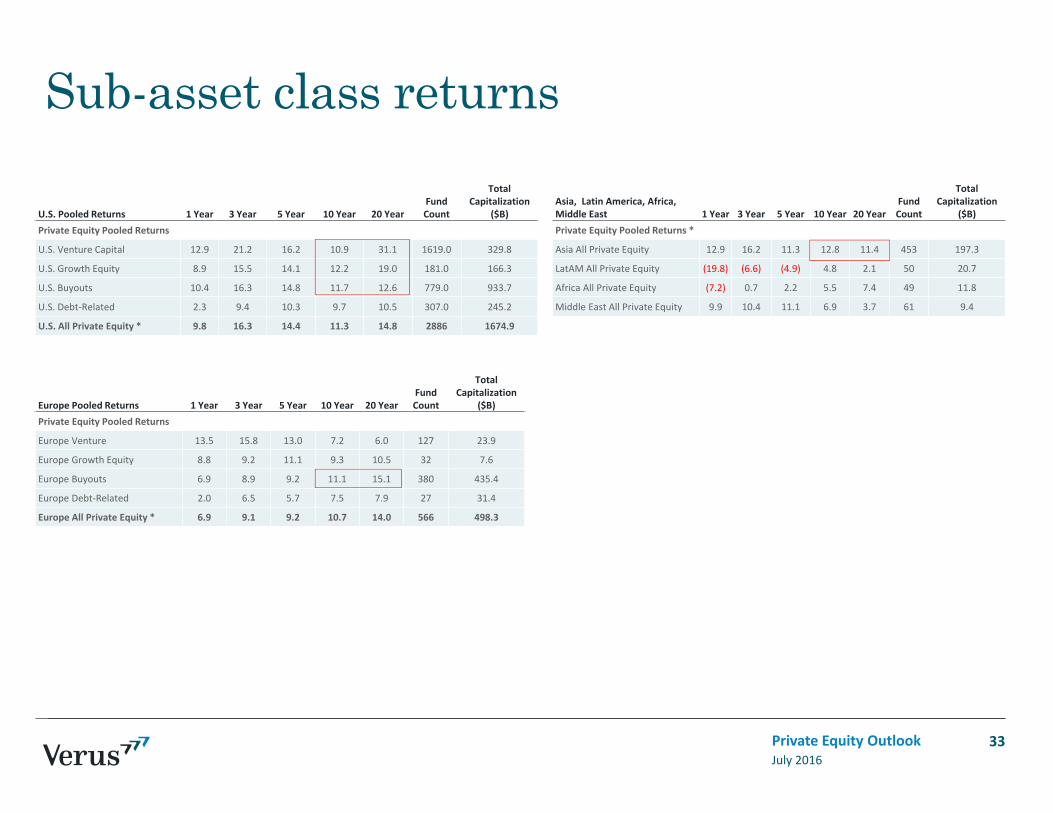
PRIVATE EQUITY RETURNS BY SUB‐ASSET CLASS
— In the U.S., the best performing sub‐asset classes over the long term have been venture capital/growth, followed by buyouts. We caution that specifically in venture capital, returns are primarily driven by the very best performing managers.
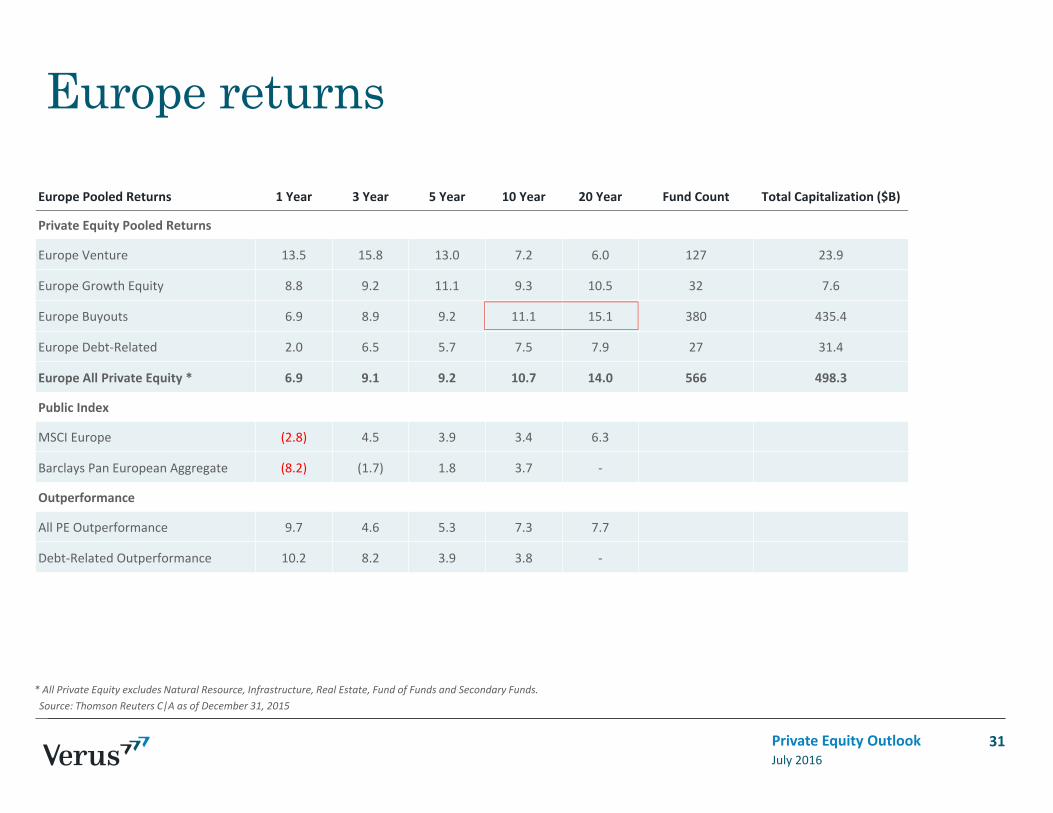
— In Europe, buyouts was the only sub‐asset class that generated consistent double digit returns over the last 10‐ and 20‐year periods.
— In Asia, sub‐asset class concentrations vary by country, with venture capital and growth a higher percentage in the developing markets, and buyouts larger in developed countries such as Japan, Australia, and South Korea. Sub‐asset class breakdown is not available across Asia, but we highlight double‐digit returns by Asia All private equity universe over the last 10‐ and 20‐year periods.
26
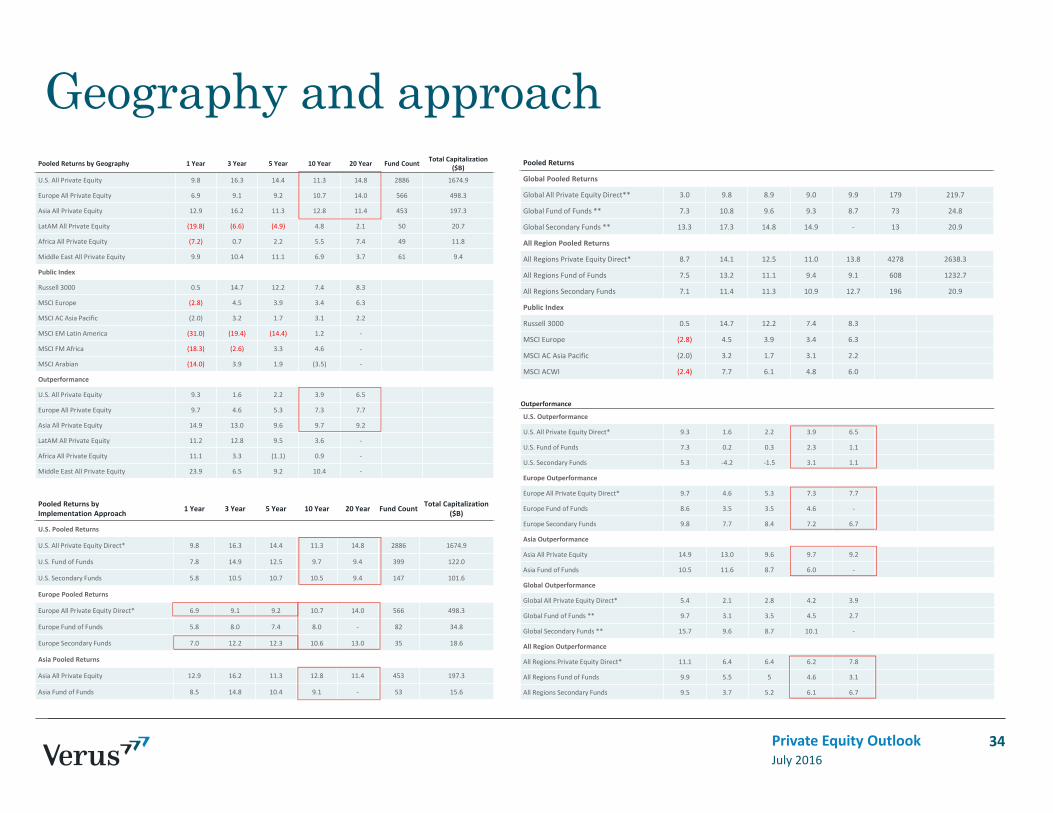
PRIVATE EQUITY RETURNS ACROSS REGIONS
— In regions with significant private equity activity, namely in the U.S., Europe, and Asia, over the long term the asset class has outperformed public benchmarks measurably.
— Outperformance in the U.S. relative to public benchmarks, while sizeable over the last 10‐year period at 3.9%, has declined considerably from 6.5% over the last 20‐year period. This decline provides evidence to our impression that the U.S. private equity market has become more efficient over time.
— In contrast to the U.S., Europe and Asia have produced more robust outperformance relative to their local public benchmarks over the last 10‐ and 20‐year periods. However, European and Asian returns have been generally in line with returns generated by the U.S. private equity universe.
— Given the above, we will continue to monitor the added value of international Private Equity commitments beyond diversification for U.S. investors.
PRIVATE EQUITY RETURNS BY IMPLEMENTATION APPROACH
— Commitments to direct funds has generated the highest outperformance relative to public benchmarks, followed by investments in secondary funds (which can be viewed as a lower cost substitute to Fund of Funds) and Funds of Funds, respectively.

27July 2016Private Equity Outlook
Detailed returns by geography
Pooled Returns by Geography* 1 Year 3 Year 5 Year 10 Year 20 Year Fund Count Total Capitalization ($B)
U.S. All Private Equity 9.8 16.3 14.4 11.3 14.8 2886 1674.9
Europe All Private Equity 6.9 9.1 9.2 10.7 14.0 566 498.3
Asia All Private Equity 12.9 16.2 11.3 12.8 11.4 453 197.3
LatAM All Private Equity (19.8) (6.6) (4.9) 4.8 2.1 50 20.7
Africa All Private Equity (7.2) 0.7 2.2 5.5 7.4 49 11.8
Middle East All Private Equity 9.9 10.4 11.1 6.9 3.7 61 9.4
Public Index
Russell 3000 0.5 14.7 12.2 7.4 8.3
MSCI Europe (2.8) 4.5 3.9 3.4 6.3
MSCI AC Asia Pacific (2.0) 3.2 1.7 3.1 2.2
MSCI EM Latin America (31.0) (19.4) (14.4) 1.2 ‐
MSCI FM Africa (18.3) (2.6) 3.3 4.6 ‐
MSCI Arabian (14.0) 3.9 1.9 (3.5) ‐
Outperformance
U.S. All Private Equity 9.3 1.6 2.2 3.9 6.5
Europe All Private Equity 9.7 4.6 5.3 7.3 7.7
Asia All Private Equity 14.9 13.0 9.6 9.7 9.2
LatAM All Private Equity 11.2 12.8 9.5 3.6 ‐
Africa All Private Equity 11.1 3.3 (1.1) 0.9 ‐
Middle East All Private Equity 23.9 6.5 9.2 10.4 ‐
* All Private Equity excludes Natural Resource, Infrastructure, Real Estate, Fund of Funds and Secondary Funds.Source: Thomson Reuters C|A as of December 31, 2015

28July 2016Private Equity Outlook
Pooled returns by implementation approach
Pooled Returns byImplementation Approach 1 Year 3 Year 5 Year 10 Year 20 Year Fund Count Total Capitalization ($B)
U.S. Pooled Returns
U.S. All Private Equity Direct* 9.8 16.3 14.4 11.3 14.8 2886 1674.9
U.S. Fund of Funds 7.8 14.9 12.5 9.7 9.4 399 122.0
U.S. Secondary Funds 5.8 10.5 10.7 10.5 9.4 147 101.6
Europe Pooled Returns
Europe All Private Equity Direct* 6.9 9.1 9.2 10.7 14.0 566 498.3
Europe Fund of Funds 5.8 8.0 7.4 8.0 ‐ 82 34.8
Europe Secondary Funds 7.0 12.2 12.3 10.6 13.0 35 18.6
Asia Pooled Returns
Asia All Private Equity 12.9 16.2 11.3 12.8 11.4 453 197.3
Asia Fund of Funds 8.5 14.8 10.4 9.1 ‐ 53 15.6
Global Pooled Returns
Global All Private Equity Direct** 3.0 9.8 8.9 9.0 9.9 179 219.7
Global Fund of Funds ** 7.3 10.8 9.6 9.3 8.7 73 24.8
Global Secondary Funds ** 13.3 17.3 14.8 14.9 ‐ 13 20.9
All Region Pooled Returns
All Regions Private Equity Direct* 8.7 14.1 12.5 11.0 13.8 4278 2638.3
All Regions Fund of Funds 7.5 13.2 11.1 9.4 9.1 608 1232.7
All Regions Secondary Funds 7.1 11.4 11.3 10.9 12.7 196 20.9
Public Index
Russell 3000 0.5 14.7 12.2 7.4 8.3
MSCI Europe (2.8) 4.5 3.9 3.4 6.3
MSCI AC Asia Pacific (2.0) 3.2 1.7 3.1 2.2
MSCI ACWI (2.4) 7.7 6.1 4.8 6.0

29July 2016Private Equity Outlook
Pooled returns outperformance
Outperformance
U.S. Outperformance
U.S. All Private Equity Direct* 9.3 1.6 2.2 3.9 6.5
U.S. Fund of Funds 7.3 0.2 0.3 2.3 1.1
U.S. Secondary Funds 5.3 ‐4.2 ‐1.5 3.1 1.1
Europe Outperformance
Europe All Private Equity Direct* 9.7 4.6 5.3 7.3 7.7
Europe Fund of Funds 8.6 3.5 3.5 4.6 ‐
Europe Secondary Funds 9.8 7.7 8.4 7.2 6.7
Asia Outperformance
Asia All Private Equity 14.9 13.0 9.6 9.7 9.2
Asia Fund of Funds 10.5 11.6 8.7 6.0 ‐
Global Outperformance
Global All Private Equity Direct* 5.4 2.1 2.8 4.2 3.9
Global Fund of Funds ** 9.7 3.1 3.5 4.5 2.7
Global Secondary Funds ** 15.7 9.6 8.7 10.1 ‐
All Region Outperformance
All Regions Private Equity Direct* 11.1 6.4 6.4 6.2 7.8
All Regions Fund of Funds 9.9 5.5 5 4.6 3.1
All Regions Secondary Funds 9.5 3.7 5.2 6.1 6.7

30July 2016Private Equity Outlook
U.S. returnsU.S. Pooled Returns 1 Year 3 Year 5 Year 10 Year 20 Year Fund Count Total Capitalization ($B)
Private Equity Pooled Returns 1674.9
U.S. Venture Capital 12.9 21.2 16.2 10.9 31.1 1619.0 329.8
U.S. Growth Equity 8.9 15.5 14.1 12.2 19.0 181.0 166.3
U.S. Buyouts 10.4 16.3 14.8 11.7 12.6 779.0 933.7
U.S. Debt‐Related 2.3 9.4 10.3 9.7 10.5 307.0 245.2
U.S. All Private Equity * 9.8 16.3 14.4 11.3 14.8 2886
Public Index
S&P 500 1.4 15.1 12.6 7.3 8.2
Russell 3000 0.5 14.7 12.2 7.4 8.3
Barclay’s Aggregate 0.5 1.4 3.2 4.5 5.3
Outperformance
All PE Outperformance 9.3 1.6 2.2 3.9 6.5
Debt‐Related Outperformance 1.8 8.0 7.1 5.2 5.2
* All Private Equity excludes Natural Resource, Infrastructure, Real Estate, Fund of Funds and Secondary Funds.Source: Thomson Reuters C|A as of December 31, 2015
31July 2016Private Equity Outlook
Europe returns
Europe Pooled Returns 1 Year 3 Year 5 Year 10 Year 20 Year Fund Count Total Capitalization ($B)
Private Equity Pooled Returns
Europe Venture 13.5 15.8 13.0 7.2 6.0 127 23.9
Europe Growth Equity 8.8 9.2 11.1 9.3 10.5 32 7.6
Europe Buyouts 6.9 8.9 9.2 11.1 15.1 380 435.4
Europe Debt‐Related 2.0 6.5 5.7 7.5 7.9 27 31.4
Europe All Private Equity * 6.9 9.1 9.2 10.7 14.0 566 498.3
Public Index
MSCI Europe (2.8) 4.5 3.9 3.4 6.3
Barclays Pan European Aggregate (8.2) (1.7) 1.8 3.7 ‐
Outperformance
All PE Outperformance 9.7 4.6 5.3 7.3 7.7
Debt‐Related Outperformance 10.2 8.2 3.9 3.8 ‐
* All Private Equity excludes Natural Resource, Infrastructure, Real Estate, Fund of Funds and Secondary Funds.Source: Thomson Reuters C|A as of December 31, 2015

32July 2016Private Equity Outlook
Asia, Latin America, Africa, Middle East returnsAsia, Latin America, Africa, Middle East 1 Year 3 Year 5 Year 10 Year 20 Year Fund Count Total Capitalization ($B)
Private Equity Pooled Returns *
Asia All Private Equity 12.9 16.2 11.3 12.8 11.4 453 197.3
LatAM All Private Equity (19.8) (6.6) (4.9) 4.8 2.1 50 20.7
Africa All Private Equity (7.2) 0.7 2.2 5.5 7.4 49 11.8
Middle East All Private Equity 9.9 10.4 11.1 6.9 3.7 61 9.4
Public Index
MSCI Emerging Markets (14.6) (6.4) (4.5) 3.9 5.5
MSCI AC Asia Pacific (2.0) 3.2 1.7 3.1 2.2
MSCI EM Latin America (31.0) (19.4) (14.4) 1.2 ‐
MSCI FM Africa (18.3) (2.6) 3.3 4.6 ‐
MSCI Arabian (14.0) 3.9 1.9 (3.5) ‐
Outperformance
Asia All Private Equity 14.9 13.0 9.6 9.7 9.2
LatAM All Private Equity 11.2 12.8 9.5 3.6 ‐
Africa All Private Equity 11.1 3.3 (1.1) 0.9 ‐
Middle East All Private Equity 23.9 6.5 9.2 10.4 ‐
* All Private Equity excludes Natural Resource, Infrastructure, Real Estate, Fund of Funds and Secondary Funds.Source: Thomson Reuters C|A as of December 31, 2015
Asia, Latin America, Africa, Middle East 1 Year 3 Year 5 Year 10 Year 20 Year
Fund Count
Total Capitalization
($B)Private Equity Pooled Returns *
Asia All Private Equity 12.9 16.2 11.3 12.8 11.4 453 197.3
LatAM All Private Equity (19.8) (6.6) (4.9) 4.8 2.1 50 20.7
Africa All Private Equity (7.2) 0.7 2.2 5.5 7.4 49 11.8
Middle East All Private Equity 9.9 10.4 11.1 6.9 3.7 61 9.4
Europe Pooled Returns 1 Year 3 Year 5 Year 10 Year 20 YearFund Count
Total Capitalization
($B)Private Equity Pooled Returns
Europe Venture 13.5 15.8 13.0 7.2 6.0 127 23.9
Europe Growth Equity 8.8 9.2 11.1 9.3 10.5 32 7.6
Europe Buyouts 6.9 8.9 9.2 11.1 15.1 380 435.4
Europe Debt‐Related 2.0 6.5 5.7 7.5 7.9 27 31.4
Europe All Private Equity * 6.9 9.1 9.2 10.7 14.0 566 498.3
33July 2016Private Equity Outlook
Sub-asset class returns
U.S. Pooled Returns 1 Year 3 Year 5 Year 10 Year 20 YearFund Count
Total Capitalization
($B)Private Equity Pooled Returns
U.S. Venture Capital 12.9 21.2 16.2 10.9 31.1 1619.0 329.8
U.S. Growth Equity 8.9 15.5 14.1 12.2 19.0 181.0 166.3
U.S. Buyouts 10.4 16.3 14.8 11.7 12.6 779.0 933.7
U.S. Debt‐Related 2.3 9.4 10.3 9.7 10.5 307.0 245.2
U.S. All Private Equity * 9.8 16.3 14.4 11.3 14.8 2886 1674.9
Pooled Returns byImplementation Approach 1 Year 3 Year 5 Year 10 Year 20 Year Fund Count Total Capitalization
($B)
U.S. Pooled Returns
U.S. All Private Equity Direct* 9.8 16.3 14.4 11.3 14.8 2886 1674.9
U.S. Fund of Funds 7.8 14.9 12.5 9.7 9.4 399 122.0
U.S. Secondary Funds 5.8 10.5 10.7 10.5 9.4 147 101.6
Europe Pooled Returns
Europe All Private Equity Direct* 6.9 9.1 9.2 10.7 14.0 566 498.3
Europe Fund of Funds 5.8 8.0 7.4 8.0 ‐ 82 34.8
Europe Secondary Funds 7.0 12.2 12.3 10.6 13.0 35 18.6
Asia Pooled Returns
Asia All Private Equity 12.9 16.2 11.3 12.8 11.4 453 197.3
Asia Fund of Funds 8.5 14.8 10.4 9.1 ‐ 53 15.6
34July 2016Private Equity Outlook
Geography and approachPooled Returns by Geography 1 Year 3 Year 5 Year 10 Year 20 Year Fund Count Total Capitalization
($B)
U.S. All Private Equity 9.8 16.3 14.4 11.3 14.8 2886 1674.9
Europe All Private Equity 6.9 9.1 9.2 10.7 14.0 566 498.3
Asia All Private Equity 12.9 16.2 11.3 12.8 11.4 453 197.3
LatAM All Private Equity (19.8) (6.6) (4.9) 4.8 2.1 50 20.7
Africa All Private Equity (7.2) 0.7 2.2 5.5 7.4 49 11.8
Middle East All Private Equity 9.9 10.4 11.1 6.9 3.7 61 9.4
Public Index
Russell 3000 0.5 14.7 12.2 7.4 8.3
MSCI Europe (2.8) 4.5 3.9 3.4 6.3
MSCI AC Asia Pacific (2.0) 3.2 1.7 3.1 2.2
MSCI EM Latin America (31.0) (19.4) (14.4) 1.2 ‐
MSCI FM Africa (18.3) (2.6) 3.3 4.6 ‐
MSCI Arabian (14.0) 3.9 1.9 (3.5) ‐
Outperformance
U.S. All Private Equity 9.3 1.6 2.2 3.9 6.5
Europe All Private Equity 9.7 4.6 5.3 7.3 7.7
Asia All Private Equity 14.9 13.0 9.6 9.7 9.2
LatAM All Private Equity 11.2 12.8 9.5 3.6 ‐
Africa All Private Equity 11.1 3.3 (1.1) 0.9 ‐
Middle East All Private Equity 23.9 6.5 9.2 10.4 ‐
Pooled Returns
Global Pooled Returns
Global All Private Equity Direct** 3.0 9.8 8.9 9.0 9.9 179 219.7
Global Fund of Funds ** 7.3 10.8 9.6 9.3 8.7 73 24.8
Global Secondary Funds ** 13.3 17.3 14.8 14.9 ‐ 13 20.9
All Region Pooled Returns
All Regions Private Equity Direct* 8.7 14.1 12.5 11.0 13.8 4278 2638.3
All Regions Fund of Funds 7.5 13.2 11.1 9.4 9.1 608 1232.7
All Regions Secondary Funds 7.1 11.4 11.3 10.9 12.7 196 20.9
Public Index
Russell 3000 0.5 14.7 12.2 7.4 8.3
MSCI Europe (2.8) 4.5 3.9 3.4 6.3
MSCI AC Asia Pacific (2.0) 3.2 1.7 3.1 2.2
MSCI ACWI (2.4) 7.7 6.1 4.8 6.0
Outperformance
U.S. Outperformance
U.S. All Private Equity Direct* 9.3 1.6 2.2 3.9 6.5
U.S. Fund of Funds 7.3 0.2 0.3 2.3 1.1
U.S. Secondary Funds 5.3 ‐4.2 ‐1.5 3.1 1.1
Europe Outperformance
Europe All Private Equity Direct* 9.7 4.6 5.3 7.3 7.7
Europe Fund of Funds 8.6 3.5 3.5 4.6 ‐
Europe Secondary Funds 9.8 7.7 8.4 7.2 6.7
Asia Outperformance
Asia All Private Equity 14.9 13.0 9.6 9.7 9.2
Asia Fund of Funds 10.5 11.6 8.7 6.0 ‐
Global Outperformance
Global All Private Equity Direct* 5.4 2.1 2.8 4.2 3.9
Global Fund of Funds ** 9.7 3.1 3.5 4.5 2.7
Global Secondary Funds ** 15.7 9.6 8.7 10.1 ‐
All Region Outperformance
All Regions Private Equity Direct* 11.1 6.4 6.4 6.2 7.8
All Regions Fund of Funds 9.9 5.5 5 4.6 3.1
All Regions Secondary Funds 9.5 3.7 5.2 6.1 6.7

Asia, Latin America, Africa, Middle East 1 Year 3 Year 5 Year 10 Year 20 Year
Fund Count
Total Capitalization ($B)
Private Equity Pooled Returns *
Asia All Private Equity 12.9 16.2 11.3 12.8 11.4 453 197.3
LatAM All Private Equity (19.8) (6.6) (4.9) 4.8 2.1 50 20.7
Africa All Private Equity (7.2) 0.7 2.2 5.5 7.4 49 11.8Middle East All Private Equity 9.9 10.4 11.1 6.9 3.7 61 9.4
Public Index
MSCI Emerging Markets (14.6) (6.4) (4.5) 3.9 5.5
MSCI AC Asia Pacific (2.0) 3.2 1.7 3.1 2.2
MSCI EM Latin America (31.0) (19.4) (14.4) 1.2 ‐
MSCI FM Africa (18.3) (2.6) 3.3 4.6 ‐
MSCI Arabian (14.0) 3.9 1.9 (3.5) ‐
Outperformance
Asia All Private Equity 14.9 13.0 9.6 9.7 9.2
LatAM All Private Equity 11.2 12.8 9.5 3.6 ‐
Africa All Private Equity 11.1 3.3 (1.1) 0.9 ‐Middle East All Private Equity 23.9 6.5 9.2 10.4 ‐
Europe Pooled Returns 1 Year 3 Year 5 Year 10 Year 20 YearFund Count
Total Capitalization ($B)
Private Equity Pooled Returns
Europe Venture 13.5 15.8 13.0 7.2 6.0 127 23.9
Europe Growth Equity 8.8 9.2 11.1 9.3 10.5 32 7.6
Europe Buyouts 6.9 8.9 9.2 11.1 15.1 380 435.4
Europe Debt‐Related 2.0 6.5 5.7 7.5 7.9 27 31.4
Europe All Private Equity * 6.9 9.1 9.2 10.7 14.0 566 498.3
Public Index
MSCI Europe (2.8) 4.5 3.9 3.4 6.3Barclays Pan European Aggregate (8.2) (1.7) 1.8 3.7 ‐
Outperformance
All PE Outperformance 9.7 4.6 5.3 7.3 7.7 Debt‐Related Outperformance 10.2 8.2 3.9 3.8 ‐
35July 2016Private Equity Outlook
Geographies with outperformanceU.S. Pooled Returns 1 Year 3 Year 5 Year 10 Year 20 Year
Fund Count
Total Capitalization ($B)
Private Equity Pooled Returns
U.S. Venture Capital 12.9 21.2 16.2 10.9 31.1 1619.0 329.8
U.S. Growth Equity 8.9 15.5 14.1 12.2 19.0 181.0 166.3
U.S. Buyouts 10.4 16.3 14.8 11.7 12.6 779.0 933.7
U.S. Debt‐Related 2.3 9.4 10.3 9.7 10.5 307.0 245.2
U.S. All Private Equity * 9.8 16.3 14.4 11.3 14.8 2886 1674.9
Public Index
S&P 500 1.4 15.1 12.6 7.3 8.2
Russell 3000 0.5 14.7 12.2 7.4 8.3
Barclay’s Aggregate 0.5 1.4 3.2 4.5 5.3
Outperformance
All PE Outperformance 9.3 1.6 2.2 3.9 6.5 Debt‐Related Outperformance 1.8 8.0 7.1 5.2 5.2
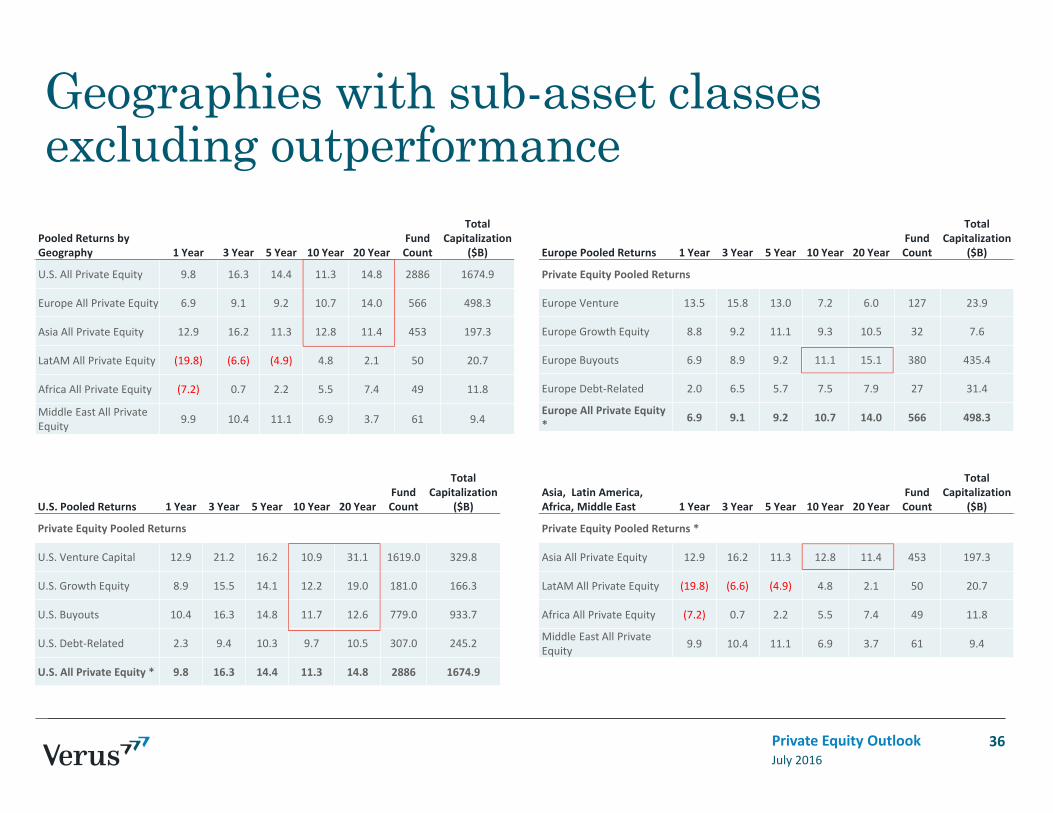
Geographies with sub-asset classes excluding outperformance
Asia, Latin America, Africa, Middle East 1 Year 3 Year 5 Year 10 Year 20 Year
Fund Count
Total Capitalization
($B)
Private Equity Pooled Returns *
Asia All Private Equity 12.9 16.2 11.3 12.8 11.4 453 197.3
LatAM All Private Equity (19.8) (6.6) (4.9) 4.8 2.1 50 20.7
Africa All Private Equity (7.2) 0.7 2.2 5.5 7.4 49 11.8
Middle East All Private Equity 9.9 10.4 11.1 6.9 3.7 61 9.4
36July 2016Private Equity Outlook
U.S. Pooled Returns 1 Year 3 Year 5 Year 10 Year 20 YearFund Count
Total Capitalization
($B)
Private Equity Pooled Returns
U.S. Venture Capital 12.9 21.2 16.2 10.9 31.1 1619.0 329.8
U.S. Growth Equity 8.9 15.5 14.1 12.2 19.0 181.0 166.3
U.S. Buyouts 10.4 16.3 14.8 11.7 12.6 779.0 933.7
U.S. Debt‐Related 2.3 9.4 10.3 9.7 10.5 307.0 245.2
U.S. All Private Equity * 9.8 16.3 14.4 11.3 14.8 2886 1674.9
Pooled Returns by Geography 1 Year 3 Year 5 Year 10 Year 20 Year
Fund Count
Total Capitalization
($B)
U.S. All Private Equity 9.8 16.3 14.4 11.3 14.8 2886 1674.9
Europe All Private Equity 6.9 9.1 9.2 10.7 14.0 566 498.3
Asia All Private Equity 12.9 16.2 11.3 12.8 11.4 453 197.3
LatAM All Private Equity (19.8) (6.6) (4.9) 4.8 2.1 50 20.7
Africa All Private Equity (7.2) 0.7 2.2 5.5 7.4 49 11.8
Middle East All Private Equity 9.9 10.4 11.1 6.9 3.7 61 9.4
Europe Pooled Returns 1 Year 3 Year 5 Year 10 Year 20 YearFund Count
Total Capitalization
($B)
Private Equity Pooled Returns
Europe Venture 13.5 15.8 13.0 7.2 6.0 127 23.9
Europe Growth Equity 8.8 9.2 11.1 9.3 10.5 32 7.6
Europe Buyouts 6.9 8.9 9.2 11.1 15.1 380 435.4
Europe Debt‐Related 2.0 6.5 5.7 7.5 7.9 27 31.4
Europe All Private Equity * 6.9 9.1 9.2 10.7 14.0 566 498.3

Notices & disclosuresPast performance is no guarantee of future results. This report or presentation is provided for informational purposes only and is directed to institutional clients and eligible institutional counterparties only and should not be relied upon by retail investors. Nothing herein constitutes investment, legal, accounting or tax advice, or a recommendation to buy, sell or hold a security or pursue a particular investment vehicle or any trading strategy. The opinions and information expressed are current as of the date provided or cited only and are subject to change without notice. This information is obtained from sources deemed reliable, but there is no representation or warranty as to its accuracy, completeness or reliability. Verus Advisory Inc. and Verus Investors, LLC expressly disclaim any and all implied warranties or originality, accuracy, completeness, non‐infringement, merchantability and fitness for a particular purpose. This report or presentation cannot be used by the recipient for advertising or sales promotion purposes.
The material may include estimates, outlooks, projections and other “forward‐looking statements.” Such statements can be identified by the use of terminology such as “believes,” “expects,” “may,” “will,” “should,” “anticipates,” or the negative of any of the foregoing or comparable terminology, or by discussion of strategy, or assumptions such as economic conditions underlying other statements. No assurance can be given that future results described or implied by any forward looking information will be achieved. Actual events may differ significantly from those presented. Investing entails risks, including possible loss of principal. Risk controls and models do not promise any level of performance or guarantee against loss of principal.
“VERUS ADVISORY™ and VERUS INVESTORS™ and any associated designs are the respective trademarks of Verus Advisory, Inc. and Verus Investors, LLC. Additional information is available upon request.
July 2016Private Equity Outlook 37