The Tour Operators’ Initiative: tour operators in action for sustainable development
Upload
nguyentuongCategory
view
219download
3
update cover
update logo on every slide to 2016
INDUSTRY SNAPSHOT20 16

Every year since 2006 the ATTA has surveyed its growing database of tour operators. Each year adventure travel tour operators are invited to share information about their business operations as well as trends they are experiencing in traveler demographics, destinations, and activities.
The ATTA Industry Snapshot offers those already working in adventure travel with a useful benchmarking tool, and those outside the industry with perspective on the health, outlook and characteristics of this dynamic industry.
The 2016 Industry Snapshot asks respondents to share information about the 2015 business year. The survey was conducted using QuestionPro Online Survey Software during the month of February 2016. Two hundred and sixty nine completed surveys were returned, along with two hundred and fifty one partially complete surveys. Respondents came from companies headquartered in eighty two different countries.
Respondent Profile
The largest group of respondents have company headquarters in North America (35 percent), followed by Europe (21 percent) and South America (18 percent). Fifty-eight percent of respondents characterize themselves as inbound (supplier) companies, 26% characterize themselves as inbound and outbound (buyer), and 17 percent characterize themselves as outbound only.
Result Highlights
Company Financials
Companies from all regions of the world have a favorable revenue outlook for 2016. Seventy percent of respondents say they expect revenues to be up in 2016, 22 percent expect revenues to be flat, and eight percent expect revenues to be down. Looking at revenue projections regionally, companies in South America are the most bullish on adventure travel, expecting a 27 percent increase in revenues for 2016 over 2015. In terms of profit, companies in North America and South America expect profits up as much as 33 percent over 2015.
The primary factor influencing the positive revenue and profit projections is new customers and adding new products while controlling costs.
INDUSTRY SNAPSHOT20 16 © 2016, ATTA
2016 Adventure Travel Trade Association Industry Snapshot

Operations
As in past years, operations is the area in which most companies are adding staff (35%). Twenty-eight percent of revenue is spent on payroll. Marketing budgets have been increasing every year and will be up again in 2016, at an average of $169,245 they are 18 percent higher than 2015, and six percent of revenue. Booking
When asked if their company has an online reservation system that accepts credit cards, 53 percent of adventure travel tour operators said they do not.
For those companies that do have an online booking system (online booking defined as an automated system to handle the entire transaction from trip selection, availability confirmation and payment) companies in the Middle East and Europe had the highest percentage of their bookings completed online, with 48 percent and 47 percent respectively.
Traveler and Product Trends
Travelers
Globally, the average age of adventure traveler customers is 48. Tour operators reported fifty percent of their adventure travelers are between the ages of 41 and 60.
These adventure traveler customers are slightly more likely to be female (53 percent). Most are traveling as couples (36 percent) and in groups (32 percent).
Solo travelers and families each make up approximately 17 percent of adventure travel customers.
Itineraries and Activities
It is interesting to note that while families and solo travelers make up the smallest percentage of adventure travel customers at this time, 72 percent of adventure companies say they are developing more itineraries to serve families and multi-generational groups. Forty two percent say they are developing more itineraries to appeal to solo travelers. Seventeen percent are working on trips specifically to appeal to LGBT (lesbian, gay, bisexual, transgender) travelers.
Custom itineraries, soft adventures and cultural adventures are the most in-demand types of itineraries. ‘Soft adventures’ is a general term that includes activities such as backpacking, birdwatching, camping, canoeing, cycling, fishing, hiking, horseback riding, sea kayaking, rafting, safaris, surfing, snorkeling, for example.
INDUSTRY SNAPSHOT20 16 © 2016, ATTA
Created by Ecem Afacan
from the Noun Project

When asked what trends they see as most significant in driving product development in adventure travel today, adventure travel companies offered a broad range of insights. A few direct quotes from this open-ended question are provided below:
“Increasing need to implement a social element into the trip such as visiting an orphanage, home for elders, etc.”
“Comfort, safety, security, reassurance that tour operators give to their guests.”
“Greater demand for more interaction with the community.”
“Tailor made experiences that offer the feeling that you ‘are the only one’ there - complete immersion and authenticity.”
Trip Duration and Price
Trip duration ranges from five days to nine days. Reported trip prices ranged from $167 USD per day (for companies based in Central America/Caribbean) to $448 USD per day (for companies based in North America).
Destinations
The top five regions of the world receiving increased interest from travelers are South America, Central America, North America, Southern Africa and Western Europe. The top three countries that clients are booking are Italy, United States, and Spain.
Destination Benefits
Adventure travel tour operators estimate that 65% of the per guest trip cost remains in the local region. Furthermore, they estimate each guest spends approximately $145 USD on local handicrafts or souvenirs.
INDUSTRY SNAPSHOT20 16 © 2016, ATTA

Organization Headquarters
North America 35%
Africa 9%
Europe 21%
INDUSTRY SNAPSHOT20 16 © 2016, ATTA
Pacific 2%
Middle East 3%
Central America 3%
Asia 8%
South America 18%

Tour Operation Type
Outbound (buyer) 17%
Outbound and Inbound 26%
Inbound (supplier) 57%
INDUSTRY SNAPSHOT20 16 © 2016, ATTA

Customers Per Year
HEADQUARTERS CUSTOMERS PER YEAR
AFRICA 2,863
ASIA 6,578
CENTRAL AMERICA / CARIBBEAN 14,402
EUROPE 7,908
MIDDLE EAST 2,157
NORTH AMERICA 10,472
SOUTH AMERICA 4,198
INDUSTRY SNAPSHOT20 16 © 2016, ATTA

Trip Length
HEADQUARTERS LENGTH IN DAYS
AFRICA 9
ASIA 8
CENTRAL AMERICA / CARIBBEAN 5
EUROPE 7
MIDDLE EAST 9
NORTH AMERICA 8
PACIFIC 9
SOUTH AMERICA 6
INDUSTRY SNAPSHOT20 16 © 2016, ATTA
COMPANY SIZE IN 2014 BY REVENUE LENGTH IN DAYS
$0-250K 6
$250K-1M 8
$1M-5M 9
GREATER THAN $5M 8

Trip Price Per Day in US DollarsIncluding lodging, excluding airfares
INDUSTRY SNAPSHOT20 16 © 2016, ATTA
HEADQUARTERS PER DAY, 2015CHANGE OVER/UNDER
2014
AFRICA $285 9%
ASIA $178 8%
CENTRAL AMERICA / CARIBBEAN $167 65%
EUROPE $200 2%
MIDDLE EAST $288 7%
NORTH AMERICA $448 1%
SOUTH AMERICA $255 22%
* Regions not containing sufficient sample size are excluded from this chart.
** Trip prices are quoted in USD each year and may be affected by fluctuating exchange rates year over year. Survey respondents provide estimates to the best of their knowledge.

Staff Averages By Company Size
INDUSTRY SNAPSHOT20 16 © 2016, ATTA
FULL TIME EMPLOYEES NON-STAFF SUBCONTRACTORS
$0-250K 14
$250K-1M
$1M-5M
GREATER THAN $5M
7
15
60
$0-250K 15
$250K-1M
$1M-5M
GREATER THAN $5M
15
21
52
COMPANY SIZE BY 2015 REVENUE COMPANY SIZE BY 2015 REVENUE

In what business area did you add the most staff in 2015?
Operations 35%
Guides 13%
No additions in 2015 17%
INDUSTRY SNAPSHOT20 16 © 2016, ATTA
Other 2%
Accounting 3%
Office Administration 5%
Marketing 9%
Sales 16%

What percentage of your organization's annual revenue is spent on payroll (excluding contractors)?
INDUSTRY SNAPSHOT20 16 © 2016, ATTA
OF REVENUE SPENT ON PAYROLL
28%

Guide to Guest Ratio
HEADQUARTERS RATIO
AFRICA 1:6
ASIA 1:8
CENTRAL AMERICA / CARIBBEAN 1:9
EUROPE 1:9
MIDDLE EAST 1:8
NORTH AMERICA 1:8
SOUTH AMERICA 1:7
INDUSTRY SNAPSHOT20 16 © 2016, ATTA
GLOBAL AVERAGE
1:8

Estimated percentage of trip cost per guest that remains in the local region.
INDUSTRY SNAPSHOT20 16 © 2016, ATTA
OF TRIP COST REMAINING IN THE REGION
65%

Average estimated guest expenditure on local handicrafts or souvenirs.
INDUSTRY SNAPSHOT20 16 © 2016, ATTA
SPENT PER GUEST (SHOWN IN US DOLLAR)
$145ATTA asked tour operators to estimate how much an average guest spends on local handicrafts or souvenirs.

Does your organization have an online reservation system that accepts credit cards?
INDUSTRY SNAPSHOT20 16 © 2016, ATTA
Yes 47%
No 53%

%
What percentage of your bookings are completed online?*
INDUSTRY SNAPSHOT20 16 © 2016, ATTA
BY REGIONAL LOCATION OF BUSINESS BY COMPANY SIZE IN 2015
AFRICA 24%
SOUTH AMERICA
$0-250K 42%
$250K-1M
$1M-5M
GREATER THAN $5M
31%
42%
34%
*Online booking means the entire transaction is completed using an automated system to select the trip, confirm availability and pay.
9%
28%
47%
48%
43%
5%
22%
ASIA
CENTRAL AMERICA/ CARIBBEAN
EUROPE
MIDDLE EAST
NORTH AMERICA
OCEANIA

EBITDA*
INDUSTRY SNAPSHOT20 16 © 2016, ATTA
HEADQUARTERS 2015 2014 2015EBITDA MARGIN
2014EBITDA MARGIN
ASIA $318,000 $285,000 25% 24%
EUROPE $175,000 $132,000 10% 9%
NORTH AMERICA $283,000 $220,000 15% 13%
SOUTH AMERICA $326,000 $310,000 16% 15%
Regions not containing sufficient sample size are excluded from this chart. * EBITDA - Earnings Before Interest, Taxes, Depreciation and Amortization.
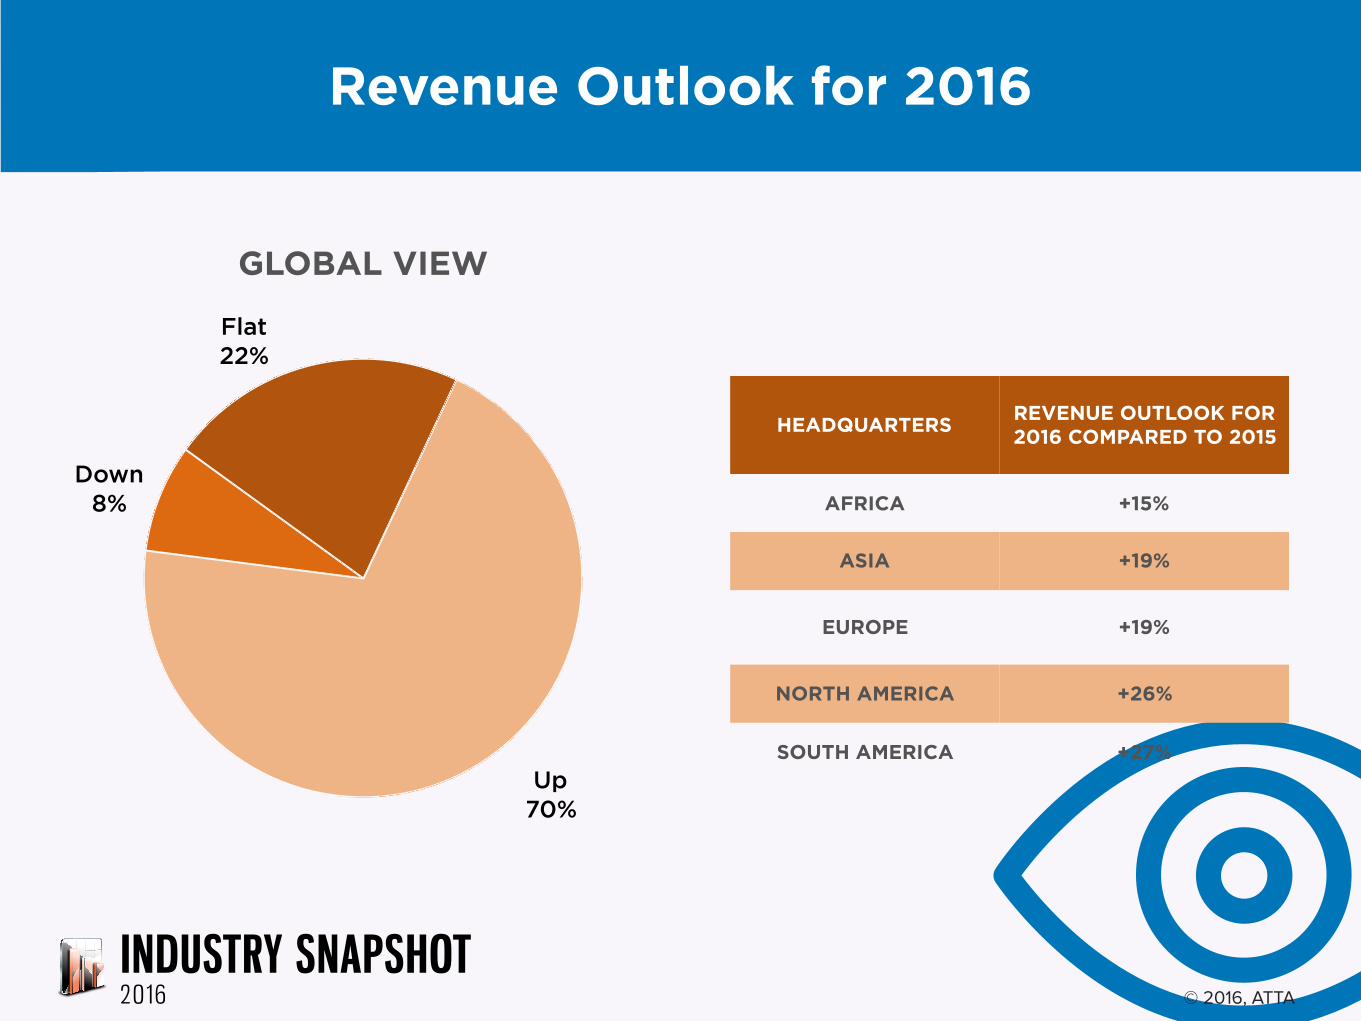
Revenue Outlook for 2016
HEADQUARTERS REVENUE OUTLOOK FOR 2016 COMPARED TO 2015
AFRICA +15%
ASIA +19%
EUROPE +19%
NORTH AMERICA +26%
SOUTH AMERICA +27%
INDUSTRY SNAPSHOT20 16 © 2016, ATTA
Flat 22%
Down 8%
Up 70%
GLOBAL VIEW

Net Profit Outlook for 2016
HEADQUARTERSNET PROFIT OUTLOOK
FOR 2016 COMPARED TO 2015
ASIA +21%
EUROPE +33%
NORTH AMERICA +32%
SOUTH AMERICA +27%
INDUSTRY SNAPSHOT20 16 © 2016, ATTA
Flat 23%
Down 12%
Up 65%
GLOBAL VIEW

Primary Factor Influencing Net Profit Projections Positively
INDUSTRY SNAPSHOT20 16 © 2016, ATTA
NEW CUSTOMERS 34%
MORE REPEAT BUSINESS
21%
13%
9%
7%
4%
4%
NEW PRODUCTS ADDED WHILE CONTROLLING COSTS
ACCESS TO NEW MARKETS
CURRENCY EXCHANGE
NEW BUSINESS LINES ADDED
CRISIS IN ANOTHER REGION
OTHER
3%
2%
1%
DECREASED OVERHEAD
FEWER OR FLAT OFFERINGS WHILE CONTROLLING COSTS
OIL/GAS PRICES 1%

Primary Factor Influencing Net Profit Projections Negatively
INDUSTRY SNAPSHOT20 16 © 2016, ATTA
FEWER NEW CUSTOMERS 31%
28%
14%
14%
7%
3%
3%
CRISIS IN MY REGION
INCREASED OVERHEAD
OTHER
INCREASED COMPETITION
CURRENCY EXCHANGE
LESS REPEAT BUSINESS

Customer Demographics
INDUSTRY SNAPSHOT20 16 © 2016, ATTA
Age Traveler Type
Gender
51-60 25%
70+ 5%
28 and under 11%
29-40 19%
Male 47%
61-70 15%
41-50 25%
Female 53%
Couples 36%
Groups 32%
Families 16%
Solos 17%

Customer Demographics
INDUSTRY SNAPSHOT20 16 © 2016, ATTA
HEADQUARTERS % FEMALE GUESTS
AFRICA 57%
ASIA 45%
EUROPE 53%
NORTH AMERICA 51%
SOUTH AMERICA 51%

Are you developing more itineraries to address the needs of:
INDUSTRY SNAPSHOT20 16 © 2016, ATTA
Solo Travelers Family Multi-Generational
LGBT(Lesbian, Gay, Bisexual, Transgender)
Yes 42%
No 58%
Yes 17%
No 83%
Yes 72%
No 28%

Average Age of Clients
HEADQUARTERS AVERAGE AGE
AFRICA 49
ASIA 42
EUROPE 49
NORTH AMERICA 49
SOUTH AMERICA 45
INDUSTRY SNAPSHOT20 16 © 2016, ATTA
GLOBAL AVERAGE CLIENT AGE
48* Regions not containing sufficient sample size are excluded from this chart.

What trend or trends do you see as most significant in driving product development in adventure travel, today?
INDUSTRY SNAPSHOT20 16 © 2016, ATTA
GENERAL INDUSTRY TRENDS
View more trends in report appendix.
• “ADVENTURE TRAVEL IS ENTERING THE MAINSTREAM”
• “COMFORT/SAFETY/SECURITY TOUR OPERATORS OFFER TO GUESTS”
• “ZIKA VIRUS WILL AFFECT OUR BOOKINGS”
• “LAST MINUTE BOOKINGS”
• “ONLINE BOOKING”
MARKETING TRENDS
• “AGGRESSIVE MARKETING ATTRACTING NEW CUSTOMERS”
• “BLOGGING
• REVIEW-DRIVEN

What trend or trends do you see as most significant in driving product development in adventure travel, today?
INDUSTRY SNAPSHOT20 16 © 2016, ATTA
ACTIVITY TRENDS
View more trends in report appendix.
• TREKKING
• CYCLING
• FOOD, BEER, UNIQUE GASTRONOMY
• CULTURAL EXPERIENCES
• COMMUNITY INTERACTION
• MOUNTAIN BIKING EXCURSIONS INCORPORATED INTO GROUP TOURS
THEMES
• CONSERVATION/WILDLIFE/ NATURE
• CULINARY TOURISM SHOULD BE, BUT CLIENTS NOT ASKING AS MUCH AS EXPECTED
• SAFETY AND SECURITY
• ECOLOGICAL AWARENESS

Regions of Increased Customer Interest
INDUSTRY SNAPSHOT20 16 © 2016, ATTA
Increasing Interest
No Change
Decreasing Interest

Top Countries Clients Are BookingBy Company Headquarters
INDUSTRY SNAPSHOT20 16 © 2016, ATTA
HEADQUARTERS #1 #2 #3 #4 #5 #6
EUROPE ITALY SPAIN FRANCE UNITED KINGDOM SOUTH AFRICA CHILE
NORTH AMERICA UNITED STATES ITALY PERU ECUADOR CANADA ARGENTINA
ALL REGIONS ITALY UNITED STATES INDIA PERU SPAIN ECUADOR

Itineraries of Changing Customer Interest How customer demand in 2016 compares to 2015
INDUSTRY SNAPSHOT20 16 © 2016, ATTA
CUSTOM ITINERARIES
SOFT ADVENTURES
CULTURAL-BASED ADVENTURES
SHORTER DURATION OPTION TO EXISTING ITINERARIES
DOMESTIC AND/OR REGIONAL TRAVEL
FAMILY OR MULTI-GENERATIONAL
SELF/GUIDED
PHILANTHROPIC ACTIVITIES
“GREEN” TRAVEL OPTIONS
HARD ADVENTURES

Primary Focus of Guest Requests for Increased Customization % ranking each most important area of guest requests for customization
INDUSTRY SNAPSHOT20 16 © 2016, ATTA
Completely customized trips 55%
Custom departure time 28%
Time within the planned itinerary for customized experiences
18%

hikingtrekking
WalkingCyclingCulturalbikingsafari
Rafting
wildlifeTours
CULTURE
bike
Photography
viewing
hike
sea
watchingvisits
touring
tubing
BearSafaris
NatureDiving
Riding
cruise
fishing
Tour
surfingskiin
g
Cruising
Horsewellness
Great
History
Bicyclingmultisport
Travelsnow
Group
Food
City
Yoga
MTB
Falls
Whitewater
Victoria
fly
tourism
Table
villages
sport
bait
Pole
South
germany
glacier
BICYCLE
Gorilla
TrekingBungee
Jumping
exchange
Snorkel
coast
Halfday
dogs
ride
balooning
cave
sledturtle
Day
inca
trail
kayak
Park
SCUBA
Dive
sail
loire
amalfi
Mull
english
mtn Vinson
Voyage
Mt
mountaineering
Motorcycling
visit
caves
road
marble
paragliding
patagonia
Philanthropy
luxury
Privaetly
Guided
provence
based
Land
Holidays
Drives
jeeps lam
anai
River
Arade
Balloon
AirHot
horseriding
Ski
Skye
driving
heli
naturecultural
gwaii
haida
boarding
mulitday
Snowmobiling
Grand
Sof
Galapagos
Spa
France
Experiences
wine
Teaching
Children
Traditional
uyuni
salt
flats
family
equestrianEcotourism
immersion
sicilian
volcanoes
cross
Lions
canoeing
canoe
Whale
camping
Bird
wild
life
atv
site
Archaeological
Animal
4x4
Top 2016 Activities Word Cloud
INDUSTRY SNAPSHOT20 16 © 2016, ATTA
Top Ten Terms Used to Describe Preferred Activities: 1. Cultural 2. Hiking 3. Cycling 4. Eco-tourism 5. Trekking
6. Walking 7. Safaris 8. Locals 9. Birdwatching 10. Environmental

Top Activities Clients Are BookingBy Company Headquarters
INDUSTRY SNAPSHOT20 16 © 2016, ATTA
HEADQUARTERS #1 #2 #3 #4 #5
AFRICA SAFARISENVIRONMENTAL
SUSTAINABLE ACTIVITIES
CAMPING ECO-TOURISM GETTING TO KNOW THE LOCALS
ASIA CULTURAL ACTIVITIES TREKKING CAMPING ECO-TOURISM VOLUNTEER TOURISM
EUROPE HIKING CYCLING WALKING TOURS CULTURAL ACTIVITIES TREKKING
NORTH AMERICA CYCLING CULTURAL ACTIVITIES HIKING ECO-TOURISM SNORKELING
SOUTH AMERICA CULTURAL ACTIVITIES ECO-TOURISM HIKING TREKKING WALKING TOURS
ALL REGIONS CULTURAL ACTIVITIES HIKING CYCLING ECO-TOURISM TREKKING

Marketing Budgets (US Dollars)
INDUSTRY SNAPSHOT20 16 © 2016, ATTA
2015 AVERAGE 2014 AVERAGE CHANGE OVER 2014
BUDGET AS A PERCENT OF 2015
REVENUE
$170,000 $143,000 18% 6%

2015 Marketing Budget Detailed
INDUSTRY SNAPSHOT20 16 © 2016, ATTA
2016 PERCENTAGE OF BUDGET
2015 PERCENTAGE OF BUDGET
PERCENTAGE OF 2015 GROSS REVENUE
AVERAGE DOLLAR AMOUNT
CONTENT CREATION (STORIES, PHOTOS, VIDEO) 16% 15% 0.6% $23,000
TRADE EVENTS 15% 16% 0.6% $22,000
SOCIAL MEDIA OUTREACH 13% 12% 0.6% $18,000
ONLINE ADVERTISING AND SPONSORED CONTENT 12% 14% 0.6% $17,000
SEARCH ENGINE OPTIMIZATION 10% 8% 0.5% $14,000
EMAIL CAMPAIGNS 9% 7% 0.4% $12,000
PUBLIC RELATIONS 6% 6% 0.3% $9,000
PRINT ADVERTISING 6% 8% 0.3% $9,000
CONSUMER EVENTS 5% 4% 0.2% $7,000
DIRECT MAIL 4% 4% 0.2% $6,000
SMARTPHONES AND MOBILE APPS 1% 0.5% 0.1% $1,000

Other Items in 2016 Marketing Budget
INDUSTRY SNAPSHOT20 16 © 2016, ATTA
Includes:
Website Development
Partnerships/Partner Visits/ Partner Promotions
Roadshows
Sales Missions

Does your company have a documented safety and risk management plan?
INDUSTRY SNAPSHOT20 16 © 2016, ATTA
Africa Asia
Yes 62%
No 18%
Yes 72%
Europe
Yes 75%
No 25%
Yes 65%No
35%
Yes 67%
No 33% Yes
69%
No 31%
North America South America

APPENDIX
INDUSTRY SNAPSHOT20 16 © 2016, ATTA

• Women adventurers
• Aging travelers
• Being invited by friends, especially women
• Boomers want to be active
• Desire to try a new challenging activity, supervised by a professional
• Disposable income
• Desire for easy to moderate activities
• Families
• Solos
INDUSTRY SNAPSHOT20 16 © 2016, ATTA
What trend or trends do you see as most significant in driving product development in adventure travel, today? Itinerary Trends
• Internet brings more informed travelers
• More use of social media and internet. Digital media and mobile technology
• Multi-generational
• Increasing number of Asian travelers and the need to adapt experiences to fit their cultural expectations and language needs
• Travelers are Trophy Collectors, not hunters. Less interested in: the journey, camping, off-line
• Less fear of travel in unstable areas

INDUSTRY SNAPSHOT20 16 © 2016, ATTA
Top Activities Clients Are Booking By Company Headquarters - Other Demands
A • Adventure mix with luxury experience (good food and good night sleep)
• Authentic tourism experiences
• Canyoning
• Choosing lodging
• Climbing tours
• Combination of soft adventures with cultural explorations
• Combining sailing with other activities, such as whale watching
• Community based tourism
• Cooking - hands on cooking programs
C
• Encounters with local people Expedition Travel
• Fishing in Alaska Food and wine - meet the maker
• Food and Wine, pilgrimage Routes (point to point long distance walking)
• Glacier hiking
• Green woodcraft
• Heritage
• High Ropes Course
• Horse riding holiday combined with a cultural tour post ride
EF
G
H

INDUSTRY SNAPSHOT20 16 © 2016, ATTA
Other Demands (continued)
I • Interactive authenticity
• Culture, Learning Activities, High-end camping experiences (glamping), Kayaking
• Monastic temples, monuments, daily excursion to local places on demand, lake view
• More creature comforts in a remote setting
• More people like to get involved in local activities instead of just looking at things
• Mountain biking
• Multi adventure/ mulitisport
• Mystical tourism
• Paragliding and hang-gliding
M
• Participative tourism sharing benefits and activities with local people
• Photography tours
• Qualified leaders/guides
• Rock Climbing and Ice Climbing Clinics
• Safaris
• Safety and security
• Service
• Shorter lead-time
• Skating on natural ice
• Small groups, private trips, winter trips
QRS
P

INDUSTRY SNAPSHOT20 16 © 2016, ATTA
Other Demands (continued)
S • Special Interest Trips
• Specialist guides
• SUP, diving, hiking
• Surf
• Tailormade activities
• Trips to two or more countries
• Visits of social character (home for elders, orphanage, etc.)
T
• Walking in remotes places, mix of mountain and beaches..not just one type of environment
• Whale shark tours
• Wildlife viewing and photography
• Wildlife watching
• Yoga & Wellness
• Yoga, Soft adventure
W
YV

THANK YOU
INDUSTRY SNAPSHOT20 16 © 2016, ATTA

update cover
update logo on every slide to 2016
INDUSTRY SNAPSHOT20 16