2016 Gender and Veteran Demographics Webinar · 2016 Gender and Veteran Demographics Webinar Slide...
13
1 2016 Gender and Veteran Demographics Webinar Slide 1 Hi, my name is Nancy Glowacki. I am an Army veteran and I currently serve as the Women Veteran Program Manager for the Department of Labor Veterans’ Employment and Training Service, known as DOL VETS. I’d like to talk to you a little bit today about demographics pertaining to women veterans and why these demographics are so important. Slide 2 You may already know that veterans make up 9% of the overall adult population in America. This means that approximately 1 in every 12 adults is a veteran. Slide 3 There are currently approximately 2 million living women veterans in the United States. Slide 4
-
Upload
phungthuan -
Category
Documents
-
view
213 -
download
0
Transcript of 2016 Gender and Veteran Demographics Webinar · 2016 Gender and Veteran Demographics Webinar Slide...

1
2016 Gender and Veteran Demographics Webinar
Slide 1
Hi, my name is Nancy Glowacki. I am an Army veteran and I currently serve as the Women Veteran
Program Manager for the Department of Labor Veterans’ Employment and Training Service, known as
DOL VETS. I’d like to talk to you a little bit today about demographics pertaining to women veterans and
why these demographics are so important.
Slide 2
You may already know that veterans make up 9% of the overall adult population in America. This means
that approximately 1 in every 12 adults is a veteran.
Slide 3
There are currently approximately 2 million living women veterans in the United States.
Slide 4
2
Women currently make up approximately 10% of the overall veteran population. That means that 1 in
every 10 veterans is a woman.
Slide 5
Comparatively, 1 in every 2 adults in the general population is a woman.
Slide 6
Veterans make up 16% of the men in America. 1 in 6 adult males in this country is a veteran. So, most
Americans have had personal interactions with a veteran who was a man.
Slide 7
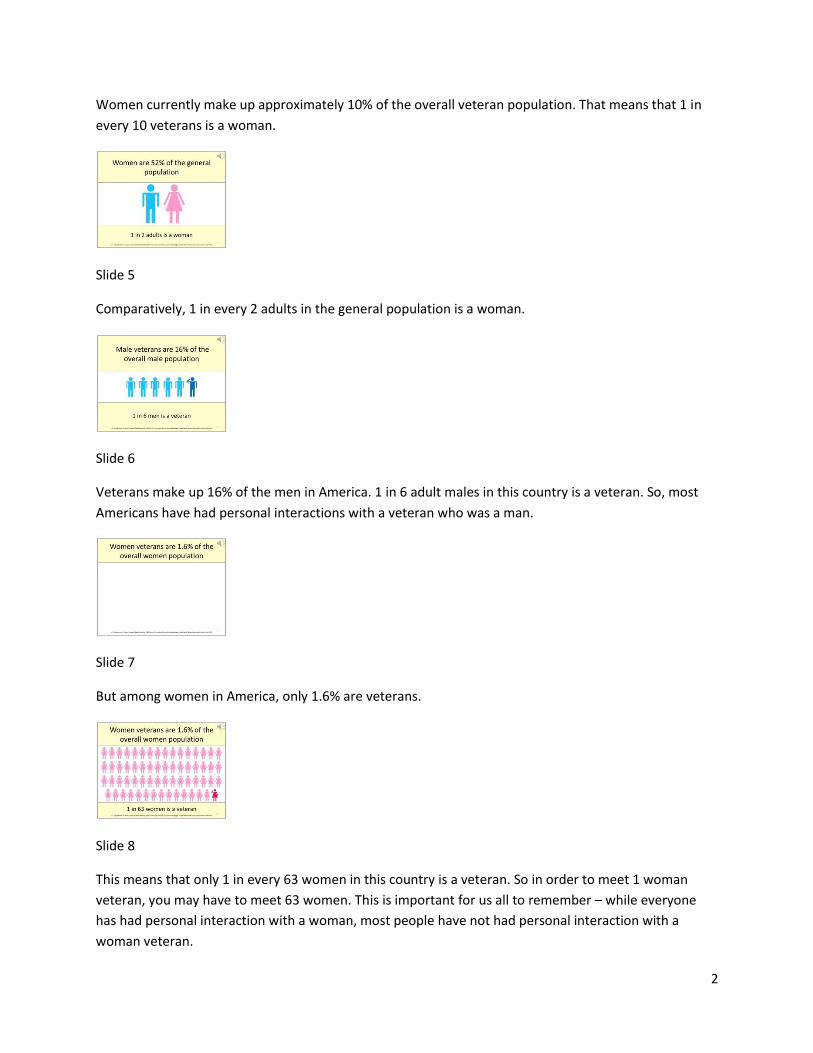
But among women in America, only 1.6% are veterans.
Slide 8
This means that only 1 in every 63 women in this country is a veteran. So in order to meet 1 woman
veteran, you may have to meet 63 women. This is important for us all to remember – while everyone
has had personal interaction with a woman, most people have not had personal interaction with a
woman veteran.

3
Slide 9
Perhaps this is why even as women veterans get more recognition than ever before as a population,
individual women veterans still get forgotten.
Slide 10
For those of us who provide veteran services, it is absolutely critical that we ask each and every
potential female client, “have you ever served in the military?” Remember, we may have to ask 63
women before hearing 1 yes, but we must keep on asking.
Slide 11
So, what does this look like when we combine men and women and veterans and nonveterans?
Slide 12
For every 100 adults, 1 is a woman veteran, 8 are male veterans, 40 are male nonveterans, and 51 are
women nonveterans.

4
Slide 13
If we look at adults under 35 years old, we see an even greater divide between veterans and
nonveterans, particularly for women veterans.
Slide 14
Only 2.7% of all 18-34 year olds in America are veterans – that’s 1 in 37 adults under 35 years old.
Slide 15
Women make up 18% of 18-34 year old veterans, which means that 1 in every 5 veterans under 35 years
old is a woman.
Slide 16
Comparatively, in the general population of 18-34 year olds, 1 in 2 people is a woman.

5
Slide 17
Among men, veterans comprise 4.4% of 18-34 year olds. 1 in 23 men under 35 years old is a veteran.
Slide 18
Meanwhile, among women 18-34 years old, only 1% are veterans – 1%! That means that to meet just
one woman under age 35 who has served in the military, you may have to meet 100 women of that age
group.
Slide 19
Now how does this look in the overall population? Well, for every 200 18-34 year olds, 1 is a woman
veteran, 4 are male veterans, 96 are male nonveterans, and 99 are women nonveterans.
Slide 20
Now let’s look at era of service, race and ethnicity, and age differences between male veterans and
women veterans.

6
Slide 21
Compared to male veterans, women veterans are over twice as likely to have served in the Gulf War II
era but not the Gulf War I era.
Slide 22
Women veterans are more likely than male veterans to have served in the Gulf War I era but not the
Gulf War II era,
Slide 23
and women veterans are almost twice as likely as male veterans to have served in both Gulf War I and
Gulf War II eras.
Slide 24
Meanwhile, male veterans are almost three times as likely as women veterans to have served in the
World War II era, the Korean War era, or the Vietnam War era.

7
Slide 25
Looking at race and ethnicity – the majority of veterans are white, however women veterans are less
likely than male veterans to be white.
Slide 26
Women veterans are almost twice as likely as male veterans or nonveterans of either gender to be Black
or African American.
Slide 27
Veterans are less likely that nonveterans to be Asian or Hispanic or Latino, and women veterans are
more likely than male veterans to be Hispanic or Latino.
Slide 28
Looking at age – here is where we see some drastic differences. Women veterans are twice as likely as
male veterans to be under 35 years old. This is important to remember because people under 35 years
old consistently have higher unemployment rates, a trend that is true for both veterans and
nonveterans, and among both genders.

8
Slide 29
Half of male veterans are 65 years old or over, compared to 17% of women veterans. But, our focus at
the Department of Labor is employment, and you may be wondering just how many of those males over
65 years old are still in the workforce.
Slide 30
If we look only at veterans who are currently in the civilian labor force, we still see that 20% of male
veterans in the workforce are 65 years old or over, compared to 3.8% of women veterans. That’s right –
male veterans in the workforce are 5 times as likely as women veterans in the workforce to be 65 years
old or over.
Slide 31
So what does workforce or civilian labor force really mean? The workforce, also known as the civilian
labor force, includes both people who are currently employed and people who are not currently
employed, but who are both available for work and actively seeking work – those known as
unemployed.
Slide 32

9
Women veterans are more likely than male veterans or women non-veterans to be in the civilian labor
force.
Slide 33
That leaves us with the term, not in the labor force. If a person is no longer actively seeking work, they
are considered to be not in the labor force.
Slide 34
There are many reasons why a person may not be seeking work. They could be retired, they could be a
stay at home parent, and they could also desire to work but have given up on seeking work. This can
happen when a job seeker either believes no jobs are available or believes that they are not qualified
and therefore have become discouraged and given up.
Slide 35
Women veterans are less likely than male veterans or women nonveterans to not be in the labor force.
Slide 36

10
So, since our focus at the Department of Labor is the workforce, let’s now look at those basic
demographics again, but this time focusing only on people in the civilian labor force.
Slide 37
1 in 15 adults in the civilian labor force is a veteran. You most likely work with, or have worked with, at
least one veteran.
Slide 38
1 in 2 adults in the workforce is a woman.
Slide 39
But only 1 in 8 veterans in the workforce is a woman.
Slide 40
Only 1 in every 59 women in the workforce is a veteran.

11
Slide 41
Comparatively, 1 in 9 men in the workforce is a veteran.
Slide 42
Looking at 100 adults, including both genders and both veterans and nonveterans, we still see that only
1 is a woman veteran, but there are some differences in those around her. Here we see that 6 out of 100
adults in the workforce are male veterans, 47 are male nonveterans, and 46 are women nonveterans.
Slide 43
Looking at 18-34 year olds in the workforce, veterans comprise only 3% - that means that 1 in every 34
adults under the age of 35 in the civilian labor force is a veteran.
Slide 44
1 in 6 18-34 year old veterans in the civilian labor force is a woman.
12
Slide 45
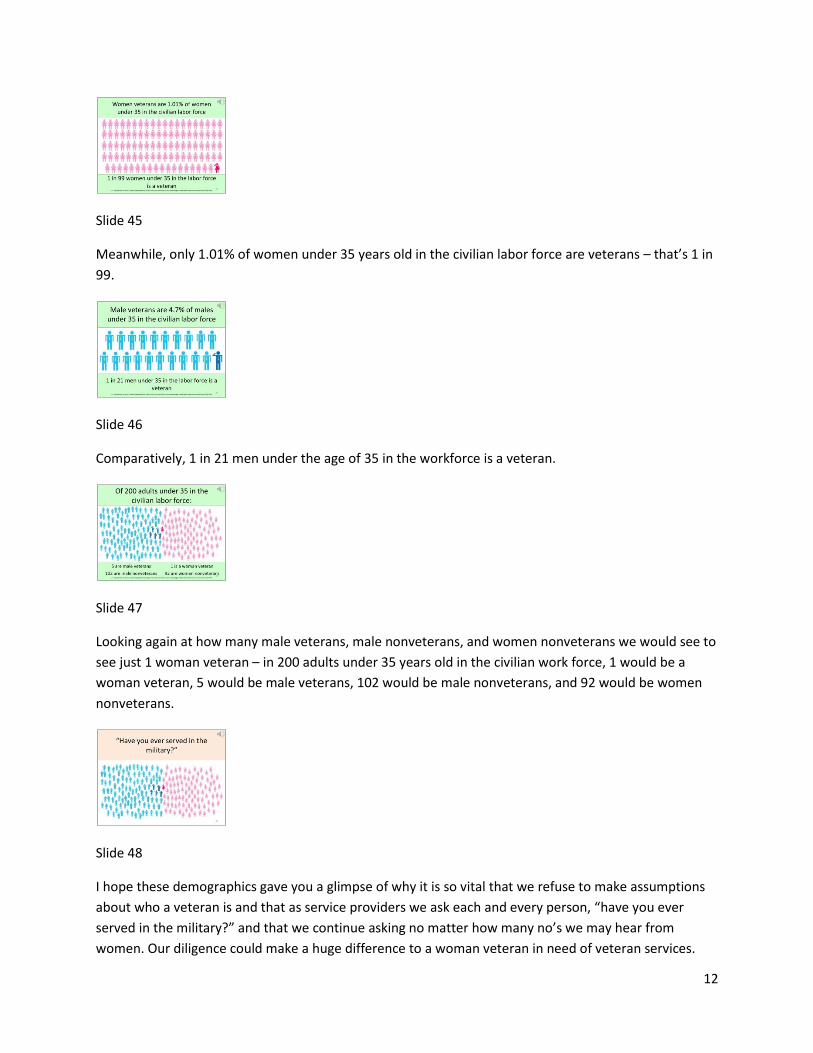
Meanwhile, only 1.01% of women under 35 years old in the civilian labor force are veterans – that’s 1 in
99.
Slide 46
Comparatively, 1 in 21 men under the age of 35 in the workforce is a veteran.
Slide 47
Looking again at how many male veterans, male nonveterans, and women nonveterans we would see to
see just 1 woman veteran – in 200 adults under 35 years old in the civilian work force, 1 would be a
woman veteran, 5 would be male veterans, 102 would be male nonveterans, and 92 would be women
nonveterans.
Slide 48
I hope these demographics gave you a glimpse of why it is so vital that we refuse to make assumptions
about who a veteran is and that as service providers we ask each and every person, “have you ever
served in the military?” and that we continue asking no matter how many no’s we may hear from
women. Our diligence could make a huge difference to a woman veteran in need of veteran services.

13
Slide 49
It is also vital that women veterans own their service proudly, and tell people that they are a veteran as
often as they can. Every person you tell about your military service is one person who has now
interacted personally with a woman veteran and who is now a little less likely to assume all veterans are
men, or to assume that the next woman they meet is not a veteran.
Slide 50
Thank you for taking the time to view this webinar. Please feel free to download the PPT slides and to
use them as you see fit, and as always, please remember that free employment services are available in
your local area. Visit veterans.gov to learn more, or view the Employment Assistance for Women
Veterans webinar, also available at dol.gov/vets/womenveterans.