2016 Further Mathematics Written examination 2 · PDF fileFURTHER MATHEMATICS Written...
37
FURTHER MATHEMATICS Written examination 2 Monday 31 October 2016 Reading time: 9.00 am to 9.15 am (15 minutes) Writing time: 9.15 am to 10.45 am (1 hour 30 minutes) QUESTION AND ANSWER BOOK Structure of book Section A – Core Number of questions Number of questions to be answered Number of marks 7 7 36 Section B – Modules Number of modules Number of modules to be answered Number of marks 4 2 24 Total 60 • Students are to write in blue or black pen. • Students are permitted to bring into the examination room: pens, pencils, highlighters, erasers, sharpeners, rulers, one bound reference, one approved technology (calculator or software) and, if desired, one scientific calculator. Calculator memory DOES NOT need to be cleared. For approved computer-based CAS, full functionality may be used. • Students are NOT permitted to bring into the examination room: blank sheets of paper and/or correction fluid/tape. Materials supplied • Question and answer book of 33 pages. • Formula sheet. • Working space is provided throughout the book. Instructions • Write your student number in the space provided above on this page. • Unless otherwise indicated, the diagrams in this book are not drawn to scale. • All written responses must be in English. At the end of the examination • You may keep the formula sheet. Students are NOT permitted to bring mobile phones and/or any other unauthorised electronic devices into the examination room. © VICTORIAN CURRICULUM AND ASSESSMENT AUTHORITY 2016 SUPERVISOR TO ATTACH PROCESSING LABEL HERE Victorian Certificate of Education 2016 STUDENT NUMBER Letter
Transcript of 2016 Further Mathematics Written examination 2 · PDF fileFURTHER MATHEMATICS Written...

FURTHER MATHEMATICSWritten examination 2
Monday 31 October 2016 Reading time: 9.00 am to 9.15 am (15 minutes) Writing time: 9.15 am to 10.45 am (1 hour 30 minutes)
QUESTION AND ANSWER BOOK
Structure of bookSection A – Core Number of
questionsNumber of questions
to be answeredNumber of
marks
7 7 36Section B – Modules Number of
modulesNumber of modules
to be answeredNumber of
marks
4 2 24 Total 60
• Studentsaretowriteinblueorblackpen.• Studentsarepermittedtobringintotheexaminationroom:pens,pencils,highlighters,erasers,
sharpeners,rulers,oneboundreference,oneapprovedtechnology(calculatororsoftware)and,ifdesired,onescientificcalculator.CalculatormemoryDOESNOTneedtobecleared.Forapprovedcomputer-basedCAS,fullfunctionalitymaybeused.
• StudentsareNOTpermittedtobringintotheexaminationroom:blanksheetsofpaperand/orcorrectionfluid/tape.
Materials supplied• Questionandanswerbookof33pages.• Formulasheet.• Workingspaceisprovidedthroughoutthebook.
Instructions• Writeyourstudent numberinthespaceprovidedaboveonthispage.• Unlessotherwiseindicated,thediagramsinthisbookarenotdrawntoscale.• AllwrittenresponsesmustbeinEnglish.
At the end of the examination• Youmaykeeptheformulasheet.
Students are NOT permitted to bring mobile phones and/or any other unauthorised electronic devices into the examination room.
©VICTORIANCURRICULUMANDASSESSMENTAUTHORITY2016
SUPERVISOR TO ATTACH PROCESSING LABEL HEREVictorian Certificate of Education 2016
STUDENT NUMBER
Letter
2016FURMATHEXAM2 2
do
no
t w
rit
e i
n t
his
ar
ea
do
no
t w
rit
e i
n t
his
ar
ea
SECTION A – Question 1 – continued
Data analysis
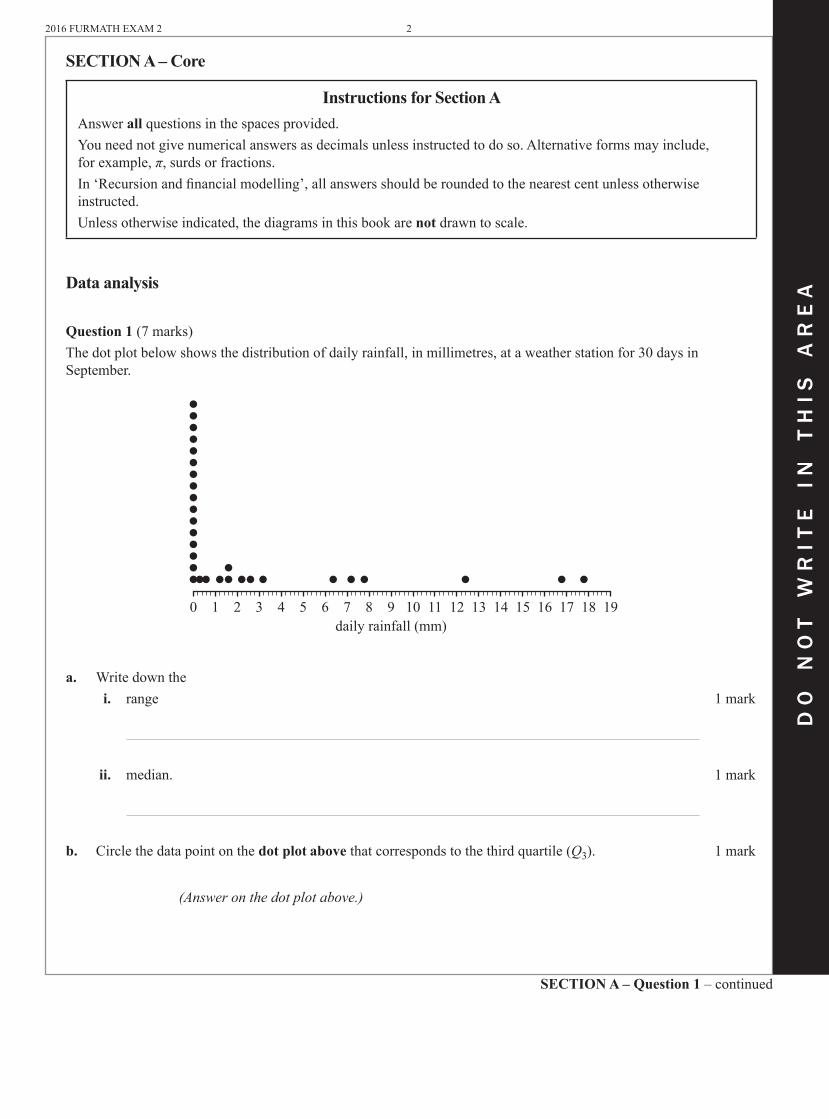
Question 1 (7marks)Thedotplotbelowshowsthedistributionofdailyrainfall,inmillimetres,ataweatherstationfor30daysinSeptember.
0 1 2 3 4 5 6 7 8 9daily rainfall (mm)
10 11 12 13 14 15 16 17 18 19
a. Writedownthe i. range 1mark
ii. median. 1mark
b. Circlethedatapointonthedot plot abovethatcorrespondstothethirdquartile(Q3). 1mark
(Answer on the dot plot above.)
SECTION A – Core
Instructions for Section AAnswerallquestionsinthespacesprovided.Youneednotgivenumericalanswersasdecimalsunlessinstructedtodoso.Alternativeformsmayinclude, forexample,π,surdsorfractions.In‘Recursionandfinancialmodelling’,allanswersshouldberoundedtothenearestcentunlessotherwiseinstructed.Unlessotherwiseindicated,thediagramsinthisbookarenotdrawntoscale.

3 2016FURMATHEXAM2
SECTION A – continuedTURN OVER
do
no
t w
rit
e i
n t
his
ar
ea
do
no
t w
rit
e i
n t
his
ar
ea
c. Writedown
i. thenumberofdaysonwhichnorainfallwasrecorded 1mark
ii. thepercentageofdaysonwhichthedailyrainfallexceeded12mm. 1mark
d. UsethegridbelowtoconstructahistogramthatdisplaysthedistributionofdailyrainfallforthemonthofSeptember.Useintervalwidthsoftwowiththefirstintervalstartingat0. 2marks
222018161412frequency1086420
0 2 4 6 8 10daily rainfall (mm)
12 14 16 18
2016FURMATHEXAM2 4
do
no
t w
rit
e i
n t
his
ar
ea
do
no
t w
rit
e i
n t
his
ar
ea
SECTION A – Question 2 – continued
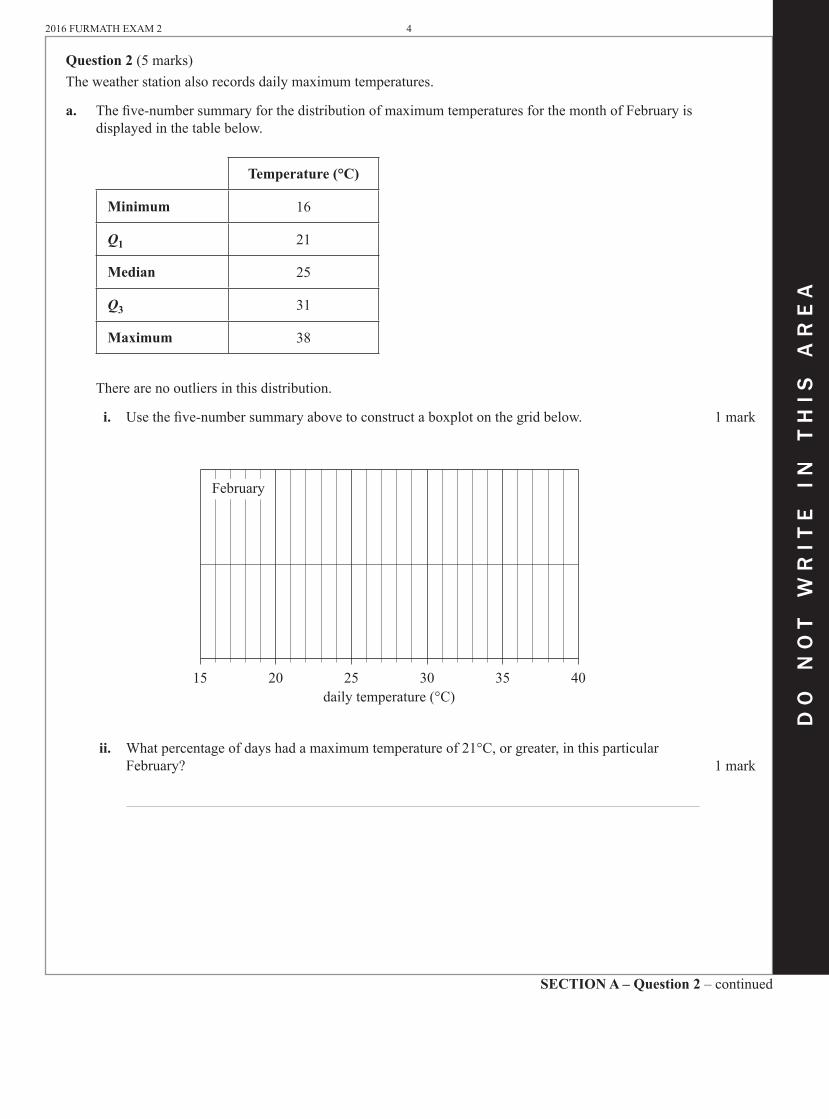
Question 2 (5marks)Theweatherstationalsorecordsdailymaximumtemperatures.
a. Thefive-numbersummaryforthedistributionofmaximumtemperaturesforthemonthofFebruaryisdisplayedinthetablebelow.
Temperature (°C)
Minimum 16
Q1 21
Median 25
Q3 31
Maximum 38
Therearenooutliersinthisdistribution.
i. Usethefive-numbersummaryabovetoconstructaboxplotonthegridbelow. 1mark
15 20 25daily temperature (°C)
30 35 40
February
ii. Whatpercentageofdayshadamaximumtemperatureof21°C,orgreater,inthisparticularFebruary? 1mark

5 2016FURMATHEXAM2
SECTION A – continuedTURN OVER
do
no
t w
rit
e i
n t
his
ar
ea
do
no
t w
rit
e i
n t
his
ar
ea
b. TheboxplotsbelowdisplaythedistributionofmaximumdailytemperatureforthemonthsofMayandJuly.
month
6 8 10 12temperature (°C)
14 16 18 20
July
May
i. Describetheshapesofthedistributionsofdailytemperature (includingoutliers)forJulyand forMay. 1mark
July
May
ii. DeterminethevalueoftheupperfencefortheJulyboxplot. 1mark
iii. Usingtheinformationfromtheboxplots,explainwhythemaximumdailytemperature is associatedwiththemonthoftheyear.Quotethevaluesofappropriatestatisticsinyourresponse. 1mark

2016FURMATHEXAM2 6
do
no
t w
rit
e i
n t
his
ar
ea
do
no
t w
rit
e i
n t
his
ar
ea
SECTION A – Question 3 – continued
Question 3 (8marks)Thedatainthetablebelowshowsasampleofactualtemperaturesandapparenttemperaturesrecordedattheweatherstation.Ascatterplotofthedataisalsoshown.Thedatawillbeusedtoinvestigatetheassociationbetweenthevariablesapparent temperature and actual temperature.
Apparent temperature (°C)
Actual temperature (°C)
24.7 28.5
24.3 27.6
24.9 27.7
23.2 26.9
24.2 26.6
22.6 25.5
21.5 24.4
20.6 23.8
19.4 22.3
18.4 22.1
17.6 20.9
18.7 21.2
18.2 20.5
a. Usethescatterplottodescribetheassociationbetweenapparent temperature and actual temperature intermsofstrength,directionandform. 1mark
b. i. Determinetheequationoftheleastsquareslinethatcanbeusedtopredicttheapparent temperaturefromtheactual temperature.
Writethevaluesoftheinterceptandslopeofthisleastsquareslineintheappropriateboxesprovidedbelow.
Roundyouranswerstotwosignificantfigures. 3marks
apparent temperature = + × actual temperature
161718192021
apparenttemperature
(°C)
2223242526
20 21 22 23 24actual temperature (°C)
25 26 27 28 29
n = 13r2 = 0.97

7 2016FURMATHEXAM2
SECTION A – continuedTURN OVER
do
no
t w
rit
e i
n t
his
ar
ea
do
no
t w
rit
e i
n t
his
ar
ea
ii. Interprettheinterceptoftheleastsquareslineintermsofthevariablesapparent temperature and actual temperature. 1mark
c. Thecoefficientofdeterminationfortheassociationbetweenthevariablesapparent temperature and actual temperatureis0.97
Interpretthecoefficientofdeterminationintermsofthesevariables. 1mark
d. Theresidualplotobtainedwhentheleastsquareslinewasfittedtothedataisshownbelow.
1.5
1
0.5
0residual
–0.5
–1
–1.520 21 22 23 24
actual temperature (°C)25 26 27 28 29
i. Aresidualplotcanbeusedtotestanassumptionaboutthenatureoftheassociationbetweentwonumericalvariables.
Whatisthisassumption? 1mark
ii. Doestheresidualplotabovesupportthisassumption?Explainyouranswer. 1mark

2016FURMATHEXAM2 8
do
no
t w
rit
e i
n t
his
ar
ea
do
no
t w
rit
e i
n t
his
ar
ea
SECTION A – Question 4 – continued
Question 4 (4marks)Thetimeseriesplotbelowshowstheminimum rainfall recordedattheweatherstationeachmonthplottedagainstthemonth number(1=January,2=February,andsoon).Rainfallisrecordedinmillimetres.Thedatawascollectedoveraperiodofoneyear.
unsmoothedfive-mediansmoothed
Key1009080706050minimum
rainfall (mm)403020100
0 1 2 3 4 5 6 7month number
8 9 10 11 12 13
a. Five-mediansmoothinghasbeenusedtosmooththetimeseriesplotabove. Thefirstfoursmoothedpointsareshownascrosses(×).
Completethefive-mediansmoothingbymarkingsmoothedvalueswithcrosses(×)onthetime series plot above. 2marks
(Answer on the time series plot above.)
9 2016FURMATHEXAM2
SECTION A – continuedTURN OVER
do
no
t w
rit
e i
n t
his
ar
ea
do
no
t w
rit
e i
n t
his
ar
ea
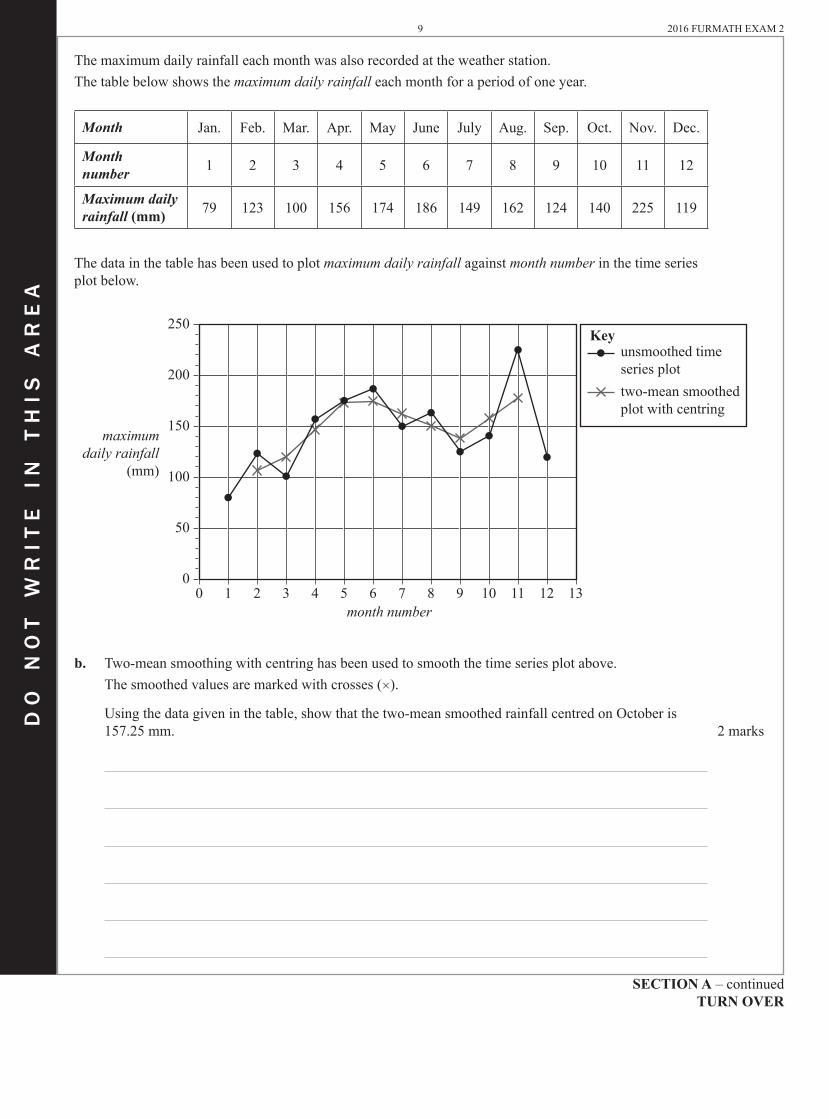
Themaximumdailyrainfalleachmonthwasalsorecordedattheweatherstation.Thetablebelowshowsthemaximum daily rainfalleachmonthforaperiodofoneyear.
Month Jan. Feb. Mar. Apr. May June July Aug. Sep. Oct. Nov. Dec.
Month number 1 2 3 4 5 6 7 8 9 10 11 12
Maximum daily rainfall (mm) 79 123 100 156 174 186 149 162 124 140 225 119
Thedatainthetablehasbeenusedtoplotmaximum daily rainfall againstmonth numberinthetimeseriesplotbelow.
unsmoothed timeseries plottwo-mean smoothedplot with centring
Key250
200
150maximum
daily rainfall(mm) 100
50
00 1 2 3 4 5 6 7
month number8 9 10 11 12 13
b. Two-meansmoothingwithcentringhasbeenusedtosmooththetimeseriesplotabove. Thesmoothedvaluesaremarkedwithcrosses(×).
Usingthedatagiveninthetable,showthatthetwo-meansmoothedrainfallcentredonOctoberis157.25mm. 2marks

2016FURMATHEXAM2 10
SECTION A – continued
do
no
t w
rit
e i
n t
his
ar
ea
do
no
t w
rit
e i
n t
his
ar
ea
Recursion and financial modelling
Question 5 (5marks)Kenhasopenedasavingsaccounttosavemoneytobuyanewcaravan.Theamountofmoneyinthesavingsaccountafternyears,Vn ,canbemodelledbytherecurrencerelationshownbelow.
V0=15000, Vn+1=1.04×Vn
a. HowmuchmoneydidKeninitiallydepositintothesavingsaccount? 1mark
b. UserecursiontowritedowncalculationsthatshowthattheamountofmoneyinKen’ssavingsaccountaftertwoyears,V2,willbe$16224. 1mark
c. Whatistheannualpercentagecompoundinterestrateforthissavingsaccount? 1mark
d. Theamountofmoneyintheaccountafternyears,Vn,canalsobedeterminedusingarule.
i. Completetherulebelowbywritingtheappropriatenumbersintheboxesprovided. 1mark
Vn = n ×
ii. HowmuchmoneywillbeinKen’ssavingsaccountafter10years? 1mark
11 2016FURMATHEXAM2
SECTION A – continuedTURN OVER
do
no
t w
rit
e i
n t
his
ar
ea
do
no
t w
rit
e i
n t
his
ar
ea
Question 6 (3marks)Ken’sfirstcaravanhadapurchasepriceof$38000.Aftereightyears,thevalueofthecaravanwas$16000.
a. Showthattheaveragedepreciationinthevalueofthecaravanperyearwas$2750. 1mark
b. LetCnbethevalueofthecaravannyearsafteritwaspurchased. Assumethatthevalueofthecaravanhasbeendepreciatedusingthe flat ratemethodofdepreciation.
Writedownarecurrencerelation,intermsofCn+1 and Cn,thatmodelsthevalueofthecaravan. 1mark
c. Thecaravanhastravelledanaverageof5000kmineachoftheeightyearssinceitwaspurchased. Assumethatthevalueofthecaravanhasbeendepreciatedusingtheunit costmethodofdepreciation.
Byhowmuchisthevalueofthecaravanreducedperkilometretravelled? 1mark

2016FURMATHEXAM2 12
do
no
t w
rit
e i
n t
his
ar
ea
do
no
t w
rit
e i
n t
his
ar
ea
END OF SECTION A
Question 7 (4marks)Kenhasborrowed$70000tobuyanewcaravan.Hewillbechargedinterestattherateof6.9%perannum,compoundingmonthly.
a. Forthefirstyear(12months),Kenwillmakemonthlyrepaymentsof$800.
i. FindtheamountthatKenwilloweonhisloanafterhehasmade12repayments. 1mark
ii. WhatisthetotalinterestthatKenwillhavepaidafter12repayments? 1mark
b. Afterthreeyears,Kenwillmakealumpsumpaymentof$Linordertoreducethebalanceofhisloan. ThislumpsumpaymentwillensurethatKen’sloanisfullyrepaidinafurtherthreeyears. Ken’srepaymentamountremainsat$800permonthandtheinterestrateremainsat6.9%perannum,
compoundingmonthly.
WhatisthevalueofKen’slumpsumpayment,$L? Roundyouranswertothenearestdollar. 2marks

13 2016FURMATHEXAM2
do
no
t w
rit
e i
n t
his
ar
ea
do
no
t w
rit
e i
n t
his
ar
ea
SECTION B – continuedTURN OVER
SECTION B – Modules
Instructions for Section BSelect twomodulesandanswerallquestionswithintheselectedmodules.Youneednotgivenumericalanswersasdecimalsunlessinstructedtodoso.Alternativeformsmayinclude, forexample,π,surdsorfractions.Unlessotherwiseindicated,thediagramsinthisbookarenotdrawntoscale.
Contents Page
Module1–Matrices................................................................................................................................................... 14
Module2–Networksanddecisionmathematics....................................................................................................... 20
Module3–Geometryandmeasurement.................................................................................................................... 24
Module4–Graphsandrelations................................................................................................................................ 30
2016FURMATHEXAM2 14
do
no
t w
rit
e i
n t
his
ar
ea
do
no
t w
rit
e i
n t
his
ar
ea
SECTION B – Module 1 – continued
Module 1 – Matrices
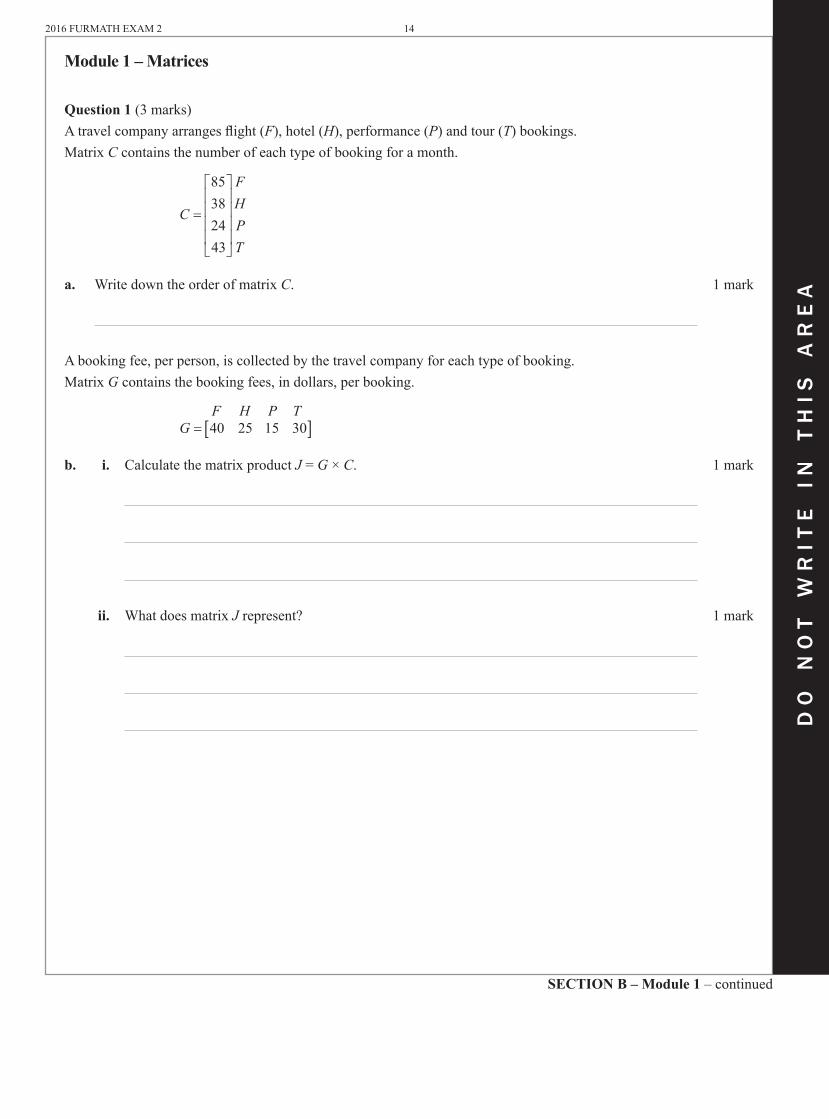
Question 1 (3marks)Atravelcompanyarrangesflight(F),hotel(H),performance(P)andtour(T)bookings.MatrixCcontainsthenumberofeachtypeofbookingforamonth.
C
FHPT
=
85382443
a. WritedowntheorderofmatrixC. 1mark
Abookingfee,perperson,iscollectedbythetravelcompanyforeachtypeofbooking.MatrixGcontainsthebookingfees,indollars,perbooking.
F H P TG = [ ]40 25 15 30
b. i. CalculatethematrixproductJ = G × C. 1mark
ii. WhatdoesmatrixJrepresent? 1mark

15 2016FURMATHEXAM2
do
no
t w
rit
e i
n t
his
ar
ea
do
no
t w
rit
e i
n t
his
ar
ea
SECTION B – Module 1 – continuedTURN OVER
Question 2 (2marks)Thetravelcompanyhasfiveemployees,Amara(A),Ben(B),Cheng(C),Dana(D)andElka(E).ThecompanyallowseachemployeetosendadirectmessagetoanotheremployeeonlyasshowninthecommunicationmatrixGbelow.ThematrixG2isalsoshownbelow.
receiverA B C D E
G sender
ABCDE
=
0 1 1 1 11 0 1 0 01 1 0 1 00 1 0 0 10 0 0 1 0
receiverA B C D E
G sender
ABCDE
2
2 2 1 2 11 2 1 2 11 2 2 1 21 0 1 1 00 1 0 0 1
=
The‘1’inrowE,columnDofmatrixGindicatesthatElka(sender)cansendadirectmessageto Dana(receiver).The‘0’inrowE,columnCofmatrixGindicatesthatElkacannotsendadirectmessagetoCheng.
a. TowhomcanDanasendadirectmessage? 1mark
b. ChengneedstosendamessagetoElka,butcannotdothisdirectly.
WritedownthenamesoftheemployeeswhocansendthemessagefromChengdirectlytoElka. 1mark

2016FURMATHEXAM2 16
do
no
t w
rit
e i
n t
his
ar
ea
do
no
t w
rit
e i
n t
his
ar
ea
SECTION B – Module 1 – Question 3 – continued
Question 3 (7marks)Thetravelcompanyisstudyingthechoicebetweenair(A),land(L),sea(S)orno(N)travelbysomeofitscustomerseachyear.MatrixT,shownbelow,containsthepercentagesofcustomerswhoareexpectedtochangetheirchoiceoftravelfromyeartoyear.
this yearA L S N
T =
0 65 0 25 0 25 0 500 15 0 60 0 20 0 150 05 0 10 0 25
. . . .
. . . .
. . . 00 200 15 0 05 0 30 0 15
.. . . .
ALSN
next year
LetSnbethematrixthatshowsthenumberofcustomerswhochooseeachtypeoftravelnyearsafter2014.MatrixS0belowshowsthenumberofcustomerswhochoseeachtypeoftravelin2014.
S
ALSN
0
5203208080
=
MatrixS1belowshowsthenumberofcustomerswhochoseeachtypeoftravelin2015.
S TSdef
ALSN
1 0
478
= =
a. WritethevaluesmissingfrommatrixS1(d,e,f)intheboxesprovidedbelow. 1mark
d = e = f =
b. Writeacalculationthatshowsthat478customerswereexpectedtochooseairtravelin2015. 1mark
17 2016FURMATHEXAM2
do
no
t w
rit
e i
n t
his
ar
ea
do
no
t w
rit
e i
n t
his
ar
ea
SECTION B – Module 1 – Question 3 – continuedTURN OVER
c. Considerthecustomerswhochoseseatravelin2014.
Howmanyofthesecustomerswereexpectedtochooseseatravelin2015? 1mark
d. Considerthecustomerswhowereexpectedtochooseairtravelin2015.
Whatpercentageofthesecustomershadalsochosenairtravelin2014? Roundyouranswertothenearestwholenumber. 1mark

2016FURMATHEXAM2 18
do
no
t w
rit
e i
n t
his
ar
ea
do
no
t w
rit
e i
n t
his
ar
ea
End of Module 1 – SECTION B – continued
In2016,thenumberofcustomersstudiedwasincreasedto1360.MatrixR2016,shownbelow,containsthenumberofthesecustomerswhochoseeachtypeoftravelin2016.
R
ALSN
2016
64646516485
=
Thecompanyintendstoincreasethenumberofcustomersinthestudyin2017andin2018.Thematrixthatcontainsthenumberofcustomerswhoareexpectedtochooseeachtypeoftravelin 2017(R2017)and2018(R2018)canbedeterminedusingthematrixequationsshownbelow.
R2017 = TR2016 + B R2018 = TR2017 + B
this yearA L S N
Twhere =
0 65 0 25 0 25 0 500 15 0 60 0 20 0 150 05 0 1
. . . .
. . . .
. . 00 0 25 0 200 15 0 05 0 30 0 15
808040. .
. . . .
=
ALSN
next year B
−−
80
ALSN
e. i. TheelementinthefourthrowofmatrixBis–80.
Explainthisnumberinthecontextofselectingcustomersforthestudiesin2017and2018. 1mark
ii. Determinethenumberofcustomerswhoareexpectedtochooseseatravelin2018. Roundyouranswertothenearestwholenumber. 2marks

19 2016FURMATHEXAM2
do
no
t w
rit
e i
n t
his
ar
ea
do
no
t w
rit
e i
n t
his
ar
ea
SECTION B – continuedTURN OVER
CONTINUES OVER PAGE

2016FURMATHEXAM2 20
do
no
t w
rit
e i
n t
his
ar
ea
do
no
t w
rit
e i
n t
his
ar
ea
SECTION B – Module 2 – continued
Module 2 – Networks and decision mathematics
Question 1 (3marks)Amapoftheroadsconnectingfivesuburbsofacity,Alooma(A),Beachton(B),Campville(C), Dovenest(D)andEasyside(E),isshownbelow.
Campville
Alooma
Beachton
Easyside
Dovenest
a. StartingatBeachton,whichtwosuburbscanbedriventousingonlyoneroad? 1mark
Agraphthatrepresentsthemapoftheroadsisshownbelow.
A
B
C
DE
OneoftheedgesthatconnectstovertexEismissingfromthegraph.
b. i. Addthemissingedgetothegraph above. 1mark
(Answer on the graph above.)
ii. ExplainwhattheloopatDrepresentsintermsofadriverwhoisdepartingfromDovenest. 1mark

21 2016FURMATHEXAM2
do
no
t w
rit
e i
n t
his
ar
ea
do
no
t w
rit
e i
n t
his
ar
ea
SECTION B – Module 2 – continuedTURN OVER
Question 2 (3marks)ThesuburbofAloomahasaskateboardparkwithsevenramps.TherampsareshownasverticesT,U,V,W,X,Y and Zonthegraphbelow.
V
WU
YT
Z X
rough
rough
ThetracksbetweenrampsU and VandbetweenrampsW and Xarerough,asshownonthegraphabove.
a. NathanbeginsskatingatrampWandfollowsanEuleriantrail.
AtwhichrampdoesNathanfinish? 1mark
b. ZoebeginsskatingatrampXandfollowsaHamiltonianpath. Thepathshechoosesdoesnotincludethetworoughtracks.
WritedownapaththatZoecouldtakefromstarttofinish. 1mark
c. Birracanskateoveranyofthetracks,includingtheroughtracks. HebeginsskatingatrampXandwillcompleteaHamiltoniancycle.
Inhowmanywayscouldhedothis? 1mark
2016FURMATHEXAM2 22
do
no
t w
rit
e i
n t
his
ar
ea
do
no
t w
rit
e i
n t
his
ar
ea
SECTION B – Module 2 – Question 3 – continued
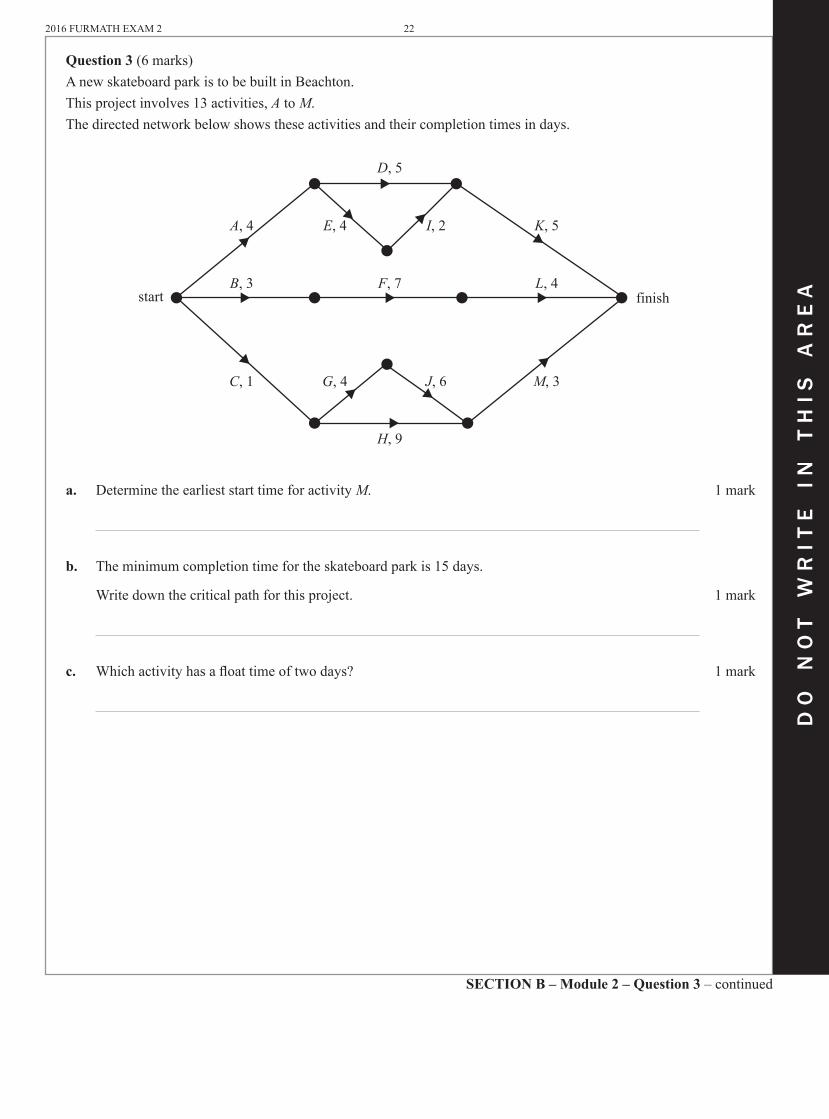
Question 3 (6marks)AnewskateboardparkistobebuiltinBeachton.Thisprojectinvolves13activities,A to M.Thedirectednetworkbelowshowstheseactivitiesandtheircompletiontimesindays.
D, 5
K, 5A, 4 E, 4 I, 2
L, 4F, 7B, 3
G, 4 J, 6 M, 3C, 1
H, 9
start finish
a. DeterminetheearlieststarttimeforactivityM. 1mark
b. Theminimumcompletiontimefortheskateboardparkis15days.
Writedownthecriticalpathforthisproject. 1mark
c. Whichactivityhasafloattimeoftwodays? 1mark

23 2016FURMATHEXAM2
do
no
t w
rit
e i
n t
his
ar
ea
do
no
t w
rit
e i
n t
his
ar
ea
End of Module 2 – SECTION B – continuedTURN OVER
d. ThecompletiontimesforactivitiesE,F,G,I and Jcaneachbereducedbyoneday. Thecostofreducingthecompletiontimebyonedayfortheseactivitiesisshowninthetablebelow.
Activity Cost ($)
E 3000
F 1000
G 5000
I 2000
J 4000
Whatistheminimumcosttocompletetheprojectintheshortesttimepossible? 1mark
e. Theskateboardparkprojectonpage22willberepeatedatCampville,butwiththeadditionofoneextraactivity.
Thenewactivity,N,willtakesixdaystocompleteandhasafloattimeofoneday. ActivityNwillfinishatthesametimeastheproject.
i. AddactivityNtothenetworkbelow. 1mark
D, 5
K, 5A, 4 E, 4 I, 2
L, 4F, 7B, 3
G, 4 J, 6 M, 3C, 1
H, 9
start finish
ii. WhatisthelateststarttimeforactivityN? 1mark
2016FURMATHEXAM2 24
do
no
t w
rit
e i
n t
his
ar
ea
do
no
t w
rit
e i
n t
his
ar
ea
SECTION B – Module 3 – continued
Module 3 – Geometry and measurement
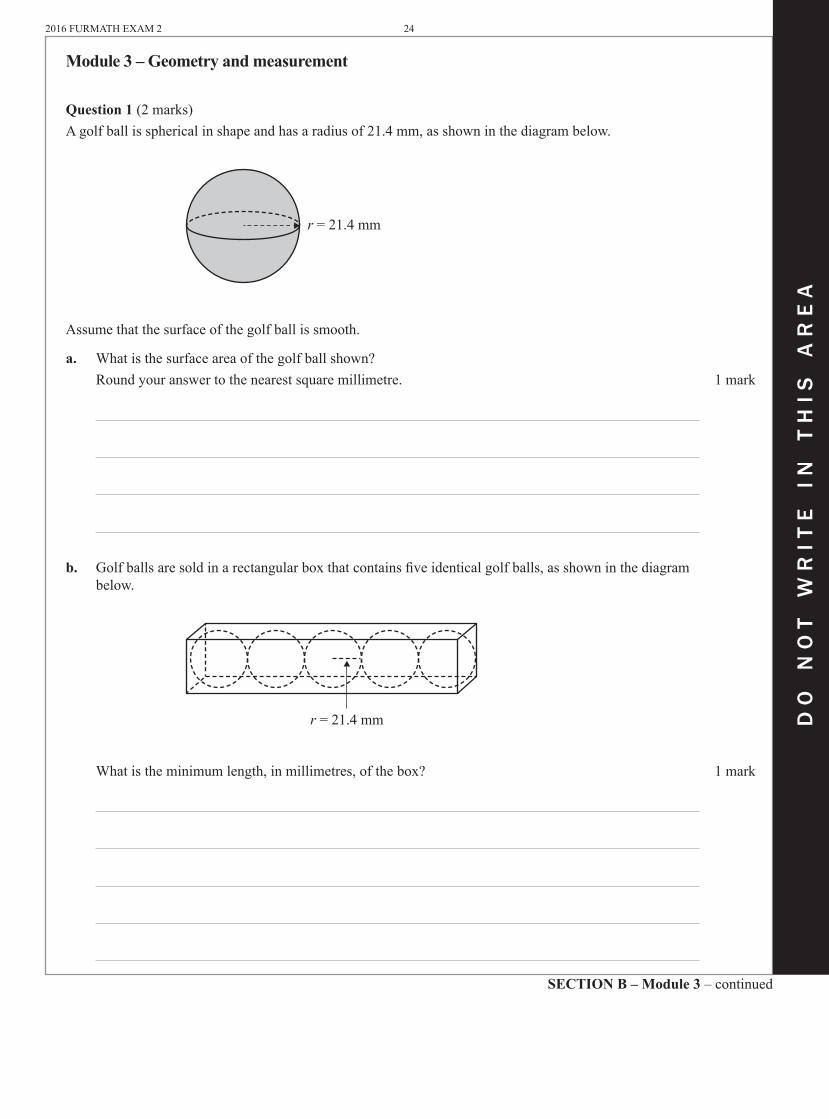
Question 1 (2marks)Agolfballissphericalinshapeandhasaradiusof21.4mm,asshowninthediagrambelow.
r = 21.4 mm
Assumethatthesurfaceofthegolfballissmooth.
a. Whatisthesurfaceareaofthegolfballshown? Roundyouranswertothenearestsquaremillimetre. 1mark
b. Golfballsaresoldinarectangularboxthatcontainsfiveidenticalgolfballs,asshowninthediagrambelow.
r = 21.4 mm
Whatistheminimumlength,inmillimetres,ofthebox? 1mark

25 2016FURMATHEXAM2
do
no
t w
rit
e i
n t
his
ar
ea
do
no
t w
rit
e i
n t
his
ar
ea
SECTION B – Module 3 – continuedTURN OVER
Question 2 (2marks)SalenapractisesgolfatadrivingrangebyhittinggolfballsfrompointT.ThefirstballthatSalenahitstravelsdirectlynorth,landingatpointA.ThesecondballthatSalenahitstravels50monabearingof030°,landingatpointB.Thediagrambelowshowsthepositionsofthetwoballsaftertheyhavelanded.
A
T
Bnorth
50 m
30°
a. Howfarapart,inmetres,arethetwogolfballs? 1mark
b. Afenceispositionedattheendofthedrivingrange. Thefenceis16.8mhighandis200mfromthepointT.
T200 m
16.8 mfence
WhatistheangleofelevationfromTtothetopofthefence? Roundyouranswertothenearestdegree. 1mark

2016FURMATHEXAM2 26
do
no
t w
rit
e i
n t
his
ar
ea
do
no
t w
rit
e i
n t
his
ar
ea
SECTION B – Module 3 – continued
Question 3 (2marks)AgolftournamentisplayedinStAndrews,Scotland,atlocation56°N,3°W.
a. AssumethattheradiusofEarthis6400km.
FindtheshortestgreatcircledistancetotheequatorfromStAndrews. Roundyouranswertothenearestkilometre. 1mark
b. ThetournamentbeginsonThursdayat6.32aminStAndrews,Scotland. ManypeopleinMelbournewillwatchthetournamentliveontelevision. AssumethatthetimedifferencebetweenMelbourne(38°S,145°E)andStAndrews(56°N,3°W)is
10hours.
OnwhatdayandatwhattimewillthetournamentbegininMelbourne? 1mark
27 2016FURMATHEXAM2
do
no
t w
rit
e i
n t
his
ar
ea
do
no
t w
rit
e i
n t
his
ar
ea
SECTION B – Module 3 – continuedTURN OVER
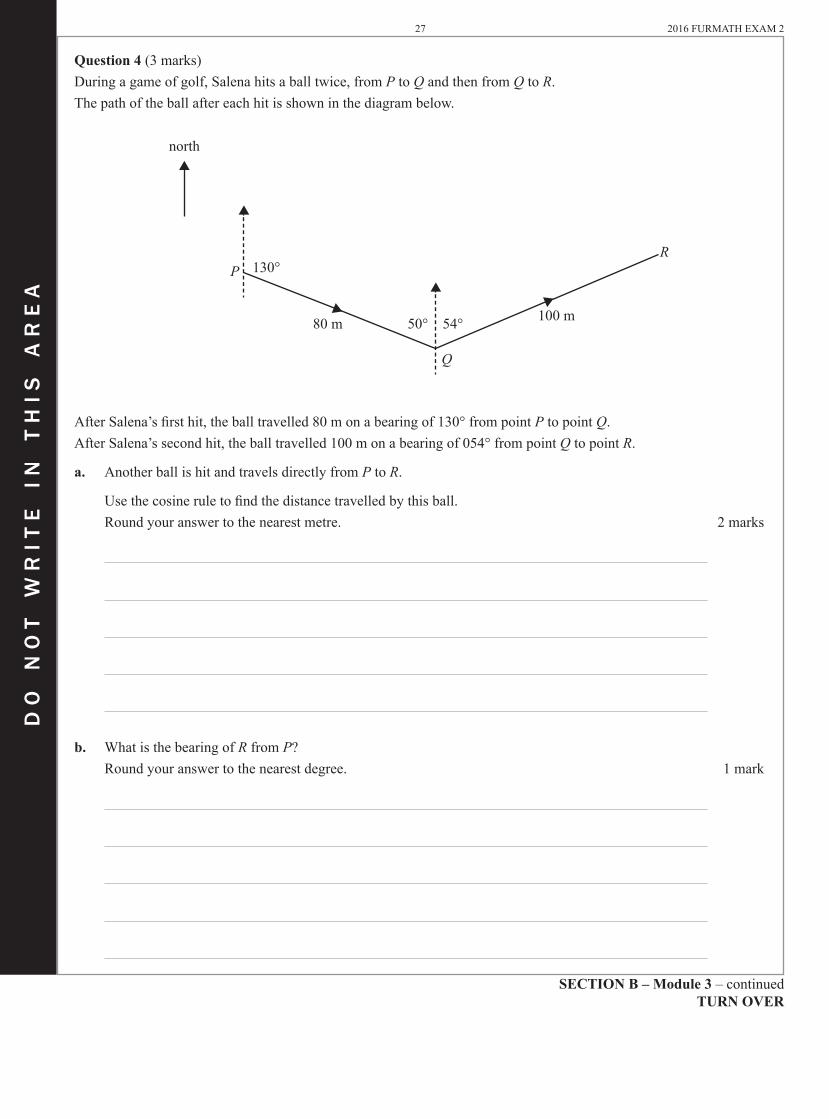
Question 4 (3marks)Duringagameofgolf,Salenahitsaballtwice,fromP to QandthenfromQ to R.Thepathoftheballaftereachhitisshowninthediagrambelow.
P
Q
R130°
50° 54°80 m 100 m
north
AfterSalena’sfirsthit,theballtravelled80monabearingof130°frompointPtopointQ.AfterSalena’ssecondhit,theballtravelled100monabearingof054°frompointQtopointR.
a. AnotherballishitandtravelsdirectlyfromP to R.
Usethecosineruletofindthedistancetravelledbythisball. Roundyouranswertothenearestmetre. 2marks
b. WhatisthebearingofRfromP? Roundyouranswertothenearestdegree. 1mark

2016FURMATHEXAM2 28
do
no
t w
rit
e i
n t
his
ar
ea
do
no
t w
rit
e i
n t
his
ar
ea
SECTION B – Module 3 – Question 5 – continued
Question 5 (3marks)Agolfcoursehasasprinklersystemthatwatersthegrassintheshapeofasector,asshowninthediagrambelow.
100°S
d
AsprinklerispositionedatpointSandcanturnthroughanangleof100°.Theshadedareaonthediagramshowstheareaofgrassthatiswateredbythesprinkler.
a. If147.5m2ofgrassiswatered,whatisthemaximumdistance,dmetres,thatthewaterreaches fromS?
Roundyouranswertothenearestmetre. 1mark

29 2016FURMATHEXAM2
do
no
t w
rit
e i
n t
his
ar
ea
do
no
t w
rit
e i
n t
his
ar
ea
End of Module 3 – SECTION B – continuedTURN OVER
b. Anothersprinklercanwateralargerareaofgrass. Thissprinklerwillwaterasectionofgrassasshowninthediagrambelow.
M
N
L
100°
area watered by sprinkler
4.5 m12 m
Thesectionofgrassthatiswateredis4.5mwideatallpoints. Watercanreachamaximumof12mfromthesprinkleratL.
Whatistheareaofgrassthatthissprinklerwillwater? Roundyouranswertothenearestsquaremetre. 2marks
2016FURMATHEXAM2 30
do
no
t w
rit
e i
n t
his
ar
ea
do
no
t w
rit
e i
n t
his
ar
ea
SECTION B – Module 4 – continued
Module 4 – Graphs and relations
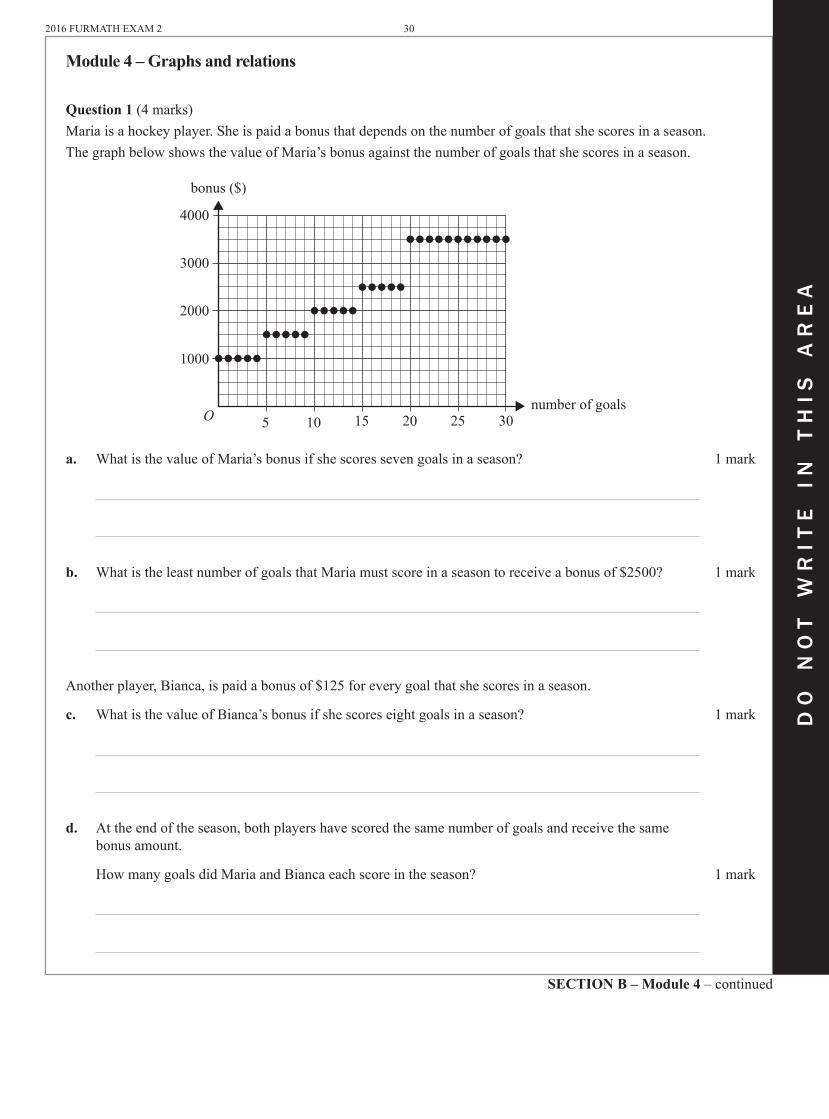
Question 1 (4marks)Mariaisahockeyplayer.Sheispaidabonusthatdependsonthenumberofgoalsthatshescoresinaseason.ThegraphbelowshowsthevalueofMaria’sbonusagainstthenumberofgoalsthatshescoresinaseason.
4000
3000
2000
1000
O 5 10 15 20 25 30
bonus ($)
number of goals
a. WhatisthevalueofMaria’sbonusifshescoressevengoalsinaseason? 1mark
b. WhatistheleastnumberofgoalsthatMariamustscoreinaseasontoreceiveabonusof$2500? 1mark
Anotherplayer,Bianca,ispaidabonusof$125foreverygoalthatshescoresinaseason.
c. WhatisthevalueofBianca’sbonusifshescoreseightgoalsinaseason? 1mark
d. Attheendoftheseason,bothplayershavescoredthesamenumberofgoalsandreceivethesamebonusamount.
HowmanygoalsdidMariaandBiancaeachscoreintheseason? 1mark
31 2016FURMATHEXAM2
do
no
t w
rit
e i
n t
his
ar
ea
do
no
t w
rit
e i
n t
his
ar
ea
SECTION B – Module 4 – continuedTURN OVER
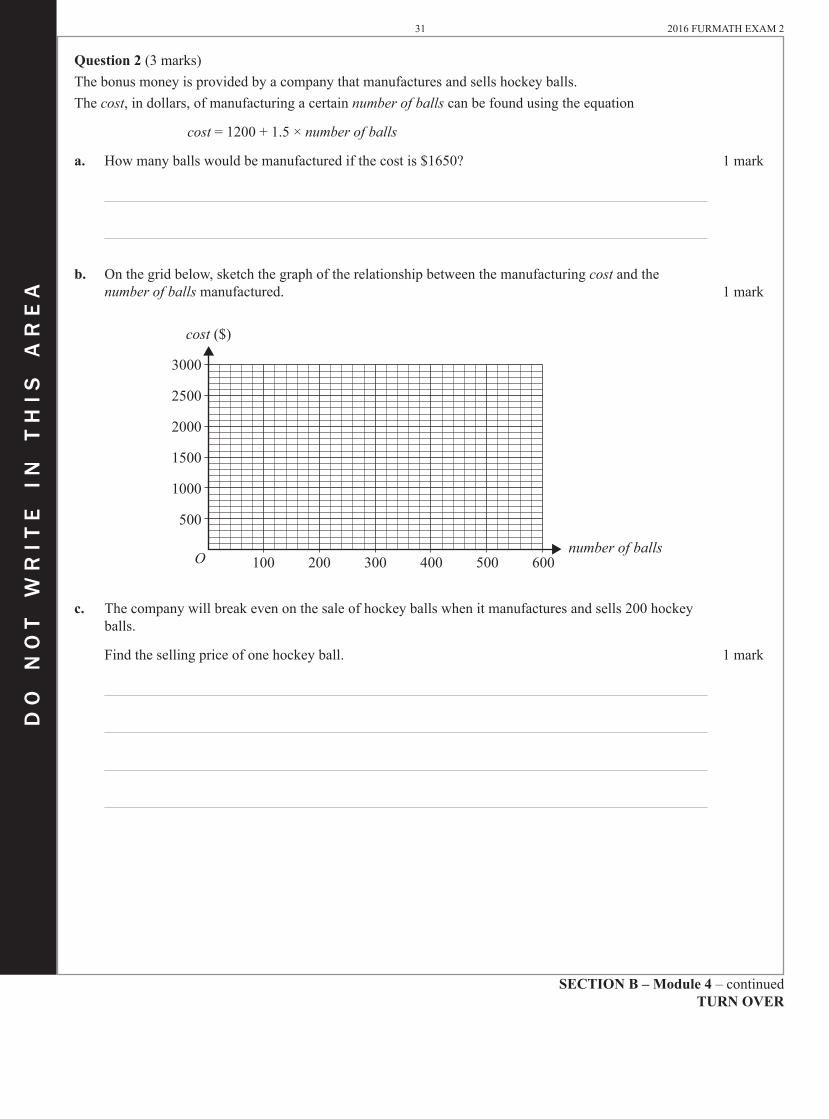
Question 2 (3marks)Thebonusmoneyisprovidedbyacompanythatmanufacturesandsellshockeyballs.Thecost,indollars,ofmanufacturingacertainnumber of ballscanbefoundusingtheequation
cost=1200+1.5×number of balls
a. Howmanyballswouldbemanufacturedifthecostis$1650? 1mark
b. Onthegridbelow,sketchthegraphoftherelationshipbetweenthemanufacturingcostandthe number of ballsmanufactured. 1mark
3000
2500
2000
1500
1000
500
O 100 200 300 400 500 600
cost ($)
number of balls
c. Thecompanywillbreakevenonthesaleofhockeyballswhenitmanufacturesandsells200hockeyballs.
Findthesellingpriceofonehockeyball. 1mark
2016FURMATHEXAM2 32
do
no
t w
rit
e i
n t
his
ar
ea
do
no
t w
rit
e i
n t
his
ar
ea
SECTION B – Module 4 – Question 3 – continued
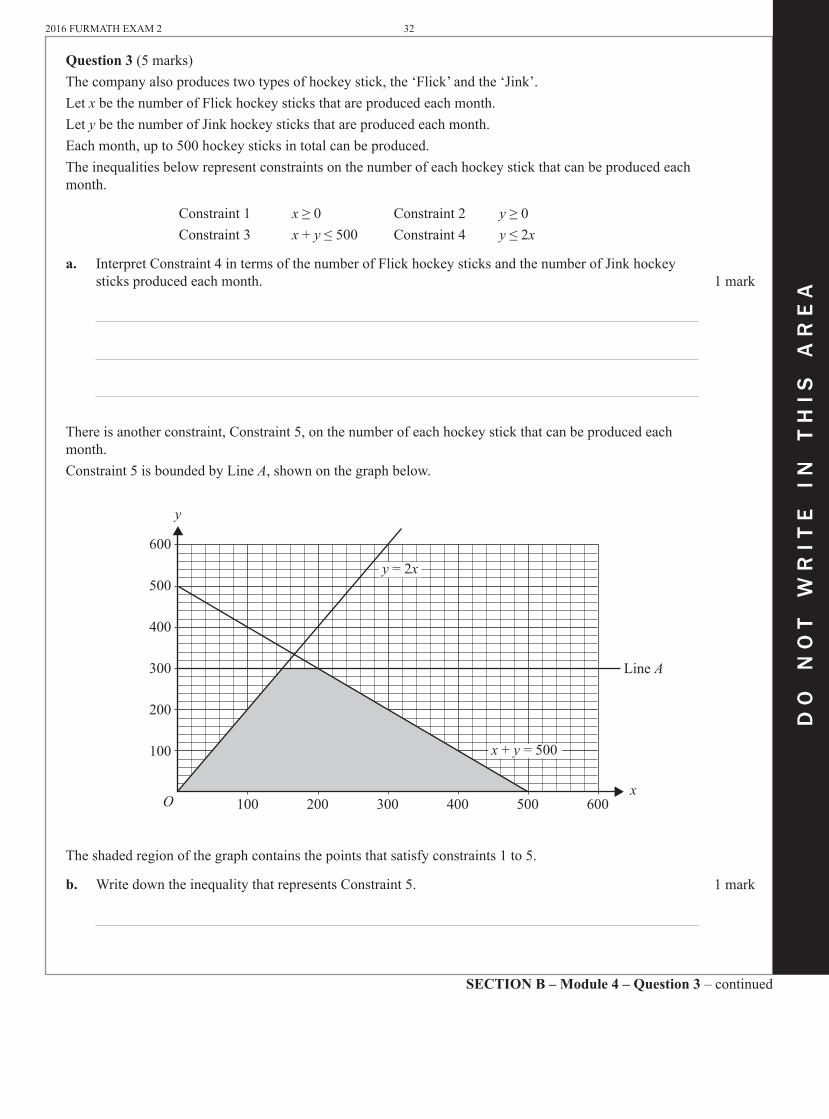
Question 3 (5marks)Thecompanyalsoproducestwotypesofhockeystick,the‘Flick’andthe‘Jink’.LetxbethenumberofFlickhockeysticksthatareproducedeachmonth.LetybethenumberofJinkhockeysticksthatareproducedeachmonth.Eachmonth,upto500hockeysticksintotalcanbeproduced.Theinequalitiesbelowrepresentconstraintsonthenumberofeachhockeystickthatcanbeproducedeachmonth.
Constraint1 x≥0 Constraint2 y≥0Constraint 3 x + y≤500 Constraint4 y≤2x
a. InterpretConstraint4intermsofthenumberofFlickhockeysticksandthenumberofJinkhockeysticksproducedeachmonth. 1mark
Thereisanotherconstraint,Constraint5,onthenumberofeachhockeystickthatcanbeproducedeachmonth.Constraint5isboundedbyLineA,shownonthegraphbelow.
600
500
400
300
200
100
O 100 200 300 400 500 600
y
x
Line A
y = 2x
x + y = 500
Theshadedregionofthegraphcontainsthepointsthatsatisfyconstraints1to5.
b. WritedowntheinequalitythatrepresentsConstraint5. 1mark

33 2016FURMATHEXAM2
do
no
t w
rit
e i
n t
his
ar
ea
do
no
t w
rit
e i
n t
his
ar
ea
Theprofit,P,thatthecompanymakesfromthesaleofthehockeysticksisgivenby
P = 62x + 86y
c. Findthemaximumprofitthatthecompanycanmakefromthesaleofthehockeysticks. 1mark
d. ThecompanywantstochangethesellingpriceoftheFlickandJinkhockeysticksinordertoincreaseitsmaximumprofitto$42000.
AlloftheconstraintsonthenumbersofFlickandJinkhockeysticksthatcanbeproducedeachmonthremainthesame.
Theprofit,Q,thatismadefromthesaleofhockeysticksisnowgivenby
Q = mx + ny
TheprofitmadeontheFlickhockeysticksismdollarsperhockeystick. TheprofitmadeontheJinkhockeysticksisndollarsperhockeystick. Themaximumprofitof$42000ismadebyselling400Flickhockeysticksand100Jinkhockey
sticks.
Whatarethevaluesofm and n? 2marks
END OF QUESTION AND ANSWER BOOK


FURTHER MATHEMATICS
Written examination 2
FORMULA SHEET
Instructions
This formula sheet is provided for your reference.A question and answer book is provided with this formula sheet.
Students are NOT permitted to bring mobile phones and/or any other unauthorised electronic devices into the examination room.
© VICTORIAN CURRICULUM AND ASSESSMENT AUTHORITY 2016
Victorian Certificate of Education 2016

FURMATH EXAM 2
Further Mathematics formulas
Core – Data analysis
standardised score z x xsx
=−
lower and upper fence in a boxplot lower Q1 – 1.5 × IQR upper Q3 + 1.5 × IQR
least squares line of best fit y = a + bx, where b rssy
x= and a y bx= −
residual value residual value = actual value – predicted value
seasonal index seasonal index = actual figuredeseasonalised figure
Core – Recursion and financial modelling
first-order linear recurrence relation u0 = a, un + 1 = bun + c
effective rate of interest for a compound interest loan or investment
r rneffective
n= +
−
×1
1001 100%
Module 1 – Matrices
determinant of a 2 × 2 matrix A a bc d=
, det A
acbd ad bc= = −
inverse of a 2 × 2 matrix AAd bc a
− =−
−
1 1det
, where det A ≠ 0
recurrence relation S0 = initial state, Sn + 1 = T Sn + B
Module 2 – Networks and decision mathematics
Euler’s formula v + f = e + 2

3 FURMATH EXAM
END OF FORMULA SHEET
Module 3 – Geometry and measurement
area of a triangle A bc=12
sin ( )θ
Heron’s formula A s s a s b s c= − − −( )( )( ), where s a b c= + +12
( )
sine ruleaA
bB
cCsin ( ) sin ( ) sin ( )
= =
cosine rule a2 = b2 + c2 – 2bc cos (A)
circumference of a circle 2π r
length of an arc r × × °π
θ180
area of a circle π r2
area of a sector πθr2
360×
°
volume of a sphere43π r 3
surface area of a sphere 4π r2
volume of a cone13π r 2h
volume of a prism area of base × height
volume of a pyramid13
× area of base × height
Module 4 – Graphs and relations
gradient (slope) of a straight line m y y
x x=
−−
2 1
2 1
equation of a straight line y = mx + c