2016First-Time Freshmen Enrollment by Race, Fall Terms 2007-2016 Summary of Registration Type, Fall...
181
2016 FACT BOOK Office of Institutional Effectiveness, Planning and Research mtsu.edu/iepr
Transcript of 2016First-Time Freshmen Enrollment by Race, Fall Terms 2007-2016 Summary of Registration Type, Fall...

2016 FACT BOOK
Office of Institutional Effectiveness, Planning and Research
mtsu.edu/iepr

TABLE OF CONTENTSGENERAL INFORMATION History of the University Mission Statement/Vision Statement & Community Standards The Tennessee Higher Education Commission The Tennessee Board of Regents MTSU Board of Trustees MTSU Administration MTSU Organization Chart (PDF)
ADMISSION Admission Standards Admission Application Statistics ACT Scores Top Tennessee High Schools of First-Time Freshmen
HEADCOUNT BY MAJOR Undergraduate Majors by College (Chart) Headcount, Student Credit Hours, and Full-Time Equivalents Summary Headcount, Student Credit Hours, and Full-Time Equivalents (FTE) Fall Terms 2014-16 First-Time, Full-Time Freshmen by College, Major, Gender and Ethnicity Undergraduate Majors by Gender and Enrollment Status Undergraduate Majors by Race Within College and Department Graduate Majors by Gender and Enrollment Status Graduate Majors by Race Students Credit Hours Taught by College, Department and Course Level Fall 2016
STUDENT DEMOGRAPHICS Snapshot of Fall 2016 Student Body Headcount by College, Classification and Gender Students by Ethnic Group Headcount by Race, Classification and Gender Student Age Information Student Enrollment Hours Carried by Classification Students by Classification and Gender (SCH & FTE) New and Returning Students by Classification and Gender Fall Semester Growth Transfer Institutions Types of Institutions from which Students Transferred Undergraduate Transfers by College, Department and Major Evening Students by Credit Hours and Gender by Classification Off-Campus Enrollment: Gender by Classification Off-Campus Enrollment by Location
1

Cont’d STUDENT DEMOGRAPHICS Alternative Delivery Courses Residency Status of Students Headcount Tennessee County Fall Terms 2015-2016 Headcount by Tennessee County (Map) Fall 2016 Headcount by State of Residence Comparison of Fall 2015-2016 Headcount by Country – Comparison of Fall 2015-2016 First-Time Freshmen Enrollment by State – Comparison of Fall 2015-2016 First-Time Freshmen Enrollment by County – Comparison of Fall 2015-2016 International Students (F or J Visas Only)
ACCREDITATION AND DEGREE Approved Accreditation AgenciesDegree and Major Offerings Summary Degrees Conferred: Academic Year 2015-2016 Degrees Conferred by College Affiliation, Department and Gender AY 2015-16 Undergraduate Degrees Conferred by College, Department, Race and Gender
AY 2015-16 Graduate Degrees Conferred by College, Department, Race and Gender AY 2015-16
RETENTION RATES AND GRADUATION RATES Official One-Year Retention Rates, MTSU Freshmen Cohorts: Fall Semesters 2004- 2014 (Graph) Official Freshmen Retention Rates, Tennessee Public Universities: Fall 2014 to Fall 2015MTSU Official Six-Year Graduation Rates, Fall Cohorts 2004 through 2009 (Graph) Official Six-Year Graduation Rates, Tennessee Public Universities: Fall 2009 Fr. Cohorts (Graph) Six-Year Graduation Rates, Fall 2009 First-Time Freshmen, who graduated
through 2015-16 from any Tennessee Public College or University
STUDENT-RELATED INFORMATION Division of Student Affairs, Enrollment, and Academic Services Career Housing and Residential Life Student Financial Assistance Summary Athletics Public Safety
FACULTY AND STAFF INFORMATION Faculty Profile by Age, Rank, and Tenure -- Fall 2016 Faculty Profile by Academic Department -- Fall 2016 Faculty Awards Full-Time University Employees Part-Time University Employees
2

ALUMNI RELATIONS Alumni Association 2016-2017 MTSU Alumni Distribution by Tennessee County MTSU Alumni in Tennessee (Map) MTSU Alumni Distribution by State MTSU Alumni in the United States (Map)
CENTERS AND CHAIRS Centers of Excellence Endowed Chairs Chairs of Excellence
BUDGET AND FINANCIAL INFORMATION Unrestricted Educational and General Revenues by Source Unrestricted Educational and General Expenditures Tuition and Fees Research Services
RESOURCES, SERVICES, AND FACILITIES MTSU Foundation James E. Walker Library Physical Facilities Inventory Campus Map
HISTORICAL DATA Degrees Conferred: Historical Trends Headcount by Gender, Fall Terms 1911-2016 Full-Time and Part-Time Headcount, Fall Terms 2007-2016 Students by Race, Fall Terms 2007-2016 First-Time Freshmen Enrollment by Race, Fall Terms 2007-2016 Summary of Registration Type, Fall Terms 2009-2016 Students by Permanent Residency, Fall Terms 2005-2016 Headcount by Tennessee County, Fall Terms 2007-2016 Out-of-State Students, Fall Terms 2007-2016 Total Student Credit Hours, Fall Terms 2006-2016
3
Office of Institutional Effectiveness, Planning and Research
www.mtsu.edu/iepr/
GENERAL INFORMATION 2016 FACT BOOK
History of the University Mission Statement/Vision Statement & Community Standards The Tennessee Higher Education Commission The Tennessee Board of Regents MTSU Board of Trustees MTSU Administration MTSU Organizational Chart (PDF)

The History of the University
Middle Tennessee State University began as Middle Tennessee State Normal School, opening its doors on Monday, September 11, 1911.
In 1909, the Tennessee General Assembly passed legislation to improve the system of public education by establishing a General Education Fund and creating three normal schools, one in each of the three grand divisions of the state. These institutions were to establish teaching standards or “norms,” hence the name. The Murfreesboro school began with four buildings on a dusty site that just a year earlier had been farmland.
Opening with a two-year program for training teachers, Middle Tennessee State Normal School evolved into a four-year teachers’ college in 1925 with the power of granting the Bachelor of Science degree. In 1943, the General Assembly designated the institution a state college. This new status marked a sharp departure from the founding purpose and opened the way for expanding curricular offerings and programs. In 1965, the institution advanced to university status.
Several significant milestones chart the progress from normal school to university and beyond. During the progressive movement from a two-year normal to a university, several significant milestones may be identified. Responding to the expressed needs of the institution’s service area, the Graduate School was established in 1951. The Bachelor of Arts was added that same year. To effect better communications and improve administrative supervision, the school’s concept was introduced in 1962.
Back to Table of Contents
As MTSU developed and grew, new degree programs included the Doctor of Arts in 1970 and the Specialist in Education in 1974. Library resources dramatically increased, and sophisticated computer services aided instruction and administration. A highly trained faculty enabled the University to continue growth in program offerings. In 1991, the University’s six schools-five undergraduate and the graduate school-became colleges. In 1998, MTSU’s Honors Program became the Honors College, the first in the state. In 2006, the Division of Continuing Studies and Public Service changed to the College of Continuing Education and Distance Learning. In 2002, approval was granted to redesignate three D.A. programs to Doctor of Philosophy programs, and subsequently five others have been approved. In the 2010 reorganization, Continuing Education and Distance Learning became the University College, and the College of Education and Behavioral Science became the College of Education and the College of Behavioral and Health Sciences. The Doctor of Education was approved in 2012.
Since 1911, MTSU has graduated more than 100,000 students. Despite the University’s growth from a campus of 100 acres, 125 students, and a faculty of 18, to an academic city of over 500 acres, more than 22,000 students, and a faculty of more than 900, the institution is still essentially a “people’s university” with a concern for the diverse needs of the area that it serves. In 1986, James McGill Buchanan (‘40) became the first MTSU alumnus to be awarded the Nobel Prize. Buchanan received the Nobel Memorial Prize in Economic Sciences for his development of the theory of public choice, a way of studying the expenditure of public funds. In 2011 the University celebrated its Centennial year with the theme “A Tradition of Excellence.” As the University looks forward to the next 100 years, the theme is exemplified as everyone in the University community-students, faculty, staff, alumni, and friends-strives to be the best.
Back to Table of Contents

Statement of Mission Middle Tennessee State University is a comprehensive university that embraces its role as the destination of choice for Tennessee undergraduates while expanding its reach nationally and internationally through signature programs and select master’s and doctoral programs. The University generates, preserves, and disseminates knowledge and innovation and uses scholarship to enhance teaching and public service. The University is committed to preparing students to thrive in their chosen professions and a changing global society.
A major public institution of higher learning, MTSU is a member of the State University and Community College System of Tennessee.
Approved March 25, 2011, by the Tennessee Board of Regents
Purpose To fulfill its mission, Middle Tennessee State University
• fosters a student-centered environment conducive to lifelong learning, personal development, andsuccess;
• offers a broad array of high quality, affordable academic programs grounded in a common core of artsand sciences;
• enhances access and academic opportunity for a diverse student population, including distance learningand other special services and programs for first generation, non-traditional, high-achieving, and transferstudents;
• challenges students through diverse teaching methods and media including educational technology,experiential learning, undergraduate and graduate research, and co-curricular and extra-curricularactivities;
• recruits exceptional faculty and develops resources to support excellence in instruction, research, creativeactivity, and public and professional service;
• develops and sustains academic partnerships, entrepreneurial activities, outreach and public service thatsupport instruction and research and that meet the needs of communities throughout the region; and
• serves as an emerging center for international study, understanding, and exchange.
Middle Tennessee State University educates students to
• think logically, critically, and creatively;• make sound judgments with an awareness of ethical, moral, and aesthetic values;• acquire a working knowledge of a discipline or a group of related disciplines;• examine, analyze, and shape the contemporary world through scientific knowledge, creative undertakings,
and an understanding of culture and history;• communicate clearly and precisely and understand the proper role of free expression in our society; and• demonstrate the effective and adaptive use of current and/or emerging technologies.
Vision Middle Tennessee State University will be a vibrant hub for educating accomplished students who are civically engaged and globally responsible citizens; a seedbed for research and entrepreneurship; and an engine of cultural and economic development.
Back to Table of Contents
Community Standards MTSU is committed to developing and nurturing a community devoted to learning, growth, and service. Each person who joins or affiliates with the community does so freely and accepts and practices the following core values and expectations:
• Honesty and Integrity. The notions of personal and academic honesty and integrity are central to theexistence of the MTSU community. All members of the community will strive to achieve and maintainthe highest standards of academic achievement in the classroom and personal and social responsibility on-and off-campus.
• Respect for Diversity. The MTSU community is composed of individuals representing different races,ethnicities, sexual orientations, cultures, and ways of thinking. We respect individual differences andunique perspectives and acknowledge our commonalities.
• Engagement in the Community. All members of the community are encouraged to participate ineducationally purposeful activities that support and enhance the MTSU experience. Active involvementand personal investment in the classroom and throughout the community are hallmarks of an engagedcitizen.
• Commitment to Non-violence. MTSU is committed to the principles of nonviolence and peacefulconflict resolution. Community members will freely express their ideas and resolve differences usingreason and persuasion.
Source: MTSU Undergraduate Catalog
Back to Table of Contents

THE TENNESSEE HIGHER EDUCATION COMMISSION
The Tennessee Higher Education Commission was created in 1967 by the Tennessee General Assembly to achieve coordination and foster unity with regard to higher education in the state. The commission coordinates and provides guidance to the institutions governed by the University of Tennessee Board of Trustees, the six locally-governed state universities, and the community colleges, and colleges of applied technology governed by the Tennessee Board of Regents. There are currently nine public universities, two special purpose institutes, 13 community colleges, and 27 colleges of applied technology in Tennessee that serve approximately 250,000 students.
The Commission is composed of nine voting members appointed from the general public, each serving six-year terms and representing the Grand Divisions of the State equally; three Constitutional Officers who are ex-officio voting members (Comptroller of the Treasury, State Treasurer, and Secretary of State); two ex-officio student members; and the Executive Director of the State Board of Education, as an ex-officio non-voting member.
2016-2017 COMMISSION MEMBERS
Evan Cope, Chair, Murfreesboro – 4th Congressional District Keith Wilson, Vice Chair, Kingsport – 1st Congressional District David Kustoff, Vice Chair, Germantown – 8th Congressional District A C Wharton, Jr., Secretary, Memphis – 9th Congressional District Tre Hargett, Secretary of State Justin P. Wilson, State Comptroller David H. Lillard, Jr., State Treasurer Mintha Roach, Knoxville – 2nd Congressional District Pam Koban, Nashville – 5th Congressional District Pam Martin, Mt. Juliet – 6th Congressional District Bill Lee, Franklin – 7th Congressional District Dr. Nancy Dishner – East Tennessee Dr. Sara Heyburn, non-voting ex officio, Executive Director, State Board of Education Siri Kadire, voting ex-officio, University of Tennessee Health Science Center
Source: The Tennessee Higher Education Commission (www.state.tn.gov/thec)
Back to Table of Contents

The Tennessee Board of Regents
The Tennessee Board of Regents was created in 1972 by the General Assembly as the governing body of the State University and Community College System of Tennessee. The system consists of 46 separate institutions--six state universities, 13 community colleges, and 27 colleges of applied technology. Each type of institution -- university, community college, and college of applied technology offer classes in almost all of Tennessee’s 95 counties – and has its own mission. The universities educate students seeking bachelor's and advanced degrees and work to create new knowledge through research. The community colleges prepare students for transfer to a university as well as for direct entry into the workforce. And the colleges of applied technology are focused on workforce development. Counting our institutions' centers and other off-campus locations, TBR institutions offer classes across the state to some 200,000 students. All of our campuses welcome inquiries and visitors.
The Honorable Bill Haslam, Governor Emily J. Reynolds, Vice Chair, At-Large, Middle, 2012-2018 MaryLou Apple, Ph.D., 6th Congressional District, 2015-2018 Greg Duckett, 9th Congressional District, 2012-2018 Alex Fitzner, Faculty Regent, 2016-2017 Darrell S. Freeman, Sr., 7th Congressional District, 2012-2016 Tom Griscom, 3rd Congressional District, 2010-2017 Mike Krause, Ex-Officio Executive Director TN Higher Education Commission Fran Marcum, 4th Congressional District, 2004-2016 Candice McQueen, Ph.D., Ex-Officio Regent Commissioner of Education Barbara U. Prescott, Ph.D., 8th Congressional District, 2014-2020 Howard W. Roddy, At-Large, East, 2004-2016 Nick Russell, Student Regent, 2015-2016 Leigh A. Shockey, At-Large, West, 2014-2020 J. Parker Smith, 1st Congressional District, 2013-2019 Jai Templeton, Ex-Officio Regent, 36th Commissioner of Agriculture Robert P. Thomas, 5th Congressional District, 2005-2015 Danni B. Varlan, 2nd Congressional District, 2010-2018
Source: The Tennessee Board of Regents (www.tbr.edu)
Back to Table of Contents

Board of Trustees Overview of the New Governance Structure
Middle Tennessee State University’s Board of Trustees is being established under the auspices of the Focus on College and University Success (FOCUS) legislation that was introduced by Gov. Bill Haslam in 2015 and, in 2016, passed by the General Assembly and signed into law. Until the new board is seated, MTSU is governed by the Tennessee Board of Regents (TBR).
The FOCUS Act calls for the Board of Trustees to be the University’s governing body. The Board is comprised of ten (10) members of which nine (9) members shall be voting members and one (1) member shall be a nonvoting member. Of the (9) voting members, at least six (6) members shall be residents of the State of Tennessee. Eight (8) of the voting members will be appointed by the Governor of the State of Tennessee with at least three (3) being alumni of the University. A University faculty member shall serve as one (1) voting Board member to be selected by the University Faculty Senate. The nonvoting member shall be a student representative to be appointed by the Board.
The governor on Oct. 13, 2016, announced eight appointees to the MTSU board. The appointments, subject to approval by the General Assembly, are effective Jan. 16, 2017. They are:
W. Andrew Adams J. B. Baker Pete Delay Darrell Freeman Joey Jacobs Chris Karbowiak Stephen Smith Pamela Wright
The University Faculty Senate chose Dr. Tony Johnston, a professor in the Department of Agribusiness and Agriscience in the College of Basic and Applied Sciences, to be the first faculty representative of the Board. The Board will determine a process for the selection of a student representative.
Back to Table of Contents
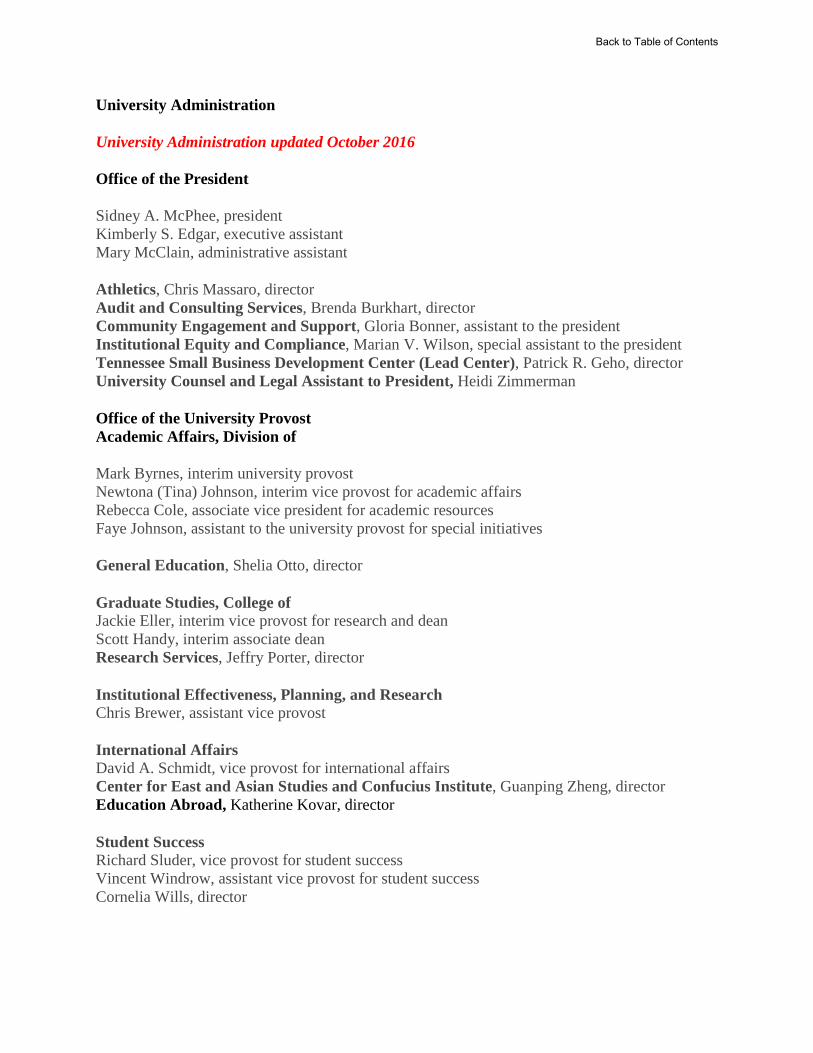
University Administration
University Administration updated October 2016
Office of the President
Sidney A. McPhee, president Kimberly S. Edgar, executive assistant Mary McClain, administrative assistant
Athletics, Chris Massaro, director Audit and Consulting Services, Brenda Burkhart, director Community Engagement and Support, Gloria Bonner, assistant to the president Institutional Equity and Compliance, Marian V. Wilson, special assistant to the president Tennessee Small Business Development Center (Lead Center), Patrick R. Geho, director University Counsel and Legal Assistant to President, Heidi Zimmerman
Office of the University Provost Academic Affairs, Division of
Mark Byrnes, interim university provost Newtona (Tina) Johnson, interim vice provost for academic affairs Rebecca Cole, associate vice president for academic resources Faye Johnson, assistant to the university provost for special initiatives
General Education, Shelia Otto, director
Graduate Studies, College of Jackie Eller, interim vice provost for research and dean Scott Handy, interim associate dean Research Services, Jeffry Porter, director
Institutional Effectiveness, Planning, and Research Chris Brewer, assistant vice provost
International Affairs David A. Schmidt, vice provost for international affairs Center for East and Asian Studies and Confucius Institute, Guanping Zheng, director Education Abroad, Katherine Kovar, director
Student Success Richard Sluder, vice provost for student success Vincent Windrow, assistant vice provost for student success Cornelia Wills, director
Back to Table of Contents

University Honors, College of, John R. Vile, dean Philip E. Phillips, associate dean
Walker Library, Bonnie Allen, dean
Walker Library, Jason Martin, associate dean Library User Services, Christy Groves, chair Library Collection Development and Management Development, David Nelson, chair
Basic and Applied Sciences, College of Robert “Bud” Fischer, dean Saeed Foroudastan, associate dean Aerospace, Wendy Beckman, chair Agribusiness and Agriscience, Jessica Carter, school director Biology, Lynn Boyd, chair Chemistry, Greg Van Patten, chair Computer Science, Chrisila C. Pettey, chair Concrete Industry Management, Heather J. Brown, chair Engineering Technology, Walter Boles, chair Geosciences, Warner Cribb, chair Mathematical Sciences, Donald A. Nelson, chair Military Science, LTC Jackie McDowell, chair Physics and Astronomy, Ron Henderson, chair
Behavioral and Health Sciences, College of Harold D. Whiteside, dean Scott Colclough, interim associate dean Criminal Justice Administration, Lance Selva, interim chair Health and Human Performance, Doug Winborn, interim chair Human Sciences, Deborah Belcher, chair Nursing, Jenny Sauls, school director Psychology, Greg Schmidt, chair Social Work, Michael Sherr, chair
Business, Jennings A. Jones College of David Urban, dean David Foote, associate dean Kim Sokoya, associate dean for graduate and executive education Lara Daniel, assistant dean for assessment Accounting, Jeannie J. Harrington, interim chair Computer Information Systems, Charles Apigian, chair Economics and Finance, Keith Gamble, chair Management, Jill Austin, chair Marketing, Vince Smith, interim chair
Back to Table of Contents

Education, College of Lana Seivers, dean Rick Vanosdall, interim associate dean Womack Educational Leadership, James O. Huffman, chair Elementary and Special Education, Robyn Ridgley, interim chair
Liberal Arts, College of Karen Petersen, interim dean Stephen Smith, interim associate dean Dawn McCormack, associate dean Art, Michael Baggerly, interim chair Communication Studies and Organizational Communication, Heather Hundley, chair English, Maria Bachman, chair Foreign Languages and Literatures, Roger Pieroni, chair History, Susan Myers-Shirk, interim chair Music, Michael Parkinson, school director Philosophy, Ron Bombardi, chair Political Science and International Relations, Stephen Morris, chair Sociology and Anthropology, Brandon Wallace, chair Theatre and Dance, Jeff Gibson, chair
Media and Entertainment, College of Ken Paulson, dean Zeny Sarabia-Panol, associate dean Electronic Media Communication, Billy Pittard, chair Journalism, Greg Pitts, school director Recording Industry, Beverly Keel, chair
University College David Gotcher, Associate dean Vacant, associate dean Peggy Carpenter, assistant dean University Studies, Marva Lucas, chair
Centers of Excellence Center for Historic Preservation, Carroll Van West, director Center for Popular Music, Gregory Reish, director
Chairs of Excellence The Jennings Jones Chair in Free Enterprise The Jennings Jones Chair in Urban and Regional Planning The John Seigenthaler Chair in First Amendment Studies, Deborah Fisher, director The Dr. Carl Adams Chair in HealthCare Services, M. Jo Edwards, chairholder The National HealthCare Chair in Nursing The Robert E. and Georgianna West Russell Chair in Manufacturing Excellence, Charles H. Perry, chairholder
Back to Table of Contents

The Katherine Davis Murfree Chair in Dyslexic Studies, Tim Odegard, chairholder John C. Miller Chair in Equine Reproductive Physiology Mary E. Miller Chair in Equine Health
Endowed Chairs Martin Chair of Insurance, Dave Wood, chairholder Weatherford Chair of Finance, vacant, chairholder The Wright Travel Chair in Entrepreneurship, William McDowell, chairholder
Business and Finance, Division of
Alan Thomas, vice president
Administration, Ron Malone, assistant vice president Administrative and Business Services, Kathryn D. Crisp, assistant vice president Budget Office, Kathy R. Thurman, assistant vice president Campus Planning, Patricia S. Miller, assistant vice president Facilities Services, Joe Whitefield, assistant vice president Human Resource Services, Kathy Musselman, assistant vice president Public Safety, Carl S. Peaster, assistant vice president and chief of police
Information Technology, Division of
Bruce Petryshak, vice president for information technology and CIO
Academic and Instructional Technologies, Barbara Draude, assistant vice president Client Services and IT Business Operations, Robin Jones, assistant vice president Enterprise Applications Services, Lisa Rogers, senior associate vice president and deputy CIO Technical Services and Information Security, Brian Holley, assistant vice president and ISO IT Projects and Portfolio Management, Tom Wallace, associate vice president
Marketing and Communications, Division of
Andrew Oppmann, vice president for marketing and communications
Creative and Visual Services, Kara Hooper, director News and Media Relations, Jimmy Hart, director Resource and Operations Management, Jack Ross, senior director University Publications, Drew Ruble, senior editor
Student Affairs, Division of
Debra Sells, vice president and vice provost for enrollment and academic services Career Development Center, Bill Fletcher, director Charlie and Hazel Daniels Veterans and Military Family, Hilary Miller, director Disability and Access Center, Lance Alexis, director
Back to Table of Contents

Student-Athlete Enhancement Center, Todd Wyant, director Student Support Services, Melissa Towe, director
Admissions and Enrollment Services Laurie Witherow, associate vice provost for admissions and enrollment services Enrollment Technical Systems, Teresa Thomas, director Financial Aid and Scholarships, Stephen White, director MT One Stop, Melinda Thomas, director Registrar/Scheduling, Susan Fieldhouse, registrar Undergraduate Recruitment, Linda Olsen, director
Student Life Sarah Sudak, associate vice president for student affairs and dean of students Campus Recreation Center, Charles Gregory, director Child Care Lab, Nancy James, director Counseling & Testing Services, Jane Tipps, director Housing and Residential Life, Michelle Safewright director Judicial Affairs & Mediation Services, Laura Sosh-Lightsy, assistant dean New Student and Family Programs, Gina Poff, director Student Health Services, Rick Chapman, director Student Programming, Rich Kershaw, director Student Union Facilities, Cynthia Stone, director
Dan Kelley, assistant vice president for student affairs Fraternity and Sorority Life, Leslie Merritt, director Intercultural and Diversity Affairs, Daniel Green, director June Anderson Women’s Center for Women and Nontraditional Students, Barbara Scales, director Student Organizations and Service, Jackie Victory, director Student Government, Madison Tracy, student body president
University Advancement, Division of
William J. “Joe” Bales, vice president
Advancement Services, Ronda Vaughter, director Alumni Relations, Ginger C. Freeman, director Development, Pat Branum, director
Source: MTSU Undergraduate Catalog & Provost Office
Back to Table of Contents

Tennessee Board of Regents
President
ChancellorTennessee Board of Regents
Executive Assistant to the President DirectorAthletics
Director Systemwide Internal Audit General Counsel
Administrative Assistant to the President
Assistant to the President for Institutional Equity and Compliance University Counsel &
Assistant to the President
DirectorAudit and Consulting Services
TN Small BusinessDevelopment Center-Lead
Center
Vice President o f Student Affairs and Vice Provost for Enrol lment and Academic
Services
Vice PresidentBusiness and Finance
Vice President for University Advancement
University ProvostVice President for
Information TechnologyAnd Chief Information
Officer
Vice ProvostResearch and Dean
College of Graduate Studies
Assistant to the Provost for Special
Initiatives
Associate Vice President Academic Resoures
DeanCollege of Business
DeanCollege of Education
DeanCollege of Liberal
Arts
DeanCollege of
Behavioral and Health Sciences
Dean College of Media &
Entertainment
Dean University Library
DeanUniversity Honors
College
Associate Vice President for Student Affa irs and Dean of
Students
DirectorLearning, Teaching,
and Innovative Technologies
Center
Special Advisor for Veterans Initiatives
Assistant Vice President
Budget & Financial Planning
Assistant to Vice President
Assistant Vice President
Human Resources
Assistant Vice President for
Student Affairs
Associate Vice Provost for
Admissions and EnrollmentServices
Associate Vice President for
Business & Finance
Assistant Vice President
Facilities Service
DirectorDevelopment
Director Alumni Relations
DirectorAdvancement
Services
Associate Vice President
Project and Portfolio Management
Assistant Vice President
Academic & Instructional Technologies
Senior Associate Vice President
Enterprise Application Services
Assistant Vice President
Technical Services and Information Security
Assistant Vice President Client Services and IT
Business Operations
Assistant Vice President
University Police
Assistant Vice President
Administration
Assistant Vice President
Campus Planning
Assistant Vice President
Administrative and Business Services
MIDDLE TENNESSEE STATE UNIVERSITY JULY BUDGET 2016-17
Vice President for Marketing and
Communications
Vice Provost for International Affairs
Disabled Student Services
Student Support Services
Student Athlete Enhancement
Center
Career Development
Center
Dean College of Basic and
Applied Sciences
Vice Provostfor Academic
Affairs
DirectorAcademic
Technology, Planning and
Projects
Assistant Vice President
Compliance and Enterprise Risk Management
Vice Provost for Student Success
Director of Academic Marketing
Senior Director for Resource and
Operations Management
Senior Editor for University
Publications
Director of News and Media Relations
Director of Creative and Visual Services
Administrative Coordinator to Vice
President
Assistant to the President
Office of University Community Relations
DeanUniversity College
Assistant to the Provost for Curriculum
Development
Veterans & Military Family Center Director
Strategic Partners & Planning
Back to Table of Contents

Office of Institutional Effectiveness, Planning and Research www.mtsu.edu/iepr/
ADMISSION 2016 FACT BOOK
Admission Standards Admission Application Statistics ACT Scores Top Tennessee High Schools of First-Time Freshmen
Back to Table of Contents

Admission Standards - Undergraduates
Freshman Applicants Following are the admission standards for all freshman applicants. The categories described below are designed to clarify the process used to evaluate undergraduate applications. It is not necessary for the applicant to choose a category in which to apply. The categories are
Honors Admission-for high-ability students Guaranteed Admission-for the majority of applicants Conditional Admission-for applicants not meeting standard admission requirements who have special talents or circumstances which may be taken into consideration Honors admission will be granted to applicants who complete a distribution of college preparatory courses with
• ACT composite score of 25 (SAT 1130) or higher and at least a 3.5 high school GPA.
Participation in the Honors College is not required of applicants admitted in this category.
Guaranteed Admission-Regular admission will be granted to freshman applicants who complete a distribution ofcollege preparatory courses with one of the following:
• a minimum 3.0 GPA• a minimum composite ACT of 22 (SAT 1020–Critical Reading and Math)• a minimum 2.7 GPA and minimum ACT of 19 (SAT 900)
Conditional Admission-Any student not meeting guaranteed admission requirements will be considered forconditional admission. The review will include all academic credentials as well as other special interests and skillsand other non-academic factors as explained on the Personal Statement Form which should be completed at thepoint of application. Students conditionally admitted should work closely with an academic advisor to develop aclass schedule that promotes academic success and should maintain regular contact with the advisor throughoutthe semester. Additionally, students admitted in this category will be expected to
• maintain academic good standing as defined by University retention standards• meet more specific requirements as required for certain populations of students.
GED or HiSET applicants will be considered for conditional admission. A minimum GED score of 450 orminimum HiSET score of 10 is required. The review will include GED or HiSET credentials as well as otherspecial interests, skills, and non-academic factors as explained on the Personal Statement Form which can becompleted at the point of application.
The Admissions Review Board may also request additional documentation specific to each individual’scircumstances. It is expected that a very small number of people in this category will be admitted. In the absenceof special talents or circumstances, applicants who do not meet the requirements for Guaranteed Admission willbe denied. Decisions of the Admissions Review Board are final.
Graduate
General Admissions Policies
The University welcomes applications from individuals qualified for graduate study. An applicant initially applies to the College of Graduate Studies. Upon receipt of all required materials and assuming the applicant meets the admission standards of the College of Graduate Studies, applications for degree-seeking students are then forwarded to the individual program for consideration. Applications for admission should be completed online (www.mtsu.edu/graduate/apply.php). In accepting admission to the College of Graduate Studies, a graduate
Back to Table of Contents

student assumes responsibility for knowing and complying with the regulations and procedures set forth in this catalog as well as any amendments or revisions that may ensue.
Graduate applicants must have earned a bachelor’s degree, although for some programs a master’s degree is required for admission. Under certain conditions undergraduate seniors with 98 semester hours of credit may be eligible to take graduate coursework. Applicants admitted to graduate programs as degree-seeking students are those working toward a graduate degree. Degree-seeking students must be recommended for admission by the graduate program/department and approved by the dean of the College of Graduate Studies.
Students not seeking a degree are classified as non-degree-seeking students. Except for those interested in teaching licensure or master’s +30, non-degree-seeking students must be admitted to the College of Graduate Studies. They are not admitted into a specific program. Non-degree-seeking students may take classes not restricted to students admitted into specific programs. Non-degree-seeking students may take courses for a reasonable period of time as determined by the dean of the College of Graduate Studies. NOTE: Non-degree-seeking students are not permitted to enroll in graduate courses in the Jennings A. Jones College of Business.Students interested in obtaining a teaching license or working on master’s +30 hours should apply for admissionto either the Initial Licensing Track or the Master’s +30 Track.
All applicants to the College of Graduate Studies must have an overall undergraduate grade point average (GPA) of 2.75 (on a 4.00 scale) to be considered for unconditional admission. (Also see conditional admission.) Applicants who attended graduate school at another institution must have a minimum cumulative GPA of 3.00 on all graduate work and a minimum of 2.75 on all undergraduate work to be considered for unconditional admission. International students on an F1 visa must meet requirements for unconditional admission.
Individual programs may have higher admission requirements than those of the College of Graduate Studies. Applicants should consult the programs for individual program admission requirements.
The College of Graduate Studies notifies all students of formal admission to both the College of Graduate Studies and to individual graduate programs. Students pursuing a graduate degree must be fully admitted to the program prior their initial semester of coursework.
Back to Table of Contents

Men (%) Women (%) Total Men (%) Women (%) Total Men (%) Women (%) Total
Number of Applicants 4,063 43.4% 5,290 56.6% 9,353 3,579 43.8% 4,585 56.2% 8,164 3,616 42.4% 4,922 57.6% 8,538
Number of Admissions 2,800 41.5% 3,940 58.5% 6,740 2,549 43.0% 3,378 57.0% 5,927 2,494 42.6% 3,364 57.4% 5,858
Number Enrolled (full-time) 1,352 44.6% 1,682 55.4% 3,034 1,300 46.5% 1,493 53.5% 2,793 1,247 44.3% 1,568 55.7% 2,815
Number Enrolled (part-time) 37 60.7% 24 39.3% 61 22 47.8% 24 52.2% 46 10 38.5% 16 61.5% 26
Total Enrolled (full-time/part-time) 1,389 44.9% 1,706 55.1% 3,095 1,322 46.6% 1,517 53.4% 2,839 1,257 44.2% 1,584 55.8% 2,841
% of Admission (full-time/part-time) 49.6% 43.3% 45.9% 51.9% 44.9% 47.9% 50.4% 47.1% 48.5%
Source: Census
Fall 2014Fall 2015Fall 2016
Number of Applicants9,353 8,164 8,538
Number of Admissions6,740 5,927 5,858
Total Enrolled (full-time/part-time)3,095 2,839 2,841
Admission Application Statistics: Three-year Enrollment Trends
Fall 2014-Fall 2016Fall 2014 Fall 2015 Fall 2016
Fall 2014 Fall 2015 Fall 2016
Number of Applicants 9,353 8,164 8,538
Number of Admissions 6,740 5,927 5,858
Total Enrolled (full-time/part-time) 3,095 2,839 2,841
- 1,000 2,000 3,000 4,000 5,000 6,000 7,000 8,000 9,000
10,000
Admission Application Statistics: Three-year Enrollment Rate Fall 2014-Fall 2016
Back to Table of Contents

Freshman ACT Profile Fall 2016
Score
01-10
11-15
16-20
21-25
26-30
31-36
TOTAL
Average ACT Scores 2014-2016
ENGL MATH READ SCI COMP ENGL MATH READ SCI COMP ENGL MATH READ SCI COMPMTSU Avg. 22.6 20.8 23.0 22.1 22.3 22.3 20.7 22.7 22.1 22.1 22.7 20.9 23.3 22.3 22.5Nat'l Avg. 20.3 20.9 21.3 20.8 21.0 20.4 20.8 21.4 20.9 21.0 20.1 20.6 21.3 20.8 20.8
Category
English
Usage/Mechanics
Rhetorical Skills
Mathematics
Elementary Algebra
Alg./Coord.Geometry
Plane Geom./Trig.
Reading
Social Studies/Sci.
Arts/Literature
Science Reasoning
Composite(1) Only freshman class that enrolled at MTSU.(2) National average norm represents the HS Graduating Class in the previous year.(3) n/a = not available.
Source: MTSU Admissions database; www.act.org
English
257
465
980
671
234
12
11.2 11.6
21.3 22.1
Headcount
10.2 11.2
22.1 22.7
11.4
11.3 11.4
11.6
20.4 22.3
10.7 11.8
10.4 11.3
100%
801
1,232
22.2 22.2
11.3 11.2
11.53%
365
116
0.00%
6.15%
419
29
Academic Years
100%
689
947
548
302
105
%
0.15%
4.93%
ACT Scores
2,6192,619
%
100% 2,619
44.10%
32.65%
16.00%
1.11%
36.16%
26.31%
%
0.00%
4.01%
30.58%
4.43%
47.04%
13.94% 20.31%
3.47%91
532
2,619
40.66%
100%
1,065
Science
855
20.92%
129
4
ReadingHeadcount Headcount
0
%
0.00%
2.60%
32.95%
68
CompositeHeadcount
0
863
2,619
%
0.46%
8.93%
25.62%
37.42%
17.75%
9.81%
100%
2013-14
MTSU (1) National (2) MTSU (1)
2014-15
MathHeadcount
0
161
1,155
21.922.521.6
National (2) MTSU (1) National (2)
22.122.4
11.3
11.5
20.6
21.5
22.3
22.1
11.8
11.3
11.2
10.9
11.5
11.4
22.3
22.622.5
10.8
10.6
10.3
22.4
20.7
11.5
21.9
2015-16
22.8
11.6
11.6
21.6 22.3
22.3 22.9
11.2
22.2
11.3 11.2
11.4 11.4
11.7
22.3
11.4 11.7
11.7
10.6 11.3
10.3 11.2
11.5
0.0
5.0
10.0
15.0
20.0
25.0
ENGL MATH READ SCI COMP
Fall 2014
MTSU Avg. Nat'l Avg.
0.0
5.0
10.0
15.0
20.0
25.0
ENGL MATH READ SCI COMP
Fall 2015
MTSU Avg. Nat'l Avg.
0.0
5.0
10.0
15.0
20.0
25.0
ENGL MATH READ SCI COMP
Fall 2016
MTSU Avg. Nat'l Avg.
Back to Table of Contents

Top Tennessee High Schools of First-Time FreshmenFall 2016
Rank High School Name City No. Rank High School Name City No.
1 Riverdale High School Murfreesboro 124 13 Homelife Academy Memphis 242 Blackman High School Murfreesboro 119 13 Brentwood High School Brentwood 233 Oakland High School Murfreesboro 96 14 Centennial High School Franklin 234 Siegel High School Murfreesboro 96 15 White Station High School Memphis 235 Stewart's Creek High School Smyrna 70 15 Southwind High School Memphis 216 Smyrna High School Smyrna 62 16 Whitehaven High School Memphis 217 Central Magnet School Murfreesboro 59 17 Summit High School Spring Hill 218 Lavergne High School La Vergne 52 18 Germantown High School Germantown 209 Cane Ridge High School Antioch 47 18 Martin Luther King Hlth Magnet Nashville 209 Antioch High School Antioch 45 19 Coffee County Central High School Manchester 18
10 Mt. Juliet High School Mount Juliet 3710 Wilson Central High School Lebanon 3611 John Overton Comprehensive Hs Nashville 36 SUBTOTAL 1,15111 McGavock High School Nashville 31 OTHER 1,69012 Glencliff High School Nashville 27 TOTAL FIRST-TIME FRESHMEN 2,841
Source: MTSU Office of Institutional Effectiveness, Planning and Research0 20 40 60 80 100 120 140
Riverdale High School
Blackman High School
Oakland High School
Siegel High School
Stewarts Creek High School
Smyrna High School
Central Magnet School
Lavergne High School
Cane Ridge High School
Antioch High School
124
119
96
96
70
62
59
52
47
45
Back to Table of Contents

Office of Institutional Effectiveness, Planning and Research www.mtsu.edu/iepr/
HEADCOUNT BY MAJOR 2016 FACT BOOK
Undergraduate Majors by College (Chart) Headcount, Student Credit Hours, and Full-Time
Equivalents Summary Headcount, Student Credit Hours, and Full-Time
Equivalents (FTE) Fall Terms 2014-16 First-Time, Full-Time Freshmen by College, Major,
Gender and Ethnicity Undergraduate Majors by Gender and Enrollment Status Undergraduate Majors by Race within College and
Department Graduate Majors by Gender and Enrollment Status Graduate Majors by Race Students Credit Hours taught by College, Department and
Course Level Fall 2016
Back to Table of Contents

Basic and Applied Sciences473424%
Behavioral and Health Sciences445723%
Business270614%
Education7324%
Liberal Arts229212%
Mass Communications243612%
Non-Degree Seeking6953%
University College16418%
Undergraduate Majors by CollegeFall 2016
Total = 19,693
Back to Table of Contents
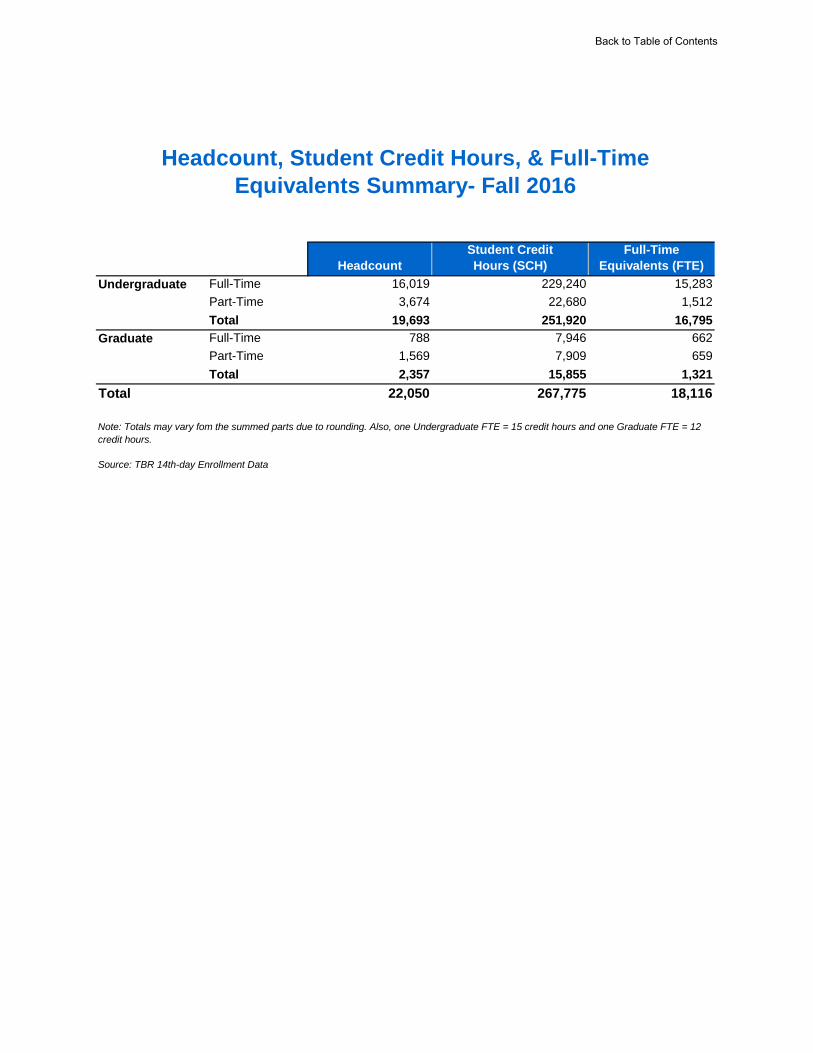
HeadcountStudent Credit Hours (SCH)
Full-Time Equivalents (FTE)
16,019 229,240 15,2833,674 22,680 1,512
19,693 251,920 16,795788 7,946 662
1,569 7,909 6592,357 15,855 1,321
Total 22,050 267,775 18,116
Headcount, Student Credit Hours, & Full-Time Equivalents Summary- Fall 2016
Undergraduate Full-TimePart-TimeTotal
Note: Totals may vary fom the summed parts due to rounding. Also, one Undergraduate FTE = 15 credit hours and one Graduate FTE = 12 credit hours.
Source: TBR 14th-day Enrollment Data
Graduate Full-TimePart-TimeTotal
Back to Table of Contents

201422,729
275,77518,664
2014 % of Total 201566,496 24.1% 63,90154,780 19.9% 53,14656,390 20.4% 59,99780,092 29.0% 75,3281,266 0.5% 2,110
557 0.2% 59513,837 5.0% 13,149
366 0.1% 2801,991 0.7% 1,936
275,775 100% 270,442
% of Total23.8%19.6%20.1%28.6%0.5%0.2%6.2%0.2%0.9%100%
Note: One Undergraduate FTE = 15 credit hours and One Graduate FTE = 12 credit hours.
Note: Student FTE-to-Faculty Ratio = (Full-Time Students + 1/3 Part-Time Students)/(Full-Time Faculty + 1/3 Part-Time Faculty)-This is based on method used to calculate student-to-faculty ratio for the national Common Data Set
Student-to-Faculty Ratio 20:01 18:01 18:01Full-Time Faculty Headcount 963 918 1033
0.8%Total Full-Time Equivalents 18,664 18,295 100% 18,116 100%Doctoral 166 161 0.9% 144
6.0%Specialist in Education 30 23 0.1% 40 0.2%Masters 1,153 1,096 6.0% 1,085
0.9%Graduate Special 46 50 0.3% 53 0.3%Undergraduate Special 84 141 0.8% 168
21.6%Senior 5,339 5,022 27.4% 5,084 28.1%Junior 3,759 4,000 21.9% 3,911
22.5%Sophomore 3,652 3,543 19.4% 3,550 19.6%Freshman 4,433 4,260 23.3% 4,082
Full-Time Equivalents (FTE) by Classification Fall Terms 2014 - 2016
Level 2014 2015 % of Total 2016 % of Total
Doctoral 0.7% 1,730 0.6%Total Student Credit Hours 100% 267,775 100%
Masters 4.9% 13,017 4.9%Specialist in Education 0.1% 475 0.2%
Undergraduate Special 0.8% 2,522 0.9%Graduate Special 0.2% 633 0.2%
Junior 22.2% 58,662 21.9%Senior 27.9% 76,267 28.5%
Freshman 23.6% 61,226 22.9%Sophomore 19.7% 53,243 19.9%
-1.0%
Student Credit Hours by Classification Fall Terms 2014 - 2016
Level % of Total 2016 % of Total
Full-Time Equivalents (FTE) -4.6% 18,295 -2.0% 18,116
-2.0%Student Credit Hours (SCH) -4.5% 270,442 -1.9% 267,775 -1.0%Headcount -4.8% 22,511 -1.0% 22,050
Headcount, Student Credit Hours, and Full-Time Equivalents (FTEs) Fall Terms 2014 - 2016
% Change 2015 % Change 2016 % Change
Back to Table of Contents

Female Male Female Male Female Male Female Male Female Male Female Male Female Male Female Male Female
Basic and Applied Sciences
Academic Focus/Undecided 0 0 0 0 1 0 3 1 0 0 3 5 0 0 0 0 0 13
Aerospace (BS) 0 0 0 0 2 3 1 20 4 7 13 109 0 0 0 2 0 162
Agribusiness (BS) 0 0 0 0 0 0 1 0 1 1 5 5 0 0 0 1 0 14
Animal Science (BS) 0 0 0 0 1 0 12 0 3 0 52 7 0 0 4 0 0 79
Biochemistry (BS) 0 0 0 0 3 4 7 3 1 1 9 11 0 0 0 0 0 39
Biology (BS) 0 0 1 0 7 5 31 11 10 2 61 25 0 0 1 4 3 161
Chemistry (BS) 0 0 0 0 1 1 5 3 2 0 12 11 0 0 1 1 0 37
Computer Science (BS) 0 0 0 0 2 10 5 16 1 2 4 45 0 0 1 3 0 89
Concrete Industry Management (BS) 0 0 0 1 0 0 2 7 0 2 1 10 0 0 0 1 0 24
Construction Management (BS) 0 0 0 0 0 0 0 2 0 1 0 9 0 0 0 0 0 13
Engineering Technology (BS) 0 0 0 0 2 7 1 15 1 3 0 25 0 0 0 0 0 56
Environmental Sustainability Tech (BS) 0 0 0 0 0 1 1 1 0 1 2 5 0 0 0 0 0 11
Forensic Science (BS) 0 0 0 0 0 0 19 1 0 1 12 6 0 0 2 0 0 41
Geoscience (BS) 0 0 0 0 0 0 2 0 0 0 2 2 0 0 0 0 0 6
Mathematics (BS) 0 0 0 0 1 1 1 2 2 1 10 3 0 0 0 0 0 21
Mechatronics Engineering (BS) 0 0 0 0 1 5 0 8 0 5 5 23 0 0 0 2 0 51
Physics (BS) 0 0 0 0 0 0 0 0 0 0 2 5 0 0 0 0 0 7
Plant & Soil Science (BS) 0 0 0 0 0 0 0 0 0 0 1 3 0 0 0 0 0 4
Science (BS) 0 0 0 0 9 4 32 7 5 1 42 19 0 0 4 2 0 125
Basic and Applied Sciences Total 0 0 1 1 30 41 123 97 30 28 236 328 0 0 13 16 3 953
Behavioral and Health Sciences
Academic Focus/Undecided 0 0 0 0 0 0 1 0 0 0 0 0 0 0 0 0 0 1
Athletic Training (BS) 0 0 0 0 0 0 6 8 2 0 12 8 0 0 0 1 0 37
Community & Public Health (BS) 0 0 0 0 1 0 2 1 0 0 0 0 0 0 0 0 0 4
Criminal Justice Administration (BS) 0 0 0 0 0 2 18 6 1 1 11 23 0 0 1 1 0 64
Exercise Science (BS) 0 0 0 0 0 1 6 9 1 2 14 13 0 0 0 3 0 49
Family & Consumer Studies (BS) 0 0 0 0 0 0 2 0 0 0 2 0 0 0 0 0 0 4
Industrial & Org Psychology (BS) 0 0 0 0 0 0 2 0 1 0 1 0 0 0 0 0 0 4
Interior Design (BS) 0 0 0 0 0 0 3 0 0 0 5 0 0 0 0 0 0 8
Alaskan Native
Native Hawaiian or Other Pacific
IslanderWhite
0
0
0
0
0
0
0
0
0
6
0
0
0
0
2
0
0
0
1
2
0
0
0
0
0
0
Grand TotalMale
0
1
First-Time, Full-Time Freshmen by College, Major, Gender and EthnicityFall 2016
College/Major
American Indian AsianBlack or African
American HispanicTwo Or More
Races Not Specified
Back to Table of ContentsBack to Table of ContentsBack to Table of Contents

Female Male Female Male Female Male Female Male Female Male Female Male Female Male Female Male Female
Alaskan Native
Native Hawaiian or Other Pacific
IslanderWhiteGrand TotalMale
First-Time, Full-Time Freshmen by College, Major, Gender and EthnicityFall 2016
College/Major
American Indian AsianBlack or African
American HispanicTwo Or More
Races Not Specified
Leisure, Sprt & Tourism Studies (BS) 0 0 0 0 0 0 1 2 0 0 3 2 0 0 0 0 0 8
Nursing (BSN) 0 0 2 0 7 4 101 4 10 4 70 23 0 0 8 1 0 234
Nutrition & Food Science (BS) 0 0 0 0 0 0 1 0 1 1 10 2 0 0 0 0 0 15
Physical Education (BS) 0 0 0 0 0 0 1 1 0 0 0 1 0 0 0 1 0 4
Psychology (BS) 0 0 0 0 2 1 37 3 2 2 39 8 0 0 4 0 0 98
Social Work (BSW) 1 0 1 0 0 0 6 0 0 0 9 0 0 0 1 0 0 17
Speech/Language Path & Audio (BS) 0 0 0 0 0 0 2 0 0 0 12 0 0 0 0 0 0 14
Textiles Merchandising Design (BS) 0 0 0 0 2 0 4 2 3 0 11 1 0 0 0 0 0 23
Behavioral and Health Sciences Total 0 0 3 0 12 8 193 36 21 10 199 81 0 0 14 7 0 584
Business
Academic Focus/Undecided 0 0 0 0 0 0 1 1 0 0 4 7 0 0 1 0 0 14
Accounting (BBA) 0 0 0 0 2 1 1 6 0 2 13 9 0 0 1 0 0 35
Business Administration (BBA) 0 0 0 0 1 3 15 7 4 2 17 24 0 0 3 2 1 79
Business Education (BS) 0 0 0 0 1 0 1 2 0 0 1 1 0 0 0 0 0 6
Economics (BBA) 0 0 0 0 1 0 0 0 0 0 0 2 0 0 0 0 0 3
Entrepreneurship (BBA) 0 0 0 0 0 1 5 3 0 2 1 4 0 0 0 2 0 18
Finance (BBA) 0 0 0 0 1 1 3 8 0 0 3 13 0 0 0 1 0 33
Information Systems (BBA) 0 0 0 0 1 1 1 4 0 1 5 10 0 0 0 1 0 25
Management (BBA) 0 0 0 0 1 1 5 4 0 1 4 4 0 0 0 1 0 21
Marketing (BBA) 0 0 0 0 1 0 6 4 0 1 13 10 0 0 1 2 0 40
Business Total 0 0 0 0 9 8 38 39 4 9 61 84 0 0 6 9 1 274
Education
Academic Focus/Undecided 0 0 0 0 0 0 0 0 0 0 4 0 0 0 0 0 0 4
Early Childhood Education (BS) 0 0 0 0 0 0 12 0 2 0 14 0 1 0 3 0 0 32
Interdisciplinary Studies (BS) 0 0 0 0 0 0 2 2 0 1 11 2 0 0 1 0 0 19
Special Education (BS) 0 0 0 0 0 0 1 0 0 0 10 0 0 0 0 0 0 11
Education Total 0 0 0 0 0 0 15 2 2 1 39 2 1 0 4 0 0 66
Liberal Arts
Academic Focus/Undecided 0 0 0 0 0 1 2 0 2 1 5 1 0 0 1 0 0 13
Anthropology (BA) 0 0 0 0 0 0 1 0 0 0 3 0 0 0 0 0 0 4
0
0
0
0
0
0
0
2
6
0
0
0
0
3
1
0
0
0
0
0
0
0
0
0
0
0
0
Back to Table of ContentsBack to Table of ContentsBack to Table of Contents

Female Male Female Male Female Male Female Male Female Male Female Male Female Male Female Male Female
Alaskan Native
Native Hawaiian or Other Pacific
IslanderWhiteGrand TotalMale
First-Time, Full-Time Freshmen by College, Major, Gender and EthnicityFall 2016
College/Major
American Indian AsianBlack or African
American HispanicTwo Or More
Races Not Specified
Anthropology (BS) 0 0 0 0 0 0 2 1 0 0 4 2 0 0 0 0 0 9
Art (BFA) 0 0 0 0 0 0 4 3 2 1 13 6 0 0 3 1 0 33
Art Education (BS) 0 0 0 0 0 0 0 0 0 0 1 0 0 0 1 0 0 2
Economics (BS) 0 0 0 0 0 1 0 0 1 0 0 2 0 0 0 0 0 4
English (BA) 0 0 0 0 1 0 6 0 1 1 22 7 0 0 0 0 0 38
Foreign Language (BA) 0 0 0 0 0 0 1 0 0 0 8 3 0 0 0 0 0 12
Foreign Language (BS) 0 0 0 0 0 0 0 0 0 1 4 1 0 0 0 0 0 6
Global Studies & Cultural Geography (BS) 0 0 0 0 0 0 0 0 1 0 1 2 0 0 0 0 0 4
History (BA) 0 0 0 0 0 0 0 0 0 0 1 5 0 0 0 0 0 6
History (BS) 0 0 0 0 0 0 0 1 0 1 1 3 0 0 0 0 0 6
International Relations (BA) 0 0 0 0 1 0 0 0 0 0 3 0 0 0 0 0 0 4
International Relations (BS) 0 0 0 0 0 0 0 0 0 0 1 0 0 0 0 0 0 1
Music (BM) 0 0 0 0 2 0 4 6 1 3 25 28 0 0 1 0 0 70
Organizational Communication (BS) 0 0 0 0 0 0 0 0 0 0 3 1 0 0 0 0 0 5
Philosophy (BA) 0 0 0 0 0 0 0 1 1 1 0 0 0 0 0 0 0 3
Philosophy (BS) 0 0 0 0 0 0 0 0 0 0 1 2 0 0 0 0 0 3
Political Science (BA) 0 0 0 0 0 0 4 0 0 1 4 2 0 0 1 1 0 13
Political Science (BS) 0 0 0 0 1 0 6 1 1 1 10 10 0 0 1 1 0 32
Sociology (BA) 0 0 0 0 0 0 0 0 0 0 2 2 0 0 1 0 0 5
Sociology (BS) 0 0 0 0 0 0 0 0 0 0 1 0 0 0 0 0 0 1
Theatre (BS) 0 0 0 0 0 0 1 1 0 0 9 5 0 0 0 0 0 16
Liberal Arts Total 0 0 0 0 5 2 31 14 10 11 122 82 0 0 9 3 0 290
Media and Entertainment
Academic Focus/Undecided 0 0 0 0 0 0 0 1 0 0 1 0 0 0 0 0 0 2
Animation (BS) 0 0 0 0 1 1 0 4 0 1 11 11 0 0 1 1 0 31
Journalism (BS) 0 0 0 0 3 0 14 4 1 0 22 21 0 0 1 1 0 67
Mass Communication (BS) 0 0 0 0 3 1 9 5 3 5 32 27 0 0 1 2 0 88
Recording Industry (BS) 0 0 0 0 3 1 13 37 2 9 80 103 0 0 6 6 0 260
Media and Entertainment Total 0 0 0 0 10 3 36 51 6 15 146 162 0 0 9 10 0 448
University College
0
0
0
0
0
0
0
0
0
1
1
0
0
0
0
0
0
0
0
0
0
0
0
0
0
0
0
0
Back to Table of ContentsBack to Table of ContentsBack to Table of Contents

Female Male Female Male Female Male Female Male Female Male Female Male Female Male Female Male Female
Alaskan Native
Native Hawaiian or Other Pacific
IslanderWhiteGrand TotalMale
First-Time, Full-Time Freshmen by College, Major, Gender and EthnicityFall 2016
College/Major
American Indian AsianBlack or African
American HispanicTwo Or More
Races Not Specified
Academic Focus/Undecided 0 1 0 8 2 25 11 4 2 81 52 0 0 3 6 0 195
Integrated Studies (BS) 0 0 0 0 0 0 0 0 0 0 3 0 0 0 0 0 0 3
Liberal Studies (BS) 0 0 0 0 0 0 0 0 0 0 0 1 0 0 0 0 0 1
Professional Studies (BS) 0 0 0 0 0 0 1 0 0 0 0 0 0 0 0 0 0 1
University College Total 0 0 1 0 8 2 26 11 4 2 84 53 0 0 3 6 0 200
Grand Total 0 0 5 1 74 64 462 250 77 76 887 792 1 0 58 51 4 2,815
0
0
13
0
0
0
Back to Table of ContentsBack to Table of ContentsBack to Table of Contents

Full-Time Part-Time Full-Time Part-Time
11 9 7 7
75 1 592 61
40 7 77 6236 39 46 8
13 2 26 4
464 59 203 34103 6 25 2
103 10 87 1258 9 54 11
0 0 0 1269 44 113 19
61 7 312 81
15 4 131 811 3 106 26
19 7 249 6223 2 37 626 4 211 24
37 6 37 11
0 0 1 066 10 85 5
16 8 54 10
1,646 237 2,453 398
5 1 0 0
250 24 250 32
67 5 47 5Health and Human PerformanceAthletic Training (BS) 124
Academic Focus/Undecided (25AFC) 6Criminal JusticeCriminal Justice Administration (BS) 556
Total Basic and Applied Sciences 4,734Behavioral and Health SciencesAcademic Focus
Mathematics (BS) 166Physics and AstronomyPhysics (BS) 88
Geoscience (BS) 91Mathematical Sciences Actuarial Science (BS) 1
Environmental Sustainability & Technology (BS) 68Mechatronics Engineering (BS) 265Geosciences
Construction Management (BS) 146Engineering TechnologyEngineering Technology (BS) 337
Computer Science (BS) 461Concrete and Construction MgmtConcrete Industry Management (BS) 158
Environmental Sustainability & Technology (BS) 1Science (BS) 445Computer Science
ChemistryBiochemistry (BS) 212Chemistry (BS) 132
Biology (BS) 760Forensic Science (BS) 136
Agribusiness (BS) 130Animal Science (BS) 329Plant & Soil Science (BS) 45
Agribusiness and Agriscience
Basic and Applied SciencesAcademic FocusAcademic Focus/Undecided (25AFC) 34
Biology
Undergraduate Majors by Gender & Enrollment StatusFall 2016
Female MaleTotal
AerospaceAerospace (BS) 729
Back to Table of ContentsBack to Table of ContentsBack to Table of Contents
Full-Time Part-Time Full-Time Part-Time
Undergraduate Majors by Gender & Enrollment StatusFall 2016
Female MaleTotal
104 13 30 4263 24 249 36
56 6 106 524 1 35 4
143 14 3 4
150 26 2 072 6 3 0
119 26 26 8127 7 15 3
676 126 127 18
44 7 21 7486 94 143 25
221 30 26 6
2,807 410 1,083 157
13 4 21 12
198 90 193 66
48 21 265 66
13 0 24 466 6 197 18
260 43 325 5644 7 50 876 19 109 16
16 6 14 5139 17 149 21
1 0 0 0
874 213 1,347 272
14 4 7 1Elementary and Special Ed
EducationAcademic FocusAcademic Focus/Undecided (25AFC) 26
Marketing (BBA) 326Office Management (BBA) 1
Total Business 2,706
Management (BBA) 220MarketingBusiness Education (BS) 41
ManagementBusiness Administration (BBA) 684Entrepreneurship (BBA) 109
Economics and FinanceEconomics (BBA) 41Finance (BBA) 287
Accounting (BBA) 547Computer Information SystemsInformation Systems (BBA) 400
Academic FocusAcademic Focus/Undecided (25AFC) 50Accounting
Social Work (BSW) 283
Total Behavioral and Health Sciences 4,457Business
Industrial & Organizational Psychology (BS) 79Psychology (BS) 748Social Work
NursingNursing (BSN) 947Psychology
Interior Design (BS) 81Nutrition & Food Science (BS) 179Textiles Merchandising Design (BS) 152
Speech/Language Pathology & Audiology (BS) 164Human SciencesFamily & Consumer Studies (BS) 178
Exercise Science (BS) 572Leisure, Sport & Tourism Studies (BS) 173Physical Education (BS) 64
Community & Public Health (BS) 151
Back to Table of ContentsBack to Table of ContentsBack to Table of Contents

Full-Time Part-Time Full-Time Part-Time
Undergraduate Majors by Gender & Enrollment StatusFall 2016
Female MaleTotal
212 33 5 0307 28 24 3
73 8 11 2
606 73 47 6
10 7 5 3
127 29 68 203 1 1 01 0 1 0
23 15 7 012 4 0 2
194 22 60 15
8 2 29 6
173 31 83 14
58 15 24 732 4 12 6
49 9 28 5
41 6 58 1519 3 58 9
102 4 124 9
5 0 9 26 3 15 4
17 3 17 116 0 4 095 9 72 1935 7 23 5
35 7 17 36 0 3 1
33 10 9 2
Anthropology (BS) 62Anthropology (BA) 10Sociology (BS) 54
Political Science (BS) 195Political Science (BA) 70Sociology and Anthropology
Political Sci & Intl RelationsInternational Relations (BS) 38International Relations (BA) 20
PhilosophyPhilosophy (BS) 16Philosophy (BA) 28
History (BS) 89MusicMusic (BM) 239
Global Studies & Cultural Geography (BS) 91HistoryHistory (BA) 120
Foreign Language (BA) 104Foreign Language (BS) 54Global Studies
EnglishEnglish (BA) 301Foreign Languages and Lit
Organizational Communication (BS) 291Economics and FinanceEconomics (BS) 45
Art Education (BS) 45Art History (BA) 18Comm Studies & Org Comm
Art (BFA) 244Art (BS) 5Art (BA) 2
Academic FocusAcademic Focus/Undecided (25AFC) 25Art
Special Education (BS) 94
Total Education 732Liberal Arts
Early Childhood Education (BS) 250Interdisciplinary Studies (BS) 362
Back to Table of ContentsBack to Table of ContentsBack to Table of Contents

Full-Time Part-Time Full-Time Part-Time
Undergraduate Majors by Gender & Enrollment StatusFall 2016
Female MaleTotal
14 4 6 1
54 7 36 4
1,168 202 769 153
4 2 3 0
20 0 25 1239 35 292 47
74 5 52 2272 22 153 33
364 29 691 71
973 93 1,216 154
20 356 14 305
20 356 14 305
220 20 193 93 28 4 15
161 198 130 126137 120 55 95
58 20 35 14
579 386 417 2598,673 1,970 7,346 1,704Total Undergraduate 19,693
Source:TBR 14th-day Enrollment Data
University StudiesIntegrated Studies (BS) 127
Total University College 1,641
Regents Online Degree ProgramLiberal Studies (BS) 615Professional Studies (BS) 407
Academic Focus- UndecidedAcademic Focus/Undecided (25AFC) 442AF/Undecided-Prior Bachelors (25AFC) 50
Non Degree Seeking (NDUG) 695
Total Non-Degree Seeking 695University College
Total Media and Entertainment 2,436Non-Degree SeekingNon-Degree Seeking
Mass Communication (BS) 480Recording IndustryRecording Industry (BS) 1155
Mass Communication (BS) 613JournalismJournalism (BS) 133
Academic Focus/Undecided (25AFC) 9Electronic Media CommunicationAnimation (BS) 46
Total Liberal Arts 2,292Media and EntertainmentAcademic Focus
Sociology (BA) 25Theatre and DanceTheatre (BS) 101
Back to Table of ContentsBack to Table of ContentsBack to Table of Contents
Alaskan Native
American Indian Asian
Black or African
American Hispanic
Native Hawaiian or Other Pacific
Islander WhiteTwo Or More
Races Not Specified % Black%
White%
Other
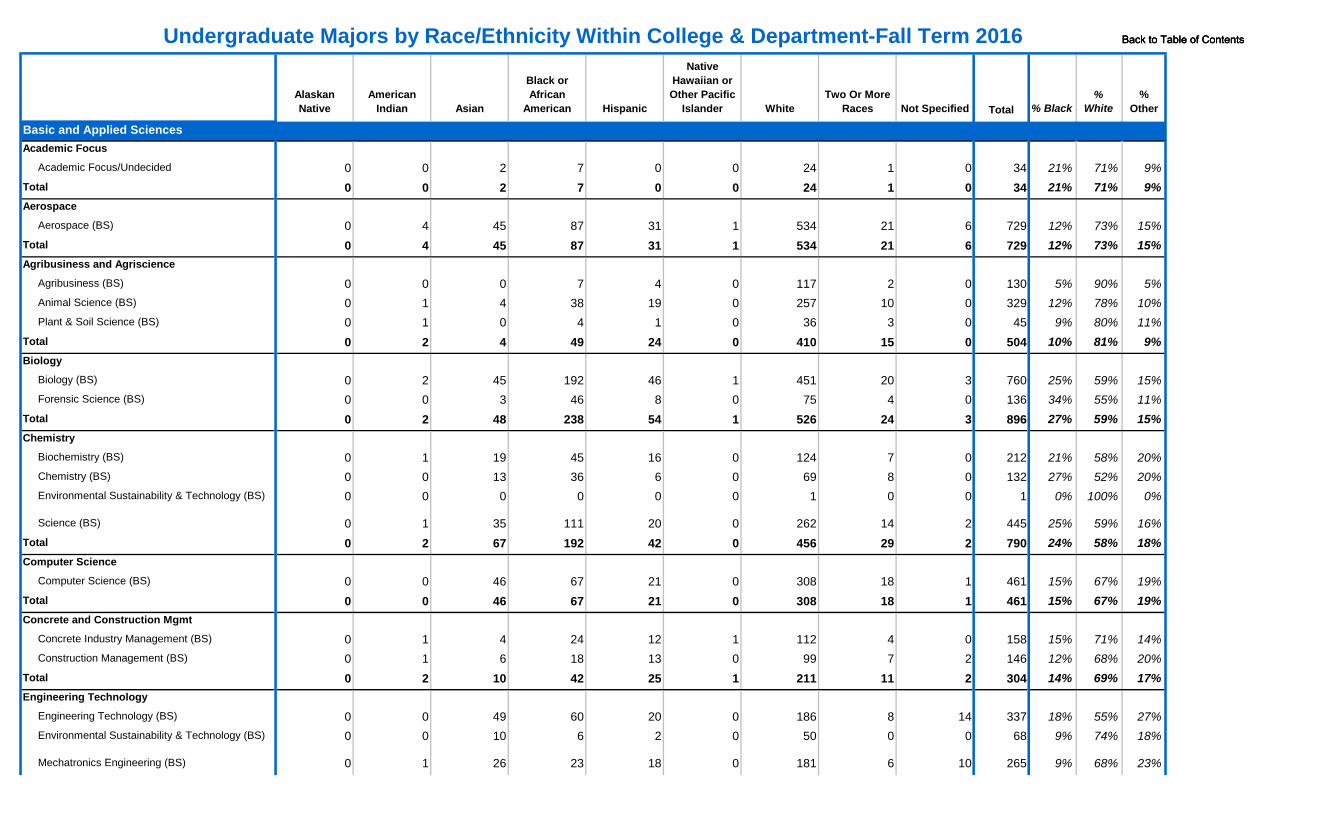
Basic and Applied SciencesAcademic Focus
Academic Focus/Undecided 0 0 2 7 0 0 24 1 0 21% 71% 9%Total 0 0 2 7 0 0 24 1 0 21% 71% 9%Aerospace
Aerospace (BS) 0 4 45 87 31 1 534 21 6 12% 73% 15%Total 0 4 45 87 31 1 534 21 6 12% 73% 15%Agribusiness and Agriscience
Agribusiness (BS) 0 0 0 7 4 0 117 2 0 5% 90% 5% Animal Science (BS) 0 1 4 38 19 0 257 10 0 12% 78% 10% Plant & Soil Science (BS) 0 1 0 4 1 0 36 3 0 9% 80% 11%
Total 0 2 4 49 24 0 410 15 0 10% 81% 9%Biology
Biology (BS) 0 2 45 192 46 1 451 20 3 25% 59% 15% Forensic Science (BS) 0 0 3 46 8 0 75 4 0 34% 55% 11%Total 0 2 48 238 54 1 526 24 3 27% 59% 15%Chemistry
Biochemistry (BS) 0 1 19 45 16 0 124 7 0 21% 58% 20% Chemistry (BS) 0 0 13 36 6 0 69 8 0 27% 52% 20% Environmental Sustainability & Technology (BS) 0 0 0 0 0 0 1 0 0 0% 100% 0%
Science (BS) 0 1 35 111 20 0 262 14 2 25% 59% 16%Total 0 2 67 192 42 0 456 29 2 24% 58% 18%Computer Science
Computer Science (BS) 0 0 46 67 21 0 308 18 1 15% 67% 19%Total 0 0 46 67 21 0 308 18 1 15% 67% 19%Concrete and Construction Mgmt
Concrete Industry Management (BS) 0 1 4 24 12 1 112 4 0 15% 71% 14% Construction Management (BS) 0 1 6 18 13 0 99 7 2 12% 68% 20%Total 0 2 10 42 25 1 211 11 2 14% 69% 17%Engineering Technology
Engineering Technology (BS) 0 0 49 60 20 0 186 8 14 18% 55% 27% Environmental Sustainability & Technology (BS) 0 0 10 6 2 0 50 0 0 9% 74% 18%
Mechatronics Engineering (BS) 0 1 26 23 18 0 181 6 10 9% 68% 23%
Total
34
130329
45504
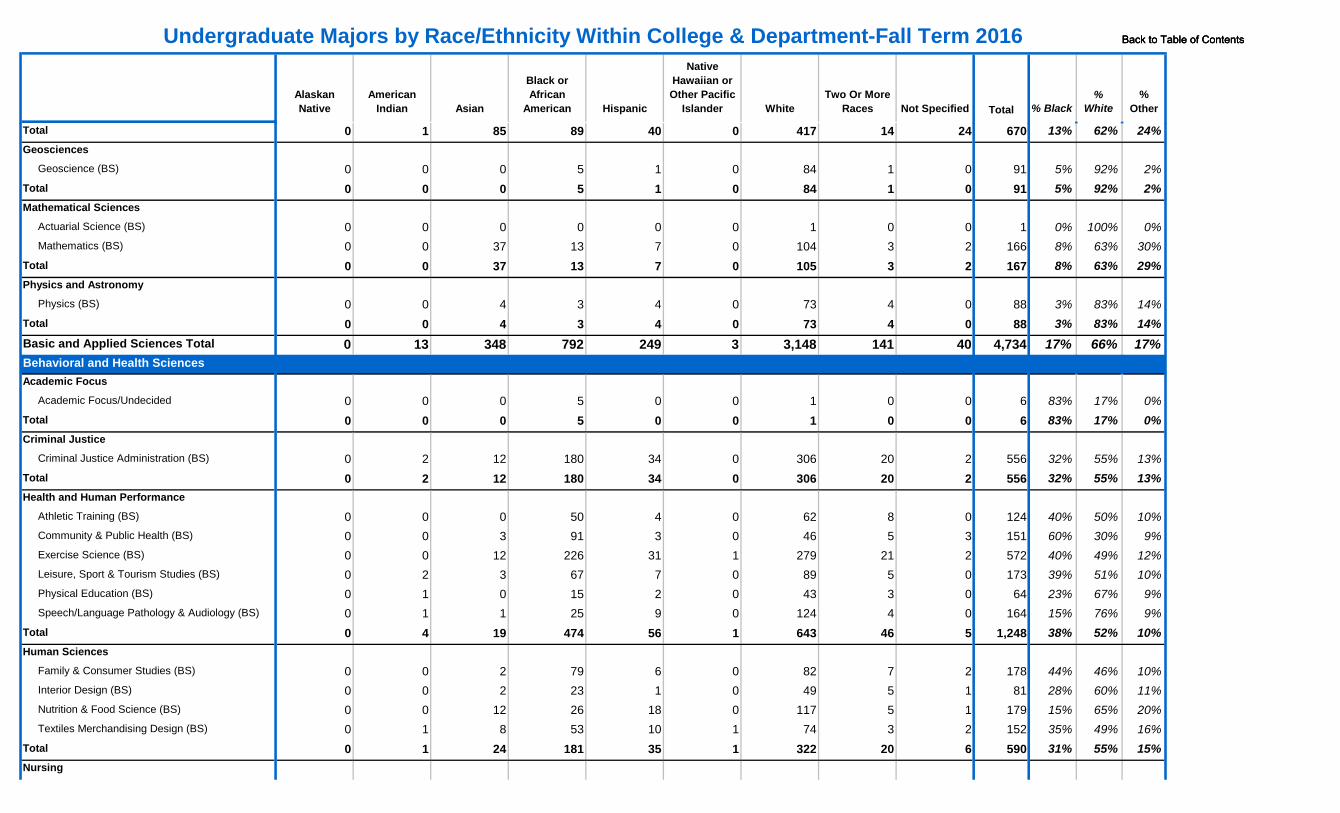
Undergraduate Majors by Race/Ethnicity Within College & Department-Fall Term 2016
34
729729
1321
445790
760136896
212
304
33768
265
461461
158146
Back to Table of ContentsBack to Table of ContentsBack to Table of Contents
Alaskan Native
American Indian Asian
Black or African
American Hispanic
Native Hawaiian or Other Pacific
Islander WhiteTwo Or More
Races Not Specified % Black%
White%
OtherTotal
Undergraduate Majors by Race/Ethnicity Within College & Department-Fall Term 2016
Total 0 1 85 89 40 0 417 14 24 13% 62% 24%Geosciences
Geoscience (BS) 0 0 0 5 1 0 84 1 0 5% 92% 2%Total 0 0 0 5 1 0 84 1 0 5% 92% 2%Mathematical Sciences
Actuarial Science (BS) 0 0 0 0 0 0 1 0 0 0% 100% 0% Mathematics (BS) 0 0 37 13 7 0 104 3 2 8% 63% 30%Total 0 0 37 13 7 0 105 3 2 8% 63% 29%Physics and Astronomy
Physics (BS) 0 0 4 3 4 0 73 4 0 3% 83% 14%Total 0 0 4 3 4 0 73 4 0 3% 83% 14%Basic and Applied Sciences Total 0 13 348 792 249 3 3,148 141 40 17% 66% 17%Behavioral and Health SciencesAcademic Focus
Academic Focus/Undecided 0 0 0 5 0 0 1 0 0 83% 17% 0%Total 0 0 0 5 0 0 1 0 0 83% 17% 0%Criminal Justice
Criminal Justice Administration (BS) 0 2 12 180 34 0 306 20 2 32% 55% 13%Total 0 2 12 180 34 0 306 20 2 32% 55% 13%Health and Human Performance
Athletic Training (BS) 0 0 0 50 4 0 62 8 0 40% 50% 10% Community & Public Health (BS) 0 0 3 91 3 0 46 5 3 60% 30% 9% Exercise Science (BS) 0 0 12 226 31 1 279 21 2 40% 49% 12% Leisure, Sport & Tourism Studies (BS) 0 2 3 67 7 0 89 5 0 39% 51% 10% Physical Education (BS) 0 1 0 15 2 0 43 3 0 23% 67% 9% Speech/Language Pathology & Audiology (BS) 0 1 1 25 9 0 124 4 0 15% 76% 9%
Total 0 4 19 474 56 1 643 46 5 38% 52% 10%Human Sciences
Family & Consumer Studies (BS) 0 0 2 79 6 0 82 7 2 44% 46% 10% Interior Design (BS) 0 0 2 23 1 0 49 5 1 28% 60% 11% Nutrition & Food Science (BS) 0 0 12 26 18 0 117 5 1 15% 65% 20% Textiles Merchandising Design (BS) 0 1 8 53 10 1 74 3 2 35% 49% 16%
Total 0 1 24 181 35 1 322 20 6 31% 55% 15%Nursing
1166167
88
670
9191
6
556556
884,734
6
1641,248
17881
124151572173
64
179152590
Back to Table of ContentsBack to Table of ContentsBack to Table of Contents
Alaskan Native
American Indian Asian
Black or African
American Hispanic
Native Hawaiian or Other Pacific
Islander WhiteTwo Or More
Races Not Specified % Black%
White%
OtherTotal
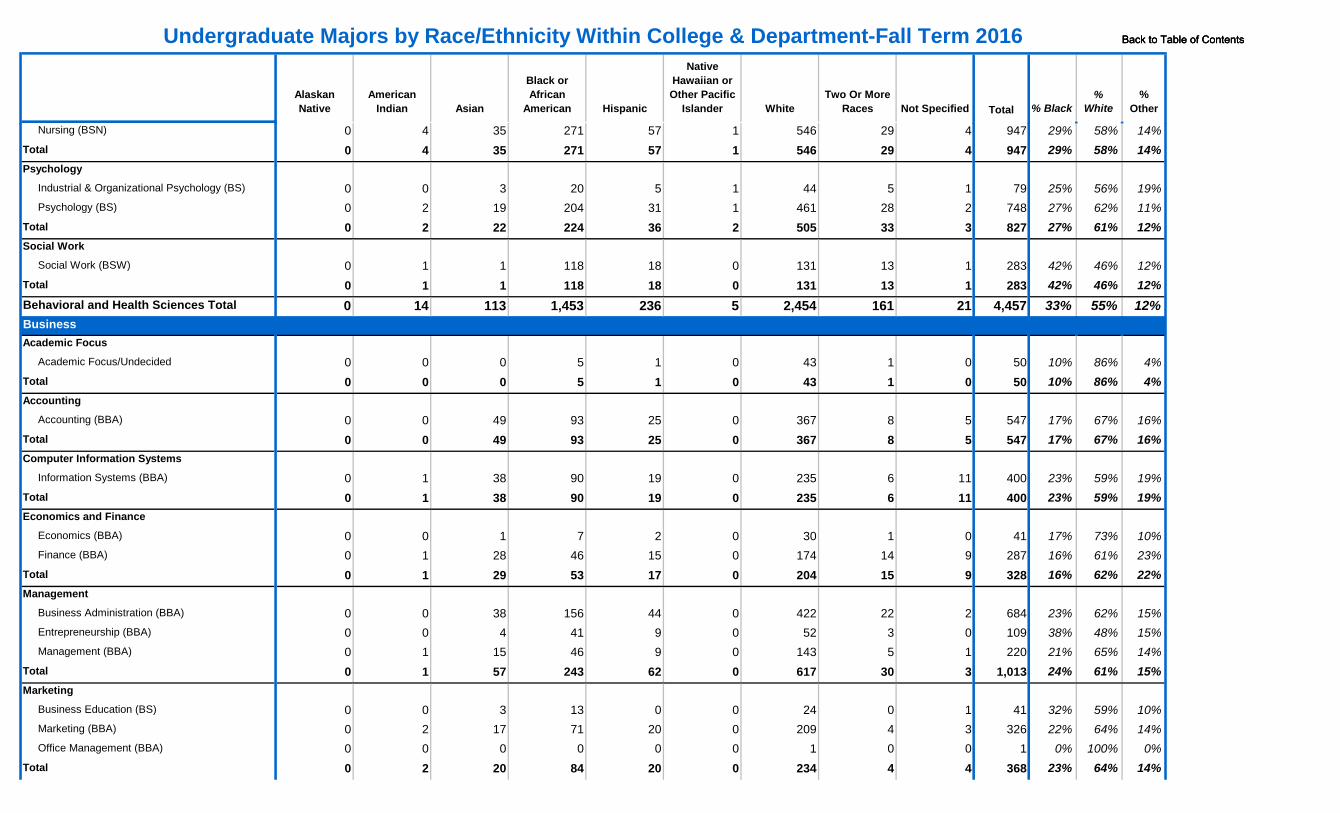
Undergraduate Majors by Race/Ethnicity Within College & Department-Fall Term 2016
Nursing (BSN) 0 4 35 271 57 1 546 29 4 29% 58% 14%Total 0 4 35 271 57 1 546 29 4 29% 58% 14%Psychology
Industrial & Organizational Psychology (BS) 0 0 3 20 5 1 44 5 1 25% 56% 19% Psychology (BS) 0 2 19 204 31 1 461 28 2 27% 62% 11%Total 0 2 22 224 36 2 505 33 3 27% 61% 12%Social Work
Social Work (BSW) 0 1 1 118 18 0 131 13 1 42% 46% 12%Total 0 1 1 118 18 0 131 13 1 42% 46% 12%Behavioral and Health Sciences Total 0 14 113 1,453 236 5 2,454 161 21 33% 55% 12%BusinessAcademic Focus
Academic Focus/Undecided 0 0 0 5 1 0 43 1 0 10% 86% 4%Total 0 0 0 5 1 0 43 1 0 10% 86% 4%Accounting
Accounting (BBA) 0 0 49 93 25 0 367 8 5 17% 67% 16%Total 0 0 49 93 25 0 367 8 5 17% 67% 16%Computer Information Systems
Information Systems (BBA) 0 1 38 90 19 0 235 6 11 23% 59% 19%Total 0 1 38 90 19 0 235 6 11 23% 59% 19%Economics and Finance
Economics (BBA) 0 0 1 7 2 0 30 1 0 17% 73% 10% Finance (BBA) 0 1 28 46 15 0 174 14 9 16% 61% 23%Total 0 1 29 53 17 0 204 15 9 16% 62% 22%Management
Business Administration (BBA) 0 0 38 156 44 0 422 22 2 23% 62% 15% Entrepreneurship (BBA) 0 0 4 41 9 0 52 3 0 38% 48% 15% Management (BBA) 0 1 15 46 9 0 143 5 1 21% 65% 14%
Total 0 1 57 243 62 0 617 30 3 24% 61% 15%Marketing
Business Education (BS) 0 0 3 13 0 0 24 0 1 32% 59% 10% Marketing (BBA) 0 2 17 71 20 0 209 4 3 22% 64% 14% Office Management (BBA) 0 0 0 0 0 0 1 0 0 0% 100% 0%
Total 0 2 20 84 20 0 234 4 4 23% 64% 14%
947
79748827
947
5050
547
283283
4,457
41287328
684
547
400400
3261
368
109220
1,013
41
Back to Table of ContentsBack to Table of ContentsBack to Table of Contents
Alaskan Native
American Indian Asian
Black or African
American Hispanic
Native Hawaiian or Other Pacific
Islander WhiteTwo Or More
Races Not Specified % Black%
White%
OtherTotal
Undergraduate Majors by Race/Ethnicity Within College & Department-Fall Term 2016
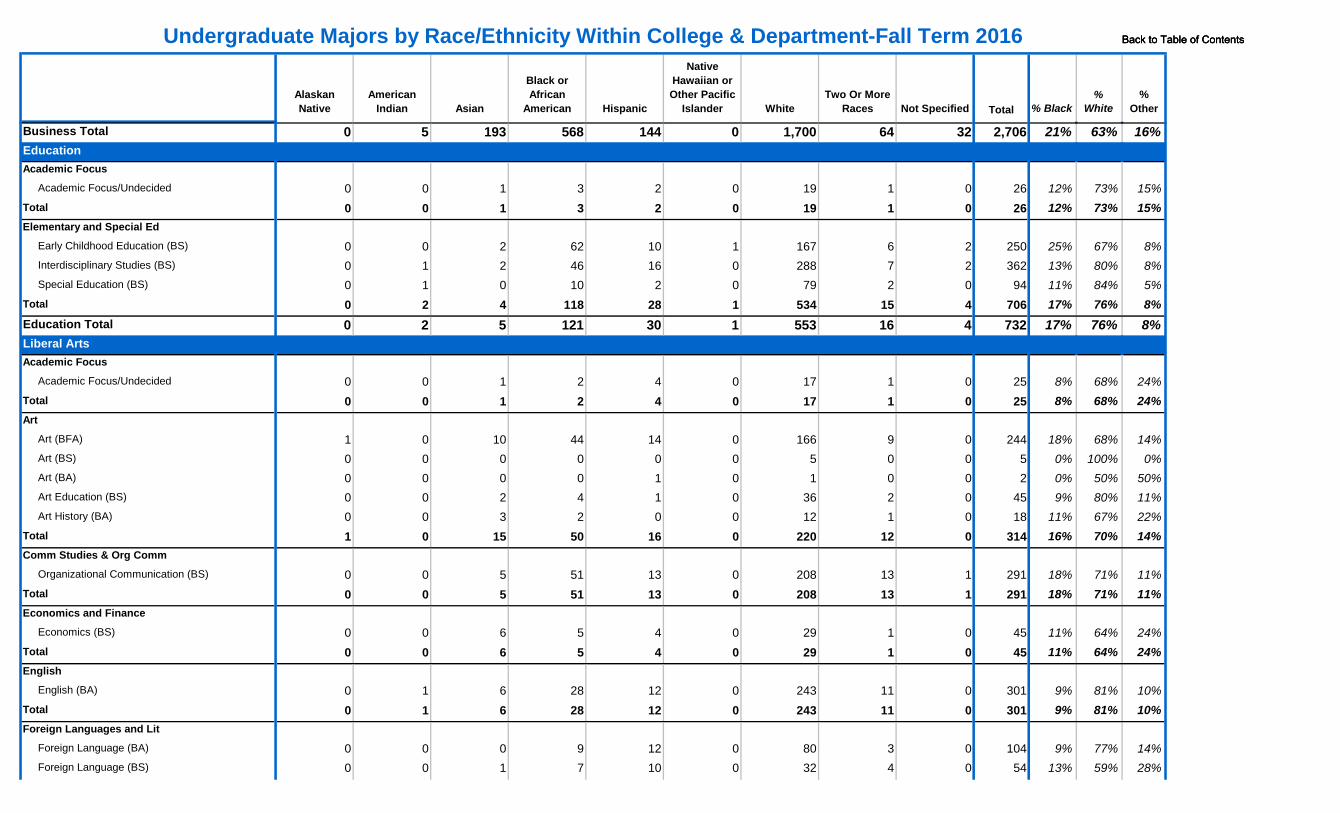
Business Total 0 5 193 568 144 0 1,700 64 32 21% 63% 16%EducationAcademic Focus
Academic Focus/Undecided 0 0 1 3 2 0 19 1 0 12% 73% 15%Total 0 0 1 3 2 0 19 1 0 12% 73% 15%Elementary and Special Ed
Early Childhood Education (BS) 0 0 2 62 10 1 167 6 2 25% 67% 8% Interdisciplinary Studies (BS) 0 1 2 46 16 0 288 7 2 13% 80% 8% Special Education (BS) 0 1 0 10 2 0 79 2 0 11% 84% 5%
Total 0 2 4 118 28 1 534 15 4 17% 76% 8%Education Total 0 2 5 121 30 1 553 16 4 17% 76% 8%Liberal ArtsAcademic Focus
Academic Focus/Undecided 0 0 1 2 4 0 17 1 0 8% 68% 24%Total 0 0 1 2 4 0 17 1 0 8% 68% 24%Art
Art (BFA) 1 0 10 44 14 0 166 9 0 18% 68% 14% Art (BS) 0 0 0 0 0 0 5 0 0 0% 100% 0% Art (BA) 0 0 0 0 1 0 1 0 0 0% 50% 50%
Art Education (BS) 0 0 2 4 1 0 36 2 0 9% 80% 11% Art History (BA) 0 0 3 2 0 0 12 1 0 11% 67% 22%
Total 1 0 15 50 16 0 220 12 0 16% 70% 14%Comm Studies & Org Comm
Organizational Communication (BS) 0 0 5 51 13 0 208 13 1 18% 71% 11%Total 0 0 5 51 13 0 208 13 1 18% 71% 11%Economics and Finance
Economics (BS) 0 0 6 5 4 0 29 1 0 11% 64% 24%Total 0 0 6 5 4 0 29 1 0 11% 64% 24%English
English (BA) 0 1 6 28 12 0 243 11 0 9% 81% 10%Total 0 1 6 28 12 0 243 11 0 9% 81% 10%Foreign Languages and Lit
Foreign Language (BA) 0 0 0 9 12 0 80 3 0 9% 77% 14% Foreign Language (BS) 0 0 1 7 10 0 32 4 0 13% 59% 28%
2,706
36294
706732
2626
250
52
4518
314
2525
244
45
301301
291291
45
10454
Back to Table of ContentsBack to Table of ContentsBack to Table of Contents

Alaskan Native
American Indian Asian
Black or African
American Hispanic
Native Hawaiian or Other Pacific
Islander WhiteTwo Or More
Races Not Specified % Black%
White%
OtherTotal
Undergraduate Majors by Race/Ethnicity Within College & Department-Fall Term 2016
Total 0 0 1 16 22 0 112 7 0 10% 71% 19%Global Studies
Global Studies & Cultural Geography (BS) 0 0 6 8 7 0 62 7 1 9% 68% 23%Total 0 0 6 8 7 0 62 7 1 9% 68% 23%History
History (BA) 0 0 0 4 2 0 113 1 0 3% 94% 3% History (BS) 0 0 0 3 2 0 79 5 0 3% 89% 8%
Total 0 0 0 7 4 0 192 6 0 3% 92% 5%Music
Music (BM) 0 0 8 25 13 0 185 8 0 10% 77% 12%Total 0 0 8 25 13 0 185 8 0 10% 77% 12%Philosophy
Philosophy (BS) 0 0 0 0 1 0 14 1 0 0% 88% 13% Philosophy (BA) 0 1 0 4 2 0 21 0 0 14% 75% 11%Total 0 1 0 4 3 0 35 1 0 9% 80% 11%Political Sci & Intl Relations
International Relations (BS) 0 0 0 5 2 0 31 0 0 13% 82% 5% International Relations (BA) 0 0 1 0 3 0 15 1 0 0% 75% 25% Political Science (BS) 0 1 3 47 12 0 119 13 0 24% 61% 15% Political Science (BA) 0 0 1 15 9 0 40 5 0 21% 57% 21%
Total 0 1 5 67 26 0 205 19 0 21% 63% 16%Sociology and Anthropology
Anthropology (BS) 0 0 0 6 3 0 51 1 1 10% 82% 8% Anthropology (BA) 0 0 1 1 1 0 7 0 0 10% 70% 20% Sociology (BS) 0 0 1 9 3 0 38 3 0 17% 70% 13% Sociology (BA) 0 0 0 7 1 0 16 1 0 28% 64% 8%
Total 0 0 2 23 8 0 112 5 1 15% 74% 11%Theatre and Dance
Theatre (BS) 0 0 2 15 4 0 77 3 0 15% 76% 9%Total 0 0 2 15 4 0 77 3 0 15% 76% 9%Liberal Arts Total 1 3 57 301 136 0 1,697 94 3 13% 74% 13%Media and EntertainmentAcademic Focus
Academic Focus/Undecided 0 0 1 2 0 0 5 1 0 22% 56% 22%
91
12089
209
158
91
2844
3820
239239
16
105425
151
19570
323
62
9
101101
2,292
Back to Table of ContentsBack to Table of ContentsBack to Table of Contents

Alaskan Native
American Indian Asian
Black or African
American Hispanic
Native Hawaiian or Other Pacific
Islander WhiteTwo Or More
Races Not Specified % Black%
White%
OtherTotal
Undergraduate Majors by Race/Ethnicity Within College & Department-Fall Term 2016
Total 0 0 1 2 0 0 5 1 0 22% 56% 22%Electronic Media Communication
Animation (BS) 0 0 3 5 3 0 32 3 0 11% 70% 20% Mass Communication (BS) 0 2 19 114 36 0 422 19 1 19% 69% 13%Total 0 2 22 119 39 0 454 22 1 18% 69% 13%Journalism
Journalism (BS) 0 1 5 32 5 0 85 5 0 24% 64% 12% Mass Communication (BS) 0 1 13 143 21 0 274 26 2 30% 57% 13%Total 0 2 18 175 26 0 359 31 2 29% 59% 13%Recording Industry
Recording Industry (BS) 0 5 19 196 48 1 849 36 1 17% 74% 10%Total 0 5 19 196 48 1 849 36 1 17% 74% 10%Media and Entertainment Total 0 9 60 492 113 1 1,667 90 4 20% 68% 11%Non-Degree SeekingNon-Degree Seeking
Non Degree Seeking (NDUG) 0 1 72 43 26 0 473 19 61 6% 68% 26%Total 0 1 72 43 26 0 473 19 61 6% 68% 26%Non-Degree Seeking Total 0 1 72 43 26 0 473 19 61 6% 68% 26%University CollegeAcademic Focus- Undecided
Academic Focus/Undecided 0 2 19 87 22 1 291 18 2 20% 66% 14% AF/Undecided-Prior Bachelors 0 0 0 8 2 0 39 1 0 16% 78% 6%Total 0 2 19 95 24 1 330 19 2 19% 67% 14%Regents Online Degree Program
Liberal Studies (BS) 0 3 8 154 27 0 403 18 2 25% 66% 9% Professional Studies (BS) 0 1 3 107 15 0 266 13 2 26% 65% 8%Total 0 4 11 261 42 0 669 31 4 26% 65% 9%University Studies
Integrated Studies (BS) 0 0 1 43 6 0 73 4 0 34% 57% 9%Total 0 0 1 43 6 0 73 4 0 34% 57% 9%University College Total 0 6 31 399 72 1 1,072 54 6 24% 65% 10%Grand Total 1 53 879 4,169 1,006 11 12,764 639 171 21% 65% 14%
9
46613
1,1551,1552,436
659
133480613
44250
492
695695695
1271,641
19,693Source:TBR 14th-day Enrollment Data
615407
1,022
127
Back to Table of ContentsBack to Table of ContentsBack to Table of Contents

Major/Degree Part-Time Full-Time Part-Time Total
Regular-Degree-seeking Accounting (MACC) 32 14 26 87 Administration & Supervision (MED) 66 6 21 115 Administration & Supervision (EDS) 32 1 13 46 Assessment, Lrn & Sch Imprvmnt (EDD) 22 0 6 30 Aviation Administration (MS) 6 8 16 33 Biology (MS) 11 1 16 29 Business Administration (MBA) 48 31 63 167 Business Education (MBE) 3 1 0 5 Chemistry (MS) 9 3 14 30 Computational Science (PHD) 1 8 17 29 Computer Science (MS) 1 19 11 38 Criminal Justice Admin (MCJ) 10 7 11 34 Curriculum & Inst/Ed Leadership(MED) 53 10 29 109 Curriculum & Inst/Ed Leadership(EDS) 20 0 5 26 Curriculum & Inst/Elem Edu* (MED) 26 3 1 77 Curriculum & Inst/Psychology (EDS) 11 0 0 11 Economics (MA) 0 2 3 7 Economics (PHD) 2 9 11 27 English (MA) 19 0 8 29 English (PHD) 32 1 16 51 Engr Tech & Industrial Studies (MS) 1 6 4 16 Exercise Science (MS) 5 3 3 13 Finance (MS) 0 7 0 12 Foreign Language (MAT) 4 4 1 16 Health and Human Performance (MS) 3 0 2 9 History (MA) 22 9 18 63 Horse Science (MS) 0 0 0 11 Human Performance (PHD) 27 3 10 45 Information Systems (MS) 15 36 32 102 International Affairs (MA) 4 4 5 18 Leisure and Sport Management (MS) 6 8 5 22 Liberal Arts (MA) 17 6 12 37 Library Science* (MLS) 12 0 1 18 Literacy (MED) 10 0 0 12 Literacy Studies (PHD) 15 1 5 30 Management (MS) 13 3 9 32 Mathematics(MS) 2 3 5 15 Mathematics(MST) 1 0 0 2 Mathematics & Science Educ (PHD) 17 1 10 31 Media and Communication (MS) 13 5 10 33 Molecular Biosciences (PHD) 11 5 13 35 Music (MM) 4 14 3 30
Graduate Majors by Gender & Enrollment StatusFall 2016
Female MaleFull-Time
437
15220231
251
5
2
41411
7
6
25
171
52
5
470
2
325
195
569
3
297
15
Back to Table of ContentsBack to Table of ContentsBack to Table of Contents

Major/Degree Part-Time Full-Time Part-Time Total
Graduate Majors by Gender & Enrollment StatusFall 2016
Female MaleFull-Time
Professional Counseling (MED) 35 1 6 60 Professional Science (MS) 15 30 25 92 Psychology (MA) 28 12 8 101 Public History (PHD) 15 0 9 29 Recording Arts & Technologies (MFA) 2 16 6 31 Social Work (MSW) 26 1 4 54 Sociology (MA) 2 2 0 13 Special Education (MED) 9 2 1 17Regents Online Degree Program Adv Stud in Teaching Learning (MED) 7 0 0 8 Nursing (MSN) 142 3 11 175 Professional Studies (MPS) 36 2 19 59Non-Degree Seeking AddOn Endorsement/Library Sci (NDGD) 10 0 1 11 AddOn Endorsement/Special Educ (NDGD) 1 0 0 1 Alternative I & II Licensure (NDGD) 18 2 15 36 Non Degree Seeking (NDGD) 38 3 16 62 Occupational Licensure (NDGD) 3 0 4 7 Schl Counseling Licensre Trck (NDGD) 5 0 0 5 Special Edu Licensure Track (NDGD) 5 0 0 5Graduate Certificates Family Nurse Practitioner (GCRT) 3 0 0 4 Gerontology* (GCRT) 1 0 0 1 Health Care Management (GCRT) 0 0 2 2 U.S. Culture and Education (GCRT) 0 1 0 1 Women's and Gender Studies (GCRT) 0 0 0 1Total 1007 317 562 2357
57
23
182253
95
1192
00
471
10001
15000
Back to Table of ContentsBack to Table of ContentsBack to Table of Contents

Major/DegreeAlaskan Native
American Indian Asian
Black or African
American Hispanic
Native Hawaiian or Other Pacific
Islander White Not Specified Total % Black % White % OtherRegular Degree-Seeking
Accounting (MACC) 0 0 11 6 4 0 64 0 87 7% 74% 20% Administration & Supervision (MED) 0 0 3 14 4 0 92 0 115 12% 80% 8% Administration & Supervision (EDS) 0 0 0 2 0 0 44 0 46 4% 96% 0% Assessment, Learning & School Improvement (EDD) 0 0 0 4 0 0 26 0 30 13% 87% 0% Aviation Administration (MS) 0 0 9 2 1 0 20 0 33 6% 61% 33% Biology (MS) 0 0 0 0 1 0 28 0 29 0% 97% 3% Business Administration (MBA) 0 3 16 21 8 0 114 0 167 13% 68% 19% Business Education (MBE) 0 0 0 1 0 0 4 0 5 20% 80% 0% Chemistry (MS) 0 0 12 5 2 0 11 0 30 17% 37% 47% Computational Science (PHD) 0 0 12 2 0 0 14 0 29 7% 48% 45% Computer Science (MS) 0 0 14 2 1 0 21 0 38 5% 55% 39% Criminal Justice Administration (MCJ) 0 0 0 10 1 0 21 0 34 29% 62% 9% Curriculum & Instruction, Educational Leadership (EDS) 0 0 0 2 1 0 22 0 26 8% 85% 8% Curriculum & Instruction, Educational Leadership (MED) 0 0 7 11 6 0 84 0 109 10% 77% 13% Curriculum & Instruction, Elementary Education (MED) 0 0 0 10 2 0 63 0 77 13% 82% 5% Curriculum & Instruction, Psychology (EDS) 0 0 0 1 1 0 8 0 11 9% 73% 18% Economics (PHD) 0 0 11 4 1 0 10 0 27 15% 37% 48% Economics (MA) 0 0 0 1 0 0 6 0 7 14% 86% 0% Engineering Technology & Industrial Studies (MS) 0 0 1 4 1 0 10 0 16 25% 63% 13% English (PHD) 0 0 3 2 3 0 43 0 51 4% 84% 12% English (MA) 0 0 2 1 0 0 26 0 29 3% 90% 7% Exercise Science (MS) 0 0 0 1 0 0 12 0 13 8% 92% 0% Finance (MS) 0 0 7 2 0 0 3 0 12 17% 25% 58% Foreign Language (MAT) 0 0 0 0 4 0 11 0 16 0% 69% 31% Health and Human Performance (MS) 0 0 0 2 0 0 7 0 9 22% 78% 0% History (MA) 0 0 2 1 2 0 58 0 63 2% 92% 6% Horse Science (MS) 0 0 0 0 1 0 10 0 11 0% 91% 9% Human Performance (PHD) 0 0 5 4 1 0 34 0 45 9% 76% 16% Information Systems (MS) 0 0 25 9 0 0 65 0 102 9% 64% 27% International Affairs (MA) 0 0 1 3 2 0 12 0 18 17% 67% 17% Leisure and Sport Management (MS) 0 0 0 1 0 0 20 0 22 5% 91% 5% Liberal Arts (MA) 0 0 0 5 0 0 30 0 37 14% 81% 5% Library Science* (MLS) 0 0 0 0 0 0 18 0 18 0% 100% 0% Literacy (MED) 0 0 0 0 0 0 12 0 12 0% 100% 0% Literacy Studies (PHD) 1 0 6 3 0 0 19 0 30 10% 63% 27% Management (MS) 0 0 2 5 0 0 25 0 32 16% 78% 6% Mathematics (MS) 0 0 4 0 2 0 8 0 15 0% 53% 47% Mathematics (MST) 0 0 0 0 0 0 2 0 2 0% 100% 0%0
00101
13012
01000
00000
11211
00102
00105
Two Or More Races
22
Graduate Majors by Race- Fall 2016Back to Table of ContentsBack to Table of ContentsBack to Table of Contents

Major/DegreeAlaskan Native
American Indian Asian
Black or African
American Hispanic
Native Hawaiian or Other Pacific
Islander White Not Specified Total % Black % White % OtherTwo Or More
Races
Graduate Majors by Race- Fall 2016
Mathematics & Science Education (PHD) 0 0 2 4 1 0 24 0 31 13% 77% 10% Media and Communication (MS) 0 0 2 6 2 0 21 0 33 18% 64% 18% Molecular Biosciences (PHD) 0 1 9 1 1 0 19 0 35 3% 54% 43% Music (MM) 0 0 5 0 2 0 23 0 30 0% 77% 23% Professional Counseling (MED) 0 0 2 8 2 0 46 0 60 13% 77% 10% Professional Science (MS) 0 0 22 5 1 0 60 0 92 5% 65% 29% Psychology (MA) 0 1 4 10 5 0 81 0 101 10% 80% 10% Public History (PHD) 0 0 0 6 1 0 22 0 29 21% 76% 3% Recording Arts & Technologies (MFA) 0 0 1 6 3 0 18 0 31 19% 58% 23% Social Work (MSW) 0 1 1 16 1 0 33 0 54 30% 61% 9% Sociology (MA) 0 0 2 2 1 0 5 1 13 15% 38% 46% Special Education (MED) 0 0 3 1 0 1 12 0 17 6% 71% 24%Regents Online Degree Program
Advanced Studies in Teaching & Learning (MED) 0 0 0 0 0 0 8 0 8 0% 100% 0% Nursing (MSN) 0 0 3 24 2 0 144 0 175 14% 82% 4% Professional Studies (MPS) 0 0 3 17 1 0 37 0 59 29% 63% 8%Non-Degree Seeking
Add-On Endorsement- Library Science (NDGD) 0 0 0 0 0 0 11 0 11 0% 100% 0% Add-On Endorsement- Special Education (NDGD) 0 0 0 0 0 0 1 0 1 0% 100% 0% Alternative I & II Licensure (NDGD) 0 0 0 1 2 0 33 0 36 3% 92% 6% Non Degree Seeking (NDGD) 0 0 1 6 3 0 52 0 62 10% 84% 6% Occupational Licensure (NDGD) 0 0 0 1 0 0 5 0 7 14% 71% 14% School Counseling Licensure Track (NDGD) 0 0 1 0 0 0 4 0 5 0% 80% 20% Special Education Licensure Track (NDGD) 0 0 0 0 0 0 5 0 5 0% 100% 0%Graduate Certificates
Family Nurse Practitioner (GCRT) 0 0 1 0 1 0 2 0 4 0% 50% 50% Gerontology (GCRT) 0 0 0 0 0 0 1 0 1 0% 100% 0% Health Care Management (GCRT) 0 0 0 1 0 0 1 0 2 50% 50% 0% U.S. Culture and Education (GCRT) 0 0 0 0 0 0 1 0 1 0% 100% 0% Women's and Gender Studies (GCRT) 0 0 0 0 0 0 1 0 1 0% 100% 0%
Grand Total 1 6 215 256 78 1 1,747 1 2,357 11% 74% 15%0
52
Source:TBR 14th-day Enrollment Data
0000
00100
21
00
220
0
24003
0240
Back to Table of ContentsBack to Table of ContentsBack to Table of Contents

College/Department/Subject N SCH N SCH N SCH N SCH N SCH N SCH N SCH N Basic and Applied Sciences Aerospace
AERO-Aerospace 553 1,659 214 627 627 1,694 352 902 72 186 1,818
TRNS-Transportation 22 66 29 87 51
Total 575 1,725 214 627 656 1,781 352 902 72 186 1,869
Agribusiness and Agriscience
ABAS-Agribusiness&Agriscience 338 792 185 525 386 1,158 307 910 9 27 34 102 1,259
Total 338 792 185 525 386 1,158 307 910 9 27 34 102 1,259
Basic and Applied Sciences
MOBI-Molecular Biosciences 10 30 10
MSE-Math Science Education 31 31 9 9 39 75 79
Total 31 31 9 9 49 105 89
Biology
BIOL-Biology (MTSU & TN eC) 2,901 5,713 1,981 3,882 1,011 2,308 652 1,416 17 35 85 220 6,647
FRSC-Forensics Science 11 28 11
FSBI-Forensics Sci-Biology 18 42 18
MOBI-Molecular Biosciences 63 190 63
Total 2,901 5,713 1,981 3,882 1,011 2,308 681 1,486 17 35 85 220 63 190 6,739
Chemistry
CHEM-Chemistry 2,869 5,752 178 402 695 1,373 322 841 81 234 6 20 4,151
FSCH-Forensics Sci-Chemistry 2 4 2
PREP-Pre-Professional 3+1 1 0 1
PSCI-Physical Science 680 1,360 56 224 736
Total 3,549 7,112 178 402 697 1,377 379 1,065 81 234 6 20 4,890
Computer Science
CSCI-Computer Sci (MTSU&TN eC) 577 1,733 92 368 304 1,001 149 447 28 84 71 217 12 36 1,233
Total 577 1,733 92 368 304 1,001 149 447 28 84 71 217 12 36 1,233
Concrete and Construction Mgmt
CIM-Concrete Industry Mgmt 83 83 13 26 143 437 174 462 6 18 419
Total 83 83 13 26 143 437 174 462 6 18 419
Engineering Technology
CMT-Const Mgt T-MTSU Comp-TN e 53 159 125 375 96 288 274
ENGR-Engineering 160 480 218 654 309 927 79 197 766
EST-Environmental Sci & Tech 24 72 39 117 63
1,026
822
2,258
189
3,886
3,886
1,026
8,622
4
0
1,584
10,210
28
42
190
13,834
30
115
145
13,574
5,221
3,514
3,514
SCH
5,068
153
SCH Taught by College, Department, Course Level and TermFall 2016
Lower Upper Masters Doctoral
Total1000 2000 3000 4000 5000 6000 7000
Back to Table of ContentsBack to Table of ContentsBack to Table of Contents

College/Department/Subject N SCH N SCH N SCH N SCH N SCH N SCH N SCH N SCH
SCH Taught by College, Department, Course Level and TermFall 2016
Lower Upper Masters Doctoral
Total1000 2000 3000 4000 5000 6000 7000
ET-Engineering Technology 112 315 255 780 232 635 4 12 66 196 669
Total 213 639 354 1,041 689 2,082 446 1,237 4 12 66 196 1,772
Geosciences
GEOL-Geology 1,481 3,066 20 60 127 504 3 9 3 6 1,634
PGEO-Physical Geography 10 40 93 310 22 67 8 22 133
Total 1,491 3,106 20 60 220 814 25 76 11 28 1,767
Mathematical Sciences
ACSI-Actuarial Sciences 52 156 10 30 34 102 96
COMS-Computational Science 14 51 13 60 27
MATH-Mathematics (MTSU & TN e) 4,733 15,472 239 659 214 734 122 370 20 48 30 90 1 3 5,359
STAT-Statistics 18 54 44 132 38 114 42 126 5 15 147
Total 4,733 15,472 239 659 232 788 218 658 68 192 120 369 19 78 5,629
Military Science
MS-Military Science 49 94 24 48 33 88 25 75 131
Total 49 94 24 48 33 88 25 75 131
Physics and Astronomy
ASTR-Astronomy 927 1,945 41 89 968
PHYS-Physics (MTSU & TN eC) 88 226 905 1,816 100 266 40 103 1,133
Total 1,015 2,171 905 1,816 141 355 40 103 2,101
Basic and Applied Sciences Total 15,555 38,671 4,194 9,403 4,312 11,435 2,991 8,159 151 426 546 1,570 149 429 27,898
Behavioral and Health Sciences Criminal Justice
CJA-Criminal Justice Admin 147 441 350 1,050 445 1,335 381 1,161 13 39 64 192 1,400
FSCJ-Forensics Sci-Crim Just 54 162 54
Total 147 441 350 1,050 445 1,335 435 1,323 13 39 64 192 1,454
Health and Human Performance
ATHC-Athletic Coaching 24 48 143 429 213 639 13 39 393
ATHT-Athletic Training 425 1,048 76 200 501
CDIS-Communication Disorders 361 1,083 89 267 450
EXSC-Exercise Science 422 1,026 375 1,602 15 46 11 33 823
HHP-Health & Human Performance 26 78 42 134 68
HLTH-Health 1,334 2,001 45 135 678 2,019 594 1,696 2 3 10 30 2,663
LSM-Leisure and Sports Mgt 14 42 37 109 1 3 52
LSTS-Leisure, Sprt&Tourism Stu 329 987 262 930 591
212
5,884
154
1,917
1,155
1,248
1,350
2,707
4,218
162
4,380
2,034
2,411
4,445
70,093
441
18,216
305
305
4,084
288
111
17,376
1,938
5,207
3,645
439
Back to Table of ContentsBack to Table of ContentsBack to Table of Contents

College/Department/Subject N SCH N SCH N SCH N SCH N SCH N SCH N SCH N SCH
SCH Taught by College, Department, Course Level and TermFall 2016
Lower Upper Masters Doctoral
Total1000 2000 3000 4000 5000 6000 7000
PHED-Physical Education 1,075 1,163 109 149 302 858 117 302 3 14 2 6 1,608
Total 2,409 3,164 178 332 2,660 7,450 1,726 5,636 29 84 91 277 56 176 7,149
Human Sciences
CDFS-Child Dev Family Services 41 123 340 1,020 266 798 647
FCSE-Family and Consumer Sci 29 87 1 3 30
HSC-Human Sciences (MTSU&TN e) 97 97 122 277 7 21 226
IDES-Interior Design 42 126 51 153 58 174 151
NFS-Nutrition and Food Science 128 384 128 384 411 1,047 308 923 975
TXMD-Textiles Merch Design 96 288 90 135 118 354 53 159 357
Total 350 856 301 768 920 2,574 807 2,331 1 3 7 21 2,386
Nursing
NURS-Nursing 873 2,275 547 1,798 67 201 1,487
Total 873 2,275 547 1,798 67 201 1,487
Psychology
PSY-Psychology (MTSU & TN eC) 1,216 3,648 794 2,078 1,023 2,834 1,089 3,247 27 81 353 815 38 87 4,540
Total 1,216 3,648 794 2,078 1,023 2,834 1,089 3,247 27 81 353 815 38 87 4,540
Social Work
SW-Social Work 174 522 350 1,050 266 1,110 3 9 163 489 956
Total 174 522 350 1,050 266 1,110 3 9 163 489 956
Behavioral and Health Sciences Total 4,122 8,109 1,797 4,750 6,271 17,518 4,870 15,445 73 216 745 1,995 94 263 17,972
Business Accounting
ACTG-Accounting 648 1,944 618 1,854 306 918 20 60 161 411 1,753
BLAW-Business Law 564 1,692 11 33 7 21 582
MBAA-MBA Accounting 56 120 56
Total 648 1,944 1,182 3,546 317 951 20 60 224 552 2,391
Business
BUS-Business 55 55 317 951 372
MBAB-MBA Business Admin 61 61 61
Total 55 55 317 951 61 61 433
Computer Information Systems
BIA-Bus Intelligence Analytics 259 777 600 900 44 132 95 285 998
INFS-Computer Info Systems 4 12 362 1,086 563 1,689 191 573 58 174 173 514 1,351
MBAI-MBA Information Systems 94 211 94
2,094
4,048
211
1,006
61
1,067
5,187
1,746
120
7,053
3,180
3,180
48,296
4,274
4,274
12,790
12,790
453
2,738
936
6,553
17,119
1,941
90
395
2,492
Back to Table of ContentsBack to Table of ContentsBack to Table of Contents

College/Department/Subject N SCH N SCH N SCH N SCH N SCH N SCH N SCH N SCH
SCH Taught by College, Department, Course Level and TermFall 2016
Lower Upper Masters Doctoral
Total1000 2000 3000 4000 5000 6000 7000
Total 4 12 621 1,863 1,163 2,589 235 705 58 174 362 1,010 2,443
Economics and Finance
ECON-Economics (MTSU & TN eC) 922 2,766 123 369 116 348 1 3 13 39 56 187 1,231
FIN-Finance 17 51 713 2,139 112 336 4 12 56 168 902
MBAE-MBA Economics 45 90 45
MBAF-MBA Finance 55 120 55
Total 939 2,817 836 2,508 228 684 5 15 169 417 56 187 2,233
Management
BUAD-Business Administration 246 738 21 63 267
ENTR-Entrepreneurship 165 495 17 51 76 228 258
LEAD-Leadership Studies 163 504 10 10 173
MBAM-MBA Management 76 180 76
MGMT-Management (MTSU & TN eC) 1,282 3,846 227 681 149 447 1,658
Total 165 495 1,462 4,401 559 1,657 246 690 2,432
Marketing
BCED-Business Comm & Education 183 549 48 144 328 984 52 156 3 9 43 129 657
MBAK-MBA Marketing 44 98 44
MKT-Marketing (MTSU & TN eC) 1,353 4,059 139 417 1,492
Total 183 549 48 144 1,681 5,043 191 573 3 9 87 227 2,193
Business Total 242 616 2,421 7,263 6,641 19,038 1,530 4,570 86 258 1,149 2,957 56 187 12,125
Education Education
ALSI-Assess Lrn & Schl Improve 69 158 69
LITS-Literacy Studies 14 42 14
Total 83 200 83
Educational Leadership
COUN-Counseling 136 407 3 9 139
FOED-Foundations of Education 2 6 181 543 32 96 215
LIBS-Library Science 56 168 113 339 169
SPSE-School Personnel Serv Edu 20 60 273 819 73 231 366
YOED-Youth Education 34 102 92 276 81 705 3 27 33 99 243
Total 34 102 92 276 137 873 25 93 736 2,207 108 336 1,132
Elementary and Special Ed
DYST-Dyslexic Studies 10 30 3 9 13 39
645
507
1,110
1,209
3,887
158
42
200
416
4,476
6,545
34,889
4,974
7,243
1,971
98
801
774
514
180
3,712
2,706
90
120
6,628
6,353
Back to Table of ContentsBack to Table of ContentsBack to Table of Contents

College/Department/Subject N SCH N SCH N SCH N SCH N SCH N SCH N SCH N SCH
SCH Taught by College, Department, Course Level and TermFall 2016
Lower Upper Masters Doctoral
Total1000 2000 3000 4000 5000 6000 7000
ECE-Early Childhood Education 46 138 20 60 163 711 229
EESE-Elem Early & Special Educ 206 412 206
ELED-Elementary Ed (MTSU&TN e) 109 327 274 1,349 7 63 175 499 565
LITS-Literacy Studies 30 90 30
MLED-Middle Level Education 5 5 27 108 32
READ-Reading 129 507 10 30 24 72 163
SPED-Special Education 171 513 75 253 12 36 51 153 309
Total 206 412 46 138 305 905 668 2,928 29 129 260 754 33 99 1,547
Education Total 206 412 80 240 397 1,181 805 3,801 54 222 996 2,961 224 635 2,762
Liberal Arts African American Studies
AAS-African American Studies 160 480 10 30 55 165 225
Total 160 480 10 30 55 165 225
Aging Studies
GERO-Gerontology 7 21 7
Total 7 21 7
Art
ART-Art 1,094 3,282 121 363 348 1,024 225 669 1,788
Total 1,094 3,282 121 363 348 1,024 225 669 1,788
Comm Studies & Org Comm
COMM-Comm Studies(MTSU & TN e) 1,728 5,184 284 846 44 132 2,056
ORCO-Organizational Comm 668 2,004 143 427 811
Total 1,728 5,184 952 2,850 187 559 2,867
English
ENGL-English (MTSU & TN eC) 3,495 10,485 1,866 5,598 614 1,834 207 573 1 3 50 149 75 218 6,308
Total 3,495 10,485 1,866 5,598 614 1,834 207 573 1 3 50 149 75 218 6,308
Foreign Languages and Lit
ARAB-Arabic 28 84 5 15 9 27 42
CHIN-Chinese 13 39 10 30 2 6 25
FL-Foreign Languages 7 21 7 21 10 30 24
FREN-French 84 252 53 159 23 69 2 6 11 33 4 12 177
GERM-German 36 108 21 63 33 89 15 45 105
HEBR-Hebrew 3 9 3
HUM-Humanities 198 594 32 96 230 690
75
72
531
305
9
18,860
18,860
126
5,338
6,162
2,431
8,593
21
21
5,338
9,452
675
675
90
113
609
955
5,365
909
412
2,238
Back to Table of ContentsBack to Table of ContentsBack to Table of Contents

College/Department/Subject N SCH N SCH N SCH N SCH N SCH N SCH N SCH N SCH
SCH Taught by College, Department, Course Level and TermFall 2016
Lower Upper Masters Doctoral
Total1000 2000 3000 4000 5000 6000 7000
ITAL-Italian 22 66 8 24 1 3 31
JAPN-Japanese 87 261 49 147 50 150 38 114 224
LATN-Latin 12 36 2 6 14
PORT-Portuguese 7 21 7
RUSS-Russian 17 51 5 15 1 3 23
SPAN-Spanish (MTSU & TN eC) 191 573 132 396 280 778 26 78 2 6 11 33 642
Total 500 1,500 483 1,449 431 1,221 88 264 20 60 25 75 1,547
Global Studies
GEOG-Geography (MTSU & TN eC) 219 657 11 33 48 144 1 3 279
GS-Global Studies 244 732 100 300 24 72 368
Total 463 1,389 111 333 72 216 1 3 647
History
HIST-History (MTSU & TN eC) 269 807 3,705 11,115 179 537 201 603 2 6 145 411 43 140 4,544
Total 269 807 3,705 11,115 179 537 201 603 2 6 145 411 43 140 4,544
Liberal Arts
MALA-Masters in Liberal Arts 55 165 55
Total 55 165 55
Music
MUAP-Music Applied 262 353 2 2 101 189 3 4 21 63 389
MUED-Music Education 40 40 41 82 17 51 30 69 10 30 3 8 141
MUEN-Music Ensembles 852 630 28 28 880
MUHL-Music History & Lit 17 34 89 267 15 41 11 24 132
MUPD-Music Pedagogy 17 34 2 4 1 2 3 7 23
MUS-Music 1,371 3,315 27 27 48 96 28 64 7 19 18 52 1,499
MUTH-Music Theory 155 577 48 144 5 15 36 76 10 29 1 3 255
Total 1,583 3,966 395 640 1,013 1,061 212 443 70 136 46 133 3,319
Philosophy
PHIL-Philosophy (MTSU & TN eC) 455 1,365 30 90 101 303 69 207 655
RS-Religious Studies 79 237 40 120 20 60 139
Total 455 1,365 109 327 141 423 89 267 794
Political Sci & Intl Relations
PLEG-Paralegal Studies 13 39 13
PS -Political Science 392 1,176 138 276 389 1,167 174 531 3 9 41 129 1,137
Total 392 1,176 138 276 402 1,206 174 531 3 9 41 129 1,150
2,382
39
3,288
3,327
844
6,379
1,965
417
280
658
366
47
3,573
165
165
611
1,104
1,941
13,619
13,619
69
1,864
4,569
837
93
672
42
21
Back to Table of ContentsBack to Table of ContentsBack to Table of Contents
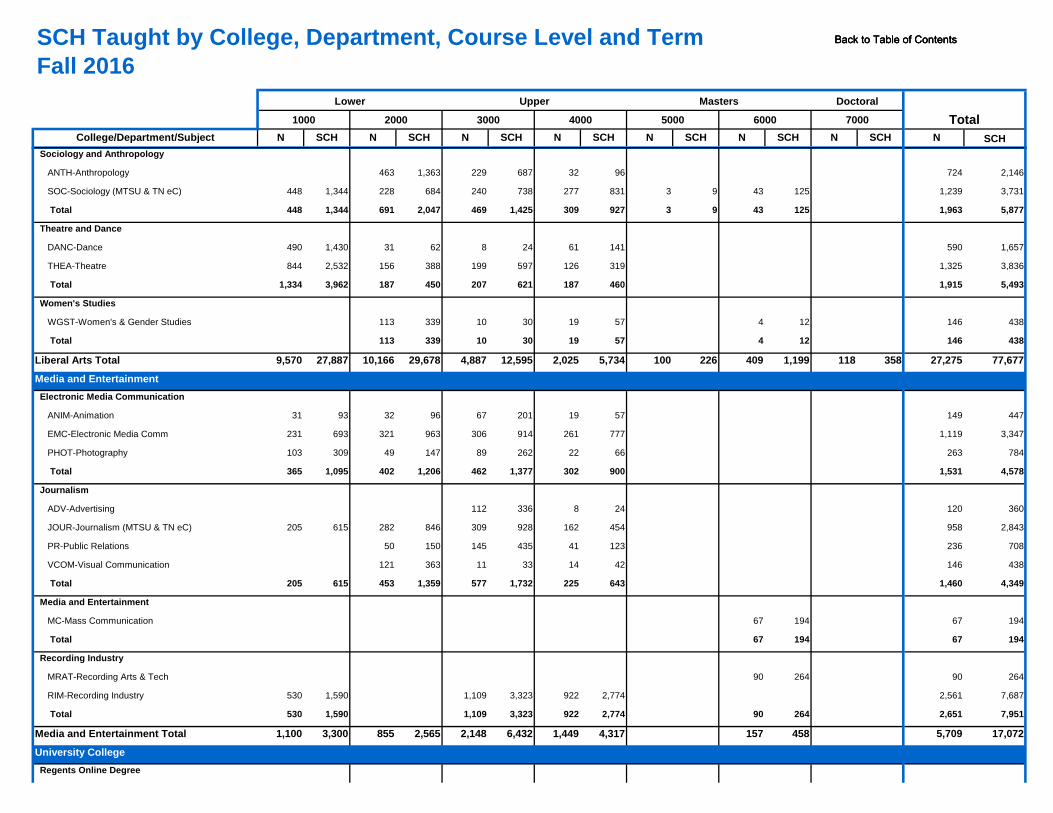
College/Department/Subject N SCH N SCH N SCH N SCH N SCH N SCH N SCH N SCH
SCH Taught by College, Department, Course Level and TermFall 2016
Lower Upper Masters Doctoral
Total1000 2000 3000 4000 5000 6000 7000
Sociology and Anthropology
ANTH-Anthropology 463 1,363 229 687 32 96 724
SOC-Sociology (MTSU & TN eC) 448 1,344 228 684 240 738 277 831 3 9 43 125 1,239
Total 448 1,344 691 2,047 469 1,425 309 927 3 9 43 125 1,963
Theatre and Dance
DANC-Dance 490 1,430 31 62 8 24 61 141 590
THEA-Theatre 844 2,532 156 388 199 597 126 319 1,325
Total 1,334 3,962 187 450 207 621 187 460 1,915
Women's Studies
WGST-Women's & Gender Studies 113 339 10 30 19 57 4 12 146
Total 113 339 10 30 19 57 4 12 146
Liberal Arts Total 9,570 27,887 10,166 29,678 4,887 12,595 2,025 5,734 100 226 409 1,199 118 358 27,275
Media and Entertainment Electronic Media Communication
ANIM-Animation 31 93 32 96 67 201 19 57 149
EMC-Electronic Media Comm 231 693 321 963 306 914 261 777 1,119
PHOT-Photography 103 309 49 147 89 262 22 66 263
Total 365 1,095 402 1,206 462 1,377 302 900 1,531
Journalism
ADV-Advertising 112 336 8 24 120
JOUR-Journalism (MTSU & TN eC) 205 615 282 846 309 928 162 454 958
PR-Public Relations 50 150 145 435 41 123 236
VCOM-Visual Communication 121 363 11 33 14 42 146
Total 205 615 453 1,359 577 1,732 225 643 1,460
Media and Entertainment
MC-Mass Communication 67 194 67
Total 67 194 67
Recording Industry
MRAT-Recording Arts & Tech 90 264 90
RIM-Recording Industry 530 1,590 1,109 3,323 922 2,774 2,561
Total 530 1,590 1,109 3,323 922 2,774 90 264 2,651
Media and Entertainment Total 1,100 3,300 855 2,565 2,148 6,432 1,449 4,317 157 458 5,709
University College Regents Online Degree
7,951
17,072
194
194
264
7,687
2,843
708
438
4,349
3,347
784
4,578
360
438
77,677
447
1,657
3,836
5,493
438
2,146
3,731
5,877
Back to Table of ContentsBack to Table of ContentsBack to Table of Contents

College/Department/Subject N SCH N SCH N SCH N SCH N SCH N SCH N SCH N SCH
SCH Taught by College, Department, Course Level and TermFall 2016
Lower Upper Masters Doctoral
Total1000 2000 3000 4000 5000 6000 7000
ACCT-Accounting (TN eCampus) 22 66 22
AGRI-Agriculture (MTSU & TN e) 4 13 4
ALH-Health Info Tech (TN eC) 10 30 10
ARTH-Art (TN eCampus) 10 30 10
ASTL-Education (TN eCampus) 9 27 9
BIOL-Biology (MTSU & TN eC) 26 98 26
BMGT-Business Mgt (TN eC) 35 105 35
BUSN-Business (TN eCampus) 27 81 9 27 36
CISP-Comp Info Sys (TN eC) 1 3 1
CITC-Comp Info Sys (TN eC) 9 27 9
COBH-Public Health (TN eC) 40 120 40
COL-College (TN eCampus) 2 6 2
COMM-Comm Studies(MTSU & TN e) 4 12 37 111 28 84 6 18 75
COM-Visual Comm (TN eCampus) 3 9 3
CRMJ-Crim Justice Admin(TN eC) 4 12 6 18 7 21 17
CSCI-Computer Sci (MTSU&TN eC) 6 18 6
ECED-Educ & Physical Ed (TN e) 3 9 4 12 7
ECON-Economics (MTSU & TN eC) 12 36 12
EDAD-Edu Admin (TN eCampus) 3 9 3
EDCI-Ed Cur Instruction(TN eC) 1 3 1
EDU-Education (TN eCampus) 3 9 3
ELPA-Interdisc Studies (TN eC) 1 3 1
ENGL-English (MTSU & TN eC) 30 90 119 357 7 21 156
ENTC-Eng Tech (TN eCampus) 1 3 1
ESC-Nat & Phy Sci (TN eCampus) 4 16 4
GEOG-Geography (MTSU & TN eC) 2 6 6 18 8
HETH-Public Health (TN eC) 174 522 174
HIST-History (MTSU & TN eC) 27 81 6 18 33
HIT-Health Info Tech (TN eC) 13 39 13
HPSS-Hum Per&Sports Sci(TN eC) 7 21 7
HSC-Human Sciences (MTSU&TN e) 1 3 1
HTL-Bus & Commerce (TN eC) 1 3 1
HUM-Humanities 4 12 4
IST-Info Systems Tech (TN eC) 2 6 2
3
12
6
522
99
39
21
3
3
468
3
16
24
21
36
9
3
9
6
225
9
51
18
105
108
3
27
120
13
30
30
27
98
66
Back to Table of ContentsBack to Table of ContentsBack to Table of Contents
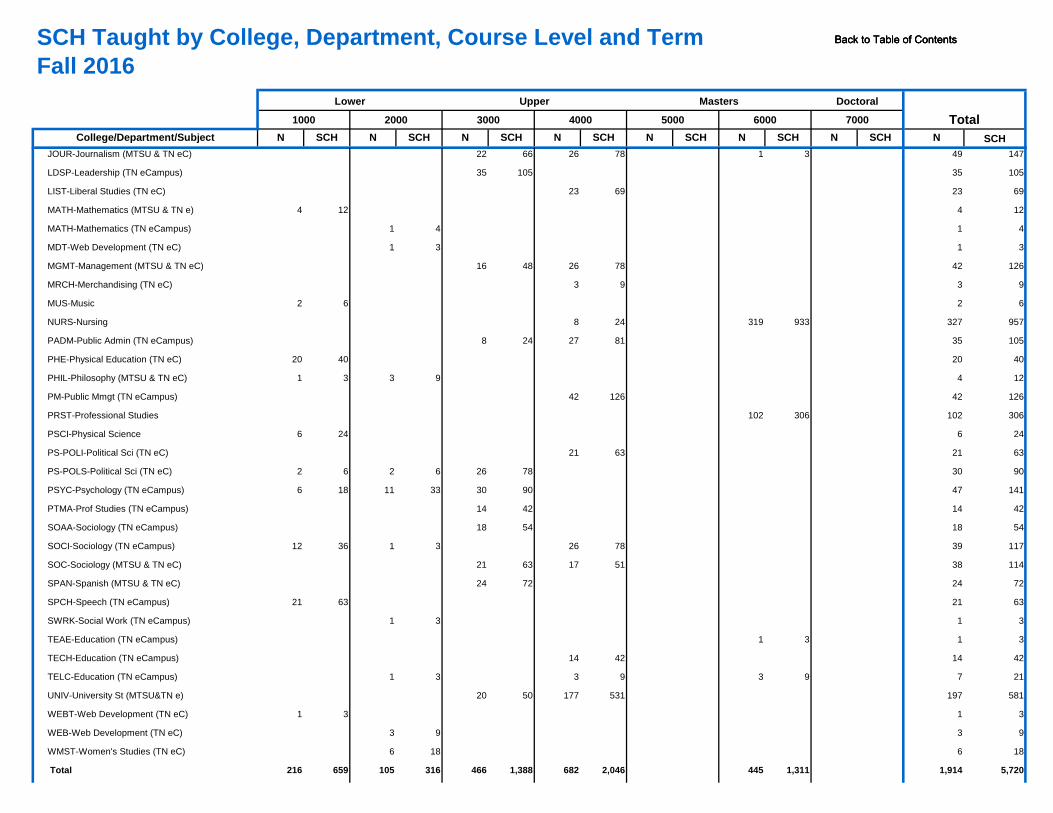
College/Department/Subject N SCH N SCH N SCH N SCH N SCH N SCH N SCH N SCH
SCH Taught by College, Department, Course Level and TermFall 2016
Lower Upper Masters Doctoral
Total1000 2000 3000 4000 5000 6000 7000
JOUR-Journalism (MTSU & TN eC) 22 66 26 78 1 3 49
LDSP-Leadership (TN eCampus) 35 105 35
LIST-Liberal Studies (TN eC) 23 69 23
MATH-Mathematics (MTSU & TN e) 4 12 4
MATH-Mathematics (TN eCampus) 1 4 1
MDT-Web Development (TN eC) 1 3 1
MGMT-Management (MTSU & TN eC) 16 48 26 78 42
MRCH-Merchandising (TN eC) 3 9 3
MUS-Music 2 6 2
NURS-Nursing 8 24 319 933 327
PADM-Public Admin (TN eCampus) 8 24 27 81 35
PHE-Physical Education (TN eC) 20 40 20
PHIL-Philosophy (MTSU & TN eC) 1 3 3 9 4
PM-Public Mmgt (TN eCampus) 42 126 42
PRST-Professional Studies 102 306 102
PSCI-Physical Science 6 24 6
PS-POLI-Political Sci (TN eC) 21 63 21
PS-POLS-Political Sci (TN eC) 2 6 2 6 26 78 30
PSYC-Psychology (TN eCampus) 6 18 11 33 30 90 47
PTMA-Prof Studies (TN eCampus) 14 42 14
SOAA-Sociology (TN eCampus) 18 54 18
SOCI-Sociology (TN eCampus) 12 36 1 3 26 78 39
SOC-Sociology (MTSU & TN eC) 21 63 17 51 38
SPAN-Spanish (MTSU & TN eC) 24 72 24
SPCH-Speech (TN eCampus) 21 63 21
SWRK-Social Work (TN eCampus) 1 3 1
TEAE-Education (TN eCampus) 1 3 1
TECH-Education (TN eCampus) 14 42 14
TELC-Education (TN eCampus) 1 3 3 9 3 9 7
UNIV-University St (MTSU&TN e) 20 50 177 531 197
WEBT-Web Development (TN eC) 1 3 1
WEB-Web Development (TN eC) 3 9 3
WMST-Women's Studies (TN eC) 6 18 6
Total 216 659 105 316 466 1,388 682 2,046 445 1,311 1,914
18
5,720
42
21
581
3
9
114
72
63
3
3
90
141
42
54
117
12
126
306
24
63
9
6
957
105
40
69
12
4
3
126
147
105
Back to Table of ContentsBack to Table of ContentsBack to Table of Contents

College/Department/Subject N SCH N SCH N SCH N SCH N SCH N SCH N SCH N SCH
SCH Taught by College, Department, Course Level and TermFall 2016
Lower Upper Masters Doctoral
Total1000 2000 3000 4000 5000 6000 7000
Study Abroad
SABR-Study Abroad 27 324 27
Total 27 324 27
University College
DE-Dual Enrollment 1 0 1
EXL-Experiential Learning 16 25 65 65 81
PRST-Professional Studies 69 207 57 171 126
Total 1 0 85 232 122 236 208
University Studies
PRST-Professional Studies 43 43 35 105 78
READ-Reading 287 861 287
UNIV-University St (MTSU&TN e) 886 2,426 58 58 944
Total 1,173 3,287 58 58 43 43 35 105 1,309
University College Total 1,417 4,270 163 374 594 1,663 839 2,387 445 1,311 3,458
University Honors College University Honors
UH-University Honors 60 90 79 201 139
Total 60 90 79 201 139
University Honors College Total 60 90 79 201 139
Grand Total 32,212 83,265 19,676 54,273 25,310 69,952 14,588 44,614 464 1,348 4,447 12,451 641 1,872 97,338291
267,775
Note: Enrollments include duplicate counts of students across courses.
10,005
291
291
148
861
2,484
3,493
0
90
378
468
324
324
Back to Table of ContentsBack to Table of ContentsBack to Table of Contents

Office of Institutional Effectiveness, Planning and Research
www.mtsu.edu/iepr/
STUDENT DEMOGRAPHICS 2016 FACT BOOK
Snapshot of Fall 2016 Student Body Headcount by College, Classification and Gender Students by Ethnic Group Headcount by Race, Classification and Gender Student Age Information Student Enrollment Hours Carried by Classification Students by Classification and Gender (SCH & FTE) New and Returning Students by Classification and Gender Fall Semester Growth Transfer Institutions Types of Transfer Institutions Undergraduate Transfers by College, Department and Major Evening Students by Credit Hours and Gender by Classification Off-Campus Enrollment: Gender by Classification Off-Campus Enrollment by Location Alternative Delivery Courses Residency Status of Students Headcount Tennessee County Fall Terms 2015-2016 Headcount by Tennessee County (Map) Fall 2016 Headcount by State of Residence Comparison of Fall 2015-2016 Headcount by Country – Comparison of Fall 2015-2016 First-Time Freshmen Enrollment by State – Comparison of Fall 2015-2016 First-Time Freshmen Enrollment by County – Comparison of Fall 2015-2016 International Students (F or J Visas Only)
Back to Table of Contents

Source: MTSU Office of Institutional Effectuveness, Planning and Research
Snapshot of Fall 2016 Student BodyTotal Headcount = 22,050
9,929
12,121
0
2,000
4,000
6,000
8,000
10,000
12,000
14,000
Male Female
Gender
16,807
5,243
0
2,000
4,000
6,000
8,000
10,000
12,000
14,000
16,000
18,000
20,000
76% 24%
Status
5,0974,746
3,145
1,272
2,581 2,5001,887
822
0
1,000
2,000
3,000
4,000
5,000
6,000
Basic andApplied Sciences
23.1%
Beh. and HealthSciences
21.5%
Business14.3%
Education5.8%
Liberal Arts11.7%
Media &Entertainment
11.3%
UniversityCollege
8.6%
Non DegreeSeeking
3.7%
College
4,2733,922
4,437
6,366
695
2,357
0
1,000
2,000
3,000
4,000
5,000
6,000
7,000
Freshman19%
Sophomore18%
Junior20%
Senior29%
Undergrad. Special3%
Graduate11%
Classification
Back to Table of ContentsBack to Table of ContentsBack to Table of Contents

Headcount by College, Classification and Gender
Term Gender 2013-14 % of Total 2014-15 % of Total 2015-16 % of Total
Summer Female 4,882 56% 4,643 55% 4,364 55%
Male 3,815 44% 3,755 45% 3,571 45%
Total 8,697 100% 8,398 100% 7,935 100%
Fall Female 12,975 54% 12,327 54% 12,312 55%
Male 10,906 46% 10,402 46% 10,199 45%
Total 23,881 100% 22,729 100% 22,511 100%
Spring Female 11,705 54% 11,541 54% 11,426 55%
Male 9,943 46% 9,742 46% 9,477 45%
Total 21,648 100% 21,283 100% 20,903 100%
Unduplicated Total 28,081 27,166 26,837
Gender- Academic Year 2013-14 to 2015-16
College 2014 % of Total 2015 % of Total 2016 % of Total
Basic and Applied Sciences 4,596 20% 4,656 21% 4,734 21%
Behavioral and Health Sciences 4,897 22% 4,630 21% 4,457 20%
Business 2,800 12% 2,770 12% 2,706 12%
Education 893 4% 794 4% 732 3%
Liberal Arts 2,551 11% 2,316 10% 2,292 10%
Media and Entertainment 2,342 10% 2,402 11% 2,436 11%
Non-Degree Seeking 334 1% 694 3% 695 3%
University College 1,849 8% 1,878 8% 1,641 7%
Total Undergraduates 20,262 89% 20,140 89% 19,693 89%
Graduate Studies 2,467 11% 2,371 11% 2,357 11%
Total 22,729 100% 22,511 100% 22,050 100%
College- Fall 2014 to 2016
Classification 2014 % of Total 2015 % of Total 2016 % of Total
Freshman 4,732 21% 4,505 20% 4,273 19%
Sophomore 4,111 18% 3,978 18% 3,922 18%
Junior 4,356 19% 4,566 20% 4,437 20%
Senior 6,729 30% 6,397 28% 6,366 29%
Undergraduate Special 334 1% 694 3% 695 3%
Graduate Special 121 1% 146 1% 136 1%
Master's 1,959 9% 1,850 8% 1,831 8%
Specialist in Education 65 0% 50 0% 83 0%
Doctoral 322 1% 325 1% 307 1%
Total 22,729 100% 22,511 100% 22,050 100%
Classification- Fall 2014 to 2016
Source: MTSU Office of Institutional Effectiveness, Planning and Research
Back to Table of ContentsBack to Table of ContentsBack to Table of Contents

Students by Ethnic Group- All Students
Fall 2014 Fall 2015 Fall 2016
Alaskan Native Enrollment 6 4 2
% Student Body 0.0% 0.0% 0.0%
% Yearly Change 50.0% -33.3% -50.0%
American Indian Enrollment 65 60 59
% Student Body 0.3% 0.3% 0.3%
% Yearly Change -14.5% -7.7% -1.7%
Asian Enrollment 1,017 1,092 1,094
% Student Body 4.5% 4.9% 5.0%
% Yearly Change 6.4% 7.4% 0.2%
Black or African American
Enrollment 4,469 4,550 4,425
% Student Body 19.7% 20.2% 20.1%
% Yearly Change -4.7% 1.8% -2.7%
Hispanic Enrollment 981 1,024 1,084
% Student Body 4.3% 4.5% 4.9%
% Yearly Change 0.3% 4.4% 5.9%
Native Hawaiian or Other Pacific Islander
Enrollment 23 19 12
% Student Body 0.1% 0.1% 0.1%
% Yearly Change 4.5% -17.4% -36.8%
White Enrollment 15,226 14,852 14,511
% Student Body 67.0% 66.0% 65.8%
% Yearly Change -5.7% -2.5% -2.3%
Two Or More Races Enrollment 670 670 691
% Student Body 2.9% 3.0% 3.1%
% Yearly Change 1.4% 0.0% 3.1%
Not Specified Enrollment 272 240 172
% Student Body 1.2% 1.1% 0.8%
% Yearly Change -20.5% -11.8% -28.3%
TotalEnrollment 22,729 22,511 22,050
% Yearly Change -4.8% -1.0% -2.0%
Source: TBR Enrollment Data
Back to Table of ContentsBack to Table of ContentsBack to Table of Contents

Alaskan Native
F F M M F M F M F M F M F M F MFirst-time Freshman 0 5 1 64 464 253 79 76 1 0 899 799 58 51 1,584 1,257
Other Freshman 0 2 1 47 266 189 47 45 1 1 334 395 33 24 721 711
Sophomore 0 7 6 95 615 363 112 88 0 0 1,221 1,214 68 49 2,085 1,837
Junior 0 8 6 105 563 320 132 98 1 0 1,557 1,400 85 71 2,427 2,010
Senior 1 6 10 134 642 451 178 125 2 5 2,382 2,090 104 77 3,450 2,916
Undergraduate Special 0 0 1 23 33 10 12 14 0 0 251 222 8 11 376 319
Total Undergraduate 1 28 25 468 2,583 1,586 560 446 5 6 6,644 6,120 356 283 10,643 9,050
Alaskan Native
Hawaiia
n or Other
Pacific
Not Specifi
ed
F F M M F M F M F F M F M F FGraduate Special 0 0 0 1 4 5 5 1 0 80 37 1 0 0 92Master's 0 3 2 81 138 74 32 30 1 856 489 26 15 1 1,140Education Specialist 0 0 0 0 4 1 2 0 0 56 18 2 0 0 64Doctoral 1 1 0 29 20 10 5 3 0 131 80 5 3 0 182
Total Undergraduate 1 4 2 111 166 90 44 34 1 1,123 624 34 18 1 1,478104 879
Data are based on the 14th day census IEPR
83 6910 19
19 125
Two Or More Races Total
F M2 44
Classification
American Indian AsianBlack or African
American Hispanic White
49 23 38
411 55 116
76 5 10
118 17 24
35 3 9
59 3 22
TotalF F M
74 4 13
Headcount by Race, Classification and GenderFall 2016
ClassificationAmerican Indian Asian
Black or African American Hispanic
Native Hawaiian or Other Pacific
Islander WhiteTwo Or More
Races Not Specified
2 591,094
4,425
1,08412
14,511
691 1720
2,000
4,000
6,000
8,000
10,000
12,000
14,000
16,000
Alaskan Native American Indian Asian Black or AfricanAmerican
Hispanic Nat. Hawaiian orOther Pacific Isl.
White Two Or More Races Not Specified
Headcount by RaceFall 2016
Total Headcount = 22,050
Back to Table of ContentsBack to Table of ContentsBack to Table of Contents
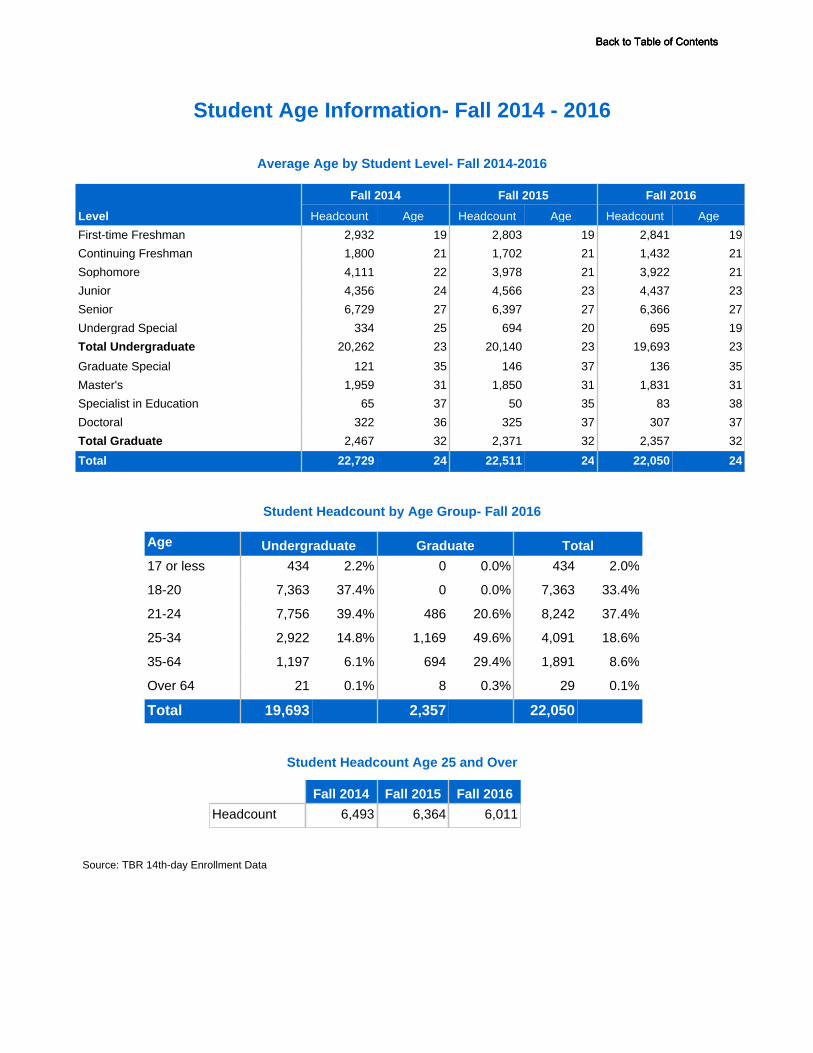
Student Age Information- Fall 2014 - 2016
Age Undergraduate Graduate Total
17 or less 434 2.2% 0 0.0% 434 2.0%
18-20 7,363 37.4% 0 0.0% 7,363 33.4%
21-24 7,756 39.4% 486 20.6% 8,242 37.4%
25-34 2,922 14.8% 1,169 49.6% 4,091 18.6%
35-64 1,197 6.1% 694 29.4% 1,891 8.6%
Over 64 21 0.1% 8 0.3% 29 0.1%
Total 19,693 2,357 22,050
Student Headcount by Age Group- Fall 2016
Average Age by Student Level- Fall 2014-2016
Level
Fall 2014 Fall 2015 Fall 2016
Headcount Age Headcount Age Headcount Age
First-time Freshman 2,932 19 2,803 19 2,841 19
Continuing Freshman 1,800 21 1,702 21 1,432 21
Sophomore 4,111 22 3,978 21 3,922 21
Junior 4,356 24 4,566 23 4,437 23
Senior 6,729 27 6,397 27 6,366 27
Undergrad Special 334 25 694 20 695 19
Total Undergraduate 20,262 23 20,140 23 19,693 23
Graduate Special 121 35 146 37 136 35
Master's 1,959 31 1,850 31 1,831 31
Specialist in Education 65 37 50 35 83 38
Doctoral 322 36 325 37 307 37
Total Graduate 2,467 32 2,371 32 2,357 32
Total 22,729 24 22,511 24 22,050 24
Source: TBR 14th-day Enrollment Data
Fall 2014 Fall 2015 Fall 2016
Headcount 6,493 6,364 6,011
Student Headcount Age 25 and Over
Back to Table of ContentsBack to Table of ContentsBack to Table of Contents

Student Enrollment Hours Carried by Classification- Fall 2016
Student Credit Hours Freshman Sophomore Junior Senior
Undergrad Special
Graduate Special Master's Ed.S. Doctoral
Total Students
Total Credit Hours
1 3 1 0 15 119 0 50 0 52 240 240
2 0 0 1 7 1 0 17 0 6 32 64
3 38 43 79 340 444 79 213 9 33 1,278 3,834
4 3 11 10 75 11 2 16 1 1 130 520
5 1 0 2 22 0 2 47 3 3 80 400
6 51 96 204 524 64 36 667 66 122 1,830 10,980
7 18 50 52 142 13 3 79 1 11 369 2,583
8 8 12 18 53 0 0 38 1 11 141 1,128
9 46 109 164 404 7 8 422 2 49 1,211 10,899
10 35 47 59 131 1 1 67 0 6 347 3,470
11 12 28 37 62 1 1 20 0 6 167 1,837
12 489 701 1,026 1,545 11 4 145 0 7 3,928 47,136
13 396 659 504 598 7 0 19 0 0 2,183 28,379
14 346 380 317 359 3 0 14 0 0 1,419 19,866
15 1,672 910 1,160 1,110 9 0 14 0 0 4,875 73,125
16 946 641 463 489 2 0 1 0 0 2,542 40,672
17 141 138 113 136 2 0 0 0 0 530 9,010
18 66 87 205 284 0 0 1 0 0 643 11,574
19 1 9 16 44 0 0 0 0 0 70 1,330
20 1 0 5 9 0 0 0 0 0 15 300
21 0 0 1 13 0 0 1 0 0 15 315
22 0 0 1 3 0 0 0 0 0 4 88
25 0 0 0 1 0 0 0 0 0 1 25
Total 4,273 3,922 4,437 6,366 695 136 1,831 83 307 22,050 267,775
TBR 14th-day Enrollment Data
Back to Table of ContentsBack to Table of ContentsBack to Table of Contents
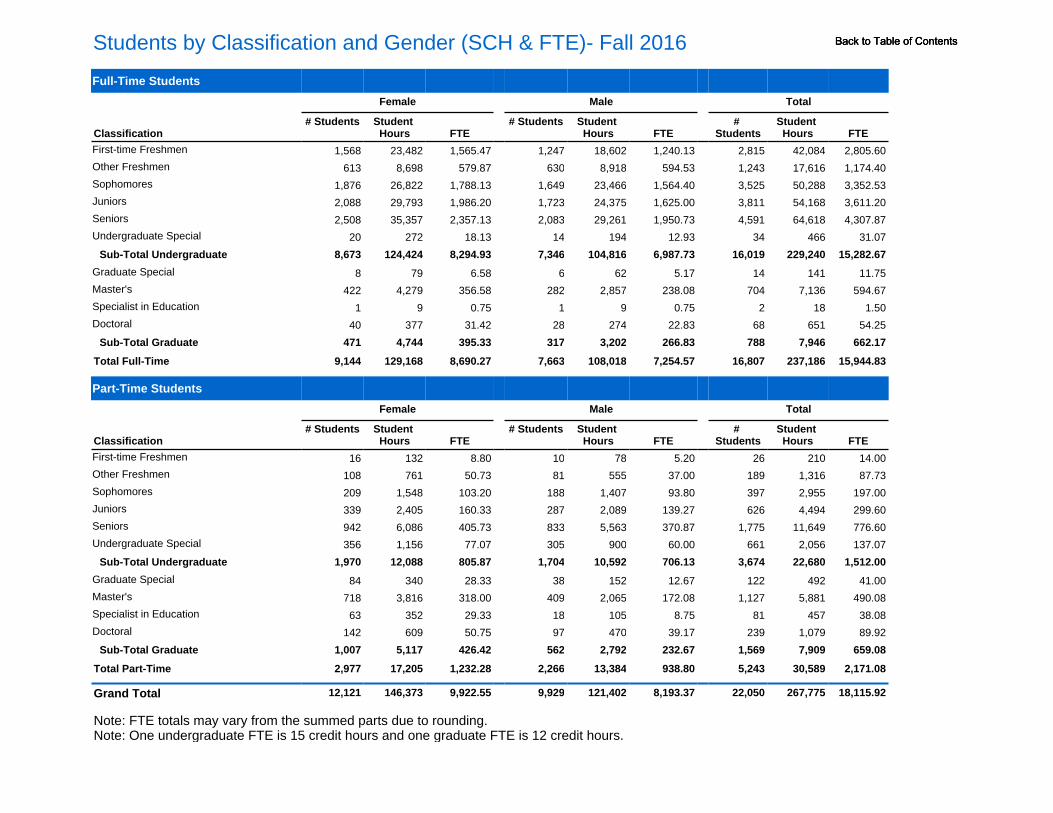
Students by Classification and Gender (SCH & FTE)- Fall 2016
Note: FTE totals may vary from the summed parts due to rounding.Note: One undergraduate FTE is 15 credit hours and one graduate FTE is 12 credit hours.
Full-Time Students
Female Male Total
Classification# Students Student
Hours FTE# Students Student
Hours FTE#
StudentsStudent
Hours FTE
First-time Freshmen 1,568 23,482 1,565.47 1,247 18,602 1,240.13 2,815 42,084 2,805.60
Other Freshmen 613 8,698 579.87 630 8,918 594.53 1,243 17,616 1,174.40
Sophomores 1,876 26,822 1,788.13 1,649 23,466 1,564.40 3,525 50,288 3,352.53
Juniors 2,088 29,793 1,986.20 1,723 24,375 1,625.00 3,811 54,168 3,611.20
Seniors 2,508 35,357 2,357.13 2,083 29,261 1,950.73 4,591 64,618 4,307.87
Undergraduate Special 20 272 18.13 14 194 12.93 34 466 31.07
Sub-Total Undergraduate 8,673 124,424 8,294.93 7,346 104,816 6,987.73 16,019 229,240 15,282.67
Graduate Special 8 79 6.58 6 62 5.17 14 141 11.75
Master's 422 4,279 356.58 282 2,857 238.08 704 7,136 594.67
Specialist in Education 1 9 0.75 1 9 0.75 2 18 1.50
Doctoral 40 377 31.42 28 274 22.83 68 651 54.25
Sub-Total Graduate 471 4,744 395.33 317 3,202 266.83 788 7,946 662.17
Total Full-Time 9,144 129,168 8,690.27 7,663 108,018 7,254.57 16,807 237,186 15,944.83
Part-Time Students
Female Male Total
Classification# Students Student
Hours FTE# Students Student
Hours FTE#
StudentsStudent
Hours FTE
First-time Freshmen 16 132 8.80 10 78 5.20 26 210 14.00
Other Freshmen 108 761 50.73 81 555 37.00 189 1,316 87.73
Sophomores 209 1,548 103.20 188 1,407 93.80 397 2,955 197.00
Juniors 339 2,405 160.33 287 2,089 139.27 626 4,494 299.60
Seniors 942 6,086 405.73 833 5,563 370.87 1,775 11,649 776.60
Undergraduate Special 356 1,156 77.07 305 900 60.00 661 2,056 137.07
Sub-Total Undergraduate 1,970 12,088 805.87 1,704 10,592 706.13 3,674 22,680 1,512.00
Graduate Special 84 340 28.33 38 152 12.67 122 492 41.00
Master's 718 3,816 318.00 409 2,065 172.08 1,127 5,881 490.08
Specialist in Education 63 352 29.33 18 105 8.75 81 457 38.08
Doctoral 142 609 50.75 97 470 39.17 239 1,079 89.92
Sub-Total Graduate 1,007 5,117 426.42 562 2,792 232.67 1,569 7,909 659.08
Total Part-Time 2,977 17,205 1,232.28 2,266 13,384 938.80 5,243 30,589 2,171.08
Grand Total 12,121 146,373 9,922.55 9,929 121,402 8,193.37 22,050 267,775 18,115.92
Back to Table of ContentsBack to Table of ContentsBack to Table of Contents

New Students
Classification FemaleFirst-time Freshmen 1,584New Transfers 1,025Undergraduate Special 6 Sub-Total Undergraduate 2,615Graduate Special 40Master's 305Specialist in Education 14Doctoral 18 Sub-Total Graduate 377
Total New Students 2,992
Returning Students
Classification FemaleFreshmen 506Sophomores 1,677Juniors 1,903Seniors 3,098Undergraduate Special 75 Sub-Total Undergraduate 7,259Graduate Special 41Master's 783Specialist in Education 42Doctoral 153 Sub-Total Graduate 1,019
Total Returning Students 8,278600 1,619
6,882 15,160
Source: MTSU Office of Institutional Effectiveness, Planning and Research
471 1,25412 54
103 256
84 1596,282 13,541
14 55
1,439 3,1161,616 3,5192,643 5,741
Male Total500 1,006
12 30224 601
2,330 5,322
26 66181 486
5 19
840 1,8659 15
2,106 4,721
New/Returning Students by Classification and GenderFall 2016
Male Total1,257 2,841
Back to Table of ContentsBack to Table of ContentsBack to Table of Contents

Fall 2014 Fall 2015 Fall 2016New First Time Freshmen 2,932 2,803 2,841New Transfer 1,809 2,018 1,865New Undergraduate Special 49 20 15New Graduate Special 62 73 66New Masters Candidate 456 488 486New EdS 0 1 19New Doctoral Student 14 9 30Total New Students 5,322 5,412 5,322Freshman Continuing 1,346 1,213 1,006Sophomore 3,274 3,130 3,116Junior 3,487 3,598 3,519Senior 6,051 5,705 5,741Undergraduate Special 246 266 159Graduate Special Continuing 41 46 55Masters Candidate 1,419 1,302 1,254EdS Continuing 50 37 54Doctoral Continuing 292 293 256Total Returning Students 16,206 15,590 15,160Freshman Readmitted 164 135 136Sophomore Readmitted 203 204 184Junior Readmitted 237 244 213Senior Readmitted 425 396 377Undergraduate Special 5 3 4Graduate Special 18 27 15Masters Candidates 84 60 91EdS Readmitted 15 12 10Doctoral Readmitted 16 23 21Total Re-Enrollees 1,167 1,104 1,051
High School Concurrent High School 34 405 51722,729 22,511 22,050Overall Growth -3.0%
Source: MTSU Office of Institutional Effectiveness, Planning and Research
-16.7%8.3%
-33.3%31.3%-9.9%
1420.6%
-11.6%8.0%
-12.3%-6.5%
Re-Enrollees -17.1%-9.4%
-10.1%-11.3%-20.0%
-114.3%
0.0%Returning Students
-25.3%-4.8%0.9%
-5.1%-35.4%34.1%
Fall Semester Growth, 2014 - 2016
Headcount by Student Type Fall 2014 - 2016
% Change2014-2016
New Students -3.1%3.1%
-69.4%6.5%6.6%
Back to Table of ContentsBack to Table of ContentsBack to Table of Contents

Transfer Institutions of Undergraduate StudentsFall 2016
Transfer Institution
New Transfer Students All Transfer Students
FR SO JR SR Total FR SO JR SR Total
Other- Out of State Institution 103 149 153 103 508 293 435 659 1,332 2,719
Motlow State Community College 30 68 136 9 243 110 256 502 615 1,483
Nashville State Technical Community College 11 61 70 32 174 75 155 234 428 892
Columbia State Community College 20 38 93 16 167 69 101 273 412 855
Volunteer State Community College 11 62 79 12 164 70 170 253 343 836
Pellissippi State Technical Community College 5 17 30 5 57 30 51 97 97 275
University of Tennessee at Knoxville 16 19 9 10 54 24 61 62 145 292
University of Tennessee at Chattanooga 10 22 17 4 53 15 64 75 129 283
Tennessee State University 12 20 14 5 51 13 47 49 68 177
Chattanooga State Technical Community College 5 14 15 7 41 57 60 57 90 264
Southwest Tennessee College 14 16 7 3 40 47 72 85 97 301
Tennessee Technological University 6 19 9 3 37 8 37 60 99 204
Austin Peay State University 7 9 5 7 28 16 28 34 62 140
East Tennessee State University 6 10 4 3 23 6 19 30 56 111
Jackson State Community College 3 15 3 1 22 58 64 47 66 235
University of Memphis 1 9 8 4 22 26 47 49 75 197
Belmont University 3 6 5 4 18 3 12 20 42 77
Roane State Community College 0 7 10 0 17 21 25 50 60 156
University of Tennessee at Martin 2 4 3 4 13 17 21 30 46 114
Walters State Community College 1 5 7 0 13 10 21 29 32 92
Bethel College 1 5 3 4 13 42 12 9 18 81
Cumberland University 1 3 3 5 12 11 10 14 23 58
Dyersburg State Community College 1 8 2 0 11 23 39 30 40 132
Lipscomb University 2 3 2 1 8 11 17 25 50 103
Cleveland State Community College 0 5 2 1 8 11 26 14 40 91
Lee University 0 4 3 0 7 8 13 19 12 52
Martin Methodist College 0 3 3 0 6 1 7 11 13 32
Carson-Newman College 2 2 2 0 6 2 4 8 4 18
Trevecca Nazarene University 1 3 1 0 5 2 4 10 16 32
Watkins Institute College of Art & Design and the Watkins Film School 2 0 2 1 5 4 2 4 5 15
Northeast State Technical Community College 1 2 2 0 5 9 11 12 17 49
Lemoyne-Owen College 0 1 2 0 3 1 6 7 5 19
Tusculum College 0 3 0 0 3 1 4 4 1 10
Maryville College 0 2 0 1 3 1 5 4 3 13
Bryan College 0 0 0 2 2 5 2 5 7 19
Nashville Auto Diesel College 2 0 0 0 2 2 0 1 1 4
ITT Technical Institute - Nashville 2 0 0 0 2 6 1 1 5 13
University of the South 0 1 0 1 2 0 1 2 5 8
Tennessee Wesleyan College 2 0 0 0 2 2 1 2 2 7
TN Tech Center Murfreesboro 1 0 0 0 1 7 7 1 6 21
High Tech Institute 1 0 0 0 1 2 1 1 0 4
Aquinas College 1 0 0 0 1 1 0 1 11 13
Daymar Junior College - Nashville 1 0 0 0 1 1 3 3 5 12
Union University 0 1 0 0 1 1 8 3 11 23
Lane College 0 0 1 0 1 1 1 6 5 13
Southern Adventist University 0 1 0 0 1 0 2 1 2 5
Freed-Hardeman University 0 1 0 0 1 1 3 5 11 20
Sorted by Headcount of New Transfer Students
Back to Table of ContentsBack to Table of ContentsBack to Table of Contents
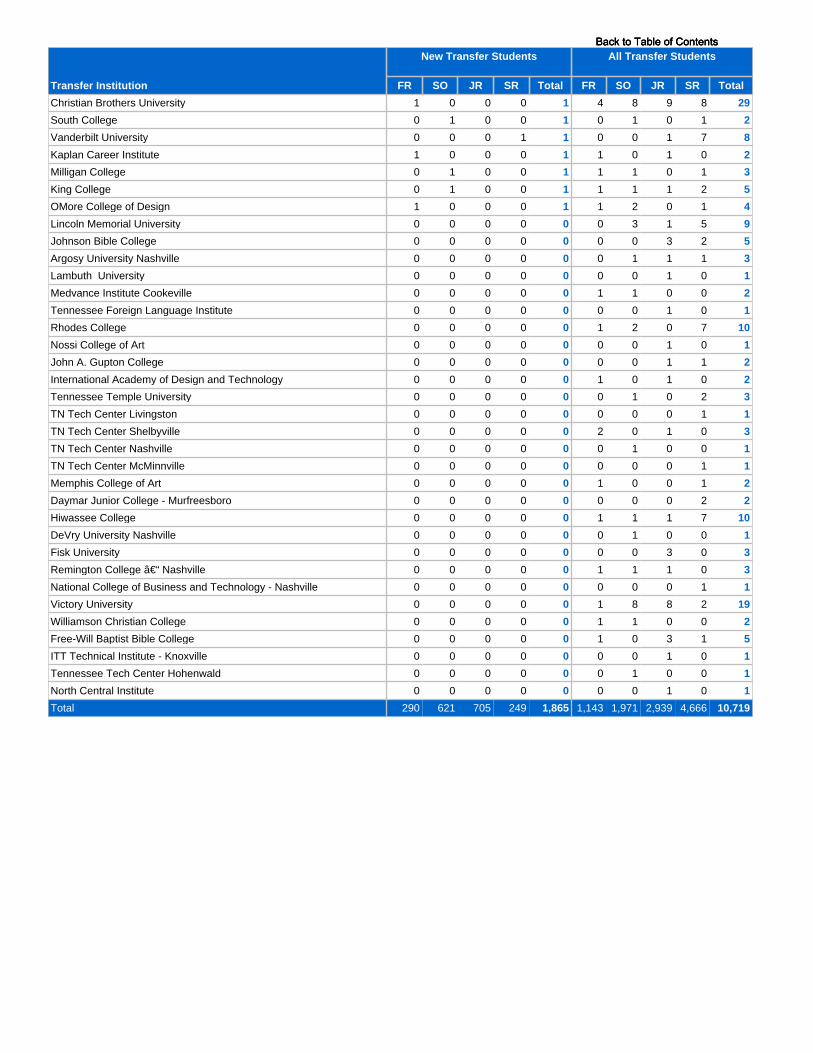
Transfer Institution
New Transfer Students All Transfer Students
FR SO JR SR Total FR SO JR SR Total
Christian Brothers University 1 0 0 0 1 4 8 9 8 29
South College 0 1 0 0 1 0 1 0 1 2
Vanderbilt University 0 0 0 1 1 0 0 1 7 8
Kaplan Career Institute 1 0 0 0 1 1 0 1 0 2
Milligan College 0 1 0 0 1 1 1 0 1 3
King College 0 1 0 0 1 1 1 1 2 5
OMore College of Design 1 0 0 0 1 1 2 0 1 4
Lincoln Memorial University 0 0 0 0 0 0 3 1 5 9
Johnson Bible College 0 0 0 0 0 0 0 3 2 5
Argosy University Nashville 0 0 0 0 0 0 1 1 1 3
Lambuth University 0 0 0 0 0 0 0 1 0 1
Medvance Institute Cookeville 0 0 0 0 0 1 1 0 0 2
Tennessee Foreign Language Institute 0 0 0 0 0 0 0 1 0 1
Rhodes College 0 0 0 0 0 1 2 0 7 10
Nossi College of Art 0 0 0 0 0 0 0 1 0 1
John A. Gupton College 0 0 0 0 0 0 0 1 1 2
International Academy of Design and Technology 0 0 0 0 0 1 0 1 0 2
Tennessee Temple University 0 0 0 0 0 0 1 0 2 3
TN Tech Center Livingston 0 0 0 0 0 0 0 0 1 1
TN Tech Center Shelbyville 0 0 0 0 0 2 0 1 0 3
TN Tech Center Nashville 0 0 0 0 0 0 1 0 0 1
TN Tech Center McMinnville 0 0 0 0 0 0 0 0 1 1
Memphis College of Art 0 0 0 0 0 1 0 0 1 2
Daymar Junior College - Murfreesboro 0 0 0 0 0 0 0 0 2 2
Hiwassee College 0 0 0 0 0 1 1 1 7 10
DeVry University Nashville 0 0 0 0 0 0 1 0 0 1
Fisk University 0 0 0 0 0 0 0 3 0 3
Remington College – Nashville 0 0 0 0 0 1 1 1 0 3
National College of Business and Technology - Nashville 0 0 0 0 0 0 0 0 1 1
Victory University 0 0 0 0 0 1 8 8 2 19
Williamson Christian College 0 0 0 0 0 1 1 0 0 2
Free-Will Baptist Bible College 0 0 0 0 0 1 0 3 1 5
ITT Technical Institute - Knoxville 0 0 0 0 0 0 0 1 0 1
Tennessee Tech Center Hohenwald 0 0 0 0 0 0 1 0 0 1
North Central Institute 0 0 0 0 0 0 0 1 0 1
Total 290 621 705 249 1,865 1,143 1,971 2,939 4,666 10,719
Back to Table of ContentsBack to Table of ContentsBack to Table of Contents

Men Women Men Women Men Women Men Women Men Women TOTAL
Tennessee InstitutionsAll 2-Year 230 357 474 583 737 975 1,019 1,366 2,460 3,281 5,741All 4-Year 105 138 202 262 244 329 385 589 936 1,318 2,254All Less Than 2-Year 2 2 1 3 1 4 2 2 6 11 17All Others 5 4 1 4 0 1 1 6 7 15 22 Sub-totals 342 501 678 852 982 1,309 1,407 1,963 3,409 4,625 8,034
Out of State 119 149 215 194 319 298 591 583 1,244 1,224 2,468
Unknown 5 14 6 12 17 10 73 51 101 87 188
Grand Totals 466 664 899 1,058 1,318 1,617 2,071 2,597 4,754 5,936 10,690
Source: SZRTSR Report
Types of Institutions From Which Undergraduate Students Transferredby Class and Gender
Fall 2016
Freshmen Sophomore Junior Senior All Classes
Back to Table of ContentsBack to Table of ContentsBack to Table of Contents
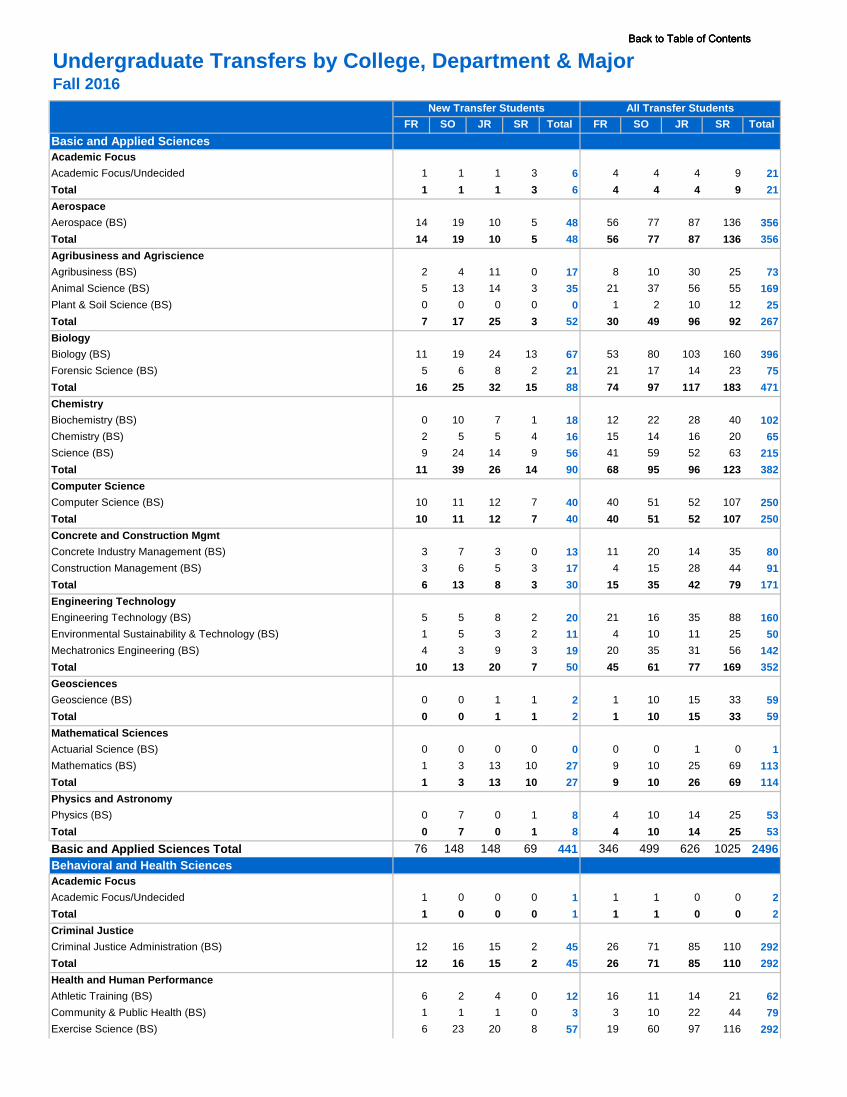
FR SO JR SR Total FR SO SR TotalBasic and Applied SciencesAcademic FocusAcademic Focus/Undecided 1 1 1 3 6 4 4 9 21Total 1 1 1 3 6 4 4 9 21AerospaceAerospace (BS) 14 19 10 5 48 56 77 136 356Total 14 19 10 5 48 56 77 136 356Agribusiness and AgriscienceAgribusiness (BS) 2 4 11 0 17 8 10 25 73Animal Science (BS) 5 13 14 3 35 21 37 55 169Plant & Soil Science (BS) 0 0 0 0 0 1 2 12 25Total 7 17 25 3 52 30 49 92 267BiologyBiology (BS) 11 19 24 13 67 53 80 160 396Forensic Science (BS) 5 6 8 2 21 21 17 23 75Total 16 25 32 15 88 74 97 183 471ChemistryBiochemistry (BS) 0 10 7 1 18 12 22 40 102Chemistry (BS) 2 5 5 4 16 15 14 20 65Science (BS) 9 24 14 9 56 41 59 63 215Total 11 39 26 14 90 68 95 123 382Computer ScienceComputer Science (BS) 10 11 12 7 40 40 51 107 250Total 10 11 12 7 40 40 51 107 250Concrete and Construction MgmtConcrete Industry Management (BS) 3 7 3 0 13 11 20 35 80Construction Management (BS) 3 6 5 3 17 4 15 44 91Total 6 13 8 3 30 15 35 79 171Engineering TechnologyEngineering Technology (BS) 5 5 8 2 20 21 16 88 160Environmental Sustainability & Technology (BS) 1 5 3 2 11 4 10 25 50Mechatronics Engineering (BS) 4 3 9 3 19 20 35 56 142Total 10 13 20 7 50 45 61 169 352GeosciencesGeoscience (BS) 0 0 1 1 2 1 10 33 59Total 0 0 1 1 2 1 10 33 59Mathematical Sciences Actuarial Science (BS) 0 0 0 0 0 0 0 0 1Mathematics (BS) 1 3 13 10 27 9 10 69 113Total 1 3 13 10 27 9 10 69 114Physics and AstronomyPhysics (BS) 0 7 0 1 8 4 10 25 53Total 0 7 0 1 8 4 10 25 53Basic and Applied Sciences Total 76 148 148 69 441 346 499 1025 2496Behavioral and Health SciencesAcademic FocusAcademic Focus/Undecided 1 0 0 0 1 1 1 0 2Total 1 0 0 0 1 1 1 0 2Criminal JusticeCriminal Justice Administration (BS) 12 16 15 2 45 26 71 110 292Total 12 16 15 2 45 26 71 110 292Health and Human PerformanceAthletic Training (BS) 6 2 4 0 12 16 11 21 62Community & Public Health (BS) 1 1 1 0 3 3 10 44 79Exercise Science (BS) 6 23 20 8 57 19 60 116 292
8585
142297
626
00
12526
1414
3177
1515
142842
3511
5296
5252
10314
117
2816
30561096
44
8787
Undergraduate Transfers by College, Department & MajorFall 2016
New Transfer Students All Transfer StudentsJR
Back to Table of ContentsBack to Table of ContentsBack to Table of Contents

Undergraduate Transfers by College, Department & MajorFall 2016Leisure, Sport & Tourism Studies (BS) 0 3 3 2 8 2 15 36 73Physical Education (BS) 2 5 6 2 15 3 7 20 43Speech/Language Pathology & Audiology (BS) 1 3 7 5 16 9 30 39 117Total 16 37 41 17 111 52 133 276 666Human SciencesFamily & Consumer Studies (BS) 2 4 5 0 11 7 12 52 101Interior Design (BS) 3 5 1 1 10 4 11 11 40Nutrition & Food Science (BS) 0 4 4 2 10 5 19 61 116Textiles Merchandising Design (BS) 3 6 2 1 12 7 23 24 78Total 8 19 12 4 43 23 65 148 335NursingNursing (BSN) 22 35 21 17 95 82 110 223 522Total 22 35 21 17 95 82 110 223 522PsychologyIndustrial & Organizational Psychology (BS) 0 0 3 0 3 0 5 32 55Psychology (BS) 9 34 34 11 88 40 71 193 457Total 9 34 37 11 91 40 76 225 512Social WorkSocial Work (BSW) 1 13 25 3 42 8 38 71 178Total 1 13 25 3 42 8 38 71 178Behavioral and Health Sciences Total 69 154 151 54 428 232 494 1053 2507BusinessAcademic FocusAcademic Focus/Undecided 2 7 1 1 11 7 9 5 30Total 2 7 1 1 11 7 9 5 30AccountingAccounting (BBA) 9 14 35 5 63 27 41 181 345Total 9 14 35 5 63 27 41 181 345Computer Information SystemsInformation Systems (BBA) 3 10 15 5 33 12 28 123 224Total 3 10 15 5 33 12 28 123 224Economics and FinanceEconomics (BBA) 0 0 1 0 1 1 3 9 20Finance (BBA) 4 6 6 1 17 11 40 61 154Total 4 6 7 1 18 12 43 70 174ManagementBusiness Administration (BBA) 21 32 40 10 103 46 81 143 405Entrepreneurship (BBA) 0 4 4 0 8 1 13 28 54Management (BBA) 2 7 8 2 19 8 14 68 130Total 23 43 52 12 130 55 108 239 589MarketingBusiness Education (BS) 3 0 4 0 7 5 1 10 25Marketing (BBA) 7 14 14 2 37 24 37 74 198Total 10 14 18 2 44 29 38 84 223Business Total 51 94 128 26 299 142 267 702 1585EducationAcademic FocusAcademic Focus/Undecided 1 3 3 1 8 2 6 3 17Total 1 3 3 1 8 2 6 3 17Elementary and Special EdEarly Childhood Education (BS) 6 9 10 2 27 20 31 53 142Interdisciplinary Studies (BS) 4 6 22 3 35 12 32 125 227Special Education (BS) 0 5 7 3 15 2 12 25 58Total 10 20 39 8 77 34 75 203 427Education Total 11 23 42 9 85 36 81 206 444Liberal ArtsAcademic Focus
121
6
385819
115
6372
474
6
1351240
187
9
61
74249
9
9696
61
6161
728
9
107
18153171
14312499
107
201339
205
30
Back to Table of ContentsBack to Table of ContentsBack to Table of Contents

Undergraduate Transfers by College, Department & MajorFall 2016Academic Focus/Undecided 0 2 0 0 2 6 3 5 15Total 0 2 0 0 2 6 3 5 15ArtArt (BA) 0 0 1 0 1 0 0 0 1Art (BFA) 3 7 6 2 18 11 29 60 138Art (BS) 0 1 1 0 2 0 1 2 5Art Education (BS) 1 0 1 1 3 2 1 18 26Art History (BA) 2 0 1 0 3 3 1 4 13Total 6 8 10 3 27 16 32 84 183Comm Studies & Org CommOrganizational Communication (BS) 1 4 5 3 13 1 23 80 159Total 1 4 5 3 13 1 23 80 159Economics and FinanceEconomics (BS) 1 3 4 1 9 2 5 11 25Total 1 3 4 1 9 2 5 11 25EnglishEnglish (BA) 8 11 12 4 35 21 35 82 189Total 8 11 12 4 35 21 35 82 189Foreign Languages and LitForeign Language (BA) 2 4 4 0 10 6 8 26 54Foreign Language (BS) 1 3 1 1 6 2 5 19 32Total 3 7 5 1 16 8 13 45 86Global StudiesGlobal Studies & Cultural Geography (BS) 0 1 2 0 3 1 7 23 47Total 0 1 2 0 3 1 7 23 47HistoryHistory (BA) 0 2 10 2 14 2 12 38 74History (BS) 0 4 6 4 14 0 8 31 63Total 0 6 16 6 28 2 20 69 137MusicMusic (BM) 3 4 7 3 17 26 19 38 109Total 3 4 7 3 17 26 19 38 109PhilosophyPhilosophy (BA) 1 0 4 0 5 4 0 5 15Philosophy (BS) 0 1 1 0 2 1 1 6 10Total 1 1 5 0 7 5 1 11 25Political Sci & Intl RelationsInternational Relations (BA) 1 1 1 0 3 4 2 2 11International Relations (BS) 1 2 0 0 3 1 6 8 21Political Science (BA) 0 5 5 2 12 7 11 13 52Political Science (BS) 2 9 7 1 19 15 24 41 113Total 4 17 13 3 37 27 43 64 197Sociology and AnthropologyAnthropology (BA) 0 1 1 0 2 0 1 0 3Anthropology (BS) 0 1 2 0 3 4 7 16 37Sociology (BA) 0 1 3 0 4 0 2 6 12Sociology (BS) 0 0 5 0 5 0 1 25 38Total 0 3 11 0 14 4 11 47 90Theatre and DanceTheatre (BS) 1 4 5 1 11 5 14 20 52Total 1 4 5 1 11 5 14 20 52Liberal Arts Total 28 71 95 25 219 124 226 579 1314Media and EntertainmentAcademic FocusAcademic Focus/Undecided 0 1 1 0 2 0 2 0 3Total 0 1 1 0 2 0 2 0 3Electronic Media Communication
385
11
41228
1313
213363
210
628
36
2446
2626
20
1616
22
5151
146
5555
77
138
255
51
11
Back to Table of ContentsBack to Table of ContentsBack to Table of Contents

Undergraduate Transfers by College, Department & MajorFall 2016Animation (BS) 2 5 7 0 14 10 5 1 23Mass Communication (BS) 7 17 18 3 45 34 72 109 306Total 9 22 25 3 59 44 77 110 329JournalismJournalism (BS) 4 25 24 1 54 31 26 4 86Mass Communication (BS) 0 0 0 0 0 6 46 130 260Total 4 25 24 1 54 37 72 134 346Recording IndustryRecording Industry (BS) 15 46 36 5 102 95 141 220 639Total 15 46 36 5 102 95 141 220 639Media and Entertainment Total 28 94 86 9 217 176 292 464 1317University CollegeAcademic Focus- UndecidedAcademic Focus/Undecided 16 7 6 1 30 63 31 9 111AF/Undecided-Prior Bachelors 0 0 0 10 10 1 0 45 46Total 16 7 6 11 40 64 31 54 157Regents Online Degree ProgramLiberal Studies (BS) 6 16 25 20 67 13 35 338 489Professional Studies (BS) 5 12 23 25 65 8 41 183 325Total 11 28 48 45 132 21 76 521 814University StudiesIntegrated Studies (BS) 0 2 1 1 4 2 5 62 85Total 0 2 1 1 4 2 5 62 85University College Total 27 37 55 57 176 87 112 637 1056
93196
1616
220
808
103
103
183183385
79198
2578
Back to Table of ContentsBack to Table of ContentsBack to Table of Contents
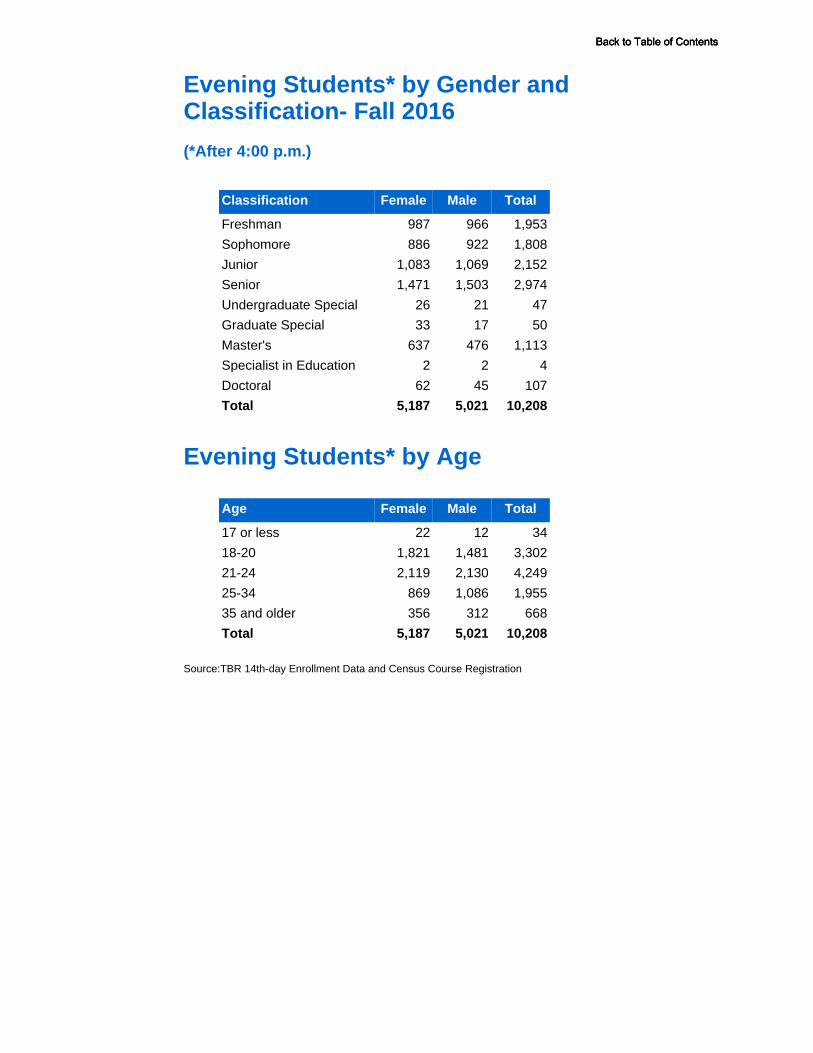
Source:TBR 14th-day Enrollment Data and Census Course Registration
Age Female Male Total
17 or less 22 12 34
18-20 1,821 1,481 3,302
21-24 2,119 2,130 4,249
25-34 869 1,086 1,955
35 and older 356 312 668
Total 5,187 5,021 10,208
Evening Students* by Age
Evening Students* by Gender and Classification- Fall 2016
(*After 4:00 p.m.)
Classification Female Male Total
Freshman 987 966 1,953
Sophomore 886 922 1,808
Junior 1,083 1,069 2,152
Senior 1,471 1,503 2,974
Undergraduate Special 26 21 47
Graduate Special 33 17 50
Master's 637 476 1,113
Specialist in Education 2 2 4
Doctoral 62 45 107
Total 5,187 5,021 10,208
Back to Table of ContentsBack to Table of ContentsBack to Table of Contents
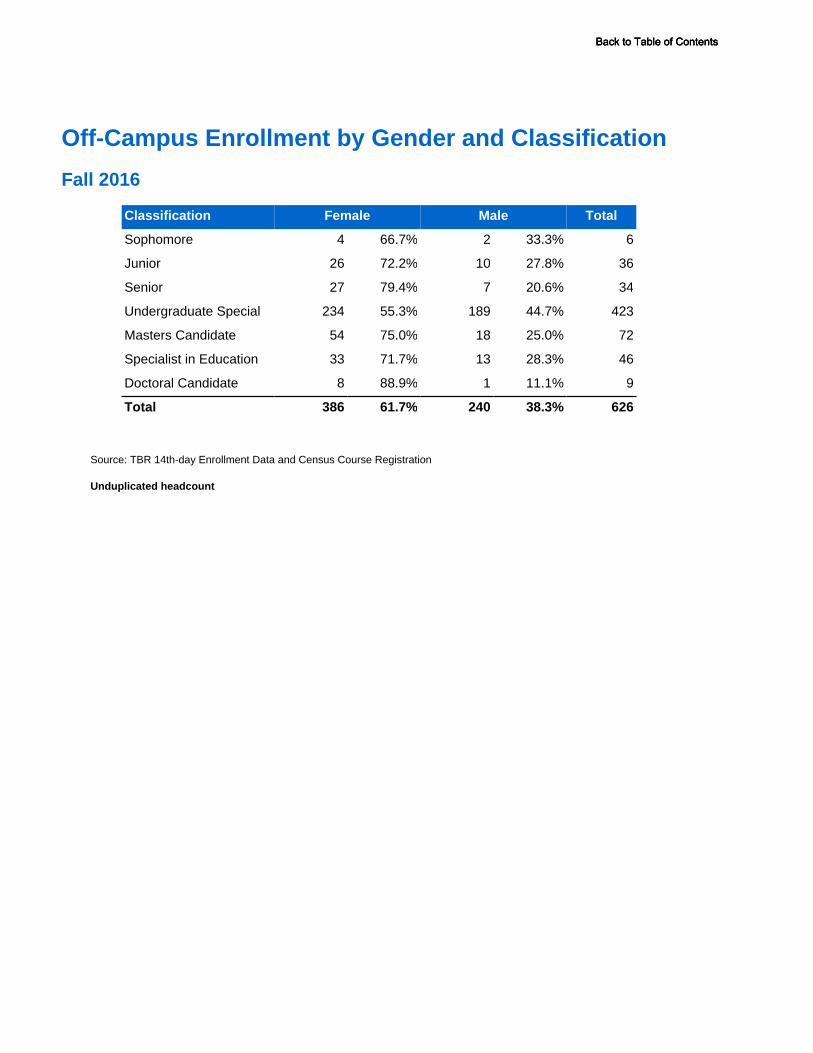
Classification Female Male Total
Sophomore 4 66.7% 2 33.3% 6
Junior 26 72.2% 10 27.8% 36
Senior 27 79.4% 7 20.6% 34
Undergraduate Special 234 55.3% 189 44.7% 423
Masters Candidate 54 75.0% 18 25.0% 72
Specialist in Education 33 71.7% 13 28.3% 46
Doctoral Candidate 8 88.9% 1 11.1% 9
Total 386 61.7% 240 38.3% 626
Source: TBR 14th-day Enrollment Data and Census Course Registration
Unduplicated headcount
Off-Campus Enrollment by Gender and Classification
Fall 2016
Back to Table of ContentsBack to Table of ContentsBack to Table of Contents
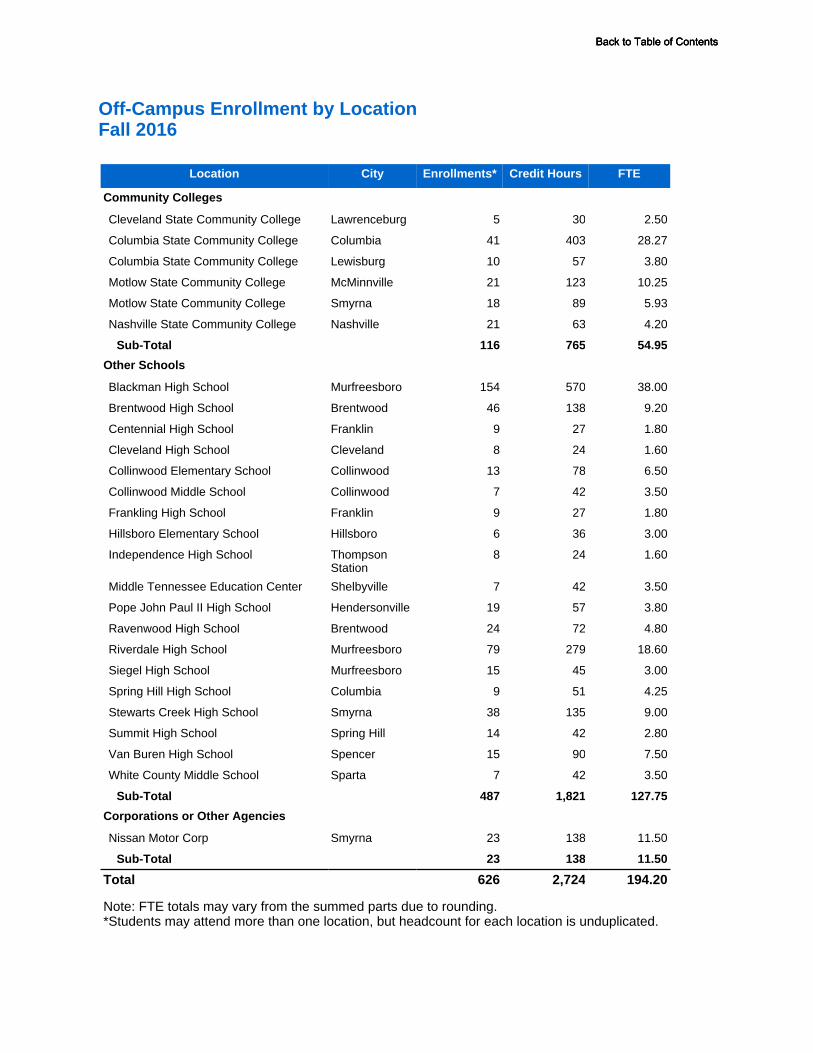
Off-Campus Enrollment by LocationFall 2016
Location City Enrollments* Credit Hours FTE
Community Colleges
Cleveland State Community College Lawrenceburg 5 30 2.50
Columbia State Community College Columbia 41 403 28.27
Columbia State Community College Lewisburg 10 57 3.80
Motlow State Community College McMinnville 21 123 10.25
Motlow State Community College Smyrna 18 89 5.93
Nashville State Community College Nashville 21 63 4.20
Sub-Total 116 765 54.95
Other Schools
Blackman High School Murfreesboro 154 570 38.00
Brentwood High School Brentwood 46 138 9.20
Centennial High School Franklin 9 27 1.80
Cleveland High School Cleveland 8 24 1.60
Collinwood Elementary School Collinwood 13 78 6.50
Collinwood Middle School Collinwood 7 42 3.50
Frankling High School Franklin 9 27 1.80
Hillsboro Elementary School Hillsboro 6 36 3.00
Independence High School Thompson Station
8 24 1.60
Middle Tennessee Education Center Shelbyville 7 42 3.50
Pope John Paul II High School Hendersonville 19 57 3.80
Ravenwood High School Brentwood 24 72 4.80
Riverdale High School Murfreesboro 79 279 18.60
Siegel High School Murfreesboro 15 45 3.00
Spring Hill High School Columbia 9 51 4.25
Stewarts Creek High School Smyrna 38 135 9.00
Summit High School Spring Hill 14 42 2.80
Van Buren High School Spencer 15 90 7.50
White County Middle School Sparta 7 42 3.50
Sub-Total 487 1,821 127.75
Corporations or Other Agencies
Nissan Motor Corp Smyrna 23 138 11.50
Sub-Total 23 138 11.50
Total 626 2,724 194.20
Note: FTE totals may vary from the summed parts due to rounding.*Students may attend more than one location, but headcount for each location is unduplicated.
Back to Table of ContentsBack to Table of ContentsBack to Table of Contents
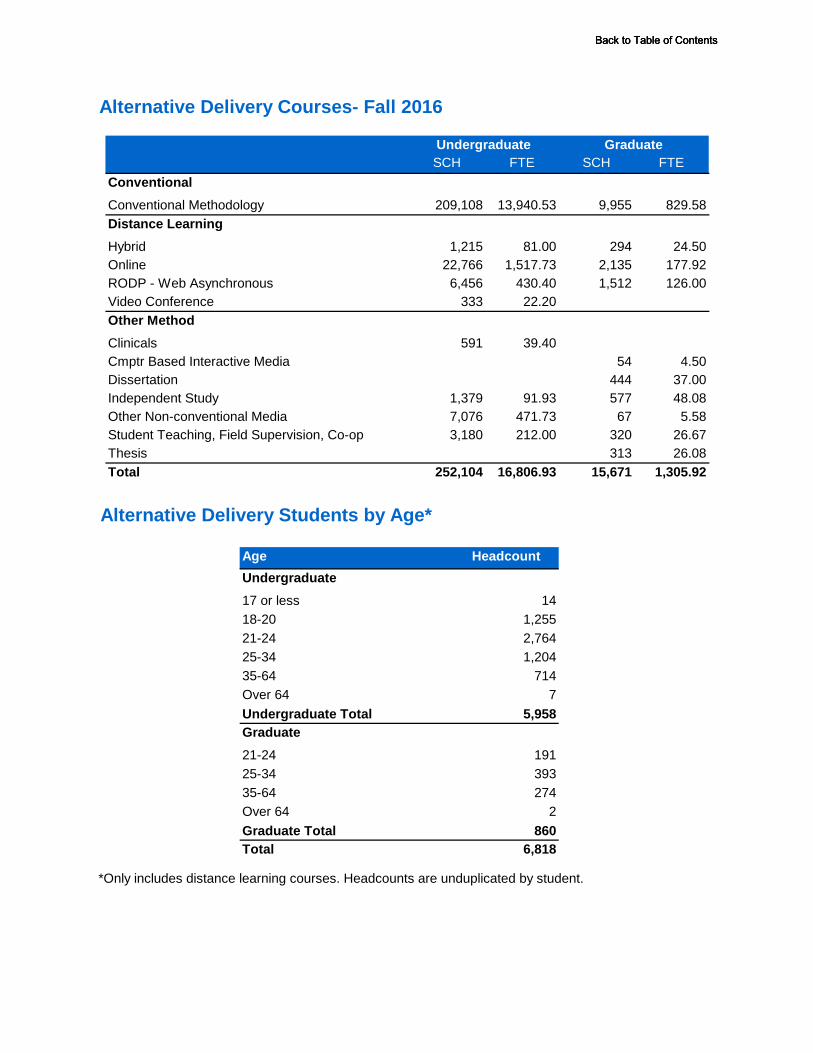
FTE
13,940.53
81.001,517.73
430.4022.20
39.40
91.93471.73212.00
16,806.93
Total 6,818
*Only includes distance learning courses. Headcounts are unduplicated by student.
35-64 274Over 64 2Graduate Total 860
Graduate21-24 19125-34 393
35-64 714Over 64 7Undergraduate Total 5,958
18-20 1,25521-24 2,76425-34 1,204
Alternative Delivery Students by Age*
Age HeadcountUndergraduate17 or less 14
Thesis 313 26.08Total 252,104 15,671 1,305.92
Other Non-conventional Media 7,076 67 5.58Student Teaching, Field Supervision, Co-op 3,180 320 26.67
Dissertation 444 37.00Independent Study 1,379 577 48.08
Clinicals 591Cmptr Based Interactive Media 54 4.50
Video Conference 333Other Method
Online 22,766 2,135 177.92RODP - Web Asynchronous 6,456 1,512 126.00
Distance LearningHybrid 1,215 294 24.50
ConventionalConventional Methodology 209,108 9,955 829.58
Alternative Delivery Courses- Fall 2016
Undergraduate GraduateSCH SCH FTE
Back to Table of ContentsBack to Table of ContentsBack to Table of Contents

Residency Status* of Students- Fall 2016
New Students
Classification
In State Out of State
Female Male TotalFemale Male Total Female Male Total
Freshman 1,590 1,208 2,798 148 185 333 1,738 1,393 3,131
Sophomore 292 273 565 25 32 57 317 305 622
Junior 385 263 648 24 33 57 409 296 705
Senior 133 94 227 12 9 21 145 103 248
Undergrad Special 4 7 11 2 2 4 6 9 15
Graduate Special 33 24 57 7 2 9 40 26 66
Masters 238 131 369 67 50 117 305 181 486
Specialist in Education 13 5 18 1 0 1 14 5 19
Doctoral 11 5 16 7 7 14 18 12 30
Total 2,699 2,010 4,709 293 320 613 2,992 2,330 5,322
All Students
Classification
In State Out of State
Female Male TotalFemale Male Total Female Male Total
Freshman 2,116 1,685 3,801 189 283 472 2,305 1,968 4,273
Sophomore 1,970 1,589 3,559 115 248 363 2,085 1,837 3,922
Junior 2,326 1,798 4,124 101 212 313 2,427 2,010 4,437
Senior 3,302 2,639 5,941 148 277 425 3,450 2,916 6,366
Undergrad Special 310 238 548 66 81 147 376 319 695
Graduate Special 85 42 127 7 2 9 92 44 136
Masters 946 517 1,463 194 174 368 1,140 691 1,831
Specialist in Education 62 19 81 2 0 2 64 19 83
Doctoral 119 70 189 63 55 118 182 125 307
Total 11,236 8,597 19,833 885 1,332 2,217 12,121 9,929 22,050
*Based on application for admission
Source: TBR Enrollment Data
Back to Table of ContentsBack to Table of ContentsBack to Table of Contents

County 2015 2016#
Change County 2015 2016 # ChangeAnderson 59 56 -3 Macon 31 27 -4Bedford 411 396 -15 Madison 189 156 -33Benton 18 17 -1 Marion 33 41 8Bledsoe 6 5 -1 Marshall 203 195 -8Blount 100 103 3 Maury 487 463 -24Bradley 118 126 8 Mcminn 29 27 -2Campbell 12 8 -4 Mcnairy 36 38 2Cannon 154 158 4 Meigs 8 6 -2Carroll 41 35 -6 Monroe 20 21 1Carter 15 14 -1 Montgomery 234 238 4Cheatham 111 104 -7 Moore 29 25 -4Chester 16 15 -1 Morgan 8 6 -2Claiborne 13 14 1 Obion 37 34 -3Clay 0 2 2 Overton 8 7 -1Cocke 14 5 -9 Perry 11 7 -4Coffee 407 340 -67 Pickett 1 3 2Crockett 19 16 -3 Polk 8 7 -1Cumberland 56 60 4 Putnam 58 56 -2Davidson 3,244 3,107 -137 Rhea 12 9 -3Decatur 20 22 2 Roane 69 70 1Dekalb 58 57 -1 Robertson 111 107 -4Dickson 102 96 -6 Rutherford 6,629 6,651 22Dyer 52 46 -6 Scott 9 8 -1Fayette 57 59 2 Sequatchie 8 4 -4Fentress 12 14 2 Sevier 37 40 3Franklin 155 151 -4 Shelby 1,506 1,418 -88Gibson 72 75 3 Smith 36 44 8Giles 57 45 -12 Stewart 3 5 2Grainger 4 2 -2 Sullivan 70 58 -12Greene 21 17 -4 Sumner 467 491 24Grundy 31 23 -8 Tipton 96 89 -7Hamblen 43 34 -9 Trousdale 20 17 -3Hamilton 510 506 -4 Unicoi 2 2 0Hardeman 48 44 -4 Union 5 6 1Hardin 29 35 6 Van buren 9 11 2Hawkins 14 15 1 Warren 162 181 19Haywood 48 43 -5 Washington 55 49 -6Henderson 31 26 -5 Wayne 43 49 6Henry 30 30 0 Weakley 18 19 1Hickman 42 40 -2 White 15 28 13Houston 6 6 0 Williamson 1,508 1,513 5Humphreys 17 19 2 Wilson 887 859 -28Jackson 5 4 -1 Total TN 20,283 19,833 -450Jefferson 23 20 -3 Foreign 1,133 1,061 -72Johnson 1 3 2 Out-of-state 1,087 1,151 64
Knox 410 398 -12 Armed forces 5 2 -3
Lake 2 3 1 Unknown 3 3 0Lauderdale 53 45 -8 Total 22,511 22,050 -461Lawrence 124 120 -4
Headcount by Tennessee County- Fall Terms 2015 - 2016
Back to Table of ContentsBack to Table of ContentsBack to Table of Contents

Headcount by Tennessee County Map Fall 2015
Source: MTSU Office of Institutional Effectiveness, Planning and Research
34 3
19 30
46
45
89
1,418 59
43
44
156
16
75 35
26
15
38 35
22
17
5
6
19
7
49
3 58
14
2 17
49
15 0
34 2
5
20
40
14
6
398
103
8
56
32 70
8
6
21
7
27
126
6
14
3
7
2 27
60
9
5
506
4
11
28
56
4
41
23
181
57
44
17
158
340
151
859
491
6,651
396
25
115 45
120
22 463
195
1,513
3,107
40
96
104
107 238
Back to Table of ContentsBack to Table of ContentsBack to Table of Contents

State 2015 2016#
Change
Alabama 80 99 19
Arizona 4 2 -2
Arkansas 29 34 5
California 40 43 3
Colorado 9 12 3
Connecticut 5 7 2
Delaware 2 3 1
District of Columbia 1 1 0
Florida 62 59 -3
Georgia 239 298 59
Hawaii 0 1 1
Idaho 2 0 -2
Illinois 41 56 15
Indiana 21 24 3
Iowa 1 3 2
Kansas 9 7 -2
Kentucky 76 81 5
Louisiana 17 17 0
Maine 1 1 0
Maryland 34 33 -1
Massachusetts 2 6 4
Michigan 25 22 -3
Minnesota 10 7 -3
Mississippi 33 34 1
Missouri 24 13 -11
Montana 2 1 -1
Nebraska 2 1 -1
Nevada 7 8 1
New Hampshire 2 4 2
State 2015 2016#
Change
New Jersey 12 7 -5
New Mexico 2 2 0
New York 19 18 -1
North Carolina 28 28 0
North Dakota 1 2 1
Ohio 32 26 -6
Oklahoma 8 6 -2
Oregon 4 2 -2
Pennsylvania 18 18 0
Rhode Island 2 1 -1
South Carolina 41 39 -2
South Dakota 1 1 0
Tennessee 20,283 19,833 -450
Texas 42 32 -10
Vermont 0 1 1
Virginia 70 70 0
Washington 7 4 -3
West Virginia 10 8 -2
Wisconsin 9 8 -1
Wyoming 1 0 -1
Total 21,370 20,983 -387
Foreign 1,133 1,061 -72
Armed Forces 5 2 -3
Unknown 3 4 1
Grand Total 22,511 22,050 -461
Headcount by State of Residence- Fall Terms 2015 - 2016
Back to Table of ContentsBack to Table of ContentsBack to Table of Contents

Country 2015 2016#
Change Country 2015 2016#
Change Country 2015 2016#
ChangeAlbania 0 1 1 Haiti 2 0 -2 Rwanda 1 1 0
Argentina 1 2 1 Hondrus 0 1 1 Saudi Arabia 607 461 -146
Armed Forces 5 2 -3 Hong Kong 0 1 1 Singapore 1 1 0
Australia 0 1 1 Hungary 2 1 -1 South Africa 1 0 -1
Austria 1 2 1 India 55 58 3 Spain 6 6 0
Bahamas, the 14 29 15 Indonesia 0 3 3 Sri Lanka 4 2 -2
Bahrain 1 1 0 Iran 3 5 2 Sudan 0 1 1
Bangladesh 11 11 0 Italy 4 5 1 Suriname 1 1 0
Belarus 2 2 0 Japan 26 18 -8 Sweden 3 3 0
Belgium 0 1 1 Jordan 1 1 0 Switzerland 4 3 -1
Belize 1 0 -1 Kenya 15 13 -2 Syria 3 4 1
Bolivia 1 0 -1 Korea Republic 21 23 2 Taiwan 5 4 -1
Brazil 7 7 0 Kuwait 15 17 2 Tanzania 1 0 -1
Cameroon 0 1 1 Laos 1 0 -1 Thailand 5 10 5
Canada 12 14 2 Libya 4 5 1 Trinidad-Tobago 2 2 0
Chile 1 1 0 Madagascar 2 3 1 Tunisia 0 1 1
China 97 108 11 Malaysia 3 7 4 Turkey 3 1 -2
Colombia 5 7 2 Mexico 30 40 10 Uganda 3 1 -2
Congo 0 1 1 Muscat/Oman 34 34 0 Ukraine 5 5 0
Congo (Dem.Republic) 4 4 0 Nepal 6 8 2 United Arab Emirates 1 1 0
Costa Rica 1 2 1 Netherlands 0 1 1 United Kingdom 10 13 3
Czech Republic 1 1 0 New Zealand 0 1 1 United States 21,370 20,984 -386
Dominican Republic 1 1 0 Nicaragua 1 0 -1 Uzbekistan 3 6 3
Egypt 3 8 5 Nigeria 12 16 4 Venezulea 15 12 -3
El Salvador 4 4 0 Norway 2 2 0 Vietnam 6 9 3
Ethiopia 3 6 3 Pakistan 1 1 0 Zambia 2 1 -1
Finland 0 3 3 Paraguay 1 1 0 Unknown 3 3 0
France 2 2 0 Peru 2 1 -1 Total 22,511 22,050 -461Gambia, the 1 0 -1 Puerto Rico 0 1 1
Germany 6 6 0 Qatar 1 1 0
Ghana 8 9 1 Romania 0 1 1
Guatemala 6 4 -2 Russia 3 4 1
1. Saudia Arabia 5. Muscat/Oman 9. Kuwait
2. China 6. Bahamas 10. Nigeria
3. India 7. Korea
4. Mexico 8. Japan
Headcount by Country- Fall Terms 2015 - 2016
Top 10 Foreign Countries
Note: Enrollment counts may differ from the International Students report due to differences in source data.
Back to Table of ContentsBack to Table of ContentsBack to Table of Contents
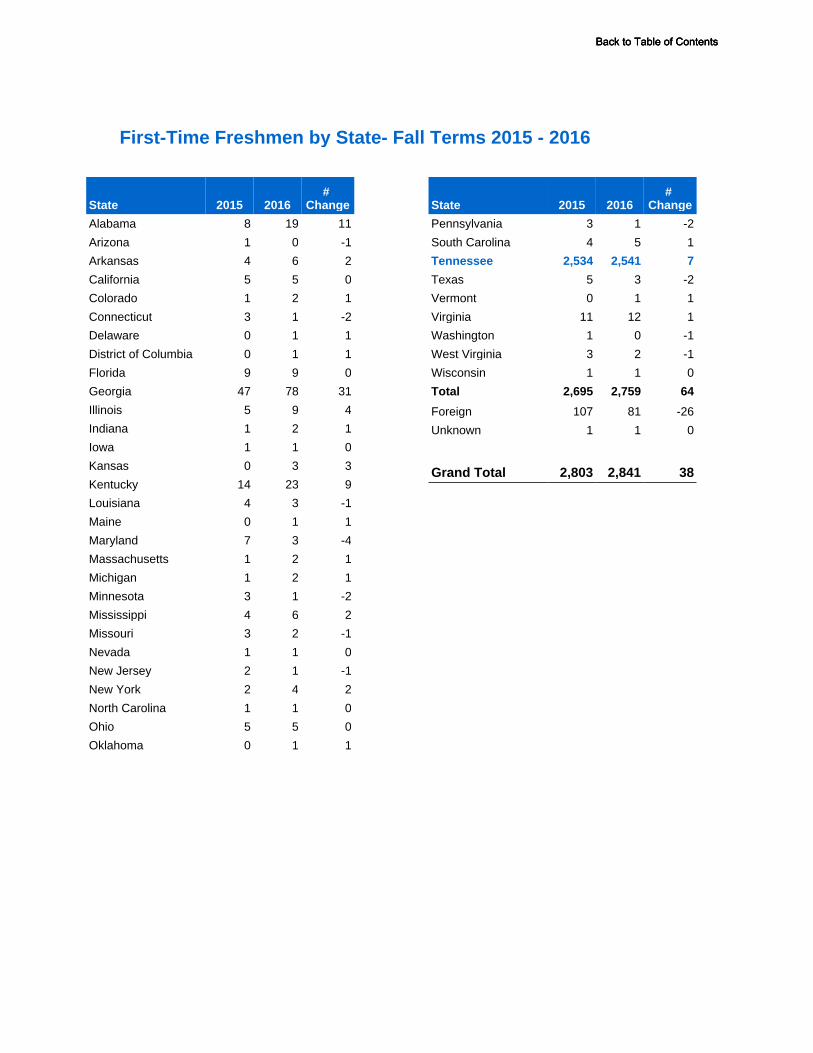
State 2015 2016#
Change
Alabama 8 19 11
Arizona 1 0 -1
Arkansas 4 6 2
California 5 5 0
Colorado 1 2 1
Connecticut 3 1 -2
Delaware 0 1 1
District of Columbia 0 1 1
Florida 9 9 0
Georgia 47 78 31
Illinois 5 9 4
Indiana 1 2 1
Iowa 1 1 0
Kansas 0 3 3
Kentucky 14 23 9
Louisiana 4 3 -1
Maine 0 1 1
Maryland 7 3 -4
Massachusetts 1 2 1
Michigan 1 2 1
Minnesota 3 1 -2
Mississippi 4 6 2
Missouri 3 2 -1
Nevada 1 1 0
New Jersey 2 1 -1
New York 2 4 2
North Carolina 1 1 0
Ohio 5 5 0
Oklahoma 0 1 1
State 2015 2016#
Change
Pennsylvania 3 1 -2
South Carolina 4 5 1
Tennessee 2,534 2,541 7
Texas 5 3 -2
Vermont 0 1 1
Virginia 11 12 1
Washington 1 0 -1
West Virginia 3 2 -1
Wisconsin 1 1 0
Total 2,695 2,759 64
Foreign 107 81 -26
Unknown 1 1 0
Grand Total 2,803 2,841 38
First-Time Freshmen by State- Fall Terms 2015 - 2016
Back to Table of ContentsBack to Table of ContentsBack to Table of Contents

County 2015 2016#
ChangeAnderson 4 12 8
Bedford 45 45 0
Benton 1 5 4
Blount 15 13 -2
Bradley 20 18 -2
Campbell 2 2 0
Cannon 27 17 -10
Carroll 10 8 -2
Carter 5 5 0
Cheatham 15 20 5
Chester 7 1 -6
Claiborne 4 1 -3
Clay 0 1 1
Cocke 1 0 -1
Coffee 37 26 -11
Crockett 5 4 -1
Cumberland 9 15 6
Davidson 385 361 -24
Decatur 5 5 0
Dekalb 6 7 1
Dickson 17 12 -5
Dyer 14 6 -8
Fayette 12 9 -3
Fentress 2 4 2
Franklin 16 16 0
Gibson 10 14 4
Giles 4 0 -4
Grainger 1 0 -1
Greene 6 2 -4
Grundy 2 4 2
Hamblen 3 1 -2
Hamilton 111 109 -2
Hardeman 13 9 -4
Hardin 5 7 2
Hawkins 2 3 1
Haywood 14 11 -3
Henderson 3 6 3
Henry 8 8 0
Hickman 3 4 1
Houston 2 1 -1
Humphreys 4 3 -1
Jackson 1 1 0
Jefferson 5 5 0
Johnson 0 2 2
Knox 60 77 17
Lake 1 1 0
Lauderdale 16 12 -4
Lawrence 12 4 -8
Lewis 4 2 -2
County 2015 2016#
ChangeLincoln 3 7 4
Loudon 2 2 0
Macon 7 4 -3
Madison 27 31 4
Marion 5 7 2
Marshall 20 19 -1
Maury 25 29 4
Mcminn 4 3 -1
Mcnairy 7 10 3
Meigs 1 0 -1
Monroe 3 4 1
Montgomery 36 48 12
Moore 1 0 -1
Obion 4 5 1
Overton 1 2 1
Perry 1 1 0
Pickett 0 1 1
Polk 2 1 -1
Putnam 4 8 4
Rhea 2 1 -1
Roane 4 7 3
Robertson 8 12 4
Rutherford 684 793 109
Sevier 7 4 -3
Shelby 374 280 -94
Smith 3 7 4
Stewart 0 1 1
Sullivan 6 7 1
Sumner 40 49 9
Tipton 28 13 -15
Trousdale 0 2 2
Unicoi 0 1 1
Union 0 2 2
Van buren 1 1 0
Warren 21 20 -1
Washington 7 7 0
Wayne 2 6 4
Weakley 4 6 2
White 1 2 1
Williamson 140 145 5
Wilson 95 94 -1
Total TN 2,534 2,541 7
Foreign 107 81 -26
Out-of-state 161 219 58
Unknown 1 0 -1
Total 2,803 2,841 38
First-Time Freshmen by County- Fall Terms 2015 - 2016
Back to Table of ContentsBack to Table of ContentsBack to Table of Contents

Count % Count % Count % Count % Count %US Citizen 24305 95.7% 22728 95.2% 21375 94.0% 20969 93.2% 20567 93.3%Not US Citizen 1089 4.3% 1153 4.8% 1354 6.0% 1542 6.8% 1483 6.7%
TOTAL 25394 100% 23881 100% 22729 100% 22511 100% 22050 100%
Count % Count % Count % Count % Count %Non-resident Alien With VISA 577 53.0% 639 55.4% 883 65.2% 1064 69.0% 1017 68.6%Perm Res Alien, Asylee or Refugee 429 39.4% 434 37.6% 397 29.3% 408 26.5% 417 28.1%Resident Alien (Tax Purposes) 81 7.4% 74 6.4% 69 5.1% 53 3.4% 38 2.6%Reclassification In Progress 0 0.0% 0 0.0% 1 0.1% 0 0.0% 1 0.1%Other Non-Citizen 2 0.2% 6 0.5% 4 0.3% 17 1.1% 10 0.7%
TOTAL 1089 100% 1153 100% 1354 100% 1542 100% 1483 100%
Status
StatusFall 2012 Fall 2013
International Students
Fall 2014 Fall 2015 Fall 2016
Fall 2012 Fall 2013 Fall 2014 Fall 2015 Fall 2016
0
5000
10000
15000
20000
25000
30000
Fall 2012 Fall 2013 Fall 2014 Fall 2015 Fall 2016
US Citizens and Non-Citizens - All Students
US Citizen Not US Citizen
0
200
400
600
800
1000
1200
1400
1600
1800
Fall 2012 Fall 2013 Fall 2014 Fall 2015 Fall 2016
Non-Citizen Categories - All Students
Non-resident Alien With VISA Perm Res Alien, Asylee or Refugee Resident Alien (Tax Purposes)Reclassification In Progress Other Non-Citizen
Back to Table of ContentsBack to Table of ContentsBack to Table of Contents

Office of Institutional Effectiveness, Planning and Research www.mtsu.edu/iepr/
ACCREDITATION AND DEGREE2016 FACT BOOK
Approved Accreditation AgenciesDegree and Major Offerings Summary Degrees Conferred: Academic Year 2015-2016 Degrees Conferred by College Affiliation,
Department and Gender AY 2015-16 Undergraduate Degrees Conferred by College,
Department, Race and Gender AY 2015-16 Graduate Degrees Conferred by College,
Department, Race and Gender AY 2015-16
Back to Table of Contents

Approved Accreditation Agencies
Discipline Acronym Accrediting Agency Allied Health CAAHEP Commission on Accreditation of Allied Health Education Programs1
Architecture NAAB National Architectural Accrediting Board
Art and Design NASAD National Association of Schools of Art and Design
Athletic Training CAATE Commission on Accreditation of Athletic Training Education
Audiology/Speech-Language Pathology
ASHA American Speech-Language-Hearing Association
Aviation AABI Aviation Accreditation Board International
Biochemistry ASBMB American Society for Biochemistry and Molecular Biology
Business ACBSP Association of Collegiate Business Schools and Programs2
Business AACSB Association to Advance Collegiate Schools of Business3
Chemistry ACS American Chemical Society
Clinical Laboratory Sciences NAACLS National Accrediting Agency for Clinical Laboratory Sciences
Clinical Pastoral Education ACPEAC Association for Clinical Pastoral Education, Inc. – Accreditation
Commission
Counseling ACA American Counseling Association
Culinary ACF American Culinary Federation
Dentistry ADA American Dental Association
Dietetics AND Academy of Nutrition and Dietetics
Engineering (Applied Science, Computing and Technology)
ABET Accrediting Board for Engineering and Technology
Environmental Health Science NEHA National Environmental Health Association
Family and Consumer Sciences AAFCS American Association of Family and Consumer Sciences
Forestry SAF Society of American Foresters Health Administration AUPHA Association of University Programs in Health Administration
Back to Table of ContentsBack to Table of ContentsBack to Table of Contents

Health Information CAHIIM Commission on Accreditation for Health Informatics and Information Management Education
Discipline Acronym Accrediting Agency Industrial Technology ATMAE Association of Technology, Management, and Applied Engineering
Interior Design CIDA Council for Interior Design Accreditation
Journalism and Mass Communication
ACEJMC Accrediting Council on Education in Journalism and Mass Communications
Landscape Architecture ASLA American Society of Landscape Architects
Law and Legal Studies ABA American Bar Association
Library and Information Studies ALA American Library Association
Massage Therapy COMTA Commission on Massage Therapy Accreditation
Medical Education LCME Liaison Committee on Medical Education
Music NASM National Association of Schools of Music
Nurse Anesthetists AANA American Association of Nurse Anesthetists
Nursing ACEN Accreditation Commission for Education in Nursing4
Nursing AACN American Association of Colleges of Nursing5
Occupational Therapy AOTA American Occupational Therapy Association, Inc.
Ophthalmic JCAHPO Joint Commission on Allied Health Personnel in Ophthalmology
Optician COA Commission on Opticianry Accreditation
Pharmacy ACPE Accreditation Council for Pharmacy Education
Pharmacy Technician ASHP American Society of Health - System Pharmacists
Physical Therapy APTA American Physical Therapy Association
Planning ACSP Association of Collegiate Schools of Planning
Psychology APA American Psychological Association
Public Affairs and Administration NASPAA National Association of Schools of Public Affairs and Administration
Public Health CEPH Council on Education for Public Health
Radiologic Technology JRCERT Joint Review Committee on Education in Radiologic Technology
Back to Table of ContentsBack to Table of ContentsBack to Table of Contents
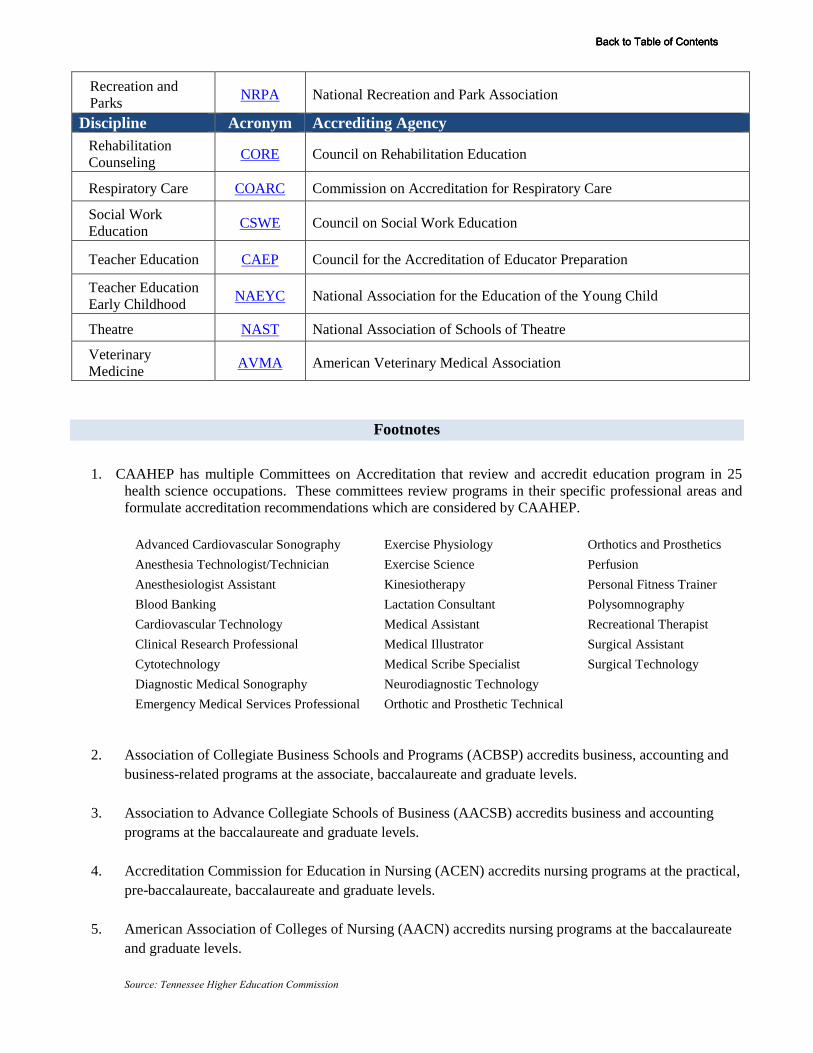
Recreation and Parks NRPA National Recreation and Park Association
Discipline Acronym Accrediting Agency Rehabilitation Counseling CORE Council on Rehabilitation Education
Respiratory Care COARC Commission on Accreditation for Respiratory Care
Social Work Education CSWE Council on Social Work Education
Teacher Education CAEP Council for the Accreditation of Educator Preparation
Teacher Education Early Childhood NAEYC National Association for the Education of the Young Child
Theatre NAST National Association of Schools of Theatre
Veterinary Medicine AVMA American Veterinary Medical Association
Footnotes
1. CAAHEP has multiple Committees on Accreditation that review and accredit education program in 25health science occupations. These committees review programs in their specific professional areas and formulate accreditation recommendations which are considered by CAAHEP.
Advanced Cardiovascular Sonography Exercise Physiology Orthotics and Prosthetics Anesthesia Technologist/Technician Exercise Science Perfusion Anesthesiologist Assistant Kinesiotherapy Personal Fitness Trainer Blood Banking Lactation Consultant Polysomnography Cardiovascular Technology Medical Assistant Recreational Therapist Clinical Research Professional Medical Illustrator Surgical Assistant Cytotechnology Medical Scribe Specialist Surgical Technology Diagnostic Medical Sonography Neurodiagnostic Technology Emergency Medical Services Professional Orthotic and Prosthetic Technical
2. Association of Collegiate Business Schools and Programs (ACBSP) accredits business, accounting andbusiness-related programs at the associate, baccalaureate and graduate levels.
3. Association to Advance Collegiate Schools of Business (AACSB) accredits business and accountingprograms at the baccalaureate and graduate levels.
4. Accreditation Commission for Education in Nursing (ACEN) accredits nursing programs at the practical,pre-baccalaureate, baccalaureate and graduate levels.
5. American Association of Colleges of Nursing (AACN) accredits nursing programs at the baccalaureate and graduate levels.
Source: Tennessee Higher Education Commission
Back to Table of ContentsBack to Table of ContentsBack to Table of Contents

Degree and Major Offerings
Undergraduate Majors A-Z
A
• Accounting, B.B.A.• Actuarial Science, B.S.• Aerospace, Administration Concentration, B.S.• Aerospace, Flight Dispatch Concentration, B.S.• Aerospace, Maintenance Management Concentration, B.S.• Aerospace, Professional Pilot Concentration, B.S.• Aerospace, Technology Concentration, B.S.• Aerospace, Unmanned Aircraft Systems (UAS) Operations Concentration, B.S.• Agribusiness, B.S.• Agribusiness, Agricultural Education Certification, B.S.• Animal Science, B.S.• Animal Science, Agricultural Education Certification, B.S.• Animal Science, Horse Science Concentration, B.S.• Animation, B.S.• Anthropology, B.A.• Anthropology, B.S.• Art Education, B.S.• Art, Art History, B.A.• Art, Art History, B.S.• Art, Art Practices, B.A.• Art, Art Practices, B.S.• Art, Graphic Design Concentration, B.F.A.• Art, Studio Concentration, B.F.A.• Athletic Training, B.S.
B
• Biochemistry, B.S.• Biology, Genetics and Biotechnology Concentration, B.S.• Biology, Microbiology Concentration, B.S.• Biology, Organismal Biology and Ecology Concentration, B.S.• Biology, Physiology Concentration, B.S.• Biology, Teacher Licensure (MTeach), B.S.• Business Administration, B.B.A.• Business Education, Non-teaching, B.S.• Business Education, Non-teaching (Training and Development), B.S.• Business Education, Teaching Licensure, B.S.
C
• Chemistry, B.S.• Chemistry, Professional Concentration (Biomolecular Track)• Chemistry, Professional Concentration (Materials Track)• Chemistry, Teacher Licensure (MTeach), B.S.• Community and Public Health, Health Education and Lifetime Wellness Concentration, B.S.
Back to Table of ContentsBack to Table of ContentsBack to Table of Contents

• Community and Public Health, Public Health Concentration, B.S.• (Computer) Information Systems, B.B.A.• Computer Science, Business Applications Concentration (Business Administration Minor), B.S.• Computer Science, Business Applications Concentration (Mathematics Minor), B.S.• Computer Science, Professional Computer Science Concentration, B.S.• Concrete Industry Management, Concrete Contracting Concentration, B.S.• Concrete Industry Management, Production, Sales, and Service Concentration, B.S.• Construction Management, Commercial Construction Management Concentration, B.S.• Construction Management, Electrical Construction Management Concentration, B.S.• Construction Management, Land Development/Residential Building Construction Management,
B.S.• Construction Management, Pre-Architecture• Criminal Justice Administration, B.S.• Criminal Justice Administration, Homeland Security Concentration, B.S.• Criminal Justice Administration, Law Enforcement Concentration, B.S.
D
• Diagnostic Medical Sonography Curriculum (Science, Health Science Concentration, B.S.)
E
• Early Childhood Education, B.S.• Economics, B.B.A.• Economics, Labor Relations Concentration, B.B.A.• Economics (Nonbusiness), B.S.• Engineering Technology, Computer Engineering Technology Concentration, B.S.• Engineering Technology, Electromechanical Engineering Technology Concentration, B.S.• Engineering Technology, Mechanical Engineering Technology Concentration, B.S.• Engineering Technology, Pre-Engineering• English, B.A.• English, Cultural Studies Concentration, B.A.• English, Literary Studies Concentration, B.A.• English, Secondary English Teacher Licensure Concentration, B.A.• English, Writing Concentration, B.A.• Entrepreneurship, B.B.A.• Environmental Sustainability and Technology, B.S.• Exercise Science, B.S.
F
• Family and Consumer Studies, Child Development and Family Studies Concentration, B.S.• Family and Consumer Studies, Family and Consumer Sciences Education Concentration, B.S.• Finance, Business Finance Concentration, B.B.A.• Finance, Financial Institution Management Concentration, B.B.A.• Finance, Insurance Concentration, B.B.A.• Finance, Real Estate Concentration, B.B.A.• Foreign Languages, French Concentration, B.A.• Foreign Languages, French Concentration, B.S.• Foreign Languages, French Teacher Licensure, B.S.• Foreign Languages, German Concentration, B.A.• Foreign Languages, German Concentration, B.S.
Back to Table of ContentsBack to Table of ContentsBack to Table of Contents
• Foreign Languages, German Teacher Licensure, B.S.• Foreign Languages, Japanese Concentration, B.A.• Foreign Languages, Japanese Concentration, B.S.• Foreign Languages, Spanish Concentration, B.A.• Foreign Languages, Spanish Concentration, B.S.• Foreign Languages, Spanish Teacher Licensure, B.S.• Forensic Science, B.S.
G
• Geoscience, Geology Concentration (Earth Science), B.S.• Geoscience, Geology Concentration (Earth Science for Teachers), B.S.• Geoscience, Geology Concentration (Geology), B.S.• Geoscience, Physical Geography Concentration (Geographic Techniques), B.S.• Geoscience, Physical Geography Concentration (Physical Geography), B.S.• Global Studies and Cultural Geography, Cultural Geography Concentration, B.S.• Global Studies and Cultural Geography, Global Studies Concentration, B.S.• Global Studies and Cultural Geography, Cultural Geography Licensure, B.S.
H
• History, B.A.• History, Teacher Licensure, B.A.• History, B.S.• History, Teacher Licensure, B.S.
I
• Industrial/Organizational Psychology, B.S.• Information Systems, B.B.A.• Interdisciplinary Studies (Grades 6-8, English), B.S.• Interdisciplinary Studies (Grades 6-8, Math), B.S.• Interdisciplinary Studies (Grades 6-8, Science), B.S.• Interdisciplinary Studies (Grades 6-8, Social Studies), B.S.• Interdisciplinary Studies (Grades K-6), B.S.• Integrated Studies, B.S.• Interior Design, B.S.• International Relations, B.A.• International Relations, B.S.
J
• Journalism, B.S.• Journalism, Advertising-Public Relations Concentration (Advertising), B.S.• Journalism, Advertising-Public Relations Concentration (Public Relations), B.S.• Journalism, Advertising-Public Relations Concentration (Recording Industry) B.S.• Journalism, Media Studies Concentration, B.S.• Journalism, Visual Communication Concentration, B.S.
L
• Leisure, Sport, and Tourism Studies, B.S.
Back to Table of ContentsBack to Table of ContentsBack to Table of Contents
• Liberal Studies, B.S.• Liberal Studies, Applied Leadership, B.S.
M
• Management, B.B.A.• Marketing, B.B.A.• Mass Communication, Electronic Media Communication Concentration (Media Management),
B.S.• Mass Communication, Electronic Media Communication Concentration (Video and Film
Production), B.S.• Mass Communication, New Media Communication Concentration, B.S.• Mass Communication, Photography Concentration, B.S.• Mathematics, Mathematics Education Concentration, B.S.• Mathematics, Professional Mathematics Concentration (Advanced Mathematics), B.S.• Mathematics, Professional Mathematics Concentration (Business), B.S.• Mathematics, Professional Mathematics Concentration (General Mathematics), B.S.• Mathematics, Professional Mathematics Concentration (Industrial Mathematics), B.S.• Mathematics, Professional Mathematics Concentration (Statistics), B.S.• Mechatronics Engineering, B.S.• Music, Instrumental Music Education Concentration, B.M.• Music, Instrumental Performance Concentration (Brass, Orchestral Strings, Woodwinds, and
Percussion), B.M.• Music, Instrumental Performance Concentration (Guitar), B.M.• Music, Instrumental Performance Concentration (Jazz Studies), B.M.• Music, Instrumental Performance Concentration (Organ), B.M.• Music, Instrumental Performance Concentration (Piano), B.M.• Music, Music Industry Concentration, B.M.• Music, Theory-Composition Concentration, B.M.• Music, Vocal/General Music Education Concentration, B.M.• Music, Voice Performance Concentration, B.M.
N
• (Nonbusiness) Economics, B.S.• Nursing, B.S.N.• Nutrition and Food Science, B.S.• Nutrition and Food Science, Dietetics Concentration, B.S.
O
• Organizational Communication, B.S.• Organizational Communication, Communication Studies Concentration, B.S.
P
• Philosophy, B.A.• Philosophy, B.S.• Physical Education, B.S.• Physics, Applied Physics Concentration, B.S.• Physics, Astronomy Concentration, B.S.• Physics, Physics Teaching Concentration, B.S.
Back to Table of ContentsBack to Table of ContentsBack to Table of Contents

• Physics, Professional Physics Concentration, B.S.• Plant and Soil Science, B.S.• Plant and Soil Science, Agricultural Education Certification, B.S.• Political Science, B.A.• Political Science, B.S.• Political Science, Pre-Law Concentration, B.A.• Political Science, Pre-Law Concentration, B.S.• Political Science, Public Administration Concentration, B.A.• Political Science, Public Administration Concentration, B.S.• Political Science, Teacher Licensure, B.S.• Pre-Architecture• Pre-Chiropractic Curriculum, (Science Health Science Concentration, B.S.)• Pre-Cytotechnology Curriculum (Science, Health Science Concentration, B.S.)• Pre-Dental Curriculum (Science, Health Science Concentration, B.S.)• Pre-Engineering• Pre-Health Information Management Curriculum (Science, Health Science Concentration, B.S.)• Pre-Medical Curriculum (Science, Health Science Concentration, B.S.)• Pre-Medical Technology Curriculum (Science, Health Science Concentration, B.S.)• Pre-Nuclear Medicine Technology Curriculum (Science, Health Science Concentration, B.S.)• Pre-Occupational Therapy Curriculum (Science, Health Science Concentration, B.S.)• Pre-Pharmacy Curriculum (Science, Health Science Concentration, B.S.)• Pre-Physical Therapy Curriculum (Science, Health Science Concentration, B.S.)• Pre-Radiation Therapy Technology Curriculum (Science, Health Science Concentration, B.S.)• Professional Studies, Healthcare Administration Concentration, B.S.• Professional Studies, Information Technology Concentration, B.S.• Professional Studies, International Organizational Leadership Concentration, B.S.• Professional Studies, Organizational Leadership Concentration, B.S.• Psychology, B.S.• (Psychology) Industrial/Organizational Psychology, B.S.• Psychology, Pre-graduate School Concentration, B.S.
R
• Recording Industry, Audio Production Concentration, B.S.• Recording Industry, Commercial Songwriting Concentration, B.S.• Recording Industry, Music Business Concentration, B.S.
S
• Science, General Science Concentration with Teacher Licensure, B.S.• Science, General Science Concentration, B.S.• Science, Health Science Concentration, B.S.• Science, Health Science Concentration, Diagnostic Medical Sonography Curriculum, B.S.• Science, Health Science Concentration, Pre-Chiropractic Curriculum, B.S.• Science, Health Science Concentration, Pre-Cytotechnology Curriculum, B.S.• Science, Health Science Concentration, Pre-Dental Curriculum, B.S.• Science, Health Science Concentration, Pre-Health Information Management Curriculum, B.S.• Science, Health Science Concentration, Pre-Medical Curriculum, B.S.• Science, Health Science Concentration, Pre-Medical Technology Curriculum, B.S.• Science, Health Science Concentration, Pre-Nuclear Medicine Technology Curriculum, B.S.• Science, Health Science Concentration, Pre-Occupational Therapy Curriculum, B.S.• Science, Health Science Concentration, Pre-Pharmacy Curriculum, B.S.
Back to Table of ContentsBack to Table of ContentsBack to Table of Contents

• Science, Health Science Concentration, Pre-Physical Therapy Curriculum, B.S.• Science, Health Science Concentration, Pre-Radiation Therapy Technology Curriculum, B.S.• Social Work, B.S.W.• Sociology, B.A.• Sociology, B.S.• Sociology, Anthropology Concentration, B.A.• Special Education (Comprehensive), B.S.• Special Education (Modified), B.S.• Speech/Language Pathology and Audiology, B.S.
T
• Textiles, Merchandising, and Design, Apparel Design Concentration, B.S.• Textiles, Merchandising, and Design, Fashion Merchandising Concentration, B.S.• Theatre, B.S.• Theatre, Teacher Licensure, B.S.
V
• Veterinary Medicine Study Preparation
Back to Table of ContentsBack to Table of ContentsBack to Table of Contents

Graduate Programs by Degree
Master of Accountancy
• Accounting, M.Acc.
Master of Arts
• Economics, M.A.• Economics, Financial Economics Concentration, M.A.• English, M.A.• History, M.A.• History, Public History Concentration, M.A.• International Affairs, International Development and Globalization, M.A.• International Affairs, International Security and Peace Studies, M.A.• Psychology, Clinical Concentration, M.A.• Psychology, Experimental Concentration, M.A.• Psychology, Industrial/Organizational Concentration, M.A.• Psychology, Pre-Specialist in Education: School Psychology Concentration, M.A.• Psychology, Quantitative Psychology Concentration, M.A.• Sociology, M.A.• Liberal Arts, M.A.
Master of Arts in Teaching
• Foreign Languages, French Concentration, M.A.T.• Foreign Languages, German Concentration, M.A.T.• Foreign Languages, Spanish Concentration, M.A.T.
Master of Business Administration
• Business Administration, M.B.A.• Business Administration, Concrete Industry Management Concentration, M.B.A.• Business Administration, Health Care Management Concentration, M.B.A.• Business Administration, Music Business, M.B.A.
Master of Business Education
• Business Education, M.B.E.
Master of Criminal Justice
• Criminal Justice Administration, M.C.J.
Master of Education
• Administration and Supervision, Agricultural Education Leadership, M.Ed.• Administration and Supervision, Higher Education Specialization, M.Ed.• Administration and Supervision, K-12 Public School Specialization, M.Ed.• Administration and Supervision, Nonlicensure Program, M.Ed.
Back to Table of ContentsBack to Table of ContentsBack to Table of Contents

• Advanced Studies in Teaching and Learning, Early and Middle Childhood Literacy: Reading-Language Arts Concentration, M.Ed.
• Curriculum and Instruction, M.Ed.• Curriculum and Instruction, Elementary School Education Concentration, M.Ed.• Curriculum and Instruction, English as a Second Language Concentration, M.Ed.• Curriculum and Instruction, Initial Licensure Specialization, M.Ed.• Curriculum and Instruction, Secondary Education Licensure Path Specialization, M.Ed.• Literacy, M.Ed.• Professional Counseling, Clinical Mental Health Counseling Concentration, M.Ed.• Professional Counseling, School Counseling Concentration, M.Ed.• Special Education, Mildly/Moderately Disabled Students Concentration, M.Ed.• Special Education, Severely/Profoundly Disabled Students Concentration, M.Ed.
Master of Fine Arts
• Recording Arts and Technologies, M.F.A.
Master of Library Science
• Library Science, M.L.S.
Master of Music
• Music, Collaborative Piano Specialization, M.M.• Music, Conducting Specialization, M.M.• Music, Jazz Studies Specialization, M.M.• Music, Music Composition for Contemporary Media Specialization, M.M.• Music, Music Composition Specialization, M.M.• Music, Music Education Specialization, M.M.• Music, Musicology Specialization, M.M.• Music, Performance Specialization, M.M.
Master of Professional Studies
• Professional Studies, Human Resources Leadership Concentration, M.P.S.• Professional Studies, Strategic Leadership Concentration, M.P.S.• Professional Studies, Training and Development Concentration, M.P.S.
Master of Science
• Aviation Administration, Aviation Education Concentration, M.S.• Aviation Administration, Aviation Management Concentration, M.S.• Aviation Administration, Aviation Safety and Security Management Concentration, M.S.• Biology, M.S.• Chemistry, M.S.• Computer Science, M.S.• Engineering Technology, Engineering Technology Concentration, M.S.• Engineering Technology, Occupational Health and Safety Concentration, M.S.• Exercise Science, M.S.• Finance, Corporate Finance Concentration, M.S.• Finance, Investments Concentration, M.S.
Back to Table of ContentsBack to Table of ContentsBack to Table of Contents

• Finance, General Concentration, M.S.• Health and Human Performance, Health Concentration, M.S.• Health and Human Performance, Physical Education Concentration, M.S.• Horse Science, Equine Education Concentration, M.S.• Horse Science, Equine Physiology Concentration, M.S.• Horse Science, Industry Management Concentration, M.S.• Information Systems, Business Intelligence and Analytics Concentration, M.S.• Information Systems, IS General Concentration, M.S.• Information Systems, Information Security and Assurance Concentration, M.S.• Information Systems, IT Project Management Concentration, M.S.• Leisure and Sport Management, Recreation and Leisure Services Concentration, M.S.• Leisure and Sport Management, Sport Industry Concentration, M.S.• Management, Social Innovation and Not-for-Profit Management Concentration, M.S.• Management, Organizational Leadership Concentration, M.S.• Management, Supply Chain Management Concentration, M.S.• Media and Communication, M.S.• Mathematics, General Mathematics Concentration, M.S.• Mathematics, Industrial Mathematics Concentration, M.S.• Mathematics, Research Preparation Concentration, M.S.• Professional Science, Actuarial Sciences Concentration, M.S.• Professional Science, Biostatistics Concentration, M.S.• Professional Science, Biotechnology Concentration, M.S.• Professional Science, Engineering Management Concentration, M.S.• Professional Science, Health Care Informatics Concentration, M.S.• Professional Science, Geosciences Concentration, M.S.
Master of Science in Nursing
• Nursing, Advanced Practice: Family Nurse Practitioner, M.S.N. (TN eCampus)• Nursing, Nursing Administration, M.S.N. (TN eCampus)• Nursing, Nursing Education, M.S.N. (TN ECampus)• Nursing, Nursing Informatics, M.S.N.
Master of Science in Teaching
• Mathematics, Middle Grade Mathematics Concentration, M.S.T.• Mathematics, Secondary Mathematics Concentration, M.S.T.
Master of Social Work
• Social Work, Advanced Generalist Social Work Practice Concentration, M.S.W.
Specialist in Education
• Administration and Supervision, Ed.S.• Administration and Supervision, Higher Education Specialization, Ed.S.• Administration and Supervision, Instructional Leader Licensure Program Specialization, Ed.S.• Curriculum and Instruction, Ed.S.• Curriculum and Instruction, Culture, Cognition, and the Learning Process Specialization, Ed.S.• Curriculum and Instruction, School Psychology Concentration, Ed.S.
Back to Table of ContentsBack to Table of ContentsBack to Table of Contents

Doctor of Education
• Assessment, Learning, and School Improvement, Ed.D.
Doctor of Philosophy
• Computational Science, Ph.D.• Economics, Ph.D.• English, Ph.D.• Human Performance, Ph.D.• Literacy Studies, Ph.D.• Mathematics and Science Education, Biological Education Concentration, Ph.D.• Mathematics and Science Education, Chemical Education Concentration, Ph.D.• Mathematics and Science Education, Interdisciplinary Science Education Concentration, Ph.D.• Mathematics and Science Education, Mathematics Education Concentration, Ph.D.• Molecular Biosciences, Ph.D.• Public History, Ph.D.
Non-Degree
• Accounting Minor• Aerospace Minor• Agriculture Minor• Art Minor• Biology Minor• Chemistry Minor• Computer Science Minor• Criminal Justice Administration Minor• Curriculum and Instruction Minor• Earth Science/Geology Minor• Economics Minor• Education Minor• English Minor• Foreign Languages Minor• Physical Geography Minor• Gerontology Minor• History Minor• Human Sciences Minor• Information Systems Minor• Library Science Minor• Mass Communication Minor• Mathematics Minor• Music Minor• Physics Minor• Political Science Minor• Psychology Minor• Reading Minor• Sociology Minor• Special Education Minor• Speech and Theatre Minor
Back to Table of ContentsBack to Table of ContentsBack to Table of Contents

Graduate Certificate
• Advanced Practice: Family Nurse Practitioner Certificate (TN eCampus)• College and University Teaching Certificate• Gerontology Certificate• Health Care Management Certificate• Museum Management Certificate• Nursing Administration Certificate (TN eCampus)• Nursing Education Certificate (TN eCampus)• Nursing Informatics Certificate (TN eCampus)• United States Culture and Education Certificate• Women's and Gender Studies Certificate
Source: MTSU Undergraduate and Graduate Catalogs
Back to Table of ContentsBack to Table of ContentsBack to Table of Contents
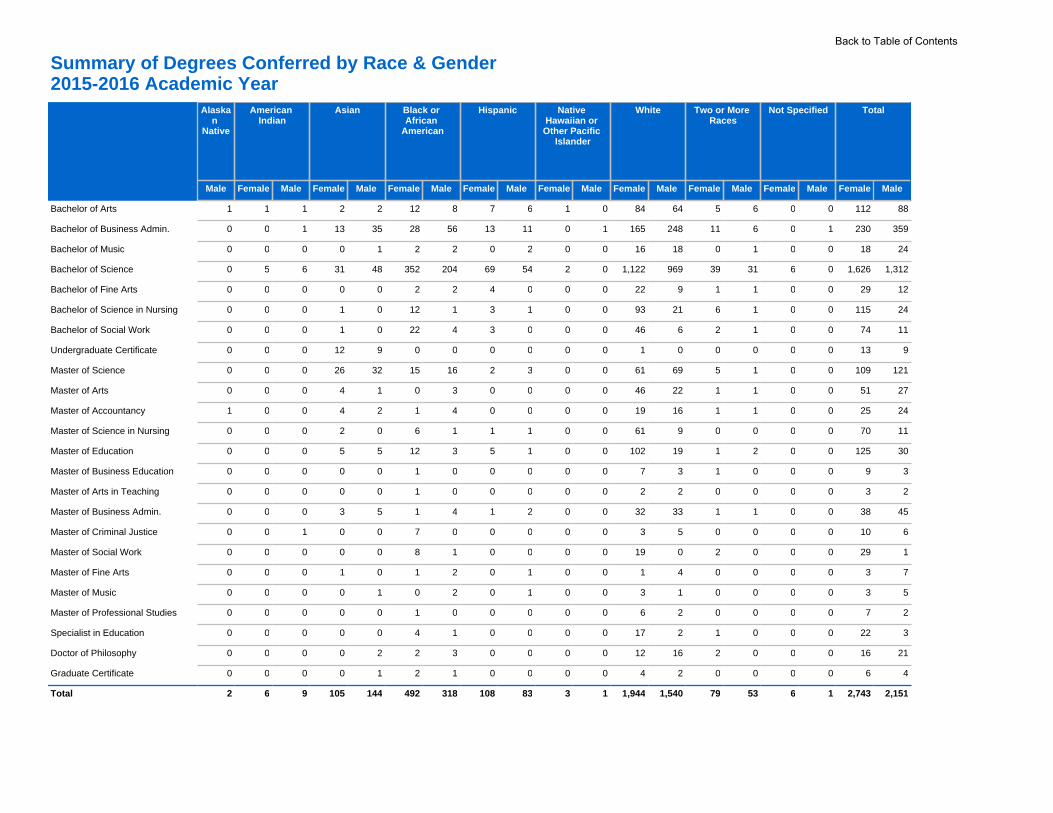
Summary of Degrees Conferred by Race & Gender2015-2016 Academic Year
Alaskan
Native
American Indian
Asian Black or African
American
Hispanic Native Hawaiian or Other Pacific
Islander
White Two or More Races
Not Specified Total
Male Female Male Female Male Female Male Female Male Female Male Female Male Female Male Female Male Female Male
Bachelor of Arts 1 1 1 2 2 12 8 7 6 1 0 84 64 5 6 0 0 112 88
Bachelor of Business Admin. 0 0 1 13 35 28 56 13 11 0 1 165 248 11 6 0 1 230 359
Bachelor of Music 0 0 0 0 1 2 2 0 2 0 0 16 18 0 1 0 0 18 24
Bachelor of Science 0 5 6 31 48 352 204 69 54 2 0 1,122 969 39 31 6 0 1,626 1,312
Bachelor of Fine Arts 0 0 0 0 0 2 2 4 0 0 0 22 9 1 1 0 0 29 12
Bachelor of Science in Nursing 0 0 0 1 0 12 1 3 1 0 0 93 21 6 1 0 0 115 24
Bachelor of Social Work 0 0 0 1 0 22 4 3 0 0 0 46 6 2 1 0 0 74 11
Undergraduate Certificate 0 0 0 12 9 0 0 0 0 0 0 1 0 0 0 0 0 13 9
Master of Science 0 0 0 26 32 15 16 2 3 0 0 61 69 5 1 0 0 109 121
Master of Arts 0 0 0 4 1 0 3 0 0 0 0 46 22 1 1 0 0 51 27
Master of Accountancy 1 0 0 4 2 1 4 0 0 0 0 19 16 1 1 0 0 25 24
Master of Science in Nursing 0 0 0 2 0 6 1 1 1 0 0 61 9 0 0 0 0 70 11
Master of Education 0 0 0 5 5 12 3 5 1 0 0 102 19 1 2 0 0 125 30
Master of Business Education 0 0 0 0 0 1 0 0 0 0 0 7 3 1 0 0 0 9 3
Master of Arts in Teaching 0 0 0 0 0 1 0 0 0 0 0 2 2 0 0 0 0 3 2
Master of Business Admin. 0 0 0 3 5 1 4 1 2 0 0 32 33 1 1 0 0 38 45
Master of Criminal Justice 0 0 1 0 0 7 0 0 0 0 0 3 5 0 0 0 0 10 6
Master of Social Work 0 0 0 0 0 8 1 0 0 0 0 19 0 2 0 0 0 29 1
Master of Fine Arts 0 0 0 1 0 1 2 0 1 0 0 1 4 0 0 0 0 3 7
Master of Music 0 0 0 0 1 0 2 0 1 0 0 3 1 0 0 0 0 3 5
Master of Professional Studies 0 0 0 0 0 1 0 0 0 0 0 6 2 0 0 0 0 7 2
Specialist in Education 0 0 0 0 0 4 1 0 0 0 0 17 2 1 0 0 0 22 3
Doctor of Philosophy 0 0 0 0 2 2 3 0 0 0 0 12 16 2 0 0 0 16 21
Graduate Certificate 0 0 0 0 1 2 1 0 0 0 0 4 2 0 0 0 0 6 4
Total 2 6 9 105 144 492 318 108 83 3 1 1,944 1,540 79 53 6 1 2,743 2,151
Back to Table of Contents

Female Male Total Female Male TotalBasic and Applied SciencesAerospaceAerospace (BS) 10 106 116 0 0 0Aviation Administration (MS) 0 0 0 1 9 10Agribusiness and AgriscienceAgribusiness (BS) 18 16 34 0 0 0Animal Science (BS) 42 11 53 0 0 0Horse Science (MS) 0 0 0 7 0 7Plant & Soil Science (BS) 3 12 15 0 0 0Basic and Applied SciencesComputational Science (PHD) 0 0 0 0 1 1Mathematics & Science Education (PHD) 0 0 0 4 3 7Molecular Biosciences (PHD) 0 0 0 0 2 2Professional Science (MS) 0 0 0 29 26 55BiologyBiology (BS) 68 45 113 0 0 0Biology (MS) 0 0 0 11 3 14Forensic Science (BS) 5 3 8 0 0 0ChemistryBiochemistry (BS) 21 17 38 0 0 0Chemistry (BS) 7 9 16 0 0 0Chemistry (MS) 0 0 0 11 9 20Science (BS) 30 12 42 0 0 0Computer ScienceComputer Science (BS) 7 33 40 0 0 0Computer Science (MS) 0 0 0 1 8 9Concrete Industry ManagementConcrete Industry Management (BS) 4 34 38 0 0 0Engineering TechnologyConstruction Management (BS) 1 20 21 0 0 0Engineering Technology (BS) 1 52 53 0 0 0Engineering Technology & Industrial Studies (MS)
0 0 0 5 8 13
Environmental Science Technology (BS) 0 1 1 0 0 0Environmental Sustainability & Technology (BS)
1 4 5 0 0 0
Mechatronics Engineering (BS) 0 14 14 0 0 0GeosciencesGeoscience (BS) 6 14 20 0 0 0Mathematical Sciences Mathematics (BS) 12 13 25 0 0 0Mathematics (MS) 0 0 0 5 5 10Physics and AstronomyPhysics (BS) 3 7 10 0 0 0
Basic and Applied Sciences Total 239 423 662 74 74 148Behavioral and Health Sciences
Criminal Justice
Degrees Conferred by College Affiliation, Department & Gender2015-2016 Academic Year
College/DepartmentUndergraduate Graduate
Back to Table of ContentsBack to Table of ContentsBack to Table of Contents
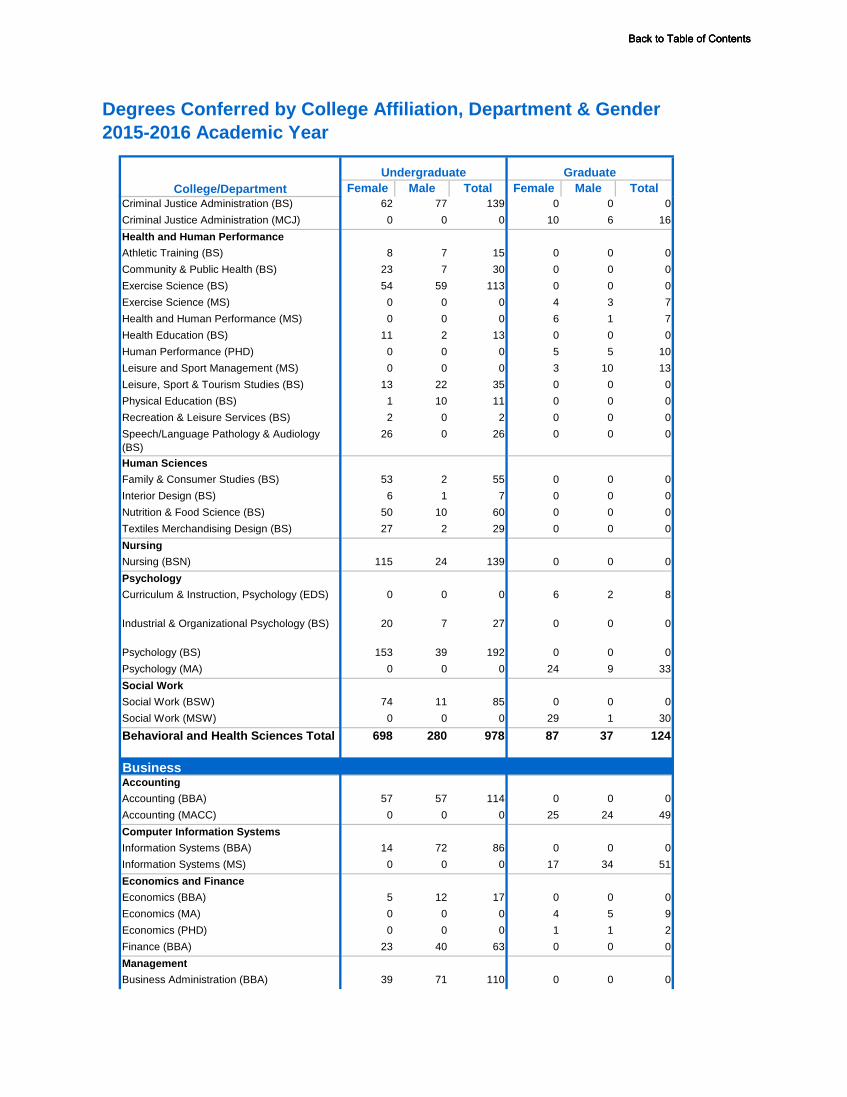
Female Male Total Female Male Total
Degrees Conferred by College Affiliation, Department & Gender2015-2016 Academic Year
College/DepartmentUndergraduate Graduate
Criminal Justice Administration (BS) 62 77 139 0 0 0Criminal Justice Administration (MCJ) 0 0 0 10 6 16Health and Human PerformanceAthletic Training (BS) 8 7 15 0 0 0Community & Public Health (BS) 23 7 30 0 0 0Exercise Science (BS) 54 59 113 0 0 0Exercise Science (MS) 0 0 0 4 3 7Health and Human Performance (MS) 0 0 0 6 1 7Health Education (BS) 11 2 13 0 0 0Human Performance (PHD) 0 0 0 5 5 10Leisure and Sport Management (MS) 0 0 0 3 10 13Leisure, Sport & Tourism Studies (BS) 13 22 35 0 0 0Physical Education (BS) 1 10 11 0 0 0Recreation & Leisure Services (BS) 2 0 2 0 0 0Speech/Language Pathology & Audiology (BS)
26 0 26 0 0 0
Human SciencesFamily & Consumer Studies (BS) 53 2 55 0 0 0Interior Design (BS) 6 1 7 0 0 0Nutrition & Food Science (BS) 50 10 60 0 0 0Textiles Merchandising Design (BS) 27 2 29 0 0 0NursingNursing (BSN) 115 24 139 0 0 0PsychologyCurriculum & Instruction, Psychology (EDS) 0 0 0 6 2 8
Industrial & Organizational Psychology (BS) 20 7 27 0 0 0
Psychology (BS) 153 39 192 0 0 0Psychology (MA) 0 0 0 24 9 33Social WorkSocial Work (BSW) 74 11 85 0 0 0Social Work (MSW) 0 0 0 29 1 30
Behavioral and Health Sciences Total 698 280 978 87 37 124
BusinessAccountingAccounting (BBA) 57 57 114 0 0 0Accounting (MACC) 0 0 0 25 24 49Computer Information SystemsInformation Systems (BBA) 14 72 86 0 0 0Information Systems (MS) 0 0 0 17 34 51Economics and FinanceEconomics (BBA) 5 12 17 0 0 0Economics (MA) 0 0 0 4 5 9Economics (PHD) 0 0 0 1 1 2Finance (BBA) 23 40 63 0 0 0ManagementBusiness Administration (BBA) 39 71 110 0 0 0
Back to Table of ContentsBack to Table of ContentsBack to Table of Contents

Female Male Total Female Male Total
Degrees Conferred by College Affiliation, Department & Gender2015-2016 Academic Year
College/DepartmentUndergraduate Graduate
Business Administration (MBA) 0 0 0 38 45 83Entrepreneurship (BBA) 14 11 25 0 0 0Management (BBA) 31 50 81 0 0 0Management (MS) 0 0 0 6 3 9Marketing (BBA) 10 11 21 0 0 0MarketingBusiness Education (BS) 2 6 8 0 0 0Business Education (MBE) 0 0 0 9 3 12Entrepreneurship (BBA) 1 5 6 0 0 0Marketing (BBA) 31 29 60 0 0 0Office Management (BBA) 5 1 6 0 0 0
Business Total 232 365 597 100 115 215EducationEducationLiteracy Studies (PHD) 0 0 0 3 0 3Educational LeadershipAdministration & Supervision (EDS) 0 0 0 11 1 12Administration & Supervision (MED) 0 0 0 31 10 41College & University Teaching (GCRT) 0 0 0 0 3 3Curriculum & Instruction, Educational Leadership (EDS)
0 0 0 5 0 5
Curriculum & Instruction, Educational Leadership (MED)
0 0 0 28 14 42
Professional Counseling (MED) 0 0 0 21 1 22Elementary and Special EdCurriculum & Instruction, Elementary Education (MED)
0 0 0 25 4 29
Early Childhood Education (BS) 31 2 33 0 0 0Interdisciplinary Studies (BS) 101 13 114 0 0 0Literacy (MED) 0 0 0 8 0 8Special Education (BS) 14 4 18 0 0 0Special Education (MED) 0 0 0 9 1 10
Education Total 146 19 165 141 34 175Liberal Arts
Speech & Theatre (BA) 0 1 1 0 0 0ArtArt (BFA) 29 12 41 0 0 0Art Education (BS) 6 1 7 0 0 0Art History (BA) 3 1 4 0 0 0Comm Studies & Org CommOrganizational Communication (BS) 81 26 107 0 0 0Speech & Theatre (BA) 1 0 1 0 0 0Speech & Theatre (BS) 1 0 1 0 0 0Economics and FinanceEconomics (BS) 4 11 15 0 0 0EnglishEnglish (BA) 53 16 69 0 0 0English (MA) 0 0 0 5 7 12
Back to Table of ContentsBack to Table of ContentsBack to Table of Contents
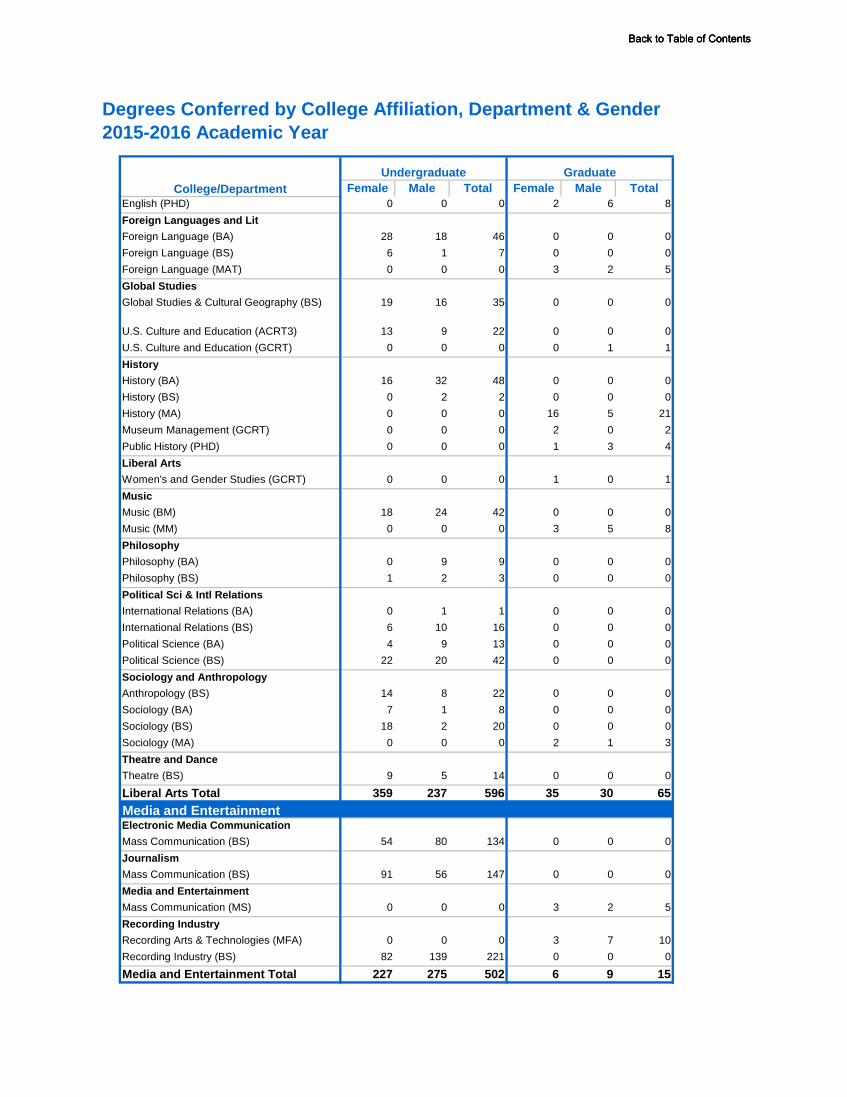
Female Male Total Female Male Total
Degrees Conferred by College Affiliation, Department & Gender2015-2016 Academic Year
College/DepartmentUndergraduate Graduate
English (PHD) 0 0 0 2 6 8Foreign Languages and LitForeign Language (BA) 28 18 46 0 0 0Foreign Language (BS) 6 1 7 0 0 0Foreign Language (MAT) 0 0 0 3 2 5Global StudiesGlobal Studies & Cultural Geography (BS) 19 16 35 0 0 0
U.S. Culture and Education (ACRT3) 13 9 22 0 0 0U.S. Culture and Education (GCRT) 0 0 0 0 1 1HistoryHistory (BA) 16 32 48 0 0 0History (BS) 0 2 2 0 0 0History (MA) 0 0 0 16 5 21Museum Management (GCRT) 0 0 0 2 0 2Public History (PHD) 0 0 0 1 3 4Liberal ArtsWomen's and Gender Studies (GCRT) 0 0 0 1 0 1MusicMusic (BM) 18 24 42 0 0 0Music (MM) 0 0 0 3 5 8PhilosophyPhilosophy (BA) 0 9 9 0 0 0Philosophy (BS) 1 2 3 0 0 0Political Sci & Intl RelationsInternational Relations (BA) 0 1 1 0 0 0International Relations (BS) 6 10 16 0 0 0Political Science (BA) 4 9 13 0 0 0Political Science (BS) 22 20 42 0 0 0Sociology and AnthropologyAnthropology (BS) 14 8 22 0 0 0Sociology (BA) 7 1 8 0 0 0Sociology (BS) 18 2 20 0 0 0Sociology (MA) 0 0 0 2 1 3Theatre and DanceTheatre (BS) 9 5 14 0 0 0
Liberal Arts Total 359 237 596 35 30 65Media and EntertainmentElectronic Media CommunicationMass Communication (BS) 54 80 134 0 0 0JournalismMass Communication (BS) 91 56 147 0 0 0Media and EntertainmentMass Communication (MS) 0 0 0 3 2 5Recording IndustryRecording Arts & Technologies (MFA) 0 0 0 3 7 10Recording Industry (BS) 82 139 221 0 0 0
Media and Entertainment Total 227 275 502 6 9 15
Back to Table of ContentsBack to Table of ContentsBack to Table of Contents

Female Male Total Female Male Total
Degrees Conferred by College Affiliation, Department & Gender2015-2016 Academic Year
College/DepartmentUndergraduate Graduate
University CollegeRegents Online Degree ProgramAdvanced Studies in Teaching & Learning (MED)
0 0 0 3 0 3
Family Nurse Practitioner (GCRT) 0 0 0 3 0 3Liberal Studies (BS) 206 187 393 0 0 0Nursing (MSN) 0 0 0 70 11 81Professional Studies (BS) 73 24 97 0 0 0Professional Studies (MPS) 0 0 0 7 2 9University StudiesIntegrated Studies (BS) 37 29 66 0 0 0
University College Total 316 240 556 83 13 96Grand Total 2,217 1,839 4,056 526 312 838
Back to Table of ContentsBack to Table of ContentsBack to Table of Contents

Alaskan Native
Male Female Male Female Male Female Male Female Male Female Male Female Male Female Male Female Male Female
Basic and Applied SciencesAerospace
Aerospace (BS) 0 0 0 0 3 2 12 1 2 7 87 0 0 0 2 0 0 10 116
Agribusiness and Agriscience
Agribusiness (BS) 0 0 0 0 0 1 1 0 0 16 15 0 0 1 0 0 0 18 34
Animal Science (BS) 0 0 0 0 0 1 0 2 0 38 11 0 0 1 0 0 0 42 53
Plant & Soil Science (BS) 0 0 0 0 0 0 0 0 0 3 12 0 0 0 0 0 0 3 15
Biology
Biology (BS) 0 0 1 6 2 11 6 3 2 47 32 0 0 1 2 0 0 68 113
Forensic Science (BS) 0 0 0 1 1 2 0 0 0 2 2 0 0 0 0 0 0 5 8
Chemistry
Biochemistry (BS) 0 0 1 2 1 3 2 1 2 15 11 0 0 0 0 0 0 21 38
Chemistry (BS) 0 0 0 0 2 0 0 2 1 5 6 0 0 0 0 0 0 7 16
Science (BS) 0 0 0 3 2 7 2 0 0 20 8 0 0 0 0 0 0 30 42
Computer Science
Computer Science (BS) 0 0 0 0 3 0 2 0 1 7 27 0 0 0 0 0 0 7 40
Concrete Industry Management
Concrete Industry Management (BS) 0 0 0 0 2 1 4 0 1 3 27 0 0 0 0 0 0 4 38
Engineering Technology
Construction Management (BS) 0 0 0 0 2 1 1 0 2 0 14 0 0 0 1 0 0 1 21
Engineering Technology (BS) 0 0 0 0 18 0 4 0 0 1 29 0 0 0 1 0 0 1 53
Environmental Science Technology (BS) 0 0 0 0 0 0 0 0 0 0 1 0 0 0 0 0 0 0 1
Environmental Sustainability & Technology (BS)
0 0 0 0 0 0 0 0 0 1 4 0 0 0 0 0 0 1 5
Mechatronics Engineering (BS) 0 0 0 0 1 0 1 0 0 0 12 0 0 0 0 0 0 0 14
Geosciences
Geoscience (BS) 0 0 0 0 0 1 0 0 0 5 14 0 0 0 0 0 0 6 20
Mathematical Sciences
Mathematics (BS) 0 0 0 0 1 1 0 0 0 10 12 1 0 0 0 0 0 12 25
Physics and Astronomy
Physics (BS) 0 0 0 0 0 0 0 0 1 3 5 0 0 0 1 0 0 3 10
Basic and Applied Sciences Total 0 0 2 12 38 31 35 9 12 183 329 1 0 3 7 0 0 239 662
Behavioral and Health Sciences
Criminal Justice
Undergraduate Degrees Conferred by College, Department, Race & Gender- 2015-2016 Academic Year
College/Department
American Indian Asian
Black or African
American Hispanic White
Native Hawaiian or Other Pacific
IslanderTwo or More
Races Not Specified Total Grand TotalMale
106
16
11
12
45
3
17
9
12
33
34
20
52
1
4
14
14
13
7
423
Back to Table of Contents

Alaskan
NativeMale Female Male Female Male Female Male Female Male Female Male Female Male Female Male Female Male Female
Basic and Applied SciencesAerospace
Aerospace (BS) 0 0 0 0 3 2 12 1 2 7 87 0 0 0 2 0 0 10 116
Agribusiness and Agriscience
Agribusiness (BS) 0 0 0 0 0 1 1 0 0 16 15 0 0 1 0 0 0 18 34
Animal Science (BS) 0 0 0 0 0 1 0 2 0 38 11 0 0 1 0 0 0 42 53
Plant & Soil Science (BS) 0 0 0 0 0 0 0 0 0 3 12 0 0 0 0 0 0 3 15
Biology
Biology (BS) 0 0 1 6 2 11 6 3 2 47 32 0 0 1 2 0 0 68 113
Forensic Science (BS) 0 0 0 1 1 2 0 0 0 2 2 0 0 0 0 0 0 5 8
Chemistry
Biochemistry (BS) 0 0 1 2 1 3 2 1 2 15 11 0 0 0 0 0 0 21 38
Chemistry (BS) 0 0 0 0 2 0 0 2 1 5 6 0 0 0 0 0 0 7 16
Science (BS) 0 0 0 3 2 7 2 0 0 20 8 0 0 0 0 0 0 30 42
Computer Science
Computer Science (BS) 0 0 0 0 3 0 2 0 1 7 27 0 0 0 0 0 0 7 40
Concrete Industry Management
Concrete Industry Management (BS) 0 0 0 0 2 1 4 0 1 3 27 0 0 0 0 0 0 4 38
Engineering Technology
Construction Management (BS) 0 0 0 0 2 1 1 0 2 0 14 0 0 0 1 0 0 1 21
Engineering Technology (BS) 0 0 0 0 18 0 4 0 0 1 29 0 0 0 1 0 0 1 53
Environmental Science Technology (BS) 0 0 0 0 0 0 0 0 0 0 1 0 0 0 0 0 0 0 1
Environmental Sustainability & Technology (BS)
0 0 0 0 0 0 0 0 0 1 4 0 0 0 0 0 0 1 5
Mechatronics Engineering (BS) 0 0 0 0 1 0 1 0 0 0 12 0 0 0 0 0 0 0 14
Geosciences
Geoscience (BS) 0 0 0 0 0 1 0 0 0 5 14 0 0 0 0 0 0 6 20
Mathematical Sciences
Mathematics (BS) 0 0 0 0 1 1 0 0 0 10 12 1 0 0 0 0 0 12 25
Physics and Astronomy
Physics (BS) 0 0 0 0 0 0 0 0 1 3 5 0 0 0 1 0 0 3 10
Basic and Applied Sciences Total 0 0 2 12 38 31 35 9 12 183 329 1 0 3 7 0 0 239 662
Behavioral and Health Sciences
Criminal Justice
13
7
423
1
4
14
14
33
34
20
52
3
17
9
12
16
11
12
45
Total Grand TotalMale
106
Undergraduate Degrees Conferred by College, Department, Race & Gender- 2015-2016 Academic Year
College/Department
American Indian Asian
Black or African
American Hispanic White
Native Hawaiian or Other Pacific
IslanderTwo or More
Races Not Specified
Back to Table of ContentsBack to Table of ContentsBack to Table of Contents

Alaskan
NativeMale Female Male Female Male Female Male Female Male Female Male Female Male Female Male Female Male Female
Total Grand TotalMale
Undergraduate Degrees Conferred by College, Department, Race & Gender- 2015-2016 Academic Year
College/Department
American Indian Asian
Black or African
American Hispanic White
Native Hawaiian or Other Pacific
IslanderTwo or More
Races Not Specified
Criminal Justice Administration (BS) 0 0 0 2 0 33 16 2 2 25 58 0 0 0 1 0 0 62 139
Health and Human Performance
Athletic Training (BS) 0 1 0 0 0 2 0 0 0 5 7 0 0 0 0 0 0 8 15
Community & Public Health (BS) 0 0 0 0 0 14 2 0 0 7 5 0 0 1 0 1 0 23 30
Exercise Science (BS) 0 0 0 0 0 20 17 1 4 32 38 0 0 1 0 0 0 54 113
Health Education (BS) 0 0 0 0 0 7 2 1 0 2 0 0 0 0 0 1 0 11 13
Leisure, Sport & Tourism Studies (BS) 0 0 0 0 0 1 5 0 1 11 16 0 0 1 0 0 0 13 35
Physical Education (BS) 0 0 0 0 0 1 7 0 0 0 3 0 0 0 0 0 0 1 11
Recreation & Leisure Services (BS) 0 0 0 0 0 1 0 0 0 1 0 0 0 0 0 0 0 2 2
Speech/Language Pathology & Audiology (BS)
0 0 0 1 0 4 0 1 0 20 0 0 0 0 0 0 0 26 26
Human Sciences
Family & Consumer Studies (BS) 0 0 0 1 0 12 0 3 0 37 2 0 0 0 0 0 0 53 55
Interior Design (BS) 0 0 0 0 0 2 0 0 1 4 0 0 0 0 0 0 0 6 7
Nutrition & Food Science (BS) 0 0 0 3 0 8 1 3 0 34 7 0 0 0 2 2 0 50 60
Textiles Merchandising Design (BS) 0 0 0 1 0 10 1 0 0 14 1 0 0 2 0 0 0 27 29
Nursing
Nursing (BSN) 0 0 0 1 0 12 1 3 1 93 21 0 0 6 1 0 0 115 139
Psychology
Industrial & Organizational Psychology (BS) 0 0 0 1 0 5 1 1 0 12 6 0 0 1 0 0 0 20 27
Psychology (BS) 0 1 0 0 0 37 6 7 1 103 31 0 0 5 1 0 0 153 192
Social Work
Social Work (BSW) 0 0 0 1 0 22 4 3 0 46 6 0 0 2 1 0 0 74 85
Behavioral and Health Sciences Total
0 2 0 11 0 191 63 25 10 446 201 0 0 19 6 4 0 698 978
BusinessAccounting
Accounting (BBA) 0 0 0 2 8 4 4 4 0 46 42 0 0 1 3 0 0 57 114
Computer Information Systems
Information Systems (BBA) 0 0 0 1 12 2 10 1 3 9 46 0 0 1 1 0 0 14 86
Economics and Finance
Economics (BBA) 0 0 0 0 0 1 3 0 0 3 8 0 0 1 1 0 0 5 17
Finance (BBA) 0 0 0 0 2 3 4 3 1 15 32 0 0 2 1 0 0 23 63
Management
Business Administration (BBA) 0 0 1 5 7 3 15 2 2 28 45 0 1 1 0 0 0 39 110
40
71
57
72
12
7
39
11
280
1
10
2
24
22
10
0
0
2
77
7
7
59
2
Back to Table of ContentsBack to Table of ContentsBack to Table of Contents

Alaskan
NativeMale Female Male Female Male Female Male Female Male Female Male Female Male Female Male Female Male Female
Total Grand TotalMale
Undergraduate Degrees Conferred by College, Department, Race & Gender- 2015-2016 Academic Year
College/Department
American Indian Asian
Black or African
American Hispanic White
Native Hawaiian or Other Pacific
IslanderTwo or More
Races Not Specified
Entrepreneurship (BBA) 0 0 0 0 0 6 3 1 1 6 7 0 0 1 0 0 0 14 25
Management (BBA) 0 0 0 2 4 4 10 1 1 22 35 0 0 2 0 0 0 31 81
Marketing (BBA) 0 0 0 1 1 0 1 0 0 8 9 0 0 1 0 0 0 10 21
Marketing
Business Education (BS) 0 0 0 0 0 0 2 0 0 2 4 0 0 0 0 0 0 2 8
Entrepreneurship (BBA) 0 0 0 0 0 1 1 0 0 0 4 0 0 0 0 0 0 1 6
Marketing (BBA) 0 0 0 2 1 4 5 1 3 23 19 0 0 1 0 0 1 31 60
Office Management (BBA) 0 0 0 0 0 0 0 0 0 5 1 0 0 0 0 0 0 5 6
Business Total 0 0 1 13 35 28 58 13 11 167 252 0 1 11 6 0 1 232 597EducationElementary and Special Ed
Early Childhood Education (BS) 0 0 0 0 0 6 0 0 0 24 2 0 0 1 0 0 0 31 33
Interdisciplinary Studies (BS) 0 0 0 1 0 7 2 4 1 87 10 0 0 1 0 1 0 101 114
Special Education (BS) 0 0 1 0 0 1 0 1 0 12 3 0 0 0 0 0 0 14 18
Education Total 0 0 1 1 0 14 2 5 1 123 15 0 0 2 0 1 0 146 165Liberal Arts
Speech & Theatre (BA) 0 0 0 0 0 0 0 0 0 0 0 0 0 0 1 0 0 0 1
Art
Art (BFA) 0 0 0 0 0 2 2 4 0 22 9 0 0 1 1 0 0 29 41
Art Education (BS) 0 0 0 1 0 0 0 0 0 5 1 0 0 0 0 0 0 6 7
Art History (BA) 0 0 0 0 0 1 0 0 1 2 0 0 0 0 0 0 0 3 4
Comm Studies & Org Comm
Organizational Communication (BS) 0 0 0 1 1 16 9 3 2 59 12 0 0 2 2 0 0 81 107
Speech & Theatre (BA) 0 0 0 0 0 0 0 0 0 1 0 0 0 0 0 0 0 1 1
Speech & Theatre (BS) 0 0 0 0 0 0 0 0 0 1 0 0 0 0 0 0 0 1 1
Economics and Finance
Economics (BS) 0 0 0 0 1 0 0 0 0 4 9 0 0 0 1 0 0 4 15
English
English (BA) 1 1 0 1 1 5 1 0 2 42 11 1 0 3 0 0 0 53 69
Foreign Languages and Lit
Foreign Language (BA) 0 0 0 1 0 3 3 5 1 18 14 0 0 1 0 0 0 28 46
Foreign Language (BS) 0 0 0 0 0 0 0 1 0 5 1 0 0 0 0 0 0 6 7
Global Studies
11
16
18
1
1
26
0
0
1
12
1
2
13
4
19
6
5
29
1
365
11
50
11
Back to Table of ContentsBack to Table of ContentsBack to Table of Contents
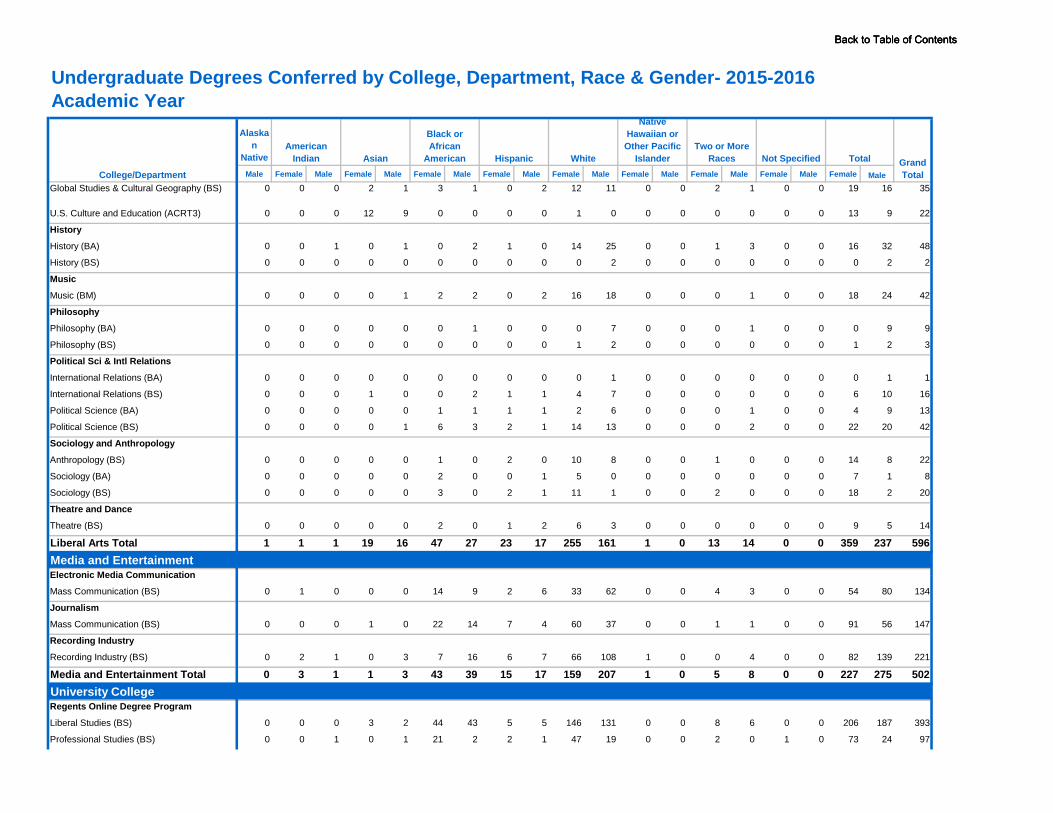
Alaskan
NativeMale Female Male Female Male Female Male Female Male Female Male Female Male Female Male Female Male Female
Total Grand TotalMale
Undergraduate Degrees Conferred by College, Department, Race & Gender- 2015-2016 Academic Year
College/Department
American Indian Asian
Black or African
American Hispanic White
Native Hawaiian or Other Pacific
IslanderTwo or More
Races Not Specified
Global Studies & Cultural Geography (BS) 0 0 0 2 1 3 1 0 2 12 11 0 0 2 1 0 0 19 35
U.S. Culture and Education (ACRT3) 0 0 0 12 9 0 0 0 0 1 0 0 0 0 0 0 0 13 22
History
History (BA) 0 0 1 0 1 0 2 1 0 14 25 0 0 1 3 0 0 16 48
History (BS) 0 0 0 0 0 0 0 0 0 0 2 0 0 0 0 0 0 0 2
Music
Music (BM) 0 0 0 0 1 2 2 0 2 16 18 0 0 0 1 0 0 18 42
Philosophy
Philosophy (BA) 0 0 0 0 0 0 1 0 0 0 7 0 0 0 1 0 0 0 9
Philosophy (BS) 0 0 0 0 0 0 0 0 0 1 2 0 0 0 0 0 0 1 3
Political Sci & Intl Relations
International Relations (BA) 0 0 0 0 0 0 0 0 0 0 1 0 0 0 0 0 0 0 1
International Relations (BS) 0 0 0 1 0 0 2 1 1 4 7 0 0 0 0 0 0 6 16
Political Science (BA) 0 0 0 0 0 1 1 1 1 2 6 0 0 0 1 0 0 4 13
Political Science (BS) 0 0 0 0 1 6 3 2 1 14 13 0 0 0 2 0 0 22 42
Sociology and Anthropology
Anthropology (BS) 0 0 0 0 0 1 0 2 0 10 8 0 0 1 0 0 0 14 22
Sociology (BA) 0 0 0 0 0 2 0 0 1 5 0 0 0 0 0 0 0 7 8
Sociology (BS) 0 0 0 0 0 3 0 2 1 11 1 0 0 2 0 0 0 18 20
Theatre and Dance
Theatre (BS) 0 0 0 0 0 2 0 1 2 6 3 0 0 0 0 0 0 9 14
Liberal Arts Total 1 1 1 19 16 47 27 23 17 255 161 1 0 13 14 0 0 359 596Media and EntertainmentElectronic Media Communication
Mass Communication (BS) 0 1 0 0 0 14 9 2 6 33 62 0 0 4 3 0 0 54 134
Journalism
Mass Communication (BS) 0 0 0 1 0 22 14 7 4 60 37 0 0 1 1 0 0 91 147
Recording Industry
Recording Industry (BS) 0 2 1 0 3 7 16 6 7 66 108 1 0 0 4 0 0 82 221
Media and Entertainment Total 0 3 1 1 3 43 39 15 17 159 207 1 0 5 8 0 0 227 502University CollegeRegents Online Degree Program
Liberal Studies (BS) 0 0 0 3 2 44 43 5 5 146 131 0 0 8 6 0 0 206 393
Professional Studies (BS) 0 0 1 0 1 21 2 2 1 47 19 0 0 2 0 1 0 73 97
275
187
24
80
56
139
1
2
5
237
1
10
9
20
8
24
9
2
16
9
32
2
Back to Table of ContentsBack to Table of ContentsBack to Table of Contents

Alaskan
NativeMale Female Male Female Male Female Male Female Male Female Male Female Male Female Male Female Male Female
Total Grand TotalMale
Undergraduate Degrees Conferred by College, Department, Race & Gender- 2015-2016 Academic Year
College/Department
American Indian Asian
Black or African
American Hispanic White
Native Hawaiian or Other Pacific
IslanderTwo or More
Races Not Specified
University Studies
Integrated Studies (BS) 0 0 1 0 0 11 8 2 0 23 20 0 0 1 0 0 0 37 66
University College Total 0 0 2 3 3 76 53 9 6 216 170 0 0 11 6 1 0 316 556Grand Total 1 6 8 60 95 430 277 99 74 1,549 1,335 3 1 64 47 6 1 2,217 4,056
29
2401,839
Back to Table of ContentsBack to Table of ContentsBack to Table of Contents

Alaskan Native
American Indian
Male Male Female Male Female Male Female Male Female Male Female Male Female Male
College of Graduate StudiesAccounting
Accounting (MACC) 1 0 4 2 1 4 0 0 19 16 1 1 25 24 49
Aerospace
Aviation Administration (MS) 0 0 1 1 0 3 0 0 0 5 0 0 1 9 10
Agribusiness and Agriscience
Horse Science (MS) 0 0 0 0 0 0 0 0 7 0 0 0 7 0 7
Basic and Applied Sciences
Computational Science (PHD) 0 0 0 1 0 0 0 0 0 0 0 0 0 1 1
Mathematics & Science Education (PHD) 0 0 0 0 0 0 0 0 4 3 0 0 4 3 7
Molecular Biosciences (PHD) 0 0 0 0 0 2 0 0 0 0 0 0 0 2 2
Professional Science (MS) 0 0 9 5 4 5 1 0 13 16 2 0 29 26 55
Biology
Biology (MS) 0 0 0 0 1 0 0 0 9 3 1 0 11 3 14
Chemistry
Chemistry (MS) 0 0 6 7 1 0 0 0 4 2 0 0 11 9 20
Computer Information Systems
Information Systems (MS) 0 0 7 10 2 3 1 2 7 19 0 0 17 34 51
Computer Science
Computer Science (MS) 0 0 0 5 0 0 0 0 1 3 0 0 1 8 9
Criminal Justice
Criminal Justice Administration (MCJ) 0 1 0 0 7 0 0 0 3 5 0 0 10 6 16
Economics and Finance
Economics (MA) 0 0 3 1 0 0 0 0 1 4 0 0 4 5 9
Economics (PHD) 0 0 0 1 0 0 0 0 1 0 0 0 1 1 2
Education
Literacy Studies (PHD) 0 0 0 0 1 0 0 0 2 0 0 0 3 0 3
Educational Leadership
Administration & Supervision (EDS) 0 0 0 0 2 0 0 0 8 1 1 0 11 1 12
Administration & Supervision (MED) 0 0 2 0 3 1 0 0 26 8 0 1 31 10 41
College & University Teaching (GCRT) 0 0 0 0 0 1 0 0 0 2 0 0 0 3 3
Curriculum & Instruction, Educational Leadership (EDS)
0 0 0 0 1 0 0 0 4 0 0 0 5 0 5
Curriculum & Instruction, Educational Leadership (MED)
0 0 3 5 4 1 3 1 18 6 0 1 28 14 42
Graduate Degrees Conferred by College, Department, Race & Gender 2015-2016 Academic Year
College/Department
Asian
Black or African
American Hispanic WhiteTwo Or More
Races Total Grand Total
Back to Table of Contents
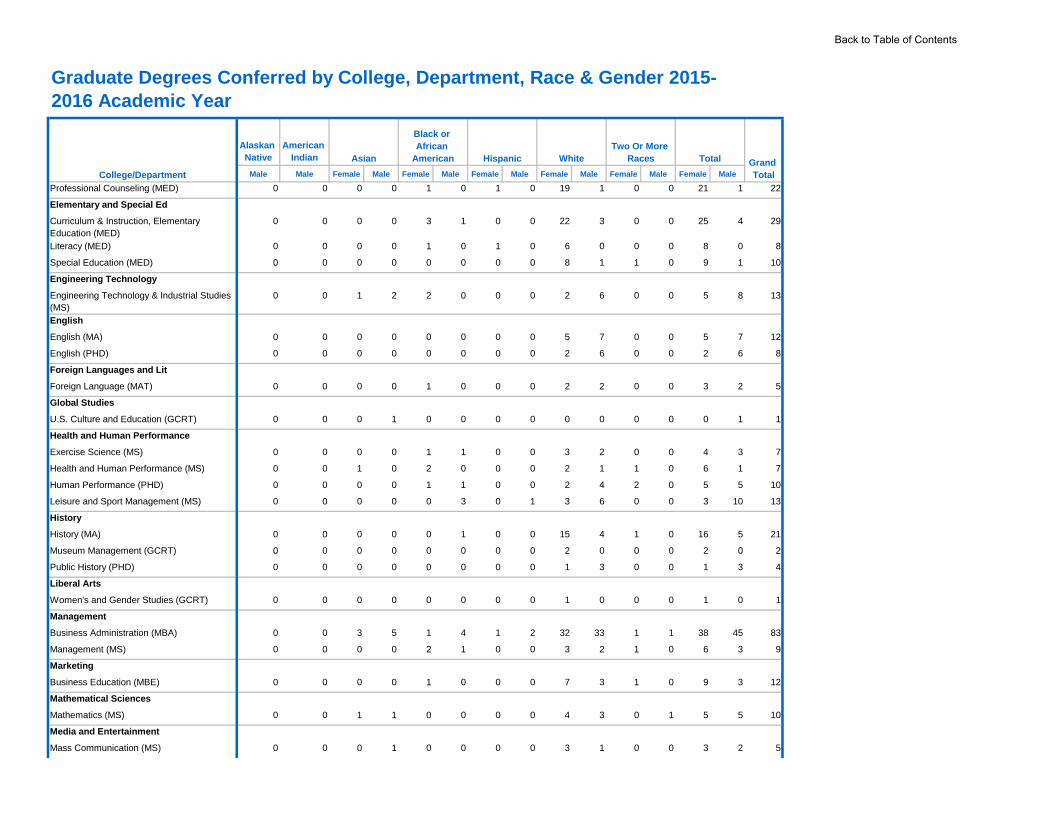
Alaskan Native
American Indian
Male Male Female Male Female Male Female Male Female Male Female Male Female Male
Graduate Degrees Conferred by College, Department, Race & Gender 2015-2016 Academic Year
College/Department
Asian
Black or African
American Hispanic WhiteTwo Or More
Races Total Grand Total
Professional Counseling (MED) 0 0 0 0 1 0 1 0 19 1 0 0 21 1 22
Elementary and Special Ed
Curriculum & Instruction, Elementary Education (MED)
0 0 0 0 3 1 0 0 22 3 0 0 25 4 29
Literacy (MED) 0 0 0 0 1 0 1 0 6 0 0 0 8 0 8
Special Education (MED) 0 0 0 0 0 0 0 0 8 1 1 0 9 1 10
Engineering Technology
Engineering Technology & Industrial Studies (MS)
0 0 1 2 2 0 0 0 2 6 0 0 5 8 13
English
English (MA) 0 0 0 0 0 0 0 0 5 7 0 0 5 7 12
English (PHD) 0 0 0 0 0 0 0 0 2 6 0 0 2 6 8
Foreign Languages and Lit
Foreign Language (MAT) 0 0 0 0 1 0 0 0 2 2 0 0 3 2 5
Global Studies
U.S. Culture and Education (GCRT) 0 0 0 1 0 0 0 0 0 0 0 0 0 1 1
Health and Human Performance
Exercise Science (MS) 0 0 0 0 1 1 0 0 3 2 0 0 4 3 7
Health and Human Performance (MS) 0 0 1 0 2 0 0 0 2 1 1 0 6 1 7
Human Performance (PHD) 0 0 0 0 1 1 0 0 2 4 2 0 5 5 10
Leisure and Sport Management (MS) 0 0 0 0 0 3 0 1 3 6 0 0 3 10 13
History
History (MA) 0 0 0 0 0 1 0 0 15 4 1 0 16 5 21
Museum Management (GCRT) 0 0 0 0 0 0 0 0 2 0 0 0 2 0 2
Public History (PHD) 0 0 0 0 0 0 0 0 1 3 0 0 1 3 4
Liberal Arts
Women's and Gender Studies (GCRT) 0 0 0 0 0 0 0 0 1 0 0 0 1 0 1
Management
Business Administration (MBA) 0 0 3 5 1 4 1 2 32 33 1 1 38 45 83
Management (MS) 0 0 0 0 2 1 0 0 3 2 1 0 6 3 9
Marketing
Business Education (MBE) 0 0 0 0 1 0 0 0 7 3 1 0 9 3 12
Mathematical Sciences
Mathematics (MS) 0 0 1 1 0 0 0 0 4 3 0 1 5 5 10
Media and Entertainment
Mass Communication (MS) 0 0 0 1 0 0 0 0 3 1 0 0 3 2 5
Back to Table of Contents

Alaskan Native
American Indian
Male Male Female Male Female Male Female Male Female Male Female Male Female Male
Graduate Degrees Conferred by College, Department, Race & Gender 2015-2016 Academic Year
College/Department
Asian
Black or African
American Hispanic WhiteTwo Or More
Races Total Grand Total
Music
Music (MM) 0 0 0 1 0 2 0 1 3 1 0 0 3 5 8
Psychology
Curriculum & Instruction, Psychology (EDS) 0 0 0 0 1 1 0 0 5 1 0 0 6 2 8
Psychology (MA) 0 0 1 0 0 2 0 0 23 7 0 0 24 9 33
Recording Industry
Recording Arts & Technologies (MFA) 0 0 1 0 1 2 0 1 1 4 0 0 3 7 10
Regents Online Degree Program
Advanced Studies in Teaching & Learning (MED)
0 0 0 0 0 0 0 0 3 0 0 0 3 0 3
Family Nurse Practitioner (GCRT) 0 0 0 0 2 0 0 0 1 0 0 0 3 0 3
Nursing (MSN) 0 0 2 0 6 1 1 1 61 9 0 0 70 11 81
Professional Studies (MPS) 0 0 0 0 1 0 0 0 6 2 0 0 7 2 9
Social Work
Social Work (MSW) 0 0 0 0 8 1 0 0 19 0 2 0 29 1 30
Sociology and Anthropology
Sociology (MA) 0 0 0 0 0 0 0 0 2 0 0 1 2 1 3
Basic and Applied Sciences Total 1 1 45 49 62 41 9 9 395 205 15 6 526 312 838
Grand Total 1 1 45 49 62 41 9 9 395 205 15 6 526 312 838
Back to Table of Contents

Office of Institutional Effectiveness, Planning and Research www.mtsu.edu/iepr/
RETENTION RATES & GRADUATION RATES2016 FACT BOOK
Official One-Year Retention Rates, MTSU Freshmen Cohorts: Fall Semesters 2004-2014 (Graph)
Official Freshmen Retention Rates, Tennessee Public Universities: Fall 2014 to Fall 2015 (Graph)
MTSU Official Six Year Graduation Rates, Fall Cohorts: 2004 through 2009 (Graph)
Official Six-Year Graduation Rates, Tennessee Public Universities: Fall 2009-2015 Fr. Cohorts (Graph)
Six-Year Graduation Rates, Fall 2009 First-Time Freshmen, who graduated through 2015-16 from any Tennessee Public
College or University
Back to Table of Contents

Data Source: Tennessee Higher Education Commission
Graph: MTSU Office of Institutional Effectiveness, Planning and Research
* Cohorts include summer first-time freshmen who enrolled in the fall plus fall first-time, full-time freshmen. Retention rates are based on students who enrolled the subsequentfall semester in any Tennessee public institution of higher education.
Official One-Year Retention Rates
Middle Tennessee State UniversityFreshman Cohorts: Fall Semesters 2004-2014*
81.7%80.9%
78.7%
80.0%
82.1% 82.3%
79.3%78.1%
76.3%
78.1%
79.8%
60.0%
62.0%
64.0%
66.0%
68.0%
70.0%
72.0%
74.0%
76.0%
78.0%
80.0%
82.0%
84.0%
2004-05 2005-06 2006-07 2007-08 2008-09 2009-10 2010-11 2011-12 2012-13 2013-14 2014-15
Back to Table of ContentsBack to Table of ContentsBack to Table of Contents
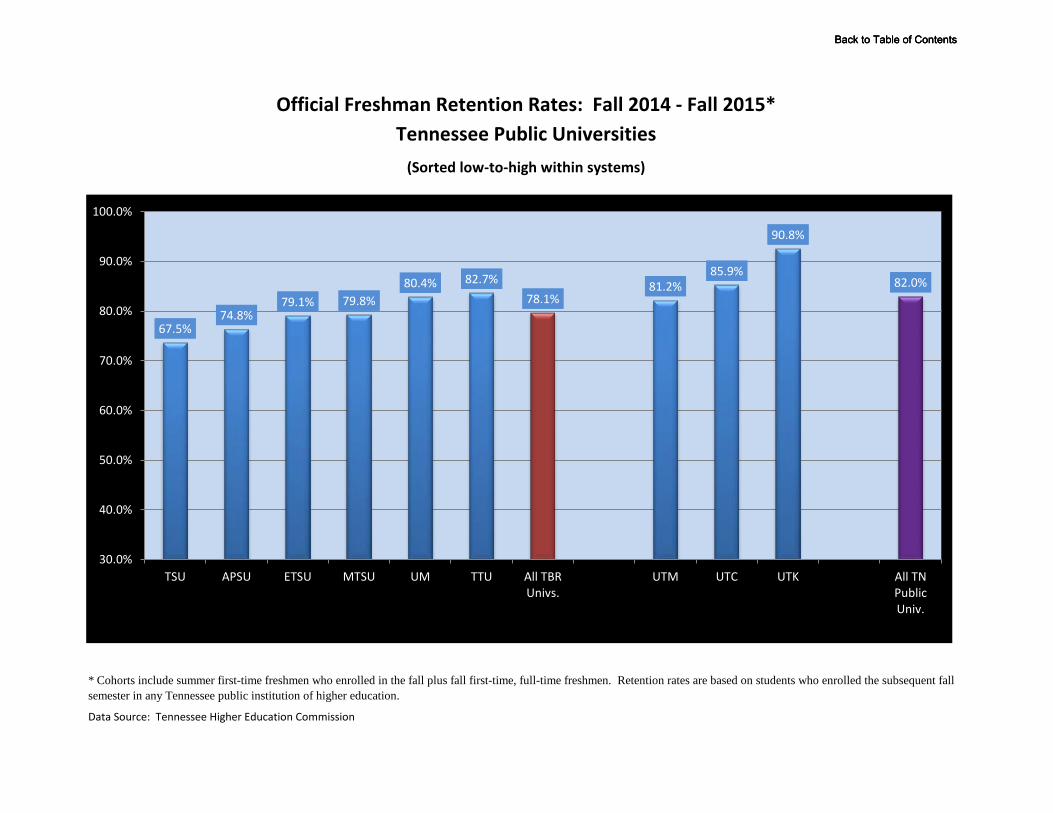
Data Source: Tennessee Higher Education Commission
Official Freshman Retention Rates: Fall 2014 - Fall 2015*Tennessee Public Universities
* Cohorts include summer first-time freshmen who enrolled in the fall plus fall first-time, full-time freshmen. Retention rates are based on students who enrolled the subsequent fallsemester in any Tennessee public institution of higher education.
(Sorted low-to-high within systems)
67.5%74.8%
79.1% 79.8%80.4% 82.7%
78.1%81.2%
85.9%
90.8%
82.0%
30.0%
40.0%
50.0%
60.0%
70.0%
80.0%
90.0%
100.0%
TSU APSU ETSU MTSU UM TTU All TBRUnivs.
UTM UTC UTK All TNPublicUniv.
Back to Table of ContentsBack to Table of ContentsBack to Table of Contents

Data Source: Tennessee Higher Education CommissionGraph: MTSU Office of Institutional Effectiveness, Planning and Research
Cohorts include summer first-time, full-time freshmen who returned for the fall semester, in addition to the fall first-time, full-time freshmen. Graduation rates reflect graduation from any Tennessee public institution within six years.
MTSU Official Six-Year Graduation RatesFall Cohorts 2004 through 2009
52.9% 52.7%51.6%
55.5%
52.1%51.1%
43.0%44.0%45.0%46.0%47.0%48.0%49.0%50.0%51.0%52.0%53.0%54.0%55.0%56.0%57.0%
2004-2010 2005-2011 2006-2012 2007-2013 2008-2014 2009-2015
Back to Table of ContentsBack to Table of ContentsBack to Table of Contents

Data Source: Tennessee Higher Education CommissionGraph: MTSU Office of Institutional Effectiveness, Planning and Research
Official Six-Year Graduation Rates: 2009-2015
Cohorts include summer first-time, full-time freshmen who returned for the fall semester, in addition to the fall first-time, full-time freshmen. Graduation rates reflect graduation from any Tennessee public institution within six years.
Tennessee Public UniversitiesFall 2009 Freshman Cohorts*
45.3%
52.2% 51.1%
34.2%
61.9%
49.3% 50.1%
59.8%
79.5%
58.1%
69.5%
57.2%
0.0%
10.0%
20.0%
30.0%
40.0%
50.0%
60.0%
70.0%
80.0%
90.0%
APSU ETSU MTSU TSU TTU UoM TBRUniv.
UTC UTK UTM UTUniv.
TotalUniv.
Back to Table of ContentsBack to Table of ContentsBack to Table of Contents

2015 - 2016 Tennessee Higher Education Fact Book 51
Six-year Graduation Rates by Institution
Fall 2009 Cohort
HeadcountOverall
Grad RateHeadcount Grad Rate
Percent
of Total
Grads
Headcount
Percent
of Total
Grads
Headcount
Percent
of Total
Grads
Headcount
Percent
of Total
Grads
Headcount
Percent
of Total
Grads
Headcount
Percent
of Total
Grads
TBR Community Colleges
Chattanooga State Community College 1,274 261 20.5% 207 16.2% 79.3% 215 82.4% 71 27.2% 12 4.6% 0 0.0% 15 5.7%
Cleveland State Community College 662 201 30.4% 159 24.0% 79.1% 171 85.1% 43 21.4% 28 13.9% 0 0.0% 8 4.0%
Columbia State Community College 851 274 32.2% 190 22.3% 69.3% 203 74.1% 88 32.1% 18 6.6% 0 0.0% 25 9.1%
Dyersburg State Community College 741 152 20.5% 114 15.4% 75.0% 122 80.3% 48 31.6% * 1.3% 0 0.0% 11 7.2%
Jackson State Community College 1,001 227 22.7% 153 15.3% 67.4% 158 69.6% 78 34.4% 14 6.2% 0 0.0% 12 5.3%
Motlow State Community College 1,098 358 32.6% 268 24.4% 74.9% 281 78.5% 152 42.5% 10 2.8% 0 0.0% 29 8.1%
Nashville State Community College 932 210 22.5% 142 15.2% 67.6% 150 71.4% 69 32.9% 15 7.1% 0 0.0% 9 4.3%
Northeast State Community College 1,201 348 29.0% 295 24.6% 84.8% 300 86.2% 109 31.3% 13 3.7% 0 0.0% 15 4.3%
Pellissippi State Community College 1,631 508 31.1% 370 22.7% 72.8% 385 75.8% 174 34.3% 34 6.7% 0 0.0% 22 4.3%
Roane State Community College 1,288 440 34.2% 331 25.7% 75.2% 352 80.0% 171 38.9% 26 5.9% 0 0.0% 11 2.5%
Southwest Tennessee Community College 2,063 265 12.8% 181 8.8% 68.3% 181 68.3% 98 37.0% * 1.5% 0 0.0% 17 6.4%
Volunteer State Community College 1,499 390 26.0% 275 18.3% 70.5% 279 71.5% 139 35.6% 32 8.2% 0 0.0% 42 10.8%
Walters State Community College 1,558 535 34.3% 426 27.3% 79.6% 443 82.8% 166 31.0% 48 9.0% 0 0.0% 17 3.2%
TBR Community College Total 15,799 4,169 26.4% 3,111 19.7% 74.6% 3,240 77.7% 1,406 33.7% 256 6.1% 0 0.0% 233 5.6%
TBR Universities
Austin Peay State University 1,465 663 45.3% 549 37.5% 82.8% 15 2.3% 599 90.3% * 1.4% 0 0.0% 48 7.2%
East Tennessee State University 2,033 1,061 52.2% 856 42.1% 80.7% 60 5.7% 923 87.0% 20 1.9% 0 0.0% 74 7.0%
Middle Tennessee State University 3,613 1,846 51.1% 1,573 43.5% 85.2% 68 3.7% 1,714 92.8% 17 0.9% 0 0.0% 62 3.4%
Tennessee State University 1,305 446 34.2% 352 27.0% 78.9% 7 1.6% 379 85.0% * 0.9% * 0.2% 56 12.6%
Tennessee Technological University 1,877 1161 61.9% 982 52.3% 84.6% 65 5.6% 1,062 91.5% 25 2.2% 0 0.0% 25 2.2%
University of Memphis 2,220 1,095 49.3% 977 44.0% 89.2% 22 2.0% 1,006 91.9% 11 1.0% 0 0.0% 60 5.5%
TBR University Total 12,513 6,272 50.1% 5,289 42.3% 84.3% 237 3.8% 5,683 90.6% 86 1.4% * 0.0% 325 5.2%
UT Universities
University of Tennessee at Chattanooga 2,189 1,309 59.8% 949 43.4% 72.5% 92 7.0% 1,167 89.2% 31 2.4% 0 0.0% 41 3.1%
University of Tennessee, Knoxville 3,698 2,940 79.5% 2,594 70.1% 88.2% 64 2.2% 2,754 93.7% 66 2.2% 0 0.0% 82 2.8%
University of Tennessee at Martin 1,372 797 58.1% 629 45.8% 78.9% 53 6.6% 705 88.5% 16 2.0% 0 0.0% 37 4.6%
UT University Total 7,259 5,046 69.5% 4,172 57.5% 82.7% 209 4.1% 4,626 91.7% 113 2.2% 0 0.0% 160 3.2%
University Total 19,772 11,318 57.2% 9,461 47.9% 83.6% 446 3.9% 10,309 91.1% 199 1.8% * 0.0% 485 4.3%
Grand Total 35,571 15,487 43.5% 12,572 35.3% 81.2% 3,686 23.8% 11,715 75.6% 455 2.9% * 0.0% 718 4.6%
Out-of-StateTwo-Year Four-Year TICUA Non-TICUA
Institution FTFTF
Total Grads Grads from Admitting InsitutionTN Public Institutions TN Private Institutions
Source: THEC SIS
Notes:
Total Grads were first-time, full-time freshmen (FTFTF) who enrolled summer of 2009 and returned that fall, or enrolled fall 2009 and graduated from either their admitting institution or
another institution by spring or summer of 2015. Graduates from the summer of 2015 were included along with traditionally reported spring graduates to align with IPEDS reporting.
The graduation rate for the Total Grads category is a distinct count of students and includes all in- and out-of-state graduates.
The graduation rate for the Grads from Admitting Institution category consists of students who began at their admitting institution and graduated from that same institution within six
years.
Graduates in the TN Public or TN Private Institutions columns may be duplicated; students graduated from either their admitting institution or another institution, or both their
admitting institution and another institution.
Back to Table of ContentsBack to Table of ContentsBack to Table of Contents

Office of Institutional Effectiveness, Planning and Research www.mtsu.edu/iepr/
STUDENT-RELATED INFORMATION 2016 FACT BOOK
Division of Student Affairs, Enrollment, and Academic Services Housing and Residential Life Student Financial Assistance Summary Athletics Public Safety
Back to Table of ContentsBack to Table of ContentsBack to Table of Contents

DIVISION OF STUDENT AFFAIRS, ENROLLMENT, AND ACADEMIC SERVICES
The Division of Student Affairs, Enrollment and Academic Services provides essential programs and services which support the matriculation, academic achievement, personal development, and quality of life of all students. Efficient enrollment services assist students in making effective transitions to the university environment. Educational partnerships and academic support programs promote student learning and help students integrate academic development and personal growth. Creation of meaningful campus traditions and an active, involved campus life encourages the development of student leadership, personal responsibility and accountability, and an inclusive and supportive learning community.
GOALS OF THE DIVISION
• Dedicated support services expand access in enrollment and support retention and academic success.
• Student centered learning opportunities promote leadership development, campus involvement, andthe creation of a supportive and inclusive learning community that is responsive to individualdifferences and representative of the diversity of MTSU’s population.
• Co-curricular programming supports student learning, creates an academically engaging community,and fosters a campus-wide commitment to learning.
• Effective management of state-of-the art facilities supports the integration of student academicsuccess and personal growth.
• Partnerships with students create opportunities to communicate and advocate for their issues andconcerns on the MTSU campus.
The division includes 27 offices which work together to realize the mission, vision, and goals of the division.
STUDENT AFFAIRS and ENROLLMENT AND ACADEMIC SERVICES Programs and departments reporting within the division of student affairs include a variety of areas related to services and facilities designed to enhance the quality of campus life for students, while promoting student learning and assisting students to become more effective in their academic pursuits.
Programs and departments related to Enrollment Services assist students as they apply for admission to the university, and continue to provide support in the areas of financial aid, records and scheduling throughout their time at MTSU.
The following departments report directly to the vice president, who is located in KUC 212 and can be reached at (615) 898-2440.
Student Athletic Enhancement Center Career Development Center Disability and Access CenterStudent Athlete Enhancement Center Student Support Services (TRIO) MTSU Charlie and Hazel Daniels Veteran's and Military Family Center
Back to Table of ContentsBack to Table of ContentsBack to Table of Contents
The following programs and departments report directly to the associate vice president for Student Affairs and dean of students, who is located in KUC 212 and can be reached at (615) 898-5342.
Campus Recreation Child Care Lab Counseling and Testing Dining Services Student Support Services (TRIO) Student Health Services
Housing and Residential Life New Student and Family Programs New Student Orientation (CUSTOMS) Judicial Affairs & Mediation Services Student Programming Student Union Facilities
The following departments report directly to the associate vice provost for admissions and enrollment services, who is located in SSAC 120 and can be reached at (615) 898-2239.
AdmissionsEnrollment Technical Systems Registrar and Scheduling
Financial Aid and Scholarships MT One Stop Undergraduate Recruitment
CENTER FOR STUDENT INVOLVEMENT AND LEADERSHIP (CSIL) The following programs and departments report to the assistant vice president for Student Affairs, who is located in Student Union 330 and can be reached at (615) 898-5812. These programs and departments provide students the opportunity for involvement, service to the community, and leadership development.
Fraternity and Sorority Life Intercultural and Diversity Affairs Student Government Association June Anderson Center for Women and Nontraditional Students Student Organizations and Service
Source: Division of Student Affairs, Enrollment and Academic Services
Back to Table of ContentsBack to Table of ContentsBack to Table of Contents

On-Campus Occupancy by Building - Fall 2016
Area/Building Occupancy CapacityPercent
OccupancyArea I: WEST SIDE OF CAMPUS
Women's Residences Lyon Complex Rutledge 53 55 96%
McHenry Hall 52 52 100%Mary Hall 29 29 100%
Monohan Complex Reynolds Hall 96 98 98%Schardt 62 65 95%
Men's Residences Lyon Complex Rutledge 29 31 94%
McHenry Hall 55 55 100%Mary 43 44 98%
Monohan Complex Reynolds Hall 45 47 96%Schardt 106 108 98%
Area II: MID-CAMPUS Judd Hall 92 95 97%Women's Residences Beasley Hall 87 90 97%
Smith Hall 72 73 99%
Gracy Hall 95 96 99%Men's Residences
Judd Hall 5 5 100%Smith Hall 59 59 100%Sims Hall 97 99 98%
Area III: HIGH RISE BUILDINGSWomen's Residences Corlew Hall 168 170 99%
Cummings Hall 179 181 99%
Men's Residences Corlew Hall 156 158 99%Cummings Hall 167 169 99%
Area IV: MID AND EAST SIDEWomen's Residences Deere Hall 120 121 99%
Nicks Hall 66 67 99%
Men's Residences Deere Hall 23 24 96%
Nicks Hall 73 74 99%Area V & VI: EAST SIDE
Men and Women's Residences - Scarlett CommonsApartment Styles Women's Residences 243 246 99%
Men's Residences 164 165 99%
Womack Lane Apartments (single students)Women's Residences 128 131 98%Men's Residences 123 126 98%
Family Student Housing Womack Lane Apartments (families)One Bedroom 4 4 100%Two Bedroom 10 10 100%
House 1 Women's Residences 20 23 87%House 2 Women's Residences 15 16 94%House 3 Women's Residences 15 22 68%House 4 Women's Residences 22 25 88%House 6 Women's Residences 11 13 85%House 7 Women's Residences 36 36 100%House 8 Women's Residences 23 24 96%
TOTAL Residences 2,843 2,906 98%
Source: MTSU Housing and Residential Life Office
On-Campus Occupancy by Area of Campus - Fall 2016
Housing and Residential Life
Area I20.0%
Area II17.0%
Area III24.0%
Area IV10.0%
Area V & VI29.0%
Back to Table of ContentsBack to Table of ContentsBack to Table of Contents

Academic Year 2015-2016
No. Awards Amount
Institutional/Foundation Aid 4,033 $10,837,345
Employment ProgramsFederal College Work Study Program 305 $496,480Institutional Student Work
Grant Programs Federal and state grant programs for undergraduate students (PELL, SEOG, TSAC) 9,090 $43,378,836Other grants to students (Federal ACG, Federal SMART, Federal Teach, TN Child 66 $165,030Welfare, GEAR UP Bridge Scholarship, McNair Scholarship, Noyce Physics-Mathematics Scholarship, Student Support Grant, and the STEM Scholarship)
Loan ProgramsFederally funded loans for students (includes Grad Plus, and excludes Parent 12,506 $89,003,564PLUS loan)
State Funded Academic ScholarshipsScholarships for academically talented students, disadvantaged students, 7,541 $28,365,472desegregation populations, including lottery funds
Externally Funded ScholarshipsAwarded by private sources to individual students 925 $1,801,165
Athletic ScholarshipsSupporting student athletes in men's and women's intercollegiate sports 404 $9,486,065
No. of Students Receiving Financial Aid (approximate) 18,982
TOTAL Amount of Financial Aid (approximate) $183,533,957
Source: MTSU Student Financial Aid Office
Student Financial Assistance Summary
Back to Table of ContentsBack to Table of ContentsBack to Table of Contents
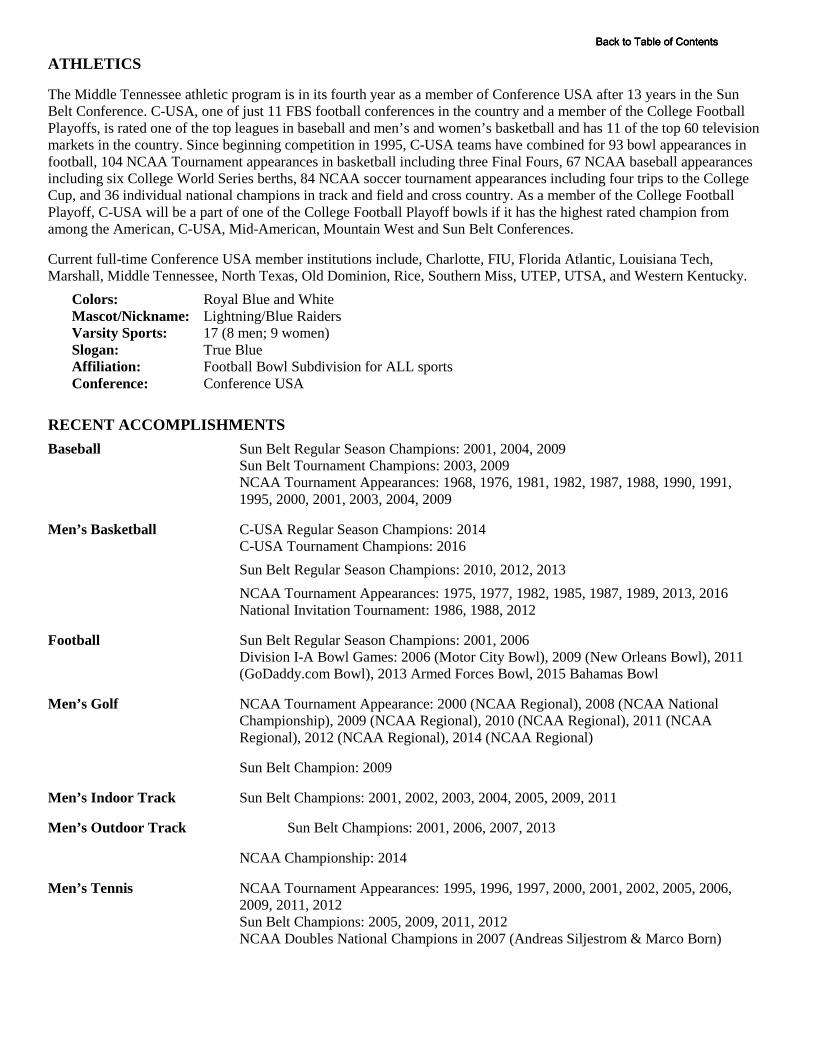
ATHLETICS
The Middle Tennessee athletic program is in its fourth year as a member of Conference USA after 13 years in the Sun Belt Conference. C-USA, one of just 11 FBS football conferences in the country and a member of the College Football Playoffs, is rated one of the top leagues in baseball and men’s and women’s basketball and has 11 of the top 60 television markets in the country. Since beginning competition in 1995, C-USA teams have combined for 93 bowl appearances in football, 104 NCAA Tournament appearances in basketball including three Final Fours, 67 NCAA baseball appearances including six College World Series berths, 84 NCAA soccer tournament appearances including four trips to the College Cup, and 36 individual national champions in track and field and cross country. As a member of the College Football Playoff, C-USA will be a part of one of the College Football Playoff bowls if it has the highest rated champion from among the American, C-USA, Mid-American, Mountain West and Sun Belt Conferences.
Current full-time Conference USA member institutions include, Charlotte, FIU, Florida Atlantic, Louisiana Tech, Marshall, Middle Tennessee, North Texas, Old Dominion, Rice, Southern Miss, UTEP, UTSA, and Western Kentucky.
Colors: Royal Blue and White Mascot/Nickname: Lightning/Blue Raiders Varsity Sports: 17 (8 men; 9 women) Slogan: True Blue Affiliation: Football Bowl Subdivision for ALL sports Conference: Conference USA
RECENT ACCOMPLISHMENTS Baseball Sun Belt Regular Season Champions: 2001, 2004, 2009
Sun Belt Tournament Champions: 2003, 2009 NCAA Tournament Appearances: 1968, 1976, 1981, 1982, 1987, 1988, 1990, 1991, 1995, 2000, 2001, 2003, 2004, 2009
Men’s Basketball C-USA Regular Season Champions: 2014 C-USA Tournament Champions: 2016 Sun Belt Regular Season Champions: 2010, 2012, 2013 NCAA Tournament Appearances: 1975, 1977, 1982, 1985, 1987, 1989, 2013, 2016 National Invitation Tournament: 1986, 1988, 2012
Football Sun Belt Regular Season Champions: 2001, 2006 Division I-A Bowl Games: 2006 (Motor City Bowl), 2009 (New Orleans Bowl), 2011 (GoDaddy.com Bowl), 2013 Armed Forces Bowl, 2015 Bahamas Bowl
Men’s Golf NCAA Tournament Appearance: 2000 (NCAA Regional), 2008 (NCAA National Championship), 2009 (NCAA Regional), 2010 (NCAA Regional), 2011 (NCAA Regional), 2012 (NCAA Regional), 2014 (NCAA Regional)
Sun Belt Champion: 2009
Men’s Indoor Track Sun Belt Champions: 2001, 2002, 2003, 2004, 2005, 2009, 2011
Men’s Outdoor Track Sun Belt Champions: 2001, 2006, 2007, 2013
NCAA Championship: 2014
Men’s Tennis NCAA Tournament Appearances: 1995, 1996, 1997, 2000, 2001, 2002, 2005, 2006, 2009, 2011, 2012 Sun Belt Champions: 2005, 2009, 2011, 2012 NCAA Doubles National Champions in 2007 (Andreas Siljestrom & Marco Born)
Back to Table of ContentsBack to Table of ContentsBack to Table of Contents

Women’s Basketball C-USA Regular Season Champions: 2014 C-USA Tournament Champions: 2014, 2016 Sun Belt Tournament Champions: 2004, 2005, 2006, 2007, 2009, 2010, 2013 NCAA Tournament Appearances: 1983, 1984, 1985, 1986, 1988, 1996, 1998, 2004, 2005, 2006, 2007, 2009, 2010, 2011, 2012, 2013, 2014, 2016 WNIT Appearances: 1999, 2001, 2008, 2015
Women’s Indoor Track Sun Belt Champions: 2001, 2002, 2003, 2004, 2012
Women’s Outdoor Track Sun Belt Champions: 2000, 2005
Men’s Cross Country Sun Belt Champions: 2009
Women’s Cross Country Conference USA Champions: 2014
Women’s Golf NCAA Regional Appearance: 2015, 2016
Conference USA Champions: 2015, 2016
Women’s Soccer Sun Belt Championships: 2004, 2012 Sun Belt Tournament Championships: 2010 NCAA Tournament Appearances: 2010
Women’s Softball NCAA Tournament Appearance: 2000
Women’s Tennis NCAA Tournament Appearance: 2000
Women’s Volleyball NCAA Tournament Appearances: 1995, 2006, 2007 (Sweet 16), 2008, 2009, 2010, 2011 Sun Belt Champions: 2006, 2007, 2008, 2009, 2010
ATHLETIC TEAMS AND HEAD COACHES Baseball – Jim McGuire Soccer (Women) - Aston Rhoden Basketball (Men) - Kermit Davis Basketball (Women) - Rick Insell Cross Country (Men & Women) – Keith Vroman Football – Rick Stockstill
Softball (Women) – Jeff Breeden Tennis (Men) – Jimmy Borendame Tennis (Women) – Charlie Ramsay Track (Men and Women) - Dean Hayes
Golf (Men) – Brennan Webb Volleyball (Women) – Jeff Huebner (interim)
Golf (Women) – Chris Adams
Source: MT Athletic Communications
Back to Table of ContentsBack to Table of ContentsBack to Table of Contents
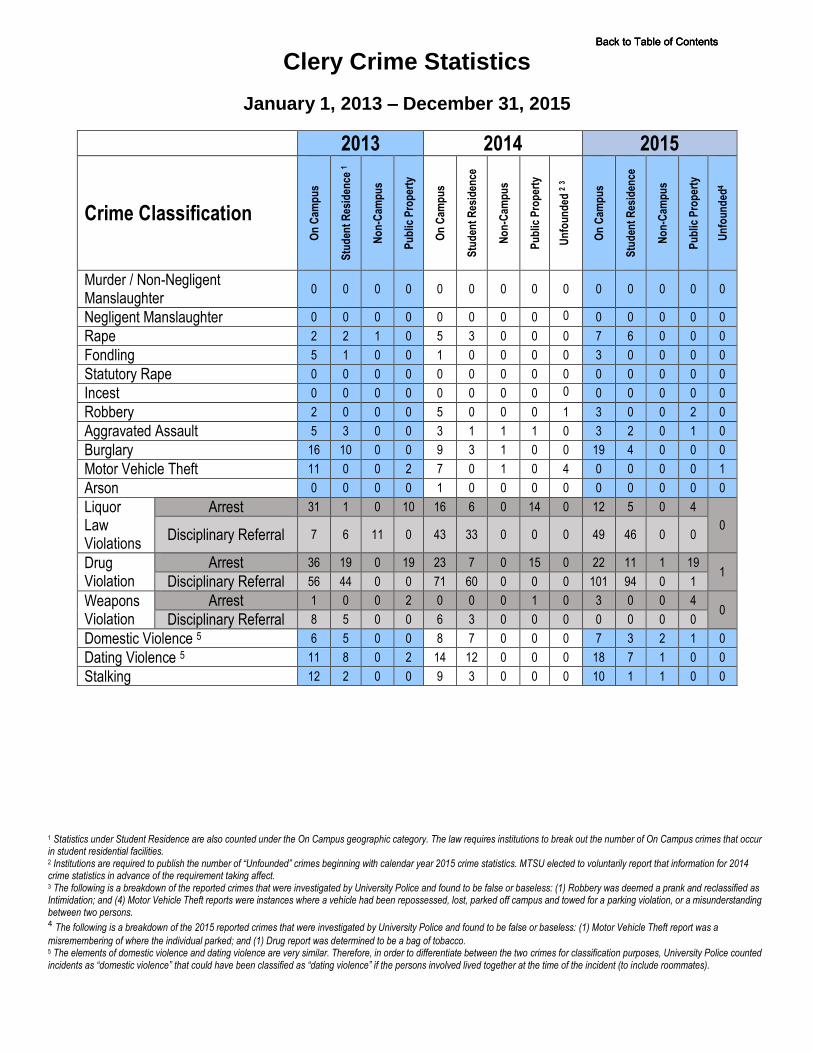
Clery Crime StatisticsJanuary 1, 2013 – December 31, 2015
2013 2014 2015
Crime Classification
On
Cam
pu
s
Stu
den
t R
esid
ence
1
No
n-C
amp
us
Pu
blic
Pro
per
ty
On
Cam
pu
s
Stu
den
t R
esid
ence
No
n-C
amp
us
Pu
blic
Pro
per
ty
Un
fou
nd
ed 2
3
On
Cam
pu
s
Stu
den
t R
esid
ence
No
n-C
amp
us
Pu
blic
Pro
per
ty
Un
fou
nd
ed4
Murder / Non-Negligent Manslaughter
0 0 0 0 0 0 0 0 0 0 0 0 0 0
Negligent Manslaughter 0 0 0 0 0 0 0 0 0 0 0 0 0 0
Rape 2 2 1 0 5 3 0 0 0 7 6 0 0 0
Fondling 5 1 0 0 1 0 0 0 0 3 0 0 0 0
Statutory Rape 0 0 0 0 0 0 0 0 0 0 0 0 0 0
Incest 0 0 0 0 0 0 0 0 0 0 0 0 0 0
Robbery 2 0 0 0 5 0 0 0 1 3 0 0 2 0
Aggravated Assault 5 3 0 0 3 1 1 1 0 3 2 0 1 0
Burglary 16 10 0 0 9 3 1 0 0 19 4 0 0 0
Motor Vehicle Theft 11 0 0 2 7 0 1 0 4 0 0 0 0 1
Arson 0 0 0 0 1 0 0 0 0 0 0 0 0 0
Liquor Law Violations
Arrest 31 1 0 10 16 6 0 14 0 12 5 0 4
0 Disciplinary Referral 7 6 11 0 43 33 0 0 0 49 46 0 0
Drug Violation
Arrest 36 19 0 19 23 7 0 15 0 22 11 1 19 1
Disciplinary Referral 56 44 0 0 71 60 0 0 0 101 94 0 1
Weapons Violation
Arrest 1 0 0 2 0 0 0 1 0 3 0 0 4 0
Disciplinary Referral 8 5 0 0 6 3 0 0 0 0 0 0 0
Domestic Violence 5 6 5 0 0 8 7 0 0 0 7 3 2 1 0
Dating Violence 5 11 8 0 2 14 12 0 0 0 18 7 1 0 0
Stalking 12 2 0 0 9 3 0 0 0 10 1 1 0 0
1 Statistics under Student Residence are also counted under the On Campus geographic category. The law requires institutions to break out the number of On Campus crimes that occur in student residential facilities. 2 Institutions are required to publish the number of “Unfounded” crimes beginning with calendar year 2015 crime statistics. MTSU elected to voluntarily report that information for 2014 crime statistics in advance of the requirement taking affect. 3 The following is a breakdown of the reported crimes that were investigated by University Police and found to be false or baseless: (1) Robbery was deemed a prank and reclassified as Intimidation; and (4) Motor Vehicle Theft reports were instances where a vehicle had been repossessed, lost, parked off campus and towed for a parking violation, or a misunderstanding between two persons. 4 The following is a breakdown of the 2015 reported crimes that were investigated by University Police and found to be false or baseless: (1) Motor Vehicle Theft report was a
misremembering of where the individual parked; and (1) Drug report was determined to be a bag of tobacco.5 The elements of domestic violence and dating violence are very similar. Therefore, in order to differentiate between the two crimes for classification purposes, University Police counted incidents as “domestic violence” that could have been classified as “dating violence” if the persons involved lived together at the time of the incident (to include roommates).
Back to Table of ContentsBack to Table of ContentsBack to Table of Contents

Office of Institutional Effectiveness, Planning and Research www.mtsu.edu/iepr/
FACULTY & STAFF INFORMATION 2016 FACT BOOK
Faculty Profile by Age, Rank, and Tenure – Fall 2016 Faculty Profile by Academic Department – Fall 2016 Faculty Awards Full-Time University Employees Part-Time University Employees
Back to Table of ContentsBack to Table of ContentsBack to Table of Contents

College/Unit by Age ProfessorAssociate Professor
Assistant Professor
Instructor Lecturer TenuredNon-Tenured
on TrackNot Eligible for Tenure
Total
Basic and Applied Sciences20-29 0 0 2 1 4 0 2 5 730-39 0 3 25 2 14 2 23 19 4440-49 13 20 5 1 11 33 5 12 5050-59 39 14 2 2 7 51 3 11 6560-69 27 12 4 0 2 37 2 5 4470+ 7 3 1 0 0 11 0 0 11
TOTAL 86 52 39 6 38 134 35 52 221Behavioral and Health Sciences
20-29 0 0 1 0 0 0 1 0 130-39 0 1 14 0 4 1 12 6 1940-49 9 8 11 2 12 18 6 18 4250-59 14 11 9 1 8 21 8 14 4360-69 22 11 1 0 1 32 2 1 3570+ 5 1 0 0 0 6 0 0 6
TOTAL 50 32 36 3 25 78 29 39 146Business
20-29 0 0 0 0 1 0 0 1 130-39 0 3 6 0 2 2 7 2 1140-49 3 12 4 0 3 14 5 3 2250-59 18 13 2 3 2 30 3 5 3860-69 21 7 1 1 6 28 1 7 3670+ 3 0 0 0 2 3 0 2 5
TOTAL 45 35 13 4 16 77 16 20 113Education
30-39 0 1 4 0 2 1 4 2 740-49 3 2 6 0 3 5 6 3 1450-59 2 2 3 0 1 4 3 1 860-69 10 3 2 0 2 14 1 2 1770+ 1 1 0 0 0 2 0 0 2
TOTAL 16 9 15 0 8 26 14 8 48Liberal Arts
20-29 0 0 1 0 3 0 1 3 430-39 0 6 26 1 37 5 27 38 7040-49 18 29 11 1 27 45 12 29 8650-59 35 19 1 3 17 54 1 20 7560-69 45 9 1 0 7 53 0 9 6270+ 5 0 0 0 2 5 0 2 7
TOTAL 103 63 40 5 93 162 41 101 304Media and Entertainment
30-39 0 2 3 0 1 2 3 1 640-49 3 5 9 0 3 7 10 3 2050-59 11 5 5 0 1 15 6 1 2260-69 11 3 4 0 1 13 5 1 1970+ 1 0 0 0 0 1 0 0 1
TOTAL 26 15 21 0 6 38 24 6 68University Studies
20-29 0 0 0 0 2 0 0 2 230-39 0 0 0 1 3 0 0 4 440-49 1 2 1 0 4 2 2 4 850-59 2 1 0 0 4 3 0 4 760-69 4 2 0 0 3 6 0 3 9
TOTAL 7 5 1 1 16 11 2 17 30University Honors College 0 0 0 0 0 0 0 0 0TOTAL 0 0 0 0 0 0 0 0 0Walker Library
30-39 0 1 3 0 0 1 3 0 440-49 1 7 3 0 0 8 3 0 1150-59 1 1 4 0 0 4 2 0 660-69 1 1 1 0 0 2 1 0 370+ 0 1 0 0 0 1 0 0 1
TOTAL 3 11 11 0 0 16 9 0 25UNIVERSITY TOTAL 336 222 176 19 202 542 170 243 955
Faculty Profile - Fall 2016
Full-Time Faculty by Age, Rank and Tenure
Back to Table of Contents

O I B H W T X M F D M O TE TT NE* Prof. Assoc. Asst. Inst. Lect.Basic and Applied Sciences
Aerospace 0 0 1 0 15 0 0 11 5 5 9 2 8 5 3 2 6 5 0 3 16Agribusiness and Agriscience 1 0 1 0 12 0 0 9 5 11 3 0 7 1 6 4 5 1 2 2 14Biology 2 0 2 1 35 0 3 28 15 40 3 0 31 5 7 23 7 7 1 5 43Chemistry 6 0 3 0 23 0 2 21 13 33 0 1 23 5 6 15 9 4 1 5 34Computer Science 7 0 0 0 6 0 1 8 6 14 0 0 10 4 0 9 1 4 0 0 14Concrete and Construction Management 2 0 0 0 6 0 0 7 1 4 4 0 4 0 4 2 4 2 0 0 8Engineering Technology 6 0 0 1 9 0 1 14 3 16 1 0 10 4 3 7 3 4 0 3 17Geosciences 0 0 1 1 9 1 1 9 4 10 3 0 7 3 3 4 3 3 0 3 13Mathematical Sciences 13 0 3 0 30 0 1 23 24 37 9 1 28 6 13 16 12 6 1 12 47Physics and Astronomy 1 0 0 0 11 0 3 11 4 14 1 0 6 2 7 4 2 3 1 5 15
TOTAL 38 0 11 3 156 1 12 141 80 184 33 4 134 35 52 86 52 39 6 38 221Behavioral and Health Sciences
Criminal Justice Administration 0 0 1 0 10 0 0 9 2 11 0 0 5 4 2 2 3 4 0 2 11Health and Human Performance 3 1 1 1 29 0 0 15 20 27 7 1 19 7 9 10 11 5 3 6 35Human Sciences 1 0 0 1 15 0 0 1 16 11 6 0 10 3 4 7 3 3 0 4 17Nursing 0 0 1 0 25 0 2 3 25 15 13 0 6 10 12 4 5 18 0 1 28Psychology 2 0 2 0 37 2 0 25 18 40 3 0 30 3 10 23 6 4 0 10 43Social Work 0 0 2 0 9 0 1 4 8 9 3 0 8 2 2 4 4 2 0 2 12
TOTAL 6 1 7 2 125 2 3 57 89 113 32 1 78 29 39 50 32 36 3 25 146Business
Accounting 0 0 0 0 22 0 1 9 14 18 5 0 12 5 6 7 6 4 2 4 23Computer Information Systems 3 0 1 0 14 0 1 13 6 17 2 0 15 1 3 6 9 1 0 3 19Economics and Finance 1 0 3 1 16 0 1 19 3 22 0 0 17 4 1 10 7 4 0 1 22Management 3 0 2 0 22 0 0 19 8 22 5 0 16 5 6 13 5 3 1 5 27Marketing 1 0 2 0 18 1 0 9 13 18 3 1 17 1 4 9 8 1 1 3 22
TOTAL 8 0 8 1 92 1 3 69 44 97 15 1 77 16 20 45 35 13 4 16 113Education
Elementary and Special Education 1 0 0 1 20 0 0 6 16 20 2 0 10 8 4 4 6 8 0 4 22 Womack Educational Leadership 0 0 3 1 20 0 2 11 15 23 3 0 16 6 4 12 3 7 0 4 26TOTAL 1 0 3 2 40 0 2 17 31 43 5 0 26 14 8 16 9 15 0 8 48Liberal Arts
Art 1 0 2 0 18 0 4 9 16 5 20 0 12 5 8 3 9 5 0 8 25Communication Studies and Org Comm. 2 0 2 0 21 0 3 6 22 15 13 0 7 5 16 3 4 5 0 16 28English 0 0 2 1 72 2 4 38 43 55 26 0 40 2 39 29 11 2 0 39 81Foreign Languages and Literatures 4 0 1 3 15 1 1 9 16 20 5 0 19 2 4 9 9 3 0 4 25History 1 0 5 3 30 0 8 26 21 46 1 0 21 8 18 15 8 8 1 15 47Music 3 0 4 1 23 0 5 25 11 26 10 0 25 5 6 19 7 4 1 5 36Philosophy 0 0 1 0 7 0 1 6 3 9 0 0 7 2 0 4 3 2 0 0 9Political Science and International Rel. 2 0 2 0 10 0 2 12 4 15 1 0 11 4 1 7 5 3 1 0 16Sociology and Anthropology 1 0 3 0 15 0 2 11 10 18 3 0 14 2 5 10 5 2 0 4 21Theatre and Dance 0 0 1 1 10 0 4 9 7 2 13 1 6 6 4 4 2 6 2 2 16
TOTAL 14 0 23 9 221 3 34 151 153 211 92 1 162 41 101 103 63 40 5 93 304Media and Entertainment
Electronic Media Communication 0 0 0 1 15 1 0 13 4 3 13 1 7 8 2 5 3 7 0 2 17 Journalism 2 0 1 0 19 0 0 10 12 15 5 2 13 6 3 6 8 5 0 3 22 Recording Industry 0 0 3 1 25 0 0 20 9 10 18 1 18 10 1 15 4 9 0 1 29TOTAL 2 0 4 2 59 1 0 43 25 28 36 4 38 24 6 26 15 21 0 6 68Walker Library
Collection Development and Mgmt. 0 0 1 0 8 1 0 3 7 3 7 0 6 4 0 2 4 4 0 0 10 User Services 0 0 1 0 14 0 0 4 11 1 14 0 10 5 0 1 7 7 0 0 15TOTAL 0 0 2 0 22 1 0 7 18 4 21 0 16 9 0 3 11 11 0 0 25University Studies 0 0 7 1 22 0 0 9 21 15 15 0 11 2 17 7 5 1 1 16 30University Honors College 0 0 0 0 0 0 0 0 0 0 0 0 0 0 0 0 0 0 0 0 0UNIVERSITY TOTAL 69 1 65 20 737 9 54 494 461 695 249 11 542 170 243 336 222 176 19 202 955
Ethnic Origin Gender Degree Tenure RankO Asian M Male D Doctorate TE Tenured Prof. ProfessorI American Indian F Female M Masters TT Non-Tenured on Track Assoc. Associate ProfessorB Black of African American O Other degrees NE Not Eligible for Tenure Asst. Assistant ProfessorH Hispanic includes Ed.S. Inst. InstructorW White Lect. LecturerT Two or More RacesX Not Specified
Excludes Military Science, post retirement and postdoctoral faculty; faculty on full reassignment, leave of absence, or sick leave.*Not Eligible for Tenure (NE) includes temporary appointments along with clinical track, coordinator track, and research track appointments.
Faculty Profile - Fall 2016
Academic DepartmentEthnic Origin Gender Degree Tenure Rank TOTAL
Back to Table of Contents

Faculty Awards—2015-2016
Career Achievement Award
The Career Achievement Award was created to recognize accomplishments in the areas of teaching, educational innovation, publications and research/creative activity, public service, University service, and service to the profession. The MTSU Foundation created this award in 2000.
Dr. Michael Hein, Psychology
Outstanding Teacher Award
The MTSU Foundation has funded the Outstanding Teacher Award for more than 30 years.
Dr. Mark Callender, Aerospace Dr. Helen Gray, Health and Human Performance Dr. Lisa Langenbach, Political Science and International Relations
Dr. Cliff Welborn, Management Dr. Andrew Wyatt, Sociology and Anthropology
Distinguished Research Award
The Distinguished Research Award recognizes scholarly activity that generates new knowledge, products, or applications. This includes empirical studies, analytical literature searches that result in substantial modification of existing explanations of events, and/or creation of scholarly works of expression or appreciation.
Dr. Nancy Goldberg, Foreign Languages and Literatures Dr. Philip Phillips, University Honors College
Outstanding Public Service Award
The Public Service Committee has defined public service as the term used to encompass activities that utilize the professional expertise of the University faculty in providing service to the community, state, region, or nation within the bounds of the University mission as executed by its departments.
Dr. Robert Blair, Marketing Dr. Terri Tharp, Elementary and Special Education
Ms. Tammy Bryant, University College
Creative Activity Award
The Creative Activity Award recognizes faculty contributions in areas such as dance, theatre, musical composition or performance, and the visual arts (including painting and sculpture) as well as in other fields or artistic endeavors. For the purpose of this award, creative achievement is defined as original, imaginative work of artistic merit as distinguished from empirical/analytical works of scholarly research.
Dr. Gaylord Brewer, English
Outstanding Achievement in Instructional Technology Award
The Outstanding Achievement in Instructional Technology Award is an annual award that recognizes faculty who do excellent work in their fields with the use of technology.
Mr. Charles Dahan, Recording Industry Dr. Anatoliy Volkov, Chemistry Ms. Tammy Donham, Recording Industry
Outstanding Achievement in General Education Award
The Outstanding Achievement in General Education recognizes outstanding teaching in General Education.
Dr. Jennifer Kates, English
Special Projects Award
The MTSU Foundation, grants funding for special projects pursued by full-time faculty members. The object of the award is to provide seed money for a project that brings acclaim to the University. The Special Projects Committee of the MTSU Foundation Board of Trustees reviews the applications and selects the winning project. The committee reserves the right to split the award between two projects.
Mr. John Merchant, Recording Industry Mr. Robert Gordon, Electronic Media Communication Dr. David E. Nelson, Chemistry
Source: MTSU Foundation
Back to Table of ContentsBack to Table of Contents
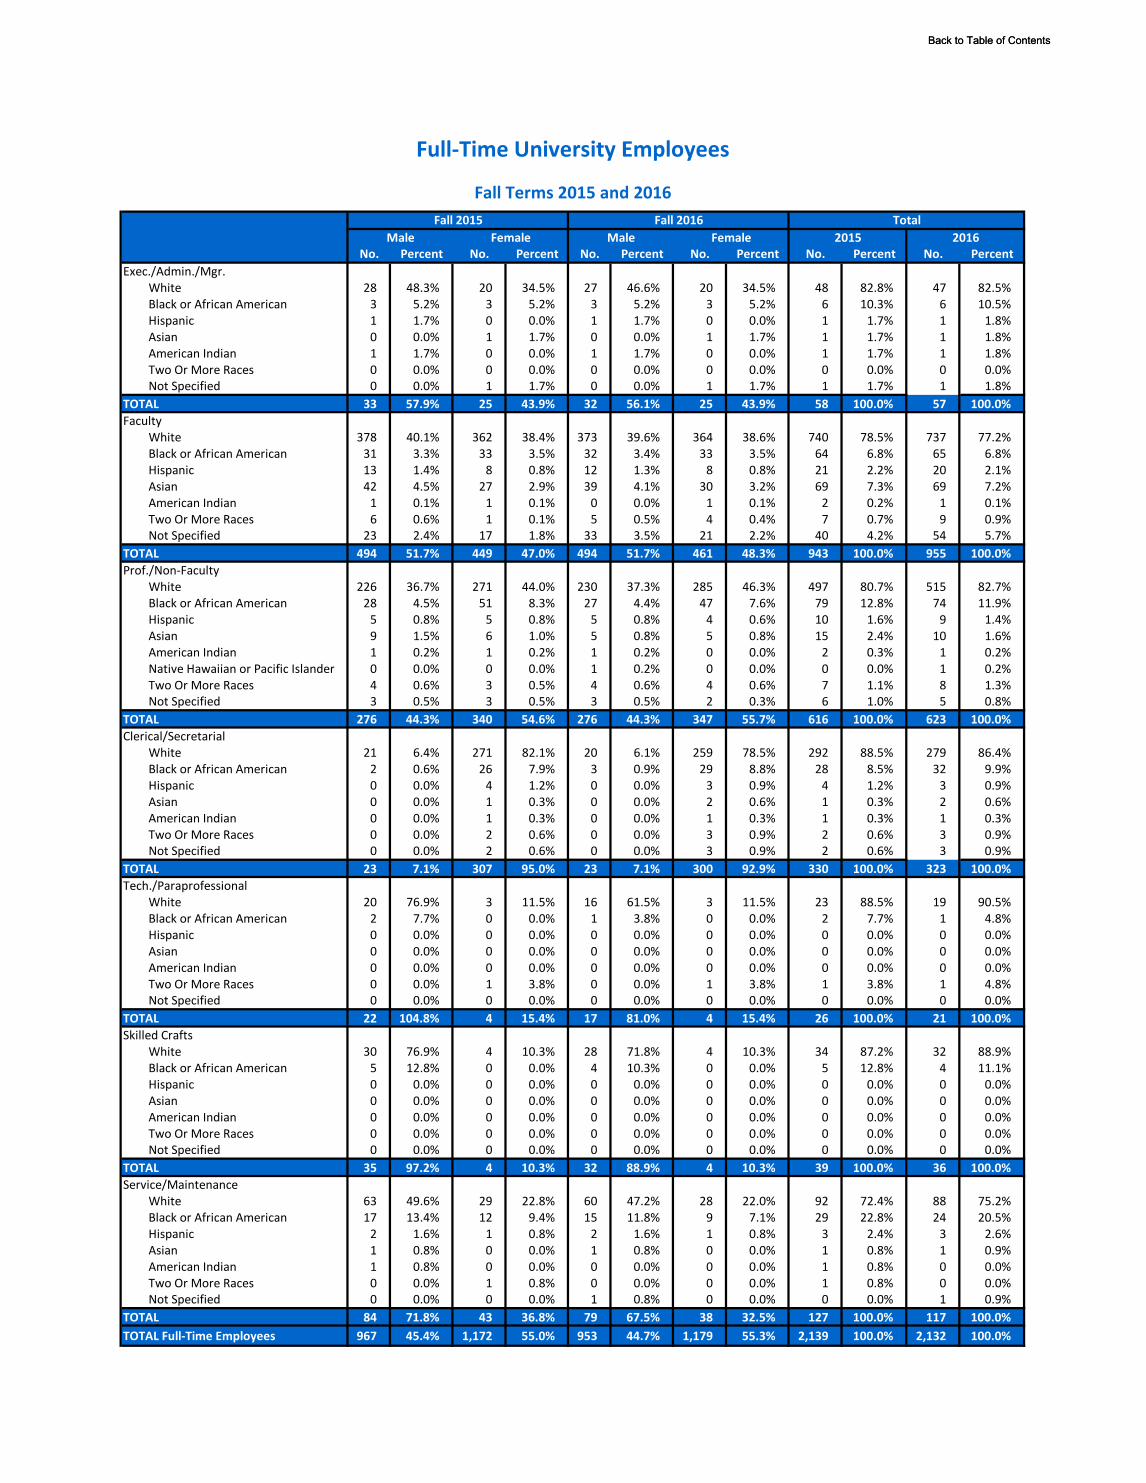
Fall Terms 2015 and 2016Fall 2015 Fall 2016 Total
Male Female Male Female 2015 2016No. Percent No. Percent No. Percent No. Percent No. Percent No. Percent
Exec./Admin./Mgr.White 28 48.3% 20 34.5% 27 46.6% 20 34.5% 48 82.8% 47 82.5%Black or African American 3 5.2% 3 5.2% 3 5.2% 3 5.2% 6 10.3% 6 10.5%Hispanic 1 1.7% 0 0.0% 1 1.7% 0 0.0% 1 1.7% 1 1.8%Asian 0 0.0% 1 1.7% 0 0.0% 1 1.7% 1 1.7% 1 1.8%American Indian 1 1.7% 0 0.0% 1 1.7% 0 0.0% 1 1.7% 1 1.8%Two Or More Races 0 0.0% 0 0.0% 0 0.0% 0 0.0% 0 0.0% 0 0.0%Not Specified 0 0.0% 1 1.7% 0 0.0% 1 1.7% 1 1.7% 1 1.8%
TOTAL 33 57.9% 25 43.9% 32 56.1% 25 43.9% 58 100.0% 57 100.0%Faculty
White 378 40.1% 362 38.4% 373 39.6% 364 38.6% 740 78.5% 737 77.2%Black or African American 31 3.3% 33 3.5% 32 3.4% 33 3.5% 64 6.8% 65 6.8%Hispanic 13 1.4% 8 0.8% 12 1.3% 8 0.8% 21 2.2% 20 2.1%Asian 42 4.5% 27 2.9% 39 4.1% 30 3.2% 69 7.3% 69 7.2%American Indian 1 0.1% 1 0.1% 0 0.0% 1 0.1% 2 0.2% 1 0.1%Two Or More Races 6 0.6% 1 0.1% 5 0.5% 4 0.4% 7 0.7% 9 0.9%Not Specified 23 2.4% 17 1.8% 33 3.5% 21 2.2% 40 4.2% 54 5.7%
TOTAL 494 51.7% 449 47.0% 494 51.7% 461 48.3% 943 100.0% 955 100.0%Prof./Non-Faculty
White 226 36.7% 271 44.0% 230 37.3% 285 46.3% 497 80.7% 515 82.7%Black or African American 28 4.5% 51 8.3% 27 4.4% 47 7.6% 79 12.8% 74 11.9%Hispanic 5 0.8% 5 0.8% 5 0.8% 4 0.6% 10 1.6% 9 1.4%Asian 9 1.5% 6 1.0% 5 0.8% 5 0.8% 15 2.4% 10 1.6%American Indian 1 0.2% 1 0.2% 1 0.2% 0 0.0% 2 0.3% 1 0.2%Native Hawaiian or Pacific Islander 0 0.0% 0 0.0% 1 0.2% 0 0.0% 0 0.0% 1 0.2%Two Or More Races 4 0.6% 3 0.5% 4 0.6% 4 0.6% 7 1.1% 8 1.3%Not Specified 3 0.5% 3 0.5% 3 0.5% 2 0.3% 6 1.0% 5 0.8%
TOTAL 276 44.3% 340 54.6% 276 44.3% 347 55.7% 616 100.0% 623 100.0%Clerical/Secretarial
White 21 6.4% 271 82.1% 20 6.1% 259 78.5% 292 88.5% 279 86.4%Black or African American 2 0.6% 26 7.9% 3 0.9% 29 8.8% 28 8.5% 32 9.9%Hispanic 0 0.0% 4 1.2% 0 0.0% 3 0.9% 4 1.2% 3 0.9%Asian 0 0.0% 1 0.3% 0 0.0% 2 0.6% 1 0.3% 2 0.6%American Indian 0 0.0% 1 0.3% 0 0.0% 1 0.3% 1 0.3% 1 0.3%Two Or More Races 0 0.0% 2 0.6% 0 0.0% 3 0.9% 2 0.6% 3 0.9%Not Specified 0 0.0% 2 0.6% 0 0.0% 3 0.9% 2 0.6% 3 0.9%
TOTAL 23 7.1% 307 95.0% 23 7.1% 300 92.9% 330 100.0% 323 100.0%Tech./Paraprofessional
White 20 76.9% 3 11.5% 16 61.5% 3 11.5% 23 88.5% 19 90.5%Black or African American 2 7.7% 0 0.0% 1 3.8% 0 0.0% 2 7.7% 1 4.8%Hispanic 0 0.0% 0 0.0% 0 0.0% 0 0.0% 0 0.0% 0 0.0%Asian 0 0.0% 0 0.0% 0 0.0% 0 0.0% 0 0.0% 0 0.0%American Indian 0 0.0% 0 0.0% 0 0.0% 0 0.0% 0 0.0% 0 0.0%Two Or More Races 0 0.0% 1 3.8% 0 0.0% 1 3.8% 1 3.8% 1 4.8%Not Specified 0 0.0% 0 0.0% 0 0.0% 0 0.0% 0 0.0% 0 0.0%
TOTAL 22 104.8% 4 15.4% 17 81.0% 4 15.4% 26 100.0% 21 100.0%Skilled Crafts
White 30 76.9% 4 10.3% 28 71.8% 4 10.3% 34 87.2% 32 88.9%Black or African American 5 12.8% 0 0.0% 4 10.3% 0 0.0% 5 12.8% 4 11.1%Hispanic 0 0.0% 0 0.0% 0 0.0% 0 0.0% 0 0.0% 0 0.0%Asian 0 0.0% 0 0.0% 0 0.0% 0 0.0% 0 0.0% 0 0.0%American Indian 0 0.0% 0 0.0% 0 0.0% 0 0.0% 0 0.0% 0 0.0%Two Or More Races 0 0.0% 0 0.0% 0 0.0% 0 0.0% 0 0.0% 0 0.0%Not Specified 0 0.0% 0 0.0% 0 0.0% 0 0.0% 0 0.0% 0 0.0%
TOTAL 35 97.2% 4 10.3% 32 88.9% 4 10.3% 39 100.0% 36 100.0%Service/Maintenance
White 63 49.6% 29 22.8% 60 47.2% 28 22.0% 92 72.4% 88 75.2%Black or African American 17 13.4% 12 9.4% 15 11.8% 9 7.1% 29 22.8% 24 20.5%Hispanic 2 1.6% 1 0.8% 2 1.6% 1 0.8% 3 2.4% 3 2.6%Asian 1 0.8% 0 0.0% 1 0.8% 0 0.0% 1 0.8% 1 0.9%American Indian 1 0.8% 0 0.0% 0 0.0% 0 0.0% 1 0.8% 0 0.0%Two Or More Races 0 0.0% 1 0.8% 0 0.0% 0 0.0% 1 0.8% 0 0.0%Not Specified 0 0.0% 0 0.0% 1 0.8% 0 0.0% 0 0.0% 1 0.9%
TOTAL 84 71.8% 43 36.8% 79 67.5% 38 32.5% 127 100.0% 117 100.0%TOTAL Full-Time Employees 967 45.4% 1,172 55.0% 953 44.7% 1,179 55.3% 2,139 100.0% 2,132 100.0%
Full-Time University Employees
Back to Table of ContentsBack to Table of Contents
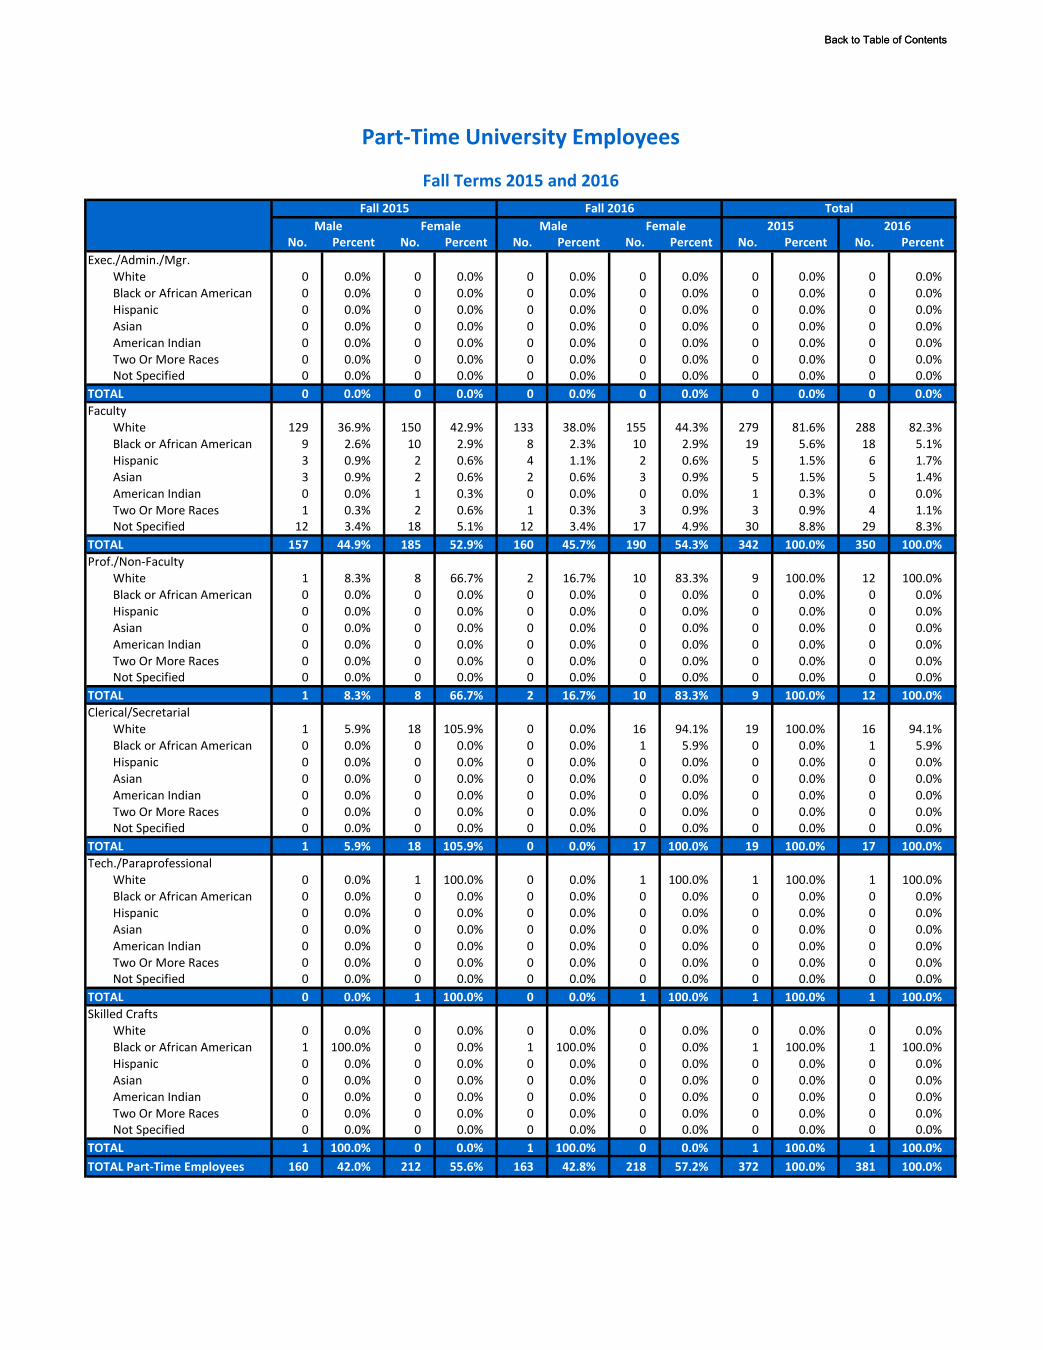
Fall Terms 2015 and 2016Fall 2015 Fall 2016 Total
Male Female Male Female 2015 2016No. Percent No. Percent No. Percent No. Percent No. Percent No. Percent
Exec./Admin./Mgr.White 0 0.0% 0 0.0% 0 0.0% 0 0.0% 0 0.0% 0 0.0%Black or African American 0 0.0% 0 0.0% 0 0.0% 0 0.0% 0 0.0% 0 0.0%Hispanic 0 0.0% 0 0.0% 0 0.0% 0 0.0% 0 0.0% 0 0.0%Asian 0 0.0% 0 0.0% 0 0.0% 0 0.0% 0 0.0% 0 0.0%American Indian 0 0.0% 0 0.0% 0 0.0% 0 0.0% 0 0.0% 0 0.0%Two Or More Races 0 0.0% 0 0.0% 0 0.0% 0 0.0% 0 0.0% 0 0.0%Not Specified 0 0.0% 0 0.0% 0 0.0% 0 0.0% 0 0.0% 0 0.0%
TOTAL 0 0.0% 0 0.0% 0 0.0% 0 0.0% 0 0.0% 0 0.0%Faculty
White 129 36.9% 150 42.9% 133 38.0% 155 44.3% 279 81.6% 288 82.3%Black or African American 9 2.6% 10 2.9% 8 2.3% 10 2.9% 19 5.6% 18 5.1%Hispanic 3 0.9% 2 0.6% 4 1.1% 2 0.6% 5 1.5% 6 1.7%Asian 3 0.9% 2 0.6% 2 0.6% 3 0.9% 5 1.5% 5 1.4%American Indian 0 0.0% 1 0.3% 0 0.0% 0 0.0% 1 0.3% 0 0.0%Two Or More Races 1 0.3% 2 0.6% 1 0.3% 3 0.9% 3 0.9% 4 1.1%Not Specified 12 3.4% 18 5.1% 12 3.4% 17 4.9% 30 8.8% 29 8.3%
TOTAL 157 44.9% 185 52.9% 160 45.7% 190 54.3% 342 100.0% 350 100.0%Prof./Non-Faculty
White 1 8.3% 8 66.7% 2 16.7% 10 83.3% 9 100.0% 12 100.0%Black or African American 0 0.0% 0 0.0% 0 0.0% 0 0.0% 0 0.0% 0 0.0%Hispanic 0 0.0% 0 0.0% 0 0.0% 0 0.0% 0 0.0% 0 0.0%Asian 0 0.0% 0 0.0% 0 0.0% 0 0.0% 0 0.0% 0 0.0%American Indian 0 0.0% 0 0.0% 0 0.0% 0 0.0% 0 0.0% 0 0.0%Two Or More Races 0 0.0% 0 0.0% 0 0.0% 0 0.0% 0 0.0% 0 0.0%Not Specified 0 0.0% 0 0.0% 0 0.0% 0 0.0% 0 0.0% 0 0.0%
TOTAL 1 8.3% 8 66.7% 2 16.7% 10 83.3% 9 100.0% 12 100.0%Clerical/Secretarial
White 1 5.9% 18 105.9% 0 0.0% 16 94.1% 19 100.0% 16 94.1%Black or African American 0 0.0% 0 0.0% 0 0.0% 1 5.9% 0 0.0% 1 5.9%Hispanic 0 0.0% 0 0.0% 0 0.0% 0 0.0% 0 0.0% 0 0.0%Asian 0 0.0% 0 0.0% 0 0.0% 0 0.0% 0 0.0% 0 0.0%American Indian 0 0.0% 0 0.0% 0 0.0% 0 0.0% 0 0.0% 0 0.0%Two Or More Races 0 0.0% 0 0.0% 0 0.0% 0 0.0% 0 0.0% 0 0.0%Not Specified 0 0.0% 0 0.0% 0 0.0% 0 0.0% 0 0.0% 0 0.0%
TOTAL 1 5.9% 18 105.9% 0 0.0% 17 100.0% 19 100.0% 17 100.0%Tech./Paraprofessional
White 0 0.0% 1 100.0% 0 0.0% 1 100.0% 1 100.0% 1 100.0%Black or African American 0 0.0% 0 0.0% 0 0.0% 0 0.0% 0 0.0% 0 0.0%Hispanic 0 0.0% 0 0.0% 0 0.0% 0 0.0% 0 0.0% 0 0.0%Asian 0 0.0% 0 0.0% 0 0.0% 0 0.0% 0 0.0% 0 0.0%American Indian 0 0.0% 0 0.0% 0 0.0% 0 0.0% 0 0.0% 0 0.0%Two Or More Races 0 0.0% 0 0.0% 0 0.0% 0 0.0% 0 0.0% 0 0.0%Not Specified 0 0.0% 0 0.0% 0 0.0% 0 0.0% 0 0.0% 0 0.0%
TOTAL 0 0.0% 1 100.0% 0 0.0% 1 100.0% 1 100.0% 1 100.0%Skilled Crafts
White 0 0.0% 0 0.0% 0 0.0% 0 0.0% 0 0.0% 0 0.0%Black or African American 1 100.0% 0 0.0% 1 100.0% 0 0.0% 1 100.0% 1 100.0%Hispanic 0 0.0% 0 0.0% 0 0.0% 0 0.0% 0 0.0% 0 0.0%Asian 0 0.0% 0 0.0% 0 0.0% 0 0.0% 0 0.0% 0 0.0%American Indian 0 0.0% 0 0.0% 0 0.0% 0 0.0% 0 0.0% 0 0.0%Two Or More Races 0 0.0% 0 0.0% 0 0.0% 0 0.0% 0 0.0% 0 0.0%Not Specified 0 0.0% 0 0.0% 0 0.0% 0 0.0% 0 0.0% 0 0.0%
TOTAL 1 100.0% 0 0.0% 1 100.0% 0 0.0% 1 100.0% 1 100.0%TOTAL Part-Time Employees 160 42.0% 212 55.6% 163 42.8% 218 57.2% 372 100.0% 381 100.0%
Part-Time University Employees
Back to Table of ContentsBack to Table of Contents

Office of Institutional Effectiveness, Planning and Research www.mtsu.edu/iepr/
ALUMNI RELATIONS 2016 FACT BOOK
Alumni Association 2015-2016 MTSU Alumni Distribution by Tennessee County MTSU Alumni in Tennessee (Map) MTSU Alumni Distribution by State MTSU Alumni in the United States (Map)
Back to Table of ContentsBack to Table of ContentsBack to Table of Contents
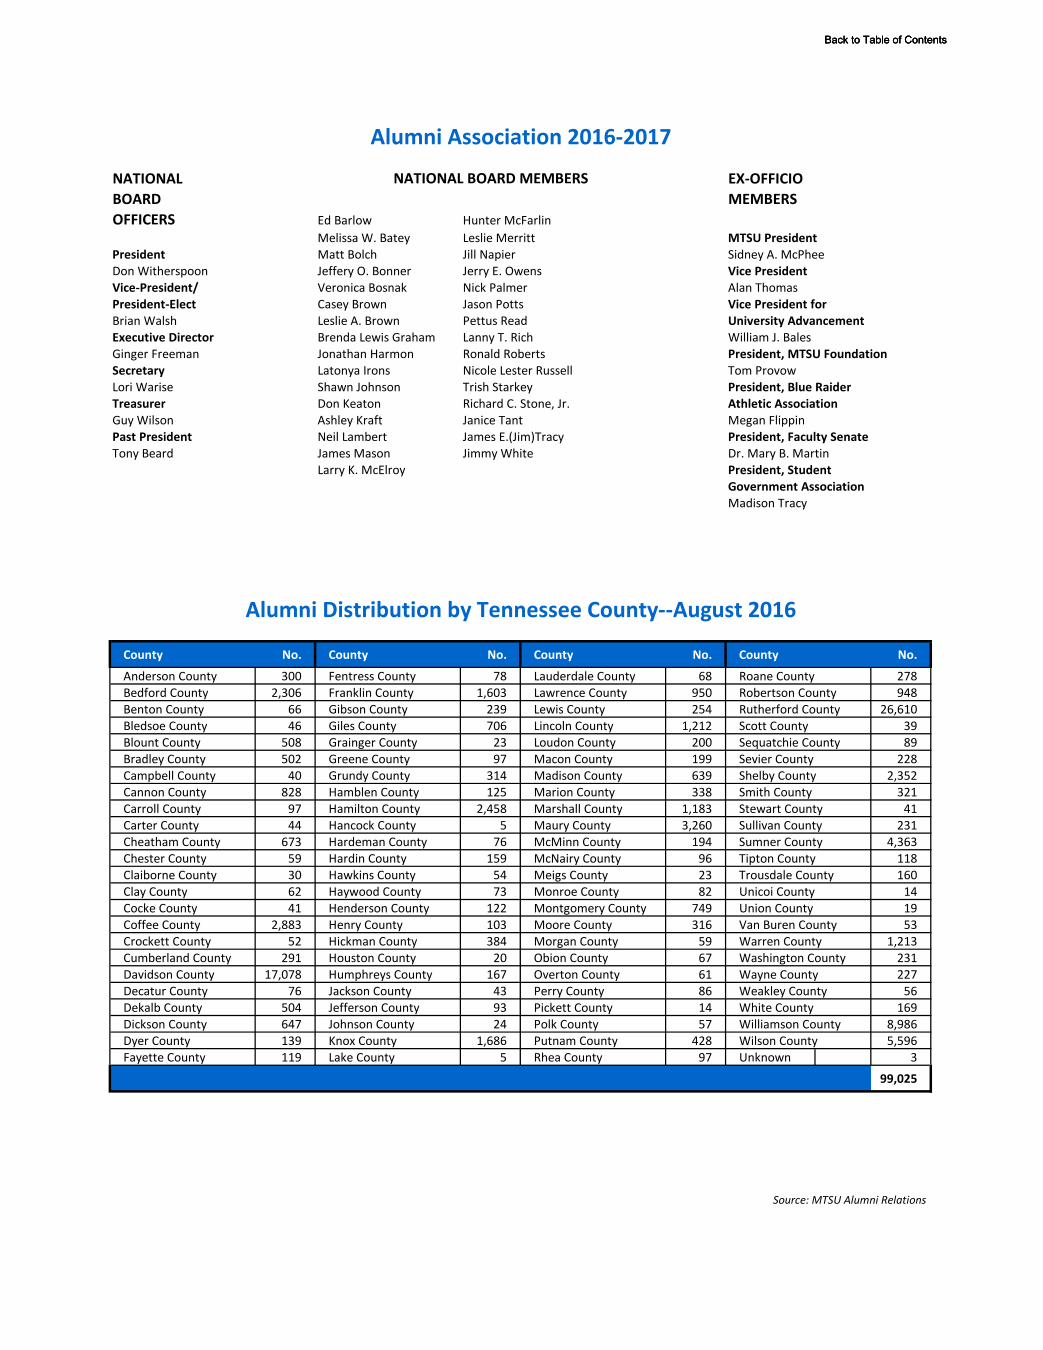
NATIONAL EX-OFFICIO BOARD MEMBERSOFFICERS Ed Barlow Hunter McFarlin
Melissa W. Batey Leslie MerrittPresident Matt Bolch Jill NapierDon Witherspoon Jeffery O. Bonner Jerry E. OwensVice-President/ Veronica Bosnak Nick PalmerPresident-Elect Casey Brown Jason PottsBrian Walsh Leslie A. Brown Pettus ReadExecutive Director Brenda Lewis Graham Lanny T. RichGinger Freeman Jonathan Harmon Ronald RobertsSecretary Latonya Irons Nicole Lester RussellLori Warise Shawn Johnson Trish StarkeyTreasurer Don Keaton Richard C. Stone, Jr.Guy Wilson Ashley Kraft Janice TantPast President Neil Lambert James E.(Jim)TracyTony Beard James Mason Jimmy White
Larry K. McElroy
MTSU PresidentSidney A. McPheeVice PresidentAlan ThomasVice President for University Advancement William J. BalesPresident, MTSU Foundation Tom ProvowPresident, Blue Raider Athletic Association Megan FlippinPresident, Faculty Senate Dr. Mary B. Martin President, Student Government Association Madison Tracy
Alumni Distribution by Tennessee County--August 2016
County No. County No. County No. County No.
Anderson County 300 Fentress County 78 Lauderdale County 68 Roane County 278Bedford County 2,306 Franklin County 1,603 Lawrence County 950 Robertson County 948Benton County 66 Gibson County 239 Lewis County 254 Rutherford County 26,610Bledsoe County 46 Giles County 706 Lincoln County 1,212 Scott County 39Blount County 508 Grainger County 23 Loudon County 200 Sequatchie County 89Bradley County 502 Greene County 97 Macon County 199 Sevier County 228Campbell County 40 Grundy County 314 Madison County 639 Shelby County 2,352Cannon County 828 Hamblen County 125 Marion County 338 Smith County 321Carroll County 97 Hamilton County 2,458 Marshall County 1,183 Stewart County 41Carter County 44 Hancock County 5 Maury County 3,260 Sullivan County 231Cheatham County 673 Hardeman County 76 McMinn County 194 Sumner County 4,363Chester County 59 Hardin County 159 McNairy County 96 Tipton County 118Claiborne County 30 Hawkins County 54 Meigs County 23 Trousdale County 160Clay County 62 Haywood County 73 Monroe County 82 Unicoi County 14Cocke County 41 Henderson County 122 Montgomery County 749 Union County 19Coffee County 2,883 Henry County 103 Moore County 316 Van Buren County 53Crockett County 52 Hickman County 384 Morgan County 59 Warren County 1,213Cumberland County 291 Houston County 20 Obion County 67 Washington County 231Davidson County 17,078 Humphreys County 167 Overton County 61 Wayne County 227Decatur County 76 Jackson County 43 Perry County 86 Weakley County 56Dekalb County 504 Jefferson County 93 Pickett County 14 White County 169Dickson County 647 Johnson County 24 Polk County 57 Williamson County 8,986Dyer County 139 Knox County 1,686 Putnam County 428 Wilson County 5,596Fayette County 119 Lake County 5 Rhea County 97 Unknown 3
99,025
Source: MTSU Alumni Relations
Alumni Association 2016-2017
NATIONAL BOARD MEMBERS
Back to Table of ContentsBack to Table of ContentsBack to Table of Contents

2016 MTSU Alumni in Tennessee
67 5
56 103
139
68
118
2,352 119
73
76
639
52
239 97
122
59
96 159
76
66
41
20
167
86
227
24 231
44
14 97
231
54 5
125 23
41
93
228
30
19
1,686
508
40
300
200 278
39
59
82
57
194
502
23
78
14
61
62 199
291
97
46
2,458
89
53
169
428
43
338
314
1,213
504
321
160
828
2,883
1,603
5,596
4,363
26,610
2,306
316
1,212 706
950
254 3,260
1,183
8,986
17,078
384
647
673
948 749
Source: MTSU Alumni Relations
Back to Table of ContentsBack to Table of ContentsBack to Table of Contents

State No. State No. State No.
Alabama 2,145 Louisiana 363 Oklahoma 243Alaska 59 Maine 39 Oregon 189Arizona 348 Maryland 453 Pennsylvania 422Arkansas 347 Massachusetts 181 Rhode Island 31California 1,250 Michigan 401 South Carolina 838Colorado 545 Minnesota 168 South Dakota 35Connecticut 115 Mississippi 564 Tennessee 99,025Delaware 49 Missouri 471 Texas 2,079District of Columbia 94 Montana 50 Utah 80Florida 2,954 Nebraska 56 Vermont 24Georgia 3,627 Nevada 179 Virginia 1,240Hawaii 60 New Hampshire 48 Washington 338Idaho 51 New Jersey 200 West Virginia 130Illinois 643 New Mexico 110 Wisconsin 162Indiana 601 New York 488 Wyoming 33Iowa 127 North Carolina 1,333 Armed Forces-Europe 91Kansas 162 North Dakota 20 Military-Pacific 56Kentucky 1,366 Ohio 717 Foreign Countries 1,347
TOTAL 126,747
*Only reachable alumni or those with good addresses are included.
Source: MTSU Alumni Relations
MTSU Alumni Distribution By State
Back to Table of ContentsBack to Table of ContentsBack to Table of Contents

2016 MTSU Alumni in the United States
338
189
1,250
50
51
179
80
348
59
60
1,347
91
56
33
545
110
20
35
56
162
243
2,079
168
127
471
347
363
162
643 601
99,025
564 2,145 3,627
1,366
717
401
2,954
838
1,333
1,240 130
94
49
453 200 31
115
181
48
24
422
488
39
126,747
Source: MTSU Alumni Relations
Back to Table of ContentsBack to Table of ContentsBack to Table of Contents

Office of Institutional Effectiveness, Planning and Research www.mtsu.edu/iepr/
CENTERS AND CHAIRS 2016 FACT BOOK
Centers of Excellence Endowed Chairs Chairs of Excellence
Back to Table of ContentsBack to Table of ContentsBack to Table of Contents

Centers of Excellence
THE CENTER FOR HISTORIC PRESERVATION Established 1984 Dr. Carroll Van West, Director
Established in 1984, the Center for Historic Preservation works with students, communities, and partners to interpret and preserve historic properties across the nation. The Center impacts all types of communities by providing boots-on-the-ground technical and preservation tools that allow residents to create new opportunities through the sustainable use of their heritage assets, from the RCA Studio A in Nashville to the Shiloh Rosenwald School in Alabama. The Center also leads scholarly research such as the Tennessee Encyclopedia of History and Culture and the website, Trials and Triumphs: Tennesseans Search for Citizenship and Opportunity.
Training students for professional careers is at the heart of the Center's mission. It provides unparalleled opportunities through its signature programs: the Tennessee Civil War National Heritage Area, Teaching with Primary Sources across Tennessee, MTSU's American Democracy Project, Tennessee Century Farms Program, and its digital humanities partnership with the MTSU Walker Library. Hundreds of preservation professionals received their formative training through the Center, where faculty and staff teach historic preservation and history classes and direct graduate theses and dissertations.
THE CENTER FOR POPULAR MUSIC Established 1985 Dr. Gregory N. Reish, Director
The Center holds over one million items related to American vernacular music traditions, encompassing the full range of styles in popular music, folk and traditional music, sacred music, and community band music. The materials are wide-ranging and include, in part, early American sheet music, songsters, and broadsides; sound recordings in all formats; published scholarly books and periodicals; unique archival collections; multi-media digital collections; and databases that offer the latest marketing statistics.
The Center also strives to stimulate learning and the exchange of ideas through grant-supported projects, conferences, classes, guest lectures, and concerts, the Spring Fed record label, interviews, discussion blogs, social media engagement, digitization activities, and staff research projects. You can explore many of our digital collections, activities, and holdings on this website. Free and open to everyone, the Center has a staff eager to help you better understand our country's vast musical heritage.
Source: Center for Historic Preservation and Center for Popular Music
Back to Table of ContentsBack to Table of ContentsBack to Table of Contents
Endowed Chairs
Several academic programs are enriched through the establishment of Chairs dedicated to the support of a particular discipline. The chairholders may be full-time faculty members or may be individuals from the appropriate business or professional field who are on campus for special seminars or lecture series. Two Chairs, funded by gifts to the University Foundation, are administered through the Economics and Finance Department. The third is housed in the Business Communication and Entrepreneurship Department.
THE MARTIN CHAIR OF INSURANCE Established 1982 Chairholder, Dave Wood The Martin Chair of Insurance was founded by a group of alumni and friends to upgrade and enhance the insurance curriculum at MTSU. It was named in honor of Thomas T. Martin, a Murfreesboro insurance agent who was a highly successful underwriter for almost 60 years. Source: http://www.mtsu.edu/martinchair/
THE WEATHERFORD CHAIR OF FINANCE Established 1986 Chairholder, William F. Ford
The Weatherford Chair of Finance was established to honor Jack O. Weatherford, one of Tennessee’s and the nation’s leading community bankers. A decorated Navy veteran of World War II, Mr. Weatherford completed his education at Middle Tennessee State University and the University of Tennessee-Knoxville. He began his banking career at the Murfreesboro Bank and Trust Company, where he rose through the ranks to chair and CEO. Holding top positions in national banking organizations, he led his bank through a series of mergers involving acquisitions of smaller area banks. The Weatherford Chair of Finance provides specialized training for students interested in banking careers. It also operates a placement service for such students, provides scholarships for them, and conducts research and seminars on topics of interest to the banking community.
Source: http://www.mtsu.edu/business/weatherford.php
THE WRIGHT TRAVEL CHAIR OF ENTREPRENEURSHIP
Established 2007 Chairholder, William C. McDowell
Dr. William McDowell holds the Wright Travel Chair of Entrepreneurship. McDowell joined MTSU in 2014 after launching several successful businesses (and churches) and teaching entrepreneurship at East Carolina University. McDowell believes college creates opportunities for future entrepreneurs to get experience without risk. "We work with people to organize their
Back to Table of ContentsBack to Table of ContentsBack to Table of Contents

ideas and build a structure: a marketing plan, a production plan, financing options. Jones College can really help idea people launch their ideas."
McDowell launched the 2015 Business Plan Competition, open to all MTSU students and alumni. Prominent area early-stage company investors, entrepreneurs, and business leaders judged student presentations. Prizes awarded were $7,500 for first place and $5,000 for second. The 2015 winner was Matthew Wright, PhD candidate in molecular bio-sciences, for his business plan for Salomon's House, a life-science startup that focuses on the conservation of endangered plant species and explores the plants' chemical profiles for potential use in the development of pharmaceuticals.
Source: http://www.mtsu.edu/wrightchair/
Back to Table of ContentsBack to Table of ContentsBack to Table of Contents

Chairs of Excellence
Several academic programs are enriched through the establishment of chairs which are dedicated to the support of a particular discipline. There are forty-three (43) Chairs of Excellence in the Tennessee Board of Regents Higher Education System. Middle Tennessee State University houses nine (9) Chairs of Excellence, established with a combination of private, University, and state funds.
THE JENNINGS A. JONES CHAIR OF EXCELLENCE IN FREE ENTERPRISE Established 1986 Chairholder, Aubrey B. Harwell, Jr.
The Jennings A. Jones Chair of Excellence in Free Enterprise was established for the purpose of promoting and developing an increased understanding of free enterprise to make students and area residents more knowledgeable about the economic forces that shape their lives and the well-being of this country. The Chair also emphasizes the appropriate relationship between government and business in a free society and has an impact not only on Middle Tennessee State University students but also on the regional community. The Chair of Free Enterprise seeks to provide opportunities for the campus and middle Tennessee communities to dialog with individuals of national and international reputation.
Source: www.mtsu.edu/business/enterprise.php
THE JENNINGS & REBECCA JONES CHAIR OF EXCELLENCE IN URBAN AND REGIONAL PLANNING Established 1997
The Jennings and Rebecca Jones Chair of Excellence in Urban and Regional Planning produces and disseminates information relevant to the planning needs and issues in the midstate region. It encourages dialogue on these important issues among area policymakers, opinion leaders, and the broader community of interest.
Source: www.mtsu.edu/business/planning.php
THE JOHN SEIGENTHALER CHAIR OF EXCELLENCE IN FIRST AMENDMENT STUDIES Established 1986 Director, Deborah Fisher
The John Seigenthaler Chair of Excellence in First Amendment Studies was instituted in 1986 to honor John Seigenthaler’s lifelong commitment to free expression values. Seigenthaler, longtime president, editor and publisher of the Nashville Tennessean, is now chairman emeritus of that newspaper. He was also the first editorial director of USA TODAY and the first chairman of the Freedom Forum First
Back to Table of ContentsBack to Table of ContentsBack to Table of Contents
Amendment Center at Vanderbilt University. Seigenthaler remained a leading nationwide spokesman for First Amendment Freedoms until his death at age 86 on July 11, 2014.
The chair was created under the Tennessee Chairs of Excellence program with an initial endowment of about $1.3 million, which has grown to more than $3 million. The chair is designed to provide programs about First Amendment rights as well as funding for distinguished professionals, academics, seminars and research.
Source: http://mtpress.mtsu.edu/firstamendment/history/
THE DR. CARL ADAMS CHAIR IN HEALTH CARE SERVICES Established 1987 Chairholder, M. Jo Edwards
As community physician, Dr. Carl Adams' concern for the quality and quantity of health care professionals to address the issues of a sufficient and well educated health care work force led him to establish the Adams Chair of Excellence in Health Care Services. The Adams Chair was established in November 1988 with funds donated by the late Dr. Carl Adams and his wife, Jennie Mae Adams, and matched by MTSU and the Tennessee Chairs of Excellence program. The Chair provides a platform for MTSU to engage an interdisciplinary group of scholars, in partnership with the community, to forge solutions to current health care concerns. The Center for Health and Human Services is the operational center for the Chair. It was approved in 1993 by the Tennessee Board of Regents.
The Adams family of Murfreesboro, Tennessee, has been a strong supporter of MTSU for many decades. The late Dr. Carl E. Adams, a physician and lifelong resident of Tennessee, had a vision to provide higher quality healthcare services for seniors. He was the founding President and CEO of National HealthCare Corporation (NHC). Dr. Adams began his work in elder care by adding skilled nursing services, registered nurses, and rehabilitative services for NHC healthcare centers. Together with his wife, Jennie Mae, he was also devoted to improving the quality of life for all citizens in the regional community.
The Chair is available to serve on all health and human service faculty advisory councils and to assist various departments in establishing common goals that would benefit all programs in these service areas.
The primary mission of The Adams Chair of Excellence is:
To strengthen the working relationships between MTSU’s programs in health and humanservices and the regional health care community.
To enhance and continuously improve the image of MTSU at the regional, national andinternational level.
Back to Table of ContentsBack to Table of ContentsBack to Table of Contents
To enhance the academic, research and service programs, by involving faculty members inhealth and human service programs, to ensure the continuous improvement of their skills, andthe relevancy and immediacy of the materials they impart to students.
To make Middle Tennessee State University an institution of choice for those wishing to pursuecareers in health and human services.
Holder of the Adams Chair of Excellence, Martha Jo Edwards, Ed.D. was selected as the first Adams Chair of Excellence in 1992 served until her retirement in December 2015. Source: http://www.mtsu.edu/achcs/about_chair.php
THE ROBERT E. AND GEORGIANNA WEST RUSSELL CHAIR OF MANUFACTURING EXCELLENCE Established 1988 Chairholder, Charles H. Perry
The Robert E. and Georgianna West Russell Chair of Manufacturing Excellence is one of 43 Chairs of Excellence in the Tennessee Board of Regents Higher Education System. Housed at Middle Tennessee State University, in the Department of Engineering Technology, it was founded by the co-owners of Quality Industries of LaVergne, Tennessee. Robert (deceased) and Georgianna West Russell were both graduates of MTSU and established the Chair of Manufacturing Excellence in 1988.
The Chair works with undergraduate and graduate programs to assist in the matching of students into the workforce by improving curriculum areas and increasing the dialog between industries and education regarding employment needs. The Chair serves on all Engineering and all Technology Industrial Advisory councils to assist the department in establishing common goals that would benefit all programs in the department. Dr. Charles Perry is the current Chair holder of the Russell Chair of Manufacturing Excellence.
Source: http://www.mtsu.edu/et/russellchair.php#overview
THE KATHERINE DAVIS MURFREE - CHAIR OF EXCELLENCE IN DYSLEXIC STUDIES Established 1989 Chairholder, Dr. Timothy Odegard
The Tennessee Center for the Study and Treatment of Dyslexia was established by the Tennessee General Assembly in 1993 to assist K-12 students with dyslexia, their teachers, and their families. Dyslexia is the principal learning disability contributing to limited overall development of literacy skills, despite good teaching, among intelligent individuals who want to learn. Low literacy has high cost consequences for society. But, students with dyslexia can learn to read and write effectively if identified early; if specialized approaches to instruction are provided, and if teachers and families are patient.
The Center is dedicated to informing the public about the condition of dyslexia, to establishing reliable approaches to identifying students (K-12) with dyslexia, to educating teachers (pre-service and in
Back to Table of ContentsBack to Table of ContentsBack to Table of Contents
service) in best practices that promote literacy acquisition among students with dyslexia, and to enhancing the knowledge base regarding the nature of dyslexia, its biological substrate, as well as effective interventions.
Source: http://www.mtsu.edu/dyslexia/aboutcenter.php
THE NATIONAL HEALTHCARE CHAIR IN NURSING Established 1988
The National HealthCare Chair of Excellence in Nursing is an endowed professorship established through a major gift from the National HealthCare Corporation to: 1) promote the collaborative relationship between the National HealthCare Corporation and the Middle Tennessee State University School of Nursing; 2) recruit geriatric nursing experts of national stature to the nursing faculty at Middle Tennessee State University; 3) promote the development and integration of geriatric nursing and geriatric research at Middle Tennessee State University; 4) provide a source of expert consultation for the nurses and administrators of NHC and other clinical agencies in the Middle Tennessee region and; 5) promote the national visibility of the Middle Tennessee State University School of Nursing.
The position was held by Dr. Suzanne Prevost from August 1998 – August 2008. A search is currently underway to fill the position.
MARY E. MILLER CHAIR OF EXCELLENCE IN EQUINE HEALTH Established 1995 Director, Dr. Holly Spooner
The purpose of this Mary E. Miller Chair in Equine Health is to enhance equine health through research and teaching. The Chair holder funds are used to support the Clinical Specialist in Equine Health. In this role, the Chair extends knowledge to the horse industry through research and teaching and collaborates on equine health studies with veterinarians and equine scientists nationwide. Seminars, professional papers, and periodical articles are used to reach the industry.
JOHN C. MILLER CHAIR OF EXCELLENCE IN EQUINE REPRODUCTIVE PHYSIOLOGY Established 1995 Acting Director, Dr. John Haffner
The purpose of the John C. Miller Chair of Excellence in Equine Reproductive Physiology is to assist the equine industry in making breeding more efficient. Outreach of the chair will be extensive. Middle Tennessee is the center for equine breeding in the state with the sole Horse Science Program at Middle Tennessee State University, and learning reproduction is a primary science within the major.
Source: http://www.mtsu.edu/cbas/chairs_excellence.php
Back to Table of ContentsBack to Table of ContentsBack to Table of Contents

Office of Institutional Effectiveness, Planning and Research
www.mtsu.edu/iepr/
BUDGET & FINANCIAL INFORMATION 2016 FACT BOOK
Unrestricted Educational and General Revenues by Source Unrestricted Educational and General Expenditures Tuition and Fees Research Services
Back to Table of ContentsBack to Table of ContentsBack to Table of Contents
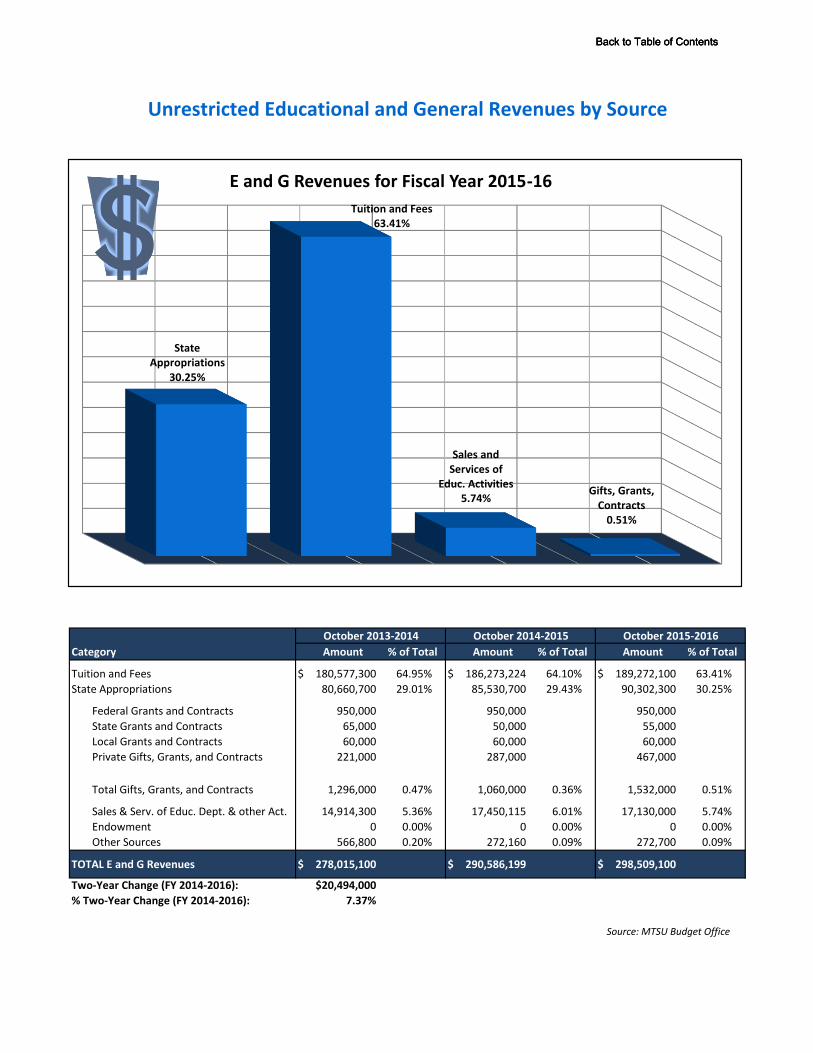
October 2013-2014 October 2014-2015 October 2015-2016
Category Amount % of Total Amount % of Total Amount % of Total
Tuition and Fees $ 180,577,300 64.95% $ 186,273,224 64.10% $ 189,272,100 63.41%
State Appropriations 80,660,700 29.01% 85,530,700 29.43% 90,302,300 30.25%
Federal Grants and Contracts 950,000 950,000 950,000
State Grants and Contracts 65,000 50,000 55,000
Local Grants and Contracts 60,000 60,000 60,000
Private Gifts, Grants, and Contracts 221,000 287,000 467,000
Total Gifts, Grants, and Contracts 1,296,000 0.47% 1,060,000 0.36% 1,532,000 0.51%
Sales & Serv. of Educ. Dept. & other Act. 14,914,300 5.36% 17,450,115 6.01% 17,130,000 5.74%
Endowment 0 0.00% 0 0.00% 0 0.00%
Other Sources 566,800 0.20% 272,160 0.09% 272,700 0.09%
TOTAL E and G Revenues $ 278,015,100 $ 290,586,199 $ 298,509,100
$20,494,000
7.37%
Source: MTSU Budget Office
Two-Year Change (FY 2014-2016):
% Two-Year Change (FY 2014-2016):
Unrestricted Educational and General Revenues by Source
State Appropriations
30.25%
Tuition and Fees63.41%
Sales and Services of
Educ. Activities5.74%
Gifts, Grants, Contracts
0.51%
E and G Revenues for Fiscal Year 2015-16
Back to Table of ContentsBack to Table of ContentsBack to Table of Contents

Instruction
Academic Support
Institutional Support
Student Services
Research
Physical Plant
Public Service
Professional
Salaries
Other
Salaries
Employee
BenefitsTravel
Operating
Expenses
Equipment
(Capital
Outlay)
Total
% of
Total
E & GInstruction 85,213,004 7,518,661 32,219,553 963,444 20,462,721 1,648,756 148,026,139 48.45%
Research 841,049 1,185,250 724,527 54,623 5,410,199 8,500 8,224,148 2.69%
Public Service 216,321 1,639,710 734,400 35,477 1,937,078 89,364 4,652,350 1.52%
Academic Support 6,026,640 14,059,123 7,325,887 420,568 -927,309 4,347,006 31,251,915 10.23%
Student Services 780,769 15,878,157 5,427,150 3,403,027 18,667,397 67,617 44,224,117 14.47%
Institutional Support 3,529,593 8,634,184 4,474,992 186,307 8,529,505 57,165 25,411,746 8.32%
Physical Plant 5,484,157 3,276,003 3,558,164 69,754 15,787,692 462,838 28,638,608 9.37%
Scholarships & Fellowships 0 0 0 0 15,094,447 0 15,094,447 4.94%
Total E and G Expenditures 102,091,533 52,191,088 54,464,673 5,133,200 84,961,730 6,681,246 305,523,470 100.00%
Source: MTSU Budget Office
Unrestricted Educational and General Expenditures
PROFESSIONAL SALARIES
OtherSalaries
17%
EmployeeBenefits
18%
Travel2%
OperatingExpenses
28%
Equipment (Capital Outlay)
2%
ProfessionalSalaries
33%
E and G Expenditures for Fiscal Year 2016
Back to Table of ContentsBack to Table of ContentsBack to Table of Contents
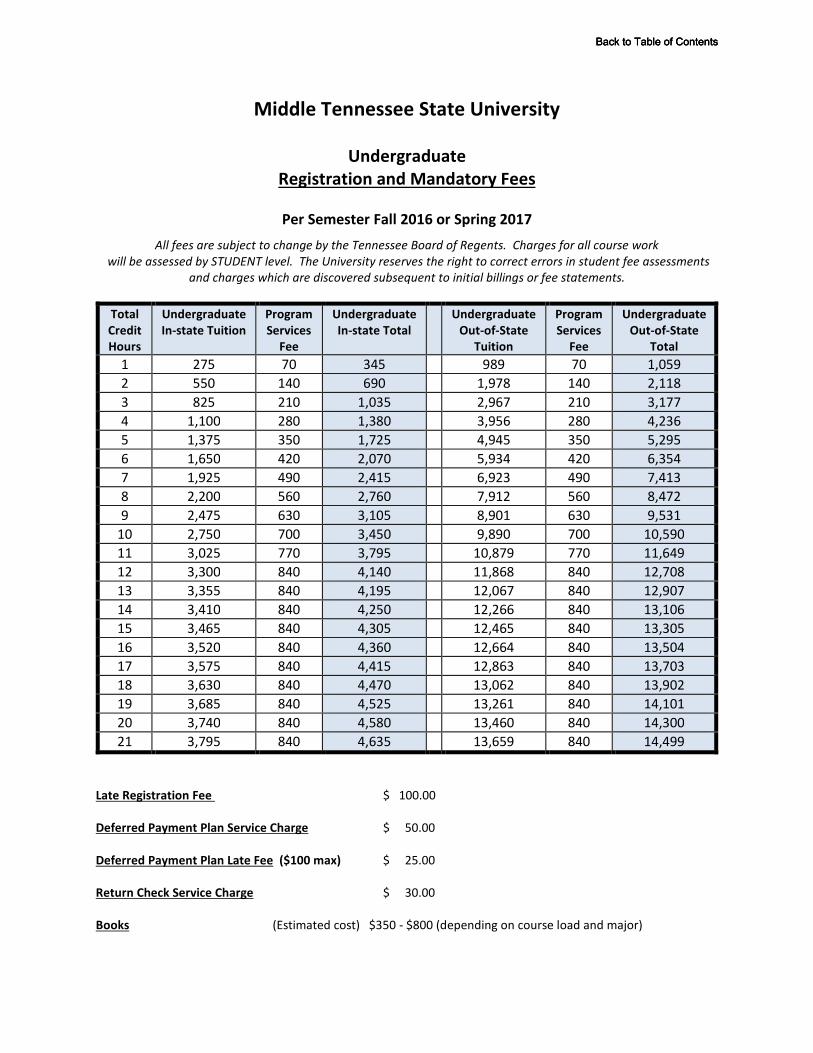
Middle Tennessee State University
Undergraduate
Registration and Mandatory Fees
Per Semester Fall 2016 or Spring 2017
All fees are subject to change by the Tennessee Board of Regents. Charges for all course work
will be assessed by STUDENT level. The University reserves the right to correct errors in student fee assessments
and charges which are discovered subsequent to initial billings or fee statements.
Total
Credit
Hours
Undergraduate
In-state Tuition
Program
Services
Fee
Undergraduate
In-state Total
Undergraduate
Out-of-State
Tuition
Program
Services
Fee
Undergraduate
Out-of-State
Total
1 275 70 345 989 70 1,059
2 550 140 690 1,978 140 2,118
3 825 210 1,035 2,967 210 3,177
4 1,100 280 1,380 3,956 280 4,236
5 1,375 350 1,725 4,945 350 5,295
6 1,650 420 2,070 5,934 420 6,354
7 1,925 490 2,415 6,923 490 7,413
8 2,200 560 2,760 7,912 560 8,472
9 2,475 630 3,105 8,901 630 9,531
10 2,750 700 3,450 9,890 700 10,590
11 3,025 770 3,795 10,879 770 11,649
12 3,300 840 4,140 11,868 840 12,708
13 3,355 840 4,195 12,067 840 12,907
14 3,410 840 4,250 12,266 840 13,106
15 3,465 840 4,305 12,465 840 13,305
16 3,520 840 4,360 12,664 840 13,504
17 3,575 840 4,415 12,863 840 13,703
18 3,630 840 4,470 13,062 840 13,902
19 3,685 840 4,525 13,261 840 14,101
20 3,740 840 4,580 13,460 840 14,300
21 3,795 840 4,635 13,659 840 14,499
Late Registration Fee $ 100.00
Deferred Payment Plan Service Charge $ 50.00
Deferred Payment Plan Late Fee ($100 max) $ 25.00
Return Check Service Charge $ 30.00
Books (Estimated cost) $350 - $800 (depending on course load and major)
Back to Table of ContentsBack to Table of ContentsBack to Table of Contents

Middle Tennessee State University
Graduate
Registration and Other Fees
Per Semester Fall 2016 or Spring 2017
All fees are subject to change by the Tennessee Board of Regents. Charges for all course work
will be assessed by STUDENT level. The University reserves the right to correct errors in student fee assessments
and charges which are discovered subsequent to initial billings or fee statements.
Total
Credit
Hours
Graduate
Instate Tuition
Program
Services
Fee
Graduate
Instate Total
Graduate
Out-of-State
Tuition
Program
Services
Fee
Graduate
Out-of-State
Total
1 443 70 513 1,227 70 1,297
2 886 140 1,026 2,454 140 2,594
3 1,329 210 1,539 3,681 210 3,891
4 1,772 280 2,052 4,908 280 5,188
5 2,215 350 2,565 6,135 350 6,485
6 2,658 420 3,078 7,362 420 7,782
7 3,101 490 3,591 8,589 490 9,079
8 3,544 560 4,104 9,816 560 10,376
9 3,987 630 4,617 11,043 630 11,673
10 4,430 700 5,130 12,270 700 12,970
11 4,518 770 5,288 12,514 770 13,284
12 4,606 840 5,446 12,758 840 13,598
13 4,694 840 5,534 13,002 840 13,842
14 4,782 840 5,622 13,246 840 14,086
15 4,870 840 5,710 13,490 840 14,330
16 4,958 840 5,798 13,734 840 14,574
17 5,046 840 5,886 13,978 840 14,818
18 5,134 840 5,974 14,222 840 15,062
Late Registration Fee $ 100.00
Deferred Payment Plan Service Charge $ 50.00
Deferred Payment Plan Late Fee ($100 max) $ 25.00
Return Check Service Charge $ 30.00
Books (Estimated cost) $350 - $800 (depending on course load and major)
Back to Table of ContentsBack to Table of ContentsBack to Table of Contents
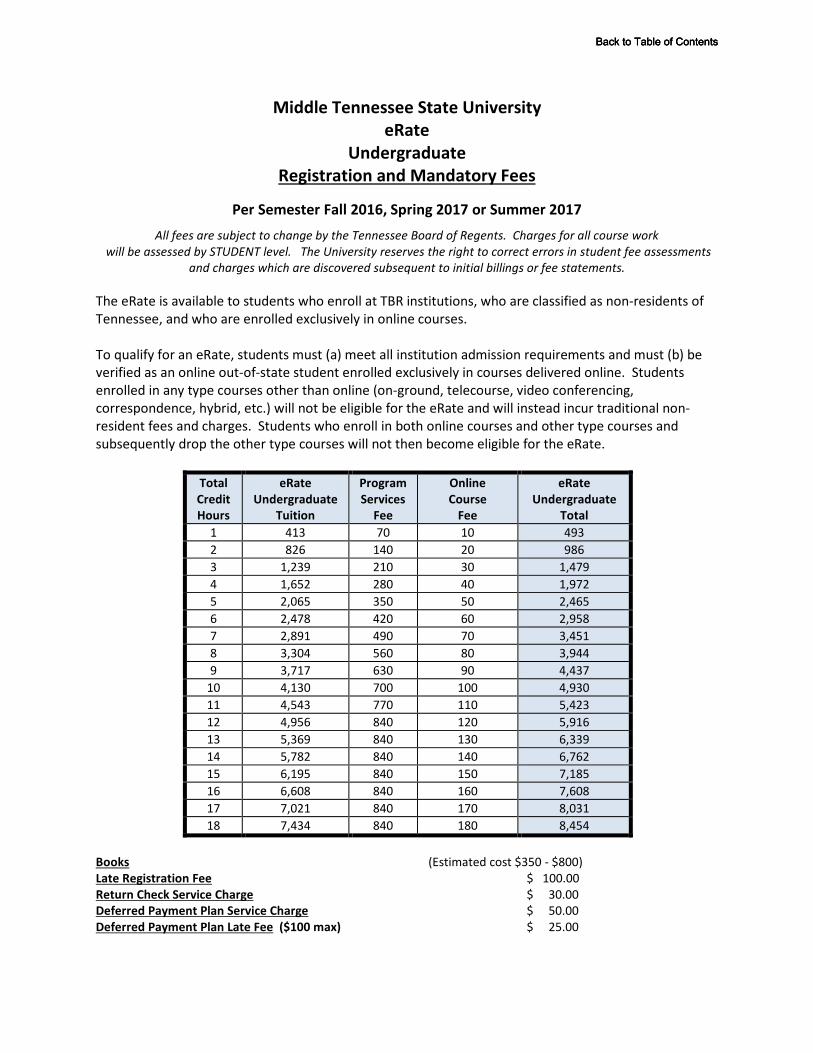
Middle Tennessee State University
eRate
Undergraduate
Registration and Mandatory Fees
Per Semester Fall 2016, Spring 2017 or Summer 2017
All fees are subject to change by the Tennessee Board of Regents. Charges for all course work
will be assessed by STUDENT level. The University reserves the right to correct errors in student fee assessments
and charges which are discovered subsequent to initial billings or fee statements.
The eRate is available to students who enroll at TBR institutions, who are classified as non-residents of
Tennessee, and who are enrolled exclusively in online courses.
To qualify for an eRate, students must (a) meet all institution admission requirements and must (b) be
verified as an online out-of-state student enrolled exclusively in courses delivered online. Students
enrolled in any type courses other than online (on-ground, telecourse, video conferencing,
correspondence, hybrid, etc.) will not be eligible for the eRate and will instead incur traditional non-
resident fees and charges. Students who enroll in both online courses and other type courses and
subsequently drop the other type courses will not then become eligible for the eRate.
Total
Credit
Hours
eRate
Undergraduate
Tuition
Program
Services
Fee
Online
Course
Fee
eRate
Undergraduate
Total
1 413 70 10 493
2 826 140 20 986
3 1,239 210 30 1,479
4 1,652 280 40 1,972
5 2,065 350 50 2,465
6 2,478 420 60 2,958
7 2,891 490 70 3,451
8 3,304 560 80 3,944
9 3,717 630 90 4,437
10 4,130 700 100 4,930
11 4,543 770 110 5,423
12 4,956 840 120 5,916
13 5,369 840 130 6,339
14 5,782 840 140 6,762
15 6,195 840 150 7,185
16 6,608 840 160 7,608
17 7,021 840 170 8,031
18 7,434 840 180 8,454
Books (Estimated cost $350 - $800)
Late Registration Fee $ 100.00
Return Check Service Charge $ 30.00
Deferred Payment Plan Service Charge $ 50.00
Deferred Payment Plan Late Fee ($100 max) $ 25.00
Back to Table of ContentsBack to Table of ContentsBack to Table of Contents
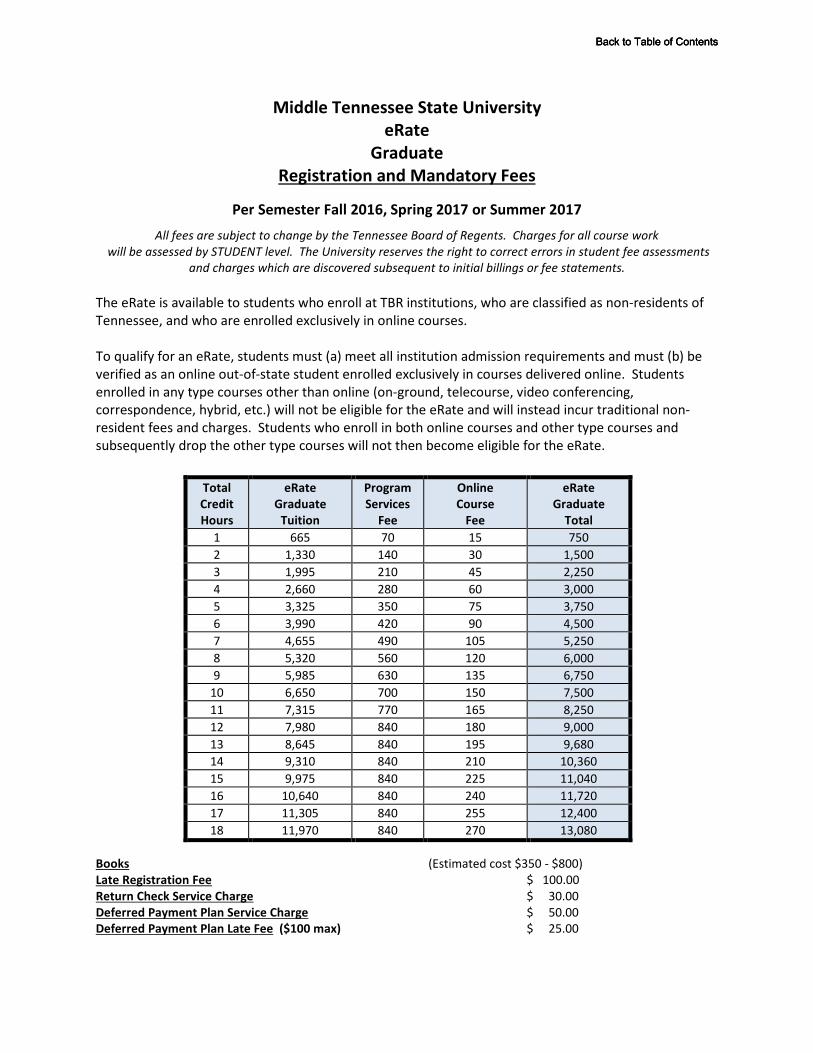
Middle Tennessee State University
eRate
Graduate
Registration and Mandatory Fees
Per Semester Fall 2016, Spring 2017 or Summer 2017
All fees are subject to change by the Tennessee Board of Regents. Charges for all course work
will be assessed by STUDENT level. The University reserves the right to correct errors in student fee assessments
and charges which are discovered subsequent to initial billings or fee statements.
The eRate is available to students who enroll at TBR institutions, who are classified as non-residents of
Tennessee, and who are enrolled exclusively in online courses.
To qualify for an eRate, students must (a) meet all institution admission requirements and must (b) be
verified as an online out-of-state student enrolled exclusively in courses delivered online. Students
enrolled in any type courses other than online (on-ground, telecourse, video conferencing,
correspondence, hybrid, etc.) will not be eligible for the eRate and will instead incur traditional non-
resident fees and charges. Students who enroll in both online courses and other type courses and
subsequently drop the other type courses will not then become eligible for the eRate.
Total
Credit
Hours
eRate
Graduate
Tuition
Program
Services
Fee
Online
Course
Fee
eRate
Graduate
Total
1 665 70 15 750
2 1,330 140 30 1,500
3 1,995 210 45 2,250
4 2,660 280 60 3,000
5 3,325 350 75 3,750
6 3,990 420 90 4,500
7 4,655 490 105 5,250
8 5,320 560 120 6,000
9 5,985 630 135 6,750
10 6,650 700 150 7,500
11 7,315 770 165 8,250
12 7,980 840 180 9,000
13 8,645 840 195 9,680
14 9,310 840 210 10,360
15 9,975 840 225 11,040
16 10,640 840 240 11,720
17 11,305 840 255 12,400
18 11,970 840 270 13,080
Books (Estimated cost $350 - $800)
Late Registration Fee $ 100.00
Return Check Service Charge $ 30.00
Deferred Payment Plan Service Charge $ 50.00
Deferred Payment Plan Late Fee ($100 max) $ 25.00
Back to Table of ContentsBack to Table of ContentsBack to Table of Contents

Middle Tennessee State University
TN eCampus
Registration and Other Fees
Per Semester Fall 2016, Spring 2017, or Summer 2017
All fees are subject to change by the Tennessee Board of Regents. Charges for all course work
will be assessed by STUDENT level. The University reserves the right to correct errors in student fee assessments
and charges which are discovered subsequent to initial billings or fee statements.
TN eCampus (formerly RODP, ROCC) courses are all charged per hour and viewed separately from MTSU courses
so as not to mix with the full-time cap applicable to MTSU courses. TN eCampus fees are computed in addition to
any MTSU course fees and do not apply to the full-time maximum for MTSU registration fees.
Note: TN eCampus courses DO NOT even exchange with MTSU courses unless the course is dropped during the
100% fee adjustment period.
Student Registration Fees per Hour Undergraduate Graduate
In-state Resident - Maintenance Fees 275.00 443.00
Out-of-state Resident – Maintenance Fees 989.00 1,227.00
Online Course Fee (Required of all students ) 110.00 110.00
Nursing Course Fee (Upper Division NURS Courses) $ 35.00 per credit hour
Late Registration Fee $ 100.00
Return Check Service Charge $ 30.00
Deferred Payment Plan Service Charge $ 50.00
Deferred Payment Plan Late Fee ($100 max) $ 25.00
Books (Estimated cost) $ 500 - $800
TOTALS PER HOUR UNDERGRADUATE
IN-STATE
UNDERGRADUATE
OUT-OF-STATE
GRADUATE
IN-STATE
GRADUATE
OUT-OF-STATE
1 385 1,099 553 1,337
2 770 2,198 1,106 2,674
3 1,155 3,297 1,659 4,011
4 1,540 4,396 2,212 5,348
5 1,925 5,495 2,765 6,685
6 2,310 6,594 3,318 8,022
7 2,695 7,693 3,871 9,359
8 3,080 8,792 4,424 10,696
9 3,465 9,891 4,977 12,033
10 3,850 10,990 5,530 13,370
11 4,235 12,089 6,083 14,707
12 4,620 13,188 6,636 16,044
13 5,005 14,287 7,189 17,381
14 5,390 15,386 7,742 18,718
15 5,775 16,485 8,295 20,055
16 6,160 17,584 8,848 21,392
17 6,545 18,683 9,401 22,729
18 6,930 19,782 9,954 24,066
Back to Table of ContentsBack to Table of ContentsBack to Table of Contents

The Office of Research Services, formerly the Office of Research and Sponsored Programs, was established in 1992
to provide assistance in developing proposals for external funding support of programs. Its mission is to provide
services to faculty and staff to support their efforts to obtain external funding for various programs.
During 2015 - 2016 the University received 91 grants totalling $9,669,235. Of this total, $6,065,035 were federal
funds; $1,674,331 were federal flow-through funds; $1,184,279 were state funds; $77,328 were local funds;
and $668,262 were private funds.
2013 - 2014 2015-2016
Source Amount No. Awarded Amount No. Awarded Amount No. Awarded
Federal Flow Through 3,590,137 38 2,187,155 33 1,674,331 5
Federal 7,961,353 31 6,190,054 26 6,065,035 37
State 889,315 14 1,821,768 25 1,184,279 22
Local 137,672 5 81,149 3 77,328 5
Private/Other 331,244 17 346,185 21 668,262 22
Other/Foreign 188,080 5 343,132 6 0 0
Total 13,097,801 110 10,969,443 114 9,669,235 91
Office of Research Services
2014 - 2015
Source: MTSU Office of Research Services
Back to Table of ContentsBack to Table of ContentsBack to Table of Contents
Office of Institutional Effectiveness, Planning and Research www.mtsu.edu/iepr/
RESOURCES, SERVICES & FACILITIES 2016 FACT BOOK
MTSU Foundation James E. Walker Library Physical Facilities Inventory Campus Map
Back to Table of ContentsBack to Table of ContentsBack to Table of Contents
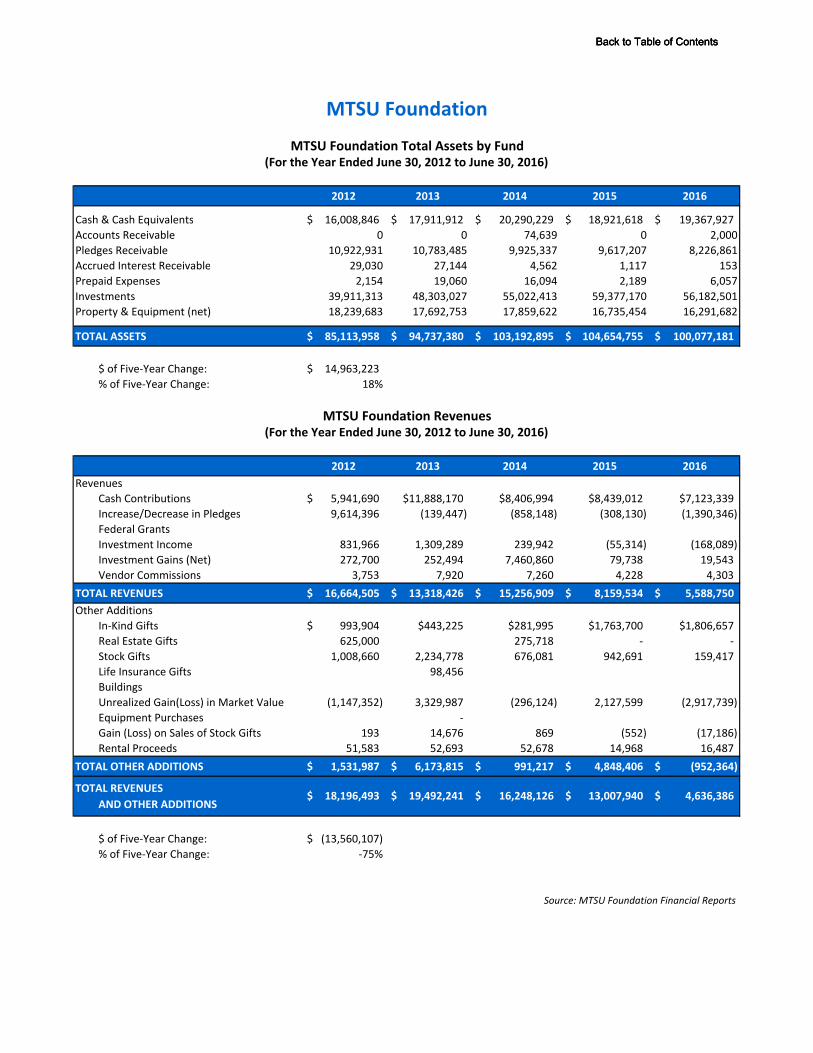
MTSU Foundation Total Assets by Fund(For the Year Ended June 30, 2012 to June 30, 2016)
2012 2013 2014 2015 2016
Cash & Cash Equivalents 16,008,846$ 17,911,912$ 20,290,229$ 18,921,618$ 19,367,927$
Accounts Receivable 0 0 74,639 0 2,000
Pledges Receivable 10,922,931 10,783,485 9,925,337 9,617,207 8,226,861
Accrued Interest Receivable 29,030 27,144 4,562 1,117 153
Prepaid Expenses 2,154 19,060 16,094 2,189 6,057
Investments 39,911,313 48,303,027 55,022,413 59,377,170 56,182,501
Property & Equipment (net) 18,239,683 17,692,753 17,859,622 16,735,454 16,291,682
TOTAL ASSETS 85,113,958$ 94,737,380$ 103,192,895$ 104,654,755$ 100,077,181$
$ of Five‐Year Change: 14,963,223$
% of Five‐Year Change: 18%
MTSU Foundation Revenues(For the Year Ended June 30, 2012 to June 30, 2016)
2012 2013 2014 2015 2016
Revenues
Cash Contributions 5,941,690$ $11,888,170 $8,406,994 $8,439,012 $7,123,339
Increase/Decrease in Pledges 9,614,396 (139,447) (858,148) (308,130) (1,390,346)
Federal Grants
Investment Income 831,966 1,309,289 239,942 (55,314) (168,089)
Investment Gains (Net) 272,700 252,494 7,460,860 79,738 19,543
Vendor Commissions 3,753 7,920 7,260 4,228 4,303
TOTAL REVENUES 16,664,505$ 13,318,426$ 15,256,909$ 8,159,534$ 5,588,750$
Other Additions
In‐Kind Gifts 993,904$ $443,225 $281,995 $1,763,700 $1,806,657
Real Estate Gifts 625,000 275,718 ‐ ‐
Stock Gifts 1,008,660 2,234,778 676,081 942,691 159,417
Life Insurance Gifts 98,456
Buildings
Unrealized Gain(Loss) in Market Value (1,147,352) 3,329,987 (296,124) 2,127,599 (2,917,739)
Equipment Purchases ‐
Gain (Loss) on Sales of Stock Gifts 193 14,676 869 (552) (17,186)
Rental Proceeds 51,583 52,693 52,678 14,968 16,487
TOTAL OTHER ADDITIONS 1,531,987$ 6,173,815$ 991,217$ 4,848,406$ (952,364)$
TOTAL REVENUES
AND OTHER ADDITIONS
$ of Five‐Year Change: (13,560,107)$
% of Five‐Year Change: ‐75%
Source: MTSU Foundation Financial Reports
MTSU Foundation
18,196,493$ 19,492,241$ 16,248,126$ 13,007,940$ 4,636,386$
Back to Table of ContentsBack to Table of ContentsBack to Table of Contents

In 1912, the first library for Middle Tennessee State Normal School was established by newly hired librarian Betty Avent Murfree. She started the collection with donations of 75 books from persons both on and off campus. The library was housed on the third floor of Old Main overlooking the main entrance, and its collection eventu-ally grew to 2,000 volumes. By 1925, a separate library building was needed for the newly named Middle Tennessee State Teachers College. Designed to accommodate 20,000 volumes, the structure was erected across from Old Main on the site where Peck Hall now stands. In 1958, a new library building was constructed at a cost of $500,000. Located east of the older library and between the Science Building and Jones Hall, this new building was to hold a growing collection of up to 150,000 volumes. It was named the Andrew L. Todd Library. In 1970, an ad-dition to Todd Library was required to meet the needs of a growing university. Although this building was designed to contain 225,000 volumes, over 600,000 volumes filled its shelves.
In spring 1999, MTSU again opened a new library to meet the needs of a rapidly growing student body. It was designed to accommodate a collection of over one million bound volumes and provide seating for 2,600. The library includes a four-floor atrium that serves as the central organizing element for the interior spaces and brings controlled, natural daylight to readers and study spaces in the building. In fall 2001, the new library, a visible sign of the University’s commitment to quality education, was named James E. Walker Library in honor of a former MTSU president who was a friend of the library, a leader in higher education, and a partner in securing funding for the new building.
The Walker Library building is visited by well over ONE MILLION people per year (that’s an average of over 25,000 per week) and equally as many people visit online through library.mtsu.edu. Through hundreds of Library research classes taught to one on one research coach appointments to the forty thousand people helped with research and technology at library service desks throughout the year the James E Walker Library truly is the JEWL of the campus.
Holdings for Academic Years 2008-2009 to 2014-15
2009-2010 2010-2011 2011-2012 2012-2013 2013-2014 2014-2015 2015-2016
Volumes (1) 1,111,412 1,120,409 1,115,388 1,521,865 1,521,802 1,488,011 1,634,255 Periodical Subscriptions(2) 30,958 32,320 41,459 62,727 70,590 88,183 87,137 Microtext Units 1,329,275 1,309,454 1,309,774 1,309,951 1,310,961 1,311,961 1,307,801
Total 2,471,645 2,462,183 2,466,621 2,894,543 2,903,353 2,888,155 3,029,193
Operating Expenditures for Academic Years 2008-2009 to 2014-15
2009-2010 2010-2011 2011-2012 2012-2013 2013-2014 2014-2015 2015-2016
Staff Salary and Wages (3) $4,390,160 $4,348,019 $4,599,154 $4,606,403 $4,837,113.75 $4,761,254.09 4,796,395 Collection Expenditures (4) 3,325,274 3,724,101 3,561,691 4,000,000 $4,314,519.68 $4,166,271.90 4,185,806 Other Operating Expenditures (5) 443,949 540,518 858,580 633,020 $562,105.42 $747,007.85 570,717
Total $8,159,383 $8,612,638 $9,019,425 $9,239,423 $9,713,739 $9,674,534 9,552,918
(1) Includes electronic books(2) Beginning 2007-2008 includes electronic subscriptions(3) Administratives, Instructional and Clerical Salaries, CWSP match, Work Scholarship and staff benefits(4) Books, Periodicals, Binding and electronic resources (includes TAF)(5) Travel, Equipment and SuppliesNote: expenditures for recurring costs for library computer lab divided as follows: 2/3 to operations, 1/3 to staffing
Source: Walker Library
James E. Walker Library
Back to Table of ContentsBack to Table of ContentsBack to Table of Contents

FACILITYBuilding
AbbreviationYear
CompletedGross Sq. Ft. Completed
Initial Cost
LEASED FACILITYAirport Hangar 2 AIR 1980 6,000 LeasedBox Hangar 3 BH3 4,095 LeasedMiddle Tennessee Education Center, Shelbyville, TN MTEC 5,458 LeasedOff Campus Warehouse OWH 1970 20,750 Leased3050 Medical Center Parkway CHAM 2,774 Leased
PERMANENT FACILITYAbernathy Hall ABER 1973 51,700 1,150,000Alpha Chi Omega House ACOH 1998 11,682 1,097,450Alpha Delta Pi House ADPH 1998 13,039 1,303,780Alpha Omicron Pi House AOPH 1998 12,652 1,313,261Alumni Memorial Gym AMG 1950 72,022 3,048,187Alumni Office 2263 Middle Tennessee Blvd. ALOF 2004 2,795 125,800Alumni Relations House 2259 Middle Tennesse Blvd. ALUM 2005 10,417 540,000Andrew L. Todd Hall TODD 1958 114,388 1,681,730Andrew Woodfin Miller, Sr. Education Center MEC 126,839Barn BARN 8,300Baseball Stadium BS2 2009 26,670 4,900,000Beasley Hall BH 1959 20,138 261,000Bell Street Garage GBS 139,320Boutwell Dramatic Arts BDA 1964 56,164 865,000Business and Aerospace BAS 1997 184,712 21,795,000Cason-Kennedy Nursing Building CKNB 1994 31,478 3,150,000Central Services Building (Day Care Center) CSB 1968 6,178 82,017Central Utility Plant/ Chilling Plant CUP 1967 6,188 892,816Central Utility Plant/ Cogeneration Plant COGN 1998 16,216 11,748,440Champion Way Garage GCW 2012 158,933 8,959,319Chi Omega House COH 1998 9,822 960,072College Heights Chapel CH 1959 9,229 668,875College of Education Building COE 2011 91,206 20,478,438Commodity Barn COMB 2011 1,660 112,000Cope Administration Building CAB 1965 51,740 775,000Corlew Hall CORL 1967 106,669 1,900,000Cyber Café at Woodmore WC 1963 7,430 125,000Davis Science Building DSB 1967 75,472 1,715,000Dean A. Hayes Track and Soccer Stadium HTSS 2007 15,965 2,212,900Deere Hall DH 1969 39,086 644,085Donald McDonald Hangar HGR 2006 11,088 833,867E.W. Midgett Building MGB 1959 18,614 240,000Ellington Human Sciences EHS 1962 15,662 913,000Emmett and Rose Kennon Sports Hall of Fame KSHF 2004 12,735 1,495,000Ezell Hall EZEL 1973 52,452 1,150,000Fairview Building FAIR 1962 37,141 1,900,000Farm Shop FSHP 2011 9,772 353,000Flight Simulator Building FSB 2015 3,946 539,600Floyd Stadium STA 1998 288,838 25,500,000Forrest Hall FH 1954 14,177 391,800Gracy Hall GRH 1963 22,104 253,000Greek Row House #7 GRH7 1998 13,729 1,334,004Greenhouse GH 1975 4,774 60,000Health, Wellness and Recreation Center REC 1995 143,456 14,534,361Health, Wellness and Recreation Center Addition REC2 2008 57,429 16,816,865Horse Science Center HSC 2002 51,409 5,677,000Horse Science Center Addition HSCL 2003 8,060Horticulture Facility HC 1997 9,002 500,000Housing Maintenance Annex HMA 1976 5,162 120,000James E. Walker Library LIB 1998 252,534 25,000,000James Union Building JUB 1952 58,308 1,776,000Jean A. Jack Flight Education Center FEC 1997 5,052 556,000Jim Cummings Hall JCH 1969 97,012 1,826,000John Bragg Media and Entertainment Building BRAGG 1990 91,116 15,585,000
Physical Facilities InventoryBack to Table of ContentsBack to Table of ContentsBack to Table of Contents

FACILITYBuilding
AbbreviationYear
CompletedGross Sq. Ft. Completed
Initial Cost
Jones Hall JH 1921 39,855 1,925,720Judd Hall JUDD 1963 22,104 253,000Kappa Delta House KDH 1998 8,467 853,750Keathley University Center KUC 1967 122,671 2,405,630Kirksey Old Main KOM 1911 83,706 1,058,000Lyon Hall LH 1927 25,794 430,100Main Dairy MD 2011 24,943 2,194,000Maintenance Complex (Bayer-Travis) BTB 1969 3,414 32,926Maintenance Complex (Hastings) HAB 1969 8,439 85,576Maintenance Complex (Haynes-Turner) HTB 1969 10,831 112,028Maintenance Complex (Holmes) HOB 1969 5,796 87,312Maintenance Complex (Open Shed) MCX 1969 9,955 66,573Maintenance Complex (Warehouse) WH 1969 17,513 179,585Mary Hall MARY 1962 20,789 304,200McFarland Building MB 1969 10,477 288,822McHenry Hall MCH 1962 20,987 367,300Miller Lanier Airway Science AWS 1989 18,582 856,044Monohan Hall MOH 1954 28,475 796,600MTSU Blvd. Garage GMB 2012 160,217 8,959,319Murphy Center MC 1971 249,492 6,599,000Ned McWherter Learning Resource Center LRC 1975 65,802 1,700,000Nicks Hall NICK 1969 36,721 563,850Nursing Building Addition NB3 2006 24,028 3,150,000Observatory OBS 2008 724 600,000Parking Services Building (1403 E. Main St.) PKS 1951 12,098 2,151,300Paul W. Martin, Sr. Honors Building HONR 2003 20,718 4,150,000Peck Hall PH 1968 110,501 1,741,000Pittard Campus School PCS 1927 47,797 200,000President's Home PRES 1911 7,794 42,000Printing Services Building PSB 2005 4,320 600,000Project HELP PHLP 1996 4,568 409,792Recreation Storage RS 2007 4,400 591,320Reynolds Hall REH 1960 35,826 428,400ROTC Annex ROTX 1942 10,143 45,000Rutledge Hall RH 1911 21,323 253,000Sam H. Ingram Building ING 1951 27,499 2,225,000Satellite Chiller Plant SCP 2009 10,085 8,592,433Saunders Fine Arts SFA 1959 32,788 387,000Scarlett Commons Apt. Bldg. 1 SCB1 1999 17,189 1,200,000Scarlett Commons Apt. Bldg. 2 SCB2 1999 17,189 1,200,000Scarlett Commons Apt. Bldg. 3 SCB3 1999 17,189 1,200,000Scarlett Commons Apt. Bldg. 4 SCB4 1999 17,189 1,200,000Scarlett Commons Apt. Bldg. 5 SCB5 1999 11,459 1,200,000Scarlett Commons Apt. Bldg. 6 SCB6 1999 17,189 1,200,000Scarlett Commons Apt. Bldg. 7 SCB7 1999 17,189 1,200,000Scarlett Commons Apt. Bldg. 8 SCB8 1999 17,189 1,200,000Scarlett Commons Apt. Bldg. 9 SCB9 1999 17,189 1,200,000Scarlett Commons Club House SCCH 1999 8,354 1,200,000Schardt Hall SCH 1960 35,859 428,400Science Building SCI 2014 263,670 95,102,168Sigma Chi House SCHH 1998 10,363 986,292Sims Hall SIMS 1959 21,540 261,000Smith Hall SMH 1951 38,511 459,500Sports Medicine/Stadium Addition SMD 2000 2,508 1,000,000Stark Agribusiness and Agriscience Center SAG 1968 25,463 536,360Stephen B. Smith Baseball Clubhouse SBCH 1997 11,525 300,000Storage Building SB 1,100Storage Warehouse SW 1978 10,363 45,630Student Services and Admissions Center SSAC 2014 70,143 15,482,373Student Union STU 2010 210,760 55,067,759Telecomm Building TCM 1996 10,267 1,365,000Telescope Building TB 1986 412 75,000Tennessee Center for the Study and Treat. of Dyslexia DYS 2000 7,169 1,438,000
Back to Table of ContentsBack to Table of ContentsBack to Table of ContentsBack to Table of Contents

FACILITYBuilding
AbbreviationYear
CompletedGross Sq. Ft. Completed
Initial Cost
Tennessee Livestock Center TLC 1972 157,315 3,905,369Tennessee Miller Coliseum and Horse Barn TMC 2001 293,171 22,500,000Tennis Shelter TENN 1993 1,748 30,000Tom H. Jackson Building JACK 1911 8,114 395,246Vocational Agricultural VA 1979 6,047 128,974Voorhies Engineering Technology VET 1942 39,291 1,384,365Wiser - Patten Science WPS 1932 41,449 1,225,000WMOT Transmitter WMOT 1959 433 5,200Womack Lane Apts. A WLAA 1966 11,899 161,000Womack Lane Apts. B WLAB 1966 11,096 137,000Womack Lane Apts. C WLAC 1966 12,702 161,000Womack Lane Apts. D WLAD 1968 11,096 148,567Womack Lane Apts. E WLAE 1968 14,309 192,208Womack Lane Apts. F WLAF 1968 14,309 192,208Womack Lane Apts. G WLAG 1971 14,309 214,860Womack Lane Apts. H WLAH 1971 14,308 214,860Womack Lane Apts. I WLAI 1971 14,308 214,860Womack Lane Apts. J WLAJ 1971 11,864 174,852Womack Lane Apts. K WLAK 1971 11,872 174,852Womack Lane Apts. L WLAL 1971 11,872 174,852Women's Softball Batting Enclosure WSBE 2014 2,600 99,106Women's Softball Complex WSBC 2005 3,427 635,324Wood-Steagall Center WSC 2003 10,142 1,275,000Wright Music Building WMB 1980 31,357 2,000,000Zeta Tau Alpha House ZTAH 1998 13,840 1,239,277106, 108 City View Drive FRIZ 1956 1,231 77,000110 A,B,C City View Drive HAN1 1955 1,971 102,0001102 Ewing Boulevard EWG3 1948 1,818 145,0001105 Ewing Boulevard EWG1 1948 1,536 57,0001109 Ewing Boulevard EWG2 1948 1,520 145,0001114 East Lytle St. LYTL 1948 1,874 74,920123 City View CVD 1952 1,070 80,000125 City View JERN 1948 1,228 80,000129 City View SMI 1950 1,459 91,0001412 E. Main St. (University Police) PS 1974 6,240 337,9001416 E. Main St. (Harrison House) HARR 1925 2,454 51,8001417 E. Main Annex / Soil Lab SL 1958 339 3,0001417 E. Main St. (Black House) BLH 1958 3,027 27,2001509 Elrod St. ELR 1952 1,481 140,0001511 Elrod St. BERG 1950 2,454 132,5001611 Elrod St. ELR2 1941 1,179 95,0001618 Elrod St. ELR4 1952 1,394 84,5001707 E. Main St. EM3 1956 2,880 163,5001710 Elrod St. ELR3 1960 1,656 147,0001800 Jordan Ave. JA1 1932 2,766 200,0001803 E. Main St. EM1 1931 1,700 167,0001803 Jordan Ave. JA5 1932 1,804 110,0001804 Jordan Ave. AND 1973 1,596 8,7001805 Ragland Ave. RA2 1950 1,242 67,7681807 Jordan Ave. JA3 1945 1,538 140,0001809 / 1811 Ragland VAUG 1957 2,502 133,0001810 Jordan Ave. JORD 1952 1,984 125,0001815 Jordan Ave. JA6 1932 2,990 157,5001819 Jordan Ave. JA4 1946 1,854 166,9001821 Jordan Ave. JA2 1947 1,994 119,0001903 Jordan Ave. JA7 1937 2,005 120,0001914 Ragland Ave. RAGL 1962 1,236 90,0001918 Ragland Ave. RA1 1964 1,295 109,7002006 Ragland Ave. HOUK 1964 1,413 107,0002007 Ragland Ave. BAI 1954 1,468 85,000203 Womack Lane WOM 1962 3,506 235,000209 N. Baird Lane WANH 1958 1,243 12,500209, 209A, 209B City View Drive FRI 1949 2,811 135,000
Back to Table of ContentsBack to Table of ContentsBack to Table of ContentsBack to Table of Contents

FACILITYBuilding
AbbreviationYear
CompletedGross Sq. Ft. Completed
Initial Cost
211 City View JON 1963 1,402 89,000213 City View JON2 1999 1,356 94,000213 Wilson Ave. WA3 1987 1,598 102,600216 Wilson Ave. WA4 1962 1,092 69,500217 Wilson Ave. STE 1951 2,344 142,000219 Eastland Ave. RAD 1947 1,618 88,000220 Eastland Ave. EAS1 1958 1,083 79,000220 Wilson Ave. WA1 1956 2,947 170,0002207 E. Main St. EM5 1941 2,029 188,0002227 E. Main St. BOW 1943 1,169 80,0002302 Louise Street LOU3 1967 1,336 73,0002306 Louise Street LOU1 1996 1,062 72,0002311 E. Main St. EM2 1950 1,646 150,0002315 E. Main St. EM4 1942 1,045 74,0002411-2417 Middle Tennessee Blvd. MT1 1939 4,009 195,0002431-2437 Middle Tennessee Blvd. MT3 1949 5,155 250,0002505 Middle Tennessee Blvd. MT6 1949 4,3502511 MiddleTennessee Blvd. MT4 1955 2,272 175,6002645 Middle Tennessee Blvd. KING 1947 2,218 155,0002739 Middle Tennessee Blvd. MT5 1964 2,287 198,0003005 Guy James Rd. FARM1 1960 1,351 135,1003009 Guy James Rd. FARM4 1950 880 88,0003091 Guy James Rd. FARM5 1968 1,500 109,5004570 Lebanon Rd. SWINE 1958 2,100 48,900915 Bell St. WHI 1955 1,040 82,000
TOTAL PERM. FACILITIES 205 5,893,827 494,308,297TEMPORARY FACILITY
Holmes Building Modular Addition HBM 1996 2,675 110,000TOTAL TEMPORARY FACILITIES 1 2,675 110,000LICENSED FACILITY
Jeff Hendrix Golf Performance Center HGPC 2,600TOTAL LICENSED FACILITIES 1 2,600 0TOTAL FACILITIES 207 5,899,102 494,418,297NEW FACILITIES UNDER CONSTRUCTION
Strobel Lobby 3,281
Source: MTSU Campus Planning
Back to Table of ContentsBack to Table of ContentsBack to Table of ContentsBack to Table of Contents
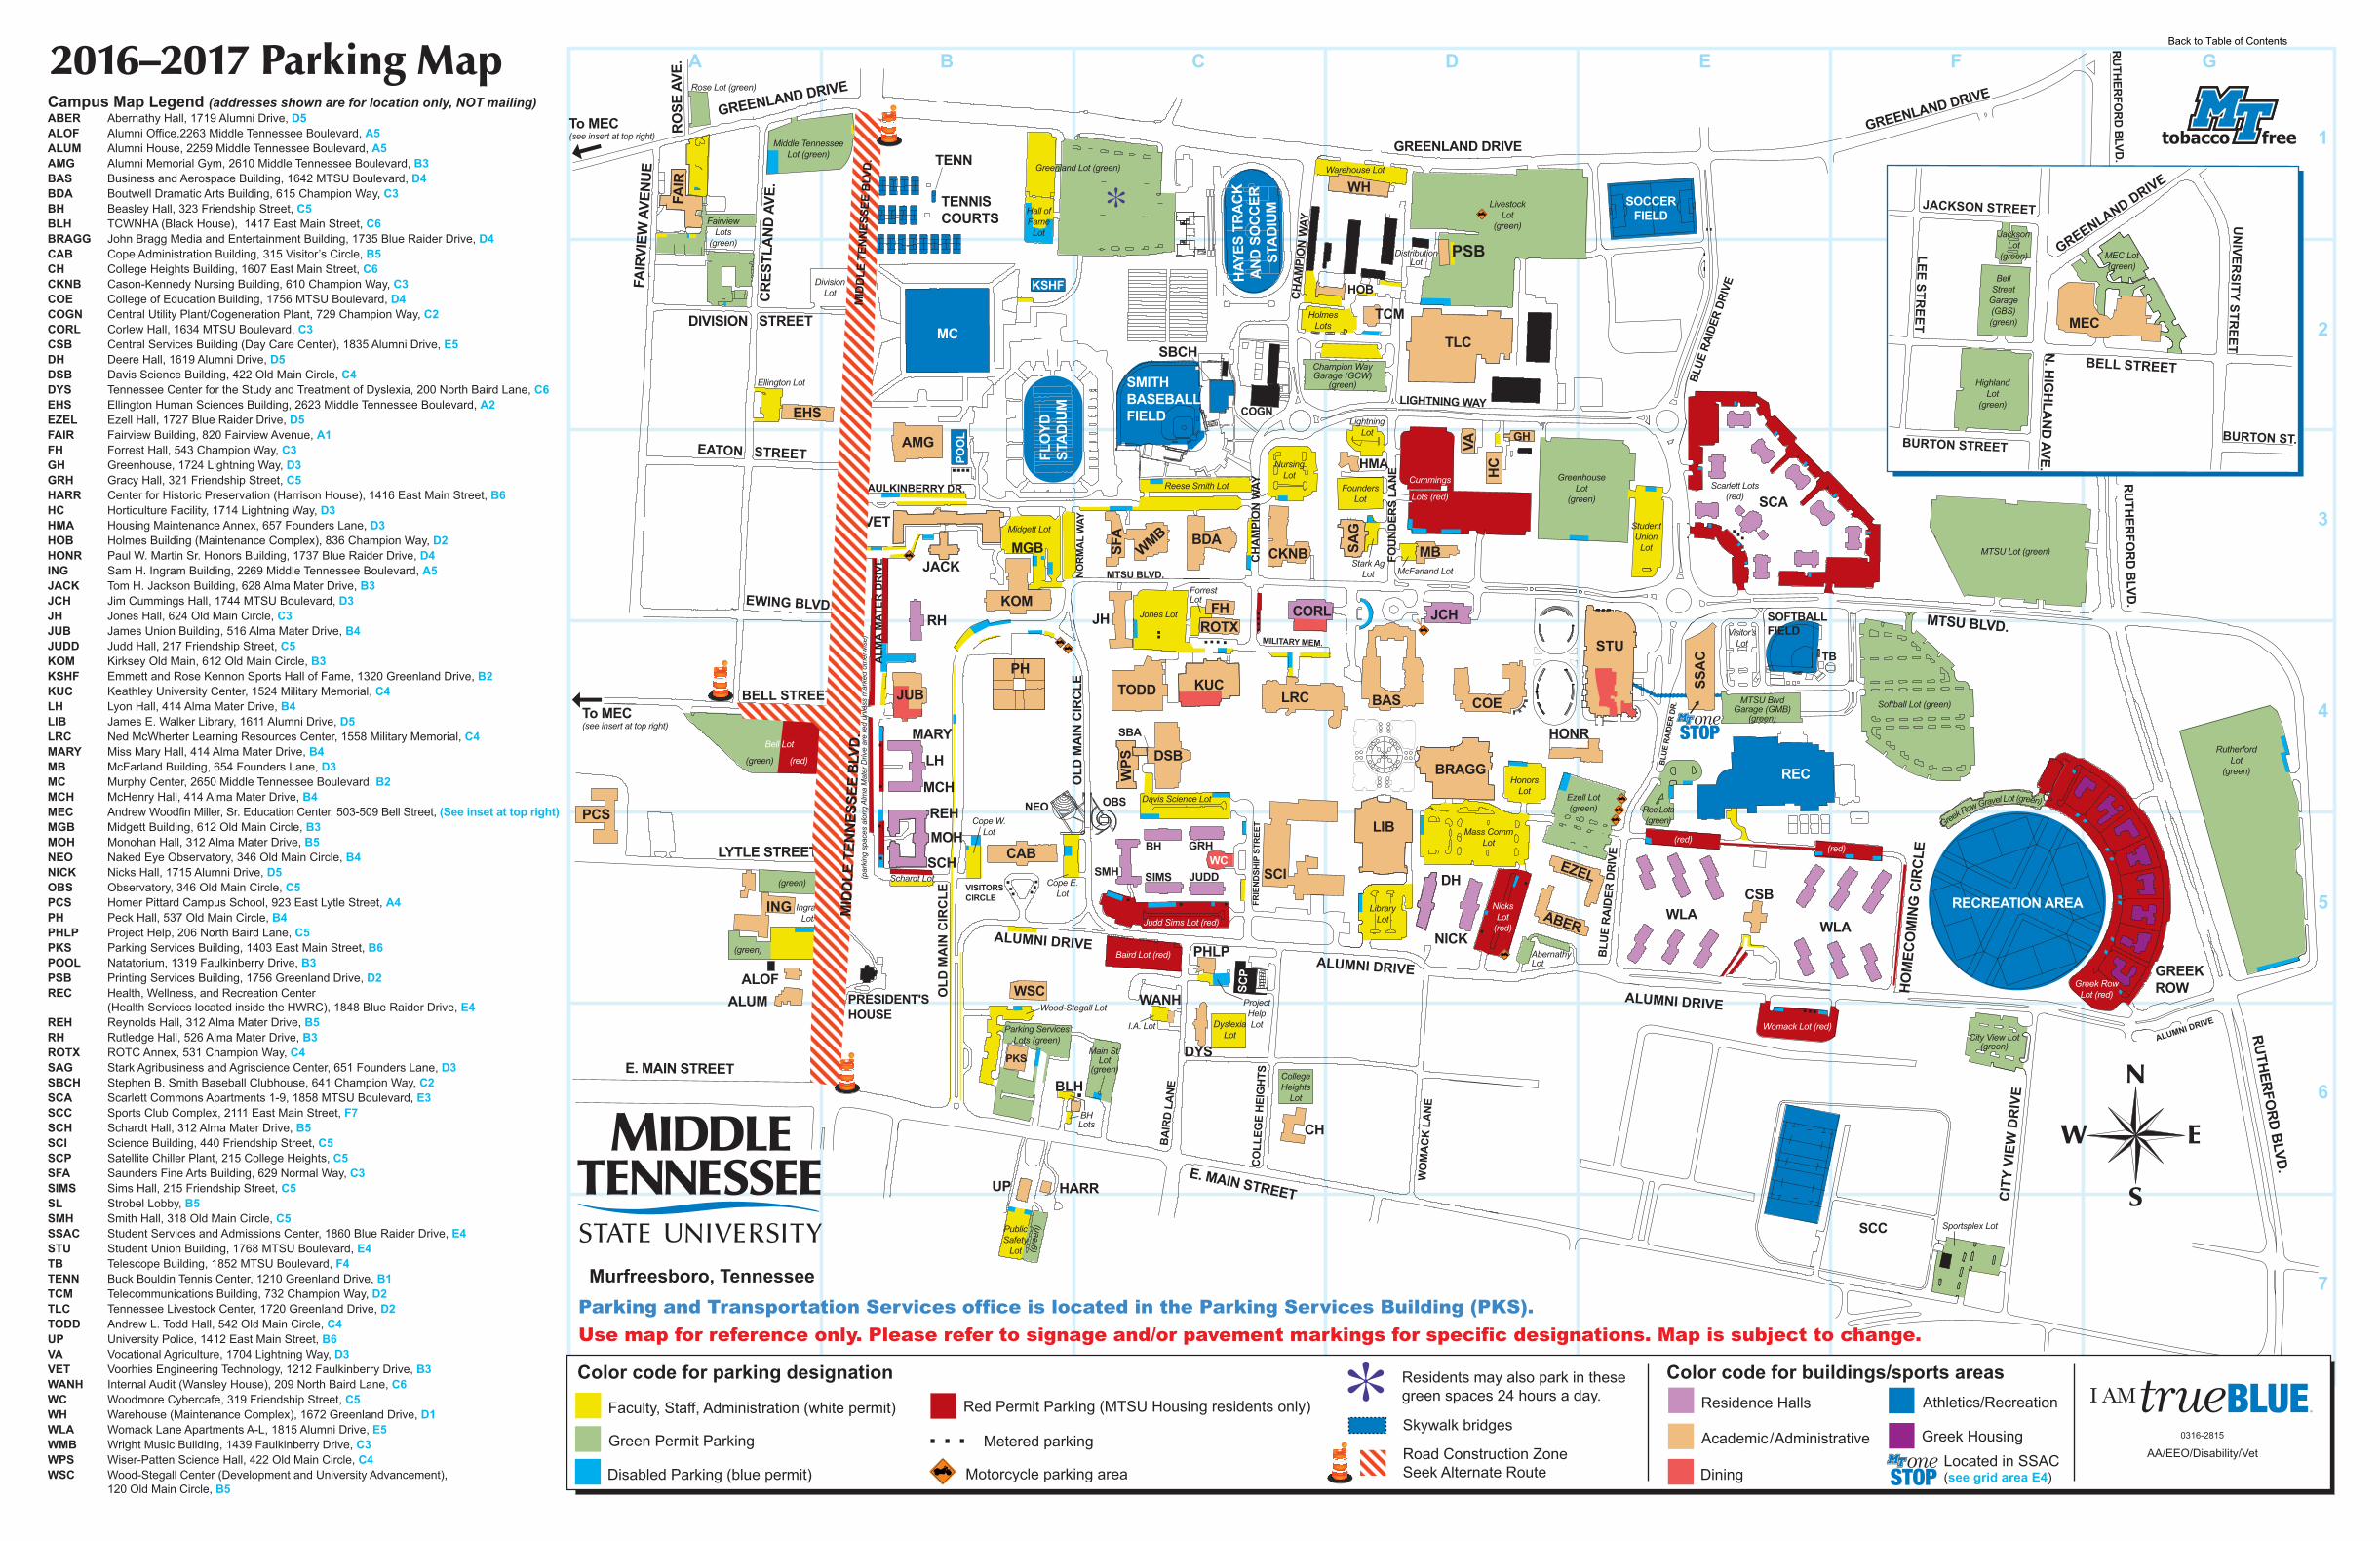
GREENLAND DRIVE
FAIR
VIEW
AVE
NU
E
CR
ESTL
AN
D A
VE.
FAIR
DIVISION STREET
TENNISCOURTS
MC
EHS
AMG
POO
L
FLO
YDST
AD
IUM
CH
AM
PIO
N W
AY
TLC
VA
WH
HOB
SAG
SCA
SFA BDA
WMB
MTSU BLVD.NO
RM
AL
WAY
MGB
KOM
JACK
VET
RH JH
BELL STREET
PH
LH
MOHLYTLE STREET CAB
OLD
MA
IN C
IRC
LE
VISITORSCIRCLE
PRESIDENT'SHOUSE
MID
DLE
TEN
NES
SEE
BLV
D.
OLD
MA
IN C
IRC
LE
UP HARR
BLH
WANH
BA
IRD
LA
NE
E. MAIN STREET
PHLP
WO
MA
CK
LA
NE
FH
KUC
WPS DSB
SMH
BH GRH
SIMS JUDD
CORL
LRC BAS
ROTX
LIB
BRAGG
ABER
EZEL
WLACSB
GREEKROWH
OM
ECO
MIN
G C
IRC
LE
MTSU BLVD.
WLA
PCS
ALM
A M
ATER
DR
IVE
HC
KSHF
MILITARY MEM.
MCH
MARY
SCH
REH
....
SBA
ALUMALOF
DH
NICK
FAULKINBERRY DR.
CKNB
HONR
ING
MID
DLE
TEN
NES
SEE
BLV
D.
NEO
PKS
TODD
ALUMNI DRIVE
HAY
ES T
RA
CK
AN
D S
OC
CER
STA
DIU
M
COGN
WSC
HMA
OBS
GREENLAND DRIVE
RU
THER
FOR
D B
LVD.
RU
THER
FOR
D B
LVD.
SCC
RUTHERFORD BLVD.
REC
SCP
TENN
COE
STU
ALUMNI DRIVE
ALUMNI DRIVE
CH
CO
LLEG
E H
EIG
HTS
ALUMNI DRIVE
BLUE
RAI
DER
DRIV
E
SMITHBASEBALLFIELD
SBCH
GH
BLUE
RAI
DER
DRIV
E
GREENLAND DRIVE
CH
AM
PIO
N W
AY
FOU
ND
ERS
LAN
E
RECREATION AREA
CIT
Y VI
EW D
RIV
E
JCH
MB
JUB
TB
SOFTBALLFIELD
STU
FRIE
ND
SHIP
STR
EET
WC
RO
SE A
VE.
SOCCERFIELD
BLUE
RAI
DER
DR.
LIGHTNING WAY
LivestockLot
(green)
Rose Lot (green)
FairviewLots
(green)
Middle TennesseeLot (green)
DivisionLot
Ellington Lot
Bell Lot
IngramLots
Greenland Lot (green)
Hall ofFame
Lot
Midgett Lot
Reese Smith Lot
Jones Lot
Cope W.Lot
Cope E.Lot
Schardt Lot
Wood-Stegall Lot
Parking ServicesLots (green)
Main St.Lot
(green)
I.A. Lot
Baird Lot (red)
Judd Sims Lot (red)
Davis Science Lot
PublicSafety
Lot
CollegeHeights
Lot
DyslexiaLot
ProjectHelpLot
DYS
LibraryLot
Mass CommLot
HonorsLot
Ezell Lot(green)
AbernathyLot
NicksLot
(red)
Rec Lots(green)
Womack Lot (red)City View Lot
(green)
Greek RowLot (red)
RutherfordLot
(green)
Softball Lot (green)
MTSU Lot (green)
Scarlett Lots(red)
Cummings
Lots (red)
GreenhouseLot
(green)
StudentUnion
Lot
TCM
FoundersLot
Stark AgLot McFarland Lot
LightningLot
NursingLot
HolmesLots
To MEC(see insert at top right)
To MEC(see insert at top right)
DistributionLot
Warehouse Lot
ForrestLot
BHLots
E. MAIN STREET
Sportsplex Lot
SCI
Champion WayGarage (GCW)
(green)
MTSU BlvdGarage (GMB)
(green)
SSA
C
Greek Row Gravel Lot (green)
(green)
(green)
(green) (red)
(gre
en)
(red)(red)
(par
king
spa
ces
alon
g Al
ma
Mat
er D
rive
are
red
unle
ss m
arke
d ot
herw
ise)
Visitor’sLot
EATON STREET
EWING BLVD.
PSB
MID
DLE
TEN
NES
SEE
BLV
D.
MID
DLE
TEN
NES
SEE
BLV
D.
Red Permit Parking (MTSU Housing residents only)
Color code for parking designation Color code for buildings/sports areas
Metered parking
Motorcycle parking area
Green Permit Parking
Faculty, Staff, Administration (white permit)
Disabled Parking (blue permit)
Parking and Transportation Services office is located in the Parking Services Building (PKS).Use map for reference only. Please refer to signage and/or pavement markings for specific designations. Map is subject to change.
AA/EEO/Disability/Vet
2016–2017 Parking Map
Greek HousingLocated in SSAC(see grid area E4)
Academic / Administrative
Residence Halls Athletics/Recreation
Dining
Campus Map Legend (addresses shown are for location only, NOT mailing)ABER Abernathy Hall, 1719 Alumni Drive, D5ALOF Alumni Office,2263 Middle Tennessee Boulevard, A5ALUM Alumni House, 2259 Middle Tennessee Boulevard, A5AMG Alumni Memorial Gym, 2610 Middle Tennessee Boulevard, B3BAS Business and Aerospace Building, 1642 MTSU Boulevard, D4BDA Boutwell Dramatic Arts Building, 615 Champion Way, C3BH Beasley Hall, 323 Friendship Street, C5BLH TCWNHA (Black House), 1417 East Main Street, C6BRAGG John Bragg Media and Entertainment Building, 1735 Blue Raider Drive, D4CAB Cope Administration Building, 315 Visitor’s Circle, B5CH College Heights Building, 1607 East Main Street, C6CKNB Cason-Kennedy Nursing Building, 610 Champion Way, C3COE College of Education Building, 1756 MTSU Boulevard, D4COGN Central Utility Plant/Cogeneration Plant, 729 Champion Way, C2CORL Corlew Hall, 1634 MTSU Boulevard, C3CSB Central Services Building (Day Care Center), 1835 Alumni Drive, E5DH Deere Hall, 1619 Alumni Drive, D5DSB Davis Science Building, 422 Old Main Circle, C4DYS Tennessee Center for the Study and Treatment of Dyslexia, 200 North Baird Lane, C6EHS Ellington Human Sciences Building, 2623 Middle Tennessee Boulevard, A2EZEL Ezell Hall, 1727 Blue Raider Drive, D5FAIR Fairview Building, 820 Fairview Avenue, A1FH Forrest Hall, 543 Champion Way, C3GH Greenhouse, 1724 Lightning Way, D3GRH Gracy Hall, 321 Friendship Street, C5HARR Center for Historic Preservation (Harrison House), 1416 East Main Street, B6HC Horticulture Facility, 1714 Lightning Way, D3HMA Housing Maintenance Annex, 657 Founders Lane, D3HOB Holmes Building (Maintenance Complex), 836 Champion Way, D2HONR Paul W. Martin Sr. Honors Building, 1737 Blue Raider Drive, D4ING Sam H. Ingram Building, 2269 Middle Tennessee Boulevard, A5JACK Tom H. Jackson Building, 628 Alma Mater Drive, B3JCH Jim Cummings Hall, 1744 MTSU Boulevard, D3JH Jones Hall, 624 Old Main Circle, C3JUB James Union Building, 516 Alma Mater Drive, B4JUDD Judd Hall, 217 Friendship Street, C5KOM Kirksey Old Main, 612 Old Main Circle, B3KSHF Emmett and Rose Kennon Sports Hall of Fame, 1320 Greenland Drive, B2KUC Keathley University Center, 1524 Military Memorial, C4LH Lyon Hall, 414 Alma Mater Drive, B4LIB James E. Walker Library, 1611 Alumni Drive, D5LRC Ned McWherter Learning Resources Center, 1558 Military Memorial, C4MARY Miss Mary Hall, 414 Alma Mater Drive, B4MB McFarland Building, 654 Founders Lane, D3MC Murphy Center, 2650 Middle Tennessee Boulevard, B2MCH McHenry Hall, 414 Alma Mater Drive, B4MEC Andrew Woodfin Miller, Sr. Education Center, 503-509 Bell Street, (See inset at top right)MGB Midgett Building, 612 Old Main Circle, B3MOH Monohan Hall, 312 Alma Mater Drive, B5NEO Naked Eye Observatory, 346 Old Main Circle, B4NICK Nicks Hall, 1715 Alumni Drive, D5OBS Observatory, 346 Old Main Circle, C5PCS Homer Pittard Campus School, 923 East Lytle Street, A4PH Peck Hall, 537 Old Main Circle, B4PHLP Project Help, 206 North Baird Lane, C5PKS Parking Services Building, 1403 East Main Street, B6POOL Natatorium, 1319 Faulkinberry Drive, B3PSB Printing Services Building, 1756 Greenland Drive, D2REC Health, Wellness, and Recreation Center (Health Services located inside the HWRC), 1848 Blue Raider Drive, E4REH Reynolds Hall, 312 Alma Mater Drive, B5RH Rutledge Hall, 526 Alma Mater Drive, B3ROTX ROTC Annex, 531 Champion Way, C4SAG Stark Agribusiness and Agriscience Center, 651 Founders Lane, D3SBCH Stephen B. Smith Baseball Clubhouse, 641 Champion Way, C2SCA Scarlett Commons Apartments 1-9, 1858 MTSU Boulevard, E3SCC Sports Club Complex, 2111 East Main Street, F7SCH Schardt Hall, 312 Alma Mater Drive, B5SCI Science Building, 440 Friendship Street, C5SCP Satellite Chiller Plant, 215 College Heights, C5SFA Saunders Fine Arts Building, 629 Normal Way, C3SIMS Sims Hall, 215 Friendship Street, C5SL Strobel Lobby, B5SMH Smith Hall, 318 Old Main Circle, C5SSAC Student Services and Admissions Center, 1860 Blue Raider Drive, E4STU Student Union Building, 1768 MTSU Boulevard, E4TB Telescope Building, 1852 MTSU Boulevard, F4TENN Buck Bouldin Tennis Center, 1210 Greenland Drive, B1TCM Telecommunications Building, 732 Champion Way, D2TLC Tennessee Livestock Center, 1720 Greenland Drive, D2TODD Andrew L. Todd Hall, 542 Old Main Circle, C4UP University Police, 1412 East Main Street, B6VA Vocational Agriculture, 1704 Lightning Way, D3VET Voorhies Engineering Technology, 1212 Faulkinberry Drive, B3WANH Internal Audit (Wansley House), 209 North Baird Lane, C6WC Woodmore Cybercafe, 319 Friendship Street, C5WH Warehouse (Maintenance Complex), 1672 Greenland Drive, D1WLA Womack Lane Apartments A-L, 1815 Alumni Drive, E5WMB Wright Music Building, 1439 Faulkinberry Drive, C3WPS Wiser-Patten Science Hall, 422 Old Main Circle, C4WSC Wood-Stegall Center (Development and University Advancement), 120 Old Main Circle, B5
Skywalk bridges
Residents may also park in these green spaces 24 hours a day.
Road Construction ZoneSeek Alternate Route
MEC
BELL STREET
GREENLAND DRIVE
N. H
IGH
LAN
D AVE.
BURTON STREET
JACKSON STREET
UN
IVERSITY STR
EET
BURTON ST.LEE STR
EET
HighlandLot
(green)
BellStreet
Garage(GBS)(green)
JacksonLot
(green) MEC Lot(green)
Murfreesboro, Tennessee
0316-2815
Back to Table of Contents
Office of Institutional Effectiveness, Planning and Research www.mtsu.edu/iepr/
HISTORICAL DATA 2016 FACT BOOK
Degrees Conferred: Historical Trends Headcount by Gender, Fall Terms 1911-2016 Full-Time and Part-Time Headcount, Fall Terms 2007-2016 Students by Race, Fall Terms 2007-2016 First-Time Freshmen Enrollment by Race, Fall Terms 2007-2016 Summary of Registration Type, Fall Terms 2009-2016 Students by Permanent Residency, Fall Terms 2005-2016 Headcount by Tennessee County, Fall Terms 2007-2016 Out-of-State Students, Fall Terms 2007-2016 Total Student Credit Hours, Fall Terms 2006-2016
Back to Table of ContentsBack to Table of ContentsBack to Table of ContentsBack to Table of Contents

2011-12 2012-13 2013-14 2014-15 2015-16
Total Bachelor's Degrees 3,911 4,159 4,012 4,064 4,056
Total Master's Degrees 811 882 795 791 766
Total Ed. S. Degrees 114 128 66 56 25
Total Doctoral Degrees 20 23 32 30 37
Total Graduate Certificates 9 13 11 9 10
University Total 4,865 5,205 4,916 4,950 4,894
College of Graduate Studies 2011-12 2012-13 2013-14 2014-15 2015-16
Accounting & Information Systems, Master of Science - - 1 0 0
Accounting, Master of Accountancy 39 29 39 45 49
Administration & Supervision, Education Specialist 68 92 24 38 12
Administration & Supervision, Master of Education 89 120 53 44 41
Adv Stud in Teaching Learning, Master of Education 8 6 4 3 3
Aerospace Education, Master of Education 3 1 0 0 0
Archival Management, Graduate Certificate - - - 1 0
Aviation Administration, Master of Science 5 10 7 5 10
Biology, Master of Science 9 8 11 8 14
Business Administration, Master of Business Admin. 146 140 127 98 83
Business Administration, Master of Business Education - - - 1 0
Business Education, Master of Business Education 10 15 11 9 12
Chemistry, Doctor of Arts 0 1 0 0 0
Chemistry, Master of Science 11 6 13 9 20
College & University Teaching, Graduate Certificate - 1 0 0 3
Computational Science, Doctor of Philosophy - - - 3 1
Computer Science, Master of Science 13 10 16 14 9
Criminal Justice Admin, Master of Criminal Justice 5 3 2 17 16
Curriculum & Instruction/Ed Leadrshp, Education Specialist 35 28 35 10 5
Curriculum & Instruction/Ed Leadrshp, Master of Education 70 88 48 89 42
Curriculum & Instruction/Elem Edu, Education Specialist 3 1 1 0 0
Curriculum & Instruction/Elem Edu, Master of Education 52 62 52 42 29
Curriculum & Instruction/Psychology, Education Specialist 8 7 6 8 8
Dyslexic Studies, Graduate Certificate 0 2 1 0 0
Economics, Doctor of Philosophy 1 5 6 3 2
Economics, Master of Arts 12 18 9 15 9
Engineering Technology & Industrial Stud, name change effective 2009 Master of Sci 9 5 13 5 13
English, Doctor of Philosophy 5 4 11 2 8
English, Master of Arts 9 10 6 12 12
Exercise Science, Master of Science 11 13 10 9 7
Family Nurse Practitioner, Graduate Certificate 2 0 1 5 3
Foreign Language, Master of Arts in Teaching 6 8 8 11 5
Gerontology, Graduate Certificate 3 6 1 1 0
Health & Human Performance, Master of Science 6 6 16 8 7
Health Care Management, Graduate Certificate 4 4 2 2 0
Health, Physical Education & Recreation, Master of Science 10 0 0 0 0
History, Master of Arts 22 28 17 15 21
Degrees and Certificates Conferred: Historical Trends
Academic Years 2011- 2016
Degrees Conferred by Type Summary
Degrees and Certificates Conferred by College
Back to Table of ContentsBack to Table of ContentsBack to Table of ContentsBack to Table of Contents

Horse Science, Master of Science - 3 5 6 7
Human Performance, Doctor of Philosophy 7 5 7 7 10
Human Sciences, Master of Science 7 8 0 0 0
Information Systems, Master of Science 29 28 35 38 51
International Affairs, Master of Arts - - 3 5 0
Leisure and Sport Management, Master of Science 13 25 16 19 13
Literacy Studies, Doctor of Philosophy 2 3 4 4 3
Literacy, name change effective Jan., 2011 Master of Education 10 8 5 5 8
Management, Master of Science - - - 2 9
Mass Communication, Master of Science 15 9 7 9 5
Mathematics & Science Educ, Doctor of Philosophy 2 0 4 2 7
Mathematics, Master of Science 6 9 14 6 10
Mathematics Master of Science in Teaching 4 6 5 2 0
Molecular Biosciences, Doctor of Philosophy - - - 6 2
Museum Management Graduate Certificate - - 1 0 2
Music, Master of Arts 16 14 7 9 8
Nursing, Master of Science in Nursing 15 32 59 87 81
Professional Counseling, Master of Education 13 16 23 18 22
Professional Science, Master of Science 29 34 44 51 55
Professional Studies, Master of Professional Studies 17 15 22 17 9
Psychology, Master of Arts 41 33 37 27 33
Public History, Doctor of Philosophy 3 5 0 3 4
Reading, Master of Education, name changed to Literacy effective Jan., 2011 - - - - 0
Recording Arts & Technologies, Master of Fine Arts 10 12 11 7 10
Social Work, Master of Social Work 15 18 22 14 30
Sociology, Master of Arts 6 9 7 1 3
Special Education, Master of Education 20 17 10 9 10
U.S. Culture and Education, Graduate Certificate - - - - 1
Women's and Gender Studies, Graduate Certificate - - 5 0 1
College Total 954 1046 904 886 838
Back to Table of ContentsBack to Table of ContentsBack to Table of ContentsBack to Table of Contents

College of Basic and Applied Sciences 2011-12 2012-13 2013-14 2014-15
Aerospace, Bachelor of Science 104 124 122 121
Agribusiness, Bachelor of Science 23 34 34 28
Animal Science, Bachelor of Science 50 48 50 60
Biochemistry, Bachelor of Science 50 59 53 47
Biology, Bachelor of Science 103 92 111 113
Chemistry, Bachelor of Science 26 15 9 12
Computer Science, Bachelor of Science 33 34 33 59
Concrete Industry Management, Bachelor of Science 89 56 54 35
Construction Management, Bachelor of Science 38 22 18 26
Engineering Technology, Bachelor of Science 40 29 48 67
Environmental Science and Technology, Bachelor of Science 5 8 11 4
Environmental Sustain Tech
Forensic Science, Bachelor of Science 0 3 6 6
Geosciences, Bachelor of Science ─ ─ ─ 20
Industrial Technology, Bachelor of Science 1 0 0 0
Mathematics, Bachelor of Science 26 38 29 25
Mechatronics Engineering
Physics, Bachelor of Science 11 13 14 15
Plant and Soil Science, Bachelor of Science 17 35 28 18
Science, Bachelor of Science 53 62 49 56
College Total 669 672 669 712
College of Behavioral and Health Sciences 2011-12 2012-13 2013-14 2014-15
Athletic Training, Bachelor of Science 10 13 9 12
Community & Public Health
Criminal Justice Administration, Bachelor of Science 131 153 143 153Exercise Science, Bachelor of Science, effective August, 2009 72 76 91 86
Family and Consumer Studies, Bachelor of Science 41 46 52 55
Health Education, Bachelor of Science 44 50 58 62
Industrial/Organizational Psychology, Bachelor of Science 14 16 20 21
Interior Design, Bachelor of Science 13 7 9 9
Leisure Sport & Tourism Studies, Bachelor of Science 0 3 8 32
Nursing, Bachelor of Science in Nursing 169 200 185 159
Nutrition and Food Science, Bachelor of Science 31 38 53 48
Physical Education, Bachelor of Science 35 40 39 11
Psychology, Bachelor of Science 182 209 180 209
Recreation and Leisure Services, Bachelor of Science 22 24 13 7
Social Work, Bachelor of Social Work 86 90 78 81
Speech & Theatre-Communication Disorders, Bachelor of Science 26 28 25 21
Speech/Language Path & Audio, Bachelor of Science 0 0 0 22
Textiles, Merchandising, and Design, Bachelor of Science 41 38 22 36
College Total 917 1,031 985 1,024
Jennings A. Jones College of Business 2011-12 2012-13 2013-14 2014-15Accounting, Bachelor of Business Administration 122 118 131 111
Business Administration, Bachelor of Business Administration 100 84 101 100
Business Education, Bachelor of Science 9 13 12 5
Economics, Bachelor of Business Administration 9 16 14 12
Entrepreneurship, Bachelor of Business Administration 30 28 25 26
Finance, Bachelor of Business Administration 67 67 52 72
Information Systems, Bachelor of Business Administration 63 45 52 76
Management, Bachelor of Business Administration 83 79 87 83
Marketing, Bachelor of Business Administration 119 90 94 106
Office Management, Bachelor of Business Administration 4 5 11 2
College Total 606 545 579 593
Back to Table of ContentsBack to Table of ContentsBack to Table of ContentsBack to Table of Contents

College of Education 2011-12 2012-13 2013-14 2014-15Early Childhood Education, Bachelor of Science 45 38 42 27
Interdisciplinary Studies, Bachelor of Science 197 198 136 120
Special Education, Bachelor of Science 27 28 22 12
College Total 269 264 200 159
College of Liberal Arts 2011-12 2012-13 2013-14 2014-15Anthropology, Bachelor of Science 22 30 20 28
Art Education, Bachelor of Science 9 18 10 7
Art History, Bachelor of Arts 3 3 3 7
Art, Bachelor of Fine Arts 31 46 40 55
Economics, Bachelor of Science 16 15 14 19
English, Bachelor of Arts 72 87 98 95
Foreign Language, Bachelor of Arts 35 53 36 41
Foreign Language, Bachelor of Science 13 17 8 4
Geoscience, Bachelor of Science 15 24 20 8
Global Studies, Bachelor of Arts 38 30 29 7
Global Studies & Cultural Geog ─ ─ ─ 38
History, Bachelor of Arts 69 64 61 43
History, Bachelor of Science ─ ─ ─ ─International Relations, Bachelor of Arts ─ ─ ─ ─International Relations, Bachelor of Science 27 22 18 17
Music, Bachelor of Music 39 37 38 35
Organizational Communication, Bachelor of Science 68 82 87 102
Philosophy, Bachelor of Arts 13 15 16 12
Philosophy, Bachelor of Science
Political Science, Bachelor of Arts 12 13 14 13
Political Science, Bachelor of Science 77 57 68 52
Sociology, Bachelor of Arts 5 5 5 6
Sociology, Bachelor of Science 31 30 29 21
Speech & Theatre, Bachelor of Arts 5 11 7 2Speech & Theatre, Bachelor of Science 23 33 36 11
Theatre, Bachelor of Science ─ ─ ─ 8
U.S. Culture and Education,Undergraduate Certificate ─ ─ ─ 13
College Total 623 692 657 644
College of Mass Communication 2011-12 2012-13 2013-14 2014-15
Mass Communication, Bachelor of Science 265 303 258 247
Recording Industry, Bachelor of Science 239 232 220 217
College Total 504 535 478 464
University College 2011-12 2012-13 2013-14 2014-15
University Studies, Bachelor of University Studies 2 0 17 6
Adv Stud in Teaching & Learning, Master of Education (RODP) 8 6 4 3
Integrated Studies, Bachelor of Science 0 0 0 57
Family Nurse Practitioner, Graduate Certificate (RODP) 2 0 1 5
Liberal Studies, Bachelor of Science (RODP) 286 365 361 329
Nursing, Master of Science in Nursing (RODP) 15 32 59 87
Professional Studies, Bachelor of Science 35 55 66 76
Professional Studies, Master of Professional Studies (RODP) 17 15 22 17
College Total 365 473 530 580
University Total 3,911 4,159 4,012 4,064
Source: MTSU Office of Institutional Effectiveness, Planning and Research
Back to Table of ContentsBack to Table of ContentsBack to Table of ContentsBack to Table of Contents

Total TotalYear Male Female Hdct Year Male Female Hdct1911 120 127 247 1964 2,761 1,817 4,5781912 100 217 317 1965 3,371 2,112 5,4831913 185 289 474 1966 3,374 2,387 5,7611914 201 343 544 1967 3,547 2,710 6,2571915 199 395 594 1968 3,869 2,910 6,7791916 244 381 625 1969 4,137 3,288 7,4251917 198 303 501 1970 4,486 3,607 8,0931918 206 323 529 1971 4,819 3,827 8,6461919 63 147 210 1972 5,002 4,267 9,2691920 99 294 393 1973 5,254 4,423 9,6771921 201 393 594 1974 5,294 4,833 10,1271922 222 387 609 1975 5,538 4,976 10,5141923 431 662 1,093 1976 5,288 4,908 10,1961924 230 462 692 1977 5,159 5,064 10,2231925 100 233 333 1978 5,042 5,274 10,3161926 180 235 415 1979 5,234 5,646 10,8801927 163 370 533 1980 5,392 5,883 11,2751928 172 343 515 1981 5,305 5,626 10,9311929 169 398 567 1982 5,316 5,617 10,9331930 216 413 629 1983 5,572 5,797 11,3691931 238 351 589 1984 5,542 5,686 11,2281932 226 379 605 1985 5,397 5,896 11,2931933 218 334 552 1986 5,390 6,018 11,4081934 266 358 624 1987 5,641 6,334 11,9751935 263 346 609 1988 6,139 7,026 13,1651936 274 337 611 1989 6,587 7,549 14,1361937 252 298 550 1990 6,864 8,001 14,8651938 339 401 740 1991 7,325 8,348 15,6731939 338 403 741 1992 7,860 8,927 16,7871940 342 390 732 1993 8,100 9,283 17,3831941 225 311 536 1994 7,795 9,325 17,1201942 129 224 353 1995 7,840 9,584 17,4241943 28 238 266 1996 8,037 9,887 17,9241944 20 180 200 1997 8,155 10,211 18,3661945 43 188 231 1998 8,303 10,129 18,4321946 513 243 756 1999 8,726 10,267 18,9931947 677 399 1,076 2000 8,721 10,400 19,1211948 718 309 1,027 2001 9,160 10,913 20,0731949 740 476 1,216 2002 9,638 11,525 21,1631950 679 532 1,211 2003 10,004 11,740 21,7441951 691 570 1,261 2004 10,344 11,978 22,3221952 739 536 1,275 2005 10,418 12,136 22,5541953 903 558 1,461 2006 10,625 12,238 22,8631954 1,104 619 1,723 2007 10,750 12,496 23,2461955 1,194 738 1,932 2008 11,029 12,843 23,8721956 1,349 734 2,083 2009 11,744 13,444 25,1881957 1,420 828 2,248 2010 12,293 14,137 26,4301958 1,681 858 2,539 2011 12,251 14,191 26,4421959 1,543 820 2,363 2012 11,754 13,640 25,3941960 1,772 1,078 2,850 2013 10,906 12,975 23,8811961 2,058 1,185 3,243 2014 10,402 12,327 22,7291962 2,323 1,416 3,739 2015 10,199 12,312 22,5111963 2,551 1,497 4,048 2016 9,929 12,121 22,050
Headcount by GenderFall Terms 1911 - 2016
Back to Table of ContentsBack to Table of ContentsBack to Table of ContentsBack to Table of Contents

Number of No. Percent Number of No. PercentYear Students Change Change Students Change Change2016 16,225 -154 -0.9% 5,825 -307 -5.0% 22,050 -461 -2.0%2015 16,379 -1,108 -6.3% 6,132 890 17.0% 22,511 -218 -1.0%2014 17,487 -176 -1.0% 5,242 -976 -15.7% 22,729 -1,152 -4.8%2013 17,663 -1,011 -5.4% 6,218 -502 -7.5% 23,881 -1,513 -6.0%2012 18,674 -995 -5.1% 6,720 -53 -0.8% 25,394 -1,048 -4.0%2011 19,669 -314 -1.6% 6,773 326 5.1% 26,442 12 0.05%2010 19,983 778 4.1% 6,447 464 7.8% 26,430 1,242 4.9%2009 19,205 787 4.3% 5,983 529 9.7% 25,188 1,316 5.5%2008 18,418 423 2.4% 5,454 203 3.9% 23,872 626 2.7%2007 17,995 215 1.2% 5,251 168 3.3% 23,246 383 1.7%2001 15,270 653 4.5% 4,803 299 6.6% 20,073 952 5.0%2000 14,617 --- --- 4,504 --- --- 19,121 0 #DIV/0!
Source: SZRESTT Report
Full-Time and Part-Time Headcount
Fall Terms 2007 - 2016
Full-Time Part-Time
No. Change
Percent
Change
Number of
Students
TOTAL
Back to Table of ContentsBack to Table of ContentsBack to Table of ContentsBack to Table of Contents

Alaskan American
Native Indian Asian Black Not SpecifiedYear No. % No. % No. % No. % No. % No. % No. % No. % No. % TOTAL
2016 2 0.0% 59 0.3% 1,094 5.0% 4,425 20.1% 1,084 4.9% 12 0.1% 14,511 65.8% 691 3.1% 172 0.8% 22,050
2015 4 0.0% 60 0.3% 1,092 4.9% 4,550 20.2% 1,024 4.5% 19 0.1% 14,852 66.0% 670 3.0% 240 1.1% 22,5114
2014 6 0.0% 65 0.3% 1,017 4.5% 4,469 19.7% 981 4.3% 23 0.1% 15,226 67.0% 670 2.9% 272 1.2% 22,729
2013 4 0.0% 76 0.3% 956 4.0% 4,690 19.6% 978 4.1% 22 0.1% 16,152 67.6% 661 2.8% 342 1.4% 23,881
2012 4 0.0% 69 0.3% 979 3.9% 4,669 18.4% 927 3.7% 25 0.1% 17,668 69.6% 618 2.4% 435 1.7% 25,394
2011 5 0.0% 79 0.3% 930 3.5% 4,622 17.5% 865 3.3% 22 0.1% 18,888 71.4% 535 2.0% 496 1.9% 26,442
2010 5 0.0% 81 0.3% 834 3.2% 4,307 16.3% 767 2.9% 16 0.1% 19,388 73.4% 444 1.7% 588 2.2% 26,430
2009 9 0.0% 107 0.4% 873 3.5% 4,025 16.0% 597 2.4% 19,225 76.3% 352 1.4% 25,188
2008 10 0.0% 84 0.4% 755 3.2% 3,521 14.7% 537 2.2% 18,680 78.3% 285 1.2% 23,872
2007 14 0.1% 96 0.4% 709 3.0% 3,166 13.6% 518 2.2% 18,469 79.5% 274 1.2% 23,246
Source: SPSS Census Reports
* Effective with the 2010-11 academic year, higher education institutions must collect and report students’ race and ethnicity using the newrace/ethnicity categories as determined by the US Congress and documented in the Federal Register, Volume 72, Number 202, pp. 59266-59279, 2007. The categories used in this report comply with this federal law.
WhiteTwo or More
Races *Hispanic
Nat. Hawaiian or Other Pacific
Isl. *
Students by RaceFall Terms 2007 - 2016
Back to Table of ContentsBack to Table of ContentsBack to Table of ContentsBack to Table of Contents
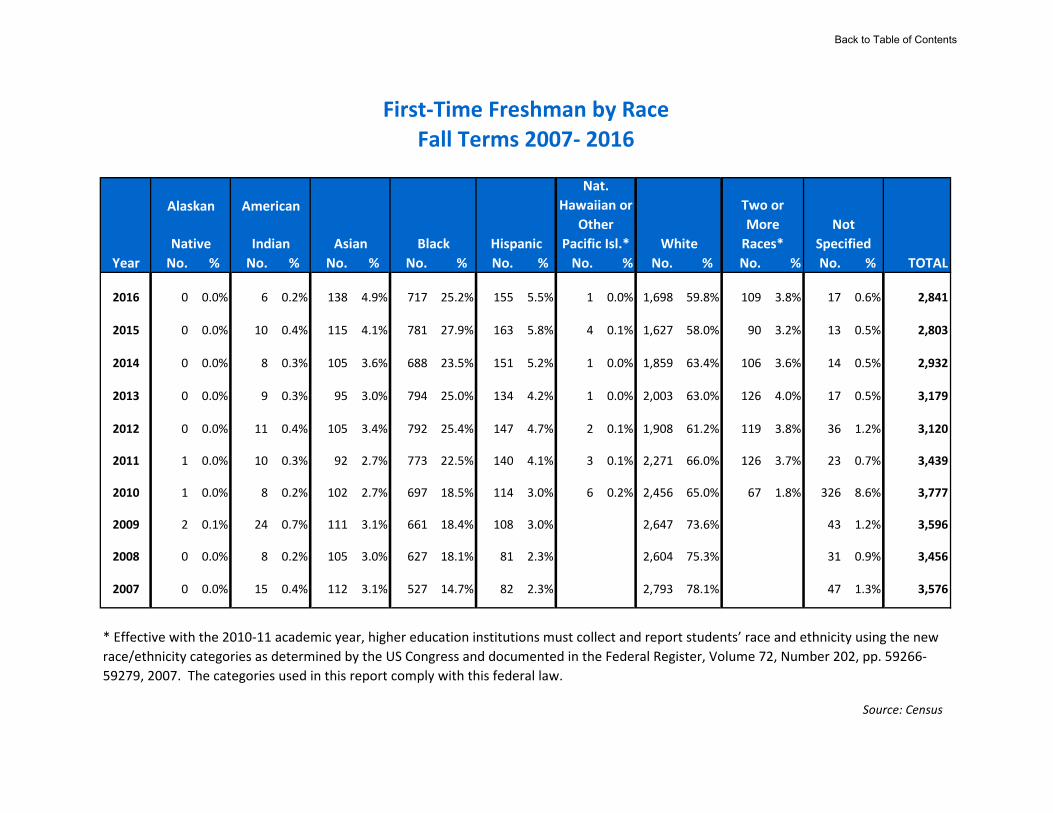
Alaskan American
Native Indian Asian BlackYear No. % No. % No. % No. % No. % No. % No. % No. % No. % TOTAL
2016 0 0.0% 6 0.2% 138 4.9% 717 25.2% 155 5.5% 1 0.0% 1,698 59.8% 109 3.8% 17 0.6% 2,841
2015 0 0.0% 10 0.4% 115 4.1% 781 27.9% 163 5.8% 4 0.1% 1,627 58.0% 90 3.2% 13 0.5% 2,803
2014 0 0.0% 8 0.3% 105 3.6% 688 23.5% 151 5.2% 1 0.0% 1,859 63.4% 106 3.6% 14 0.5% 2,932
2013 0 0.0% 9 0.3% 95 3.0% 794 25.0% 134 4.2% 1 0.0% 2,003 63.0% 126 4.0% 17 0.5% 3,179
2012 0 0.0% 11 0.4% 105 3.4% 792 25.4% 147 4.7% 2 0.1% 1,908 61.2% 119 3.8% 36 1.2% 3,120
2011 1 0.0% 10 0.3% 92 2.7% 773 22.5% 140 4.1% 3 0.1% 2,271 66.0% 126 3.7% 23 0.7% 3,439
2010 1 0.0% 8 0.2% 102 2.7% 697 18.5% 114 3.0% 6 0.2% 2,456 65.0% 67 1.8% 326 8.6% 3,777
2009 2 0.1% 24 0.7% 111 3.1% 661 18.4% 108 3.0% 2,647 73.6% 43 1.2% 3,596
2008 0 0.0% 8 0.2% 105 3.0% 627 18.1% 81 2.3% 2,604 75.3% 31 0.9% 3,456
2007 0 0.0% 15 0.4% 112 3.1% 527 14.7% 82 2.3% 2,793 78.1% 47 1.3% 3,576
Source: Census
* Effective with the 2010-11 academic year, higher education institutions must collect and report students’ race and ethnicity using the new race/ethnicity categories as determined by the US Congress and documented in the Federal Register, Volume 72, Number 202, pp. 59266-59279, 2007. The categories used in this report comply with this federal law.
First-Time Freshman by RaceFall Terms 2007- 2016
Nat. Hawaiian or
Other Pacific Isl.* White
Two or More
Races*Not
SpecifiedHispanic
Back to Table of Contents

Summary of Registration TypeFall Terms 2009-2016
% ChangeClassification 2009 2010 2011 2012 2013 2014 2015 2016 2015-2016New Undergraduates 5,770 6,057 5,645 5,194 5,103 4,790 4,841 4,776 -1.3%New Graduates 816 728 719 724 570 532 571 601 5.3%Returnees 16,946 17,938 18,600 18,010 16,893 16,206 15,590 15,105 -3.1%Re-Enrollees 1,630 1,682 1,461 1,432 1,281 1,167 1,104 1,051 -4.8%Pre-college 26 25 17 34 34 34 405 517 27.7%Total Students 25,188 26,430 26,442 25,394 23,881 22,729 22,511 22,050 -2.0%
Source: SZRESUM Report
Back to Table of ContentsBack to Table of ContentsBack to Table of ContentsBack to Table of Contents

Students by Permanent ResidencyFall Terms 2005 - 2015
Year Tennessee Out-of-State ForeignArmedForces Unknown Total
2016 19,833 1,151 1,061 2 3 22,050
2015 20,283 1,087 1,133 5 3 22,511
2014 20,629 1,135 953 10 0 22,727
2013 21,979 1,166 726 10 0 23,881
2012 23,497 1,216 673 7 1 25,394
2011 24,609 1,252 572 4 5 26,442
2010 24,764 1,200 458 2 6 26,430
2009 23,705 1,123 359 1 0 25,188
2008 22,372 1,223 271 4 2 23,872
2007 21,602 1,171 307 - 166 23,246
2006 21,325 1,236 302 - 0 22,863
2005 20,962 1,338 254 - 0 22,5542002 19,402 1,484 277 - 0 21,163
Source: Census Report
Back to Table of ContentsBack to Table of ContentsBack to Table of ContentsBack to Table of Contents
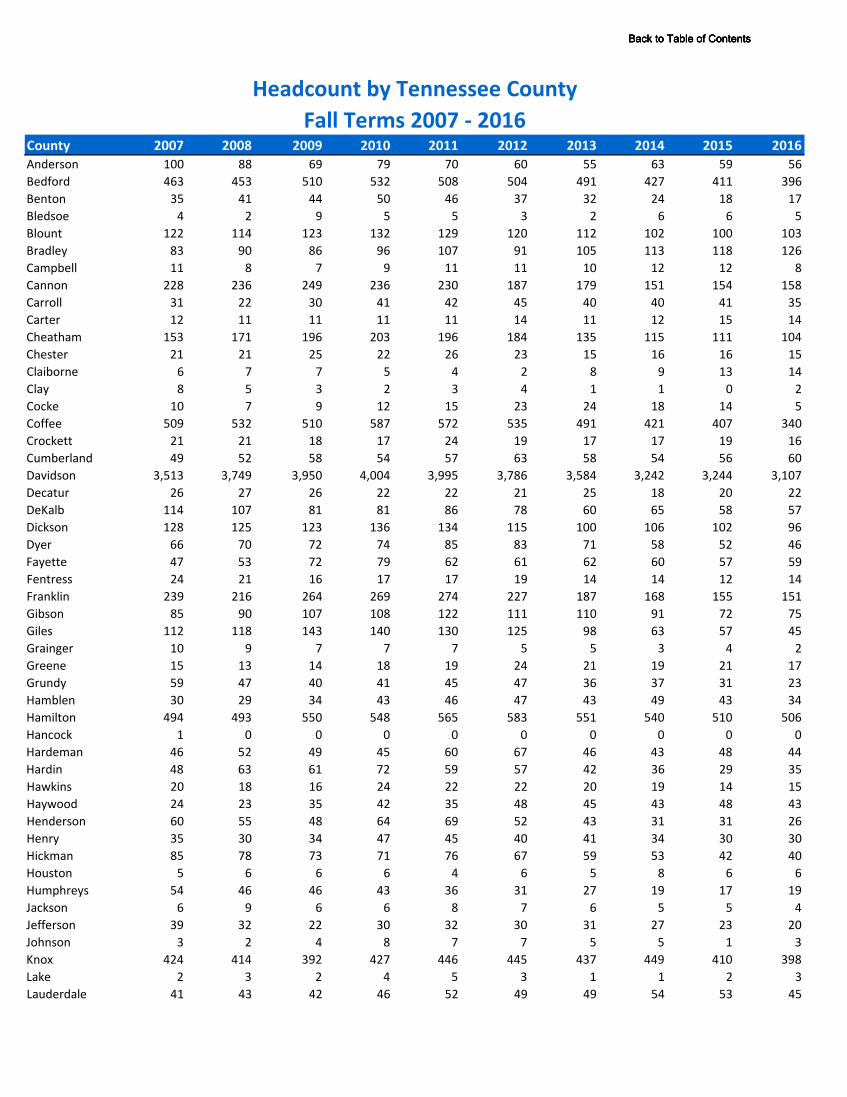
County 2007 2008 2009 2010 2011 2012 2013 2014 2015 2016Anderson 100 88 69 79 70 60 55 63 59 56Bedford 463 453 510 532 508 504 491 427 411 396Benton 35 41 44 50 46 37 32 24 18 17Bledsoe 4 2 9 5 5 3 2 6 6 5Blount 122 114 123 132 129 120 112 102 100 103Bradley 83 90 86 96 107 91 105 113 118 126Campbell 11 8 7 9 11 11 10 12 12 8Cannon 228 236 249 236 230 187 179 151 154 158Carroll 31 22 30 41 42 45 40 40 41 35Carter 12 11 11 11 11 14 11 12 15 14Cheatham 153 171 196 203 196 184 135 115 111 104Chester 21 21 25 22 26 23 15 16 16 15Claiborne 6 7 7 5 4 2 8 9 13 14Clay 8 5 3 2 3 4 1 1 0 2Cocke 10 7 9 12 15 23 24 18 14 5Coffee 509 532 510 587 572 535 491 421 407 340Crockett 21 21 18 17 24 19 17 17 19 16Cumberland 49 52 58 54 57 63 58 54 56 60Davidson 3,513 3,749 3,950 4,004 3,995 3,786 3,584 3,242 3,244 3,107Decatur 26 27 26 22 22 21 25 18 20 22DeKalb 114 107 81 81 86 78 60 65 58 57Dickson 128 125 123 136 134 115 100 106 102 96Dyer 66 70 72 74 85 83 71 58 52 46Fayette 47 53 72 79 62 61 62 60 57 59Fentress 24 21 16 17 17 19 14 14 12 14Franklin 239 216 264 269 274 227 187 168 155 151Gibson 85 90 107 108 122 111 110 91 72 75Giles 112 118 143 140 130 125 98 63 57 45Grainger 10 9 7 7 7 5 5 3 4 2Greene 15 13 14 18 19 24 21 19 21 17Grundy 59 47 40 41 45 47 36 37 31 23Hamblen 30 29 34 43 46 47 43 49 43 34Hamilton 494 493 550 548 565 583 551 540 510 506Hancock 1 0 0 0 0 0 0 0 0 0Hardeman 46 52 49 45 60 67 46 43 48 44Hardin 48 63 61 72 59 57 42 36 29 35Hawkins 20 18 16 24 22 22 20 19 14 15Haywood 24 23 35 42 35 48 45 43 48 43Henderson 60 55 48 64 69 52 43 31 31 26Henry 35 30 34 47 45 40 41 34 30 30Hickman 85 78 73 71 76 67 59 53 42 40Houston 5 6 6 6 4 6 5 8 6 6Humphreys 54 46 46 43 36 31 27 19 17 19Jackson 6 9 6 6 8 7 6 5 5 4Jefferson 39 32 22 30 32 30 31 27 23 20Johnson 3 2 4 8 7 7 5 5 1 3Knox 424 414 392 427 446 445 437 449 410 398Lake 2 3 2 4 5 3 1 1 2 3Lauderdale 41 43 42 46 52 49 49 54 53 45
Headcount by Tennessee CountyFall Terms 2007 - 2016
Back to Table of ContentsBack to Table of ContentsBack to Table of ContentsBack to Table of Contents

County 2007 2008 2009 2010 2011 2012 2013 2014 2015 2016
Headcount by Tennessee CountyFall Terms 2007 - 2016
Lawrence 128 122 131 163 176 142 163 137 124 120Lewis 52 41 41 45 33 25 30 29 28 22Lincoln 178 191 205 185 223 207 182 151 125 115Loudon 35 36 47 48 47 43 33 37 32 32Macon 35 19 23 33 35 31 33 29 31 27Madison 209 226 248 272 271 269 224 190 189 156Marion 56 54 53 60 54 39 38 35 33 41Marshall 191 191 223 242 224 190 179 191 203 195Maury 595 602 624 639 586 594 526 523 487 463McMinn 37 28 38 36 38 34 32 38 29 27McNairy 43 47 55 57 49 55 41 43 36 38Meigs 2 4 5 6 6 4 5 7 8 6Monroe 21 23 31 24 20 21 28 25 20 21Montgomery 243 258 265 272 278 265 260 278 234 238Moore 37 36 47 43 45 45 36 34 29 25Morgan 15 12 16 22 19 14 10 10 8 6Obion 36 33 32 41 39 40 36 41 37 34Overton 9 11 13 10 13 11 16 17 8 7Perry 24 16 15 12 11 10 7 10 11 7Pickett 1 3 5 5 3 2 2 1 1 3Polk 11 7 6 8 9 13 9 8 8 7Putnam 62 64 64 64 78 66 54 58 58 56Rhea 10 14 16 14 16 17 15 15 12 9Roane 67 56 61 60 66 62 56 71 69 70Robertson 188 202 209 200 210 170 147 126 111 107Rutherford 5,977 6,421 6,872 7,292 7,342 7,168 6,760 6,439 6,629 6,651Scott 11 13 15 9 8 9 18 13 9 8Sequatchie 8 8 12 7 6 2 8 10 8 4Sevier 87 81 59 54 46 60 43 42 37 40Shelby 1,072 1,174 1,291 1,411 1,427 1,509 1,494 1,448 1,506 1,418Smith 70 62 63 58 50 49 43 45 36 44Stewart 2 3 13 8 10 6 4 4 3 5Sullivan 91 79 74 77 83 79 90 86 70 58Sumner 749 759 810 789 751 636 579 513 467 491Tipton 57 64 84 108 109 102 87 91 96 89Trousdale 27 30 27 29 33 24 23 23 20 17Unicoi 1 3 2 3 3 1 1 2 2 2Union 3 6 6 9 8 9 5 5 5 6Van Buren 5 5 6 10 5 6 5 7 9 11Warren 236 233 256 267 256 210 189 170 162 181Washington 61 51 56 60 66 57 63 59 55 49Wayne 40 36 36 35 36 40 38 51 43 49Weakley 22 18 25 24 24 27 17 15 18 19White 28 22 18 15 23 17 17 15 15 28Williamson 1,950 1,979 2,052 2,172 2,033 1,904 1,739 1,573 1,508 1,513Wilson 1,054 1,107 1,156 1,151 1,120 1,025 984 953 887 859Unknown 45 --- --- 0 0 0 0 0 3 0Total 21,602 22,372 23,705 24,764 24,609 23,497 21,979 20,629 20,286 19,833
Source: Census Report
Back to Table of ContentsBack to Table of ContentsBack to Table of ContentsBack to Table of Contents
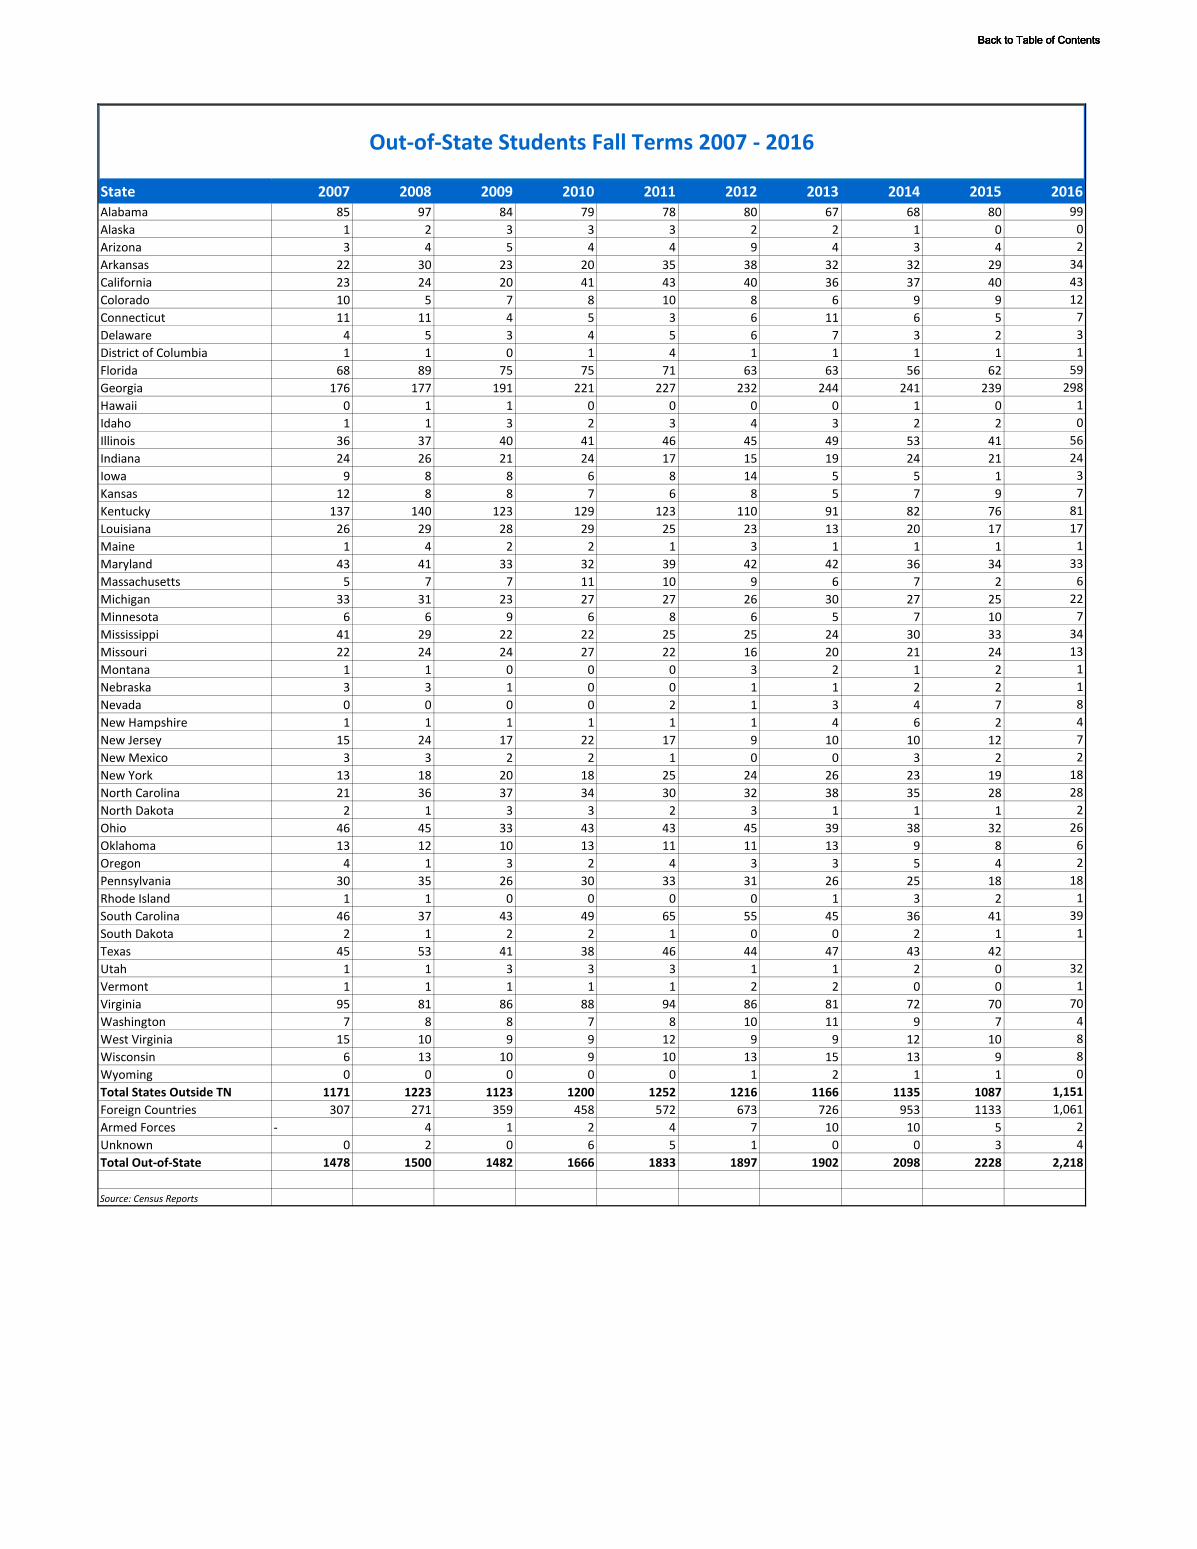
State 2007 2008 2009 2010 2011 2012 2013 2014 2015 2016Alabama 85 97 84 79 78 80 67 68 80 99Alaska 1 2 3 3 3 2 2 1 0 0Arizona 3 4 5 4 4 9 4 3 4 2Arkansas 22 30 23 20 35 38 32 32 29 34California 23 24 20 41 43 40 36 37 40 43Colorado 10 5 7 8 10 8 6 9 9 12Connecticut 11 11 4 5 3 6 11 6 5 7Delaware 4 5 3 4 5 6 7 3 2 3District of Columbia 1 1 0 1 4 1 1 1 1 1Florida 68 89 75 75 71 63 63 56 62 59Georgia 176 177 191 221 227 232 244 241 239 298Hawaii 0 1 1 0 0 0 0 1 0 1Idaho 1 1 3 2 3 4 3 2 2 0Illinois 36 37 40 41 46 45 49 53 41 56Indiana 24 26 21 24 17 15 19 24 21 24Iowa 9 8 8 6 8 14 5 5 1 3Kansas 12 8 8 7 6 8 5 7 9 7Kentucky 137 140 123 129 123 110 91 82 76 81Louisiana 26 29 28 29 25 23 13 20 17 17Maine 1 4 2 2 1 3 1 1 1 1Maryland 43 41 33 32 39 42 42 36 34 33Massachusetts 5 7 7 11 10 9 6 7 2 6Michigan 33 31 23 27 27 26 30 27 25 22Minnesota 6 6 9 6 8 6 5 7 10 7Mississippi 41 29 22 22 25 25 24 30 33 34Missouri 22 24 24 27 22 16 20 21 24 13Montana 1 1 0 0 0 3 2 1 2 1Nebraska 3 3 1 0 0 1 1 2 2 1Nevada 0 0 0 0 2 1 3 4 7 8New Hampshire 1 1 1 1 1 1 4 6 2 4New Jersey 15 24 17 22 17 9 10 10 12 7New Mexico 3 3 2 2 1 0 0 3 2 2New York 13 18 20 18 25 24 26 23 19 18North Carolina 21 36 37 34 30 32 38 35 28 28North Dakota 2 1 3 3 2 3 1 1 1 2Ohio 46 45 33 43 43 45 39 38 32 26Oklahoma 13 12 10 13 11 11 13 9 8 6Oregon 4 1 3 2 4 3 3 5 4 2Pennsylvania 30 35 26 30 33 31 26 25 18 18Rhode Island 1 1 0 0 0 0 1 3 2 1South Carolina 46 37 43 49 65 55 45 36 41 39South Dakota 2 1 2 2 1 0 0 2 1 1Texas 45 53 41 38 46 44 47 43 42 19,833Utah 1 1 3 3 3 1 1 2 0 32Vermont 1 1 1 1 1 2 2 0 0 1Virginia 95 81 86 88 94 86 81 72 70 70Washington 7 8 8 7 8 10 11 9 7 4West Virginia 15 10 9 9 12 9 9 12 10 8Wisconsin 6 13 10 9 10 13 15 13 9 8Wyoming 0 0 0 0 0 1 2 1 1 0Total States Outside TN 1171 1223 1123 1200 1252 1216 1166 1135 1087 1,151Foreign Countries 307 271 359 458 572 673 726 953 1133 1,061Armed Forces - 4 1 2 4 7 10 10 5 2Unknown 0 2 0 6 5 1 0 0 3 4Total Out-of-State 1478 1500 1482 1666 1833 1897 1902 2098 2228 2,218
Source: Census Reports
Out-of-State Students Fall Terms 2007 - 2016
Back to Table of ContentsBack to Table of ContentsBack to Table of ContentsBack to Table of Contents

Total Student Number PercentYear Credit Hours Change Change
2016 267,775 -8,000 -2.8%2015 270,442 -18,347 -6.0%2014 275,775 -13,014 -4.2%2013 288,789 -17,588 -5.7%2012 306,377 -14,804 -4.6%2011 321,181 -2,904 -0.9%2010 324,085 13,120 4.2%2009 310,965 14,201 4.8%2008 296,764 7,398 2.6%2007 289,366 2,660 0.9%2006 286,706 3,160 1.1%
2007 2008 2009 2010 2011 2012 2013 2014 2015 2016Total SCH 289,366 296,764 310,965 324,085 321,181 306,377 288,789 275,775 270,442 267,775
-
50,000
100,000
150,000
200,000
250,000
300,000
350,000
Total Student Credit Hours (SCH)Fall Terms 2006 - 2016
Back to Table of ContentsBack to Table of ContentsBack to Table of ContentsBack to Table of Contents

0573-4316 / Middle Tennessee State University does not discriminate on the basis of race, color, national origin, sex, or disability. See our full policy at www.mtsu.edu/titleix.