2016 Fact Book - Florida Department Of...
112
THE FACT BOOK REPORT FOR THE FLORIDA COLLEGE SYSTEM Compiling the fact book begins in the fall with completion being the early part of the following year. 2016
Transcript of 2016 Fact Book - Florida Department Of...

THE FACT BOOK
REPORT FOR THE FLORIDA COLLEGE SYSTEM
Compiling the fact book begins in the fall with completion being the early part of the following year.
2016

Florida College System
Florida College System
Table of Contents
Foreword Table of Contents Florida College System Florida College Funding Policy Introduction Student Information [1 Fall Headcount Enrollment [2 Annual Headcount Enrollment [3 FTE Enrollment [4 Program Enrollment [5 Credit Program Completions [6 Employee Information [7 Financial Information PART 1: Fall Headcount Enrollment 1.1F Fall Headcount Enrollment: Full-Time/Part-Time, Beginning-of-Term Fall 2015-16 1.2F Race/Ethnicity Fall Headcount Enrollment: Beginning-of-Term Fall 2015-16 1.3T Fall Headcount Enrollment: Full-Time/Part-Time by Ethnicity and Gender, Beginning-of-Term Fall 2015-16 1.4T Fall Headcount Enrollment: Colleges by Ethnicity and Gender, Beginning-of-Term Fall 2015-16 1.5F Fall Headcount Enrollment: Beginning-of-Term Fall 2011-12 through Fall 2015-16 1.6F Race/Ethnicity Fall Headcount Enrollment: Beginning-of-Term Fall 2011-12 through Fall 2015-16 1.7T Fall Headcount Enrollment: Full-Time/Part-Time by Age Ranges, Beginning-of-Term Fall 2015-16

Florida College System
Florida College System
PART 2: Annual Headcount Enrollment 2.1F Annual Student Headcount: 2010-11 through 2014-15 2.2T Annual Unduplicated Student Headcount Enrollment by College, 2014-15 2.3T Annual Unduplicated Student Headcount Enrollment by College, 2010-11 through 2014-15 2.3.1T - Students Served - Lower Division/Non-Credit 2.3.2T - Students Served - Upper Division 2.3.3T - Students Served - All: Lower Division/Non-Credit and Upper Division 2.3.4T - Students Enrolled in a Course - Lower Division/Non-Credit 2.3.5T - Students Enrolled in a Course - Upper Division 2.3.6T - Students Enrolled in a Course - All: Lower Division/Non-Credit and Upper Division 2.3.7T - Students Enrolled in a Funded Course - Lower Division/Non-Credit 2.3.8T - Students Enrolled in a Funded Course - Upper Division 2.3.9T - Students Enrolled in a Funded Course - All: Lower Division/Non-Credit and Upper Division 2.4F Annual Disability Headcount Enrollment, 2010-11 through 2014-15
PART 3: FTE Enrollment 3.1F FTE Enrollment (Funded) by Program Area, 2010-11 through 2014-15 3.2T FTE Enrollment (Funded) by College and Program Area, 2014-15 3.2.1T - Lower Division 3.2.2T - Lower and Upper Division 3.3T Annual FTE Enrollment (Funded) by College, 2010-11 through 2014-15 3.3.1T - Lower Division 3.3.2T - Upper Division 3.4T FTE Enrollment (Funded) by Discipline and College, Lower and Upper Division, 2014-15 3.5T FTE Enrollment (Funded): Actual FTE and Percent by Program Area, 2005-06 through 2014-15
PART 4: Program Enrollment 4.1F Credit Program Enrollment: Headcount by Program Area, 2014-15 4.2F Credit Program Enrollment: Workforce Education, Headcount by Program Area, 2014-15 4.3F Credit Program Enrollment: Headcount by Award Type, 2010-11 through 2014-15 4.4F Credit Program Enrollment: Workforce Education, Headcount by Program Area, 2010-11 through 2014-15 4.5T Credit Program Enrollment: Headcount by College and Ethnicity/Special Populations, 2014-15 4.5.1T - Associate in Arts Degree Program 4.5.2T - Educator Preparation Institute Certificate Program 4.5.3T - Certificate of Professional Prep Program 4.5.4T - Workforce Education: Associate in Science Degree Program 4.5.5T - Workforce Education: Postsecondary Adult Vocational Certificate Program

Florida College System
Florida College System
4.5.6T - Workforce Education: Postsecondary Vocational Certificate Program 4.5.7T - Workforce Education: Advanced Technical Certificate Program 4.5.8T - All Program Areas 4.6T Program Enrollment: Headcount by College and Program Area, 2014-15 4.7T Credit Program Enrollment: Workforce Education, Headcount by College and Program Area, 2014-15 4.8T Continuing Workforce Education Enrollment: Headcount by College and Continuing Workforce Education Course Areas, 2014-15 4.9T Credit Enrollment: Workforce Education, Headcount by College and Apprenticeship Program Areas, 2014-15 4.10T Credit Program Enrollment, Bachelors Degree Program, Headcount by College and Ethnicity/Special Populations,
2014-15 4.10.1T - Educational Bachelors Degree Programs 4.10.2T - Nursing Bachelors Degree Programs
4.10.3T - Other Bachelors Degree Programs 4.10.4T - All Bachelors Degree Programs
PART 5: Credit Program Completions 5.1F Credit Program Completers: Headcount by Award Type, 2010-11 through 2014-15 5.2F Minority Credit Program Completers, 2010-11 through 2014-15 5.3T Credit Program Completers: Headcount by College, Award Type, and Gender, 2014-15 5.4T Credit Program Completers: Headcount by College and Ethnicity/Special Populations, 2014-15 5.4.1T - Associate in Arts Degree Program 5.4.2T - Educator Preparation Institute Certificate Program 5.4.3T - Certificate of Professional Prep Program 5.4.4T - Workforce Education: Associate in Science Degree Program 5.4.5T - Workforce Education: Postsecondary Adult Vocational Certificate Program 5.4.6T - Workforce Education: Postsecondary Vocational Certificate Program 5.4.7T - Workforce Education: Advanced Technical Certificate Program 5.4.8T - All Program Areas 5.5T Credit Program Completers, Bachelor’s Degree Program, Headcount by College and Ethnicity/Special Populations,
2014-15 5.5.1T - Educational Bachelors Degree Programs 5.5.2T - Nursing Bachelors Degree Programs 5.5.3T - Other Bachelors Degree Programs 5.5.4T - All Bachelors Degree Programs
Part 6: Employee Information 6.1F Employee Headcount by Occupational Activity, Fall 2015-16 6.2F Employee Headcount by Occupational Activity, Fall 2011-12 through Fall 2015-16

Florida College System
Florida College System
6.3F Employee Headcount: Full-Time/Part-Time by Ethnicity and Gender, Fall 2015-16 6.4T College Employee Headcount by Occupational Activity: Full-Time/Part-Time, Ethnicity, and Gender, Fall 2015-16 6.5T Average Salary of Full-Time Instructional Personnel by Semesters Employed, Fall 2006-07 through Fall 2015-16 6.6T Average Salary of Full-Time Instructional Personnel: College by Semesters Employed, Fall 2015-16 6.7T Average Converted Salary of Full-Time Instructional Personnel: Headcount and Salary by College and Faculty Degree, Fall 2015-16
Part 7: Financial Information 7.1F Operating Expenditures: By Program Area and Category, 2014-15 7.2T Operating Budget – Funding History: FTE, Revenue, and Estimated Retirement Savings, 1994-95 through 2015-16 7.3T Annual Cost Analysis: Expenditures by College and Function, 2014-15 7.4T Annual Cost Analysis: Percentage by College and Function, 2014-15 7.5T Annual Cost Analysis: Expenditures by College and Category, 2014-15 7.6T Cost Analysis Summary, 2014-15 7.6.1T - FTE Based on 30 Credit Hours 7.6.2T - Actual Credit Hours 7.7T Full Cost Summary Report: Cost Per Credit Hour by Program and College, 2014-15 7.8T Student Fees for Lower Level Credit Programs: Resident Students, Colleges by Fee Type, Fee Per Credit Hour, Fall 2015 7.9T Student Fees for Lower Level Credit Programs: Non-Resident Students, Colleges by Fee Type, Fee Per Credit Hour, Fall 2015 7.10T Student Fees Comparison for Lower Level Credit Programs: Resident and Non-Resident Student Fees by College, Fall 2014, and Fall
2015 7.11T Student Fees for Upper Level Credit Programs: Resident Students, Colleges by Fee Type, Fee Per Credit Hour, Fall 2015 7.12T Student Fees for Upper Level Credit Programs: Non-Resident Students, Colleges by Fee Type, Fee Per Credit Hour, Fall 2015 7.13T Student Fees Comparison for Upper Level Credit Programs: Resident and Non-Resident Student Fees by College, Fall 2014, and Fall
2014 7.14T Facilities: Sites, Inventory, and Value by College, 2014-15
Glossary

Florida College System
Division of Accountability, Research, and Measurement Department of Education, 501 Turlington Building, 325 W. Gaines Street, Tallahassee, Florida 32399-0400
http://www.fldoe.org/cc
Florida College System
POINTS OF INTEREST
System Profile (2014-15)
Florida Colleges 28 Campuses 68 Sites 178 College Owned Buildings 2,096 Acres of Land (Owned & Leased) 13,276 Capital Assets
Staff Resources (Fall 2015)
All Employees 45,294 Faculty 22,465 Full-Time 6,156 Part-Time 16,309
Operating Funding (2015-16)
General Revenue 935,360,793 Student Fees 817,647,932 Lottery Funding 244,903,227
Enrollment (2014-15)
Total Annual Student Headcount 813,838
Accessibility
Florida’s 28 colleges operate 178 sites around the state, providing educational opportunities within commuting distance to all of Florida’s residents.
Fall 2015 College Credit Students
Full-Time Students 35% Part-Time Students 65% Average Student Age 25 Gender 59% Female Minority Enrollment 58%
Program Enrollments (2014-15)*
Bachelors Degree Program 37,022 Associate in Arts Degree (AA) 341,675 Associate in Science Degree (AS) 112,409 College Credit Certificates (CCC) 30,285 Vocational Certificates 22,697 Developmental and Vocational Preparatory 94,545 Adult and Secondary 29,783 Continuing Workforce Education 118,165 Life Long Learning 1,226 Recreation and Leisure 52,934 Educator Preparation Institute (EPI) 2,064 Certificate of Professional Prep 142 Apprenticeship 2,471
*Students may enroll in more than one program.
Degrees/Certificates Awarded (2014-15)
Total Degrees/Certificates Awarded 110,844 Bachelors Degree Program 6,776 AA Degrees 55,888 AS Degrees (majority enter the workforce) 14,973 Vocational and College Credit Certificates 32,271 Educator Preparation Institute (EPI) 716 Certificate of Professional Prep 59

Florida College System
Florida College System
Florida's college system began in 1933 when Palm Beach Junior College was established as a public two-year college. Palm Beach Junior College remained the only public two-year college in Florida until 1947, when the status of St. Petersburg Junior College, begun in 1927, was changed from a private junior college to public. When the Florida Minimum Foundation Program was enacted in 1947, combined state and local support for Florida colleges became a reality. Because of this combined support, Pensacola Junior College was established in 1947. Also, Chipola Junior College, established in 1947 as a private institution, changed the status to become a public junior college a year later. In 1955, the Legislature established the Community College Council. The report was published in 1957 under the title, "The Community Junior College in Florida's Future." This report was approved by the State Board of Education and contained recommendations for needed legal changes and a master plan for establishing a system of public colleges in Florida. The system would provide post-high school education within commuting distance for more than 90 percent of Florida's population. With the development and implementation of the master plan, Florida became a national model for the development of a statewide system of Florida colleges. Consequently, the 1957 Legislature authorized the creation of the Division of Community Colleges in the State Department of Education and appropriated funds for six new colleges to begin implementation of the master plan. These colleges were: Gulf Coast Community College Manatee Junior College Central Florida Community College North Florida Junior College Daytona Beach Community College St. Johns River Community College The state continued to build additional colleges through the 1960s and early 1970s. In 1972, the master plan was fully implemented with the opening of Pasco-Hernando Community College. There were twelve black colleges that merged with the Florida College System. These black colleges served as a critical foundation for the Florida College System:
Booker T. Washington Junior College founded in 1949, merged with Pensacola Junior College in 1965 Carver Junior College founded in 1960, merged with Brevard Junior College in 1963 Collier-Blocker Junior College founded in 1960, merged with St. Johns River Community College in 1965 Gibbs Junior College founded in 1957, merged with St. Petersburg Junior College in 1966 Hampton Junior College founded in 1958, merged with Central Florida Community College in 1966 Jackson College founded in 1961, merged with Chipola Junior College in 1966 Johnson College founded in 1962, merged with Lake-Sumter Community College in 1966 Lincoln College founded in 1960, merged with Indian River Community College in 1965 Roosevelt College founded in 1958, merged with Palm Beach Community College in 1965 Rosenwald College founded in 1958, merged with Gulf Coast Community College in 1966 Suwannee River College founded in 1959, merged with North Florida Community College in 1967 Volusia Community College founded in 1957, merged with Daytona Beach Community College in 1966

Florida College System
Florida College System
Florida’s 28 colleges were established to serve the citizens of the State of Florida by offering the first two years of a baccalaureate degree, vocational education, and adult continuing education. Of the 182 sites, there are 146 official Public Education Capital Outlay (PECO) sites in the Florida College System. Furthermore, in order to bring instruction closer to students, more than 2,000 other locations, such as churches, public schools, and community centers are also used. To further ensure the efficient and effective operation of Florida's college system, the Florida Legislature established the State Community College Coordinating Board in 1979, and in 1983 replaced that board with the State Board of Community Colleges. The State Board of Community Colleges earned the respect of the colleges by preserving local control, represented by local Boards of Trustees, while simultaneously establishing system wide policies and coordination. The Florida college system has received national recognition because of this unusual balance between local control, state coordination and funding. In 2001, the statute that established the State Board of Community Colleges was repealed and the Florida college system was placed under the jurisdiction of the Florida Board of Education. During the expansion and modification of Florida’s college system, the postsecondary educational needs in Florida were changing. The identifiable changes included an increase in the average age of students; changes in enrollment patterns, population growth, and population patterns; increased emphasis on vocational education and economic development; and the entry of women into the work force in unprecedented numbers. The Postsecondary Education Planning Commission (PEPC) was established in 1981 to provide overall guidance and direction for the improvement of postsecondary education in Florida. A new college master plan was developed. The Master Plan for the Florida college system was first published in September 1983. This Master Plan addressed several concerns, including emphasis on the improvement of quality, the trend toward increased part-time enrollments, minority needs, women's needs, and student financial aid needs. The 1988 Master Plan updated the 1983 plan and identified challenges (from which strategic plans would evolve) addressing areas such as quality education, economic development, and the quality of life. In 2005, a committee of college faculty, staff, administrators, and trustees with assistance from the Division of Florida Colleges (DFC) developed a strategic plan. The 2005 Division of Florida Colleges’ Strategic Plan is aligned with the Department of Education’s strategic imperatives and goals, and includes the following eight sector level goals:
1. Ensure open-door access and student success
2. Vitalize communities through the State by enhancing workforce development programs in community-specific need areas
3. Facilitate baccalaureate expansion policies which help meet unmet community economic and educational needs
4. Enhance leadership and professional development opportunities for faculty, staff and administration
5. Enhance learning and student services through expanded use of emerging technologies

Florida College System
Florida College System
6. Maintain a low tuition policy that supports open-door access
7. Align college funding with performance
8. Implement a comprehensive facilities development plan that supports continued access The statewide mission for the Florida College System is contained in Chapter 1004, Section 65, Florida Statutes. The primary mission of the Florida College System includes the following:
Providing lower level undergraduate instruction and awarding associate degrees;
Preparing students directly for careers requiring less than baccalaureate degrees;
Providing student development services; and
Promoting economic development for the state within each college district through the provision of special programs. The secondary role for colleges includes offering programs in:
Community services that are not directly related to academic or occupational advancement;
Adult general education; and
Recreational and leisure services. As stated in Florida Statutes, Chapter 1004, Section 65(4):
"The colleges' mission reflects a commitment to be responsive to local educational needs and challenges. In achieving this mission, the colleges strive to maintain sufficient local authority and flexibility while preserving appropriate legal accountability to the state."
Beginning in 2001, several institutions within the Florida College System were given permission to offer the four-year baccalaureate degree. St. Petersburg College was the first institution allowed to do this. A number of colleges have followed by offering baccalaureate degrees. The initial emphasis was on teacher education, nursing and computer technology. St. Petersburg College has begun offering degrees in other areas as well. While the ability to offer the four-year degree has expanded the mission of these institutions, the major focus remains that of a college. In 2008, the legislature approved a pilot project that changed the name of the Florida Community College System to the Florida College System. Also, several colleges dropped the word “community” and added the word “state” to the institution’s name.
Florida College System
Florida College System
Florida's 28 Colleges
College
Year the College was established
Palm Beach State College 1933 St. Petersburg College 1947 Chipola College 1948 Pensacola State College 1947 Gulf Coast State College 1957 College of Central Florida 1957 Daytona State College 1958 State College of Florida, Manatee-Sarasota 1958 North Florida Community College 1958 St. Johns River State College 1958 Eastern Florida State College 1960 Broward College 1960 Indian River State College 1960 Miami Dade College 1960 Edison State College 1962 Florida Gateway College 1962 Lake-Sumter State College 1962 Northwest Florida State College 1964 Polk State College 1965 Florida Keys Community College 1966 Florida State College at Jacksonville 1966 Santa Fe College 1966 Seminole State College of Florida 1966 South Florida State College 1966 Tallahassee Community College 1967 Valencia College 1967 Hillsborough Community College 1968 Pasco-Hernando State College 1972

Florida College System
Florida College System
Florida College Funding Policy The following describes the present State Funding Policy for Florida's College Operations: General appropriations are provided to each college in a lump sum, which means the institution is given an amount of money to operate the college and provide various programs and services. Colleges' local Boards of Trustees are given the flexibility, by law, to develop a budget with available resources which best meets their college’s priorities for offering programs and meeting local needs. Colleges' local Boards of Trustees are also given the responsibility and provided the flexibility to set local policy on employee pay, salary increases, most fringe benefits, and job qualifications/requirements. The primary source for these operating funds is state General Revenue, but some state funds are also provided from lottery proceeds. The balance of the college operating funds is made up of student tuition, fees, grants, and other local college funds. In addition, categorical funding is sometimes provided for specific special issues or projects. The Florida Legislature determines the specific amount to be funded for the issue or project and expenditures of these funds are to be limited to that purpose. An example is matching funds for Private Contribution/State Matching Programs. Each year the Florida Legislature specifies a standard student fee amount per credit hour to be charged. Florida Colleges’ local Boards of Trustees are authorized to set fees at their college within a range of ten percent below to fifteen percent above this standard amount.

STUDENT INFORMATION

Fall Headcount Enrollment
Note: On the following pages, Fall Enrollment does not include students in such programs as Adult Education, Continuing Workforce Education, or General Education Development (GED©) Preparation.
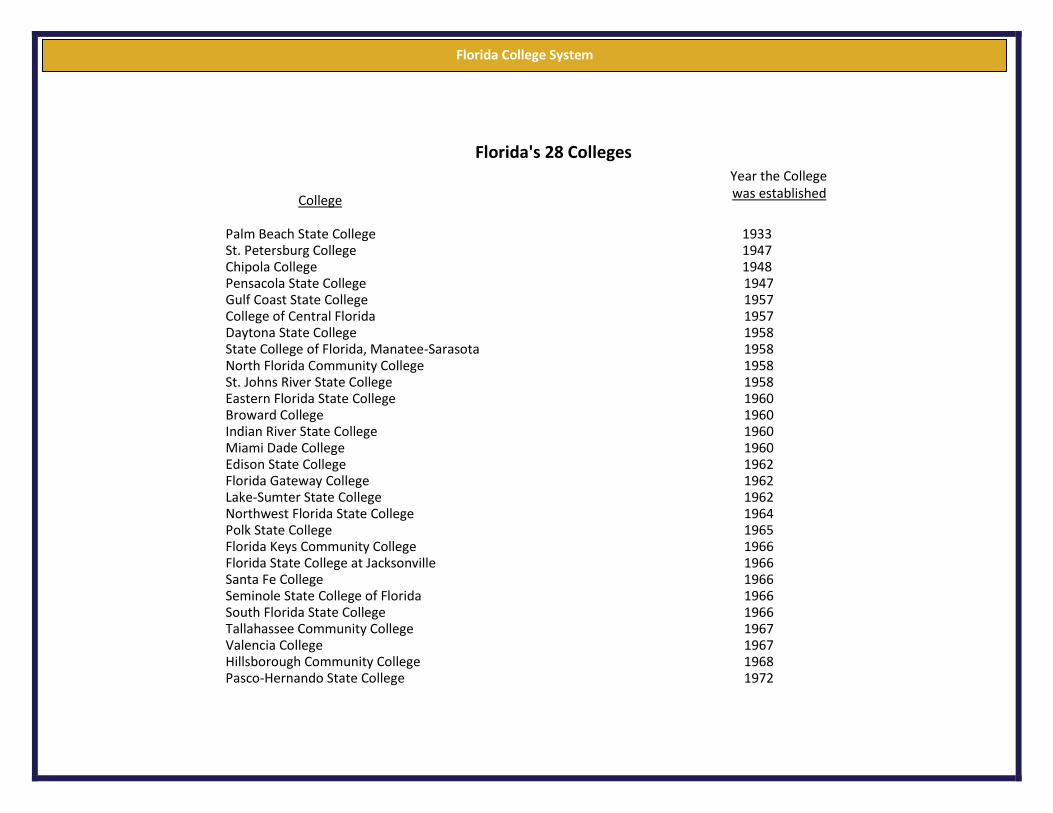
Fact Book 1.1F Florida College System
Fall Headcount Enrollment Full-Time/Part-Time
Beginning-of-Term Fall 2015-16
Category
DEG/CERT Seeking First-Time
DEG/CERT Seeking Transfer-In
DEG/CERT Seeking Continuing
NON-DEG/CERT Seeking Total
Full-Time 46,808 9,473 92,574 11,398 160,253
Part-Time 31,842 12,979 195,172 55,017 295,010
Total 78,650 22,452 287,746 66,415 455,263
PERA - 1.1F and 1.3T 11/20/2015 15:48:39 Source: Federal IPEDS EF2 based on data from the 2015-16 Student Data Base Fall Beginning-of-Term (refer to table 1.3T)

Fact Book 1.2F Florida College System
Race/Ethnicity Fall Headcount Enrollment Beginning-of-Term Fall 2015-16
Fall Headcount Enrollment
Black Hispanic Non-Resident Alien Other Minority Two or More Races Unknown Ethnicity White Total
Sum % Sum % Sum % Sum % Sum % Sum % Sum % Sum %
Fall
78,928
17.34
124,083
27.26
10,270
2.26
14,283
3.14
10,202
2.24
25,916
5.69
191,581
42.08
455,263
100.00 2015
PERA - 1.2F and 1.4T 11/20/2015 15:48:53 Source: Data based on data from the 2015-16 Student Data Base Fall Beginning-of-Term (refer to table 1.4T) Other Minority = American Indian, Alaskan Native, Asian, Native Hawaiian, Pacific Islanders

Fact Book 1.3T Florida College System
Fall Headcount Enrollment Full-Time/Part-Time by Ethnicity and Gender
Students Enrolled for Credit Beginning-of-Term Fall 2015-16
Full-Time Part-Time All
DEG/CERT
Seeking
First-Time
DEG/CERT
Seeking
Transfer-In
DEG/CERT
Seeking
Continuing
NON-DEG/
CERT
Seeking
Total
Full-Time
Students
DEG/CERT
Seeking
First-Time
DEG/CERT
Seeking
Transfer-In
DEG/CERT
Seeking
Continuing
NON-DEG/
CERT
Seeking
Total
Part-Time
Students
Grand Total
Female Non-Resident Alien 738 261 1,745 167 2,911 364 60 1,853 280 2,557 5,468
Hispanic 8,540 1,117 14,483 1,223 25,363 5,138 1,893 32,925 6,874 46,830 72,193
Black 4,218 893 9,249 631 14,991 3,841 1,666 25,078 4,147 34,732 49,723
Other Minority 748 139 1,533 236 2,656 427 252 3,338 1,337 5,354 8,010
White 8,869 2,055 20,458 3,692 35,074 6,478 3,448 48,255 17,363 75,544 110,618
Two or More Races 755 179 1,209 177 2,320 495 211 2,118 799 3,623 5,943
Unknown Ethnicity 1,129 229 2,531 1,039 4,928 743 396 5,494 3,323 9,956 14,884
Subtotal 24,997 4,873 51,208 7,165 88,243 17,486 7,926 119,061 34,123 178,596 266,839
Male Non-Resident Alien 741 236 1,753 126 2,856 342 50 1,358 196 1,946 4,802
Hispanic 7,118 1,006 11,195 705 20,024 4,241 1,209 22,345 4,071 31,866 51,890
Black 3,258 668 5,931 300 10,157 2,896 936 13,268 1,948 19,048 29,205
Other Minority 666 124 1,281 174 2,245 377 164 2,571 916 4,028 6,273
White 8,469 2,206 17,964 2,148 30,787 5,407 2,317 31,255 11,197 50,176 80,963
Two or More Races 582 130 959 98 1,769 409 135 1,501 445 2,490 4,259
Unknown Ethnicity 977 230 2,283 682 4,172 684 242 3,813 2,121 6,860 11,032
Subtotal 21,811 4,600 41,366 4,233 72,010 14,356 5,053 76,111 20,894 116,414 188,424
Total 46,808 9,473 92,574 11,398 160,253 31,842 12,979 195,172 55,017 295,010 455,263
PERA - 1.1F and 1.3T 11/23/2015 10:10:12
Source: Federal IPEDS EF2 based on data from 2015-16 Student Data Base Fall Beginning-of-Term
Other Minority = American Indian, Alaskan Native, Asian, Native Hawaiian, Pacific Islanders
Note1: Number of Full-Time students with unknown gender not included = 1,685
Note2: Number of Part-Time students with unknown gender not included = 3,674

Colleges by Ethnicity and Gender Beginning-of-Term Fall 2015-16
Non-Resident
Alien
Hispanic
Black
Other Minority
White Two or More
Races
Unknown
Ethnicity
Total
Female Male Female Male Female Male Female Male Female Male Female Male Female Male Female Male
Eastern Florida 53 64 1,156 771 1,072 648 304 202 6,248 4,378 265 180 146 106 9,244 6,349
Broward 852 683 8,651 6,335 9,059 5,190 865 679 4,584 3,655 460 356 1,015 694 25,486 17,592
Central Florida 53 52 656 452 622 312 104 97 2,867 1,687 180 109 165 96 4,647 2,805
Chipola 4 4 53 33 196 103 25 12 1,038 603 26 14 14 8 1,356 777
Daytona 25 41 1,213 778 1,213 645 232 158 5,689 3,784 165 94 147 108 8,684 5,608
FL SouthWestern 189 146 2,657 1,591 1,032 660 226 150 4,809 3,105 181 125 518 320 9,612 6,097
Fla SC at Jax 150 73 1,160 775 4,212 2,191 688 552 7,404 5,427 416 251 1,674 1,191 15,704 10,460
Florida Keys 3 1 153 103 50 43 14 11 318 270 10 11 51 43 599 482
Gulf Coast 10 6 181 116 383 194 108 79 2,383 1,586 117 80 109 101 3,291 2,162
Hillsborough 460 411 4,103 2,853 2,822 1,767 553 423 5,326 4,307 391 283 1,507 1,365 15,162 11,409
Indian River 114 106 2,159 1,416 1,794 1,077 237 148 6,119 4,060 220 181 337 236 10,980 7,224
Florida Gateway 4 1 92 56 204 79 32 15 1,478 847 20 16 9 7 1,839 1,021
Lake Sumter 18 14 221 124 298 169 138 112 1,821 1,164 81 54 255 172 2,832 1,809
State College FL 102 83 904 579 590 316 162 128 4,256 2,722 138 96 285 171 6,437 4,095
Miami Dade 1,917 1,628 24,970 18,115 5,780 3,559 405 296 1,957 1,780 126 117 927 755 36,082 26,250
North Florida 2 0 45 17 204 79 12 2 564 310 0 0 6 2 833 410
Northwest Fla 14 12 274 208 14 10 2 1 79 63 12 6 3,019 2,191 3,414 2,491
Palm Beach State 306 225 4,741 3,524 4,404 2,760 507 419 5,740 4,991 391 282 742 584 16,831 12,785
Pasco-Hernando 20 10 1,261 833 373 209 191 147 4,804 2,967 203 142 134 93 6,986 4,401
Pensacola 20 19 355 246 885 521 216 176 3,996 2,661 315 204 120 106 5,907 3,933
Polk 61 52 1,303 794 1,157 554 169 110 3,568 2,214 174 93 253 155 6,685 3,972
St. Johns River 11 4 342 179 456 196 124 90 3,220 1,977 130 90 158 114 4,441 2,650
St. Petersburg 135 100 2,366 1,525 2,850 1,433 743 511 12,171 8,377 510 290 412 344 19,187 12,580
Santa Fe 100 169 1,213 1,149 1,371 840 279 246 4,754 3,966 280 217 91 92 8,088 6,679
Seminole State 197 163 2,287 1,846 1,878 963 327 282 4,779 4,288 303 246 99 83 9,870 7,871
South Florida 22 21 554 307 188 88 44 34 781 536 31 21 19 13 1,639 1,020
Tallahassee 56 90 707 742 2,276 1,514 109 91 3,103 3,095 229 220 101 112 6,581 5,864
Valencia 570 624 8,416 6,423 4,340 3,085 1,194 1,102 6,762 6,143 569 481 2,571 1,770 24,422 19,628
System 5,468 4,802 72,193 51,890 49,723 29,205 8,010 6,273 110,618 80,963 5,943 4,259 14,884 11,032 266,839 188,424
PERA - 1.2F and 1.4T 11/20/2015 15:48:53
Source: Federal IPEDS EF2 based on data from 2015-16 Student Data Base Fall Beginning-of-Term
Other Minority = American Indian, Alaskan Native, Asian, Native Hawaiian, Pacific Islanders
Note1: Number of Full-Time students with unknown gender not included = 1,685
Note2: Number of Part-Time students with unknown gender not included = 3,674

Fact Book 1.5F Florida College System
Fall Headcount Enrollment
Beginning-of-Term Fall 2011-12 through Fall 2015-16
Category
First Time First Year First Time Transfer Degree/Certificate Seeking Non-Degree Seeking Total Fall 2011-12 85,427 24,857 305,672 62,174 478,130
Fall 2012-13 79,981 25,115 305,517 64,873 475,486
Fall 2013-14 81,645 23,976 295,933 63,259 464,813
Fall 2014-15 81,466 23,757 294,858 60,831 460,912
Fall 2015-16 78,650 22,452 287,746 66,415 455,263
PERA - 1.5F 11/20/2015 15:48:59
Source: Federal IPEDS EF2 based on data from the 2011-12 through 2015-16 Student Data Base Fall Beginning-of-Term (refer to table 1.3T for current year)
In 2011-12, some end-of-term data was used to produce this report for Daytona, Fla SC at Jax and St. Johns River.

Fact Book 1.6F Florida College System
Race/Ethnicity Fall Headcount Enrollment
Beginning-of-Term Fall 2011-12 through Fall 2015-16
Race_Ethnicity
Black Hispanic Non-Resident Alien Other Minority Two or More Races Unknown Ethnicity White Total Fall 2011-12 86,451 114,149 6,405 14,279 5,732 30,582 220,532 478,130
Fall 2012-13 83,921 118,416 6,397 14,130 7,204 31,142 214,276 475,486
Fall 2013-14 83,666 118,821 8,891 14,099 8,552 22,398 208,386 464,813
Fall 2014-15 82,701 122,391 9,321 14,175 9,650 21,497 201,177 460,912
Fall 2015-16 78,928 124,083 10,270 14,283 10,202 25,916 191,581 455,263
PERA - 1.6F 11/20/2015 15:49:10
Source: Data based upon the 2011-12 through 2015-16 Student Data Base Fall Beginning-of-Term (refer to table 1.4T for current year)
In 2011-12, some end-of-term data was used to produce this report for Daytona, Fla SC at Jax and St. Johns River
Other Minority = Asian, American Indian, Alaskan Native, Native Hawaiian, Pacific Islanders

Fact Book 1.7T Florida College System
Fall Headcount Enrollment Full-Time/Part-Time by Age Ranges
Students Enrolled for Credit Beginning-of-Term Fall 2015-16
Female Male Grand Total
Full-Time Under 18 6,459 3,360 9,819
18-19 35,715 28,213 63,928
20-21 16,687 14,826 31,513
22-24 9,655 8,715 18,370
25-29 8,191 7,744 15,935
30-34 4,339 3,859 8,198
35-39 2,747 2,110 4,857
40-49 3,175 2,153 5,328
50-64 1,201 945 2,146
65 Over 37 42 79
Age Unknown 37 43 80
Subtotal 88,243 72,010 160,253
Part-Time Under 18 18,792 11,070 29,862
18-19 24,515 19,149 43,664
20-21 28,766 23,602 52,368
22-24 28,493 20,805 49,298
25-29 26,953 17,437 44,390
30-34 15,675 8,976 24,651
35-39 11,076 5,419 16,495
40-49 15,603 6,273 21,876
50-64 8,110 3,283 11,393
65 Over 551 364 915
Age Unknown 62 36 98
Subtotal 178,596 116,414 295,010
Grand Total 266,839 188,424 455,263
PERA - 1.7T 11/20/2015 15:49:17
Source: Federal IPEDS EF2 based on data from 2015-16 Student Data Base Fall Beginning-of-Term
Note: Full-Time and Part-Time students having unknown gender are not included.
Note: The age is based on the Integrated Postsecondary Education Data System (IPEDS) October 15th cutoff date.

Annual Headcount Enrollment

Fact Book 2.1F Florida College System Annual
Student Headcount 2010-11 through 2014-15
Rec & Leisure Unduplicated Total
2010-11 57,761 903,846 961,607
2011-12 64,557 879,948 944,505
2012-13 65,363 843,733 909,096
2013-14 59,932 813,509 873,441
2014-15 52,934 813,538 866,472
PERA - 2.1F 02/22/2016 14:23:44 Source: 2010-11 through 2014-15 Student Data Base and 2010-11 through 2014-15 EA-3 (Refer to table 4.6T for current year)

Fact Book 2.2T Florida College System
Annual Unduplicated Student Headcount Enrollment
2014-15
DIVISION
LOWER/NON-CREDIT UPPER ALL
STUDENTS SERVED
STUDENTS
ENROLLED IN A
COURSE
FUNDED STUDENTS
ENROLLED IN A
COURSE
STUDENTS SERVED
STUDENTS
ENROLLED IN A
COURSE
FUNDED STUDENTS
ENROLLED IN A
COURSE
STUDENTS SERVED
STUDENTS
ENROLLED IN A
COURSE
FUNDED STUDENTS
ENROLLED IN A
COURSE
Eastern Florida 24,508 23,998 21.270 669 669 663 24,620 24,110 21.382
Broward 66,528 65,723 63.465 2,167 2,161 2.129 67,313 66,502 64.238
Central Florida 13,138 12,435 10.855 648 645 634 13,278 12,572 10.992
Chipola 2,957 2,933 2.442 242 240 233 3,131 3,105 2.609
Daytona 26,807 26,645 22.001 2,031 2,022 1.992 27,679 27,508 22.897
FL SouthWestern 20,770 20,521 20.354 1,356 1,348 1.330 21,499 21,242 21.064
Fla SC at Jax 50,825 49,283 45.009 3,044 3,012 2.986 52,190 50,616 46.353
Florida Keys 1,828 1,802 1.549 0 0 0 1,828 1,802 1.549
Gulf Coast 12,240 10,394 8.874 158 139 139 12,285 10,420 8.902
Hillsborough 44,085 43,715 39.889 0 0 0 44,085 43,715 39.889
Indian River 26,926 26,487 26.168 3,193 3,180 3.164 28,276 27,824 27.506
Florida Gateway 4,539 4,504 4.077 54 54 54 4,575 4,540 4.113
Lake Sumter 7,029 6,943 6.000 106 106 106 7,061 6,975 6.038
State College FL 20,721 19,074 15.021 803 798 795 21,069 19,417 15.369
Miami Dade 139,597 137,728 103.318 4,576 4,486 4.411 141,737 139,778 105.483
North Florida 2,064 1,989 1.720 0 0 0 2,064 1,989 1.720
Northwest Fla 11,570 11,169 10.467 821 815 795 11,979 11,572 10.885
Palm Beach State 46,105 45,367 42.161 1,548 1,542 1.520 46,816 46,072 42.873
Pasco-Hernando 17,016 16,670 15.216 250 250 249 17,105 16,759 15.306
Pensacola 18,313 18,032 16.651 562 562 559 18,522 18,241 16.864
Polk 16,164 15,860 15.801 1,773 1,766 1.755 16,920 16,609 16.548
St. Johns River 10,843 10,488 9.952 439 435 435 11,036 10,677 10.160
St. Petersburg 51,657 51,263 40.673 5,970 5,937 5.770 55,362 54,935 44.289
Santa Fe 22,681 21,679 20.786 1,179 1,163 1.152 23,094 22,076 21.189
Seminole State 29,226 28,810 28.212 1,310 1,306 1.286 29,684 29,264 28.668
South Florida 5,984 5,806 4.749 164 164 163 6,029 5,851 4.797
Tallahassee 38,017 37,632 18.571 0 0 0 38,017 37,632 18.571
Valencia 66,113 64,988 60.463 340 339 335 66,284 65,158 60.634
System 798,251 781,938 675.714 33,403 33,139 32.655 813,538 796,961 690.888
PERA: HEADCOUNT REPORT LUD, HDCNT - 11/20/2015 15:54:10
SOURCE: 2014-15 Student Data Base
Notes: Upper Division includes any student enrolled in an upper division course or granted a baccalaureate degree. Lower Division/Non-Credit includes any student enrolled in a lower division or
non-credit course or granted an award other than a baccalaureate degree or was reported with no course enrollment.
Students Served - Any student reported on the Student Database. May not be enrolled in a course, but was granted an award or acceleration credit or other service.
Students Enrolled in a Course - Student reported on the Student Database that was enrolled in any course.
Funded Students Enrolled in a Course - Student reported on the Student Database and eligible for state funding, so that the hours count toward Funded FTE.

Fact Book 2.3.1T Florida College System
Annual Unduplicated Student Headcount Enrollment
2010-11 Through 2014-15 Students Served - Lower Division/Non-Credit
2010-11 2011-12 2012-13 2013-14 2014-15
Eastern Florida 28,775 27,647 26,552 25,777 24,508
Broward 65,411 68,651 67,688 66,163 66,528
Central Florida 17,719 16,363 16,002 14,225 13,138
Chipola 3,595 3,534 3,349 3,157 2,957
Daytona 36,545 31,206 28,234 27,468 26,807
FL SouthWestern 25,545 24,791 22,101 21,182 20,770
Fla SC at Jax 76,623 66,367 56,215 54,151 50,825
Florida Keys 2,940 2,481 2,343 2,000 1,828
Gulf Coast 13,726 13,226 12,993 13,097 12,240
Hillsborough 46,648 46,654 45,712 43,841 44,085
Indian River 32,258 30,000 28,157 26,785 26,926
Florida Gateway 5,778 5,576 4,899 4,603 4,539
Lake Sumter 8,133 7,936 7,609 7,072 7,029
State College FL 22,817 22,096 21,355 17,033 20,721
Miami Dade 145,331 143,725 140,688 135,531 139,597
North Florida 2,515 2,285 2,096 1,889 2,064
Northwest Fla 15,132 14,496 13,180 12,288 11,570
Palm Beach State 50,418 48,529 47,403 46,587 46,105
Pasco-Hernando 17,716 18,383 16,493 16,384 17,016
Pensacola 22,150 21,628 21,279 19,914 18,313
Polk 16,708 16,586 17,323 17,152 16,164
St. Johns River 11,052 12,165 10,866 10,932 10,843
St. Petersburg 56,027 57,739 54,146 50,756 51,657
Santa Fe 25,843 25,897 24,227 23,190 22,681
Seminole State 32,646 32,269 32,226 30,294 29,226
South Florida 8,648 6,306 5,867 5,547 5,984
Tallahassee 39,303 38,130 38,353 37,767 38,017
Valencia 66,544 66,504 65,608 65,787 66,113
System 896,546 871,170 832,964 800,572 798,251
PERA: HEADCOUNT REPORT HISTORY LUD, HDHST - 11/20/2015 15:54:24
SOURCE: 2010-11 Through 2014-15 Student Data Base
Notes: Students Served - Any student reported on the Student Database. May not be enrolled in a course, but was granted an award or acceleration credit or other service.
Lower Division/Non-Credit includes any student enrolled in a lower division or non-credit course or granted an award other than a baccalaureate degree or was reported with no course enrollment.

Fact Book 2.3.2T Florida College System
Annual Unduplicated Student Headcount Enrollment
2010-11 Through 2014-15 Students Served - Upper Division
2010-11 2011-12 2012-13 2013-14 2014-15
Eastern Florida 0 0 0 244 669
Broward 994 1,491 1,665 1,887 2,167
Central Florida 74 218 350 513 648
Chipola 232 264 226 221 242
Daytona 1,395 1,639 1,783 1,899 2,031
FL SouthWestern 1,174 1,240 1,265 1,265 1,356
Fla SC at Jax 1,470 2,117 2,594 2,703 3,044
Gulf Coast 11 41 92 154 158
Indian River 1,522 1,914 2,412 2,881 3,193
Florida Gateway 0 0 17 33 54
Lake Sumter 0 0 37 78 106
State College FL 97 243 526 739 803
Miami Dade 2,502 3,023 3,843 4,197 4,576
Northwest Fla 718 790 808 814 821
Palm Beach State 751 1,065 1,272 1,499 1,548
Pasco-Hernando 0 0 0 0 250
Pensacola 124 324 464 543 562
Polk 275 644 1,101 1,486 1,773
St. Johns River 52 178 273 375 439
St. Petersburg 5,254 5,485 5,480 5,554 5,970
Santa Fe 385 577 830 1,046 1,179
Seminole State 32 287 712 1,113 1,310
South Florida 0 0 48 94 164
Valencia 0 124 167 264 340
System 17,062 21,664 25,965 29,602 33,403
PERA: HEADCOUNT REPORT HISTORY LUD, HDHST - 11/20/2015 15:54:34
SOURCE: 2010-11 Through 2014-15 Student Data Base
Notes: Students Served - Any student reported on the Student Database. May not be enrolled in a course, but was granted an award or acceleration credit or other service.
Upper Division includes any student enrolled in an upper division course or granted a baccalaureate degree.

Fact Book 2.3.3T Florida College System
Annual Unduplicated Student Headcount Enrollment
2010-11 Through 2014-15 Students Served - All: Lower Division/Non Credit and Upper Division
2010-11 2011-12 2012-13 2013-14 2014-15
Eastern Florida 28,775 27,647 26,552 25,846 24,620
Broward 65,708 69,168 68,261 66,809 67,313
Central Florida 17,760 16,399 16,061 14,331 13,278
Chipola 3,737 3,713 3,523 3,307 3,131
Daytona 37,119 31,883 28,937 28,228 27,679
FL SouthWestern 26,018 25,353 22,757 21,881 21,499
Fla SC at Jax 76,986 66,951 57,114 55,220 52,190
Florida Keys 2,940 2,481 2,343 2,000 1,828
Gulf Coast 13,729 13,233 13,026 13,150 12,285
Hillsborough 46,648 46,654 45,712 43,841 44,085
Indian River 32,857 30,688 28,978 27,890 28,276
Florida Gateway 5,778 5,576 4,906 4,626 4,575
Lake Sumter 8,133 7,936 7,619 7,088 7,061
State College FL 22,863 22,174 21,546 17,354 21,069
Miami Dade 146,526 144,964 142,254 137,397 141,737
North Florida 2,515 2,285 2,096 1,889 2,064
Northwest Fla 15,469 14,887 13,602 12,704 11,979
Palm Beach State 50,677 48,956 47,880 47,194 46,816
Pasco-Hernando 17,716 18,383 16,493 16,384 17,105
Pensacola 22,196 21,728 21,436 20,094 18,522
Polk 16,817 16,843 17,673 17,664 16,920
St. Johns River 11,071 12,214 10,969 11,071 11,036
St. Petersburg 58,759 60,485 57,196 54,112 55,362
Santa Fe 25,901 26,003 24,438 23,485 23,094
Seminole State 32,653 32,341 32,449 30,703 29,684
South Florida 8,648 6,306 5,879 5,562 6,029
Tallahassee 39,303 38,130 38,353 37,767 38,017
Valencia 66,544 66,567 65,680 65,912 66,284
System 903,846 879,948 843,733 813,509 813,538
PERA: HEADCOUNT REPORT HISTORY LUD, HDHST - 11/20/2015 15:54:41
SOURCE: 2010-11 Through 2014-15 Student Data Base
Notes: Students Served - Any student reported on the Student Database. May not be enrolled in a course, but was granted an award or acceleration credit or other service.
Lower Division/Non-Credit includes any student enrolled in a lower division or non-credit course or granted an award other than a baccalaureate degree or was reported with no course enrollment.
Upper Division includes any student enrolled in an upper division course or granted a baccalaureate degree.
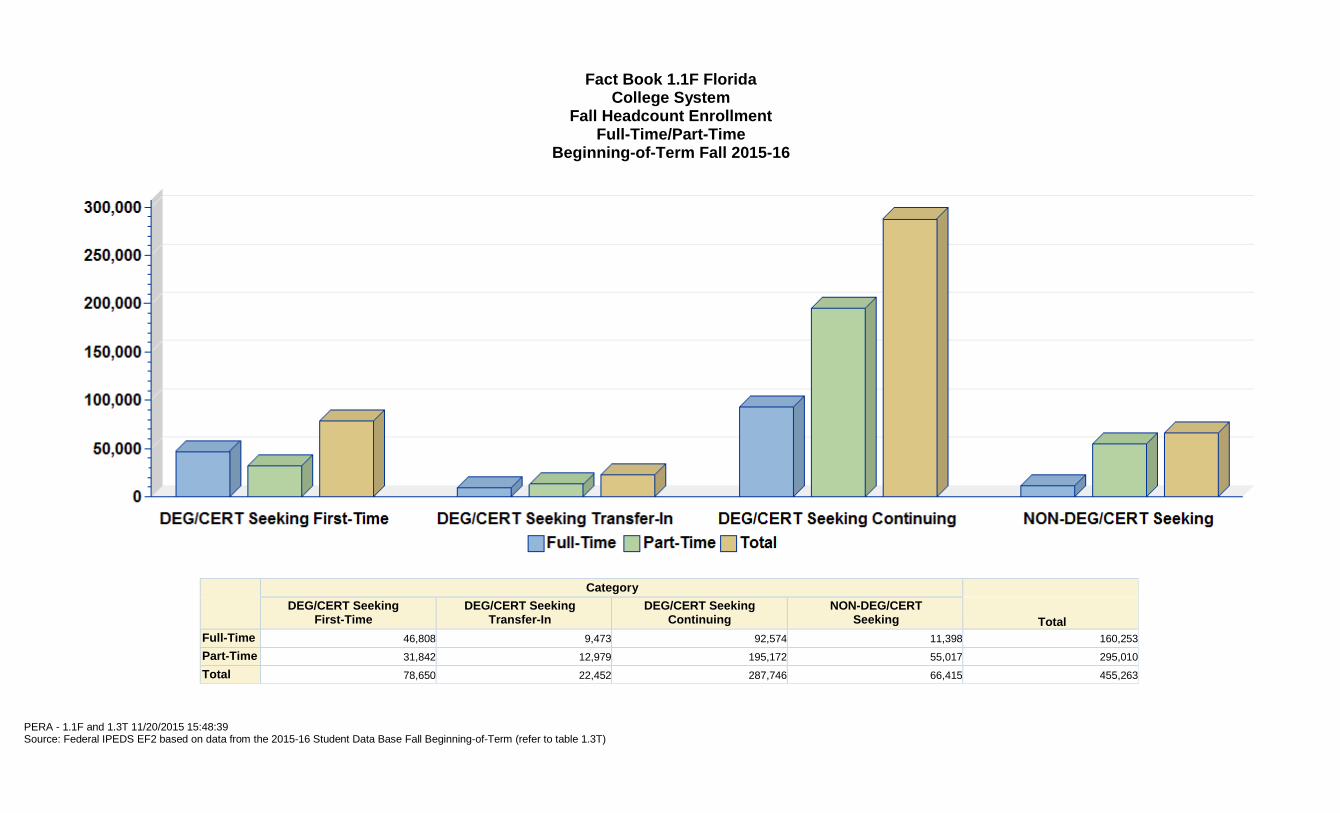
Fact Book 2.3.4T Florida College System
Annual Unduplicated Student Headcount Enrollment
2010-11 Through 2014-15 Students Enrolled in a Course - Lower Division/Non Credit
2010-11 2011-12 2012-13 2013-14 2014-15
Eastern Florida 28,502 27,350 26,337 25,575 23,998
Broward 63,778 66,246 64,891 65,620 65,723
Central Florida 16,775 15,409 13,528 13,365 12,435
Chipola 3,543 3,489 3,318 3,124 2,933
Daytona 35,454 30,332 27,866 26,958 26,645
FL SouthWestern 24,687 23,970 21,592 20,761 20,521
Fla SC at Jax 75,617 65,447 55,452 52,626 49,283
Florida Keys 2,914 2,413 2,316 1,986 1,802
Gulf Coast 13,426 12,839 11,749 11,086 10,394
Hillsborough 46,102 45,803 45,193 43,579 43,715
Indian River 31,543 29,011 27,394 26,288 26,487
Florida Gateway 5,666 5,439 4,843 4,571 4,504
Lake Sumter 8,024 7,775 7,500 6,992 6,943
State College FL 21,858 21,238 20,312 16,386 19,074
Miami Dade 142,700 138,775 136,604 133,756 137,728
North Florida 2,498 2,240 2,076 1,858 1,989
Northwest Fla 14,727 14,012 12,734 11,549 11,169
Palm Beach State 49,104 47,431 45,990 46,068 45,367
Pasco-Hernando 17,501 17,965 16,243 16,188 16,670
Pensacola 21,888 21,296 20,958 19,634 18,032
Polk 16,485 16,232 17,068 16,869 15,860
St. Johns River 10,835 10,704 10,489 10,565 10,488
St. Petersburg 55,653 56,630 53,478 50,195 51,263
Santa Fe 25,055 25,070 23,407 22,046 21,679
Seminole State 32,268 31,748 31,743 29,852 28,810
South Florida 8,534 6,160 5,737 5,389 5,806
Tallahassee 38,876 37,088 37,963 37,271 37,632
Valencia 65,467 64,798 63,941 64,214 64,988
System 879,480 846,910 810,722 784,371 781,938
PERA: HEADCOUNT REPORT HISTORY LUD, HDHST - 11/20/2015 15:54:48
SOURCE: 2010-11 Through 2014-15 Student Data Base
Student reported on the Student Database enrolled in a course.
Lower Division/Non-Credit includes any student enrolled in a lower division or non-credit course.

Fact Book 2.3.5T Florida College System
Annual Unduplicated Student Headcount Enrollment
2010-11 Through 2014-15 Students Enrolled in a Course - Upper Division
2010-11 2011-12 2012-13 2013-14 2014-15
Eastern Florida 0 0 0 244 669
Broward 994 1,490 1,659 1,874 2,161
Central Florida 74 218 350 513 645
Chipola 229 260 225 221 240
Daytona 1,387 1,630 1,771 1,891 2,022
FL SouthWestern 1,170 1,230 1,257 1,254 1,348
Fla SC at Jax 1,468 2,099 2,551 2,674 3,012
Gulf Coast 11 41 92 154 139
Indian River 1,517 1,899 2,406 2,874 3,180
Florida Gateway 0 0 17 33 54
Lake Sumter 0 0 37 78 106
State College FL 97 243 525 735 798
Miami Dade 2,452 3,003 3,803 4,158 4,486
Northwest Fla 717 784 806 810 815
Palm Beach State 751 1,063 1,268 1,491 1,542
Pasco-Hernando 0 0 0 0 250
Pensacola 124 324 464 543 562
Polk 275 642 1,098 1,483 1,766
St. Johns River 52 178 273 374 435
St. Petersburg 5,166 5,426 5,429 5,516 5,937
Santa Fe 385 576 825 1,045 1,163
Seminole State 32 287 712 1,110 1,306
South Florida 0 0 48 94 164
Valencia 0 124 167 264 339
System 16,901 21,517 25,783 29,433 33,139
PERA: HEADCOUNT REPORT HISTORY LUD, HDHST - 11/20/2015 15:54:55
SOURCE: 2010-11 Through 2014-15 Student Data Base
Student reported on the Student Database enrolled in a course.
Upper Division includes any student enrolled in an upper division course.

Fact Book 2.3.6T Florida College System
Annual Unduplicated Student Headcount Enrollment
2010-11 Through 2014-15 Students Enrolled in a Course - Lower Division/Non Credit or Upper Division
2010-11 2011-12 2012-13 2013-14 2014-15
Eastern Florida 28,502 27,350 26,337 25,644 24,110
Broward 64,075 66,762 65,458 66,253 66,502
Central Florida 16,816 15,445 13,587 13,471 12,572
Chipola 3,682 3,664 3,491 3,274 3,105
Daytona 36,020 31,000 28,557 27,710 27,508
FL SouthWestern 25,156 24,522 22,240 21,449 21,242
Fla SC at Jax 75,978 66,013 56,308 53,666 50,616
Florida Keys 2,914 2,413 2,316 1,986 1,802
Gulf Coast 13,429 12,846 11,782 11,139 10,420
Hillsborough 46,102 45,803 45,193 43,579 43,715
Indian River 32,137 29,684 28,209 27,386 27,824
Florida Gateway 5,666 5,439 4,850 4,594 4,540
Lake Sumter 8,024 7,775 7,510 7,008 6,975
State College FL 21,904 21,316 20,502 16,703 19,417
Miami Dade 143,845 139,994 138,130 135,583 139,778
North Florida 2,498 2,240 2,076 1,858 1,989
Northwest Fla 15,063 14,397 13,154 11,961 11,572
Palm Beach State 49,363 47,856 46,463 46,667 46,072
Pasco-Hernando 17,501 17,965 16,243 16,188 16,759
Pensacola 21,934 21,396 21,115 19,814 18,241
Polk 16,594 16,487 17,415 17,378 16,609
St. Johns River 10,854 10,753 10,592 10,703 10,677
St. Petersburg 58,297 59,317 56,477 53,513 54,935
Santa Fe 25,113 25,175 23,613 22,340 22,076
Seminole State 32,275 31,820 31,966 30,258 29,264
South Florida 8,534 6,160 5,749 5,404 5,851
Tallahassee 38,876 37,088 37,963 37,271 37,632
Valencia 65,467 64,861 64,013 64,339 65,158
System 886,619 855,541 821,309 797,139 796,961
PERA: HEADCOUNT REPORT HISTORY LUD, HDHST - 11/20/2015 15:55:03
SOURCE: 2010-11 Through 2014-15 Student Data Base
Student reported on the Student Database enrolled in a course.
Lower Division/Non-Credit includes any student enrolled in a lower division or non-credit course.
Upper Division includes any student enrolled in an upper division course.

Fact Book 2.3.7T Florida College System
Annual Unduplicated Student Headcount Enrollment
2010-11 Through 2014-15 Funded Students Enrolled in a Course - Lower Division/Non Credit
2010-11 2011-12 2012-13 2013-14 2014-15
Eastern Florida 25,175 24,470 23,402 22,587 21,270
Broward 59,881 62,560 61,680 62,443 63,465
Central Florida 12,716 12,241 11,581 11,314 10,855
Chipola 2,818 2,819 2,734 2,592 2,442
Daytona 31,804 26,401 23,788 22,873 22,001
FL SouthWestern 23,774 23,294 21,041 20,397 20,354
Fla SC at Jax 58,310 56,677 50,763 48,356 45,009
Florida Keys 2,221 1,999 1,887 1,702 1,549
Gulf Coast 11,293 10,744 9,795 9,276 8,874
Hillsborough 40,649 40,837 40,167 39,468 39,889
Indian River 31,429 28,832 27,277 26,119 26,168
Florida Gateway 4,652 4,626 4,327 4,289 4,077
Lake Sumter 6,789 6,651 6,406 6,014 6,000
State College FL 17,393 16,555 15,900 14,893 15,021
Miami Dade 110,778 108,203 105,078 103,049 103,318
North Florida 1,950 1,863 1,752 1,623 1,720
Northwest Fla 13,099 12,002 11,221 10,752 10,467
Palm Beach State 43,711 43,461 42,729 42,767 42,161
Pasco-Hernando 15,688 15,969 14,531 14,586 15,216
Pensacola 20,557 19,999 19,604 17,981 16,651
Polk 15,034 16,137 16,594 16,639 15,801
St. Johns River 10,054 10,030 9,831 9,782 9,952
St. Petersburg 42,301 43,042 41,417 40,442 40,673
Santa Fe 22,965 22,634 21,547 20,921 20,786
Seminole State 31,430 30,820 30,879 29,209 28,212
South Florida 6,025 5,090 4,579 4,438 4,749
Tallahassee 22,835 22,851 20,891 19,297 18,571
Valencia 59,238 60,825 59,987 60,010 60,463
System 744,569 731,632 701,388 683,819 675,714
PERA: HEADCOUNT REPORT HISTORY LUD, HDHST - 11/20/2015 15:55:09
SOURCE: 2010-11 Through 2014-15 Student Data Base
Student reported on the Student Database enrolled in a funded course.
Lower Division/Non-Credit includes any student enrolled in a lower division or non-credit course.

Fact Book 2.3.8T Florida College System
Annual Unduplicated Student Headcount Enrollment
2010-11 Through 2014-15 Funded Students Enrolled in a Course - Upper Division
2010-11 2011-12 2012-13 2013-14 2014-15
Eastern Florida 0 0 0 241 663
Broward 978 1,465 1,630 1,840 2,129
Central Florida 74 215 348 508 634
Chipola 227 260 224 220 233
Daytona 1,369 1,600 1,753 1,856 1,992
FL SouthWestern 1,147 1,202 1,220 1,225 1,330
Fla SC at Jax 1,461 2,080 2,536 2,659 2,986
Gulf Coast 11 41 92 152 139
Indian River 1,511 1,892 2,397 2,866 3,164
Florida Gateway 0 0 17 33 54
Lake Sumter 0 0 37 77 106
State College FL 97 242 518 730 795
Miami Dade 2,411 2,949 3,734 4,093 4,411
Northwest Fla 708 773 797 797 795
Palm Beach State 732 1,045 1,247 1,469 1,520
Pasco-Hernando 0 0 0 0 249
Pensacola 124 323 463 542 559
Polk 271 637 1,088 1,474 1,755
St. Johns River 52 178 273 374 435
St. Petersburg 4,959 5,208 5,271 5,357 5,770
Santa Fe 379 570 818 1,035 1,152
Seminole State 30 279 693 1,088 1,286
South Florida 0 0 48 94 163
Valencia 0 124 164 259 335
System 16,541 21,083 25,368 28,989 32,655
PERA: HEADCOUNT REPORT HISTORY LUD, HDHST - 11/20/2015 15:55:16
SOURCE: 2010-11 Through 2014-15 Student Data Base
Student reported on the Student Database enrolled in a funded course.
Upper Division includes any student enrolled in an upper division course or granted a baccalaureate degree.

Fact Book 2.3.9T Florida College System
Annual Unduplicated Student Headcount Enrollment
2010-11 Through 2014-15 Funded Students Enrolled in a Course - All: Lower Division/Non-Credit and Upper Division
2010-11 2011-12 2012-13 2013-14 2014-15
Eastern Florida 25,175 24,470 23,402 22,658 21,382
Broward 60,176 63,074 62,238 63,071 64,238
Central Florida 12,757 12,280 11,641 11,422 10,992
Chipola 2,957 2,997 2,908 2,741 2,609
Daytona 32,377 27,065 24,488 23,641 22,897
FL SouthWestern 24,248 23,837 21,676 21,068 21,064
Fla SC at Jax 58,681 57,253 51,627 49,412 46,353
Florida Keys 2,221 1,999 1,887 1,702 1,549
Gulf Coast 11,296 10,752 9,834 9,330 8,902
Hillsborough 40,649 40,837 40,167 39,468 39,889
Indian River 32,023 29,505 28,092 27,216 27,506
Florida Gateway 4,652 4,626 4,335 4,312 4,113
Lake Sumter 6,789 6,651 6,419 6,034 6,038
State College FL 17,441 16,636 16,094 15,216 15,369
Miami Dade 111,937 109,441 106,655 104,965 105,483
North Florida 1,950 1,863 1,752 1,623 1,720
Northwest Fla 13,468 12,420 11,658 11,183 10,885
Palm Beach State 43,974 43,889 43,206 43,378 42,873
Pasco-Hernando 15,688 15,969 14,531 14,586 15,306
Pensacola 20,603 20,100 19,764 18,162 16,864
Polk 15,143 16,392 16,935 17,147 16,548
St. Johns River 10,073 10,081 9,935 9,951 10,160
St. Petersburg 44,928 45,735 44,395 43,739 44,289
Santa Fe 23,023 22,741 21,759 21,220 21,189
Seminole State 31,437 30,890 31,098 29,621 28,668
South Florida 6,025 5,090 4,591 4,453 4,797
Tallahassee 22,835 22,851 20,891 19,297 18,571
Valencia 59,238 60,888 60,058 60,133 60,634
System 751,764 740,332 712,036 696,749 690,888
PERA: HEADCOUNT REPORT HISTORY LUD, HDHST - 11/20/2015 15:55:22
SOURCE: 2010-11 Through 2014-15 Student Data Base
Student reported on the Student Database enrolled in a funded course.
Lower Division/Non-Credit includes any student enrolled in a lower division or non-credit course.
Upper Division includes any student enrolled in an upper division course.

Fact Book 2.4F Florida College System
Annual Disability Headcount Enrollment 2010-11 through 2014-15
Visual Hearing Physical Speech Learning Mental Autism Brain Injury Other Not Categorized Total
2010-11 686 736 3,062 105 8,633 7,215 0 0 573 81 21,091
2011-12 717 796 3,100 119 9,081 7,904 233 74 540 0 22,564
2012-13 661 749 2,950 130 8,779 7,796 417 186 582 0 22,250
2013-14 635 737 2,764 151 8,631 7,976 622 284 665 0 22,465
2014-15 618 682 2,581 157 8,374 8,001 744 313 756 0 22,226
PERA - 2.4F 11/20/2015 15:54:00 Source: 2010-11 through 2014-15 Student Data Base Note: Disability categories are self-reported by the student and verified by the appropriate office within each institution. Note: The total may contain duplicate headcounts for students who have more than one disability code for the reporting year.

FTE Enrollment
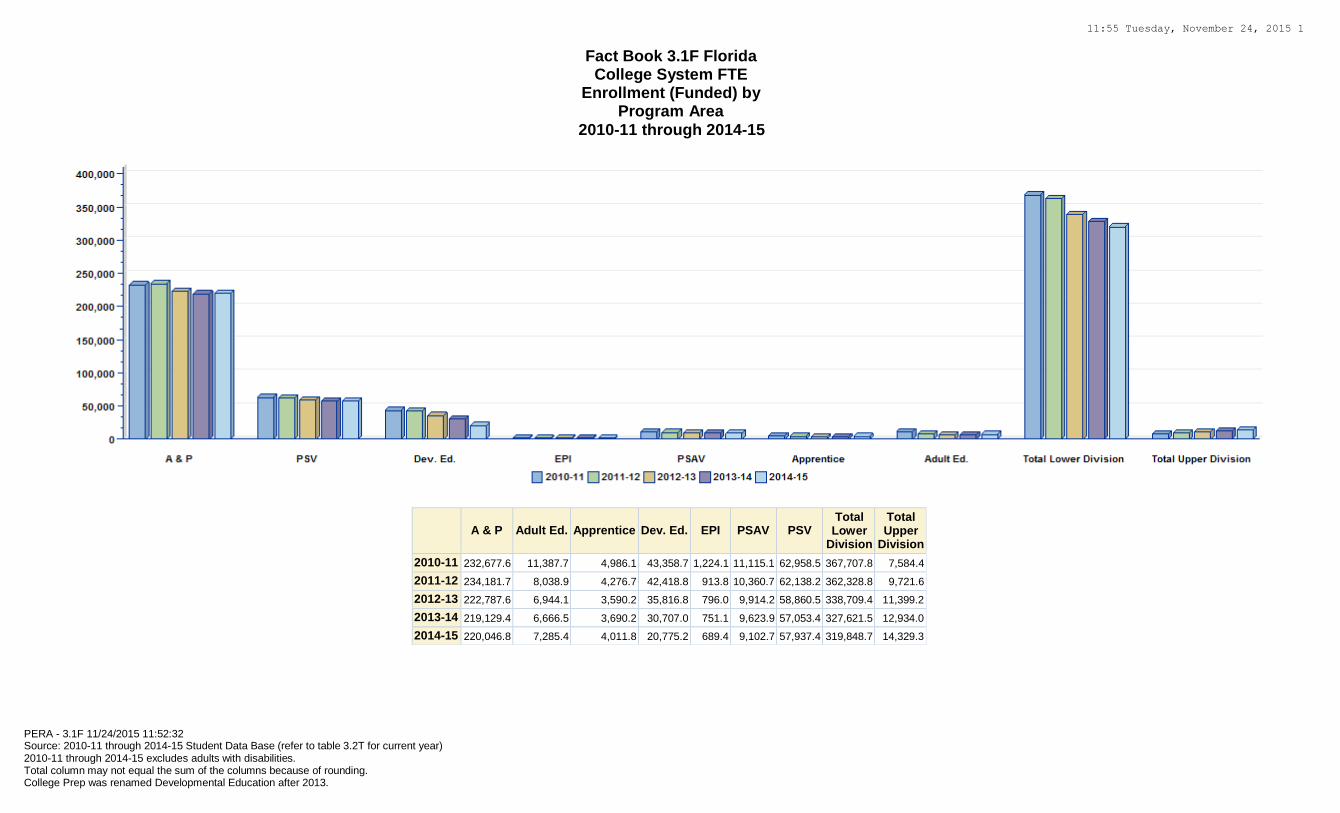
11:55 Tuesday, November 24, 2015 1
Fact Book 3.1F Florida College System FTE
Enrollment (Funded) by Program Area
2010-11 through 2014-15
A & P
Adult Ed.
Apprentice
Dev. Ed.
EPI
PSAV
PSV
Total Lower
Division
Total Upper
Division
2010-11 232,677.6 11,387.7 4,986.1 43,358.7 1,224.1 11,115.1 62,958.5 367,707.8 7,584.4
2011-12 234,181.7 8,038.9 4,276.7 42,418.8 913.8 10,360.7 62,138.2 362,328.8 9,721.6
2012-13 222,787.6 6,944.1 3,590.2 35,816.8 796.0 9,914.2 58,860.5 338,709.4 11,399.2
2013-14 219,129.4 6,666.5 3,690.2 30,707.0 751.1 9,623.9 57,053.4 327,621.5 12,934.0
2014-15 220,046.8 7,285.4 4,011.8 20,775.2 689.4 9,102.7 57,937.4 319,848.7 14,329.3
PERA - 3.1F 11/24/2015 11:52:32 Source: 2010-11 through 2014-15 Student Data Base (refer to table 3.2T for current year) 2010-11 through 2014-15 excludes adults with disabilities. Total column may not equal the sum of the columns because of rounding. College Prep was renamed Developmental Education after 2013.

FACT BOOK 3.2.1T FLORIDA COLLEGE SYSTEM
FTE ENROLLMENT: FUNDED, LOWER DIVISION
2014-15 FTE-3
A & P
POSTSEC VOC
DEVELOPM ENTAL ED
DEV ED
EAP
EPI
POSTSEC ADULT
VOC
APPRN CLASS
APPRN OJT
ADULT BASIC
LTRCY EAP
ADULT SEC
GED PREP
VOC PREP
VOC PREP EAP
TOTAL
EFSC 7321.5 2344.9 424.2 3.8 0.0 705.7 0.0 0.0 0.0 0.0 0.0 0.0 0.0 0.0 10800.1
BROW 18294.9 7551.6 1750.7 1058.2 58.0 518.1 0.0 0.0 0.0 0.0 0.0 0.0 0.0 0.0 29231.5
CFLA 3608.3 1240.7 272.7 181.8 0.0 159.2 0.0 0.0 13.6 0.0 0.0 18.7 0.0 0.0 5495.0
CHIP 875.2 254.2 46.0 0.0 0.0 121.7 0.0 0.0 0.0 0.0 0.0 0.0 0.4 0.0 1297.5
DAYT 6018.0 2123.9 437.3 0.0 0.7 728.1 34.5 285.6 416.6 192.6 21.8 111.6 5.9 0.0 10376.6
FSW 8408.9 527.8 324.7 37.5 0.0 19.3 0.0 0.0 0.0 0.0 0.0 0.0 0.0 0.0 9318.2
FJAX 12066.5 3629.2 1179.9 30.7 0.1 906.1 43.2 323.7 182.1 372.2 32.3 56.1 1.5 0.0 18823.6
FKEY 471.4 176.2 28.2 0.0 0.0 31.5 0.0 0.0 0.0 0.0 0.0 0.0 0.0 0.0 707.3
GULF 2908.2 741.7 124.9 0.0 27.9 141.3 0.0 0.0 0.0 0.0 0.0 0.0 0.0 0.0 3944.0
HILL 13685.2 3285.5 1020.0 312.4 162.8 512.7 113.6 1117.3 50.5 0.0 0.0 10.0 0.0 0.0 20270.0
INDR 6697.3 2645.4 393.5 0.0 0.0 733.7 51.3 440.8 238.1 589.5 53.5 84.5 0.0 41.9 11969.5
FGC 1209.7 413.8 47.5 0.0 9.8 246.4 0.0 0.0 0.0 0.0 0.0 0.0 0.0 0.0 1927.2
LSSC 2002.0 621.6 111.8 0.0 8.8 0.0 0.0 0.0 0.0 0.0 0.0 0.0 0.0 0.0 2744.2
SCF 6169.3 589.4 323.5 32.6 36.7 0.0 0.0 0.0 0.0 0.0 0.0 0.0 0.0 0.0 7151.5
MIAM 38082.7 3940.3 2701.7 3101.3 27.9 748.8 14.0 163.9 1448.3 495.4 0.0 497.2 0.0 538.2 51759.7
NFLA 517.6 173.2 24.2 0.0 0.0 90.8 0.0 0.0 0.0 0.0 0.0 0.0 0.0 0.0 805.8
NWFC 3251.9 670.7 167.3 0.0 0.0 156.1 0.0 0.0 95.6 67.7 0.0 6.2 0.0 0.0 4415.5
PALM 15418.9 1563.7 742.8 32.3 33.9 935.1 55.0 495.1 0.0 0.0 0.0 0.0 0.0 0.0 19276.8
PASC 4341.6 2249.5 623.8 0.0 36.8 352.2 0.0 0.0 5.7 0.0 0.0 0.4 0.0 0.0 7610.0
PENS 4561.8 1670.4 314.5 0.0 16.8 367.5 0.0 0.0 115.0 46.2 265.7 26.1 0.0 0.0 7384.0
POLK 4623.8 1711.4 265.7 17.2 82.2 85.1 0.0 0.0 0.0 0.0 0.0 0.0 0.0 0.0 6785.4
ST.J 3113.1 1015.9 169.9 0.0 39.3 83.7 4.1 36.5 54.0 0.0 0.0 21.5 0.0 0.0 4538.0
ST.P 11833.2 4993.7 1069.2 77.3 0.0 180.3 0.0 0.0 0.0 0.0 0.0 0.0 0.0 0.0 18153.7
SANF 7098.3 2441.0 541.1 57.7 25.7 223.2 20.0 229.7 95.5 34.7 1.9 2.7 0.0 0.0 10771.5
SEMI 7587.6 3026.7 492.3 45.8 43.3 255.6 54.3 503.0 89.1 238.2 130.7 74.2 0.0 0.0 12540.8
SFLA 1434.8 12.3 28.7 0.0 0.0 294.7 0.0 23.7 236.8 77.6 0.0 38.7 0.0 0.0 2147.3
TALL 7613.2 1095.0 691.2 13.2 0.0 267.5 0.4 2.1 46.8 26.5 0.0 15.4 0.0 0.0 9771.3
VALE 20831.9 7227.7 1229.5 226.6 78.7 238.3 0.0 0.0 0.0 0.0 0.0 0.0 0.0 0.0 29832.7
SYST 220046.8 57937.4 15546.8 5228.4 689.4 9102.7 390.4 3621.4 3087.7 2140.6 505.9 963.3 7.8 580.1 319848.7
CCTCMIS: FTECOL, CO3F29L - 07/28/2015 11:06 AM SOURCE: 2014-15 STUDENT DATA BASE

FACT BOOK 3.2.2T FLORIDA COLLEGE SYSTEM
FTE ENROLLMENT: FUNDED, LOWER AND UPPER DIVISION
2014-15 FTE-3
UPPER DIVISION
A & P
POSTSEC VOC
DEVELOPM ENTAL ED
DEV ED
EAP
EPI
POSTSEC ADULT
VOC
APPRN CLASS
APPRN OJT
ADULT BASIC
LTRCY EAP
ADULT SEC
GED PREP
VOC PREP
VOC PREP EAP
TOTAL
EFSC 239.1 7321.5 2344.9 424.2 3.8 0.0 705.7 0.0 0.0 0.0 0.0 0.0 0.0 0.0 0.0 11039.2
BROW 894.4 18294.9 7551.6 1750.7 1058.2 58.0 518.1 0.0 0.0 0.0 0.0 0.0 0.0 0.0 0.0 30125.9
CFLA 275.5 3608.3 1240.7 272.7 181.8 0.0 159.2 0.0 0.0 13.6 0.0 0.0 18.7 0.0 0.0 5770.5
CHIP 134.4 875.2 254.2 46.0 0.0 0.0 121.7 0.0 0.0 0.0 0.0 0.0 0.0 0.4 0.0 1431.9
DAYT 957.6 6018.0 2123.9 437.3 0.0 0.7 728.1 34.5 285.6 416.6 192.6 21.8 111.6 5.9 0.0 11334.2
FSW 631.6 8408.9 527.8 324.7 37.5 0.0 19.3 0.0 0.0 0.0 0.0 0.0 0.0 0.0 0.0 9949.8
FJAX 1394.2 12066.5 3629.2 1179.9 30.7 0.1 906.1 43.2 323.7 182.1 372.2 32.3 56.1 1.5 0.0 20217.8
FKEY 0.0 471.4 176.2 28.2 0.0 0.0 31.5 0.0 0.0 0.0 0.0 0.0 0.0 0.0 0.0 707.3
GULF 45.8 2908.2 741.7 124.9 0.0 27.9 141.3 0.0 0.0 0.0 0.0 0.0 0.0 0.0 0.0 3989.8
HILL 0.0 13685.2 3285.5 1020.0 312.4 162.8 512.7 113.6 1117.3 50.5 0.0 0.0 10.0 0.0 0.0 20270.0
INDR 1339.8 6697.3 2645.4 393.5 0.0 0.0 733.7 51.3 440.8 238.1 589.5 53.5 84.5 0.0 41.9 13309.3
FGC 20.8 1209.7 413.8 47.5 0.0 9.8 246.4 0.0 0.0 0.0 0.0 0.0 0.0 0.0 0.0 1948.0
LSSC 42.5 2002.0 621.6 111.8 0.0 8.8 0.0 0.0 0.0 0.0 0.0 0.0 0.0 0.0 0.0 2786.7
SCF 386.6 6169.3 589.4 323.5 32.6 36.7 0.0 0.0 0.0 0.0 0.0 0.0 0.0 0.0 0.0 7538.1
MIAM 1925.4 38082.7 3940.3 2701.7 3101.3 27.9 748.8 14.0 163.9 1448.3 495.4 0.0 497.2 0.0 538.2 53685.1
NFLA 0.0 517.6 173.2 24.2 0.0 0.0 90.8 0.0 0.0 0.0 0.0 0.0 0.0 0.0 0.0 805.8
NWFC 360.1 3251.9 670.7 167.3 0.0 0.0 156.1 0.0 0.0 95.6 67.7 0.0 6.2 0.0 0.0 4775.6
PALM 604.3 15418.9 1563.7 742.8 32.3 33.9 935.1 55.0 495.1 0.0 0.0 0.0 0.0 0.0 0.0 19881.1
PASC 94.7 4341.6 2249.5 623.8 0.0 36.8 352.2 0.0 0.0 5.7 0.0 0.0 0.4 0.0 0.0 7704.7
PENS 237.2 4561.8 1670.4 314.5 0.0 16.8 367.5 0.0 0.0 115.0 46.2 265.7 26.1 0.0 0.0 7621.2
POLK 710.7 4623.8 1711.4 265.7 17.2 82.2 85.1 0.0 0.0 0.0 0.0 0.0 0.0 0.0 0.0 7496.1
ST.J 184.3 3113.1 1015.9 169.9 0.0 39.3 83.7 4.1 36.5 54.0 0.0 0.0 21.5 0.0 0.0 4722.3
ST.P 2630.7 11833.2 4993.7 1069.2 77.3 0.0 180.3 0.0 0.0 0.0 0.0 0.0 0.0 0.0 0.0 20784.4
SANF 419.1 7098.3 2441.0 541.1 57.7 25.7 223.2 20.0 229.7 95.5 34.7 1.9 2.7 0.0 0.0 11190.6
SEMI 572.6 7587.6 3026.7 492.3 45.8 43.3 255.6 54.3 503.0 89.1 238.2 130.7 74.2 0.0 0.0 13113.4
SFLA 93.2 1434.8 12.3 28.7 0.0 0.0 294.7 0.0 23.7 236.8 77.6 0.0 38.7 0.0 0.0 2240.5
TALL 0.0 7613.2 1095.0 691.2 13.2 0.0 267.5 0.4 2.1 46.8 26.5 0.0 15.4 0.0 0.0 9771.3
VALE 134.7 20831.9 7227.7 1229.5 226.6 78.7 238.3 0.0 0.0 0.0 0.0 0.0 0.0 0.0 0.0 29967.4
SYST 14329.3 220046.8 57937.4 15546.8 5228.4 689.4 9102.7 390.4 3621.4 3087.7 2140.6 505.9 963.3 7.8 580.1 334178.0
CCTCMIS: FTECOL, CO3F29C - 11/24/2015 11:23 AM SOURCE: 2014-15 STUDENT DATA BASE

Fact Book 3.3.1T Florida College System
Annual FTE Enrollment (Funded - Lower Division) by College
2010-11 through 2014-15
2010-11 2011-12 2012-13 2013-14 2014-15
Eastern Florida 13,513.5 13,395.2 12,017.6 11,469.3 10,800.1
Broward 30,043.4 30,395.8 29,326.2 29,698.9 29,231.5
Central Florida 6,575.7 6,435.3 5,821.0 5,695.6 5,495.0
Chipola 1,537.0 1,495.4 1,465.6 1,375.9 1,297.5
Daytona 15,541.3 13,062.6 11,595.1 11,022.7 10,376.6
FL SouthWestern 11,659.5 11,216.4 9,923.6 9,550.3 9,318.2
Fla SC at Jax 24,834.5 24,220.2 21,523.4 20,387.6 18,823.6
Florida Keys 968.1 909.5 836.6 776.4 707.3
Gulf Coast 4,904.4 4,829.7 4,461.5 4,202.1 3,944.0
Hillsborough 21,418.5 21,357.6 20,472.1 19,973.9 20,270.0
Indian River 13,538.5 12,963.8 12,415.8 11,932.8 11,969.5
Florida Gateway 2,318.9 2,339.2 2,159.5 2,063.8 1,927.2
Lake Sumter 3,261.0 3,237.7 2,958.7 2,756.3 2,744.2
State College FL 8,842.7 8,347.7 7,740.6 7,258.2 7,151.5
Miami Dade 58,737.8 58,372.1 54,212.9 52,604.8 51,759.7
North Florida 1,028.4 962.9 897.5 798.1 805.8
Northwest Fla 5,569.9 5,209.0 4,818.7 4,661.5 4,415.5
Palm Beach State 20,478.2 20,523.2 19,580.3 19,510.0 19,276.8
Pasco-Hernando 7,777.7 7,824.6 7,041.1 7,094.8 7,610.0
Pensacola 9,303.5 9,341.9 9,078.6 8,288.6 7,384.0
Polk 7,028.7 7,413.4 7,396.6 7,300.0 6,785.4
St. Johns River 4,986.6 4,963.5 4,659.3 4,605.6 4,538.0
St. Petersburg 20,011.4 19,968.5 18,878.2 18,194.6 18,153.7
Santa Fe 12,525.9 12,317.1 11,636.2 11,169.0 10,771.5
Seminole State 15,417.0 15,098.9 14,578.5 13,355.0 12,540.8
South Florida 2,737.4 2,416.1 2,256.9 2,148.2 2,147.3
Tallahassee 11,974.6 12,219.3 10,946.5 10,207.8 9,771.3
Valencia 31,173.7 31,492.2 30,010.8 29,519.7 29,832.7
System 367,707.8 362,328.8 338,709.4 327,621.5 319,848.7
PERA - 3.3T 11/24/2015 11:53:06 Source: 2010-11 through 2014-15 Student Data Base 2010-11 through 2014-15 excludes adults with disabilities.
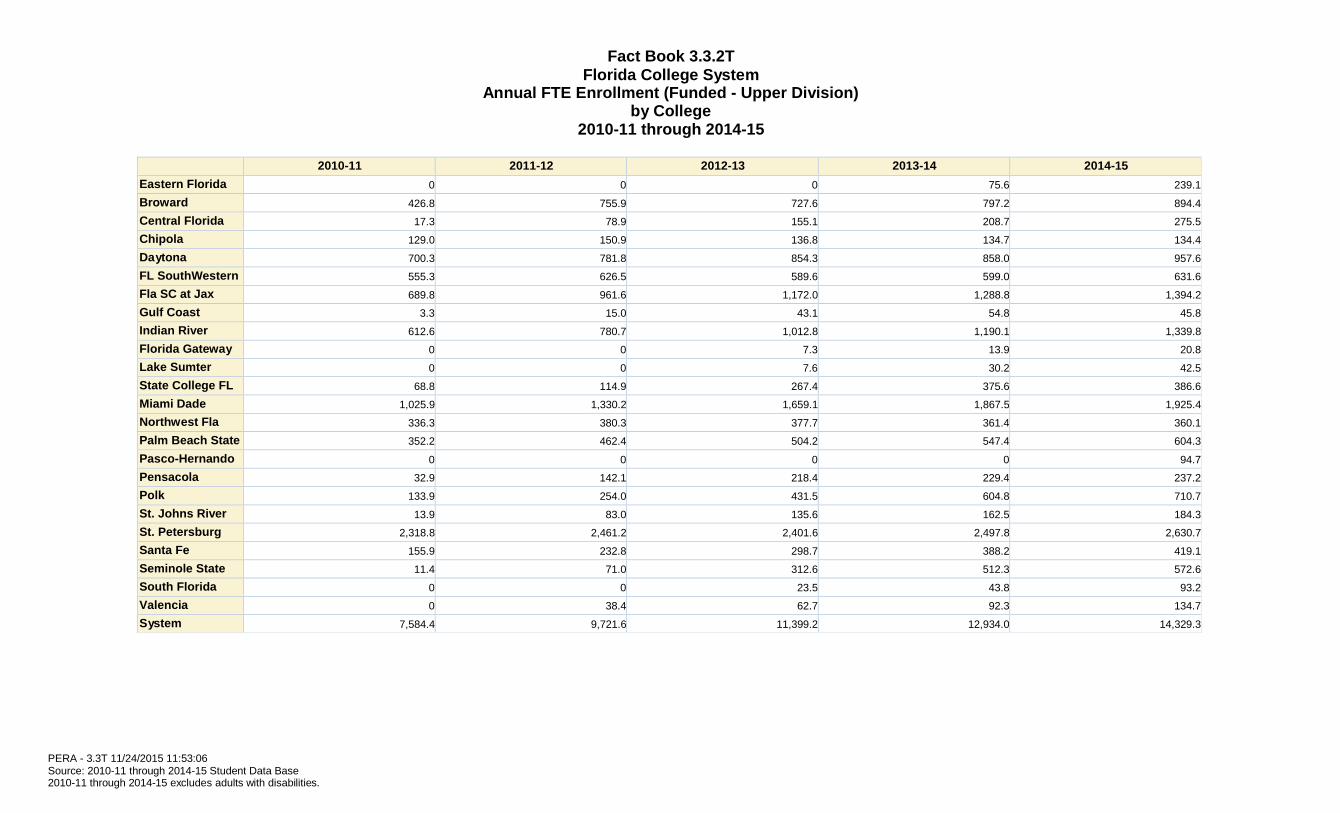
Fact Book 3.3.2T Florida College System
Annual FTE Enrollment (Funded - Upper Division) by College
2010-11 through 2014-15
2010-11 2011-12 2012-13 2013-14 2014-15
Eastern Florida 0 0 0 75.6 239.1
Broward 426.8 755.9 727.6 797.2 894.4
Central Florida 17.3 78.9 155.1 208.7 275.5
Chipola 129.0 150.9 136.8 134.7 134.4
Daytona 700.3 781.8 854.3 858.0 957.6
FL SouthWestern 555.3 626.5 589.6 599.0 631.6
Fla SC at Jax 689.8 961.6 1,172.0 1,288.8 1,394.2
Gulf Coast 3.3 15.0 43.1 54.8 45.8
Indian River 612.6 780.7 1,012.8 1,190.1 1,339.8
Florida Gateway 0 0 7.3 13.9 20.8
Lake Sumter 0 0 7.6 30.2 42.5
State College FL 68.8 114.9 267.4 375.6 386.6
Miami Dade 1,025.9 1,330.2 1,659.1 1,867.5 1,925.4
Northwest Fla 336.3 380.3 377.7 361.4 360.1
Palm Beach State 352.2 462.4 504.2 547.4 604.3
Pasco-Hernando 0 0 0 0 94.7
Pensacola 32.9 142.1 218.4 229.4 237.2
Polk 133.9 254.0 431.5 604.8 710.7
St. Johns River 13.9 83.0 135.6 162.5 184.3
St. Petersburg 2,318.8 2,461.2 2,401.6 2,497.8 2,630.7
Santa Fe 155.9 232.8 298.7 388.2 419.1
Seminole State 11.4 71.0 312.6 512.3 572.6
South Florida 0 0 23.5 43.8 93.2
Valencia 0 38.4 62.7 92.3 134.7
System 7,584.4 9,721.6 11,399.2 12,934.0 14,329.3
PERA - 3.3T 11/24/2015 11:53:06 Source: 2010-11 through 2014-15 Student Data Base 2010-11 through 2014-15 excludes adults with disabilities.

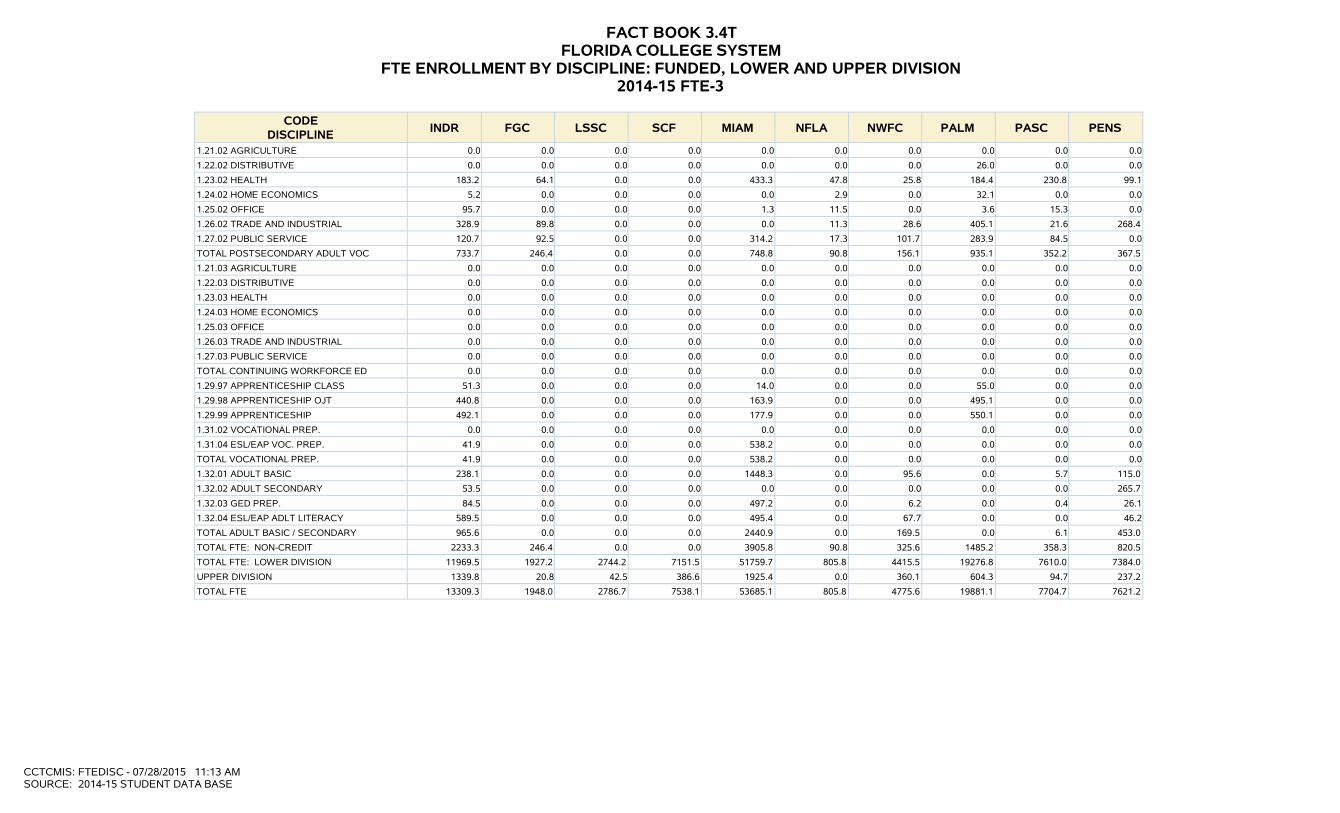
FACT BOOK 3.4T FLORIDA COLLEGE SYSTEM
FTE ENROLLMENT BY DISCIPLINE: FUNDED, LOWER AND UPPER DIVISION 2014-15 FTE-3
CODE
DISCIPLINE
ESFC
BROW
CFLA
CHIP
DAYT
FSW
FJAX
FKEY
GULF
HILL
1.11.01 AGRICULTURE & NAT RES 0.0 0.0 0.0 8.2 7.3 0.0 0.0 0.0 0.0 0.0
1.11.02 ARCHITECTURE & ENVIR. 10.5 0.0 0.0 0.0 0.0 2.7 0.0 0.0 2.5 30.1
1.11.04 BIOLOGICAL SCIENCE 971.6 1457.8 509.8 114.7 679.4 888.7 1546.6 87.8 299.5 1303.1
1.11.09 ENGINEERING 16.7 0.0 0.0 0.0 0.0 41.5 1.7 0.0 1.8 0.0
1.11.12 HEALTH PROFESSIONS 0.0 0.0 0.0 0.0 0.0 516.9 0.0 0.0 3.6 16.1
1.11.19 PHYSICAL SCIENCES 604.6 987.6 195.6 58.2 388.7 380.4 975.3 34.9 200.4 1109.1
1.12.10 FINE AND APPLIED ARTS 124.2 1095.1 148.0 65.5 924.0 175.4 463.6 33.6 244.9 507.8
1.13.11 FOREIGN LANGUAGES 320.9 731.0 82.5 17.2 200.1 170.1 268.0 2.2 93.5 165.1
1.13.15 LETTERS 1257.0 5564.7 674.5 166.6 864.8 1645.9 2124.1 110.1 544.7 2565.7
1.14.08 EDUCATION 140.5 829.7 236.6 74.1 210.7 136.1 478.9 4.5 109.7 248.5
1.15.05 BUSINESS & MANAGEMENT 30.1 0.0 0.0 1.3 159.5 298.6 0.0 26.1 127.5 0.0
1.16.07 COMPUTER & INFO. SCI. 225.9 0.0 0.0 0.3 0.0 243.8 0.0 0.0 67.1 783.8
1.16.17 MATHEMATICS 1356.6 4452.2 709.2 157.8 1250.1 1419.7 2434.4 83.6 503.4 2570.2
1.17.03 AREA STUDIES 0.9 0.0 0.0 1.4 0.0 0.0 0.0 0.0 1.2 0.0
1.17.20 PSYCHOLOGY 787.7 1425.6 255.3 63.3 552.3 565.8 936.0 29.2 7.1 1236.4
1.17.22 SOCIAL SCIENCES 686.1 1647.1 436.4 112.5 346.0 950.8 1809.8 32.4 620.4 1967.4
1.18.06 COMMUNICATIONS 33.0 56.4 8.2 1.3 26.1 6.6 0.0 0.0 8.1 665.1
1.18.13 HOME ECONOMICS 0.0 0.0 0.0 0.0 227.0 0.0 0.0 0.0 56.0 0.0
1.18.14 LAW 0.0 0.0 0.0 0.0 0.0 0.6 0.0 2.8 4.6 0.0
1.18.16 LIBRARY SCIENCE 0.0 0.0 0.0 0.0 4.1 3.0 0.0 0.0 2.7 0.0
1.18.18 MILITARY SCIENCE 2.8 4.2 0.5 0.0 0.0 0.0 2.0 0.0 0.0 2.2
1.18.21 PUBLIC AFFAIRS 0.0 0.0 0.0 0.0 0.0 1.6 0.0 16.0 9.5 0.0
1.18.23 THEOLOGY 0.0 0.0 0.0 0.0 0.0 73.1 0.0 0.0 0.0 0.0
1.18.49 INTERDISCIPLINARY 752.4 43.5 351.7 32.8 177.9 887.6 1026.1 8.2 0.0 514.6
TOTAL ADVANCED & PROFESSIONAL 7321.5 18294.9 3608.3 875.2 6018.0 8408.9 12066.5 471.4 2908.2 13685.2
1.21.01 AGRICULTURE 0.0 1.4 49.9 0.0 0.0 0.0 0.0 0.0 0.0 68.7
1.22.01 DISTRIBUTIVE 57.2 842.7 0.0 0.0 66.9 3.0 84.9 28.9 52.0 100.2
1.23.01 HEALTH 776.9 2814.1 384.9 152.0 763.1 273.3 1062.7 50.0 435.3 1155.9
1.24.01 HOME ECONOMICS 41.8 51.6 46.2 16.5 62.6 2.6 255.4 0.0 13.1 157.1
1.25.01 OFFICE 915.2 1467.6 652.5 58.8 509.0 55.6 1540.7 46.9 89.8 1006.4
1.26.01 TRADE AND INDUSTRIAL 297.3 1973.9 16.1 21.4 623.8 0.0 398.9 50.4 87.6 133.8
1.27.01 PUBLIC SERVICE 256.5 400.3 91.1 5.5 98.5 193.3 286.6 0.0 63.9 663.4
TOTAL POSTSECONDARY VOC. 2344.9 7551.6 1240.7 254.2 2123.9 527.8 3629.2 176.2 741.7 3285.5
1.31.01 DEVELOPMETNAL ED. 424.2 1750.7 272.7 46.0 437.3 324.7 1179.9 28.2 124.9 1020.0
1.31.03 ESL/EAP DEV. ED. 3.8 1058.2 181.8 0.0 0.0 37.5 30.7 0.0 0.0 312.4
TOTAL DEVELOPMENTAL EDUCATION 428.0 2808.9 454.5 46.0 437.3 362.2 1210.6 28.2 124.9 1332.4
1.50.01 EDUCATOR PREP. INST. 0.0 58.0 0.0 0.0 0.7 0.0 0.1 0.0 27.9 162.8
TOTAL FTE FOR CREDIT 10094.4 28713.4 5303.5 1175.4 8579.9 9298.9 16906.4 675.8 3802.7 18465.9
CCTCMIS: FTEDISC - 07/28/2015 11:13 AM SOURCE: 2014-15 STUDENT DATA BASE

FACT BOOK 3.4T FLORIDA COLLEGE SYSTEM
FTE ENROLLMENT BY DISCIPLINE: FUNDED, LOWER AND UPPER DIVISION 2014-15 FTE-3
CODE
DISCIPLINE
ESFC
BROW
CFLA
CHIP
DAYT
FSW
FJAX
FKEY
GULF
HILL
1.21.02 AGRICULTURE 0.0 0.0 0.0 0.0 0.0 0.0 0.0 0.0 0.0 0.0
1.22.02 DISTRIBUTIVE 0.0 0.0 0.0 0.0 16.8 0.0 55.8 0.0 0.0 0.0
1.23.02 HEALTH 194.0 155.5 19.0 2.0 189.8 7.7 170.2 0.0 57.5 26.9
1.24.02 HOME ECONOMICS 0.0 0.0 0.0 0.0 0.0 0.1 86.7 0.0 0.0 4.3
1.25.02 OFFICE 7.2 0.0 0.5 0.0 0.0 0.0 5.5 0.0 0.0 0.0
1.26.02 TRADE AND INDUSTRIAL 285.3 211.0 45.4 77.1 329.0 0.0 395.2 0.0 0.0 196.4
1.27.02 PUBLIC SERVICE 219.2 151.6 94.3 42.6 192.5 11.5 192.7 31.5 83.8 285.1
TOTAL POSTSECONDARY ADULT VOC 705.7 518.1 159.2 121.7 728.1 19.3 906.1 31.5 141.3 512.7
1.21.03 AGRICULTURE 0.0 0.0 0.0 0.0 0.0 0.0 0.0 0.0 0.0 0.0
1.22.03 DISTRIBUTIVE 0.0 0.0 0.0 0.0 0.0 0.0 0.0 0.0 0.0 0.0
1.23.03 HEALTH 0.0 0.0 0.0 0.0 0.0 0.0 0.0 0.0 0.0 0.0
1.24.03 HOME ECONOMICS 0.0 0.0 0.0 0.0 0.0 0.0 0.0 0.0 0.0 0.0
1.25.03 OFFICE 0.0 0.0 0.0 0.0 0.0 0.0 0.0 0.0 0.0 0.0
1.26.03 TRADE AND INDUSTRIAL 0.0 0.0 0.0 0.0 0.0 0.0 0.0 0.0 0.0 0.0
1.27.03 PUBLIC SERVICE 0.0 0.0 0.0 0.0 0.0 0.0 0.0 0.0 0.0 0.0
TOTAL CONTINUING WORKFORCE ED 0.0 0.0 0.0 0.0 0.0 0.0 0.0 0.0 0.0 0.0
1.29.97 APPRENTICESHIP CLASS 0.0 0.0 0.0 0.0 34.5 0.0 43.2 0.0 0.0 113.6
1.29.98 APPRENTICESHIP OJT 0.0 0.0 0.0 0.0 285.6 0.0 323.7 0.0 0.0 1117.3
1.29.99 APPRENTICESHIP 0.0 0.0 0.0 0.0 320.1 0.0 366.9 0.0 0.0 1230.9
1.31.02 VOCATIONAL PREP. 0.0 0.0 0.0 0.4 5.9 0.0 1.5 0.0 0.0 0.0
1.31.04 ESL/EAP VOC. PREP. 0.0 0.0 0.0 0.0 0.0 0.0 0.0 0.0 0.0 0.0
TOTAL VOCATIONAL PREP. 0.0 0.0 0.0 0.4 5.9 0.0 1.5 0.0 0.0 0.0
1.32.01 ADULT BASIC 0.0 0.0 13.6 0.0 416.6 0.0 182.1 0.0 0.0 50.5
1.32.02 ADULT SECONDARY 0.0 0.0 0.0 0.0 21.8 0.0 32.3 0.0 0.0 0.0
1.32.03 GED PREP. 0.0 0.0 18.7 0.0 111.6 0.0 56.1 0.0 0.0 10.0
1.32.04 ESL/EAP ADLT LITERACY 0.0 0.0 0.0 0.0 192.6 0.0 372.2 0.0 0.0 0.0
TOTAL ADULT BASIC / SECONDARY 0.0 0.0 32.3 0.0 742.6 0.0 642.7 0.0 0.0 60.5
TOTAL FTE: NON-CREDIT 705.7 518.1 191.5 122.1 1796.7 19.3 1917.2 31.5 141.3 1804.1
TOTAL FTE: LOWER DIVISION 10800.1 29231.5 5495.0 1297.5 10376.6 9318.2 18823.6 707.3 3944.0 20270.0
UPPER DIVISION 239.1 894.4 275.5 134.4 957.6 631.6 1394.2 0.0 45.8 0.0
TOTAL FTE 11039.2 30125.9 5770.5 1431.9 11334.2 9949.8 20217.8 707.3 3989.8 20270.0
CCTCMIS: FTEDISC - 07/28/2015 11:13 AM SOURCE: 2014-15 STUDENT DATA BASE

FACT BOOK 3.4T FLORIDA COLLEGE SYSTEM
FTE ENROLLMENT BY DISCIPLINE: FUNDED, LOWER AND UPPER DIVISION 2014-15 FTE-3
CODE
DISCIPLINE
INDR
FGC
LSSC
SCF
MIAM
NFLA
NWFC
PALM
PASC
PENS
1.11.01 AGRICULTURE & NAT RES 0.0 0.0 0.9 0.0 0.0 0.0 0.0 0.0 0.0 0.0
1.11.02 ARCHITECTURE & ENVIR. 11.1 5.2 0.0 0.0 16.2 0.0 0.0 40.2 0.0 0.0
1.11.04 BIOLOGICAL SCIENCE 1022.5 172.3 278.5 769.2 2725.8 69.2 450.8 1319.3 300.3 531.7
1.11.09 ENGINEERING 22.9 0.0 0.0 1.5 76.6 0.0 0.0 9.3 0.0 0.6
1.11.12 HEALTH PROFESSIONS 0.2 0.0 0.0 0.0 101.7 0.0 10.5 57.8 0.0 0.0
1.11.19 PHYSICAL SCIENCES 448.8 95.9 133.1 389.4 3003.8 18.4 309.7 1146.6 300.5 354.4
1.12.10 FINE AND APPLIED ARTS 156.2 33.4 80.5 729.2 2159.9 65.4 217.0 997.6 85.4 359.8
1.13.11 FOREIGN LANGUAGES 176.1 19.6 64.3 145.9 389.7 8.0 93.0 419.1 69.6 157.8
1.13.15 LETTERS 1340.3 262.9 376.7 1109.2 9280.9 94.3 546.3 3244.9 1315.3 1083.9
1.14.08 EDUCATION 148.5 20.7 66.9 166.3 945.4 10.2 234.0 1831.5 196.5 177.6
1.15.05 BUSINESS & MANAGEMENT 0.0 18.2 0.0 193.3 3033.4 0.0 125.3 554.0 0.0 23.8
1.16.07 COMPUTER & INFO. SCI. 0.0 0.0 0.0 168.6 2837.6 0.0 0.0 539.3 0.0 5.4
1.16.17 MATHEMATICS 1273.7 219.8 424.7 1070.2 6370.8 100.7 663.0 2751.1 953.5 934.6
1.17.03 AREA STUDIES 0.0 0.0 0.0 0.0 0.0 0.0 0.0 0.0 0.0 0.0
1.17.20 PSYCHOLOGY 472.4 94.5 146.0 398.9 3708.2 39.1 202.9 787.6 511.0 292.5
1.17.22 SOCIAL SCIENCES 1486.1 202.6 207.9 934.5 2492.8 97.2 294.1 1704.3 282.0 577.6
1.18.06 COMMUNICATIONS 22.1 57.5 42.3 9.0 64.7 8.2 0.0 3.9 0.0 6.0
1.18.13 HOME ECONOMICS 15.2 0.0 0.0 0.0 0.0 0.0 0.0 0.0 0.0 1.3
1.18.14 LAW 0.0 0.0 0.0 0.0 102.6 0.0 0.0 0.0 0.0 0.0
1.18.16 LIBRARY SCIENCE 0.0 0.0 2.0 1.2 35.5 0.0 0.0 0.0 0.0 0.4
1.18.18 MILITARY SCIENCE 0.0 0.0 0.0 0.0 4.9 0.0 1.6 0.0 0.0 0.1
1.18.21 PUBLIC AFFAIRS 0.0 0.0 0.0 39.6 0.0 0.0 3.3 0.0 0.0 0.0
1.18.23 THEOLOGY 98.5 0.0 0.0 0.0 0.0 0.0 0.0 0.0 45.9 0.0
1.18.49 INTERDISCIPLINARY 2.7 7.1 178.2 43.3 732.2 6.9 100.4 12.4 281.6 54.3
TOTAL ADVANCED & PROFESSIONAL 6697.3 1209.7 2002.0 6169.3 38082.7 517.6 3251.9 15418.9 4341.6 4561.8
1.21.01 AGRICULTURE 27.1 33.7 9.4 0.0 10.0 0.0 0.0 21.6 0.0 23.6
1.22.01 DISTRIBUTIVE 87.3 0.0 0.0 0.0 123.7 0.0 15.1 30.2 32.9 94.2
1.23.01 HEALTH 674.5 280.5 163.9 319.6 1944.6 99.8 160.4 858.0 1003.4 571.7
1.24.01 HOME ECONOMICS 81.8 18.1 39.4 0.0 721.4 0.0 34.0 69.8 0.0 196.9
1.25.01 OFFICE 876.5 55.9 341.2 117.2 324.7 55.9 328.0 237.3 1077.9 404.4
1.26.01 TRADE AND INDUSTRIAL 329.4 11.2 45.3 107.0 661.4 0.0 69.3 205.1 19.9 210.7
1.27.01 PUBLIC SERVICE 568.8 14.4 22.4 45.6 154.5 17.5 63.9 141.7 115.4 168.9
TOTAL POSTSECONDARY VOC. 2645.4 413.8 621.6 589.4 3940.3 173.2 670.7 1563.7 2249.5 1670.4
1.31.01 DEVELOPMETNAL ED. 393.5 47.5 111.8 323.5 2701.7 24.2 167.3 742.8 623.8 314.5
1.31.03 ESL/EAP DEV. ED. 0.0 0.0 0.0 32.6 3101.3 0.0 0.0 32.3 0.0 0.0
TOTAL DEVELOPMENTAL EDUCATION 393.5 47.5 111.8 356.1 5803.0 24.2 167.3 775.1 623.8 314.5
1.50.01 EDUCATOR PREP. INST. 0.0 9.8 8.8 36.7 27.9 0.0 0.0 33.9 36.8 16.8
TOTAL FTE FOR CREDIT 9736.2 1680.8 2744.2 7151.5 47853.9 715.0 4089.9 17791.6 7251.7 6563.5
CCTCMIS: FTEDISC - 07/28/2015 11:13 AM SOURCE: 2014-15 STUDENT DATA BASE
FACT BOOK 3.4T FLORIDA COLLEGE SYSTEM
FTE ENROLLMENT BY DISCIPLINE: FUNDED, LOWER AND UPPER DIVISION 2014-15 FTE-3
CODE
DISCIPLINE
INDR
FGC
LSSC
SCF
MIAM
NFLA
NWFC
PALM
PASC
PENS
1.21.02 AGRICULTURE 0.0 0.0 0.0 0.0 0.0 0.0 0.0 0.0 0.0 0.0
1.22.02 DISTRIBUTIVE 0.0 0.0 0.0 0.0 0.0 0.0 0.0 26.0 0.0 0.0
1.23.02 HEALTH 183.2 64.1 0.0 0.0 433.3 47.8 25.8 184.4 230.8 99.1
1.24.02 HOME ECONOMICS 5.2 0.0 0.0 0.0 0.0 2.9 0.0 32.1 0.0 0.0
1.25.02 OFFICE 95.7 0.0 0.0 0.0 1.3 11.5 0.0 3.6 15.3 0.0
1.26.02 TRADE AND INDUSTRIAL 328.9 89.8 0.0 0.0 0.0 11.3 28.6 405.1 21.6 268.4
1.27.02 PUBLIC SERVICE 120.7 92.5 0.0 0.0 314.2 17.3 101.7 283.9 84.5 0.0
TOTAL POSTSECONDARY ADULT VOC 733.7 246.4 0.0 0.0 748.8 90.8 156.1 935.1 352.2 367.5
1.21.03 AGRICULTURE 0.0 0.0 0.0 0.0 0.0 0.0 0.0 0.0 0.0 0.0
1.22.03 DISTRIBUTIVE 0.0 0.0 0.0 0.0 0.0 0.0 0.0 0.0 0.0 0.0
1.23.03 HEALTH 0.0 0.0 0.0 0.0 0.0 0.0 0.0 0.0 0.0 0.0
1.24.03 HOME ECONOMICS 0.0 0.0 0.0 0.0 0.0 0.0 0.0 0.0 0.0 0.0
1.25.03 OFFICE 0.0 0.0 0.0 0.0 0.0 0.0 0.0 0.0 0.0 0.0
1.26.03 TRADE AND INDUSTRIAL 0.0 0.0 0.0 0.0 0.0 0.0 0.0 0.0 0.0 0.0
1.27.03 PUBLIC SERVICE 0.0 0.0 0.0 0.0 0.0 0.0 0.0 0.0 0.0 0.0
TOTAL CONTINUING WORKFORCE ED 0.0 0.0 0.0 0.0 0.0 0.0 0.0 0.0 0.0 0.0
1.29.97 APPRENTICESHIP CLASS 51.3 0.0 0.0 0.0 14.0 0.0 0.0 55.0 0.0 0.0
1.29.98 APPRENTICESHIP OJT 440.8 0.0 0.0 0.0 163.9 0.0 0.0 495.1 0.0 0.0
1.29.99 APPRENTICESHIP 492.1 0.0 0.0 0.0 177.9 0.0 0.0 550.1 0.0 0.0
1.31.02 VOCATIONAL PREP. 0.0 0.0 0.0 0.0 0.0 0.0 0.0 0.0 0.0 0.0
1.31.04 ESL/EAP VOC. PREP. 41.9 0.0 0.0 0.0 538.2 0.0 0.0 0.0 0.0 0.0
TOTAL VOCATIONAL PREP. 41.9 0.0 0.0 0.0 538.2 0.0 0.0 0.0 0.0 0.0
1.32.01 ADULT BASIC 238.1 0.0 0.0 0.0 1448.3 0.0 95.6 0.0 5.7 115.0
1.32.02 ADULT SECONDARY 53.5 0.0 0.0 0.0 0.0 0.0 0.0 0.0 0.0 265.7
1.32.03 GED PREP. 84.5 0.0 0.0 0.0 497.2 0.0 6.2 0.0 0.4 26.1
1.32.04 ESL/EAP ADLT LITERACY 589.5 0.0 0.0 0.0 495.4 0.0 67.7 0.0 0.0 46.2
TOTAL ADULT BASIC / SECONDARY 965.6 0.0 0.0 0.0 2440.9 0.0 169.5 0.0 6.1 453.0
TOTAL FTE: NON-CREDIT 2233.3 246.4 0.0 0.0 3905.8 90.8 325.6 1485.2 358.3 820.5
TOTAL FTE: LOWER DIVISION 11969.5 1927.2 2744.2 7151.5 51759.7 805.8 4415.5 19276.8 7610.0 7384.0
UPPER DIVISION 1339.8 20.8 42.5 386.6 1925.4 0.0 360.1 604.3 94.7 237.2
TOTAL FTE 13309.3 1948.0 2786.7 7538.1 53685.1 805.8 4775.6 19881.1 7704.7 7621.2
CCTCMIS: FTEDISC - 07/28/2015 11:13 AM SOURCE: 2014-15 STUDENT DATA BASE

FACT BOOK 3.4T FLORIDA COLLEGE SYSTEM
FTE ENROLLMENT BY DISCIPLINE: FUNDED, LOWER AND UPPER DIVISION 2014-15 FTE-3
CODE
DISCIPLINE
POLK
ST.J
ST.P
SANF
SEMI
SFLA
TALL
VALE
SYST
1.11.01 AGRICULTURE & NAT RES 0.0 0.0 0.0 0.0 0.0 9.3 0.0 0.0 25.7
1.11.02 ARCHITECTURE & ENVIR. 0.0 0.0 0.0 0.0 0.0 0.0 0.0 83.2 201.7
1.11.04 BIOLOGICAL SCIENCE 189.5 414.8 553.6 490.1 832.6 174.5 558.2 1466.6 20178.5
1.11.09 ENGINEERING 0.0 0.0 0.0 0.0 0.0 9.2 0.0 95.7 277.5
1.11.12 HEALTH PROFESSIONS 25.1 0.0 0.0 0.0 0.0 136.8 0.0 0.0 868.7
1.11.19 PHYSICAL SCIENCES 325.3 137.6 839.8 582.3 651.0 52.3 584.0 1372.6 15680.3
1.12.10 FINE AND APPLIED ARTS 131.7 98.5 1772.6 537.0 250.8 16.1 91.1 1463.6 13027.9
1.13.11 FOREIGN LANGUAGES 146.3 104.8 279.9 205.9 147.4 19.4 181.0 659.6 5338.0
1.13.15 LETTERS 1175.0 548.8 3154.6 537.0 1069.1 302.8 21.8 0.0 40981.9
1.14.08 EDUCATION 285.4 61.7 224.0 52.7 116.1 24.3 465.7 1425.3 8922.1
1.15.05 BUSINESS & MANAGEMENT 0.0 0.0 11.9 0.0 0.0 102.8 0.0 0.0 4705.8
1.16.07 COMPUTER & INFO. SCI. 0.0 0.0 0.0 0.0 0.0 75.8 266.8 0.0 5214.4
1.16.17 MATHEMATICS 901.8 596.8 2463.3 1577.4 1724.8 234.8 1407.5 4430.8 43036.5
1.17.03 AREA STUDIES 0.0 0.0 0.0 0.0 0.0 0.0 0.0 0.0 3.5
1.17.20 PSYCHOLOGY 421.4 175.5 156.3 713.6 489.1 100.7 352.2 1053.5 15974.1
1.17.22 SOCIAL SCIENCES 483.7 640.5 2310.1 1276.5 920.4 135.2 1581.6 2124.0 26360.0
1.18.06 COMMUNICATIONS 60.1 16.5 58.5 1121.8 465.3 0.0 1079.5 4645.0 8465.2
1.18.13 HOME ECONOMICS 0.0 0.0 0.0 0.0 0.0 0.0 121.1 0.0 420.6
1.18.14 LAW 0.0 0.0 0.0 0.0 0.0 5.7 0.0 0.0 116.3
1.18.16 LIBRARY SCIENCE 1.2 0.0 4.3 0.0 1.5 0.4 3.2 0.0 59.5
1.18.18 MILITARY SCIENCE 0.5 0.0 0.0 4.0 0.8 0.0 1.2 2.5 27.3
1.18.21 PUBLIC AFFAIRS 0.0 0.0 0.0 0.0 0.0 4.0 0.0 0.0 74.0
1.18.23 THEOLOGY 0.0 0.0 0.0 0.0 0.0 0.0 0.0 0.0 217.5
1.18.49 INTERDISCIPLINARY 476.8 317.6 4.3 0.0 918.7 30.7 898.3 2009.5 9869.8
TOTAL ADVANCED & PROFESSIONAL 4623.8 3113.1 11833.2 7098.3 7587.6 1434.8 7613.2 20831.9 220046.8
1.21.01 AGRICULTURE 0.0 0.0 0.0 95.2 0.0 0.0 0.0 56.6 397.2
1.22.01 DISTRIBUTIVE 14.5 0.0 102.4 0.0 68.0 0.0 0.0 243.9 2048.0
1.23.01 HEALTH 858.1 380.3 2098.8 1425.6 648.9 0.0 309.3 2165.0 21830.6
1.24.01 HOME ECONOMICS 51.3 0.0 22.8 47.4 309.9 0.5 162.5 86.4 2489.1
1.25.01 OFFICE 533.5 590.8 1687.9 674.5 1017.5 6.0 442.1 2185.0 17298.8
1.26.01 TRADE AND INDUSTRIAL 135.2 5.7 332.5 148.8 555.8 0.0 0.0 1997.9 8438.4
1.27.01 PUBLIC SERVICE 118.8 39.1 749.3 49.5 426.6 5.8 181.1 492.9 5435.3
TOTAL POSTSECONDARY VOC. 1711.4 1015.9 4993.7 2441.0 3026.7 12.3 1095.0 7227.7 57937.4
1.31.01 DEVELOPMETNAL ED. 265.7 169.9 1069.2 541.1 492.3 28.7 691.2 1229.5 15546.8
1.31.03 ESL/EAP DEV. ED. 17.2 0.0 77.3 57.7 45.8 0.0 13.2 226.6 5228.4
TOTAL DEVELOPMENTAL EDUCATION 282.9 169.9 1146.5 598.8 538.1 28.7 704.4 1456.1 20775.2
1.50.01 EDUCATOR PREP. INST. 82.2 39.3 0.0 25.7 43.3 0.0 0.0 78.7 689.4
TOTAL FTE FOR CREDIT 6700.3 4338.2 17973.4 10163.8 11195.7 1475.8 9412.6 29594.4 299448.8
CCTCMIS: FTEDISC - 07/28/2015 11:13 AM SOURCE: 2014-15 STUDENT DATA BASE
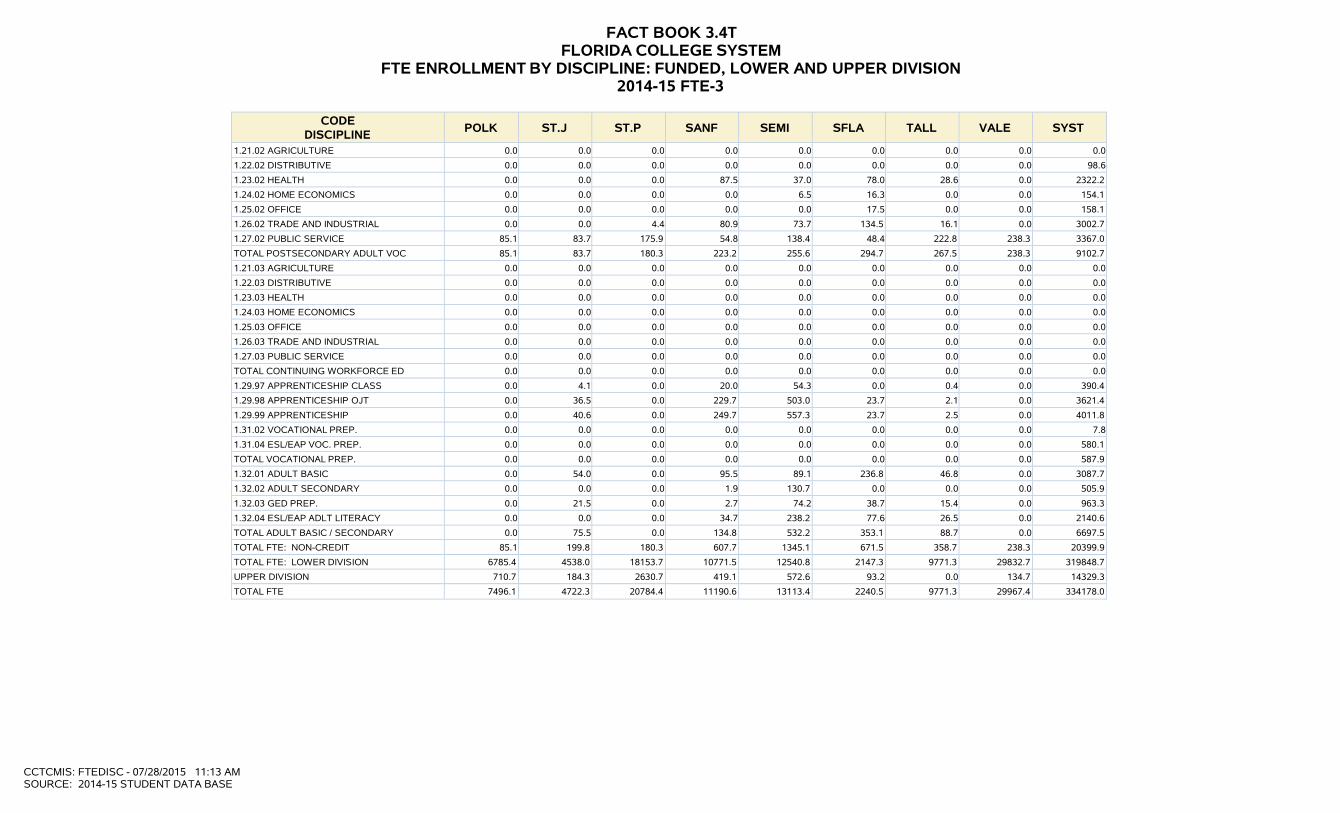
FACT BOOK 3.4T FLORIDA COLLEGE SYSTEM
FTE ENROLLMENT BY DISCIPLINE: FUNDED, LOWER AND UPPER DIVISION 2014-15 FTE-3
CODE
DISCIPLINE
POLK
ST.J
ST.P
SANF
SEMI
SFLA
TALL
VALE
SYST
1.21.02 AGRICULTURE 0.0 0.0 0.0 0.0 0.0 0.0 0.0 0.0 0.0
1.22.02 DISTRIBUTIVE 0.0 0.0 0.0 0.0 0.0 0.0 0.0 0.0 98.6
1.23.02 HEALTH 0.0 0.0 0.0 87.5 37.0 78.0 28.6 0.0 2322.2
1.24.02 HOME ECONOMICS 0.0 0.0 0.0 0.0 6.5 16.3 0.0 0.0 154.1
1.25.02 OFFICE 0.0 0.0 0.0 0.0 0.0 17.5 0.0 0.0 158.1
1.26.02 TRADE AND INDUSTRIAL 0.0 0.0 4.4 80.9 73.7 134.5 16.1 0.0 3002.7
1.27.02 PUBLIC SERVICE 85.1 83.7 175.9 54.8 138.4 48.4 222.8 238.3 3367.0
TOTAL POSTSECONDARY ADULT VOC 85.1 83.7 180.3 223.2 255.6 294.7 267.5 238.3 9102.7
1.21.03 AGRICULTURE 0.0 0.0 0.0 0.0 0.0 0.0 0.0 0.0 0.0
1.22.03 DISTRIBUTIVE 0.0 0.0 0.0 0.0 0.0 0.0 0.0 0.0 0.0
1.23.03 HEALTH 0.0 0.0 0.0 0.0 0.0 0.0 0.0 0.0 0.0
1.24.03 HOME ECONOMICS 0.0 0.0 0.0 0.0 0.0 0.0 0.0 0.0 0.0
1.25.03 OFFICE 0.0 0.0 0.0 0.0 0.0 0.0 0.0 0.0 0.0
1.26.03 TRADE AND INDUSTRIAL 0.0 0.0 0.0 0.0 0.0 0.0 0.0 0.0 0.0
1.27.03 PUBLIC SERVICE 0.0 0.0 0.0 0.0 0.0 0.0 0.0 0.0 0.0
TOTAL CONTINUING WORKFORCE ED 0.0 0.0 0.0 0.0 0.0 0.0 0.0 0.0 0.0
1.29.97 APPRENTICESHIP CLASS 0.0 4.1 0.0 20.0 54.3 0.0 0.4 0.0 390.4
1.29.98 APPRENTICESHIP OJT 0.0 36.5 0.0 229.7 503.0 23.7 2.1 0.0 3621.4
1.29.99 APPRENTICESHIP 0.0 40.6 0.0 249.7 557.3 23.7 2.5 0.0 4011.8
1.31.02 VOCATIONAL PREP. 0.0 0.0 0.0 0.0 0.0 0.0 0.0 0.0 7.8
1.31.04 ESL/EAP VOC. PREP. 0.0 0.0 0.0 0.0 0.0 0.0 0.0 0.0 580.1
TOTAL VOCATIONAL PREP. 0.0 0.0 0.0 0.0 0.0 0.0 0.0 0.0 587.9
1.32.01 ADULT BASIC 0.0 54.0 0.0 95.5 89.1 236.8 46.8 0.0 3087.7
1.32.02 ADULT SECONDARY 0.0 0.0 0.0 1.9 130.7 0.0 0.0 0.0 505.9
1.32.03 GED PREP. 0.0 21.5 0.0 2.7 74.2 38.7 15.4 0.0 963.3
1.32.04 ESL/EAP ADLT LITERACY 0.0 0.0 0.0 34.7 238.2 77.6 26.5 0.0 2140.6
TOTAL ADULT BASIC / SECONDARY 0.0 75.5 0.0 134.8 532.2 353.1 88.7 0.0 6697.5
TOTAL FTE: NON-CREDIT 85.1 199.8 180.3 607.7 1345.1 671.5 358.7 238.3 20399.9
TOTAL FTE: LOWER DIVISION 6785.4 4538.0 18153.7 10771.5 12540.8 2147.3 9771.3 29832.7 319848.7
UPPER DIVISION 710.7 184.3 2630.7 419.1 572.6 93.2 0.0 134.7 14329.3
TOTAL FTE 7496.1 4722.3 20784.4 11190.6 13113.4 2240.5 9771.3 29967.4 334178.0
CCTCMIS: FTEDISC - 07/28/2015 11:13 AM SOURCE: 2014-15 STUDENT DATA BASE

Fact Book 3.5T Florida College System FTE Enrollment (Funded)
Actual FTE and Percent by Program Area 2005-06 through 2014-15
A&P
PSV
EPI
PSAV Apprentice
CWE
Adult Ed.
Dev. Ed.
Total Lower
Division
Total Upper
Division
FTE FTE FTE FTE FTE FTE FTE FTE FTE FTE
Reporting Year
Sum
%
Sum
%
Sum
%
Sum
%
Sum
%
Sum
%
Sum
%
Sum
%
Sum
Sum
2005-06 163,204 57 53,644 19 527 0 11,206 4 6,975 2 5,814 2 18,994 7 27,351 10 287,714 1,269
2006-07 164,234 57 53,521 19 1,393 0 11,213 4 8,260 3 6,695 2 13,611 5 26,997 9 285,924 1,667
2007-08 175,604 57 56,901 19 1,769 1 10,626 3 8,440 3 9,303 3 13,888 5 29,004 9 305,535 2,290
2008-09 193,902 59 56,480 17 1,691 1 10,849 3 8,132 2 9,484 3 14,567 4 33,949 10 329,052 3,521
2009-10 217,375 60 60,827 17 1,581 0 11,551 3 6,279 2 10,070 3 12,301 3 39,916 11 359,900 5,377
2010-11 232,678 63 62,958 17 1,224 0 11,115 3 4,986 1 0 0 11,388 3 43,359 12 367,708 7,584
2011-12 234,182 65 62,138 17 914 0 10,361 3 4,277 1 0 0 8,039 2 42,419 12 362,329 9,722
2012-13 222,788 66 58,860 17 796 0 9,914 3 3,590 1 0 0 6,944 2 35,817 11 338,709 11,399
2013-14 219,129 67 57,053 17 751 0 9,624 3 3,690 1 0 0 6,667 2 30,707 9 327,622 12,934
2014-15 220,047 69 57,937 18 689 0 9,103 3 4,012 1 0 0 7,285 2 20,775 6 319,849 14,329
PERA - 3.5T 11/24/2015 11:53:25 Source: 2005-06 through 2014-15 Student Data Base (refer to table 3.4T for current year) 2004-05 through 2008-09 includes adults with disabilities, 2009-10 through 2014-15 excludes adults with disabilities. Total column may not equal the sum of the columns because of rounding. College Prep was renamed Developmental Education after 2013.

Program Enrollment
Note: On the following pages, the word “credit” when used in “credit enrollment” or “credit programs” refers to either college credit or vocational credit. Tables 4.6T and 4.8T include some non-credit program enrollment.
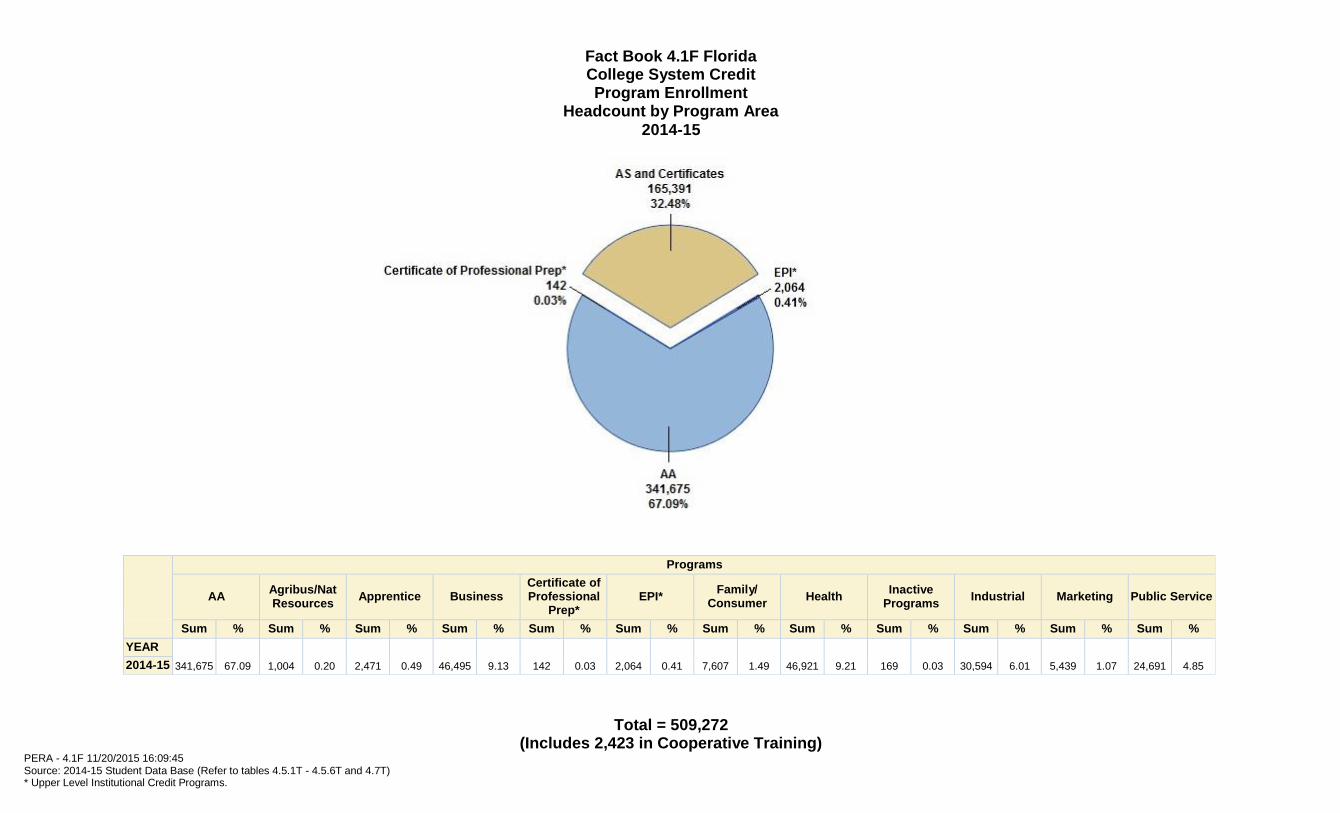
Fact Book 4.1F Florida College System Credit Program Enrollment
Headcount by Program Area 2014-15
Programs
AA
Agribus/Nat Resources
Apprentice
Business
Certificate of Professional
Prep*
EPI*
Family/ Consumer
Health
Inactive Programs
Industrial
Marketing
Public Service
Sum % Sum % Sum % Sum % Sum % Sum % Sum % Sum % Sum % Sum % Sum % Sum %
YEAR
341,675
67.09
1,004
0.20
2,471
0.49
46,495
9.13
142
0.03
2,064
0.41
7,607
1.49
46,921
9.21
169
0.03
30,594
6.01
5,439
1.07
24,691
4.85 2014-15
Total = 509,272 (Includes 2,423 in Cooperative Training)
PERA - 4.1F 11/20/2015 16:09:45 Source: 2014-15 Student Data Base (Refer to tables 4.5.1T - 4.5.6T and 4.7T) * Upper Level Institutional Credit Programs.

Fact Book 4.2F Florida College System
Credit Program Enrollment Workforce Education
Headcount by Program Area
2014-15
Programs
Agribus/Nat
Resources
Apprentice
Business Family/
Consumer
Health Inactive
Programs
Industrial
Marketing
Public Service
2014-15 1,004 2,471 46,495 7,607 46,921 169 30,594 5,439 24,691
Total = 165,391 (Includes 2,423 in Cooperative Training)
PERA - 4.2F 11/20/2015 16:09:45
Source: 2014-15 Student Data Base (Refer to table 4.7T)

Fact Book 4.3F Florida College System
Credit Program Enrollments Headcount by Award Type 2010-11 through 2014-15
Award Types
AA AS Certificate of Professional Prep Certificates EPI Total 2010-11 351,938 113,019 76 51,879 3,492 520,404
2011-12 355,393 115,244 132 49,179 2,675 522,623
2012-13 348,089 112,798 130 48,473 2,436 511,926
2013-14 339,727 110,542 146 45,998 2,304 498,717
2014-15 341,675 112,409 142 52,982 2,064 509,272
PERA - 4.3F 11/20/2015 16:13:28
Source: 2010-11 through 2014-15 Student Data Base

Fact Book 4.4F Florida College System
Credit Program Enrollment Workforce Education
Headcount by Program Area 2010-11 through 2014-15
Program Types
Agribusiness/
Natural Resources
Marketing
Health
Family/
Consumer
Business
Industrial
Public Service
Apprentice
Inactive
DCT
Total
2010-11 1,018 4,617 44,657 9,694 41,396 32,459 27,756 3,129 116 56 164,898
2011-12 976 5,457 44,095 9,302 42,073 32,718 26,379 2,762 635 26 164,423
2012-13 968 6,432 43,301 8,538 40,656 33,128 25,269 2,278 662 39 161,271
2013-14 997 5,729 43,718 7,536 40,618 30,630 24,688 2,262 336 26 156,540
2014-15 1,004 5,439 46,921 7,607 46,495 30,594 24,691 2,471 169 0 165,391
PERA - 4.4F 11/20/2015 16:13:49
Source: 2010-11 through 2014-15 Student Data Base
Total includes inactive programs and DCT, but not cooperative training, which is included in other vocational program areas.

Fact Book 4.5.1T Florida College System
Credit Program Enrollment Associate in Arts Degree Program
Headcount by College and Ethnicity/Special Populations 2014-15
Ethnicity and Gender Non-Resident
Alien
Asian
American Indian
Black
Hispanic
White
Pacific
Two_or_More
Special Populations
(F)
(M)
(F)
(M)
(F)
(M)
(F)
(M)
(F)
(M)
(F)
(M)
(F)
(M)
(F)
(M) Total
Unknowns
College
Total
Disabled
LEP
DISAD
EFSC 32 40 103 67 27 22 700 536 654 506 3,567 2,940 15 15 198 169 164 9,755 480 331 6,059
BROW 395 387 386 346 29 16 5,333 2,980 5,031 3,767 2,626 2,311 37 38 241 190 1,199 25,312 521 1,796 16,442
CFLA 57 58 65 47 17 12 685 333 672 412 2,647 1,564 10 7 102 90 422 7,200 221 45 4,636
CHIP 0 0 8 5 6 5 205 79 39 31 847 488 0 1 2 6 82 1,804 49 0 769
DAYT 13 46 93 106 24 16 787 483 749 531 3,554 2,413 6 10 117 88 119 9,155 223 1,368 6,301
FSW 148 122 145 116 24 14 927 642 2,198 1,488 4,106 2,965 15 7 168 108 555 13,748 103 9 6,160
FJAX 85 52 418 303 46 28 3,102 1,425 811 571 5,341 3,881 63 49 263 164 2,249 18,851 698 725 10,217
FKEY 1 0 7 6 2 1 33 26 96 43 234 155 0 1 11 6 64 686 38 26 356
GULF 6 5 68 47 24 7 329 160 141 84 1,685 935 0 0 88 74 131 3,784 197 0 2,495
HILL 258 266 269 219 36 35 1,719 1,059 2,486 1,727 3,481 2,555 23 10 215 165 2,447 16,970 377 528 9,501
INDR 57 42 63 44 11 3 721 426 753 525 2,209 1,583 7 3 77 55 311 6,890 166 78 3,595
FGC 3 1 18 6 10 7 238 86 84 47 1,477 707 0 0 15 10 41 2,750 112 0 1,135
LSSC 10 14 82 64 23 6 297 143 226 117 1,500 907 10 3 60 44 346 3,852 144 168 1,736
SCF 78 55 97 84 11 11 554 308 794 456 3,303 2,074 2 1 116 73 423 8,440 412 339 5,143
MIAM 1,837 1,647 249 263 32 23 5,527 3,892 24,636 19,179 1,807 1,766 13 16 132 112 1,822 62,953 2,447 8,777 36,126
NFLA 5 1 7 3 1 2 221 66 58 23 609 294 0 1 0 0 10 1,301 46 0 623
NWFC 4 8 67 31 6 7 176 143 212 155 1,357 1,121 5 6 108 83 156 3,645 124 18 1,522
PALM 192 160 259 225 13 18 2,748 1,692 2,991 2,098 3,494 3,063 30 13 203 180 979 18,358 646 1,661 8,790
PASC 14 11 105 87 26 14 341 178 1,102 743 3,888 2,320 15 13 149 113 185 9,304 263 2 5,909
PENS 11 9 84 80 25 26 573 435 196 176 2,203 1,847 14 13 181 170 128 6,171 296 27 3,034
POLK 22 19 69 46 3 3 646 282 641 340 1,752 970 3 1 65 50 326 5,238 146 58 3,185
ST.J 12 4 80 60 9 13 446 180 328 222 3,032 1,804 15 4 143 86 426 6,864 220 1 3,042
ST.P 58 93 311 276 37 23 1,560 951 1,246 883 5,930 4,766 26 19 262 219 753 17,413 824 395 10,820
SANF 121 209 177 180 36 15 1,473 990 1,164 1,134 4,360 3,810 19 14 273 199 259 14,433 589 0 7,512
SEMI 167 129 216 179 21 14 1,706 871 2,112 1,479 3,686 3,029 19 16 257 204 205 14,310 556 748 8,979
SFLA 22 13 33 28 3 1 174 76 521 258 790 435 6 3 27 19 60 2,469 65 19 1,307
TALL 53 64 46 62 8 8 1,674 1,201 543 657 2,355 2,660 10 5 158 145 302 9,951 517 93 5,691
VALE 376 462 865 858 79 46 4,551 2,978 8,131 5,836 6,561 5,774 110 75 552 466 2,348 40,068 786 2,753 24,391
Total 4,037 3,917 4,390 3,838 589 396 37,446 22,621 58,615 43,488 78,401 59,137 473 344 4,183 3,288 16,512 341,675 11,266 19,965 195,476
CCTCMIS - Factbook 4.5T & 4.10T 11/20/2015 16:14:23
Source: 2014-15 Student Data Base
LEP - Limited English Proficiency
DISAD - Disadvantaged economically or academically
Total unknowns includes both unknown ethnicity and unknown gender.

Fact Book 4.5.2T Florida College System
Credit Program Enrollment Educator Preparation Institute Certificate Program
Headcount by College and Ethnicity/Special Populations 2014-15
Ethnicity and Gender Non-Resident
Alien
Asian
American Indian
Black
Hispanic
White
Pacific
Two_or_More
Special Populations
(F)
(M)
(F)
(M)
(F)
(M)
(F)
(M)
(F)
(M)
(F)
(M)
(F)
(M)
(F)
(M) Total
Unknowns
College
Total
Disabled
LEP
DISAD
EFSC 0 0 0 0 0 0 0 0 0 0 0 0 0 0 0 0 0 0 0 0 0
BROW 2 2 5 0 0 0 29 12 39 19 39 26 0 0 6 0 17 196 1 9 33
CFLA 0 0 0 0 0 0 0 0 0 0 0 0 0 0 0 0 0 0 0 0 0
CHIP 0 0 0 0 0 0 1 0 0 0 8 3 0 0 0 0 1 13 0 0 0
DAYT 0 0 0 1 1 0 4 1 1 2 28 9 0 0 0 0 0 47 1 15 14
FSW 0 0 0 0 0 0 0 0 0 0 0 0 0 0 0 0 0 0 0 0 0
FJAX 0 0 0 0 0 0 3 0 0 0 5 0 0 0 0 0 1 9 0 0 0
FKEY 0 0 0 0 0 0 0 0 0 0 0 0 0 0 0 0 0 0 0 0 0
GULF 0 0 0 0 0 0 0 0 1 1 10 6 0 0 0 0 2 20 0 0 13
HILL 2 2 5 3 1 0 63 12 34 6 150 46 3 0 1 0 38 366 2 7 114
INDR 0 0 2 0 0 0 8 1 12 5 50 17 0 0 0 0 6 101 1 3 1
FGC 0 0 0 1 0 0 4 1 0 1 21 10 0 0 0 0 5 43 1 0 9
LSSC 0 0 0 0 0 0 4 0 0 0 18 6 0 0 0 0 6 34 0 0 5
SCF 1 0 2 0 0 0 0 0 10 3 29 15 0 0 0 1 24 85 0 2 11
MIAM 2 0 2 0 0 0 5 1 36 19 11 3 0 0 0 1 3 83 1 7 1
NFLA 0 0 0 0 0 0 0 0 0 0 0 0 0 0 0 0 0 0 0 0 0
NWFC 0 0 0 0 0 0 0 0 0 0 0 0 0 0 0 0 0 0 0 0 0
PALM 2 0 3 2 0 0 14 3 17 3 59 16 0 0 2 0 18 139 1 4 18
PASC 1 0 0 0 0 0 1 2 8 2 42 19 0 0 0 0 1 76 0 0 39
PENS 0 0 0 0 0 0 4 1 1 1 15 6 0 0 0 0 1 29 0 0 7
POLK 0 0 2 0 1 0 36 9 24 5 92 25 0 0 1 2 50 247 1 0 64
ST.J 0 0 2 0 0 0 7 2 3 1 62 31 0 0 2 0 16 126 0 0 20
ST.P 0 0 0 1 0 0 1 0 1 2 41 18 0 0 0 0 0 64 4 1 20
SANF 0 0 1 1 0 0 4 2 4 0 37 17 0 0 1 1 0 68 1 0 27
SEMI 2 0 1 0 1 0 16 4 14 5 48 20 0 0 3 0 1 115 2 1 20
SFLA 0 0 0 0 0 0 0 0 0 0 0 0 0 0 0 0 0 0 0 0 0
TALL 0 0 0 0 0 0 0 0 0 0 0 0 0 0 0 0 0 0 0 0 0
VALE 0 0 3 0 0 0 22 11 30 4 78 39 0 0 2 1 13 203 1 1 80
Total 12 4 28 9 4 0 226 62 235 79 843 332 3 0 18 6 203 2,064 17 50 496
CCTCMIS - Factbook 4.5T & 4.10T 11/20/2015 16:14:23
Source: 2014-15 Student Data Base
LEP - Limited English Proficiency
DISAD - Disadvantaged economically or academically
Total unknowns includes both unknown ethnicity and unknown gender.

Fact Book 4.5.3T Florida College System
Credit Program Enrollment Certificate of Professional Prep
Headcount by College and Ethnicity/Special Populations 2014-15
Ethnicity and Gender Non-Resident
Alien
Asian
American Indian
Black
Hispanic
White
Pacific
Two_or_More
Special Populations
(F)
(M)
(F)
(M)
(F)
(M)
(F)
(M)
(F)
(M)
(F)
(M)
(F)
(M)
(F)
(M) Total
Unknowns
College
Total
Disabled
LEP
DISAD
EFSC 0 0 0 0 0 0 0 0 0 0 0 0 0 0 0 0 0 0 0 0 0
BROW 0 0 0 0 0 0 0 0 0 0 0 0 0 0 0 0 0 0 0 0 0
CFLA 0 0 0 0 0 0 0 0 0 0 0 0 0 0 0 0 0 0 0 0 0
CHIP 0 0 0 0 0 0 0 0 0 0 0 0 0 0 0 0 0 0 0 0 0
DAYT 0 0 0 0 0 0 0 0 0 0 0 0 0 0 0 0 0 0 0 0 0
FSW 0 0 0 0 0 0 0 0 0 0 0 0 0 0 0 0 0 0 0 0 0
FJAX 0 0 0 0 0 0 0 0 0 0 0 0 0 0 0 0 0 0 0 0 0
FKEY 0 0 0 0 0 0 0 0 0 0 0 0 0 0 0 0 0 0 0 0 0
GULF 0 0 0 0 0 0 0 0 0 0 0 0 0 0 0 0 0 0 0 0 0
HILL 0 0 0 0 0 0 0 0 0 0 0 0 0 0 0 0 0 0 0 0 0
INDR 0 0 0 0 0 0 0 0 0 0 0 0 0 0 0 0 0 0 0 0 0
FGC 0 0 0 0 0 0 0 0 0 0 0 0 0 0 0 0 0 0 0 0 0
LSSC 0 0 0 0 0 0 0 0 0 0 0 0 0 0 0 0 0 0 0 0 0
SCF 0 0 0 0 0 0 0 0 0 0 0 0 0 0 0 0 0 0 0 0 0
MIAM 0 0 0 0 0 0 0 0 0 0 0 0 0 0 0 0 0 0 0 0 0
NFLA 0 0 0 0 0 0 0 0 0 0 0 0 0 0 0 0 0 0 0 0 0
NWFC 0 0 0 0 0 0 0 0 0 0 0 0 0 0 0 0 0 0 0 0 0
PALM 0 0 0 0 0 0 0 0 1 2 0 1 0 0 0 0 0 4 0 1 1
PASC 0 0 0 0 0 0 0 0 0 0 0 0 0 0 0 0 0 0 0 0 0
PENS 0 0 0 0 0 0 0 0 0 0 0 0 0 0 0 0 0 0 0 0 0
POLK 0 0 0 0 0 0 0 0 0 0 0 0 0 0 0 0 0 0 0 0 0
ST.J 0 0 0 0 0 0 0 0 0 0 0 0 0 0 0 0 0 0 0 0 0
ST.P 0 0 2 1 0 0 9 1 8 3 62 23 0 0 1 0 10 120 1 4 26
SANF 0 0 0 0 0 0 0 0 0 0 0 0 0 0 0 0 0 0 0 0 0
SEMI 2 0 0 0 0 0 2 1 3 1 6 3 0 0 0 0 0 18 0 1 1
SFLA 0 0 0 0 0 0 0 0 0 0 0 0 0 0 0 0 0 0 0 0 0
TALL 0 0 0 0 0 0 0 0 0 0 0 0 0 0 0 0 0 0 0 0 0
VALE 0 0 0 0 0 0 0 0 0 0 0 0 0 0 0 0 0 0 0 0 0
Total 2 0 2 1 0 0 11 2 12 6 68 27 0 0 1 0 10 142 1 6 28
CCTCMIS - Factbook 4.5T & 4.10T 11/20/2015 16:14:23
Source: 2014-15 Student Data Base
LEP - Limited English Proficiency
DISAD - Disadvantaged economically or academically
Total unknowns includes both unknown ethnicity and unknown gender.

Fact Book 4.5.4T Florida College System
Credit Program Enrollment Workforce Education: Associate in Science Degree Program
Headcount by College and Ethnicity/Special Populations 2014-15
Ethnicity and Gender Non-Resident
Alien
Asian
American Indian
Black
Hispanic
White
Pacific
Two_or_More
Special Populations
(F)
(M)
(F)
(M)
(F)
(M)
(F)
(M)
(F)
(M)
(F)
(M)
(F)
(M)
(F)
(M) Total
Unknowns
College
Total
Disabled
LEP
DISAD
EFSC 7 7 30 42 9 14 241 199 199 201 1,375 1,213 5 7 64 65 74 3,752 234 108 2,468
BROW 103 95 105 124 8 10 1,360 1,029 1,099 1,235 1,034 1,003 2 7 56 60 408 7,738 182 724 5,107
CFLA 8 9 20 12 7 2 230 122 205 123 1,016 551 2 3 42 19 134 2,505 83 8 1,881
CHIP 0 0 1 0 0 0 40 17 11 8 174 81 0 0 1 1 17 351 17 0 197
DAYT 7 7 37 31 7 11 287 224 231 218 1,415 1,081 6 2 45 17 49 3,675 133 543 2,614
FSW 35 32 39 28 8 15 221 234 534 467 1,144 1,011 4 4 18 40 165 3,999 60 7 2,311
FJAX 37 11 122 116 12 16 1,555 1,062 272 276 2,144 2,036 10 27 69 76 853 8,694 395 242 5,151
FKEY 0 0 2 2 2 3 10 12 35 24 145 194 0 3 3 6 57 498 27 12 267
GULF 3 1 20 17 9 5 139 102 62 42 836 645 0 0 46 24 77 2,028 143 0 1,335
HILL 57 31 75 44 18 13 487 281 579 374 1,046 816 3 3 36 25 478 4,366 142 175 2,483
INDR 12 15 20 21 2 3 266 154 209 213 872 763 1 2 23 30 97 2,703 76 47 1,468
FGC 0 1 4 4 2 1 55 45 26 13 403 301 0 0 4 4 14 877 55 0 464
LSSC 1 2 13 24 4 2 57 49 37 33 347 277 1 3 8 6 92 956 32 32 433
SCF 16 20 27 31 4 4 153 137 208 157 977 789 0 3 20 25 139 2,710 111 107 1,670
MIAM 407 419 60 71 4 5 1,715 1,225 4,407 4,032 521 532 10 7 26 23 415 13,879 762 1,602 7,271
NFLA 1 0 0 0 0 0 29 7 9 3 74 40 0 0 0 0 2 165 4 0 99
NWFC 14 1 40 9 3 4 133 89 96 58 837 530 1 4 46 37 70 1,972 83 16 1,015
PALM 38 15 63 41 4 3 563 315 532 381 951 779 1 2 37 31 276 4,032 167 327 1,790
PASC 1 0 13 13 2 1 38 21 120 75 674 412 2 3 24 22 41 1,462 55 2 1,036
PENS 4 3 25 20 13 6 178 108 75 41 855 485 5 4 67 30 23 1,942 137 15 888
POLK 10 4 34 25 5 3 230 113 226 163 768 522 2 0 30 10 213 2,358 56 36 1,315
ST.J 2 0 38 22 3 7 200 116 105 116 899 804 2 2 57 29 202 2,604 123 2 1,688
ST.P 37 31 234 156 42 20 1,650 829 907 593 5,286 3,336 21 9 180 108 629 14,068 756 360 9,386
SANF 9 15 51 37 6 6 315 198 191 215 1,250 1,083 3 1 51 50 52 3,533 254 0 2,180
SEMI 49 30 92 48 14 4 644 297 590 460 1,541 1,221 6 6 78 69 60 5,209 249 221 3,194
SFLA 3 3 2 3 0 1 24 10 90 53 146 129 1 0 7 4 18 494 12 6 319
TALL 3 5 16 0 3 1 460 171 66 26 502 276 1 1 30 8 81 1,650 148 12 1,123
VALE 204 174 260 279 27 38 1,410 1,473 2,314 2,357 2,108 2,435 30 25 134 178 743 14,189 355 1,494 8,648
Total 1,068 931 1,443 1,220 218 198 12,690 8,639 13,435 11,957 29,340 23,345 119 128 1,202 997 5,479 112,409 4,851 6,098 67,801
CCTCMIS - Factbook 4.5T & 4.10T 11/20/2015 16:14:23
Source: 2014-15 Student Data Base
LEP - Limited English Proficiency
DISAD - Disadvantaged economically or academically
Total unknowns includes both unknown ethnicity and unknown gender.

Fact Book 4.5.5T Florida College System
Credit Program Enrollment Workforce Education: Postsecondary Adult Vocational Certificate Program
Headcount by College and Ethnicity/Special Populations 2014-15
Ethnicity and Gender Non-Resident
Alien
Asian
American Indian
Black
Hispanic
White
Pacific
Two_or_More
Special Populations
(F)
(M)
(F)
(M)
(F)
(M)
(F)
(M)
(F)
(M)
(F)
(M)
(F)
(M)
(F)
(M) Total
Unknowns
College
Total
Disabled
LEP
DISAD
EFSC 1 1 11 4 2 2 47 24 39 37 266 212 1 2 4 13 12 678 33 22 289
BROW 10 20 14 15 0 0 125 122 126 212 119 174 1 5 11 5 45 1,004 16 90 449
CFLA 0 1 1 0 0 3 26 32 9 28 47 172 0 0 3 8 7 337 2 0 161
CHIP 0 0 0 0 1 1 31 16 2 4 53 115 0 0 4 3 3 233 9 0 58
DAYT 0 0 12 12 0 6 116 98 133 98 532 544 3 2 12 13 22 1,603 36 234 763
FSW 0 2 0 0 0 0 0 2 2 17 2 36 0 0 0 4 9 74 0 0 15
FJAX 17 9 34 29 8 5 593 496 149 124 590 935 4 7 12 22 331 3,365 126 88 836
FKEY 0 0 0 0 0 1 3 4 4 12 8 20 0 0 0 0 6 58 0 2 17
GULF 0 0 2 1 0 0 12 6 3 3 42 47 0 0 2 2 5 125 3 0 53
HILL 2 7 5 22 1 2 56 138 31 212 97 599 0 3 4 6 387 1,572 19 6 237
INDR 8 14 13 5 0 4 181 191 177 189 449 593 0 2 10 13 61 1,910 35 62 521
FGC 0 0 3 1 0 0 100 54 18 16 283 280 0 0 8 2 23 788 38 0 367
LSSC 0 0 0 0 0 0 0 0 0 0 0 0 0 0 0 0 0 0 0 0 0
SCF 0 0 0 0 0 0 0 0 0 0 0 0 0 0 0 0 0 0 0 0 0
MIAM 59 84 8 0 1 0 279 232 464 677 43 117 1 0 0 4 78 2,047 81 289 306
NFLA 0 0 0 0 0 0 29 12 2 3 62 19 0 0 0 0 1 128 4 0 88
NWFC 0 0 5 3 0 1 11 15 5 19 72 143 0 1 3 9 10 297 3 1 97
PALM 17 7 41 27 3 3 471 364 539 467 460 863 2 1 26 14 248 3,553 97 139 632
PASC 2 0 11 5 1 1 22 10 45 31 299 152 1 1 9 3 13 606 21 1 261
PENS 0 0 12 1 2 5 84 64 26 7 225 106 0 0 17 10 5 564 24 11 232
POLK 0 0 0 2 0 0 6 14 8 27 16 85 0 0 0 2 2 162 1 0 26
ST.J 0 0 1 0 0 0 4 16 3 8 20 104 0 0 2 8 30 196 2 1 64
ST.P 0 0 0 3 0 0 9 13 10 23 43 213 0 1 1 2 15 333 6 3 42
SANF 0 1 5 3 0 1 27 46 16 37 113 321 0 0 4 5 12 591 26 0 196
SEMI 2 3 2 5 1 3 42 87 30 136 90 456 0 1 4 15 20 897 25 26 244
SFLA 3 11 2 3 1 0 27 23 83 85 95 158 1 3 3 2 16 516 24 1 223
TALL 1 0 3 3 1 0 101 99 24 21 92 198 1 0 6 4 17 571 15 2 94
VALE 0 0 3 10 0 1 41 72 31 111 27 163 0 2 3 8 17 489 9 5 78
Total 122 160 188 154 22 39 2,443 2,250 1,979 2,604 4,145 6,825 15 31 148 177 1,395 22,697 655 983 6,349
CCTCMIS - Factbook 4.5T & 4.10T 11/20/2015 16:14:23
Source: 2014-15 Student Data Base
LEP - Limited English Proficiency
DISAD - Disadvantaged economically or academically
Total unknowns includes both unknown ethnicity and unknown gender.

Fact Book 4.5.6T Florida College System
Credit Program Enrollment Workforce Education: Postsecondary Vocational Certificate Program
Headcount by College and Ethnicity/Special Populations 2014-15
Ethnicity and Gender Non-Resident
Alien
Asian
American Indian
Black
Hispanic
White
Pacific
Two_or_More
Special Populations
(F)
(M)
(F)
(M)
(F)
(M)
(F)
(M)
(F)
(M)
(F)
(M)
(F)
(M)
(F)
(M) Total
Unknowns
College
Total
Disabled
LEP
DISAD
EFSC 1 2 10 7 2 0 75 27 60 26 339 224 2 0 22 9 6 812 58 26 393
BROW 102 95 100 76 9 2 837 556 912 809 498 675 8 1 25 28 223 4,956 79 530 2,932
CFLA 0 0 2 1 1 0 10 6 8 13 50 88 0 0 2 4 10 195 2 0 70
CHIP 0 0 0 0 0 0 1 0 0 1 11 23 0 0 0 0 0 36 1 0 2
DAYT 0 2 10 7 5 4 39 34 40 58 261 298 0 0 4 4 8 774 44 116 447
FSW 2 3 1 6 1 6 10 21 37 72 129 222 0 1 4 7 44 566 7 0 220
FJAX 27 3 73 66 11 6 723 423 101 116 1,100 917 5 11 38 31 413 4,064 195 137 2,370
FKEY 0 0 0 0 0 0 4 1 3 1 18 36 0 0 1 3 11 78 5 1 28
GULF 0 0 3 2 0 0 12 7 6 3 44 66 0 0 2 1 6 152 7 0 63
HILL 11 8 14 19 8 4 73 99 101 173 240 443 1 1 12 8 194 1,409 41 47 535
INDR 6 5 3 3 0 3 101 56 47 69 245 288 0 5 12 5 41 889 23 15 449
FGC 0 0 2 1 0 0 31 24 11 1 189 141 0 0 1 0 9 410 28 0 219
LSSC 1 2 3 1 1 1 18 4 6 6 51 44 0 0 1 1 11 151 3 8 52
SCF 0 0 3 2 0 0 5 9 9 6 39 35 0 0 0 1 4 113 4 8 52
MIAM 45 76 5 6 0 0 164 142 482 587 42 91 1 1 0 2 51 1,695 70 241 390
NFLA 0 0 0 0 0 0 5 6 1 2 33 40 0 0 0 0 0 87 3 0 38
NWFC 0 1 1 1 0 0 22 13 8 10 137 104 0 0 5 3 13 318 17 2 116
PALM 11 4 21 16 2 2 216 159 278 209 310 412 2 2 12 12 167 1,835 79 117 431
PASC 0 1 1 3 0 0 7 4 8 11 53 101 0 0 2 4 5 200 4 0 69
PENS 1 0 2 2 0 0 38 7 2 4 112 68 0 0 9 3 7 255 10 1 65
POLK 0 1 5 1 0 1 13 10 17 13 59 34 0 0 1 0 17 172 8 3 78
ST.J 0 0 8 4 0 0 36 15 22 20 191 145 2 0 7 5 44 499 30 0 302
ST.P 9 1 21 23 1 7 116 85 68 57 508 589 1 1 10 16 92 1,605 89 46 736
SANF 0 4 8 3 0 1 71 33 18 35 203 184 0 0 10 8 9 587 40 0 309
SEMI 33 27 35 24 4 1 272 128 293 231 703 660 8 6 33 30 31 2,519 115 131 1,409
SFLA 1 0 0 0 0 0 3 1 16 8 26 26 1 0 0 1 6 89 10 1 48
TALL 1 2 2 4 0 1 54 36 21 12 49 90 0 0 4 5 10 291 15 6 83
VALE 78 62 127 120 11 7 460 451 801 692 909 1,013 2 5 45 61 332 5,176 144 448 2,620
Total 329 299 460 398 56 46 3,416 2,357 3,376 3,245 6,549 7,057 33 34 262 252 1,764 29,933 1,131 1,884 14,526
CCTCMIS - Factbook 4.5T & 4.10T 11/20/2015 16:14:23
Source: 2014-15 Student Data Base
LEP - Limited English Proficiency
DISAD - Disadvantaged economically or academically
Total unknowns includes both unknown ethnicity and unknown gender.

Fact Book 4.5.7T Florida College System
Credit Program Enrollment Workforce Education: Advanced Technical Certificate Program
Headcount by College and Ethnicity/Special Populations 2014-15
Ethnicity and Gender Non-Resident
Alien
Asian
American Indian
Black
Hispanic
White
Pacific
Two_or_More
Special Populations
(F)
(M)
(F)
(M)
(F)
(M)
(F)
(M)
(F)
(M)
(F)
(M)
(F)
(M)
(F)
(M) Total
Unknowns
College
Total
Disabled
LEP
DISAD
EFSC 0 0 0 0 0 0 0 0 0 0 0 0 0 0 0 0 0 0 0 0 0
BROW 1 0 0 0 0 0 2 5 4 7 2 8 0 0 0 0 3 32 0 6 16
CFLA 0 0 0 0 0 0 0 0 0 0 0 0 0 0 0 0 0 0 0 0 0
CHIP 0 0 0 0 0 0 0 0 0 0 0 0 0 0 0 0 0 0 0 0 0
DAYT 0 0 0 1 0 0 0 0 0 1 1 6 0 0 0 0 0 9 0 2 0
FSW 0 0 0 0 0 0 0 0 0 0 0 0 0 0 0 0 0 0 0 0 0
FJAX 0 0 0 0 0 0 0 0 0 0 0 0 0 0 0 0 0 0 0 0 0
FKEY 0 0 0 0 0 0 0 0 0 0 0 0 0 0 0 0 0 0 0 0 0
GULF 0 0 0 0 0 0 0 0 1 0 1 0 0 0 0 0 0 2 0 0 0
HILL 1 0 2 0 0 0 8 0 6 1 17 6 0 0 0 0 4 45 2 3 3
INDR 0 0 0 0 0 0 1 0 0 0 0 0 0 0 0 0 0 1 0 0 1
FGC 0 0 0 0 0 0 0 0 0 0 0 0 0 0 0 0 0 0 0 0 0
LSSC 0 0 0 0 0 0 0 0 0 0 0 0 0 0 0 0 0 0 0 0 0
SCF 1 0 1 0 0 0 1 3 1 1 25 6 0 0 0 0 3 42 0 2 16
MIAM 1 0 0 0 0 0 0 0 2 1 0 1 0 0 0 0 0 5 0 2 1
NFLA 0 0 0 0 0 0 0 0 0 0 0 0 0 0 0 0 0 0 0 0 0
NWFC 0 0 0 0 0 0 0 0 0 0 0 0 0 0 0 0 0 0 0 0 0
PALM 1 0 1 1 0 0 3 7 11 10 15 7 0 0 0 0 6 62 1 5 6
PASC 0 0 0 0 0 0 0 0 0 0 0 0 0 0 0 0 0 0 0 0 0
PENS 0 0 0 0 0 0 2 0 0 0 3 1 0 0 0 0 0 6 0 0 0
POLK 0 0 0 0 0 0 0 0 2 0 3 1 0 0 0 0 0 6 0 0 0
ST.J 0 0 0 0 0 0 0 0 0 0 0 0 0 0 0 0 0 0 0 0 0
ST.P 0 0 0 0 0 0 5 2 2 1 16 12 0 0 0 0 1 39 0 1 12
SANF 0 0 0 1 0 0 5 0 0 0 8 6 0 0 0 0 0 20 1 0 4
SEMI 0 0 0 0 0 0 0 0 0 0 0 0 0 0 0 0 0 0 0 0 0
SFLA 0 0 0 0 0 0 0 0 0 0 0 0 0 0 0 0 0 0 0 0 0
TALL 0 0 0 0 0 0 1 0 0 0 2 0 0 0 0 0 0 3 0 0 2
VALE 0 0 3 1 0 0 9 3 19 6 28 8 0 0 1 0 2 80 1 4 13
Total 5 0 7 4 0 0 37 20 48 28 121 62 0 0 1 0 19 352 5 25 74
CCTCMIS - Factbook 4.5T & 4.10T 11/20/2015 16:14:23
Source: 2014-15 Student Data Base
LEP - Limited English Proficiency
DISAD - Disadvantaged economically or academically
Total unknowns includes both unknown ethnicity and unknown gender.

Fact Book 4.5.8T Florida College System
Credit Program Enrollment All Program Areas
Headcount by College and Ethnicity/Special Populations 2014-15
Ethnicity and Gender Non-Resident
Alien
Asian
American Indian
Black
Hispanic
White
Pacific
Two_or_More
Special Populations
(F)
(M)
(F)
(M)
(F)
(M)
(F)
(M)
(F)
(M)
(F)
(M)
(F)
(M)
(F)
(M) Total
Unknowns
College
Total
Disabled
LEP
DISAD
EFSC 41 50 154 120 40 38 1,063 786 952 770 5,547 4,589 23 24 288 256 256 14,997 805 487 9,209
BROW 613 599 610 561 46 28 7,686 4,704 7,211 6,049 4,318 4,197 48 51 339 283 1,895 39,238 799 3,155 24,979
CFLA 65 68 88 60 25 17 951 493 894 576 3,760 2,375 12 10 149 121 573 10,237 308 53 6,748
CHIP 0 0 9 5 7 6 278 112 52 44 1,093 710 0 1 7 10 103 2,437 76 0 1,026
DAYT 20 55 152 158 37 37 1,233 840 1,154 908 5,791 4,351 15 14 178 122 198 15,263 437 2,278 10,139
FSW 185 159 185 150 33 35 1,158 899 2,771 2,044 5,381 4,234 19 12 190 159 773 18,387 170 16 8,706
FJAX 166 75 647 514 77 55 5,976 3,406 1,333 1,087 9,180 7,769 82 94 382 293 3,847 34,983 1,414 1,192 18,574
FKEY 1 0 9 8 4 5 50 43 138 80 405 405 0 4 15 15 138 1,320 70 41 668
GULF 9 6 93 67 33 12 492 275 214 133 2,618 1,699 0 0 138 101 221 6,111 350 0 3,959
HILL 331 314 370 307 64 54 2,406 1,589 3,237 2,493 5,031 4,465 30 17 268 204 3,548 24,728 583 766 12,873
INDR 83 76 101 73 13 13 1,278 828 1,198 1,001 3,825 3,244 8 12 122 103 516 12,494 301 205 6,035
FGC 3 2 27 13 12 8 428 210 139 78 2,373 1,439 0 0 28 16 92 4,868 234 0 2,194
LSSC 12 18 98 89 28 9 376 196 269 156 1,916 1,234 11 6 69 51 455 4,993 179 208 2,226
SCF 96 75 130 117 15 15 713 457 1,022 623 4,373 2,919 2 4 136 100 593 11,390 527 458 6,892
MIAM 2,351 2,226 324 340 37 28 7,690 5,492 30,027 24,495 2,424 2,510 25 24 158 142 2,369 80,662 3,361 10,918 44,095
NFLA 6 1 7 3 1 2 284 91 70 31 778 393 0 1 0 0 13 1,681 57 0 848
NWFC 18 10 113 44 9 12 342 260 321 242 2,403 1,898 6 11 162 132 249 6,232 227 37 2,750
PALM 261 186 388 312 22 26 4,015 2,540 4,369 3,170 5,289 5,141 35 18 280 237 1,694 27,983 991 2,254 11,668
PASC 18 12 130 108 29 16 409 215 1,283 862 4,956 3,004 18 17 184 142 245 11,648 343 5 7,314
PENS 16 12 123 103 40 37 879 615 300 229 3,413 2,513 19 17 274 213 164 8,967 467 54 4,226
POLK 32 24 110 74 9 7 931 428 918 548 2,690 1,637 5 1 97 64 608 8,183 212 97 4,668
ST.J 14 4 129 86 12 20 693 329 461 367 4,204 2,888 19 6 211 128 718 10,289 375 4 5,116
ST.P 104 125 568 460 80 50 3,350 1,881 2,242 1,562 11,886 8,957 48 30 454 345 1,500 33,642 1,680 810 21,042
SANF 130 229 242 225 42 23 1,895 1,269 1,393 1,421 5,971 5,421 22 15 339 263 332 19,232 911 0 10,228
SEMI 255 189 346 256 41 22 2,682 1,388 3,042 2,312 6,074 5,389 33 29 375 318 317 23,068 947 1,128 13,847
SFLA 29 27 37 34 4 2 228 110 710 404 1,057 748 9 6 37 26 100 3,568 111 27 1,897
TALL 58 71 67 69 12 10 2,290 1,507 654 716 3,000 3,224 12 6 198 162 410 12,466 695 113 6,993
VALE 658 698 1,261 1,268 117 92 6,493 4,988 11,326 9,006 9,711 9,432 142 107 737 714 3,455 60,205 1,296 4,705 35,830
Total 5,575 5,311 6,518 5,624 889 679 56,269 35,951 77,700 61,407 119,467 96,785 643 537 5,815 4,720 25,382 509,272 17,926 29,011 284,750
CCTCMIS - Factbook 4.5T & 4.10T 11/20/2015 16:14:23
Source: 2014-15 Student Data Base
LEP - Limited English Proficiency
DISAD - Disadvantaged economically or academically
Total unknowns includes both unknown ethnicity and unknown gender.

Fact Book 4.6T Florida College System
Program Enrollment Headcount by College and Program Area
2014-15
Workforce Education
Associate In Arts
Educator
Preparation
Institute
Certificate of
Professional
Prep
College &
Vocational
Preparatory
AS
Degree
PSV
Cert.
PSAV
Cert.
CWE*
Adult Education
Basic &
Secondary
Community Instructional
Services
Rec. & Leisure
Life Long Learning
Other
Total (Duplicated)
Unduplicated Headcount
Eastern Florida 9,755 0 0 2,317 3,752 812 678 3,594 0 61 198 3,374 24,541 24,620
Broward 25,312 196 0 10,490 7,738 4,988 1,004 2,773 0 129 0 26,500 79,130 67,313
Central Florida 7,200 0 0 1,722 2,505 195 337 1,639 176 0 0 . 13,774 13,278
Chipola 1,804 13 0 223 351 36 233 506 0 0 0 . 3,166 3,131
Daytona 9,155 47 0 2,687 3,675 783 1,603 4,658 3,652 0 13 4,210 30,483 27,679
FL SouthWestern 13,748 0 0 2,212 3,999 566 74 16 0 9 0 3,339 23,963 21,499
Fla SC at Jax 18,851 9 0 5,027 8,694 4,064 3,365 4,662 4,100 391 0 12,857 62,020 52,190
Florida Keys 686 0 0 175 498 78 58 262 0 368 0 242 2,367 1,828
Gulf Coast 3,784 20 0 954 2,028 154 125 2,059 0 1,923 0 . 11,047 12,285
Hillsborough 16,970 366 0 6,151 4,366 1,454 1,572 3,873 370 749 0 9,445 45,316 44,085
Indian River 6,890 101 0 2,499 2,703 890 1,910 159 3,188 232 0 6,834 25,406 28,276
Florida Gateway 2,750 43 0 310 877 410 788 596 0 0 21 792 6,587 4,575
Lake Sumter 3,852 34 0 584 956 151 0 1,066 0 1,448 131 1,506 9,728 7,061
State College FL 8,440 85 0 1,664 2,710 155 0 4,146 0 412 0 4,512 22,124 21,069
Miami Dade 62,953 83 0 21,950 13,879 1,700 2,047 41,801 8,502 29,314 0 24,652 206,881 141,737
North Florida 1,301 0 0 182 165 87 128 289 0 0 0 70 2,222 2,064
Northwest Fla 3,645 0 0 876 1,972 318 297 598 1,240 2,191 0 2,199 13,336 11,979
Palm Beach State 18,358 139 4 4,608 4,032 1,897 3,553 3,665 0 2,207 556 13,991 53,010 46,816
Pasco-Hernando 9,304 76 0 2,423 1,462 200 606 2,275 149 0 31 2,106 18,632 17,105
Pensacola 6,171 29 0 1,797 1,942 261 564 1,614 2,042 4,231 0 2,578 21,229 18,522
Polk 5,238 247 0 1,734 2,358 178 162 . 0 0 0 3,567 13,484 16,920
St. Johns River 6,864 126 0 1,223 2,604 499 196 503 534 246 0 1,676 14,471 11,036
St. Petersburg 17,413 64 120 5,813 14,068 1,644 333 10,891 0 1,719 166 4,333 56,564 55,362
Santa Fe 14,433 68 0 2,387 3,533 607 591 1,231 1,020 4,375 0 1,877 30,122 23,094
Seminole State 14,310 115 18 3,009 5,209 2,519 897 558 2,924 65 110 731 30,465 29,684
South Florida 2,469 0 0 192 494 89 516 1,138 1,158 1,420 0 736 8,212 6,029
Tallahassee 9,951 0 0 3,229 1,650 294 571 19,258 728 1,444 0 6,212 43,337 38,017
Valencia 40,068 203 0 8,110 14,189 5,256 489 4,335 0 0 0 14,720 87,370 66,284
System Total 341,675 2,064 142 94,548 112,409 30,285 22,697 118,165 29,783 52,934 1,226 153,059 958,987 813,538
PERA - 4.6T 11/23/2015 10:10:52
Source: 2015 Student Data Base
Other = These figures reflect students awaiting enrollment in limited access programs, students enrolled in apprenticeship courses, and students who are enrolled in courses related to employment, as general freshmen or for other personal objectives. There may be some
duplication between major program areas.
Unduplicated headcount represents the unduplicated number of students by each college, excluding recreation and leisure.
*Continuing workforce education (CWE)

Fact Book 4.7T Florida College System
Credit Program Enrollment: Workforce Education Headcount by College and Program Area
2014-15
Marketing
Health
Family/
Consumer
Business
Industrial
Public Service
Apprentice
Agriculture/
Natural Resources
Inactive
Total
Co-Op Training
Eastern Florida 3 1,018 316 1,746 1,425 734 0 0 0 5,242 97
Broward 265 3,511 555 5,528 2,472 1,399 0 0 0 13,730 172
Central Florida 0 1,300 122 860 153 419 0 183 0 3,037 135
Chipola 0 252 26 75 119 148 0 0 0 620 0
Daytona 129 1,843 201 1,393 1,638 655 202 0 0 6,061 148
FL SouthWestern 0 1,967 62 1,522 89 999 0 0 0 4,639 0
Fla SC at Jax 1,235 2,370 931 5,221 4,274 1,862 230 0 0 16,123 898
Florida Keys 102 104 0 108 97 58 0 165 0 634 0
Gulf Coast 34 979 8 442 423 421 0 0 0 2,307 47
Hillsborough 122 2,309 164 1,243 1,072 1,894 555 33 0 7,392 0
Indian River 139 1,324 271 1,124 1,427 788 355 75 0 5,503 143
Florida Gateway 0 957 93 214 357 397 0 57 0 2,075 0
Lake Sumter 0 372 73 428 76 158 0 0 0 1,107 3
State College FL 33 626 225 1,025 501 455 0 0 0 2,865 0
Miami Dade 849 4,428 1,124 3,071 4,698 3,200 135 49 72 17,626 137
North Florida 0 231 35 27 45 42 0 0 0 380 0
Northwest Fla 18 972 109 577 457 453 0 0 1 2,587 10
Palm Beach State 407 2,583 1,451 1,430 1,551 1,503 489 68 0 9,482 24
Pasco-Hernando 10 1,277 0 577 66 338 0 0 0 2,268 65
Pensacola 54 1,236 60 460 763 189 0 5 0 2,767 24
Polk 0 1,113 201 512 444 428 0 0 0 2,698 9
St. Johns River 11 748 0 1,608 410 500 22 0 0 3,299 0
St. Petersburg 436 8,160 270 3,065 1,589 2,524 0 0 1 16,045 110
Santa Fe 13 1,777 174 1,380 700 343 154 190 0 4,731 0
Seminole State 77 2,521 772 2,661 1,132 1,157 305 0 0 8,625 322
South Florida 0 368 36 238 238 165 19 35 0 1,099 79
Tallahassee 0 725 328 530 183 744 5 0 0 2,515 0
Valencia 1,502 1,850 0 9,430 4,195 2,718 0 144 95 19,934 0
System Total 5,439 46,921 7,607 46,495 30,594 24,691 2,471 1,004 169 165,391 2,423
PERA - 4.1F 02/22/2016 11:22:38
Source: 2015 Student Data Base
Does not include workforce education (CWE) course enrollments
Cooperative training is also included in vocational program areas
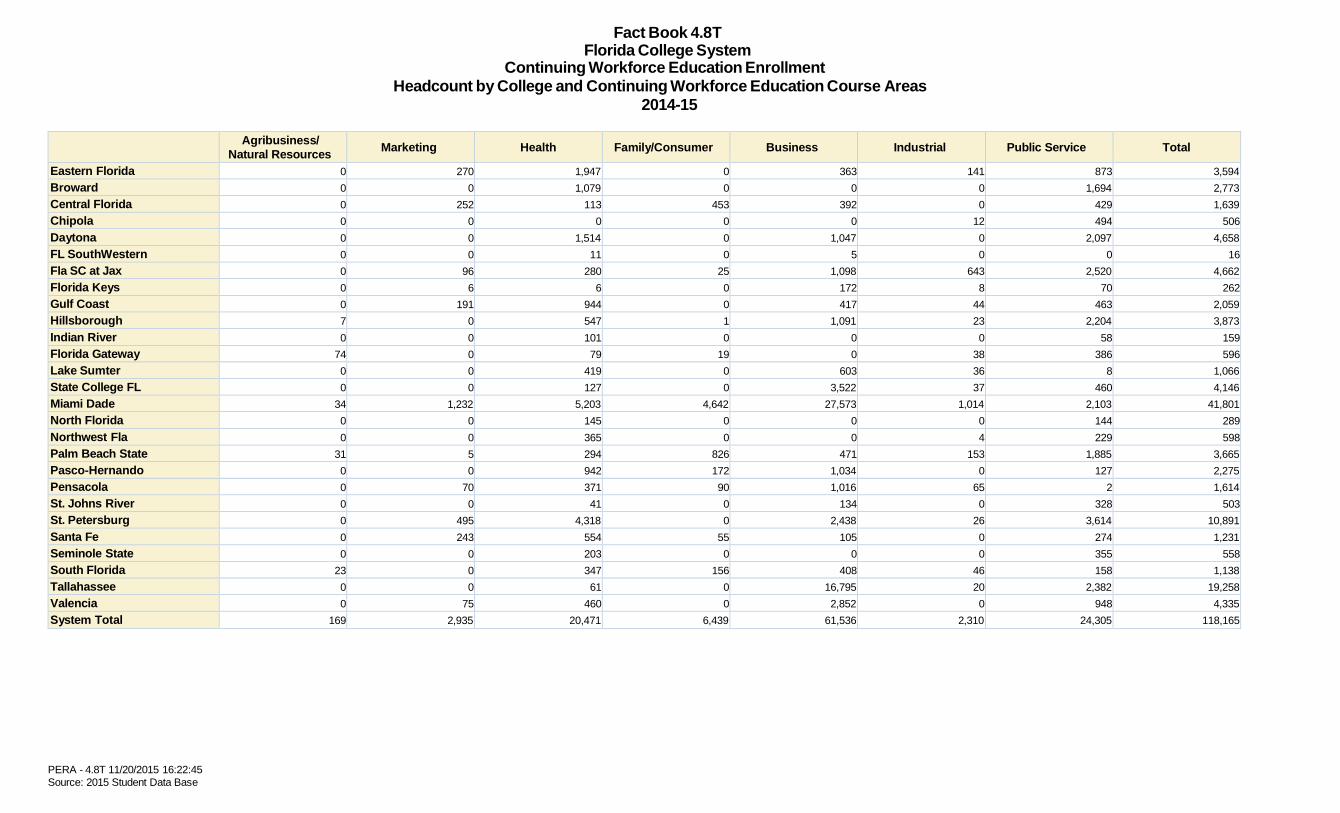
Fact Book 4.8T Florida College System
Continuing Workforce Education Enrollment Headcount by College and Continuing Workforce Education Course Areas
2014-15
Agribusiness/
Natural Resources
Marketing
Health
Family/Consumer
Business
Industrial
Public Service
Total
Eastern Florida 0 270 1,947 0 363 141 873 3,594
Broward 0 0 1,079 0 0 0 1,694 2,773
Central Florida 0 252 113 453 392 0 429 1,639
Chipola 0 0 0 0 0 12 494 506
Daytona 0 0 1,514 0 1,047 0 2,097 4,658
FL SouthWestern 0 0 11 0 5 0 0 16
Fla SC at Jax 0 96 280 25 1,098 643 2,520 4,662
Florida Keys 0 6 6 0 172 8 70 262
Gulf Coast 0 191 944 0 417 44 463 2,059
Hillsborough 7 0 547 1 1,091 23 2,204 3,873
Indian River 0 0 101 0 0 0 58 159
Florida Gateway 74 0 79 19 0 38 386 596
Lake Sumter 0 0 419 0 603 36 8 1,066
State College FL 0 0 127 0 3,522 37 460 4,146
Miami Dade 34 1,232 5,203 4,642 27,573 1,014 2,103 41,801
North Florida 0 0 145 0 0 0 144 289
Northwest Fla 0 0 365 0 0 4 229 598
Palm Beach State 31 5 294 826 471 153 1,885 3,665
Pasco-Hernando 0 0 942 172 1,034 0 127 2,275
Pensacola 0 70 371 90 1,016 65 2 1,614
St. Johns River 0 0 41 0 134 0 328 503
St. Petersburg 0 495 4,318 0 2,438 26 3,614 10,891
Santa Fe 0 243 554 55 105 0 274 1,231
Seminole State 0 0 203 0 0 0 355 558
South Florida 23 0 347 156 408 46 158 1,138
Tallahassee 0 0 61 0 16,795 20 2,382 19,258
Valencia 0 75 460 0 2,852 0 948 4,335
System Total 169 2,935 20,471 6,439 61,536 2,310 24,305 118,165
PERA - 4.8T 11/20/2015 16:22:45
Source: 2015 Student Data Base

Fact Book 4.9T Florida College System
Credit Enrollment Workforce Education
Headcount by College and Apprenticeship Program Areas
2014-15
Business Family/Consumer Health Industrial Marketing Public Service Total
Eastern Florida 0 0 0 0 0 0 0
Broward 0 0 0 0 0 0 0
Central Florida 0 0 0 0 0 0 0
Chipola 0 0 0 0 0 0 0
Daytona 0 66 0 136 0 0 202
FL SouthWestern 0 0 0 0 0 0 0
Fla SC at Jax 0 0 0 230 0 0 230
Florida Keys 0 0 0 0 0 0 0
Gulf Coast 0 0 0 0 0 0 0
Hillsborough 0 0 0 555 0 0 555
Indian River 0 135 0 220 0 0 355
Florida Gateway 0 0 0 0 0 0 0
Lake Sumter 0 0 0 0 0 0 0
State College FL 0 0 0 0 0 0 0
Miami Dade 0 0 0 135 0 0 135
North Florida 0 0 0 0 0 0 0
Northwest Fla 0 0 0 0 0 0 0
Palm Beach State 0 0 0 489 0 0 489
Pasco-Hernando 0 0 0 0 0 0 0
Pensacola 0 0 0 0 0 0 0
Polk 0 0 0 0 0 0 0
St. Johns River 0 0 0 22 0 0 22
St. Petersburg 0 0 0 0 0 0 0
Santa Fe 0 0 0 154 0 0 154
Seminole State 0 0 0 305 0 0 305
South Florida 0 0 0 19 0 0 19
Tallahassee 0 0 0 5 0 0 5
Valencia 0 0 0 0 0 0 0
System Total 0 201 0 2,270 0 0 2,471
PERA - 4.9T 11/20/2015 16:15:40
Source: 2014-15 Student Data Base

Fact Book 4.10.1T Florida College System
Credit Program Enrollment Educational Bachelors Degree Programs
Headcount by College and Ethnicity/Special Populations 2014-15
Ethnicity and Gender Non-Resident
Alien
Asian
American Indian
Black
Hispanic
White
Pacific
Two_or_More
Special Populations
(F)
(M)
(F)
(M)
(F)
(M)
(F)
(M)
(F)
(M)
(F)
(M)
(F)
(M)
(F)
(M) Total
Unknowns
College
Total
Disabled
LEP
DISAD
EFSC 0 0 0 0 0 0 0 0 0 0 0 0 0 0 0 0 0 0 0 0 0
BROW 4 3 13 1 1 1 94 22 98 19 99 24 2 1 5 2 13 402 9 19 275
CFLA 1 0 0 0 0 0 3 0 3 0 37 3 1 0 0 0 0 48 2 0 38
CHIP 0 0 0 0 3 0 4 2 0 0 62 13 0 0 0 0 4 88 3 0 45
DAYT 0 0 1 1 0 0 9 1 15 5 158 32 0 0 2 1 0 225 12 31 175
FSW 1 0 0 0 2 0 6 4 31 10 171 21 1 0 1 1 9 258 5 0 175
FJAX 1 0 2 0 1 0 68 4 5 1 145 8 0 0 1 0 25 261 10 4 166
FKEY 0 0 0 0 0 0 0 0 0 0 0 0 0 0 0 0 0 0 0 0 0
GULF 0 0 0 0 0 0 0 0 0 0 0 0 0 0 0 0 0 0 0 0 0
HILL 0 0 0 0 0 0 0 0 0 0 0 0 0 0 0 0 0 0 0 0 0
INDR 1 0 3 1 3 0 13 4 30 9 171 38 1 0 2 1 10 287 5 1 199
FGC 0 0 0 0 0 0 3 0 2 0 9 0 0 0 0 0 0 14 1 0 11
LSSC 0 0 0 0 0 0 0 0 0 0 0 0 0 0 0 0 0 0 0 0 0
SCF 1 0 2 0 1 0 20 1 10 0 63 1 0 0 0 0 1 100 3 1 67
MIAM 14 2 1 1 0 0 73 15 428 73 51 13 0 0 1 0 13 685 48 12 364
NFLA 0 0 0 0 0 0 0 0 0 0 0 0 0 0 0 0 0 0 0 0 0
NWFC 0 0 3 0 0 0 15 1 3 0 86 18 0 0 5 2 5 138 8 0 78
PALM 0 0 0 0 0 0 0 0 0 0 0 0 0 0 0 0 0 0 0 0 0
PASC 0 0 0 0 0 0 0 0 0 0 0 0 0 0 0 0 0 0 0 0 0
PENS 0 0 0 0 0 0 0 0 0 0 0 0 0 0 0 0 0 0 0 0 0
POLK 0 0 0 0 0 0 0 0 0 0 0 0 0 0 0 0 0 0 0 0 0
ST.J 0 0 0 0 0 0 3 0 8 0 69 3 0 0 1 0 2 86 4 0 71
ST.P 2 0 8 4 2 0 55 9 74 10 466 99 1 0 7 1 34 772 54 9 534
SANF 0 0 0 0 2 0 39 1 9 0 46 5 0 0 3 1 0 106 6 0 70
SEMI 0 0 0 0 0 0 0 0 0 0 0 0 0 0 0 0 0 0 0 0 0
SFLA 0 0 0 0 0 0 0 0 3 1 11 3 0 0 0 0 0 18 1 0 15
TALL 0 0 0 0 0 0 0 0 0 0 0 0 0 0 0 0 0 0 0 0 0
VALE 0 0 0 0 0 0 0 0 0 0 0 0 0 0 0 0 0 0 0 0 0
Total 25 5 33 8 15 1 405 64 719 128 1,644 281 6 1 28 9 116 3,488 171 77 2,283
PERA - 4.5T & 4.10T 11/20/2015 16:15:43
Source: 2014-15 Student Data Base
LEP - Limited English Proficiency
DISAD - Disadvantaged economically or academically
Total unknowns includes both unknown ethnicity and unknown gender.

Fact Book 4.10.2T Florida College System
Credit Program Enrollment Nursing Bachelors Degree Programs
Headcount by College and Ethnicity/Special Populations 2014-15
Ethnicity and Gender Non-Resident
Alien
Asian
American Indian
Black
Hispanic
White
Pacific
Two_or_More
Special Populations
(F)
(M)
(F)
(M)
(F)
(M)
(F)
(M)
(F)
(M)
(F)
(M)
(F)
(M)
(F)
(M) Total
Unknowns
College
Total
Disabled
LEP
DISAD
EFSC 0 0 0 0 0 0 0 0 0 0 0 0 0 0 0 0 0 0 0 0 0
BROW 10 0 12 5 1 0 181 11 59 10 88 18 0 0 2 0 11 408 1 40 97
CFLA 0 1 4 1 0 1 8 2 9 5 35 9 0 0 2 0 1 78 1 0 46
CHIP 0 0 0 0 0 0 11 1 0 0 48 10 0 0 0 0 1 71 1 0 16
DAYT 0 0 2 0 1 0 24 2 21 1 111 13 0 0 3 0 2 180 6 47 86
FSW 2 0 8 3 0 0 46 9 39 8 179 33 0 0 2 0 35 364 1 0 133
FJAX 2 0 4 2 0 0 64 6 7 0 88 8 1 0 0 1 18 201 7 5 88
FKEY 0 0 0 0 0 0 0 0 0 0 0 0 0 0 0 0 0 0 0 0 0
GULF 0 0 1 0 0 0 3 0 1 0 40 6 0 0 3 1 1 56 3 0 36
HILL 0 0 0 0 0 0 0 0 0 0 0 0 0 0 0 0 0 0 0 0 0
INDR 2 0 5 2 3 0 56 12 26 9 220 32 2 0 3 0 12 384 7 6 101
FGC 0 0 1 0 0 0 5 1 1 0 43 4 0 0 0 0 1 56 1 0 10
LSSC 0 0 0 0 0 0 0 0 0 0 0 0 0 0 0 0 0 0 0 0 0
SCF 1 0 10 0 0 1 19 3 26 4 268 36 0 0 1 0 18 387 5 5 160
MIAM 45 16 18 17 2 0 279 47 506 155 92 26 0 2 0 0 26 1,231 16 92 248
NFLA 0 0 0 0 0 0 0 0 0 0 0 0 0 0 0 0 0 0 0 0 0
NWFC 1 0 4 0 2 0 5 1 4 2 90 19 0 0 5 0 4 137 2 2 37
PALM 1 1 3 1 0 0 40 1 24 2 44 6 1 0 3 0 23 150 3 17 38
PASC 0 0 2 0 0 0 3 0 7 1 85 12 0 0 0 0 0 110 1 0 43
PENS 0 0 7 1 1 0 15 0 8 0 110 19 0 0 2 3 6 172 2 0 47
POLK 0 1 15 3 0 0 58 7 38 2 304 36 1 0 8 0 24 497 3 10 123
ST.J 0 0 1 0 1 0 9 1 1 1 71 10 1 0 1 0 4 101 2 0 45
ST.P 5 1 47 13 3 1 104 10 70 18 631 106 2 0 11 1 48 1,071 44 30 319
SANF 0 0 7 0 0 0 14 1 10 2 76 10 0 0 4 0 0 124 3 0 27
SEMI 0 0 0 0 0 0 0 0 0 0 0 0 0 0 0 0 0 0 0 0 0
SFLA 0 0 2 1 0 0 4 1 8 2 13 3 1 0 0 0 0 35 0 1 8
TALL 0 0 0 0 0 0 0 0 0 0 0 0 0 0 0 0 0 0 0 0 0
VALE 0 0 0 0 0 0 0 0 0 0 0 0 0 0 0 0 0 0 0 0 0
Total 69 20 153 49 14 3 948 116 865 222 2,636 416 9 2 50 6 235 5,813 109 255 1,708
PERA - 4.5T & 4.10T 11/20/2015 16:15:43
Source: 2014-15 Student Data Base
LEP - Limited English Proficiency
DISAD - Disadvantaged economically or academically
Total unknowns includes both unknown ethnicity and unknown gender.

Fact Book 4.10.3T Florida College System
Credit Program Enrollment Other Bachelors Degree Programs
Headcount by College and Ethnicity/Special Populations 2014-15
Ethnicity and Gender Non-Resident
Alien
Asian
American Indian
Black
Hispanic
White
Pacific
Two_or_More
Special Populations
(F)
(M)
(F)
(M)
(F)
(M)
(F)
(M)
(F)
(M)
(F)
(M)
(F)
(M)
(F)
(M) Total
Unknowns
College
Total
Disabled
LEP
DISAD
EFSC 3 5 15 7 1 4 55 30 51 33 359 257 3 1 15 10 5 854 54 24 546
BROW 24 13 14 31 2 2 371 263 249 225 176 199 1 2 15 7 74 1,668 39 173 1,096
CFLA 0 1 7 2 0 1 86 27 63 29 301 173 2 1 13 6 12 724 32 0 543
CHIP 0 0 0 0 0 0 7 1 0 0 30 21 0 0 0 0 4 63 2 0 37
DAYT 4 2 15 17 4 2 129 79 77 96 587 553 4 0 10 16 17 1,612 63 263 1,043
FSW 2 4 5 5 2 2 33 35 93 60 271 204 0 0 5 1 54 776 12 1 413
FJAX 6 0 54 49 2 3 534 306 47 56 792 736 7 6 22 13 358 2,991 130 92 1,677
FKEY 0 0 0 0 0 0 0 0 0 0 0 0 0 0 0 0 0 0 0 0 0
GULF 0 0 0 0 2 0 6 4 2 3 39 59 0 0 3 2 3 123 6 0 76
HILL 0 0 0 0 0 0 0 0 0 0 0 0 0 0 0 0 0 0 0 0 0
INDR 23 7 27 27 5 4 386 180 306 168 1,101 680 2 2 23 11 102 3,054 100 50 1,840
FGC 0 0 0 0 0 0 0 0 0 0 0 0 0 0 0 0 0 0 0 0 0
LSSC 0 0 0 0 0 0 6 4 2 3 52 42 0 0 1 0 2 112 4 4 45
SCF 0 0 2 4 0 1 25 8 27 18 129 113 0 0 4 0 24 355 24 13 248
MIAM 93 64 8 13 0 2 431 303 1,073 1,006 102 105 0 1 3 2 65 3,271 148 130 1,542
NFLA 0 0 0 0 0 0 0 0 0 0 0 0 0 0 0 0 0 0 0 0 0
NWFC 2 0 6 3 3 1 38 31 29 16 200 173 0 1 15 3 11 532 16 5 231
PALM 13 6 30 26 4 3 337 172 234 170 390 317 0 1 18 7 131 1,859 71 177 916
PASC 0 1 2 1 0 2 4 5 20 16 99 62 0 0 4 2 4 222 9 1 143
PENS 0 0 4 4 2 3 65 30 19 10 213 124 2 2 15 4 15 512 40 2 233
POLK 6 5 23 19 0 3 237 74 106 80 539 368 1 0 12 7 59 1,539 58 22 844
ST.J 0 0 2 2 2 1 11 9 14 6 134 67 0 0 3 2 10 263 9 0 161
ST.P 22 18 52 51 10 11 270 134 242 170 1,583 1,200 4 3 37 9 248 4,064 176 86 2,177
SANF 4 2 24 14 0 1 164 57 68 50 486 279 0 1 13 14 8 1,185 55 0 655
SEMI 13 13 20 21 2 2 115 104 120 183 317 516 1 3 20 25 17 1,492 43 60 894
SFLA 0 1 1 1 0 0 17 3 17 11 49 39 1 1 0 1 2 144 6 2 92
TALL 0 0 0 0 0 0 0 0 0 0 0 0 0 0 0 0 0 0 0 0 0
VALE 1 2 10 11 1 0 15 34 19 48 69 78 1 1 1 5 10 306 8 19 139
Total 216 144 321 308 42 48 3,342 1,893 2,878 2,457 8,018 6,365 29 26 252 147 1,235 27,721 1,105 1,124 15,591
PERA - 4.5T & 4.10T 11/20/2015 16:15:43
Source: 2014-15 Student Data Base
LEP - Limited English Proficiency
DISAD - Disadvantaged economically or academically
Total unknowns includes both unknown ethnicity and unknown gender.

Fact Book 4.10.4T Florida College System
Credit Program Enrollment All Bachelors Degree Programs
Headcount by College and Ethnicity/Special Populations 2014-15
Ethnicity and Gender Non-Resident
Alien
Asian
American Indian
Black
Hispanic
White
Pacific
Two_or_More
Special Populations
(F)
(M)
(F)
(M)
(F)
(M)
(F)
(M)
(F)
(M)
(F)
(M)
(F)
(M)
(F)
(M) Total
Unknowns
College
Total
Disabled
LEP
DISAD
EFSC 3 5 15 7 1 4 55 30 51 33 359 257 3 1 15 10 5 854 54 24 546
BROW 38 16 39 37 4 3 646 296 406 254 363 241 3 3 22 9 98 2,478 49 232 1,468
CFLA 1 2 11 3 0 2 97 29 75 34 373 185 3 1 15 6 13 850 35 0 627
CHIP 0 0 0 0 3 0 22 4 0 0 140 44 0 0 0 0 9 222 6 0 98
DAYT 4 2 18 18 5 2 162 82 113 102 856 598 4 0 15 17 19 2,017 81 341 1,304
FSW 5 4 13 8 4 2 85 48 163 78 621 258 1 0 8 2 98 1,398 18 1 721
FJAX 9 0 60 51 3 3 666 316 59 57 1,025 752 8 6 23 14 401 3,453 147 101 1,931
FKEY 0 0 0 0 0 0 0 0 0 0 0 0 0 0 0 0 0 0 0 0 0
GULF 0 0 1 0 2 0 9 4 3 3 79 65 0 0 6 3 4 179 9 0 112
HILL 0 0 0 0 0 0 0 0 0 0 0 0 0 0 0 0 0 0 0 0 0
INDR 26 7 35 30 11 4 455 196 362 186 1,492 750 5 2 28 12 124 3,725 112 57 2,140
FGC 0 0 1 0 0 0 8 1 3 0 52 4 0 0 0 0 1 70 2 0 21
LSSC 0 0 0 0 0 0 6 4 2 3 52 42 0 0 1 0 2 112 4 4 45
SCF 2 0 14 4 1 2 64 12 63 22 460 150 0 0 5 0 43 842 32 19 475
MIAM 152 82 27 31 2 2 783 365 2,007 1,234 245 144 0 3 4 2 104 5,187 212 234 2,154
NFLA 0 0 0 0 0 0 0 0 0 0 0 0 0 0 0 0 0 0 0 0 0
NWFC 3 0 13 3 5 1 58 33 36 18 376 210 0 1 25 5 20 807 26 7 346
PALM 14 7 33 27 4 3 377 173 258 172 434 323 1 1 21 7 154 2,009 74 194 954
PASC 0 1 4 1 0 2 7 5 27 17 184 74 0 0 4 2 4 332 10 1 186
PENS 0 0 11 5 3 3 80 30 27 10 323 143 2 2 17 7 21 684 42 2 280
POLK 6 6 38 22 0 3 295 81 144 82 843 404 2 0 20 7 83 2,036 61 32 967
ST.J 0 0 3 2 3 1 23 10 23 7 274 80 1 0 5 2 16 450 15 0 277
ST.P 29 19 107 68 15 12 429 153 386 198 2,680 1,405 7 3 55 11 330 5,907 274 125 3,030
SANF 4 2 31 14 2 1 217 59 87 52 608 294 0 1 20 15 8 1,415 64 0 752
SEMI 13 13 20 21 2 2 115 104 120 183 317 516 1 3 20 25 17 1,492 43 60 894
SFLA 0 1 3 2 0 0 21 4 28 14 73 45 2 1 0 1 2 197 7 3 115
TALL 0 0 0 0 0 0 0 0 0 0 0 0 0 0 0 0 0 0 0 0 0
VALE 1 2 10 11 1 0 15 34 19 48 69 78 1 1 1 5 10 306 8 19 139
Total 310 169 507 365 71 52 4,695 2,073 4,462 2,807 12,298 7,062 44 29 330 162 1,586 37,022 1,385 1,456 19,582
PERA - 4.5T & 4.10T 11/20/2015 16:15:43
Source: 2014-15 Student Data Base
LEP - Limited English Proficiency
DISAD - Disadvantaged economically or academically
Total unknowns includes both unknown ethnicity and unknown gender.

Credit Program Completions

Fact Book 5.1F Florida College System
Credit Program Completers Headcount by Award Type 2010-11 through 2014-15
Award Types
AA AS Certificate of Professional Prep Certificates EPI Total 2010-11 52,317 13,880 16 22,977 1,366 90,556
2011-12 62,614 14,953 36 23,135 1,081 101,819
2012-13 57,690 15,464 43 26,773 907 100,877
2013-14 55,132 15,163 48 27,892 696 98,931
2014-15 55,888 14,943 59 32,462 716 104,068
PERA - 5.1F 02/22/2016 11:38:35
Source: 2010-11 through 2014-15 Student Data Base

Fact Book 5.2F Florida College System
Minority Credit Program Completers Headcount by Award Type 2010-11 through 2014-15
Minorities
Black
Hispanic
Asian or Pacific Islander
Asian Amer.
Indian or Alaskan Native
Two_Or_More
Total
2010-11 13,228 18,492 114 2,542 318 512 35,206
2011-12 15,755 22,257 140 2,818 337 854 42,161
2012-13 14,975 23,199 187 2,886 327 1,165 42,739
2013-14 15,191 22,960 189 2,827 316 1,405 42,888
2014-15 16,466 24,529 224 3,116 322 1,870 46,527
PERA - 5.2F 02/22/2016 12:55:12
Source: 2010-11 through 2014-15 Student Data Base

Fact Book 5.3T Florida College System
Credit Program Completers Headcount by College, Award Type, and Gender
2014-15
Associate in Arts Educator Preparation
Institute
Associate on Science
Certificates Certificate of Professional
Prep
Totals
Male Female Unknown Total Male Female Unknown Total Male Female Unknown Total Male Female Unknown Total Male Female Unknown Total Male Female Unknown Total
Eastern Florida 903 1,338 28 2,269 0 0 0 0 201 284 4 489 771 1,060 12 1,843 0 0 0 0 1,875 2,682 44 4,601
Broward 1,717 2,767 261 4,745 8 15 2 25 483 654 66 1,203 2,242 2,408 222 4,872 0 0 0 0 4,450 5,844 551 10,845
Central Florida 307 528 94 929 0 2 0 2 80 192 27 299 426 621 60 1,107 0 0 0 0 813 1,343 181 2,337
Chipola 81 134 6 221 0 0 0 0 20 47 1 68 72 50 3 125 0 0 0 0 173 231 10 414
Daytona 596 1,060 19 1,675 2 4 0 6 257 462 4 723 765 585 10 1,360 0 0 0 0 1,620 2,111 33 3,764
FL SouthWestern 491 901 49 1,441 0 0 0 0 179 305 22 506 151 60 26 237 0 0 0 0 821 1,266 97 2,184
Fla SC at Jax 1,128 1,852 490 3,470 2 10 2 14 334 616 129 1,079 1,102 1,488 273 2,863 0 0 0 0 2,566 3,966 894 7,426
Florida Keys 32 56 12 100 0 0 0 0 18 38 7 63 53 26 7 86 0 0 0 0 103 120 26 249
Gulf Coast 202 379 14 595 6 18 2 26 83 206 4 293 130 118 11 259 0 0 0 0 421 721 31 1,173
Hillsborough 1,130 1,472 375 2,977 26 102 16 144 270 502 76 848 969 462 268 1,699 0 0 0 0 2,395 2,538 735 5,668
Indian River 594 1,047 97 1,738 2 7 3 12 265 334 16 615 681 596 53 1,330 0 0 0 0 1,542 1,984 169 3,695
Florida Gateway 89 202 2 293 7 9 1 17 54 96 3 153 141 175 9 325 0 0 0 0 291 482 15 788
Lake Sumter 188 308 40 536 0 8 2 10 30 80 9 119 23 14 6 43 0 0 0 0 241 410 57 708
State College FL 348 525 298 1,171 0 3 33 36 67 142 47 256 18 24 12 54 0 0 0 0 433 694 390 1,517
Miami Dade 3,478 5,115 238 8,831 9 27 1 37 578 868 41 1,487 782 704 56 1,542 0 0 0 0 4,847 6,714 336 11,897
North Florida 42 109 0 151 0 0 0 0 7 35 0 42 59 93 2 154 0 0 0 0 108 237 2 347
Northwest Fla 394 553 34 981 1 0 0 1 75 139 7 221 119 159 12 290 0 0 0 0 589 851 53 1,493
Palm Beach State 1,265 1,943 181 3,389 6 32 9 47 245 441 53 739 1,140 976 153 2,269 0 0 0 0 2,656 3,392 396 6,444
Pasco-Hernando 483 743 34 1,260 18 45 2 65 109 218 8 335 231 317 18 566 0 0 0 0 841 1,323 62 2,226
Pensacola 385 601 11 997 1 7 1 9 183 441 6 630 179 363 5 547 0 0 0 0 748 1,412 23 2,183
Polk 383 667 66 1,116 12 61 14 87 115 241 42 398 188 133 23 344 0 0 0 0 698 1,102 145 1,945
St. Johns River 221 395 27 643 11 28 5 44 81 156 44 281 178 206 40 424 0 0 0 0 491 785 116 1,392
St. Petersburg 1,008 1,715 151 2,874 9 20 1 30 355 666 51 1,072 616 408 66 1,090 10 24 6 40 1,998 2,833 275 5,106
Santa Fe 1,132 1,321 46 2,499 7 14 0 21 181 366 4 551 364 253 10 627 0 0 0 0 1,684 1,954 60 3,698
Seminole State 849 1,273 39 2,161 7 21 0 28 235 402 5 642 1,468 1,674 33 3,175 13 6 0 19 2,572 3,376 77 6,025
South Florida 117 224 5 346 0 0 0 0 23 65 3 91 135 121 6 262 0 0 0 0 275 410 14 699
Tallahassee 1,049 1,124 80 2,253 0 0 0 0 70 209 15 294 408 199 15 622 0 0 0 0 1,527 1,532 110 3,169
Valencia 2,296 3,358 573 6,227 20 32 3 55 609 731 106 1,446 2,111 1,960 276 4,347 0 0 0 0 5,036 6,081 958 12,075
System Total 20,908 31,710 3,270 55,888 154 465 97 716 5,207 8,936 800 14,943 15,522 15,253 1,687 32,462 23 30 6 59 41,814 56,394 5,860 104,068
PERA - 5.3T 11/20/2015 15:57:30
Source: 2014-15 Student Data Base.
Unknown = Unknown gender and/or race

Fact Book 5.4.1T Florida College System
Credit Program Completers Associate in Arts Degree Program
Headcount by College and Ethnicity/Special Populations 2014-15
Ethnicity and Gender Non-Resident
Alien
Asian
American Indian
Black
Hispanic
White
Pacific
Two_or_More
Special Populations
(F)
(M)
(F)
(M)
(F)
(M)
(F)
(M)
(F)
(M)
(F)
(M)
(F)
(M)
(F)
(M) Total
Unknowns
College
Total
Disabled
LEP
DISAD
EFSC 6 14 42 26 8 10 140 67 137 93 954 647 4 5 47 41 28 2,269 98 68 878
BROW 78 82 102 100 4 2 993 392 937 618 591 483 13 5 49 35 261 4,745 90 405 2,601
CFLA 13 14 12 7 3 0 77 39 90 42 327 199 1 0 5 6 94 929 32 2 540
CHIP 0 0 2 1 1 1 29 7 3 2 98 70 0 0 1 0 6 221 6 0 94
DAYT 2 4 23 29 7 2 120 58 118 62 769 426 0 1 21 14 19 1,675 62 206 934
FSW 22 8 18 11 2 0 110 52 235 129 496 282 3 2 15 7 49 1,441 28 1 636
FJAX 14 9 81 69 12 4 545 231 121 96 1,032 687 9 6 38 26 490 3,470 122 95 1,767
FKEY 0 0 1 0 2 0 1 1 7 5 43 26 0 0 2 0 12 100 7 1 40
GULF 2 2 17 8 1 0 33 8 18 12 296 164 0 0 12 8 14 595 36 0 265
HILL 45 38 48 45 9 8 242 150 427 308 661 550 6 1 34 30 375 2,977 77 86 1,269
INDR 11 9 31 13 1 1 185 84 156 94 645 384 0 0 18 9 97 1,738 36 17 764
FGC 1 0 2 2 2 0 15 5 9 3 172 78 0 0 1 1 2 293 13 0 103
LSSC 3 0 10 16 2 0 27 13 38 15 219 136 1 0 8 8 40 536 18 14 172
SCF 7 8 15 15 0 0 35 23 86 55 376 238 0 0 6 9 298 1,171 58 37 442
MIAM 231 216 46 47 3 0 862 452 3,646 2,462 305 289 2 3 20 9 238 8,831 342 559 3,883
NFLA 1 0 1 0 0 1 21 6 14 2 72 33 0 0 0 0 0 151 3 0 81
NWFC 3 3 24 11 1 0 41 24 51 33 402 303 3 2 28 18 34 981 32 6 241
PALM 32 22 69 56 1 5 516 263 548 312 749 581 1 1 27 25 181 3,389 140 321 1,439
PASC 4 3 14 12 3 4 31 17 124 81 548 351 1 2 18 13 34 1,260 33 0 611
PENS 2 1 16 13 3 4 72 32 33 25 441 285 3 2 31 23 11 997 48 2 305
POLK 3 5 14 18 0 2 111 45 102 70 416 234 2 0 19 9 66 1,116 31 11 491
ST.J 2 1 9 5 1 1 24 17 29 12 315 179 4 0 11 6 27 643 34 0 291
ST.P 13 14 69 57 7 4 194 84 177 95 1,222 734 5 3 28 17 151 2,874 160 62 1,330
SANF 22 45 37 40 4 1 158 80 210 191 848 747 0 1 42 27 46 2,499 102 0 962
SEMI 24 20 57 32 7 1 180 92 302 173 681 506 1 1 21 24 39 2,161 97 105 1,063
SFLA 1 1 1 2 0 0 19 6 75 30 125 73 0 1 3 4 5 346 9 2 169
TALL 15 13 8 17 1 3 364 228 123 141 577 616 2 1 34 30 80 2,253 139 12 1,093
VALE 66 50 179 157 8 9 541 301 1,198 733 1,281 973 19 6 66 67 573 6,227 141 318 2,614
Total 623 582 948 809 93 63 5,686 2,777 9,014 5,894 14,661 10,274 80 43 605 466 3,270 55,888 1,994 2,330 25,078
PERA - 5.4T & 5.5T 11/20/2015 15:57:50
Source: 2014-15 Student Data Base
LEP - Limited English Proficiency
DISAD - Disadvantaged economically or academically
Total unknowns includes both unknown ethnicity and unknown gender.

Fact Book 5.4.2T Florida College System
Institutional Credit Program Completers Educator Preparation Institute Certificate Program
Headcount by College and Ethnicity/Special Populations 2014-15
Ethnicity and Gender Non-Resident
Alien
Asian
American Indian
Black
Hispanic
White
Pacific
Two_or_More
Special Populations
(F)
(M)
(F)
(M)
(F)
(M)
(F)
(M)
(F)
(M)
(F)
(M)
(F)
(M)
(F)
(M) Total
Unknowns
College
Total
Disabled
LEP
DISAD
EFSC 0 0 0 0 0 0 0 0 0 0 0 0 0 0 0 0 0 0 0 0 0
BROW 1 0 0 0 0 0 6 2 3 2 5 4 0 0 0 0 2 25 0 0 1
CFLA 0 0 0 0 0 0 0 0 0 0 2 0 0 0 0 0 0 2 0 0 0
CHIP 0 0 0 0 0 0 0 0 0 0 0 0 0 0 0 0 0 0 0 0 0
DAYT 0 0 0 1 0 0 0 0 0 0 4 1 0 0 0 0 0 6 1 0 0
FSW 0 0 0 0 0 0 0 0 0 0 0 0 0 0 0 0 0 0 0 0 0
FJAX 0 0 0 0 0 0 0 0 1 0 9 2 0 0 0 0 2 14 0 0 0
FKEY 0 0 0 0 0 0 0 0 0 0 0 0 0 0 0 0 0 0 0 0 0
GULF 0 0 0 0 1 0 3 0 0 0 14 6 0 0 0 0 2 26 0 0 5
HILL 0 0 3 0 0 0 12 4 14 3 70 19 2 0 1 0 16 144 1 2 17
INDR 0 0 0 0 0 0 0 0 0 0 7 2 0 0 0 0 3 12 0 0 0
FGC 0 0 0 0 0 0 0 0 0 0 9 7 0 0 0 0 1 17 0 0 4
LSSC 0 0 0 0 0 0 1 0 1 0 6 0 0 0 0 0 2 10 0 1 0
SCF 0 0 0 0 0 0 0 0 0 0 3 0 0 0 0 0 33 36 0 0 2
MIAM 2 0 1 0 0 0 2 0 16 6 6 3 0 0 0 0 1 37 1 3 0
NFLA 0 0 0 0 0 0 0 0 0 0 0 0 0 0 0 0 0 0 0 0 0
NWFC 0 0 0 0 0 0 0 0 0 0 0 1 0 0 0 0 0 1 0 0 0
PALM 1 0 1 1 0 0 1 0 7 0 22 5 0 0 0 0 9 47 0 2 0
PASC 0 0 1 2 1 0 0 2 5 1 37 13 0 0 1 0 2 65 1 0 5
PENS 0 0 0 0 0 0 2 0 0 0 5 1 0 0 0 0 1 9 1 0 0
POLK 0 1 0 0 0 0 6 3 8 0 46 8 0 0 1 0 14 87 3 0 6
ST.J 0 0 0 0 0 0 2 0 0 0 26 11 0 0 0 0 5 44 0 0 5
ST.P 0 0 0 0 0 0 1 0 0 1 19 8 0 0 0 0 1 30 1 0 10
SANF 0 0 0 0 0 0 0 1 2 0 12 6 0 0 0 0 0 21 0 0 1
SEMI 0 0 1 0 0 0 1 0 0 3 17 4 0 0 2 0 0 28 1 0 2
SFLA 0 0 0 0 0 0 0 0 0 0 0 0 0 0 0 0 0 0 0 0 0
TALL 0 0 0 0 0 0 0 0 0 0 0 0 0 0 0 0 0 0 0 0 0
VALE 0 1 0 0 0 0 1 5 7 1 24 13 0 0 0 0 3 55 0 1 5
Total 4 2 7 4 2 0 38 17 64 17 343 114 2 0 5 0 97 716 10 9 63
PERA - 5.4T & 5.5T 11/20/2015 15:57:50
Source: 2014-15 Student Data Base
LEP - Limited English Proficiency
DISAD - Disadvantaged economically or academically
Total unknowns includes both unknown ethnicity and unknown gender.

Fact Book 5.4.3T Florida College System
Institutional Credit Program Completers Certificate of Professional Prep
Headcount by College and Ethnicity/Special Populations 2014-15
Ethnicity and Gender Non-Resident
Alien
Asian
American Indian
Black
Hispanic
White
Pacific
Two_or_More
Special Populations
(F)
(M)
(F)
(M)
(F)
(M)
(F)
(M)
(F)
(M)
(F)
(M)
(F)
(M)
(F)
(M) Total
Unknowns
College
Total
Disabled
LEP
DISAD
EFSC 0 0 0 0 0 0 0 0 0 0 0 0 0 0 0 0 0 0 0 0 0
BROW 0 0 0 0 0 0 0 0 0 0 0 0 0 0 0 0 0 0 0 0 0
CFLA 0 0 0 0 0 0 0 0 0 0 0 0 0 0 0 0 0 0 0 0 0
CHIP 0 0 0 0 0 0 0 0 0 0 0 0 0 0 0 0 0 0 0 0 0
DAYT 0 0 0 0 0 0 0 0 0 0 0 0 0 0 0 0 0 0 0 0 0
FSW 0 0 0 0 0 0 0 0 0 0 0 0 0 0 0 0 0 0 0 0 0
FJAX 0 0 0 0 0 0 0 0 0 0 0 0 0 0 0 0 0 0 0 0 0
FKEY 0 0 0 0 0 0 0 0 0 0 0 0 0 0 0 0 0 0 0 0 0
GULF 0 0 0 0 0 0 0 0 0 0 0 0 0 0 0 0 0 0 0 0 0
HILL 0 0 0 0 0 0 0 0 0 0 0 0 0 0 0 0 0 0 0 0 0
INDR 0 0 0 0 0 0 0 0 0 0 0 0 0 0 0 0 0 0 0 0 0
FGC 0 0 0 0 0 0 0 0 0 0 0 0 0 0 0 0 0 0 0 0 0
LSSC 0 0 0 0 0 0 0 0 0 0 0 0 0 0 0 0 0 0 0 0 0
SCF 0 0 0 0 0 0 0 0 0 0 0 0 0 0 0 0 0 0 0 0 0
MIAM 0 0 0 0 0 0 0 0 0 0 0 0 0 0 0 0 0 0 0 0 0
NFLA 0 0 0 0 0 0 0 0 0 0 0 0 0 0 0 0 0 0 0 0 0
NWFC 0 0 0 0 0 0 0 0 0 0 0 0 0 0 0 0 0 0 0 0 0
PALM 0 0 0 0 0 0 0 0 0 0 0 0 0 0 0 0 0 0 0 0 0
PASC 0 0 0 0 0 0 0 0 0 0 0 0 0 0 0 0 0 0 0 0 0
PENS 0 0 0 0 0 0 0 0 0 0 0 0 0 0 0 0 0 0 0 0 0
POLK 0 0 0 0 0 0 0 0 0 0 0 0 0 0 0 0 0 0 0 0 0
ST.J 0 0 0 0 0 0 0 0 0 0 0 0 0 0 0 0 0 0 0 0 0
ST.P 0 0 1 0 0 1 3 2 4 3 16 4 0 0 0 0 6 40 2 1 8
SANF 0 0 0 0 0 0 0 0 0 0 0 0 0 0 0 0 0 0 0 0 0
SEMI 1 0 0 0 0 0 0 1 0 4 5 8 0 0 0 0 0 19 2 2 3
SFLA 0 0 0 0 0 0 0 0 0 0 0 0 0 0 0 0 0 0 0 0 0
TALL 0 0 0 0 0 0 0 0 0 0 0 0 0 0 0 0 0 0 0 0 0
VALE 0 0 0 0 0 0 0 0 0 0 0 0 0 0 0 0 0 0 0 0 0
Total 1 0 1 0 0 1 3 3 4 7 21 12 0 0 0 0 6 59 4 3 11
PERA - 5.4T & 5.5T 11/20/2015 15:57:50
Source: 2014-15 Student Data Base
LEP - Limited English Proficiency
DISAD - Disadvantaged economically or academically
Total unknowns includes both unknown ethnicity and unknown gender.

Fact Book 5.4.4T Florida College System
Credit Program Completers Workforce Education: Associate in Science Degree Program
Headcount by College and Ethnicity/Special Populations 2014-15
Ethnicity and Gender Non-Resident
Alien
Asian
American Indian
Black
Hispanic
White
Pacific
Two_or_More
Special Populations
(F)
(M)
(F)
(M)
(F)
(M)
(F)
(M)
(F)
(M)
(F)
(M)
(F)
(M)
(F)
(M) Total
Unknowns
College
Total
Disabled
LEP
DISAD
EFSC 1 2 5 5 0 5 19 14 23 19 230 148 0 0 6 8 4 489 35 14 271
BROW 20 15 53 51 2 2 189 95 173 138 208 174 1 2 8 6 66 1,203 26 181 619
CFLA 0 0 3 3 1 0 18 8 17 9 151 59 0 0 2 1 27 299 16 0 191
CHIP 0 0 0 0 0 0 4 7 4 0 38 13 0 0 1 0 1 68 1 0 36
DAYT 3 2 10 7 1 0 39 26 46 19 354 202 2 0 7 1 4 723 25 100 447
FSW 7 2 4 6 0 2 30 17 59 42 203 107 0 1 2 2 22 506 8 0 270
FJAX 5 3 33 18 1 2 143 68 36 23 392 214 0 2 6 4 129 1,079 56 34 548
FKEY 0 0 1 1 0 0 0 2 8 3 29 12 0 0 0 0 7 63 7 2 27
GULF 0 0 5 3 0 0 14 9 9 4 169 62 0 0 9 5 4 293 30 0 193
HILL 11 6 22 5 4 1 86 32 105 61 263 162 2 0 9 3 76 848 23 36 383
INDR 3 2 6 5 1 2 61 36 41 39 218 175 0 2 4 4 16 615 17 10 293
FGC 0 0 1 0 0 0 9 2 5 2 81 50 0 0 0 0 3 153 7 0 64
LSSC 0 0 2 1 1 0 3 1 8 3 63 25 0 0 3 0 9 119 3 4 43
SCF 0 0 6 5 0 0 4 3 16 7 115 51 0 0 1 1 47 256 9 17 133
MIAM 55 35 11 11 2 0 194 95 510 366 90 67 2 1 4 3 41 1,487 68 132 538
NFLA 0 0 0 0 0 0 4 0 2 0 29 7 0 0 0 0 0 42 2 0 21
NWFC 1 1 3 2 0 2 18 13 7 4 104 48 0 1 6 4 7 221 11 3 91
PALM 10 2 17 3 1 1 89 47 102 57 218 132 0 0 4 3 53 739 31 61 284
PASC 0 0 3 1 0 0 9 4 27 7 168 95 0 0 11 2 8 335 8 0 220
PENS 0 1 10 7 3 1 51 25 21 10 330 133 4 0 22 6 6 630 38 3 251
POLK 1 0 8 7 2 0 34 16 39 17 154 73 0 0 3 2 42 398 6 8 212
ST.J 0 0 5 2 0 1 11 2 7 10 125 65 1 1 7 0 44 281 13 2 168
ST.P 5 3 26 10 1 1 64 32 49 30 514 275 1 0 6 4 51 1,072 77 33 571
SANF 1 2 7 5 2 0 32 17 35 20 279 132 1 0 9 5 4 551 35 0 315
SEMI 7 1 21 7 2 1 55 22 86 41 225 158 1 1 5 4 5 642 36 34 311
SFLA 0 1 1 1 0 1 6 2 18 5 38 13 0 0 2 0 3 91 1 2 45
TALL 0 0 3 0 1 0 63 22 16 4 122 43 0 0 4 1 15 294 30 4 193
VALE 15 15 33 29 2 5 120 97 249 162 306 286 1 5 5 10 106 1,446 40 135 661
Total 145 93 299 195 27 27 1,369 714 1,718 1,102 5,216 2,981 16 16 146 79 800 14,943 659 815 7,399
PERA - 5.4T & 5.5T 11/20/2015 15:57:50
Source: 2014-15 Student Data Base
LEP - Limited English Proficiency
DISAD - Disadvantaged economically or academically
Total unknowns includes both unknown ethnicity and unknown gender.

Fact Book 5.4.5T Florida College System
Credit Program Completers Workforce Education: Postsecondary Adult Vocational Certificate Program
Headcount by College and Ethnicity/Special Populations 2014-15
Ethnicity and Gender Non-Resident
Alien
Asian
American Indian
Black
Hispanic
White
Pacific
Two_or_More
Special Populations
(F)
(M)
(F)
(M)
(F)
(M)
(F)
(M)
(F)
(M)
(F)
(M)
(F)
(M)
(F)
(M) Total
Unknowns
College
Total
Disabled
LEP
DISAD
EFSC 1 1 10 3 2 2 43 14 39 19 223 146 0 2 14 6 6 531 23 14 116
BROW 0 12 0 8 0 0 17 60 16 96 16 70 1 1 2 2 13 314 5 27 115
CFLA 0 0 1 1 0 1 4 18 5 7 20 60 0 0 1 2 2 122 1 0 62
CHIP 0 0 0 0 1 0 14 4 0 2 24 52 0 0 2 3 1 103 1 0 17
DAYT 0 0 5 8 0 0 43 43 49 36 194 241 3 2 2 5 6 637 15 95 267
FSW 0 1 0 0 0 0 0 0 1 9 2 20 0 0 0 2 4 39 0 0 5
FJAX 3 3 12 14 6 0 192 178 88 62 364 370 2 2 4 7 115 1,422 44 27 263
FKEY 0 0 0 0 0 1 1 4 2 8 6 16 0 0 0 0 6 44 0 0 11
GULF 0 0 1 0 0 0 16 6 4 3 38 69 0 0 2 2 9 150 3 0 60
HILL 1 1 2 10 1 1 52 70 24 85 78 287 0 0 1 3 139 755 6 2 91
INDR 2 2 3 5 0 0 30 44 41 63 163 230 0 0 2 3 20 608 12 13 137
FGC 0 0 1 0 0 0 33 12 6 6 79 80 0 0 3 0 6 226 8 0 88
LSSC 0 0 0 0 0 0 0 0 0 0 0 0 0 0 0 0 0 0 0 0 0
SCF 0 0 0 0 0 0 0 0 0 0 0 0 0 0 0 0 0 0 0 0 0
MIAM 10 6 3 1 0 0 77 64 126 235 17 52 0 0 0 0 31 622 21 48 88
NFLA 1 0 1 0 0 0 24 5 1 1 40 17 0 0 0 0 1 91 3 0 51
NWFC 0 0 0 1 0 1 3 5 2 3 28 46 0 0 0 4 3 96 1 0 22
PALM 6 3 24 13 0 1 219 151 185 163 238 347 2 0 16 7 97 1,472 37 74 244
PASC 2 0 12 3 0 0 13 3 30 15 166 68 0 1 3 2 11 329 5 1 111
PENS 0 0 11 0 0 3 66 22 17 2 131 38 0 0 9 3 0 302 11 7 92
POLK 0 0 0 2 0 0 5 12 8 23 12 77 0 0 0 1 1 141 1 0 19
ST.J 0 0 1 0 0 0 0 6 2 7 10 55 0 0 1 4 22 108 0 1 41
ST.P 0 0 0 2 0 0 5 12 6 18 36 162 0 1 1 2 11 256 5 3 39
SANF 0 0 3 3 0 0 17 21 10 14 60 97 0 0 4 3 6 238 17 0 81
SEMI 3 1 2 3 1 0 31 32 22 37 72 137 0 0 4 9 4 358 8 14 127
SFLA 1 1 0 1 0 0 16 13 37 31 43 64 0 1 1 0 4 213 8 0 86
TALL 0 1 1 2 0 0 42 57 9 19 74 189 1 0 4 5 7 411 9 1 36
VALE 0 0 1 9 0 0 21 51 13 80 15 144 0 1 3 7 8 353 3 6 23
Total 30 32 94 89 11 10 984 907 743 1,044 2,149 3,134 9 11 79 82 533 9,941 247 333 2,292
PERA - 5.4T & 5.5T 11/20/2015 15:57:50
Source: 2014-15 Student Data Base
LEP - Limited English Proficiency
DISAD - Disadvantaged economically or academically
Total unknowns includes both unknown ethnicity and unknown gender.

Fact Book 5.4.6T Florida College System
Credit Program Completers Workforce Education: Postsecondary Vocational Certificate Program
Headcount by College and Ethnicity/Special Populations 2014-15
Ethnicity and Gender Non-Resident
Alien
Asian
American Indian
Black
Hispanic
White
Pacific
Two_or_More
Special Populations
(F)
(M)
(F)
(M)
(F)
(M)
(F)
(M)
(F)
(M)
(F)
(M)
(F)
(M)
(F)
(M) Total
Unknowns
College
Total
Disabled
LEP
DISAD
EFSC 10 6 4 8 7 8 83 49 48 52 565 439 0 3 11 13 6 1,312 136 34 361
BROW 90 89 102 78 9 1 807 486 848 743 466 567 7 1 24 28 207 4,553 69 489 2,669
CFLA 0 0 9 7 1 0 70 36 89 36 381 239 0 0 9 11 57 945 45 0 669
CHIP 0 0 0 0 0 0 1 0 0 0 8 11 0 0 0 0 2 22 0 0 3
DAYT 0 5 6 7 2 1 34 35 23 67 218 309 1 0 4 3 4 719 37 98 404
FSW 1 2 0 3 1 2 5 4 12 17 38 87 0 0 0 4 22 198 5 0 60
FJAX 2 0 28 22 6 0 256 121 37 39 474 272 3 3 11 9 158 1,441 53 37 866
FKEY 0 0 0 0 0 0 0 1 0 2 17 21 0 0 0 0 1 42 0 0 23
GULF 0 0 3 2 0 0 8 5 5 3 36 40 0 0 0 0 2 104 7 0 62
HILL 8 6 10 9 7 1 36 62 61 112 161 313 2 0 10 6 128 932 26 26 315
INDR 4 5 2 2 0 3 86 38 37 49 214 228 0 5 12 4 33 722 22 10 379
FGC 0 0 0 1 0 0 3 4 5 0 44 38 0 0 1 0 3 99 10 0 41
LSSC 0 0 0 1 0 0 2 3 0 0 12 19 0 0 0 0 6 43 1 0 13
SCF 0 0 0 1 0 0 2 2 1 0 15 13 0 0 1 0 10 45 2 3 22
MIAM 43 44 6 4 0 0 105 63 272 266 43 45 0 0 1 2 25 919 60 108 240
NFLA 1 0 0 0 0 1 2 4 1 1 22 30 0 0 0 0 1 63 2 0 21
NWFC 0 0 2 0 0 0 16 5 7 1 93 48 0 0 8 5 9 194 8 1 82
PALM 9 2 11 9 0 0 58 80 74 96 119 248 0 2 5 7 54 774 36 57 218
PASC 0 0 0 2 0 0 5 5 4 19 81 105 0 1 1 7 7 237 6 0 115
PENS 0 0 1 1 0 1 20 12 4 8 90 86 1 0 9 2 5 240 16 0 79
POLK 0 0 7 1 0 1 32 13 10 8 59 48 0 1 0 0 22 202 1 3 41
ST.J 0 0 4 5 0 2 20 10 8 8 152 79 0 0 8 2 18 316 20 0 225
ST.P 7 0 7 13 2 6 48 28 27 31 258 331 1 0 1 6 54 820 51 24 366
SANF 0 4 9 9 0 0 23 20 10 23 99 149 0 0 6 9 4 365 26 0 174
SEMI 33 33 51 29 9 1 280 136 312 259 810 740 6 7 38 44 29 2,817 123 139 1,555
SFLA 0 0 0 0 0 0 2 2 6 7 15 15 0 0 0 0 2 49 3 0 18
TALL 0 0 3 1 0 0 19 35 3 5 39 93 0 0 2 1 8 209 22 0 88
VALE 70 57 101 85 11 5 336 319 609 521 708 774 0 3 35 46 268 3,948 99 354 2,085
Total 278 253 366 300 55 33 2,359 1,578 2,513 2,373 5,237 5,387 21 26 197 209 1,145 22,330 886 1,383 11,194
PERA - 5.4T & 5.5T 11/20/2015 15:57:50
Source: 2014-15 Student Data Base
LEP - Limited English Proficiency
DISAD - Disadvantaged economically or academically
Total unknowns includes both unknown ethnicity and unknown gender.

Fact Book 5.4.7T Florida College System
Credit Program Completers Workforce Education: Advanced Technical Certificate Program
Headcount by College and Ethnicity/Special Populations 2014-15
Ethnicity and Gender Non-Resident
Alien
Asian
American Indian
Black
Hispanic
White
Pacific
Two_or_More
Special Populations
(F)
(M)
(F)
(M)
(F)
(M)
(F)
(M)
(F)
(M)
(F)
(M)
(F)
(M)
(F)
(M) Total
Unknowns
College
Total
Disabled
LEP
DISAD
EFSC 0 0 0 0 0 0 0 0 0 0 0 0 0 0 0 0 0 0 0 0 0
BROW 1 0 0 0 0 0 1 0 0 0 1 0 0 0 0 0 2 5 0 0 2
CFLA 0 0 0 0 0 0 5 1 6 2 20 5 0 0 0 0 1 40 1 0 32
CHIP 0 0 0 0 0 0 0 0 0 0 0 0 0 0 0 0 0 0 0 0 0
DAYT 0 0 0 0 0 0 0 0 0 1 1 2 0 0 0 0 0 4 0 0 0
FSW 0 0 0 0 0 0 0 0 0 0 0 0 0 0 0 0 0 0 0 0 0
FJAX 0 0 0 0 0 0 0 0 0 0 0 0 0 0 0 0 0 0 0 0 0
FKEY 0 0 0 0 0 0 0 0 0 0 0 0 0 0 0 0 0 0 0 0 0
GULF 0 0 0 0 0 0 0 0 0 0 5 0 0 0 0 0 0 5 1 0 4
HILL 1 0 2 0 0 0 1 0 2 0 2 3 0 0 0 0 1 12 2 2 2
INDR 0 0 0 0 0 0 0 0 0 0 0 0 0 0 0 0 0 0 0 0 0
FGC 0 0 0 0 0 0 0 0 0 0 0 0 0 0 0 0 0 0 0 0 0
LSSC 0 0 0 0 0 0 0 0 0 0 0 0 0 0 0 0 0 0 0 0 0
SCF 0 0 0 0 0 0 0 0 1 0 4 2 0 0 0 0 2 9 0 1 3
MIAM 0 0 0 0 0 0 0 0 1 0 0 0 0 0 0 0 0 1 0 1 0
NFLA 0 0 0 0 0 0 0 0 0 0 0 0 0 0 0 0 0 0 0 0 0
NWFC 0 0 0 0 0 0 0 0 0 0 0 0 0 0 0 0 0 0 0 0 0
PALM 0 0 0 0 0 0 0 4 4 5 6 2 0 0 0 0 2 23 1 2 6
PASC 0 0 0 0 0 0 0 0 0 0 0 0 0 0 0 0 0 0 0 0 0
PENS 0 0 0 0 0 0 1 0 0 0 3 1 0 0 0 0 0 5 0 0 0
POLK 0 0 0 0 0 0 0 0 0 0 0 1 0 0 0 0 0 1 0 0 0
ST.J 0 0 0 0 0 0 0 0 0 0 0 0 0 0 0 0 0 0 0 0 0
ST.P 0 0 0 0 0 0 2 0 1 1 6 3 0 0 0 0 1 14 0 1 1
SANF 0 0 0 1 0 0 4 2 0 0 8 8 0 0 0 1 0 24 2 0 3
SEMI 0 0 0 0 0 0 0 0 0 0 0 0 0 0 0 0 0 0 0 0 0
SFLA 0 0 0 0 0 0 0 0 0 0 0 0 0 0 0 0 0 0 0 0 0
TALL 0 0 0 0 0 0 1 0 0 0 1 0 0 0 0 0 0 2 0 0 2
VALE 0 0 1 0 0 0 6 3 11 1 18 5 0 0 1 0 0 46 1 4 11
System 2 0 3 1 0 0 21 10 26 10 75 32 0 0 1 1 9 191 8 11 66
PERA - 5.4T & 5.5T 11/20/2015 15:57:50
Source: 2014-15 Student Data Base
LEP - Limited English Proficiency
DISAD - Disadvantaged economically or academically
Total unknowns includes both unknown ethnicity and unknown gender.

Fact Book 5.4.8T Florida College System
Credit Program Completers All Programs Areas
Headcount by College and Ethnicity/Special Populations 2014-15
Ethnicity and Gender Non-Resident
Alien
Asian
American Indian
Black
Hispanic
White
Pacific
Two_or_More
Special Populations
(F)
(M)
(F)
(M)
(F)
(M)
(F)
(M)
(F)
(M)
(F)
(M)
(F)
(M)
(F)
(M) Total
Unknowns
College
Total
Disabled
LEP
DISAD
EFSC 18 23 61 42 17 25 285 144 247 183 1,972 1,380 4 10 78 68 44 4,601 292 130 1,626
BROW 190 198 257 237 15 5 2,013 1,035 1,977 1,597 1,287 1,298 22 9 83 71 551 10,845 190 1,102 6,007
CFLA 13 14 25 18 5 1 174 102 207 96 901 562 1 0 17 20 181 2,337 95 2 1,494
CHIP 0 0 2 1 2 1 48 18 7 4 168 146 0 0 4 3 10 414 8 0 150
DAYT 5 11 44 52 10 3 236 162 236 185 1,540 1,181 6 3 34 23 33 3,764 140 499 2,052
FSW 30 13 22 20 3 4 145 73 307 197 739 496 3 3 17 15 97 2,184 41 1 971
FJAX 24 15 154 123 25 6 1,136 598 283 220 2,271 1,545 14 13 59 46 894 7,426 275 193 3,444
FKEY 0 0 2 1 2 1 2 8 17 18 95 75 0 0 2 0 26 249 14 3 101
GULF 2 2 26 13 2 0 74 28 36 22 558 341 0 0 23 15 31 1,173 77 0 589
HILL 66 51 87 69 21 11 429 318 633 569 1,235 1,334 12 1 55 42 735 5,668 135 154 2,077
INDR 20 18 42 25 2 6 362 202 275 245 1,247 1,019 0 7 36 20 169 3,695 87 50 1,573
FGC 1 0 4 3 2 0 60 23 25 11 385 253 0 0 5 1 15 788 38 0 300
LSSC 3 0 12 18 3 0 33 17 47 18 300 180 1 0 11 8 57 708 22 19 228
SCF 7 8 21 21 0 0 41 28 104 62 513 304 0 0 8 10 390 1,517 69 58 602
MIAM 341 301 67 63 5 0 1,240 674 4,571 3,335 461 456 4 4 25 14 336 11,897 492 851 4,749
NFLA 3 0 2 0 0 2 51 15 18 4 163 87 0 0 0 0 2 347 10 0 174
NWFC 4 4 29 14 1 3 78 47 67 41 627 446 3 3 42 31 53 1,493 52 10 436
PALM 58 29 122 82 2 7 883 545 920 633 1,352 1,315 3 3 52 42 396 6,444 245 517 2,191
PASC 6 3 30 20 4 4 58 31 190 123 1,000 632 1 4 34 24 62 2,226 53 1 1,062
PENS 2 2 38 21 6 9 212 91 75 45 1,000 544 8 2 71 34 23 2,183 114 12 727
POLK 4 6 29 28 2 3 188 89 167 118 687 441 2 1 23 12 145 1,945 42 22 769
ST.J 2 1 19 12 1 4 57 35 46 37 628 389 5 1 27 12 116 1,392 67 3 730
ST.P 25 17 103 82 10 12 317 158 264 179 2,071 1,517 7 4 36 29 275 5,106 296 124 2,325
SANF 23 51 56 58 6 1 234 141 267 248 1,306 1,139 1 1 61 45 60 3,698 182 0 1,536
SEMI 68 55 132 71 19 3 547 283 722 517 1,810 1,553 8 9 70 81 77 6,025 267 294 3,061
SFLA 2 3 2 4 0 1 43 23 136 73 221 165 0 2 6 4 14 699 21 4 318
TALL 15 14 15 20 2 3 489 342 151 169 813 941 3 1 44 37 110 3,169 200 17 1,412
VALE 151 123 315 280 21 19 1,025 776 2,087 1,498 2,352 2,195 20 15 110 130 958 12,075 284 818 5,399
Total 1,083 962 1,718 1,398 188 134 10,460 6,006 14,082 10,447 27,702 21,934 128 96 1,033 837 5,860 104,068 3,808 4,884 46,103
PERA - 5.4T & 5.5T 11/20/2015 15:57:50
Source: 2014-15 Student Data Base
LEP - Limited English Proficiency
DISAD - Disadvantaged economically or academically
Total unknowns includes both unknown ethnicity and unknown gender.
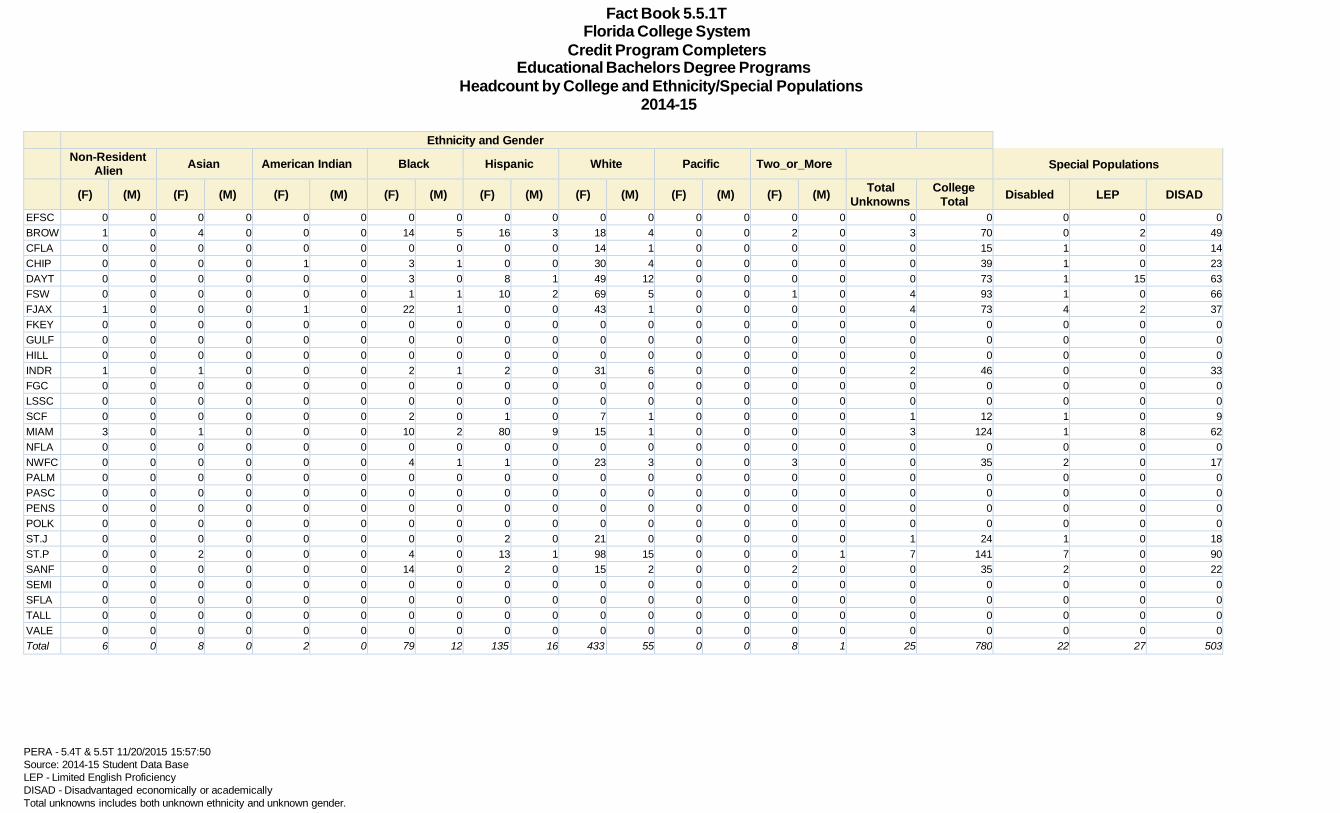
Fact Book 5.5.1T Florida College System
Credit Program Completers Educational Bachelors Degree Programs
Headcount by College and Ethnicity/Special Populations 2014-15
Ethnicity and Gender Non-Resident
Alien
Asian
American Indian
Black
Hispanic
White
Pacific
Two_or_More
Special Populations
(F)
(M)
(F)
(M)
(F)
(M)
(F)
(M)
(F)
(M)
(F)
(M)
(F)
(M)
(F)
(M) Total
Unknowns
College
Total
Disabled
LEP
DISAD
EFSC 0 0 0 0 0 0 0 0 0 0 0 0 0 0 0 0 0 0 0 0 0
BROW 1 0 4 0 0 0 14 5 16 3 18 4 0 0 2 0 3 70 0 2 49
CFLA 0 0 0 0 0 0 0 0 0 0 14 1 0 0 0 0 0 15 1 0 14
CHIP 0 0 0 0 1 0 3 1 0 0 30 4 0 0 0 0 0 39 1 0 23
DAYT 0 0 0 0 0 0 3 0 8 1 49 12 0 0 0 0 0 73 1 15 63
FSW 0 0 0 0 0 0 1 1 10 2 69 5 0 0 1 0 4 93 1 0 66
FJAX 1 0 0 0 1 0 22 1 0 0 43 1 0 0 0 0 4 73 4 2 37
FKEY 0 0 0 0 0 0 0 0 0 0 0 0 0 0 0 0 0 0 0 0 0
GULF 0 0 0 0 0 0 0 0 0 0 0 0 0 0 0 0 0 0 0 0 0
HILL 0 0 0 0 0 0 0 0 0 0 0 0 0 0 0 0 0 0 0 0 0
INDR 1 0 1 0 0 0 2 1 2 0 31 6 0 0 0 0 2 46 0 0 33
FGC 0 0 0 0 0 0 0 0 0 0 0 0 0 0 0 0 0 0 0 0 0
LSSC 0 0 0 0 0 0 0 0 0 0 0 0 0 0 0 0 0 0 0 0 0
SCF 0 0 0 0 0 0 2 0 1 0 7 1 0 0 0 0 1 12 1 0 9
MIAM 3 0 1 0 0 0 10 2 80 9 15 1 0 0 0 0 3 124 1 8 62
NFLA 0 0 0 0 0 0 0 0 0 0 0 0 0 0 0 0 0 0 0 0 0
NWFC 0 0 0 0 0 0 4 1 1 0 23 3 0 0 3 0 0 35 2 0 17
PALM 0 0 0 0 0 0 0 0 0 0 0 0 0 0 0 0 0 0 0 0 0
PASC 0 0 0 0 0 0 0 0 0 0 0 0 0 0 0 0 0 0 0 0 0
PENS 0 0 0 0 0 0 0 0 0 0 0 0 0 0 0 0 0 0 0 0 0
POLK 0 0 0 0 0 0 0 0 0 0 0 0 0 0 0 0 0 0 0 0 0
ST.J 0 0 0 0 0 0 0 0 2 0 21 0 0 0 0 0 1 24 1 0 18
ST.P 0 0 2 0 0 0 4 0 13 1 98 15 0 0 0 1 7 141 7 0 90
SANF 0 0 0 0 0 0 14 0 2 0 15 2 0 0 2 0 0 35 2 0 22
SEMI 0 0 0 0 0 0 0 0 0 0 0 0 0 0 0 0 0 0 0 0 0
SFLA 0 0 0 0 0 0 0 0 0 0 0 0 0 0 0 0 0 0 0 0 0
TALL 0 0 0 0 0 0 0 0 0 0 0 0 0 0 0 0 0 0 0 0 0
VALE 0 0 0 0 0 0 0 0 0 0 0 0 0 0 0 0 0 0 0 0 0
Total 6 0 8 0 2 0 79 12 135 16 433 55 0 0 8 1 25 780 22 27 503
PERA - 5.4T & 5.5T 11/20/2015 15:57:50
Source: 2014-15 Student Data Base
LEP - Limited English Proficiency
DISAD - Disadvantaged economically or academically
Total unknowns includes both unknown ethnicity and unknown gender.

Fact Book 5.5.2T Florida College System
Credit Program Completers Nursing Bachelors Degree Programs
Headcount by College and Ethnicity/Special Populations 2014-15
Ethnicity and Gender Non-Resident
Alien
Asian
American Indian
Black
Hispanic
White
Pacific
Two_or_More
Special Populations
(F)
(M)
(F)
(M)
(F)
(M)
(F)
(M)
(F)
(M)
(F)
(M)
(F)
(M)
(F)
(M) Total
Unknowns
College
Total
Disabled
LEP
DISAD
EFSC 0 0 0 0 0 0 0 0 0 0 0 0 0 0 0 0 0 0 0 0 0
BROW 5 0 5 2 0 0 39 2 17 0 23 4 0 0 0 0 2 99 1 8 27
CFLA 0 0 0 0 0 0 0 0 0 0 0 0 0 0 0 0 0 0 0 0 0
CHIP 0 0 0 0 0 0 3 0 0 0 20 5 0 0 0 0 0 28 0 0 3
DAYT 0 0 0 0 0 0 7 0 5 1 23 3 0 0 1 0 0 40 0 10 16
FSW 0 0 2 1 0 0 9 3 13 2 48 9 0 0 0 0 6 93 0 0 35
FJAX 1 0 2 0 0 0 21 1 1 0 17 0 0 0 0 1 4 48 0 2 26
FKEY 0 0 0 0 0 0 0 0 0 0 0 0 0 0 0 0 0 0 0 0 0
GULF 0 0 0 0 0 0 2 0 1 0 33 4 0 0 2 0 1 43 0 0 14
HILL 0 0 0 0 0 0 0 0 0 0 0 0 0 0 0 0 0 0 0 0 0
INDR 0 0 1 1 0 0 7 1 3 0 20 3 0 0 0 0 1 37 0 0 5
FGC 0 0 0 0 0 0 1 0 0 0 8 1 0 0 0 0 1 11 1 0 3
LSSC 0 0 0 0 0 0 0 0 0 0 0 0 0 0 0 0 0 0 0 0 0
SCF 0 0 2 0 0 0 9 1 5 1 72 11 0 0 0 0 12 113 2 1 38
MIAM 24 6 2 1 0 0 81 22 138 38 15 6 0 0 0 0 6 339 5 38 54
NFLA 0 0 0 0 0 0 0 0 0 0 0 0 0 0 0 0 0 0 0 0 0
NWFC 1 0 2 0 0 0 0 1 1 2 37 13 0 0 1 0 1 59 1 2 14
PALM 0 0 0 0 0 0 5 0 4 0 4 1 0 0 0 0 3 17 1 1 6
PASC 0 0 0 0 0 0 0 0 0 0 0 0 0 0 0 0 0 0 0 0 0
PENS 0 0 1 0 0 0 0 0 0 0 14 2 0 0 0 2 2 21 1 0 6
POLK 0 0 2 1 0 0 8 1 8 1 45 5 1 0 1 0 3 76 0 0 13
ST.J 0 0 0 0 0 0 0 0 0 0 3 0 0 0 0 0 1 4 0 0 3
ST.P 0 0 15 6 1 0 29 4 16 3 203 33 1 0 2 0 13 326 9 8 76
SANF 0 0 2 0 0 0 3 0 3 0 19 0 0 0 0 0 0 27 1 0 3
SEMI 0 0 0 0 0 0 0 0 0 0 0 0 0 0 0 0 0 0 0 0 0
SFLA 0 0 0 0 0 0 0 0 0 0 0 0 0 0 0 0 0 0 0 0 0
TALL 0 0 0 0 0 0 0 0 0 0 0 0 0 0 0 0 0 0 0 0 0
VALE 0 0 0 0 0 0 0 0 0 0 0 0 0 0 0 0 0 0 0 0 0
System 31 6 36 12 1 0 224 36 215 48 604 100 2 0 7 3 56 1,381 22 70 342
PERA - 5.4T & 5.5T 11/20/2015 15:57:50
Source: 2014-15 Student Data Base
LEP - Limited English Proficiency
DISAD - Disadvantaged economically or academically
Total unknowns includes both unknown ethnicity and unknown gender.

Fact Book 5.5.3T Florida College System
Credit Program Completers Other Bachelors Degree Programs
Headcount by College and Ethnicity/Special Populations 2014-15
Ethnicity and Gender Non-Resident
Alien
Asian
American Indian
Black
Hispanic
White
Pacific
Two_or_More
Special Populations
(F)
(M)
(F)
(M)
(F)
(M)
(F)
(M)
(F)
(M)
(F)
(M)
(F)
(M)
(F)
(M) Total
Unknowns
College
Total
Disabled
LEP
DISAD
EFSC 1 2 1 1 0 1 5 2 0 1 12 14 0 0 1 1 0 42 3 4 26
BROW 6 3 0 3 0 1 62 53 44 37 39 30 0 0 1 1 14 294 9 42 175
CFLA 0 0 3 0 0 0 10 2 12 3 52 24 0 0 0 1 4 111 5 0 74
CHIP 0 0 0 0 0 0 0 0 0 0 7 3 0 0 0 0 1 11 0 0 6
DAYT 1 2 4 2 1 1 38 24 23 20 173 88 2 0 3 0 3 385 14 51 234
FSW 0 1 1 0 1 2 2 9 20 12 49 50 0 0 0 1 9 157 3 0 73
FJAX 2 0 6 12 0 0 93 43 10 7 171 152 2 1 2 1 66 568 9 19 299
FKEY 0 0 0 0 0 0 0 0 0 0 0 0 0 0 0 0 0 0 0 0 0
GULF 0 0 0 0 0 0 0 0 0 0 1 4 0 0 0 0 0 5 0 0 2
HILL 0 0 0 0 0 0 0 0 0 0 0 0 0 0 0 0 0 0 0 0 0
INDR 3 1 1 1 0 1 71 25 56 20 166 102 0 0 2 1 15 465 15 7 260
FGC 0 0 0 0 0 0 0 0 0 0 0 0 0 0 0 0 0 0 0 0 0
LSSC 0 0 0 0 0 0 0 0 1 0 6 5 0 0 0 0 0 12 0 1 5
SCF 0 0 1 0 0 0 4 2 2 3 35 13 0 0 0 0 7 67 5 2 39
MIAM 33 21 1 2 0 1 93 61 237 189 24 19 0 0 0 0 11 692 24 44 257
NFLA 0 0 0 0 0 0 0 0 0 0 0 0 0 0 0 0 0 0 0 0 0
NWFC 1 0 2 1 1 0 8 9 6 2 43 34 0 0 5 0 1 113 1 1 43
PALM 2 1 5 2 1 2 49 14 27 23 64 46 0 0 5 2 19 262 11 22 118
PASC 0 0 0 0 0 0 0 0 0 0 0 0 0 0 0 0 0 0 0 0 0
PENS 0 0 0 3 0 0 14 6 2 2 40 18 0 0 1 1 1 88 7 0 42
POLK 0 1 8 5 0 0 38 11 20 8 87 71 1 0 2 1 5 258 7 7 108
ST.J 0 0 0 0 1 0 1 0 3 0 21 18 0 0 0 0 2 46 3 0 17
ST.P 2 6 9 9 0 2 41 18 40 28 269 189 0 0 4 1 51 669 31 21 285
SANF 0 1 4 3 0 0 13 4 3 2 60 24 0 0 7 0 1 122 2 0 49
SEMI 2 2 2 6 0 0 11 6 13 29 43 68 0 0 3 3 1 189 3 10 107
SFLA 0 0 0 1 0 0 2 0 2 1 11 10 1 0 0 0 0 28 1 0 15
TALL 0 0 0 0 0 0 0 0 0 0 0 0 0 0 0 0 0 0 0 0 0
VALE 0 0 2 0 1 0 2 4 3 1 8 8 0 0 0 0 2 31 1 4 8
System 53 41 50 51 6 11 557 293 524 388 1,381 990 6 1 36 14 213 4,615 154 235 2,242
PERA - 5.4T & 5.5T 11/20/2015 15:57:50
Source: 2014-15 Student Data Base
LEP - Limited English Proficiency
DISAD - Disadvantaged economically or academically
Total unknowns includes both unknown ethnicity and unknown gender.

Fact Book 5.5.4T Florida College System
Credit Program Completers All Bachelors Degree Programs
Headcount by College and Ethnicity/Special Populations 2014-15
Ethnicity and Gender Non-Resident
Alien
Asian
American Indian
Black
Hispanic
White
Pacific
Two_or_More
Special Populations
(F)
(M)
(F)
(M)
(F)
(M)
(F)
(M)
(F)
(M)
(F)
(M)
(F)
(M)
(F)
(M) Total
Unknowns
College
Total
Disabled
LEP
DISAD
EFSC 1 2 1 1 0 1 5 2 0 1 12 14 0 0 1 1 0 42 3 4 26
BROW 12 3 9 5 0 1 115 60 77 40 80 38 0 0 3 1 19 463 10 52 251
CFLA 0 0 3 0 0 0 10 2 12 3 66 25 0 0 0 1 4 126 6 0 88
CHIP 0 0 0 0 1 0 6 1 0 0 57 12 0 0 0 0 1 78 1 0 32
DAYT 1 2 4 2 1 1 48 24 36 22 245 103 2 0 4 0 3 498 15 76 313
FSW 0 1 3 1 1 2 12 13 43 16 166 64 0 0 1 1 19 343 4 0 174
FJAX 4 0 8 12 1 0 136 45 11 7 231 153 2 1 2 2 74 689 13 23 362
FKEY 0 0 0 0 0 0 0 0 0 0 0 0 0 0 0 0 0 0 0 0 0
GULF 0 0 0 0 0 0 2 0 1 0 34 8 0 0 2 0 1 48 0 0 16
HILL 0 0 0 0 0 0 0 0 0 0 0 0 0 0 0 0 0 0 0 0 0
INDR 4 1 3 2 0 1 80 27 61 20 217 111 0 0 2 1 18 548 15 7 298
FGC 0 0 0 0 0 0 1 0 0 0 8 1 0 0 0 0 1 11 1 0 3
LSSC 0 0 0 0 0 0 0 0 1 0 6 5 0 0 0 0 0 12 0 1 5
SCF 0 0 3 0 0 0 15 3 8 4 114 25 0 0 0 0 20 192 8 3 86
MIAM 60 27 4 3 0 1 184 85 455 236 54 26 0 0 0 0 20 1,155 30 90 373
NFLA 0 0 0 0 0 0 0 0 0 0 0 0 0 0 0 0 0 0 0 0 0
NWFC 2 0 4 1 1 0 12 11 8 4 103 50 0 0 9 0 2 207 4 3 74
PALM 2 1 5 2 1 2 54 14 31 23 68 47 0 0 5 2 22 279 12 23 124
PASC 0 0 0 0 0 0 0 0 0 0 0 0 0 0 0 0 0 0 0 0 0
PENS 0 0 1 3 0 0 14 6 2 2 54 20 0 0 1 3 3 109 8 0 48
POLK 0 1 10 6 0 0 46 12 28 9 132 76 2 0 3 1 8 334 7 7 121
ST.J 0 0 0 0 1 0 1 0 5 0 45 18 0 0 0 0 4 74 4 0 38
ST.P 2 6 26 15 1 2 74 22 69 32 570 237 1 0 6 2 71 1,136 47 29 451
SANF 0 1 6 3 0 0 30 4 8 2 94 26 0 0 9 0 1 184 5 0 74
SEMI 2 2 2 6 0 0 11 6 13 29 43 68 0 0 3 3 1 189 3 10 107
SFLA 0 0 0 1 0 0 2 0 2 1 11 10 1 0 0 0 0 28 1 0 15
TALL 0 0 0 0 0 0 0 0 0 0 0 0 0 0 0 0 0 0 0 0 0
VALE 0 0 2 0 1 0 2 4 3 1 8 8 0 0 0 0 2 31 1 4 8
Total 90 47 94 63 9 11 860 341 874 452 2,418 1,145 8 1 51 18 294 6,776 198 332 3,087
PERA - 5.4T and 5.5T 11/20/2015 15:57:50
Source: 2014-15 Student Data Base
LEP - Limited English Proficiency
DISAD - Disadvantaged economically or academically
Total unknowns includes both unknown ethnicity and unknown gender.
Employee Information
Note: On the following pages, data includes college employees on the payroll of the institution as of October 1.

Fact Book 6.1F Florida College System
Employee Headcount by
Occupational Activity Fall 2015-16
Exec, Admin, Mgr
Business and
Financial Operations
Computer Engineering and Science
Community Service, Legal, Arts and Media
Instructional
Archivists, Curators
and Museum Technicians
Librarians
Library
Technicians
Non-Postsecondary
Teaching
Healthcare Practitioners
and Technical
Service
Occupations
Sum % of
Total
Sum % of
Total
Sum % of
Total
Sum % of
Total
Sum % of
Total
Sum % of
Total
Sum % of
Total
Sum % of
Total
Sum
% of Total
Sum % of
Total
Sum % of
Total
YEAR
1,272
2.81
1,407
3.11
1,541
3.40
2,014
4.45
22,465
49.60
21
0.05
279
0.62
210
0.46
3,254
7.18
71
0.16
2,860
6.31 2016
Sales and Related
Occupations
Office and
Administrative Support
Occupations
Natural Resources,
Construction and
Maintenance Occup
Production,
Transportation and Material
Total
Sum % of Total
Sum % of Total
Sum % of Total
Sum % of Total
YEAR
104
0.23
8,843
19.52
850
1.88
103
0.23
45,294 2016
PERA - RHDETGEN 12/01/2015 11:33:08 SOURCE: APR2016 NOTE: Includes temporary employees. Thirteen employees with unknown gender are not included. NOTE: Beginning in 2013, IPEDS changed the Occupational Codes which were reported NOTE: Exec, Admin, Mgr, Business and Financial Operations, Computer Engineering and Science, Community Service, Legal, Arts and Media, Archivists, Curators and Museum Technicians, Librarians, Healthcare Practitioners and Technical, Sales and Related Occupations, Production, Transportation and Material were too small to show on the chart.

Fact Book 6.2F Florida College System
Employee Headcount by
Occupational Activity Fall 2011-12 through Fall 2015-16
Occupational Activity
Exec., Admin. Mgr. Instructional Professional Other Total
Fall 2011-12 713 24,941 6,348 15,484 47,486
Fall 2012-13 1,182 22,610 6,799 14,869 45,460
Fall 2013-14 1,271 21,894 7,745 14,899 45,809
Fall 2014-15 1,284 20,933 8,254 14,979 45,450
Fall 2015-16 1,253 22,465 7,169 14,407 45,294
PERA - 6.2F 02/23/2016 9:22:38 Source: Fall 2011-12 through Fall 2015-16 Annual Personnel Reports (Refer to table 6.4T for current year) Note: Includes temporary employees, Thirteen employees with unknown gender are not included in the current year. Note: New 2013 occupational activity codes have led to a distribution of employee headcounts which may differ from previous years. Note: Other includes Teaching Assistant/Associate, Technical/Paraprofessional, Skilled Craft, Service/Maintenance, Computer/Engineering/Science, Library Technicians, Service, Office/Administrative Support, Natural Resources/Construction/Maintenance, Production/Transportation/Material Moving, and Secretarial/Clerical occupations.

Fact Book 6.3F Florida College System
Employee Headcount Full-Time/Part-Time by Ethnicity and Gender
Fall 2015-16
White Black Hispanic Other
Male Female Male Female Male Female Male Female Total
Full-Time 5,220 7,364 1,223 2,130 1,286 1,986 520 677 20,406
Part-Time 6,818 7,072 1,560 2,367 2,514 2,822 784 951 24,888
Total 12,038 14,436 2,783 4,497 3,800 4,808 1,304 1,628 45,294
PERA - RHDETGEN 02/23/2016 11:15:09 SOURCE: APR2016 NOTE: Includes temporary employees. Thirteen employees with unknown gender are not included. NOTE: Beginning in 2013, IPEDS changed the Occupational Codes which were reported

Fact Book 6.4T Florida College System
College Employee Headcount by Occupational Activity, Full-Time/Part-Time, Ethnicity and Gender
Fall Term 2015-16
Male Female Black Hispanic Other Female
White Black Hisp. Other White Black Hisp. Other Total # % # % # % # %
Exec,Admin,Mgr Full-Time 440 65 47 29 494 98 69 27 1,269 163 13% 116 9.1% 56 4.4% 688 54%
Part-Time 2 0 0 0 1 0 0 0 3 0 0.0% 0 0.0% 0 0.0% 1 33%
Sub-Total 442 65 47 29 495 98 69 27 1,272 163 13% 116 9.1% 56 4.4% 689 54%
Business and Financial Operations Full-Time 204 48 40 14 615 191 155 69 1,336 239 18% 195 15% 83 6.2% 1,030 77%
Part-Time 7 4 4 0 32 6 14 4 71 10 14% 18 25% 4 5.6% 56 79%
Sub-Total 211 52 44 14 647 197 169 73 1,407 249 18% 213 15% 87 6.2% 1,086 77%
Computer Engineering and Science Full-Time 557 74 158 60 262 48 64 26 1,249 122 9.8% 222 18% 86 6.9% 400 32%
Part-Time 55 29 72 16 32 19 56 13 292 48 16% 128 44% 29 9.9% 120 41%
Sub-Total 612 103 230 76 294 67 120 39 1,541 170 11% 350 23% 115 7.5% 520 34%
Community Service, Legal, Arts and Media Full-Time 320 91 75 22 521 223 136 50 1,438 314 22% 211 15% 72 5.0% 930 65%
Part-Time 167 35 46 18 170 37 75 28 576 72 13% 121 21% 46 8.0% 310 54%
Sub-Total 487 126 121 40 691 260 211 78 2,014 386 19% 332 16% 118 5.9% 1,240 62%
Instructional Less Than 9 Months 3,997 641 1,280 436 3,849 1,019 1,215 509 12,946 1,660 13% 2,495 19% 945 7.3% 6,592 51%
09-10 Months 1,867 245 314 195 2,299 354 355 204 5,833 599 10% 669 11% 399 6.8% 3,212 55%
11-12 Months 1,340 169 136 80 1,437 273 144 107 3,686 442 12% 280 7.6% 187 5.1% 1,961 53%
Full-Time 1,906 259 326 202 2,484 388 381 210 6,156 647 11% 707 11% 412 6.7% 3,463 56%
Part-Time 5,298 796 1,404 509 5,101 1,258 1,333 610 16,309 2,054 13% 2,737 17% 1,119 6.9% 8,302 51%
Sub-Total 7,204 1,055 1,730 711 7,585 1,646 1,714 820 22,465 2,701 12% 3,444 15% 1,531 6.8% 11,765 52%
Archivists, Curators and Museum Technicians Full-Time 4 1 1 0 7 2 0 3 18 3 17% 1 5.6% 3 17% 12 67%
Part-Time 1 0 0 0 1 1 0 0 3 1 33% 0 0.0% 0 0.0% 2 67%
Sub-Total 5 1 1 0 8 3 0 3 21 4 19% 1 4.8% 3 14% 14 67%
Librarians Full-Time 40 1 0 5 105 15 15 9 190 16 8.4% 15 7.9% 14 7.4% 144 76%
Part-Time 9 1 0 3 59 8 3 6 89 9 10% 3 3.4% 9 10% 76 85%
Sub-Total 49 2 0 8 164 23 18 15 279 25 9.0% 18 6.5% 23 8.2% 220 79%
Library Technicians Full-Time 24 7 9 1 76 25 21 7 170 32 19% 30 18% 8 4.7% 129 76%
Part-Time 6 4 1 1 18 3 3 4 40 7 18% 4 10% 5 13% 28 70%
Sub-Total 30 11 10 2 94 28 24 11 210 39 19% 34 16% 13 6.2% 157 75%
Non-Postsecondary Teaching Full-Time 290 80 58 27 456 172 123 66 1,272 252 20% 181 14% 93 7.3% 817 64%
Part-Time 500 141 174 127 580 162 165 133 1,982 303 15% 339 17% 260 13% 1,040 52%
Sub-Total 790 221 232 154 1,036 334 288 199 3,254 555 17% 520 16% 353 11% 1,857 57%
Healthcare Practitioners and Technical Full-Time 21 3 0 0 33 4 6 2 69 7 10% 6 8.7% 2 2.9% 45 65%
Part-Time 0 0 1 0 1 0 0 0 2 0 0.0% 1 50% 0 0.0% 1 50%
Sub-Total 21 3 1 0 34 4 6 2 71 7 9.9% 7 9.9% 2 2.8% 46 65%
Service Occupations Full-Time 516 316 234 88 211 153 112 28 1,658 469 28% 346 21% 116 7.0% 504 30%
PERA - RHDETGEN 02/23/2016 11:15:09 SOURCE: APR2016 NOTE: Includes temporary employees. Thirteen employees with unknown gender are not included. NOTE: Beginning in 2013, IPEDS changed the Occupational Codes which were reported

Fact Book 6.4T Florida College System
College Employee Headcount by Occupational Activity, Full-Time/Part-Time, Ethnicity and Gender
Fall Term 2015-16
Male Female Black Hispanic Other Female
White Black Hisp. Other White Black Hisp. Other Total # % # % # % # %
Part-Time 177 206 222 22 83 237 245 10 1,202 443 37% 467 39% 32 2.7% 575 48%
Sub-Total 693 522 456 110 294 390 357 38 2,860 912 32% 813 28% 148 5.2% 1,079 38%
Sales and Related Occupations Full-Time 12 6 5 1 37 11 10 5 87 17 20% 15 17% 6 6.9% 63 72%
Part-Time 1 0 1 0 10 1 4 0 17 1 5.9% 5 29% 0 0.0% 15 88%
Sub-Total 13 6 6 1 47 12 14 5 104 18 17% 20 19% 6 5.8% 78 75%
Office and Administrative Support Occupations Full-Time 356 165 248 38 1,997 748 885 171 4,608 913 20% 1,133 25% 209 4.5% 3,801 82%
Part-Time 562 337 581 85 976 630 921 143 4,235 967 23% 1,502 35% 228 5.4% 2,670 63%
Sub-Total 918 502 829 123 2,973 1,378 1,806 314 8,843 1,880 21% 2,635 30% 437 4.9% 6,471 73%
Natural Resources, Construction and Maintenance Occup Full-Time 491 98 83 31 50 47 9 3 812 145 18% 92 11% 34 4.2% 109 13%
Part-Time 24 1 4 2 5 0 2 0 38 1 2.6% 6 16% 2 5.3% 7 18%
Sub-Total 515 99 87 33 55 47 11 3 850 146 17% 98 12% 36 4.2% 116 14%
Production, Transportation and Material Full-Time 39 9 2 2 16 5 0 1 74 14 19% 2 2.7% 3 4.1% 22 30%
Part-Time 9 6 4 1 3 5 1 0 29 11 38% 5 17% 1 3.4% 9 31%
Sub-Total 48 15 6 3 19 10 1 1 103 25 24% 7 6.8% 4 3.9% 31 30%
All Employees Full-Time 5,220 1,223 1,286 520 7,364 2,130 1,986 677 20,406 3,353 16% 3,272 16% 1,197 5.9% 12,157 60%
Part-Time 6,818 1,560 2,514 784 7,072 2,367 2,822 951 24,888 3,927 16% 5,336 21% 1,735 7.0% 13,212 53%
Total 12,038 2,783 3,800 1,304 14,436 4,497 4,808 1,628 45,294 7,280 16% 8,608 19% 2,932 6.5% 25,369 56%
PERA - RHDETGEN 02/23/2016 11:15:09 SOURCE: APR2016 NOTE: Includes temporary employees. Thirteen employees with unknown gender are not included. NOTE: Beginning in 2013, IPEDS changed the Occupational Codes which were reported

Fact Book 6.5T Florida College System
Average Salary of Full-Time Instructional Personnel by Semesters Employed
Fall 2006-07 through Fall 2015-16
2.0 Semesters 2.5 Semesters 3.0 Semesters 2.0 Semesters Equivalent* Number Salary Number Salary Number Salary Number Salary % Change
Fall 2006-07 2,607 $50,230 2,184 $57,322 397 $61,953 5,188 $51,057 3.3%
Fall 2007-08 2,913 $51,232 1,951 $61,506 380 $64,043 5,244 $53,059 3.9%
Fall 2008-09 2,948 $51,651 2,011 $61,892 369 $65,603 5,328 $53,533 0.9%
Fall 2009-10 2,975 $51,848 1,949 $62,059 373 $65,041 5,297 $53,625 0.2%
Fall 2010-11 3,081 $52,107 2,010 $63,202 403 $66,667 5,494 $54,243 1.2%
Fall 2011-12 3,525 $52,903 1,765 $63,602 401 $67,396 5,691 $54,586 0.6%
Fall 2012-13 3,392 $54,000 1,771 $64,047 598 $65,070 5,761 $55,219 1.2%
Fall 2013-14 3,479 $53,961 1,846 $65,509 600 $65,978 5,925 $55,706 0.9%
Fall 2014-15 3,477 $54,203 1,848 $66,523 649 $65,553 5,974 $56,081 0.7%
Fall 2015-16 3,554 $54,750 1,964 $67,380 520 $69,106 6,038 $57,020 1.7%
PERA - 6.5T 12/01/2015 11:33:10
Source: Fall 2006-07 through 2015-16 Annual Personnel Reports
Note: Temporary employees are not included.
Full-time faculty with contracts less than 2 terms are not included.
* 2.0 semester equivalents have been determined by the application of conversion factors to the 2.5 and 3.0 semester
salaries. These contract periods have been adjusted in order to develop a salary composite for 2.0 semesters or nine months.
This period is the nationally recognized basis for comparison.
The federal standard of 0.909 and 0.818 have been respectively applied to 2.5 and 3.0 semester salaries.
The number of days per term included in a contract may vary among the colleges.

Fact Book 6.6T Florida College System
College by Semesters Employed
Fall Term 2015-16
2.0 Semesters 2.5 Semesters 3.0 Semesters 2.0 Semesters Equivalent* Number Salary Number Salary Number Salary Number Salary % Change
Eastern Florida 255 $53,829 0 $0 0 $0 255 $53,829 (0.5%)
Broward 358 $59,830 34 $67,665 8 $78,167 400 $60,056 0.3%
Central Florida 120 $55,328 0 $0 0 $0 120 $55,328 2.6%
Chipola 0 $0 46 $51,161 0 $0 46 $46,510 2.7%
Daytona 261 $58,693 0 $0 30 $88,093 291 $60,072 0.7%
FL SouthWestern 176 $56,721 0 $0 0 $0 176 $56,721 (0.0%)
Fla SC at Jax 394 $54,803 0 $0 0 $0 394 $54,803 5.8%
Florida Keys 0 $0 24 $64,147 1 $71,025 25 $58,307 1.0%
Gulf Coast 0 $0 74 $53,134 31 $70,532 105 $51,080 10%
Hillsborough 299 $53,685 0 $0 10 $49,294 309 $53,253 2.5%
Indian River 0 $0 202 $83,102 9 $89,264 211 $75,440 2.2%
Florida Gateway 44 $49,222 4 $57,691 17 $65,398 65 $50,541 0.3%
Lake Sumter 84 $45,764 0 $0 0 $0 84 $45,764 (1.2%)
State College FL 152 $53,718 0 $0 0 $0 152 $53,718 0.7%
Miami Dade 0 $0 724 $70,784 31 $72,090 755 $64,129 1.1%
North Florida 19 $47,805 2 $33,983 10 $50,786 31 $44,697 0.6%
Northwest Fla 0 $0 98 $55,944 0 $0 98 $50,859 (9.1%)
Palm Beach State 306 $56,296 0 $0 0 $0 306 $56,296 4.4%
Pasco-Hernando 148 $55,204 0 $0 7 $45,299 155 $54,385 0.1%
Pensacola 157 $47,255 0 $0 20 $55,277 177 $47,026 (0.5%)
Polk 155 $55,456 3 $56,540 1 $70,000 159 $55,391 0.5%
St. Johns River 54 $45,752 60 $51,688 20 $57,743 134 $46,529 (0.4%)
St. Petersburg 47 $69,960 237 $69,796 97 $83,627 381 $65,520 2.0%
Santa Fe 230 $49,894 0 $0 15 $56,488 245 $49,669 (2.5%)
Seminole State 33 $59,704 0 $0 162 $64,768 195 $54,128 0.1%
South Florida 8 $50,965 34 $55,117 22 $62,548 64 $50,582 (0.1%)
Tallahassee 180 $58,043 0 $0 2 $47,185 182 $57,829 13%
Valencia 74 $44,537 422 $63,286 27 $62,558 523 $55,366 1.9%
System Total 3,554 $54,750 1,964 $67,380 520 $69,106 6,038 $57,020 1.7%
PERA - RAVGSAL 12/01/2015 11:33:10
Source: APR2016
Notes: Temporary employees are not included. Full-time faculty with contracts less than 2 terms are not included. *2.0 S e m e s t e r Equivalents have been determined by the application of conversion factors to the 2.5 and 3.0 semester salaries. These contract periods have
been adjusted in order to develop a salary composite for 2.0 semesters or nine months. This period is the nationally recognized basis for comparison. The f e d e r a l standard factors of 0.909 and 0.818 have been respectively applied to 2.5 and 3.0 semester salaries. The
number of days per term included in a contract may vary among the colleges. Several Florida Colleges were involved with union negotiations at the time the data was reported. Therefore the posted amounts could differ once negotiations are completed.
Notes: Beginning in 2013, IPEDS changed the Occupational Codes used for reporting.
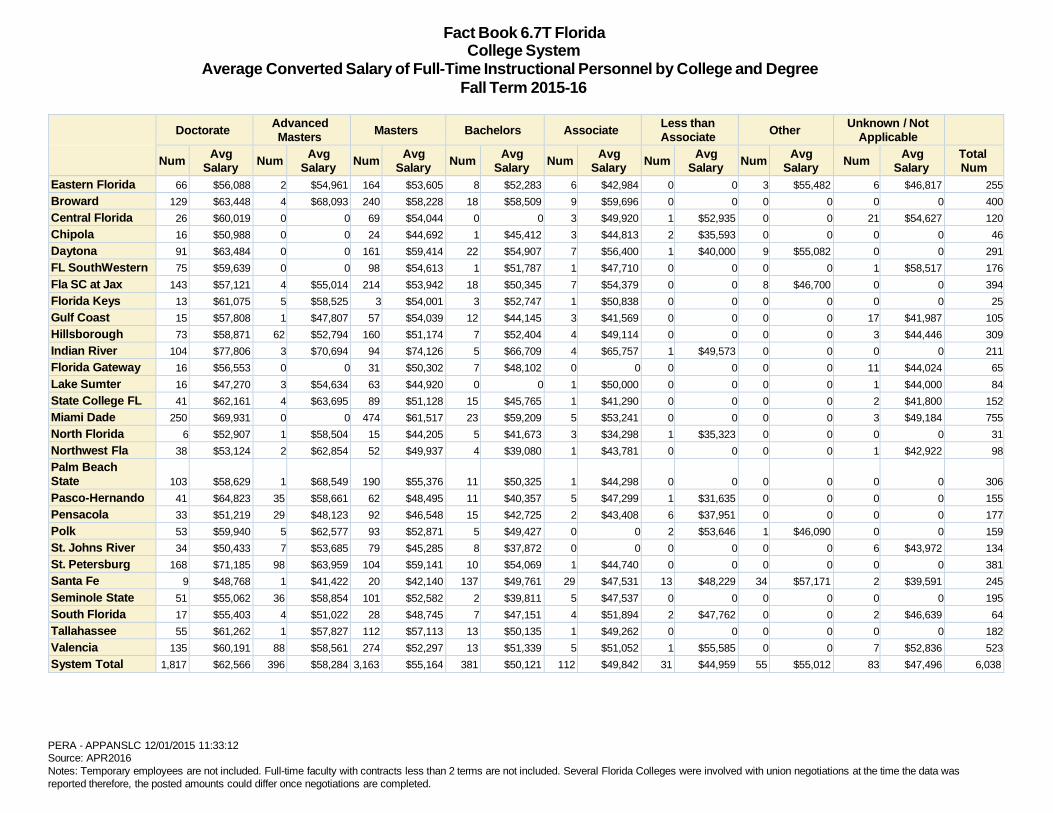
Fact Book 6.7T Florida College System
Average Converted Salary of Full-Time Instructional Personnel by College and Degree
Fall Term 2015-16
Doctorate Advanced
Masters
Masters
Bachelors
Associate Less than
Associate
Other Unknown / Not
Applicable
Num Avg
Salary
Num Avg
Salary
Num Avg
Salary
Num Avg
Salary
Num Avg
Salary
Num Avg
Salary
Num Avg
Salary
Num Avg
Salary Total Num
Eastern Florida 66 $56,088 2 $54,961 164 $53,605 8 $52,283 6 $42,984 0 0 3 $55,482 6 $46,817 255
Broward 129 $63,448 4 $68,093 240 $58,228 18 $58,509 9 $59,696 0 0 0 0 0 0 400
Central Florida 26 $60,019 0 0 69 $54,044 0 0 3 $49,920 1 $52,935 0 0 21 $54,627 120
Chipola 16 $50,988 0 0 24 $44,692 1 $45,412 3 $44,813 2 $35,593 0 0 0 0 46
Daytona 91 $63,484 0 0 161 $59,414 22 $54,907 7 $56,400 1 $40,000 9 $55,082 0 0 291
FL SouthWestern 75 $59,639 0 0 98 $54,613 1 $51,787 1 $47,710 0 0 0 0 1 $58,517 176
Fla SC at Jax 143 $57,121 4 $55,014 214 $53,942 18 $50,345 7 $54,379 0 0 8 $46,700 0 0 394
Florida Keys 13 $61,075 5 $58,525 3 $54,001 3 $52,747 1 $50,838 0 0 0 0 0 0 25
Gulf Coast 15 $57,808 1 $47,807 57 $54,039 12 $44,145 3 $41,569 0 0 0 0 17 $41,987 105
Hillsborough 73 $58,871 62 $52,794 160 $51,174 7 $52,404 4 $49,114 0 0 0 0 3 $44,446 309
Indian River 104 $77,806 3 $70,694 94 $74,126 5 $66,709 4 $65,757 1 $49,573 0 0 0 0 211
Florida Gateway 16 $56,553 0 0 31 $50,302 7 $48,102 0 0 0 0 0 0 11 $44,024 65
Lake Sumter 16 $47,270 3 $54,634 63 $44,920 0 0 1 $50,000 0 0 0 0 1 $44,000 84
State College FL 41 $62,161 4 $63,695 89 $51,128 15 $45,765 1 $41,290 0 0 0 0 2 $41,800 152
Miami Dade 250 $69,931 0 0 474 $61,517 23 $59,209 5 $53,241 0 0 0 0 3 $49,184 755
North Florida 6 $52,907 1 $58,504 15 $44,205 5 $41,673 3 $34,298 1 $35,323 0 0 0 0 31
Northwest Fla 38 $53,124 2 $62,854 52 $49,937 4 $39,080 1 $43,781 0 0 0 0 1 $42,922 98
Palm Beach
State
103
$58,629
1
$68,549
190
$55,376
11
$50,325
1
$44,298
0
0
0
0
0
0
306
Pasco-Hernando 41 $64,823 35 $58,661 62 $48,495 11 $40,357 5 $47,299 1 $31,635 0 0 0 0 155
Pensacola 33 $51,219 29 $48,123 92 $46,548 15 $42,725 2 $43,408 6 $37,951 0 0 0 0 177
Polk 53 $59,940 5 $62,577 93 $52,871 5 $49,427 0 0 2 $53,646 1 $46,090 0 0 159
St. Johns River 34 $50,433 7 $53,685 79 $45,285 8 $37,872 0 0 0 0 0 0 6 $43,972 134
St. Petersburg 168 $71,185 98 $63,959 104 $59,141 10 $54,069 1 $44,740 0 0 0 0 0 0 381
Santa Fe 9 $48,768 1 $41,422 20 $42,140 137 $49,761 29 $47,531 13 $48,229 34 $57,171 2 $39,591 245
Seminole State 51 $55,062 36 $58,854 101 $52,582 2 $39,811 5 $47,537 0 0 0 0 0 0 195
South Florida 17 $55,403 4 $51,022 28 $48,745 7 $47,151 4 $51,894 2 $47,762 0 0 2 $46,639 64
Tallahassee 55 $61,262 1 $57,827 112 $57,113 13 $50,135 1 $49,262 0 0 0 0 0 0 182
Valencia 135 $60,191 88 $58,561 274 $52,297 13 $51,339 5 $51,052 1 $55,585 0 0 7 $52,836 523
System Total 1,817 $62,566 396 $58,284 3,163 $55,164 381 $50,121 112 $49,842 31 $44,959 55 $55,012 83 $47,496 6,038
PERA - APPANSLC 12/01/2015 11:33:12
Source: APR2016
Notes: Temporary employees are not included. Full-time faculty with contracts less than 2 terms are not included. Several Florida Colleges were involved with union negotiations at the time the data was
reported therefore, the posted amounts could differ once negotiations are completed.

Financial Information

Fact Book 7.1F Florida
College System
Operating Expenditures
2014-15 Operating Expenditures by Category Operating Expenditures by Program Area
Percentage by Category
Adult
Education
Advanced and
Professional Apprentice
Capital Outlay
Current Expense
EPI Non-
Instructional
Operating Expenditures by Category 0 0 0 1.52 21.27 0 0
Operating Expenditures by Program Area 1.95 62.35 0.26 0 0 .022 0.74
Percentage by Category
Other PSAV PSV
Personnel Expense
(Full-Time)
Personnel Expense
(Part-Time) Preparatory
Operating Expenditures by Category 0 0 0 63.69 13.51 0
Operating Expenditures by Program Area 1.55 4.08 22.66 0 0 6.18
PERA - 7.1F 03/11/2016 11:00:34
Source: 2014-15 Annual Cost Analysis.
Note: EPI and Apprentice were too small of a percentage to fit title on the chart.
Note: Due to rounding percentages may not add to 100%.
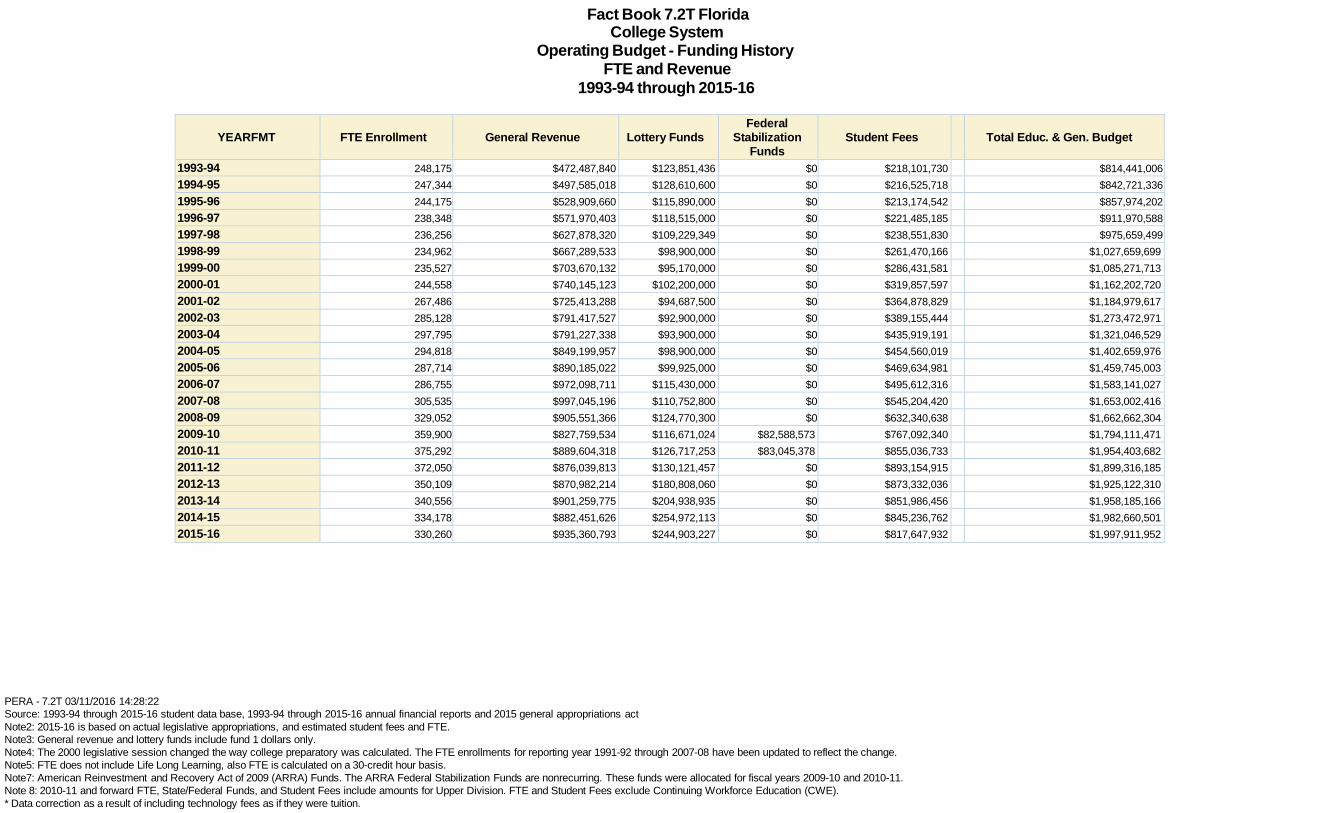
Fact Book 7.2T Florida College System
Operating Budget - Funding History FTE and Revenue
1993-94 through 2015-16
YEARFMT
FTE Enrollment
General Revenue
Lottery Funds
Federal
Stabilization
Funds
Student Fees
Total Educ. & Gen. Budget
1993-94 248,175 $472,487,840 $123,851,436 $0 $218,101,730 $814,441,006
1994-95 247,344 $497,585,018 $128,610,600 $0 $216,525,718 $842,721,336
1995-96 244,175 $528,909,660 $115,890,000 $0 $213,174,542 $857,974,202
1996-97 238,348 $571,970,403 $118,515,000 $0 $221,485,185 $911,970,588
1997-98 236,256 $627,878,320 $109,229,349 $0 $238,551,830 $975,659,499
1998-99 234,962 $667,289,533 $98,900,000 $0 $261,470,166 $1,027,659,699
1999-00 235,527 $703,670,132 $95,170,000 $0 $286,431,581 $1,085,271,713
2000-01 244,558 $740,145,123 $102,200,000 $0 $319,857,597 $1,162,202,720
2001-02 267,486 $725,413,288 $94,687,500 $0 $364,878,829 $1,184,979,617
2002-03 285,128 $791,417,527 $92,900,000 $0 $389,155,444 $1,273,472,971
2003-04 297,795 $791,227,338 $93,900,000 $0 $435,919,191 $1,321,046,529
2004-05 294,818 $849,199,957 $98,900,000 $0 $454,560,019 $1,402,659,976
2005-06 287,714 $890,185,022 $99,925,000 $0 $469,634,981 $1,459,745,003
2006-07 286,755 $972,098,711 $115,430,000 $0 $495,612,316 $1,583,141,027
2007-08 305,535 $997,045,196 $110,752,800 $0 $545,204,420 $1,653,002,416
2008-09 329,052 $905,551,366 $124,770,300 $0 $632,340,638 $1,662,662,304
2009-10 359,900 $827,759,534 $116,671,024 $82,588,573 $767,092,340 $1,794,111,471
2010-11 375,292 $889,604,318 $126,717,253 $83,045,378 $855,036,733 $1,954,403,682
2011-12 372,050 $876,039,813 $130,121,457 $0 $893,154,915 $1,899,316,185
2012-13 350,109 $870,982,214 $180,808,060 $0 $873,332,036 $1,925,122,310
2013-14 340,556 $901,259,775 $204,938,935 $0 $851,986,456 $1,958,185,166
2014-15 334,178 $882,451,626 $254,972,113 $0 $845,236,762 $1,982,660,501
2015-16 330,260 $935,360,793 $244,903,227 $0 $817,647,932 $1,997,911,952
PERA - 7.2T 03/11/2016 14:28:22
Source: 1993-94 through 2015-16 student data base, 1993-94 through 2015-16 annual financial reports and 2015 general appropriations act
Note2: 2015-16 is based on actual legislative appropriations, and estimated student fees and FTE.
Note3: General revenue and lottery funds include fund 1 dollars only.
Note4: The 2000 legislative session changed the way college preparatory was calculated. The FTE enrollments for reporting year 1991-92 through 2007-08 have been updated to reflect the change.
Note5: FTE does not include Life Long Learning, also FTE is calculated on a 30-credit hour basis.
Note7: American Reinvestment and Recovery Act of 2009 (ARRA) Funds. The ARRA Federal Stabilization Funds are nonrecurring. These funds were allocated for fiscal years 2009-10 and 2010-11.
Note 8: 2010-11 and forward FTE, State/Federal Funds, and Student Fees include amounts for Upper Division. FTE and Student Fees exclude Continuing Workforce Education (CWE).
* Data correction as a result of including technology fees as if they were tuition.

Fact Book 7.3T Florida College System
Annual Cost Analysis Expenditures by College and Function
2014-15
Instructional Costs
College
Direct Instruction
Academic Support
Student Services
Institutional Support Plant Oper. &
Maintenance
Total Instructional Costs
Unallocated Costs
Total Costs
Eastern Florida $34,439,346 $5,809,546 $8,008,554 $12,093,431 $10,478,953 $70,829,832 $167,540 $70,997,371
Broward $77,285,545 $21,711,478 $16,149,464 $32,061,369 $26,329,650 $173,537,507 $2,015,587 $175,553,093
Central Florida $16,360,524 $3,574,775 $3,872,483 $6,694,101 $6,278,310 $36,780,193 $297,641 $37,077,834
Chipola $5,959,238 $757,975 $1,154,116 $3,378,249 $2,913,276 $14,162,853 $1,086,476 $15,249,329
Daytona $38,777,274 $7,970,671 $8,367,331 $14,135,918 $10,820,089 $80,071,282 $377,706 $80,448,988
FL SouthWestern $30,547,841 $6,589,698 $7,493,287 $10,925,608 $7,942,695 $63,499,129 $0 $63,499,129
Fla SC at Jax $56,858,181 $22,969,734 $13,505,098 $24,294,855 $18,026,107 $135,653,976 $-215,537 $135,438,440
Florida Keys $3,392,119 $1,171,611 $850,060 $2,560,011 $1,553,552 $9,527,354 $0 $9,527,354
Gulf Coast $14,349,519 $2,068,422 $2,417,455 $4,993,459 $5,915,174 $29,744,029 $174,211 $29,918,240
Hillsborough $48,348,789 $9,057,339 $12,342,503 $24,079,995 $17,397,766 $111,226,393 $1,166,381 $112,392,773
Indian River $41,968,468 $9,935,392 $8,108,986 $7,546,484 $13,118,926 $80,678,256 $306,172 $80,984,428
Florida Gateway $6,758,379 $2,665,401 $1,599,084 $4,534,431 $2,703,341 $18,260,635 $40,920 $18,301,555
Lake Sumter $7,848,228 $3,088,227 $2,041,713 $5,056,662 $2,888,352 $20,923,183 $545,727 $21,468,910
State College FL $18,037,434 $2,801,435 $4,248,057 $10,361,193 $5,526,524 $40,974,643 $0 $40,974,643
Miami Dade $138,868,914 $31,712,374 $22,186,903 $60,651,904 $43,273,925 $296,694,020 $2,343,710 $299,037,730
North Florida $3,021,115 $1,500,697 $1,142,560 $1,982,096 $1,501,057 $9,147,525 $255,761 $9,403,286
Northwest FL $12,190,047 $3,898,611 $2,104,880 $7,156,216 $4,961,222 $30,310,977 $766,289 $31,077,265
Palm Beach $51,513,238 $18,652,004 $15,160,571 $11,978,005 $15,937,824 $113,241,642 $104,904 $113,346,546
Pasco-Hernando $17,435,774 $6,744,417 $5,938,926 $8,022,872 $6,101,373 $44,243,361 $544,184 $44,787,545
Pensacola $22,011,027 $4,096,167 $4,671,764 $11,218,362 $12,739,688 $54,737,007 $1,767,799 $56,504,807
Polk $22,948,732 $4,246,740 $4,142,962 $10,164,097 $6,926,347 $48,428,877 $724,668 $49,153,545
St. Johns River $13,325,243 $2,939,535 $2,539,048 $7,406,120 $4,844,590 $31,054,535 $1,070,451 $32,124,986
St. Petersburg $64,475,732 $22,149,039 $18,591,253 $19,346,861 $18,890,955 $143,453,839 $1,677 $143,455,516
Santa Fe $33,920,086 $7,339,851 $7,054,161 $13,657,921 $9,573,764 $71,545,783 $728,392 $72,274,174
Seminole $34,678,424 $7,299,713 $8,099,940 $14,801,297 $8,274,574 $73,153,949 $0 $73,153,949
South Florida $8,407,228 $2,865,837 $1,898,064 $3,752,601 $4,303,446 $21,227,176 $298,251 $21,525,427
Tallahassee $28,168,459 $4,641,466 $3,781,439 $13,523,770 $8,211,563 $58,326,697 $725,478 $59,052,175
Valencia $80,488,661 $17,256,914 $20,279,430 $28,867,682 $20,792,005 $167,684,693 $0 $167,684,693
System $932,383,565 $235,515,069 $207,750,092 $375,245,570 $298,225,047 $2,049,119,342 $15,294,386 $2,064,413,728
PERA - 7.3T 02/23/2016 11:57:02
Source: 2014-15 Cost Analysis Reports
Due to rounding, column and rows may not foot and cross-foot.

Fact Book 7.4T Florida College System
Annual Cost Analysis Percentage by College and Function
2014-15
Instructional Costs
College
Direct Instruction
Academic Support
Student Services
Institutional Support Plant Oper. &
Maintenance
Total Instructional Costs
Unallocated Costs
Total Costs
Eastern Florida 48.51% 8.18% 11.28% 17.03% 14.76% 99.76% 0.24% 100.00%
Broward 44.02% 12.37% 9.20% 18.26% 15.00% 98.85% 1.15% 100.00%
Central Florida 44.12% 9.64% 10.44% 18.05% 16.93% 99.20% 0.80% 100.00%
Chipola 39.08% 4.97% 7.57% 22.15% 19.10% 92.88% 7.12% 100.00%
Daytona 48.20% 9.91% 10.40% 17.57% 13.45% 99.53% 0.47% 100.00%
FL SouthWestern 48.11% 10.38% 11.80% 17.21% 12.51% 100.00% 0.00% 100.00%
Fla SC at Jax 41.98% 16.96% 9.97% 17.94% 13.31% 100.16% -0.16% 100.00%
Florida Keys 35.60% 12.30% 8.92% 26.87% 16.31% 100.00% 0.00% 100.00%
Gulf Coast 47.96% 6.91% 8.08% 16.69% 19.77% 99.42% 0.58% 100.00%
Hillsborough 43.02% 8.06% 10.98% 21.42% 15.48% 98.96% 1.04% 100.00%
Indian River 51.82% 12.27% 10.01% 9.32% 16.20% 99.62% 0.38% 100.00%
Florida Gateway 36.93% 14.56% 8.74% 24.78% 14.77% 99.78% 0.22% 100.00%
Lake Sumter 36.56% 14.38% 9.51% 23.55% 13.45% 97.46% 2.54% 100.00%
State College FL 44.02% 6.84% 10.37% 25.29% 13.49% 100.00% 0.00% 100.00%
Miami Dade 46.44% 10.60% 7.42% 20.28% 14.47% 99.22% 0.78% 100.00%
North Florida 32.13% 15.96% 12.15% 21.08% 15.96% 97.28% 2.72% 100.00%
Northwest FL 39.22% 12.54% 6.77% 23.03% 15.96% 97.53% 2.47% 100.00%
Palm Beach 45.45% 16.46% 13.38% 10.57% 14.06% 99.91% 0.09% 100.00%
Pasco-Hernando 38.93% 15.06% 13.26% 17.91% 13.62% 98.78% 1.22% 100.00%
Pensacola 38.95% 7.25% 8.27% 19.85% 22.55% 96.87% 3.13% 100.00%
Polk 46.69% 8.64% 8.43% 20.68% 14.09% 98.53% 1.47% 100.00%
St. Johns River 41.48% 9.15% 7.90% 23.05% 15.08% 96.67% 3.33% 100.00%
St. Petersburg 44.94% 15.44% 12.96% 13.49% 13.17% 100.00% 0.00% 100.00%
Santa Fe 46.93% 10.16% 9.76% 18.90% 13.25% 98.99% 1.01% 100.00%
Seminole 47.40% 9.98% 11.07% 20.23% 11.31% 100.00% 0.00% 100.00%
South Florida 39.06% 13.31% 8.82% 17.43% 19.99% 98.61% 1.39% 100.00%
Tallahassee 47.70% 7.86% 6.40% 22.90% 13.91% 98.77% 1.23% 100.00%
Valencia 48.00% 10.29% 12.09% 17.22% 12.40% 100.00% 0.00% 100.00%
System 45.16% 11.41% 10.06% 18.18% 14.45% 99.26% 0.74% 100.00%
PERA - 7.4T 02/23/2016 11:57:20
Source: 2014-15 Cost Analysis Reports
Due to rounding, column and rows may not foot and cross-foot.

Fact Book 7.5T Florida College System Annual
Cost Analysis Expenditures by College and Category
2014-15
Personnel Cost
College Total Personnel Expenses
Current Expenses Capital Expenses Grand Total Full Time Part Time
Eastern Florida $47,547,513 $7,159,144 $54,706,657 $15,803,536 $487,179 $70,997,371
Broward $105,986,197 $27,532,679 $133,518,876 $39,024,079 $3,010,138 $175,553,093
Central Florida $19,660,889 $8,503,649 $28,164,538 $7,826,150 $1,087,146 $37,077,834
Chipola $9,967,001 $952,120 $10,919,121 $3,815,397 $514,811 $15,249,329
Daytona $59,982,019 $5,584,796 $65,566,816 $13,281,233 $1,600,939 $80,448,988
FL SouthWestern $36,230,111 $12,505,622 $48,735,733 $14,098,380 $665,016 $63,499,129
Fla SC at Jax $90,542,706 $17,363,073 $107,905,779 $25,869,495 $1,663,166 $135,438,440
Florida Keys $5,856,909 $703,511 $6,560,420 $2,963,934 $3,000 $9,527,354
Gulf Coast $20,168,636 $2,745,875 $22,914,511 $5,977,527 $1,026,202 $29,918,240
Hillsborough $67,266,126 $11,441,044 $78,707,170 $33,253,271 $432,332 $112,392,773
Indian River $57,709,847 $7,926,082 $65,635,929 $14,642,437 $706,062 $80,984,428
Florida Gateway $11,942,615 $1,570,467 $13,513,083 $4,542,845 $245,627 $18,301,555
Lake Sumter $14,226,575 $2,711,166 $16,937,741 $4,473,127 $58,042 $21,468,910
State College FL $26,182,875 $4,064,612 $30,247,486 $10,603,225 $123,931 $40,974,643
Miami Dade $171,725,104 $63,478,154 $235,203,258 $58,590,189 $5,244,282 $299,037,730
North Florida $6,155,886 $480,850 $6,636,736 $2,447,590 $318,960 $9,403,286
Northwest FL $18,538,453 $4,222,055 $22,760,507 $7,874,970 $441,788 $31,077,265
Palm Beach $68,344,548 $20,433,869 $88,778,417 $22,312,370 $2,255,760 $113,346,546
Pasco-Hernando $30,855,604 $3,332,132 $34,187,736 $10,256,395 $343,414 $44,787,545
Pensacola $33,082,228 $4,017,709 $37,099,937 $18,386,169 $1,018,701 $56,504,807
Polk $30,154,461 $5,244,499 $35,398,960 $13,536,238 $218,347 $49,153,545
St. Johns River $22,336,698 $1,809,401 $24,146,099 $7,807,226 $171,661 $32,124,986
St. Petersburg $100,073,062 $15,211,601 $115,284,662 $27,773,710 $397,144 $143,455,516
Santa Fe $48,243,737 $7,820,006 $56,063,743 $15,336,729 $873,702 $72,274,174
Seminole $47,055,629 $11,129,514 $58,185,143 $14,845,383 $123,423 $73,153,949
South Florida $15,189,526 $1,509,550 $16,699,076 $4,809,136 $17,215 $21,525,427
Tallahassee $36,961,290 $7,357,805 $44,319,095 $13,731,916 $1,001,164 $59,052,175
Valencia $112,882,762 $22,103,789 $134,986,551 $25,296,083 $7,402,059 $167,684,693
System $1,314,869,005 $278,914,773 $1,593,783,778 $439,178,737 $31,451,213 $2,064,413,728
% of Total Expenses 63.69% 13.51% 77.2% 21.27% 1.52% 100%
PERA - 7.5T 02/23/2016 12:47:29 Source: 2014-15 Cost Analysis Reports Due to rounding, column and rows may not foot and cross-foot.
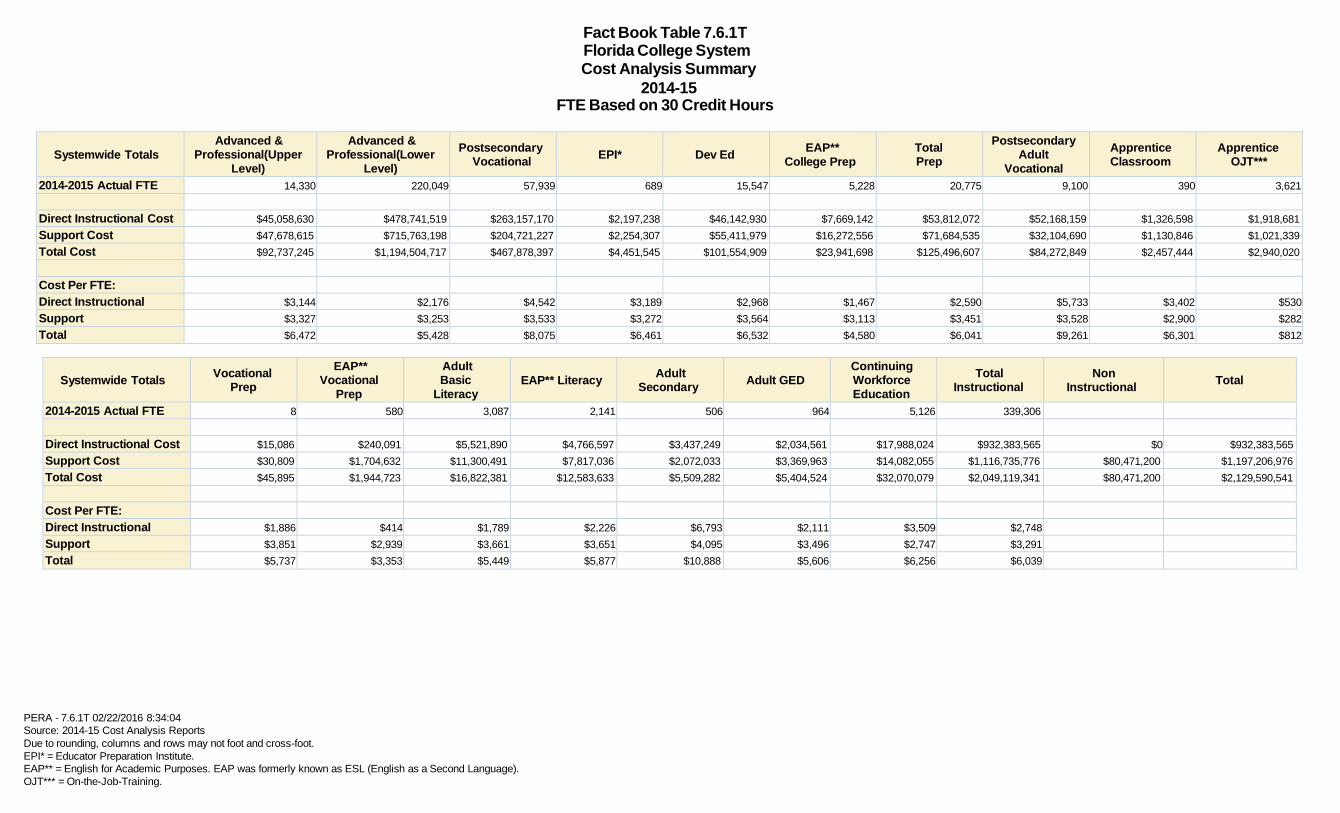
Fact Book Table 7.6.1T Florida College System Cost Analysis Summary
2014-15 FTE Based on 30 Credit Hours
Systemwide Totals
Advanced &
Professional(Upper
Level)
Advanced &
Professional(Lower
Level)
Postsecondary Vocational
EPI*
Dev Ed
EAP**
College Prep
Total Prep
Postsecondary
Adult
Vocational
Apprentice Classroom
Apprentice OJT***
2014-2015 Actual FTE 14,330 220,049 57,939 689 15,547 5,228 20,775 9,100 390 3,621
Direct Instructional Cost $45,058,630 $478,741,519 $263,157,170 $2,197,238 $46,142,930 $7,669,142 $53,812,072 $52,168,159 $1,326,598 $1,918,681
Support Cost $47,678,615 $715,763,198 $204,721,227 $2,254,307 $55,411,979 $16,272,556 $71,684,535 $32,104,690 $1,130,846 $1,021,339
Total Cost $92,737,245 $1,194,504,717 $467,878,397 $4,451,545 $101,554,909 $23,941,698 $125,496,607 $84,272,849 $2,457,444 $2,940,020
Cost Per FTE: Direct Instructional $3,144 $2,176 $4,542 $3,189 $2,968 $1,467 $2,590 $5,733 $3,402 $530
Support $3,327 $3,253 $3,533 $3,272 $3,564 $3,113 $3,451 $3,528 $2,900 $282
Total $6,472 $5,428 $8,075 $6,461 $6,532 $4,580 $6,041 $9,261 $6,301 $812
Systemwide Totals
Vocational Prep
EAP** Vocational
Prep
Adult Basic
Literacy
EAP** Literacy
Adult Secondary
Adult GED
Continuing
Workforce
Education
Total Instructional
Non Instructional
Total
2014-2015 Actual FTE 8 580 3,087 2,141 506 964 5,126 339,306 Direct Instructional Cost $15,086 $240,091 $5,521,890 $4,766,597 $3,437,249 $2,034,561 $17,988,024 $932,383,565 $0 $932,383,565
Support Cost $30,809 $1,704,632 $11,300,491 $7,817,036 $2,072,033 $3,369,963 $14,082,055 $1,116,735,776 $80,471,200 $1,197,206,976
Total Cost $45,895 $1,944,723 $16,822,381 $12,583,633 $5,509,282 $5,404,524 $32,070,079 $2,049,119,341 $80,471,200 $2,129,590,541
Cost Per FTE: Direct Instructional $1,886 $414 $1,789 $2,226 $6,793 $2,111 $3,509 $2,748 Support $3,851 $2,939 $3,661 $3,651 $4,095 $3,496 $2,747 $3,291 Total $5,737 $3,353 $5,449 $5,877 $10,888 $5,606 $6,256 $6,039
PERA - 7.6.1T 02/22/2016 8:34:04
Source: 2014-15 Cost Analysis Reports
Due to rounding, columns and rows may not foot and cross-foot.
EPI* = Educator Preparation Institute.
EAP** = English for Academic Purposes. EAP was formerly known as ESL (English as a Second Language).
OJT*** = On-the-Job-Training.

Fact Book Table 7.6.2T Florida College System Cost Analysis Summary
2014-15 Actual Credit Hours
Systemwide Totals
Advanced &
Professional(Upper
Level)
Advanced &
Professional(Lower
Level)
Postsecondary Vocational
EPI*
Dev Ed
EAP**
College Prep
Total Prep
Postsecondary
Adult
Vocational
Apprentice Classroom
Apprentice OJT***
2014-2015 Actual Credit Hours
429,903 6,601,460 1,738,166 20,680 466,408 156,852 623,260 272,992 11,711 108,638
Direct Instructional Cost $45,058,630 $478,741,519 $263,157,170 $2,197,238 $46,142,930 $7,669,142 $53,812,072 $52,168,159 $1,326,598 $1,918,681
Support Cost $47,678,615 $715,763,198 $204,721,227 $2,254,307 $55,411,979 $16,272,556 $71,684,535 $32,104,690 $1,130,846 $1,021,339
Total Cost $92,737,245 $1,194,504,717 $467,878,397 $4,451,545 $101,554,909 $23,941,698 $125,496,607 $84,272,849 $2,457,444 $2,940,020
Cost Per Credit Hour: Direct Instructional $105 $73 $151 $106 $99 $49 $86 $191 $113 $18
Support $111 $108 $118 $109 $119 $104 $115 $118 $97 $9
Total $216 $181 $269 $215 $218 $153 $201 $309 $210 $27
Systemwide Totals
Vocational Prep
EAP**
Vocational
Prep
Adult
Basic
Literacy
EAP** Literacy
Adult Secondary
Adult GED
Continuing
Workforce
Education
Total Instructional
Non Instructional
Total
2014-2015 Actual Credit
Hours 230 17,408 92,622 64,224 15,185 28,913 153,781 10,179,172
Direct Instructional Cost $15,086 $240,091 $5,521,890 $4,766,597 $3,437,249 $2,034,561 $17,988,024 $932,383,565 $0 $932,383,565
Support Cost $30,809 $1,704,632 $11,300,491 $7,817,036 $2,072,033 $3,369,963 $14,082,055 $1,116,735,776 $80,471,200 $1,197,206,976
Total Cost $45,895 $1,944,723 $16,822,381 $12,583,633 $5,509,282 $5,404,524 $32,070,079 $2,049,119,341 $80,471,200 $2,129,590,541
Cost Per Credit Hour: Direct Instructional $66 $14 $60 $74 $226 $70 $117 $90 Support $134 $98 $122 $122 $136 $117 $92 $108 Total $200 $112 $182 $196 $363 $187 $209 $198
PERA - 7.6.2T 02/22/2016 9:00:15
Source: 2014-15 Cost Analysis Reports
Due to rounding, columns and rows may not foot and cross-foot.
EPI* = Educator Preparation Institute
EAP** = English for Academic Purposes. EAP was formerly known as ESL (English as a second language).
OJT*** = On-the-Job-Training

Fact Book 7.7T Florida College System
Full Cost Summary Report Cost Per Credit Hour by Program and College
2014-15
College
Advanced &
Professional (Upper Level)
Advanced &
Professional (Lower Level)
Postsecondary Vocational
EPI*
Postsecondary Adult Vocational
Apprenticeship
Development Ed.
Vocational Prep.
Adult Education
College Total
Eastern Florida $197 $188 $274 $242 $0 $0 219 $0 $0 $207
Broward $206 $169 $227 $202 $147 $0 289 $0 $0 $189
Central Florida $184 $194 $268 $183 $0 $0 312 $0 $177 $210
Chipola $322 $286 $441 $304 $0 $0 380 $545 $0 $322
Daytona $240 $215 $290 $221 $152 $53 320 $129 $200 $228
FL SouthWestern $200 $184 $604 $289 $0 $0 482 $0 $0 $211
Fla SC at Jax $200 $198 $276 $255 $255 $32 312 $401 $267 $218
Florida Keys $0 $379 $538 $447 $0 $0 798 $0 $0 $431
Gulf Coast $325 $216 $344 $225 $353 $0 353 $0 $0 $243
Hillsborough $0 $173 $236 $236 $241 $47 231 $0 $271 $180
Indian River $215 $172 $272 $220 $0 $45 275 $0 $218 $202
Florida Gateway $389 $268 $384 $348 $396 $0 346 $0 $0 $299
Lake Sumter $274 $219 $317 $350 $501 $0 0 $0 $0 $246
State College FL $182 $171 $282 $156 $100 $0 0 $0 $0 $178
Miami Dade $194 $160 $403 $198 $148 $52 257 $0 $128 $173
North Florida $0 $323 $442 $523 $0 $0 438 $0 $0 $357
Northwest FL $226 $203 $244 $203 $0 $0 246 $0 $172 $211
Palm Beach $177 $162 $409 $205 $108 $58 356 $0 $0 $188
Pasco-Hernando $219 $166 $224 $174 $203 $0 298 $0 $532 $190
Pensacola $196 $223 $269 $221 $175 $0 271 $0 $265 $236
Polk $173 $192 $282 $222 $237 $0 467 $0 $0 $215
St. Johns River $214 $207 $245 $202 $260 $34 419 $0 $207 $218
St. Petersburg $267 $209 $247 $197 $0 $0 313 $0 $0 $223
Santa Fe $215 $186 $287 $204 $314 $35 355 $0 $325 $212
Seminole $156 $173 $225 $182 $204 $34 251 $0 $309 $185
South Florida $300 $296 $508 $531 $0 $38 466 $0 $249 $310
Tallahassee $0 $160 $262 $229 $0 $22 407 $0 $166 $160
Valencia $271 $172 $198 $254 $178 $0 318 $0 $0 $181
Weighted Mean $216 $181 $269 $218 $215 $45 309 $200 $201 $198
PERA - 7.7T 02/23/2016 12:02:10
Source: 2014-15 Cost Analysis Reports
Note: *Educator Preparation Institute (EPI)
Due to rounding, columns and rows may not foot and cross-foot.

Fact Book 7.8T Florida College System
Student Fees for Lower Level Credit Programs Resident Students
Colleges by Fee Type
Fee per Credit Hour Fall 2014-15
College
Tuition
Student Financial Aid Fee
Student Activity Fee
Capital Improvement Fee
Technology Fee
Total Fall 2015 Fees for Academic
Year (30 Hours)
Eastern Florida $78.84 $3.46 $7.88 $9.88 $3.94 $104.00 $3,120.00
Broward $80.00 $4.00 $8.00 $13.50 $4.00 $109.50 $3,285.00
Central Florida $79.60 $3.98 $7.96 $11.58 $3.98 $107.10 $3,213.00
Chipola $78.84 $5.50 $6.00 $8.00 $3.66 $102.00 $3,060.00
Daytona $80.84 $3.94 $7.88 $7.88 $3.94 $104.48 $3,134.40
FL SouthWestern $81.21 $4.07 $8.13 $13.88 $4.07 $111.36 $3,340.80
Fla SC at Jax $82.78 $4.14 $4.15 $9.67 $4.14 $104.88 $3,146.40
Florida Keys $82.78 $4.14 $8.28 $9.88 $4.14 $109.22 $3,276.60
Gulf Coast $72.92 $3.65 $7.29 $7.29 $3.65 $94.80 $2,844.00
Hillsborough $80.45 $4.03 $7.23 $8.23 $3.91 $103.85 $3,115.50
Indian River $81.21 $4.06 $5.00 $9.50 $4.06 $103.83 $3,114.90
Florida Gateway $78.94 $5.53 $6.25 $7.89 $3.71 $102.32 $3,069.60
Lake Sumter $81.20 $5.03 $7.56 $7.88 $4.06 $105.73 $3,171.90
State College FL $78.84 $3.94 $7.88 $7.88 $3.94 $102.48 $3,074.40
Miami Dade $82.78 $4.14 $8.28 $15.88 $4.14 $115.22 $3,456.60
North Florida $76.00 $5.30 $6.50 $8.20 $3.80 $99.80 $2,994.00
Northwest FL $82.77 $3.86 $0.00 $13.52 $3.86 $104.01 $3,120.30
Palm Beach $76.92 $3.84 $5.78 $10.62 $3.84 $101.00 $3,030.00
Pasco-Hernando $76.57 $3.83 $7.66 $13.29 $3.83 $105.18 $3,155.40
Pensacola $79.20 $3.96 $7.92 $9.54 $3.96 $104.58 $3,137.40
Polk $82.78 $4.14 $8.28 $11.88 $4.14 $111.22 $3,336.60
St. Johns River $78.84 $3.51 $7.88 $11.83 $3.94 $106.00 $3,180.00
St. Petersburg $80.94 $4.04 $7.63 $15.10 $4.04 $111.75 $3,352.50
Santa Fe $77.98 $3.83 $7.80 $8.66 $3.50 $101.77 $3,053.10
Seminole $79.78 $3.00 $7.88 $7.88 $3.94 $102.48 $3,074.40
South Florida $79.18 $5.54 $7.92 $7.92 $3.96 $104.52 $3,135.60
Tallahassee $76.80 $3.84 $5.35 $11.00 $3.84 $100.83 $3,024.90
Valencia $82.66 $3.83 $7.07 $5.67 $3.83 $103.06 $3,091.80
Weighted Mean $80.52 $3.96 $7.19 $11.11 $3.96 $106.74 $3,202.13
PERA - 7.8T 02/23/2016 12:02:22
Source: 2014-15 College Operating Budgets
Due to rounding, weighted mean total may not equal.

Fact Book 7.9T Florida College System
Student Fees for Lower Level Credit Programs Non-Resident Students
Colleges by Fee Type
Fee per Credit Hour Fall 2014-15
College
Tuition
Out-of-State Fee
Student Financial Aid Fee
Student Activity Fee
Capital Improvement Fee
Technology Fee
Total
Fall 2015 Fees for
Academic Year
(30 Hours)
Eastern Florida $78.84 $236.69 $3.46 $7.88 $63.11 $15.78 $405.76 $12,172.80
Broward $80.00 $226.40 $15.30 $8.00 $19.60 $15.30 $364.60 $10,938.00
Central Florida $79.60 $238.80 $15.92 $7.96 $63.68 $15.92 $421.88 $12,656.40
Chipola $78.84 $194.35 $5.50 $6.00 $8.00 $3.66 $296.35 $8,890.50
Daytona $80.84 $236.69 $15.78 $7.88 $49.83 $15.78 $406.80 $12,204.00
FL SouthWestern $81.21 $243.79 $16.25 $8.13 $65.00 $16.25 $430.63 $12,918.90
Fla SC at Jax $82.78 $248.33 $16.56 $4.15 $32.89 $16.56 $401.27 $12,038.10
Florida Keys $82.78 $248.33 $16.56 $8.28 $66.22 $16.56 $438.73 $13,161.90
Gulf Coast $72.92 $221.42 $14.72 $7.29 $24.69 $14.72 $355.76 $10,672.80
Hillsborough $80.45 $241.54 $16.10 $7.23 $18.12 $15.63 $379.07 $11,372.10
Indian River $81.21 $243.78 $16.25 $5.00 $28.00 $16.25 $390.49 $11,714.70
Florida Gateway $78.94 $236.82 $22.10 $6.25 $31.58 $14.88 $390.57 $11,717.10
Lake Sumter $81.20 $248.33 $23.06 $7.56 $65.91 $16.48 $442.54 $13,276.20
State College FL $78.84 $236.69 $15.78 $7.88 $31.55 $15.78 $386.52 $11,595.60
Miami Dade $82.78 $248.33 $16.56 $8.28 $27.00 $16.56 $399.51 $11,985.30
North Florida $76.00 $228.00 $14.40 $6.50 $57.00 $14.40 $396.30 $11,889.00
Northwest FL $82.77 $248.31 $15.42 $0.00 $36.10 $15.42 $398.02 $11,940.60
Palm Beach $76.92 $226.65 $15.15 $5.78 $23.35 $15.15 $363.00 $10,890.00
Pasco-Hernando $76.57 $232.49 $15.45 $7.66 $53.43 $15.45 $401.05 $12,031.50
Pensacola $79.20 $237.60 $15.84 $7.92 $63.36 $15.84 $419.76 $12,592.80
Polk $82.78 $248.33 $16.56 $8.28 $35.55 $16.56 $408.06 $12,241.80
St. Johns River $78.84 $236.69 $14.20 $7.88 $33.55 $15.78 $386.94 $11,608.20
St. Petersburg $80.94 $242.97 $16.20 $7.63 $22.96 $16.20 $386.90 $11,607.00
Santa Fe $77.98 $231.12 $15.33 $7.80 $31.67 $14.00 $377.90 $11,337.00
Seminole $79.78 $236.69 $14.84 $7.88 $25.00 $15.78 $379.97 $11,399.10
South Florida $79.18 $237.54 $22.16 $7.92 $31.67 $15.84 $394.31 $11,829.30
Tallahassee $76.80 $230.40 $15.36 $5.35 $33.00 $15.36 $376.27 $11,288.10
Valencia $82.66 $247.87 $15.34 $7.07 $22.68 $15.34 $390.96 $11,728.80
Weighted Mean $80.52 $240.13 $15.47 $7.22 $30.34 $15.69 $389.53 $11,685.95
PERA - 7.9T 02/23/2016 11:54:59
Source: 2014-15 College Operating Budgets
Due to rounding, weighted mean total may not equal.
Note: Beginning in 2012-13, the nonresident tuition weighted mean will be the same as resident tuition weighted mean.

Fact Book 7.10T Florida College System
Student Fee Comparison for Lower Level Credit Programs
Resident and Non-Resident Student Fees by College Fall 2013-14 and Fall 2014-15
Resident Students Non-Resident Students
College Fall 2014 Actual Fees Fall 2015 Actual Fees %Increase Fall 2014 Actual Fees Fall 2015 Actual Fees %Increase
Eastern Florida $3,120 $3,120 0.00% $12,173 $12,173 0.00%
Broward $3,057 $3,285 7.46% $10,710 $10,938 2.13%
Central Florida $3,213 $3,213 0.00% $12,656 $12,656 0.00%
Chipola $3,060 $3,060 0.00% $8,891 $8,891 0.00%
Daytona $3,134 $3,134 0.00% $12,204 $12,204 0.00%
FL SouthWestern $3,281 $3,341 1.83% $12,979 $12,919 -0.46%
Fla SC at Jax $3,086 $3,146 1.94% $11,978 $12,038 0.50%
Florida Keys $3,277 $3,277 0.00% $13,162 $13,162 0.00%
Gulf Coast $2,844 $2,844 0.00% $10,673 $10,673 0.00%
Hillsborough $3,116 $3,116 0.00% $11,372 $11,372 0.00%
Indian River $3,115 $3,115 0.00% $11,715 $11,715 0.00%
Florida Gateway $3,070 $3,070 0.00% $11,717 $11,717 0.00%
Lake Sumter $3,172 $3,172 0.00% $13,276 $13,276 0.00%
State College FL $3,074 $3,074 0.00% $11,596 $11,596 -0.00%
Miami Dade $3,397 $3,457 1.77% $11,925 $11,985 0.50%
North Florida $2,994 $2,994 0.00% $11,889 $11,889 0.00%
Northwest FL $3,124 $3,120 -0.11% $11,434 $11,941 4.43%
Palm Beach $2,948 $3,030 2.80% $10,740 $10,890 1.40%
Pasco-Hernando $3,155 $3,155 0.00% $12,032 $12,032 0.00%
Pensacola $3,137 $3,137 0.00% $12,593 $12,593 0.00%
Polk $3,337 $3,337 0.00% $12,242 $12,242 0.00%
St. Johns River $3,180 $3,180 0.00% $11,608 $11,608 0.00%
St. Petersburg $3,293 $3,353 1.82% $11,547 $11,607 0.52%
Santa Fe $3,053 $3,053 0.00% $11,337 $11,337 0.00%
Seminole $3,074 $3,074 0.00% $11,399 $11,399 0.00%
South Florida $3,136 $3,136 0.00% $11,829 $11,829 0.00%
Tallahassee $3,025 $3,025 0.00% $11,288 $11,288 0.00%
Valencia $3,092 $3,092 0.00% $11,729 $11,729 0.00%
Weighted Mean $3,156 $3,202 1.45% $11,605 $11,686 0.70%
PERA - 7.10T 02/23/2016 12:04:27
Source: 2013-14 and 2014-15 College Operating Budgets
Note: Student fees are calculated based on 30 credit hours.
Note: The fees include tuition, financial aid, student activity, out-of-state, capital improvement, and technology fees.

Fact Book 7.11T Florida College System
Student Fees for Upper Level Credit Programs Resident Students
Colleges by Fee Type
Fee per Credit Hour Fall 2014-15
College
Tuition
Student Financial Aid Fee
Student Activity Fee
Capital Improvement Fee
Technology Fee
Total Fall &YEAR Fees for Academic
Year (30 Hours)
Eastern Florida $91.79 $4.59 $9.18 $18.36 $4.59 $128.51 $3,855.30
Broward $91.79 $4.59 $9.18 $14.74 $4.59 $124.89 $3,746.70
Central Florida $91.79 $4.59 $9.18 $12.74 $4.59 $122.89 $3,686.70
Chipola $91.79 $5.50 $6.00 $8.00 $3.71 $115.00 $3,450.00
Daytona $91.79 $4.59 $9.18 $10.74 $4.59 $120.89 $3,626.70
FL SouthWestern $91.79 $4.59 $9.18 $13.56 $4.59 $123.71 $3,711.30
Fla SC at Jax $91.79 $4.59 $4.15 $11.40 $4.59 $116.52 $3,495.60
Florida Keys $0.00 $0.00 $0.00 $0.00 $0.00 $0.00 $0.00
Gulf Coast $91.79 $4.37 $4.37 $8.74 $4.37 $113.64 $3,409.20
Hillsborough $0.00 $0.00 $0.00 $0.00 $0.00 $0.00 $0.00
Indian River $91.79 $4.59 $5.39 $10.74 $4.59 $117.10 $3,513.00
Florida Gateway $91.79 $4.59 $9.18 $9.18 $4.59 $119.33 $3,579.90
Lake Sumter $91.79 $6.43 $7.56 $9.88 $4.59 $120.25 $3,607.50
State College FL $91.79 $4.37 $6.55 $6.56 $2.81 $112.08 $3,362.40
Miami Dade $91.79 $4.59 $9.18 $16.74 $4.59 $126.89 $3,806.70
North Florida $0.00 $0.00 $0.00 $0.00 $0.00 $0.00 $0.00
Northwest FL $91.79 $4.59 $6.88 $14.74 $4.59 $122.59 $3,677.70
Palm Beach $91.79 $4.59 $9.18 $12.70 $4.59 $122.85 $3,685.50
Pasco-Hernando $91.79 $4.59 $9.18 $15.93 $4.59 $126.08 $3,782.40
Pensacola $91.79 $4.59 $9.18 $10.74 $4.59 $120.89 $3,626.70
Polk $91.79 $4.59 $9.18 $12.74 $4.59 $122.89 $3,686.70
St. Johns River $91.79 $4.51 $9.18 $12.68 $4.59 $122.75 $3,682.50
St. Petersburg $91.79 $4.59 $9.18 $12.55 $4.59 $122.70 $3,681.00
Santa Fe $91.79 $4.59 $9.18 $11.18 $4.59 $121.33 $3,639.90
Seminole $91.79 $4.37 $8.74 $8.74 $4.37 $118.01 $3,540.30
South Florida $91.79 $4.59 $9.18 $9.18 $4.59 $119.33 $3,579.90
Tallahassee $0.00 $0.00 $0.00 $0.00 $0.00 $0.00 $0.00
Valencia $91.79 $3.83 $7.07 $5.67 $3.83 $112.19 $3,365.70
Weighted Mean $91.79 $4.58 $8.12 $12.55 $4.52 $121.56 $3,646.71
PERA - 7.11T 02/23/2016 11:57:35
Source: 2014-15 College Operating Budgets
Due to rounding, weighted mean total may not equal.

Fact Book 7.12T Florida College System
Student Fees for Upper Level Credit Programs Non-Resident Students
Colleges by Fee Type
Fee per Credit Hour Fall 2014-15
College
Tuition
Out-of-State Fee
Student Financial Aid Fee
Student Activity Fee
Capital Improvement Fee
Technology Fee
Total
Fall 2015 Fees for
Academic Year
(30 Hours)
Eastern Florida $91.79 $292.63 $19.22 $9.18 $76.88 $19.22 $508.92 $15,267.60
Broward $91.79 $384.72 $23.83 $9.18 $50.10 $23.83 $583.45 $17,503.50
Central Florida $91.79 $340.20 $21.60 $9.18 $86.40 $21.60 $570.77 $17,123.10
Chipola $91.79 $194.35 $5.50 $6.00 $8.00 $3.71 $309.35 $9,280.50
Daytona $91.79 $468.00 $4.59 $9.18 $55.98 $4.59 $634.13 $19,023.90
FL SouthWestern $91.79 $511.41 $30.16 $9.18 $120.64 $30.16 $793.34 $23,800.20
Fla SC at Jax $91.79 $239.32 $16.56 $4.15 $32.89 $16.56 $401.27 $12,038.10
Florida Keys $0.00 $0.00 $0.00 $0.00 $0.00 $0.00 $0.00 $0.00
Gulf Coast $91.79 $436.86 $26.21 $4.37 $34.95 $26.21 $620.39 $18,611.70
Hillsborough $0.00 $0.00 $0.00 $0.00 $0.00 $0.00 $0.00 $0.00
Indian River $91.79 $377.84 $16.33 $5.39 $21.22 $23.47 $536.04 $16,081.20
Florida Gateway $91.79 $275.37 $18.36 $9.18 $36.72 $18.36 $449.78 $13,493.40
Lake Sumter $91.79 $275.37 $25.70 $7.56 $39.52 $18.36 $458.30 $13,749.00
State College FL $91.79 $275.00 $18.12 $6.55 $34.06 $16.56 $442.08 $13,262.40
Miami Dade $91.79 $357.00 $22.44 $9.18 $30.12 $22.44 $532.97 $15,989.10
North Florida $0.00 $0.00 $0.00 $0.00 $0.00 $0.00 $0.00 $0.00
Northwest FL $91.79 $275.37 $18.36 $6.88 $40.10 $18.36 $450.86 $13,525.80
Palm Beach $91.79 $435.15 $4.59 $9.18 $12.70 $4.59 $558.00 $16,740.00
Pasco-Hernando $91.79 $275.37 $18.36 $9.18 $63.71 $18.36 $476.77 $14,303.10
Pensacola $91.79 $275.37 $18.36 $9.18 $73.43 $18.36 $486.49 $14,594.70
Polk $91.79 $289.31 $19.06 $9.18 $40.30 $19.06 $468.70 $14,061.00
St. Johns River $91.79 $373.36 $23.18 $9.18 $47.24 $23.25 $568.00 $17,040.00
St. Petersburg $91.79 $275.53 $18.37 $9.18 $12.55 $18.37 $425.79 $12,773.70
Santa Fe $91.79 $595.03 $34.34 $9.18 $11.18 $34.34 $775.86 $23,275.80
Seminole $91.79 $262.26 $17.48 $8.74 $25.00 $17.48 $422.75 $12,682.50
South Florida $91.79 $275.37 $18.36 $9.18 $36.72 $18.36 $449.78 $13,493.40
Tallahassee $0.00 $0.00 $0.00 $0.00 $0.00 $0.00 $0.00 $0.00
Valencia $91.79 $275.37 $15.34 $7.07 $22.68 $15.34 $427.59 $12,827.70
Weighted Mean $91.79 $341.34 $18.40 $8.12 $35.51 $18.99 $514.15 $15,424.46
PERA - 7.12T 02/23/2016 11:57:43
Source: 2014-15 College Operating Budgets
Due to rounding, weighted mean total may not equal.

Fact Book 7.13T Florida College System
Student Fee Comparison for Upper Level Credit Programs
Resident and Non-Resident Student Fees by College Fall 2013-14 and Fall 2014-15
Resident Students Non-Resident Students
College Fall 2014 Actual Fees Fall 2015 Actual Fees %Increase Fall 2014 Actual Fees Fall 2015 Actual Fees %Increase
Eastern Florida $3,855 $3,855 0.00% $15,268 $15,268 0.00%
Broward $3,687 $3,747 1.63% $17,444 $17,504 0.34%
Central Florida $3,687 $3,687 0.00% $17,123 $17,123 0.00%
Chipola $3,450 $3,450 0.00% $9,281 $9,281 0.00%
Daytona $3,627 $3,627 0.00% $19,024 $19,024 0.00%
FL SouthWestern $3,651 $3,711 1.64% $23,800 $23,800 0.00%
Fla SC at Jax $3,436 $3,496 1.75% $11,978 $12,038 0.50%
Florida Keys $0 $0 0.00% $0 $0 0.00%
Gulf Coast $3,409 $3,409 0.00% $18,612 $18,612 0.00%
Hillsborough $0 $0 0.00% $0 $0 0.00%
Indian River $3,513 $3,513 0.00% $16,081 $16,081 0.00%
Florida Gateway $3,580 $3,580 0.00% $13,493 $13,493 0.00%
Lake Sumter $3,608 $3,608 0.00% $13,749 $13,749 0.00%
State College FL $3,362 $3,362 0.00% $13,262 $13,262 0.00%
Miami Dade $3,747 $3,807 1.60% $15,929 $15,989 0.38%
North Florida $0 $0 0.00% $0 $0 0.00%
Northwest FL $3,678 $3,678 0.00% $13,526 $13,526 0.00%
Palm Beach $3,626 $3,686 1.65% $16,680 $16,740 0.36%
Pasco-Hernando $3,782 $3,782 0.00% $14,303 $14,303 0.00%
Pensacola $3,627 $3,627 0.00% $14,595 $14,595 0.00%
Polk $3,687 $3,687 0.00% $14,061 $14,061 0.00%
St. Johns River $3,683 $3,683 0.00% $17,040 $17,040 0.00%
St. Petersburg $3,621 $3,681 1.66% $12,714 $12,774 0.47%
Santa Fe $3,640 $3,640 0.00% $23,276 $23,276 0.00%
Seminole $3,540 $3,540 0.00% $12,683 $12,683 0.00%
South Florida $3,580 $3,580 0.00% $13,493 $13,493 0.00%
Tallahassee $0 $0 0.00% $0 $0 0.00%
Valencia $3,366 $3,366 0.00% $12,828 $12,828 0.00%
Weighted Mean $3,610 $3,647 1.02% $15,393 $15,424 0.20%
PERA - 7.13T 02/23/2016 12:01:59
Source: 2013-14 and 2014-15 College Operating Budgets
Note: Student fees are calculated based on 30 credit hours.
Note: The fees include tuition, financial aid, student activity, out-of-state, capital improvement, and technology fees.

Fact Book 7.14T Florida College System
Facilities Sites, Inventory, and Value by College
2014-15
College
Number of Sites
Total
Operating
Campuses
Total Acres*
Total
Owned
Buildings**
Owned Total Gross Sq. Ft. **
Building Values ***
Content Values ***
Combined Values***
Eastern Florida 6 4 543 51 1,893,244 $295,671,095 $30,232,338 $325,903,433
Broward 11 3 419 124 2,683,451 $449,758,277 $67,474,996 $517,233,273
Central Florida 7 1 336 68 883,765 $158,079,940 $28,112,215 $186,192,155
Chipola 2 1 165 51 585,325 $94,267,923 $13,777,520 $108,045,443
Daytona 7 2 556 87 1,756,194 $302,932,655 $31,190,041 $334,122,696
FL SouthWestern 4 3 412 85 1,221,102 $215,691,336 $30,826,531 $246,517,867
Fla SC at Jax 10 4 844 109 3,045,288 $798,985,009 $69,156,010 $868,141,019
Florida Keys 4 1 127 19 285,182 $49,464,841 $3,790,950 $53,255,791
Gulf Coast 5 1 265 42 709,568 $143,465,926 $30,795,307 $174,261,233
Hillsborough 12 5 851 69 1,770,889 $290,667,549 $38,926,278 $329,593,827
Indian River 7 1 713 78 1,428,832 $319,704,226 $69,300,900 $389,005,126
Florida Gateway 6 1 146 66 474,038 $65,052,556 $18,436,137 $83,488,693
Lake Sumter 3 2 276 28 516,198 $87,405,829 $21,077,987 $108,483,816
State College FL 3 2 205 60 811,348 $149,598,603 $28,139,810 $177,738,413
Miami Dade 11 8 497 168 6,681,033 $875,414,274 $104,008,232 $979,422,506
North Florida 2 1 166 27 227,084 $35,593,901 $4,189,498 $39,783,399
Northwest FL 6 1 533 61 1,026,442 $156,193,991 $34,258,581 $190,452,572
Palm Beach 5 3 377 134 1,919,680 $278,129,033 $36,151,414 $314,280,447
Pasco-Hernando 6 3 601 94 1,119,402 $175,885,951 $35,286,586 $211,172,537
Pensacola 7 3 631 59 1,302,764 $191,390,009 $29,926,377 $221,316,386
Polk 7 2 259 30 937,850 $137,349,184 $24,394,222 $161,743,406
St. Johns River 3 3 291 43 597,562 $103,290,664 $16,587,692 $119,878,356
St. Petersburg 12 4 404 167 2,649,838 $435,956,034 $42,819,255 $478,775,289
Santa Fe 7 1 277 63 1,047,048 $196,711,638 $24,613,883 $221,325,521
Seminole 5 3 741 58 1,350,939 $230,291,548 $44,255,976 $274,547,524
South Florida 7 1 310 87 639,076 $107,832,054 $7,712,697 $115,544,751
Tallahassee 6 1 1,730 85 2,039,906 $247,090,166 $54,196,351 $301,286,517
Valencia 10 5 693 93 2,349,377 $390,513,780 $81,303,016 $471,816,796
System 181 70 13,369 2,106 41,952,425 $6,982,387,992 $1,020,940,800 $8,003,328,792
PERA - 7.14T 02/23/2016 11:57:50
Source: Value Information: Florida College System Risk Management Consortium, dated 12/10/2013 (all colleges except Florida State College at Jacksonville)
Source: Value Information: Florida State College at Jacksonville, dated 1/10/2014
*Note: Includes leased.
**Note: Includes covered walks.
***Note: Building and content values do not include builders risk, owned fine art, vehicle or watercraft values.

Glossary

Glossary
Glossary Refer to the following website for a complete set of terms and acronyms: http://www.fldoe.org/schools/higher-ed/fl-college-system/glossary.stml

Florida College System Department of Education • 501 Turlington Building • 325 W. Gaines Street • Tallahassee, Florida 32399-0400
http://www.fldoe.org/schools/higher-ed/fl-college-system/


![Florida Department of Educationfldoe.org/core/fileparse.php/7478/urlt/2013gr8anchorset.pdfrearrangement of sentences would scarcely affect meaning ([Suntown] is a nice small town,](https://static.fdocuments.us/doc/165x107/5e6aecb4a1d9bb3cb539758c/florida-department-of-rearrangement-of-sentences-would-scarcely-affect-meaning-suntown.jpg)