2016 Edition by Clyde Wayne Crews Jr. Crews - Ten Thousand... · In January 2016, the Congressional...
89
2016 An Annual Snapshot of the Federal Regulatory State CLYDE WAYNE CREWS JR. CEI
Transcript of 2016 Edition by Clyde Wayne Crews Jr. Crews - Ten Thousand... · In January 2016, the Congressional...

The Competitive Enterprise Institute
promotes the institutions of liberty and
works to remove government-created
barriers to economic freedom, innovation,
and prosperity through timely analysis,
effective advocacy, inclusive coalition-
building, and strategic litigation.
COMPETITIVE ENTERPRISE INSTITUTE
1899 L Street NW, 12th Floor
Washington, DC 20036
202-331-1010
cei.org
2016An Annual Snapshot of the Federal Regulatory State
CLYDE WAYNE CREWS JR.
TEN TH
OU
SAN
D CO
MM
AN
DM
ENTS
CREW
SCEI

Crews: Ten Thousand Commandments 2016 1
In January 2016, the Congressional Budget Office (CBO) reported outlays for fiscal year (FY) 2015 of $3.687 trillion and projected spending for FY 2016 at $3.919 trillion.1 Discretionary, entitlement, and interest spending is projected to surpass $4 trillion in 2017 and to top $5 trillion by FY 2022.2 High debt and deficits notwithstanding, $5 trillion in annual spending will soon be the new normal.
Revenue is not expected to cover spending at any point in the coming decade. Once unthinkable, trillion-dollar deficits became an annual occurrence during the economic downturn between 2009 and 2012,3 and the CBO projects that deficits will exceed $1 tril-lion again by FY 2022.4 In the near term, President Obama’s more optimistic 2017 bud-get projects smaller deficits than recent highs, yet the $503 billion deficit projected for 2017 is expected to hit $660 billion in 2022 with no hint of balance anywhere in sight.5
Such sums once typified the level of budgets themselves rather than shortfalls. Granted,
numerous other countries’ national govern-ment outlays consume a greater share of their national output, compared with about 20 percent for the U.S. federal government, but in absolute terms, the U.S. government is the largest government on the planet.6 Only six other nations top $1 trillion in annual gov-ernment revenues, and none but the United States and recently China collect more than $2 trillion.7
Alongside spending, regulations are another way the federal government heavily influ-ences society. Like federal spending, regu-lations and their costs should be closely tracked and disclosed annually. Then, pe-riodic housecleaning should be performed. The limited cost-benefit analysis at the agency level covers only a fraction of rules.8
Among the problems with cost-benefit anal-ysis is that it relies primarily on agency self-reporting. Having agencies audit their own rules is like asking students to grade their own exams. Regulators are disinclined to un-derscore when a rule’s benefits do not justify
Ten Thousand Commandments
An Annual Snapshot of the Federal Regulatory State
2016 Edition
by Clyde Wayne Crews Jr.
Executive Summary

2 Crews: Ten Thousand Commandments 2016
its costs. In fact, one could expect agencies to devise new and suspect categories of benefits to justify agency rulemaking activity and new endeavors.9
A major driver of overregulation is the en-trenched overdelegation of rulemaking power to agencies. Requiring expedited votes on economically significant or controver-sial agency rules before they become binding would help reestablish congressional ac-countability and affirm the principle of “no regulation without representation.”
Openness about regulatory facts and fig-ures can be bolstered through federal regu-latory transparency report cards, similar to the presentation in the annual Ten Thousand Commandments report.10 These report cards could be officially issued each year to distill information for the public and policy makers about the scope of the regulatory state.
Regulation: The Hidden Tax
The national debt now stands at $18.9 tril-lion.11 That is alarming. Yet the federal government’s reach extends well beyond Washington’s taxes, deficits, and borrowing. Federal environmental, safety and health, and economic regulations affect the economy by hundreds of billions—even trillions—of dollars annually in addition to the offi-cial dollar outlays that dominate the federal policy debate.
Firms generally pass the costs of some taxes along to consumers.12 Likewise, some regula-tory compliance costs borne by businesses will find their way into the prices consum-ers pay, affect the wages workers earn, and lead to lower levels of growth and prosper-ity. Precise regulatory costs can never be fully known because, unlike taxes, they are unbudgeted and often indirect.13 But scat-tered government and private data exist about the number of regulations issued, their costs and effects, and the agencies that issue them. Compiling some of that information can make the federal regulatory enterprise
somewhat more comprehensible. That com-pilation is one purpose of Ten Thousand Commandments, highlights of which follow:
• Based on federal government data, past reports, and contemporary studies, this report highlights regulatory compliance and economic impacts of federal inter-vention of $1.885 trillion annually.14
• The Weidenbaum Center at Washington University in St. Louis and the Regula-tory Studies Center at George Washing-ton University in Washington, D.C., jointly estimate that agencies spent $63 billion in 2015 to administer and police the regulatory enterprise. Adding the $1.885 trillion in off-budget compliance costs brings the total reckoned regula-tory enterprise to about $1.948 trillion.
• If it were a country, U.S. regulation would be the ninth-largest economy, ranking behind India and ahead of Russia.
• U.S. regulatory costs fall between the gross domestic products (GDPs) of Canada and the United Kingdom, the highest-income nations among the countries ranked most free in the annual Index of Economic Freedom and Economic Freedom of the World reports.
• In 2015, 114 laws were enacted by Congress during the calendar year, while 3,410 rules were issued by agencies.15 Thus, 30 rules were issued for every law enacted last year. This “Unconstitutional-ity Index,” the ratio of regulations issued by agencies to laws passed by Congress and signed by the president, had been 16 in 2014 and 51 in 2013. The average for the decade has been 26. This disparity highlights the delegation of lawmaking power to unelected agency officials.
• If one assumed that all costs of federal regulation and intervention flowed all the way down to households, U.S. house-holds would “pay” $14,842 annually on average in a regulatory hidden tax. That payment amounts to 22 percent of the average income of $66,877 and 28 percent of the expenditure budget of $53,495. The “tax” exceeds every item in the budget except housing. More is
If it were a country, U.S.
regulation would be the ninth-
largest economy, ranking behind
India and ahead of Russia.
Crews: Ten Thousand Commandments 2016 3
“spent” on embedded regulation than on health care, food, transportation, enter-tainment, apparel, services, and savings.
• The estimated cost of regulation is equivalent to half the level of federal spending itself, which was $3.687 tril-lion in 2015.
• Regulatory costs of $1.88 trillion amount to 11 percent of U.S. GDP, which was estimated at $17.9 trillion in 2015 by the Commerce Department’s Bureau of Economic Analysis.
• When regulatory costs are combined with federal FY 2015 outlays of $3.687 trillion, the federal government’s share of the entire economy reaches 31.1 percent. This does not include state and local spending and regulation.
• The costs of the regulatory hidden tax surpass federal individual and corporate income tax receipts, which total $1.82 trillion combined. – Regulatory compliance costs exceed
2015 estimated individual income tax revenues of $1.478 trillion.
– Regulatory compliance costs vastly exceed the 2015 estimated U.S. corporate income tax revenues of $341.7 billion.
• Regulatory costs rival corporate pretax profits of $2.208 trillion.
• The Federal Register finished 2015 at 80,260 pages, the third-highest level in its history.
• Of the seven all-time-high Federal Regis-ter page counts, six have occurred under President Obama.
• Federal Register pages devoted specifically to final rules stand at 24,694 in 2015. The record high was 26,417 in 2013.
• The 2015 Federal Register contained 3,410 final rules and 2,342 proposed rules.
• The annual outflow of more than 3,400 final rules—sometimes far above that level—means that 94,246 rules have been issued since 1993 when the first edition of Ten Thousand Commandments was published.
• President George W. Bush’s administra-tion averaged 63 “major” rules (a broader category than “economically significant”)
annually during his eight years in of-fice. President Obama’s seven years so far have averaged 81, or a 29 percent higher average annual output than that of Bush. Obama has already issued 570 major rules during his seven years, compared with Bush’s 505 over eight years.
• Since the nation’s founding, more than 15,236 executive orders have been is-sued. President Obama had issued 244 as of the end of 2015.
• President Bush published 129 memo-randa over his entire presidency, whereas Obama issued 219 that were published in the Federal Register during his first seven years.
• Whereas the federal government issues more than 3,400 rules annually, public notices in the Federal Register normally exceed 24,000 annually, with uncounted “guidance documents” and other procla-mations with potential regulatory effect among them. There were 24,393 notices in 2015, and there have been 526,292 since 1995.
• As for the current regulatory pipeline, 60 federal departments, agencies, and com-missions have 3,297 regulatory actions at various stages of implementation, according to the fall 2015 “Regulatory Plan and the Unified Agenda of Federal Regulatory and Deregulatory Actions.”
• Of the 3,297 regulations in the pipeline, 218 are “economically significant” rules, which the federal government defines as having annual effects on the economy of $100 million or more. Assuming that those rule-making effects are primarily regulatory rather than deregulatory im-plies roughly $22 billion yearly in future off-budget regulatory costs in the works.
• For completed economically significant rules (a narrower category than “major”), the average for Obama’s seven years so far is 67; George W. Bush’s average over his eight years was 49.
• Of the 3,297 regulations now in the works, 674 affect small businesses. Of those, 386 required a regulatory flex-ibility analysis, up from 374 last year. An additional 288 were otherwise noted by agencies to affect small businesses

4 Crews: Ten Thousand Commandments 2016
in some fashion. While the combined reported number of rules affecting small business is down recently, the average of Obama’s seven years so far, 406, exceeds Bush’s eight-year average of 377.
• The five most active rule-producing en-tities—the Departments of the Treasury, the Interior, Commerce, Health and Human Services, and Transportation—account for 1,348 rules, or 41 percent of all rules in the Unified Agenda pipeline.
• The Environmental Protection Agency (EPA), which until two years ago ranked consistently in the top five, is now sixth. But adding the EPA’s 188 rules brings the total from the top six rulemaking agencies to 1,639 rules, or 46 percent of all federal rules.
Reducing overspending and relieving regula-tory burdens are vital to the nation’s eco-nomic health. The short-lived series of budget surpluses from 1998 to 2001 now seem like ancient history. Mounting pres-sures to restrain spending budgets can in-centivize lawmakers to impose off-budget regulations on the private sector rather than add to unpopular deficit spending. Unlike on-budget spending, the regulatory costs remain largely hidden from public view, a feature that can make regulation overly at-tractive to lawmakers. For example, a new government program like job training could involve either increasing government spend-ing or imposing new regulations that require businesses to provide such training.

Crews: Ten Thousand Commandments 2016 5
Introduction: Toward a Rational Regulatory Budget
Congress’s spending disclosure and account-ability, although imperfect, are necessary conditions for holding the federal govern-ment accountable to voters. Washington funds its programs either by raising taxes or by borrowing—with a promise to repay with interest—from future tax collections. However controversial government spend-ing programs may be, taxpayers can inspect costs in the federal budget’s historical tables16 and Congressional Budget Office (CBO) publications.17
However, the government can also “fund” objectives and programs through regulatory compliance. Rather than pay directly and book expenses for new initiatives, federal regulations can compel the private sector, as well as state and local governments, to bear the costs of federal initiatives.
Regulatory compliance and economic im-pact costs are not budgeted and lack the formal public disclosure that accompanies federal spending. Therefore, regulatory ini-tiatives can enable federal commandeering of private sector resources with compara-tively little public fuss, rendering regulation a form of off-budget taxation. Policy makers find it easier to impose regulatory costs than to embark on more government spending because of the former’s lack of disclosure and accountability for costs. Furthermore, where regulatory compliance costs prove burden-some, Congress can escape accountability by
blaming an agency for issuing an unpopular rule.
Table 1 provides some perspective on the regulatory “tax” by presenting summary data for selected topics described in Ten Thousand Commandments. Trends over recent years are provided where information is available.
The 2016 edition of Ten Thousand Com-mandments contains four main sections:
1. An overview of the costs and scope of the regulatory state, such as its esti-mated size compared with federal bud-getary components and gross domestic product (GDP).
2. An analysis of trends in the numbers of regulations issued by agencies, based on information provided in the Federal Register and in the “Regulatory Plan and Unified Agenda of Federal Regula-tory and Deregulatory Actions.”
3. Recommendations for reform that emphasize improving congressional accountability for rulemaking. This section offers steps to (a) improve regulatory disclosures through a regu-latory transparency report card and (b) increase congressional responsibility to voters for costly and controversial rules.
4. An appendix containing historical tables of regulatory trends over past decades.
Rather than pay directly and book expenses for new initiatives, federal regulations can
compel the private sector, as well as state and local governments, to bear the costs of federal initiatives.

6 Crews: Ten Thousand Commandments 2016
Year-End 2015
1-Year Change
5-Year Change (2011–2015)
10-Year Change (2006–2015)
Total regulatory costs $1.886 trillion 1.0% n/a n/aAgency enforcement budgets $63.0 billion 4.3% 4.6% 28.1%Federal Register pages 80,260 3.3% –1.2% 7.1%
Devoted to final rules 24,694 –0.7% –6.0% 10.5%Federal Register final rules 3,410 –4.1% –10.4% –8.3%Code of Federal Regulations pages 178,277 –0.6% 5.3% 15.7%Total rules in Agenda pipeline 3,297 –3.5% –20.1% –18.6%
Completed 554 –11.9% –45.1% –34.9%Active 2,244 –3.3% –16.1% –6.1%Long term 499 7.3% 12.9% –38.5%
“Economically significant” rules in the year-end pipeline 218 9.0% 2.8% 54.6%
Completed 36 16.1% –20.0% 12.5%Active 149 13.7% 8.0% 98.7%Long term 33 –13.2% 13.8% –2.9%
Rules affecting small business 674 0.0% –18.0% –14.4%Regulatory flexibility analysis required 386 3.2% –7.7% –2.4%Regulatory flexibility analysis not required 288 –4.0% –28.7% –29.8%
Rules affecting state governments 409 3.3% –20.0% –24.7%Rules affecting local governments 255 10.4% –19.3% –26.5%GAO Congressional Review Act reports on major rules 76 –6.2% –5.0% 35.7%
EPA BreakdownFinal rules (Federal Register) 579 7.4% 8.6% 14.4%EPA rules in Agenda 188 1.1% –40.9% –49.5%EPA rules affecting small business 12 100.0% –83.6% –87.4%
FCC BreakdownFinal rules (Federal Register) 90 –37.5% –30.8% –52.1%FCC rules in Agenda 132 0.8% 29.1% –4.3%FCC rules affecting small business 99 1.0% 26.9% –8.3%
Table 1. The Regulatory State: A 2015 Overview
Note: n/a = not applicable.
Crews: Ten Thousand Commandments 2016 7
The Cost of Regulation and Intervention
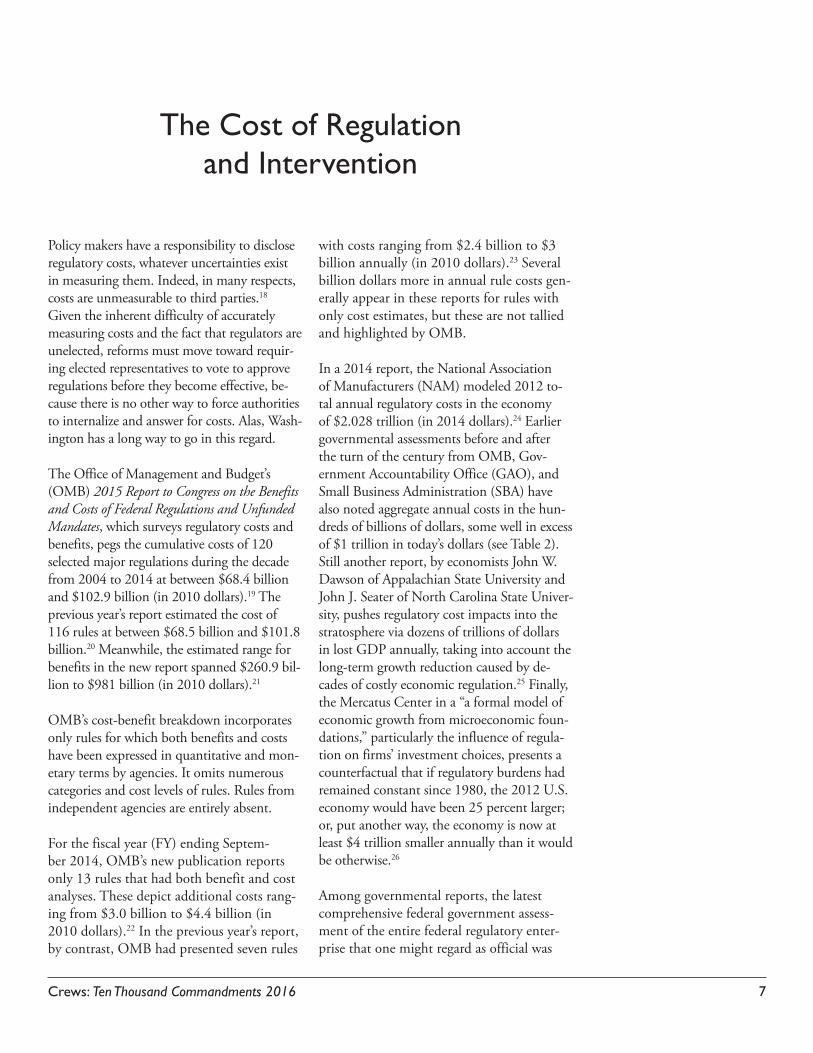
Policy makers have a responsibility to disclose regulatory costs, whatever uncertainties exist in measuring them. Indeed, in many respects, costs are unmeasurable to third parties.18 Given the inherent difficulty of accurately measuring costs and the fact that regulators are unelected, reforms must move toward requir-ing elected representatives to vote to approve regulations before they become effective, be-cause there is no other way to force authorities to internalize and answer for costs. Alas, Wash-ington has a long way to go in this regard.
The Office of Management and Budget’s (OMB) 2015 Report to Congress on the Benefits and Costs of Federal Regulations and Unfunded Mandates, which surveys regulatory costs and benefits, pegs the cumulative costs of 120 selected major regulations during the decade from 2004 to 2014 at between $68.4 billion and $102.9 billion (in 2010 dollars).19 The previous year’s report estimated the cost of 116 rules at between $68.5 billion and $101.8 billion.20 Meanwhile, the estimated range for benefits in the new report spanned $260.9 bil-lion to $981 billion (in 2010 dollars).21
OMB’s cost-benefit breakdown incorporates only rules for which both benefits and costs have been expressed in quantitative and mon-etary terms by agencies. It omits numerous categories and cost levels of rules. Rules from independent agencies are entirely absent.
For the fiscal year (FY) ending Septem-ber 2014, OMB’s new publication reports only 13 rules that had both benefit and cost analyses. These depict additional costs rang-ing from $3.0 billion to $4.4 billion (in 2010 dollars).22 In the previous year’s report, by contrast, OMB had presented seven rules
with costs ranging from $2.4 billion to $3 billion annually (in 2010 dollars).23 Several billion dollars more in annual rule costs gen-erally appear in these reports for rules with only cost estimates, but these are not tallied and highlighted by OMB.
In a 2014 report, the National Association of Manufacturers (NAM) modeled 2012 to-tal annual regulatory costs in the economy of $2.028 trillion (in 2014 dollars).24 Earlier governmental assessments before and after the turn of the century from OMB, Gov-ernment Accountability Office (GAO), and Small Business Administration (SBA) have also noted aggregate annual costs in the hun-dreds of billions of dollars, some well in excess of $1 trillion in today’s dollars (see Table 2). Still another report, by economists John W. Dawson of Appalachian State University and John J. Seater of North Carolina State Univer-sity, pushes regulatory cost impacts into the stratosphere via dozens of trillions of dollars in lost GDP annually, taking into account the long-term growth reduction caused by de-cades of costly economic regulation.25 Finally, the Mercatus Center in a “a formal model of economic growth from microeconomic foun-dations,” particularly the influence of regula-tion on firms’ investment choices, presents a counterfactual that if regulatory burdens had remained constant since 1980, the 2012 U.S. economy would have been 25 percent larger; or, put another way, the economy is now at least $4 trillion smaller annually than it would be otherwise.26
Among governmental reports, the latest comprehensive federal government assess-ment of the entire federal regulatory enter-prise that one might regard as official was

8 Crews: Ten Thousand Commandments 2016
Hop
kins
19
92(1
991
do
llars
)
Gov
ernm
ent
Acc
ount
abili
ty
Offi
ce 1
995
(199
5 do
llars
)
Hop
kins
19
95(1
995
do
llars
)
Smal
l B
usin
ess
Adm
in. 2
001
(200
1
dolla
rs)
Offi
ce o
f M
anag
emen
t &
Bud
get
2002
(200
1 do
llars
)
Smal
l B
usin
ess
Adm
in. 2
005
(200
4
dolla
rs)
Smal
l B
usin
ess
Adm
in. 2
010
Nat
iona
l A
ssoc
iati
on o
f M
anuf
actu
rers
20
14(2
012
dolla
rs)
Envi
ronm
enta
l11
516
819
720
322
128
133
0O
ther
Soc
ial
3655
30Tr
ansp
orta
tion
22
Labo
r22
Econ
omic
Reg
ulat
ion
591
1,23
61,
448
Effic
ienc
y73
8015
0Tr
ansf
ers
130
147
337
Effic
ienc
y -
Dom
estic
101
Tran
sfer
s -
Dom
estic
202
Effic
ienc
y -
Int’l
Tra
de44
Tran
sfer
s -
Int’l
Tra
de88
Wor
kpla
ce a
nd
Hom
elan
d Se
curi
ty82
106
7592
Pape
rwor
k/Pr
oces
s/In
fo C
olle
ctio
n (t
ax
com
plia
nce)
189
218
129
190
195
160
159
Tota
ls:
543
647
668
843
954
1,11
31,
752
2,02
9To
tals
, con
vert
ed t
o 20
13 $
992.
498
1,02
4.71
21,
109.
391,
255.
46
Tabl
e 2.
Ass
essm
ents
of F
eder
al R
egul
atio
n: L
ate
20th
Cen
tury
, Ear
ly 2
1st
Cen
tury
, Bill
ions
of D
olla
rs
Sour
ces:
Tho
mas
D. H
opki
ns, “
Cos
ts o
f Reg
ulat
ion:
Fill
ing
the
Gap
s, R
epor
t pr
epar
ed fo
r th
e R
egul
ator
y In
form
atio
n Se
rvic
e C
ente
r,” W
ashi
ngto
n, D
.C.,
Aug
ust
1992
, htt
p://w
ww
.thec
re
.com
/CO
ST%
20O
F%20
REG
ULA
TIO
N%
20FI
LLIN
G%
20T
HE%
20G
APS
. Gen
eral
Acc
ount
ing
Offi
ce, B
riefi
ng R
epor
t to
the
Ran
king
Min
ority
Mem
ber,
Com
mitt
ee o
n G
over
nmen
tal
Affa
irs,
U.S
. Sen
ate,
Reg
ulat
ory
Ref
orm
: Inf
orm
atio
n on
Cos
ts, C
ost
Effe
ctiv
enes
s, an
d M
anda
ted
Dea
dlin
es fo
r R
egul
atio
ns, (
GA
O/P
EMD
95
18BR
), M
arch
199
5, h
ttp:
//arc
hive
.gao
.gov
/t
2pba
t1/1
5377
4.pd
f. T
hom
as D
. Hop
kins
, “T
he C
hang
ing
Burd
en o
f Reg
ulat
ion,
Pap
erw
ork,
and
Tax
Com
plia
nce
on S
mal
l Bus
ines
s: A
Rep
ort
to C
ongr
ess,”
Offi
ce o
f the
Chi
ef C
ouns
el
for A
dvoc
acy,
U.S
. Sm
all B
usin
ess A
dmin
istr
atio
n, W
ashi
ngto
n, D
.C.,
Oct
ober
199
5, h
ttp:
//ww
w.s
ba.g
ov/a
dvo/
law
s/ar
chiv
e/la
w_b
rd.h
tml.
Offi
ce o
f Man
agem
ent
and
Budg
et, “
Dra
ft R
epor
t to
C
ongr
ess
on t
he C
osts
and
Ben
efits
of F
eder
al R
egul
atio
ns,”
Fede
ral R
egist
er, M
arch
28,
200
2, p
p. 15
037-
1503
8, h
ttp:
//ww
w.w
hite
hous
e.go
v/si
tes/
defa
ult/
files
/om
b/as
sets
/om
b/in
fore
g /c
brep
ort.p
df. W
. Mar
k C
rain
and
Tho
mas
D. H
opki
ns, “
The
Impa
ct o
f Reg
ulat
ory
Cos
ts o
n Sm
all F
irm
s,” r
epor
t pr
epar
ed fo
r th
e Sm
all B
usin
ess A
dmin
istr
atio
n, O
ffice
of A
dvoc
acy,
RFP
No.
SB
AH
Q-0
0-R
-002
7, O
ctob
er 2
001,
htt
p://w
ww
.sba
.gov
/adv
o/re
sear
ch/r
s207
tot.p
df. W
. Mar
k C
rain
, “T
he Im
pact
of R
egul
ator
y C
osts
on
Smal
l Fir
ms,”
rep
ort
prep
ared
for
the
Smal
l Bus
ines
s A
dmin
istr
atio
n, O
ffice
of A
dvoc
acy,
Con
trac
t no
. SBH
Q-0
3-M
-052
2, S
epte
mbe
r 20
05, h
ttps
://w
ww
.sba
.gov
/site
s/de
faul
t/fil
es/fi
les/
rs26
4tot
. Nat
iona
l Ass
ocia
tion
of M
anuf
actu
rers
, “T
he
Cos
t of
Fed
eral
Reg
ulat
ion
to t
he U
.S. E
cono
my,
Man
ufac
turi
ng a
nd S
mal
l Bus
ines
s,” W
. Mar
k C
rain
and
Nic
ole
V. C
rain
, Sep
tem
ber
10, 2
014,
htt
p://w
ww
.nam
.org
/~/m
edia
/A7A
8456
F3
3484
E498
F40C
B46D
6167
F31.
ashx
. Som
e fig
ures
her
e ar
e ad
just
ed t
o 20
13 b
y th
e ch
ange
in t
he c
onsu
mer
pri
ce in
dex
betw
een
2001
and
201
3 (1
.316
), an
d be
twee
n 19
95 a
nd 2
013,
de
rive
d fr
om “
CPI
Det
aile
d R
epor
t D
ata
for A
pril
2014
,” Bu
reau
of L
abor
Sta
tistic
s, W
ashi
ngto
n, D
.C. (
Tabl
e 24
. His
tori
cal C
onsu
mer
Pri
ce In
dex
for A
ll U
rban
Con
sum
ers
(CPI
-U),
U.S
. city
av
erag
e, a
ll ite
ms)
, htt
p://w
ww
.bls
.gov
/cpi
/cpi
d140
4.pd
f.
Crews: Ten Thousand Commandments 2016 9
prepared in September 2010 for the SBA.27 This report, which the SBA presented in sev-eral iterations over the previous decade and a half, has been discontinued. The report esti-mated regulatory compliance costs of $1.752 trillion for 2008 and received significant criticism, to which the authors responded di-rectly and more than adequately.28
The primary purpose of the SBA report series was to examine the extent to which regulatory costs impose higher burdens on small firms, which have higher per-employee regulatory costs than do larger ones. The exercise is vi-tally important, but the federal government now chooses to ignore it. The SBA and earlier OMB surveys traditionally have conveyed reg-ulatory costs using the following categories:
• Economic regulatory costs (for example,market entry restrictions and transferpayments such as price supports thatshift money from one pocket to another)
• Workplace regulatory costs• Environmental regulatory costs• Paperwork costs
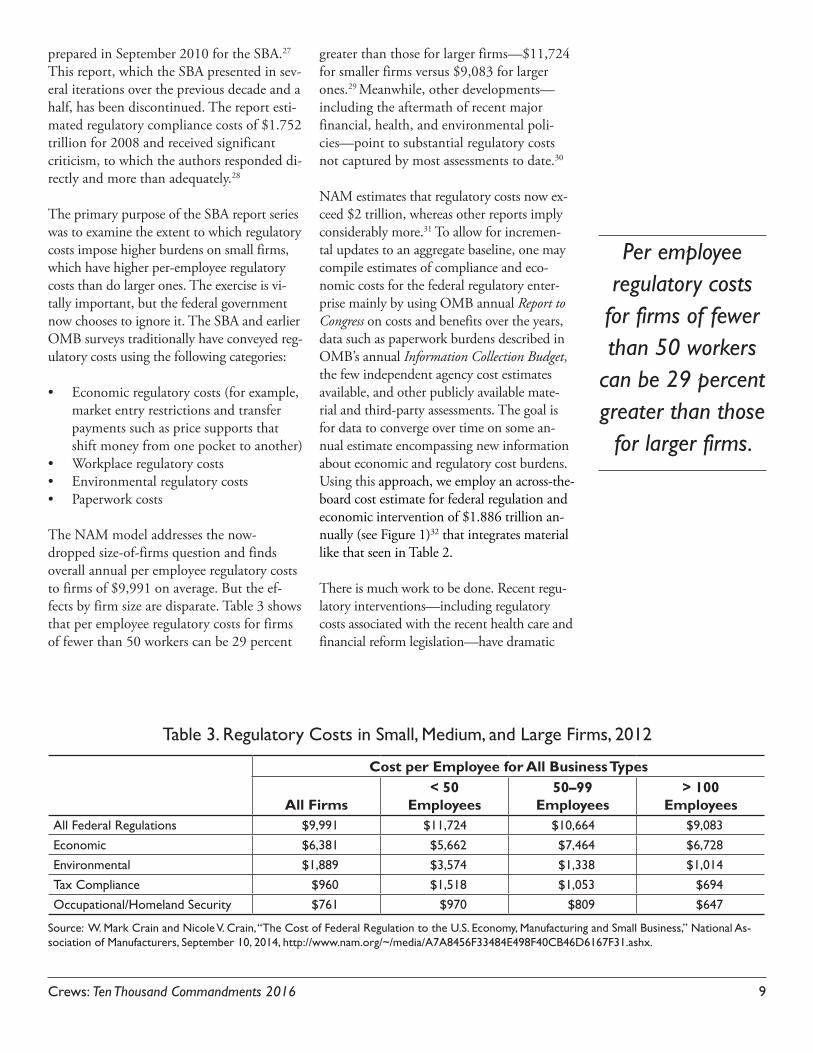
The NAM model addresses the now-dropped size-of-firms question and finds overall annual per employee regulatory costs to firms of $9,991 on average. But the ef-fects by firm size are disparate. Table 3 shows that per employee regulatory costs for firms of fewer than 50 workers can be 29 percent
greater than those for larger firms—$11,724 for smaller firms versus $9,083 for larger ones.29 Meanwhile, other developments—including the aftermath of recent major financial, health, and environmental poli-cies—point to substantial regulatory costs not captured by most assessments to date.30
NAM estimates that regulatory costs now ex-ceed $2 trillion, whereas other reports imply considerably more.31 To allow for incremen-tal updates to an aggregate baseline, one may compile estimates of compliance and eco-nomic costs for the federal regulatory enter-prise mainly by using OMB annual Report to Congress on costs and benefits over the years, data such as paperwork burdens described in OMB’s annual Information Collection Budget, the few independent agency cost estimates available, and other publicly available mate-rial and third-party assessments. The goal is for data to converge over time on some an-nual estimate encompassing new information about economic and regulatory cost burdens. Using this approach, we employ an across-the-board cost estimate for federal regulation and economic intervention of $1.886 trillion an-nually (see Figure 1)32 that integrates material like that seen in Table 2.
There is much work to be done. Recent regu-latory interventions—including regulatory costs associated with the recent health care and financial reform legislation—have dramatic
Per employee regulatory costs
for firms of fewer than 50 workers
can be 29 percent greater than those
for larger firms.
Cost per Employee for All Business Types
All Firms< 50
Employees50–99
Employees> 100
EmployeesAll Federal Regulations $9,991 $11,724 $10,664 $9,083 Economic $6,381 $5,662 $7,464 $6,728 Environmental $1,889 $3,574 $1,338 $1,014 Tax Compliance $960 $1,518 $1,053 $694 Occupational/Homeland Security $761 $970 $809 $647
Table 3. Regulatory Costs in Small, Medium, and Large Firms, 2012
Source: W. Mark Crain and Nicole V. Crain, “The Cost of Federal Regulation to the U.S. Economy, Manufacturing and Small Business,” National As-sociation of Manufacturers, September 10, 2014, http://www.nam.org/~/media/A7A8456F33484E498F40CB46D6167F31.ashx.

10 Crews: Ten Thousand Commandments 2016
economic impacts. Other long-recognized costs, such as indirect costs and the effects of lost innovation or productivity, remain stub-bornly difficult to assess and can produce un-derestimates of the total regulatory burden.33
Regulatory Compliance Costs: Catching Up to Government Spending?
FY 2015 saw a deficit of $439.0 billion on $3.687 trillion in outlays. Figure 2 compares deficits and outlays for 2014–2015 and pro-jected amounts for 2016 with our regulatory cost estimate of $1.88 trillion. In the 2016 bar, note that estimated regulatory compliance costs are equivalent to nearly half the projected
level of fiscal budget outlays and well over three times the anticipated deficit of $544 billion.
Recognizing that off-budget, largely hidden regulatory compliance costs are equivalent to half of all federal outlays is sobering enough, but the situation is more dramatic in Wash-ington’s high-spending culture of perpetual deficits, because regulations constitute a type of off-budget spending in the form of federal mandates—for which the population is com-pelled to bear the cost. That is why looking at outlays, regulation, and the deficit at one glance is useful (see Figure 2).
The last time the federal government bal-anced the budget was between 1998 and 2001.34 But those were days when a $2 tril-lion federal budget was regarded as high.
Economic regulation $399 billion
All other$70 billionFinancial
$80 billion
FCC/Infrastructure$132 billion
Environment$386 billion
DOT$80 billion
DOE$13 billion
USDA$9 billion
DOL$127 billion
DHS$57 billion
Health$194 billion
Major rules, untabulated $20 billion
Tax compliance $316 billion
International trade $3.3 billion
Figure 1. Annual Cost of Federal Regulation and Intervention, 2016 Estimate, $1.885 Trillion
Source: Wayne Crews, Tip of the Costberg: On the Invalidity of All Cost of Regulation Estimates and the Need to Compile Them Anyway, 2016 ed., http://ssrn.com/abstract=2502883.
Note: DHS = Department of Homeland Security; DOE = Department of Education; DOL = Department of Labor; DOT = Department of Transportation; FCC = Federal Communications Commission; USDA = U.S. Department of Agriculture.
The last time the federal government balanced the budget was
between 1998 and 2001.

Crews: Ten Thousand Commandments 2016 11
Today, regulatory costs approach $2 trillion, while annual federal spending hovers around $3.9 trillion and will soon top $4 trillion. FY 2015 saw a deficit of $439 billion on $3.687 trillion in outlays, with no balance—let alone surplus—anywhere in sight over the coming decade, according to the CBO. The deficit is projected to jump by more than $100 billion during 2016, to reach $3.919 trillion. And the trend likely will continue northward, as the deficit’s rate of increase is projected to top $1 trillion by 2022.35
All this spending can translate into even higher future regulatory costs. Spending re-lated to bailouts, stimulus, infrastructure, health care, telecommunications, and more will include significant regulatory com-ponents as well. Burdening the American
economy with even more regulatory man-dates and restrictions will lead to more years of slow growth and stagnant job creation. To avoid that fate and truly address Wash-ington’s spending and deficit culture and off-budget regulation, policy makers should move toward economic liberalization and a reduced regulatory state.
Regulatory Costs versus Income Taxes and Corporate Profits
Regulatory costs easily exceed the cost of individual income taxes and vastly exceed revenue from corporate taxes combined. As Figure 3 shows, regulatory costs now tower over the estimated 2015 individual income tax revenues of $1.478 trillion (individual
Figure 2. Federal Outlays and Deficits Compared with Federal
$0
$500
$1,000
$1,500
$2,000
$2,500
$3,000
$3,500
Federal OutlaysRegulatory CostsDeficit
201620152014
Billi
ons
of D
olla
rs
Year
$439
$1,882
$3,687
$544
$1,885
Regulatory Costs (2014, 2015, and projected 2016)
$4,000 $3,919
$483
$1,882
$3,504
Sources: 2014 deficit and outlays from CBO, The Budget and Economic Outlook: Fiscal Years 2015 to 2025, Janu-ary 2016, Table 1-2, “CBO’s Baseline Budget Projections,” p. 13, https://www.cbo.gov/sites/default/files/114th-congress-2015-2016/reports/49892-Outlook2015.pdf. 2014-16 regulatory cost estimate from Crews, Tip of the Costberg, Working Paper 2014, 2015 and 2016 eds. 2015 actual and 2016 projected deficit and outlays from CBO, The Budget and Economic Outlook: Fiscal Years 2016 to 2026, January 2016, Summary Table 1, “CBO’s Baseline Budget Projections,” p. 2. https://www.cbo.gov/sites/default/files/114th-congress-2015-2016 /reports/51129-2016Outlook.pdf.
Note: Federal deficit and outlay numbers are by fiscal year; regulatory costs by calendar year.

12 Crews: Ten Thousand Commandments 2016
income tax receipts had fallen substantially during the economic downturn but are rising again).36 Corporate income taxes collected by the U.S. government, estimated at $341.7 billion in 2015, are dwarfed by regulatory costs (corporate tax receipts had declined by half during the recent downturn).37 The combination of the two, $1.82 trillion, is just exceeded by our regulatory cost estimate. As the last bar of Figure 3 shows, regulatory compliance costs are approaching the level of pretax corporate profits, which were $2.208 trillion in 2014.38 This is the third time pre-tax profits have topped $2 trillion.
Regulatory Costs versus GDP
Regulation “Eats” 11 Percent of U.S. GDP
For the United States, the Commerce Depart-ment’s Bureau of Economic Analysis in Janu-ary 2016 estimated GDP for 2015 at $17.938 trillion.39 The total regulatory cost estimate of
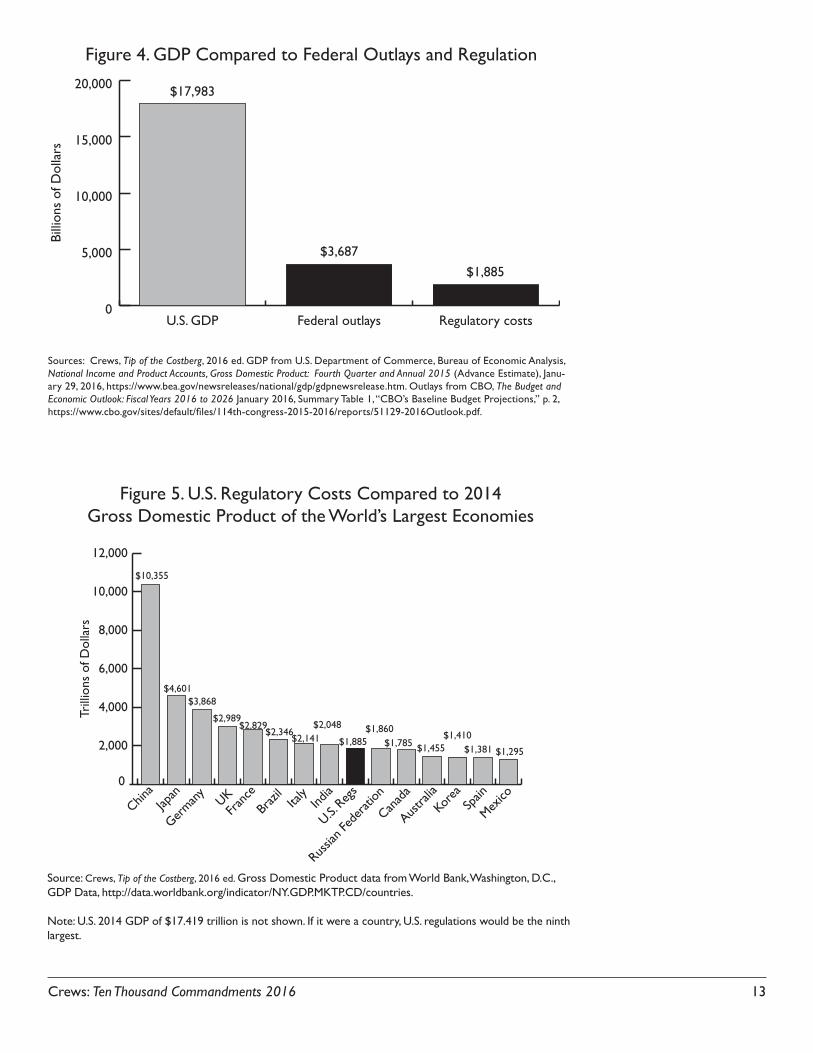
$1.885 trillion is equivalent to approximately 10.5 percent of that amount. Combining regulatory costs with federal FY 2015 outlays of $3.687 trillion (see Figure 2) indicates that the federal government’s share of the economy reaches $5.572 trillion, or 31.1 percent (see Figure 4). This does not include state and lo-cal spending and regulation.
U.S. Regulation Can Be Compared to Some of the World’s Largest Economies
Not counting the United States, only eight countries have GDPs that exceed the es-timated cost of regulation in the United States. U.S. regulatory costs surpass the 2014 GDP of both Canada, at $1.785 trillion, and Mexico, at $1.295 trillion. If U.S. regulatory costs of $1.885 trillion were a country, it would be the world’s ninth-largest economy, ranking behind India and ahead of Rus-sia.40 Figure 5 depicts this number embed-ded within a ranking of the 14 largest global
Figure 3. Regulatory Compliance Compared with Individual Income Taxes, Corporate Income Taxes, and Corporate Pretax Profits
$0
$500
$1,000
$1,500
$2,000
$2,500
Corporate Pretax Profits,
2014
Corporate Income Taxes,
est. 2015
Individual Income Taxes,
est. 2015
RegulatoryCosts
Billi
ons
of D
olla
rs
$1,885
$1,478
$342
$2,208
Sources: Crews, Tip of the Costberg, 2016 ed. Estimated 2014 tax figures from OMB, Historical Tables, Table 2.1, “Receipts by Source: 1934–2019,” http://www.whitehouse.gov/omb/budget/Historicals. 2014 corporate pretax profits (domestic and inter-national) from Bureau of Economic Analysis, National Income and Product Accounts Tables, Table 6.17D, “Corporate Profits before Tax by Industry,” http://www.bea.gov/iTable/iTable.cfm?ReqID=9&step=1#reqid=9&step=3&isuri=1&903=243.
Regulatory compliance costs are approaching
the level of pretax corporate profits,
which were $2.208 trillion in
2014.
Crews: Ten Thousand Commandments 2016 13
Figure 5. U.S. Regulatory Costs Compared to 2014 Gross Domestic Product of the World’s Largest Economies
0
2,000
4,000
6,000
8,000
10,000
12,000
Mexico
Spain
Korea
Austra
lia
Canad
a
Russia
n Fed
erati
on
U.S. Reg
sInd
iaIta
lyBr
azil
Fran
ceUK
German
yJap
anChin
a
Trill
ions
of D
olla
rs
$10,355
$4,601
$2,989$2,829
$2,346$2,141
$2,048
$1,885$1,860
$1,785 $1,455$1,410
$1,381 $1,295
$3,868
Source: Crews, Tip of the Costberg, 2016 ed. Gross Domestic Product data from World Bank, Washington, D.C., GDP Data, http://data.worldbank.org/indicator/NY.GDP.MKTP.CD/countries.
Note: U.S. 2014 GDP of $17.419 trillion is not shown. If it were a country, U.S. regulations would be the ninth largest.
Figure 4. GDP Compared to Federal Outlays and Regulation
0
5,000
10,000
15,000
20,000
Regulatory costsFederal outlaysU.S. GDP
Billi
ons
of D
olla
rs
$17,983
$3,687
$1,885
Sources: Crews, Tip of the Costberg, 2016 ed. GDP from U.S. Department of Commerce, Bureau of Economic Analysis, National Income and Product Accounts, Gross Domestic Product: Fourth Quarter and Annual 2015 (Advance Estimate), Janu-ary 29, 2016, https://www.bea.gov/newsreleases/national/gdp/gdpnewsrelease.htm. Outlays from CBO, The Budget and Economic Outlook: Fiscal Years 2016 to 2026 January 2016, Summary Table 1, “CBO’s Baseline Budget Projections,” p. 2, https://www.cbo.gov/sites/default/files/114th-congress-2015-2016/reports/51129-2016Outlook.pdf.

14 Crews: Ten Thousand Commandments 2016
economies (U.S. GDP is omitted in the chart).
U.S. Regulatory Costs Exceed GDPs of All the World’s Most-Free Economies
U.S. regulatory costs of $1.885 trillion ex-ceed the output of many of the world’s major economies, including those regarded as the most economically free. Two annual surveys of global economic freedom are widely cited. Each year, the Heritage Foundation and the Wall Street Journal jointly publish the Index of Economic Freedom.41 Meanwhile, Cana-da’s Fraser Institute, in conjunction with the Cato Institute and a group of international think tanks, publishes the annual Economic Freedom of the World report.42 Of the top
10 countries in these publications, eight are common to both. Figure 6 lists the eight compared to U.S. regulatory costs. Note that the United States no longer ranks in the top 10 of either report. Overregulation is likely a factor affecting that ranking.
Regulation: A Hidden Tax on the Family Budget
Like the taxes they are required to pay, businesses will pass some regulatory costs on to consumers. Costs are borne by busi-nesses, households, and lower-level govern-ments both through direct pass downs and in broader indirect economic effects.43 Thus, regulatory costs propagate through an econ-omy, for which the basic unit remains the in-dividual and the household. The implication
Figure 6. U.S. Regulatory Load Compared to 2014 Gross Domestic Product in World Economies Regarded as Most Free
0
500
1,000
1,500
2,000
2,500
3,000
United
King
dom
Switz
erlan
d
Singa
pore
New Z
ealan
d
Hong K
ong
Irelan
dChil
e
Canad
a
U.S. Reg
s
Billi
ons
of D
olla
rs $1,885$1,785
$258 $251 $291$166
$308
$701
$2,989
Sources: Crews, Tip of the Costberg. Gross Domestic Product data from World Bank, Washington, D.C., GDP Data, http://data.worldbank.org/indicator/NY.GDP.MKTP.CD/countries. New Zealand is from 2011 data.
Note: “Free” economies consist of those in the top ten of both the Heritage Foundation/Wall Street Journal Index of Economic Freedom and the Fraser Institute/Cato Institute Economic Freedom of the World report.

Crews: Ten Thousand Commandments 2016 15
is that regulation has large effects on societal wealth. For perspective, if we assume the full pass-through of all such costs to consumers, we can look at the share of each household’s regulatory costs and compare it with total annual expenditures as compiled by the La-bor Department’s Bureau of Labor Statistics (BLS).44
For America’s 127 million households, or “consumer units” in BLS parlance, the aver-age 2014 pretax income was $66,877.45 Fig-ure 7 breaks down household expenditures of $53,495 by category. The highest category is housing at $17,798 annually. The second-highest category is transportation at $9,073.
As Figure 7 shows, U.S. households “pay” $14,842 annually in a hidden regulatory tax ($1.885 trillion in regulation divided by 127 million “consumer units”), or 22 percent of
average income before taxes. That figure is higher than every annual household budget-ary expenditure item except housing. More is “spent” on embedded or hidden regulation in society than on health care, food, trans-portation, entertainment, apparel and ser-vices, and savings. Societal regulatory costs amount to up to 28 percent of the typical household’s expenditure budget.46
The Federal Government’s Costs of Policing the Regulatory State
Regulatory cost estimates encompass com-pliance costs paid by the public, but those estimates do not include administrative costs—the on-budget amounts spent by fed-eral agencies to produce their rules and to police regulatory compliance. The Weiden-
Figure 7. The U.S. Household Expense Budget of $53,495 Compared to Regulatory Costs
0
5,000
10,000
15,000
20,000
Regula
tion
Oth
er
Perso
nal in
s. & pe
nsion
s
Cash co
ntr.
Enter
tainm
ent
Health
care
Tran
spor
tation
Appare
l and
serv
ices
Food
Housin
g
$17,798
$6,759
$1,786
$9,073
$4,290$2,728
$1,788
$5,726
$3,548
$14,842
Societal “hidden tax” is equivalent to 28% of 2014 budget, more than every item
except housing, which is 22% of household pre-tax income of $66,877.
Dol
lars
Sources: Bureau of Labor Statistics, author arithmetic.
Note: Proxy for households here is BLS depiction of 127,006,000 “Consumer units,” which comprise “fami-lies, single persons living alone or sharing a household with others but who are financially independent, or two or more persons living together who share expenses.”
More is “spent” on embedded or hidden regulation in society than on health care, food, transportation, entertainment, apparel and services, and
savings.

16 Crews: Ten Thousand Commandments 2016
baum Center at Washington University in St. Louis, Missouri, and the Regulatory Studies Center at George Washington University in Washington, D.C., regularly examine the an-nual presidential federal budget proposal to compile the administrative costs of develop-ing and enforcing rules. Such amounts, as funds that taxpayers contribute to support agencies’ administrative operations, are dis-closed in the federal budget.
The estimated FY 2015 enforcement costs incurred by federal departments and agen-cies stood at $63 billion (in constant 2014 dollars, adjusted from original 2009 dollars), a 4.3 percent increase over $60.4 billion the previous year (Figure 8).47
Of that amount, $12.1 billion was spent administering economic regulations. The larger amount spent for writing and enforc-ing social and environmental regulations was $51 billion. In current dollars, the Environ-mental Protection Agency (EPA) alone spent an estimated $5.211 billion in this latter category in 2015, accounting for 8.3 per-cent of the total expected to be spent by all regulatory agencies.48 The EPA formerly ac-counted for the lion’s share of governmental administration and enforcement costs, but the Department of Homeland Security, at an estimated $26.5 billion, now accounts for 42.1 percent.49
The $63 billion in regulatory agency en-forcement costs—$12.1 billion plus $51 bil-lion—helps complete a picture of the federal
Figure 8. Federal Agency Enforcement Budgets, $63 Billion Total in FY 2015
0
10
20
30
40
50
60
70
Economic Regulation Social Regulation
20152014201320122011201020092008200720062005
Billi
ons
of D
olla
rs
Year
$40.4 $41.8 $42.2 $44.8$48.1
$50.0 $50.6$50.9
$49.1 $49.6 $51.0
$7.2$7.4 $7.7
$8.1$8.7
$9.0 $9.7 $10.1 $10.8 $10.9$12.1
Source: Susan Dudley and Melinda Warren, “Regulators’ Budget Increases Consistent with Growth in Fiscal Budget: An Analysis of the U.S. Budget for Fiscal Years 2015 and 2016,” Regulators’ Budget No. 37, published jointly by the Regulatory Studies Center at the George Washington University and the Weidenbaum Center on the Economy, Government, and Public Policy, May 2015, p. 25.
Note: Original 2009 constant dollars are adjusted here by the change in the consumer price index between 2009 and 2015, derived from Consumer Price Index tables, U.S. Department of Labor, Bureau of Labor Sta-tistics, Washington, D.C. (Table 24. All Urban Consumers (CPI-U), U.S. city average, all items), http://www .bls.gov/cpi/tables.htm

Crews: Ten Thousand Commandments 2016 17
regulatory apparatus. Adding administrative costs tabulated by the Weidenbaum Center and the Regulatory Studies Center to our $1.885 trillion estimate brings the total 2015 regulatory cost estimate to about $1.948 trillion.
The number of estimated full-time-equiv-alent administrative and enforcement staff stood at 277,266 in FY 2015, up from
276,576 in 2014, according to the joint re-port by the Weidenbaum Center and Regu-latory Studies Center. There has been an increase of well over 100,000 federal employ-ees since the 2001 staffing level of 173,027.50 Much of the post-2001 surge may be attrib-utable to the creation of the Transportation Security Administration that year, which included the hiring of thousands of airport screening personnel.

18 Crews: Ten Thousand Commandments 2016
The Federal Register is the daily depository of all proposed and final federal rules and regu-lations. Although its number of pages is an often cited measure of the scope of federal regulations, there are problems with relying on page counts. The wordiness of rules will vary, thus affecting the number of pages and obscuring the real effects of the underlying mandates. A short rule could be costly and a lengthy one relatively cheap. Furthermore, the Federal Register contains administrative notices, corrections, rules relating to the gov-ernance of federal programs and budgetary operation, presidential statements, and other material. Blank pages sometimes appear—in previous decades, they numbered into the thousands owing to the Government Publish-ing Office’s imperfect prediction of the num-ber of pages that agencies would require.
Federal Register Pages
Despite these limitations, it remains worth-while to track the Federal Register’s growth according to its page counts, provided these caveats are kept in mind. Tens of thousands of pages stream from America’s depart-ments, agencies, and commissions. As Figure 9 shows, at the end of 2015, the number of Federal Register pages stood at 80,260. This count is President Obama’s third-highest level, as well as the third-highest level in the entire history of the Federal Register. Both 2010 and 2011 had been the all-time record years, at 81,405 and 81,247, respectively. The 79,435 count in 2008 under President George W. Bush holds the title for fourth-highest level. Of the seven all-time high Federal Register page counts, six have occurred during the
Obama administration. (For a history of Fed-eral Register page totals since 1936, see Appen-dix: Historical Tables, Part A.)
Federal Register Pages Devoted to Final Rules
Whereas they may plausibly signify greater governmental activity, gross page counts alone do not reveal whether actual regulatory burdens have increased or decreased, given that a rule of a few pages might impose a sig-nificant burden and vice versa. Isolating the pages devoted to final rules might be more informative because doing so omits pages devoted to proposed rules, agency notices, corrections, and presidential documents (al-though those categories have regulatory ef-fects too). From 2014 to 2015, the number of pages devoted to final rules remained rela-tively flat, moving from 24,861 to 24,694. Following immediately from 2013’s record high of 26,417, these counts maintain high levels that have been the norm during the Obama administration (see Figure 10).
Figure 10 shows that over the decade since 2006, the number of Federal Register pages devoted to final rules has increased by 10.5 percent. Meanwhile, pages of proposed rules reached 22,588 in 2015, the second-highest level, which indicates we may see a surge in final rule pages in the future. Pages of pro-posed rules peaked at 23,193 in 2011 under Obama.
Another way of looking at Federal Register trends is by pages per decade (see Figure 11). If page counts hold around the current
Thousands of Pages and Rules in the Federal Register
A short rule could be costly and a lengthy one
relatively cheap.

Crews: Ten Thousand Commandments 2016 19
Figure 9. Number of Federal Register Pages, 2003–2015N
umbe
r of
Pag
es
71,26975,67573,870 74,937
Year
72,09079,435
68,598
81,40581,24778,96179,311
77,68780,260
0
20,000
40,000
60,000
80,000
100,000
2015201420132012201120102009200820072006200520042003
Source: National Archives and Records Administration, Office of the Federal Register.
Note: Of seven all-time-high Federal Register page counts, six belong to the Obama administration.
Figure 10. Federal Register Pages Devoted to Final Rules, 2003–2015
0
5,000
10,000
15,000
20,000
25,000
30,000
2015201420132012201120102009200820072006200520042003
Num
ber
of P
ages
Year
22,670 22,546 23,04122,347 22,771
26,320
20,782
24,91426,274
24,69026,417
24,861 24,694
Source: National Archives and Records Administration, Office of the Federal Register.
20 Crews: Ten Thousand Commandments 2016
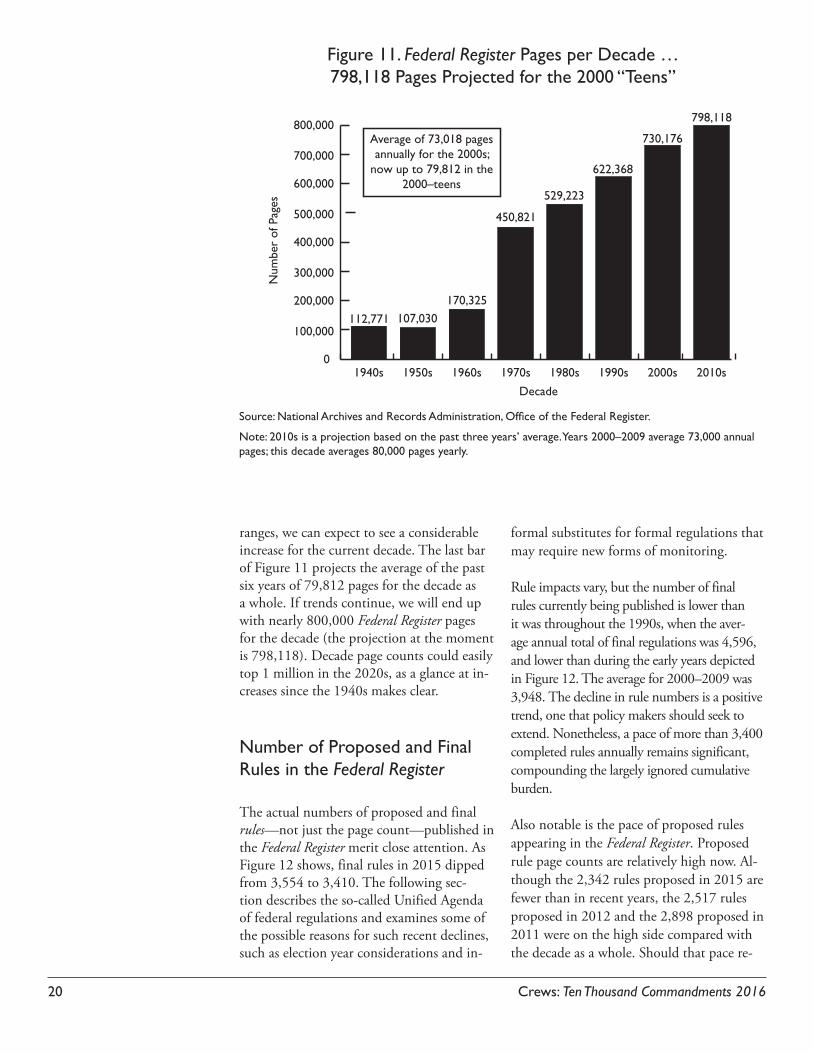
ranges, we can expect to see a considerable increase for the current decade. The last bar of Figure 11 projects the average of the past six years of 79,812 pages for the decade as a whole. If trends continue, we will end up with nearly 800,000 Federal Register pages for the decade (the projection at the moment is 798,118). Decade page counts could easily top 1 million in the 2020s, as a glance at in-creases since the 1940s makes clear.
Number of Proposed and Final Rules in the Federal Register
The actual numbers of proposed and final rules—not just the page count—published in the Federal Register merit close attention. As Figure 12 shows, final rules in 2015 dipped from 3,554 to 3,410. The following sec-tion describes the so-called Unified Agenda of federal regulations and examines some of the possible reasons for such recent declines, such as election year considerations and in-
formal substitutes for formal regulations that may require new forms of monitoring.
Rule impacts vary, but the number of final rules currently being published is lower than it was throughout the 1990s, when the aver-age annual total of final regulations was 4,596, and lower than during the early years depicted in Figure 12. The average for 2000–2009 was 3,948. The decline in rule numbers is a positive trend, one that policy makers should seek to extend. Nonetheless, a pace of more than 3,400 completed rules annually remains significant, compounding the largely ignored cumulative burden.
Also notable is the pace of proposed rules appearing in the Federal Register. Proposed rule page counts are relatively high now. Al-though the 2,342 rules proposed in 2015 are fewer than in recent years, the 2,517 rules proposed in 2012 and the 2,898 proposed in 2011 were on the high side compared with the decade as a whole. Should that pace re-
Figure 11. Federal Register Pages per Decade … 798,118 Pages Projected for the 2000 “Teens”
0
100,000
200,000
300,000
400,000
500,000
600,000
700,000
800,000
2010s2000s1990s1980s1970s1960s1950s1940s
Num
ber
of P
ages
112,771 107,030170,325
450,821
529,223
622,368
730,176
798,118
Decade
Average of 73,018 pages annually for the 2000s;
now up to 79,812 in the 2000–teens
Source: National Archives and Records Administration, Office of the Federal Register.
Note: 2010s is a projection based on the past three years’ average. Years 2000–2009 average 73,000 annual pages; this decade averages 80,000 pages yearly.

Crews: Ten Thousand Commandments 2016 21
sume, high numbers of proposed rules (and page counts) signify likely future increases in final rules. (For the numbers of proposed and final rules and other documents issued in the Federal Register since 1976, see Appen-dix: Historical Tables, Part B.)
Cumulative Final Rules in the Federal Register
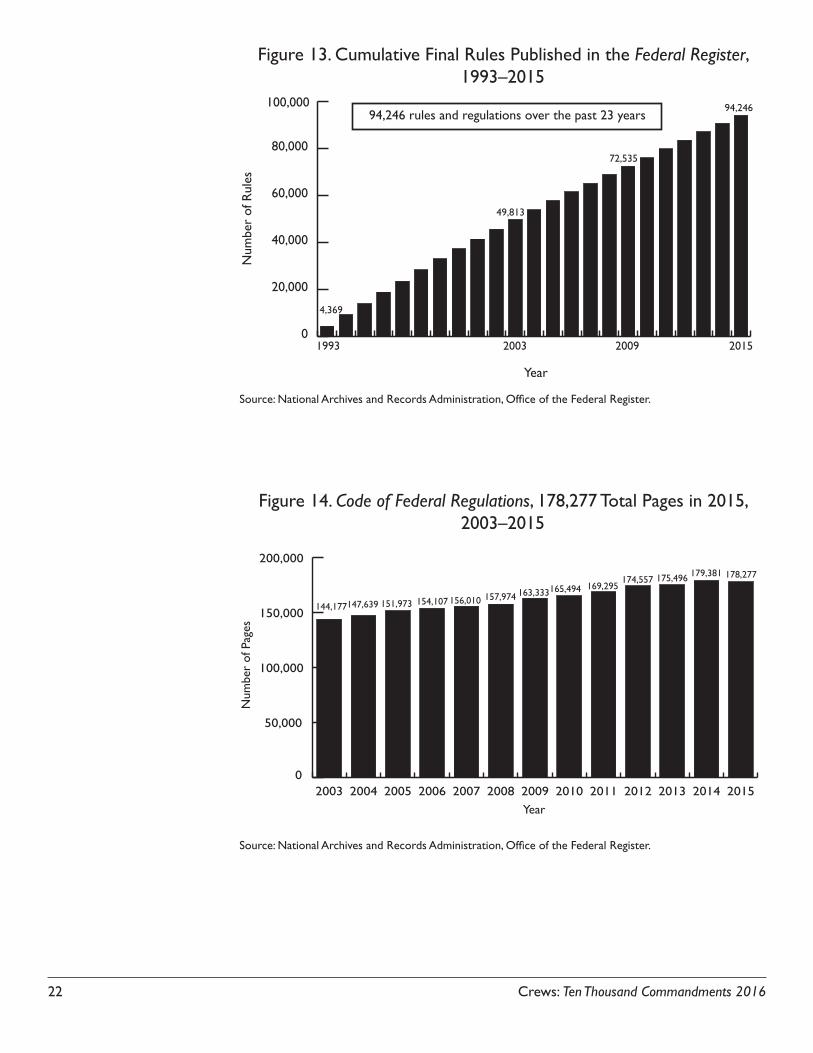
Despite yearly fluctuations, the cumulative effect of regulation can matter a great deal. The bottom line is that the annual outflow of at least 3,400 final rules—and often far more—has meant that 94,246 rules have been issued since 1993, when the first edi-tion of Ten Thousand Commandments was published (see Figure 13).
The Expanding Code of Federal Regulations
The page count for final general and perma-nent rules in the Code of Federal Regulations (CFR) is more modest than that of the Fed-eral Register, but still considerable. In 1960, the CFR contained 22,877 pages. Since 1975, total pages in the complete CFR have grown from 71,224 to 178,277 at the end of 2015, including the 1,170-page index. That is a 150 percent increase over the pe-riod. The number of CFR bound volumes stands at 237, compared with 133 in 1975. Figure 14 depicts the CFR’s pages for the past decade. (For the detailed breakdown of numbers of pages and volumes in the CFR since 1975, see Appendix: Historical Tables, Part C.)
Figure 12. Number of Proposed and Final Rules in the Federal Register, 2003–2015
0
1,000
2,000
3,000
4,000
5,000
6,000
7,000
8,000
Proposed RulesFinal Rules
2015201420132012201120102009200820072006200520042003Year
Num
ber
of R
ules
4,148 4,101 3,975 3,718
2,5382,430
2,257 2,346
3,410 final rules in 2015; 2,342 proposed
2,308
3,595
2,475
2,044
3,503
2,439
3,5733,830
2,898
3,807
2,517 2,5942,383
3,708 3,554
2,342
3,4103,659
Source: National Archives and Records Administration, Office of the Federal Register.
The annual outflow of at
least 3,400 final rules—and often far more—has
meant that 94,246 rules
have been issued since 1993, when the first edition of Ten Thousand Commandments was published.
22 Crews: Ten Thousand Commandments 2016
Figure 13. Cumulative Final Rules Published in the Federal Register, 1993–2015
0
20,000
40,000
60,000
80,000
100,000
Num
ber
of Rules
4,369
Year
94,246
72,535
1993 2003 2009 2015
49,813
94,246 rules and regulations over the past 23 years
Source: National Archives and Records Administration, Office of the Federal Register.
Figure 14. Code of Federal Regulations, 178,277 Total Pages in 2015, 2003–2015
0
50,000
100,000
150,000
200,000
2015201420132012201120102009200820072006200520042003
Num
ber
of P
ages
144,177147,639 151,973 154,107
Year
156,010 157,974 163,333165,494 169,295174,557 175,496 179,381 178,277
Source: National Archives and Records Administration, Office of the Federal Register.

Crews: Ten Thousand Commandments 2016 23
Presidential Executive Orders and Executive Memoranda
President Obama famously pledged to use his “pen and phone” to implement parts of his policy agenda without congressional ap-proval.51 Executive orders, presidential mem-oranda, and other executive actions make up a large component of that initiative.52 This section examines those numbers, but a con-siderable amount of executive branch activity is not well measured and merits heightened attention, especially when an administration so explicitly emphasizes unilateral action.53
Executive orders ostensibly deal with the in-ternal workings and operations of the federal government. Subsequent presidents can over-turn them. Their use is nothing new, dating back to George Washington’s administra-tion.54 President Obama’s totals are not high compared with those of other presidents. At the end of 2015, he had issued 244 execu-tive orders. Figure 15 provides a snapshot of executive orders issued over the past two decades, from 2000 to the present. Obama
Figure 15. Number of Executive Orders and Presidential Memoranda, 2000–2015
Num
ber
of E
xecu
tive
Ord
ers
and
Pres
iden
tial M
emor
anda
0
10
20
30
40
50
60
70
Presidential MemorandaExecutive Orders
Year
2015201420132012201120102009200820072006200520042003200220012000
39
67
12
32
10
41
14
46
21
2723 25
18
32
16
29
15
44
384142
33
19
39
32
24
3234
2529
31
13
Source: National Archives and Records Administration, Office of the Federal Register.

24 Crews: Ten Thousand Commandments 2016
issued more executive orders in his first term than did President George W. Bush in his second term, but Bush was comparatively more active during his first term.
Presidential memoranda since 1999—which presidential scholar Phillip Cooper has termed “executive orders by another name”—are also depicted in Figure 15.55 Memoranda may or may not be published, depending on the administration’s own de-termination of “general applicability and legal effect,” making it “difficult to count presidential memoranda.”56 Obama’s pace since 2009 tops that of George W. Bush, which is unsurprising given his administra-tion’s openness about prioritizing executive action. Bush published 129 memoranda over his entire presidency, whereas Obama issued 219 during his first seven years that were published in the Federal Register. (President Bill Clinton published just 14 memoranda.57)
The pertinent question as far as regulatory burdens are concerned, is what these execu-tive orders and memoranda are used for and what they do. Executive actions can liberal-ize and enhance freedom, such as President Abraham Lincoln’s Emancipation Procla-mation. Or they can expand governmental power, such as President Harry Truman’s failed attempt to seize control of America’s steel mills58 or President Franklin D. Roos-evelt’s confiscation of the nation’s gold.59
Whether lengthy or brief, orders and memo-randa can have significant impacts for or against liberty. Therefore, a smaller number of them does not necessarily mean small ef-fects. In 2014 alone, Obama memoranda created a new financial investment instru-ment and implemented new positive rights regarding work hours and employment pref-erences for federal contractors.60 As with the Federal Register, counts are interesting but do not tell the whole story.
Obama’s own Executive Order No. 13563 about review and reform was a pledge to roll back regulation, but it amounted to only a few billion dollars in cuts that were
swamped by other rules issued.61 In all, four of Obama’s executive orders directly address overregulation and rollbacks.62
Other key executive orders directly affecting regulatory restraint were President Bill Clin-ton’s 1993 Executive Order No. 1286663 and President Ronald Reagan’s Executive Order No. 12291, which formalized central regula-tory review at OMB.64 Clinton’s was a step back from the heavier oversight of the Rea-gan order in that it sought “to reaffirm the primacy of Federal agencies in the regulatory decision-making process.”65
The United States existed for many de-cades before a president issued more than two dozen executive orders—that was President Franklin Pierce, who served dur-ing 1853–1857.66 Orders numbered in the single digits or teens until President Lincoln and the subsequent reconstruction period. The Ulysses S. Grant administration issued 217, then a record.67 From the 20th cen-tury onward, orders topped 100 for each president and sometimes numbered in the thousands. President Franklin D. Roosevelt issued 3,467 numbered executive orders. Table 4 provides a look at executive order counts by administration since the nation’s founding and presents a total approximate count of 15,236. (In an expansion of Figure 15, executive orders since 1995 by calendar year appear in Appendix: Historical Tables, Part I.)
We live in an era in which the government—without actually passing a law—increasingly dictates parameters of various economic sec-tors, including health care, retirement, edu-cation, energy production, finance, land and resource management, funding of science and research, and manufacturing. Executive actions and decrees issued in a limited gov-ernment context have different implications than do those issued in an era of activist gov-ernment, rendering some of what transpires today without precedent. For example, the Internal Revenue Service granted numerous waivers of the Patient Protection and Afford-able Care Act’s employer mandate without regard to the statute’s language.68
We live in an era in which the government—without actually passing a law—
increasingly dictates
parameters of various economic
sectors.

Crews: Ten Thousand Commandments 2016 25
Sequence Number Total Number of Executive
OrdersEnding Beginning
George Washington n/a 8
John Adams n/a 1
Thomas Jefferson n/a 4
James Madison n/a 1
James Monroe n/a 1
John Quincy Adams n/a 3
Andrew Jackson n/a 12
Martin van Buren n/a 10
William Henry Harrison n/a 0
John Tyler n/a 17
James K. Polk n/a 18
Zachary Taylor n/a 5
Millard Fillmore n/a 12
Franklin Pierce n/a 35
James Buchanan n/a 16
Abraham Lincoln n/a 48
Andrew Johnson n/a 79
Ulysses S. Grant n/a 217
Rutherford B. Hayes n/a 92
James Garfield n/a 6
Chester Arthur n/a 96
Grover Cleveland - I n/a 113
Benjamin Harrison n/a 143
Grover Cleveland - II n/a 140
William McKinley n/a 185
Theodore Roosevelt 1,081
William Howard Taft 724
Woodrow Wilson 1,803
Warren G. Harding 522
Calvin Coolidge 1,203
Herbert Hoover 6,070 5,075 996
Franklin D. Roosevelt 9,537 6,071 3,467
Harry S. Truman 10,431 9,538 894
Dwight D. Eisenhower 10,913 10,432 482
John F. Kennedy 11,127 10,914 214
Lyndon B. Johnson 11,451 11,128 324
Richard Nixon 11,797 11,452 346
Table 4. Executive Orders by Administration
(continued)

26 Crews: Ten Thousand Commandments 2016
Counting rules and regulations, executive or-ders, memoranda, and other regulatory guid-ance gets us only so far. These actions need more scrutiny and oversight, because they
have become powerful means of working around the constitutional system of legisla-tion made by an elected body.69
Sequence Number Total Number of Executive
OrdersEnding Beginning
Gerald R. Ford 11,966 11,798 169
Jimmy Carter 12,286 11,967 320
Ronald Reagan 12,667 12,287 381
George H. W. Bush 12,833 12,668 166
William J. Clinton 13,197 12,834 364
George W. Bush 13,488 13,198 291
Barack Obama 13,715 13,489 227
Total Number of Executive Orders 15,236
Source: W. Crews’s tabulations; Executive Orders Disposition Tables Index, Office of the Federal Register, National Archives, http://www.archives.gov/federal-register/executive-orders/disposition.html; “Executive Orders,” The American Presidency Project, ed. John T. Woolley and Gerhard Peters (Santa Barbara, CA: 1999–2014.), http://www.presidency.ucsb.edu/data/orders.php.
Note: n/a = not applicable or not available
Table 4. Executive Orders by Administration (continued)

Crews: Ten Thousand Commandments 2016 27
24,000 Public Notices Annually
Public notices in the Federal Register include non-rulemaking documents such as meeting and hearing notices and agency-related or-ganizational material.70 But there are tens of thousands of yearly public notices, including memoranda, bulletins, guidance documents, alerts, and other proclamations, many of which could be important to the public. Fig-ure 16 shows the number of notices annu-ally. Notices stood at 24,393 in 2015, and have dipped below 24,000 only once since 1996 (in 2014). There have been 526,292 public notices since 1995.
During the 2015 calendar year, 35 notices received OMB review (see Figure 17 in the next section), and some of those were
deemed to have an “economically signifi-cant” impact. A history of the number of no-tices reviewed annually appears in Appendix: Historical Tables, Part D.
Policy makers should pay more attention to such documents because of the modern executive inclination to advance policy by memorandum, notice, bulletin, and even blog post. Most notice-and-comment regu-lations already lack cost-benefit or other analysis. Increased unilateral executive ac-tion will render costs of regulation even less transparent as the federal government expands and increasingly interposes itself in commerce and other realms of private activity.
Figure 16. Thousands of “Public Notices” in the Federal Register, 1995–2015
Year
24,36723,162
26,03326,197
25,505 25,47024,829
25,74325,419
25,30925,353 25,031
24,47625,279
24,753
26,17326,161
24,40824,261
23,97024,393
Num
ber
of N
otes
0
5,000
10,000
15,000
20,000
25,000
30,000
201520142013201220112010200920082007200620052004200320022001200019991998199719961995
Source: National Archives and Records Administration, Office of the Federal Register.

28 Crews: Ten Thousand Commandments 2016
Analysis of the Regulatory Plan and Unified Agenda of Federal Regulations
What little regulatory disclosure does exist has suffered under the Obama administration. “The Regulatory Plan and Unified Agenda of Federal Regulatory and Deregulatory Actions” (the Agenda) outlining agency priorities nor-mally appears in the Federal Register each fall and, minus the Regulatory Plan component, each spring. However, these days it seems even this limited disclosure has become too much to ask of a government that avoids preparing a comprehensive and balanced fiscal budget for itself, let alone a regulatory one. Election campaign considerations can cause agencies to hold back on rules or report fewer of them. In addition, OMB now routinely reports on fewer “long-term” planned rules—including disclosure of rules affecting small business—an omission that misleadingly pushes the overall Agenda count downward. The overall number of rules appearing in the Agenda has decreased of late, yet that does not mean regulatory bur-dens have decreased. In any event, counts for the costlier subset of rules are up.
The Agenda’s rules primarily affect the pri-vate sector, but many also affect state and lo-cal governments and the federal government itself. In normal circumstances, the Agenda gives researchers a sense of the flow of the regulatory pipeline. It details rules recently completed, plus those anticipated or priori-tized within the upcoming 12 months by federal departments, agencies, and commis-sions (59 in the newest edition). As a cross-sectional snapshot of rules moving through the regulatory pipeline, the Agenda compiles agency-reported federal regulatory actions at several stages:
• Prerule actions• Proposed and final rules
• Actions completed during the previousfew months
• Anticipated longer-term rulemakingbeyond a 12-month horizon
Therefore, the rules contained in the Agenda often carry over at the same stage from one year to the next, or they may reappear in subsequent editions at different stages.
However, agencies are not required to limit their regulatory activity to what they pub-lish in the Agenda. As the Federal Register has noted:
The Regulatory Plan and the Uni-fied Agenda do not create a legal obligation on agencies to adhere to schedules in this publication or to confine their regulatory activities to those regulations that appear within it.71
The appearance of the Agenda has become less reliable. The fall 2011 edition did not appear until January 20, 2012.72 The spring 2012 edition did not appear at all, and a solitary volume with no seasonal designation finally appeared the Friday before the Christ-mas 2012 holiday with no clarity on how its methodology might have been affected by the delay.
In spring 2013, a document titled “Spring 2013 Update to the Unified Agenda of Fed-eral Regulatory and Deregulatory Actions” appeared instead of the normal Unified Agenda the day before July 4. Then in late 2013, echoing 2012’s pre-Santa version, the fall edition appeared the day before Thanks-giving (coinciding with a delay of regula-

Crews: Ten Thousand Commandments 2016 29
tory implementation of the Affordable Care Act’s employer mandate, in defiance of that statute’s language). In both 2014 and 2015, the fall edition again appeared the weekend before Thanksgiving.
Whereas rules finalized in the Federal Reg-ister remain above 3,400 annually, the rules now being reported in the Unified Agenda pipeline are fewer, owing perhaps to the ad-ministration’s own formal and informal rule-making delays and reporting irregularities and new guidance memoranda affecting the Agenda’s production.
In 2012, spring and fall guidelines from OMB’s then-director of the Office of In-formation and Regulatory Affairs (OIRA), Cass Sunstein, altered directives to agencies regarding their Agenda reporting:
In recent years, a large number of Unified Agenda entries have been for regulatory actions for which no real activity is expected within the coming year. Many of these entries are listed as “Long-Term.” Please consider terminating the listing of such entries until some action is likely to occur. …
Many entries are listed with pro-jected dates that have simply been moved back year after year, with no action taken. Unless your agency realistically intends to take action in the next 12 months, you can remove these items from the Agenda.73
Newly appointed OIRA Administrator How-ard Shelanski issued a similar memoran-dum on the Unified Agenda on August 7, 2013—“please consider removing” became the more direct “please remove.”74 As Susan Dudley of the George Washington Univer-sity Regulatory Studies Center noted, the changes introduced in the Sunstein and Shel-anski memoranda might be beneficial, but “to the extent that reclassifying actions reduces the public’s ability to understand upcoming regulatory activity, the revisions could reduce transparency and accountability.”75
Upon release of the fall 2013 edition, regula-tory expert Leland Beck noted the Agenda’s fluid nature, stating: “The [A]genda provides only a semi-filtered view of each agency’s in-tentions and must be considered within its limitations.” Furthermore, it “reflect[s] what the agency wants to make public, not neces-sarily all that they are actually considering, and some highly controversial issues may be withheld.”76
Politics and elections can play a role in re-porting and rule delays, and presidential election year 2012 appeared to be an extreme example. One Washington Post headline pro-claimed, “White House Delayed Enacting Rules Ahead of 2012 Election to Avoid Con-troversy.” The Post summed up the matter as follows:
The number and scope of delays under Obama went well beyond those of his predecessors, who helped shape rules but did not have the same formalized controls, said current and former officials who spoke on the condition of anonym-ity because of the sensitivity of the topic.77
A December 2013 report by the Admin-istrative Conference of the United States about the growing length of time it took to complete rule reviews at OMB reinforced The Washington Post article’s conclusion.78 However, the 2014 midterm elections did not appear to have as significant an impact on rule volume as the 2012 presidential cycle.
Figure 17 presents the number of Execu-tive Order No. 12866 rule reviews carried out at OMB, by stage and by economic significance, for calendar year 2015. It also shows the number of days OMB took to review rules in 2015. The time of review improved over the past year, but a review still can take several months rather than the once-common two months or less. The Office of Information and Regulatory Af-fairs, however, does not review indepen-dent agencies’ rules. Appendix: Historical
It seems even limited disclosure has become too much to ask of a government that avoids preparing a comprehensive
and balanced fiscal budget for itself, let alone a regulatory
one.

30 Crews: Ten Thousand Commandments 2016
Tables, Part D, presents a detailed break-down of numbers of rules reviewed by type and by average days for review from 1991 through 2015. During the pre–Executive Order No. 12866 years depicted there, 1991–1993, review times were shorter, al-though numbers of rules were considerably higher.
Information about numbers of reviews and how long they take is well worth report-ing for clarity and perspective. But whether reviewing a rule takes 120 days or 30 days may not make a great deal of difference in a regime where OMB reviews only a few hun-dred of several thousand annual rules and where cost-benefit analysis rarely occurs in the first place.
Some healthy skepticism may be justified regarding the numbers in the most recent Agenda, given the lack of both a clarifica-tion of the numbers’ legitimacy and recent rule delay by the administration. But like the Federal Register, they are what we have, and reporting could be improved.
3,297 Rules Acknowledged in the Unified Agenda Pipeline
The fall 2015 Unified Agenda finds 59 fed-eral agencies, departments, and commis-sions recognizing 3,297 regulations in the active (prerule, proposed, and final), just-completed, and long-term stages.79 Many of the rules are not new to the Agenda and have been in the pipeline for quite some time.
As Figure 18 shows, the overall Agenda pipeline had topped 4,000 rules until 2012, except for the year 2007. (The all-time-high count for rules in the year-end Agenda of 5,119 occurred back in 1994.) The 2013 drop of 18.6 percent from 4,062 rules in 2012 in part reflects the change in directive noted earlier. (For a history of the numbers of rules in the spring and fall Unified Agenda editions since 1983, see Appendix: Historical Tables, Part E.)80
The Federal Register consistently shows more than 3,400 rules finalized annually, but
Figure 17. Number of OMB Rule Reviews under Executive Order 12866 and Average Days under Review, 2015
0
100
200
300
400
500
Ove
rall A
vg. D
ays
Day
s Non
signif
. Rev
iews
Day
s Sign
if. Rev
iews
Non
-Eco
n. Sig
nif. R
eview
s
Econ
Sign
if. Rev
iews
Total R
eview
s
Not
ice R
eview
s
Final
Rule R
eview
s
Inte
rim Fina
l Rule
Rev
iews
Prop
osed
Rule
Rev
iews
Prer
ule R
eview
s
8
178164
130
84
29 35
415
285
90 88
Num
ber
of R
ules
Source: Author search on RegInfo.gov, “Review Counts” database search engine under Regulatory Review heading.

Crews: Ten Thousand Commandments 2016 31
with dips in the past two years. As Figure 18 shows, since 2003, “Active” rule counts consistently remained above 2,300, until that number dropped this past year. This category stands at 2,244 for 2015. Although the Uni-fied Agenda pipeline shows very large recent declines, whether that will translate into fewer actual regulations finalized in the Fed-eral Register remains to be seen.
Note that although rules in the “Completed” category in fall Agendas (spring Agendas are not shown in Figure 18) had been ris-ing steadily and rapidly under Obama—from 669 in 2009 to 1,172 in 2012, a 75.2 percent increase—they too dropped pre-cipitously in 2013. (Completed rules are “ac-tions or reviews the agency has completed or withdrawn since publishing its last agenda.”) This decline appears to reflect the admin-istration’s rule delays noted in the previous section. Although this category rose to 629 in 2014, it dipped to 554 in 2015. Despite the drop in Obama’s “Completed” rules since
2012, the average of his seven years of fall Agendas, 745, exceeds the average of 726 for George W. Bush’s final six years (see bottom one-third of Figure 18).
With respect to the “Long-Term” category (top of Figure 18), the Obama administra-tion discloses considerably fewer planned regulations than did its immediate prede-cessor. Announced long-term rules in the pipeline, shown in Figure 18, dropped precip-itously from 807 to 442 between 2010 and 2011. In the new 2015 Agenda, these rules stand at 499. Deemphasizing “long-term” reporting does not aid transparency because that is where much of the executive action will likely occur.
The total pipeline count of 3,297 rules de-picted in Figure 18 is broken out in Table 5 by agency, commission, or issuing depart-ment. The table shows numbers of rules at the active, completed, and long-term stages by department or agency. For the numbers
Figure 18. Total Agency Rules in the Fall Unified Agenda Pipeline, 2003–2015
0
1,000
2,000
3,000
4,000
5,000
Long-termActiveCompleted
2015201420132012201120102009200820072006200520042003
Num
ber
of R
ules
Year
4,0834,266
4,062 4,0523,882 4,004 4,043
4,225 4,128
2,6332,721
2,592 2,390 2,424 2,4642,630 2,696 2,676
808746
845 811 774 849 744 807 442
642863 625 851684 691 669 722
1,010
4,062
3,305
2,3872,397
503
462
1,172446
3,297
2,244
499
554
3,415
2,321
465
629
Source: Compiled by the author from “The Regulatory Plan and Unified Agenda of Federal Regulatory and Deregulatory Actions,” Federal Register, Fall edition, consecutive years, and database at http://reginfo.gov.
Note: “Active” rules consist of rules at the pre-rule, proposed, and final stages. Pre-2004 online database totals do not match the printed, paper editions of that era, so the author has elected to retain the data as compiled in those earlier print editions.

32 Crews: Ten Thousand Commandments 2016
of rules by department and agency from previous year-end editions of the Agenda since 1999, see Appendix: Historical Tables, Part F.
Overall, the Unified Agenda gives the im-pression that regulatory burdens are de-clining, but that may reflect a pullback in disclosure and transparency such as the administration’s alleged delay of the pace of rules in 2012. That the Federal Com-munications Commission, Federal Energy Regulatory Commission, and National La-bor Relations Board own up to no “active” actions is questionable, as is the decline in active entries from the EPA. Time will tell as rules make their way from the Agenda to the Federal Register. In addition, more rulemak-ing may be shifting toward the more infor-
mal guidance and memoranda, avoiding the formalities of notice-and-comment required in the Administrative Procedure Act.81
Top Five Executive Departments and Agencies
Every year, a relative handful of executive agencies account for a large number of the rules in the pipeline. The five departments and agencies listed in Table 6—the Depart-ments of Commerce, Health and Human Services, the Interior, Transportation, and the Treasury—were the most active rule makers. These top five, with 1,348 rules among them, account for 41 percent of the 3,297 rules in the Agenda pipeline. For the third time, the
Total Rules
Unified Agenda Regulatory Plan Component
Active Completed Long Term Active Long TermAll Agencies 3297 2244 554 499 139 2
Dept. of Agriculture 155 123 25 7 14 1
Dept. of Commerce 246 142 92 12
Dept. of Defense 117 86 30 1 7
Dept. of Education 25 16 6 3 2
Dept. of Energy 107 86 14 7 7
Dept. of Health and Human Services 213 153 33 27 18
Dept. of Homeland Security 130 75 8 47 19 1
Dept. of Housing and Urban Development 52 40 9 3 2
Dept. of the Interior 288 224 44 20
Dept. of Justice 100 76 8 16 7
Dept. of Labor 97 71 10 16 9
Dept. of State 44 26 12 6
Dept. of Transportation 210 152 30 28 18
Dept. of Treasury 391 331 32 28
Dept. of Veterans Affairs 80 55 18 7
Environmental Protection Agency 188 115 40 33 16
Agency for International Development 8 4 3 1
Table 5. Unified Agenda Entries by Department and Agency, (Fall 2015)
The Unified Agenda gives the impression that
regulatory burdens are declining, but that may reflect
a pullback in disclosure and transparency.

Crews: Ten Thousand Commandments 2016 33
Total Rules
Unified Agenda Regulatory Plan Component
Active Completed Long Term Active Long TermArchitectural and Transportation Barriers Compliance Board 6 4 2
Commission on Civil Rights 1 1
CPBSD* 2 2
Commodity Futures Trading Commission 34 29 4 1
Consumer Financial Protection Bureau 23 13 6 4
Consumer Product Safety Commission 45 32 4 9
Corporation for National and Community Service 7 2 1 4
Court Services/Offender Supervision, D.C. 4 4
Federal Acquisition Regulation 42 34 8
Equal Employment Opportunity Commission 8 8 4
Farm Credit Administration 27 23 3 1
Federal Communications Commission 133 6 127
Federal Deposit Insurance Corporation 25 18 4 3
Federal Energy Regulatory Commission 25 9 16
Federal Housing Finance Agency 20 14 4 2
Federal Maritime Commission 8 6 2
Federal Reserve System 18 11 7
Federal Trade Commission 20 15 3 2
General Services Administration 21 15 6
Gulf Coast Ecosystem Restoration Council 4 2 1 1
Institute of Museum and Library Services 1 1
National Aeronautics and Space Administration 14 7 7
National Archives and Records Administration 8 8
National Council on Disability 1 1
National Credit Union Administration 26 14 12
National Endowment for the Arts 7 5 2
National Endowment for the Humanities 4 3 1
National Indian Gaming Commission 9 2 7
National Science Foundation 1 1
National Transportation Safety Board 15 12 3
Nuclear Regulatory Commission 65 31 11 23
Office of Government Ethics 5 5
Office of Management and Budget 4 3 1
Office of National Drug Control Policy 1 1
* Committee for Purchase from People Who Are Blind or Severely Disabled.(continued)
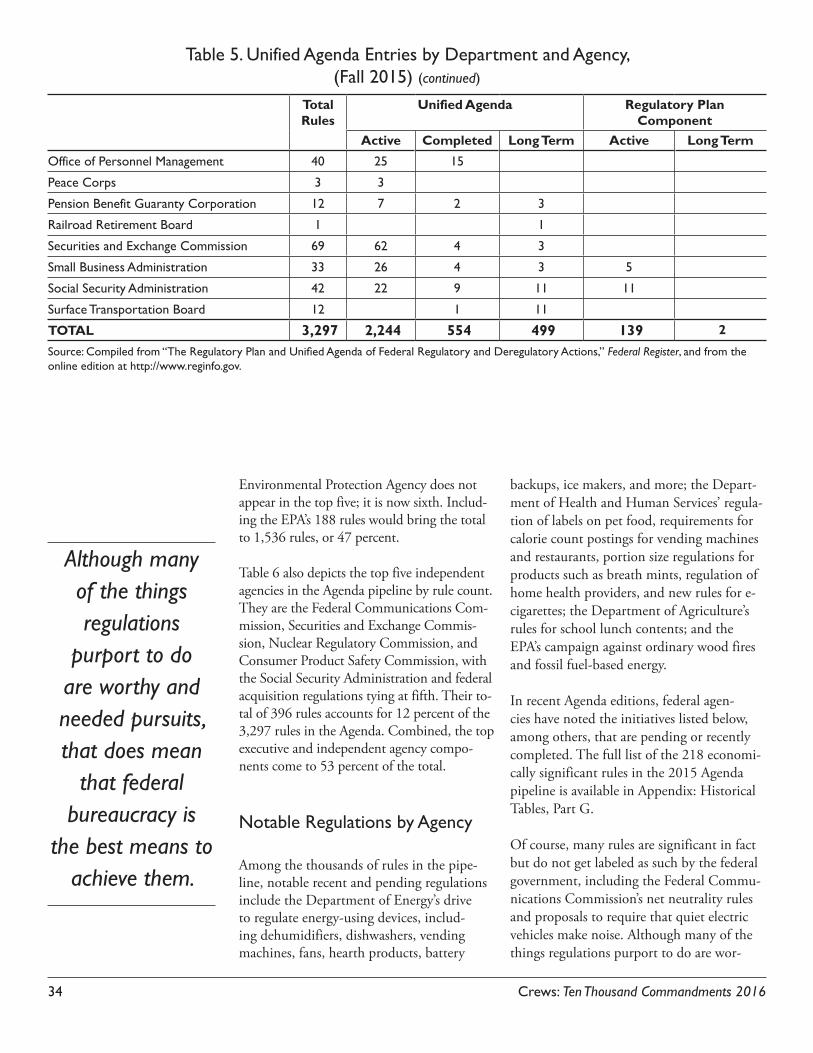
34 Crews: Ten Thousand Commandments 2016
Environmental Protection Agency does not appear in the top five; it is now sixth. Includ-ing the EPA’s 188 rules would bring the total to 1,536 rules, or 47 percent.
Table 6 also depicts the top five independent agencies in the Agenda pipeline by rule count. They are the Federal Communications Com-mission, Securities and Exchange Commis-sion, Nuclear Regulatory Commission, and Consumer Product Safety Commission, with the Social Security Administration and federal acquisition regulations tying at fifth. Their to-tal of 396 rules accounts for 12 percent of the 3,297 rules in the Agenda. Combined, the top executive and independent agency compo-nents come to 53 percent of the total.
Notable Regulations by Agency
Among the thousands of rules in the pipe-line, notable recent and pending regulations include the Department of Energy’s drive to regulate energy-using devices, includ-ing dehumidifiers, dishwashers, vending machines, fans, hearth products, battery
backups, ice makers, and more; the Depart-ment of Health and Human Services’ regula-tion of labels on pet food, requirements for calorie count postings for vending machines and restaurants, portion size regulations for products such as breath mints, regulation of home health providers, and new rules for e-cigarettes; the Department of Agriculture’s rules for school lunch contents; and the EPA’s campaign against ordinary wood fires and fossil fuel-based energy.
In recent Agenda editions, federal agen-cies have noted the initiatives listed below, among others, that are pending or recently completed. The full list of the 218 economi-cally significant rules in the 2015 Agenda pipeline is available in Appendix: Historical Tables, Part G.
Of course, many rules are significant in fact but do not get labeled as such by the federal government, including the Federal Commu-nications Commission’s net neutrality rules and proposals to require that quiet electric vehicles make noise. Although many of the things regulations purport to do are wor-
Total Rules
Unified Agenda Regulatory Plan Component
Active Completed Long Term Active Long TermOffice of Personnel Management 40 25 15
Peace Corps 3 3
Pension Benefit Guaranty Corporation 12 7 2 3
Railroad Retirement Board 1 1
Securities and Exchange Commission 69 62 4 3
Small Business Administration 33 26 4 3 5
Social Security Administration 42 22 9 11 11
Surface Transportation Board 12 1 11
TOTAL 3,297 2,244 554 499 139 2
Source: Compiled from “The Regulatory Plan and Unified Agenda of Federal Regulatory and Deregulatory Actions,” Federal Register, and from the online edition at http://www.reginfo.gov.
Table 5. Unified Agenda Entries by Department and Agency, (Fall 2015) (continued)
Although many of the things regulations
purport to do are worthy and needed pursuits, that does mean
that federal bureaucracy is
the best means to achieve them.

Crews: Ten Thousand Commandments 2016 35
thy and needed pursuits, that does mean that federal bureaucracy is the best means to achieve them, compared with insurance, li-ability and other private-sector options, or state and local oversight.
Department of Agriculture
• Mandatory country-of-origin labeling ofbeef, fish, lamb, peanuts, and pork
• National school lunch and school break-fast programs: nutrition standards for allfoods sold in school and certification of
compliance with meal requirements for the National School Lunch Program (as required by the Healthy, Hunger-Free Kids Act of 2010)
• Rural Energy for America Program• Rural broadband access loans and loan
guarantees• Mandatory inspection of catfish and
catfish products• Multifamily Housing Reinvention• Inspection regulations for eggs and egg
products• Performance standards for ready-to-eat
processed meat and poultry products
Table 6. Top Rule-Producing Executive and Independent Agencies (From year-end 2015 Unified Agenda, total of active, completed, and long-term rules)
Executive Agency Number of Rules1. Department of the Treasury 3912. Department of the Interior 2883. Department of Commerce 2464. Department of Health and Human Services 2135. Department of Transportation 210TOTAL 1,348% of Total Agenda Pipeline of 3,297 41
Note: The Environmental Protection Agency, formerly always in the top five, is sixth, with 188 rules in the pipeline.
Independent Agency Number of Rules1. Federal Communications Commission 1332. Securities and Exchange Commission 693. Nuclear Regulatory Commission 654. Consumer Product Safety Commission 455. (tie) Social Security Administration 425. (tie) Federal Acquisition Regulation 42TOTAL 396% of Total Agenda Pipeline of 3,297 12
Top 5 Executives plus Independents 1,744% of Total Agenda Pipeline 53
Source: Compiled by the author from “The Regulatory Plan and Unified Agenda of Federal Regulatory and Deregulatory Actions,” Federal Register, Fall edition, and database at http://www.reginfo.gov.
Note: “Active” rules consist of rules at the prerule, proposed, and final stages.
36 Crews: Ten Thousand Commandments 2016
• “Modernization” of poultry slaughterinspection
• Regulations concerning importation ofunmanufactured wood articles (solid-wood packing material)
• Bovine spongiform encephalopathy:minimal-risk regions and importation ofcommodities
• Nutrition labeling of single-ingredientand ground or chopped meat and poul-try products
Department of Energy
• Energy-efficiency and conservationstandards for the following: manufac-tured housing; automatic commercial icemakers; wine chillers; battery chargersand power supplies; televisions; residen-tial dehumidifiers; computer servers andcomputers; walk-in coolers and freezers;residential furnace fans, boilers, and mo-bile home furnaces; electric distributiontransformers; commercial refrigerationunits and heat pumps; clothes wash-ers and dryers; room air conditioners;portable air conditioners; dishwashers;pool heaters and direct heating equip-ment; fluorescent and incandescentlamps; metal halide lamp fixtures; smallelectric motors; refrigerated bottled orcanned beverage vending machines; andresidential central air conditioners andheat pumps
• Incentive program for manufacturingadvanced technology vehicles
Department of Commerce
• Right whale ship strike reduction• Taking of marine mammals incidental
to conducting geological and geophysi-cal exploration of mineral and energyresources on the outer continental shelf
Department of Education
• “Gainful Employment” rule to preparestudents for employment in a recognizedoccupation
• Income-driven “pay as you earn”program
• Race to the Top
Department of Health and Human Services
• Substances prohibited from use inanimal food or feed; registration of foodand animal feed facilities
• Updated standards for labeling of pet food• Over-the-counter drug review of topical
antimicrobial drug products• Revision of the Nutrition Facts and
Supplement Facts labels: serving sizes offoods that can reasonably be consumedin one eating occasion, dual-column la-beling, and modification of the referenceamounts customarily consumed
• Produce safety regulation• Sanitary transportation of human and
animal food• Focused mitigation strategies to protect
food against intentional adulteration• Federal policy for protection of human
subjects• Patient Protection and Affordable
Care Act; standards related to essentialhealth benefits, actuarial value, and ac-creditation; and Medicaid, exchanges,and children’s health insurance pro-grams: eligibility, appeals, and otherprovisions
• Price regulation: prospective paymentsystem rates for home health, acute, andlong-term hospital care; skilled nursingfacilities; inpatient rehabilitation facili-ties; and so on
• Nutrition labeling for food sold in vend-ing machines and for restaurant menuitems
• Food labeling: trans fatty acids in nutri-tion labeling, nutrient content claims,and health claims
• “Tobacco products” subject to theFederal Food, Drug, and Cosmetic Act,as amended by the Family Smoking Pre-vention and Tobacco Control Act
• Prevention of Salmonella enteritidis inshell eggs
Crews: Ten Thousand Commandments 2016 37
• Good manufacturing practice in manu-facturing, packing, or holding dietaryingredients and dietary supplements
• Good manufacturing practice regula-tions for finished pharmaceuticals
• Prior authorization process for certaindurable medical equipment, prosthetic,orthotics, and supplies
• Rule on comprehensive care for jointreplacement
• Criteria for determining whether a drugis considered usually self-administered
• Requirements for long-term care facili-ties: hospice services
• Bar-code label requirements for humandrug products and blood
• Pediatric dosing for various over-the-counter cough, cold, and allergyproducts
• Fire safety and sprinkler requirementsfor long-term care facilities
Department of Homeland Security
• Computer Assisted Passenger Prescreen-ing System, providing government accessto passenger reservation information
• Passenger screening using advanced bodyimaging technology
• Importer security filing and additionalcarrier requirements
• Air cargo screening and inspection oftowing vessels
• Minimum standards for driver’s licensesand ID cards acceptable to federalagencies
• United States Visitor and Immigrant Sta-tus Indicator Technology program, whichis authorized to collect biometric datafrom travelers and to expand to the 50most highly trafficked land border ports
Department of the Interior
• Revised requirements for well pluggingand platform decommissioning
• Increased safety measures for oil and gasoperations on the Arctic outer continen-tal shelf
• Blowout prevention for offshore oil andgas operations
Department of Justice
• Nondiscrimination on the basis ofdisability: accessibility of Web infor-mation and services of state and localgovernments
• National standards to prevent, detect,and respond to prison rape
• Retail sales of scheduled listed chemicalproducts
Department of Labor
• Conflict of interest rule in investmentadvice
• Group health plans and health insuranceissuers relating to coverage of preventiveservices under the Patient Protection andAffordable Care Act
• Walking working surfaces and personalfall protection systems (slips, trips, andfall prevention)
• Establishing a minimum wage for con-tractors (Executive Order No. 13658)
• Establishing paid sick leave for contrac-tors (Executive Order No. 13706)
• Application of the Fair Labor StandardsAct to domestic service
• Improved fee disclosure for pensionplans
• Occupational exposure to crystallinesilica, tuberculosis, and beryllium
• Rules regarding confined spaces inconstruction: preventing suffocation andexplosions
• Implementation of the health care ac-cess, portability, and renewability provi-sions of the Health Insurance Portabilityand Accountability Act of 1996
• Hearing conservation program for con-struction workers
• Reinforced concrete in construction• Preventing backover injuries and fatalities• Cranes and derricks• Health care standards for mothers and
newborns
38 Crews: Ten Thousand Commandments 2016
• Protective equipment in electric powertransmission and distribution
• Refuge alternatives for underground coalmines
• Combustible dust• Injury and illness prevention program
Department of Transportation
• Passenger car and light truck CorporateAverage Fuel Economy standards (2017model years and beyond)
• Fuel-efficiency standards for medium- and heavy-duty vehicles and work trucks
• Sound for hybrid and electric vehicles• Heavy-vehicle speed limiters and elec-
tronic stability control systems for heavyvehicles
• Requirement for installation of seat beltson motor coaches
• Carrier safety fitness determination• Hours of service, rest, and sleep for truck
drivers; electronic logging devices andhours-of-service supporting documents
• Flight crew duty limitations and restrequirements
• Standard for rearview mirrors• Commercial Driver’s License Drug and
Alcohol Clearinghouse• Automotive regulations for car lighting,
door retention, brake hoses, daytimerunning-light glare, and side-impactprotection
• Minimum training requirements for entry-level commercial motor vehicle operatorsand for operators and training instructorsof multiple trailer combination trucks
• Rear impact guards and other safetystrategies for single-unit trucks
• Amendments for positive train controlsystems
• Aging aircraft safety• Upgrade of head restraints in vehicles• Rear center lap and shoulder belt
requirement• Rear seat belt reminder system• Establishment of side-impact perfor-
mance requirements for child restraintsystems
• Registration and training for operatorsof propane tank filling equipment
• Monitoring systems for improved tiresafety and tire pressure
• Hazardous materials: transportation oflithium batteries
Environmental Protection Agency
• Control of air pollution from motorvehicles: Tier 3 motor vehicle emissionand fuel standards
• Greenhouse gas emissions and fuel-efficiency standards for medium- andheavy-duty engines and vehicles
• Standards of Performance for New Resi-dential Wood Heaters
• Oil and natural gas sector: emissionstandards for new and modified sources
• Model trading rules for greenhouse gasemissions from electric utility generat-ing places constructed before January7, 2014
• Financial responsibility requirementsunder CERCLA for certain hard-rockmining industry facilities
• Clean air visibility, mercury, and ozoneimplementation rules
• Effluent limitations guidelines andstandards for the steam electric powergenerating point source category
• Revision of stormwater regulations toaddress discharges from developed sites
• Formaldehyde emissions standards forcomposite wood products
• Review of National Ambient Air Qual-ity Standards for lead, ozone, sulfurdioxide, particulate matter, and nitro-gen dioxide
• Revision of underground storagetank regulations: revisions to existingrequirements and new requirements forsecondary containment and operatortraining
• Petroleum refineries—new source per-formance standards
• Rulemakings regarding lead-based paintand the Lead, Renovation, Repair, andPainting Program for public and com-mercial buildings
• National drinking water regulationscovering groundwater and surface water

Crews: Ten Thousand Commandments 2016 39
• National emission standards for hazard-ous air pollutants from plywood andcomposite wood products, certain recip-rocating internal combustion engines,and auto paints
• Renewable fuel standards• Standards for cooling water intake
structures• Combined rulemaking for industrial,
commercial, and institutional boilersand process heaters
• Standards for management of coal com-bustion wastes (“coal ash”) from electricpower producers
• Control of emissions from non-roadspark ignition engines, new locomotives,and new marine diesel engines
Architectural and Transportation Barriers Compliance Board
•
•
Americans with Disabilities Act accessi-bility guidelines for passenger vessels Information and communication tech-nology standards and guidelines
Office of Personnel Management
• Multistate exchanges; implementationsfor Affordable Care Act provisions
Consumer Product Safety Commission
• Flammability standards for upholsteredfurniture and bedclothes
• Testing, certification, and labeling ofcertain consumer products
• Banning of certain backyard playsets• Product registration cards for products
intended for children
Federal Communications Commission
• Net neutrality “open Internet” order• Broadband for passengers aboard aircraft• Broadband over power line systems
• Mobile personal satellitecommunications
• Satellite broadcasting signal carriagerequirements
• Rules regarding Internet protocol- enabled devices
Department of Housing and Urban Development
• Revision of manufactured home con-struction and safety standards regardinglocation of smoke alarms
• Instituting Smoke-Free Public Housing• Regulation of Fannie Mae and Freddie
Mac on housing goals• Regulations within the Real Estate
Settlement Procedures Act pertaining tomortgages and closing costs
• Refinement of income and rent determi-nations in public and assisted housing
Department of the Treasury
• Prohibition of funding of unlawfulInternet gambling
• Risk-based capital guidelines; capitaladequacy guidelines
• Assessment of fees for large bank hold-ing companies and other financial enti-ties supervised by the Federal Reserveto fund the Financial Research Fund(which includes the Financial StabilityOversight Council)
• Registration and Regulation of SwapDealers and Major Swap Participants;Registration and Regulation of Security-Based Swap Dealers and Major Security-Based Swap Participants
• Troubled Asset Relief Program stan-dards for compensation and corporategovernance
Federal Deposit Insurance Corporation
• Standardized Approach for Risk-Weighted Assets
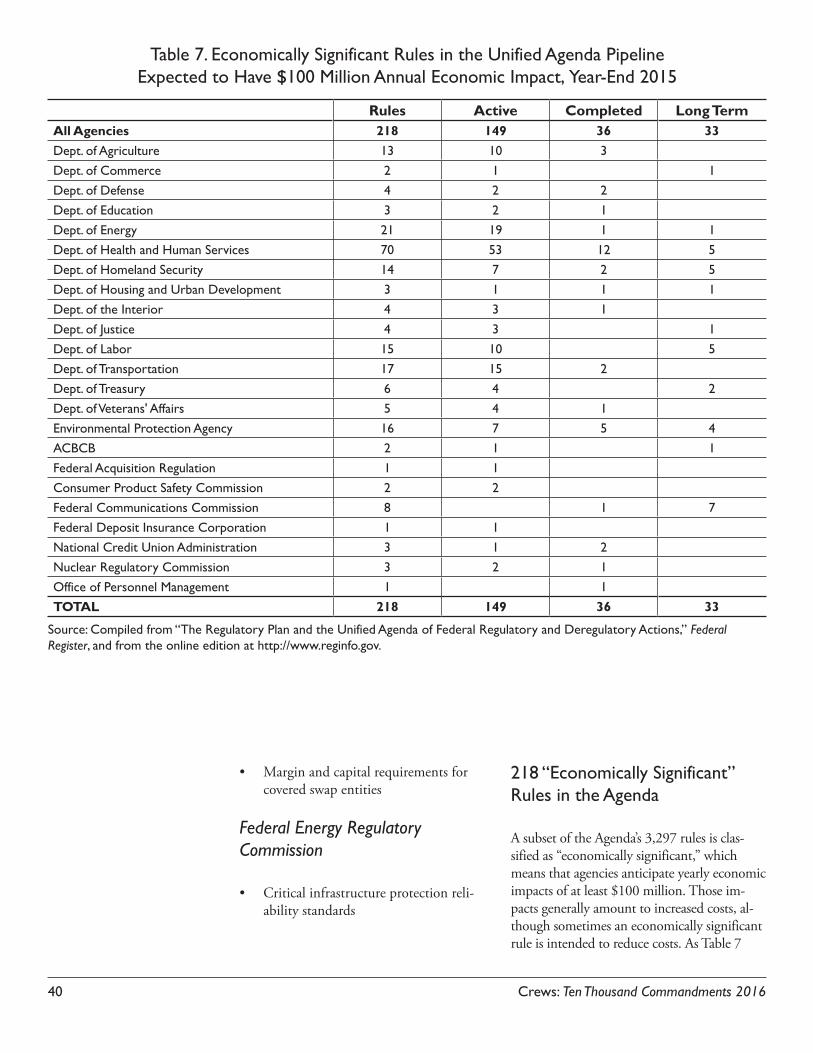
40 Crews: Ten Thousand Commandments 2016
• Margin and capital requirements forcovered swap entities
Federal Energy Regulatory Commission
• Critical infrastructure protection reli-ability standards
218 “Economically Significant” Rules in the Agenda
A subset of the Agenda’s 3,297 rules is clas-sified as “economically significant,” which means that agencies anticipate yearly economic impacts of at least $100 million. Those im-pacts generally amount to increased costs, al-though sometimes an economically significant rule is intended to reduce costs. As Table 7
Rules Active Completed Long TermAll Agencies 218 149 36 33Dept. of Agriculture 13 10 3Dept. of Commerce 2 1 1Dept. of Defense 4 2 2Dept. of Education 3 2 1Dept. of Energy 21 19 1 1Dept. of Health and Human Services 70 53 12 5Dept. of Homeland Security 14 7 2 5Dept. of Housing and Urban Development 3 1 1 1Dept. of the Interior 4 3 1Dept. of Justice 4 3 1Dept. of Labor 15 10 5Dept. of Transportation 17 15 2Dept. of Treasury 6 4 2Dept. of Veterans' Affairs 5 4 1Environmental Protection Agency 16 7 5 4ACBCB 2 1 1Federal Acquisition Regulation 1 1Consumer Product Safety Commission 2 2Federal Communications Commission 8 1 7Federal Deposit Insurance Corporation 1 1National Credit Union Administration 3 1 2Nuclear Regulatory Commission 3 2 1Office of Personnel Management 1 1TOTAL 218 149 36 33
Source: Compiled from “The Regulatory Plan and the Unified Agenda of Federal Regulatory and Deregulatory Actions,” Federal Register, and from the online edition at http://www.reginfo.gov.
Table 7. Economically Significant Rules in the Unified Agenda Pipeline Expected to Have $100 Million Annual Economic Impact, Year-End 2015

Crews: Ten Thousand Commandments 2016 41
shows, 218 economically significant rules (up from 200 last year) from 23 separate depart-ments and agencies appear at the active (pre-rule, proposed rule, and final rule), completed, and long-term stages.
While the overall number of rules in the Agenda has declined, the overall number of “economically significant” rules in the pipeline during the current administration is considerably higher than earlier in the decade. President George W. Bush started an uptick; President Obama continued it, increasing the flow of costly economically significant rules at the completed and active stages. As Figure 19 shows, 2015’s 218 rules are a 9 percent increase over the previous year’s 200, but they are not the highest level of the current administration.
Recent online database editions of the Agenda break economically significant rules into completed, active, and long-term cate-gories. Among the 218 rules, the body of ac-
tive economically significant rules in the fall Agenda has topped 130 for all but the first of Obama’s seven years in office. (His seven-year average is 135; the George W. Bush eight-year average was 87.)
Obama’s level of completed rules in the fall 2015 Unified Agenda has also been consis-tently higher than those under Bush, even taking into account the drop since 2012 that appears to conform with the effort to dial back on regulations during that election year. Completed rules in the fall agenda peaked at 57 in 2012 and stand at 36 in 2015. Figure 20 isolates the totals of completed economi-cally significant rules from both the spring and the fall Agendas for closer analysis of yearly trends in this category.
As Figure 20 shows, the annual totals for com-pleted economically significant rules are down substantially from the 2010 peak of 81. They stand at 61 in 2015, which is still higher than in any year of the Bush administration save
Figure 19. Economically Significant Rules in the Unified Agenda Pipeline, 2003–2015
0
50
100
150
200
250
Long-termActiveCompleted
2015201420132012201120102009200820072006200520042003
Num
ber
of R
ules
Year
127 136 136 141
160
180 184
224212
28
84
24
26
83
27
34
75
32
31
103
26
37
110
33
28
123
33
33
140
51
29
138
45
224
19131
32
136131
5728
218
36
149
33
200
38
131
31
33
71
23
Source: Compiled from “The Regulatory Plan and Unified Agenda of Federal Regulatory and Deregulatory Actions,” Federal Register, Fall edition, various years.
The overall number of
“economically significant” rules in the pipeline
during the current administration is considerably
higher than earlier in the decade.

42 Crews: Ten Thousand Commandments 2016
2001 and higher than in the Clinton years shown. In fact, apart from 2001, the level of completed economically significant rules from 2008 forward is notably higher than dur-ing the earlier part of the decade and the late 1990s. For completed economically signifi-cant rules, the average for Obama’s seven years so far is 67; George W. Bush’s average over his eight years was 49. This takes into account that only one edition of the Unified Agenda appeared in 2012. (Also, some agency “mid-night regulations” may have been issued by the Bush administration in 2009 as Obama was taking office, though the Obama admin-istration did issue a freeze to review Bush rules upon assuming office.82)
Each of the 218 economically significant rules scattered among the 3,297 rules in the Agenda is reckoned to have annual impacts of at least $100 million when implemented. So taken together, those rules might be ex-
pected to impose annual costs of at least $22 billion (218 rules multiplied by the $100 million economically significant threshold). Some rules, however, may decrease costs, which would offset this total. Yet, whatever the elusive actual total cost, these costs are cumulative, as they are recurring annual costs to be added to previous years’ costs. And, as noted, agencies are not limited to what they list in the Agenda.
Paying the most attention to economically sig-nificant rules should not tempt policy makers and analysts into ignoring the remaining bulk of rules in the yearly pipeline. In 2015, 3,079 federal rules were not designated as officially economically significant by the government (3,297 total rules minus the 218 economically significant ones). But that categorization does not mean that many of those rules are not economically significant in the ordinary sense of such a phrase. A rule may cost up to $99
Figure 20. Annual Completed Economically Significant Rules in the Unified Agenda, 1996–2014N
umbe
r of
Rul
es
Year
0
20
40
60
80
100
FallSpring
20152014201320122011201020092008200720062005200420032002200120001999199819971996
42
27
1523
1420
15
49
2115 16 21 16 15
29 37 30 23
23
13
2129
26
1723 24
2732
26
33
33
51
28
57
57
46
27
41
35
75
38 38 40
48 48
41
62
70
81
34
45
79
25
36
61
38
31
69
51
Sources: Compiled from “The Regulatory Plan and Unified Agenda of Federal Regulatory and Deregulatory Actions,” Federal Register, Spring and Fall editions, various years.
Paying the most attention to economically
significant rules should not tempt
policy makers and analysts
into ignoring the remaining bulk of rules in the yearly
pipeline.

Crews: Ten Thousand Commandments 2016 43
million and escape the official “economically significant” designation.
Federal Regulations Affecting Small Business
It is often said that there is no such thing as a free lunch, something particularly true for the small businessperson. The “Small Busi-ness Anthem,” heard on the Small Business Advocate radio program, goes in part:83
Even though you make payroll every Friday,
You don’t have a guaranteed paycheck.
You’re a small business owner, and you eat what you kill.
The Regulatory Flexibility Act (RFA) di-rects federal agencies to assess their rules’ ef-fects on small businesses.84 Figure 21 shows the number of rules requiring annual RFA
analysis, as well as other rules that are an-ticipated by agencies to affect small business but do not require an annual RFA analysis. The number of rules acknowledged to sig-nificantly affect small business has dropped substantially since 2012, probably reflecting reporting changes noted already. At the end of 2015, overall rules affecting small business stood at 674, the same as 2014 but down from 854 in 2012. Before the 2013 drop, the number of rules with small-business impacts during the Obama administration regularly exceeded 800, which had not occurred since 2003.
Of those 674 rules in play with small-busi-ness impacts, 386 required an RFA, a drop from the peak of 470 requiring an RFA in 2012 (2012’s 470 rules had been a 12.4 per-cent increase over 2011 and far above any-thing seen in the past decade). Another 288 rules were otherwise deemed by agencies to affect small business but not to rise to the level of requiring an RFA. In the past three years, disclosure of this category of rules ap-pears to have diminished.
Figure 21. Rules Affecting Small Business, 2003–2015
0
200
400
600
800
1,000
RFA not requiredRFA required
2015201420132012201120102009200820072006200520042003
859789 788 787 757 753 758
845 822
489430 398 410 382 356 386
Num
ber
of R
ules
Year
417404
370 359 390 377 375 397372
428 418
854
384
470
669
278
391
674
300
374
674
288
386
Sources: Compiled from “The Regulatory Plan and Unified Agenda of Federal Regulatory and Deregulatory Actions,” Federal Register, Fall edition, various years.
A rule may cost up to $99 million
and escape the official
“economically significant” designation.

44 Crews: Ten Thousand Commandments 2016
Notable here is that, even though the over-all reported number of rules affecting small business is down, the average of Obama’s seven years so far, 406, exceeds Bush’s eight-year average of 377.
Table 8 breaks out the 2015 Agenda’s 674 rules affecting small business by depart-
ment, agency, and commission. Five of them—the Federal Communications Com-mission and the Departments of Agri-culture, Commerce, Health and Human Services, and Transportation—account for 402, or 60 percent, of the rules affecting small business.
* Committee for Purchase from People Who Are Blind or Severely Disabled.
Table 8. Unified Agenda Entries Affecting Small Business by Department, Agency, and Commission, Year-End 2014
Total Rules
Number Affecting Small Business
% Affect-ing Small Business Top 5
RFA Required RFA Not Required
TotalActive Completed L-T Active Completed L-TDept. of Agriculture 155 19 5 11 3 2 40 25.8 40Dept. of Commerce 246 39 29 2 26 11 2 109 44.3 109Dept. of Defense 117 1 7 2 10 8.5Dept. of Education 25 1 1 4.0Dept. of Energy 107 4 1 1 2 8 7.5Dept. of Health & Human Services 213 36 9 2 31 8 7 93 43.7 93
Dept. of Homeland Security 130 9 6 3 4 22 16.9
Dept. of Housing & Urban Development 52 1 1 1.9
Dept. of the Interior 288 9 18 5 3 35 12.2Dept. of Justice 100 1 4 4 9 9.0Dept. of Labor 97 9 1 2 8 1 1 22 22.7Dept. of State 44 8 4 6 18 40.9Dept. of Transportation 210 20 4 19 8 10 61 29.0 61Dept. of Treasury 391 1 22 23 5.9Dept. of Veterans' Affairs 80 1 1 1.3
Environmental Protection Agency 188 5 2 1 3 1 12 6.4
Agency for International Development 8 0 0.0
Architectural and Transportation Barriers Compliance Board
6 1 1 2 33.3
Commission on Civil Rights 1 0 0.0
CPBSD* 2 0 0.0

Crews: Ten Thousand Commandments 2016 45
Total Rules
Number Affecting Small Business
% Affect-ing Small Business Top 5
RFA Required RFA Not Required
TotalActive Completed L-T Active Completed L-TCommodity Futures Trading Commission 34 0 0.0
Consumer Financial Protection Bureau 23 3 1 4 17.4
Consumer Product Safety Commission 45 2 2 4.4
Corp. for National and Community Service 7 0 0.0
Court Sevices/Offender Supervision, D.C. 4 0 0.0
Federal Acquisition Regulation 42 16 3 1 2 22 52.4
Equal Employment Opportunity Comm. 8 2 2 25.0
Farm Credit Administration 27 0 0.0
Federal Communications Commission
133 2 94 3 99 74.4 99
Federal Deposit Insurance Corporation 25 0 0.0
Federal Energy Regulatory Commission 25 0 0.0
Federal Housing Finance Agency 20 0 0.0
Federal Maritime Commission 8 1 1 12.5
Federal Reserve System 18 3 1 4 22.2Federal Trade Commission 20 13 3 2 18 90.0
General Services Administration 21 4 4 2 10 47.6
Gulf Coast Ecosystem Restoration Council 4 0.0
Institute of Museum and Library Services 1 0 0.0
National Aeronautics and Space Administration 14 1 1 7.1
National Archives and Records Administration 8 0 0.0
National Council on Disability 1 0.0
National Credit Union Administration 26 0 0.0
(continued)

46 Crews: Ten Thousand Commandments 2016
Total Rules
Number Affecting Small Business
% Affect-ing Small Business Top 5
RFA Required RFA Not Required
TotalActive Completed L-T Active Completed L-TNational Endowment for the Arts 7 2 2 28.6
National Endowment for the Humanities 4 0 0.0
National Indian Gaming Commission 9 0 0.0
National Science Foundation 1 0 0.0
National Transportation Safety Board 15 0.0
Nuclear Regulatory Commission 65 2 1 3 4.6
Office of Government Ethics 5 0 0.0
Office of Management and Budget 4 0 0.0
Office of National Drug Control Policy 1 0.0
Office of Personnel Management 40 0 0.0
Peace Corps 3 0 0.0Pension Benefit Guaranty Corporation 12 0 0.0
Railroad Retirement Board 1 0 0.0
Securities and Exchange Commission 69 9 1 1 11 15.9
Small Business Administration 33 19 3 2 2 1 1 28 84.8
Social Security Administration 42 0 0.0
Surface Transportation Board 12 0 0.0
TOTAL 3,297 213 61 112 190 53 45 674 20.4 402
386 288 60% of total
Source: Compiled from “The Regulatory Plan and Unified Agenda of Federal Regulatory and Actions.” Note: RFA = regulatory flexibility analysis; L-T = long term.
Table 8. Unified Agenda Entries Affecting Small Business by Department, Agency, and Commission, Year-End 2014 (continued)

Crews: Ten Thousand Commandments 2016 47
The overall proportion of total rules af-fecting small business, as noted in Table 8, stands at 20.4 percent, but the range is quite wide among agencies. (For the numbers of rules affecting small business broken down by department and agency for fall Agendas since 1996, see Appendix: Historical Tables, Part H.)
For further perspective on the small-business regulatory climate, Box 1 depicts a partial list of the basic, non-sector-specific laws and regulations that affect small business.
Federal Regulations Affecting State and Local Governments
Ten Thousand Commandments primarily em-phasizes regulations imposed on the private sector. However, state and local officials’ realization during the 1990s that their own priorities were being overridden by federal mandates generated demands for reform. As a result, the Unfunded Mandates Act was passed in 1995, requiring lawmakers to pay
Assumes nonunion, nongovernment contractor, with interstate operations and a basic employee benefits package. Includes general workforce-related regulation only. Omitted are (a) categories such as environmental and consumer product safety regulations and (b) regulations applying to specific types of businesses, such as mining, farming, trucking, or financial firms.
1 EMPLOYEE• Fair Labor Standards Act (overtime and minimum
wage [27 percent minimum wage increase since 1990])
• Social Security matching and deposits• Medicare, Federal Insurance Contributions Act
(FICA)• Military Selective Service Act (allowing 90 days leave
for reservists; rehiring of discharged veterans)• Equal Pay Act (no sex discrimination in wages)• Immigration Reform Act (eligibility must be docu-
mented)• Federal Unemployment Tax Act (unemployment
compensation)• Employee Retirement Income Security Act (standards
for pension and benefit plans)• Occupational Safety and Health Act• Polygraph Protection Act
4 EMPLOYEES: ALL THE ABOVE, PLUS• Immigration Reform Act (no discrimination with
regard to national origin, citizenship, or intention to obtain citizenship)
15 EMPLOYEES: ALL THE ABOVE, PLUS• Civil Rights Act Title VII (no discrimination with
regard to race, color, national origin, religion, or sex; pregnancy-related protections; record keeping)
• Americans with Disabilities Act (no discrimination, reasonable accommodations)
20 EMPLOYEES: ALL THE ABOVE, PLUS• Age Discrimination Act (no discrimination on the
basis of age against those 40 and older)• Older Worker Benefit Protection Act (benefits for older
workers must be commensurate with younger workers)• Consolidation Omnibus Budget Reconciliation Act
(COBRA) (continuation of medical benefits for up to 18 months upon termination)
25 EMPLOYEES: ALL THE ABOVE, PLUS• Health Maintenance Organization Act (HMO Option
required)• Veterans’ Reemployment Act (reemployment for
persons returning from active, reserve, or National Guard duty)
50 EMPLOYEES: ALL THE ABOVE, PLUS• Family and Medical Leave Act (12 weeks unpaid leave
or care for newborn or ill family member)
100 EMPLOYEES: ALL THE ABOVE, PLUS• Worker Adjusted and Retraining Notification Act
(60-days written plant closing notice)• Civil Rights Act (annual EEO-1 form)
Box 1. Federal Workplace Regulation Affecting Growing Businesses
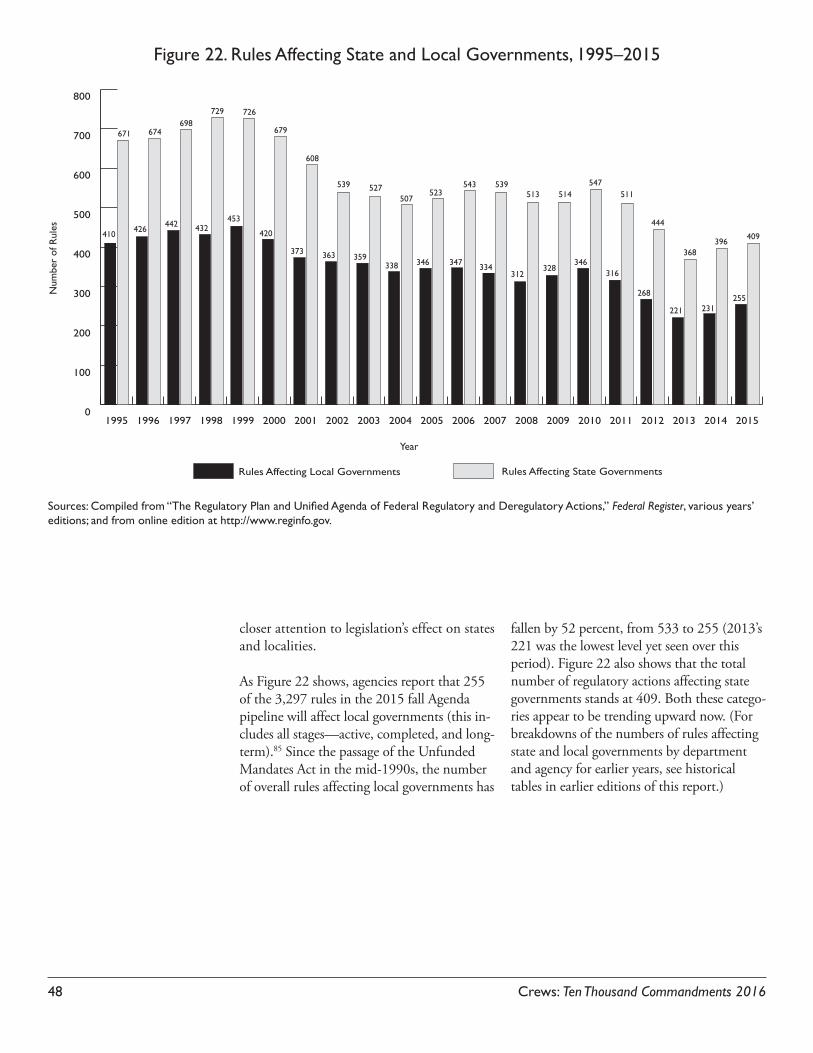
48 Crews: Ten Thousand Commandments 2016
closer attention to legislation’s effect on states and localities.
As Figure 22 shows, agencies report that 255 of the 3,297 rules in the 2015 fall Agenda pipeline will affect local governments (this in-cludes all stages—active, completed, and long-term).85 Since the passage of the Unfunded Mandates Act in the mid-1990s, the number of overall rules affecting local governments has
fallen by 52 percent, from 533 to 255 (2013’s 221 was the lowest level yet seen over this period). Figure 22 also shows that the total number of regulatory actions affecting state governments stands at 409. Both these catego-ries appear to be trending upward now. (For breakdowns of the numbers of rules affecting state and local governments by department and agency for earlier years, see historical tables in earlier editions of this report.)
Figure 22. Rules Affecting State and Local Governments, 1995–2015N
umbe
r of
Rul
es
Year
0
100
200
300
400
500
600
700
800
Rules Affecting State GovernmentsRules Affecting Local Governments
201520142013201220112010200920082007200620052004200320022001200019991998199719961995
511
316
444
268
368
221
396409
231255
547
346
514
328
513
312
539
334
543
347
523
346
507
338363
539 527
359
608
373
679
420
453
726729
432
698
442426
674
410
671
Sources: Compiled from “The Regulatory Plan and Unified Agenda of Federal Regulatory and Deregulatory Actions,” Federal Register, various years’ editions; and from online edition at http://www.reginfo.gov.

Crews: Ten Thousand Commandments 2016 49
Government Accountability Office Database on Regulations
The various federal reports and databases on regulations serve different purposes:
• The Federal Register shows the aggregate number of proposed and final rules (both those that affect the private sector and those that deal with internal govern-ment machinery or programs).
• The Unified Agenda shows agency regulatory priorities and provides details about the overall number of rules at various stages in the regulatory pipe-line, as well as those with economically significant effects and those affect-ing small business and state and local governments.
The 1996 Congressional Review Act (CRA) requires agencies to submit reports to Con-gress on their major rules—those with an-nual estimated costs of $100 million or more. Owing to such reports, which are maintained in a database at the Government Accountability Office (GAO), one can more readily observe (a) which of the thousands of final rules that agencies issue each year are major and (b) which agencies are producing the rules.86
The CRA gives Congress a window of 60 legislative days in which to review a major rule and, if desired, pass a resolution of disap-proval rejecting the rule. Despite the issuance of thousands of rules since the Act’s passage, including many dozens of major rules, only one has been rejected: the Department of Labor’s rule on workplace repetitive-motion injuries in early 2001. According to a recent review, however, final rules are no longer properly submitted to the GAO and to Con-gress as required under the CRA.87
Table 9, derived from the GAO database of major rules, depicts the number of final ma-jor rule reports issued by the GAO regard-ing agency rules through 2015. There were 76 rules in 2015, according to the GAO’s database, and 81 in 2014.88 The 100 rules in 2010 was the highest count since this tabula-tion began following passage of the CRA; 50 rules in 2003 was the lowest.
Mirroring what was seen as the most active ex-ecutive and independent rule-making agencies in Table 6, the Departments of Health and Human Services, the Interior, and the Trea-sury, along with the Environmental Protection Agency and the Securities and Exchange Com-mission, have been particularly active.
President George W. Bush averaged 63 ma-jor rules annually during his eight years in office; President Obama’s seven years so far have averaged 81, or a 29 percent higher aver-age annual output than that of Bush. Obama has already issued 570 major rules over seven years, compared with Bush’s 505 over eight years. This parallels the depiction of economi-cally significant rules in Figures 19 and 20. Despite declines in overall rule counts in the Unified Agenda, the Obama administration’s output level of higher-impact rules during the decade is notably higher.
A May 2015 Heritage Foundation analysis of the current administration’s regulatory record isolated the major rules listed in the GAO database affecting only the private sector and distinguished between those that are deregula-tory and those that are regulatory. This report found that 184 major rules adopted during the Obama administration have added almost $80 billion in annual costs.89
Obama has already issued
570 major rules over seven years, compared with Bush’s 505 over
eight years.

50 Crews: Ten Thousand Commandments 2016
Tabl
e 9.
Gov
ernm
ent A
ccou
ntab
ility
Offi
ce R
epor
ts o
n M
ajor
Rul
es a
s R
equi
red
by t
he C
ongr
essi
onal
Rev
iew
Act
, 19
99–2
015
2015
2014
2013
2012
2011
2010
2009
2008
2007
2006
2005
2004
2003
2002
2001
2000
1999
Ach
itect
ural
Bar
rier
s C
ompl
ianc
e Bo
ard
11
Bure
au o
f Con
sum
er F
inan
cial
Pr
otec
tion
24
11
Com
mod
ity F
utur
es T
radi
ng
Com
mis
sion
14
96
Con
sum
er P
rodu
ct S
afet
y C
omm
issi
on1
1
Dep
artm
ent
of A
gric
ultu
re7
84
24
612
37
86
74
79
6
Dep
artm
ent
of C
omm
erce
22
12
12
5
Dep
artm
ent
of D
efen
se2
14
46
12
31
Dep
artm
ent
of E
duca
tion
12
54
25
62
12
1
Dep
artm
ent
of E
nerg
y2
63
15
47
33
11
33
Dep
artm
ent
of H
ealth
and
H
uman
Ser
vice
s18
2724
2324
2417
2419
1622
2217
1315
177
Dep
artm
ent
of H
omel
and
Secu
rity
32
21
13
15
42
32
2
Dep
artm
ent
of H
ousi
ng a
nd
Urb
an D
evel
opm
ent
12
11
21
11
21
Dep
artm
ent
of Ju
stic
e1
13
11
13
4
Dep
artm
ent
of L
abor
13
33
26
12
33
11
23
5
Dep
artm
ent
of t
he In
teri
or6
66
76
77
105
66
87
78
96
Dep
artm
ent
of S
tate
11
1
Dep
artm
ent
of T
rans
port
atio
n3
33
22
56
83
13
54
63
4
Dep
artm
ent
of T
reas
ury
76
32
14
11
11
11
Dep
artm
ent
of V
eter
ans A
ffair
s4
31
12
22
11
21
3
Emer
genc
y O
il an
d G
as L
oan
Boar
d1
Emer
genc
y St
eel G
uara
ntee
Loa
n Bo
ard
1
Envi
ronm
enta
l Pro
tect
ion
Age
ncy
82
35
68
39
28
37
31
420
5
Equa
l Em
ploy
men
t O
ppor
tuni
ty
Com
mis
sion
1
Fede
ral C
omm
unic
atio
ns
Com
mis
sion
11
16
21
14
23
36
6
Fede
ral D
epos
it In
sura
nce
Cor
pora
tion
11
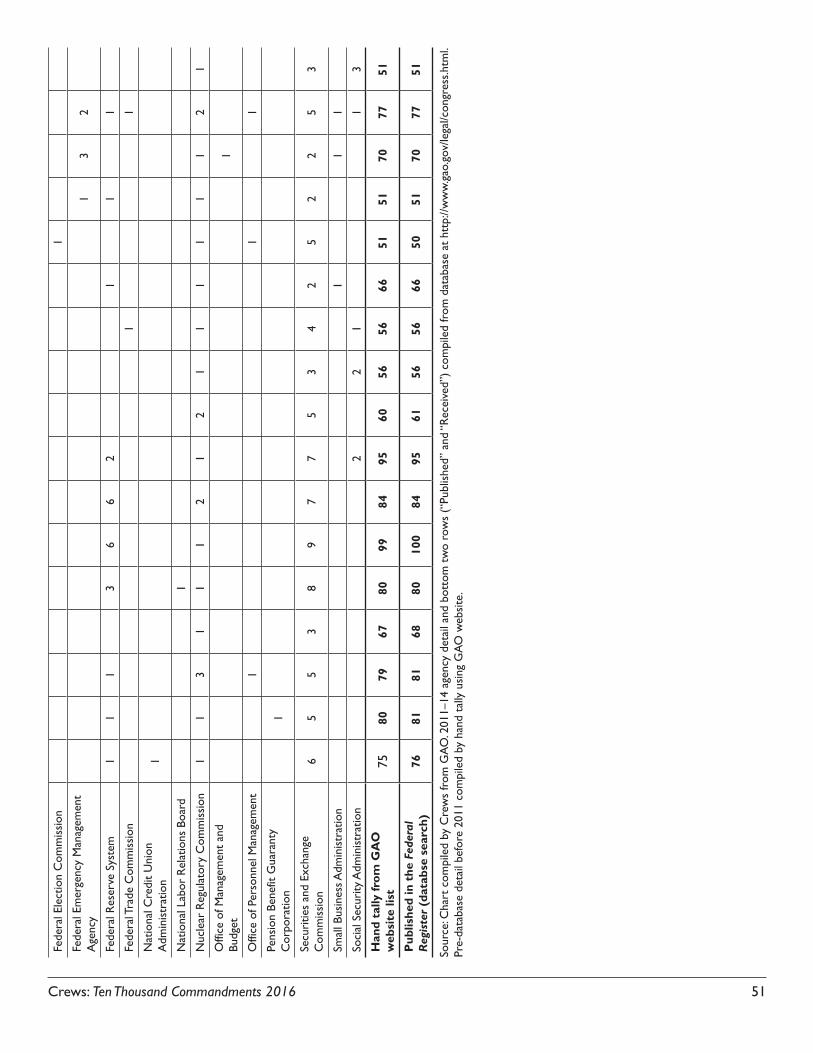
Crews: Ten Thousand Commandments 2016 51
Fede
ral E
lect
ion
Com
mis
sion
1
Fede
ral E
mer
genc
y M
anag
emen
t A
genc
y1
32
Fede
ral R
eser
ve S
yste
m1
11
36
62
11
1
Fede
ral T
rade
Com
mis
sion
11
Nat
iona
l Cre
dit
Uni
on
Adm
inis
trat
ion
1
Nat
iona
l Lab
or R
elat
ions
Boa
rd1
Nuc
lear
Reg
ulat
ory
Com
mis
sion
11
31
11
21
21
11
11
12
1
Offi
ce o
f Man
agem
ent
and
Budg
et1
Offi
ce o
f Per
sonn
el M
anag
emen
t1
11
Pens
ion
Bene
fit G
uara
nty
Cor
pora
tion
1
Secu
ritie
s an
d Ex
chan
ge
Com
mis
sion
65
53
89
77
53
42
52
25
3
Smal
l Bus
ines
s Adm
inis
trat
ion
11
1
Soci
al S
ecur
ity A
dmin
istr
atio
n2
21
13
Han
d ta
lly fr
om G
AO
w
ebsi
te li
st75
8079
6780
9984
9560
5656
6651
5170
7751
Pub
lishe
d in
the
Fed
eral
R
egis
ter
(dat
abse
sea
rch)
7681
8168
8010
084
9561
5656
6650
5170
7751
Sour
ce: C
hart
com
pile
d by
Cre
ws
from
GA
O. 2
011–
14 a
genc
y de
tail
and
bott
om t
wo
row
s (“
Publ
ishe
d” a
nd “
Rec
eive
d”)
com
pile
d fr
om d
atab
ase
at h
ttp:
//ww
w.g
ao.g
ov/le
gal/c
ongr
ess.
htm
l. Pr
e-da
taba
se d
etai
l bef
ore
2011
com
pile
d by
han
d ta
lly u
sing
GA
O w
ebsi
te.
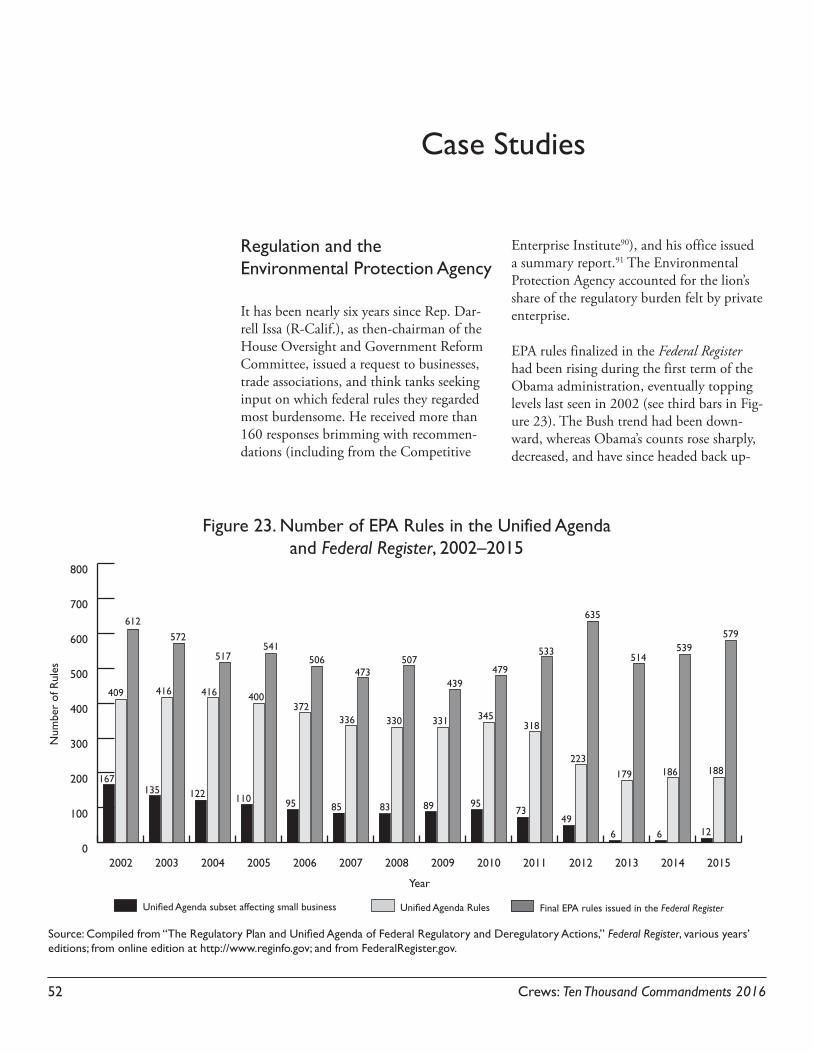
52 Crews: Ten Thousand Commandments 2016
Case Studies
Regulation and the Environmental Protection Agency
It has been nearly six years since Rep. Dar-rell Issa (R-Calif.), as then-chairman of the House Oversight and Government Reform Committee, issued a request to businesses, trade associations, and think tanks seeking input on which federal rules they regarded most burdensome. He received more than 160 responses brimming with recommen-dations (including from the Competitive
Enterprise Institute90), and his office issued a summary report.91 The Environmental Protection Agency accounted for the lion’s share of the regulatory burden felt by private enterprise.
EPA rules finalized in the Federal Register had been rising during the first term of the Obama administration, eventually topping levels last seen in 2002 (see third bars in Fig-ure 23). The Bush trend had been down-ward, whereas Obama’s counts rose sharply, decreased, and have since headed back up-
Figure 23. Number of EPA Rules in the Unified Agenda and Federal Register, 2002–2015
Unified Agenda subset affecting small business Unified Agenda Rules Final EPA rules issued in the Federal Register
Num
ber
of R
ules
Year
612
572
517541
506473
507
330
439479
533
635
514539
579
223
179 186 188
496 6 12
73
318345
95
331
8983
336
85
372
95
400
110
416
122
416
135
409
167
0
100
200
300
400
500
600
700
800
20152014201320122011201020092008200720062005200420032002
Source: Compiled from “The Regulatory Plan and Unified Agenda of Federal Regulatory and Deregulatory Actions,” Federal Register, various years’ editions; from online edition at http://www.reginfo.gov; and from FederalRegister.gov.

Crews: Ten Thousand Commandments 2016 53
ward. Under Obama, finalized EPA rules rose from 439 to 635 between 2009 and 2012—a 45 percent increase—before drop-ping 19 percent to 514 in 2013. Between 2013 and 2015, the count rose 12.6 percent to 579.
Note the Unified Agenda count and the just-noted actual rule count suspiciously diverg-ing. There has been a substantial drop-off in the Agenda-listed rules issued by EPA over the past few years compared with the higher levels of EPA rules finalized in the Federal Register, as seen in Figure 23. The past three years’ Agenda counts have been interesting, because the EPA did not appear among the top five rule-making agencies in the Unified Agenda pipeline (it is again sixth with 188 rules; see Table 6). In the past two years, the EPA rules in the Unified Agenda pipeline did rise slightly, from 179 to 188, but they had otherwise been dropping since 2010, to 179 in 2013, which was the lowest level of the decade. As of April 26, 2016, the EPA had finalized 139 rules in the Federal Register.
The agency also no longer ranks among the agencies with the most rules in the Unified Agenda that affect small business. Note, also in Figure 23, the implausible 88 percent drop from 49 rules affecting small business in 2012 to only six in both 2013 and 2014, and then 12 in 2015.
Where did all the EPA’s Agenda rules go? Box 2 shows a breakdown of the agency’s 2011-2013 Unified Agenda–listed rules by stage of completion. One can see that chunks of the
EPA’s active, completed, and long-term rules simply vanished during that interval. Such a drop-off does not square with the level of regulatory impact driven by the EPA, but can be partly explained by the earlier discussion of rule delays and the Sunstein and Shelan-ski memoranda and their possible effect on reporting policy in the Unified Agenda. Recall too that only one Agenda, not the required two, appeared in 2012.
The EPA is not likely to roll back regulatory pursuits, as may be inferred from the Obama administration’s public statements about acting on energy and environmental policy unilaterally. Many noteworthy rules were listed earlier in this report in “Notable Regu-lations by Agency.” An October 2012 Senate Minority Report from Sen. James Inhofe (R-Okla.), then-ranking member of the Sen-ate Committee on Environment and Public Works, detailed what it called “Numerous Obama-EPA Rules Placed on Hold until af-ter the Election.”92 Those rules include the following:
• Greenhouse gas regulations• Ozone rule• Hydraulic fracturing rule• Florida numeric nutrient criteria (water
quality rules)• Guidance documents for waters covered
by the Clean Water Act• Stormwater regulation• Tier 3 gas regulations• Maximum achievable control technolo-
gies rules for industrial boilers and for cement
Box 2. Dropoff in Active, Completed, and Long-Term EPA Rules in the Unified Agenda
Total Active Completed Long Term2011 318 175 82 612012 223 117 71 352013 179 134 21 24

54 Crews: Ten Thousand Commandments 2016
• Power plant cooling towers rule• Coal ash rule• Farm dust regulations• Spill prevention control and counter-
measure rule
Various years’ editions of the Office of Man-agement and Budget’s Report to Congress on the Benefits and Costs of Federal Regulations attest to the EPA’s status as one of the more costly regulators. For example, the 2013 draft report had presented a range of total costs of $14.8 billion to $19.5 billion added during the fiscal year for the four rules for
which quantified cost-benefit analysis oc-curred. Well over half was attributable to the EPA: $8.3 billion to the agency exclusively and another $5.3 billion to $8.8 billion to the EPA and Department of Transportation’s fuel economy standards.93 In the 2015 re-port, 13 rules were claimed to cost only $3.0 to $4.4 billion, but EPA rules accounted for $1.6 billion, likely at least half. Overall, this author’s survey of available information yields an estimate of the annual impact of EPA rules at $386 billion, or 2.1 percent of GDP.94 That amount is still less than the 2.4 percent of GDP the EPA once anticipated.95

Crews: Ten Thousand Commandments 2016 55
The Federal Communications Commis-sion (FCC) is by no means the heavyweight among regulators as gauged by the num-ber of rules issued. Its tally of 133 rules in the Unified Agenda pipeline is surpassed by seven other departments or agencies (see Table 5), and its count of eight economi-cally significant rules is exceeded by those of seven other agencies (see Table 7). Yet the FCC merits singling out for review because it wields great influence over a major eco-nomic sector regarded as a growth engine in today’s economy: telecommunications,
the Internet, and the information economy generally.
The FCC is an expensive agency. It spent an estimated $464 million on regulatory devel-opment and enforcement during FY 201596 and likely accounts for more than $100 billion in annual regulatory and economic impact.97 Figure 24 shows the numbers of FCC’s final rules in the Federal Register dur-ing the past decade, its overall rules in the fall Unified Agenda, and its Agenda rules with small-business impacts.
Regulation and the Federal Communications Commission
Figure 24. Number of FCC Rules in the Unified Agenda and Federal Register, 2002–2015
Unified Agenda subset affecting small business Unified Agenda Rules Final rules issued in the Federal Register
Num
ber
of R
ules
Year
313
286 286
232
188
109
162
143128
100
130
109118
8999 98
132 135 132144
9099
133
78
103
147
112
145
110106
145
109
139
108
143
113
146
113
134
104
141
109
0
50
100
150
200
250
300
350
20152014201320122011201020092008200720062005200420032002
Source: Compiled from “The Regulatory Plan and Unified Agenda of Federal Regulatory and Deregulatory Actions,” Federal Register, various years’ editions; from online edition at www.reginfo.gov; and from FederalRegister.gov.
56 Crews: Ten Thousand Commandments 2016
According to the National Archives’ online database, FCC final rules in the Federal Reg-ister numbered as high as 313 back in 2002 and then declined steadily during the decade to lows of 109 in 2012 and 90 in 2015 (see third bars in Figure 24). There had been a bump upward of 32 percent between 2012 and 2014 (from 109 to 144).98 As of April 26, 2016, the FCC had finalized 32 rules in the Federal Register.
Of the 3,297 total rules in the 2015 fall Agenda pipeline, 133, or 4 percent, were in the works at the FCC (Figure 24). The com-mission’s Agenda presence remained rather flat during the decade before dropping rap-idly to a low of 103 rules in 2011, but it has been rising since. Ninety-nine of the FCC’s rules in the fall 2015 pipeline, or 74 percent of its total, affect small business, as Figure 24 and Table 8 show.
Although the FCC has published fewer rules in the Agenda and has finalized fewer than in preceding years, a pro-regulatory mind-set prevails at the commission, most recently seen in the February 2015 push to apply utility regulation to broadband in alleged pursuit of so-called net neutrality, now be-ing litigated.99 Once again, an agency’s rule count is not all that matters, because a hand-ful of rules can have an outsized impact. Today’s vibrant and robust communications markets are not fragile contrivances requiring fine-tuning by government bodies.100 Com-munications markets do not exhibit abuses and market failures calling for top-down
rulemaking with respect to each and every new technological advance. Yet the FCC forges ahead to expand its domain in disre-gard of the outdated character of its original mandate to police public airwaves character-ized by scarcity. Such conditions no longer apply today, when everyone is a potential broadcaster.
The FCC has continued the net neutrality push despite having already been rebuffed in federal court following earlier attempts and despite the concerns of many in Con-gress, which never delegated authority to the commission.101 Although a January 2014 federal court decision102 struck down part of the FCC’s open Internet order,103 it exposed the Internet to even wider FCC regulation—and the commission has re-sponded accordingly.104 In recent years, the FCC has also inserted itself into other mat-ters, including multicast must-carry regula-tion, media ownership restrictions, video game violence portrayal, and wireless net neutrality.105
As noted, of the 218 economically significant rules in the works across the entire federal government, eight belong to the FCC (see Table 7) and are presented in Box 3. Such rulemakings, along with other FCC rules in the Agenda pipeline and the hundreds made final each year, present opportunities for ei-ther liberalization of telecommunications or avenues for new central regulatory oversight and protracted legal battles.106 The commis-sion has chosen the latter.
Today’s vibrant and robust
communications markets are not fragile
contrivances requiring fine-
tuning by government
bodies.
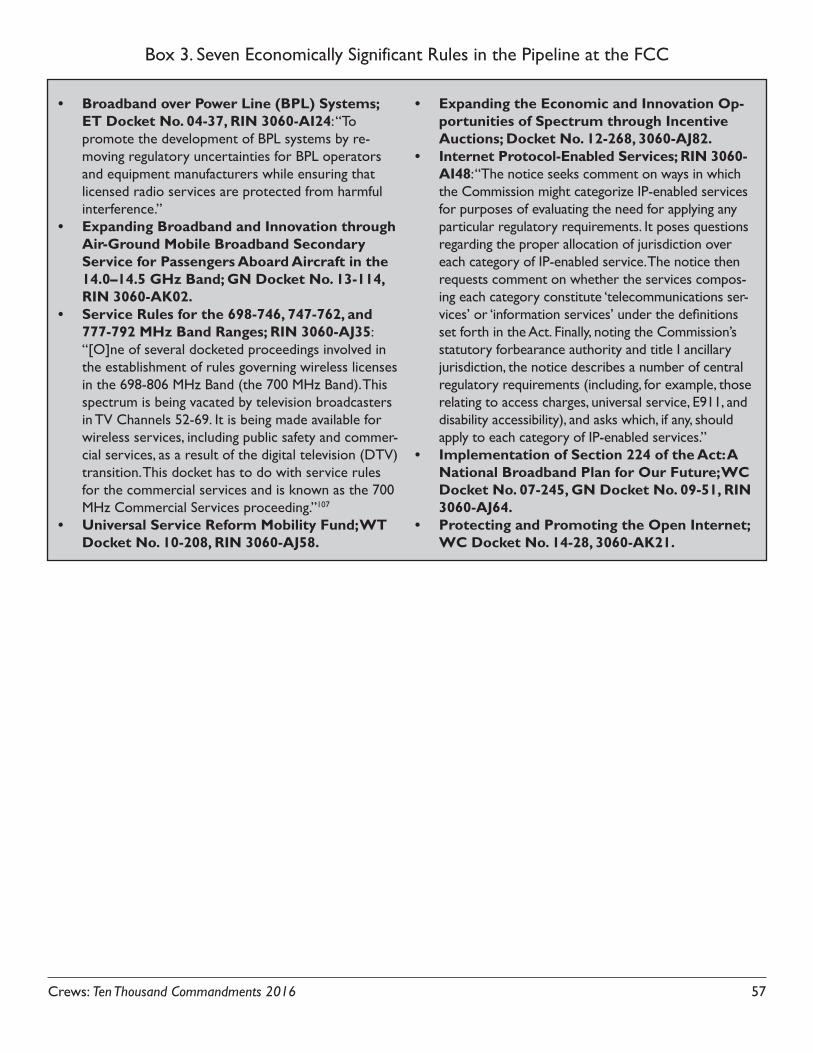
Crews: Ten Thousand Commandments 2016 57
• Broadband over Power Line (BPL) Systems; ET Docket No. 04-37, RIN 3060-AI24: “To promote the development of BPL systems by re-moving regulatory uncertainties for BPL operators and equipment manufacturers while ensuring that licensed radio services are protected from harmful interference.”
• Expanding Broadband and Innovation through Air-Ground Mobile Broadband Secondary Service for Passengers Aboard Aircraft in the 14.0–14.5 GHz Band; GN Docket No. 13-114, RIN 3060-AK02.
• Service Rules for the 698-746, 747-762, and 777-792 MHz Band Ranges; RIN 3060-AJ35: “[O]ne of several docketed proceedings involved in the establishment of rules governing wireless licenses in the 698-806 MHz Band (the 700 MHz Band). This spectrum is being vacated by television broadcasters in TV Channels 52-69. It is being made available for wireless services, including public safety and commer-cial services, as a result of the digital television (DTV) transition. This docket has to do with service rules for the commercial services and is known as the 700 MHz Commercial Services proceeding.”107
• Universal Service Reform Mobility Fund; WT Docket No. 10-208, RIN 3060-AJ58.
• Expanding the Economic and Innovation Op-portunities of Spectrum through Incentive Auctions; Docket No. 12-268, 3060-AJ82.
• Internet Protocol-Enabled Services; RIN 3060-AI48: “The notice seeks comment on ways in which the Commission might categorize IP-enabled services for purposes of evaluating the need for applying any particular regulatory requirements. It poses questions regarding the proper allocation of jurisdiction over each category of IP-enabled service. The notice then requests comment on whether the services compos-ing each category constitute ‘telecommunications ser-vices’ or ‘information services’ under the definitions set forth in the Act. Finally, noting the Commission’s statutory forbearance authority and title I ancillary jurisdiction, the notice describes a number of central regulatory requirements (including, for example, those relating to access charges, universal service, E911, and disability accessibility), and asks which, if any, should apply to each category of IP-enabled services.”
• Implementation of Section 224 of the Act: A National Broadband Plan for Our Future; WC Docket No. 07-245, GN Docket No. 09-51, RIN 3060-AJ64.
• Protecting and Promoting the Open Internet; WC Docket No. 14-28, 3060-AK21.
Box 3. Seven Economically Significant Rules in the Pipeline at the FCC

58 Crews: Ten Thousand Commandments 2016
In contrast to stimulus spending of dubi-ous merit in an already debt-soaked U.S. economy, a regulatory liberalization agenda would constitute genuine stimulus and offer some confidence and certainty for business enterprises and entrepreneurs. Proposals like those described next can help achieve that goal.
Steps to Improve Regulatory Disclosure
Certainly some regulations’ benefits exceed costs, but net benefits or even actual costs are known for very few. Without more complete regulatory accounting, it is difficult to know whether society wins or loses as a result of rules.108 Pertinent, relevant, and readily avail-able regulatory data should be summarized and reported publicly to help create pres-sures for even better disclosure and reform. An incremental step would be for Congress to require—or for the Office of Manage-ment and Budget to initiate—publication of a summary of already available but scattered data. Such a regulatory transparency report card could resemble the presentation in Ten Thousand Commandments. That alone would help transform today’s regulatory hidden tax culture into one characterized by greater openness.
Accountability matters along with disclosure. Congress must cease delegating legislative power to unelected agency personnel. We need institutional changes that force Con-gress to internalize pressures that would push it to make cost-benefit assessments before issuing open-ended directives to agencies to
write rules. Reining in off-budget regulatory costs can occur only when elected represen-tatives assume responsibility and end “regu-lation without representation.”
Regulations fall into two broad classes: (a) those that are economically significant (cost-ing more than $100 million annually) and (b) those that are not. Agencies typically emphasize reporting of economically sig-nificant or major rules, which OMB also tends to emphasize in its annual assessments of the regulatory state. A problem with this approach is that many rules that technically come in below that threshold can still be very significant in the real-world sense of the term.
Moreover, agencies need not specify whether any or all of their economically significant or major rules cost only $100 million or far more than that. Instead, Congress could require agencies to break up their cost cat-egories into tiers. Table 10 presents one alter-native for assigning economically significant rules to one of five categories. Agencies could classify their rules on the basis of either (a) cost information that has been provided in the regulatory impact analyses that accom-pany many economically significant rules or (b) separate internal or external estimates. The Unified Agenda and annual OMB re-ports to Congress could be made more user friendly by adopting these reforms.
Regulatory information that is available is of-ten tedious to compile or interpret. To learn about regulatory trends and to accumulate information on rules, interested citizens need either to comb through the Agenda’s 1,000-plus pages of small, multicolumn
Liberate to Stimulate
Congress must cease delegating legislative power
to unelected agency personnel.

Crews: Ten Thousand Commandments 2016 59
print or compile results from online searches and agencies’ regulatory plans. Data from the Agenda could be made more accessible and user friendly if officially summarized in charts each year and presented as a section in the federal budget, in the Agenda itself, or in the Economic Report of the President.109
A regulatory transparency report card would reveal more clearly what we do not know about the regulatory state. Information could be added to the report as warranted—for
instance, success or failure of special initia-tives, such as “reinventing government” or regulatory reform efforts. Providing five-year historical data would prove useful to schol-ars, third-party researchers, and members of Congress. By making agency activity more explicit, a regulatory transparency report card would help ensure that policy mak-ers take the growth of the regulatory state seriously. Recommended components for a regulatory transparency report card appear in Box 4.
Category Breakdown1 > $100 million, < $500 million2 > $500 million, < $1 billion3 > $1 billion, < $5 billion4 > $5 billion, < $10 billion5 > $10 billion
Table 10. A Possible Breakdown of Economically Significant Rules
• Tallies of economically significant rules and minor rules by department, agency, and commission• Numbers and percentages required/not required by statute or court order• Numbers and percentages of rules affecting small business • Depictions of how regulations accumulate as a small business grows• Numbers and percentages of regulations that contain numerical cost estimates• Tallies of existing cost estimates, including subtotals by agency and grand total• Numbers and percentages lacking cost estimates, with a short explanation for the lack of cost estimates• Analysis of the Federal Register, including number of pages and proposed and final rule breakdowns by agency• Number of major rules reported on by the Government Accountability Office in its database of reports on regulations• Ranking of most active rulemaking agencies• Identification of rules that are deregulatory rather than regulatory• Identification of rules that affect internal agency procedures alone• Number of rules new to the Unified Agenda; number that are carryovers from previous years• Numbers and percentages of rules facing statutory or judicial deadlines that limit executive branch ability to
restrain them• Rules for which weighing costs and benefits is statutorily prohibited• Percentages of rules reviewed by the OMB and action taken
Box 4. Regulatory Transparency Report Card, Recommended Official Summary Data by Program, Agency, and Grand Total, with Five-Year Historical Tables

60 Crews: Ten Thousand Commandments 2016
Ending Regulation without Representation: The Unconstitutionality Index—30 Rules for Every Law
Agencies do not answer to voters. Yet in a sense, regulators and the administration, rather than Congress, do the bulk of U.S. lawmaking. Years of unbudgeted growth of the federal regulatory enterprise are worrisome when no one can claim with certainty that regulatory benefits exceed costs. But agen-cies are not the only culprits. For too long, Congress has shirked its constitutional duty to make the tough calls. Instead, it delegates substantial lawmaking power to agencies and then fails to ensure that the regulations deliver benefits that exceed costs.110 Thus, agencies can hardly be the only ones faulted for subop-timal or damaging regulation or for not ensur-ing that only good rules get through.
Agencies face significant incentives to ex-pand their turf by regulating even without demonstrated need. The primary measure of an agency’s productivity—other than growth in its budget and number of employees—is the body of regulation it produces.111 One need not deplete too much time and energy blaming agencies for carrying out the very regulating they were set up to do in the first place. Better to point a finger at Congress.
For perspective, consider that regulatory agencies issued 3,410 final rules, whereas the 114th Congress passed and President Obama signed into law a comparatively few 114 bills in calendar year 2015.112 Figure 25 presents the “Unconstitutionality Index,” the multiple of rules issued over the num-ber of public laws by calendar year passed since 2003. There were 30 rules for every law in 2015. The ratio can vary widely, but the average over the decade has been 26 rules
Figure 25. The 2014 Unconstitutionality Index, 2003–2015
Num
ber
of R
ules
Year
4,101
3,718 3,830
3,503
188 125 217 81 127 72
3,659
224 114
3,5543,410
285
3,7083,8073,573
321
3,595
161
3,943
299
4,148
198
0
1,000
2,000
3,000
4,000
5,000
Final Rules IssuedBills
2015201420132012201120102009200820072006200520042003
Source: Federal Register data from National Archives and Records Administration and from Crews tabulation at http://www .tenthousandcommandments.com. Public Laws data compiled from Government Printing Office, Public and Private Laws at http://www.gpo.gov/fdsys/browse/collection.action?collectionCode=PLAW; and from National Archives, Previous Sessions: Public Law Numbers at http://www.archives.gov/federal-register/laws/past/index.html.
Regulators and the administration,
rather than Congress, do
the bulk of U.S. lawmaking.
Crews: Ten Thousand Commandments 2016 61
for every law. Rules issued by agencies are not usually substantively related to the cur-rent year’s laws; typically, agencies adminis-ter earlier legislation. Still, this perspective is a useful way of depicting flows and relative workloads.
If the thousands of agency public notices and dozens—sometimes hundreds—of executive orders issued annually are considered, policy making without representation assumes even greater importance as an issue of concern. Historical Tables Part I depicts the Uncon-stitutionality Index dating back to 1993 and shows just by way of comparison the num-bers of executive orders and the numbers of agency notices.
An annual regulatory transparency report card is worthwhile and needed but not the complete answer. Regulatory reforms that rely on agencies policing themselves will not rein in the regulatory state or fully address regulation without representation. Rather, making Congress directly answerable to vot-ers for the costs that agencies impose on the public would best promote accountable regulation. Congress should vote on agen-cies’ final rules before they become binding on the public.
Increasing congressional accountability for regulatory costs should be a priority in to-day’s era of debt and deficits. Concern about mounting national debt invites Congress to regulate rather than to increase government spending to accomplish policy ends. Sup-pose Congress wanted to create a job-training program. Funding the program would require approval of a new appropriation for the De-partment of Labor, which would appear in the federal budget and would increase the deficit. Instead, Congress could pass a law requiring Fortune 500 companies to fund job training,
a mandate that would be carried out through new regulations issued by the Department of Labor. The latter option would add little to federal spending but would still let Congress take credit for the program. By regulating instead of spending, government can expand almost indefinitely without explicitly taxing anybody one extra penny.
Affirmation of new major regulations would ensure that Congress bears direct respon-sibility for every dollar of new regulatory costs and is essential for controlling the off-budget regulatory state. The Regulations from the Executive in Need of Scrutiny Act (REINS) Act (H.R. 427, S. 226), sponsored by Rep. Todd Young (R-Ind.) and Sen. Rand Paul (R-Ky.), offers one such approach.113 It would require Congress to vote on all eco-nomically significant agency regulations—those with estimated annual costs of $100 million or more. It has passed the House in the current and two previous congressional sessions but has not moved forward in the Senate.
To avoid getting bogged down in approving myriad agency rules, Congress could vote on agency regulations in bundles. Another way to expedite the process is by allowing congressional approval or disapproval of new regulations to be given by voice vote, rather than by tabulated roll-call vote. What mat-ters is that Congress would go on record for what laws the public must heed.
Congressional rather than agency approval of regulations and regulatory costs should be the goal of reform. When Congress ensures transparency and disclosure and finally as-sumes responsibility for the growth of the regulatory state, the resulting system will be one that is fairer and more accountable to voters.
Congress should vote on agencies’ final rules before
they become binding on the
public.
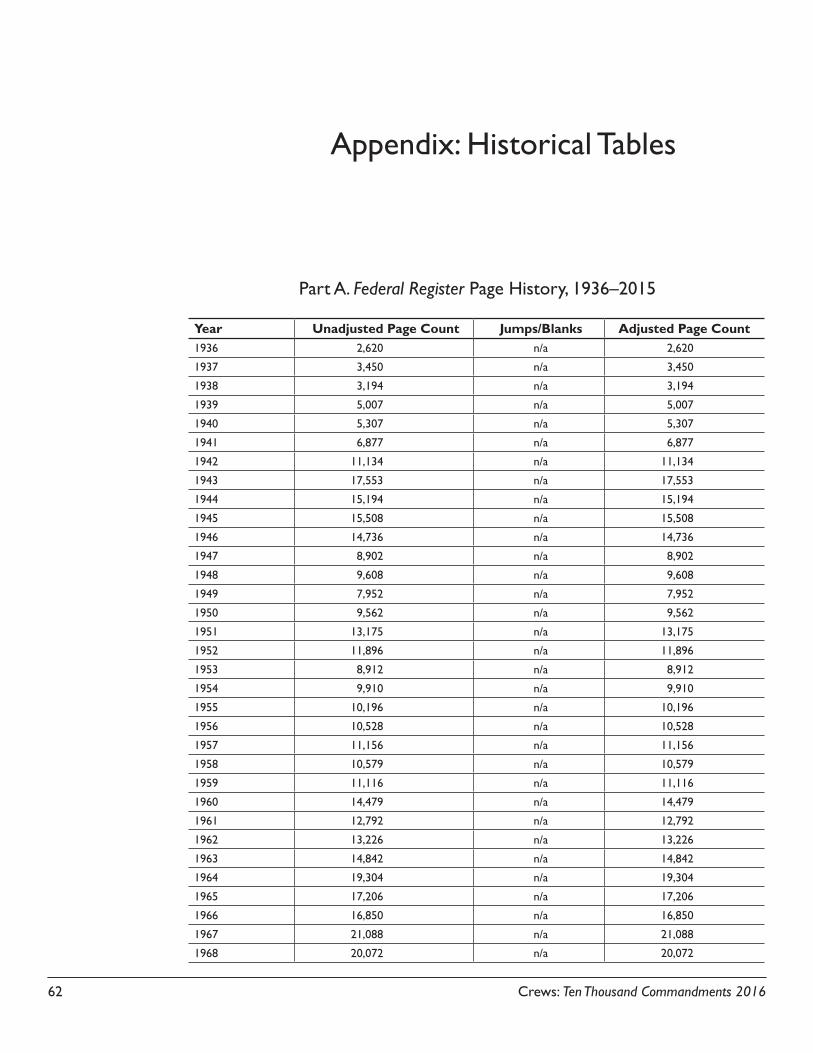
62 Crews: Ten Thousand Commandments 2016
Appendix: Historical Tables
Year Unadjusted Page Count Jumps/Blanks Adjusted Page Count1936 2,620 n/a 2,620
1937 3,450 n/a 3,450
1938 3,194 n/a 3,194
1939 5,007 n/a 5,007
1940 5,307 n/a 5,307
1941 6,877 n/a 6,877
1942 11,134 n/a 11,134
1943 17,553 n/a 17,553
1944 15,194 n/a 15,194
1945 15,508 n/a 15,508
1946 14,736 n/a 14,736
1947 8,902 n/a 8,902
1948 9,608 n/a 9,608
1949 7,952 n/a 7,952
1950 9,562 n/a 9,562
1951 13,175 n/a 13,175
1952 11,896 n/a 11,896
1953 8,912 n/a 8,912
1954 9,910 n/a 9,910
1955 10,196 n/a 10,196
1956 10,528 n/a 10,528
1957 11,156 n/a 11,156
1958 10,579 n/a 10,579
1959 11,116 n/a 11,116
1960 14,479 n/a 14,479
1961 12,792 n/a 12,792
1962 13,226 n/a 13,226
1963 14,842 n/a 14,842
1964 19,304 n/a 19,304
1965 17,206 n/a 17,206
1966 16,850 n/a 16,850
1967 21,088 n/a 21,088
1968 20,072 n/a 20,072
Part A. Federal Register Page History, 1936–2015

Crews: Ten Thousand Commandments 2016 63
Year Unadjusted Page Count Jumps/Blanks Adjusted Page Count1969 20,466 n/a 20,466
1970 20,036 n/a 20,036
1971 25,447 n/a 25,447
1972 28,924 n/a 28,924
1973 35,592 n/a 35,592
1974 45,422 n/a 45,422
1975 60,221 n/a 60,221
1976 57,072 6,567 50,505
1977 65,603 7,816 57,787
1978 61,261 5,565 55,696
1979 77,498 6,307 71,191
1980 87,012 13,754 73,258
1981 63,554 5,818 57,736
1982 58,494 5,390 53,104
1983 57,704 4,686 53,018
1984 50,998 2,355 48,643
1985 53,480 2,978 50,502
1986 47,418 2,606 44,812
1987 49,654 2,621 47,033
1988 53,376 2,760 50,616
1989 53,842 3,341 50,501
1990 53,620 3,825 49,795
1991 67,716 9,743 57,973
1992 62,928 5,925 57,003
1993 69,688 8,522 61,166
1994 68,108 3,194 64,914
1995 67,518 4,873 62,645
1996 69,368 4,777 64,591
1997 68,530 3,981 64,549
1998 72,356 3,785 68,571
1999 73,880 2,719 71,161
2000 83,294 9,036 74,258
2001 67,702 3,264 64,438
2002 80,332 4,726 75,606
2003 75,798 4,529 71,269
2004 78,852 3,177 75,675
2005 77,777 3,907 73,870
2006 78,724 3,787 74,937
2007 74,408 2,318 72,090
2008 80,700 1,265 79,435
2009 69,644 1,046 68,598
2010 82,480 1,075 81,405
2011 82,415 1,168 81,247
2012 80,050 1,089 78,961
2013 80,462 1,151 79,311
2014 78,796 1,109 77,687
2015 81,402 1,142 80,260
Sour
ce: N
atio
nal A
rchi
ves
and
Rec
ords
Adm
inis
trat
ion,
Offi
ce o
f the
Fed
eral
Reg
iste
r.N
ote:
Publ
icat
ion
of p
ropo
sed
rule
s w
as n
ot r
equi
red
befo
re t
he A
dmin
istr
ativ
e Pr
oced
ures
Act
of 1
946.
Pre
ambl
es t
o ru
les
wer
e pu
blis
hed
only
to
a lim
ited
exte
nt b
efor
e th
e 19
70s.
n/a
= no
t av
aila
ble.

64 Crews: Ten Thousand Commandments 2016
Year Final Rules Proposed Rules Other* Total1976 7,401 3,875 27,223 38,499 1977 7,031 4,188 28,381 39,600 1978 7,001 4,550 28,705 40,256 1979 7,611 5,824 29,211 42,646 1980 7,745 5,347 33,670 46,762 1981 6,481 3,862 30,090 40,433 1982 6,288 3,729 28,621 38,638 1983 6,049 3,907 27,580 37,536 1984 5,154 3,350 26,047 34,551 1985 4,843 3,381 22,833 31,057 1986 4,589 3,185 21,546 29,320 1987 4,581 3,423 22,052 30,056 1988 4,697 3,240 22,047 29,984 1989 4,714 3,194 22,218 30,126 1990 4,334 3,041 22,999 30,374 1991 4,416 3,099 23,427 30,942 1992 4,155 3,170 24,063 31,388 1993 4,369 3,207 24,017 31,593 1994 4,867 3,372 23,669 31,908 1995 4,713 3,339 23,133 31,185 1996 4,937 3,208 24,485 32,630 1997 4,584 2,881 26,260 33,725 1998 4,899 3,042 26,313 34,254 1999 4,684 3,281 26,074 34,039 2000 4,313 2,636 24,976 31,925 2001 4,132 2,512 25,392 32,036 2002 4,167 2,635 26,250 33,052 2003 4,148 2,538 25,168 31,854 2004 4,101 2,430 25,846 32,377 2005 3,943 2,257 26,020 32,220 2006 3,718 2,346 25,429 31,4932007 3,595 2,308 24,784 30,6872008 3,830 2,475 25,574 31,879 2009 3,503 2,044 25,218 30,7652010 3,573 2,439 26,543 32,5552011 3,807 2,898 26,296 33,0012012 3,708 2,517 24,755 30,9802013 3,659 2,594 24,517 30,7702014 3.554 2,383 24,257 30,1942015 3,410 2,342 24,294 30,046
Part B. Number of Documents in the Federal Register, 1976–2015
Source: National Archives and Records Administration, Office of the Federal Register.
* “Other” documents are presidential documents, agency notices, and corrections.
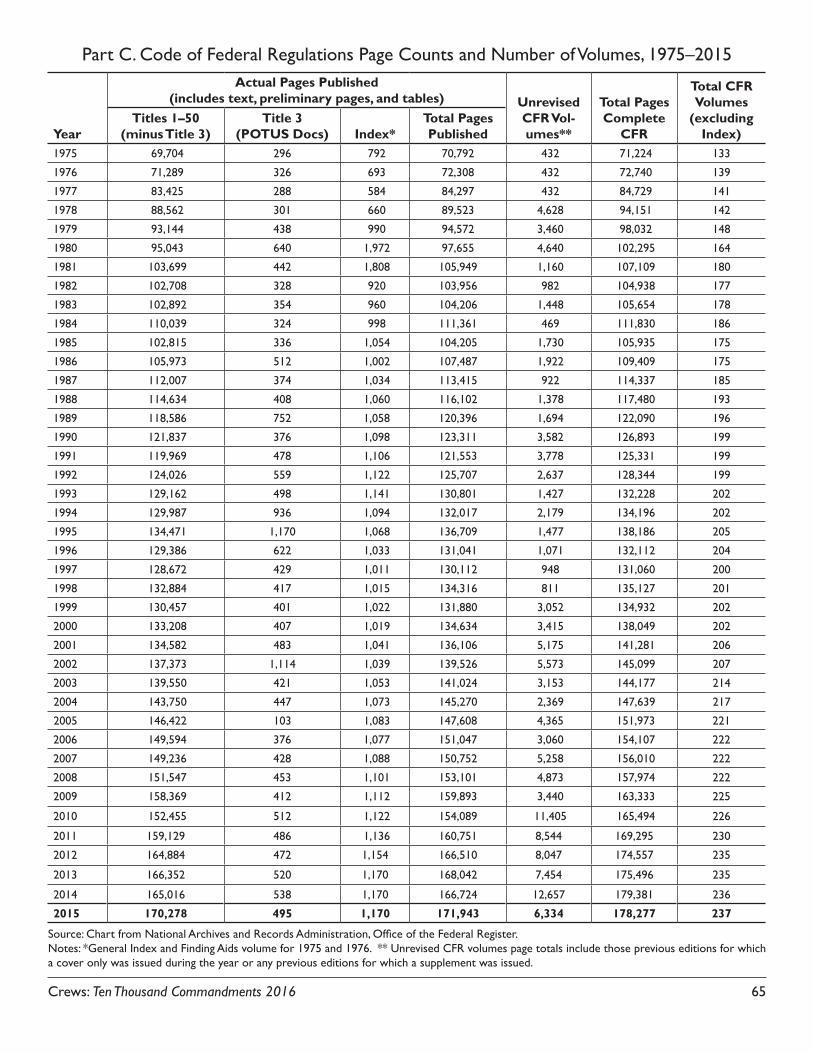
Crews: Ten Thousand Commandments 2016 65
Part C. Code of Federal Regulations Page Counts and Number of Volumes, 1975–2015
Year
Actual Pages Published (includes text, preliminary pages, and tables) Unrevised
CFR Vol-umes**
Total Pages Complete
CFR
Total CFR Volumes
(excluding Index)
Titles 1–50 (minus Title 3)
Title 3 (POTUS Docs) Index*
Total Pages Published
1975 69,704 296 792 70,792 432 71,224 133
1976 71,289 326 693 72,308 432 72,740 139
1977 83,425 288 584 84,297 432 84,729 141
1978 88,562 301 660 89,523 4,628 94,151 142
1979 93,144 438 990 94,572 3,460 98,032 148
1980 95,043 640 1,972 97,655 4,640 102,295 164
1981 103,699 442 1,808 105,949 1,160 107,109 180
1982 102,708 328 920 103,956 982 104,938 177
1983 102,892 354 960 104,206 1,448 105,654 178
1984 110,039 324 998 111,361 469 111,830 186
1985 102,815 336 1,054 104,205 1,730 105,935 175
1986 105,973 512 1,002 107,487 1,922 109,409 175
1987 112,007 374 1,034 113,415 922 114,337 185
1988 114,634 408 1,060 116,102 1,378 117,480 193
1989 118,586 752 1,058 120,396 1,694 122,090 196
1990 121,837 376 1,098 123,311 3,582 126,893 199
1991 119,969 478 1,106 121,553 3,778 125,331 199
1992 124,026 559 1,122 125,707 2,637 128,344 199
1993 129,162 498 1,141 130,801 1,427 132,228 202
1994 129,987 936 1,094 132,017 2,179 134,196 202
1995 134,471 1,170 1,068 136,709 1,477 138,186 205
1996 129,386 622 1,033 131,041 1,071 132,112 204
1997 128,672 429 1,011 130,112 948 131,060 200
1998 132,884 417 1,015 134,316 811 135,127 201
1999 130,457 401 1,022 131,880 3,052 134,932 202
2000 133,208 407 1,019 134,634 3,415 138,049 202
2001 134,582 483 1,041 136,106 5,175 141,281 206
2002 137,373 1,114 1,039 139,526 5,573 145,099 207
2003 139,550 421 1,053 141,024 3,153 144,177 214
2004 143,750 447 1,073 145,270 2,369 147,639 217
2005 146,422 103 1,083 147,608 4,365 151,973 221
2006 149,594 376 1,077 151,047 3,060 154,107 222
2007 149,236 428 1,088 150,752 5,258 156,010 222
2008 151,547 453 1,101 153,101 4,873 157,974 222
2009 158,369 412 1,112 159,893 3,440 163,333 225
2010 152,455 512 1,122 154,089 11,405 165,494 226
2011 159,129 486 1,136 160,751 8,544 169,295 230
2012 164,884 472 1,154 166,510 8,047 174,557 235
2013 166,352 520 1,170 168,042 7,454 175,496 235
2014 165,016 538 1,170 166,724 12,657 179,381 236
2015 170,278 495 1,170 171,943 6,334 178,277 237
Source: Chart from National Archives and Records Administration, Office of the Federal Register. Notes: *General Index and Finding Aids volume for 1975 and 1976. ** Unrevised CFR volumes page totals include those previous editions for which a cover only was issued during the year or any previous editions for which a supplement was issued.

66 Crews: Ten Thousand Commandments 2016
Ave
rage
Day
s R
evie
w T
ime
Year
Pre
rule
re
view
sP
ropo
sed
rule
re-
view
s
Inte
rim
fin
al r
ule
revi
ews
Fina
l rul
e re
view
sN
otic
e re
view
sTo
tal
revi
ews
ES
re-
view
sN
on-E
S re
view
sD
ays
ES
revi
ews
Day
s no
n-E
S re
view
s
Ove
rall
aver
age
days
1993
297
66
1,15
528
2,16
710
62,
061
5342
4319
9416
317
6830
212
883
113
469
733
3031
1995
822
564
270
5362
074
546
4135
3519
9628
160
5623
231
507
7443
339
4242
1997
2019
664
174
5150
581
424
4754
5319
9815
192
5818
240
487
7341
433
5048
1999
1924
771
214
3658
786
501
5153
5320
0013
210
6625
340
582
9249
060
6262
2001
927
495
285
3770
011
158
946
6058
2002
2326
181
249
5566
910
056
944
4646
2003
2323
292
309
5971
510
161
442
5049
2004
2623
764
241
5862
685
541
3555
5320
0518
221
6624
759
611
8252
939
5957
2006
1222
943
270
4660
071
529
3459
5620
0722
248
4425
025
589
8550
449
6461
2008
1727
639
313
2867
313
553
853
6361
2009
2821
467
237
4959
512
547
033
4039
2010
3626
184
232
7769
013
855
248
5151
2011
2431
776
262
6174
011
762
351
6058
2012
1214
433
195
4042
483
341
6981
7920
1311
177
3316
037
418
104
314
121
143
137
2014
1720
143
144
4645
211
433
810
613
412
720
158
178
2916
435
415
130
285
8490
88
Part
D. N
umbe
r of
Reg
ulat
ory
Rev
iew
s at
the
Offi
ce o
f Inf
orm
atio
n an
d R
egul
ator
y A
ffair
s, 19
93–2
015
Sour
ce: A
utho
r se
arch
on
Reg
Info
.gov
, “R
evie
w C
ount
s” d
atab
ase
sear
ch e
ngin
e un
der
Reg
ulat
ory
Rev
iew
hea
ding
.
Not
e: ES
= e
cono
mic
ally
sig
nific
ant.

Crews: Ten Thousand Commandments 2016 67
1980s
1983April 2,863
October 4,032
1984April 4,114
October 4,016
1985April 4,265
October 4,131
1986April 3,961
October 3,983
1987April 4,038
October 4,005
1988April 3,941
October 4,017
1989April 4,003
October 4,187
Part E. Unified Agenda Rules History, 1983–2014
Total Number of Rules Under Consideration or Enacted2000s
2000 October 4,6992001 October 4,5092002 October 4,1872003 December 4,2662004 December 4,0832005 October 4,0622006 December 4, 0522007 December 3,8822008 December 4,0042009 December 4,0432010 December 4,2252011 December 4,1282012 Year-End* 4,0622013 November 3,3052014 November 3,4152015 November 3,297
Sources: Compiled from “The Regulatory Plan and Unified Agenda of Federal Regulatory and Deregulatory Actions,” Federal Register, various years’ editions; also from online edition at http://www.reginfo.gov.
*Spring edition skipped in 2012.
1990s
1990April 4,332
October 4,470
1991April 4,675
October 4,863
1992April 4,186
October 4,909
1993April 4,933
October 4,950
1994April 5,105
October 5,119
1995April 5,133
October 4,735
1996April 4,570
October 4,680
1997April 4,417
October 4,407
1998April 4,504
October 4,560
1999April 4,524
October 4,568

Part
F. A
gend
a R
ules
His
tory
by
Dep
artm
ent
and
Age
ncy,
2000
–201
420
1420
1320
1220
1120
1020
0920
0820
0720
0620
0520
0420
0320
0220
0120
00A
dvis
ory
Cou
ncil
on H
isto
ric
Pres
erva
tion
10
00
11
10
1A
genc
y fo
r In
tern
atio
nal D
evel
opm
ent
75
1014
1412
710
810
88
76
6A
rchi
tect
ural
and
Tra
nspo
rtat
ion
Barr
iers
C
ompl
ianc
e Bo
ard
78
87
65
54
34
45
57
Com
mis
sion
on
Civ
il R
ight
s1
11
11
21
11
11
11
1C
omm
odity
Fut
ures
Tra
ding
Com
mis
sion
2633
8368
5632
2519
1411
1515
1930
21C
onsu
mer
Fin
anci
al P
rote
ctio
n Bu
reau
2126
34C
onsu
mer
Pro
duct
Saf
ety
Com
mis
sion
3733
4838
5139
3119
2418
1820
2021
20C
orpo
ratio
n fo
r N
atio
nal a
nd C
omm
unity
Ser
vice
64
513
107
79
1111
89
169
6C
ourt
Ser
vice
s/O
ffend
er S
uper
visi
on, D
.C.
33
33
22
22
11
13
75
0C
PBSD
*2
22
33
33
56
65
00
00
Dep
artm
ent
of A
gric
ultu
re16
015
927
626
528
732
737
429
031
129
227
932
331
431
232
7D
epar
tmen
t of
Com
mer
ce27
025
041
532
829
630
032
530
330
229
627
330
027
034
239
0D
epar
tmen
t of
Def
ense
121
104
146
140
150
133
109
131
143
163
126
108
8793
117
Dep
artm
ent
of E
duca
tion
2620
2418
2322
1713
169
1113
148
21D
epar
tmen
t of
Ene
rgy
105
9210
896
9685
5447
6361
5066
5361
67D
epar
tmen
t of
Hea
lth a
nd H
uman
Ser
vice
s21
720
020
425
131
223
123
625
925
724
923
321
921
927
730
8D
epar
tmen
t of
Hom
elan
d Se
curi
ty14
113
916
023
223
023
725
226
728
029
531
433
8D
epar
tmen
t of H
ousin
g an
d U
rban
Dev
elop
men
t55
5258
6565
6073
8692
9010
310
910
089
113
Dep
artm
ent
of Ju
stic
e10
295
112
120
137
121
138
140
139
124
125
122
249
229
202
Dep
artm
ent
of L
abor
9584
9890
9910
496
9493
9388
8910
214
115
6D
epar
tmen
t of
Sta
te47
4163
3530
1827
2828
2421
1541
3221
Dep
artm
ent
of t
he In
teri
or32
435
332
032
525
927
728
726
430
530
328
729
529
842
341
8D
epar
tmen
t of
Tra
nspo
rtat
ion
216
220
232
224
223
230
200
199
215
227
301
365
543
511
536
Dep
artm
ent
of T
reas
ury
426
428
487
497
580
528
521
545
501
514
532
530
513
458
450
Dep
artm
ent
of V
eter
ans A
ffair
s75
6685
8281
7880
6577
7679
8710
416
414
1En
viro
nmen
tal P
rote
ctio
n A
genc
y18
617
922
331
834
533
133
033
637
240
041
641
740
941
644
9Eq
ual E
mpl
oym
ent
Opp
ortu
nity
Com
mis
sion
89
97
77
57
86
34
43
6Ex
port
-Impo
rt B
ank
of t
he U
nite
d St
ates
1Fa
rm C
redi
t Adm
inis
trat
ion
2630
3025
2325
1912
1920
2021
1417
17Fa
rm C
redi
t Sy
stem
Insu
ranc
e C
orpo
ratio
n25
11
01
11
11
13
Fede
ral A
cqui
sitio
n R
egul
atio
n36
4050
5185
5544
3642
4445
4943
4856
Fede
ral C
omm
unic
atio
ns C
omm
issi
on13
213
211
810
314
714
514
314
513
914
314
613
414
114
513
7Fe
dera
l Cou
ncil
on t
he A
rts
and
Hum
aniti
es1
Fede
ral D
epos
it In
sura
nce
Cor
pora
tion
2517
2221
2121
1918
2416
2017
1722
26Fe
dera
l Em
erge
ncy
Man
agem
ent A
genc
y0
00
00
024
3026
Fede
ral E
nerg
y R
egul
ator
y C
omm
issi
on24
2940
4136
3739
4147
3523
2119
818
Fede
ral H
ousi
ng F
inan
ce A
genc
y19
2032
2527
3010
38
89
119
1212
Fede
ral H
ousi
ng F
inan
ce B
oard
3
Fede
ral M
ariti
me
Com
mis
sion
76
48
46
34
35
711
87
9
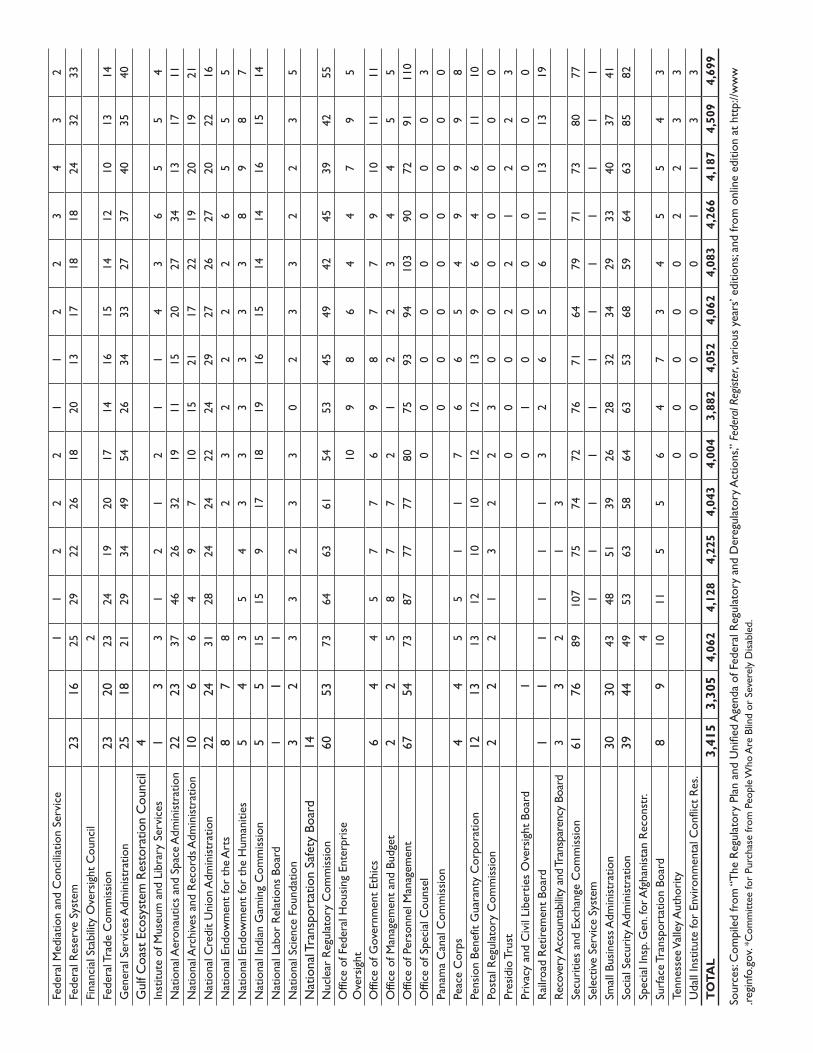
Fede
ral M
edia
tion
and
Con
cilia
tion
Serv
ice
11
22
21
12
23
43
2Fe
dera
l Res
erve
Sys
tem
2316
2529
2226
1820
1317
1818
2432
33Fi
nanc
ial S
tabi
lity
Ove
rsig
ht C
ounc
il2
Fede
ral T
rade
Com
mis
sion
2320
2324
1920
1714
1615
1412
1013
14G
ener
al S
ervi
ces A
dmin
istr
atio
n25
1821
2934
4954
2634
3327
3740
3540
Gul
f Coa
st E
cosy
stem
Res
tora
tion
Cou
ncil
4In
stitu
te o
f Mus
eum
and
Lib
rary
Ser
vice
s1
33
12
12
11
43
65
54
Nat
iona
l Aer
onau
tics
and
Spac
e A
dmin
istr
atio
n22
2337
4626
3219
1115
2027
3413
1711
Nat
iona
l Arc
hive
s an
d R
ecor
ds A
dmin
istr
atio
n10
66
49
710
1521
1722
1920
1921
Nat
iona
l Cre
dit
Uni
on A
dmin
istr
atio
n22
2431
2824
2422
2429
2726
2720
2216
Nat
iona
l End
owm
ent
for
the
Art
s8
78
23
22
22
65
55
Nat
iona
l End
owm
ent
for
the
Hum
aniti
es5
43
54
33
33
33
89
87
Nat
iona
l Ind
ian
Gam
ing
Com
mis
sion
55
1515
917
1819
1615
1414
1615
14N
atio
nal L
abor
Rel
atio
ns B
oard
11
1N
atio
nal S
cien
ce F
ound
atio
n3
23
32
33
02
33
22
35
Nat
iona
l Tra
nspo
rtat
ion
Safe
ty B
oard
14N
ucle
ar R
egul
ator
y C
omm
issi
on60
5373
6463
6154
5345
4942
4539
4255
Offi
ce o
f Fed
eral
Hou
sing
Ent
erpr
ise
Ove
rsig
ht10
98
64
47
95
Offi
ce o
f Gov
ernm
ent
Ethi
cs6
44
57
76
98
77
910
1111
Offi
ce o
f Man
agem
ent
and
Budg
et2
25
87
72
12
23
44
55
Offi
ce o
f Per
sonn
el M
anag
emen
t67
5473
8777
7780
7593
9410
390
7291
110
Offi
ce o
f Spe
cial
Cou
nsel
00
00
00
00
3Pa
nam
a C
anal
Com
mis
sion
00
00
00
00
Peac
e C
orps
44
55
11
76
65
49
99
8Pe
nsio
n Be
nefit
Gua
rant
y C
orpo
ratio
n12
1313
1210
1012
1213
96
46
1110
Post
al R
egul
ator
y C
omm
issi
on2
22
13
22
30
00
00
00
Pres
idio
Tru
st0
00
22
12
23
Priv
acy
and
Civ
il Li
bert
ies
Ove
rsig
ht B
oard
10
10
00
00
00
Rai
lroad
Ret
irem
ent
Boar
d1
11
11
13
26
56
1113
1319
Reco
very
Acc
ount
abilit
y an
d Tr
ansp
aren
cy B
oard
33
21
3Se
curi
ties
and
Exch
ange
Com
mis
sion
6176
8910
775
7472
7671
6479
7173
8077
Sele
ctiv
e Se
rvic
e Sy
stem
11
11
11
11
11
11
Smal
l Bus
ines
s Adm
inis
trat
ion
3030
4348
5139
2628
3234
2933
4037
41So
cial
Sec
urity
Adm
inis
trat
ion
3944
4953
6358
6463
5368
5964
6385
82Sp
ecia
l Ins
p. G
en. f
or A
fgha
nist
an R
econ
str.
4Su
rfac
e Tr
ansp
orta
tion
Boar
d8
910
115
56
47
34
55
43
Tenn
esse
e Va
lley
Aut
hori
ty0
00
00
22
33
Uda
ll In
stitu
te fo
r En
viro
nmen
tal C
onfli
ct R
es.
00
00
01
13
3T
OTA
L 3
,415
3
,305
4
,062
4
,128
4
,225
4
,043
4
,004
3
,882
4
,052
4
,062
4
,083
4
,266
4
,187
4
,509
4
,699
Sour
ces:
Com
pile
d fr
om “
The
Reg
ulat
ory
Plan
and
Uni
fied
Age
nda
of F
eder
al R
egul
ator
y an
d D
ereg
ulat
ory
Act
ions
,” Fe
dera
l Reg
ister
, var
ious
yea
rs’ e
ditio
ns; a
nd fr
om o
nlin
e ed
ition
at
http
://w
ww
.re
ginf
o.go
v. *C
omm
ittee
for
Purc
hase
from
Peo
ple
Who
Are
Blin
d or
Sev
erel
y D
isab
led.

70 Crews: Ten Thousand Commandments 2016
Part G. List of 218 Economically Significant Rules, Year-End 2015
ACTIVE RULEMAKING (149)
DEPARTMENT OF AGRICULTURE
1. USDA/FCIC, Final Rule Stage, General Administrative Regulations; Catastrophic Risk Protection Endorsement; Area Risk Protection Insurance Regulations; and the Common Crop Insurance Regulations, Basic Provisions, 0563-AC43
2. USDA/RHS, Final Rule Stage, Multi-Family Housing (MFH) Reinvention, 0575-AC13
3. USDA/NRCS, Final Rule Stage, Environmental Quality Incentives Program (EQIP), 0578-AA62
4. USDA/FSIS, Final Rule Stage, Mandatory Inspection of Fish of the Order Siluriformes and Products Derived from Such Fish, 0583-AD36
5. USDA/FNS, Proposed Rule Stage, Modernizing Supple-mental Nutrition Assistance Program (SNAP) Benefit Redemption Systems, 0584-AE37
6. USDA/FNS, Proposed Rule Stage, Supplemental Nutri-tion Assistance Program (SNAP): Electronic Benefits Transfer Requirements for Scanning and Product-Lookup Technology, 0584-AE39
7. USDA/FNS, Proposed Rule Stage, Supplemental Nutri-tion Assistance Program: Standard Utility Allowances Based on the Receipt of Energy Assistance Payments, 0584-AE43
8. USDA/FNS, Final Rule Stage, Eligibility, Certifi-cation, and Employment and Training Provisions, 0584-AD87
9. USDA/FNS, Final Rule Stage, Supplemental Nutrition Assistance Program: Farm Bill of 2008 Retailer Sanc-tions, 0584-AD88
10. USDA/FNS, Final Rule Stage, National School Lunch and School Breakfast Programs: Nutrition Standards for All Foods Sold in School, as Required by the Healthy, Hunger-Free Kids Act of 2010, 0584-AE09
DEPARTMENT OF COMMERCE
11. DOC/PTO, Proposed Rule Stage, Setting and Adjusting Patent Fees, 0651-AD02
DEPARTMENT OF DEFENSE
12. DOD/DODOASHA, Final Rule Stage, TRICARE; Re-imbursement of Long-Term Care Hospitals, 0720-AB47
13. DOD/OS, Final Rule Stage, Transition Assistance Pro-gram (TAP) for Military Personnel, 0790-AJ17
DEPARTMENT OF EDUCATION
14. ED/OCTAE, Final Rule Stage, Workforce Innovation and Opportunity Act, 1830-AA21
15. ED/OPE, Final Rule Stage, REPAYE, 1840-AD18
DEPARTMENT OF ENERGY
16. DOE/ENDEP, Final Rule Stage, Advanced Technology Vehicles Manufacturing Incentive Program, 1901-AB25
17. DOE/EE, Proposed Rule Stage, Energy Efficiency Stan-dards for Manufactured Housing,1904-AC11
18. DOE/EE, Proposed Rule Stage, Energy Conservation Standards for Miscellaneous Refrigeration Products, 1904-AC51
19. DOE/EE, Proposed Rule Stage, Energy Conserva-tion Standards for Commercial Packaged Boilers, 1904-AD01
20. DOE/EE, Proposed Rule Stage, Energy Conser-vation Standards for Portable Air Conditioners, 1904-AD02
21. DOE/EE, Proposed Rule Stage, Coverage De-termination for Computers and Battery Backup Systems,1904-AD04
22. DOE/EE, Proposed Rule Stage, Energy Conservation Standards for Residential Non-Weatherized Gas Fur-naces, 1904-AD20
23. DOE/EE, Proposed Rule Stage, Energy Conservation Standards for Residential Dishwashers, 1904-AD24
24. DOE/EE, Proposed Rule Stage, Energy Conservation Standards for Commercial Water Heating Equipment, 1904-AD34
25. DOE/EE, Proposed Rule Stage, Energy Conserva-tion Standards for Central Air Conditioners and Heat Pumps, 1904-AD37
26. DOE/EE, Final Rule Stage, Fossil Fuel–Generated Energy Consumption Reduction for New Federal Buildings and Major Renovations of Federal Buildings, 1904-AB96
27. DOE/EE, Final Rule Stage, Energy Conservation Standards for Commercial and Industrial Pumps, 1904-AC54
28. DOE/EE, Final Rule Stage, Energy Conservation Stan-dards for Fans and Blowers, 1904-AC55
29. DOE/EE, Final Rule Stage, Energy Efficiency Standards for Residential Dehumidifiers, 1904-AC81
30. DOE/EE, Final Rule Stage, Energy Conservation Stan-dards for Residential Boilers, 1904-AC88

Crews: Ten Thousand Commandments 2016 71
31. DOE/EE, Final Rule Stage, Energy Conservation Standards for Small, Large, and Very Large Commercial Package A/C and Heating Equipment, 1904-AC95
32. DOE/EE, Final Rule Stage, Energy Conservation Stan-dards for Commercial Warm Air Furnaces, 1904-AD11
33. DOE/EE, Final Rule Stage, Energy Conservation Stan-dards for Residential Conventional Cooking Products, 1904-AD15
34. DOE/EE, Final Rule Stage, Energy Conservation Stan-dards for Hearth Products, 1904-AD35
DEPARTMENT OF HEALTH AND HUMAN SERVICES
35. HHS/FDA, Proposed Rule Stage, Over-the-Counter (OTC) Drug Review Topical Antimicrobial Drug Prod-ucts, 0910-AF69
36. HHS/FDA, Proposed Rule Stage, Updated Standards for Labeling of Pet Food, 0910-AG09
37. HHS/FDA, Proposed Rule Stage, Requirements for the Testing and Reporting of Tobacco Product Constituents, Ingredients, and Additives, 0910-AG59
38. HHS/FDA, Proposed Rule Stage, Radiology Devices; Designation of Special Controls for the Computed Tomography X-ray System, 0910-AH03
39. HHS/FDA, Proposed Rule Stage, Requirements for Tobacco Product Manufacturing Practice, 0910-AH22
40. HHS/FDA, Final Rule Stage, Food Labeling: Revi-sion of the Nutrition and Supplement Facts Labels, 0910-AF22
41. HHS/FDA, Final Rule Stage, Food Labeling: Serving Sizes of Foods That Can Reasonably Be Consumed at One Eating Occasion; Dual-Column Labeling; Up-dating, Modifying, and Establishing Certain RACCs, 0910-AF23
42. HHS/FDA, Final Rule Stage, Electronic Distribution of Prescribing Information for Human Prescription Drugs Including Biological Products, 0910-AG18
43. HHS/FDA, Final Rule Stage, Standards for the Grow-ing, Harvesting, Packing, and Holding of Produce for Human Consumption, 0910-AG35
44. HHS/FDA, Final Rule Stage, Tobacco Products Sub-ject to the Federal Food, Drug, and Cosmetic Act, as Amended by the Family Smoking Prevention and Tobacco Control Act, 0910-AG38
45. HHS/FDA, Final Rule Stage, Focused Mitigation Strate-gies to Protect Food against Intentional Adulteration, 0910-AG63
46. HHS/FDA, Final Rule Stage, Foreign Supplier Verification Program, 0910-AG64
47. HHS/FDA, Final Rule Stage, Sanitary Transportation of Human and Animal Food, 0910-AG98
48. HHS/IHS, Proposed Rule Stage, Catastrophic Health Emergency Fund (CHEF), 0917-AA10
49. HHS/CDC, Final Rule Stage, World Trade Center Health Program Requirements for Enrollment, Appeals, Certification of Health Conditions Reimbursement, 0920-AA44
50. HHS/SAMHSA, Proposed Rule Stage, Increase Num-ber of Patients to Which Drug Addiction Treatment Act (DATA)–Waived Physicians Can Prescribe Buprenorphine, 0930-AA22
51. HHS/OIG, Final Rule Stage, Medicare and State Health Care Programs: Fraud and Abuse; Revisions to the Of-fice of the Inspector General’s Civil Monetary Penalty Rules, 0936-AA04
52. HHS/OASH, Proposed Rule Stage, Federal Policy for the Protection of Human Subjects, 0937-AA02
53. HHS/CMS, Proposed Rule Stage, Hospital and Critical Access Hospital (CAH) Changes to Promote Innovation, Flexibility, and Improvement in Patient Care (CMS-3295-P), 0938-AS21
54. HHS/CMS, Proposed Rule Stage, Medicare Clinical Diagnostic Laboratory Test Payment System (CMS-1621-F), 0938-AS33
55. HHS/CMS, Proposed Rule Stage, CY 2017 Notice of Benefit and Payment Parameters (CMS-9937-P), 0938-AS57
56. HHS/CMS, Proposed Rule Stage, Revisions to Require-ments for Discharge Planning for Hospitals, Home Health Agencies, and Critical Access Hospitals (CMS-3317-F), 0938-AS59
57. HHS/CMS, Proposed Rule Stage, Imaging Accredita-tion (CMS-3309-P), 0938-AS62
58. HHS/CMS, Proposed Rule Stage, Medicaid Dispropor-tionate Share Hospital (DSH) Allotment Reductions (CMS-2394-P), 0938-AS63
59. HHS/CMS, Proposed Rule Stage, Requirements for Surety Bonds for Certain Medicare Providers and Sup-pliers (CMS-6067-P), 0938-AS65
60. HHS/CMS, Proposed Rule Stage, Merit-Based Incentive Payment System (MIPS) and Alternative Payment Mod-els (APMs) in Medicare Fee-for-Service (CMS-5517-P), 0938-AS69
61. HHS/CMS, Proposed Rule Stage, FY 2017 Prospective Payment System and Consolidated Billing for Skilled Nursing Facilities (CMS-1645-P), 0938-AS75
62. HHS/CMS, Proposed Rule Stage, Hospital Inpatient Prospective Payment System for Acute Care Hospitals and the Long-Term Care Hospital Prospective Payment System and FY 2017 Rates (CMS-1655-P), 0938-AS77
63. HHS/CMS, Proposed Rule Stage, FY 2017 Inpatient Rehabilitation Facility Prospective Payment System (CMS-1647-P), 0938-AS78
72 Crews: Ten Thousand Commandments 2016
64. HHS/CMS, Proposed Rule Stage, FY 2017 Hospice Rate Update (CMS-1652-P), 0938-AS79
65. HHS/CMS, Proposed Rule Stage, CY 2017 Home Health Prospective Payment System Refinements and Rate Update (CMS-1648-P), 0938-AS80
66. HHS/CMS, Proposed Rule Stage, CY 2017 Revisions to Payment Policies under the Physician Fee Schedule and Other Revisions to Medicare Part B (CMS-1654-P), 0938-AS81
67. HHS/CMS, Proposed Rule Stage, CY 2017 Hospital Outpatient PPS Policy Changes and Payment Rates and Ambulatory Surgical Center Payment System Policy Changes and Payment Rates (CMS-1656-P), 0938-AS82
68. HHS/CMS, Proposed Rule Stage, CY 2017 Changes to the End-Stage Renal Disease (ESRD) Prospective Payment System and Quality Incentive Program (CMS-1651-P), 0938-AS83
69. HHS/CMS, Proposed Rule Stage, Program Integrity En-hancements to the Provider Enrollment Process (CMS-6058-P), 0938-AS84
70. HHS/CMS, Final Rule Stage, Face-to-Face Require-ments for Home Health Services; Policy Changes and Clarifications Related to Home Health (CMS-2348-F), 0938-AQ36
71. HHS/CMS, Final Rule Stage, Covered Outpatient Drugs (CMS-2345-F), 0938-AQ41
72. HHS/CMS, Final Rule Stage, Reform of Require-ments for Long-Term Care Facilities (CMS-3260-F), 0938-AR61
73. HHS/CMS, Final Rule Stage, Prior Authorization Process for Certain Durable Medical Equipment, Prosthetics, Orthotics, and Supplies (DMEPOS) Items (CMS-6050-F), 0938-AR85
74. HHS/CMS, Final Rule Stage, Mental Health Parity and Addiction Equity Act of 2008; Application of Mental Health Parity Requirements to Medicaid Managed Care Organizations, CHIP, and Alternative Benefit Plans (CMS-2333-F), 0938-AS24
75. HHS/CMS, Final Rule Stage, Medicaid Managed Care, CHIP Delivered in Managed Care, Medicaid and CHIP Comprehensive Quality Strategies, and Revi-sions Related to Third-Party Liability (CMS-2390-F), 0938-AS25
76. HHS/CMS, Final Rule Stage, Eligibility Notices, Fair Hearing and Appeal Processes for Medicaid, and other Provisions Related to Eligibility and Enrollment for Medicaid and CHIP (CMS-2334-F2), 0938-AS27
77. HHS/CMS, Final Rule Stage, CY 2016 Inpatient Hospital Deductible and Hospital and Extended Care Services Coinsurance Amounts (CMS-8059-N), 0938-AS36
78. HHS/CMS, Final Rule Stage, CY 2016 Part B Monthly Actuarial Rates, Monthly Premium Rates, and Annual Deductible (CMS-8061-N), 0938-AS38
79. HHS/CMS, Final Rule Stage, CY 2016 Revisions to Payment Policies under the Physician Fee Schedule and other Revisions to Medicare Part B (CMS-1631-FC) , 0938-AS40
80. HHS/CMS, Final Rule Stage, CY 2016 Hospital Outpatient PPS Policy Changes and Payment Rates and Ambulatory Surgical Center Payment System Policy Changes and Payment Rates (CMS-1633-FC), 0938-AS42
81. HHS/CMS, Final Rule Stage, Medicaid Mechanized Claims Processing and Information Retrieval Systems (CMS-2392-F), 0938-AS53
82. HHS/CMS, Final Rule Stage, Omnibus Group and Individual Insurance Market Reforms (CMS-9993-F), 0938-AS56
83. HHS/CMS, Final Rule Stage, Comprehensive Care for Joint Replacement (CMS-5516-F), 0938-AS64
84. HHS/CMS, Final Rule Stage, CY 2017 Inpatient Hospital Deductible and Hospital and Extended Care Services Coinsurance Amounts (CMS-8062-N), 0938-AS70
85. HHS/OCR, Proposed Rule Stage, Nondiscrimination under the Patient Protection and Affordable Care Act, 0945-AA02
86. HHS/ACF, Final Rule Stage, Head Start Performance Standards, 0970-AC63
87. HHS/OS, Final Rule Stage, 2015 Edition Health Infor-mation Technology (Health IT) Certification Criteria, Base Electronic Health Record (EHR) Definition, and ONC Health IT Certification Program Modifications, 0991-AB93
DEPARTMENT OF HOMELAND SECURITY
88. DHS/USCIS, Proposed Rule Stage, U.S. Citizenship and Immigration Services Fee Schedule, 1615-AC09
89. DHS/USCG, Prerule Stage, Commercial Fishing Indus-try Vessels, 1625-AA77
90. DHS/USCG, Proposed Rule Stage, Updates to Mari-time Security, 1625-AB38
91. DHS/USCG, Final Rule Stage, Commercial Fishing Vessels Implementation of 2010 and 2012 Legislation, 1625-AB85
92. DHS/USCBP, Final Rule Stage, Importer Security Filing and Additional Carrier Requirements, 1651-AA70
93. DHS/TSA, Final Rule Stage, Passenger Screening Using Advanced Imaging Technology, 1652-AA67
94. DHS/USICE, Proposed Rule Stage, Improving and Ex-panding Training Opportunities for F-1 Nonimmigrant

Crews: Ten Thousand Commandments 2016 73
Students with STEM Degrees and Expanding Cap-Gap Relief for All F-1 Students with Pending H-1B Petitions, 1653-AA72
DEPARTMENT OF HOUSING AND URBAN DEVELOPMENT
95. HUD/PIH, Proposed Rule Stage, Instituting Smoke-Free Public Housing (FR-5597), 2577-AC97
DEPARTMENT OF THE INTERIOR
96. DOI/BSEE, Final Rule Stage, Blowout Prevention Sys-tems and Well Control, 1014-AA11
97. DOI/FWS, Proposed Rule Stage, Migratory Bird Hunt-ing; 2016–2017 Migratory Game Bird Hunting Regula-tions, 1018-BA70
98. DOI/ASLM, Final Rule Stage, Arctic Regulations, 1082-AA00
DEPARTMENT OF JUSTICE
99. DOJ/DEA, Final Rule Stage, Electronic Prescriptions for Controlled Substances, 1117-AA61
100. DOJ/DEA, Final Rule Stage, Retail Sales of Scheduled Listed Chemical Products; Chemical; Self-Certification of Regulated Sellers of Scheduled Listed Chemical Prod-ucts, 1117-AB05
101. DOJ/CRT, Proposed Rule Stage, Nondiscrimination on the Basis of Disability: Accessibility of Web Infor-mation and Services of State and Local Governments, 1190-AA65
DEPARTMENT OF LABOR
102. DOL/ETA, Proposed Rule Stage, Workforce Innovation and Opportunity Act; Joint Rule with U.S. Department of Education for Combined and Unified State Plans, Performance Accountability, and the One-Stop System Joint Provisions, 1205-AB74
103. DOL/EBSA, Proposed Rule Stage, Conflict-of-Interest Rule Investment Advice, 1210-AB32
104. DOL/EBSA, Final Rule Stage, Final Rules under the Affordable Care Act for Grandfathered Plans, Preexist-ing Condition Exclusions, Lifetime and Annual Limits, Rescissions, Dependent Coverage, Appeals, and Patient Protections, 1210-AB72
105. DOL/OSHA, Prerule Stage, Combustible Dust, 1218-AC41
106. DOL/OSHA, Prerule Stage, Preventing Backover Inju-ries and Fatalities, 1218-AC51
107. DOL/OSHA, Proposed Rule Stage, Occupational Expo-sure to Beryllium, 1218-AB76
108. DOL/OSHA, Final Rule Stage, Occupational Exposure to Crystalline Silica, 1218-AB70
109. DOL/OSHA, Final Rule Stage, Walking Working Sur-faces and Personal Fall Protection Systems (Slips, Trips, and Fall Prevention), 1218-AB80
110. DOL/WHD, Proposed Rule Stage, Establishing Paid Sick Leave for Contractors, Executive Order No. 13706, 1235-AA13
111. DOL/WHD, Final Rule Stage, Defining and Delim-iting the Exemptions for Executive, Administrative, Professional, Outside Sales, and Computer Employees, 1235-AA11
DEPARTMENT OF TRANSPORTATION
112. DOT/FMCSA, Proposed Rule Stage, Carrier Safety Fit-ness Determination, 2126-AB11
113. DOT/FMCSA, Proposed Rule Stage, Heavy Vehicle Speed Limiters, 2126-AB63
114. DOT/FMCSA, Proposed Rule Stage, Entry-Level Driver Training, 2126-AB66
115. DOT/FMCSA, Final Rule Stage, Commercial Driver’s License Drug and Alcohol Clearinghouse (MAP-21), 2126-AB18
116. DOT/FMCSA, Final Rule Stage, Electronic Logging Devices and Hours of Service Supporting Documents (MAP-21) (RRR), 2126-AB20
117. DOT/NHTSA, Prerule Stage, Rear Impact Guards and Other Safety Strategies for Single-Unit Trucks, 2127-AL57
118. DOT/NHTSA, Proposed Rule Stage, Heavy Vehicle Speed Limiters, 2127-AK92
119. DOT/NHTSA, Proposed Rule Stage, Rear Seat Belt Reminder System, 2127-AL37
120. DOT/NHTSA, Proposed Rule Stage, Fuel-Efficiency Standards for Medium- and Heavy-Duty Vehicles and Work Trucks: Phase 2, 2127-AL52
121. DOT/NHTSA, Proposed Rule Stage, Federal Motor Ve-hicle Safety Standard (FMVSS) 150 Vehicle-to-Vehicle (V2V) Communication, 2127-AL55
122. DOT/NHTSA, Final Rule Stage, Establish Side Impact Performance Requirements for Child Restraint Systems (MAP-21), 2127-AK95
123. DOT/FRA, Proposed Rule Stage, Passenger Equipment Safety Standards Amendments, 2130-AC46
124. DOT/FTA, Proposed Rule Stage, Transit Asset Manage-ment, 2132-AB07
125. DOT/PHMSA, Proposed Rule Stage, Pipeline Safety: Gas Transmission, 2137-AE72

74 Crews: Ten Thousand Commandments 2016
126. DOT/PHMSA, Proposed Rule Stage, Pipeline Safety: Amendments to Parts 192 and 195 to Require Valve In-stallation and Minimum Rupture Detection Standards, 2137-AF06
DEPARTMENT OF THE TREASURY
127. TREAS/DO, Final Rule Stage, Assessment of Fees for Large Bank-Holding Companies and Nonbank Finan-cial Companies Supervised by the Federal Reserve to Cover the Expenses of the Financial Research Fund, 1505-AC42
128. TREAS/DO, Final Rule Stage, Restore Act Program, 1505-AC44
129. TREAS/CUSTOMS, Final Rule Stage, Automated Commercial Environment (ACE) Required for Elec-tronic Entry/Entry Summary (Cargo Release and Related Entry) Filings, 1515-AE03
130. TREAS/OCC, Final Rule Stage, Registration and Regu-lation of Swap Dealers and Major Swap Participants; Registration and Regulation of Security-Based Swap Dealers and Major Security-Based Swap Participants, 1557-AD43
DEPARTMENT OF VETERANS AFFAIRS
131. VA, Proposed Rule Stage, Tiered Pharmacy Copay-ments, 2900-AP35
132. VA, Final Rule Stage, Net Worth, Asset Transfers, and Income Exclusions for Needs-Based Benefits, 2900-AO73
133. VA, Final Rule Stage, Copayments for Medications in 2015, 2900-AP15
134. VA, Final Rule Stage, Expanded Access to Non-VA Care through the Veterans Choice Program, 2900-AP60
ENVIRONMENTAL PROTECTION AGENCY
135. EPA/SWER, Proposed Rule Stage, Modernization of the Accidental Release Prevention Regulations under the Clean Air Act, 2050-AG82
136. EPA/SWER, Proposed Rule Stage, Financial Responsi-bility Requirements under CERCLA Section 108(b) for Classes of Facilities in the Hard Rock Mining Industry, 2050-AG61
137. EPA/AR, Proposed Rule Stage, Interstate Transport Rule for the 2008 Ozone NAAQS, 2060-AS05
138. EPA/AR, Proposed Rule Stage, Oil and Natural Gas Sec-tor: Emission Standards for New and Modified Sources, 2060-AS30
139. EPA/AR, Proposed Rule Stage, Model Trading Rules for Greenhouse Gas Emissions from Electric Utility Gener-
ating Units Constructed on or Before January 8, 2014, 2060-AS47
140. EPA/AR, Final Rule Stage, Petroleum Refinery Sector Risk and Technology Review and New Source Perfor-mance Standards, 2060-AQ75
141. EPA/AR, Final Rule Stage, Greenhouse Gas Emissions and Fuel Efficiency Standards for Medium- and Heavy-Duty Engines and Vehicles Phase 2, 2060-AS16
ARCHITECTURAL AND TRANSPORATION BARRIERS COMPLIANCE BOARD
142. ATBCB, Final Rule Stage, Information and Com-munication Technology Standards and Guidelines, 3014-AA37
CONSUMER PRODUCT SAFETY COMMISSION
143. CPSC, Prerule Stage, Rule Review of: Standard for the Flammability (Open Flame) of Mattress Sets, 3041-AD47
144. CPSC, Proposed Rule Stage, Flammability Standard for Upholstered Furniture, 3041-AB35
FEDERAL ACQUISITION REGULATION
145. FAR, Final Rule Stage, Federal Acquisition Regulation (FAR); FAR Case 2014-025; Fair Pay and Safe Work-places, 9000-AM81
FEDERAL DEPOSIT INSURANCE CORPORATION
146. FDIC, Final Rule Stage, Margin and Capital Require-ments for Covered Swap Entities, 3064-AE21
NATIONAL CREDIT UNION ADMINISTRATION
147. NCUA, Final Rule Stage, Risk-Based Capital, 3133-AD77
NUCLEAR REGULATORY COMMISSION
148. NRC, Proposed Rule Stage, Revision of Fee Sched-ules: Fee Recovery for FY 2016 (NRC-2015-0223), 3150-AJ66
149. NRC, Final Rule Stage, Domestic Licensing of Source Material Amendments/Integrated Safety Analysis (NRC-2009-0079), 3150-AI50

Crews: Ten Thousand Commandments 2016 75
COMPLETED ACTIONS (36)
DEPARTMENT OF AGRICULTURE
150. USDA/APHIS, Completed Actions, Importation of Beef from a Region in Brazil, 0579-AD41
151. USDA/APHIS, Completed Actions, User Fees for Agricultural Quarantine and Inspection Services, 0579-AD77
152. USDA/APHIS, Completed Actions, Importation of Beef from a Region in Argentina, 0579-AD92
DEPARTMENT OF DEFENSE
153. DOD/DODOASHA, Completed Actions, CHAM-PUS/TRICARE: Pilot Program for Refills of Maintenance Medications for TRICARE for Life Ben-eficiaries through the TRICARE Mail Order Program, 0720-AB60
154. DOD/OS, Completed Actions, Limitations on Terms of Consumer Credit Extended to Service Members and Dependents, 0790-AJ10
DEPARTMENT OF EDUCATION
155. ED/OII, Completed Actions, Charter Schools Grants to SEAs, 1855-AA12
DEPARTMENT OF ENERGY
156. DOE/EE, Completed Actions, Energy Conservation Standards for Single-Package Vertical Air Conditioners and Single-Package Vertical Heat Pumps, 1904-AC85
DEPARTMENT OF HEALTH AND HUMAN SERVICES
157. HHS/FDA, Current Good Manufacturing Practice and Hazard Analysis and Risk-Based Preventive Controls for Food for Animals, 0910-AG10
158. HHS/FDA, Current Good Manufacturing and Hazard Analysis and Risk-Based Preventive Controls for Human Food, 0910-AG36
159. HHS/FDA, Revision of Postmarketing Reporting Re-quirements Discontinuance or Interruption in Supply of Certain Products (Drug Shortages), 0910-AG88
160. HHS/CMS, Medicare Shared Savings Program; Ac-countable Care Organizations (CMS-1461-F), 0938-AS06
161. HHS/CMS, Electronic Health Record Incentive Pro-gram Stage 3 and Modifications to Meaningful Use in 2015 through 2017 (CMS-3310-F), 0938-AS26
162. HHS/CMS, FY 2016 Hospice Rate Update (CMS-1629-F), 0938-AS39
163. HHS/CMS, Hospital Inpatient Prospective Payment System for Acute Care Hospitals and the Long-Term Care Hospital Prospective Payment System and FY 2016 Rates (CMS-1632-FC), 0938-AS41
164. HHS/CMS, FY 2016 Prospective Payment System and Consolidated Billing for Skilled Nursing Facilities (CMS-1622-F), 0938-AS44
165. HHS/CMS, FY 2016 Inpatient Rehabilitation Fa-cility Prospective Payment System (CMS-1624-F), 0938-AS45
166. HHS/CMS, CY 2016 Home Health Prospective Pay-ment System Refinements and Rate Update (CMS-1625-F), 0938-AS46
167. HHS/CMS, Coverage of Certain Preventive Services; Eligible Organizations (CMS-9940-F), 0938-AS50
168. HHS/CMS, Electronic Health Record Incentive Pro-gram Modifications to Meaningful Use in 2015 through 2017 (CMS-3311-F), 0938-AS58
DEPARTMENT OF HOMELAND SECURITY
169. DHS/USCBP, Changes to the Visa Waiver Program to Implement the Electronic System for Travel Authoriza-tion (ESTA) Program, 1651-AA72
170. DHS/USCBP, Electronic System for Travel Authoriza-tion (ESTA): Fee for Use of the System, 651-AA83
DEPARTMENT OF HOUSING AND URBAN DEVELOPMENT
171. HUD/HUDSEC, Credit Risk Retention (FR-5504), 2501-AD53
DEPARTMENT OF THE INTERIOR
172. DOI/FWS, Migratory Bird Hunting; 2015–2016 Mi-gratory Game Bird Hunting Regulations, 1018-BA67
DEPARTMENT OF TRANSPORTATION
173. DOT/NHTSA, Electronic Stability Control Systems for Heavy Vehicles (MAP-21), 2127-AK97
174. DOT/PHMSA, Hazardous Materials: Enhanced Tank Car Standards and Operational Controls for High-Haz-ard Flammable Trains, 2137-AE91
DEPARTMENT OF VETERANS AFFAIRS
175. VA, Expanded Access to Non-VA Care through the Veterans Choice Program, 2900-AP24

76 Crews: Ten Thousand Commandments 2016
ENVIRONMENTAL PROTECTION AGENCY
176. EPA/WATER, Effluent Limitations Guidelines and Standards for the Steam Electric Power Generating Point Source Category, 2040-AF14
177. EPA/SWER, Revising Underground Storage Tank Regu-lations Revisions to Existing Requirements and New Requirements for Secondary Containment and Operator Training, 2050-AG46
178. EPA/AR, Review of the National Ambient Air Quality Standards for Ozone, 2060-AP38
179. EPA/AR, NESHAP for Brick and Structural Clay Prod-ucts Manufacturing and NESHAP for Clay Ceramics Manufacturing, 2060-AP69
180. EPA/AR, Carbon Pollution Emission Guidelines for Existing Stationary Sources: Electric Utility Generating Units, 2060-AR33
FEDERAL COMMUNICATIONS COMMISSION
181. FCC, Broadband over Power Line Systems; ET Docket No. 04-37, 3060-AI24
NATIONAL CREDIT UNION ADMINISTRATION
182. NCUA, Loans in Areas Having Special Flood Hazards, 3133-AE18
183. NCUA, Loans in Areas Having Special Flood Hazards (Escrow and Mandatory Purchase), 3133-AE40
NUCLEAR REGULATORY COMMISSION
184. NRC, Revision of Fee Schedules: Fee Recovery for FY 2015 (NRC-2014-0200), 3150-AJ44
OFFICE OF PERSONNEL MANAGEMENT
185. OPM, Federal Employees Health Benefits Program Self Plus One Enrollment Type, 3206-AN08
LONG-TERM ACTIONS (33)
DEPARTMENT OF COMMERCE
186. DOC/NOAA, Taking Marine Mammals Incidental to Conducting Geological and Geophysical Exploration of Mineral and Energy Resources on the Outer Continen-tal Shelf in the Gulf of Mexico, 0648-BB38
DEPARTMENT OF ENERGY
187. DOE/OGC, Convention on Supplementary Compensa-tion for Nuclear Damage Contingent Cost Allocation, 1990-AA39
DEPARTMENT OF HEALTH AND HUMAN SERVICES
188. HHS/FDA, Regulations on Human Drug Compound-ing under Sections 503A and 503B of the Federal Food, Drug, and Cosmetic Act, 0910-AH10
189. HHS/CMS, Home Health Agency Conditions of Par-ticipation (CMS-3819-F), 0938-AG81
190. HHS/CMS, Emergency Preparedness Requirements for Medicare and Medicaid Participating Providers and Sup-pliers (CMS-3178-F), 0938-AO91
191. HHS/CMS, Fire Safety Requirements for Certain Health Care Facilities (CMS-3277-F), 0938-AR72
192. HHS/CMS, Adoption of Operating Rules for HIPAA Transactions (CMS-0036-IFC), 0938-AS01
DEPARTMENT OF HOMELAND SECURITY
193. DHS/OS, Collection of Alien Biometric Data upon Exit from the United States at Air and Sea Ports of Depar-ture, 1601-AA34
194. DHS/OS, Ammonium Nitrate Security Program, 1601-AA52
195. DHS/USCIS, Temporary Non-Agricultural Employ-ment of H-2B Aliens in the United States, 1615-AC06
196. DHS/TSA, General Aviation Security and Other Air-craft Operator Security, 1652-AA53
197. DHS/TSA, Standardized Vetting, Adjudication, and Redress Services, 1652-AA61
DEPARTMENT OF HOUSING AND URBAN DEVELOPMENT
198. HUD/CPD, Housing Trust Fund, 2506-AC30
DEPARTMENT OF JUSTICE
199. DOJ/CRT, Nondiscrimination on the Basis of Disabil-ity; Accessibility of Web Information and Services of Public Accommodations, 1190-AA61
DEPARTMENT OF LABOR
200. DOL/ETA, Temporary Non-Agricultural Employment of H-2B Aliens in the United States, 1205-AB76

Crews: Ten Thousand Commandments 2016 77
201. DOL/EBSA, Improved Fee Disclosure for Welfare Plans, 1210-AB37
202. DOL/OSHA, Infectious Diseases, 1218-AC46203. DOL/OSHA, Injury and Illness Prevention Program,
1218-AC48204. DOL/OSHA, Update to the Hazard Communication
Standard, 1218-AC93
DEPARTMENT OF THE TREASURY
205. TREAS/OCC, Treatment of Certain Collateralized Debt Obligations Backed by Trust Preferred Securities, 1557-AD79
206. TREAS/CDFI, Interim Rule for the CDFI Bond Guar-antee Program, 1559-AA01
ENVIRONMENTAL PROTECTION AGENCY
207. EPA/WATER, Stormwater Regulations Revision to Ad-dress Discharges from Developed Sites, 2040-AF13
208. EPA/WATER, National Primary Drinking Water Regulations for Lead and Copper: Regulatory Revisions, 2040-AF15
209. EPA/AR, Review of the National Ambient Air Quality Standards for Particulate Matter, 2060-AS50
210. EPA/OCSPP, Lead; Renovation, Repair, and Paint-ing Program for Public and Commercial Buildings, 2070-AJ56
ARCHITECTURAL AND TRANSPORTATION BARRIERS COMPLIANCE BOARD
211. ATBCB, Americans with Disabilities Act (ADA) Acces-sibility Guidelines for Passenger Vessels, 3014-AA11
FEDERAL COMMUNICATIONS COMMISSION
212. FCC, Expanding Broadband and Innovation through Air-Ground Mobile Broadband Secondary Service for Passengers Aboard Aircraft in the 14.0–14.5 GHz Band; GN Docket No. 13-114, 3060-AK02
213. FCC, In the Matter of Service Rules for the 698 to 746, 747 to 762, and 777 to 792 MHz Bands, 3060-AJ35
214. FCC, Universal Service Reform Mobility Fund (WT Docket No. 10-208), 3060-AJ58
215. FCC, Expanding the Economic and Innovation Op-portunities of Spectrum through Incentive Auctions; Docket No. 12-268, 3060-AJ82
216. FCC, IP-Enabled Services; WC Docket No. 04-36, 3060-AI48
217. FCC, Implementation of Section 224 of the Act; A Na-tional Broadband Plan for Our Future (WC Docket No. 07-245, GN Docket No. 09-51), 3060-AJ64
218. FCC, Protecting and Promoting the Open Internet (GN Docket No. 14-28 OK?), 3060-AK21
Source: Data compiled by Clyde Wayne Crews Jr. from “The Regulatory Plan and the Unified Agenda of Federal Regulatory and Deregulatory Ac-tions,” Federal Register, and from online edition at http://www.reginfo.gov.
Note: The “Regulation Identifier Number” appears at the end of each entry. Sequential numbers in print editions of the “Regulatory Plan and Unified Agenda” no longer apply. For additional information, see “How to Use the Unified Agenda,” http://www.reginfo.gov/public/jsp/eAgenda/StaticContent /UA_HowTo.jsp.

Part
H. R
ules
Affe
ctin
g Sm
all B
usin
ess,
1997
–201
4
2014
2013
2012
2011
2010
2009
2008
2007
2006
2005
2004
2003
2002
2001
2000
1999
1998
1997
Dep
t. of
Agr
icul
ture
4745
8065
8487
9373
6754
5264
3956
4749
6358
Dep
t. of
Com
mer
ce11
210
315
811
598
9010
711
211
110
879
7477
8998
8852
29D
ept.
of D
efen
se7
1225
2616
127
1314
1312
136
87
1521
15D
ept.
of E
duca
tion
23
11
00
01
00
01
00
00
1D
ept.
of E
nerg
y4
58
63
21
10
00
10
11
00
2D
ept.
of H
ealth
and
Hum
an
Serv
ices
103
9185
100
112
9493
9610
911
210
696
9210
810
775
8810
0
Dep
t. of
Hom
elan
d Se
curi
ty25
2827
3437
3542
4443
4338
330
00
00
0D
ept.
of H
ousi
ng a
nd U
rban
D
evel
opm
ent
01
01
54
46
116
30
11
7
Dep
t. of
the
Inte
rior
3023
2423
1817
1819
2921
2026
1720
1833
2928
Dep
t. of
Just
ice
1010
99
53
25
78
88
1315
1414
1026
Dep
t. of
Lab
or24
2224
2326
2929
2626
1919
2322
2640
3841
39D
ept.
of S
tate
2120
3121
204
31
01
12
63
20
01
Dep
t. of
Tra
nspo
rtat
ion
5368
6556
4945
4143
6063
103
151
216
244
266
246
208
44D
ept.
of T
reas
ury
2729
3947
5648
4745
3741
3827
2627
3115
6050
Dep
t. of
Vet
eran
s' A
ffair
s1
21
23
22
00
00
01
13
66
7A
genc
y fo
r In
tern
atio
nal
Dev
elop
men
t1
10
01
10
01
21
00
00
Arc
h. a
nd T
rans
Bar
rier
s C
ompl
ianc
e Bo
ard
11
11
00
00
00
01
12
23
0
Com
mod
ity F
utur
es T
radi
ng
Com
mis
sion
10
11
10
11
20
00
01
0
Con
sum
er F
inan
cial
Pro
tect
ion
Bure
au3
48
5
Con
sum
er P
rodu
ct S
afet
y C
omm
issi
on2
00
01
00
00
00
00
0
Cor
pora
tion
for
Nat
iona
l and
C
omm
unity
Ser
vice
00
00
11
00
00
00
00
Envi
ronm
enta
l Pro
tect
ion
Age
ncy
66
4973
9589
8385
9511
012
213
516
718
520
517
917
816
3
Equa
l Em
ploy
men
t O
ppor
tuni
ty
Com
mis
sion
22
35
54
23
33
00
02
00
21
Fede
ral E
mer
genc
y M
anag
emen
t A
genc
y0
00
00
11
10
00
Fede
ral A
cqui
sitio
n R
egul
atio
n24
1715
105
46
55
75
56
913
1611
15Fe
dera
l Com
mun
icat
ions
C
omm
issi
on98
9989
7811
211
011
010
910
811
311
310
410
911
710
591
8270
Fede
ral D
epos
it In
sura
nce
Cor
pora
tion
45
21
Fede
ral E
nerg
y R
egul
ator
y C
omm
issi
on0
01
00
00
00
01
00

Fede
ral H
ousi
ng F
inan
ce B
oard
00
00
00
00
00
01
0Fe
dera
l Mar
itim
e C
omm
issi
on1
11
33
33
23
57
107
67
45
0Fe
dera
l Res
erve
Sys
tem
75
1217
86
55
36
53
710
82
52
Fede
ral T
rade
Com
mis
sion
2118
2122
1616
1311
1312
119
99
910
1011
Fede
ral M
edia
tion
and
Con
cilia
tion
Serv
ice
00
00
00
00
11
00
0
Gen
eral
Ser
vice
s Adm
inis
trat
ion
42
34
56
73
33
15
41
12
23
Nat
iona
l Aer
onau
tics
and
Spac
e A
dmin
istr
atio
n1
22
30
00
00
00
00
01
0
Nat
iona
l Arc
hive
s an
d R
ecor
ds
Adm
inis
trat
ion
00
00
11
10
00
01
1
Nat
iona
l Cre
dit
Uni
on
Adm
inis
trat
ion
24
47
31
41
20
00
00
01
Nat
iona
l End
owm
ent
for
the
Art
s2
22
00
00
02
20
00
00
Nat
iona
l End
owm
ent
for
the
Hum
aniti
es0
00
00
00
00
00
01
Nuc
lear
Reg
ulat
ory
Com
mis
sion
43
63
12
12
11
03
55
35
89
Offi
ce o
f Man
agem
ent a
nd B
udge
t0
00
00
00
00
12
11
Rai
lroad
Ret
irem
ent
Boar
d0
00
00
00
00
00
01
Res
olut
ion
Trus
t C
orpo
ratio
n0
170
00
00
00
0Sm
all B
usin
ess A
dmin
istr
atio
n23
2738
3539
2013
1521
1918
2421
2124
2820
13So
cial
Sec
urity
Adm
inis
trat
ion
11
11
11
11
10
02
00
Surf
ace
Tran
spor
tatio
n Bo
ard
1Se
curi
ties
and
Exch
ange
C
omm
issi
on9
1519
2721
2119
2916
020
2528
2640
3927
34
TO
TAL
674
669
854
822
845
758
753
757
787
788
789
859
892
996
1054
963
937
733
Sour
ce: C
ompi
led
from
“T
he R
egul
ator
y Pl
an a
nd U
nifie
d A
gend
a of
Fed
eral
Reg
ulat
ory
and
Der
egul
ator
y A
ctio
ns,”
Fede
ral R
egist
er, v
ario
us y
ears
’ edi
tions
, ww
w.re
ginf
o.go
v.

Part I. The Unconstitutionality Index, 1993–2015
Year Final Rules Public Laws The Index NoticesExecutive
OrdersExecutive Memos
1993 4,369 210 211994 4,867 255 191995 4,713 88 54 23,162 401996 4,937 246 20 24,367 501997 4,584 153 30 26,033 381998 4,899 241 20 26,197 381999 4,684 170 28 25,505 352000 4,313 410 11 25,470 39 132001 4,132 108 38 24,829 67 122002 4,167 269 15 25,743 32 102003 4,148 198 21 25,419 41 142004 4,101 299 14 25,309 46 212005 3,975 161 25 25,353 27 232006 3,718 321 12 25,031 25 182007 3,595 188 19 24,476 32 162008 3,830 285 13 25,279 29 152009 3,503 125 28 24,753 44 382010 3,573 217 16 26,173 41 422011 3,807 81 47 26,161 33 192012 3,708 127 29 24,408 39 322013 3,659 72 51 24,261 24 322014 3,554 224 16 23,970 34 252015 3,410 114 30 24,393 29 31
Sources: Final rules, notices, and executive orders compiled from database at National Archives and Records Administration, Office of the Federal Register, https://www.federalregister.gov/articles/search#advanced; Public laws from Government Printing Office, Public and Private Laws, http://www.gpo.gov/fdsys/browse/collection.action?collectionCode=PLAW.
80 Crews: Ten Thousand Commandments 2016
Crews: Ten Thousand Commandments 2016 81
1 Congressional Budget Office (CBO), The Budget and Economic Outlook: 2016 to 2026, January 2016, Table 1, “CBO’s Baseline Budget Projections,” p. 2, https://www.cbo.gov/sites/ default/files/114th-congress-2015-2016/reports/51129-2016Outlook.pdf.
2 Office of Management and Budget (OMB), Budget of the United States Government, Fiscal Year (FY) 2017, Summary Tables, Table S-1, “Budget Totals,” p. 115, https://www.whitehouse.gov/sites/default/files/omb/budget/fy2017/assets/tables.pdf.
3 OMB, Historical Tables, Table 1.1, “Summary of Re-ceipts, Outlays, and Surpluses or Deficits (-): 1789–2021,” http://www.whitehouse.gov/omb/budget/historicals.
4 CBO, 2016.
5 OMB, FY 2017, Table S-1.
6 International percentages are available from the Organ-isation for Economic Co-operation and Development (OECD), Economic Outlook Annex Tables, http://www.oecd.org/eco/eco-nomicoutlookanalysisandforecasts/economicoutlookannextables.htm; Annex Table 25, “General Government Total Outlays.” Ac-cording to the OECD, the U.S. figure for 2015 is 37.9 percent, but that figure includes state and local spending outlays. For federal outlays alone as a percentage of gross domestic product (GDP), the figure is 20.5 percent ($3.687 trillion/$17.938 tril-lion), using GDP data from the U.S. Department of Commerce, Bureau of Economic Analysis, “National Income and Product Accounts, Gross Domestic Product: Fourth Quarter and An-nual 2015 (Advance Estimate),” news release, January 29, 2016, http://www.bea.gov/newsreleases/national/gdp/gdpnewsrelease.htm.
7 Central Intelligence Agency, The World Factbook, https://www.cia.gov/library/publications/the-world-factbook/fields/2056.html. Nations with at least $1 trillion in revenues are China, France, Germany, Italy, Japan, the United Kingdom, and the United States.
8 Regulations with cost estimates presented by OMB have made up only 0.5 percent of the annual rule flow of around 3,500 over the past decade, based on data compiled from the Office of In-formation and Regulatory Affairs’ annual Report to Congress on the Benefits and Costs of Federal Regulations and Unfunded Mandates on State, Local, and Tribal Entities, https://www.whitehouse .gov/omb/inforeg_regpol_reports_congress. See also Clyde Wayne Crews Jr., “Boosting Regulatory Transparency: Comments of the Competitive Enterprise Institute on the Office of Management and Budget’s 2013 Draft Report to Congress on the Benefits and Costs of Federal Regulations and Agency Compliance with the Unfunded Mandates Reform Act,” Competitive Enterprise Institute, Wash-ington, D.C., July 31, 2013, p. 9, http://bit.ly/1dqsTbY. See also Crews, “Federal Regulation: The Costs of Benefits,” Forbes, Janu-ary 7, 2013, http://www.forbes.com/sites/waynecrews/2013/01/07/federal-regulation-the-costs-of-benefits/.
9 “Measuring the Impact of Regulation: The Rule of More,” The Economist, February 18, 2012, http://www.economist.com/node/21547772.
10 The regulatory report card has long been proposed in Ten Thousand Commandments; it was also featured in Clyde Wayne Crews Jr., “The Other National Debt Crisis: How and Why Con-gress Must Quantify Federal Regulation,” Issue Analysis 2011 No. 4, Competitive Enterprise Institute, Washington, D.C., Octo-ber 2011, http://cei.org/issue-analysis/other-national-debt-crisis. Those reporting proposals appeared in the Achieving Less Excess in Regulation and Requiring Transparency (ALERRT) Act during the 113th Congress (2013–2014), https://beta.congress.gov/bill/113th-congress/house-bill/2804. They had first appeared in Sen. Olympia Snowe’s (R-Maine) 112th Congress legislation, Restoring Tax and Regulatory Cer-tainty to Small Businesses (RESTART) Act (S. 3572). Section 213 detailed this proposed “regulatory transparency reporting,” which includes reporting on major-rule costs in tiers. The full text of S. 3572 is available at https://www.govtrack.us/congress/bills/112/s3572/text.
11 “The Debt to the Penny and Who Holds It,” U.S. De-partment of the Treasury, Bureau of the Fiscal Service, http://www.treasurydirect.gov/NP/debt/current.
12 For a survey of corporate tax incidence estimates, see Jennifer C. Gravelle, “Corporate Tax Incidence: A Review of Empirical Estimates and Analysis,” Congressional Budget Office Working Paper Series: Working Paper 2011-01, June 2011, http://www.cbo.gov/sites/default/files/cbofiles/ftpdocs/122xx /doc12239/06-14-2011-corporatetaxincidence.pdf.
13 See James M. Buchanan, Cost and Choice: An Inquiry in Economic Theory (Chicago and London: University of Chicago Press, 1969).
14 Clyde Wayne Crews Jr., “Tip of the Costberg: On the Invalidity of All Cost of Regulation Estimates and the Need to Compile Them Anyway,” working paper, Competitive Enterprise Institute, available on Social Science Research Network (SSRN), 2016 Edition, http://ssrn.com/abstract=2502883. Editions also available on scribd: http://www.scribd.com/doc/103172296/Tip -of-the-Costberg-On-the-Invalidity-of-All-Cost-of-Regulation -Estimates-and-the-Need-to-Compile-Them-Anyway.
15 CBO, A Review of CBO’s Activities in 2014 under the Un-funded Mandates Reform Act, March 2015, p. 2, http://www.cbo .gov/sites/default/files/cbofiles/attachments/50051-UMRA.pdf.
16 OMB, Historical Tables, http://www.whitehouse.gov/omb/budget/Historicals.
17 CBO website, http://www.cbo.gov.
18 Buchanan, Cost and Choice, 1969, pp. 42–43.
Notes

82 Crews: Ten Thousand Commandments 2016
19 OMB, 2015 Report to Congress on the Benefits and Costs of Federal Regulations and Unfunded Mandates on State, Local, and Tribal Entities, Table 1-1, “Estimates of the Total Annual Benefits and Costs of Major Federal Rules by Agency, October 1, 2004–September 30, 2014 (billions of 2001 or 2010 dollars),” March 10, 2016, pp. 9-10, https://www.whitehouse.gov/sites/ default/files/omb/inforeg/2015_cb/2015-cost-benefit-report.pdf.
20 OMB, 2014 Draft Report to Congress on the Benefits and Costs of Federal Regulations and Unfunded Mandates on State, Lo-cal, and Tribal Entities, Table 1-1, “Estimates of the Total Annual Benefits and Costs of Major Federal Rules by Agency, October 1, 2003–September 30, 2013 (billions of 2010 dollars),” May 2014, pp. 9–11, http://www.whitehouse.gov/sites/default/files /omb/inforeg/2014_cb/draft_2014_cost_benefit_report-updated .pdf.
21 OMB, 2015 Report to Congress, Table 1-1, pp. 9-10.
22 OMB, 2015 Report to Congress, Table 1-5, “Estimates, by Agency, of the Total Annual Benefits and Costs of Major Rules: October 1, 2013–September 30, 2014 (billions of 2001 or 2010 dollars),” p. 23.
23 OMB, 2014 Draft Report to Congress, Table 1-5, “Total Annual Benefits and Costs of Major Rules by Fiscal Year (billions of 2001 or 2010 dollars),” p. 22.
24 W. Mark Crain and Nicole V. Crain, “The Cost of Fed-eral Regulation to the U.S. Economy, Manufacturing, and Small Business,” National Association of Manufacturers, September 10, 2014, http://www.nam.org/~/media/A7A8456F33484E498F-40CB46D6167F31.ashx.
25 John W. Dawson and John J. Seater, “Federal Regu-lation and Aggregate Economic Growth,” Journal of Economic Growth, Vol. 18, No. 2, pp. 137–177, June 2013, http://papers.ssrn.com/sol3/papers.cfm?abstract_id=2223315##.
26 Bentley Coffey, Patrick A. McLaughlin, and Pietro Per-etto, “The Cumulative Cost of Regulations,” Mercatus Working Paper, Mercatus Center, April 2016, http://mercatus.org/sites /default/files/Coffey-Cumulative-Cost-Regs-v3.pdf.
27 Nicole V. Crain and W. Mark Crain, “The Impact of Regulatory Costs on Small Firms,” report prepared for the Small Business Administration, Office of Advocacy, Contract No. SBAHQ-08-M-0466, September 2010, http://www.sba.gov/advocacy/7540/49291.
28 The 2010 Crain and Crain calculations updated a 2005 report by Mark Crain that found 2004 regulatory costs of $1.1 tril-lion (W. Mark Crain, “The Impact of Regulatory Costs on Small Firms,” report prepared for the Small Business Administration, Office of Advocacy, Contract No. SBHQ-03-M-0522, September 2005, https://www.sba.gov/sites/default/files/files/rs264tot.pdf ). In a still earlier October 2001 report by Crain and Thomas Hop-kins, the authors noted regulatory costs of $843 billion (W. Mark Crain and Thomas D. Hopkins, “The Impact of Regulatory Costs on Small Firms,” report prepared for the Small Business Adminis-tration, Office of Advocacy, RFP No. SBAHQ-00-R-0027, Octo-
ber 2001, http://www.sba.gov/sites/default/files/files/rs207tot.pdf ). That report, in turn, updated still earlier SBA analyses.
Recent criticisms of the more recent Crain and Crain SBA re-port (“The Impact of Regulatory Costs”; see note 26) would also apply to some OMB calculations and have in the past—though critics do not present alternative and defensible total cost esti-mates. In particular, the Crain and Crain model for calculating costs of economic regulations using the World Bank Regulatory Quality Index has fallen under criticism by OMB and others. Earlier estimates by Crain and Hopkins would be in the same ballpark, in current dollars, even without including the costs of interim regulations. Moreover, current estimates do not cap-ture the costs of such major initiatives as health care legislation, Dodd-Frank financial regulation, or even the earlier Sarbanes-Oxley financial rules. This author addressed some of those con-cerns about the SBA study in a Forbes column (Crews, “The Cost of Government Regulation,” Forbes, July 6, 2011, http://www.forbes.com/sites/waynecrews/2011/07/06/the-cost-of -government-regulation-the-barack-obama-cass-sunstein-urban -legend/).
Following are the primary criticisms and links to Crain and Crain’s responses to them:
Curtis W. Copeland, “Analysis of an Estimate of the Total Costs of Federal Regulations,” Congressional Re-search Service, April 6, 2011, http://www.progressiv-ereform.org/articles/CRS_Crain_and_Crain.pdf. Crain and Crain response: http://policystudies.lafayette.edu /files/2011/03/Response-to-CRS-April-28-2011-inc2.pdf.
John Irons and Andrew Green, “Flaws Call for Re-jecting Crain and Crain Model,” Economic Policy Insti-tute Issue Brief No. 308, July 19, 2011, http://www .epi.org/publication/flaws_call_for_rejecting_crain_and _crain_model/. Crain and Crain response: http:// policystudies.lafayette.edu/files/2011/03/EPI-response .pdf.
Sidney A. Shapiro, Ruth Ruttenberg, and James Goodwin, “Setting the Record Straight: The Crain and Crain Report on Regulatory Costs,” Center for Progres-sive Reform White Paper No. 1103, February 2011, http://www.progressivereform.org/articles/SBA_Regu-latory_Costs_Analysis_1103.pdf. Crain and Crain re-sponse: http://policystudies.lafayette.edu/files/2011/03/Analysis-of-CPR_4_27_last.pdf.
29 Crain and Crain, “The Cost of Federal Regulation,” 2014.
30 For example, the February 18, 2012, issue of The Econo-mist features a special section, “Over-Regulated America,” which notes, “[R]ed tape in America is no laughing matter. The prob-lem is not the rules that are self-evidently absurd. It is the ones that sound reasonable on their own but impose a huge burden collectively. America is meant to be the home of laissez-faire. ... Yet for some time America has been straying from this ideal.”

Crews: Ten Thousand Commandments 2016 83
With respect to the regulations emerging from the Dodd-Frank law, the story notes that “financial firms in America must prepare to comply with a law that is partly unintelligible and partly un-knowable.” (http://www.economist.com/node/21547789). This special section includes the following articles: “Measuring the Impact of Regulation: The Rule of More,” http://www.economist.com/node/21547772; “Deleting Regula-tions: Of Sunstein and Sunsets,” http://www.economist.com/node/21547799; and “Excessive Regulation: Tangled Up in Green Tape,” http://www.economist.com/node/21547804.
31 Dawson and Seater, “Federal Regulation and Aggregate Economic Growth,” 2013.
32 Crews, “Tip of the Costberg,” 2016.
33 Thomas D. Hopkins, economist and former deputy ad-ministrator of OIRA, “Statement Prepared for the Subcommittee on National Economic Growth, Natural Resources, and Regula-tory Affairs of the House Committee on Government Reform and Oversight,” May 16, 1996. See also Hopkins, “Regulatory Costs in Profile,” Policy Study No. 231, Center for the Study of American Business, August 1996, p. 4.
34 The total surplus was $128 billion in FY 2001. White House, OMB, Table 1.1, “Summary of Receipts, Outlays, and Surpluses or Deficits (-): 1789–2020,” http://www.whitehouse .gov/sites/default/files/omb/budget/fy2016/assets/hist01z1.xls.
35 CBO, The Budget and Economic Outlook, January 2016, Summary Table 1.
36 Estimated 2015 tax figures from OMB, Historical Ta-bles, Table 2.1, “Receipts by Source: 1934–2020,” https://www.whitehouse.gov/sites/default/files/omb/budget/fy2016/assets/hist02z1.xls. This spreadsheet is regularly found at http://www.whitehouse.gov/omb/budget/Historicals.
37 Ibid.
38 Corporate 2014 pretax profits (domestic and interna-tional) from U.S. Department of Commerce, Bureau of Eco-nomic Analysis, National Income and Product Accounts Tables, Table 6.17D, “Corporate Profits before Tax by Industry,” http://www.bea.gov/iTable/iTable.cfm?ReqID=9&step=1#reqid=9&step=3&isuri=1&903=243. This spreadsheet is found at http://www.bea.gov /iTable/iTable.cfm?ReqID=9&step=1#reqid=9&step=1&isuri=1.
39 U.S. Department of Commerce, Bureau of Economic Analysis, “National Income and Product Accounts, Gross Domes-tic Product: Fourth Quarter and Annual 2015 (Advance Estimate),” news release, January 29, 2016, http://www.bea.gov/newsreleases /national/gdp/gdpnewsrelease.htm. Similar data are also available at the World Bank, Washington, D.C., Data: GDP (Current U.S. $), http://data.worldbank.org/indicator/NY.GDP.MKTP.CD.
40 The World Bank, “Gross Domestic Product 2014,” http://databank.worldbank.org/data/download/GDP.pdf.
41 Terry Miller and Anthony B. Kim, 2016 Index of Eco-nomic Freedom, Heritage Foundation/Wall Street Journal, Febru-ary 2016, http://www.heritage.org/index/.
42 James Gwartney, Robert Lawson, and Joshua Hall, et al., Economic Freedom of the World: 2015 Annual Report (Washington, D.C.: Cato Institute, 2015), http://www.cato.org/economic-freedom-world.
43 As the previously cited National Association of Manufac-turers study on regulatory costs observes: “It is worth emphasizing that all regulatory costs are—and can only be—borne by indi-viduals, as consumers, as workers, as stockholders, as owners or as taxpayers. In other words, the distinction between ‘business’ and ‘in-dividuals’ focuses on the compliance responsibility, fully recognizing that ultimately all costs must fall on individuals.” Crain and Crain, “The Cost of Federal Regulation,” 2014, p. 46.
44 U.S. Department of Labor, Bureau of Labor Statistics, “Consumer Expenditures—2014,” economic news release, Sep-tember 3, 2015, http://www.bls.gov/news.release/cesan.nr0.htm.
45 Ibid. For the BLS, “Consumer units include families, single persons living alone or sharing a household with others but who are financially independent, or two or more persons living together who share expenses.” For each “unit,” average an-nual expenditures were $53,495, according to the BLS. The BLS also provided additional information on these figures by email and in the following document: “Average Annual Expenditures and Characteristics of All Consumer Units, Consumer Expendi-ture Survey, 2006-2011,” http://www.bls.gov/cex/2011/standard/multiyr.pdf. Find the 2014 version at http://www.bls.gov/cex/2014/standard/multiyr.pdf.
46 That is still a relatively light load compared with the federal debt per household, which Ohio Senator and former OMB Director Rob Portman has said reaches $140,000 per household. As PolitiFact noted, “Portman was using an average to illustrate a point, not to say that each of us needs to take out a second mortgage.” The same perspective holds when we try to contextualize regulation. Stephen Koff, “Sen. Rob Portman Says the National Debt Breaks Down to $140,000 per Household,” PolitiFact, March 27, 2013, http://www.politifact.com/ohio /statements/2013/mar/27/rob-portman/sen-rob-portman-says -national-debt-breaks-down-140/.
47 Susan Dudley and Melinda Warren, “Regulators’ Budget Increases Consistent with Growth in Fiscal Budget: An Analysis of the U.S. Budget for Fiscal Years 2015 and 2016,” Regulators’ Budget No. 37, published jointly by the Regulatory Studies Center, George Washington University, Washington, D.C., and the Weidenbaum Center on the Economy, Government, and Public Policy, Washing-ton University, St. Louis, Missouri, May 2015, http://regulatory studies.columbian.gwu.edu/sites/regulatorystudies.columbian.gwu .edu/files/downloads/2016_Regulators_Budget.pdf. Instead of using the Dudley and Warren nominal dollar estimates, their 2009 con-stant dollars are adjusted here by the change in the consumer price index between 2009 and 2014, derived from Consumer Price Index

84 Crews: Ten Thousand Commandments 2016
tables, U.S. Department of Labor, Bureau of Labor Statistics, Wash-ington, D.C. (Table 24. Historical Consumer Price Index for All Urban Consumers [CPI-U], U.S. city average, all items), “Annual avg.” column, http://www.bls.gov/cpi/tables.htm.
48 Ibid., Table A-1, 2015, p. 16 (current dollars).
49 Ibid., Table A-1, 2015, p. 15 (current dollars).
50 Ibid., Table A-6, “Total Staffing of Federal Regulatory Activity,” 2015, p. 26.
51 See “President Barack Obama’s State of the Union Ad-dress,” The White House, Office of the Press Secretary, January 28, 2014, http://www.whitehouse.gov/the-press-office/2014/01/28 /president-barack-obamas-state-union-address.
52 Clyde Wayne Crews Jr., “Despotism-Lite? The Obama Administration’s Rule by Memo,” Forbes, July 1, 2014, https://cei .org/content/despotism-lite-obama-administrations-rule-memo.
53 Clyde Wayne Crews Jr., “Mapping Washington’s Law-lessness: A Preliminary Inventory of ‘Regulatory Dark Mat-ter,’” Issue Analysis 2015 No. 6, Competitive Enterprise Institute, December 2015. https://cei.org/sites/default/files/Wayne%20Crews%20-%20Mapping%20Washington%27s%20Lawlessness .pdf.
54 Kenneth Mayer, With the Stroke of a Pen: Executive Or-ders and Presidential Power (Princeton, NJ: Princeton University Press, 2001), p. 67, http://bit.ly/M9aGcn.
55 Gregory Korte, “Obama Issues ‘Executive Orders by An-other Name,’” USA Today, December 17, 2014, http://www .usatoday.com/story/news/politics/2014/12/16/obama-presidential -memoranda-executive-orders/20191805/.
56 Glenn Kessler, “Claims Regarding Obama’s Use of Execu-tive Orders and Presidential Memoranda,” Washington Post, Decem-ber 31, 2014, http://www.washingtonpost.com/blogs/fact-checker /wp/2014/12/31/claims-regarding-obamas-use-of-executive-orders-and-presidential-memoranda/.
57 Most of Clinton’s memoranda are not shown in Figure 15. However, they are likewise derived from the “Advanced Doc-ument Search” feature on htpps://www.FederalRegister.gov.
58 Youngstown Sheet & Tube Co. v. Sawyer 343 U.S. 579, 1952, http://supreme.justia.com/cases/federal/us/343/579/case.html.
59 Ben Traynor, “Roosevelt’s Gold Confiscation: Could It Happen Again?” The Telegraph, April 3, 2013, http://www.telegraph .co.uk/finance/personalfinance/investing/gold/9968494/Roosevelts-gold-confiscation-could-it-happen-again.html.
60 Crews, “Despotism-Lite?,” 2014.
61 Executive Order No. 13563, Improving Regulation and Regulatory Review, January 18, 2011, http://www.gpo.gov /fdsys/pkg/FR-2011-01-21/pdf/2011-1385.pdf.
62 These are Executive Orders No. 13563 (Improving Regulation and Regulatory Review, January 18, 2011); 13579 (Regulation and Independent Regulatory Agencies, July 11,
2011); 13609 (Promoting International Regulatory Coopera-tion, May 1, 2012); and 13610 (Identifying and Reducing Regu-latory Burdens, May 10, 2012). All are available at http://www.whitehouse.gov/omb/inforeg_regmatters#eo13610.
63 Executive Order No. 12866, “Regulatory Planning and Review,” September 30, 1993, http://www.archives.gov/federal -register/executive-orders/pdf/12866.pdf.
64 Executive Order No. 12291, “Federal Regulation,” February 17, 1981, http://www.archives.gov/federal-register /codification/executive-order/12291.html.
65 Executive Order No. 12866, “Regulatory Planning and Review,” Federal Register, Vol. 58, No. 190, October 4, 1993.
66 Executive Orders Disposition Tables Index, Office of the Federal Register, National Archives, http://www.archives.gov /federal-register/executive-orders/disposition.html; and Executive Orders, The American Presidency Project, http://www.presidency.ucsb.edu/data/orders.php.
67 Ibid.
68 John D. Graham and James W. Broughel, “Stealth Reg-ulation: Addressing Agency Evasion of OIRA and the Adminis-trative Procedure Act,” Harvard Journal of Law and Public Policy, Federalist Edition, Vol. 1, No. 1, pp. 40–41, 2014, http://www .harvard-jlpp.com/wp-content/uploads/2010/01/Graham _Broughel_final.pdf.
69 See, for example, Graham and Broughel, 2014.
70 “Notices” are defined at http://www.federalregister.gov: “This category contains non-rulemaking documents that are ap-plicable to the general public and named parties. These documents include notices of public meetings, hearings, investigations, grants and funding, environmental impact statements, information col-lections, statements of organization and functions, delegations, and other announcements of public interest.”
71 Noted, for example, in Federal Register, Vol. 74, No. 233, December 7, 2009, p. 64133.
72 It did not appear in the Federal Register, but in the on-line database at http://www.reginfo.gov.
73 Memorandum for Regulatory Policy Officers at Executive Departments and Agencies and Managing and Executive Direc-tors of Certain Agencies and Commissions, “Spring 2012 Unified Agenda of Federal Regulatory and Deregulatory Actions” (plus attach-ment), Cass Sunstein, administrator, Office of Information and Regulatory Affairs, Executive Office of the President, March 12, 2012, http://www.whitehouse.gov/sites/default/files/omb/assets /inforeg/agenda-data-call-and-guidelines-spring-2012.pdf.
74 Memorandum for Regulatory Policy Officers at Ex-ecutive Departments and Agencies and Managing and Execu-tive Directors of Certain Agencies and Commissions, “Fall 2013 Regulatory Plan and Unified Agenda of Federal Regulatory and Deregulatory Actions,” Howard Shelanski, administrator, Office of Information and Regulatory Affairs, Executive Office of the Presi-

Crews: Ten Thousand Commandments 2016 85
dent, August 7, 2013, http://www.whitehouse.gov/sites/default /files/omb/inforeg/memos/fall-2013-regulatory-plan-and-agenda .pdf.
75 Susan E. Dudley, “2012 Unified Agenda Less Informa-tive,” Regulatory Studies Center, George Washington University, Washington, D.C., February 6, 2013, http://research.columbian.gwu.edu/regulatorystudies/sites/default/files/u41/20130206_unified_agenda_dudley.pdf.
76 Leland E. Beck, “Fall 2013 Unified Agenda Published: Something New, Something Old,” Federal Regulations Advisor, No-vember 27, 2013, http://www.fedregsadvisor.com/2013/11/27 /fall-2013-unified-agenda-published-something-new-something -old.
77 A former White House official told the Post: “As we entered the run-up to the election, the word went out the White House was not eager to review new rules.” Juliet Eilperin, “White House Delayed Enacting Rules Ahead of 2012 Election to Avoid Controversy,” Washington Post, December 14, 2013, http://www.washingtonpost.com/politics/white-house-delayed -enacting-rules-ahead-of-2012-election-to-avoid-controversy /2013/12/14/7885a494-561a-11e3-ba82-16ed03681809_story .html?hpid=z1.
78 Curtis W. Copeland, “Length of Rule Reviews by the Office of Information and Regulatory Affairs,” Administrative Conference of the United States, December 2, 2013, http://www.acus.gov/sites/default/files/documents/OIRA%20 Review%20Final%20Report%20with%20Cover%20Page.pdf.
79 This count has been compiled in Ten Thousand Com-mandments over the years from printed editions of the National Archives and Records Administration, Office of the Federal Reg-ister’s “Regulatory Plan and Unified Agenda of Federal Regula-tory and Deregulatory Actions,” printed separately as well as in the Federal Register, and from http://www.reginfo.gov.
80 Although the Unified Agenda is published twice a year, this document primarily tracks each year’s fall or year-end compilation.
81 Crews, “Mapping Washington’s Lawlessness.”
82 “Obama Orders Halt to Pending Regulations for Re-view,” Fox News, January 20, 2009, http://www.foxnews.com /politics/2009/01/20/obama-orders-halt-pending-regulations -review.
83 Jim Blasingame, “Small Business Advocate” website, http://www.smallbusinessadvocate.com.
84 The Federal Register notes: “The Regulatory Flexibility Act requires that agencies publish semiannual regulatory agen-das in the Federal Register describing regulatory actions they are developing that may have a significant economic impact on a sub-stantial number of small entities.” Cited, for example, in Federal Register, Vol. 74, No. 233, December 7, 2009, pp. 64131–64132.
85 The legislation and executive orders by which agencies are directed to assess effects on state and local governments are described in the Agenda’s appendixes.
86 Government Accountability Office website, “Congressio-nal Review Act Resources,” http://www.gao.gov/legal/congressional-review-act/overview.
87 Curtis W. Copeland, “Congressional Review Act: Many Recent Final Rules Were Not Submitted to GAO and Congress,” White Paper, July 15, 2014, http://www.washingtonpost.com /r/2010-2019/WashingtonPost/2014/07/25/National-Politics /Advance/Graphics/CRA%20Report%200725.pdf.
88 The GAO through 2014 presented its major-rule reports only for the most recent three months. It now presents them in a scroll window in reverse chronological order going further back, which was used here for 2015’s hand tally. Alongside, the GAO pro-vides a searchable database of rules submitted to it by agencies, op-erating on the presumption that the major ones are those requiring and receiving a GAO report as required by the CRA, http://www.gao.gov/legal/congressional-review-act/overview. There are some-times slight differences between some hand tallies and the database search engine results (earlier years’ discrepancies visible in earlier editions of Ten Thousand Commandments have now vanished from the database). Also, sometimes slight changes exist in the results the search engine provides from year to year, as well as its URL. For 2015, the hand tally yielded 75 rules; the database, 76.
89 James L. Gattuso and Diane Katz, “Red Tape Rising: Six Years of Escalating Regulation under Obama,” Backgrounder No. 3015, Heritage Foundation, May 11, 2015, http://www.heritage .org/research/reports/2015/05/red-tape-rising-six-years-of -escalating-regulation-under-obama.
90 Fred Smith, founder and then-president, CEI, Letter to Rep. Darrell Issa (R-Calif.), January 3, 2011, http://www.scribd .com/doc/47563145/Competitive-Enterprise-Institute-Letter-to -Chairman-Issa-January-3-2011.
91 Darren Goode, “Gripes over EPA in Responses to Dar-rell Issa,” Politico, February 7, 2011, http://www.politico.com/news/stories/0211/48995.html.
92 Senator James Inhofe, “A Look Ahead to EPA Regula-tions for 2013: Numerous Obama-EPA Rules Placed on Hold until after the Election Spell Doom for Jobs and Economic Growth,” Minority Report, Senate Committee on Environment and Public Works, October 18, 2012, http://www.epw.senate .gov/public/_cache/files/fda3fe87-14d2-4252-827f-d553249 bf4cd/a-look-ahead-to-epa-regulations-for-20131.pdf .
93 OMB, 2013 Draft Report to Congress, Table 1-3, pp. 18–19.
94 Crews, “Tip of the Costberg,” 2016.
95 U.S. Environmental Protection Agency, Environmental Investments: The Cost of a Clean Environment, EPA-230-11-90-083, November 1990, http://yosemite.epa.gov/ee/epa/eerm.nsf /vwAN/EE-0294B-2.pdf/$file/EE-0294B-2.pdf.

86 Crews: Ten Thousand Commandments 2016
96 Susan Dudley and Melinda Warren, “Regulators’ Budget Increases Consistent with Growth in Fiscal Budget: An Analysis of the U.S. Budget for Fiscal Years 2015 and 2016,” Regulators’ Budget, No. 37, May 2015, Table A-1, p. 17.
97 Jerry Ellig, “Costs and Consequences of Federal Tele-communications Regulations,” Federal Communications Law Journal, Vol. 58, No.1, p. 95, January 2006, http://ssrn.com/abstract=982574.
98 Federal Register, http://www.federalregister.gov. For another roundup of FCC regulations, see Ryan Young, “Fed-eral Communications Commission: Regulations Impose $142 Billion in Compliance Costs; More on the Way,” Regulatory Re-port Card No. 2, Competitive Enterprise Institute, February 21, 2013, http://cei.org/sites/default/files/Ryan%20Young%20-%20FCC%20Regulatory%20Report%20Card.pdf.
99 Tom Wheeler, “FCC Chairman Tom Wheeler: This Is How We Will Ensure Net Neutrality,” Wired, February 4, 2015, http://www.wired.com/2015/02/fcc-chairman-wheeler-net-neutrality.
100 See Clyde Wayne Crews Jr., “Splinternets and Cyber-spaces vs. Net Neutrality,” Daily Caller, February 3, 2010, http://dailycaller.com/2010/02/03/splinternets-and-cyberspaces-vs-net -neutrality/.
101 Gautham Nagesh, “FCC Plans to Issue New ‘Net Neu-trality’ Rules,” Wall Street Journal, February 19, 2014, http:// online.wsj.com/news/articles/SB10001424052702303636404579392960485193226.
102 Verizon v. FCC (D.C. Cir. January 14, 2014), http://www.cadc.uscourts.gov/internet/opinions.nsf/3AF8B4D938CDEEA685257C6000532062/$file/11-1355-1474943.pdf.
103 Federal Communications Commission, Report and Order on “Preserving the Open Internet Broadband Industry Practices,” adopted December 21, 2010, http://www.fcc.gov/docu-ment/preserving-open-internet-broadband-industry-practices-1. See also Brief for Competitive Enterprise Institute et al. as Amici Curiae Supporting Appellant, Verizon v. FCC, No. 11-1355 (D.C. Cir. July 23, 2012), http://techfreedom.org/sites/default/files/Verizon_v_FCC_Amicus_Brief.pdf.
104 Wheeler.
105 See Crews, “Comments of Competitive Enterprise In-stitute in FCC Future of Media Proceeding, GN Docket No. 10-25,” May 7, 2010, http://www.scribd.com/doc/135189382
/Wayne-Crews-Comments-of-Competitive-Enterprise-Institute -in-FCC-Future-of-Media-Proceeding-GN-Docket-No-10-25.
106 See, for example, Braden Cox and Clyde Wayne Crews Jr., “Communications without Commissions: A National Plan for Reforming Telecom Regulation,” Issue Analysis 2005 No. 9, Competitive Enterprise Institute, October 18, 2005, http://cei.org/pdf/4911.pdf.
107 FCC, “In the Matter of Service Rules for the 698 to 746, 747 to 762, and 777 to 792 MHz Bands,” RIN 3060-AJ35, Fall 2010, http://www.reginfo.gov/public/do/eAgendaViewRule ?pubId=201010&RIN=3060-AJ35.
108 Crews, “Promise and Peril: Implementing a Regula-tory Budget,” Policy Sciences, Vol. 31, No. 4, December 1998, pp. 343–369, http://cei.org/PDFs/promise.pdf.
109 A version of CEI’s major-rule categorization and dis-closure recommendations noted in Table 10 and Box 4 is also explored in Crews, “The Other National Debt Crisis.” Those reporting proposals later appeared in the ALERRT Act proposal and in Sen. Olympia Snowe’s 112th Congress legislation (see note 10). Section 213 of Snowe’s bill detailed this proposed “reg-ulatory transparency reporting,” https://www.govtrack.us/congress/bills/112/s3572/text.
110 For a complete analysis, see David Schoenbrod and Jerry Taylor, “The Delegation of Legislative Powers,” in Cato Handbook for Congress: Policy Recommendations for the 108th Congress, ed. Edward H. Crane and David Boaz (Washington, D.C.: Cato Institute, 2003), pp. 77–85, http://object.cato.org /sites/cato.org/files/serials/files/cato-handbook-policymakers /2003/9/hb108-8.pdf .
111 See William A. Niskanen Jr., Bureaucracy and Represen-tative Government (Chicago: Aldine, Atherton, 1971).
112 Derived from Library of Congress, Thomas website, Pub-lic Laws, http://thomas.loc.gov/home/LegislativeData.php?&n =PublicLaws&c=114; and from the U.S. Government Publishing Office, Public and Private Laws, http://www.gpo.gov/fdsys/browse /collection.action?collectionCode=PLAW.
113 Office of Sen. Rand Paul (R-Ky.), “Sen. Paul and Rep. Young Introduce REINS Act,” news release, January 22, 2015, http://www.paul.senate.gov/news/press/sen-paul-and-rep-young -introduce-reins-act.

Crews: Ten Thousand Commandments 2016 87
About the Author
Wayne Crews is Vice President for Policy at the Competitive Enterprise Institute (CEI). He is widely published and a con-tributor at Forbes.com. A frequent speaker, he has appeared at venues including the DVD Awards Showcase in Hollywood, European Commission–sponsored conferences, the National Academies, the Spanish Ministry of Justice, and the Future of Music Policy Summit. He has testified before Congress on various policy issues. Crews has been cited in dozens of law reviews and journals. His work spans regulatory reform, antitrust and competition policy, safety and environmental issues, and various information-age policy concerns.
Alongside numerous studies and articles (including the recent The Other National Debt Crisis: How and Why Congress Must Quantify Federal Regulation), Crews is co-editor of the books Who Rules the Net?: Internet Governance and Jurisdiction, and Copy Fights: The Future of Intellectual Property in the Information Age. He is co-author of What’s Yours Is Mine: Open Access and the Rise of Infrastructure Socialism, and a contributing author to other books. He has written in the Wall Street Journal, Chicago Tribune, Communications Lawyer, International Herald Tribune, and other publications. He has appeared on Fox News, CNN, ABC, CNBC, and the PBS News Hour. His policy proposals have been featured prominently in the Washing-ton Post, Forbes, and Investor’s Business Daily.
Before coming to CEI, Crews was a scholar at the Cato Institute. Earlier, Crews was a legislative aide in the U.S. Senate, an economist at Citizens for a Sound Economy and the Food and Drug Administration, and a fellow at the Center for the Study of Public Choice at George Mason University. He holds a Master’s of Business Administration from the College of William and Mary and a Bachelor’s of Science from Lander College in Greenwood, South Carolina. While at Lander, he was a candidate for the South Carolina state senate.
A dad of five, he can still do a handstand on a skateboard and enjoys custom motorcycles.

The Competitive Enterprise Institute
promotes the institutions of liberty and
works to remove government-created
barriers to economic freedom, innovation,
and prosperity through timely analysis,
effective advocacy, inclusive coalition-
building, and strategic litigation.
COMPETITIVE ENTERPRISE INSTITUTE
1899 L Street NW, 12th Floor
Washington, DC 20036
202-331-1010
cei.org
THE HIGH COST OF BIG LABOR
The Unintended Consequences of
Collective Bargaining
LOWELL GALLAWAY & JONATHAN ROBE
THE U
NIN
TEND
ED C
ON
SEQU
ENC
ES OF C
OLLEC
TIVE BARG
AIN
ING
GA
LLAWAY/
ROBE
CEI