2016 Benefit System Performance Report FINAL - … · 2 Introduction ... On this basis, most...
82
2016 Benefit System Performance Report
Transcript of 2016 Benefit System Performance Report FINAL - … · 2 Introduction ... On this basis, most...
2016 Benefit System Performance Report

Page 2 2016 Benefit System Performance Report
Authors
Herwig Raubal BEc FNZSA FIAA Chief Actuary
Eric Judd BSc FNZSA FIAA Head of Actuarial
Dan Stoner BSc FNZSA (primary regulator) FIA Senior Actuary
Published
TBC 2017 Ministry of Social Development PO Box 1556 Wellington 6140 New Zealand
ISSN
2422-8761 (Print)
2422-877X (Online)
2016 Benefit System Performance Report Page 3
Table of Contents
1 Executive Summary .......................................................................................... 4
2 Introduction ..................................................................................................... 9
3 Recent Experience .......................................................................................... 11
Profile of the Benefit System .......................................................................... 11 3.1 Performance Relative to Valuation Projections .................................................. 13 3.2 Benefit System Gateways .............................................................................. 14 3.3 Gateway 1 – New Jobseeker Support Clients .................................................... 17 3.4 Gateway 2 – Exits from Jobseeker Support ...................................................... 19 3.5 Gateway 3 – Exits from Sole Parent Support .................................................... 21 3.6 Superu Research: Off-Benefit Outcomes .......................................................... 23 3.7 Gateway 4 – Transition of Youth to Working-Age Benefits .................................. 26 3.8 Gateway 5 – Transition of JS-WR Clients to JS-HCD .......................................... 27 3.9
Gateway 6 – Transition to Supported Living Payment ........................................ 30 3.10 Better Public Services Targets ........................................................................ 31 3.11
4 Valuation Results - Life-time Liability ............................................................. 35
Summary of Benefit System Valuation Results ................................................. 35 4.1 Summary of approach ................................................................................... 38 4.2 What do the valuation results tell us? .............................................................. 42 4.3 Segmentation .............................................................................................. 45 4.4 Social housing valuation ................................................................................ 48 4.5 Benefit system clients in social housing ........................................................... 49 4.6
5 Future Focus – Risks and Opportunities ......................................................... 51
New risks identified this year ......................................................................... 51 5.1 Restated risks and opportunities ..................................................................... 52 5.2
6 Return on Investment: Employment Assistance Programmes ........................ 55
Introduction ................................................................................................. 55 6.1 Summary of Results ...................................................................................... 55 6.2 Individual Results ......................................................................................... 56 6.3 Further ROI work .......................................................................................... 61 6.4
7 Progress against Previous Report Recommendations ..................................... 62
Appendix A: Background .................................................................................. 67
Appendix B: Nature of the Business ................................................................. 69
Appendix C: Return on Investment Methodology ............................................. 77
Appendix D: Terms, Definitions & Glossary ...................................................... 79
Page 4 2016 Benefit System Performance Report
1 Executive Summary
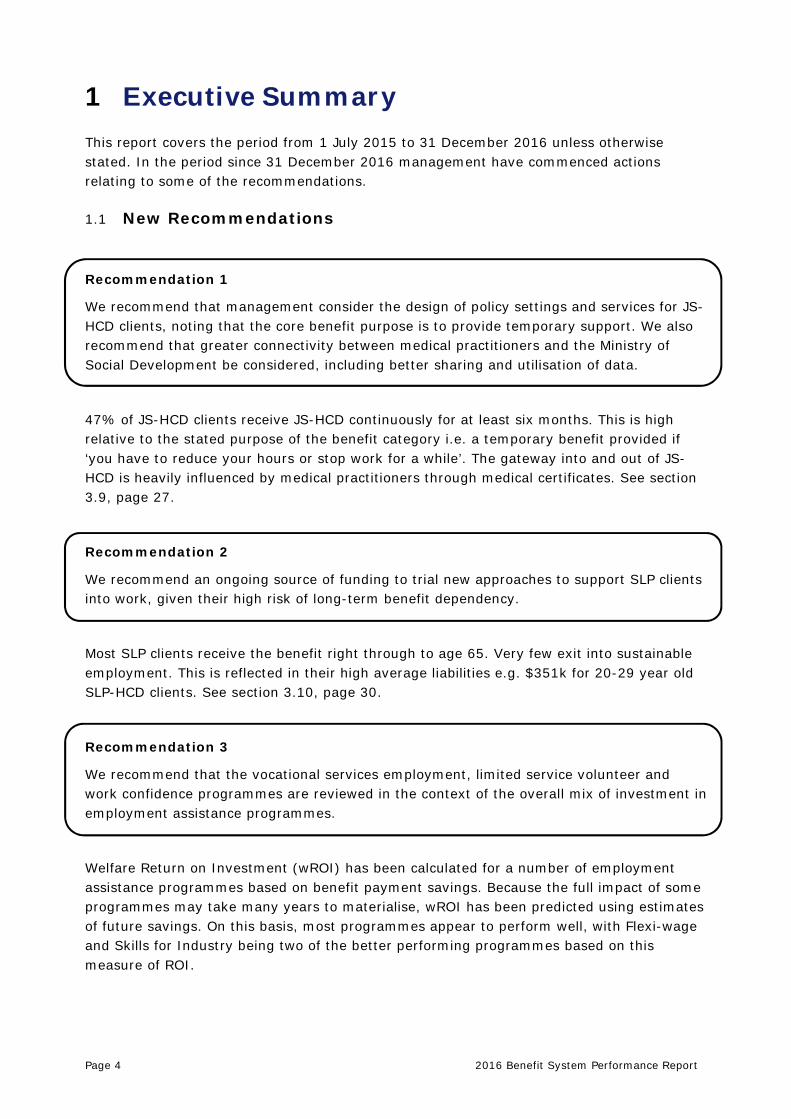
This report covers the period from 1 July 2015 to 31 December 2016 unless otherwise stated. In the period since 31 December 2016 management have commenced actions relating to some of the recommendations.
New Recommendations 1.1
Recommendation 1
We recommend that management consider the design of policy settings and services for JS-HCD clients, noting that the core benefit purpose is to provide temporary support. We also recommend that greater connectivity between medical practitioners and the Ministry of Social Development be considered, including better sharing and utilisation of data.
47% of JS-HCD clients receive JS-HCD continuously for at least six months. This is high relative to the stated purpose of the benefit category i.e. a temporary benefit provided if ‘you have to reduce your hours or stop work for a while’. The gateway into and out of JS-HCD is heavily influenced by medical practitioners through medical certificates. See section 3.9, page 27.
Recommendation 2
We recommend an ongoing source of funding to trial new approaches to support SLP clients into work, given their high risk of long-term benefit dependency.
Most SLP clients receive the benefit right through to age 65. Very few exit into sustainable employment. This is reflected in their high average liabilities e.g. $351k for 20-29 year old SLP-HCD clients. See section 3.10, page 30.
Recommendation 3
We recommend that the vocational services employment, limited service volunteer and work confidence programmes are reviewed in the context of the overall mix of investment in employment assistance programmes.
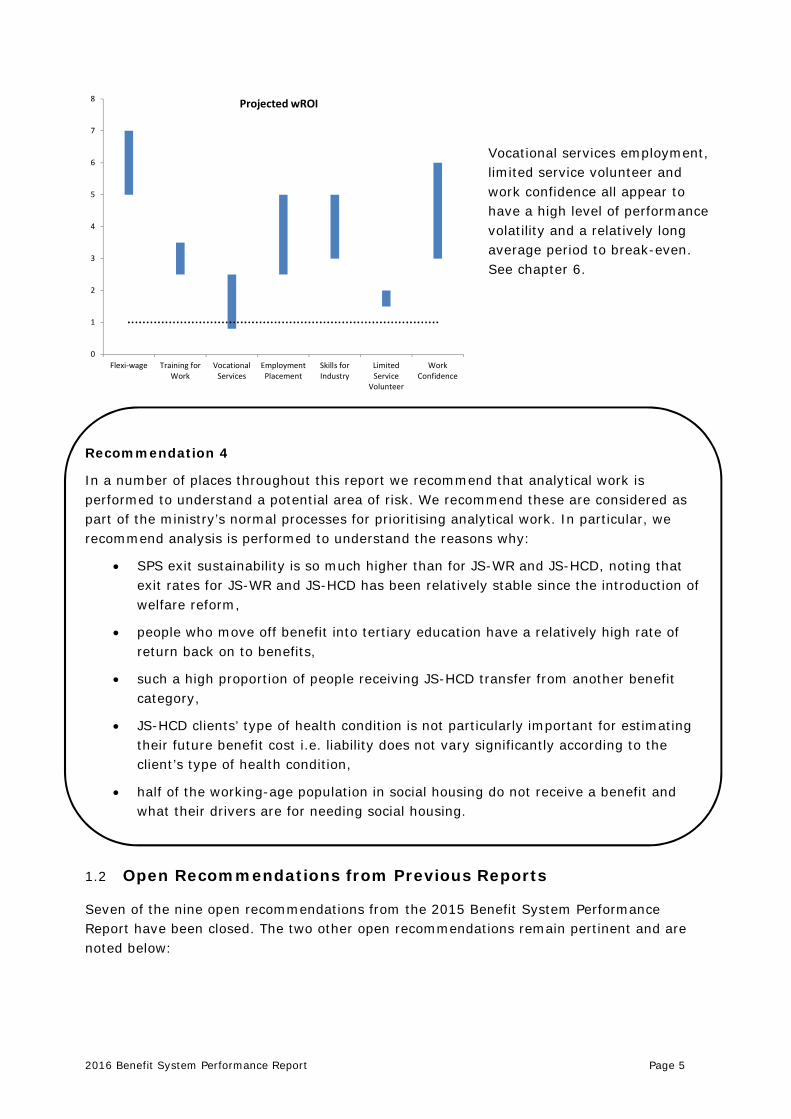
Welfare Return on Investment (wROI) has been calculated for a number of employment assistance programmes based on benefit payment savings. Because the full impact of some programmes may take many years to materialise, wROI has been predicted using estimates of future savings. On this basis, most programmes appear to perform well, with Flexi-wage and Skills for Industry being two of the better performing programmes based on this measure of ROI.
2016 Benefit System Performance Report Page 5
Vocational services employment, limited service volunteer and work confidence all appear to have a high level of performance volatility and a relatively long average period to break-even. See chapter 6.
Recommendation 4
In a number of places throughout this report we recommend that analytical work is performed to understand a potential area of risk. We recommend these are considered as part of the ministry’s normal processes for prioritising analytical work. In particular, we recommend analysis is performed to understand the reasons why:
· SPS exit sustainability is so much higher than for JS-WR and JS-HCD, noting that exit rates for JS-WR and JS-HCD has been relatively stable since the introduction of welfare reform,
· people who move off benefit into tertiary education have a relatively high rate of return back on to benefits,
· such a high proportion of people receiving JS-HCD transfer from another benefit category,
· JS-HCD clients’ type of health condition is not particularly important for estimating their future benefit cost i.e. liability does not vary significantly according to the client’s type of health condition,
· half of the working-age population in social housing do not receive a benefit and what their drivers are for needing social housing.
Open Recommendations from Previous Reports 1.2
Seven of the nine open recommendations from the 2015 Benefit System Performance Report have been closed. The two other open recommendations remain pertinent and are noted below:
0
1
2
3
4
5
6
7
8
Flexi-wage Training forWork
VocationalServices
EmploymentPlacement
Skills forIndustry
LimitedService
Volunteer
WorkConfidence
Projected wROI

Page 6 2016 Benefit System Performance Report
Recommendation 5, 2015 Benefit System Performance Report
We recommend that the design of Income Related Rent Subsidy (IRRS), Accommodation Supplement (AS) and Temporary Additional Support (TAS) be reviewed to ensure that incentives are aligned with benefit system and social housing objectives.
About 100,000 people in the BPS 1 target group benefit from IRRS paid on their behalf and/or receive TAS. The collective design of IRRS, AS and TAS creates financial disincentives for clients to move out of social housing into the private market and into employment. This is an impediment to meeting objectives of the benefit and social housing systems. See section 5.1, page 52.
Recommendation 6, 2014 Benefit System Performance Report
Management should consider whether differentiated services are appropriate for benefit system clients living in social housing.
From 2014, MSD has been assessing eligibility for social housing. There are about 45,000 main benefit system clients in social housing. Their average liability (excluding AS) is $30k higher than other clients. Combinations of risk factors are also more likely to be present. For example, 18-24 year old benefit clients who have spent time in social housing are twice as likely to have a criminal conviction and twice as likely to have had a parent on benefit for at least 80% of their teenage years. See section 4.6, page 50.
Other Key Points 1.3
BPS 1 measures are below targets but there is clear evidence of a reduction in long-term benefit dependency
The 2016 benefit system valuation highlights a $1.7bn reduction in liability attributable to the effects of policy reform and management actions. Liability is a proxy for long-term benefit dependency. Also, there is the same proportion of the working-age population receiving a main benefit as there was at the height of the pre-Global Financial Crisis (GFC) economic boom (9.8%). However, JS-WR and JS-HCD client numbers have increased in the last few months, which is concerning given strong labour market conditions.

2016 Benefit System Performance Report Page 7
An increasing proportion of benefit system clients are receiving benefits for health-related reasons
At 31 December 2016 52.3% of benefit system clients were receiving benefits for health-related reasons – an increase of more than 7% over the prior ten years. Economic cycles aside, this is forecast to increase further. The combined liability for JS-HCD and SLP clients is $28.4bn, or 42% of the total liability (excluding expenses).
Cohesive service design across health and employment services is required to best meet the needs of clients’ health and financial circumstances. This may require innovative thinking on the funding, accountability and governance structures for cross-agency work. Direct purchasing of health-related services should also be considered, with the Accident Compensation Corporation (ACC) being an example of how this can work effectively.
Fewer youth benefit clients and fewer of these clients transitioning to working-age benefits
Youth benefit client numbers have significantly decreased, from about 3,300 to about 2,900. This is partly a result of a fall in the number of YPP clients, due to a persistent decline in teenage birth rates.
Fewer youth benefit clients are transitioning to working-age benefits than before the introduction of the Youth Service. This is despite an increase in prevalence of key risk factors, such as CYF history, amongst youth benefit clients.
Collectively, this demonstrates progress with this key client group. However, early entry into the benefit system remains a key risk factor, highlighting the need for continued focus on young clients.
Factors relating to childhood vulnerability and poor childhood outcomes are the most important determinants of likelihood of long-term benefit dependency. These include intergenerational benefit receipt, Child, Youth and Family (CYF) history and poor educational attainment.
0
50,000
100,000
150,000
200,000
250,000
300,000
350,000
400,000
2003 2005 2007 2009 2011 2013 2015 2017
Number of Clients by Main Benefit
JS-WR
JS-HCD
SLP
SPS
2,000
2,500
3,000
3,500
4,000
2014 2015 2016 2017 2018
Total number receiving YP/YPP
Actual Projected 2015 Projected 2016
Forecast

Page 8 2016 Benefit System Performance Report
A strong working relationship with the Ministry for Vulnerable Children, Oranga Tamariki (MVCOT) is needed to help minimise the risk of long-term benefit dependency (and other poor outcomes) for vulnerable children.
Māori clients are significantly overrepresented in both the benefit and social housing systems
Māori clients represent 31% of the benefit system cohort and 36% of the social housing cohort, compared with 15% of the general population. Average benefit liability is $55k higher than for non-Māori.
Māori client liability has decreased over time, but not to the same extent as other ethnicities.
Relative performance is poor. More needs to be done to understand why Māori benefit experience has not improved to the same extent as other ethnicities, and what can be done to improve outcomes.
The 2013 Benefit System Performance Report recommended that ‘strategies should be considered for supporting more Māori into work and new initiatives trialed to target the barriers that cause the disparity between ethnic groups.’ This recommendation was closed during 2016 given the establishment of the Māori strategy. However, more tangible action is required on a scale sufficient to effect positive change in outcomes for Māori clients.
10
20
30
40
50
60
2011 2012 2013 2014 2015 2016
$Bill
ions Total Liability - Māori and non-Māori
Māori non-Māori

2016 Benefit System Performance Report Page 9
2 Introduction
Purpose of this report 2.1
This report highlights key dynamics of the benefit system and how they impact long-term benefit dependency. It is addressed to the Chief Executive of the Ministry of Social Development (MSD) and his leadership team, with the understanding that it will also be provided to the Minister of Finance, the Minister for Social Development and the Minister for Social Housing. The purpose of the report is for the Chief Actuary to independently:
· review recent experience in terms of exit rates, numbers of new clients and clients transitioning between benefits,
· review the performance of the benefit system and the impact of investments made to reduce benefit dependency,
· review the valuation of the liability and what can be learned from the change in liability,
· identify risks and areas of opportunity to help manage long-term benefit dependency.
The report does not explicitly cover social housing though makes comment on social housing aspects where relevant to benefit system clients. Social housing may be incorporated more broadly in the future, either as part of this report or separate reporting.
This is the fourth internal actuarial report produced in relation to the liability of the benefit system. Unless stated otherwise, it covers the period from 1 July 2015 to 31 December 2016. Previous reports have only covered the year to the previous 30 June. We have extended this to 31 December for this report to ensure information is more up-to-date.
Some of the analysis in this report relies on the liability calculations performed by Taylor Fry Consulting Actuaries and detailed in their report titled Valuation of the Benefit System for Working-age Adults as at 30 June 20161 (the 2016 Valuation Report) which was publicly released in May 2017.
Liability is a measure of future expected benefit cost and as such is a proxy for long-term benefit dependency.
Navigating this report 2.2
The report contains five core chapters: · Chapter 3 – Recent Experience – reviews benefit system experience over the 18
months to 31 December 2016, highlighting emerging or established trends relevant to managing the benefit system. It focusses on six key gateways in, through and out of the benefit system.
· Chapter 4 – Review of Valuation Results – focusses on key valuation insights management should consider in setting strategy, policy settings and managing the
1 http://www.msd.govt.nz/about-msd-and-our-work/newsroom/media-releases/2017/2016-valuation-of-the-benefit-system-for-
working-age-adults.html
Page 10 2016 Benefit System Performance Report
delivery of services to clients. This year the valuation was extended to include social housing, giving a new lens over benefit system clients.
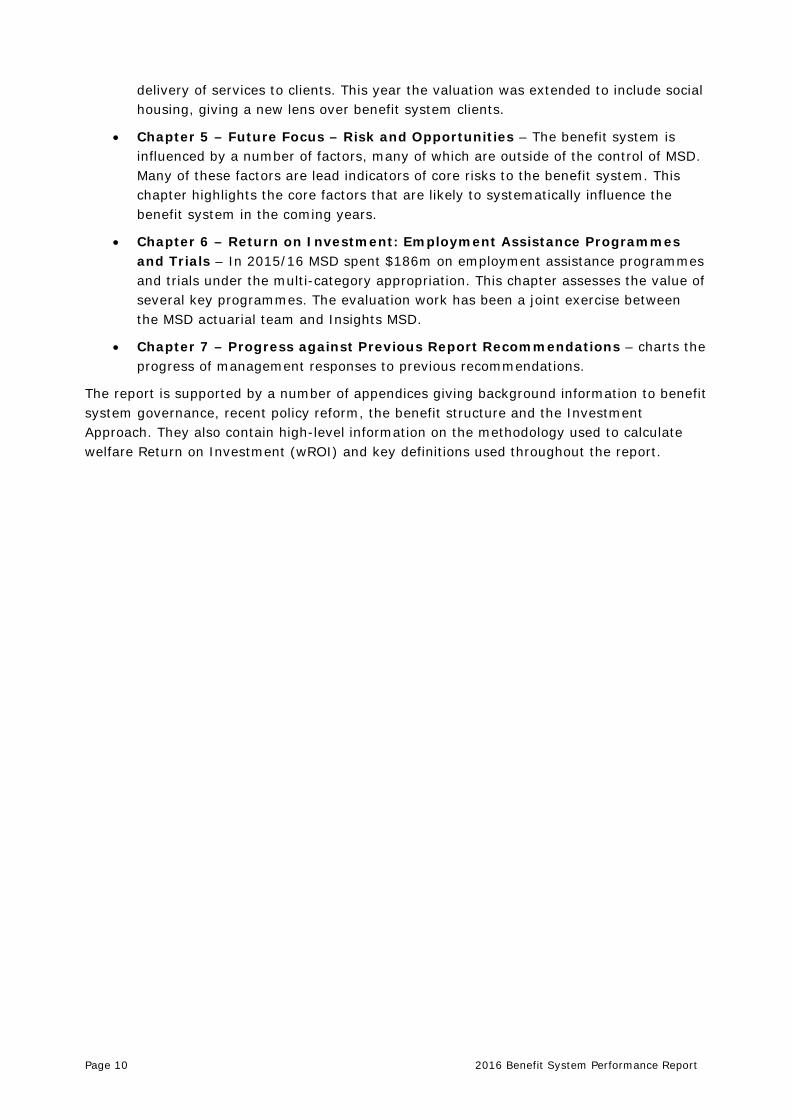
· Chapter 5 – Future Focus – Risk and Opportunities – The benefit system is influenced by a number of factors, many of which are outside of the control of MSD. Many of these factors are lead indicators of core risks to the benefit system. This chapter highlights the core factors that are likely to systematically influence the benefit system in the coming years.
· Chapter 6 – Return on Investment: Employment Assistance Programmes and Trials – In 2015/16 MSD spent $186m on employment assistance programmes and trials under the multi-category appropriation. This chapter assesses the value of several key programmes. The evaluation work has been a joint exercise between the MSD actuarial team and Insights MSD.
· Chapter 7 – Progress against Previous Report Recommendations – charts the progress of management responses to previous recommendations.
The report is supported by a number of appendices giving background information to benefit system governance, recent policy reform, the benefit structure and the Investment Approach. They also contain high-level information on the methodology used to calculate welfare Return on Investment (wROI) and key definitions used throughout the report.

2016 Benefit System Performance Report Page 11
3 Recent Experience
Summary
· BPS 1 measures are below targets, but there is clear evidence of a reduction in long-term benefit dependency as shown by the valuation. There is the same proportion of the working-age population receiving a main benefit as there was at the height of the pre-Global Financial Crisis (GFC) economic boom (9.8%).
· 47% of JS-HCD clients receive JS-HCD continuously for at least six months. This is high considering that the benefit is intended to provide temporary support. Eligibility for JS-HCD is heavily influenced by medical practitioners. Given the connection between health and employment outcomes, greater connectivity between medical practitioners and case managers should be explored.
· The Social Policy Evaluation and Research Unit’s (SUPERU) analysis of off-benefit outcomes shows that many people who leave benefits for tertiary education return to a benefit. This should be analysed further to better understand this dynamic.
· Fewer youth benefit clients are transitioning to working-age benefits than before the introduction of the Youth Service. This is despite an increase in prevalence of key risk factors, such as CYF history, amongst youth benefit clients.
Profile of the Benefit System 3.1
Chart 1 shows how the numbers of clients have changed since 2003 and how they are forecast to change to 2018. Chart 1 – Number of Clients by Main Benefit
The proportion of clients with health conditions (JS-HCD and SLP) has increased to 52.2% of clients on main benefits at 31 December 2016, up from 51.4% a year ago and 46.6% ten years ago. We forecast this to increase to about 55% by June 2018. This is partly a
0
50,000
100,000
150,000
200,000
250,000
300,000
350,000
400,000
2003 2004 2005 2006 2007 2008 2009 2010 2011 2012 2013 2014 2015 2016 2017 2018
JS-WR
JS-HCD
SLP
SPS
Forecast

Page 12 2016 Benefit System Performance Report
consequence of gradually improving economic conditions as younger and healthy clients find employment and leave the benefit system.
The combined liability for JS-HCD and SLP clients is $28.4bn, or 42% of the total liability (excluding expenses). This would be higher were it not for the fact that they are older than other clients on average, and hence have less potential future years on benefit. Their average liability tends to be higher than other clients of similar demographic profile. For example, amongst 30-39 year old NZ European females average liabilities are $351k for SLP, $212k for JS-HCD, $202k for SPS and $166k for JS-WR.
This changing mix of clients is reflected in MSD’s investment strategy through an increased focus on JS-HCD clients. There is an opportunity to work differently with clients who have health conditions, recognising that:
· Existing trends suggest this client cohort will increase further as a proportion of the total benefit system population
· Many JS-HCD and SLP clients are in social housing
· Clients’ health and financial needs are likely to be best met with a cohesive design of health and employment services.
Consistent with our recommendation in last year’s report2 (see recommendation 2, Chapter Seven), we see potential value in MSD being able to directly purchase health-related services in certain circumstances. For example, there may be elements of the Accident Compensation Corporation’s (ACC) direct purchasing approach that could be applied to the benefit system.
Chart 2 shows the proportion of clients by age band. The proportion of over fifty year old clients has increased significantly over the last six years from 27.1% in June 2010 to 31.9% in December 2016. This is partly due to a decrease in the number of younger clients. Population growth has probably also influenced the increase, with this age band growing 25% in the last 10 years.
Chart 2 – Clients by Age Band (% of Total)
2 http://www.msd.govt.nz/documents/about-msd-and-our-work/publications-resources/evaluation/investment-approach/2015-benefit-system-performance-report-final-publish.pdf
0%
10%
20%
30%
40%
50%
60%
70%
80%
90%
100%
Jan-
03
Jan-
04
Jan-
05
Jan-
06
Jan-
07
Jan-
08
Jan-
09
Jan-
10
Jan-
11
Jan-
12
Jan-
13
Jan-
14
Jan-
15
Jan-
16
50-64
40-49
30-39
20-29
16-19
Gen. pop at Dec 16

2016 Benefit System Performance Report Page 13
In absolute terms the number of over fifty year old clients (92,283 as at 31 December 2016) is nearly as high as during the GFC and 23% above the pre-GFC low (74,537 as at 31 May 2008). Nearly 80% of over fifty year old main benefit clients are receiving SLP or JS-HCD and represent $10.5bn of the total $67.1bn pre-expenses liability. It may be appropriate to consider tailored services for this population cohort.
Performance Relative to Valuation Projections 3.2
Table 1 shows the number of clients according to the valuation3. It provides further detail on the change in client numbers over the 18 months to 31 December 2016, with projected numbers from the 2016 valuation for comparison.
Table 1 – Number of Clients
Benefit Category Actual –
Quarter to 30 June 2015
Actual – Quarter to 30
June 2016
% Change June 2015 vs
June 2016
Actual – Quarter to 31
December 2016
Projected – Quarter to 31
December 2016
Actual vs Projected
Ratio
Jobseeker – Work Ready incl. Emergency Benefit
96,373 96,871 +0.5% 101,503 97,579 104%
Jobseeker – Health Conditions and Disabilities
71,535 71,159 -0.5% 73,261 71,894 102%
Sole Parent Support 77,346 73,257 -5.3% 71,838 71,449 101%
Supported Living Payment 105,943 105,057 -0.8% 104,723 104,607 100%
Youth Payment 2,193 2,061 -6.0% 1,890 1,937 98%
Young Parent Payment 1,109 1,017 -8.3% 984 987 100%
Supplementary Benefits Only 104,058 103,606 -0.4% 102,777 105,154 98%
Orphans Benefit 5,404 5,851 +8.3% 5,932 5,788 102%
Total 463,961 458,879 -1.1% 462,908 459,395 101%
Overall, client numbers are at a similar level to that projected by the 2016 valuation. In the year to 30 June 2016, client numbers reduced, particularly for SPS and youth benefits (both high liability benefit categories). This was reflected in the -$1.7bn liability decrease attributable to management influence and policy reform in the 2016 valuation. Between 30 June 2016 and 31 December 2016 client numbers have increased, partly reflecting seasonal fluctuations.
The table highlights some key aspects of how the benefit system population is evolving:
3 Client numbers in this table and several other parts of this report are based on valuation rather than official count definitions. Appendix D contains a reconciliation between the two definitions

Page 14 2016 Benefit System Performance Report
· SPS client numbers fell 5,508 over the 18 months due to sustained higher exit rates since welfare reform. Exit rate assumptions were further adjusted for the 2016 valuation to reflect this trend. Early evidence suggests extended work obligations to SPS clients whose youngest child is aged three or four may have helped increase exits from this sub-segment.
· SLP client numbers fell marginally over the 18 months, in line with valuation projections. Given previous concerns about the number of clients transferring from other benefit categories to SLP, this is an encouraging result.
· YP and YPP client numbers have decreased significantly over the 18 months. Chart 3 below shows that client numbers have decreased by about 400.
Chart 3 – YP/YPP client numbers
This is driven by two things:
o A fall in the number of YPP clients, due to a persistent decline in teenage birth rates.
o A stabilisation of YP client numbers, following increases in the first two years of the Youth Service.
· While supplementary benefits only client numbers have reduced over the 18 months, there has been a lower rate of exit for clients receiving only AS. Although we have not investigated this in detail, it is likely to at least partially reflect accommodation costs growing faster than wages in the recent past (particularly rents in major urban centres).
Benefit System Gateways 3.3
The rest of this chapter focuses on six key gateways in, through and out of the benefit system. Collectively, these gateways explain the majority of the change to the benefit system over time and the impact this has on the liability. The six gateways are:
Client Independence
1. New Jobseeker Support Clients
2. Exits from Jobseeker Support
3. Exits from Sole Parent Support
2,000
2,200
2,400
2,600
2,800
3,000
3,200
3,400
3,600
3,800
4,000
2014 2015 2016 2017 2018
Actual Projected 2015 Projected 2016

2016 Benefit System Performance Report Page 15
Youth Vulnerability
4. Transition of Youth to Working-age Benefits
Transition to High-liability Benefits
5. Transition of JS-WR Clients to JS-HCD
6. Transition to Supported Living Payment
Table 2 (with the six key gateways marked) gives a snapshot view of how clients have transitioned over the period from 30 June 2015 to 30 June 2016 compared with projections from the 30 June 2015 valuation. The projections incorporate the actual unemployment rate over the 12 months.
For clients in each benefit category in the quarter to 30 June 2015, reading across the row shows how many of these clients received a benefit in the quarter to 30 June 2016. For example, of the 96,440 JS-WR clients in the quarter to 30 June 2015, 2,666 received SPS in the quarter to 30 June 2016, and 34,835 were no longer receiving a benefit.
Conversely, the columns show for each benefit category in the quarter to 30 June 2016, how many were in each category in the quarter 30 June 2015. For example, of the 73,189 clients who received SPS in the quarter to 30 June 2016, 56,817 were receiving SPS in the quarter to 30 June 2015. 414 were SLP clients in the quarter to 30 June 2015. The ‘Recent exits’ row represents people who exited benefit in the year to 30 June 2015.
The colours indicate if the actual result was better or broadly the same (green), or worse (red) than projected.
Table 2 – Client transition – June 2015 to June 2016
JS-WR JS-HCD SPS SLP YP or YPP
SUPP - only or OB
Exits
Actual 46,160 6,554 2,666 1,213 2 5,010 34,835 96,440 Projected 45,515 7,033 2,764 1,320 3 5,050 34,755
A/P 101% 93% 96% 92% - 99% 100%Actual 5,636 44,079 1,673 4,590 - 2,087 13,764
71,829 Projected 5,553 43,880 1,961 4,816 - 2,074 13,544 A/P 101% 100% 85% 95% - 101% 102%Actual 4,119 1,191 56,817 802 - 5,363 9,082
77,374 Projected 3,695 1,236 57,477 919 - 5,136 8,910 A/P 111% 96% 99% 87% - 104% 102%Actual 886 1,016 414 92,988 - 529 9,903
105,736 Projected 927 1,133 440 92,891 3 520 9,822 A/P 96% 90% 94% 100% - 102% 101%Actual 871 93 527 21 836 35 860
3,243 Projected 1,002 104 571 18 834 55 659 A/P 87% 89% 92% - 100% 64% 131%Actual 3,218 1,875 2,613 464 6 73,794 24,432
106,402 Projected 3,652 2,088 2,820 513 3 68,027 29,298 A/P 88% 90% 93% 90% - 108% 83%Actual 60,890 54,808 64,710 100,078 844 86,818 92,876
461,024 Projected 60,344 55,474 66,033 100,477 843 80,862 96,988 A/P 101% 99% 98% 100% 100% 107% 96%Actual 8,595 3,602 2,250 665 28 3,027 77,215
95,382 Projected 8,647 3,638 2,330 767 27 3,770 76,204 A/P 99% 99% 97% 87% 104% 80% 101%Actual 69,485 58,410 66,960 100,743 872 89,845 170,091
556,406 Projected 68,991 59,112 68,363 101,244 870 84,632 173,192 A/P 101% 99% 98% 100% 100% 106% 98%
88,643 Actual 27,392 12,862 6,229 4,005 2,094 16,457 19,604 91,148 Projected 27,729 12,283 6,010 4,178 2,301 19,597 19,050
97% A/P 99% 105% 104% 96% 91% 84% 103%Actual 96,877 71,272 73,189 104,748 2,966 106,302 189,695 Projected 96,720 71,395 74,373 105,422 3,171 104,229 192,242 A/P 100% 100% 98% 99% 94% 102% 99%
30 June 2016 Benefit Category
Total
30 June 2015 Benefit Category
JS-WR
JS-HCD
SPS
SLP
YP orYPP
SUPP - only or OB
Sub-Total
RecentExits
Sub-Total
NewClients
4
6
1
5
1
2
3
Page 16 2016 Benefit System Performance Report
Aside from the six benefit gateways themselves, some overall observations from the table are:
· Exits from SUPP-only or OB – The number of clients receiving only supplementary benefits who have become completely independent of the benefit system is significantly lower than projected (24,432 vs 29,298). This is mainly because people are receiving Accommodation Supplement for longer on average. The assumed rate of exit was decreased for the 2016 valuation causing an approximate $0.4bn increase in liability.
· New SPS client numbers – While there has been success in supporting SPS clients to exit from benefit (gateway 3), the numbers of new SPS clients were higher than projected over the year (6,229 vs. 6,010).
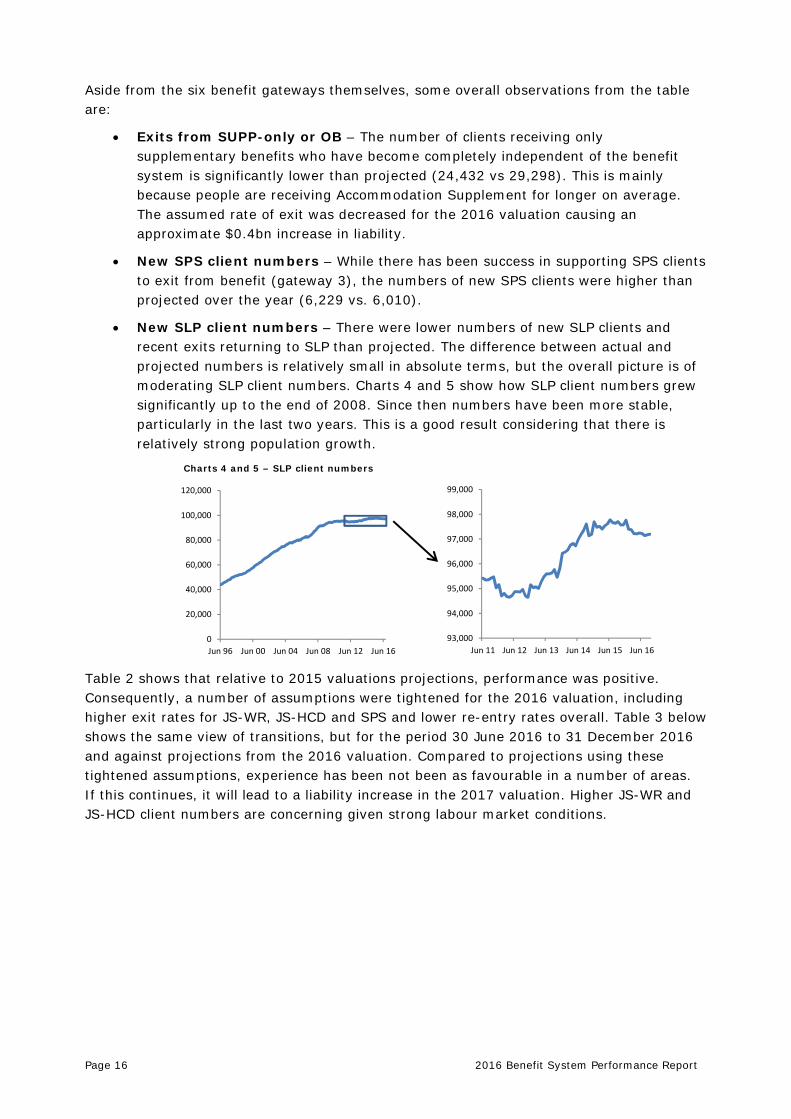
· New SLP client numbers – There were lower numbers of new SLP clients and recent exits returning to SLP than projected. The difference between actual and projected numbers is relatively small in absolute terms, but the overall picture is of moderating SLP client numbers. Charts 4 and 5 show how SLP client numbers grew significantly up to the end of 2008. Since then numbers have been more stable, particularly in the last two years. This is a good result considering that there is relatively strong population growth.
Charts 4 and 5 – SLP client numbers
Table 2 shows that relative to 2015 valuations projections, performance was positive. Consequently, a number of assumptions were tightened for the 2016 valuation, including higher exit rates for JS-WR, JS-HCD and SPS and lower re-entry rates overall. Table 3 below shows the same view of transitions, but for the period 30 June 2016 to 31 December 2016 and against projections from the 2016 valuation. Compared to projections using these tightened assumptions, experience has been not been as favourable in a number of areas. If this continues, it will lead to a liability increase in the 2017 valuation. Higher JS-WR and JS-HCD client numbers are concerning given strong labour market conditions.
0
20,000
40,000
60,000
80,000
100,000
120,000
Jun 96 Jun 00 Jun 04 Jun 08 Jun 12 Jun 1693,000
94,000
95,000
96,000
97,000
98,000
99,000
Jun 11 Jun 12 Jun 13 Jun 14 Jun 15 Jun 16
2016 Benefit System Performance Report Page 17
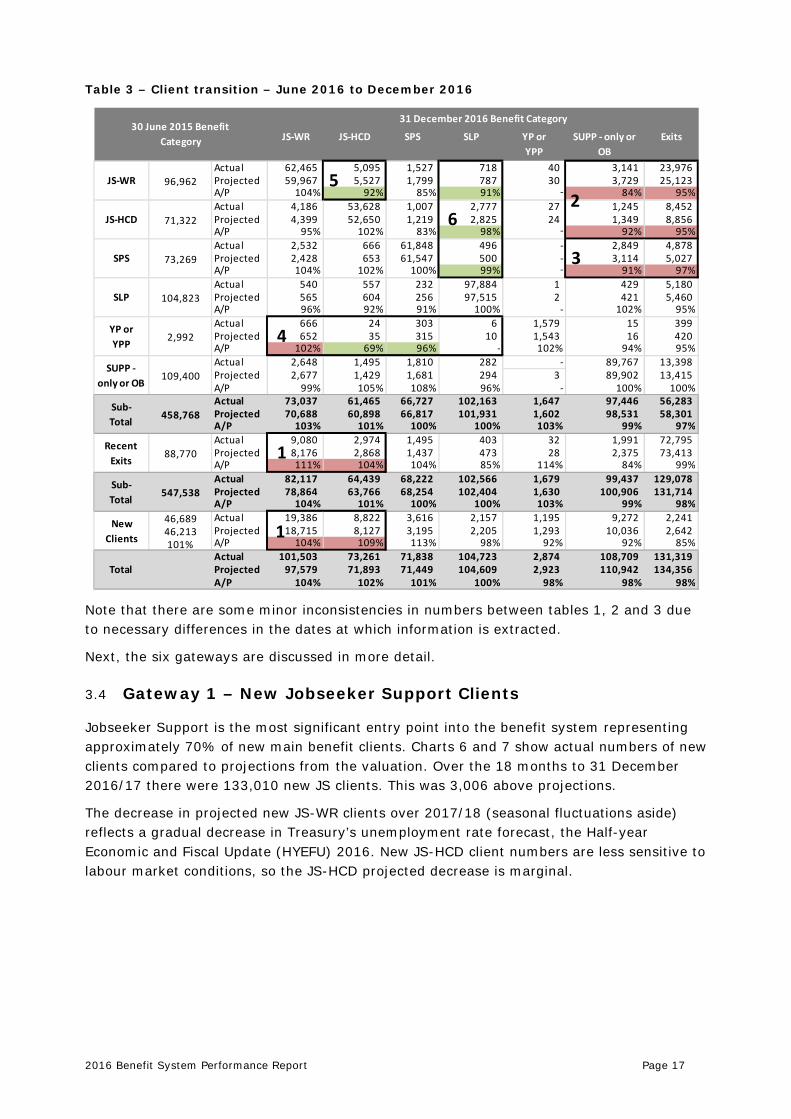
Table 3 – Client transition – June 2016 to December 2016
Note that there are some minor inconsistencies in numbers between tables 1, 2 and 3 due to necessary differences in the dates at which information is extracted.
Next, the six gateways are discussed in more detail.
Gateway 1 – New Jobseeker Support Clients 3.4
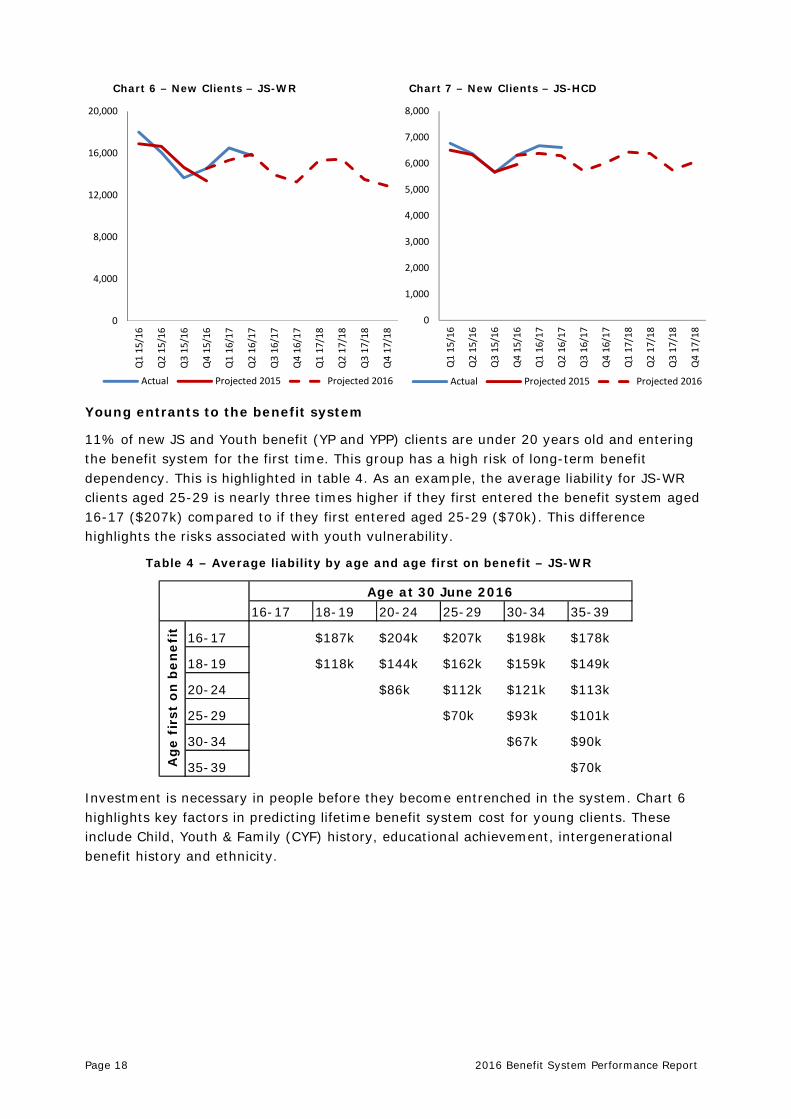
Jobseeker Support is the most significant entry point into the benefit system representing approximately 70% of new main benefit clients. Charts 6 and 7 show actual numbers of new clients compared to projections from the valuation. Over the 18 months to 31 December 2016/17 there were 133,010 new JS clients. This was 3,006 above projections.
The decrease in projected new JS-WR clients over 2017/18 (seasonal fluctuations aside) reflects a gradual decrease in Treasury’s unemployment rate forecast, the Half-year Economic and Fiscal Update (HYEFU) 2016. New JS-HCD client numbers are less sensitive to labour market conditions, so the JS-HCD projected decrease is marginal.
31 December 2016 Benefit Category
JS-WR JS-HCD SPS SLP YP or YPP
SUPP - only or OB
Exits
Actual 62,465 5,095 1,527 718 40 3,141 23,976 96,962 Projected 59,967 5,527 1,799 787 30 3,729 25,123
A/P 104% 92% 85% 91% - 84% 95%Actual 4,186 53,628 1,007 2,777 27 1,245 8,452
71,322 Projected 4,399 52,650 1,219 2,825 24 1,349 8,856 A/P 95% 102% 83% 98% - 92% 95%Actual 2,532 666 61,848 496 - 2,849 4,878
73,269 Projected 2,428 653 61,547 500 - 3,114 5,027 A/P 104% 102% 100% 99% - 91% 97%Actual 540 557 232 97,884 1 429 5,180
104,823 Projected 565 604 256 97,515 2 421 5,460 A/P 96% 92% 91% 100% - 102% 95%Actual 666 24 303 6 1,579 15 399
2,992 Projected 652 35 315 10 1,543 16 420 A/P 102% 69% 96% - 102% 94% 95%Actual 2,648 1,495 1,810 282 - 89,767 13,398
109,400 Projected 2,677 1,429 1,681 294 3 89,902 13,415 A/P 99% 105% 108% 96% - 100% 100%Actual 73,037 61,465 66,727 102,163 1,647 97,446 56,283
458,768 Projected 70,688 60,898 66,817 101,931 1,602 98,531 58,301 A/P 103% 101% 100% 100% 103% 99% 97%Actual 9,080 2,974 1,495 403 32 1,991 72,795
88,770 Projected 8,176 2,868 1,437 473 28 2,375 73,413 A/P 111% 104% 104% 85% 114% 84% 99%Actual 82,117 64,439 68,222 102,566 1,679 99,437 129,078
547,538 Projected 78,864 63,766 68,254 102,404 1,630 100,906 131,714 A/P 104% 101% 100% 100% 103% 99% 98%
46,689 Actual 19,386 8,822 3,616 2,157 1,195 9,272 2,241 46,213 Projected 18,715 8,127 3,195 2,205 1,293 10,036 2,642 101% A/P 104% 109% 113% 98% 92% 92% 85%
Actual 101,503 73,261 71,838 104,723 2,874 108,709 131,319 Projected 97,579 71,893 71,449 104,609 2,923 110,942 134,356 A/P 104% 102% 101% 100% 98% 98% 98%
Total
30 June 2015 Benefit Category
JS-WR
JS-HCD
SPS
SLP
YP orYPP
SUPP - only or OB
Sub-Total
RecentExits
Sub-Total
NewClients
4
6
1
5
1
2
3
Page 18 2016 Benefit System Performance Report
Chart 6 – New Clients – JS-WR Chart 7 – New Clients – JS-HCD
Young entrants to the benefit system
11% of new JS and Youth benefit (YP and YPP) clients are under 20 years old and entering the benefit system for the first time. This group has a high risk of long-term benefit dependency. This is highlighted in table 4. As an example, the average liability for JS-WR clients aged 25-29 is nearly three times higher if they first entered the benefit system aged 16-17 ($207k) compared to if they first entered aged 25-29 ($70k). This difference highlights the risks associated with youth vulnerability.
Table 4 – Average liability by age and age first on benefit – JS-WR
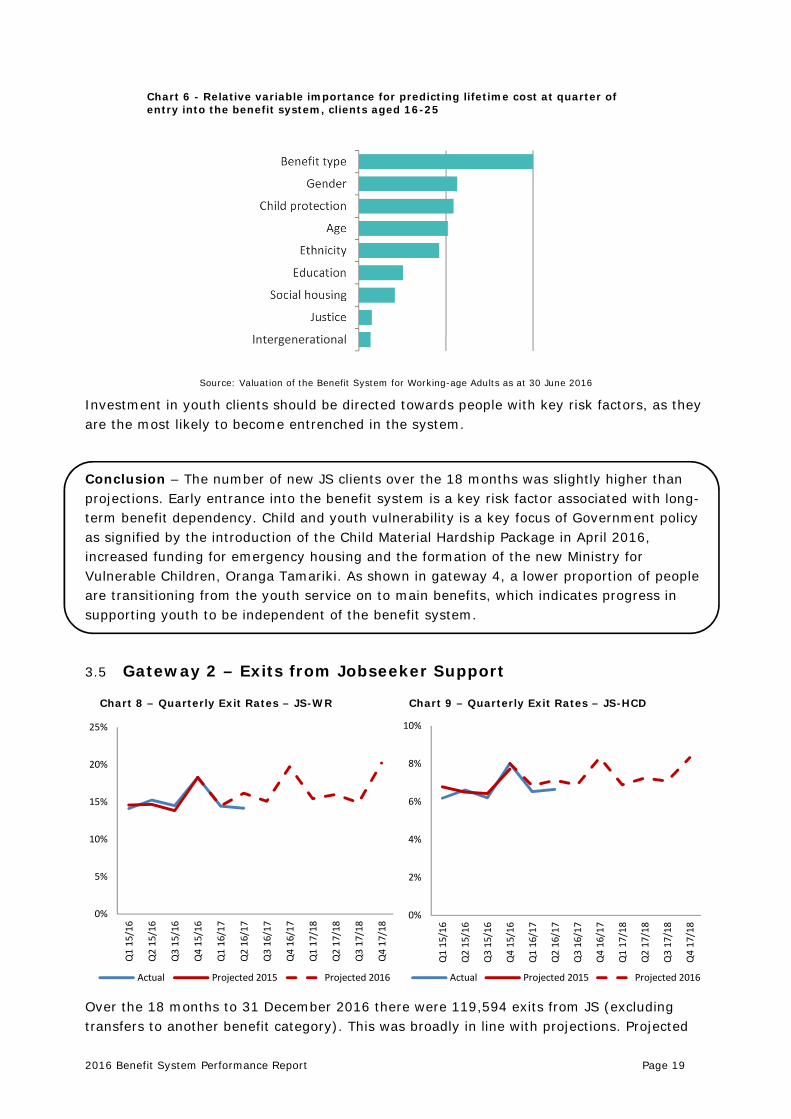
Investment is necessary in people before they become entrenched in the system. Chart 6 highlights key factors in predicting lifetime benefit system cost for young clients. These include Child, Youth & Family (CYF) history, educational achievement, intergenerational benefit history and ethnicity.
0
4,000
8,000
12,000
16,000
20,000
Q1
15/1
6
Q2
15/1
6
Q3
15/1
6
Q4
15/1
6
Q1
16/1
7
Q2
16/1
7
Q3
16/1
7
Q4
16/1
7
Q1
17/1
8
Q2
17/1
8
Q3
17/1
8
Q4
17/1
8Actual Projected 2015 Projected 2016
0
1,000
2,000
3,000
4,000
5,000
6,000
7,000
8,000
Q1
15/1
6
Q2
15/1
6
Q3
15/1
6
Q4
15/1
6
Q1
16/1
7
Q2
16/1
7
Q3
16/1
7
Q4
16/1
7
Q1
17/1
8
Q2
17/1
8
Q3
17/1
8
Q4
17/1
8
Actual Projected 2015 Projected 2016
16-17 18-19 20-24 25-29 30-34 35-39
16-17 $187k $204k $207k $198k $178k
18-19 $118k $144k $162k $159k $149k
20-24 $86k $112k $121k $113k
25-29 $70k $93k $101k
30-34 $67k $90k
35-39 $70kAg
e f
irst
on
be
ne
fit
Age at 30 June 2016
2016 Benefit System Performance Report Page 19
Source: Valuation of the Benefit System for Working-age Adults as at 30 June 2016
Investment in youth clients should be directed towards people with key risk factors, as they are the most likely to become entrenched in the system.
Conclusion – The number of new JS clients over the 18 months was slightly higher than projections. Early entrance into the benefit system is a key risk factor associated with long-term benefit dependency. Child and youth vulnerability is a key focus of Government policy as signified by the introduction of the Child Material Hardship Package in April 2016, increased funding for emergency housing and the formation of the new Ministry for Vulnerable Children, Oranga Tamariki. As shown in gateway 4, a lower proportion of people are transitioning from the youth service on to main benefits, which indicates progress in supporting youth to be independent of the benefit system.
Gateway 2 – Exits from Jobseeker Support 3.5
Chart 8 – Quarterly Exit Rates – JS-WR Chart 9 – Quarterly Exit Rates – JS-HCD
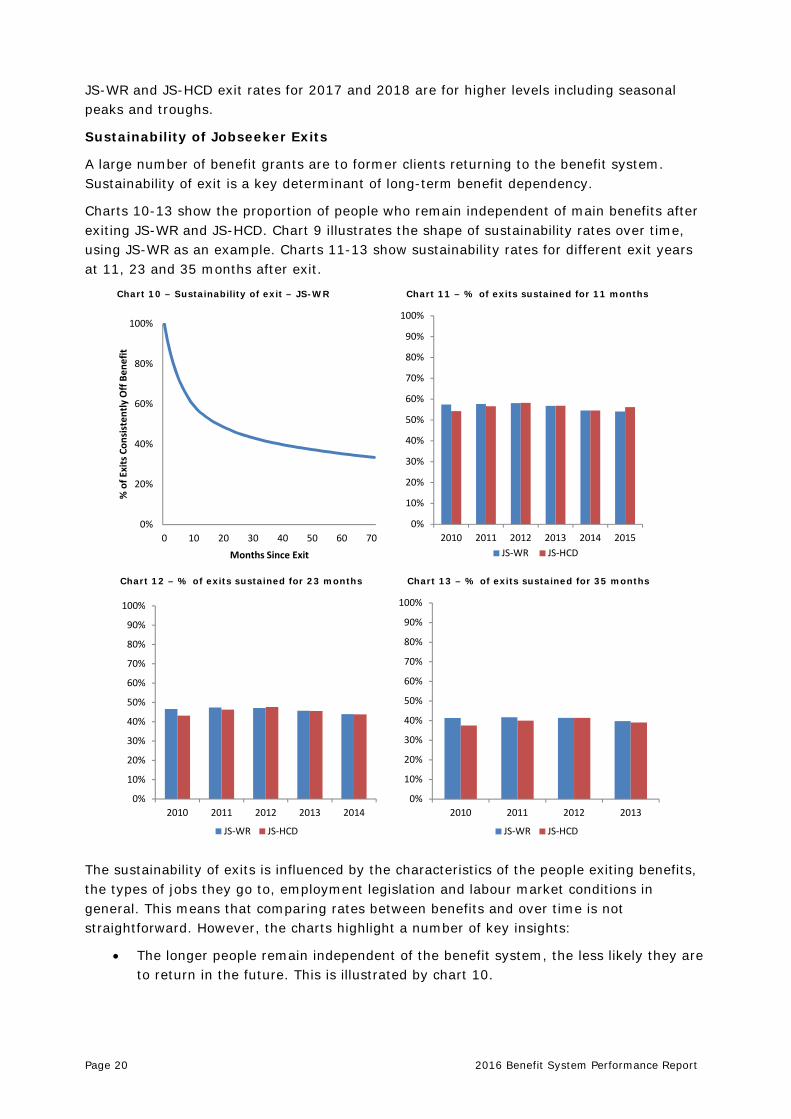
Over the 18 months to 31 December 2016 there were 119,594 exits from JS (excluding transfers to another benefit category). This was broadly in line with projections. Projected
Benefit type
Gender
Child protection
Age
Ethnicity
Education
Social housing
Justice
Intergenerational
0%
5%
10%
15%
20%
25%
Q1
15/1
6
Q2
15/1
6
Q3
15/1
6
Q4
15/1
6
Q1
16/1
7
Q2
16/1
7
Q3
16/1
7
Q4
16/1
7
Q1
17/1
8
Q2
17/1
8
Q3
17/1
8
Q4
17/1
8
Actual Projected 2015 Projected 2016
0%
2%
4%
6%
8%
10%
Q1
15/1
6
Q2
15/1
6
Q3
15/1
6
Q4
15/1
6
Q1
16/1
7
Q2
16/1
7
Q3
16/1
7
Q4
16/1
7
Q1
17/1
8
Q2
17/1
8
Q3
17/1
8
Q4
17/1
8
Actual Projected 2015 Projected 2016
Chart 6 - Relative variable importance for predicting lifetime cost at quarter of entry into the benefit system, clients aged 16-25
Page 20 2016 Benefit System Performance Report
JS-WR and JS-HCD exit rates for 2017 and 2018 are for higher levels including seasonal peaks and troughs.
Sustainability of Jobseeker Exits
A large number of benefit grants are to former clients returning to the benefit system. Sustainability of exit is a key determinant of long-term benefit dependency.
Charts 10-13 show the proportion of people who remain independent of main benefits after exiting JS-WR and JS-HCD. Chart 9 illustrates the shape of sustainability rates over time, using JS-WR as an example. Charts 11-13 show sustainability rates for different exit years at 11, 23 and 35 months after exit.
Chart 10 – Sustainability of exit – JS-WR Chart 11 – % of exits sustained for 11 months
Chart 12 – % of exits sustained for 23 months Chart 13 – % of exits sustained for 35 months
The sustainability of exits is influenced by the characteristics of the people exiting benefits, the types of jobs they go to, employment legislation and labour market conditions in general. This means that comparing rates between benefits and over time is not straightforward. However, the charts highlight a number of key insights:
· The longer people remain independent of the benefit system, the less likely they are to return in the future. This is illustrated by chart 10.
0%
20%
40%
60%
80%
100%
0 10 20 30 40 50 60 70
% o
f Exi
ts C
onsi
sten
tly O
ff B
enef
it
Months Since Exit
0%
10%
20%
30%
40%
50%
60%
70%
80%
90%
100%
2010 2011 2012 2013 2014 2015JS-WR JS-HCD
0%
10%
20%
30%
40%
50%
60%
70%
80%
90%
100%
2010 2011 2012 2013 2014
JS-WR JS-HCD
0%
10%
20%
30%
40%
50%
60%
70%
80%
90%
100%
2010 2011 2012 2013
JS-WR JS-HCD

2016 Benefit System Performance Report Page 21
· Exit sustainability rates for JS-WR and JS-HCD are very similar, with approximately 55% of exits sustained for at least 11 months and 45% sustained for at least 23 months. This is despite the benefits serving different purposes.
· Exit sustainability rates have not varied significantly over the last five years. There is some evidence of a decrease in sustainability of exits in the last three years though this is marginal.
Conclusion – JS-WR exit rates have been broadly in line with projections and the sustainability of exits is not materially different to previous years. Improving the sustainability of exits remains an important factor in reducing long-term benefit dependency.
Gateway 3 – Exits from Sole Parent Support 3.6
The number of people receiving SPS decreased from 77,346 to 71,838 over the 18 months to 31 December 2016, mainly due to a high number of people leaving the benefit system or transferring to supplementary benefits only. There was also been a higher than projected number of people transferring to JS-WR.
Charts 14 and 15 show the rate at which SPS clients are exiting the benefit system entirely or moving off SPS, but receiving supplementary benefits. The rates of exiting the system entirely are higher than projected in the 2015 valuation. Consequently, the assumed future exit rates for the 2016 valuation have increased. Increased exit rates since welfare reform phase II in 2012 and the introduction of work-focused case management in 2013 are now fully incorporated into assumptions.
Projections for 2017 and 2018 are for exit rates to be relatively stable (seasonal fluctuations aside).
Chart 14 – Quarterly Exit Rates – SPS Chart 15 – Quarterly transition from SPS to SUP only
The Child Material Hardship Package (CMHP) came into effect on 1 April 2016. This included the extension of work obligations to SPS clients whose youngest child is aged 3-4 years. Early evidence suggests that this has reduced the number of clients in the ‘youngest child aged 3-4’ segment. Chart 16 shows SPS client numbers as a percentage of the number of clients at 31 December 2015, split by the age of the youngest child.
0%
1%
2%
3%
4%
5%
Q1
15/1
6
Q2
15/1
6
Q3
15/1
6
Q4
15/1
6
Q1
16/1
7
Q2
16/1
7
Q3
16/1
7
Q4
16/1
7
Q1
17/1
8
Q2
17/1
8
Q3
17/1
8
Q4
17/1
8
Actual Projected 2015 Projected 2016
0.0%
0.5%
1.0%
1.5%
2.0%
2.5%
3.0%
Q1
15/1
6
Q2
15/1
6
Q3
15/1
6
Q4
15/1
6
Q1
16/1
7
Q2
16/1
7
Q3
16/1
7
Q4
16/1
7
Q1
17/1
8
Q2
17/1
8
Q3
17/1
8
Q4
17/1
8
Actual Projected 2015 Projected 2016

Page 22 2016 Benefit System Performance Report
Chart 16 – SPS client number by age of youngest child – change Since 31 December 2015
The difference between segments is evident from about the time CMHP was introduced, with the youngest child aged 3-4 line dropping to about 17% below the 31 December 2015 level. This is a decrease of 2,400 clients, equivalent to about +$0.5bn in actuarial release.
Sustainability of Sole Parent Support Exits
Charts 17-20 show the proportion of people who remain independent of main benefits after exiting SPS.
Chart 17 – Sustainability of exit – SPS Chart 18 – % of exits sustained for 11 months
-20%
-18%
-16%
-14%
-12%
-10%
-8%
-6%
-4%
-2%
0%Ja
n-16
Feb-
16
Mar
-16
Apr-
16
May
-16
Jun-
16
Jul-1
6
Aug-
16
Sep-
16
Oct
-16
Nov
-16
Dec
-16
Jan-
17
Feb-
17
Mar
-17
Apr-
17
0-2
3-4
5-13
0%
10%
20%
30%
40%
50%
60%
70%
80%
90%
100%
0 10 20 30 40 50 60 70
% o
f Exi
ts S
till O
ff B
enef
it
Months Since Exit
0%
10%
20%
30%
40%
50%
60%
70%
80%
90%
100%
2010 2011 2012 2013 2014 2015

2016 Benefit System Performance Report Page 23
Chart 19 – % of exits sustained for 23 months Chart 20 – % of exits sustained for 35 months
The sustainability of exits has not varied significantly year-on-year with 65%-70% of former SPS clients remaining off main benefits for at least 11 months, and 55%-60% remaining off for at least 23 months. These are significantly higher than for JS clients (about 55% at 11 months and about 45% at 23 months).
The characteristics of clients, reasons for needing benefit support, reasons for moving off benefit and type of employment will differ between JS and SPS clients. Regardless, we recommend analysis is performed to understand the reasons why SPS exit sustainability is so much higher. They may be relevant to the way we support JS clients to become independent of the benefit system.
Conclusion – SPS continues to be a key area of success, principally as a result of significant policy reform in 2012 and a major change in case management approach in 2013. Forecasts suggest that the number of people on SPS will continue to decrease in the short term.
Superu Research: Off-Benefit Outcomes 3.7
Once a client leaves the benefit system they have no obligation to keep MSD informed of their circumstances or employment status. Consequently, our view of former clients’ off-benefit outcomes is relatively limited through MSD administration data alone.
In 2016 the Social Policy Evaluation and Research Unit (Superu) commissioned Taylor Fry Consulting Actuaries to use the data in Statistics New Zealand’s Integrated Data Infrastructure (IDI) to look at where people go when they move off benefit. The IDI contains linked, anonymised datasets across a number of government departments and agencies. In particular, it includes Inland Revenue data, which allows us to understand employment outcomes.
Taylor Fry looked at approximately 140,000 people who moved off benefit between 1 July 2010 and 30 June 2011, and analysed their outcomes over the subsequent two years. We summarise the report findings here before making some comments about management insights and possible extensions of the analysis. All figures come from the associated Superu report ‘Off-benefit transitions: Where do people go?’4
4 http://www.superu.govt.nz/publication/benefit-transitions-where-do-people-go
0%
10%
20%
30%
40%
50%
60%
70%
80%
90%
100%
2010 2011 2012 2013 20140%
10%
20%
30%
40%
50%
60%
70%
80%
90%
100%
2010 2011 2012 2013

Page 24 2016 Benefit System Performance Report
Why do people leave the benefit system?
Chart 21 categorises the 140,000 people by the reason the data implies they exited benefit.
Chart 21 - People leaving benefit by exit reason
About half of these people left to take up employment (38%) or to start an education/training course (about 11%). A further 13% left due to a change in life circumstances (death, retirement or going overseas), and 3% were detained in prison.
A clear reason for exit could not be identified for a third of leavers (the two ‘other’ categories). A separate analysis of MSD’s ‘reason of exit’ code implies that about 12% were no longer eligible for a benefit (e.g. because they were supported by a partner) and another 13% left to take up employment or go overseas, but there is no record in the IDI of such activity.
Of people moving off benefit into employment, 57% had income shortly thereafter of under $3,000 a month and 82% under $4,000 a month, implying that most are moving into relatively low-wage employment.
What do people do after they have left?
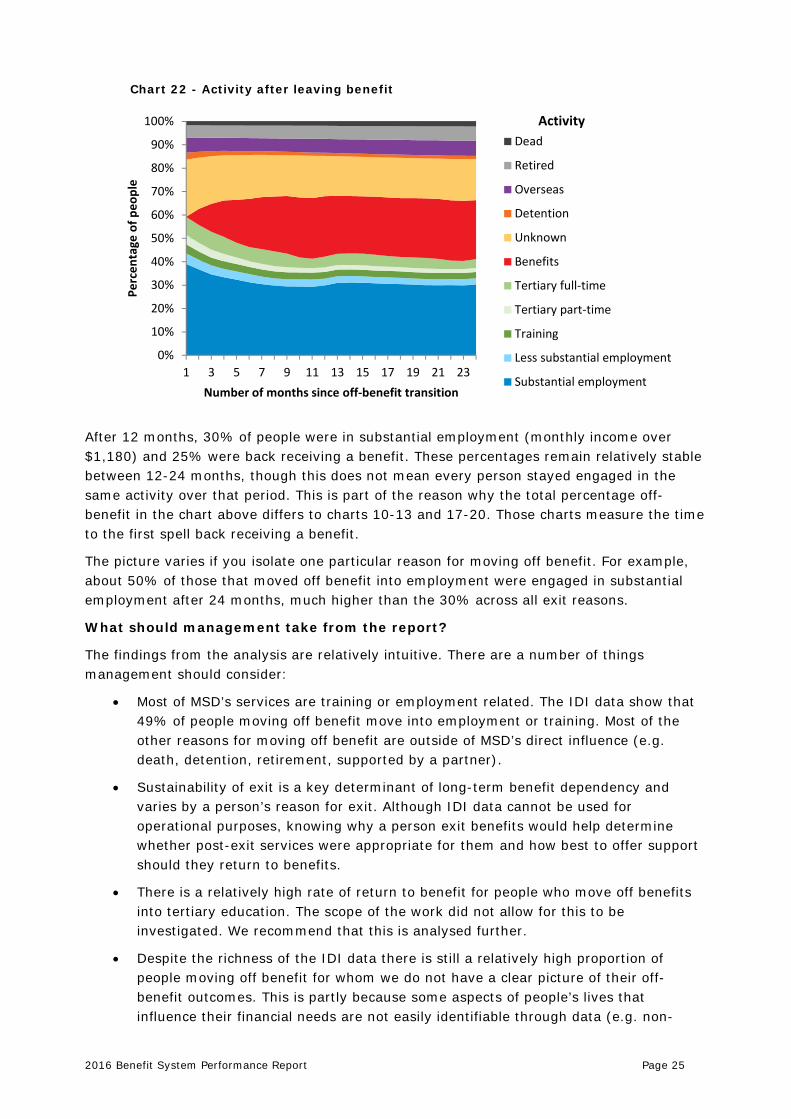
Chart 22 below shows the proportion of people in each activity group in the 24 months after they moved off benefit, starting with the proportions in chart 21.
38%
27%
8%7% 6% 5%
3% 2% 2% 2%
0
10000
20000
30000
40000
50000
60000
2016 Benefit System Performance Report Page 25
Chart 22 - Activity after leaving benefit
After 12 months, 30% of people were in substantial employment (monthly income over $1,180) and 25% were back receiving a benefit. These percentages remain relatively stable between 12-24 months, though this does not mean every person stayed engaged in the same activity over that period. This is part of the reason why the total percentage off-benefit in the chart above differs to charts 10-13 and 17-20. Those charts measure the time to the first spell back receiving a benefit.
The picture varies if you isolate one particular reason for moving off benefit. For example, about 50% of those that moved off benefit into employment were engaged in substantial employment after 24 months, much higher than the 30% across all exit reasons.
What should management take from the report?
The findings from the analysis are relatively intuitive. There are a number of things management should consider:
· Most of MSD’s services are training or employment related. The IDI data show that 49% of people moving off benefit move into employment or training. Most of the other reasons for moving off benefit are outside of MSD’s direct influence (e.g. death, detention, retirement, supported by a partner).
· Sustainability of exit is a key determinant of long-term benefit dependency and varies by a person’s reason for exit. Although IDI data cannot be used for operational purposes, knowing why a person exit benefits would help determine whether post-exit services were appropriate for them and how best to offer support should they return to benefits.
· There is a relatively high rate of return to benefit for people who move off benefits into tertiary education. The scope of the work did not allow for this to be investigated. We recommend that this is analysed further.
· Despite the richness of the IDI data there is still a relatively high proportion of people moving off benefit for whom we do not have a clear picture of their off-benefit outcomes. This is partly because some aspects of people’s lives that influence their financial needs are not easily identifiable through data (e.g. non-
0%
10%
20%
30%
40%
50%
60%
70%
80%
90%
100%
1 3 5 7 9 11 13 15 17 19 21 23
Perc
enta
ge o
f peo
ple
Number of months since off-benefit transition
Dead
Retired
Overseas
Detention
Unknown
Benefits
Tertiary full-time
Tertiary part-time
Training
Less substantial employment
Substantial employment
Activity
Page 26 2016 Benefit System Performance Report
marital relationships). We should expect this proportion to remain relatively high. Better identification of exit reason when a benefit is cancelled would help to some degree. However, this is a limited source of information because it is self-reported (i.e. dependent on what the client tells us) and only at a point in time.
Is it useful to repeat and/or extend the analysis?
The analysis was performed on a cohort of clients who left the benefit system prior to welfare reforms.
It is relatively easy to repeat the analysis for different study populations (e.g. people moving off benefit pre-GFC and post welfare reform) and over different time periods. Periodically performing this exercise will allow understanding of how off-benefit outcomes are changing over time.
As well as further analysis of the high return to benefit rate for people going into tertiary education, there are other research questions that would be useful extensions of the analysis. For example, is there evidence of salary progression for people who sustain employment?
At the time of publishing this report, work is underway at MSD to repeat and extend the analysis for a cohort of clients who left the benefit system post welfare reform.
Gateway 4 – Transition of Youth to Working-Age Benefits 3.8
People who enter the benefit system during their teenage years have a high risk of long-term benefit dependency. Intergenerational benefit dependency and CYF history are also key risk indictors. This highlights the importance of the youth benefit categories and particularly the rate at which YP/YPP clients transition onto working-age benefits.
In August 2012, the Youth Service was introduced to improve future outcomes for youth clients and teenagers not in education, employment or training (NEET). The aim is to help young people build an independent future and reduce their risk of transitioning to working-age benefits after age 18, through the achievement of NCEA Level 2 or higher and the development of life skills.
Charts 23 and 24 show former clients’ status a year after they became eligible for working-age benefits. Each vertical bar represents the cohort of YP clients who turned 17 (first chart) or YPP clients who turned 18 (second chart) in each quarter. The colour coding of the vertical bars represents the benefit these clients were receiving two years later. In both charts the yellow bars representing ‘not on benefit’ have grown i.e. fewer YP/YPP clients are transitioning to working age benefits. This is despite an increase in prevalence of key risk factors amongst youth benefit clients since the introduction of the Youth Service e.g. the proportion of clients with Child, Youth and Family history.

2016 Benefit System Performance Report Page 27
Chart 23 – Transition to working-age benefits – YP Chart 24 – Transition to working-age benefits - YPP
Source: Valuation of the Benefit System for Working-age Adults as at 30 June 2016
The Youth Service has no control group against which to compare outcomes. Also, comparing to youth clients before the Youth Service was introduced is difficult because external factors may have influenced outcomes e.g. changes to the benefit system and labour market conditions. Regardless, the improvement in outcomes appears sustained.
This is broadly consistent with separate Treasury research on the impact of the Youth Service which states that “Participation in the programme appears to raise subsequent benefit receipt rates in the short term, but there is some evidence that it encourages a move off benefit and into work in the medium term (24 to 30 months after starting benefit), especially for YPP participants.”5
Conclusion – Fewer youth benefit clients are transitioning to working-age benefits than before. Together with lower youth benefit client numbers, this demonstrates progress with this key client group. Nevertheless, youth clients have a high risk of long-term benefit dependency and should remain a focus. Factors relating to childhood vulnerability and poor childhood outcomes are the most important determinants of likelihood of long-term benefit dependency. A strong working relationship with the Ministry for Vulnerable Children, Oranga Tamariki is needed to help minimise the risk of long-term benefit dependency (and other poor outcomes) for vulnerable children.
Gateway 5 – Transition of JS-WR Clients to JS-HCD 3.9
Transition of JS clients from WR to HCD is a movement to a client segment with a higher risk of long-term benefit dependence. JS-HCD clients have a lower rate of exit from benefits and a higher rate of transition to SLP.
Over the 12 months to 30 June 2016, the rate of transition was above projections from the 2015 valuation (see the chart 25). Consequently the assumed rate of transition was increased for the 2016 valuation. In the subsequent 6 months to 31 December 2016 the
5 http://www.treasury.govt.nz/publications/research-policy/wp/2016/16-07
0%
20%
40%
60%
80%
100%
Quarter of 17 year old IYB/YP snapshot
JS SPS/Other Not on benefits
Fully affected by youth service
0%
20%
40%
60%
80%
100%
Quarter of 18 year old DPB/YPP snapshot
SPS JS/Other Not on benefits
Fully affected by youth service
Youth Program Payt Young Parent Payt

Page 28 2016 Benefit System Performance Report
rate of transition has been below the elevated 2016 projections. Projections for 2017 and 2018 suggest a steady transition rate (seasonal highs and lows aside).
Chart 25 – Quarterly transition rate – JS-WR to JS-HCD
JS-HCD is intended to be a temporary benefit to support a client during a period where a health condition or disability affects their ability to work. The temporary nature of the benefit is reinforced by requiring regular medical certificates and annual reapplication after the benefit is first granted.
Chart 26 shows the duration profile of JS-HCD clients over the three and half years to 31 December 2016. At 31 December 2016, most JS-HCD clients (80%) have been receiving benefits (any benefit) continuously for over six months and 51% for over two years. The population is heavily skewed to long duration clients, which seems inconsistent with the purpose of the benefit.
Chart 26 – JS-HCD client profile – continuous time on main benefit
Looking at the duration profile of the current population can be a little misleading, as it does not tell you anything about the duration of clients that have exited the system. Table 5 is for all people who started a JS-HCD benefit spell in 2014 as a new benefit grant or a transfer from another benefit category, and shows how long they continuously received JS-HCD over the following two years:
0.0%
0.5%
1.0%
1.5%
2.0%
2.5%
3.0%
3.5%
4.0%
Q1
15/1
6
Q2
15/1
6
Q3
15/1
6
Q4
15/1
6
Q1
16/1
7
Q2
16/1
7
Q3
16/1
7
Q4
16/1
7
Q1
17/1
8
Q2
17/1
8
Q3
17/1
8
Q4
17/1
8
Actual Projected 2015 Projected 2016
0%
10%
20%
30%
40%
50%
60%
70%
80%
90%
100%
Jul-13 Jan-14 Jul-14 Jan-15 Jul-15 Jan-16 Jul-16
Over 10 yrs
>5-10 years
>3-5 years
>2-3 years
>1-2 years
>6 mths-1 yr
>3-6 months
< 3 months

2016 Benefit System Performance Report Page 29
Table 5 – JS-HCD entrants – continuous time on main benefit
Benefit Category New Benefit
Grants New Benefit
Grants % Transfer from
another Benefit Transfer %
Received JS-HCD continuously for 24 months
4,647 14% 2,856 21%
Received JS-HCD continuously for 12-24 months
4,393 13% 1,870 14%
Received JS-HCD continuously for 6-12 months
7,113 21% 2,220 16%
Received JS-HCD continuously for 3-6 months
6,795 20% 2,436 18%
Received JS-HCD continuously for 1-3 months
6,706 20% 2,303 17%
Received JS-HCD continuously for less than 1 month
3,984 12% 2,025 15%
Total 33,638 100% 13,710 100%
The numbers paint a slightly different picture to chart 25. There are a number of insights:
· Overall, the duration mix is long relative to the core purpose of the benefit. 49% receive JS-HCD for at least six months.
· Of people granted JS-HCD, 29% were already receiving a benefit. We recommend this is investigated further. These clients are more likely to have mental illness as their primary incapacity code. Their average liability also tends to be higher when compared to clients of similar demographic profile and a similar length of time on benefit.
· Clients who transfer to JS-HCD from another benefit category tend to stay on JS-HCD longer than new JS-HCD clients. This is reasonably significant, with 34% receiving JS-HCD for at least one year compared to 27% for new JS-HCD clients. Those that have transferred to JS-HCD may warrant a more intensive service response.
· Of the 40,000 people who stopped receiving JS-HCD within 24 months, 8% transferred to SLP, 25% transferred to JS-WR, 6% transferred to SPS and 60% stopped receiving a main benefit.
Long periods of time receiving JS-HCD and relatively high rates of transition to SLP explain why JS-HCD clients have high average liability.
Eligibility for JS-HCD is heavily influenced by medical practitioners, through medical certificates. Compared to some other benefit categories, MSD management has relatively limited influence over the gateway into and out of JS-HCD. Similarly, health providers have limited influence over their JS-HCD patient’s benefit and employment interface.

Page 30 2016 Benefit System Performance Report
Given the connection between health and employment outcomes, greater connectivity is required between medical practitioners responsible for clients’ health needs and MSD case managers responsible for their financial needs. This should include better sharing of data to enable informed decisions. Seeking client consent to share employment and health-related data between case managers and health professionals could be in the clients’ best interests. Information currently provided in medical certificates could also be better utilized to guide appropriate service options.
MSD has a strong strategic focus on JS-HCD clients. In this context it is useful to think about how success has been achieved in supporting SPS clients off benefit. SPS exit rates increased following changes to work obligations for SPS clients whose youngest child is aged 5-13 in 2012 (welfare reform phase II). However, it was not until the introduction of work-focused case management in 2013 that exit rates increased substantially. It appears that the combination of policy reform and changes to the service delivery model has resulted in a significant and sustained reduction in long-term benefit dependency for these clients. Since 30 June 2014, the starting point of measurement of the BPS 1 actuarial release target, the reduction on SPS clients has increased the actuarial release by about $2bn.
Recommendation 1
We recommend that management consider the design of policy settings and services for JS-HCD clients, noting that the core benefit purpose is to provide temporary support. We also recommend that greater connectivity between medical practitioners and MSD be considered, including better sharing and utilisation of data.
Gateway 6 – Transition to Supported Living Payment 3.10
This gateway represents a movement to a higher average liability segment. Most SLP clients receive a benefit until they reach retirement age.
The number of clients being granted SLP is relatively low compared with other benefit categories. However, a small change can have a material impact on the liability if it is sustained over a long period.
Chart 27 – Transition to SLP
0
500
1,000
1,500
2,000
2,500
3,000
Q1
15/1
6
Q2
15/1
6
Q3
15/1
6
Q4
15/1
6
Q1
16/1
7
Q2
16/1
7
Q3
16/1
7
Q4
16/1
7
Q1
17/1
8
Q2
17/1
8
Q3
17/1
8
Q4
17/1
8
Actual Projected 2015 Projected 2016
2016 Benefit System Performance Report Page 31
Chart 27 shows that the number of people transitioning to SLP over the 18 months to 31 December 2016 was slightly below 2015 and 2016 valuation projections. This implies improved performance and is consistent with a broader theme of moderating SLP client numbers.
High numbers of clients transitioning to SLP has been a previous concern since SLP is the largest benefit category by client numbers and liability. Supporting SLP clients who have the potential to work remains a key lever.
Currently the vast majority of SLP clients do not move off SLP before retirement age. This is reflected in their high average liabilities e.g. $351k for 20-29 year old SLP-HCD clients. There is potential for more innovation in SLP service and policy design (also see section 3.1).
Recommendation 2
We recommend an ongoing source of funding to trial new approaches to support SLP clients into work, given their high risk of long-term benefit dependency.
Better Public Services Targets 3.11
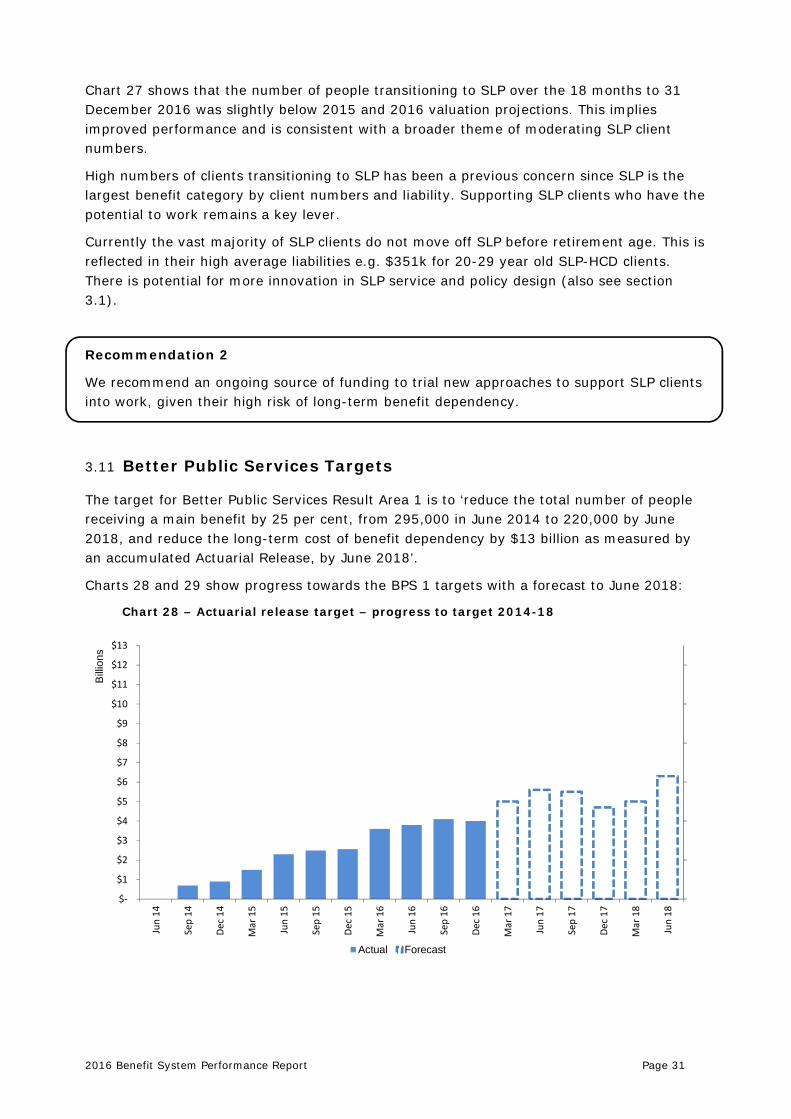
The target for Better Public Services Result Area 1 is to ‘reduce the total number of people receiving a main benefit by 25 per cent, from 295,000 in June 2014 to 220,000 by June 2018, and reduce the long-term cost of benefit dependency by $13 billion as measured by an accumulated Actuarial Release, by June 2018’.
Charts 28 and 29 show progress towards the BPS 1 targets with a forecast to June 2018:
Chart 28 – Actuarial release target – progress to target 2014-18
$-
$1
$2
$3
$4
$5
$6
$7
$8
$9
$10
$11
$12
$13
Jun
14
Sep
14
Dec
14
Mar
15
Jun
15
Sep
15
Dec
15
Mar
16
Jun
16
Sep
16
Dec
16
Mar
17
Jun
17
Sep
17
Dec
17
Mar
18
Jun
18
Bill
ions
Actual Forecast

Page 32 2016 Benefit System Performance Report
Chart 29 – Client count target – progress to target 2005-2018
The accumulated actuarial release for the period from 30 June 2014 to 31 December 2016 is $4.0bn, which is an increase of $1.7bn since 30 June 2015. The forecast is for this to grow to $6.3bn by June 2018, which is well behind the $13bn target.
Actuarial release is intended to broadly represent the Government’s impact on the benefit system. It is different to the change in valuation liability attributable to policy reform and management actions (experience item) reported in chapter 4. This is because
· The actuarial release is relative to the number of beneficiaries at 30 June 2014 (295,000), whereas the experience item is relative to a decreasing beneficiary count, as forecast by the valuation.
· The calculation methodology for the actuarial release uses the assumptions and models from the 30 June 2014 valuation. It does not include changes in liability due to changes in assumptions since the 2014 valuation. For example, if the valuation liability decreased because the SPS exit rate assumption had been increased, this would not impact the actuarial release. This removes subjectivity from the calculation process.
· The change in valuation liability excludes the estimated impact of changes in labour market conditions on client numbers. The actuarial release includes this impact.
As at 31 December 2016, the total number of people receiving a benefit was 286,590. This is 1,630 lower than at 30 June 2015. The decrease relates entirely to SPS clients. SPS clients have a higher average liability than other main benefit categories, and so contribute more to the actuarial release.
0
50,000
100,000
150,000
200,000
250,000
300,000
350,000
Dec 05 Dec 06 Dec 07 Dec 08 Dec 09 Dec 10 Dec 11 Dec 12 Dec 13 Dec 14 Dec 15 Dec 16 Dec 17
Actual Forecast Target

2016 Benefit System Performance Report Page 33
Based on a continuation of current entry and exit rates and unemployment rates consistent with HYEFU 2016, we forecast the number of clients to be approximately 276,000 at 30 June 2018 with a range of 258,000 to 293,000.
While some progress has been made towards the BPS targets, the rate of progress has been consistently short of what is required to meet the targets by June 2018. Indeed the rate at which client numbers have been declining has gradually reduced. This is shown in Chart 30 which gives the year-on-year change in client numbers:
Chart 30 – Client number target – Year-on-year change
The reducing rate of decline is evident. In November 2016 client numbers were actually higher than a year before. This was at least partly due to medical certificates being extended following the Kaikoura earthquakes. This is the first time this has occurred since the targets were set.
While it is unlikely that the BPS 1 targets will be achieved by June 2018, there is clear evidence of a reduction in long-term benefit dependency. In particular, the valuations of the benefit system have consistently highlighted that policy reform and management actions have reduced the liability (see chapter four).
It is also important to factor in population growth when thinking about BPS 1 performance. The New Zealand population has been growing at a relatively fast rate. While a higher population does not necessarily translate to a higher number of benefit system clients in the short-term, it is reasonable to assume that it will place pressure on the system.
Chart 30 shows the number of people receiving a main benefit as a proportion of the working-age population. While client numbers are much higher now than the pre-GFC (287,000 vs 258,000), as a proportion of the working-age population they are about the same (9.8%). For females the proportion is over 1% lower than pre-GFC.
Labour force participation is also at a high level (70.5%).
-9,000
-8,000
-7,000
-6,000
-5,000
-4,000
-3,000
-2,000
-1,000
0
1,000
Jun-15 Dec-15 Jun-16 Dec-16

Page 34 2016 Benefit System Performance Report
Chart 31 – Client count target as a % of estimated working-age population
The New Zealand population is projected to increase further, placing further pressure on meeting the BPS 1 targets (see the ‘population and demographic factors’ subsection of 5.2).
8%
9%
10%
11%
12%
13%
Dec 05 Dec 06 Dec 07 Dec 08 Dec 09 Dec 10 Dec 11 Dec 12 Dec 13 Dec 14 Dec 15
9.8%
12.7%
9.8%

2016 Benefit System Performance Report Page 35
4 Valuation Results - Life-time Liability
Summary of Benefit System Valuation Results 4.1
Chart 32 – Change in total liability – 30 June 2015 to 30 June 2016
Source: Valuation of the Benefit System for Working-age Adults as at 30 June 2016
The liability increased by $7.6bn to $76.0bn over the year to 30 June 2016. Most of this relates to factors outside of management control, particularly reduced interest rates. Factors attributable to management influence and policy reform decreased the liability by $1.7bn, mainly due to:
· Sustained higher exit rates for SPS clients, and
· Lower rates of re-entry to main benefits than assumed
The rest of the change in liability is explained by:
· Methodology changes to accommodate social housing into the valuation model (+$1.5bn)
· Changes to forecast unemployment, interest rates and inflation rates (+$7.2bn)
· An expected decrease in the number of clients (-$0.7bn)
· Increased benefit rates as part of the Child Material Hardship Package (+$1.5bn)
The cumulative impact related to welfare reform and management actions over the past five years is estimated to be a reduction of $13.7bn, or about 17.5% of the 2011 liability.
01020304050607080
Curr
ent c
lient
liab
ility
($b)
Change
Expenses
NOMB & RE
YOU
SLP
SPS
JS
68.4 69.8 77.0 76.3
+1.5 -0.7 -1.7 +1.5
74.6 76.0
+7.2

Page 36 2016 Benefit System Performance Report
Gains in key client segments
Table 6 shows client counts, liabilities and average future years on main benefit for each of the 17 client segments. Average liability has increased in every segment because of changes to economic assumptions underpinning the valuation model. In particular, assumed interest rates used to discount future projected benefit payments back to the present day are less than those used in the 2015 valuation.
More importantly, there have been decreases in average future years on main benefit in 13 segments. There were particularly large decreases for youth benefit clients - 15.3 to 13.8 years for Youth Payment and 15.3 to 14.3 years for Young Parent Payment. Youth clients have become less likely to transfer to the sole parent benefit, and more likely to stay off benefits after exiting.
2012 valuation numbers also show the magnitude of change since welfare reform.
Table 6 – 2016 valuation results by segment
Source: Valuation of the Benefit System for Working-age Adults as at 30 June 2016
2012 Valuation
Average future
years on main
benefits
Number at valn
date
Total liability
($m)
Average lifetime cost ($k)
Average future
years on main
benefits
Number at valn
date
Total liability
($m)
Average lifetime cost ($k)
Average future
years on main
benefits
JS-WR <1 year 8.7 44,174 4,357 99 8.8 44,538 4,983 112 8.6
JS-WR >1 year 9.2 31,802 3,670 115 9.2 32,419 4,365 135 9.4
JS-HCD <1 year 10.0 22,306 2,692 121 9.6 23,033 2,957 128 9.0
JS-HCD >1year 11.0 41,961 5,853 139 10.3 41,435 6,164 149 9.9
Sub-tota l 9.7 140,243 16,572 118 9.5 141,425 18,469 131 9.2
Youngest chi ld 0-2 15.8 26,631 5,838 219 13.8 24,590 5,851 238 12.7
Youngest chi ld 3-4 14.7 14,620 2,927 200 12.5 13,403 2,874 214 11.4
Chi ld 5-13, <1 year 10.2 4,560 631 138 9.0 4,836 734 152 8.5
Chi ld 5-13, >1 year 12.9 25,939 4,596 177 11.0 24,903 4,839 194 10.5
Sub-tota l 14.2 71,750 13,992 195 12.2 67,732 14,299 211 11.3
Ca rer 9.8 8,791 1,361 155 9.7 8,811 1,543 175 9.9
Partner 8.4 8,089 859 106 7.9 7,577 899 119 8.0
HCD 12.9 87,650 15,416 176 12.3 86,482 16,861 195 12.4
Sub-tota l 12.3 104,530 17,637 169 11.8 102,870 19,303 188 11.9
Youth Payment (<18) 15.8 1,957 330 169 15.3 1,762 315 179 13.8
Young Pa rent (<19) 17.9 1,103 251 227 15.3 990 253 255 14.3
Sub-tota l 16.9 3,060 581 190 15.3 2,752 568 206 14.0
Sup only, <1 year 3.7 30,352 1,458 48 3.1 26,356 1,467 56 2.9
Sup only, >1 year 3.9 71,460 3,770 53 3.1 74,598 4,512 60 2.8
Orphan only – 5,195 485 93 2.1 5,519 597 108 2.0
Sub-tota l – 107,007 5,713 53 3.0 106,473 6,576 62 2.8
Recent Exits Recent exi ts , <1 year 4.9 132,802 7,443 56 4.8 126,286 7,917 63 4.6
8.4 559,392 61,938 111 8.0 547,538 67,131 123 7.7
7,909 8,890
69,847 76,022
2015 Valuation 2016 Valuation
Grand total
Top tier segment Segment
Jobseeker Support
Sole Parents
Supported Living
Youth
Not On Main Benefits
All segment sub-total
Expenses + Net loans

2016 Benefit System Performance Report Page 37
Benefit clients in social housing have higher average liability
Previous valuations have added Child, Youth and Family (CYF) history, criminal convictions history, education status and intergenerational benefit receipt data to improve the predictive capability of the valuation model. This is the first year the benefit system valuation has been integrated with the social housing valuation, giving us a better understanding of people across both systems. The model has been adapted to project both future benefit receipt and future social housing usage.
Nearly half of those in the social housing cohort are in the benefit system cohort, and their average liability (excluding accommodation supplement) is $30k higher than other benefit system clients. Combinations of risk factors are also more likely to be present. For example, 18-24 year old benefit clients who have spent time in social housing are twice as likely to have a criminal conviction and twice as likely to have had a parent on benefit for at least 80% of their teenage years.
Māori clients are significantly overrepresented in both the benefit and social housing systems
Māori clients represent 31% of the benefit system cohort and 36% of the social housing cohort, compared with 15% of the general population. Average benefit liability is $55k higher than for non-Māori.
18-24 year old Māori are more than two times as likely to have three key risk factors present, such as family benefit history or social housing history, than non-Māori (40.4% vs 19.2%).
Māori liability has decreased over time, but not to the same extent as other ethnicities (see chart 33).
Relative performance is poor. More needs to be done to understand why Māori benefit experience has not improved to the same extent as other ethnicities, and what can be done to improve outcomes.
Chart 33 – Total liability – Māori and non-Māori
10
15
20
25
30
35
40
45
50
55
2011 2012 2013 2014 2015 2016
$Bill
ions
Māori non-Māori

Page 38 2016 Benefit System Performance Report
Characteristics of young, new clients
The 2016 valuation explores how effectively we can predict lifetime cost at the point of entry into the benefit system.
SLP and SPS early entrants have substantially higher average liability than early entrants to other benefit categories, highlighting opportunity for investment before people become entrenched in the system.
Liability is significantly higher for Māori who are early entrants and have CYF history. As an example, of under-25 year-olds who received their first main benefit (other than SLP and SPS) in 2015/16:
· Māori clients with CYF history have an average liability of $177k
· non-Māori without CYF history have an average liability of $77k.
There has been an improvement in the proportion of clients who have exited the benefit system after the introduction of the Youth Service. From the last valuation, the projected duration on benefits has decreased from 15.3 years to 13.8 years for YP and from 15.3 years to 14.3 years for YPP. This is despite the fact that key risk factors such as CYF history and intergenerational benefit receipt have increased in prevalence amongst YP/YPP clients since 2012 (see section 3.8).
Summary of approach 4.2
The performance of the benefit system as a whole is assessed via an annual valuation of the benefit system. The 30 June 2016 liability assessment was undertaken by Taylor Fry Consulting Actuaries (Taylor Fry). Their report, Valuation of the Benefit System for Working-age Adults as at 30 June 2016, (the 2016 Valuation Report) was prepared by Alan Greenfield FIAA, Dr Hugh Miller FIAA, and Dr Gráinne McGuire FIAA.
The liability is calculated by forecasting expected future benefit payments up to age 65 for all people aged 16-64 who have received a benefit at any time in the 12 months preceding the valuation date. These payments are then discounted back to the valuation date using discount rates. Allowance is also made for future benefit indexation, the projected cost of employment support and services, the costs to administer the system, as well as loans and debts.
The liability calculation is derived from a number of models. The models make assumptions about the probabilities of clients moving between benefit categories (including into and out of the benefit system) in the future and the amounts of associated benefit payments.
Key Assumptions
The assumptions aim to be ‘best estimate’ (i.e. they should not contain any deliberate bias towards conservatism or optimism). The liability produced from these assumptions is considered to be a ‘central estimate’.
The key assumptions used in determining the liability comprise two groups:
· Economic assumptions – These include national and regional unemployment rates, inflation and discount rates, and are all based on Treasury forecasts.

2016 Benefit System Performance Report Page 39
· Transition assumptions - Rates of transition between benefit categories and in and out of the benefit system. These are set with reference to observed experience. The general approach is to partially allow for experience changes until there is sufficient evidence that the change is likely to be sustained.
Economic assumptions
The New Zealand Treasury prescribes the risk-free rates to be used in certain accounting valuations. These have been used as discount rates for the benefit system valuation. Short-term discount rates reflect the yields of New Zealand Government bonds. Long-term discount rates, which cannot be observed from New Zealand Government bond yields, are based on long-term historical norms. The Treasury approach applies a smoothing methodology to transition between the last observed short-term rate and the assumed long-term rate.
Chart 34 shows the discount rates used in the 2016 and 2015 valuations. In the past year, short and medium-term rates have reduced significantly, in line with market yields available on Government bonds. The assumed long-term rate prescribed by the Treasury has also decreased from 5.5% to 4.75% per annum. This serves to increase the liability by $8.7bn because future cash flows are discounted by a lower amount.
Chart 34 – Discount rate assumption
The Treasury has refined the methodology for the short-term consumer price index (CPI) assumption. Previously it was based purely on the rate implied by the New Zealand inflation-indexed bond market. Now only 50% weighting is given to market data, with the other 50% weighting based on the forecasts of inflation. The assumed long-term inflation rate has also decreased from 2.5% to 2.0% per annum.
The assumption for benefit rate increases (where applicable) have been set relative to the CPI assumptions. Chart 35 shows the CPI assumptions used in the 2016 and 2015 valuations.
0%
1%
2%
3%
4%
5%
6%
2017 2021 2025 2029 2033 2037 2041 2045 2049 2053 2057 2061 2065
Dis
coun
t Rat
e
2016 valuation 2015 valuation

Page 40 2016 Benefit System Performance Report
Chart 35 – Inflation rate assumption
Inflation rates have fallen since 2015, with short-term rates reducing to 1.47% in 2016. As a result, the smoothing period to the long-term assumed rate has increased out to 2055. A decreasing inflation rate assumption serves to decrease the liability, because future CPI-linked benefits are projected to be lower. The decrease is $2.6bn.
The forecast assumptions for the national unemployment rate are provided by the Treasury. Regional unemployment rates are projected based on their historical experience while ensuring consistency with the forecast national rate.
Forecast unemployment rates impact the liability because they impact the assumed rates of exit from the benefit system, and re-entry rates following an exit.
Chart 36 shows the national unemployment rate assumption for the 2015 and 2016 valuations as well as the actual unemployment rate since 30 June 2011.
Chart 36 – Unemployment rate assumption
Statistics New Zealand recently revised the way in which the observed unemployment rate is reported. Treasury forecasts are now based on these revised rates. For ease of comparison the rates in chart 35 are on the old basis. The 2016 valuation assumption and some of the actual rates have been adjusted accordingly. The long-term forecast is approximately 0.2% higher than that used for the 2015 valuation. This has increased the liability by $1.0bn
0.0%
0.5%
1.0%
1.5%
2.0%
2.5%
3.0%
2017 2021 2025 2029 2033 2037 2041 2045 2049 2053 2057
Infla
tion
Rate
2016 valuation 2015 valuation
0%
1%
2%
3%
4%
5%
6%
7%
8%
Jun11 Jun13 Jun15 Jun17 Jun19 Jun21
Une
mpl
oym
ent R
ate
2015 valuation Actual 2016 valuation

2016 Benefit System Performance Report Page 41
Transition rate assumptions
Transition rate assumptions depend on a number of risk factors, including:
· Time-related variables – unemployment rate (at a national and regional level)
· Client-related variables – age, gender, ethnicity, education level and region
· Client history – Child, Youth and Family history, criminal convictions, social housing history and whether their parents received benefits during the client’s childhood
· Benefit history – including the current and previous periods receiving a benefit
· Family-related variables – age of youngest child and number of children
· Health and disability-related variables – incapacity type for JS-HCD and SLP
Each valuation, transition rate assumptions are reviewed to account for recent experience. Where a change in experience is material and deemed likely to be sustained, assumptions will change.
For the 2016 valuation, there were two main changes to transition rate assumptions. Firstly, the exit rate assumption for SPS clients whose youngest child is aged 5-13 was increased. Chart 37 shows how the rate at which SPS exit that benefit has increased since 2012/2013. This coincides with the introduction of greater work expectations in October 2012 (welfare reform phase II) and the introduction of work-focused case management in 2013 – see appendix B.4. Each valuation since, as we have become more confident the increase will be sustained, exit rate assumptions have been increased towards the observed rate. The observed increase has now been fully allowed for in assumptions. If further liability reductions are to stem from SPS clients, then exit rates will need to increase further.
Chart 38 shows how the 2016 assumed rates compare to historical rates, and rates assumed for the 2015 valuation.
Chart 37 – SPS exit rates by age of youngest child
Chart 38 – SPS exit rate assumptions
Source: Valuation of the Benefit System for Working-age Adults as at 30 June 2016
Secondly, the rate at which people re-enter the benefit system having been off benefits for more than one year has decreased markedly in recent years. This has been further
5.0%
5.5%
6.0%
6.5%
7.0%
7.5%
8.0%
8.5%
9.0%
9.5%
Prop
ortio
n le
avin
g be
nefit
per
qua
rter
Historical 2015 projection 2016 projection
SPS 5-13 rate over time
2%3%4%5%6%7%8%9%
10%
0 2 4 6 8 10 12
Prop
ortio
n le
avin
g be
nefit
per
qua
rter
Age of youngest child
2012/13 2013/14
2014/15 2015/16

Page 42 2016 Benefit System Performance Report
recognised in the 2016 valuation assumptions with decreases to re-entry rates, as shown in charts 39 and 40.
Chart 39 – Re-entry rates – 1-4 years after exit
Chart 40 – Re-entry rates – 5-10 years after exit
Source: Valuation of the Benefit System for Working-age Adults as at 30 June 2016
Other transition rate assumption changes include:
· A small decrease in JS-WR exit rates · A small increase in JS-HCD exit rates · A decrease in exit rates for supplementary benefit only clients
More detail on the valuation approach and assumptions can be found in the 2016 valuation report6. The rest of this chapter explains what management should take from the valuation. We also comment on some developments in valuation related work (e.g. the social housing valuation) and their use in understanding benefit system clients.
What do the valuation results tell us? 4.3
Liability can be thought of as a risk measure. The valuation allows us to track how the collective risk of long-term benefit dependency is changing over time. It also allows us to identify concentrations of risk amongst clients with similar characteristics. This helps management make decisions about where and how to invest resources with the intent of having the greatest impact on reducing long-term benefit dependency.
The 2016 valuation results contain a number of key themes:
Performance gains continue to flow through the valuation results
There was a $1.7bn decrease in liability attributable to welfare reforms and other management actions. That means that compared to expectations derived from the 2015 valuation, future benefit cost in respect of clients at 30 June 2016 has been reduced by $1.7bn. This is significant and follows gains in every year since the first valuation in 2011.
6 http://www.msd.govt.nz/documents/about-msd-and-our-work/newsroom/media-releases/2017/valuation-of-the-benefit-system-for-working-age-adults-2016/valuation-of-the-benefit-system-for-working-age-adults-2016.pdf
2.0%
2.5%
3.0%
3.5%
4.0%
Prop
ortio
n re
-ent
erin
g pe
r qua
rter
Historical 2015 projection
2016 projection
2-4 years after exit
0.0%
0.5%
1.0%
1.5%
2.0%
Prop
ortio
n re
-ent
erin
g pe
r qua
rter
Historical 2015 projection
2016 projection
5-10 years after exit

2016 Benefit System Performance Report Page 43
Chart 41 highlights that higher assumed SPS exit rates (reflecting observed experience) was the most significant contributor to the $1.7bn liability reduction.
Chart 41 – Liability reduction attributable to management influence and policy reform
Source: Valuation of the Benefit System for Working-age Adults as at 30 June 2016
Key risk factors re-affirmed and concentrations of risk identified
Key risk factors identified in previous valuations still come through in this valuation. The most important factors are early entrance to the benefit system, intergenerational benefit dependency, evidence of poor childhood experience (CYF history), low educational achievement, ethnicity and the presence of criminal convictions. Some specific factors to consider are:
· Criminal convictions are a very strong predictor of high future benefit cost amongst clients who have recently exited the benefit system. About two-thirds of people receive a main benefit within one month of leaving prison. This is closer to 80% if they were receiving a main benefit immediately before the prison spell. There is a clear pattern of imprisonment and benefit receipt. Prisoners can face considerable barriers to employment on release including negative attitudes of employers, and
-700 -600 -500 -400 -300 -200 -100 0 100 200 300
WR<1
WR>1
HCD<1
HCD>1
Ch 0-2
Ch 3-4
Ch 5-13 <1
Ch 5-13 >1
Carer
Partner
HCD
YP
YPP
SUP<1
SUP>1
OB
Recent exits
Joins
Other
Jobs
eeke
rsSo
le p
aren
tsSL
PYo
uth
NO
MB
Change on expected liability from Roll-forward ($m)
Higher SPS exit rates assumed, consistent with experience over the year
Slower exits, particularly for WR >1, but fewer re-entries once exit has occurred.
Limited change
Lower re-entries after exit. More transitions into JS rather than SPS
Materially slower exits from SUP
Lower re-entry rates sustained in 2015/16
Lower average duration on benefits
Higher expense rates

Page 44 2016 Benefit System Performance Report
have high rates of mental illness and substance abuse. Two-thirds of prisoners in New Zealand have substance abuse problems7.
· For clients who are not receiving a main benefit (or recently exited from the benefit system), their liability is $36k (or 83%) higher if they are in a social house. This is because they have a significantly higher rate of entry on to main benefits than others not in social housing.
· A JS-HCD client’s type of health condition is not particularly important for estimating their future benefit cost. We recommend this is investigated further. Understanding the reasons for this could be useful in understanding how to best work with JS-HCD clients. Intuitively the type of health condition ought to have a bearing on how long benefit system support is required, the likelihood of repeated instances of the condition, and the likelihood of the condition becoming permanent and the client transferring to SLP.
· Risk factors are often concentrated together. This is more common for particular cohorts of clients. For example, Table 7 shows the prevalence of risk factors for Māori and non-Māori 18-24 year old clients. All five of the risk factors are more prevalent for Māori. However, the relative difference between Māori and non-Māori increases as we consider larger combinations of risk factors. Māori are nearly three and half times more likely to have all five of these risk factors present than non-Māori. The liability differences are also significant.
Table 7 – Risk factor concentration – Māori compared to non-Māori (aged 18-24)
Source: Valuation of the Benefit System for Working-age Adults as at 30 June 2016
There is a similar story for social housing clients. Table 8 shows risk factors for social housing, for clients aged 18-24 years-old. The largest difference is for clients with multiple risk factors. Clients who have lived in social housing are over three times more likely to have at least three risk factors. Again, the liability differences are significant.
7 http://www.corrections.govt.nz/resources/newsletters_and_brochures/tackling_alcohol_and_drug_abuse.html
Education CYF Justice Inter-gen. Welfare Housing
NCEA <L1 or L1
A Chd protection
event
(Adult) corrections
spell
Parent on ben >80%, ages 13-18
>8 qtrs on JS
Some SH history
Non-Māori 24.4% 33.0% 9.8% 22.6% 24.5% 20.1% 66.4% 38.7% 19.2% 7.6% 2.1%Māori 28.7% 50.0% 20.2% 43.1% 33.9% 40.6% 84.3% 63.2% 40.4% 20.1% 7.2%Increase x1.18 x1.51 x2.06 x1.91 x1.39 x2.02 x1.27 x1.63 x2.10 x2.65 x3.42
Education CYF Justice Inter-gen. Welfare Housing
NCEA <L1 or L1
A Chd protection
event
(Adult) corrections
spell
Parent on ben >80%, ages 13-18
>8 qtrs on JS
Some SH history
Non-Māori $154k $161k $146k $156k $149k $153k $144k $157k $170k $180k $192kMāori $195k $208k $200k $204k $202k $210k $192k $204k $215k $224k $230k
At least 1 risk factor
At least 2 risk factors
At least 3 risk factors
Single risk factors Multi-risk factors
% of Populaton
At least 2 risk factors
At least 3 risk factors
At least 4 risk factors
At least 5 risk factors
At least 4 risk factors
At least 5 risk factors
Liability
Single risk factors Multi-risk factors
At least 1 risk factor

2016 Benefit System Performance Report Page 45
Table 8 – Risk factor concentration – Social housing (aged 18-24)
Source: Valuation of the Benefit System for Working-age Adults as at 30 June 2016
This observed correlation and concentration of risk factors is consistent with other research. For example, Caspi et Al8 identified using the Dunedin Longitudinal Study population that a large proportion of poor adult outcomes (such as obesity, benefit receipt and criminal convictions) relate to a small segment of the adult population, and that this segment can be predicted with good accuracy from early childhood.
Risk factors materialise before people first enter the benefit system
Each year the valuation has used new data sources to improve our understanding of clients’ likelihood of long-term benefit dependency. It is increasingly apparent that risk factors that correlate with likelihood of long-term benefit dependency are determined before a person enters the benefit system.
The valuation does not distinguish between correlation and causality. However, there is enough for us to conclude that poor childhood outcomes are the most important determinants of long-term benefit dependency. These factors include intergenerational benefit receipt, CYF history and poor educational achievement.
Intervention logic suggests that investing to prevent or limit the emergence of risk factors during childhood delivers better value than investing in adulthood once poor adult outcomes begin to materialise. This is not to say that MSD has no part to play in working with vulnerable adults. However, there is opportunity to improve outcomes with additional investment in prevention strategies.
Segmentation 4.4
Since 2012 the benefit system valuation results have been presented using a segmentation largely based on benefit category and duration (see table 6, section 4.1) The segmentation structure has formed the basis for monitoring benefit trends and the starting point for identifying cohorts of clients to receive existing service and new trial services.
8 Childhood forecasting of a small segment of the population with large economic burden, Caspi et Al, Dec 2016
Education CYF Inter-gen. Justice
NCEA <L1 or L1
A Chd protection
event
Parent on ben >80%, ages 13-18
(Adult) corrections
spellNo SH history 24.7% 31.5% 22.0% 10.8% 56.2% 24.7% 7.1% 1.0%Time in SH 29.8% 61.0% 53.0% 21.9% 84.0% 55.1% 22.3% 4.3%Increase x1.21 x1.94 x2.41 x2.02 x1.49 x2.24 x3.12 x4.38
Education CYF Inter-gen. Justice
NCEA <L1 or L1
A Chd protection
event
Parent on ben >80%, ages 13-18
(Adult) corrections
spellNo SH history $160k $167k $166k $158k $156k $173k $186k $186kTime in SH $197k $206k $202k $202k $195k $208k $216k $217k
% of Populaton
At least 1 risk factor
At least 2 risk factors
At least 3 risk factors
Liability
Single risk factors Multi-risk factors
At least 1 risk factor
At least 2 risk factors
At least 3 risk factors
At least 4 risk factors
At least 4 risk factors
Single risk factors Multi-risk factors

Page 46 2016 Benefit System Performance Report
The segmentation has served its purpose well. However, the investment approach and the valuation model has matured significantly since then and the context in which they exist has changed.
A review of the segmentation was carried out in Q2 2016/17. Table 9 illustrates the new segmentation structure. It places less emphasis on a client’s benefit category than the previous segmentation.
Table 9 – 2016 valuation results – new segmentation structure
Top Tier – Benefit status
The first tier splits clients based on whether they are receiving a main benefit, receiving only supplementary benefits, or aren’t receiving any benefit currently, but did so in the preceding 12 months.
Second Tier - Age
Age is the first segmenting variable for main benefit clients, with those aged under 25 separated from 25 to 65 year olds. Receiving a benefit at a young age is a key predictor of long-term benefit dependency, and splitting segments above and below age 25 reflects:
Average Lifetime cost, $k
Average Lifetime cost, $k
YP/YPP 2,752 206 1,487 54% 231 92 3% 257
JS-WR 16,650 149 8,269 50% 181 1,269 8% 173
JS-HCD 6,120 198 2,093 34% 237 413 7% 223
SPS 11,893 246 6,781 57% 269 1,791 15% 262
JS-WR 3,990 87 1,309 33% 122 312 8% 101
JS-HCD 1,555 131 358 23% 170 77 5% 158
SPS 1,882 186 738 39% 215 169 9% 198
7,949 327 2,146 27% 324 723 9% 319
JS-WR 24,261 87 8,159 34% 117 1,893 8% 103
JS-HCD 16,922 105 4,280 25% 131 1,128 7% 114
SPS, Youngest Child 0-2 4,376 172 1,576 36% 195 341 8% 191
SPS, Youngest Child 3-13 7,164 141 2,522 35% 164 602 8% 157
JS-WR 32,056 138 14,434 45% 165 5,137 16% 147
JS-HCD 39,871 149 11,733 29% 176 6,509 16% 142
SPS, Youngest Child 0-2 10,593 257 6,058 57% 279 2,450 23% 268
SPS, Youngest Child 3-13 31,824 205 14,859 47% 230 6,413 20% 219
Carers 8,292 174 3,103 37% 194 2,032 25% 192
Partners 7,420 116 1,599 22% 143 1,441 19% 131
HCD – Never Reassess 29,922 185 5,809 19% 194 3,812 13% 173HCD – 2yr reassess, Primaryincapacity, Mental Health 20,352 220 5,468 27% 246 3,350 16% 208HCD – 2yr reassess, Otherincapacity 28,935 150 8,035 28% 158 5,101 18% 147
74,144 46 9,674 13% 68 1,025 1% 57
26,810 95 8,015 30% 125 1,064 4% 108
5,519 109 2,344 42% 123 363 7% 148
60,696 38 12,952 21% 63 1,937 3% 57
65,590 86 26,994 41% 115 6,186 9% 104
547,538 123 170,795 31% 161 55,630 10% 162
Rec
ent
Eix
ts Age 16 to 65
<33% of last 5 years on main benefit
>33% of last 5 years on main benefit
Grand Total
Non-SLP, First main benefit received >= 20
Average lifetime cost, $k
Under 25
Su
pp
On
ly
Clie
nts Age 16 to
65
<33% of last 5 years on main benefit
>33% of last 5 years on main benefit
Orphans benefit
Mai
n B
enef
it Non-SLP, <75% of last 3 years on main benefit
Non-SLP, >75% of last 3 years on main benefit
SLP
Over 25
SLP
Māori population Housing Population
Number and % of total Number and % of total
Non-SLP, First main benefit received < 20
Top tier segment (Benefit Status)
Second tier
segment (Age Split)
Third tier Segment
Fourth tier segmentNumber in 2016
valn

2016 Benefit System Performance Report Page 47
· The increased focus of government on young people up to age 25
· Transitional services for those in need of support up to age 25 through MVCOT
· Data on CYF history and intergenerational dependency is currently only available for people aged up to their late 20s
· The greater predictive value of benefit history at higher ages.
Third Tier – Benefit history
For under-25 year-olds, first entry into the benefit system before age 20 is a reasonable proxy for early risk factors such as CYF history and intergenerational benefit history.
For clients aged 25 to 65, the new segmentation uses the proportion of time that a client has received a main benefit in the recent past. The specific percentages and time frames have been chosen to give the best statistical separation (in terms of liability) between segments.
Fourth Tier – Additional benefit information
The fourth tier for main benefit clients is predominantly a split by benefit category. SPS clients have also been split based on the age of their youngest child (which dictates if they have work obligations or not).
This is similar to the previous segmentation structure. For SLP clients, Carers and Partners are retained as separate segments. The remaining SLP-HCD clients make up the bulk of the over 25 year old SLP category. They have been split according to whether they are due to have their benefit status reassessed in the future or not, and in the case of those that will have their status reassessed, whether their primary incapacity is noted as a mental health condition or not.
Statistical separation in terms of liability is relatively narrow between SLP segments. This is because exit rates are low and a high proportion receive SLP continuously through to retirement. However, segmenting clients based on reassessment period and primary health condition will help develop our understanding of which SLP-HCD clients have potential to work now or in the future. It will also provoke discussion about how to positively influence the lives of people in this large benefit category.
Early insights from the new segmentation structure
The new segmentation was approved shortly before publishing this report. Further work to better understand specific segments has not yet been completed. Some early insights include
· The segmentation gives much better separation in terms of liability than the previous one. Average liability ranges from $38k (for recent exits with less than 33% of time spent on main benefits in the last five years), to $327k (for under 25 year old SLP clients). Greater variation highlights more opportunity to identify cohorts for tailored intervention.
· The age a person first received a benefit is a powerful predictor of future benefit cost. For example, under-25 year-old JS-WR clients who first received a main benefit under age of 20 have an average liability of $149k. Those who first received a main benefit over the age of 20 have a much lower average liability of $87k. It is

Page 48 2016 Benefit System Performance Report
clear that even by the age 25 there is a cohort of clients that is significantly more entrenched in the system than others.
· Clients with mental health conditions form an important segment. It highlights the severity of impact that mental illness has on the system and the potential opportunity if Government services are able to collectively support these clients towards better outcomes (including employment).
· Splitting by recent benefit history is particularly useful for recent exits and supplementary-only clients. It broadly splits clients into those who are more or less likely to return to the benefit system.
· Māori have higher average liabilities across all segments and are more heavily represented in the higher liability work-obligated segments.
· The overlap with the social housing system highlights the skew towards SPS and SLP clients, particularly those with a higher degree of recent benefit history.
Social housing valuation 4.5
This year the valuation model has been adapted to incorporate the social housing valuation. The valuation model now projects people’s expected future pathways in, through and out of both systems. This represents the most important change in the valuation approach since the first valuation in 2011 and is a significant step towards a person-centric view across social services.
The same data and modelling are used for both systems because:
· There is significant overlap between the benefit system and social housing populations (nearly half of the people covered by the social housing valuation are also included in the benefit system valuation).
· Benefit system factors help predict social housing outcomes and vice versa, so combining them makes both valuations more informative.
· Having a more person-centric view of people’s benefit and housing needs can help MSD move towards a more integrated service response to those needs.
So far separate reports have been prepared for the two systems to allow the first social housing valuation report to focus on establishing the methodology and to reflect the different objectives in the two systems.
Future work may examine how the objectives and operational responses in the two systems may be brought closer together.
The social housing valuation is an estimate of the future housing-related costs for households currently in social housing, on the register or those that have recently exited. Housing-related costs include Income-Related Rent Subsidy (IRRS), Accommodation Supplement (AS) and Temporary Additional Support (TAS). The purpose of the model is to better understand the risk factors associated with long-term use of social housing, and to support the aims of social housing reform. These aims can be broadly represented as ‘right person, right place, right duration at the right cost’.

2016 Benefit System Performance Report Page 49
The valuation methodology predicts future IRRS, AS and TAS payments. This is not unlike the benefit system valuation that predicts future benefit payments. However, there are a number of fundamental differences:
· The supply of social housing is relatively fixed in the short-term compared to the entitlement basis for benefits. This adds a layer of complexity to the modelling as future payments are not just dependent on the need for social housing, but also the availability of houses of the right size and location.
· The excess of demand over supply of social housing necessitates a waiting phase (the register) before people who are eligible for social houses are housed.
· Social housing rent is on a co-payment basis with tenants paying a portion relative to their income and the rest being paid by MSD to the housing provider. The MSD component is the IRRS. Whereas benefit payments are indexed to inflation, future IRRS payments are also dependent on rental growth and income growth. The valuation model requires assumptions about these financial factors.
· The social housing system is as much about households as it is about individuals. Consequently, the social housing component of the valuation model requires modelling individuals and household. The benefit system component just models individuals.
· Social housing is available to people of all ages, whereas the benefit system covers people aged 16-64. This requires modelling over a longer future time horizon and with greater consideration of the impact of mortality.
More detail can be found in the 2015 social housing valuation report9
The results are relevant to the benefit system not just because of the overlap in client base, but because they offer further insights into risk factors associated with dependence.
2016 social housing valuation results were not finalised at the time of publishing this report.
Benefit system clients in social housing 4.6
Chart 43 – benefit system and social housing cohorts
Source: Baseline valuation of the social housing system as at 30 June 2015
9 http://www.msd.govt.nz/about-msd-and-our-work/publications-resources/evaluation/social-housing-valuation/index.html
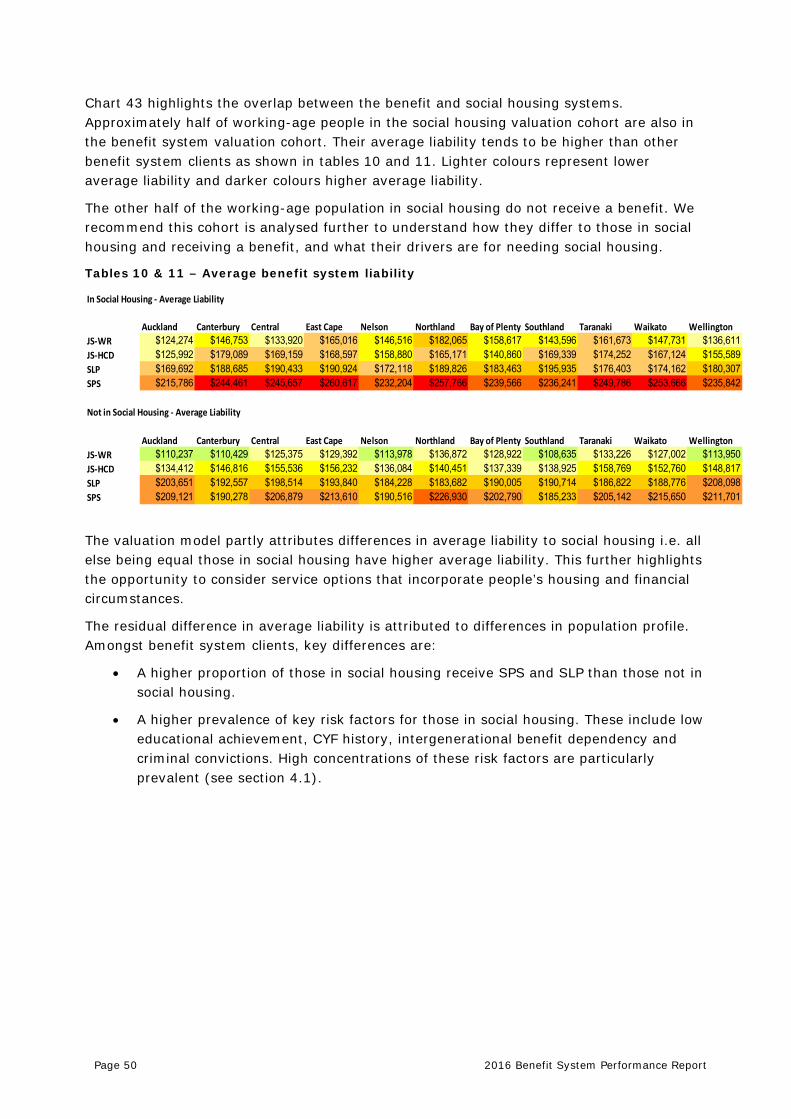
Page 50 2016 Benefit System Performance Report
Chart 43 highlights the overlap between the benefit and social housing systems. Approximately half of working-age people in the social housing valuation cohort are also in the benefit system valuation cohort. Their average liability tends to be higher than other benefit system clients as shown in tables 10 and 11. Lighter colours represent lower average liability and darker colours higher average liability.
The other half of the working-age population in social housing do not receive a benefit. We recommend this cohort is analysed further to understand how they differ to those in social housing and receiving a benefit, and what their drivers are for needing social housing.
Tables 10 & 11 – Average benefit system liability
The valuation model partly attributes differences in average liability to social housing i.e. all else being equal those in social housing have higher average liability. This further highlights the opportunity to consider service options that incorporate people’s housing and financial circumstances.
The residual difference in average liability is attributed to differences in population profile. Amongst benefit system clients, key differences are:
· A higher proportion of those in social housing receive SPS and SLP than those not in social housing.
· A higher prevalence of key risk factors for those in social housing. These include low educational achievement, CYF history, intergenerational benefit dependency and criminal convictions. High concentrations of these risk factors are particularly prevalent (see section 4.1).
In Social Housing - Average Liability
Auckland Canterbury Central East Cape Nelson Northland Bay of Plenty Southland Taranaki Waikato WellingtonJS-WR $124,274 $146,753 $133,920 $165,016 $146,516 $182,065 $158,617 $143,596 $161,673 $147,731 $136,611JS-HCD $125,992 $179,089 $169,159 $168,597 $158,880 $165,171 $140,860 $169,339 $174,252 $167,124 $155,589SLP $169,692 $188,685 $190,433 $190,924 $172,118 $189,826 $183,463 $195,935 $176,403 $174,162 $180,307SPS $215,786 $244,461 $245,657 $260,617 $232,204 $257,766 $239,566 $236,241 $249,786 $253,666 $235,842
Not in Social Housing - Average Liability
Auckland Canterbury Central East Cape Nelson Northland Bay of Plenty Southland Taranaki Waikato WellingtonJS-WR $110,237 $110,429 $125,375 $129,392 $113,978 $136,872 $128,922 $108,635 $133,226 $127,002 $113,950JS-HCD $134,412 $146,816 $155,536 $156,232 $136,084 $140,451 $137,339 $138,925 $158,769 $152,760 $148,817SLP $203,651 $192,557 $198,514 $193,840 $184,228 $183,682 $190,005 $190,714 $186,822 $188,776 $208,098SPS $209,121 $190,278 $206,879 $213,610 $190,516 $226,930 $202,790 $185,233 $205,142 $215,650 $211,701

2016 Benefit System Performance Report Page 51
5 Future Focus – Risks and Opportunities
This chapter reviews potential risks and opportunities in coming years that could significantly impact the number of people needing benefit support in the future and their degree of long-term benefit dependency. Most are risks or opportunities that evolve over an extended period of time.
To the extent that these factors can be predicted, they act as lead indicators of risks to the benefit system.
New risks identified this year 5.1
Rising Accommodation Costs
Accommodation related benefits represent significant fiscal costs to government. In the year to 30 June 2016, $1.24bn was paid in AS, $0.73bn in IRRS and $0.21bn in TAS. While TAS is not exclusively an accommodation related benefit it is principally used for that purpose by clients. For many clients it acts as a top-up to AS. IRRS costs have consistently grown year-on-year, 6.7% per annum over the last 10 years. AS and TAS costs have been relatively stable over the last five years.
Chart 44 – Accommodation-related benefit expenditure
For most clients their primary accommodation cost is rent. Over the long-term it is reasonable to expect average rent growth to be similar to average wage growth and higher than inflation. Both AS and TAS have maximum rates, with a large proportion of clients currently receiving the maximum. In the last five years rent growth has been significantly higher than inflation and average weekly earnings (see chart 45). This presents a number of risks should this continue, particularly in combination with the current design construct of accommodation-related benefits:
· AS maximum rates will increase from 1 April 2018. Since the last increase in 2005, an increasing proportion of clients have been receiving the maximum rate. Currently this is 43%, up from 20% in 2006. If rents continue to grow faster than clients’ incomes then the cost implications of any further increases to AS maximum rates will grow. The degree of dependency on AS will grow, increasing liability.
0
200
400
600
800
1000
1200
1400
$ M
illio
ns
AccommodationSupplement
TemporaryAdditional Support*
IRRS
* Special benefit before 2005/6

Page 52 2016 Benefit System Performance Report
· The proportion of the working and superannuitant population (i.e. not on main benefit) receiving AS is likely to increase. This would further increase liability.
· In the absence of further increases to AS maximum rates, the difference between IRRS and AS will continue to grow. This will increase the financial disincentive for people to move out of social housing. In the context the benefit system, this is likely to increase liability in respect of clients in social housing.
Chart 45 – Annualised growth
In the 2015 Benefit System Performance Report10 we highlighted that the design of IRRS, AS and TAS creates financial disincentives for clients to move out of social housing and into the private market and employment. This impacts about 100,000 people in the BPS 1 target group. We recommended that the design of IRRS, AS and TAS be reviewed. Some initial scoping work was done to lay the foundation of a potential review. However, work did not proceed beyond this point.
The recommendation was based on observed lower rates of benefit exit for clients in social housing (and those receiving TAS). The introduction of the social housing valuation re-enforces this point and allows us to be more confident that differences relate to people being in social housing (as opposed to differences in population profile).
Restated risks and opportunities 5.2
In last year’s report we highlighted a number of risks. Most of these are largely unchanged from last year’s report and so we briefly restate them here.
The economy
The potential for a significant recession represents the single greatest risk to the benefit system. Management’s ability to influence client outcomes is limited if unemployment is high. We created a ‘significant recession’ scenario with the unemployment rate as high as 12%, which implied that client numbers could grow by over 100,000. The projected impact on liability, while significant, was more modest in relative terms at $10bn. This liability impact would reduce as the economy improves though there would likely be a residual
10 http://www.msd.govt.nz/documents/about-msd-and-our-work/publications-resources/evaluation/investment-approach/2015-
benefit-system-performance-report-final-publish.pdf
0%
1%
2%
3%
4%
5%
6%
7%
2010 2011 2012 2013 2014 2015 2016
Rent (3 bed house)
Average WeeklyEarningsInflation
Note: Rent growth derived from MBIE rental bond data

2016 Benefit System Performance Report Page 53
impact of $1bn-$1.5bn relating to clients who wouldn’t otherwise have entered the benefit system.
Health trends – Mental illness
Between 2000 and 2016 (mainly between 2000 and 2010), the number of JS-HCD and SLP clients whose primary incapacity is mental illness more than doubled from 23,000 to 56,000. This increase is equivalent to about $5.5bn in liability. Various research studies suggest a long-term increase in mental illness prevalence, particularly anxiety and depression. There is a risk that prevalence increases further, with consequences for people’s work capacity and potential need for benefit system support. Over the eighteen months to 31 December 2016, the number of JS-HCD and SLP clients whose primary incapacity is mental illness increased by 3,900 to 56,000.
Population and demographic factors
Statistics New Zealand’s median long-term population projections suggest significant population growth over the next 20 years. They also suggest an ageing population and greater proportions of Māori, Asian people and Pacific Peoples. Based on the 2015 valuation this suggests a potential benefit system liability impact of +$2.3bn by 2018 and +$15.9bn by 2038. This is almost entirely driven by population growth rather than other demographic change. It is significant in the context of the BPS 1 actuarial release target which is relative to a fixed beneficiary count target. Projected population and demographic change should be considered in future target setting.
Sole parents – Birth rates
Birth rates for younger females have consistently declined for several decades (see chart 46). Rates for under 25 year olds have declined significantly since 2010. Birth rates for Māori teenagers have halved since 2008.
This is significant for two reasons:
· Over 90% of SPS clients first come into the benefit system under the age of 30. Older mothers are more likely to be in stable relationships and more likely to have financial stability.
· Average liability is significantly higher for SPS clients who first come into the benefit system at an early age. For example, 30-39 year old SPS clients who first come into the benefit system under the age of 30 have a 63% (or $84k) higher average liability than those who first come into the benefit system aged 30-39. The age somebody first comes into the benefit system is correlated with other significant liability predictors such as intergenerational benefit dependency.

Page 54 2016 Benefit System Performance Report
Chart 46 – Birth rates per 1,000 females
While it is difficult to quantify, lower birth rates among young females are likely to have had a gradual impact on SPS client numbers and contributed to a lower level of long-term benefit dependency amongst SPS clients.
0
20
40
60
80
100
120
140
160
15-19 Years
20-24 Years
25-29 Years
30-34 Years
35-39 Years
40-44 Years
45-49 Years

2016 Benefit System Performance Report Page 55
6 Return on Investment: Employment Assistance Programmes
Introduction 6.1
In this chapter we evaluate seven employment programmes that received almost two thirds ($122m) of the Multi-Category Appropriation that was spent on employment programmes in 2016. For the remaining MCA programmes, it is either too early to assess their impact, or it is not technically possible to robustly estimate their returns.
MSD has calculated the ‘welfare return on investment’ (wROI) for these programmes. The wROI is the ratio of a programme’s outcomes to total cost. Outcomes are measured by the financial savings made when MSD no longer needs to pay a client a benefit due to the impact of the programme. Note, there are likely to be other broader fiscal and social impacts associated with these programmes that are not currently factored into the calculations.
The most important measure presented here is the Predicted wROI. Clients who are helped into employment might not require a benefit for many years – so much of a programme’s success may lie in the future. The Predicted wROI reported here includes a prediction of future savings based on the benefit liability associated with clients.
We do not allow for non-participant effects as these are difficult to reliably estimate:
· Substitution effect – Where helping participants into employment is at the expense of non-participants’ employment prospects
· Displacement effect – Where a programme helps improve a firm’s competitiveness leading to the loss of employment among competing firms
Both effects can reduce the value of a programme. Their impact will differ between programmes.
Summary of Results 6.2
Chart 46 summarises the range of the Predicted wROI for each programme (2015/16 costs are noted). For example, Flexi-wage has a Predicted wROI of between 5 and 7. The dotted line is when a programme pays for itself in savings.

Page 56 2016 Benefit System Performance Report
Chart 46 – Predicted wROI
Overall, the employment programmes appear to be delivering value. The strongest results are for Flexi-wage, and Skills for Industry.
Vocational services employment, limited service volunteer and work confidence all appear to have a high level of performance volatility and a relatively long average period to break-even.
Recommendation 3
We recommend that the vocational services employment, limited service volunteer and work confidence programmes are reviewed in the context of the overall mix of investment in employment assistance programmes.
Individual Results 6.3
In addition to the Predicted wROI, each programme has a graph of the realised welfare return on investment to date (i.e. with no predicted future savings). We expect that the realised welfare return on investment will ultimately reach the Predicted wROI band.
The graph shows how quickly the programme breaks even. We typically have higher confidence in our conclusions when the break-even occurs soon, as well as when there is low variability between years.
The blue line represents the group of clients who have participated in the programme in the last five years. Where possible, we have included a red line, which shows the experience so far of participants who started in 2016.
0
1
2
3
4
5
6
7
8
Flexi-wage
($26m)
Training forWork
($28m)
VocationalServices($31m)
EmploymentPlacement
($19m)
Skills forIndustry($11m)
LimitedService
Volunteer($5m)
WorkConfidence
($3m)
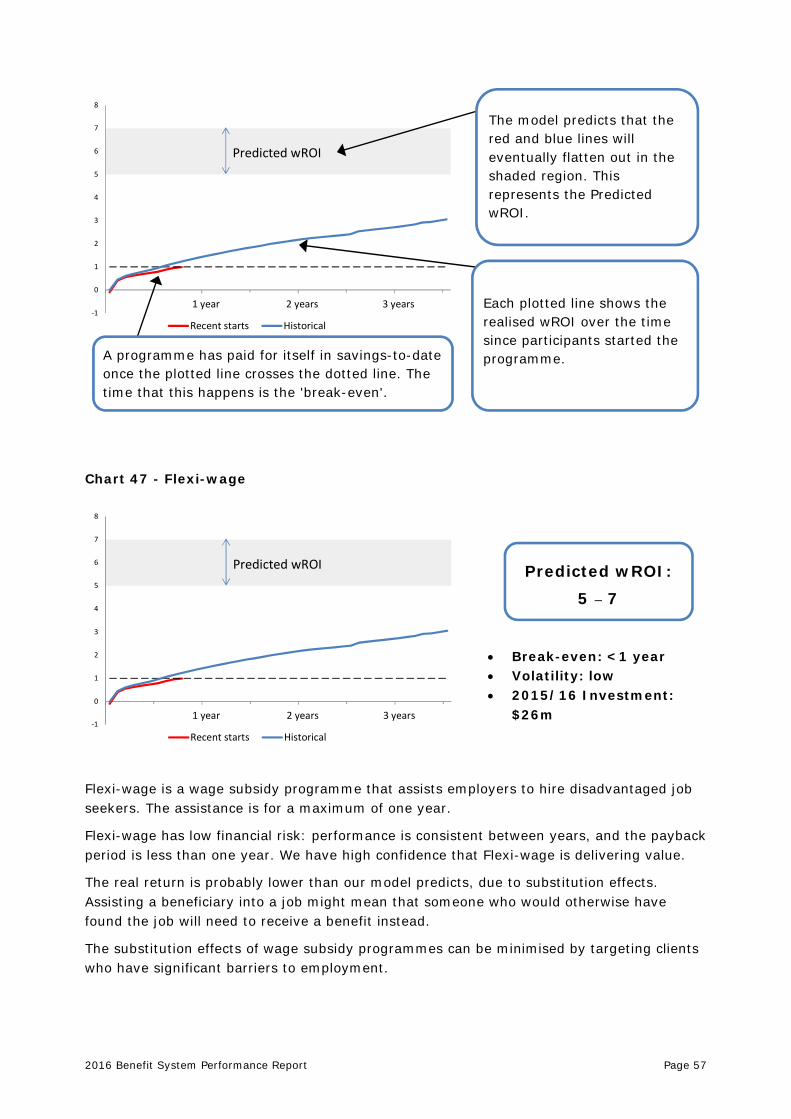
2016 Benefit System Performance Report Page 57
Chart 47 - Flexi-wage
Flexi-wage is a wage subsidy programme that assists employers to hire disadvantaged job seekers. The assistance is for a maximum of one year.
Flexi-wage has low financial risk: performance is consistent between years, and the payback period is less than one year. We have high confidence that Flexi-wage is delivering value.
The real return is probably lower than our model predicts, due to substitution effects. Assisting a beneficiary into a job might mean that someone who would otherwise have found the job will need to receive a benefit instead.
The substitution effects of wage subsidy programmes can be minimised by targeting clients who have significant barriers to employment.
-1
0
1
2
3
4
5
6
7
8
1 year 2 years 3 years
Recent starts Historical
Predicted wROI
· Break-even: <1 year · Volatility: low · 2015/16 Investment:
$26m
-1
0
1
2
3
4
5
6
7
8
1 year 2 years 3 years
Recent starts Historical
Predicted wROI Predicted wROI:
5 – 7
Each plotted line shows the realised wROI over the time since participants started the programme. A programme has paid for itself in savings-to-date
once the plotted line crosses the dotted line. The time that this happens is the 'break-even'.
The model predicts that the red and blue lines will eventually flatten out in the shaded region. This represents the Predicted wROI.

Page 58 2016 Benefit System Performance Report
Chart 48 - Training for Work
· Break-even: 3-5 years · Volatility: low · 2015/16 investment:
$28m
Training for Work involves contracted providers delivering intensive, short-duration training courses for high liability clients.
Training for Work has low financial risk: performance is consistent across the years, with a medium-term break-even. We have high confidence that Training for Work is delivering value, with a moderate return.
Chart 49 - Vocational Services Employment
· Break-even: 5+ years · Volatility: high · 2015/16 investment:
$31m
Vocational Services Employment contracts community organisations to assist people with health conditions and disabilities to return to work.
While this programme takes a long time to break even, we predict that this programme will deliver value in the long term, although the expected return is lower than those of the other programmes considered here. There is some risk that the programme never breaks even.
-0.5
0
0.5
1
1.5
2
2.5
3
3.5
4
1 year 2 years 3 years
Historical
Predicted wROI
-0.5
0
0.5
1
1.5
2
2.5
3
1 year 2 years 3 years
Recent starts Historical
Predicted wROIPredicted wROI:
0.8 – 2.5
Predicted wROI:
2.5 – 3.5

2016 Benefit System Performance Report Page 59
Chart 50 - Employment Placement or Assistance Initiative
· Break-even: 2-3 years · Volatility: high · 2015/16 investment:
$19m
This programme uses performance-based contracts with providers, where payment to the provider is conditional on outcomes such as the proportion of participants who gain employment, and who remain in employment for specified periods.
Performance has been inconsistent. There was a significant improvement in performance during the last three years. This should be fully understood to ensure that the programme continues to deliver value.
Chart 51 - Skills for Industry
· Break-even: 1-2 years · Volatility: low · 2015/16 investment:
$11m
Skills for Industry is a training programme to train participants for specific jobs. It can involve a mixture of intensive courses and on-the-job training.
This programme has strong financial outcomes. Performance is very consistent, with all annual cohorts up to and including 2014 having already paid for themselves.
-1
0
1
2
3
4
5
6
1 year 2 years 3 years
Historical
Predicted wROI
-1
0
1
2
3
4
5
6
1 year 2 years 3 years
Recent starts Historical
Predicted wROI
Predicted wROI:
2.5 – 5
Predicted wROI:
3 – 5

Page 60 2016 Benefit System Performance Report
Chart 52 - Limited Service Volunteer
· Break-even: 5+ years · Volatility: medium · 2015/16 investment:
$5m
Limited Services Volunteer is a six-week residential course run by the Defence Force. Participants are typically aged 17-25 years.
This programme has one of the lowest Predicted wROI results. This also comes at a high risk, since the programme takes a long time to break even. Results have been poor in the past, but appear to have improved.
Chart 53 - Work Confidence
· Break-even: 5+ years · Volatility: high · 2015/16 investment:
$3m
Work Confidence involves short duration courses designed to improve clients’ confidence and motivation to help them find employment or undertake training.
The Predicted wROI suggests that this programme is delivering value in the long term. However, the programme has performed poorly in recent years. This is the weakest performance of the programmes we have evaluated.
-1
-0.5
0
0.5
1
1.5
2
2.5
1 year 2 years 3 years
2012-2015 2010-2011
Predicted wROI
-3
-2
-1
0
1
2
3
4
5
6
7
1 year 2 years 3 years
2011 2013 2015
Predicted wROI
Predicted wROI:
1.5 – 2
Predicted wROI:
3 – 6

2016 Benefit System Performance Report Page 61
Further ROI work 6.4
The ROI calculations were supported by the Insights MSD team. Further work is underway to assess the wROI of MSD’s case management service streams and MSD’s randomised controlled trials.
In the future, the intent is to perform ROI assessments in Statistics New Zealand’s IDI. This will enable a broader set of fiscal and social outcomes to be included in the calculation, giving more confidence in whether a programme is delivering value.

Page 62 2016 Benefit System Performance Report
7 Progress against Previous Report Recommendations
This section details progress MSD has made against the recommendations from previous Benefit System Performance Reports. Many of these recommendations related to broad areas of focus and were not necessarily expected to be completed within a short space of time. Therefore, some are carried forward for the next year.
Recommendation 3 was initially closed, recognising that work to scope a review of IRRS, AS and TAS was underway. The work did not progress beyond this stage and so we have reopened the recommendation in this report (see section 4.5).
Operational Design and Strategy 7.1
Recommendation 1
To ensure focus is directed towards reducing long-term benefit dependency, ensure priority is given to the actuarial release target. Operational targets may need to be amended to reflect this (2015 BSPR).
Management comment
Management have considered this recommendation and agree priority should be given to the actuarial release target.
In May 2016 the Minister for Social Development accepted the Ministry’s recommendation to focus efforts on the actuarial release target.
MSD already focusses on investment in higher liability segments, including sole parent and HCD client groups.
This recommendation has been completed and is now closed.
Recommendation 2
Management explore opportunities to work more closely with health providers to ensure that clients suffering from mental illness receive appropriate care and support. The viability of MSD directly purchasing mental health services for clients should also be explored (2015 BSPR).
Management comment
Management agree that there is merit in working more closely with others to improve outcomes for clients with mental illness, including potentially directly purchasing mental health services.
MSD has now developed a longer-term strategic response to the mental health cohort. This includes an Investment Strategy with a clear focus on HCD clients, as well as business as usual targets in place for HCD work exits, as part of EmployAbility.
Additionally, there are a number of trials and initiatives in place, including:
· Realising Employment through Active Coordinated Healthcare (REACH) prototype: a 12 week service in Dinsdale to support clients to prepare for work using Cognitive Behavioural Therapy (CBT)

2016 Benefit System Performance Report Page 63
· Supported Living Payment (SLP) Opt-In expansion: this allows SLP clients with any health condition or disability to opt-in to active case management.
· Work to Wellness: a mental health employment contracted case management service
· EmployAbility: an expansion of Project 300 involving supporting any client with a health condition or disability into sustainable employment
· Training for hiring managers: a targeted campaign and training material for hiring managers to promote hiring clients with a health condition or disability.
Future priority work related to HCD clients includes Connecting Services for Better Outcomes (formerly Packages of Care), which involves MSD working with District Health Boards (DHBs), and a range of other organisations. The DHBs we are working with as part of this work are Northland, Waitemata, Waikato and Canterbury.
Management will continue to investigate service strategies for working with clients with mental health conditions.
Given the strategic focus on HCD clients and associated work programmes, this recommendation is considered closed.
Recommendation 3
The design of IRRS, AS and TAS be reviewed to ensure that incentives are aligned with the objective to reduce welfare dependency (2015 BSPR).
Management comment
Increases to AS were announced as part of the Family Incomes Package in Budget 2017. These changes to AS will reduce the gap in affordability between social housing and the private rental market. The impact of these new AS settings will be considered as part of any further work on broader accommodation subsidies.
This recommendation has been reopened.
Recommendation 4
Management should consider whether differentiated services are appropriate for benefit system clients living in social housing (2014 BSPR – recommendation wording changed marginally).
Management comment
As a result of changes in the Ministry’s structure following the split of MSD into two agencies, the operational responsibility for housing returned to the DCE Service Delivery from 1 April 2017. This consolidates the delivery of housing related functions and establishes a centre of expertise in Service Delivery.
This change enhances the Ministry’s client centric approach, by integrating all operations under a single service line, and recognises the strong overlap between the benefit and housing systems.
To enhance the Ministry’s understanding of the barriers to achieving benefit and housing independence for our clients, the Ministry has commissioned independent research to understand whether/how helping people with their housing needs can also help us to
Page 64 2016 Benefit System Performance Report
achieve better employment outcomes. This qualitative research into current and former social housing tenants has a particular interest in investigating four groups:
Current social housing tenants who are “close” to the private rental market (e.g. paying market rent or receiving an Income Related Rent Subsidy (IRRS) of less than $150)
Current social housing tenants who have exited social housing in the past, but have churned back into social housing
Former social housing tenants who have made a successful exit from social housing into the private rental or home ownership market
Former social housing tenants who are currently on the social housing register.
The Ministry is currently completing its first Social Housing Investment Strategy. The Investment Strategy provides clear information about where MSD will focus investments to achieve the best possible outcomes from social housing; specifically, it identifies which groups of clients will be an investment priority in the upcoming year and the outcomes MSD is seeking through this investment. In 2017/18, MSD will focus on increasing supply and expanding its tailored service offerings to improve the responsiveness, effectiveness and support available for people at different stages of housing need.
MSD’s investment priorities for 2017/18 have been informed by the 2015 social housing valuation and the Social Investment Unit’s social housing test case. Work is underway to build a more robust understanding of how social housing contributes to broader outcomes and how to measure success in achieving these outcomes, which will inform future investment decisions.
In future years, MSD’s social housing and welfare investment strategies will be integrated. This will enable MSD to design and evaluate interventions across both systems and enhance how it delivers services across both welfare and housing, based on a more holistic view of the drivers of need.
This recommendation is still in progress and has been held over for the following year.
Recommendation 5
Investigation into the causes of greater levels of vulnerability to long-term benefit receipt for Māori. Strategies should be considered for supporting more Māori into work and new initiatives trialed to target the barriers that cause the disparity between ethnic groups (2013 BSPR).
Management comment
Further analysis has been conducted on Māori as recommended.
The Ministry’s 2016/2017 Investment Strategy identifies Māori as a key focus area for reducing benefit liability, and we are now developing a Māori Strategy, which will seek to improve sustainable employment outcomes, as a means to address long-term benefit dependence among Māori.
The Māori Strategy will be a subset of the Ministry’s Investment Strategy, and establish the Ministry’s response to tackling welfare dependency over the short, medium and long term, to ensure that employment opportunities for Māori are meaningful, fit for the future and sustainable.

2016 Benefit System Performance Report Page 65
To ensure the actions and initiatives are effective, we will co-design the Strategy with the assistance of a Māori Innovation Reference Group. The Strategy will be designed and implemented over a two year period.
The Māori Strategy will benefit our existing partnership with iwi work programme, by providing a foundation to support and manage future partnerships with iwi.
Under this programme we have partnered with Ngati Porou’s social service provider Te Runanganui o Ngati Porou to co-design a service for young Māori mothers named Wahine Activate. The target group for the service represents a significant portion of the East Coast region’s long-term benefit liability.
Wahine Activate recently had their second intake of participants, and we are currently making arrangements to undertake an evaluation to understand what works for this client group, and what worked in the partnership between the Ministry and Ngati Porou.
This recommendation has been completed and is now closed.
Data Access and Analytics 7.2
Recommendation 6
Analysis is performed using Accident Compensation Corporation (ACC) data to understand the experience of former ACC clients that transition to the benefit system (2014 BSPR).
Management comment
Analysis was reported to management in Q3 2015/16. Management found the analysis useful. Key findings are that:
· there is a positive trend of less people transitioning from ACC weekly compensation to the benefit system
· former ACC weekly compensation clients who do transition into the benefit system have lower average liabilities than other comparable clients
· the flow of people from ACC weekly compensation into the benefit system doesn’t appear to represent a material risk to the system
At this stage there is no intent to differentiate our service approach explicitly for clients who have recently stopped receiving ACC weekly compensation.
This recommendation has been completed and is now closed.
Recommendation 7
A link to education data from the Ministry of Education is needed to inform the valuation and better understand the correlations between education and benefit dependency (2013 BSPR).
Management comment
Management agrees that improved education data is useful for the valuation.
The MSD actuarial team has investigated available Ministry of Education (MoE) data. There is data that will be useful for the valuation albeit only going far back enough to cover a small portion of our client population. Behavioural indicators such as suspension absences

Page 66 2016 Benefit System Performance Report
may be particularly useful. MoE data will be included in the 2017 valuations (benefit system and social housing).
As this is part of the work plan for the 2017 valuations, this recommendation is considered closed.
Recommendation 8
Data collection for youth clients is improved to provide a separate benefit code for YP and YPP benefits (or YPP flag) and improve education and child information data collection for these clients (2013 BSPR).
Management comment
A split of youth clients into YP and YPP had been achieved and used in the 2014 and 2015 valuations.
The MSD actuarial team has reviewed the data supplied by Youth Service providers and found that it is not particularly useful for valuation purposes.
We will continue to pursue the notion of using Ministry of Education data as per recommendation 7 and as such management consider this recommendation closed.
This recommendation has been completed and is now closed.
Segmentation 7.3
Recommendation 9
Further investigation into segmentation and whether segmenting the client base using the current continuous duration approach gives the best separation for understanding the drivers of liability. Possible alternatives include age at entry into the benefit system or proportion of time spent on benefit since first benefit receipt (2013 BSPR).
Management comment
Management agree that a review of segmentation is worthwhile.
A review has been performed and the segmentation structure changed significantly. See section 4.3 for a split of 2016 valuation results under the new segmentation structure.
This recommendation has been completed and is now closed.
2016 Benefit System Performance Report Page 67
Appendix A: Background A.1 Review of the Benefit System
Cabinet established the Welfare Working Group (WWG) in April 2010 to conduct a review of the benefit system. Its findings were reported in February 2011 in a report titled Reducing Long-Term Benefit Dependency.
A key theme of the report was to take a long-term view of the social, economic and fiscal costs of benefit dependency. The report recommended adopting an actuarial approach to measuring the liability associated with the benefit system and using this as a tool to inform management.
In November 2011, the Government announced it would move forward with an Investment Approach to managing the benefit system. The Investment Approach is the framework underpinning the Government’s programme of Welfare Reform. This has included:
· merging benefit categories
· extending work obligations to more clients
· introducing new work preparation and other obligations
· funding a more active approach to work with clients who need more assistance to find work.
The changes to benefit categories and obligations were designed to embed a work focus throughout the benefit system and to support the Investment Approach to welfare. These changes have increased the number of people with active work expectations and given MSD more flexibility to provide services to people, appropriate to their circumstances.
A key tool in the Investment Approach to managing the benefit system is the development of an actuarial valuation and reporting framework. Its primary aims are to provide:
· an insight into what is driving people’s risk of long-term benefit dependency
· a financial assessment of the total cost of the benefit system
· an understanding of what is driving the change in cost of the benefit system
· a means of measuring performance in managing the benefit system over time
· a means of analysing the financial impact of policy and operational changes.
This detailed understanding can be used to help Management better target services to help those most in need of support.
A.2 Professional Standards
There are currently no actuarial professional standards which strictly apply to the valuation of unfunded social welfare liabilities. Where relevant, this report and the valuation calculations have been carried out consistent with the professional standards of the New Zealand Society of Actuaries.
In particular, the valuation has been carried out consistent with standards that apply to the valuation of accident compensation liabilities, namely the New Zealand Society of Actuaries Professional Standard No. 30 entitled Valuation of general insurance claims and this report

Page 68 2016 Benefit System Performance Report
complies with relevant sections of Professional Standard No. 31 entitled General Insurers – Financial Condition Reports.
A.3 Scope
This report covers the actuarial valuation, analysis and, where appropriate, the implementation and management of the Investment Approach within the operation of Work and Income.
The liability for current clients is defined to be:
The estimated future lifetime costs of all benefit payments and associated expenses for working-age clients who received a benefit payment in the 12 months up to and including the effective date of the valuation.
This means recent exits from the benefit system are included in the scope of the liability until they have been without benefit assistance for at least 12 months, even though they may not currently be receiving any financial assistance from MSD.
These recent exits have been included in the scope of the liability because there is a high rate of return to the benefit system for previous benefit recipients. This continuing vulnerability means that people who have been off benefit for less than 12 months should continue to be viewed as ‘clients’ to help provide a management focus on sustainable exits from the benefit system.
The liability and this report cover working age people. Benefits payable to people over the eligibility age for superannuation are excluded from the scope of this report. Student Loans and Jobseeker Support Student Hardship have also been excluded from the liability.
The scope of this report does not extend to discussions on the appropriateness or feasibility of pre-funding the valuation liability.
A review of the scope for 2017 and beyond is planned.

2016 Benefit System Performance Report Page 69
Appendix B: Nature of the Business B.1 Purpose
Service Delivery is an operational arm of MSD, tasked with administering the benefit system for working age adults. The role of Service Delivery is to help people throughout New Zealand find work and to provide income support based on entitlements set out in the Social Security Act 1964 (the Act).
Some of the key responsibilities outlined in the Act are:
· to provide financial support to those not in paid employment and help them find employment where they are able to work
· to provide financial support to those unable to work because of sickness, injury, disability or caring responsibilities
· to provide financial support to help alleviate financial hardship
· to provide services to encourage young people to receive education, training or employment
· where appropriate, to impose work requirements on those receiving financial support or in the case of young people, requirements relating to education, budget management and parenting.
In carrying out duties under the Act, the following general principles, outlined in section 1B, are to apply:
· work in paid employment offers the best opportunity for people to achieve social and economic well-being
· the priority for people of working age should be to find and retain work
· people for whom work may not currently be an appropriate outcome should be assisted to prepare for work in the future and develop employment-focused skills
· people for whom work is not appropriate should be provided support in accordance with the Act.
B.2 Governance
The Act confers powers and authorities on the Chief Executive (CE) of MSD to oversee the administration of the benefit system and requires the CE to follow written directions from the Minister. Reporting to the CE are several Deputy Chief Executives (DCE) including a DCE of Service Delivery.
Ministers established Treasury as an external monitoring function, tasked with giving an independent view of the progress of implementation of the investment approach and MSD’s performance.
B.3 Benefit Structure
Until July 2013 financial assistance was provided to eligible working age clients through:

Page 70 2016 Benefit System Performance Report
Table 12 – Benefit Structure – Pre 15 July 2013
Benefit Type Purpose
Domestic Purposes Benefit (DPB)
· Financial support for:
- Single parents living without a partner, irrespective of whether the other parent is contributing to maintenance payments and irrespective of fault
- People caring for the sick and infirm
- Women living alone who were aged 50 or more and lose financial support of their partner or spouse, or a dependent child in their care for at least 15 years has left care
Sickness Benefit (SB)
· Financial support for people temporarily incapacitated from working full-time through sickness or accident, who would otherwise be available for full-time work.
Invalid’s Benefit (IB) · Financial support for people permanently and
severely restricted in capacity for work due to sickness, injury or disability or who are totally blind.
Unemployment Benefit (UB) · Financial support for people not in full-time work but
available for and looking for full-time work.
Widows Benefit (WB)
· Financial support for women with children who have been married or in de-facto relationship for 15 years or more (or five years if over 50) and whose partner has died.
Emergency Benefit (EB)
· Financial support for people who are not eligible for another main benefit and are in hardship and unable to earn a sufficient livelihood due to their health condition, domestic circumstances, residence or another reason.
Orphans Benefit (OB) · Financial support to people (aged 18 or over) caring
for an orphan or unsupported child for a period likely to exceed one year.
Supplementary Benefits
· Additional financial assistance depending on circumstances
- Accommodation Supplement to help with rent, board or home ownership costs
- Childcare Subsidy to help with cost of pre-school care
- Disability Allowances to help with ongoing costs because of a disability
- Unsupported Child’s Benefit to help carers support a child or young person whose parents are unable to care for them because of a family breakdown
Hardship Payments · Financial support for essential one-off needs

2016 Benefit System Performance Report Page 71
Eligibility criteria for main benefits (DPB, IB, SB, UB, WB) generally required recipients to have continuously lived in New Zealand for two years since becoming a citizen or permanent resident.
From 15 July 2013, the benefit structure was consolidated from the multiple benefit types listed in paragraph B.6 to three main benefit types plus two youth benefits (which started from August 2012). These changes, along with the increase in the number of people with active work expectations, were made to embed a work focus in the benefit system. The new benefit structure is summarised below:
Table 13 – Benefit Structure – Post 15 July 2013
Benefit Type (and former type)
Purpose
Jobseeker Support
which incorporates the former
- UB, SB
- DPB, WB with youngest child aged 14 or over
To provide financial support to those not in full-time work but actively seeking and available for work and those who are temporarily exempt due to a health condition or disability but who will soon be able to work
Sole Parent Support
Which incorporates the former
- DPB, WB or Women Living Alone Benefit with youngest child aged 13 or under
To provide financial support for single parents with school age or under school age children
Part-time work obligations start once the youngest child is aged five
Note: If another child is born while on the benefit, once that child turns one, the obligations are dependent on the next youngest child's age
Supported Living Payment
Which incorporates the former
- IB
- DPB – Care of Sick and Infirm
To provide financial support to people unable to work because they are permanently and severely restricted due to a health condition or disability or are totally blind or caring for a person who requires full-time care and attention at home
Youth Payment
Which incorporates the former
- under 18 receiving UB, SB or EB
- Note that young people formerly receiving IB are included in Supported Living Payment
To provide financial support to people aged 16 to 18 years old (subject to education, training or work obligations)
Young Parent Payment
Which incorporates the former
- under 19 receiving DPB
To provide financial support to people aged 16 to 19 years old with a dependent child (subject to budgeting and early childhood education obligations)
Supplementary Benefits No change
Benefit payment amounts are income tested. Abatement rates vary by benefit type.
The new Jobseeker benefit reflects the work focus under the welfare reforms by including those sole parents having full-time work obligations (children 14 or over). It also includes people having short-term deferrals of their work obligations.
Creating the two new youth benefits highlights the importance of working with vulnerable young people who, without support, are likely to develop long-term benefit dependency. The focus for these benefits is training and education as a precursor to work.

Page 72 2016 Benefit System Performance Report
B.4 Recent Reforms
Future Focus
The Social Security (New Work Tests, Incentives and Obligations) Amendment Bill passed into law on 23 August 2010. This bill supported changes announced under the Future Focus initiative.
· From 27 September 2010:
· UB recipients are required to reapply for their benefit and complete a Comprehensive Work Assessment interview every 52 weeks.
· DPB Sole Parent clients whose youngest child is six years or older are subject to part-time work obligations.
· Repeat applicants for hardship assistance are subject to new budgeting obligations.
· Hardship applicants are able to receive their first and second grants in a year over the phone.
· From 2 May 2011:
· Clients in receipt of SB for 52 weeks are required to attend a reassessment interview with a case manager.
· New SB clients are required to undergo an additional medical assessment by a health practitioner eight weeks after their grant date (shifting out the dates of 13 weekly reassessments thereafter).
· Clients issued with a medical certificate indicating they are capable of work for 15–29 hours a week have part-time work obligations.
· The Bill also required people on a youth benefit to be in education, work or training and introduced graduated sanctions when obligations are not met.
Welfare Reforms
On 30 May 2011, Cabinet agreed to a programme of work to develop the Government's response to the WWG. Cabinet agreed the reforms should focus on ensuring sustainable paid work is the goal for as many beneficiaries as possible and increase investment in people with high long-term social and economic needs.
The package has been phased in over three stages.
· Phase One: The YP and YPP benefits and delivery of the new Youth Service began from 20 August 2012. The Youth Service targets 16-18 year olds at risk of long-term benefit dependency and aims to help them work towards independence through education, training or work-based learning with the support of community based providers.
· Phase Two: Greater work expectations were introduced from 15 October 2012 for DPB - Sole Parent, Woman Alone and Widows Benefit recipients.
· Phase Three: From 15 July 2013 three new benefit categories were introduced - JS, SPS and SLP. In addition, new policies and processes were introduced such as social obligations for parents, pre-employment drug testing, work ability assessments for job seekers with deferred work obligations, and checks for warrants to arrest.

2016 Benefit System Performance Report Page 73
In July 2012, Cabinet agreed to provide MSD with greater flexibility to use contracted service providers to support beneficiaries to meet their obligations and achieve sustainable employment outcomes. The aim is to draw on the expertise in the Non-Government Organisation and private sectors to achieve employment outcomes for more people.
Following these changes, the main purposes of administering benefits in line with the Act and assisting people to find work are largely unchanged. From a practical perspective, however, since the welfare reforms, more of the spend on services and interventions has been directed towards activities such as employment assistance and providing services to people appropriate to their circumstances, with increased numbers of case managers working one-to-one with clients.
Child Material Hardship Package
As part of Budget 2015 a Child Material Hardship Package was announced incorporating a number of changes to benefits and policy settings:
· A $25 a week (after tax) increase in benefit rates for families with children
· Strengthened work obligations for beneficiary parents, including:
· Introduction of part-time work obligations to SPS clients with youngest child aged three and four
· An increase in part-time work obligations from 15 to 20 hours a week
· An increase in childcare subsidy rate from $4 to $5 for low-income families
These changes were effective from 1 April 2016.
Operational Service Model
Service Delivery is the largest service line of MSD, with 11 regional offices, more than 140 service centres, a contact centre located in five sites, and a centralised processing unit.
The service delivery framework incorporates five distinct internal case management services:
· Work-Focussed Case Management (WFCM - General): provides intensive one-to-one, face-to-face case management support for clients likely to remain on benefit for a long time without intervention. The goal of this service is to address a client's barriers to employment and find them work.
· Work-Focussed Case Management - Health Condition, Injury or Disability (WFCM - HCD): provides customised case management for Jobseekers with a deferred work obligation who display indicators that, with support, they will be able to return to work.
· Work-Focussed Case Management - Integrated Service (WFCM - IS): provides intensive wrap-around case management for clients aged 24 or under and who began receiving a benefit as a youth, giving them a high risk of long-term benefit dependence. The service also provides case management for clients who are identified as having multiple and complex needs and so require additional support to address barriers to work.
· Work Search Support (WSS): is a service for work-ready JS clients that increases in intensity with time on benefit. It starts with clients doing self-directed job search
Page 74 2016 Benefit System Performance Report
and progressing to support from outbound calls to the client then to Work Search Assessment and various Work Development Workshops to help clients who have more connections to the labour market stay focused on finding employment.
· General Case Management (GCM): is a one-to-many service to provide income support and support to prepare for work. This service is for clients for whom employment is not a short-term goal, who are receiving non-beneficiary assistance, or who are yet to be assigned to a more intensive service.
Clients are allocated into services depending on a range of eligibility factors. Streaming rules are reviewed to ensure appropriate allocation of clients to services.
A separate case management service (the Youth Service) is targeted at clients receiving a youth benefit i.e. those aged under 18 (and parents up to age 19). The Youth Service is co-managed by contracted providers and MSD. It is more focused on educational and training goals than on immediate work outcomes. The intent is to extend the Youth Service to 18 and 19 year old clients, without dependent children, who are at significant risk of long-term welfare dependency.
MSD partners with employers, training providers, and social support providers, to help deliver tailored services, such as ongoing mentoring and wrap-around support, to clients to help them into training or work.
Benefit payment administration is a major function of MSD, along with fraud prevention and detection. The business unit also handles Emergency Management (preparation and response for welfare responsibilities) on behalf of the Government.
B.5 Investment Approach
To achieve the goal of reducing long-term benefit dependency, Government implemented an Investment Approach to the benefit system. The aim of the Investment Approach is to better target appropriations to the needs of the clients. Its success relies on:
· a clear long-term outcome based on the external valuation and the factors over which MSD has influence
· strong accountability mechanisms where performance is measured transparently against the future liability
· flexible funding so MSD can allocate resources to where they are most effective at improving long-term employment outcomes. Increased flexibility entails the ability to stop, trial and expand programmes and services, and the ability to move funding to those programmes and services that improve client outcomes.
There are a number of elements in place that are essential to the successful delivery of the investment approach and to target funding better to reduce long-term dependency. They are explained in the following sections.
Annual Valuation of the Benefit System
A key component of the Investment Approach to managing the benefit system is the annual actuarial valuation of the liability for people of working age.

2016 Benefit System Performance Report Page 75
Multi-Category Appropriation (MCA)
MSD is provided with appropriations to fund the administration of the benefit system and to meet its duties to help people find work. Crucial to being able to direct investment funds towards interventions that will most benefit clients is the introduction of the MCA, providing increased funding flexibility. The first MCA of its kind was agreed by Cabinet in September 2013 and approved by the Minister of Finance in October 2013 (for implementation from 1 January 2014). Operational flexibility is provided by the delegation of decision-making rights from Ministers to the CE of MSD.
The use of an MCA places responsibility on MSD to use these public funds prudently and efficiently. The Investment Approach aims to direct the funding where it will do the most good, and to establish a clearer link between the application of funds and how they impact on peoples’ risk of long-term benefit receipt.
Controls and Governance of Investments
Trials and the Return on Investment Framework: To help understand the impacts that can be attributed to investment initiatives better, a number of trials are in place. Outcomes for the targeted groups of people in a trial are tracked and compared to a control group having similar attributes. This forms part of the broader ROI framework MSD has developed.
Key elements of the framework are:
· a consistent approach across all investments and all clients to make strategic decisions about how intervention funding should be allocated
· an approach to attribution of the impacts on the liability of various interventions
· a business case discipline to identify expected outcomes at the outset of significant investments and new initiatives (e.g. trials of new service delivery approaches, and cases for roll-out of successful trials). This can be used to monitor the actual impact and ROI against these expected outcomes.
Crucially, the framework incorporates estimated liability impacts of investment initiatives. This allows for a full understanding of long-term impact. Ultimately this enables us to form a view as to whether a particular investment initiative is delivering value for money.
Chapter six of this report contains ROI analysis of a number of existing employment assistance programmes and trials.
Quarterly Actuarial Reporting: A quarterly valuation monitoring report is provided to the Minister for Social Development, the Minister of Finance and to the Management of MSD. Its purpose is to:
· monitor the key drivers of the liability, such as client numbers and benefit payments
· identify variances in trends projected from the valuation and MSD's actual experience
· provide an update of the valuation liability and report on the actuarial release component of BPS 1
· provide a transparent account of the performance of the benefit system and MSD’s management thereof.
Page 76 2016 Benefit System Performance Report
Benefit System Performance Report: This annual report (and the quarterly monitoring reports) are tools available to provide greater transparency of the performance of the benefit system. It provides the CE with a review of the performance and the impact of investments made to reduce benefit dependency. It also identifies areas for attention to help manage long-term benefit dependency.

2016 Benefit System Performance Report Page 77
Appendix C: Return on Investment Methodology The return on investment (ROI) is a ratio of savings to costs, calculated by comparing two groups of clients, according to their past and predicted financial relationship with MSD.
Return on Investment
A ratio allows us to measure the impact of a programme regardless of its size, which is particularly useful for comparing programmes of different sizes.
The return on investment is:
Net Benefit Payments + Net Other
Total Programme
Where:
· Net Benefit Payments – is the difference in benefit payments between the treatment and comparison groups. This includes the difference in benefit system liability.
· Net Other – is the difference between the treatment and comparison groups in utilisation of other programmes and case management services.
· Total Programme – is the total cost of the programme (excluding overheads).
Treatment and comparison groups
To calculate savings caused by a programme, we want to know how much MSD would have paid to participants had they not participated in the programme. To estimate this, we compare the costs of the participants in the programme (the treatment group), with a group of similar clients who are not in the programme (the comparison group).
We use the method of propensity matching to find a comparison group with similar characteristics to the treatment group at the time the programme starts. We want two groups such that the only difference is that one group is in the programme. Then we conclude that the difference in benefit costs between the groups must be a result of the programme.
Financial outcomes
Outcomes are measured by the financial savings made when MSD no longer needs to pay a client a main benefit, supplementary benefit, or a one-off payment. There are also savings in administrative costs, as MSD no longer needs to administer income support, or provide intervention programmes.
Clients who are helped into employment may not require a benefit for many years - so much of a programme’s success may lie in the future. It would be impractical to wait for these savings to be realised before assessing the impact of a programme, so the outcomes also include a prediction of future savings as well as observed savings.
Savings and costs do not include a share of indirect costs and overheads. The cost of the employment programmes is relatively small in the context of total Ministry costs and is unlikely to materially influence indirect costs and overheads.
Page 78 2016 Benefit System Performance Report
There are other costs and benefits that are not included. For example, supporting people into sustainable employment is likely to have an impact on their use of other social services and well-being more broadly.
Limitations
We are reliant on a number of factors, including:
· Data – We have applied broad reasonableness checks, this does not rule out the possibility of quality issues.
· Model risk – As with any model of future outcomes, there is a risk that future savings estimates are not an adequate representation of the complex, real-life system they represent, and/or there is a risk of future external changes that materially influence actual experience e.g. legislative, policy or economic changes.
· Comparison group selection – With any comparison between groups there is the risk that unobserved differences in profile cause differences in observed experience that are mistakenly attributed to programme performance.
2016 Benefit System Performance Report Page 79
Appendix D: Terms, Definitions & Glossary D.1 Terms & Definitions
Client Numbers
Client numbers noted in this report, except BPS numbers or where otherwise specified, are based on the valuation methodology and differ to official counts because:
· client numbers in the valuation include all clients who have received a benefit in the quarter whereas official reporting is at a point in time
· client numbers in the valuation count partners as separate clients whereas official reporting does not
· the valuation includes 16-17 year olds whereas the working age count is for 18-64 year olds
· the valuation includes recent exits (anyone not receiving a benefit but who has within the past 12 months) and people receiving orphan benefits and/or supplementary payments that are not included in the main benefit numbers
· the extraction dates for the valuation data and the official count data are different. The valuation data is collected one month after the reporting date to allow for any back-dated changes to be made.
A brief reconciliation is given in table 14:
Table 14 – Reconciliation
Main working age benefits at 31 December 2016 286,590
Quarterly count definition and back-dating of data +13,896
Partners +45,615
16-17 year olds +2,607
Clients receiving supplementary benefits only* +74,599
Clients receiving the orphans benefit +5,303
Recent exits** +34,298
Total receiving benefits in the quarter to 31 December 2016 462,908
All projections in this report come from the valuation model and will differ to Treasury forecasts because they are used for a different purpose and adopt different methodologies and assumptions.
Benefit Categorisation
Where information is broken down by benefit category, data prior to benefit structure changes in July 2013 have been adjusted to ensure a consistent basis. Appendix B provides details on the July 2013 benefit structure changes.
* The main working-age benefit count only includes main benefit clients ** The valuation current client liability definition includes people not currently receiving benefits but have done in the previous 12 months
Page 80 2016 Benefit System Performance Report
D.2 Glossary
ACC – Accident Compensation Corporation
AS – Accommodation Supplement
BPS – Better Public Services
CE – Chief Executive
CMHP – Child Material Hardship Package
CYF – Child, Youth and Family
CYF-CP – Child, Youth and Family-Care and Protection
CYF-YJ – Child, Youth and Family-Youth Justice
Corrections – Department of Corrections
DA – Disability Allowance
DCE – Deputy Chief Executive
DHB – District Health Board
DPB – Domestic Purposes Benefit
EB – Emergency Benefit
FCA – Flexible Childcare Assistance
FIAA – Fellow of the Institute of Actuaries of Australia
FIA – Fellow of the Institute of Actuaries (UK)
FNZSA – Fellow of the New Zealand Society of Actuaries
GCM – General Case Management
GFC – Global Financial Crisis
HCD – Health Conditions and Disabilities
HNZ – Housing New Zealand
HYEFU – Half-year Economic and Fiscal Update
IDI – Integrated Data Infrastructure
IEEP – Intergenerational Early Entrant Parent
IRRS – Income Related Rent Subsidy
JS – Jobseeker Support
JS-WR – Jobseeker Support-Work Ready
JS-HCD – Jobseeker Support-Health Conditions and Disabilities
LET – Liability Estimator Tool
MCA – Multi-Category Appropriation
MSD – Ministry of Social Development
MVCOT – Ministry for Vulnerable Children, Oranga Tamariki

2016 Benefit System Performance Report Page 81
NCEA – National Certificate of Educational Achievement
NEET – Not in Education, Employment or Training
NGO – Non-Government Organisation
NOMB – Not on Main Benefit
OB – Orphans Benefit
ROI – Return on Investment
SB – Sickness Benefit
SIU – Social Investment Unit
SLP – Supported Living Payment
SPB – Special Benefit
SPS – Sole Parent Support
SUP – Supplementary Benefits Only
Superu – Social Policy Evaluation and Research Unit
TAS – Temporary Additional Support
TFW – Training for Work
UB – Unemployment Benefit
WFCM – Work-Focused Case Management
WSS – Work Search Support
YP – Youth Payment
YPP – Young Parent Payment

Page 82 2016 Benefit System Performance Report