Xiao-Bi Xie University of California at Santa Cruz Sanya , China July 24-28, 2011
2016 Annual Results Presentation
28 February 2017

Potential investors and shareholders (the “Potential Investors and Shareholders”) of Hutchison Telecommunications Hong Kong Holdings
Limited (“the Company”) are reminded that information contained in this Presentation comprises extracts of operational data and financial
information of the Company and its subsidiaries (“the Group”) for the year ended 31 December 2016. The information included is solely for
the use in this Presentation and certain information has not been independently verified. No representations or warranties, expressed or
implied, are made as to, and no reliance should be placed on, the fairness, accuracy, completeness or correctness of the information or
opinions presented or contained in this Presentation. Potential Investors and Shareholders should refer to the 2016 Annual Report for the
results of the Group which are published in accordance with the listing rules of The Stock Exchange of Hong Kong Limited.
The performance and the results of operations of the Group contained within this Presentation are historical in nature, and past
performance is no guarantee of the future results of the Group. Any forward-looking statements and opinions contained within this
Presentation are based on current plans, estimates and projections, and therefore involve risks and uncertainties. Actual results may differ
materially from expectations discussed in such forward-looking statements and opinions. The Group, the Directors, employees and agents of
the Group assume (a) no obligation to correct or update the forward-looking statements or opinions contained in this Presentation; and (b)
no liability in the event that any of the forward-looking statements or opinions do not materialise or turn out to be incorrect.
Potential Investors and Shareholders should exercise caution when investing in or dealing in the securities of the Company.
Disclaimer
1

Business Performance
2

Challenging 2016 and achievements made
Key Challenges
• Weakening economy
• Intensified competition
• Disruptive mobile pricing
• Lesser demand in handsets, roaming and IDD
• Increasing spectrum and network costs
Our efforts and achievements
• Customer base grew to 3.2m
• Significant mobile churn reduction
• Mobile opex reduced by 7% YoY
• Launched attractive OTT services and roaming products
• Upgraded to 4.5G mobile network with TDD&FDD aggregation
• Good penetration in fixed-line corporate and business market segments
3

Highlights
• Group service revenue at $12,024 million, with net service revenue stable at $7,640 million
• Mobile local net service revenue remains stable with local net ARPU improved by 4%
• Stable consolidated opex and capex
• Consolidated EBITDA reports at $2,465 million
• Consolidated EBIT reports at $1,044 million
• Consolidated NPAT reports at $701 million
• Final dividend at 6.90 cents per share, with full year dividend of 10.90 cents per share
4

Mobile
Our customers benefit from HTHKH’s style of
innovation via advanced mobile networks and
services delivered in customer-centric fashion.
5

Mobile business
6
Favourable/
2016 2015 (Unfavourable)
HK$ million HK$ million Change
Total revenue 8,332 18,477 -55%
- Net service revenue 3,946 4,106 -4%
- Hardware revenue 4,386 14,371 -69%
Net customer service margin 3,656 3,823 -4%
Net customer service margin % 93% 93% -
Standalone handset sales margin 73 308 -76%
Total CACs (325) (270) -20%
Operating expenses (2,071) (2,224) +7%
EBITDA 1,333 1,637 -19%
Service EBITDA 1,260 1,329 -5%
Service EBITDA Margin % 32% 32% -
Depreciation and amortisation (733) (661) -11%
EBIT 600 976 -39%

Mobile Service Revenue
Local non-data revenue
Local data revenue
Mobile local service revenue
3,275 3,224
0
2,000
4,000
HK
$ m
illi
on
s
2015 2016
831
722
0
500
1,000
HK
$ m
illi
on
s
Mobile roaming service revenue
2015 2016
4,106 3,946
0
2,500
5,000
HK
$ m
illi
on
s
Total mobile service revenue
2015 2016
7

154 161 161 168
0
120
240
HK
$ /
mo
nth
Blended local postpaid net ARPU and net AMPU
Local net AMPU Local net ARPU
2015 2016 2015 2016
Postpaid Churn
1.8%
1.3%
0.0%
1.0%
2.0%
Pe
rce
nta
ge
(%
)
Mobile KPIs
1,547 1,736
1,484 1,486
0
2,000
4,000
Total customers in Hong Kong and Macau
3,031
2015 2016
2015 2016 3,222
+6%
1,466 1,714
0
1,000
2,000
MB
/mo
nth
Blended data usage per 3G+4G customers
2015 2016
+17%
Postpaid
Prepaid
+5% +4%
8
Fixed-line
HTHKH enables customers with international,
corporate, data centre and residential broadband
services via an extensive fibre-optic network.
9

Fixed-line business – financial highlights
10
Favourable/
2016 2015 (Unfavourable)
HK$ million HK$ million Change
Revenue 4,127 3,973 +4%
Operating expenses (2,875) (2,699) -7%
Opex as % of revenue 70% 68% -2% points
EBIT DA 1,252 1,274 -2%
EBITDA margin % 30% 32% -2% points
Depreciation and amortisation (688) (697) +1%
EBIT 564 577 -2%
CAPEX (excluding licence) (509) (485) -5%
EBITDA less CAPEX 743 789 -6%

International and Local Carrier 53%
(2015: 53%)
Corporate and Business 31% (2015: 30%)
Residential 13%
(2015: 14%)
Fixed-line business
Total Fixed-line revenue
2016 : HK$4,127 million
(2015 : HK$3,973 million)
1 “Others” include revenues from interconnection charges , data centers and others
• 87% fixed-line revenue contributed
from non-residential market
• 4% YoY growth
Others1: 3%
(2015: 3%)
11

Fixed-line international and local carrier market
International and local carrier Revenue
914 944
1,192 1,253
0
1,300
2,600
2015 2016
HK
$ m
illi
on
s
2,106 2,197
• Strong growth (+4%) supported by the
increase in data consumption
• Supported by trends such as OTT and IoT
Data IDD
12
53%

Fixed-line corporate and business market
• +10% YoY growth driven by strong
growth in data
• Extensive Network (4.9k FTTB commercial
buildings, 25k Wi-Fi hotspots)
• Accredited service provider of SDNet/2 with
stringent requirement set by HKEx
• Large and diversified base of 61.2k
corporate and SME customers
• Winning vertical penetration strategy
(e.g. banks, government, insurance, logistics)
Corporate and Business Revenue
925 1,058
255
242
0
700
1,400
2015 2016
HK
$ m
illi
on
s
Data Voice and IDD
1,180
1,300
13
31%
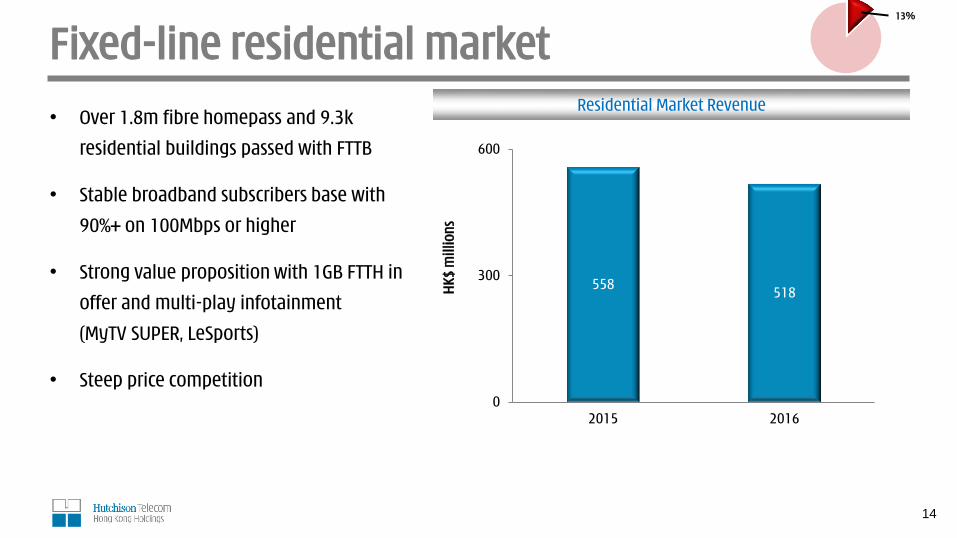
Fixed-line residential market
Residential Market Revenue
558 518
0
300
600
2015 2016
HK
$ m
illi
on
s
• Over 1.8m fibre homepass and 9.3k
residential buildings passed with FTTB
• Stable broadband subscribers base with
90%+ on 100Mbps or higher
• Strong value proposition with 1GB FTTH in
offer and multi-play infotainment
(MyTV SUPER, LeSports)
• Steep price competition
14
13%

Financial Overview
15

Consolidated financial highlights
16
Favourable/
2016 2015 (Unfavourable)
HK$ million HK$ million Change
Consolidated service revenue 7,640 7,674 -
Consolidated hardware revenue 4,384 14,368 -69%
Consolidated revenue 12,024 22,042 -45%
Consolidated service EBITDA 2,392 2,483 -4%
Consolidated hardware EBITDA 73 305 -76%
Consolidated EBITDA 2,465 2,788 -12%
Consolidated service EBIT 971 1,125 -14%
Consolidated hardware EBIT 73 305 -76%
Consoldated EBIT 1,044 1,430 -27%
Service profit 655 722 -9%
Hardware profit 46 193 -76%
Profit attributable to shareholders 701 915 -23%
Earnings per share (in HK cents) 14.55 18.99 -23%
Final dividend per share (in HK cents) 6.90 9.00 -23%
Full year dividend per share (in HK cents) 10.90 14.20 -23%

Consolidated cost items
Customer acquisition costs
Staff costs
Other operating expenses
Depreciation and amortisation
3,977 3,915
830 896 384 437
1,358 1,421
0
4,000
8,000
HK
$ m
illi
on
s
Consolidated cost items
21%
7%
13%
59%
+2%
6%
13%
60%
21%
6,549
2015 2016
6,669
17
• Higher customer acquisition cost due to
increased selling activities for future
revenue
• Higher depreciation and amortisation from
spectrum renewal of 2100MHz and
activation of 2300MHz in Q4 2016
• Stable staff cost and other operating
expenses

Capex investment
Mobile Capex
15.5%
capex over service revenue
574 589
14% 15%
0%
13%
26%
0
400
800
% to
service
reve
nu
e
HK
$ m
illi
on
s
Fixed-line Capex
485 509
12% 12%
0%
15%
30%
0
400
800
% to
service
reve
nu
e
HK
$ m
illi
on
s
Consolidated Capex
1,059 1,098
14% 14%
0%
15%
30%
0
750
1,500
% to
service
reve
nu
e
HK
$ m
illi
on
s
2015 2016
2015 2016 2015 2016
18

1.1
1.7
0.0
1.0
2.0
Consolidated financial position
Net debt
2,941
4,230
20%
26%
0%
20%
40%
0
2,500
5,000
Ne
t de
bt to
ne
t tota
l cap
ital %
HK
$ m
illi
on
s
Net debt to net total capital ratio
As at As at
31 Dec 2015 31 Dec 2016 As at As at
31 Dec 2015 31 Dec 2016
Net debt/LTM EBITDA
Note: increase in net debt was to finance spectrum licence fee payment.
19

Outlook

Strategies to meet the Challenges
Customer
Experience
• Invest in customer loyalty
• Reward customers for relationship and business
• Segmental and delightful customer service
More
Revenue
Streams
• Variety of products tailored to specific needs
• Innovative roaming and prepaid products
• Integrated solution for corporates
• Capture OTT, M2M, Smart City and IoT opportunities
• Expansion of Data Centre and Cloud services
Prepare for 5G • Continue to improve data speed by spectrum re-farming
• Ready for network architectural change and expansion
• Strengthen technology partnership paving for 5G
Higher Cost
Efficiency
• Continue to improve cost efficiency
• Digital transformation
• Innovative digital sales and market communication channels
21

Spectrum
22
HTHKH constructively responded to OFCA’s 1st public consultation on spectrum reassignment. While we are still studying
the 2nd consultation paper, our initial position is still to support 80% of spectrum for renewal and 20% for auction.
We suggest :
80% spectrum for renewal
20% for auction
• Less spectrum for renewal brings high risks in
business certainty and customer service continuity
• Uncertainty in spectrum holding will discourage
long term investment in capital intensive
technology development
• Our prime consideration is to minimise disruption
of service to customers
OFCA’s proposed spectrum prices are extremely high and
will heavily burden HK’s mobile industry
• The proposed spectrum fee is conservatively
estimated at least 3 times more than current
• Extremely high spectrum fee is equivalent to extra
tax on mobile industry
• Heavy financial burden will hamper our ability to
provide competitive services to customers
• Destructive impact on HK’s technology leadership
position

Q & A

THANK YOU
24