2016 Annual Report to the School Community · 2016 Annual Report to the School Community ......
11
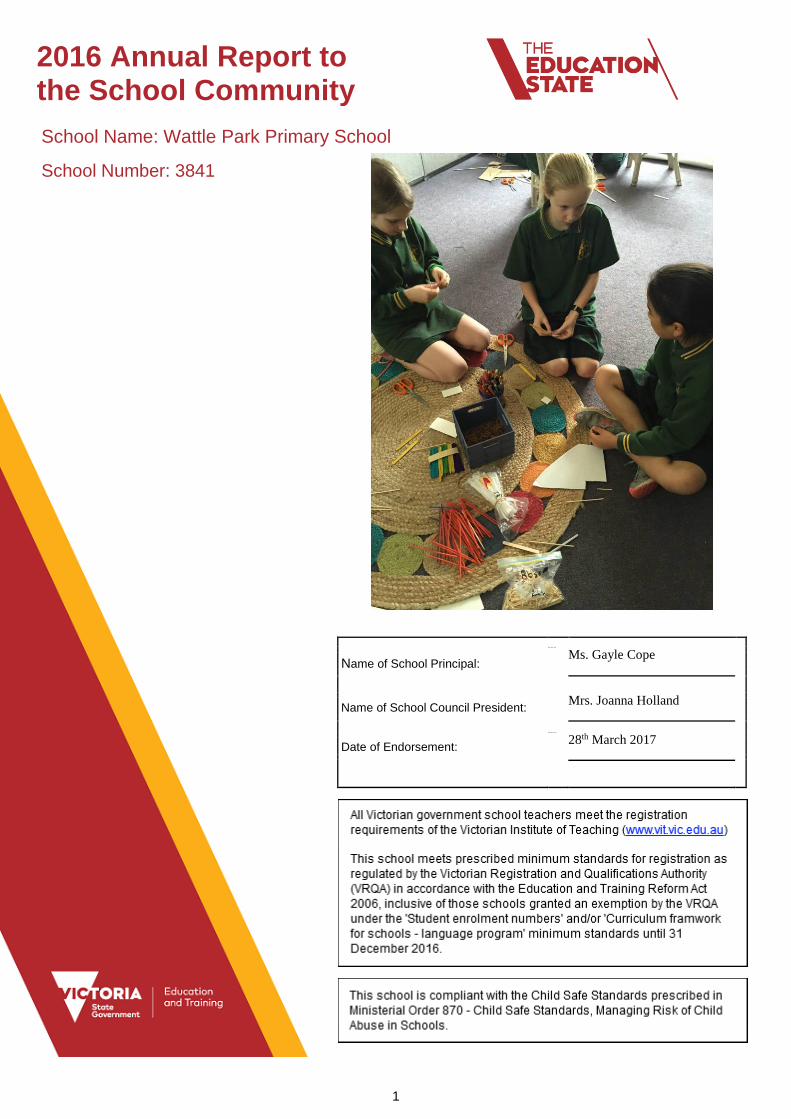
1 2016 Annual Report to the School Community School Name: Wattle Park Primary School School Number: 3841 Ms. Gayle Cope Name of School Principal: Mrs. Joanna Holland Name of School Council President: 28 th March 2017 Date of Endorsement:
Transcript of 2016 Annual Report to the School Community · 2016 Annual Report to the School Community ......
1
2016 Annual Report to the School Community
School Name: Wattle Park Primary School
School Number: 3841
Ms Gay le Cope
Ms. Gayle Cope Name of School Principal:
Mrs. Joanna Holland Name of School Council President:
28th March 2017
28th March 2017 Date of Endorsement:
Wattle Park Primary School
2
About Our School
School Context
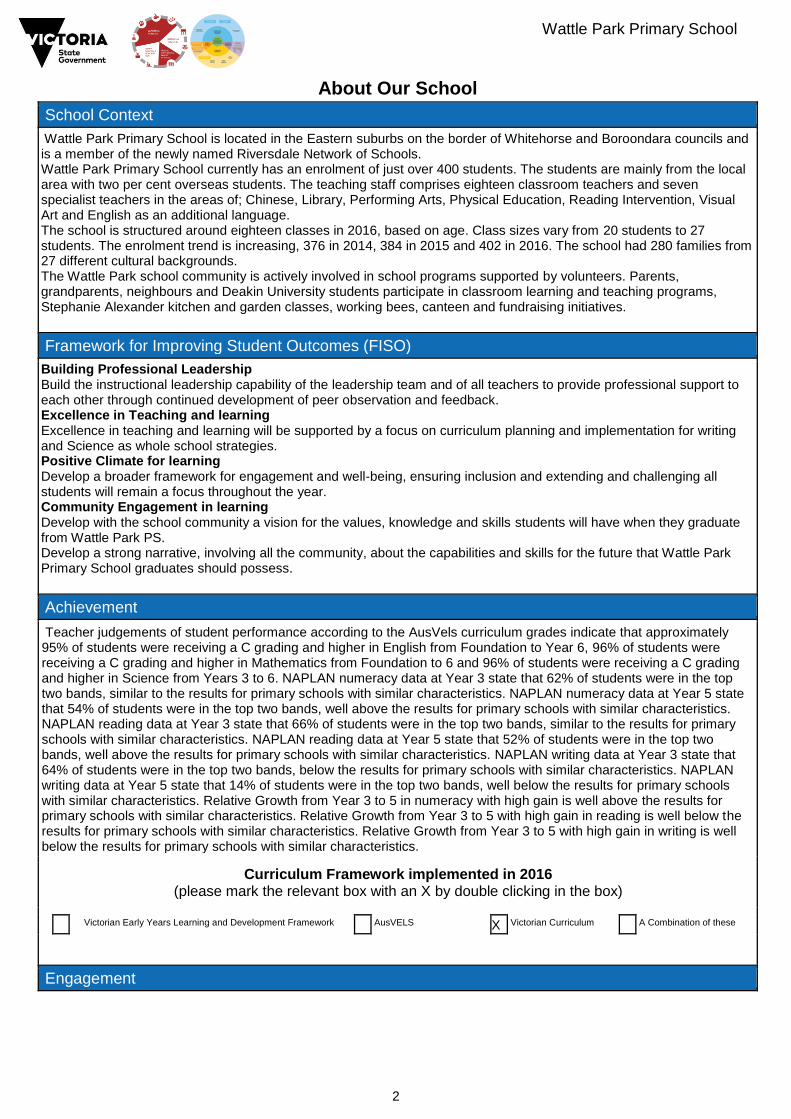
Wattle Park Primary School is located in the Eastern suburbs on the border of Whitehorse and Boroondara councils and is a member of the newly named Riversdale Network of Schools. Wattle Park Primary School currently has an enrolment of just over 400 students. The students are mainly from the local area with two per cent overseas students. The teaching staff comprises eighteen classroom teachers and seven specialist teachers in the areas of; Chinese, Library, Performing Arts, Physical Education, Reading Intervention, Visual Art and English as an additional language. The school is structured around eighteen classes in 2016, based on age. Class sizes vary from 20 students to 27 students. The enrolment trend is increasing, 376 in 2014, 384 in 2015 and 402 in 2016. The school had 280 families from 27 different cultural backgrounds. The Wattle Park school community is actively involved in school programs supported by volunteers. Parents, grandparents, neighbours and Deakin University students participate in classroom learning and teaching programs, Stephanie Alexander kitchen and garden classes, working bees, canteen and fundraising initiatives.
Framework for Improving Student Outcomes (FISO)
Building Professional Leadership Build the instructional leadership capability of the leadership team and of all teachers to provide professional support to each other through continued development of peer observation and feedback. Excellence in Teaching and learning Excellence in teaching and learning will be supported by a focus on curriculum planning and implementation for writing and Science as whole school strategies. Positive Climate for learning Develop a broader framework for engagement and well-being, ensuring inclusion and extending and challenging all students will remain a focus throughout the year. Community Engagement in learning Develop with the school community a vision for the values, knowledge and skills students will have when they graduate from Wattle Park PS. Develop a strong narrative, involving all the community, about the capabilities and skills for the future that Wattle Park Primary School graduates should possess.
Achievement
Teacher judgements of student performance according to the AusVels curriculum grades indicate that approximately 95% of students were receiving a C grading and higher in English from Foundation to Year 6, 96% of students were receiving a C grading and higher in Mathematics from Foundation to 6 and 96% of students were receiving a C grading and higher in Science from Years 3 to 6. NAPLAN numeracy data at Year 3 state that 62% of students were in the top two bands, similar to the results for primary schools with similar characteristics. NAPLAN numeracy data at Year 5 state that 54% of students were in the top two bands, well above the results for primary schools with similar characteristics. NAPLAN reading data at Year 3 state that 66% of students were in the top two bands, similar to the results for primary schools with similar characteristics. NAPLAN reading data at Year 5 state that 52% of students were in the top two bands, well above the results for primary schools with similar characteristics. NAPLAN writing data at Year 3 state that 64% of students were in the top two bands, below the results for primary schools with similar characteristics. NAPLAN writing data at Year 5 state that 14% of students were in the top two bands, well below the results for primary schools with similar characteristics. Relative Growth from Year 3 to 5 in numeracy with high gain is well above the results for primary schools with similar characteristics. Relative Growth from Year 3 to 5 with high gain in reading is well below the results for primary schools with similar characteristics. Relative Growth from Year 3 to 5 with high gain in writing is well below the results for primary schools with similar characteristics.
Curriculum Framework implemented in 2016 (please mark the relevant box with an X by double clicking in the box)
Victorian Early Years Learning and Development Framework
AusVELS
X
Victorian Curriculum
A Combination of these
Engagement
Wattle Park Primary School
3
Attitudes to School Survey data indicate that student perceptions of stimulating learning have steadily increased across the past four years for Year 5 students to 63% in 2016. Year 6 students’ perceptions about stimulating learning fluctuates each year, 59% of Year 6 students perceive the learning to be stimulating in 2016.Student motivation is high at 76% for Year 5 students and 84% for Year 6 students. 71% of Year 5 students perceive themselves to be confident of themselves as learners compared with 87% of Year 6 students perceiving themselves to be confident learners. Attendance data indicates that absence rates are at the same level to schools of similar socio- economic background. Attendance rates are fairly even across all year levels, excepting Year 2 where there was considerably less days of absence. Attendance rates are impacted upon by holidays during school terms rather than in designated holiday periods. We have a very small number of students who are consistently absent due to mental health issues of either themselves or members of their family.
Wellbeing
Creating a positive and engaging school culture forms the basis on which we believe optimal student learning will occur. Wattle Park Primary School aims to provide quality educational programs within a supportive learning environment that promotes personal excellence and fosters participation and communication. The school aims to provide a positive, fair and respectful culture. Attitudes to School Survey results from Years 5 & 6 indicate the Wellbeing factors of student morale and student distress as 80% and 85% respectively. From a student perspective, the Attitudes to School survey results state 81% of students feel connected to school. Student perceptions of safety at the school, is that they feel very safe with 84% of student responses stating they feel very positive about being safe at school. Year 5 & 6 Focus Groups when asked the question, ‘How can we improve our student well-being at the school’ stated that meditation should be incorporated throughout the school and counsellors available to talk privately about personal issues and concerns. Having available more physical sports and activities to participate in to help relieve stress and anxiety.
For more detailed information regarding our school please visit our website at
www. wattleparkps.vic.edu.au
Wattle Park Primary School
4
Performance Summary
The Government School Performance Summary provides an overview of how this school is contributing to the objectives of the Education State and how it compares to other Victorian government schools.
All schools work in partnership with their school community to improve outcomes for children and young people. Sharing this information with parents and the wider school community will help to deliver community engagement in student learning in the school, which is a state-wide priority of the Framework for Improving Student Outcomes.
Accessible data tables are available for all schools separately – please refer to 'AR_Appendix_Data_Tables' which can be found on the School Performance Reporting website.
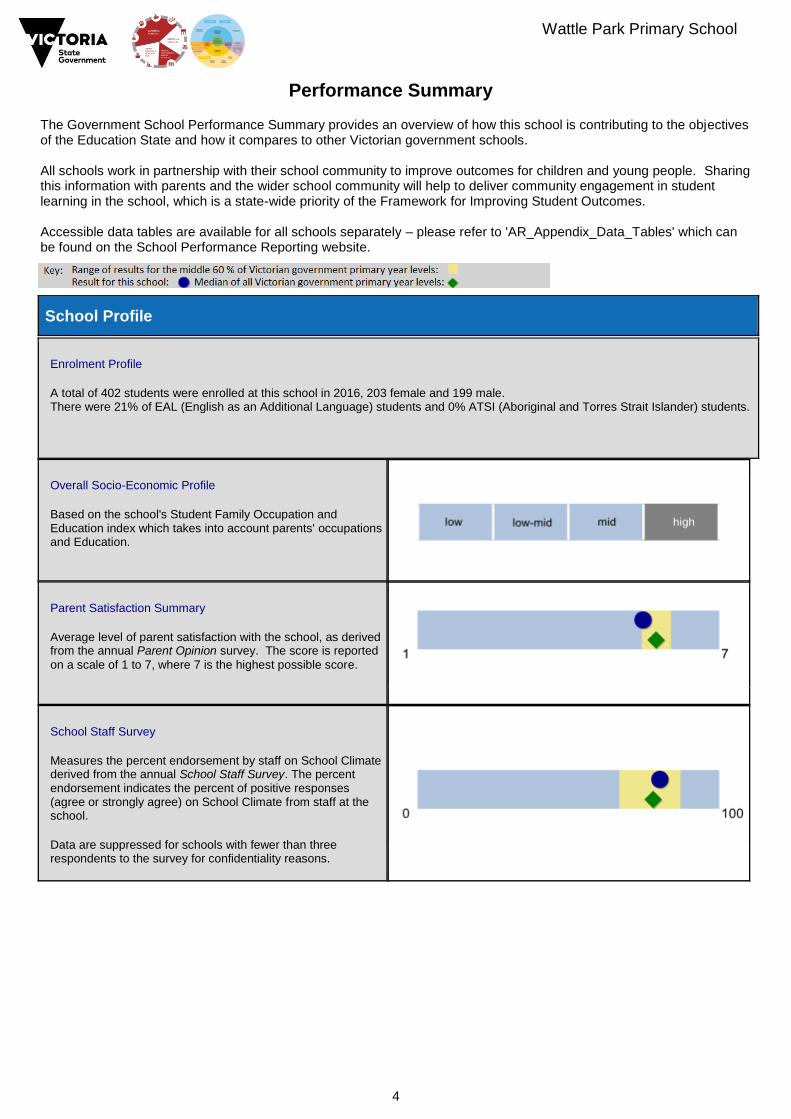
School Profile
Enrolment Profile A total of 402 students were enrolled at this school in 2016, 203 female and 199 male. There were 21% of EAL (English as an Additional Language) students and 0% ATSI (Aboriginal and Torres Strait Islander) students.
Overall Socio-Economic Profile Based on the school's Student Family Occupation and Education index which takes into account parents' occupations and Education.
Parent Satisfaction Summary Average level of parent satisfaction with the school, as derived from the annual Parent Opinion survey. The score is reported
on a scale of 1 to 7, where 7 is the highest possible score.
School Staff Survey Measures the percent endorsement by staff on School Climate derived from the annual School Staff Survey. The percent endorsement indicates the percent of positive responses (agree or strongly agree) on School Climate from staff at the school. Data are suppressed for schools with fewer than three respondents to the survey for confidentiality reasons.
Wattle Park Primary School
5
Performance Summary
Achievement
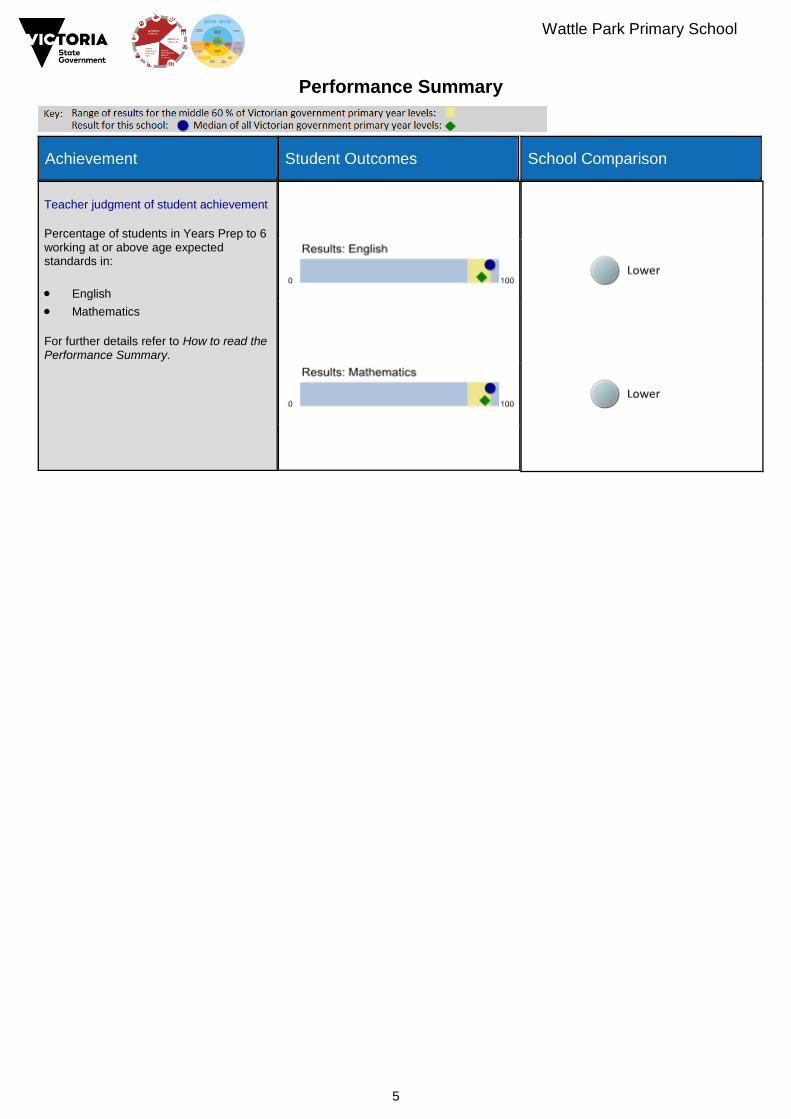
Teacher judgment of student achievement Percentage of students in Years Prep to 6 working at or above age expected standards in:
English
Mathematics
For further details refer to How to read the Performance Summary.
Student Outcomes
School Comparison
Wattle Park Primary School
6
Performance Summary
Achievement
Student Outcomes
School Comparison
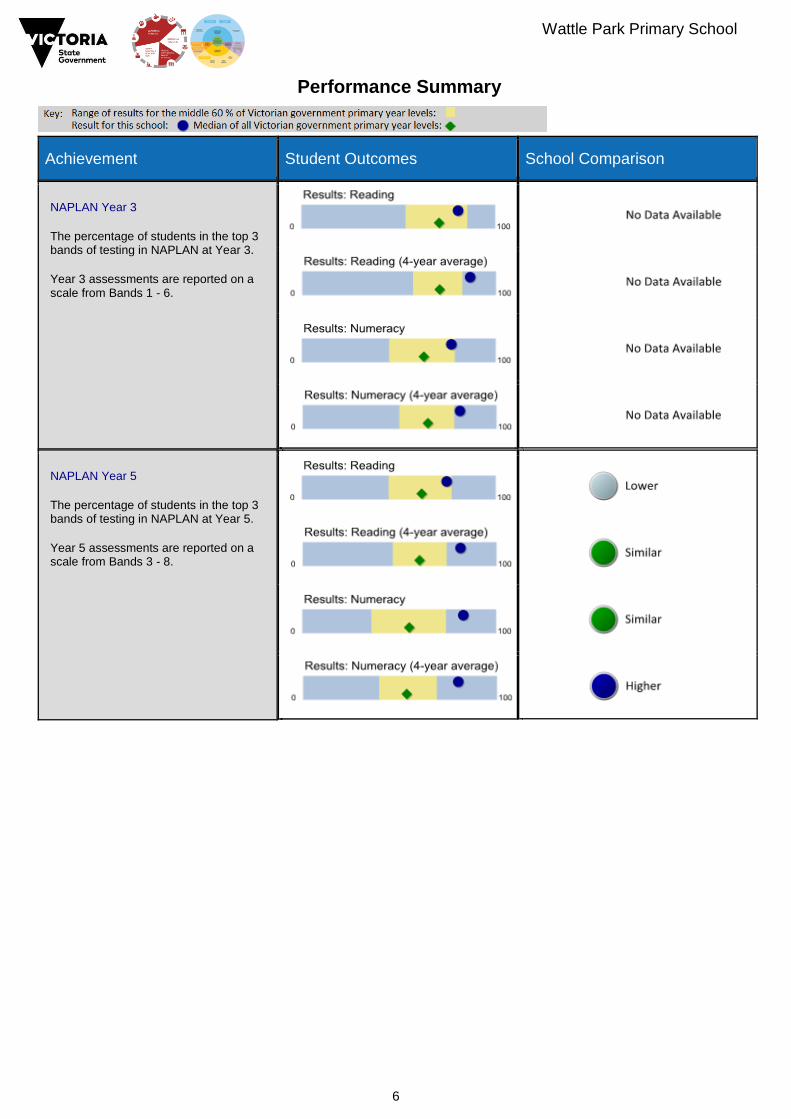
NAPLAN Year 3 The percentage of students in the top 3 bands of testing in NAPLAN at Year 3. Year 3 assessments are reported on a scale from Bands 1 - 6.
NAPLAN Year 5 The percentage of students in the top 3 bands of testing in NAPLAN at Year 5. Year 5 assessments are reported on a scale from Bands 3 - 8.

Wattle Park Primary School
7
Performance Summary
Achievement
Student Outcomes
School Comparison
NAPLAN Learning Gain Year 3 - Year 5 Learning gain of students from Year 3 to Year 5 in the following domains; Reading, Numeracy, Writing, Spelling and Grammar and Punctuation. NAPLAN learning gain is determined by comparing a student's current year result to the results of all ‘similar’ Victorian students (i.e. students in all sectors in the same year level who had the same score two years prior). If the current year result is in the top 25%, their gain level is categorised as ‘High’, middle 50%, is ‘Medium’ and bottom 25%, is ‘Low’.
NAPLAN Learning Gain does not require a School Comparison.
Wattle Park Primary School
8
Performance Summary
Engagement
Student Outcomes
School Comparison
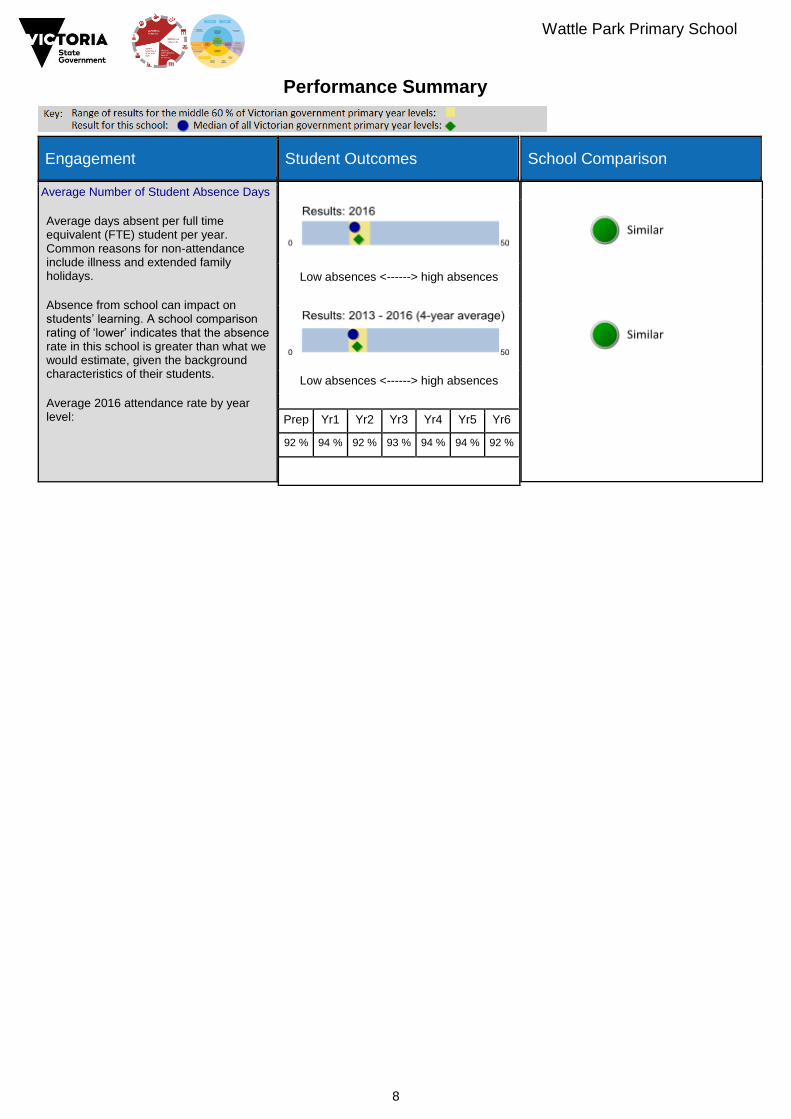
Average Number of Student Absence Days Average days absent per full time equivalent (FTE) student per year. Common reasons for non-attendance include illness and extended family holidays. Absence from school can impact on students’ learning. A school comparison rating of ‘lower’ indicates that the absence rate in this school is greater than what we would estimate, given the background characteristics of their students. Average 2016 attendance rate by year level:
Low absences <------> high absences
Low absences <------> high absences
Prep Yr1 Yr2 Yr3 Yr4 Yr5 Yr6
92 % 94 % 92 % 93 % 94 % 94 % 92 %
Wattle Park Primary School
9
Performance Summary
Wellbeing
Student Outcomes
School Comparison
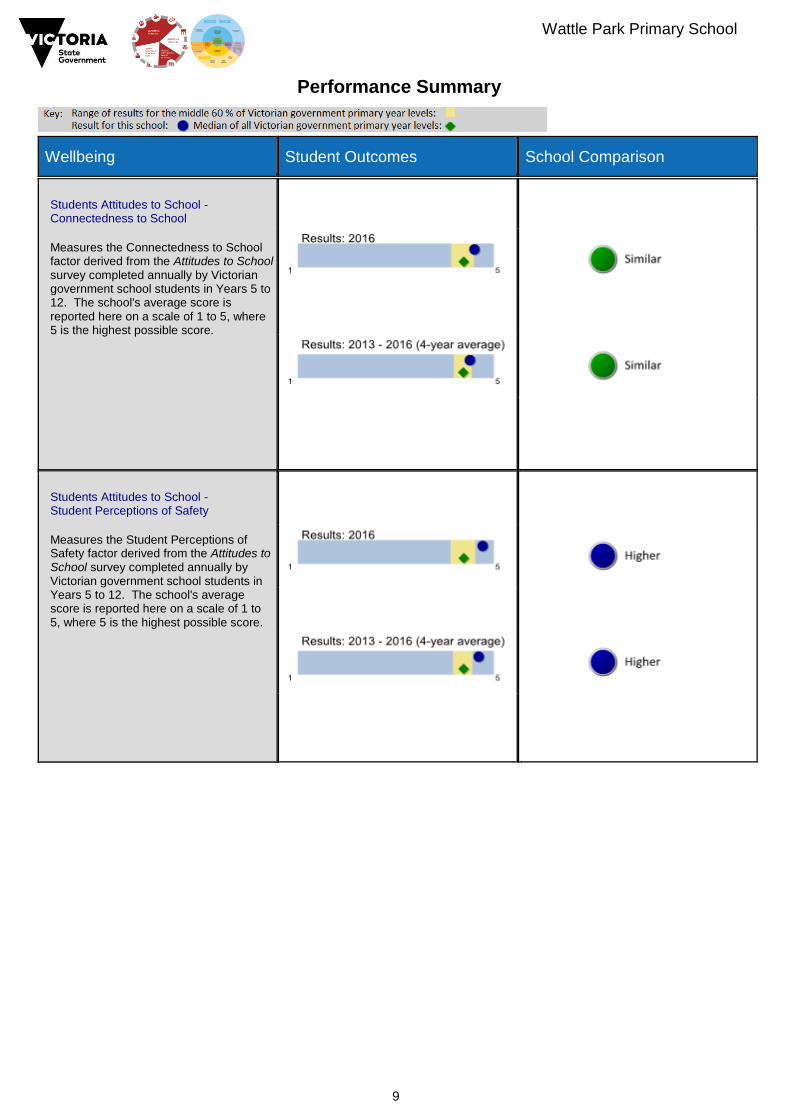
Students Attitudes to School - Connectedness to School Measures the Connectedness to School factor derived from the Attitudes to School survey completed annually by Victorian government school students in Years 5 to 12. The school's average score is reported here on a scale of 1 to 5, where 5 is the highest possible score.
Students Attitudes to School - Student Perceptions of Safety Measures the Student Perceptions of Safety factor derived from the Attitudes to School survey completed annually by Victorian government school students in Years 5 to 12. The school's average score is reported here on a scale of 1 to 5, where 5 is the highest possible score.

Wattle Park Primary School
10
How to read the Performance Summary
What are student outcomes? Student outcomes show the achievements of students in this school in English and Mathematics. They also show results in national literacy and numeracy tests and, for secondary colleges, the Victorian Certificate of Education (VCE) examinations. They provide important information about student attendance and engagement at school. For secondary, P-12 and specialist schools, the Performance Summary also provides information about how many students at this school go on to further studies or full-time work after leaving school. You can see these results for the latest year, as well as the average of the last four years (where available).
What is a School Comparison?
The School comparison is a way of comparing school performance that takes into account the different student intake characteristics of each school. A School comparison takes into account the school’s academic intake, the socio-economic background of students, the number of Aboriginal students, the number of non-English speaking and refugee students, the number of students with a disability, and the size and location of the school. The School comparison measures show that most schools are doing well and are achieving results that are ‘similar’ to what we
would estimate given the background characteristics of their students. Some schools are doing exceptionally well with the students they have, and have ‘higher’ performance. Some schools have ‘lower’ performance after taking into account their
students’ characteristics – these schools will receive targeted support to ensure that there is improvement.
Looking at both the student outcomes and school comparisons provides important information about what a school is doing well and the areas that require further improvement. More information on school comparison performance measures can be found at: http://www.education.vic.gov.au/school/principals/manage ment/pages/performreports.aspx
What is the meaning of ‘Data not available’?
For some schools, there are too few students to provide data. For other schools, there are no students at some levels, so school comparisons are not possible. Newly opened schools have only the latest year of data and no averages from previous years. The Department also recognises the unique circumstances of Specialist, Select Entry, English Language and Community Schools where school comparisons are not appropriate.
What is this school doing to improve?
All schools have a plan to improve outcomes for their students. The ‘About Our School’ statement provides a summary of this school’s improvement plan.
The Performance Summary also allows you to compare student outcomes for students at this school with the outcomes of students in all other Victorian government schools.
Additionally, NAPLAN learning gain charts are provided for each of the NAPLAN domains. These compare a student's current year NAPLAN result to the results of all ‘similar’ Victorian students (i.e. students in all sectors in the same year level who had the same NAPLAN score two years prior). If the current year result is in the top 25% their gain level is categorised as ‘High’, the middle 50% is categorised as ‘Medium’ and the bottom 25% is categorised as ‘Low’.
What are the changes in student achievement? The Victorian Curriculum F–10 has been developed to ensure that curriculum content and achievement standards enable continuous learning for all students, including, students with disabilities. The objectives of the Victorian Curriculum are the same for all students. The curriculum offers flexibility for teachers to tailor their teaching in ways that provide rigorous, relevant and engaging learning and assessment opportunities for students with disabilities. The ‘Towards Foundation Level Victorian Curriculum’ is integrated directly into the curriculum and is referred to as ‘Levels A to D’.
Wattle Park Primary School
11
Financial Performance and Position
Financial performance and position commentary
[Please refer to pg. 13 of the 2016 Annual Report Guidelines for information on how to complete the ‘Financial Performance and Position Commentary’ section]
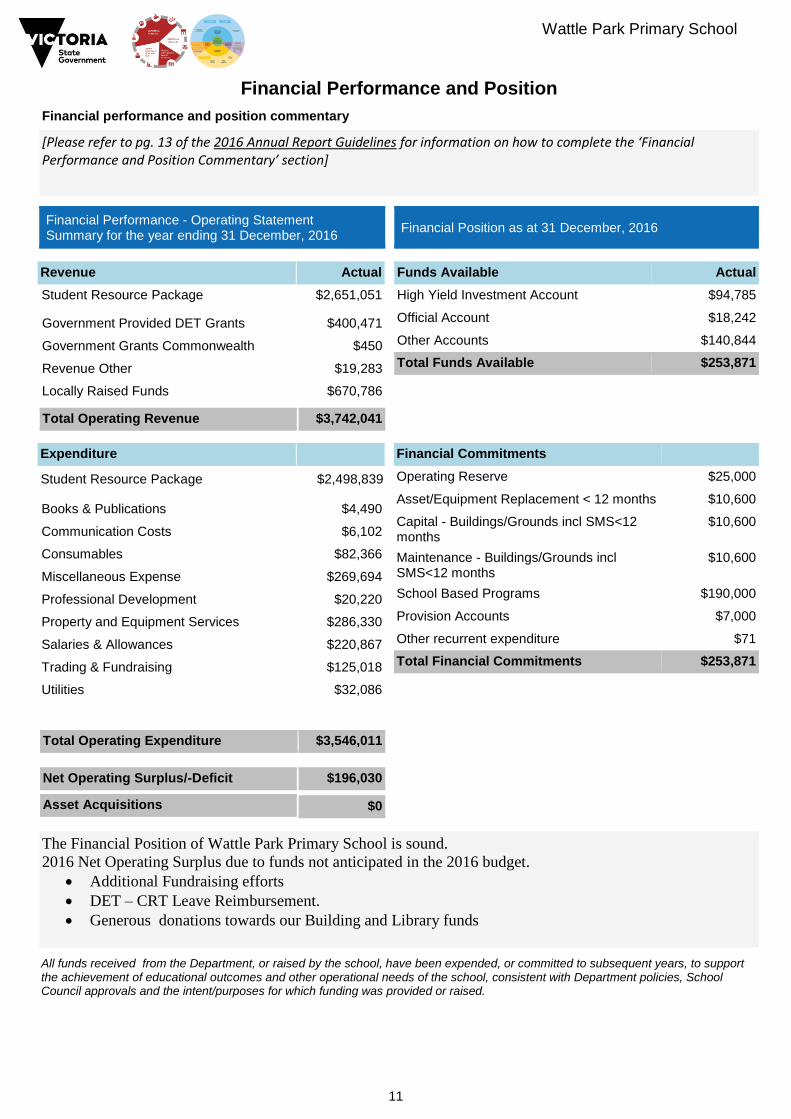
Financial Performance - Operating Statement Summary for the year ending 31 December, 2016
Financial Position as at 31 December, 2016
Revenue
Actual
Funds Available Actual
High Yield Investment Account $94,785
Official Account $18,242
Other Accounts $140,844
Total Funds Available $253,871
Student Resource Package
$2,651,051
Government Provided DET Grants $400,471
Government Grants Commonwealth $450
Revenue Other $19,283
Locally Raised Funds $670,786
Total Operating Revenue
$3,742,041
Expenditure
Financial Commitments
Operating Reserve $25,000
Asset/Equipment Replacement < 12 months $10,600
Capital - Buildings/Grounds incl SMS<12 months
$10,600
Maintenance - Buildings/Grounds incl SMS<12 months
$10,600
School Based Programs $190,000
Provision Accounts $7,000
Other recurrent expenditure $71
Total Financial Commitments $253,871
Student Resource Package
$2,498,839
Books & Publications $4,490
Communication Costs $6,102
Consumables $82,366
Miscellaneous Expense $269,694
Professional Development $20,220
Property and Equipment Services $286,330
Salaries & Allowances $220,867
Trading & Fundraising $125,018
Utilities $32,086
Total Operating Expenditure
$3,546,011
Net Operating Surplus/-Deficit
$196,030
Asset Acquisitions
$0
The Financial Position of Wattle Park Primary School is sound.
2016 Net Operating Surplus due to funds not anticipated in the 2016 budget.
Additional Fundraising efforts
DET – CRT Leave Reimbursement.
Generous donations towards our Building and Library funds
All funds received from the Department, or raised by the school, have been expended, or committed to subsequent years, to support the achievement of educational outcomes and other operational needs of the school, consistent with Department policies, School Council approvals and the intent/purposes for which funding was provided or raised.