2016 Annual Report -...
88
HOLDINGS CORPORATION 2016 Annual Report
Transcript of 2016 Annual Report -...
HOLDINGS CORPORATION
2016 Annual Report
Contents
Fairfax India Corporate Performance . . . . . . . . 1
Corporate Profile . . . . . . . . . . . . . . . . . . . . . . 2
Letter to Shareholders . . . . . . . . . . . . . . . . . . . 3
Management’s Responsibility for theConsolidated Financial Statements . . . . . . . . 18
Independent Auditor’s Report . . . . . . . . . . . . . 19
Fairfax India Consolidated Financial Statements . 20
Notes to Consolidated Financial Statements . . . 26
Management’s Discussion and Analysis ofFinancial Condition and Results of Operations 52
Corporate Information . . . . . . . . . . . . . . . . . . 85

8MAR201619315321HOLDINGS CORPORATION
2016 Annual Report
Fairfax India Corporate Performance(in US$ thousands, except as otherwise indicated)(1)
On January 30, 2015 Fairfax India Holdings Corporation subordinate voting shares began trading on theToronto Stock Exchange under the symbol FIH.U.
December 31, 2016 December 31, 2015Book value per share 10.25 9.50Closing share price(1) 11.55 10.10Income 128,604 65,251Net earnings 107,825 40,939Total assets 1,303,497 1,025,451Investments 1,095,569 978,569Common shareholders’ equity 1,075,446 1,013,329Shares outstanding(2) 104,881,031 106,678,879Net earnings per share 1.01 0.42
(1) All share references are to common shares; Closing share price is in U.S. dollars; per share amounts are in U.S. dollars.
(2) At December 31, 2016 includes 74,881,031 subordinate voting shares and 30,000,000 multiple voting shares (2015 –76,678,879 and 30,000,000, respectively).
1

FAIRFAX INDIA HOLDINGS CORPORATION
Corporate Profile
Fairfax India Holdings Corporation is an investment holding company whose objective is to achieve long termcapital appreciation, while preserving capital, by investing, either directly or through one of its wholly-ownedsubsidiaries, in public and private equity securities and debt instruments in India and Indian businesses or otherbusinesses with customers, suppliers or business primarily conducted in, or dependent on, India (‘‘IndianInvestments’’).
Indian Investments
National Collateral Management Services Limited (‘‘NCML’’) is a private agricultural commodities storagecompany headquartered in Gurgaon, India that operates in the agriculture value chain by offering end-to-endsolutions in grain procurement, testing, storage and collateral management. In 2016 NCML launched its wholly-owned subsidiary, NCML Finance Pvt. Ltd (‘‘NFin’’). NFin focuses on rural and agri-business finance. Additionalinformation can also be accessed from NCML’s website www.ncml.com.
IIFL Holdings Limited (‘‘IIFL’’) was incorporated in 1995 and is a publicly traded, diversified financial servicesholding company located in Mumbai, India with principal lines of business in a non-banking finance company,wealth management, and capital markets and other activities (comprised of retail broking, institutional equities,investment banking and financial products distribution). Additional information can also be accessed from IIFL’swebsite www.iifl.com.
Fairchem Speciality Limited (‘‘Fairchem’’, formerly known as Adi Finechem Limited) is a publicly traded,specialty chemical manufacturer located in Ahmedabad, India. Fairchem manufactures oleochemicals used in thepaints, inks and adhesives industries, as well as intermediate nutraceutical and health products. It has developed anin-house technology that uses machinery designed and manufactured by leading European companies to separateand convert waste generated during the production of soy, sunflower, corn and cotton oils into valuablenutraceutical and fatty acids. Additional information can also be accessed from Fairchem’s website www.fairchem.in.
Sanmar Chemicals Group (‘‘Sanmar’’), a private company, is one of the largest suspension Poly Vinyl Chloride(‘‘PVC’’) manufacturers in India, headquartered in Chennai, India with operational presence in India and Egypt.Additional information can also be accessed from Sanmar’s website www.sanmargroup.com.
Privi Organics Limited (‘‘Privi’’), a private company located in Mumbai, India, is a supplier of aroma chemicals tothe fragrance industry. Privi’s world-class products are the result of its very strong research and development teamthat has proven expertise in developing new products, customizing aromas per customer specifications, scaling upproducts from basic research to commercial scale, and designing process improvements to drive quality and costoptimization. A merger arrangement involving Fairchem and Privi is expected to occur by the end of the first quarterof 2017. Additional information can also be accessed from Privi’s website www.privi.com.
National Stock Exchange of India Limited (‘‘NSE’’), a private company located in Mumbai, India, is India’slargest stock exchange covering various cities and towns across the country. In addition to being a platform for allexchange traded financial products in India, NSE’s flagship index, Nifty50, is used extensively by investors in Indiaand around the world as a barometer of the Indian capital markets. Additional information can also be accessed fromNSE’s website www.nseindia.com.
Saurashtra Freight Private Limited (‘‘Saurashtra’’), a private company located in Mumbai, India, owns thelargest container freight station at Mundra port (Gujarat), the second largest and fastest growing port in India. Thecontainer freight station business provides services such as moving of containers to and from the port,stuffing/destuffing of containers, cargo storage and transportation of cargo to the end customer as well as the storage,maintenance and repair of empty containers. Additional information can also be assessed from Saurashtra’s websitewww.saurashtracontainers.com.
2
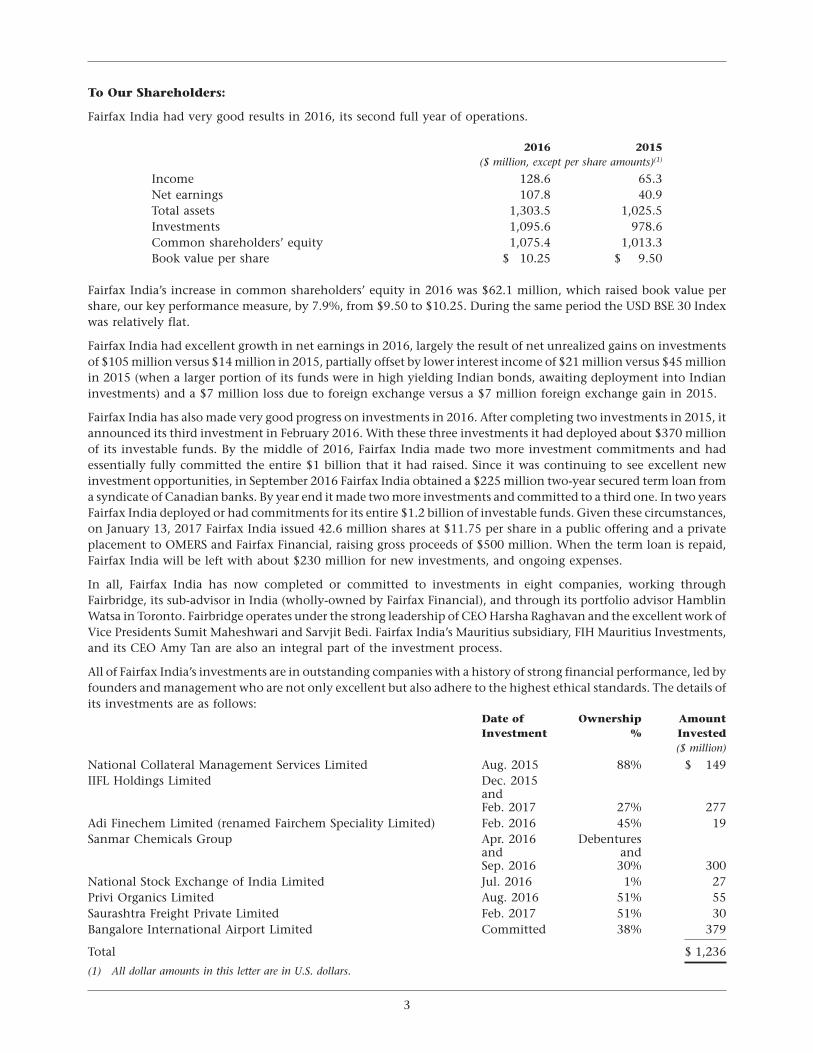
To Our Shareholders:
Fairfax India had very good results in 2016, its second full year of operations.
2016 2015($ million, except per share amounts)(1)
Income 128.6 65.3Net earnings 107.8 40.9Total assets 1,303.5 1,025.5Investments 1,095.6 978.6Common shareholders’ equity 1,075.4 1,013.3Book value per share $ 10.25 $ 9.50
Fairfax India’s increase in common shareholders’ equity in 2016 was $62.1 million, which raised book value pershare, our key performance measure, by 7.9%, from $9.50 to $10.25. During the same period the USD BSE 30 Indexwas relatively flat.
Fairfax India had excellent growth in net earnings in 2016, largely the result of net unrealized gains on investmentsof $105 million versus $14 million in 2015, partially offset by lower interest income of $21 million versus $45 millionin 2015 (when a larger portion of its funds were in high yielding Indian bonds, awaiting deployment into Indianinvestments) and a $7 million loss due to foreign exchange versus a $7 million foreign exchange gain in 2015.
Fairfax India has also made very good progress on investments in 2016. After completing two investments in 2015, itannounced its third investment in February 2016. With these three investments it had deployed about $370 millionof its investable funds. By the middle of 2016, Fairfax India made two more investment commitments and hadessentially fully committed the entire $1 billion that it had raised. Since it was continuing to see excellent newinvestment opportunities, in September 2016 Fairfax India obtained a $225 million two-year secured term loan froma syndicate of Canadian banks. By year end it made two more investments and committed to a third one. In two yearsFairfax India deployed or had commitments for its entire $1.2 billion of investable funds. Given these circumstances,on January 13, 2017 Fairfax India issued 42.6 million shares at $11.75 per share in a public offering and a privateplacement to OMERS and Fairfax Financial, raising gross proceeds of $500 million. When the term loan is repaid,Fairfax India will be left with about $230 million for new investments, and ongoing expenses.
In all, Fairfax India has now completed or committed to investments in eight companies, working throughFairbridge, its sub-advisor in India (wholly-owned by Fairfax Financial), and through its portfolio advisor HamblinWatsa in Toronto. Fairbridge operates under the strong leadership of CEO Harsha Raghavan and the excellent work ofVice Presidents Sumit Maheshwari and Sarvjit Bedi. Fairfax India’s Mauritius subsidiary, FIH Mauritius Investments,and its CEO Amy Tan are also an integral part of the investment process.
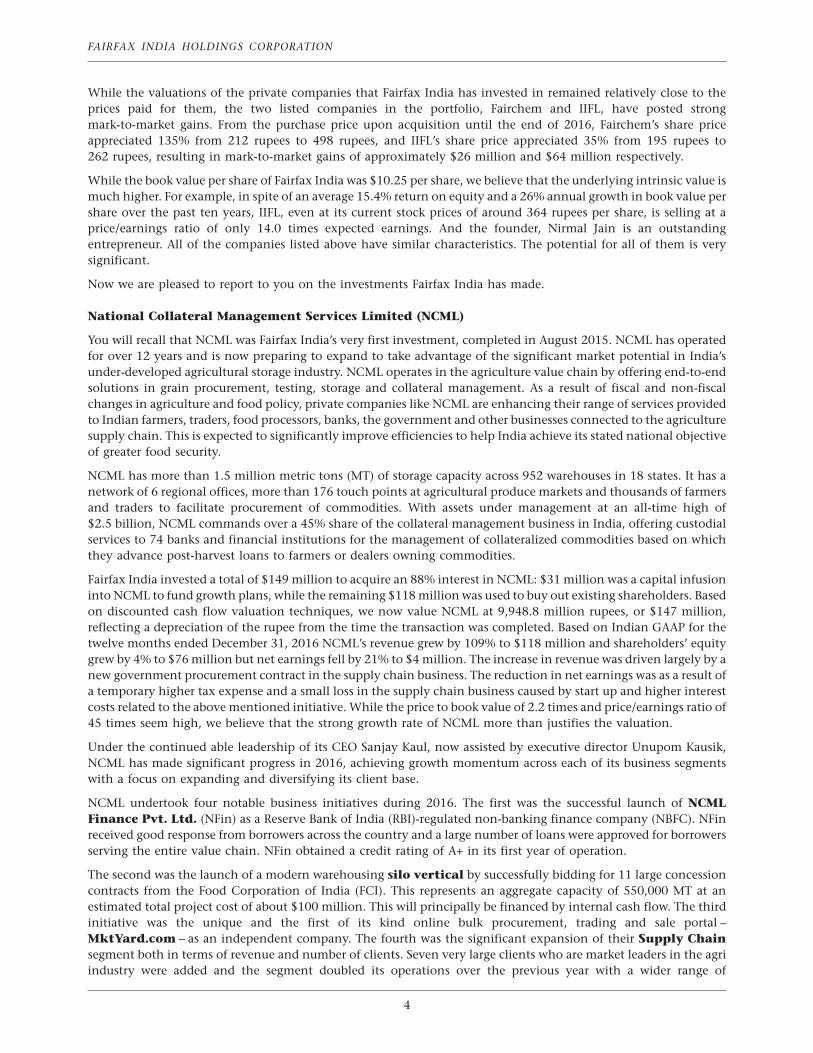
All of Fairfax India’s investments are in outstanding companies with a history of strong financial performance, led byfounders and management who are not only excellent but also adhere to the highest ethical standards. The details ofits investments are as follows:
Date of Ownership AmountInvestment % Invested
($ million)
National Collateral Management Services Limited Aug. 2015 88% $ 149IIFL Holdings Limited Dec. 2015
andFeb. 2017 27% 277
Adi Finechem Limited (renamed Fairchem Speciality Limited) Feb. 2016 45% 19Sanmar Chemicals Group Apr. 2016 Debentures
and andSep. 2016 30% 300
National Stock Exchange of India Limited Jul. 2016 1% 27Privi Organics Limited Aug. 2016 51% 55Saurashtra Freight Private Limited Feb. 2017 51% 30Bangalore International Airport Limited Committed 38% 379
Total $ 1,236
(1) All dollar amounts in this letter are in U.S. dollars.
3
FAIRFAX INDIA HOLDINGS CORPORATION
While the valuations of the private companies that Fairfax India has invested in remained relatively close to theprices paid for them, the two listed companies in the portfolio, Fairchem and IIFL, have posted strongmark-to-market gains. From the purchase price upon acquisition until the end of 2016, Fairchem’s share priceappreciated 135% from 212 rupees to 498 rupees, and IIFL’s share price appreciated 35% from 195 rupees to262 rupees, resulting in mark-to-market gains of approximately $26 million and $64 million respectively.
While the book value per share of Fairfax India was $10.25 per share, we believe that the underlying intrinsic value ismuch higher. For example, in spite of an average 15.4% return on equity and a 26% annual growth in book value pershare over the past ten years, IIFL, even at its current stock prices of around 364 rupees per share, is selling at aprice/earnings ratio of only 14.0 times expected earnings. And the founder, Nirmal Jain is an outstandingentrepreneur. All of the companies listed above have similar characteristics. The potential for all of them is verysignificant.
Now we are pleased to report to you on the investments Fairfax India has made.
National Collateral Management Services Limited (NCML)
You will recall that NCML was Fairfax India’s very first investment, completed in August 2015. NCML has operatedfor over 12 years and is now preparing to expand to take advantage of the significant market potential in India’sunder-developed agricultural storage industry. NCML operates in the agriculture value chain by offering end-to-endsolutions in grain procurement, testing, storage and collateral management. As a result of fiscal and non-fiscalchanges in agriculture and food policy, private companies like NCML are enhancing their range of services providedto Indian farmers, traders, food processors, banks, the government and other businesses connected to the agriculturesupply chain. This is expected to significantly improve efficiencies to help India achieve its stated national objectiveof greater food security.
NCML has more than 1.5 million metric tons (MT) of storage capacity across 952 warehouses in 18 states. It has anetwork of 6 regional offices, more than 176 touch points at agricultural produce markets and thousands of farmersand traders to facilitate procurement of commodities. With assets under management at an all-time high of$2.5 billion, NCML commands over a 45% share of the collateral management business in India, offering custodialservices to 74 banks and financial institutions for the management of collateralized commodities based on whichthey advance post-harvest loans to farmers or dealers owning commodities.
Fairfax India invested a total of $149 million to acquire an 88% interest in NCML: $31 million was a capital infusioninto NCML to fund growth plans, while the remaining $118 million was used to buy out existing shareholders. Basedon discounted cash flow valuation techniques, we now value NCML at 9,948.8 million rupees, or $147 million,reflecting a depreciation of the rupee from the time the transaction was completed. Based on Indian GAAP for thetwelve months ended December 31, 2016 NCML’s revenue grew by 109% to $118 million and shareholders’ equitygrew by 4% to $76 million but net earnings fell by 21% to $4 million. The increase in revenue was driven largely by anew government procurement contract in the supply chain business. The reduction in net earnings was as a result ofa temporary higher tax expense and a small loss in the supply chain business caused by start up and higher interestcosts related to the above mentioned initiative. While the price to book value of 2.2 times and price/earnings ratio of45 times seem high, we believe that the strong growth rate of NCML more than justifies the valuation.
Under the continued able leadership of its CEO Sanjay Kaul, now assisted by executive director Unupom Kausik,NCML has made significant progress in 2016, achieving growth momentum across each of its business segmentswith a focus on expanding and diversifying its client base.
NCML undertook four notable business initiatives during 2016. The first was the successful launch of NCMLFinance Pvt. Ltd. (NFin) as a Reserve Bank of India (RBI)-regulated non-banking finance company (NBFC). NFinreceived good response from borrowers across the country and a large number of loans were approved for borrowersserving the entire value chain. NFin obtained a credit rating of A+ in its first year of operation.
The second was the launch of a modern warehousing silo vertical by successfully bidding for 11 large concessioncontracts from the Food Corporation of India (FCI). This represents an aggregate capacity of 550,000 MT at anestimated total project cost of about $100 million. This will principally be financed by internal cash flow. The thirdinitiative was the unique and the first of its kind online bulk procurement, trading and sale portal –MktYard.com – as an independent company. The fourth was the significant expansion of their Supply Chainsegment both in terms of revenue and number of clients. Seven very large clients who are market leaders in the agriindustry were added and the segment doubled its operations over the previous year with a wider range of
4

commodities and geographical coverage. The division launched structured trade facilities at port locations toparticipate in international trade opportunities.
The warehousing business enhanced capacity by the addition of 100,000 MT during the year and work on its singlelargest silo facility of 38,000 MT, for maize is nearing completion. In all, this was an excellent year for NCML.
IIFL Holdings Limited (IIFL)
In December 2015 Fairfax India successfully completed an open offer for IIFL and purchased 21.9% of its sharesoutstanding at 195 rupees ($2.93) per share for a total consideration of $202 million. At 195 rupees per share, webought our position at a trailing price/earnings ratio of 12.9 times, price to book value of 2.0 times and dividend yieldof 1.5%.
At year end 2016 IIFL shares closed at a price of 262 rupees per share resulting in an unrealized gain of 35% in rupeeterms. It is trading at around 364 rupees per share and in spite of a 15.4% return on equity and a 26% annual growthin book value per share over the past 10 years, IIFL is selling at a price/earnings ratio of 14.0 times expected earnings.
Fairfax Financial has known IIFL for over a decade and been a shareholder of IIFL since 2010, owning a direct interestof 8.9% and an indirect interest through P Notes of 5.2%. One of us (Chandran) has been on the Board of IIFLsince 2012.
In February 2017 Fairfax India purchased 15,853,000 shares of IIFL while at the same time Fairfax Financial divestedits economic interest in an equivalent number of shares that it held as P Notes. This was done for several reasons:
• Over time Fairfax Financial would prefer to have all of its Indian investments (as far as possible) in FairfaxIndia with the exception of Thomas Cook and its subsidiaries, Quantum Advisors and ICICI Lombard GeneralInsurance Company Limited.
• Even at 319 rupees per share, the price/earnings ratio is 12.3 times expected earnings and represents excellentlong term value for Fairfax India.
As a result, Fairfax India now owns 26.7% of IIFL.
Based on Indian GAAP, for the 12 months ended December 31, 2016, IIFL revenues grew 15% to $688 million, netearnings after minority interest grew 26% to $95 million, and shareholders’ equity grew 47.6% to $650 million,generating an ROE of 14.6%.
IIFL is a well-established national financial services company serving over 3.5 million customers from 2,250 servicelocations and over 1,000 branches across India. It has an international presence with offices in New York, London,Geneva, Singapore, Hong Kong, Dubai and Mauritius. In addition to the founding team, IIFL now has a highlyqualified and experienced management team driven by pride and reward of ownership. Again in 2016 under theexceptional leadership of Nirmal Jain and R. Venkataraman, IIFL achieved outstanding results in each of its threefollowing major business divisions.
NBFC: This division successfully diversified its lending by adding a retail-focused loan portfolio. Loan assets undermanagement grew 15% over the previous year to approximately $3 billion. The portfolio continued to move towardsa superior loan mix by reducing its share of relatively higher risk loans to capital markets and construction financeand increasing its share of lower risk retail mortgage loans. Retail mortgages now constitute 52% of the portfolio at$1.6 billion. Asset quality was maintained with net nonperforming assets at 0.65%.
This division acquired management and control of Samasta Microfinance Limited, a Bangalore based NBFC, a microfinance institution registered with the RBI. This acquisition is consistent with IIFL’s strategy of focusing on smallticket retail credit to under-served geographies and segments.
IIFL has made very significant progress on its objective of achieving end-to-end digital interface with the increasingadoption of mobile and tablet technology. All loan products are now live with tablet-based sourcing modules. IIFL isthe first mover to offer eSign facilities to customers for end-to-end paperless transactions in all their goldloan branches.
In September 2016 CDC, the UK government-sponsored private equity fund, invested $150 million forapproximately a 15% stake in the NBFC, valuing just this division at about $1 billion while the entire company wastrading in the public markets at a valuation of $1.3 billion.
5

FAIRFAX INDIA HOLDINGS CORPORATION
Wealth Management: IIFL Wealth has emerged as one of the leading wealth managers in India with assets undermanagement, advice and distribution of about $16 billion, having grown 22% this year. It offers advisory services,wealth structuring solutions, asset management and distribution services to high net worth families. IIFL WealthNBFC, which commenced operations in February 2016, mostly offers loans against securities to a high net-worthclientele and has a loan book of about $430 million.
Capital markets and other activities: This is a collection of several businesses, including retail andinstitutional stock broking, financial products distribution, mutual fund management and investment banking. Thebroking business is a leader in its field and provides broking and advisory services to retail and institutional clients. Itis well known for its high quality and innovative research and it covers over 500 Indian companies.
The highlight for the year in this division was the landmark performance of the investment banking division that forthe 9 months ended December 31, 2016 completed 16 investment banking transactions including 5 IPOs. IIFL isamong the top 5 investment banks in the country in terms of the number of equity IPOs completed.
The IIFL Markets App is highly rated and the most downloaded with over 800,000 downloads on Google Play Store.The app is accessed by retail investors across 1,500 locations in India. With the growth of mobile networks in remotelocations, do it yourself (DIY) mobile trading forms over 30% of clients and has reduced the information asymmetryof financial markets in Tier 2 locations in India.
Despite this stellar performance, the folks at IIFL are not resting on their laurels. They have formidable objectives:
• To double IIFL’s consolidated revenues by fiscal year 2020 and, driven by margin improvement and scalebenefits, to grow net profit after minority interests by 2.5 times. They hope to reduce IIFL’s current borrowingcosts as a result of improving credit ratings.
• To reduce cyclicality and volatility in IIFL’s earnings. IIFL has a healthy mix of steady businesses, namelyconsumer finance and wealth, overlaid with fee income from the relatively volatile capital markets. Onconsumer finance, the focus is to serve retail customers digitally as far as possible.
• To de-risk the business model through multiple revenue streams from various businesses catering to varioussub-segments of customers. To achieve this, IIFL has diversified its loan book in terms of products andgeography, helping to provide insulation against concentration risk. IIFL will continue to work on improvingits best in class risk management framework and analytics to monitor risk.
The key challenges faced by IIFL in 2016 were:
• Demonetization announced by the Government in November has affected revenues in the short term. Due toits continued focus on and investments in digitization, IIFL was able to mitigate the impact of demonetizationbecause it had a ready platform to conveniently accept cashless payments from customers, the ability to makecollections through tablets and a self-help portal for quick query resolution.
• IIFL faced increased competition, particularly in the housing finance sector which is witnessing the entry of alarge number of new entrants, most of them backed by private equity. This might lead to irrational pricing inthe short term. Given IIFL’s distribution reach and capital adequacy, it believes it can withstand such shortterm pricing pressures. In any case, IIFL will not take undue risks to increase short term market share.
Overall, 2016 was an outstanding year for IIFL.
Fairchem Speciality Limited (formerly Adi Finechem Limited) (Fairchem)
On February 8, 2016 Fairfax India purchased 45% of Fairchem for 212 rupees ($3.13) per share for a totalconsideration of $19 million. The price of 212 rupees per share represented a price/earnings ratio of 12.7 timesforward earnings for a company with a 20% annual growth in earnings per share over the last 10 years.
At the end of 2016 Fairchem shares closed at a price of 498 rupees per share, an increase of 135%. It is likely that theshare price increase is primarily the result of the pending merger between Fairchem and Privi Organics Limited, acompany in which Fairfax India invested, in August 2016, $55 million for a 51% interest. We describe the Priviacquisition later in this letter.
Based on Indian GAAP, for the 12 months ended December 31, 2016, Fairchem revenues grew 17% to $26 million,net earnings were flat at $2 million, and shareholders’ equity grew 11% to $10 million, generating an ROE of 18.2%.
6

Fairchem made significant plant upgrades and modifications in 2016 as described below, and is now entering a phasewhere we expect very significant growth in revenue and profits.
Fairchem is an oleochemicals company. Oleochemicals are, broadly, chemicals that are derived from plant or animalfat, which can be used for making both edible products and non-edible products. In recent years the production ofoleochemicals has been moving from the U.S. and Europe to Asian countries because of the local availability of keyraw materials.
Fairchem occupies a unique niche in this large global playing field. It has developed an in-house technology that usesmachinery manufactured by leading European companies to convert waste generated during the production of soy,sunflower, corn and cotton oils into valuable chemicals. These chemicals include acids that go into non-edibleproducts like soaps, detergents, personal care products, paints, and other products that are used in the manufactureof health foods and vitamin E. The company’s customers include major multinational companies including BASF,Archer Daniels Midland, Cargill, Advanced Organic Materials, IFFCO Chemicals and Asian Paints. Fairchem operatesout of a single plant in Ahmedabad, the largest city in Gujarat, the home state of Prime Minister Modi. It has one ofthe largest processing capacities for natural soft oil-based fatty acids in India. Over the last ten years, Fairchem’s saleshave grown at 23% per year to $26 million, and net earnings have grown at 24% per year to $2 million with a returnon equity over 20%.
In 2016, Fairchem developed a strong business relationship with a new U.S. based customer as the customer wasemerging as a dominant player in the natural tocopherols, natural vitamin E and sterols markets. To avoid anyproduct rejection, a joint detailed process and equipment audit was completed, which resulted in plant upgrades andmodifications. Fairchem successfully started supplying to the U.S. based customer in October 2016, but the plantupgrades and modifications resulted in production losses and increased capital expenditures that negativelyimpacted Fairchem’s net earnings during 2016.
The Indian vegetable oil market is growing at more than 10% per annum, resulting in increased availability of theraw materials required for Fairchem. At the same time, the paints and printing ink industry is also expected to grow atmore than 10% per year, enabling it to absorb a higher volume of Fairchem’s products. In order to capitalize on thisopportunity and to improve plant efficiency and capacity utilization, Fairchem has embarked on a capitalexpenditure (Capex) project that will achieve energy savings and full capacity utilization by March 2017. The Capexproject will also debottleneck the manufacturing facility and achieve a 33% increase in production within two years.The Capex project should help improve both top and bottom lines.
Privi Organics Limited (Privi)
Founded in 1992 by two life-long friends, Mahesh Babani and D.B. Rao, Privi is one of India’s leading manufacturersof aroma chemicals such as Amber Fleur, Dihydromyrcenol (citrus character) and Sandal Touch. Privi startedmanufacturing aroma chemicals with only two products, which it gradually expanded to a range of over 50 productstoday, with a capacity of over 22,000 tonnes per annum. Its products are used as fragrance additives in perfumes,soaps, shampoos and packaged food. Privi enjoys a dominant position and economies of scale in its productcategories. Privi also develops and produces custom-made aroma chemicals to specific requirements of its customers.Privi sources most of its raw materials, gum turpentine oil (GTO) and crude sulfate turpentine (CST) from pulp andpaper companies globally and competes primarily with pure play and niche suppliers such as IFF, DRTand Renessenz.
One of Privi’s significant strengths is its established research and development (R&D) capabilities in aromachemicals, with a staff of 60 people, comprised of PhDs in chemistry, chemical engineers and instrumentationengineers. The research specialists continuously strive to develop new products and processes. Importantly, one ofthe R&D labs is completely focused on developing, through biotechnology, green products and green technologies intechnical collaboration with the University Institute of Chemical Technology, Mumbai.
Privi enjoys many advantages in its business:
• It has a formidable presence in the aroma chemicals industry and is one of the leading producers of aromachemicals in the world, with a sizable global market share in most of the products it manufactures. It is ontrack to be among the top 10 global players in aroma chemicals by 2018.
7

FAIRFAX INDIA HOLDINGS CORPORATION
• Both Mahesh Babani and D.B. Rao have over two decades of hands-on experience, deep business relationshipsand a strong vision for the business. They are supported by a talented and professional management team withrich industry experience.
• Privi achieved revenue and net profit CAGR of 18% and 12% respectively over the last 10 years and a return onequity of 9% and expects to double its revenue by 2018 generating 16% EBITDA margins.
• By being based in India, Privi has inherent cost advantages both in terms of cheaper manpower formanufacturing and access to quality R&D talent at competitive costs.
• Privi is less susceptible to competition because it is backward integrated for key raw materials, giving it an edgeon product pricing and the ability to enter into long term contracts. Process know-how, developed in-houseand continuously refined through R&D initiatives over the years, and cost-efficient manufacturing create astrong competitive advantage over other international or domestic players.
Privi is a trusted supplier to all of the top 10 fragrance companies, which control about 80% of the global fragrancemarket. Privi enjoys long term relationships with these fragrance companies with increasing customer engagementover the years. Their major customers are Givaudan, Fermenich, Symrise, P&G, Henkel, Aromor, Lluch, SH Kelkar,Ashapura and Drom. In order to strengthen its business model and to drive growth, Privi also has direct relationshipswith global consumer goods giants that are the end-users of its products.
Privi operates out of two state-of-the-art manufacturing plants located at Mahad (about 175 km south of Mumbai).Both the plants have dedicated facilities enabling continuous processing for all the key products, which ultimatelyresults in cost efficiency for the entire production system. Both the plants also enjoy significant cost and logisticsadvantages because of consistent and on-time deliveries to customers, resulting from the plants’ proximity to theMumbai port (JNPT). One of the plants also enjoys certain tax benefits because of its ‘Export Oriented Unit’ status.
Privi overcame some significant issues in 2016 and stands poised for a bright future. Low crude oil prices and aslowdown in China resulted in pricing pressures for the worldwide chemicals industry. Despite this, Privi was able tomaintain the previous year’s revenue with a nominal increase in EBIDTA and net earnings. The abnormal delay inreceiving permissions from the environment ministry restricted current year growth as the permission was receivedafter the yearly contracts for some customers for certain products were closed, but with better control of currentassets, particularly inventories, net operating cash flow has improved.
In August 2016 Fairfax India purchased 51% of Privi for $55 million. This was comprised of a 30% secondary stakepurchase from selling shareholders for $33 million and a capital injection of $22 million into Privi for a 21% stake.Based on 2017 projections, we value Privi as follows: price/earnings ratio of 21.9 times and price to book value of1.9 times. At the end of 2016, Fairfax India’s investment in Privi was valued at cost, since there were no changes toPrivi’s business and capital structure from the time of the transaction.
Additionally, the Boards of Directors of Fairchem and Privi approved a merger of the two companies to build anIndian specialty chemicals enterprise, with both companies converting renewable waste feed-stocks into value-added specialty chemicals. The merger will bring significant diversification and synergies to both partners, withFairchem gaining access to high quality R&D facilities, and Privi benefiting from Fairchem’s focus on costoptimization and capital efficiency. Fairfax India had acquired a 45% equity ownership in Fairchem in the firstquarter of 2016. Under the terms of the merger, the Privi shareholders will receive 27 common equity shares and27 compulsorily convertible preference shares of the merged entity for every 40 Privi shares exchanged (swap ratio of1.35:1). The swap ratio was as recommended in a valuation report issued by M/s. Walker Chandiok & Co. LLP,independent chartered accountants (a member firm of Grant Thornton in India). ICICI Securities Limited issued afairness opinion on the swap ratio. After the merger, Fairfax India will own approximately 49% in the mergedbusiness. The merger has been approved by shareholders of Fairchem and Privi and the Mumbai High Court and willbe effective by March 31, 2017. After the merger, Fairchem and Privi will continue to operate as distinct andindependent business units, run by Nahoosh Jariwala and Mahesh Babani respectively.
We prepared a valuation for Privi based on the year-end closing price of Fairchem and the swap ratio. This indicatedthat Privi’s value would be $94 million, resulting in an unrealized gain of $40 million or 73%. However, since themerger was still pending at the end of 2016, the unrealized gain was not recognized in our financial statements.Starting in the first quarter of 2017, our investment in the merged entity Fairchem (Fairchem and Privi) will be valuedbased on the quarter end closing price of the public company, Fairchem.
8

Sanmar Chemicals Group (Sanmar)
Fifty years ago, when we arrived in Madras (now Chennai) to start our college education at IIT Madras, cricket, whilepopular, was not the lucrative business it is today. Players were not paid to play and had to depend on thebenevolence of business houses and government companies for their livelihood. Sanmar and its owners were bigsupporters of the sport and the players fifty years ago even as they are today. They are a highly ethical and exemplarycorporate citizen today as they were then.
In August 2015 when we met N. Sankar, the chairman, and his son Vijay, the deputy chairman, Sanmar had growninto a large private conglomerate with sales of around $1 billion and an asset base of around $1.5 billion. Founded inthe early sixties, its business interests spanned chemicals, engineering technology and shipping, with operations inIndia, the Middle East and the Americas. Fairfax India’s investment is in the chemicals business, which constitutesmore than 80% of the group’s operations and is housed within three operating companies, two in India, ChemplastSanmar (Chemplast) and Sanmar Specialty Chemicals (SSCL), and one in Egypt, TCI Sanmar (TCI).
Chemplast is Sanmar’s flagship Indian company and has been in the chemicals business for 40 years. N. Sankar isconsidered a pioneer in the poly vinyl chloride (PVC) industry in India. With his visionary leadership, in 2009Chemplast commissioned one of the largest greenfield PVC projects in India with an annual capacity of200 thousand tons per annum (ktpa) which has been enhanced to 300 ktpa, mainly through process improvementsand minor debottlenecking, with an additional investment of only around $1 million. The aggregate PVC capacity ofChemplast is 360 ktpa, making it the second largest PVC player in India. Chemplast is also the only specialty PVCcompany in India.
Sanmar acquired TCI in 2007, with the intention of setting up a large greenfield PVC plant in Egypt to cater to thehigh growth markets of North Africa, the Middle East and parts of Europe. TCI currently operates a 200 ktpa plant butonly produces about 130 ktpa. TCI plans to undertake a $200 million expansion as follows:
• Phase 1 ($20 million): Debottlenecking of the existing PVC plant by replacing the PVC dryer which willincrease production from 130 ktpa to 200 ktpa. Replacement of the dryer has been completed and the capacityis being ramped up gradually.
• Phase 2 ($180 million): Addition of a new 200 ktpa PVC plant and a 130 ktpa calcium chloride plant. Inaddition, a 75 ktpa caustic soda by-product line will also be commissioned. This is expected to be completed in2018 and the ramp-up to full production is expected to take two years thereafter. Thus, full capacity is expectedto be attained by 2020. This will take advantage of Sanmar’s significant investment and infrastructurein Egypt.
Our analysis of the PVC industry going back about 25 years indicates that:
1. PVC sales are highly correlated with GDP growth. The auto, housing and construction sectors (key products:pipes and windows) are key drivers of this demand. TCI Sanmar’s key market areas of India, Egypt andTurkey are expected to see strong GDP growth and Sanmar has significant cost advantages supplying thesecountries.
2. PVC margins are not correlated to the price of crude oil or most other commodities.
In 2016 Fairfax India agreed to lend to Sanmar the rupee equivalent of $300 million by way of non-convertible-debentures (NCDs) for a period of 7 years. The NCDs pay a 3% payment-in-kind (PIK) interest and pay a redemptionpremium such that the yield of the NCD is 13%. In addition, for $1 million Fairfax India received a 30% equityinterest in Sanmar’s chemicals business. Fairfax India funded the initial tranche of $250 million in April 2016 and thesecond tranche of $50 million in September 2016.
9

FAIRFAX INDIA HOLDINGS CORPORATION
From the proceeds of the NCDs, Sanmar plans to utilize $80 million for capital expenditures at Chemplast (India),$111 million to repay a loan from private equity firm, KKR and $109 million to repay other Indian bank loans. At thesame time, TCI is entering into an agreement with these Indian banks for a term loan for $280 million to fundits expansion.
Based on conservative discounted cash flow and option pricing model valuation techniques, we believe that thevalue of our loan to Sanmar is now $299 million and the value of our 30% equity in Sanmar’s chemical business is$0.4 million. Based on Indian GAAP for the twelve months ended March 31, 2016 Sanmar’s revenues grew by 1% to$545 million. Until Sanmar completes its capital projects in Egypt and sales ramp up to full capacity, it will losemoney. Net loss in 2016 was $90 million, the same as in 2015. However, earnings before income tax, depreciationand amortization (EBITDA) for 2016 increased 98% to $65 million. We expect over time to make a compound annualreturn on this investment in excess of 20%.
There have been some significant developments for Sanmar since our investment. For the first time in a decade,optimism returned to the global PVC industry. This was due to reduced levels of production in China and Europenecessitated by the closure of sub-optimally sized and environmentally unfriendly PVC plants. Limited capacityaddition and growing demand led by markets like India and Egypt resulted in very good prospects for the globalPVC industry.
Chemplast, driven by strong demand, had very good financial performance in 2016. Margins were very strong,resulting in high cash generation. Chemplast is in the process of setting up a joint venture to manufacturechlorinated PVC (CPVC). CPVC is a fast growing commodity and the joint venture will be only the second domesticproducer addressing a big opportunity in India. Chemplast is also in the process of acquiring a hydrogen peroxideplant that gives them the ability to manufacture a value added product that utilizes hydrogen produced byChemplast, and provides entry into the market for a new valuable and allied product.
TCI has successfully restructured its balance sheet with a capital injection of $207 million from the parent with afurther injection of $78 million to come in March 2017. Further, as noted above, it has obtained a $280 millionproject financing loan from a consortium of Indian banks for its expansion. The key activity for TCI in the next twoyears will be implementation of the important Phase 2 project described above, on time and on budget. The projectimplementation activity is on track, orders for long lead time items have been placed and all technology tie-ups arein place.
National Stock Exchange of India Limited (NSE)
Founded in 1992, NSE is the largest stock exchange in India with a market share of over 86% in cash equity tradingand 99% in derivatives equity trading. With over 200,000 terminals in over 2,000 centres, NSE provides tradingfacilities with national reach. The exchange uses the latest communications technology for automated screen-basedtrading.
Fairfax India decided to invest in NSE for the following reasons:
• It is the leading stock exchange in a fast-growing market.
• Exchange volumes are strongly linked to economic activity and growth.
• NSE has a long track record of developing innovative products and strong risk management protocols.
• At a price/earnings ratio of 14.5 times forward earnings and price to book ratio of 2.6 times, valuations wereattractive for a near-monopoly business. Over the last 10 years they generated a return on equity of 19% andgrew book value per share annually by 21%.
Since Indian regulations mandated that no single shareholder (other than the two founding shareholders who eachown about 10%) could own more than 5%, Fairfax India decided to buy a 5% position in NSE. The position had to beaccumulated from several institutional shareholders who were interested in selling. After accumulating about 1% byJuly 2016 and while in the process of negotiating the purchase of another 3% block, strong rumours broke again thatthe much-anticipated public listing of NSE was about to be announced. As a result of the rumours, the potentialsellers walked away. Fairfax India therefore decided to suspend its efforts to purchase the remainder of the5% position.
The rumours in fact turned out to be true and NSE has begun the process of launching its initial public offering.Listing is expected to be completed by September 2017.
10
This was indeed a case of one that got away! However, Fairfax India does have a 1% position bought for $27 million,and we expect it to make excellent returns on that small investment.
Saurashtra Freight Private Limited (Saurashtra)
Raghav Agarwalla’s is a wonderful story! He has transformed a struggling business into a real powerhouse since hetook over management eight years ago when he was barely 21. Upon his return from the University of SouthernCalifornia (USC) in Los Angeles he went straight to live in a dusty little port town called Mundra. You really need tosee Mundra town to understand its contrast from Los Angeles!
Saurashtra is part of the privately-held Saurashtra group of companies, which has been in operation for over 30 yearsand was jointly founded by Surendra Kumar Sinha and Raghav’s father, Dipak Agarwalla. The group comprises fourcompanies – Saurashtra Infra and Power (which runs Saurashtra), Saurashtra Fuels, Saurashtra Ferrous and MagnumShipping Services. All group companies are held equally by the Agarwalla and Sinha families.
Since 2008, Saurashtra has been managed by newly minted USC graduate Raghav Agarwalla. The family asked him tobuild the nascent container freight service (CFS) business which was struggling since nobody within the family waspaying attention to it. Raghav has done a great job in growing the business to its current level.
CFSs are an important link between transport operators and shipping lines and effectively work as an extension of aport. It is in the port’s best interest to focus on maximizing container traffic and not get bogged down handlingcontainers that are waiting to be dispatched. Also, ports lack adequate storage facilities to hold containers forextended periods of time. CFSs provide a facility outside of congested ports for temporary storage of goods pendingcustoms clearance and further distribution. Activities like stuffing and destuffing of containers, which mightotherwise have to be done in the port, are done at the CFS.
Launched in 2005, Saurashtra is located 5 km from Mundra port. With 24/7 operations, Saurashtra has the capacityto handle 180,000 TEUs (twenty-foot equivalent units) per annum and handled about 88,000 TEUs in 2016,implying capacity utilization of about 50%. It has a market share of about 20% at Mundra port, the highest among allCFSs there. Saurashtra derives volume and revenue from both import and export of containers. While the ideal mixbetween the two for maximum efficiency is 50:50, the mix is adjusted each year in order to maximize profitability.On exports Saurashtra has relationships with more than 100 customs house agents (CHAs), who select the CFS to use.CHAs, a very fragmented industry, act on behalf of importers and exporters and are licensed by the Indian customsdepartment to perform services related to documentation, packaging, insurance and customs clearance. On importsSaurashtra has relationships with 48 of the approximately 60 shipping lines that call at Mundra port. CHAs andimporters utilizing any of the 48 shipping lines are obliged to use and pay for the services of CFSs. In return fordirecting import traffic to it, Saurashtra pays the shipping line a commission. Shipping lines can have agreementswith multiple CFSs, but tend to use 4 to 5 at a port and normally split the cargo evenly among them.
We decided to invest in Saurashtra because:
• We admired Raghav Agarwalla’s impressive leadership and track record.
• The growth in the CFS and Inland Container Depots (ICD) industry is correlated to container traffic growth,which during the last 15 years has grown at a rate of 1.3-1.4 times GDP growth, aided by increasingcontainerization of cargo.
• The CFS industry is highly fragmented: there are 15 in Mundra port and 34 in Mumbai port (JNPT). Sincemany of these are inefficient and operating below capacity, Saurashtra could serve as a platform forconsolidation.
• Saurashtra is located in Mundra port, the second largest and fastest growing container port in India. AlsoMundra port is modern and efficient and is in the process of expanding from 3.2 to 6.6 million TEUs.
• Raghav has assembled a management team of experienced professionals, several of whom have come fromother large CFSs and shipping lines. Key senior executives have been in their roles for a minimum of four years.
• Saurashtra has a paved container yard, which reduces damage to containers and large warehousing space, andis investing in cold storage, a first for CFSs at Mundra.
11
FAIRFAX INDIA HOLDINGS CORPORATION
• Saurashtra has leased a 30-acre container yard for storing empty containers for shipping lines and has thelargest inventory of empty containers which serve as a magnet for export business as empty containers areavailable on demand.
• Saurashtra plans to increase its geographical footprint by acquiring an existing CFS at JNPT, followed in duecourse by the acquisition of an ICD in the national capital region.
On February 14, 2017 Fairfax India invested $30 million to acquire a 51% interest in Saurashtra. $18 million of the$30 million will be used to purchase the founder’s stake: $10 million of this will be infused back in to Saurashtra bythe founders and used to unwind all previous transactions with Saurashtra group companies. The remaining$12 million will be invested directly into Saurashtra. Based on projected Indian GAAP financials ending March 31,2017, this implies a price/earnings ratio of 13.9 times, price/free cash flow ratio of 8.3 times and price to book value of3.6 times for a business that has over the past eight years grown revenue and EBITDA at 30% and 41% per annumrespectively and generated a 20% average return on equity. After the completion of the transaction, Saurashtra willbe left with about $22 million of cash, which it plans to use to pursue its acquisition plans. The Agarwalla and Sinhafamilies own equally the remaining 49% of Saurashtra. It is our pleasure to welcome the Agarwalla and Sinha familiesto the Fairfax India family.
Bangalore International Airport Limited (BIAL)
In 1991, a panel formed by the national airports authority of India (NAAI) selected the site for a new airport. It wasDevanahalli, a village about 40 km north of Bangalore. The impetus for the decision was that the existing airportlocated 10 km from the city centre, was unable to cope with its fast growing air passenger traffic as Bangalore wasbeginning to turn into the Silicon Valley of India. There was no room for expansion and the apron could only parksix aircraft! It then took another ten years of planning and delays until BIAL was formed as a public-privatepartnership, with the central and state governments owning 26% and the rest owned by Unique Zurich Airport,Siemens Project Ventures and Larsen & Toubro, a large Indian conglomerate. The agreement between the stategovernment, the central government and BIAL, which was signed in July 2004, awarded a 30-year (extendable byanother 30 years at BIAL’s option) concession agreement to build a new large and modern airport in Devanahalli, thesite that was originally chosen. Under the concession agreement, for 25 years no other airport will be allowed to bebuilt or operate within a radius of 150 km of BIAL. After a 32-month construction period, the airport was inauguratedon May 23, 2008.
The airport is located on 4,000 acres of land and the concession agreement provides for development of 1,000 acresof this land for commercial purposes such as hotels, retail establishments, offices and industrial or entertainmentparks. This will permit BIAL to monetize approximately 460 acres after providing land to build roads, utilities,landscaping and other services. This is very valuable real estate because Bangalore, given its congestion, is expandingfast in the direction of the new airport.
From a sleepy and relatively small town in the sixties, Bangalore has truly flourished to become a vibrant andgrowing metropolis that is now India’s third largest and fastest growing city with a population of approximately12 million. Not only is it considered the Silicon Valley of India, but virtually every major international technologycompany, social media company, software and software services company, investment bank, consulting companyand accounting firm has a major presence in the city. It is estimated that half of the Fortune 500 companies havesignificant back office operations in Bangalore.
BIAL has tremendous growth potential. While its current capacity is about 20 million passengers per annum, ithandled over 22 million passengers in 2016! Plans are already in place to gradually expand the capacity of the airportto 60 million passengers by 2030. This will include building a second runway, an additional terminal building andrelated infrastructure. Land preparation for the second runway is already underway and about half completed.
Fairfax India’s team has done a great deal of work in evaluating the investment potential of all of the four privateairports in India (Mumbai, Delhi, Hyderabad and Bangalore). Having considered all of the variables, including theconcession agreement, revenue sharing formula with the government and the method for calculating the 16%regulated return, it was Fairfax India’s firm conclusion that BIAL was the most profitable and offered the bestinvestment opportunity.
12

BIAL has three potential sources of revenues:
• Aero revenue: Aero revenue, which has grown at 25% per year over the last 8 years, is the revenue earnedfrom airlines for providing services such as navigation, landing, take-off, parking, ground handling andground safety. Rates for these individual services are fixed in a manner to get the airport operator a fixed 16%per annum regulated return on invested equity. Under the hybrid till approach, applicable to BIAL, 40% ofnon-aero revenue is considered as a part of aero revenue to compute the regulated return.
• Non-aero revenue: All the revenue sources other than from aero revenue are accounted for as non-aerorevenue. This includes income from activities such as cargo handling, fuel sales, food and beverage sales andduty free shops. BIAL takes an interest free deposit from all the concessionaires and earns annual revenue on aminimum guarantee, revenue share or fixed rental basis. Non-aero revenue has grown at a CAGR of 16% from2009 to 2016 and is expected to grow substantially due to an increase in passenger growth rates, theavailability of additional space and the increasing propensity of passengers to spend money.
• Real estate monetization: BIAL also comes with 460 acres of excess land that can be monetized by theoperator. So far, aside from building a hotel next to the airport and leasing it to the Taj Hotels Resorts andPalaces on a management contract, all other land is undeveloped. Bangalore’s historical population areas aregetting congested, hence, the city is expanding in BIAL’s direction. There will be significant upside, over time,from monetization of this real estate, a view strongly validated by Ashwin Ramesh, Fairfax’s real estate expertin India.
Prior to Fairfax India’s anticipated investment, the ownership of BIAL was:
% Ownership
GVK Group 43%Siemens Germany 26%Zurich Airports 5%Airports Authorities of India 13%Government of Karnataka 13%
Total 100%
The GVK Group (GVK) is an Indian conglomerate with interests in energy, resources, airports, transportation,hospitality and life sciences. As part of an effort to reduce its debt, GVK offered to sell a 33% interest in BIAL.
Fairfax India agreed to purchase 33% of BIAL from GVK for $330 million, implying an equity value for 100% ofapproximately $1 billion for the whole company. Concurrently, Fairfax India will also purchase Zurich Airports’ 5%interest in BIAL for $49 million. Based on Indian GAAP 2017 projections, the purchase price values BIAL at aprice/earnings ratio of 14.4 times and price to book value of 3.5 times and price/free cash flow ratio of 9.8 times. Thevalue of the real estate that can be monetized is not included in these projections.
We are very excited about this investment.
Financial Position
Fairfax India came into being on January 30, 2015, when it issued 106.7 million shares raising gross proceeds of$1.1 billion by completing a public offering, a placement to cornerstone investors and an issue to Fairfax Financial.In September 2016 it completed a $225 million 2-year secured term loan from a syndicate of Canadian banks, ledby Scotiabank.
At December 2016, the financial position of Fairfax India was as follows:
$ million
Undeployed cash and investments 430.7Term loan 223.8Common shareholders’ equity 1,075.4Total debt to equity 20.8%
13
FAIRFAX INDIA HOLDINGS CORPORATION
On January 13, 2017 Fairfax India issued 42.6 million shares at $11.75 per share in a public offering and a privateplacement to OMERS and Fairfax Financial, raising gross proceeds of $500 million. When the announcedinvestments are completed and the term loan is repaid, Fairfax India will be left with about $230 million for newinvestments, and ongoing expenses.
Developments in India
On November 8, 2016, Prime Minister Modi stunned India and the rest of the world by announcing his most radicalfrontal assault on corruption and the scourge of the undeclared and hence non-tax paying ‘‘black’’ economy of thecountry, which by some accounts represents about half of India’s economic activity. He announced the historicdecision to immediately withdraw all of the high denomination currency notes in circulation, the 500 and1,000 rupee notes (worth about $7.50 and $15), and replace them with new 500 and 2,000 rupee notes. Remarkably,the plan was kept secret except to a handful of his closest confidantes even though the printing of the replacementnotes had been well underway. People that had the withdrawn notes had until the end of the year to deposit theminto banks, but they could immediately withdraw, in new notes, only a fraction of what was deposited. Theobjectives of what now has been universally referred to as ‘‘demonetization’’ was to tackle the menace of counterfeitcurrency, terror financing, illicit political funding, bribery, tax avoidance and the black market where cash serves asthe medium for undisclosed transactions. This, coupled with the many measures taken to encourage use of electronicpayments should over time result in more formalization of the economy, increased tax collections and a reducedhoarding of illicit cash.
In order to understand the gravity and boldness of this decision, you need to understand that it is reliably estimatedthat about 80% of all transactions in India, both legitimate and black are conducted in cash and that the withdrawnnotes represented 85% in value of all currency in circulation.
The reaction was immediate and severe:
• The people attempted to use loop holes to legitimize their undeclared cash. The government moved fast toblock the loop holes, resulting in confusion for those just trying to comply with the new regime.
• There were huge line-ups at banks and ATMs as the supply of usable new cash ran low and many ATMs becamenon-operational.
• People used to doing legitimate business in cash were severely constrained.
The expressed reactions to the move were highly partisan. Those in opposition and generally predisposed to opposethe Prime Minister characterized the move as one of the dumbest of all time, while Mr. Modi’s supporters cheered andsaid they would take the short term hardships as long as the move helped take away the fruits of illegal activity andbribery from the powerful and rich and resulted, in the future, in more transparent transactions within the officialframework.
While the controversy rages on, we believe that Mr. Modi’s motive was focused on reducing corruption, terroristfinancing, counterfeiting and tax avoidance that is endemic in India. We believe that there are more actions like thisto come!
Based on the latest economic numbers, it appears as though the negative impact of demonetization on the economywas not as severe as those predicted by the nay-sayers. Also, results from some state and municipal elections indicatethat the majority of the electorate, despite some hardships, is firmly behind Mr. Modi’s demonetization decision.
Prime Minister Modi continues to aggressively pursue the implementation of all the reform measures that we wroteabout in last year’s letter. Many of these reforms required legislative changes. The government successfully passed thefollowing bills by building a consensus:
• The constitutional amendment bill to enable the introduction of a single goods and services tax in place of thecurrent myriad number of indirect taxes.
• The Aadhaar (targeted delivery of financial and other subsidies, benefits and services) act to enable targeteddelivery of government subsidies and services using the biometric Aadhaar identity.
• An insolvency and bankruptcy code to help resolve business stress in a timely manner so that the value ofunderlying assets can be maximized. This is important given the backdrop of large non-performing assets inthe banking system.
14
• The real estate regulation and development act to establish a real estate regulator in every state so that theinterests of consumers, and in some cases developers too, can be protected. Bargaining power in the sectorwhich hitherto was overwhelmingly in the hands of the developer should now be more balanced.
• An amendment of the RBI act, introducing a new monetary policy framework. Monetary policy setting hasnow been entrusted to an independent monetary policy committee (MPC) which has an explicit inflationtargeting mandate. The RBI will have a majority on the MPC, ensuring its independence.
India continued to build on the macro-economic stability achieved over the last couple of years with the fiscaldeficit, inflation and the current account deficit all projected to fall in fiscal 2017 (FY17).
• The government continued on its path to fiscal consolidation by committing to reduce the fiscal deficit to3.5% of GDP in FY17. Data for the first 9 months of the financial year suggests the government is on track toachieve this.
• Inflation continued to moderate and in FY17 should average less than 5% for the second consecutive year.While this is partly due to the fall in global commodity prices, the government should be given credit forcontinuing its tight fiscal policy and allowing only modest increases in support prices for farm products.
• India’s current account deficit has continued its declining trend with the deficit likely to fall below 1% inFY17, the lowest in over a decade. Further, the RBI successfully managed the redemption of high cost foreigncurrency deposits raised from non-resident Indians during the ‘taper-tantrum’ of late 2013 without creatingany volatility in either the currency market or money market.
• As a consequence of continued macro stability, the Indian rupee, compared to other emerging marketcurrencies, remained relatively stable through the course of 2016 despite bouts of global volatility after theBrexit vote and the U.S. elections. In the last three years, the Indian rupee has outperformed a basket ofemerging market currencies by a wide margin.
• Continued moderation in inflation, which is now well within the target band of 2-6%, allowed the RBI/MPCto cut interest rates by 50 basis points in 2016. Consequently, interest rates across the spectrum fell. The yieldon the benchmark 10-year government security fell by 125 basis points through the year while those on thebenchmark 3-month treasury bill fell by about 100 basis points.
The government continues to focus on increasing the enrolment in Aadhaar and using it for efficient targeting ofgovernment subsidies and programs. As of January 2017, over 1.1 billion people had been issued the biometricAadhaar identification number, covering over 90% of the adult population. The government’s effort to open bankaccounts for those under served by the formal financial system has also continued to yield good results. By the end ofJanuary 2017, a total of 270 million bank accounts had been opened. Of these, more than half are linked to theunique Aadhaar number and are thus ready for direct transfer of government subsidies. The government has alreadyshifted the cooking gas subsidy to direct benefit transfer (DBT), whereby the subsidy is directly credited to theintended recipient’s bank account. The government is currently doing a pilot study to shift other subsidies such asthose for kerosene, food grains and fertilizers to the DBT mechanism. Aggregate subsidies have already fallen due tothe decline in oil prices and deregulation of petrol and diesel prices. After the shift to DBT, subsidies are likely tofall further.
India continued to be the fastest growing large economy in the world. GDP growth improved by 40 bps to 7.3%during the first three quarters of 2016, largely due to improvement in agriculture growth to 2.4% from 0.7% last year.Both industry and services growth was broadly stable at 6.4% and 9.1% respectively. Given the normal monsoonrainfall after two consecutive droughts and salary revisions for government employees, consumption demandshowed signs of revival in the second half of the year.
On the not so positive side of the ledger, the government has projected GDP growth of 7.1% for FY17, which is lowerthan the growth of 7.5% in FY16. Further, this estimate may not have fully accounted for the impact ofdemonetization, so growth could slip below 7%.
Capex activity continues to remain weak due to low capacity utilization levels in many sectors. On the one hand,new capex project announcements grew about 17% in 2016 to $120 billion, and execution also picked up sharply.On the other hand, stalled projects continue to rise, now totaling about $180 billion of projects that are stalled due topolicy or commercial reasons.
15

8MAR201612231920 10MAR201607580995
FAIRFAX INDIA HOLDINGS CORPORATION
Indian equity markets were relatively flat for a second consecutive year in 2016 as the benchmark rupee Sensex indexrose by just about 2%. While total initial public offerings more than doubled in value terms to about $4 billion,equity capital raised declined 40% to $10 billion. Inflow from foreign portfolio investors (FPI) was one of the lowestin recent years, with net inflow of $2.9 billion in equities and net outflow of $6.5 billion from debt markets. However,domestic flows held up well as domestic equity mutual funds collected more than $10 billion in net inflows.
Despite these minor negatives, you can see that the government is focused on economic development and inclusivegrowth. In this environment, the companies that Fairfax India has invested in continue to make significant progress.
Fairfax India has now completed over two years of operations. We would like to acknowledge the leadership providedby John Varnell, who took on the role of founding CFO and shepherded the company through its formation. Johnhas now handed over CFO duties to Jennifer Allen, who has done an outstanding job during the transition and isnow fully in charge. We also welcome Keir Hunt, who has taken over as General Counsel and has performedadmirably in this role. John will continue as Vice President of Corporate Affairs.
We would like to thank our independent director, Dr. Punita Kumar-Sinha, who has decided not to stand forre-election, for her excellent contribution and wish her well in her future endeavours. We also thank ourindependent directors, Deepak Parekh, Tony Griffiths, Chris Hodgson and Alan Horn for their wise advice, supportand encouragement.
So Fairfax India has ended a very exciting and productive year. We are looking forward to seeing you at the annualmeeting to be held on April 20, 2017 at 2:00 p.m., Toronto time at Roy Thomson Hall, 60 Simcoe Street, Toronto,Canada, where you will have the opportunity to meet with Sanjay Kaul, Nirmal Jain, Nahoosh Jariwala, Vijay Sankar,Mahesh Babani and Raghav Agarwalla, the excellent leaders of NCML, IIFL, Fairchem, Sanmar, Privi and Saurashtra.Again, we are truly appreciative of your support as shareholders, and we hope to see you on April 20.
March 10, 2017
Chandran Ratnaswami V. Prem WatsaChief Executive Officer Chairman
16

(This page is intentionally left blank)
17

8MAR201612231920 28FEB201713300060
FAIRFAX INDIA HOLDINGS CORPORATION
Management’s Responsibility for the Consolidated Financial Statements
The preparation and presentation of the accompanying consolidated financial statements, Management’sDiscussion and Analysis (‘‘MD&A’’) and all financial information are the responsibility of management and havebeen approved by the Board of Directors.
The consolidated financial statements have been prepared in accordance with International Financial ReportingStandards as issued by the International Accounting Standards Board. Financial statements, by nature, are not precisesince they include certain amounts based upon estimates and judgments. When alternative methods exist,management has chosen those it deems to be the most appropriate in the circumstances.
Management maintains appropriate systems of internal controls. Policies and procedures are designed to givereasonable assurance that transactions are properly authorized, assets are safeguarded and financial records properlymaintained to provide reliable information for the preparation of the consolidated financial statements.
We, as Fairfax India’s Chief Executive Officer and Chief Financial Officer, have certified Fairfax India’s annualdisclosure documents filed with the Canadian Securities Administrators in accordance with Canadian securitieslegislation.
The Board of Directors is responsible for ensuring that management fulfills its responsibilities for financial reportingand is ultimately responsible for reviewing and approving the consolidated financial statements and MD&A. TheBoard carries out this responsibility principally through its Audit Committee which is independent frommanagement.
The Audit Committee is appointed by the Board of Directors and reviews the consolidated financial statements andMD&A; considers the report of the external auditors; assesses the adequacy of the internal controls of the company;examines the fees and expenses for audit services; and recommends to the Board the independent auditors forappointment by the shareholders. The independent auditors have full and free access to the Audit Committee andmeet with it to discuss their audit work, Fairfax India’s internal control over financial reporting and financialreporting matters. The Audit Committee reports its findings to the Board for consideration when approving theconsolidated financial statements and MD&A for issuance to the shareholders.
March 10, 2017
Chandran Ratnaswami Jennifer AllenChief Executive Officer Chief Financial Officer
18

10MAR201709452707
Independent Auditor’s Report
To the Shareholders of Fairfax India Holdings Corporation
We have audited the accompanying consolidated financial statements of Fairfax India Holdings Corporation and itssubsidiaries, which comprise the consolidated balance sheets as at December 31, 2016 and 2015 and the consolidatedstatements of earnings, comprehensive income, changes in equity and cash flows for the years then ended, and therelated notes, which comprise a summary of significant accounting policies and other explanatory information.
Management’s responsibility for the consolidated financial statementsManagement is responsible for the preparation and fair presentation of these consolidated financial statements inaccordance with International Financial Reporting Standards (IFRS), and for such internal control as managementdetermines is necessary to enable the preparation of consolidated financial statements that are free from materialmisstatement, whether due to fraud or error.
Auditor’s responsibilityOur responsibility is to express an opinion on these consolidated financial statements based on our audits. Weconducted our audits in accordance with Canadian generally accepted auditing standards. Those standards requirethat we comply with ethical requirements and plan and perform the audit to obtain reasonable assurance aboutwhether the consolidated financial statements are free from material misstatement.
An audit involves performing procedures to obtain audit evidence about the amounts and disclosures in theconsolidated financial statements. The procedures selected depend on the auditor’s judgment, including theassessment of the risks of material misstatement of the consolidated financial statements, whether due to fraud orerror. In making those risk assessments, the auditor considers internal control relevant to the entity’s preparation andfair presentation of the consolidated financial statements in order to design audit procedures that are appropriate inthe circumstances, but not for the purpose of expressing an opinion on the effectiveness of the entity’s internalcontrol. An audit also includes evaluating the appropriateness of accounting policies used and the reasonableness ofaccounting estimates made by management, as well as evaluating the overall presentation of the consolidatedfinancial statements.
We believe that the audit evidence we have obtained in our audits is sufficient and appropriate to provide a basis forour audit opinion.
OpinionIn our opinion, the consolidated financial statements present fairly, in all material respects, the financial position ofFairfax India Holdings Corporation and its subsidiaries as at December 31, 2016 and 2015 and their financialperformance and their cash flows for the years then ended in accordance with IFRS.
Chartered Professional Accountants, Licensed Public AccountantsToronto, Ontario
March 10, 2017
19

10MAR201607580995 10MAR201607580340
FAIRFAX INDIA HOLDINGS CORPORATION
Consolidated Financial Statements
Consolidated Balance Sheetsas at December 31, 2016 and December 31, 2015(US$ thousands)
December 31, December 31,Notes 2016 2015
AssetsCash and cash equivalents 146,960 12,464Restricted cash 7 18,810 6,457Short term investments 27,428 50,143Bonds 528,857 512,789Common stocks 539,284 415,637
Total cash and investments 6 1,261,339 997,490
Interest receivable 7,493 27,680Income taxes refundable 10 7,326 –Other assets 6 27,339 281
Total assets 1,303,497 1,025,451
LiabilitiesAccounts payable and accrued liabilities 606 743Payable to related parties 12 3,673 1,993Income taxes payable 10 – 9,386Term loan 7 223,772 –
Total liabilities 228,051 12,122
EquityTotal common shareholders’ equity 8 1,075,446 1,013,329
1,303,497 1,025,451
See accompanying notes.
Signed on behalf of the Board
Director Director
20
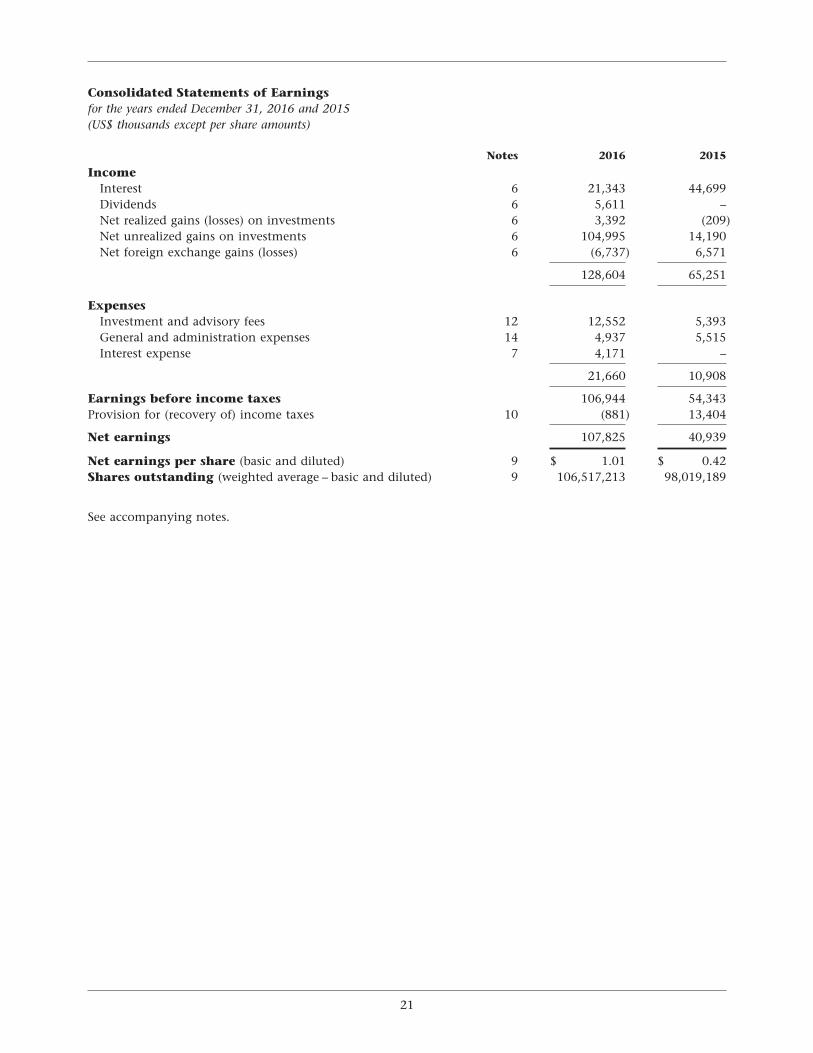
Consolidated Statements of Earningsfor the years ended December 31, 2016 and 2015(US$ thousands except per share amounts)
Notes 2016 2015
IncomeInterest 6 21,343 44,699Dividends 6 5,611 –Net realized gains (losses) on investments 6 3,392 (209)Net unrealized gains on investments 6 104,995 14,190Net foreign exchange gains (losses) 6 (6,737) 6,571
128,604 65,251
ExpensesInvestment and advisory fees 12 12,552 5,393General and administration expenses 14 4,937 5,515Interest expense 7 4,171 –
21,660 10,908
Earnings before income taxes 106,944 54,343Provision for (recovery of) income taxes 10 (881) 13,404
Net earnings 107,825 40,939
Net earnings per share (basic and diluted) 9 $ 1.01 $ 0.42Shares outstanding (weighted average – basic and diluted) 9 106,517,213 98,019,189
See accompanying notes.
21
FAIRFAX INDIA HOLDINGS CORPORATION
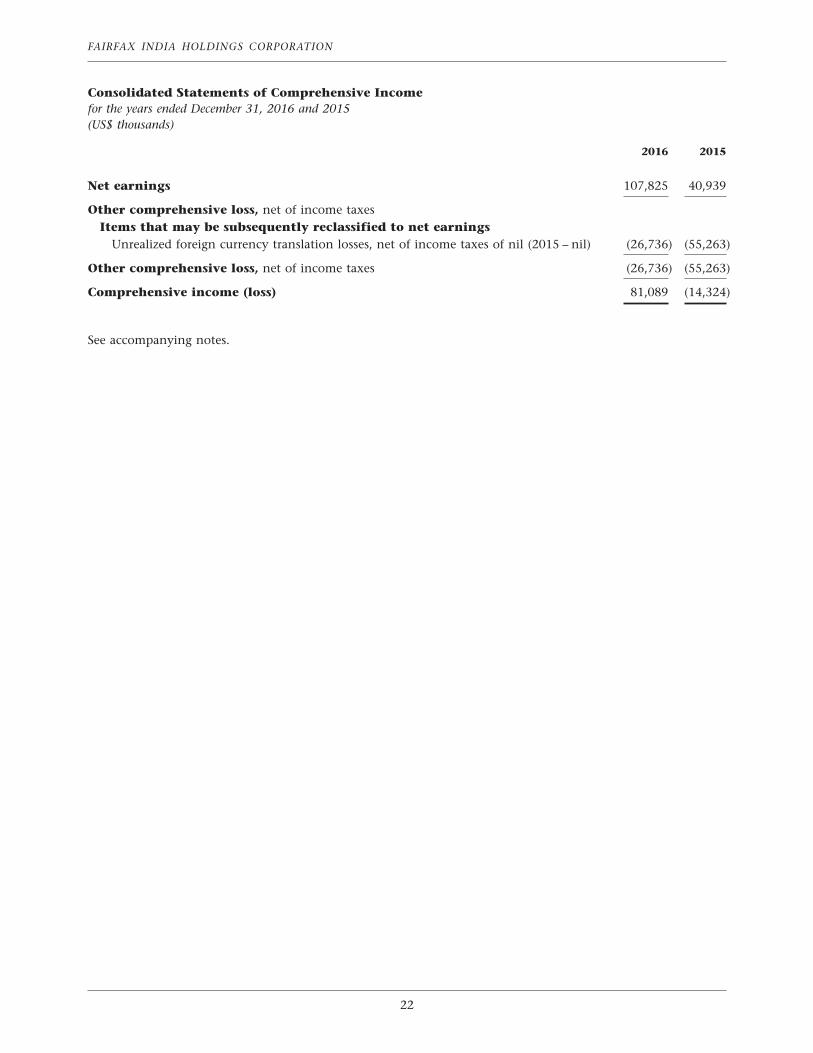
Consolidated Statements of Comprehensive Incomefor the years ended December 31, 2016 and 2015(US$ thousands)
2016 2015
Net earnings 107,825 40,939
Other comprehensive loss, net of income taxesItems that may be subsequently reclassified to net earnings
Unrealized foreign currency translation losses, net of income taxes of nil (2015 – nil) (26,736) (55,263)
Other comprehensive loss, net of income taxes (26,736) (55,263)
Comprehensive income (loss) 81,089 (14,324)
See accompanying notes.
22
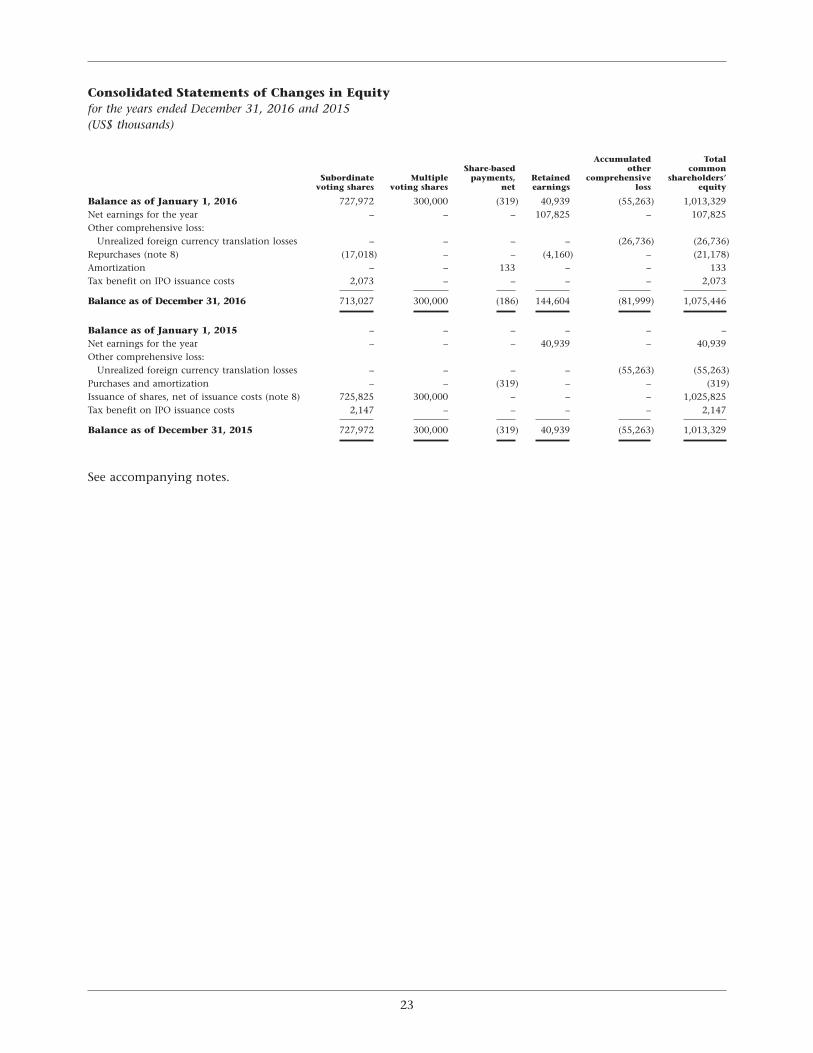
Consolidated Statements of Changes in Equityfor the years ended December 31, 2016 and 2015(US$ thousands)
Accumulated TotalShare-based other common
Subordinate Multiple payments, Retained comprehensive shareholders’voting shares voting shares net earnings loss equity
Balance as of January 1, 2016 727,972 300,000 (319) 40,939 (55,263) 1,013,329Net earnings for the year – – – 107,825 – 107,825Other comprehensive loss:
Unrealized foreign currency translation losses – – – – (26,736) (26,736)Repurchases (note 8) (17,018) – – (4,160) – (21,178)Amortization – – 133 – – 133Tax benefit on IPO issuance costs 2,073 – – – – 2,073
Balance as of December 31, 2016 713,027 300,000 (186) 144,604 (81,999) 1,075,446
Balance as of January 1, 2015 – – – – – –Net earnings for the year – – – 40,939 – 40,939Other comprehensive loss:
Unrealized foreign currency translation losses – – – – (55,263) (55,263)Purchases and amortization – – (319) – – (319)Issuance of shares, net of issuance costs (note 8) 725,825 300,000 – – – 1,025,825Tax benefit on IPO issuance costs 2,147 – – – – 2,147
Balance as of December 31, 2015 727,972 300,000 (319) 40,939 (55,263) 1,013,329
See accompanying notes.
23
FAIRFAX INDIA HOLDINGS CORPORATION
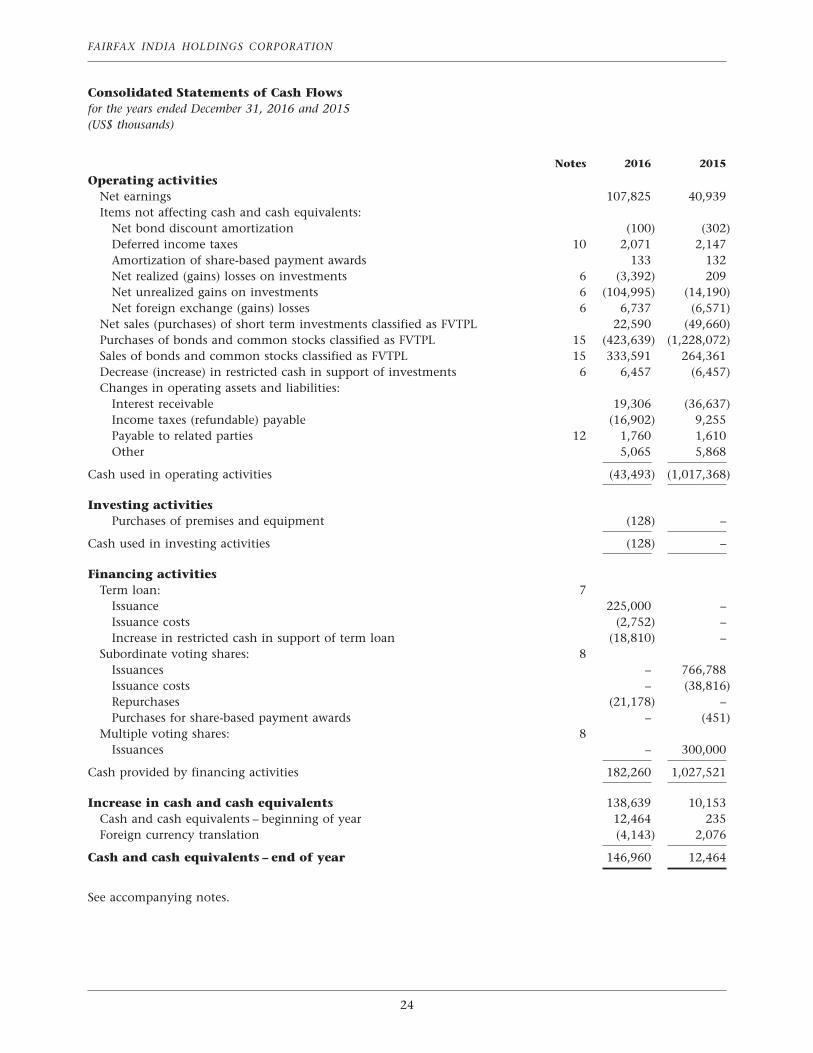
Consolidated Statements of Cash Flowsfor the years ended December 31, 2016 and 2015(US$ thousands)
Notes 2016 2015
Operating activitiesNet earnings 107,825 40,939Items not affecting cash and cash equivalents:
Net bond discount amortization (100) (302)Deferred income taxes 10 2,071 2,147Amortization of share-based payment awards 133 132Net realized (gains) losses on investments 6 (3,392) 209Net unrealized gains on investments 6 (104,995) (14,190)Net foreign exchange (gains) losses 6 6,737 (6,571)
Net sales (purchases) of short term investments classified as FVTPL 22,590 (49,660)Purchases of bonds and common stocks classified as FVTPL 15 (423,639) (1,228,072)Sales of bonds and common stocks classified as FVTPL 15 333,591 264,361Decrease (increase) in restricted cash in support of investments 6 6,457 (6,457)Changes in operating assets and liabilities:
Interest receivable 19,306 (36,637)Income taxes (refundable) payable (16,902) 9,255Payable to related parties 12 1,760 1,610Other 5,065 5,868
Cash used in operating activities (43,493) (1,017,368)
Investing activitiesPurchases of premises and equipment (128) –
Cash used in investing activities (128) –
Financing activitiesTerm loan: 7
Issuance 225,000 –Issuance costs (2,752) –Increase in restricted cash in support of term loan (18,810) –
Subordinate voting shares: 8Issuances – 766,788Issuance costs – (38,816)Repurchases (21,178) –Purchases for share-based payment awards – (451)
Multiple voting shares: 8Issuances – 300,000
Cash provided by financing activities 182,260 1,027,521
Increase in cash and cash equivalents 138,639 10,153Cash and cash equivalents – beginning of year 12,464 235Foreign currency translation (4,143) 2,076
Cash and cash equivalents – end of year 146,960 12,464
See accompanying notes.
24
Index to Notes to Consolidated Financial Statements
1. Business Operations . . . . . . . . . . . . . . . . . . . . . . . . . . . . . . . . . . . . . . . . . . . . . . . . . . . . . . . . . 26
2. Basis of Presentation . . . . . . . . . . . . . . . . . . . . . . . . . . . . . . . . . . . . . . . . . . . . . . . . . . . . . . . . 26
3. Summary of Significant Accounting Policies . . . . . . . . . . . . . . . . . . . . . . . . . . . . . . . . . . . . . . . . 27
4. Critical Accounting Estimates and Judgments . . . . . . . . . . . . . . . . . . . . . . . . . . . . . . . . . . . . . . . 31
5. Indian Investments . . . . . . . . . . . . . . . . . . . . . . . . . . . . . . . . . . . . . . . . . . . . . . . . . . . . . . . . . 33
6. Cash and Investments . . . . . . . . . . . . . . . . . . . . . . . . . . . . . . . . . . . . . . . . . . . . . . . . . . . . . . . 37
7. Term Loan . . . . . . . . . . . . . . . . . . . . . . . . . . . . . . . . . . . . . . . . . . . . . . . . . . . . . . . . . . . . . . . 40
8. Total Equity . . . . . . . . . . . . . . . . . . . . . . . . . . . . . . . . . . . . . . . . . . . . . . . . . . . . . . . . . . . . . . 40
9. Earnings per Share . . . . . . . . . . . . . . . . . . . . . . . . . . . . . . . . . . . . . . . . . . . . . . . . . . . . . . . . . . 42
10. Income Taxes . . . . . . . . . . . . . . . . . . . . . . . . . . . . . . . . . . . . . . . . . . . . . . . . . . . . . . . . . . . . . 42
11. Financial Risk Management . . . . . . . . . . . . . . . . . . . . . . . . . . . . . . . . . . . . . . . . . . . . . . . . . . . 44
12. Related Party Transactions . . . . . . . . . . . . . . . . . . . . . . . . . . . . . . . . . . . . . . . . . . . . . . . . . . . . 48
13. Segment Reporting . . . . . . . . . . . . . . . . . . . . . . . . . . . . . . . . . . . . . . . . . . . . . . . . . . . . . . . . . 49
14. General and Administration Expenses . . . . . . . . . . . . . . . . . . . . . . . . . . . . . . . . . . . . . . . . . . . . 50
15. Supplementary Cash Flow Information . . . . . . . . . . . . . . . . . . . . . . . . . . . . . . . . . . . . . . . . . . . 50
25
FAIRFAX INDIA HOLDINGS CORPORATION
Notes to Consolidated Financial Statementsfor the years ended December 31, 2016 and 2015(in US$ and thousands except per share amounts and as otherwise indicated)
1. Business Operations
Fairfax India Holdings Corporation (‘‘the company’’ or ‘‘Fairfax India’’) is an investment holding company whoseobjective is to achieve long term capital appreciation, while preserving capital, by investing, either directly orthrough one of its wholly-owned subsidiaries, in public and private equity securities and debt instruments in Indiaand Indian businesses or other businesses with customers, suppliers or business primarily conducted in, ordependent on, India (‘‘Indian Investments’’). The company makes all or substantially all of its investments eitherdirectly or through one of its wholly-owned subsidiaries, which currently include FIH Mauritius Investments Ltd(‘‘FIH Mauritius’’) and FIH Private Investments Ltd (‘‘FIH Private’’).
In the first quarter of 2015 Fairfax India completed its initial public offering (‘‘IPO’’) concurrent with two privateplacements followed by the exercise of an over-allotment option by the underwriters (collectively ‘‘the IPOOfferings’’) and raised gross proceeds of approximately $1.06 billion (net proceeds of $1.02 billion) by issuance ofsubordinate voting shares and multiple voting shares. The company’s subordinate voting shares commenced tradingon January 30, 2015 on the Toronto Stock Exchange (‘‘TSX’’) under the symbol FIH.U. The multiple voting shares arenot listed.
Fairfax Financial Holdings Limited (‘‘Fairfax’’) has taken the initiative in creating the company and is Fairfax India’sultimate parent and acts as its administrator. Fairfax is a holding company which, through its subsidiaries, isprincipally engaged in property and casualty insurance and reinsurance and the associated investment management.Fairfax is a Canadian reporting issuer with securities listed on the TSX and trading in Canadian dollars under thesymbol FFH for over 30 years and in U.S. dollars under the symbol FFH.U. Fairfax, through its subsidiaries, owns30,000,000 multiple voting shares. During 2016, certain Fairfax subsidiaries purchased 796,864 subordinate votingshares through open market transactions. At December 31, 2016 Fairfax’s multiple and subordinate voting shareholdings represented 95.3% of the voting rights and 29.4% of the equity interest in Fairfax India (December 31,2015 – 95.1% and 28.1% respectively). Subsequent to December 31, 2016, Fairfax acquired an additional13,717,873 subordinate voting shares from the company by way of a private placement (see note 8) and open markettransactions. After giving effect to those transactions Fairfax’s holdings represented 93.6% of the voting rights and30.2% of the equity interest in Fairfax India.
Hamblin Watsa Investment Counsel Ltd. (the ‘‘Portfolio Advisor’’), a wholly-owned subsidiary of Fairfax andregistered portfolio manager in the province of Ontario, is the portfolio advisor of the company and its consolidatedsubsidiaries, responsible to source and advise with respect to all investments.
The company was federally incorporated on November 25, 2014 and is domiciled in Ontario, Canada. The principaloffice of the company, Fairfax and the Portfolio Advisor is located at 95 Wellington Street West, Suite 800, Toronto,Ontario M5J 2N7.
2. Basis of Presentation
The company’s consolidated financial statements for the year ended December 31, 2016 have been prepared inaccordance with International Financial Reporting Standards (‘‘IFRS’’) as issued by the International AccountingStandards Board (‘‘IASB’’).
The consolidated balance sheets of the company are presented on a non-classified basis. Assets expected to berealized and liabilities expected to be settled within the company’s normal operating cycle of one year wouldtypically be considered as current, including the following balances: cash and cash equivalents, restricted cash, shortterm investments, interest receivable, income taxes refundable (payable), other assets, accounts payable and accruedliabilities, and payable to related parties. All other balances are generally considered as non-current.
The preparation of the company’s consolidated financial statements requires management to make estimates andassumptions that affect the reported amounts of assets and liabilities at the date of the consolidated financialstatements, the reported amounts of income and expenses during the reporting periods covered by the consolidatedfinancial statements and the related note disclosures. Critical accounting estimates and judgments are described innote 4.
These consolidated financial statements were approved for issue by the company’s Board of Directors onMarch 10, 2017.
26
3. Summary of Significant Accounting Policies
The principal accounting policies applied to the preparation of these consolidated financial statements and themethods of computation have been consistently applied to all periods presented unless otherwise stated, and are setout as follows.
ConsolidationSubsidiaries – A subsidiary is an entity over which the company has control. The company controls an entity whenthe company is exposed to, or has rights to, variable returns from its involvement with the entity and has the abilityto affect those returns through its power over the entity. The company has determined that it meets the definition ofan investment entity (see note 4) and as such, is required to apply the exception to consolidation and insteadaccount for its investments in subsidiaries (National Collateral Management Services Limited (‘‘NCML’’) and PriviOrganics Limited (‘‘Privi’’)) at fair value through profit or loss (‘‘FVTPL’’).
The company has determined that FIH Mauritius and FIH Private should be consolidated as these entities provideservices relating to the company’s investment activities. All intercompany balances, profits and transactions areeliminated in full.
Investments in associates – An associate is an entity over which the company has significant influence, but notcontrol, over the financial and operating policies. As discussed above, the company has determined that it meets thedefinition of an investment entity and as such, investments in associates (IIFL Holdings Limited (‘‘IIFL’’), FairchemSpeciality Limited (‘‘Fairchem’’, formerly known as Adi Finechem Limited) and Sanmar Chemicals Group(‘‘Sanmar’’)) are accounted for at FVTPL.
Foreign currency translationFunctional and presentation currency – The consolidated financial statements are presented in U.S. dollarswhile the Indian rupee is the functional currency of the company and its consolidated subsidiaries.
Although the company invests in Indian Investments, which are denominated in Indian rupees, its primary financialreporting objective is to measure long term capital appreciation in U.S. dollars. Accordingly, the company presentsits consolidated financial statements in U.S. dollars to provide comparability with other North American investmententities.
Foreign currency transactions – Foreign currency transactions are translated into the functional currency usingthe exchange rates prevailing at the dates of the transactions. Foreign exchange gains and losses resulting from thesettlement of such transactions and from the translation at year end exchange rates of monetary assets and liabilitiesdenominated in foreign currencies are recognized in net foreign exchange gains (losses) in the consolidatedstatements of earnings. Income and expenses are translated at the average rate of exchange for the period.
Translation to the presentation currency – The consolidated balance sheets and consolidated statements ofearnings of Fairfax India and its consolidated subsidiaries are translated to the presentation currency as follows:
• assets and liabilities are translated at the rates of exchange prevailing at the balance sheet dates;
• income and expenses are translated at the average rates of exchange for the periods presented (unless this isnot a reasonable approximation of the cumulative effect of the rates prevailing on the transaction dates, inwhich case income and expenses are translated at the dates of the transactions); and
• the net unrealized gains or losses resulting from this translation are recognized in accumulated othercomprehensive income (loss).
Upon disposal or partial disposal of FIH Mauritius or FIH Private, a proportionate share of the cumulative amount ofexchange differences recognized in accumulated other comprehensive income (loss) and accumulated in a separatecomponent in equity would be recycled to the consolidated statements of earnings as part of the determination ofthe gain or loss on disposal of these consolidated subsidiaries.
27
FAIRFAX INDIA HOLDINGS CORPORATION
Comprehensive income (loss)Comprehensive income (loss) consists of net earnings (loss) and other comprehensive income (loss) and includes allchanges in total equity during a period, except for those resulting from investments by owners and distributions toowners. Unrealized foreign currency translation gains (losses), net of income tax arising from the translation of thecompany’s Indian rupee functional currency consolidated financial statements to the U.S. dollar presentationcurrency are recognized in other comprehensive income (loss) and included in accumulated other comprehensiveincome (loss) until recycled to the consolidated statements of earnings in the future. Accumulated othercomprehensive income (loss) (net of income taxes) is included on the consolidated balance sheets as a component oftotal common shareholders’ equity and is comprised of unrealized foreign currency translation gains (losses), net ofincome taxes.
Consolidated statements of cash flowsThe company’s consolidated statements of cash flows are prepared in accordance with the indirect method,classifying cash flows by operating, investing and financing activities.
Cash and cash equivalents – Cash and cash equivalents consists of cash on hand, demand deposits with banksand other short term highly liquid investments with maturities of three months or less when purchased, and excludecash and short term highly liquid investments that are restricted. The carrying value of cash and cash equivalentsapproximates fair value.
Restricted cash – Restricted cash primarily consists of amounts required to be maintained on deposit with asyndicate of Canadian banks to support the term loan (see note 7) and for regulatory requirements related to theacquisition of certain Indian Investments.
Cash and InvestmentsCash and investments include cash and cash equivalents, restricted cash, short term investments, bonds andcommon stocks. Management determines the appropriate classifications of investments at their acquisition date.
Classification – Short term investments, equity instruments and debt instruments are classified as FVTPL.
Recognition and measurement – The company recognizes cash and investments at fair value upon initialrecognition. Purchases and sales are recognized on the trade date, which is the date on which the company commitsto purchase or sell the investments.
Investments classified as FVTPL are carried at fair value on the consolidated balance sheets with realized gains andlosses and unrealized gains and losses recorded in net realized gains (losses) on investments and net unrealized gains(losses) on investments, respectively, in the consolidated statements of earnings and as operating activities in theconsolidated statements of cash flows. Interest and dividends earned on investments are included inthe consolidated statements of earnings in interest and dividends, respectively, and as operating activities in theconsolidated statements of cash flows.
Transactions pending settlement are reflected on the consolidated balance sheets in other assets or in accountspayable and accrued liabilities. Transaction costs related to investments classified as FVTPL are expensed as incurred.An investment is derecognized when the rights to receive cash flows from the investment have expired or have beentransferred and when the company has transferred substantially all the risks and rewards of ownership.
Short term investments – Short term investments are investments with maturity dates between three monthsand twelve months when purchased.
Determination of fair value – Fair values for substantially all of the company’s investments are measured usingmarket or income approaches. Considerable judgment may be required in interpreting market data used to developestimates of fair value. Accordingly, actual values realized in future market transactions may differ from the estimatespresented in these consolidated financial statements. The use of different market assumptions and/or valuationmethodologies may have a material effect on the estimated fair values. The fair values of investments are based onbid prices for financial assets and ask prices for financial liabilities.
28
The company categorizes its fair value measurements according to a three level hierarchy described below:
Level 1 – Inputs represent unadjusted quoted prices for identical instruments exchanged in active markets.
Level 2 – Inputs include directly or indirectly observable inputs (other than Level 1 inputs) such as quoted pricesfor similar financial instruments exchanged in active markets, quoted prices for identical or similar financialinstruments exchanged in inactive markets and other market observable inputs.
Level 3 – Inputs include unobservable inputs used in the measurement of financial instruments. Management isrequired to use its own assumptions regarding unobservable inputs as there is little, if any, market activity inthese instruments or related observable inputs that can be corroborated at the measurement date.
Transfers between fair value hierarchy categories are considered effective from the beginning of the reporting periodin which the transfer is identified.
Valuation techniques used by the company’s independent pricing service providers and third party broker-dealersinclude use of prices from similar instruments where observable market prices exist, discounted cash flow analysis,option pricing models, and other valuation techniques commonly used by market participants. The companyassesses the reasonableness of pricing received from these third party sources by comparing the fair values received torecent transaction prices for similar assets where available, to industry accepted discounted cash flow models (thatincorporate estimates of the amount and timing of future cash flows and market observable inputs such as creditspreads and discount rates) and to option pricing models (that incorporate market observable inputs including thequoted price, volatility and dividend yield of the underlying security and the risk free rate).
All other financial assets and liabilities, primarily comprised of interest receivable, income taxes refundable(payable), other assets, accounts payable and accrued liabilities, payable to related parties, and term loan, aremeasured at amortized cost which approximates fair value. Under the amortized cost method, financial assets andliabilities reflect the amount required to be received or paid and discounted when appropriate, at the contract’seffective interest rate.
Net realized and unrealized gains (losses) on investmentsNet realized gains (losses) arising on the disposition of investments and net unrealized gains (losses) arising on there-measurement of investments at fair value are included in net realized gains (losses) on investments and netunrealized gains (losses) on investments in the consolidated statements of earnings, respectively.
Interest and dividend incomeInterest income is recognized on an accrual basis using the effective interest method and includes bank interest andinterest from investments in debt instruments, with the exception of the Sanmar bonds where interest income isincluded in its fair value measurement (see note 5). Interest receivable is shown separately on the consolidatedbalance sheets based on the debt instruments’ stated rates of interest. Dividends from equity investments arerecognized when the company’s right to receive payment is established.
Income taxesThe provision for (recovery of) income taxes for the period comprises current and deferred income tax. Income taxesare recognized in the consolidated statements of earnings, except to the extent that they relate to items recognized inother comprehensive income or directly in equity. In those cases, the related taxes are also recognized in othercomprehensive income or directly in equity, respectively.
Current income tax is calculated on the basis of the tax laws enacted or substantively enacted at the end of thereporting period in the countries where the company and its subsidiaries and its associates operate and generatetaxable income.
Deferred income tax is calculated under the liability method whereby deferred income tax assets and liabilities arerecognized for temporary differences between the financial statement carrying amounts of assets and liabilities andtheir respective income tax bases at the current substantively enacted tax rates. Changes in deferred income taxassociated with components of other comprehensive income are recognized directly in other comprehensive incomewhile all other changes in deferred income tax are included in the provision for (recovery of) income taxes in theconsolidated statements of earnings.
29
FAIRFAX INDIA HOLDINGS CORPORATION
Deferred income tax assets are recognized to the extent that it is probable that future taxable profit will be availableagainst which the temporary differences can be utilized. Carry forwards of unused losses or unused tax credits are taxeffected and recognized as deferred tax assets when it is probable that future taxable profits will be available againstwhich these losses or tax credits can be utilized.
Deferred income tax is not recognized for withholding tax and other taxes that may be payable on unremittedearnings for those Indian Investments that would otherwise be considered a subsidiary or an investment in associate(‘‘certain Indian Investments’’) if not for the application of investment entity accounting, where the company hasdetermined it is not probable those earnings will be repatriated in the foreseeable future.
Current and deferred income tax assets and liabilities are offset when the income taxes are levied by the sametaxation authority and there is a legally enforceable right of offset.
Other assetsOther assets primarily consist of pending settlement of sales of investments and prepaid expenses.
Term loanBorrowings are recognized initially at fair value, net of transaction costs incurred, and subsequently carried atamortized cost. Interest expense on borrowings is recognized in the consolidated statements of earnings using theeffective interest method.
Contingencies and commitmentsA provision is recognized for a contingent liability, commitment or financial guarantee when the company has apresent legal or constructive obligation as a result of a past event, it is probable that an outflow of resourcesembodying economic benefits will be required to settle the obligation and a reliable estimate can be made of theamount of the obligation. Provisions are discounted when the effect of the time value of money is consideredsignificant.
EquityCommon stock issued by the company is classified as equity when there is no contractual obligation to transfer cashor other financial assets to the holder of the shares. Incremental costs directly attributable to the issue or repurchasefor cancellation of equity instruments are recognized in equity, net of tax.
Treasury shares are equity instruments reacquired by the company which have not been canceled and are deductedfrom equity on the consolidated balance sheets, regardless of the objective of the transaction. The company acquiresits own subordinate voting shares on the open market for share-based payment awards. No gain or loss is recognizedin the consolidated statements of earnings on the purchase, sale, issue or cancellation of treasury shares.Consideration paid or received is recognized directly in equity.
Dividends and other distributions to holders of the company’s equity instruments are recognized directly in equity.
Share-based paymentsThe company has restricted share plans or equivalent for its directors with vesting periods of up to ten years from thedate of grant. The fair value of restricted share awards on the grant date is amortized to compensation expense overthe vesting period, with a corresponding increase in share-based payments, net in the consolidated statements ofchanges in equity. At each balance sheet date, the company reviews its estimates of the number of restricted shareawards expected to vest.
Net earnings (loss) per shareBasic net earnings (loss) per share is calculated by dividing the net earnings (loss) by the weighted average number ofsubordinate and multiple voting shares issued and outstanding during the period, excluding subordinate votingshares purchased by the company and held as treasury shares. Diluted net earnings (loss) per share is calculated usingthe weighted average number of subordinate and multiple voting shares that would have been outstanding duringthe period had all potential subordinate and multiple voting shares been issued at the beginning of the period, orwhen other potential dilutive instruments were granted or issued, if later.
Comparative figuresCertain prior year comparative figures have been reclassified to be consistent with current year’s presentation.
30
New accounting pronouncements adopted in 2016The company adopted the following amendments, effective January 1, 2016. These changes were adopted inaccordance with the applicable transitional provisions of each amendment, and did not have a significant impact onthe consolidated financial statements.
IFRS Annual Improvements 2012-2014In September 2014 the IASB issued a limited number of amendments to clarify the requirements of fourIFRS standards.
Disclosure Initiative (Amendments to IAS 1)In December 2014 the IASB issued certain narrow-focus amendments to IAS 1 Presentation of Financial Statements toclarify existing presentation and disclosure requirements.
New accounting pronouncements issued but not yet effectiveThe following new standards have been issued by the IASB and were not yet effective for the fiscal year beginningJanuary 1, 2016. The company is currently evaluating their impact on its consolidated financial statements and doesnot expect to adopt any of them in advance of their respective effective dates.
Recognition of Deferred Tax Assets for Unrealised Losses (Amendments to IAS 12)In January 2016 the IASB issued amendments to IAS 12 Income Taxes to clarify the requirements on recognition ofdeferred tax assets for unrealized losses. The amendments are effective for annual periods beginning on or afterJanuary 1, 2017, with retrospective application.
Disclosure Initiative (Amendments to IAS 7)In January 2016 the IASB issued amendments to IAS 7 Statement of Cash Flows that require additional disclosuresaround changes in liabilities arising from financing activities, including both changes arising from cash flow andnon-cash changes. These amendments are effective for annual periods beginning on or after January 1, 2017, withprospective application.
Foreign Currency Transactions and Advance Consideration (‘‘IFRIC 22’’)In December 2016 the IASB issued an interpretation by the IFRS Interpretations Committee to clarify the accountingfor transactions that include the receipt or payment of advance consideration in a foreign currency. IFRIC 22 iseffective for annual periods beginning on or after January 1, 2018, with a choice of prospective or retrospectiveapplication.
IFRS 9 Financial Instruments (‘‘IFRS 9’’)In July 2014 the IASB issued the complete version of IFRS 9 which supersedes the 2010 version of IFRS 9 currentlyapplied by the company. This complete version is effective for annual periods beginning on or after January 1, 2018,with retrospective application, and includes: requirements for the classification and measurement of financial assetsand liabilities; an expected credit loss model that replaces the existing incurred loss impairment model; and newhedge accounting guidance.
4. Critical Accounting Estimates and Judgments
In the preparation of the company’s consolidated financial statements, management has made a number of criticalaccounting estimates and judgments which are discussed below. Estimates and judgments are continually evaluatedand are based on historical experience and other factors, including expectations of future events that are believed tobe reasonable under the circumstances.
Where estimates were made, the reported amounts of assets, liabilities, income and expenses may differ from theamounts that would otherwise be reflected if the ultimate outcome of all uncertainties and future earnings wereknown at the time the consolidated financial statements were prepared.
Determination of investment entity statusAn entity that meets the IFRS 10 Consolidated Financial Statements (‘‘IFRS 10’’) definition of an investment entity isrequired to measure its investments in subsidiaries at FVTPL rather than consolidate them (other than thosesubsidiaries that provide services to the company).
31
FAIRFAX INDIA HOLDINGS CORPORATION
An investment entity is an entity that obtains funds from one or more investors for the purpose of providing themwith investment management services, commits to its investors that its business purpose is to invest funds solely forreturns from capital appreciation, investment income, or both, and measures and evaluates the performance ofsubstantially all of its investments on a fair value basis. The company has concluded that it continues to meet thedefinition of an investment entity, as its strategic objective of investing in Indian Investments and providinginvestment management services to investors for the purpose of generating returns in the form of long term capitalappreciation, remains unchanged. The company has also determined that FIH Mauritius and FIH Private continue toprovide investment related services to the company and should continue to be consolidated.
The company may from time to time seek to realize on any of its Indian Investments. The circumstances under whichthe company may sell some or all of its investments include: (i) where the company believes that the IndianInvestments are fully valued or that the original investment thesis has played out; or (ii) where the company hasidentified other investment opportunities which it believes present more attractive risk-adjusted returnopportunities and additional capital is needed to make such alternative investments.
The company would exit its private investments either through initial public offerings or private sales. For publiclytraded investments, exit strategies may include selling the investments through private placements or inpublic markets.
Valuation of Private InvestmentsThe valuation of the company’s private investments are assessed at the end of each reporting period.
For each private investment completed during the reporting period, the transaction price is generally considered tobe representative of fair value, subject to the background of the investment, changes in market conditions andfactors specific to the investee. The company monitors various factors impacting the businesses of its investees andbelieves the transaction price of a private investment may no longer be an appropriate estimate of fair value uponoccurrence of events such as significant under or over achievement of budgeted earnings; changes to the marketsector; regulatory revisions; movements in interest rates, foreign exchange rates and other market variables; and thepassage of time.
Estimates and judgments for private investments are continually evaluated and are based on historical experienceand other factors, including expectations of future events that are believed to be reasonable under the circumstances.The company utilizes Fairfax’s valuation personnel to assist with the valuation of its investment portfolio. Detailedvaluations are performed for those financial instruments that are priced internally, while external pricing receivedfrom independent pricing service providers and third party broker-dealers are evaluated by the company forreasonableness. The company does not use independent valuation experts to determine the fair value of itsinvestments. The company’s Chief Financial Officer oversees the valuation function and regularly reviews valuationprocesses and results, including at each quarterly reporting period. Significant valuation matters, particularly thoserequiring extensive judgment, are communicated to the company’s Audit Committee.
Notwithstanding the rigour of the company’s valuation processes, the valuation of private investments inherentlyhas estimation uncertainty and different assumptions could lead to significantly different fair values. Refer to note 5for disclosure on the valuation of the company’s private investments.
Income taxesThe company is subject to income taxes in Canada, Mauritius and India, and the company’s determination of its taxliability or receivable is subject to review by those applicable tax authorities. The company has made a criticaljudgment that it is able to control the timing of the repatriation of certain Indian Investments’ unremitted earningsdisclosed in note 10 and has no plans to repatriate these earnings in the foreseeable future; as a consequence no taxhas been recorded in these consolidated financial statements on these unremitted earnings. While the companybelieves its tax positions to be reasonable, where the company’s interpretations differ from those of tax authorities orthe timing of realization is not as expected, the provision for income taxes may increase or decrease in future periodsto reflect actual experience. The company has tax specialist personnel responsible for assessing the income taxconsequences of planned transactions and events, and undertaking the appropriate tax planning.
Realization of deferred income tax assets is dependent upon the generation of taxable income in those jurisdictionswhere the relevant tax losses and temporary differences exist. Tax legislation of each jurisdiction in which thecompany operates is interpreted to determine the provision for (recovery of) income taxes and expected timing ofthe reversal of deferred income tax assets and liabilities. The company has made a critical judgment that certain
32

deferred taxes disclosed in note 10 should not be recorded as an asset because it is not presently likely that they willbe realized.
Functional currencyAt the time of its incorporation on November 25, 2014 the company had determined the currency of its primaryeconomic environment was the U.S. dollar as the proceeds from the IPO Offerings were denominated in U.S. dollars.The deployment of the IPO proceeds into Indian Investments, denominated in Indian rupees, were subject to marketconditions and the availability of attractive investment opportunities.
During the third quarter of 2015 a substantial portion of the proceeds raised through the IPO Offerings (initiallyinvested in U.S. dollar denominated treasury bills) were reinvested into Indian Investments. Accordingly, thecompany reassessed its functional currency and adopted the Indian rupee as its functional currency on a prospectivebasis effective October 1, 2015. All balances in the consolidated financial statements were translated into Indianrupees using the exchange rate prevailing at the date of the change.
There was no change to the functional currency of the two consolidated subsidiaries, FIH Mauritius and FIH Private,which is the Indian rupee.
5. Indian Investments
Public Indian Investments
Investment in Fairchem Speciality Limited
On February 8, 2016 Fairfax India, through its wholly-owned subsidiary, acquired 44.7% of the common shares ofFairchem Speciality Limited (‘‘Fairchem’’, formerly known as Adi Finechem Limited) at a price per share of $3.13(212 Indian rupees) for total consideration of $19,409 (approximately 1.3 billion Indian rupees). See ‘Private IndianInvestments’ under the heading of ‘Investment in Privi Organics Limited’ within this note for details on a mergerarrangement involving Fairchem and Privi Organics Limited.
At December 31, 2016 the company held 44.9% of the outstanding common shares of Fairchem.
Fairchem’s shares are listed on both the Bombay Stock Exchange and the National Stock Exchange of India.
Fairchem is a specialty chemical manufacturer located in Ahmedabad, India. Fairchem manufactures oleochemicalsused in the paints, inks and adhesives industries, as well as intermediate nutraceutical and health products. It hasdeveloped an in-house technology that uses machinery designed and manufactured by leading European companiesto separate and convert waste generated during the production of soy, sunflower, corn and cotton oils into valuablenutraceutical and fatty acids.
Investment in IIFL Holdings Limited
On December 1, 2015 Fairfax India acquired 68,788,445 common shares of IIFL Holdings Limited (‘‘IIFL’’)representing a 21.9% ownership interest at a price of $2.93 per share (195 Indian rupees) for total consideration of$201,559 (approximately 13.4 billion Indian rupees). In accordance with regulations of the Securities and ExchangeBoard of India (‘‘SEBI’’), the company placed $3,600 (237.1 million Indian rupees) in escrow to fund anycontingencies. The full amount of the funds in escrow were released in the first quarter of 2016.
Prior to the company’s investment in IIFL, Fairfax, through its subsidiaries, owned 8.9% of the issued andoutstanding IIFL common shares, and had an economic interest in another 5.2% of IIFL common shares throughderivative instruments (all acquired prior to the establishment of Fairfax India).
FIH Mauritius and certain Fairfax affiliates provided undertakings to SEBI pursuant to which they agreed not toundertake certain activities so as to avoid acquiring control of IIFL subsequent to purchases made by the company. Inparticular, FIH Mauritius and the Fairfax affiliates have undertaken not to exercise voting rights on IIFL shareholderresolutions for any IIFL shares exceeding 25% of the issued and outstanding IIFL common shares at the time ofvoting, effectively limiting voting to 25% even in cases where FIH Mauritius and the Fairfax affiliates own more than25% of the IIFL shares. FIH Mauritius and the Fairfax affiliates have also undertaken not to purchase additional IIFLshares if the total IIFL shares owned by FIH Mauritius and the Fairfax affiliates would exceed approximately 36% ofthe issued and outstanding IIFL common shares unless FIH Mauritius and the Fairfax affiliates make an open offer orobtain the prior consent of SEBI for such an acquisition.
33

FAIRFAX INDIA HOLDINGS CORPORATION
At December 31, 2016 the company held 21.7% of the outstanding common shares of IIFL. On February 8, 2017 thecompany acquired a 4.99% common share equity interest in IIFL, see ‘Subsequent to December 31, 2016’ under theheading of ‘Investment in IIFL Holdings Limited’ within this note for further details.
IIFL’s shares are listed on both the Bombay Stock Exchange and the National Stock Exchange of India.
IIFL is a publicly traded, diversified financial services holding company located in Mumbai, India with principal linesof business in a non-banking finance company, wealth management, and capital markets and other activities(comprised of retail broking, institutional equities, investment banking and financial products distribution).
Private Indian Investments
Investment in National Stock Exchange of India Limited
In the third quarter of 2016 the company, through its wholly-owned subsidiaries, acquired a 1.0% common shareequity interest in the National Stock Exchange of India Limited (‘‘NSE’’) for total consideration of $26,783(approximately 1.8 billion Indian rupees). The initial transaction price was considered to approximate fair value atyear end due to the proximity of the transaction closing date to December 31, 2016 and the absence of changes infactors impacting fair value since the closing date.
NSE, a private company located in Mumbai, India, is India’s largest stock exchange covering various cities and townsacross the country. In addition to being a platform for all exchange-traded financial products in India, NSE’s flagshipindex, Nifty50, is used extensively by investors in India and around the world as a barometer of the Indian capitalmarkets.
Investment in Privi Organics Limited
On August 26, 2016 the company, through its wholly-owned subsidiaries, acquired a 50.8% common share equityinterest in Privi Organics Limited (‘‘Privi’’) for total consideration of $54,975 (approximately 3.7 billionIndian rupees).
Privi, a private company located in Mumbai, India, is a supplier of aroma chemicals to the fragrance industry. Privi’sworld-class products are the result of its very strong research and development team that has proven expertise indeveloping new products, customizing aromas per customer specifications, scaling up products from basic researchto commercial scale, and designing process improvements to drive quality and cost optimization.
On July 12, 2016 the boards of directors of Fairchem and Privi approved a merger arrangement (the ‘‘Merger’’)involving the two companies, which is expected to bring significant diversification and synergies to both. InDecember 2016 and February 2017 shareholder and regulatory approvals were received, respectively, for the Merger.Under the terms of the Merger, Privi shareholders will receive 27 common equity shares and 27 compulsorilyconvertible preference shares (‘‘CCPS’’) of the merged entity for every 40 Privi shares exchanged (‘‘swap ratio’’). Finalclosing of the Merger is subject to customary closing conditions, which involve the share exchange, and is expectedto occur by the end of the first quarter of 2017. Fairfax India will own approximately 49% of the merged entity, afterfactoring in the conversion of the CCPS. The swap ratio was recommended in a valuation report dated July 12, 2016issued by M/s. Walker Chandiok & Co. LLP, Independent Chartered Accountants (a member firm of Grant Thorntonin India). ICICI Securities Limited issued a fairness opinion on the swap ratio. Fairchem and Privi Board of Directorapproval was received on the swap ratio.
At December 31, 2016 the company prepared a valuation model to determine the value of its 9,517,042 Privicommon shares using the quoted bid price of Fairchem and the swap ratio. The company’s internal valuation modelindicated a value of $94,292 and an unrealized gain of $40,392, which was not recorded in the consolidatedstatements of earnings as the Merger still required regulatory approval at December 31, 2016. The initial transactionprice was considered to approximate fair value as there had been no significant changes to Privi’s business, capitalstructure and operating environment and the key assumptions in the company’s acquisition valuation modelcontinued to be valid due to the proximity of the transaction closing date to December 31, 2016.
Investment in Sanmar Chemicals Group
On April 8, 2016 the company announced that, through its wholly-owned subsidiaries, it had agreed to invest$300 million into Sanmar through a combination of equity and debt securities resulting in a 30% common shareequity interest in Sanmar. On April 28, 2016 the company acquired the first tranche of $250 million, comprised of
34
$1 million in equity and $249 million in bonds. On September 26, 2016 the company acquired the second tranche of$50 million in bonds.
Sanmar is one of the largest suspension Poly Vinyl Chloride (‘‘PVC’’) manufacturers in India and is in the process ofexpanding its PVC capacity in Egypt. Sanmar also manufactures caustic soda, chloromethanes, refrigerant gases,industrial salt and specialty chemical intermediates.
During 2016 management undertook a valuation study to formalize valuation models and determine theappropriate separate fair values for its bond and common share investments in Sanmar. The fair value of the Sanmarinvestments cannot be derived from an active market and accordingly, are determined using industry acceptedvaluation techniques and models. Market observable inputs are used where possible, with unobservable inputs usedwhere necessary. Use of unobservable inputs can involve significant judgment and may materially affect the reportedfair value of the Sanmar investments.
Sanmar Common Stock
At December 31, 2016 the company estimated fair value using a discounted cash flow analysis based on multi-yearfree cash flow projections with assumed after-tax discount rates ranging from 15.5% to 22.5% and long term growthrates ranging from 2.0% to 3.6%. Free cash flow projections were based on EBITDA projections from financialinformation for Sanmar’s three main business operations that had been prepared in the fourth quarter of 2016 bySanmar’s management. Discount rates were based on the company’s assessment of risk premiums to the appropriaterisk-free rate of the economic environment in which Sanmar operates. At December 31, 2016 the company’s internalvaluation model indicated that the fair value of the common shares was $440, resulting in an unrealized loss of $545which was recorded in net unrealized gains on investments in the consolidated statements of earnings.
Sanmar Bonds
At December 31, 2016 the company estimated fair value using an industry accepted discounted cash flow and optionpricing model that incorporated Sanmar’s assumed credit spread of 7.1% and certain redemption options embeddedin the bonds. The assumed credit spread was based on credit spreads of industry comparables with company specificadjustments for credit risk premium. At December 31, 2016 the company’s internal valuation model indicated thatthe fair value of the bonds was $299,093, resulting in an unrealized gain of $6,907 which was recorded in netunrealized gains on investments in the consolidated statements of earnings.
Investment in National Collateral Management Services Limited
On August 19, 2015 the company, through its wholly-owned subsidiary, acquired a 73.6% ownership interest inNational Collateral Management Services Limited (‘‘NCML’’) by acquiring 23,326,335 newly issued common sharesand 71,050,691 common shares from certain existing shareholders for an aggregate investment of $124,244(approximately 8.1 billion Indian rupees).
Subsequently, the company acquired an additional 14.5% ownership interest in NCML by acquiring18,618,420 common shares from minority shareholders for $24,472 (approximately 1.6 billion Indian rupees). AtDecember 31, 2016 the company held 88.1% of the outstanding common shares of NCML.
At December 31, 2015 the initial transaction price was considered to approximate fair value as there had been nosignificant changes to NCML’s business, capital structure and operating environment and the key assumptions in thecompany’s acquisition valuation model continued to be valid due to the proximity of the transaction closing date tothe year end. During 2016 the company refined its internal valuation model used in the determination of NCML’sfair value. The fair value of NCML cannot be derived from an active market and accordingly, is determined usingindustry accepted valuation techniques and models. Market observable inputs are used where possible, withunobservable inputs used where necessary. Use of unobservable inputs can involve significant judgment and maymaterially affect the reported fair value of NCML.
At December 31, 2016 the company estimated fair value using a discounted cash flow analysis based on multi-yearfree cash flow projections with assumed after-tax discount rates ranging from 11.9% to 15.8% and a long termgrowth rate of 6.0%. Free cash flow projections were based on EBITDA projections from financial information forNCML’s business units that had been prepared in the fourth quarter of 2016 by NCML’s management. Discount rateswere based on the company’s assessment of risk premiums to the appropriate risk-free rate of the economicenvironment in which NCML operates. At December 31, 2016 the company’s internal valuation model indicated
35

FAIRFAX INDIA HOLDINGS CORPORATION
that the fair value of the common shares was $146,586, resulting in an unrealized gain of $3,879 which was recordedin net unrealized gains on investments in the consolidated statements of earnings.
NCML is a private agricultural commodities storage company headquartered in Gurgaon, India that operates in theagriculture value chain by offering end-to-end solutions in grain procurement, testing, storage and collateralmanagement. In 2016 NCML launched its wholly-owned subsidiary, NCML Finance Pvt. Ltd, which focuses on ruraland agri-business finance.
Subsequent to December 31, 2016
Public Indian Investments
Investment in IIFL Holdings Limited
On February 8, 2017 the company, through its wholly-owned subsidiaries, acquired 15,853,000 common sharesrepresenting a 4.99% equity interest in IIFL for total consideration of $75,175 (5.1 billion Indian rupees). Inconnection with the transaction, Fairfax, through its subsidiaries, disposed of derivative instruments representing aneconomic interest of 4.99% in IIFL.
In accordance with regulations of the SEBI and the National Stock Exchange of India, the transaction was subject tocertain sale and purchase pricing guidelines and, as a result, the total consideration paid per share approximated thefair market value of the common share equity interest acquired. After giving effect to the shares acquired, thecompany held 26.7% of the outstanding common shares of IIFL.
Private Indian Investments
Investment in Saurashtra Freight Private Limited
On February 14, 2017 the company, through its wholly-owned subsidiaries, acquired a 51.0% common share equityinterest in Saurashtra Freight Private Limited (‘‘Saurashtra’’), a private company, for cash consideration of $30,018(2.0 billion Indian rupees).
Saurashtra runs the largest container freight station at Mundra port (Gujarat), the second largest and fastest growingport in India. Saurashtra’s container freight station business provides services such as moving of containers to andfrom the port, stuffing/destuffing of containers, cargo storage and transportation of cargo to the end customer as wellas the storage, maintenance and repair of empty containers.
Investment in Bangalore International Airport Limited
On March 28, 2016 the company and Fairfax, through their wholly-owned subsidiaries, announced that they willcollectively acquire 33.0% of the common shares of Bangalore International Airport Limited (‘‘BIAL’’), a privatecompany, from Bangalore Airport & Infrastructure Developers Private Limited, a wholly-owned subsidiary of GVKPower and Infrastructure Limited (‘‘GVK’’) for an aggregate investment of approximately $330 million at currentexchange rates (approximately 22 billion Indian rupees). Fairfax, through a wholly-owned subsidiary, entered into aseparate share purchase agreement to acquire an additional 5.0% common share equity interest from FlughafenZurich AG (‘‘Zurich’’) for approximately $49 million. The acquisition of the additional 5.0% common share equityinterest from Zurich in BIAL can be acquired by Fairfax or the company and is conditional upon the companyacquiring the 33.0% common share equity interest from GVK.
Fairfax India is permitted to complete up to two Indian Investments where such investment would be less than orequal to 25% of the company’s total assets (see note 11 under the heading ‘Concentration Risk’). On January 13, 2017the company received net proceeds of $493,504 from an underwritten public offering and private placements(see note 8) that resulted in an increase in the company’s total assets and investment concentration restriction limit.After giving effect to this transaction, the investment concentration restriction limit increased providing thecompany with the ability to acquire the total 38.0% investment in BIAL. The anticipated cost for the 38.0% commonshare equity interest in BIAL is approximately $379 million (approximately 25 billion Indian rupees).
36

As of March 10, 2017 certain conditions to closing remain outstanding and there is no certainty as to if or when suchconditions, consents and approvals will be satisfied or waived. Such conditions, consents and approvals that remainoutstanding primarily include finalizing certain lending arrangements between GVK and its lenders, approval fromcertain government authorities and receipt of a no-objection certificate from a relevant authorized dealer under theForeign Exchange Management Act, 1999, with respect to permitting a pledge of shares in connection with the BIALTransaction.
BIAL owns and operates the Kempegowda International Airport Bengaluru (‘‘KIAB’’), under a 30+30 year concessionagreement from the Government of India. KIAB has the distinction of being the first airport in India that was built tothe highest international standards by the private sector under a public-private partnership.
6. Cash and Investments
Fair Value Disclosures
The company’s use of quoted market prices (Level 1), valuation models using observable market information asinputs (Level 2) and valuation models without observable market information as inputs (Level 3) in the valuation ofsecurities by type of issuer was as follows:
December 31, 2016 December 31, 2015
Significant Total fair Significant Total fairother Significant value of other Significant value of
Quoted observable unobservable Total fair assets in Quoted observable unobservable Total fair assets inprices inputs inputs value of Indian rupees prices inputs inputs value of Indian rupees
(Level 1) (Level 2) (Level 3) assets (in thousands) (Level 1) (Level 2) (Level 3) assets (in thousands)
Cash and cashequivalents(1) 146,960 – – 146,960 9,974,168 12,464 – – 12,464 824,597
Restricted cash(2) 18,810 – – 18,810 1,276,632 6,457 – – 6,457 427,191
165,770 – – 165,770 11,250,800 18,921 – – 18,921 1,251,788
Short term investments –U.S. treasury bills(3) 27,428 – – 27,428 1,861,558 50,143 – – 50,143 3,317,267
Bonds:
Government of India(4) – 130,317 – 130,317 8,844,600 – 123,448 – 123,448 8,166,876
Indian corporate(4) – 99,447 – 99,447 6,749,515 – 389,341 – 389,341 25,757,320
Sanmar – – 299,093 299,093 20,299,423 – – – – –
– 229,764 299,093 528,857 35,893,538 – 512,789 – 512,789 33,924,196
Common stocks:
IIFL 265,951 – – 265,951 18,050,088 220,747 – – 220,747 14,603,787
NCML – – 146,586 146,586 9,948,814 – – 146,445 146,445 9,688,230
Privi(5) – – 54,315 54,315 3,686,331 – – – – –
Fairchem 45,488 – – 45,488 3,087,261 – – – – –
NSE(5) – – 26,504 26,504 1,798,824 – – – – –
Sanmar – – 440 440 29,871 – – – – –
Investment funds(6) – – – – – – 48,445 – 48,445 3,204,956
311,439 – 227,845 539,284 36,601,189 220,747 48,445 146,445 415,637 27,496,973
Total cash andinvestments 504,637 229,764 526,938 1,261,339 85,607,085 289,811 561,234 146,445 997,490 65,990,224
40.0% 18.2% 41.8% 100.0% 100.0% 29.1% 56.2% 14.7% 100.0% 100.0%
(1) Included U.S. treasury bills with maturity dates of less than three months of $126,941 at December 31, 2016 (December 31, 2015 – nil and $4,501 of fixed deposits).
(2) Comprised of a debt service reserve account used to fund term loan interest payments (December 31, 2015 – cash in escrow arising from investments in IIFL ($3,600) and Fairchem($2,857)).
(3) Short term U.S. treasury bills have a maturity date of June 22, 2017 (December 31, 2015 – maturity dates of June 23, 2016 and March 3, 2016).
(4) Priced based on information provided by independent pricing service providers as at December 31, 2016 and December 31, 2015. There was no change in valuation techniques for thesesecurities during 2016.
(5) Initial transaction price was considered to approximate fair value due to the proximity of the transaction closing date to December 31, 2016 and the absence of changes in factorsimpacting fair value since the closing date.
(6) These investment funds were primarily valued based on net asset value statements provided by third party fund managers that were compared to published quotes for the underlyinginvestments. The units of the funds are redeemable and priced daily. There was no change in the valuation technique for investment funds during 2016. At December 31, 2016 allinvestment funds were sold and proceeds pending settlement of sales on investments of $26,525 were included on the consolidated balance sheets as a component of other assets.
37
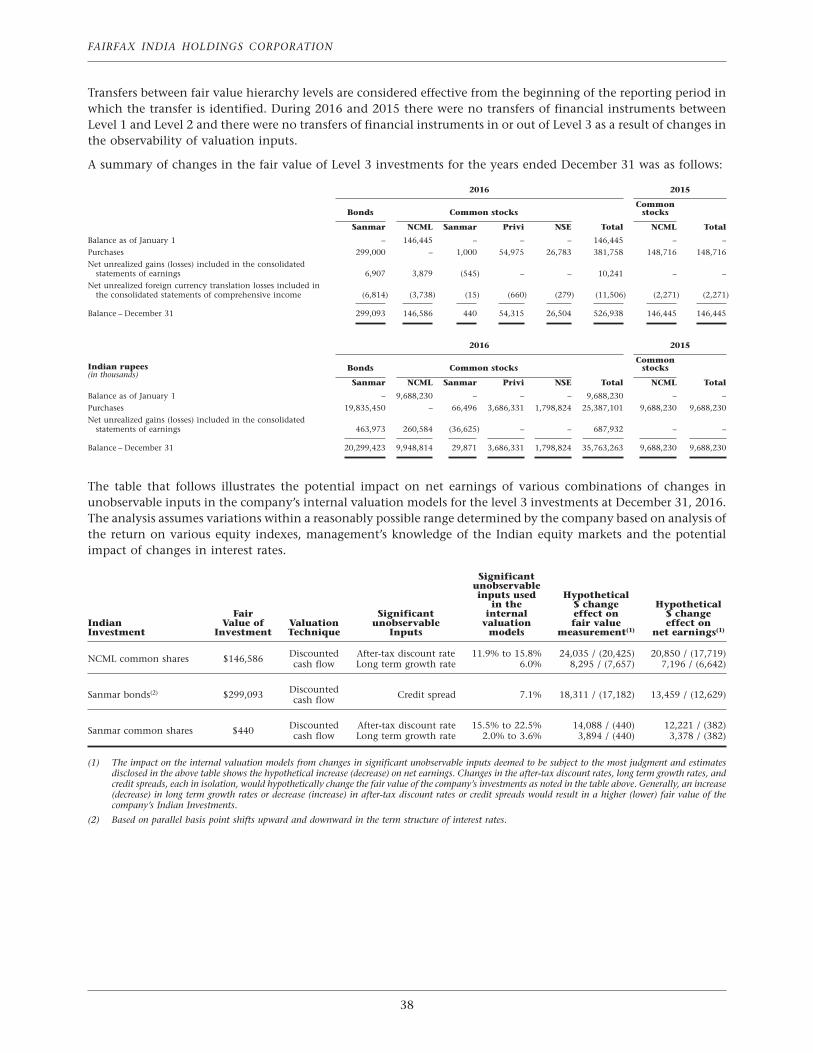
FAIRFAX INDIA HOLDINGS CORPORATION
Transfers between fair value hierarchy levels are considered effective from the beginning of the reporting period inwhich the transfer is identified. During 2016 and 2015 there were no transfers of financial instruments betweenLevel 1 and Level 2 and there were no transfers of financial instruments in or out of Level 3 as a result of changes inthe observability of valuation inputs.
A summary of changes in the fair value of Level 3 investments for the years ended December 31 was as follows:
2016 2015
CommonBonds Common stocks stocks
Sanmar NCML Sanmar Privi NSE Total NCML Total
Balance as of January 1 – 146,445 – – – 146,445 – –
Purchases 299,000 – 1,000 54,975 26,783 381,758 148,716 148,716
Net unrealized gains (losses) included in the consolidatedstatements of earnings 6,907 3,879 (545) – – 10,241 – –
Net unrealized foreign currency translation losses included inthe consolidated statements of comprehensive income (6,814) (3,738) (15) (660) (279) (11,506) (2,271) (2,271)
Balance – December 31 299,093 146,586 440 54,315 26,504 526,938 146,445 146,445
2016 2015
CommonIndian rupees Bonds Common stocks stocks(in thousands)
Sanmar NCML Sanmar Privi NSE Total NCML Total
Balance as of January 1 – 9,688,230 – – – 9,688,230 – –
Purchases 19,835,450 – 66,496 3,686,331 1,798,824 25,387,101 9,688,230 9,688,230
Net unrealized gains (losses) included in the consolidatedstatements of earnings 463,973 260,584 (36,625) – – 687,932 – –
Balance – December 31 20,299,423 9,948,814 29,871 3,686,331 1,798,824 35,763,263 9,688,230 9,688,230
The table that follows illustrates the potential impact on net earnings of various combinations of changes inunobservable inputs in the company’s internal valuation models for the level 3 investments at December 31, 2016.The analysis assumes variations within a reasonably possible range determined by the company based on analysis ofthe return on various equity indexes, management’s knowledge of the Indian equity markets and the potentialimpact of changes in interest rates.
Significantunobservableinputs used Hypothetical
in the $ change HypotheticalFair Significant internal effect on $ change
Indian Value of Valuation unobservable valuation fair value effect onInvestment Investment Technique Inputs models measurement(1) net earnings(1)
Discounted After-tax discount rate 11.9% to 15.8% 24,035 / (20,425) 20,850 / (17,719)NCML common shares $146,586 cash flow Long term growth rate 6.0% 8,295 / (7,657) 7,196 / (6,642)
DiscountedSanmar bonds(2) $299,093 Credit spread 7.1% 18,311 / (17,182) 13,459 / (12,629)cash flow
Discounted After-tax discount rate 15.5% to 22.5% 14,088 / (440) 12,221 / (382)Sanmar common shares $440 cash flow Long term growth rate 2.0% to 3.6% 3,894 / (440) 3,378 / (382)
(1) The impact on the internal valuation models from changes in significant unobservable inputs deemed to be subject to the most judgment and estimatesdisclosed in the above table shows the hypothetical increase (decrease) on net earnings. Changes in the after-tax discount rates, long term growth rates, andcredit spreads, each in isolation, would hypothetically change the fair value of the company’s investments as noted in the table above. Generally, an increase(decrease) in long term growth rates or decrease (increase) in after-tax discount rates or credit spreads would result in a higher (lower) fair value of thecompany’s Indian Investments.
(2) Based on parallel basis point shifts upward and downward in the term structure of interest rates.
38
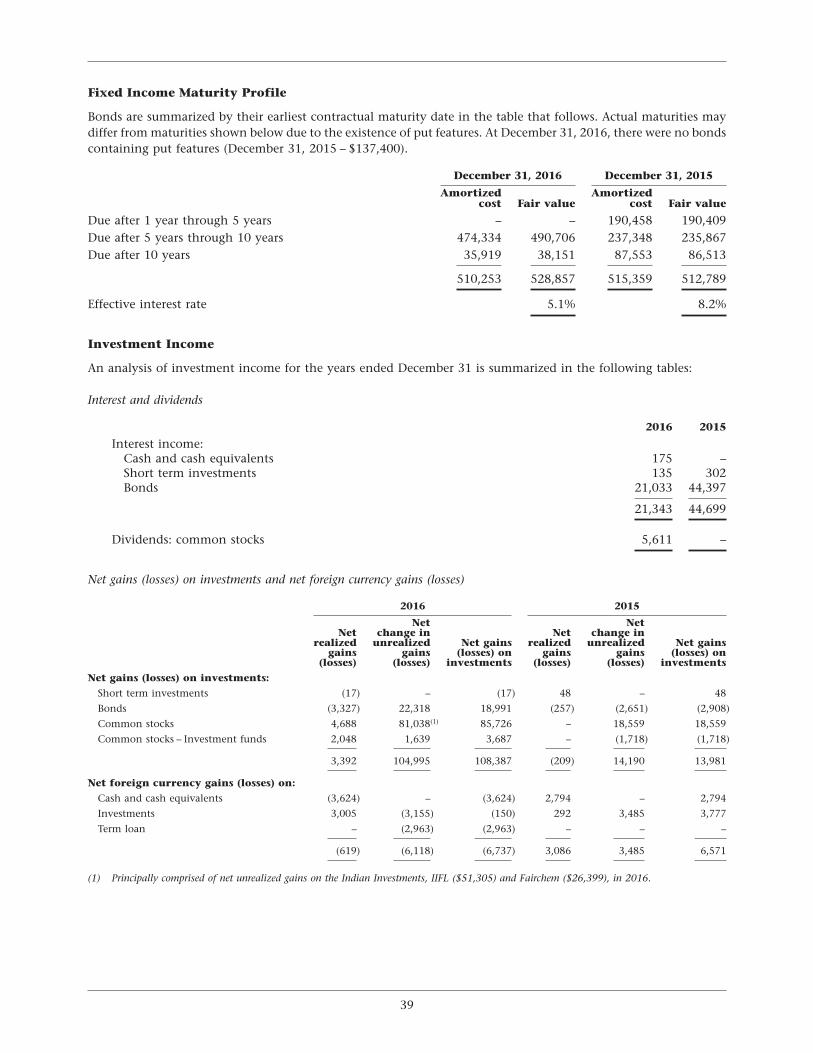
Fixed Income Maturity Profile
Bonds are summarized by their earliest contractual maturity date in the table that follows. Actual maturities maydiffer from maturities shown below due to the existence of put features. At December 31, 2016, there were no bondscontaining put features (December 31, 2015 – $137,400).
December 31, 2016 December 31, 2015
Amortized Amortizedcost Fair value cost Fair value
Due after 1 year through 5 years – – 190,458 190,409Due after 5 years through 10 years 474,334 490,706 237,348 235,867Due after 10 years 35,919 38,151 87,553 86,513
510,253 528,857 515,359 512,789
Effective interest rate 5.1% 8.2%
Investment Income
An analysis of investment income for the years ended December 31 is summarized in the following tables:
Interest and dividends
2016 2015
Interest income:Cash and cash equivalents 175 –Short term investments 135 302Bonds 21,033 44,397
21,343 44,699
Dividends: common stocks 5,611 –
Net gains (losses) on investments and net foreign currency gains (losses)
2016 2015
Net NetNet change in Net change in
realized unrealized Net gains realized unrealized Net gainsgains gains (losses) on gains gains (losses) on
(losses) (losses) investments (losses) (losses) investments
Net gains (losses) on investments:
Short term investments (17) – (17) 48 – 48
Bonds (3,327) 22,318 18,991 (257) (2,651) (2,908)
Common stocks 4,688 81,038(1) 85,726 – 18,559 18,559
Common stocks – Investment funds 2,048 1,639 3,687 – (1,718) (1,718)
3,392 104,995 108,387 (209) 14,190 13,981
Net foreign currency gains (losses) on:
Cash and cash equivalents (3,624) – (3,624) 2,794 – 2,794
Investments 3,005 (3,155) (150) 292 3,485 3,777
Term loan – (2,963) (2,963) – – –
(619) (6,118) (6,737) 3,086 3,485 6,571
(1) Principally comprised of net unrealized gains on the Indian Investments, IIFL ($51,305) and Fairchem ($26,399), in 2016.
39

FAIRFAX INDIA HOLDINGS CORPORATION
7. Term Loan
December 31, 2016 December 31, 2015
Carrying Fair Carrying FairPrincipal value(1) value(2) Principal value value
Secured Term Loan(3) 225,000 223,772 223,772 – – –
(1) Principal net of unamortized issue costs.
(2) Carrying value approximated fair value at December 31, 2016.
(3) Interest bearing at LIBOR plus 350 bps for the first six months, increasing to LIBOR plus 500 bps thereafter.
On September 16, 2016 the company completed a 2-year secured term loan (the ‘‘term loan’’) bearing an interest rateof LIBOR plus 350 to 500 basis points with a syndicate of Canadian banks for $225,000. At December 31, 2016 thecompany used a portion of the net proceeds to complete the second tranche of Sanmar bonds ($50,000, see note 5).The term loan contained a mandatory prepayment clause that became effective when the company received the netproceeds from the Offerings (see note 8), requiring repayment of the $225,000 principal amount of the term loan byMarch 31, 2017.
Under the terms of the term loan, the company is required to maintain a debt service reserve account to fund theterm loan interest payments. The cash held in the debt service reserve account was classified as restricted cash on theconsolidated balance sheets (December 31, 2016 – $18,810). The company is also required to use the term loanproceeds solely for the purposes of funding: (i) investments in Specified Portfolio Companies (comprised of NCML,IIFL, Fairchem, Sanmar, Privi or BIAL); (ii) investments in cash equivalents; (iii) transaction costs, fees and expensesrelated to Specified Portfolio Companies; and (iv) the debt service reserve account. The term loan includes a financialcovenant that requires the company to maintain total common shareholders’ equity of not less than $750,000.
At December 31, 2016 the company was in compliance with the term loan covenants.
In 2016 term loan interest expense of $2,647 and amortization of issue costs of $1,524 (2015 – nil) were included ininterest expense in the consolidated statements of earnings. At December 31, 2016 prepaid interest expense of $543(2015 – nil) was recorded in other assets on the consolidated balance sheets.
8. Total Equity
Total common shareholders’ equity
Authorized Capital
The company’s authorized share capital consists of (i) an unlimited number of multiple voting shares that may onlybe issued to Fairfax or its affiliates; (ii) an unlimited number of subordinate voting shares; and, (iii) an unlimitednumber of preference shares, issuable in series. Except as provided in any special rights or restrictions attaching toany series of preference shares issued from time to time, the preference shares will not be entitled to vote at anymeeting of the shareholders of the company.
Issued Capital
Issued capital at December 31, 2016 included 30,000,000 (December 31, 2015 – 30,000,000) multiple voting sharesand 74,881,031 (December 31, 2015 – 76,678,879) subordinate voting shares without par value prior to deducting52,728 (December 31, 2015 – 43,520) subordinate voting shares reserved in treasury for share-based payment awards.Each subordinate voting share carries one vote per share at all meetings of shareholders except for separate meetingsof holders of another class of shares. Each multiple voting share carries fifty votes per share at all meetings ofshareholders except for separate meetings of holders of another class of shares. Fairfax, through its subsidiaries, ownsall the issued and outstanding multiple voting shares, which are not traded. At December 31, 2016 there were nopreference shares issued.
40
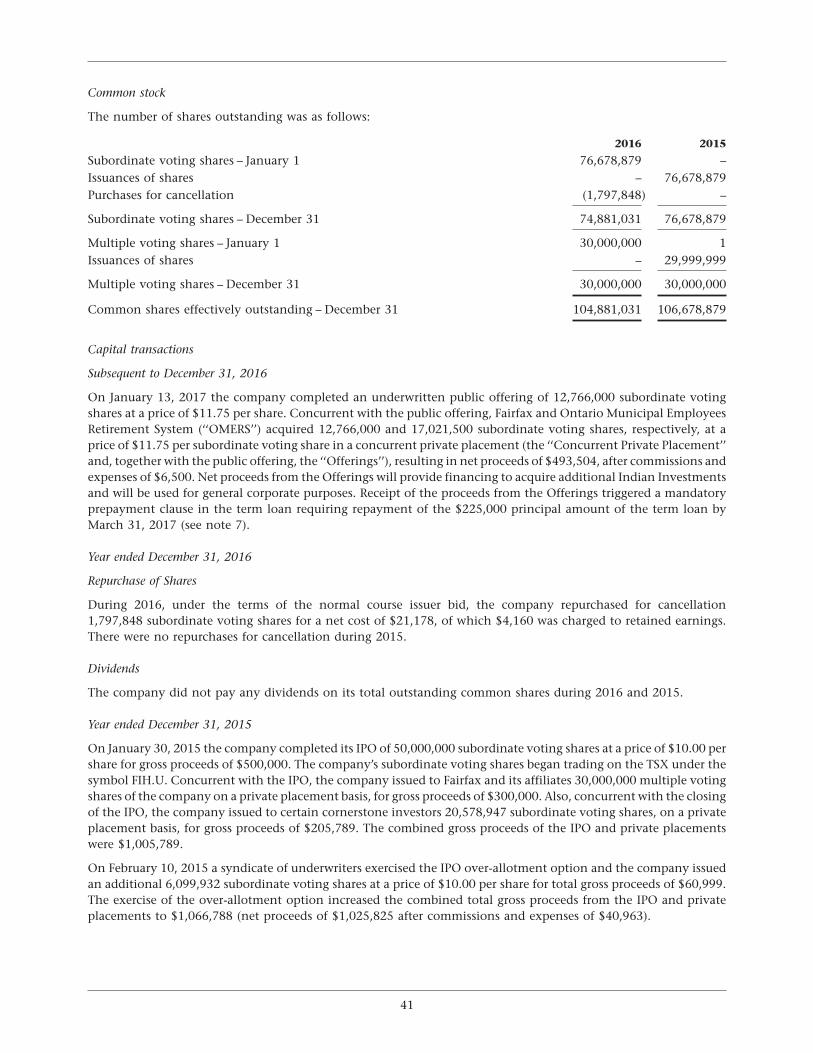
Common stock
The number of shares outstanding was as follows:
2016 2015
Subordinate voting shares – January 1 76,678,879 –Issuances of shares – 76,678,879Purchases for cancellation (1,797,848) –
Subordinate voting shares – December 31 74,881,031 76,678,879
Multiple voting shares – January 1 30,000,000 1Issuances of shares – 29,999,999
Multiple voting shares – December 31 30,000,000 30,000,000
Common shares effectively outstanding – December 31 104,881,031 106,678,879
Capital transactions
Subsequent to December 31, 2016
On January 13, 2017 the company completed an underwritten public offering of 12,766,000 subordinate votingshares at a price of $11.75 per share. Concurrent with the public offering, Fairfax and Ontario Municipal EmployeesRetirement System (‘‘OMERS’’) acquired 12,766,000 and 17,021,500 subordinate voting shares, respectively, at aprice of $11.75 per subordinate voting share in a concurrent private placement (the ‘‘Concurrent Private Placement’’and, together with the public offering, the ‘‘Offerings’’), resulting in net proceeds of $493,504, after commissions andexpenses of $6,500. Net proceeds from the Offerings will provide financing to acquire additional Indian Investmentsand will be used for general corporate purposes. Receipt of the proceeds from the Offerings triggered a mandatoryprepayment clause in the term loan requiring repayment of the $225,000 principal amount of the term loan byMarch 31, 2017 (see note 7).
Year ended December 31, 2016
Repurchase of Shares
During 2016, under the terms of the normal course issuer bid, the company repurchased for cancellation1,797,848 subordinate voting shares for a net cost of $21,178, of which $4,160 was charged to retained earnings.There were no repurchases for cancellation during 2015.
Dividends
The company did not pay any dividends on its total outstanding common shares during 2016 and 2015.
Year ended December 31, 2015
On January 30, 2015 the company completed its IPO of 50,000,000 subordinate voting shares at a price of $10.00 pershare for gross proceeds of $500,000. The company’s subordinate voting shares began trading on the TSX under thesymbol FIH.U. Concurrent with the IPO, the company issued to Fairfax and its affiliates 30,000,000 multiple votingshares of the company on a private placement basis, for gross proceeds of $300,000. Also, concurrent with the closingof the IPO, the company issued to certain cornerstone investors 20,578,947 subordinate voting shares, on a privateplacement basis, for gross proceeds of $205,789. The combined gross proceeds of the IPO and private placementswere $1,005,789.
On February 10, 2015 a syndicate of underwriters exercised the IPO over-allotment option and the company issuedan additional 6,099,932 subordinate voting shares at a price of $10.00 per share for total gross proceeds of $60,999.The exercise of the over-allotment option increased the combined total gross proceeds from the IPO and privateplacements to $1,066,788 (net proceeds of $1,025,825 after commissions and expenses of $40,963).
41

FAIRFAX INDIA HOLDINGS CORPORATION
9. Earnings per Share
Net earnings per share is calculated in the following table based upon the weighted average shares outstanding:
2016 2015
Net earnings – basic and diluted 107,825 40,939
Weighted average shares outstanding – basic and diluted 106,517,213 98,019,189
Net earnings per share – basic and diluted $ 1.01 $ 0.42
At December 31, 2016 and 2015 there were no instruments outstanding that could potentially dilute earningsper share.
10. Income Taxes
The company’s provision for (recovery of) income taxes for the years ended December 31 are summarized in thefollowing table:
2016 2015
Current income tax:Current year expense (recovery) (4,878) 11,257Adjustment to prior years’ income taxes 1,926 –
(2,952) 11,257
Deferred income tax:Origination and reversal of temporary differences 2,070 2,147Adjustments to prior years’ deferred income taxes 1 –
2,071 2,147
Provision for (recovery of) income taxes (881) 13,404
A significant portion of the company’s earnings before income taxes is earned or incurred outside of Canada. Thestatutory income tax rates for jurisdictions outside of Canada generally differ from the Canadian statutory incometax rate (and may be significantly higher or lower).
During the second quarter of 2016, India and Mauritius amended their double income tax treaty. As a result,investments acquired up to April 1, 2017 will not be assessed by India for tax on their future disposition. After April 1,2017, India will levy capital gains tax at half the India domestic rate on equity investments purchased or soldthrough Mauritius until March 31, 2019 and at the full rate from April 1, 2019 onward.
The company’s earnings (loss) before income taxes by jurisdiction and the associated provision for (recovery of)income taxes for the years ended December 31 are summarized in the following table:
2016 2015
Canada Mauritius Total Canada Mauritius Total
Earnings (loss) before income taxes (4,105) 111,049 106,944 (858) 55,201 54,343Provision for (recovery of) income taxes (4,090) 3,209 (881) 11,559 1,845 13,404
Net earnings (loss) (15) 107,840 107,825 (12,417) 53,356 40,939
The increase in pre-tax profitability in Mauritius during 2016 compared to 2015 primarily reflected increased netunrealized gains on investments, partially offset by increased investment and advisory fees. The increase in pre-taxlosses in Canada during 2016 compared to 2015 principally related to interest expense on the term loan, partiallyoffset by net realized gains on short term investments and common stocks.
42
A reconciliation of the provision for (recovery of) income taxes calculated at the Canadian statutory income tax rateto the provision of income taxes at the effective tax rate in the consolidated financial statements for the years endedDecember 31 are summarized in the following table:
2016 2015
Canadian statutory income tax rate 26.5% 26.5%
Provision for income taxes at the Canadian statutory income tax rate 28,340 14,401Tax rate differential on income earned and losses incurred outside of Canada (27,934) 313Provision relating to prior years 1,926 –Change in unrecorded tax benefit of losses and temporary differences 1,685 206Foreign exchange effect (4,898) (1,542)Other including permanent differences – 26
Provision for (recovery of) income taxes (881) 13,404
The tax rate differential on income earned and losses incurred outside of Canada of $27,934 in 2016 principallyreflected the impact of net investment income taxed in India and Mauritius at lower rates. The tax rate differential onincome earned and losses incurred outside of Canada of $313 in 2015 principally reflected the impact of netinvestment income taxed in India and Mauritius at higher rates.
The provision relating to prior years of $1,926 in 2016 (2015 – nil) primarily related to a refinement of the company’scomputation of the foreign exchange component of net realized gains and losses on investments.
The change in unrecorded tax benefit of losses and temporary differences of $1,685 in 2016 (2015 – $206) principallyreflected foreign accrual property losses incurred by FIH Mauritius. Deferred tax assets in Canada of $8,420 (2015 –$8,807) were not recorded by the company because the related pre-tax losses did not meet the applicable recognitioncriteria under IFRS.
Foreign exchange effect of $4,898 in 2016 (2015 – $1,542) principally reflected the impact of fluctuations in thevalue of the Canadian dollar relative to the U.S. dollar and the Indian rupee as the company computes its corporatetax liability in Canadian dollars pursuant to the requirements of Canadian tax authorities, whereas the functionalcurrency of the company and its Mauritius subsidiaries is the Indian rupee.
Changes in net income taxes refundable (payable) for the years ended December 31 was as follows:
2016 2015
Balance – January 1 (9,386) –Amounts recorded in the consolidated statements of earnings 2,952 (11,257)Payments made during the year 13,500 1,573Foreign currency translation 260 298
Balance – December 31 7,326 (9,386)
Management reviews the recoverability of potential deferred tax assets on an ongoing basis and adjusts, as necessary,to reflect their anticipated realization. Deferred income tax balances at December 31, 2016 were nil (December 31,2015 – nil) as the company has not recorded deferred tax assets of $6,529 (December 31, 2015 – $8,602) related tocosts of the IPO Offerings, and net operating losses and foreign accrual property losses of $1,891(December 31, 2015 – $205).
Deferred income tax has not been recognized for withholding tax and other taxes that may be payable on unremittedearnings of certain Indian Investments. At December 31, 2016 deferred income tax of approximately $13.2 millionhas not been recognized on unremitted earnings of approximately $49.8 million that are not likely to be repatriatedin the foreseeable future.
43
FAIRFAX INDIA HOLDINGS CORPORATION
11. Financial Risk Management
Overview
The company’s activities expose it to certain financial risks during or at the end of the reporting period. These risks,and the company’s management thereof, are described below.
Market Risk
Market risk (comprised of foreign currency risk, interest rate risk and other price risk) is the risk that the fair value orfuture cash flows of a financial instrument will fluctuate because of changes in market prices. The company isexposed to market risk principally in its investing activities and to the extent that those activities expose thecompany to foreign currency risk. The valuation of the company’s investment portfolio is largely dependent on theunderlying performance of the companies within the portfolio, but may also be affected, along with other financialstatement items, by fluctuations in interest rates, foreign currency exchange rates and market prices.
Foreign Currency Risk
Foreign currency risk is the risk that the fair value or cash flows of a financial instrument or another asset or liabilitywill fluctuate because of changes in exchange rates and as a result, could produce an adverse effect on net earningsand equity when measured in Indian rupees, the company’s functional currency. The company’s equity and netearnings may also be significantly affected by foreign currency translation movements as the majority of assets andnet earnings are denominated in a currency other than the company’s U.S. dollar presentation currency. Thecompany has not hedged its foreign currency risk.
The company’s net foreign currency exposure on balances denominated in currencies other than the Indian rupee(expressed in U.S. dollars) are comprised as follows:
December 31, 2016 December 31, 2015
Receivable PayableCash and from sale of Payable Cash and to
cash investment Term to related Net cash related Netequivalents Investments funds loan parties exposure equivalents Investments parties exposure
U.S. dollars 165,051(1) 27,428 26,525 (223,772) (3,659) (8,427) 12,367(1) 98,588 (1,984) 108,971All other currencies 716 – – – (14) 702 97 – (9) 88
Total 165,767 27,428 26,525 (223,772) (3,673) (7,725) 12,464 98,588 (1,993) 109,059
(1) At December 31, 2016 cash and cash equivalents included restricted cash of $18,810 to fund term loan interest payments (December 31, 2015 – nil).
The table above shows the company’s net exposure to the U.S. dollar and all other currencies. If the Indian rupeeappreciated by 5% against the U.S. dollar and all other currencies, the effect on pre-tax earnings and net earningswould be a hypothetical increase of $386 and $284 respectively (December 31, 2015 – a decrease of $5,453 and$4,008). Certain shortcomings are inherent in the method of analysis presented, including the assumption that the5% appreciation of the Indian rupee occurred with all other variables held constant.
The company’s net exposure to the U.S. dollar decreased at December 31, 2016 compared to December 31, 2015primarily as a result of the term loan completed in the third quarter of 2016 for $225,000 and the sale of U.S. dollardenominated investments (primarily U.S. treasury bills) to fund purchases of Indian Investments, partially offset byincreased holdings of cash and cash equivalents received from the term loan proceeds that were not invested intoIndian Investments. A portion of the net proceeds from the term loan were used to invest in the second tranche ofSanmar bonds. The term loan contained a mandatory prepayment clause that became effective when the companyreceived the net proceeds from the Offerings (see note 8), requiring repayment of the $225,000 principal amount ofthe term loan by March 31, 2017.
Interest Rate Risk
Interest rate risk is the risk that the fair values or future cash flows of a financial instrument will fluctuate because ofchanges in market interest rates. Interest rate movements in India may affect the company’s equity and net earnings.The Portfolio Advisor and Fairfax actively monitor interest rates in India and the potential impact changes in interestrates may have on the company’s investment portfolio. There were no significant changes to the company’sframework used to monitor, evaluate and manage interest rate risk at December 31, 2016 compared toDecember 31, 2015.
44
The table that follows displays the potential impact of changes in interest rates on the company’s fixed incomeportfolio based on parallel 200 basis point shifts up and down, in 100 basis point increments. This analysis wasperformed on each individual security, with the hypothetical effect on net earnings calculated on an after-tax basis.At December 31, 2015 the company was also exposed to indirect interest rate risk through investment funds with afair value of $48,445 to the extent the funds were invested in fixed income securities. The company’s exposure tointerest rate risk increased during 2016 due to the Sanmar bond investment (see note 5 for details on the valuation ofSanmar bonds).
December 31, 2016 December 31, 2015
Fair value of Hypothetical $ Hypothetical % Fair value of Hypothetical $ Hypothetical %fixed income change effect on change in fair fixed income change effect on change in
portfolio net earnings value portfolio net earnings fair value
Change in interest rates200 basis point rise 468,666 (44,238) (11.4)% 467,293 (33,439) (8.9)%100 basis point rise 498,029 (22,656) (5.8)% 490,481 (16,396) (4.4)%No change 528,857 – – 512,789 – –100 basis point decline 563,826 25,705 6.6 % 546,766 24,973 6.6 %200 basis point decline 592,543 46,812 12.0 % 580,625 49,860 13.2 %
Certain shortcomings are inherent in the method of analysis presented above. Computations of the prospectiveeffects of hypothetical interest rate changes are based on numerous assumptions, including the maintenance of thelevel and composition of fixed income securities at the indicated date, and should not be relied on as indicative offuture results. Actual values may differ from the projections presented should market conditions vary fromassumptions used in the calculation of the fair value of individual securities; such variations include non-parallelshifts in the term structure of interest rates and a change in individual issuer credit spreads.
Market Price Fluctuations
Market price fluctuation is the risk that the fair value or future cash flows of an equity investment will fluctuatebecause of changes in market prices (other than those arising from interest rate risk or foreign currency risk), whetherthose changes are caused by factors specific to the individual investment or its issuer, or other factors affecting allsimilar investments in the market. Changes to the company’s exposure to equity price risk through its equityinstruments at December 31, 2016 compared to December 31, 2015 are described below.
At December 31, 2015 the company was exposed to market price risk for its investments classified as Level 1 in thefair value hierarchy solely through its investment in IIFL. The company’s exposure to market price risk for its Level 1investments increased during 2016 as a result of its investment in Fairchem (see note 5). Refer to note 6 for thepotential impact on net earnings of various combinations of changes in significant unobservable inputs in thecompany’s internal valuation models for the company’s investments classified as Level 3.
The following table illustrates the potential impact on pre-tax and after-tax net earnings of a 10% change in the fairvalue of the company’s Level 1 equity investments at December 31, 2016 and 2015.
December 31, December 31,2016 2015
Change in fair value of the company’s Level 1 equity investments +10% �10% +10% �10%Level 1 equity investments 311,439 311,439 220,747 220,747
Pre-tax impact on net earnings (loss) 31,144 (31,144) 22,075 (22,075)
After-tax impact on net earnings (loss) 27,017 (27,017) 19,150 (19,150)
Credit Risk
Credit risk is the risk of loss resulting from the failure of a counterparty to honour its financial obligations to thecompany and arises predominantly with respect to cash and cash equivalents, short term investments andinvestments in debt instruments. The company’s cash and cash equivalents, and short term investments areprimarily held at the holding company in major financial institutions (principally in high credit-quality Canadianfinancial institutions). There were no significant changes to the company’s exposure to credit risk (except as set outin the discussion which follows) or the framework used to monitor, evaluate and manage credit risk at December 31,2016 compared to December 31, 2015.
45
FAIRFAX INDIA HOLDINGS CORPORATION
The company’s aggregate gross credit risk exposure was comprised as follows:
December 31, December 31,2016 2015
Cash and cash equivalents 146,960 12,464Restricted cash 18,810 6,457Short term investments – U.S. treasury bills 27,428 50,143Bonds:
Government of India 130,317 123,448Indian corporate 99,447 389,341Sanmar 299,093 –
Common stocks – Investment funds(1) – 48,445Interest receivable 7,493 27,680Other assets:
Receivable from sale of investment funds 26,525 –Prepaid interest on term loan 582 –
Total gross credit risk exposure 756,655 657,978
(1) The company was exposed to indirect credit risk through its holdings of investment funds, which were primarily invested inIndian fixed income securities.
At December 31, 2016 the company had income taxes refundable of $7,326 (December 31, 2015 – income taxespayable of $9,386).
The company’s short term investments in U.S. treasury bills are rated Aaa by Moody’s Investors Service, Inc.(‘‘Moody’s’’) and AA+ by Standard & Poor’s Financial Services LLC (‘‘S&P’’). The composition of the company’s fixedincome portfolio is presented in the table below:
December 31, 2016 December 31, 2015
Fair value Rating Fair value Rating
Government of India bonds(1) 130,317 Baa3/BBB� 123,448 Baa3/BBB�
Indian corporate bonds(2) 99,447 AAA 389,341 AAASanmar bonds(3) 299,093 BBB� – –
Total bonds 528,857 512,789
(1) Rated Baa3 by Moody’s and BBB� by S&P.(2) Rated AAA by subsidiaries of a Designated Rating Organization (‘‘DRO’’), being DBRS Limited, S&P, Fitch Inc. and
Moody’s, or subsidiaries or affiliates of a DRO.(3) Rated BBB� by Brickworks Ratings, an Indian rating agency.
The company’s exposure to credit risk from its investment in fixed income securities increased at December 31, 2016compared to December 31, 2015 reflecting the company’s sale of Indian corporate bonds rated as AAA to fund thepurchase of Sanmar bonds ($299,093) which are rated BBB�.
Liquidity Risk
Liquidity risk is the risk that the company will encounter difficulty in meeting obligations associated with financialliabilities that are settled by delivering cash or another financial asset. The company manages liquidity risk bymaintaining sufficient cash and cash equivalents to enable settlement of financial commitments on their respectivedue dates. All accounts payable and accrued liabilities are due within three months, and income taxes payable mustbe remitted to the respective tax jurisdictions within six months.
46

The company believes that cash and cash equivalents at December 31, 2016, excluding the undeployed net proceedsreceived from the term loan, provides adequate liquidity to meet the company’s known significant expenses in 2017,which are principally comprised of investment and advisory fees, corporate income taxes and general andadministration expenses. The company expects to continue to receive investment income on its holdings of fixedincome securities and dividends from its equity investments to supplement its cash and cash equivalents. The netproceeds from the Offerings (see note 8), together with net proceeds from the sale of a portion of the company’sU.S. treasury bills, Government of India bonds or Indian corporate bonds will be sufficient to fund the anticipatedinvestment in BIAL, the 4.99% investment in IIFL (February 8, 2017) and the investment in Saurashtra (February 14,2017), and will provide the residual funding required to repay the term loan by March 31, 2017. The company hasadequate working capital to support its operations.
Concentration Risk
The company’s cash and investments are primarily concentrated in India and in Indian businesses or businesses withcustomers, suppliers or business primarily conducted in, or dependent on, India. The market value of the company’sinvestments, the income generated by the company and the company’s performance will be particularly sensitive tochanges in the economic condition, interest rates, and regulatory environment of India. Adverse changes to theeconomic condition, interest rates or regulatory environment in India may have a material adverse effect on thecompany’s business, cash flows, financial condition and net earnings.
The company’s cash and investments composition by the issuer’s country of domicile was as follows:
December 31, 2016 December 31, 2015
India U.S. Total India U.S. Total
Cash and cash equivalents 719(1) 165,051(2) 165,770 6,554(1) 12,367 18,921
Short term investments – U.S. treasury bills – 27,428 27,428 – 50,143 50,143
Bonds:Government of India 130,317 – 130,317 123,448 – 123,448Indian corporate 99,447 – 99,447 389,341 – 389,341Sanmar 299,093 – 299,093 – – –
528,857 – 528,857 512,789 – 512,789
Common stocks:IIFL 265,951 – 265,951 220,747 – 220,747NCML 146,586 – 146,586 146,445 – 146,445Privi 54,315 – 54,315 – – –Fairchem 45,488 – 45,488 – – –NSE 26,504 – 26,504 – – –Sanmar 440 – 440 – – –Investment funds – – – 48,445 – 48,445
539,284 – 539,284 415,637 – 415,637
Total cash and investments 1,068,860 192,479 1,261,339 934,980 62,510 997,490
(1) Included cash and cash equivalents invested in Mauritius and Canada of $716 at December 31, 2016 (December 31,2015 – $97 and restricted cash of $6,457).
(2) Included restricted cash of $18,810 at December 31, 2016 (December 31, 2015 – nil).
The company’s holdings of common stocks and Sanmar bonds at December 31, 2016 and December 31, 2015 aresummarized by the issuer’s primary sector in the table below.
December 31, 2016 December 31, 2015
Financial and investment funds 292,455 269,192Commercial and industrial 545,922 146,445
838,377 415,637
47
FAIRFAX INDIA HOLDINGS CORPORATION
During 2016 the company’s concentration risk in the financial and investments funds sector increased primarily dueto the investment in NSE ($26,504) and the increase in fair value of IIFL, partially offset by the sale of investmentfunds, while the company’s concentration risk in the commercial and industrial sector increased primarily due to theinvestments in Sanmar (common stock – $440 and bonds – $299,093), Privi ($54,315) and Fairchem ($45,488).
The company will not make an Indian Investment if, after giving effect to such investment, the total investedamount of such investment would exceed 20% of the company’s total assets at the time of the investment; provided,however, that the company is permitted to complete up to two Indian Investments where, after giving effect to eachsuch investment, the total invested amount of each such investment would be less than or equal to 25% of thecompany’s total assets (the ‘‘Investment Concentration Restriction’’). The company’s Investment ConcentrationRestriction limit increased to approximately $325 million at December 31, 2016 from approximately $250 million atDecember 31, 2015 principally as a result of the net proceeds received from the term loan and net unrealized gains onthe company’s Indian Investments. Indian Investments may be financed through equity or debt offerings as part ofthe company’s objective to reduce its cost of capital and provide returns to common shareholders.
On January 13, 2017 the company completed the Offerings (see note 8) and received net proceeds of $493,504,increasing the Investment Concentration Restriction limit which would enable the company to complete theanticipated investment in BIAL (see note 5).
Capital Management
The company’s objectives when managing capital are to safeguard its ability to continue as a going concern in orderto provide returns for common shareholders and to maintain an optimal capital structure to reduce the cost ofcapital. The company will seek attractive risk-adjusted returns, but will at all times seek downside protection andattempt to minimize the loss of capital. Total capital at December 31, 2016, comprising the term loan and totalcommon shareholders’ equity, was $1,299,218 compared to $1,013,329 at December 31, 2015.
On September 16, 2016 the company completed a 2-year secured term loan (see note 7). The term loan includes afinancial covenant that requires the company to maintain total common shareholders’ equity of not less than$750,000. At December 31, 2016 the company was in compliance with the term loan covenants.
On January 13, 2017 the company completed an underwritten public offering and concurrent with the publicoffering, Fairfax and OMERS acquired additional subordinate voting shares resulting in net proceeds of $493,504.Net proceeds from the Offerings will provide financing to acquire additional Indian Investments and will be used forgeneral corporate purposes. Receipt of the proceeds from the Offerings triggered a mandatory prepayment clause inthe term loan requiring repayment of the $225,000 principal amount of the term loan by March 31, 2017(see note 7).
12. Related Party Transactions
Payables to Related Parties
The company’s payable to related parties was comprised as follows:
December 31, 2016 December 31, 2015
Investment and advisory fees 3,611 1,803Other 62 190
3,673 1,993
Investment Advisory Agreement
The company and its subsidiaries have entered into an agreement with Fairfax and the Portfolio Advisor to provideadministration and investment advisory services to the company (the ‘‘Investment Advisory Agreement’’). Ascompensation for the provision of these services, the company pays an investment and advisory fee, and ifapplicable, a performance fee. Such fees are determined with reference to the company’s total common shareholders’equity.
48

Investment and Advisory Fee
The per annum investment and advisory fee is calculated as 0.5% of the value of undeployed capital and 1.5% of thecompany’s total common shareholders’ equity less the value of undeployed capital.
For 2016, the company determined that the majority of its assets were invested in Indian Investments, which areconsidered deployed capital. In 2016 the investment and advisory fee recorded in the consolidated statements ofearnings was $12,552 (2015 – $5,393).
Performance Fee
The performance fee is paid for the period from January 30, 2015 to December 31, 2017 and for each consecutivethree-year period thereafter, and is calculated, on a cumulative basis, as 20% of any increase in total commonshareholders’ equity (including distributions) above a 5% per annum increase. The company determined that theperformance fee was not applicable for 2016 and 2015.
Management Compensation
Pursuant to the Investment Advisory Agreement, Fairfax is required to provide a Chief Executive Officer, a ChiefFinancial Officer and a Corporate Secretary to the company. For so long as the Investment Advisory Agreementremains in effect, all compensation payable to the Chief Executive Officer, the Chief Financial Officer and CorporateSecretary of the company will be borne by Fairfax.
Director Compensation
Compensation for the company’s Board of Directors for the years ended December 31 was as follows:
2016 2015
Retainers and fees 150 131Share-based payments 133 132Other 50 50
333 313
The compensation presented above is determined in accordance with the company’s IFRS accounting policies andmay differ from the compensation presented in the company’s Management Proxy Circular.
Other
On February 8, 2017 the company acquired 15,853,000 common shares representing a 4.99% equity interest in IIFL(see note 5 for details).
13. Segment Reporting
A business segment is a group of assets and operations engaged in providing products or services that are subject torisks and returns that are different from those of other business segments. A geographical segment is engaged inproviding products or services within a particular economic environment that is subject to risks and returns, that aredifferent from those of segments operating in other economic environments.
The company has concluded that Fairfax India is engaged in a single geographic and business segment, that ofinvesting in India and Indian Investments.
49

FAIRFAX INDIA HOLDINGS CORPORATION
14. General and Administration Expenses
General and administration expenses for the years ended December 31 were comprised as follows:
2016 2015
Brokerage fees 153 978Audit, legal and tax professional fees 2,646 2,899Salaries and employee benefit expenses 737 580Administrative expenses 811 665Other 590 393
4,937 5,515
15. Supplementary Cash Flow Information
Details of certain cash flows included in the consolidated statements of cash flows for the years ended December 31were as follows:
2016 2015
(a) Purchases of investments classified as FVTPLBonds (299,642) (819,118)Common stocks (123,997) (408,954)
(423,639) (1,228,072)
(b) Sales of investments classified as FVTPLBonds 280,960 264,361Common stocks 52,631 –
333,591 264,361
(c) Net interest and dividendsInterest received 31,803 11,794Dividends received 5,611 –Interest paid on term loan (3,190) –
34,224 11,794
(d) Income taxes paid (13,500) (1,573)
50

Index to Management’s Discussion and Analysis of Financial Condition and Results of Operations
Notes to Management’s Discussion and Analysis of Financial Condition and Results of Operations . . . . . . . 52Business Developments
Overview . . . . . . . . . . . . . . . . . . . . . . . . . . . . . . . . . . . . . . . . . . . . . . . . . . . . . . . . . . . . . . . . . . . 52Indian Investments . . . . . . . . . . . . . . . . . . . . . . . . . . . . . . . . . . . . . . . . . . . . . . . . . . . . . . . . . . . . 53Operating Environment . . . . . . . . . . . . . . . . . . . . . . . . . . . . . . . . . . . . . . . . . . . . . . . . . . . . . . . . . 54
Business Objectives . . . . . . . . . . . . . . . . . . . . . . . . . . . . . . . . . . . . . . . . . . . . . . . . . . . . . . . . . . . . . . 54Indian Investments
Public Indian Investments . . . . . . . . . . . . . . . . . . . . . . . . . . . . . . . . . . . . . . . . . . . . . . . . . . . . . . . 57Private Indian Investments . . . . . . . . . . . . . . . . . . . . . . . . . . . . . . . . . . . . . . . . . . . . . . . . . . . . . . . 61
Results of Operations . . . . . . . . . . . . . . . . . . . . . . . . . . . . . . . . . . . . . . . . . . . . . . . . . . . . . . . . . . . . 70Consolidated Balance Sheet Summary . . . . . . . . . . . . . . . . . . . . . . . . . . . . . . . . . . . . . . . . . . . . . . . . . 71Financial Condition
Capital Resources and Management . . . . . . . . . . . . . . . . . . . . . . . . . . . . . . . . . . . . . . . . . . . . . . . . . 72Book Value per Share . . . . . . . . . . . . . . . . . . . . . . . . . . . . . . . . . . . . . . . . . . . . . . . . . . . . . . . . . . . 73Liquidity . . . . . . . . . . . . . . . . . . . . . . . . . . . . . . . . . . . . . . . . . . . . . . . . . . . . . . . . . . . . . . . . . . . 73Contractual Obligations . . . . . . . . . . . . . . . . . . . . . . . . . . . . . . . . . . . . . . . . . . . . . . . . . . . . . . . . . 75
Related Party Transactions . . . . . . . . . . . . . . . . . . . . . . . . . . . . . . . . . . . . . . . . . . . . . . . . . . . . . . . . . 75Accounting and Disclosure Matters
Management’s Evaluation of Disclosure Controls and Procedures . . . . . . . . . . . . . . . . . . . . . . . . . . . . 75Management’s Report on Internal Control Over Financial Reporting . . . . . . . . . . . . . . . . . . . . . . . . . . 75Critical Accounting Estimates and Judgments . . . . . . . . . . . . . . . . . . . . . . . . . . . . . . . . . . . . . . . . . . 76Significant Accounting Policy Changes . . . . . . . . . . . . . . . . . . . . . . . . . . . . . . . . . . . . . . . . . . . . . . . 76Future Accounting Changes . . . . . . . . . . . . . . . . . . . . . . . . . . . . . . . . . . . . . . . . . . . . . . . . . . . . . . 76
Risk ManagementOverview . . . . . . . . . . . . . . . . . . . . . . . . . . . . . . . . . . . . . . . . . . . . . . . . . . . . . . . . . . . . . . . . . . . 76Risks . . . . . . . . . . . . . . . . . . . . . . . . . . . . . . . . . . . . . . . . . . . . . . . . . . . . . . . . . . . . . . . . . . . . . . 77
OtherQuarterly Data . . . . . . . . . . . . . . . . . . . . . . . . . . . . . . . . . . . . . . . . . . . . . . . . . . . . . . . . . . . . . . . 82Stock Prices and Share Information . . . . . . . . . . . . . . . . . . . . . . . . . . . . . . . . . . . . . . . . . . . . . . . . . 83Compliance with Corporate Governance Rules . . . . . . . . . . . . . . . . . . . . . . . . . . . . . . . . . . . . . . . . . 83Forward-Looking Statements . . . . . . . . . . . . . . . . . . . . . . . . . . . . . . . . . . . . . . . . . . . . . . . . . . . . . . 84
51
FAIRFAX INDIA HOLDINGS CORPORATION
Management’s Discussion and Analysis of Financial Condition and Results of Operations(as of March 10, 2017)
(Figures and amounts are in US$ and $ thousands except per share amounts and as otherwise indicated. Figures may not adddue to rounding.)
Notes to Management’s Discussion and Analysis of Financial Condition and Results of Operations
(1) Readers of the Management’s Discussion and Analysis of Financial Condition and Results of Operations(‘‘MD&A’’) should review the entire Annual Report for additional commentary and information. Additionalinformation relating to the company, including its annual information form, can be found on SEDAR atwww.sedar.com. Additional information can also be accessed from the company’s website www.fairfaxindia.ca.
(2) The MD&A contains references to book value per share. On any date, book value per share is calculated astotal common shareholders’ equity divided by the total number of common shares of the companyoutstanding on that date. Book value per share is a key performance measure of the company and is closelymonitored as it is used to calculate the performance fee payable, if any, to Fairfax Financial Holdings Limited(‘‘Fairfax’’). The performance fee is paid for the period from January 30, 2015 to December 31, 2017 and foreach consecutive three-year period thereafter, and is calculated, on a cumulative basis, as 20% of anyincrease in total common shareholders’ equity (including distributions) above a 5% per annum increase.
(3) Unless otherwise noted, consolidated financial information of the company within this MD&A is derivedfrom the consolidated financial statements of the company prepared in accordance with InternationalFinancial Reporting Standards (‘‘IFRS’’) as issued by the International Accounting Standards Board (‘‘IASB’’),and is presented in U.S. dollars with the Indian rupee as the functional currency of the company and itsconsolidated subsidiaries.
Business Developments
Overview
Fairfax has taken the initiative in creating the company and is Fairfax India’s ultimate parent and acts as itsadministrator. Fairfax is a holding company which, through its subsidiaries, is principally engaged in property andcasualty insurance and reinsurance and the associated investment management. Fairfax is a Canadian reportingissuer with securities listed on the Toronto Stock Exchange (‘‘TSX’’) and trading in Canadian dollars under thesymbol FFH for over 30 years and in U.S. dollars under the symbol FFH.U.
Hamblin Watsa Investment Counsel Ltd. (the ‘‘Portfolio Advisor’’), a wholly-owned subsidiary of Fairfax andregistered portfolio manager in the province of Ontario, is the portfolio advisor of the company and its consolidatedsubsidiaries, responsible to source and advise with respect to all investments.
In the first quarter of 2015 Fairfax India completed its initial public offering (‘‘IPO’’) of 50,000,000 subordinatevoting shares at a price of $10.00 per share for gross proceeds of $500,000. The company’s subordinate voting sharescommenced trading on January 30, 2015 on the TSX under the symbol FIH.U.
Concurrent with the IPO, the company issued to Fairfax and its affiliates 30,000,000 multiple voting shares of thecompany on a private placement basis, for gross proceeds of $300,000. The multiple voting shares are not listed. Also,concurrent with the closing of the IPO, the company issued to certain cornerstone investors 20,578,947 subordinatevoting shares, on a private placement basis, for gross proceeds of $205,789. The combined gross proceeds of the IPOand private placements were $1,005,789.
On February 10, 2015 a syndicate of underwriters exercised the IPO over-allotment option and the company issuedan additional 6,099,932 subordinate voting shares at a price of $10.00 per share for total gross proceeds of $60,999.The exercise of the over-allotment option increased the combined total gross proceeds from the IPO and privateplacements to $1,066,788 (net proceeds of $1,025,825 after commissions and expenses of $40,963).
On January 13, 2017 the company completed an underwritten public offering of 12,766,000 subordinate votingshares at a price of $11.75 per share. Concurrent with the public offering, Fairfax and Ontario Municipal EmployeesRetirement System (‘‘OMERS’’) acquired 12,766,000 and 17,021,500 subordinate voting shares, respectively, at aprice of $11.75 per subordinate voting share in a concurrent private placement (the ‘‘Concurrent Private Placement’’and, together with the public offering, the ‘‘Offerings’’), resulting in net proceeds of $493,504, after commissions and
52
expenses of $6,500. Net proceeds from the Offerings will provide financing to acquire additional Indian Investmentsand will be used for general corporate purposes. Receipt of the proceeds from the Offerings triggered a mandatoryprepayment clause in the term loan requiring repayment of the $225,000 principal amount of the term loan byMarch 31, 2017 (see note 7 (Term Loan) to the consolidated financial statements for the year endedDecember 31, 2016).
Indian Investments
Subsequent to December 31, 2016
Public Indian Investments
Investment in IIFL Holdings Limited
On February 8, 2017 the company, through its wholly-owned subsidiaries, acquired 15,853,000 common sharesrepresenting a 4.99% equity interest in IIFL Holdings Limited (‘‘IIFL’’) for total consideration of $75,175 (5.1 billionIndian rupees). In connection with the transaction, Fairfax, through its subsidiaries, disposed of derivativeinstruments representing an economic interest of 4.99% in IIFL.
In accordance with regulations of the Securities and Exchange Board of India (‘‘SEBI’’) and the National StockExchange of India, the transaction was subject to certain sale and purchase pricing guidelines and, as a result, thetotal consideration paid per share approximated the fair market value of the common share equity interest acquired.After giving effect to the shares acquired, the company held 26.7% of the outstanding common shares of IIFL.
Private Indian Investments
Investment in Saurashtra Freight Private Limited
On February 14, 2017 the company, through its wholly-owned subsidiaries, acquired a 51.0% common share equityinterest in Saurashtra Freight Private Limited (‘‘Saurashtra’’), a private company, for cash consideration of $30,018(2.0 billion Indian rupees).
Saurashtra runs the largest container freight station at Mundra port (Gujarat), the second largest and fastest growingport in India. Saurashtra’s container freight station business provides services such as moving of containers to andfrom the port, stuffing/destuffing of containers, cargo storage and transportation of cargo to the end customer as wellas the storage, maintenance and repair of empty containers.
Investment in Bangalore International Airport Limited
On March 28, 2016 the company and Fairfax, through their wholly-owned subsidiaries, announced that they willcollectively acquire 33.0% of the common shares of Bangalore International Airport Limited (‘‘BIAL’’), a privatecompany, from Bangalore Airport & Infrastructure Developers Private Limited, a wholly-owned subsidiary of GVKPower and Infrastructure Limited (‘‘GVK’’) for an aggregate investment of approximately $330 million at currentexchange rates (approximately 22 billion Indian rupees). Fairfax, through a wholly-owned subsidiary, entered into aseparate share purchase agreement to acquire an additional 5.0% common share equity interest from FlughafenZurich AG (‘‘Zurich’’) for approximately $49 million. The acquisition of the additional 5.0% common share equityinterest from Zurich in BIAL can be acquired by Fairfax or the company and is conditional upon the companyacquiring the 33.0% common share equity interest from GVK.
Fairfax India is permitted to complete up to two Indian Investments where such investment would be less than orequal to 25% of the company’s total assets (see note 11 (Financial Risk Management) under the heading‘Concentration Risk’ to the consolidated financial statements for the year ended December 31, 2016). On January 13,2017 the company received net proceeds of $493,504 from an underwritten public offering and private placements(see note 8 (Total Equity) to the consolidated financial statements for the year ended December 31, 2016) thatresulted in an increase in the company’s total assets and investment concentration restriction limit. After givingeffect to this transaction, the investment concentration restriction limit increased providing the company with theability to acquire the total 38.0% investment in BIAL. The anticipated cost for the 38.0% common share equityinterest in BIAL is approximately $379 million (approximately 25 billion Indian rupees).
53

FAIRFAX INDIA HOLDINGS CORPORATION
As of March 10, 2017 certain conditions to closing remain outstanding and there is no certainty as to if or when suchconditions, consents and approvals will be satisfied or waived. Such conditions, consents and approvals that remainoutstanding primarily include finalizing certain lending arrangements between GVK and its lenders, approval fromcertain government authorities and receipt of a no-objection certificate from a relevant authorized dealer under theForeign Exchange Management Act, 1999, with respect to permitting a pledge of shares in connection with the BIALTransaction.
BIAL owns and operates the Kempegowda International Airport Bengaluru (‘‘KIAB’’), under a 30+30 year concessionagreement from the Government of India. KIAB has the distinction of being the first airport in India that was built tothe highest international standards by the private sector under a public-private partnership.
Operating Environment
Overview
India has emerged as the fastest growing major economy in the world according to the Central StatisticsOrganization and the International Monetary Fund. According to the International Monetary Fund, the Indianeconomy will continue to grow more than 7% in the financial year 2017-18. The improvement in India’s economicfundamentals has accelerated in recent years with the combined impact of strong government reforms and theReserve Bank of India’s (‘‘RBI’’) inflation focus supported by favourable global commodity prices.
Government Initiatives
Numerous foreign companies are setting up their facilities in India on account of various government initiatives like‘‘Make in India’’ and ‘‘Digital India’’. Mr. Narendra Modi, Prime Minister of India, has launched the Make in Indiainitiative with an aim to boost the manufacturing sector of the Indian economy. This initiative is expected toincrease the purchasing power of an average Indian consumer, which would further boost demand, and hence spurdevelopment, in addition to benefiting investors. Currently, the manufacturing sector contributes over 15% ofIndia’s GDP. The Government of India, under the Make in India initiative, is providing incentives across varioussectors to achieve a higher percentage of GDP from the manufacturing sector. The Digital India initiative focuses onthree core components: creation of digital infrastructure, delivering services digitally and increasing digital literacy.
Demonetization
On November 8, 2016 the Government of India announced the demonetization of all Indian rupee 500(approximately $7.50) and 1,000 (approximately $15) banknotes. The Government of India claimed that the actionwould curtail the shadow economy and suppress on the use of illicit and counterfeit cash to fund illegal activity andterrorism. The sudden nature of the announcement and the prolonged cash shortages in the weeks that followed,created significant disruption throughout the economy, threatening economic output. The action was considered tohave reduced India’s GDP and industrial production over the short term but it is anticipated that these effects willdisappear in 2017 as the currency circulation normalizes.
Business Objectives
Investment Objective
Fairfax India is an investment holding company whose objective is to achieve long term capital appreciation, whilepreserving capital, by investing, either directly or through one of its wholly-owned subsidiaries, in public and privateequity securities and debt instruments in India and Indian businesses or other businesses with customers, suppliersor business primarily conducted in, or dependent on, India (‘‘Indian Investments’’).
Investment Strategy
The company invests in businesses that are expected to benefit from India’s pro-business political environment, itsgrowing middle class and its demographic trends that are expected to underpin strong growth for several years.Sectors of the Indian economy that the company believes will benefit most from such trends include infrastructure,financial institutions, consumer services, retail and exports. The company is not limited to investing solely in thesesectors and intends to invest in other sectors as and when opportunities arise.
54
The company utilizes, and expects to benefit significantly, from the experience and expertise of Fairfax and thePortfolio Advisor.
The company employs a conservative, fundamental value-based approach to identifying and investing in highquality public and private Indian businesses. This approach is designed to compound book value per share over thelong term. The company will seek attractive risk-adjusted returns, but will at all times seek downside protection andattempt to minimize the loss of capital.
The company intends to make Indian Investments with a view to be a strategic partner to grow the business and as aresult optimize investment returns for the shareholders of Fairfax India. The level and nature of this strategicrelationship will vary by investment. It may include one or more of the following, as deemed appropriate by thecompany: (i) board appointment or nomination rights; (ii) board observer rights; (iii) input on managementselection; (iv) the provision of managerial assistance; and (v) ongoing monitoring and cooperation with the boardand management of the portfolio business to ensure that its strategy is being implemented in a manner that isconsistent with the investment objectives of the company and with the company’s and Fairfax’s fundamental values(as set forth in Fairfax’s guiding principles which are included in Fairfax’s publicly available annual reports).
Fairfax India’s involvement with the Indian Investments may include providing specialized guidance or expertise inlimited circumstances or on a temporary basis and does not extend to any involvement in the day-to-day operationsof those operations. Activities are expected to be ancillary and undertaken to maximize returns from investments.Board representation is sought only to maintain protective rights and to maximize the value of the company’sinvestment for its shareholders.
Investment Selection
To identify potential investments, the company principally relies on the expertise of the Portfolio Advisor andits affiliates.
The following is an illustrative list of criteria that the company and the Portfolio Advisor believe to be paramountwhen identifying and investing in Indian Investments:
Attractive valuation – The company’s conservative fundamental value approach leads it to focus on businesses thathave positive, stable cash flows that can be purchased at discounted multiples. The company does not invest instart-up businesses or businesses that have speculative business plans.
Experienced and aligned management – The company focuses on businesses with experienced, entrepreneurialmanagement teams with strong, long term track records. The company generally requires the portfolio businesses tohave in place, either prior to or immediately following investment by the company, proper incentives to drive thebusinesses’ profitability.
Strong competitive position in industry – The company seeks to invest in businesses that hold leading market positions,possess strong brand power and are well-positioned to capitalize on the growth opportunities in the Indian economy.The company also seeks to invest in businesses that demonstrate significant competitive advantages as compared totheir peers and that position them to protect their market position and profitability.
Alignment of the management team with the values of the company – The company, Fairfax and the Portfolio Advisor allseek to adhere to the highest standards of business practices and ethics. The company requires that the managementteams at each of its portfolio businesses adhere to a similar standard of business practices and ethics and adhere to thecompany’s fundamental values, as described above.
The Portfolio Advisor and its affiliates conduct thorough due diligence investigations when evaluating any IndianInvestment prior to a recommendation to the company and its subsidiaries to make the investment. This generallyincludes consultations with Fairfax’s network of current and former management teams, consultants, competitors,investment bankers and senior executives to assess, among other things, the industry dynamics, the character of themanagement team and the viability of the business plan.
More specifically, due diligence in respect of a particular investment opportunity typically includes, among otheritems as deemed necessary from time to time: (i) review of historical and projected financial information; (ii) on-sitevisits; (iii) interviews with management, employees, customers and vendors; (iv) review of material agreements;(v) background checks; and (vi) research relating to the businesses’ management, industry, markets, products andservices, and competitors.
55

FAIRFAX INDIA HOLDINGS CORPORATION
The company may from time to time seek to realize on any of its Indian Investments. The circumstances under whichthe company may sell some or all of its investments include: (i) where the company believes that the IndianInvestments are fully valued or that the original investment thesis has played out; or (ii) where the company hasidentified other investment opportunities which it believes present more attractive risk-adjusted returnopportunities and additional capital is needed to make such alternative investments.
The company would exit its private investments either through initial public offerings or private sales. For publiclytraded investments, exit strategies may include selling the investments through private placements or inpublic markets.
Investment Restrictions
The company will not make an Indian Investment if, after giving effect to such investment, the total investedamount of such investment would exceed 20% of the company’s total assets at the time of the investment; provided,however, that the company is permitted to complete up to two Indian Investments where, after giving effect to eachsuch investment, the total invested amount of each such investment would be less than or equal to 25% of thecompany’s total assets (the ‘‘Investment Concentration Restriction’’). The company’s Investment ConcentrationRestriction limit increased to approximately $325 million at December 31, 2016 from approximately $250 million atDecember 31, 2015 principally as a result of the net proceeds received from the term loan and net unrealized gains onthe company’s Indian Investments. Indian Investments may be financed through equity or debt offerings as part ofthe company’s objective to reduce its cost of capital and provide returns to common shareholders.
On January 13, 2017 the company completed the Offerings and received net proceeds of $493,504, increasing theInvestment Concentration Restriction limit which would enable the company to complete the anticipatedinvestment in BIAL.
The company intends to make multiple different investments as part of its prudent investment strategy. Thecompany will invest the net proceeds from the Offerings that comply with the Investment ConcentrationRestriction. At December 31, 2016 the company determined that it was in compliance with these investmentrestrictions. With the completion of the investments in the National Stock Exchange of India Limited and PriviOrganics Limited in the third quarter of 2016, the company satisfied the voluntarily-adopted measure (set forth inthe IPO prospectus) that it would invest the net proceeds from the IPO in at least six different Indian Investments.
Indian Investments
Cautionary Statement Regarding Financial Information of Significant Indian Investments
Fairfax India has agreed to voluntarily provide within the MD&A, summary financial information prepared inaccordance with IFRS for all of its Indian Investments in which it had previously filed a business acquisition report inaccordance with section 8.2 of National Instrument 51-102 Continuous Disclosure Obligations (‘‘NI 51-102’’). NationalCollateral Management Services Limited (‘‘NCML’’), IIFL and Sanmar Chemicals Group (‘‘Sanmar’’) (collectively,‘‘Significant Indian Investments’’) prepare their financial statements in accordance with Indian Generally AcceptedAccounting Principles (‘‘Indian GAAP’’). Fairfax India is limited in respect to the amount of independent verificationit is able to perform with respect to the Significant Indian Investments financial statements. The unauditedsummarized financial information contained in this MD&A was prepared exclusively for Fairfax India. Suchunaudited financial information is the responsibility of the respective managements and has been prepared by themusing recognition, measurement and presentation principles consistent with IFRS as issued by the IASB, andprovided to the company in Indian rupees.
The company’s Significant Indian Investments fiscal years end on March 31. Summary financial information of thecompany’s Significant Indian Investments has been provided primarily relating to the periods subsequent to thecompany’s investment and to the extent that the latest interim financial information is available to the company’smanagement.
Significant Indian Investments summarized financial information should be read in conjunction with Fairfax India’shistorical consolidated financial statements including the notes thereto and the related MD&A as well as FairfaxIndia’s other public filings.
Fairfax India has no knowledge that would indicate that the Significant Indian Investments summarized financialinformation contained herein requires material modifications. However, readers are cautioned that the Significant
56
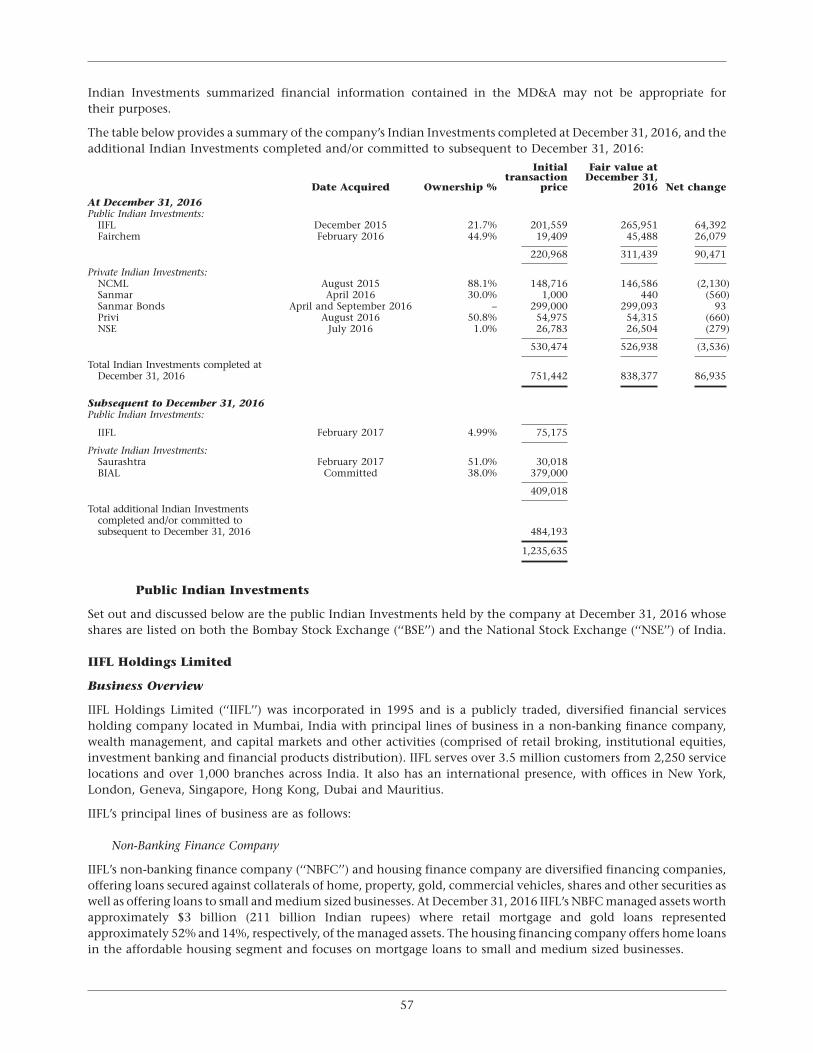
Indian Investments summarized financial information contained in the MD&A may not be appropriate fortheir purposes.
The table below provides a summary of the company’s Indian Investments completed at December 31, 2016, and theadditional Indian Investments completed and/or committed to subsequent to December 31, 2016:
Initial Fair value attransaction December 31,
Date Acquired Ownership % price 2016 Net change
At December 31, 2016Public Indian Investments:
IIFL December 2015 21.7% 201,559 265,951 64,392Fairchem February 2016 44.9% 19,409 45,488 26,079
220,968 311,439 90,471
Private Indian Investments:NCML August 2015 88.1% 148,716 146,586 (2,130)Sanmar April 2016 30.0% 1,000 440 (560)Sanmar Bonds April and September 2016 – 299,000 299,093 93Privi August 2016 50.8% 54,975 54,315 (660)NSE July 2016 1.0% 26,783 26,504 (279)
530,474 526,938 (3,536)
Total Indian Investments completed atDecember 31, 2016 751,442 838,377 86,935
Subsequent to December 31, 2016Public Indian Investments:
IIFL February 2017 4.99% 75,175
Private Indian Investments:Saurashtra February 2017 51.0% 30,018BIAL Committed 38.0% 379,000
409,018
Total additional Indian Investmentscompleted and/or committed tosubsequent to December 31, 2016 484,193
1,235,635
Public Indian Investments
Set out and discussed below are the public Indian Investments held by the company at December 31, 2016 whoseshares are listed on both the Bombay Stock Exchange (‘‘BSE’’) and the National Stock Exchange (‘‘NSE’’) of India.
IIFL Holdings Limited
Business Overview
IIFL Holdings Limited (‘‘IIFL’’) was incorporated in 1995 and is a publicly traded, diversified financial servicesholding company located in Mumbai, India with principal lines of business in a non-banking finance company,wealth management, and capital markets and other activities (comprised of retail broking, institutional equities,investment banking and financial products distribution). IIFL serves over 3.5 million customers from 2,250 servicelocations and over 1,000 branches across India. It also has an international presence, with offices in New York,London, Geneva, Singapore, Hong Kong, Dubai and Mauritius.
IIFL’s principal lines of business are as follows:
Non-Banking Finance Company
IIFL’s non-banking finance company (‘‘NBFC’’) and housing finance company are diversified financing companies,offering loans secured against collaterals of home, property, gold, commercial vehicles, shares and other securities aswell as offering loans to small and medium sized businesses. At December 31, 2016 IIFL’s NBFC managed assets worthapproximately $3 billion (211 billion Indian rupees) where retail mortgage and gold loans representedapproximately 52% and 14%, respectively, of the managed assets. The housing financing company offers home loansin the affordable housing segment and focuses on mortgage loans to small and medium sized businesses.
57

FAIRFAX INDIA HOLDINGS CORPORATION
Wealth Management
Wealth management is the fastest growing business in IIFL and is one of the leading wealth managers in India. AtDecember 31, 2016 IIFL’s wealth management division was amongst the top six mutual fund distributors in Indiaand had approximately $16 billion (1,070 billion Indian rupees) of assets under advice, distribution andmanagement. This division was a pioneer in launching alternate investment funds across equity, real estate and highyield debt. The division’s strong growth is driven by all of its varied business segments: distribution services, assetmanagement, credit, advisory and wealth structuring solutions. It has created a niche by providing unique solutionsfor its clients in the areas of succession planning, asset protection and administration services. In February 2016 IIFLlaunched Wealth NBFC that primarily offers loans to high net worth clientele, where investment securities arereceived as loan collateral. At December 31, 2016 IIFL’s Wealth NBFC had a loan book of approximately $430 million(29 billion Indian rupees).
Capital Markets and Other Activities
IIFL is a leading online and offline broking and financial advisory services provider to retail and institutional clientsand is well known for high quality research in India.
IIFL is one of the largest non-bank retail broking houses in India offering trading and advisory services to retail clientsvia its website, mobile application and branch network. Over the past two decades, IIFL has created a brand, poweredby informed research and cutting-edge technology, extensive footprint, high service standards and competitivebrokerage. IIFL also offers currency and commodities broking and the distribution of financial service products suchas mutual funds and life insurance to retail clients.
IIFL’s shares are listed on both the BSE and the NSE of India.
Additional information can also be accessed from IIFL’s website www.iifl.com.
Transaction Description
On December 1, 2015 Fairfax India acquired 68,788,445 common shares of IIFL representing a 21.9% ownershipinterest at a price of $2.93 per share (195 Indian rupees) for total consideration of $201,559 (approximately13.4 billion Indian rupees). Prior to the company’s investment in IIFL, Fairfax, through its subsidiaries, owned 8.9%of the issued and outstanding IIFL common shares, and had an economic interest in another 5.2% of IIFL commonshares through derivative instruments (all acquired prior to the establishment of Fairfax India).
At December 31, 2016 the company held 21.7% of the outstanding common shares of IIFL. FIH Mauritius and theFairfax affiliates have undertaken not to exercise voting rights on IIFL shareholder resolutions for any IIFL sharesexceeding 25% of the issued and outstanding IIFL common shares at the time of voting, effectively limiting voting to25% even in cases where FIH Mauritius and the Fairfax affiliates own more than 25% of the IIFL shares.
Fairfax had invested in IIFL prior to the company’s December 1, 2015 investment and was able to recommend forappointment one board representative, out of the eight board members, which Fairfax has maintained since 2012. AtDecember 31, 2016 the company did not have any additional board representation in IIFL, but is considered to haveboard representation through the original Fairfax board representative.
On February 8, 2017, as noted in the ‘Business Developments’ section of this MD&A under the heading ‘IndianInvestments’, the company acquired 15,853,000 common shares representing a 4.99% equity interest in IIFL for totalconsideration of $75,175 (5.1 billion Indian rupees). In connection with the transaction, Fairfax, through itssubsidiaries, disposed of derivative instruments representing an economic interest of 4.99% in IIFL. After givingeffect to the shares acquired, the company held 26.7% of the outstanding common shares of IIFL.
58
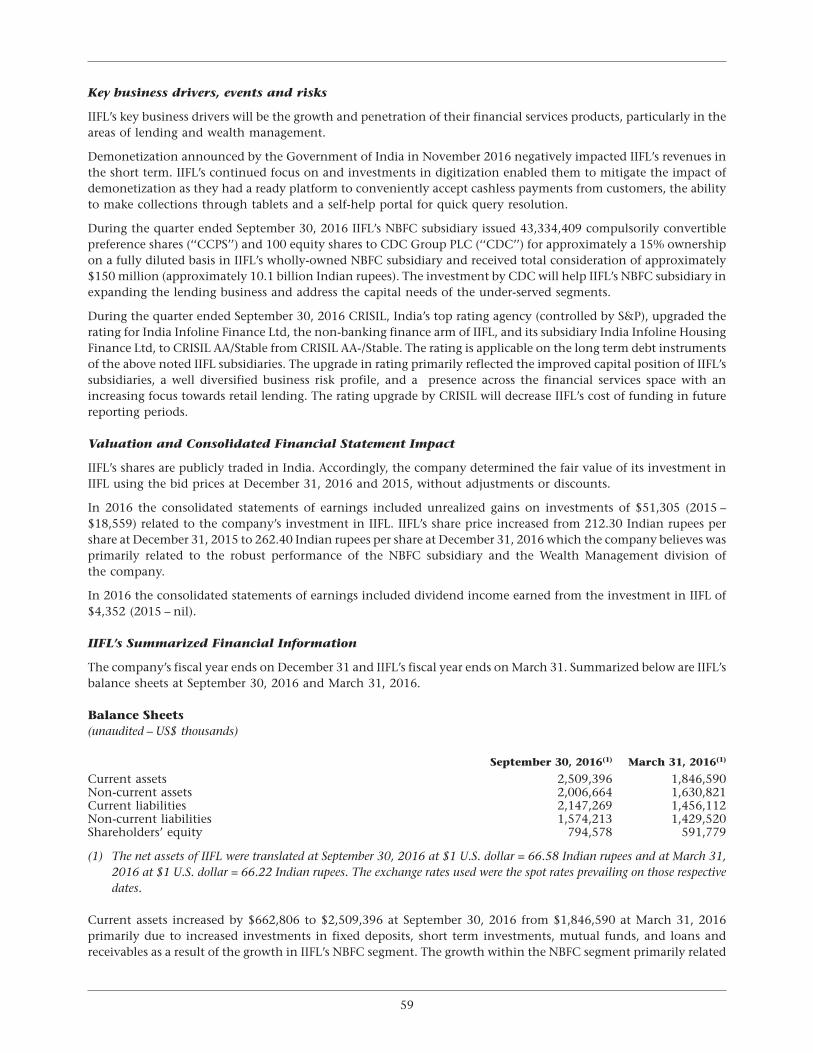
Key business drivers, events and risks
IIFL’s key business drivers will be the growth and penetration of their financial services products, particularly in theareas of lending and wealth management.
Demonetization announced by the Government of India in November 2016 negatively impacted IIFL’s revenues inthe short term. IIFL’s continued focus on and investments in digitization enabled them to mitigate the impact ofdemonetization as they had a ready platform to conveniently accept cashless payments from customers, the abilityto make collections through tablets and a self-help portal for quick query resolution.
During the quarter ended September 30, 2016 IIFL’s NBFC subsidiary issued 43,334,409 compulsorily convertiblepreference shares (‘‘CCPS’’) and 100 equity shares to CDC Group PLC (‘‘CDC’’) for approximately a 15% ownershipon a fully diluted basis in IIFL’s wholly-owned NBFC subsidiary and received total consideration of approximately$150 million (approximately 10.1 billion Indian rupees). The investment by CDC will help IIFL’s NBFC subsidiary inexpanding the lending business and address the capital needs of the under-served segments.
During the quarter ended September 30, 2016 CRISIL, India’s top rating agency (controlled by S&P), upgraded therating for India Infoline Finance Ltd, the non-banking finance arm of IIFL, and its subsidiary India Infoline HousingFinance Ltd, to CRISIL AA/Stable from CRISIL AA-/Stable. The rating is applicable on the long term debt instrumentsof the above noted IIFL subsidiaries. The upgrade in rating primarily reflected the improved capital position of IIFL’ssubsidiaries, a well diversified business risk profile, and a presence across the financial services space with anincreasing focus towards retail lending. The rating upgrade by CRISIL will decrease IIFL’s cost of funding in futurereporting periods.
Valuation and Consolidated Financial Statement Impact
IIFL’s shares are publicly traded in India. Accordingly, the company determined the fair value of its investment inIIFL using the bid prices at December 31, 2016 and 2015, without adjustments or discounts.
In 2016 the consolidated statements of earnings included unrealized gains on investments of $51,305 (2015 –$18,559) related to the company’s investment in IIFL. IIFL’s share price increased from 212.30 Indian rupees pershare at December 31, 2015 to 262.40 Indian rupees per share at December 31, 2016 which the company believes wasprimarily related to the robust performance of the NBFC subsidiary and the Wealth Management division ofthe company.
In 2016 the consolidated statements of earnings included dividend income earned from the investment in IIFL of$4,352 (2015 – nil).
IIFL’s Summarized Financial Information
The company’s fiscal year ends on December 31 and IIFL’s fiscal year ends on March 31. Summarized below are IIFL’sbalance sheets at September 30, 2016 and March 31, 2016.
Balance Sheets(unaudited – US$ thousands)
September 30, 2016(1) March 31, 2016(1)
Current assets 2,509,396 1,846,590Non-current assets 2,006,664 1,630,821Current liabilities 2,147,269 1,456,112Non-current liabilities 1,574,213 1,429,520Shareholders’ equity 794,578 591,779
(1) The net assets of IIFL were translated at September 30, 2016 at $1 U.S. dollar = 66.58 Indian rupees and at March 31,2016 at $1 U.S. dollar = 66.22 Indian rupees. The exchange rates used were the spot rates prevailing on those respectivedates.
Current assets increased by $662,806 to $2,509,396 at September 30, 2016 from $1,846,590 at March 31, 2016primarily due to increased investments in fixed deposits, short term investments, mutual funds, and loans andreceivables as a result of the growth in IIFL’s NBFC segment. The growth within the NBFC segment primarily related
59

FAIRFAX INDIA HOLDINGS CORPORATION
to retail (low risk retail mortgage loans) and commercial vehicle financing, partially offset by declines in largemortgages.
Non-current assets increased by $375,843 to $2,006,664 at September 30, 2016 from $1,630,821 at March 31, 2016primarily due to increased holdings of long term investments and loans and advances (primarily growth in the NBFCsegment, as noted above). The increases in long term investments principally related to investing part of the shortterm and long term loans entered into during the period into long term investments, and investing into long terminvestments the proceeds received from CDC on the CCPS and equity issuance of approximately $150 million(approximately 10.1 billion Indian rupees) for approximately a 15% ownership on a fully diluted basis in IIFL’swholly-owned NBFC subsidiary.
Current liabilities increased by $691,157 to $2,147,269 at September 30, 2016 from $1,456,112 at March 31, 2016primarily due to an increase in short term interest bearing loans and borrowings to support the growth in theNBFC segment.
Non-current liabilities increased by $144,693 to $1,574,213 at September 30, 2016 from $1,429,520 at March 31,2016 primarily due to an increase in long term interest bearing loans and borrowings to support the growth in theNBFC segment.
Summarized below is IIFL’s statement of earnings for six months ended September 30, 2016.
Statement of Earnings(unaudited – US$ thousands)
Six months endedSeptember 30, 2016(1)
Revenue 333,009Net earnings before taxes 77,587Net earnings 52,260
(1) Amounts for the six months ended September 30, 2016 were translated into US$ using the average exchange rates of$1 U.S. dollar = 66.93 Indian rupees prevailing during that period.
For the six months ended September 30, 2016, IIFL’s revenue and net earnings of $333,009 and $52,260 respectively,were primarily driven by activities of the NBFC segment, primarily related to retail (low risk retail mortgage loans)and commercial vehicle financing, partially offset by declines in large mortgages. IIFL’s management continues tofocus on reducing operating costs to achieve better economies of scale and leverage existing infrastructure to offercomplementary products across multiple segments. The rating upgrade by CRISIL will decrease IIFL’s cost of fundingin future reporting periods.
Fairchem Speciality Limited
Business Overview
Fairchem Speciality Limited (‘‘Fairchem’’, formerly known as Adi Finechem Limited) was incorporated in 1985 andpublicly listed its shares on the BSE in 1995 and NSE in 2015. Fairchem is a specialty chemical manufacturer locatedin Ahmedabad, India. Fairchem manufactures oleochemicals used in the paints, inks and adhesives industries, aswell as intermediate nutraceutical and health products. It has developed an in-house technology that usesmachinery designed and manufactured by leading European companies to separate and convert waste generatedduring the production of soy, sunflower, corn and cotton oils into valuable nutraceutical and fatty acids. Fatty acidsgo into non-edible products like soaps, personal care products, paints, and nutraceutical products that are used in themanufacturing of natural vitamin E and corticosteroids.
Fairchem has expanded its capacity from 8,000 tonnes per annum in 2010 to 45,000 tonnes per annum as atDecember 31, 2016, making it one of the largest processing capacity companies of natural soft oil based fatty acids inIndia. Fairchem’s business is a single business segment which is specialty chemicals and they have customers thatinclude major domestic inks and paint manufacturers, and multinational natural vitamin E and sterolmanufacturers.
Fairchem’s shares are listed on both the BSE and the NSE of India.
Additional information can also be accessed from Fairchem’s website www.fairchem.in.
60
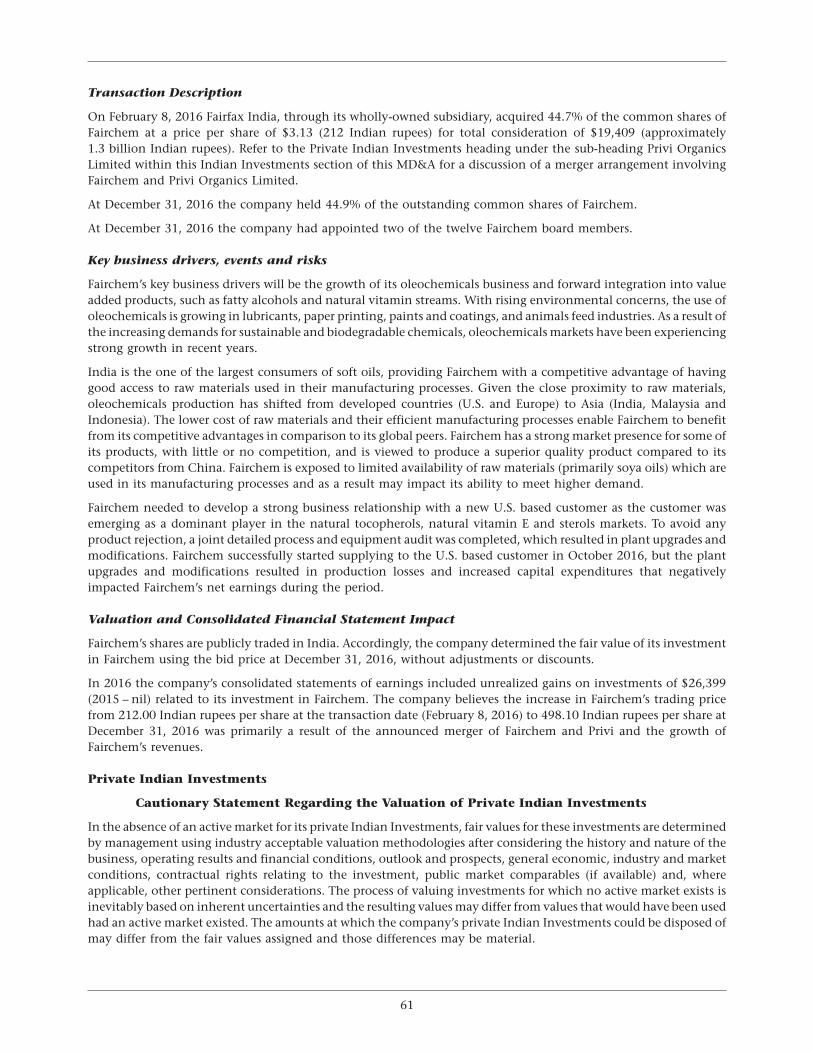
Transaction Description
On February 8, 2016 Fairfax India, through its wholly-owned subsidiary, acquired 44.7% of the common shares ofFairchem at a price per share of $3.13 (212 Indian rupees) for total consideration of $19,409 (approximately1.3 billion Indian rupees). Refer to the Private Indian Investments heading under the sub-heading Privi OrganicsLimited within this Indian Investments section of this MD&A for a discussion of a merger arrangement involvingFairchem and Privi Organics Limited.
At December 31, 2016 the company held 44.9% of the outstanding common shares of Fairchem.
At December 31, 2016 the company had appointed two of the twelve Fairchem board members.
Key business drivers, events and risks
Fairchem’s key business drivers will be the growth of its oleochemicals business and forward integration into valueadded products, such as fatty alcohols and natural vitamin streams. With rising environmental concerns, the use ofoleochemicals is growing in lubricants, paper printing, paints and coatings, and animals feed industries. As a result ofthe increasing demands for sustainable and biodegradable chemicals, oleochemicals markets have been experiencingstrong growth in recent years.
India is the one of the largest consumers of soft oils, providing Fairchem with a competitive advantage of havinggood access to raw materials used in their manufacturing processes. Given the close proximity to raw materials,oleochemicals production has shifted from developed countries (U.S. and Europe) to Asia (India, Malaysia andIndonesia). The lower cost of raw materials and their efficient manufacturing processes enable Fairchem to benefitfrom its competitive advantages in comparison to its global peers. Fairchem has a strong market presence for some ofits products, with little or no competition, and is viewed to produce a superior quality product compared to itscompetitors from China. Fairchem is exposed to limited availability of raw materials (primarily soya oils) which areused in its manufacturing processes and as a result may impact its ability to meet higher demand.
Fairchem needed to develop a strong business relationship with a new U.S. based customer as the customer wasemerging as a dominant player in the natural tocopherols, natural vitamin E and sterols markets. To avoid anyproduct rejection, a joint detailed process and equipment audit was completed, which resulted in plant upgrades andmodifications. Fairchem successfully started supplying to the U.S. based customer in October 2016, but the plantupgrades and modifications resulted in production losses and increased capital expenditures that negativelyimpacted Fairchem’s net earnings during the period.
Valuation and Consolidated Financial Statement Impact
Fairchem’s shares are publicly traded in India. Accordingly, the company determined the fair value of its investmentin Fairchem using the bid price at December 31, 2016, without adjustments or discounts.
In 2016 the company’s consolidated statements of earnings included unrealized gains on investments of $26,399(2015 – nil) related to its investment in Fairchem. The company believes the increase in Fairchem’s trading pricefrom 212.00 Indian rupees per share at the transaction date (February 8, 2016) to 498.10 Indian rupees per share atDecember 31, 2016 was primarily a result of the announced merger of Fairchem and Privi and the growth ofFairchem’s revenues.
Private Indian Investments
Cautionary Statement Regarding the Valuation of Private Indian Investments
In the absence of an active market for its private Indian Investments, fair values for these investments are determinedby management using industry acceptable valuation methodologies after considering the history and nature of thebusiness, operating results and financial conditions, outlook and prospects, general economic, industry and marketconditions, contractual rights relating to the investment, public market comparables (if available) and, whereapplicable, other pertinent considerations. The process of valuing investments for which no active market exists isinevitably based on inherent uncertainties and the resulting values may differ from values that would have been usedhad an active market existed. The amounts at which the company’s private Indian Investments could be disposed ofmay differ from the fair values assigned and those differences may be material.
61
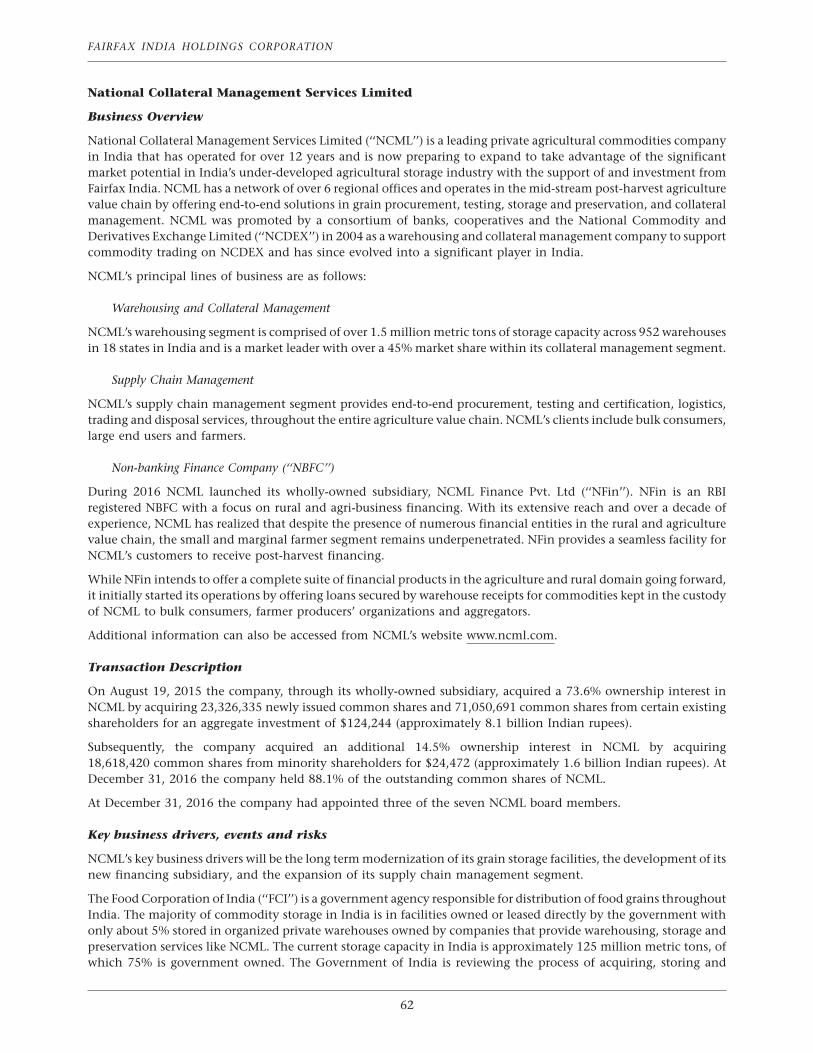
FAIRFAX INDIA HOLDINGS CORPORATION
National Collateral Management Services Limited
Business Overview
National Collateral Management Services Limited (‘‘NCML’’) is a leading private agricultural commodities companyin India that has operated for over 12 years and is now preparing to expand to take advantage of the significantmarket potential in India’s under-developed agricultural storage industry with the support of and investment fromFairfax India. NCML has a network of over 6 regional offices and operates in the mid-stream post-harvest agriculturevalue chain by offering end-to-end solutions in grain procurement, testing, storage and preservation, and collateralmanagement. NCML was promoted by a consortium of banks, cooperatives and the National Commodity andDerivatives Exchange Limited (‘‘NCDEX’’) in 2004 as a warehousing and collateral management company to supportcommodity trading on NCDEX and has since evolved into a significant player in India.
NCML’s principal lines of business are as follows:
Warehousing and Collateral Management
NCML’s warehousing segment is comprised of over 1.5 million metric tons of storage capacity across 952 warehousesin 18 states in India and is a market leader with over a 45% market share within its collateral management segment.
Supply Chain Management
NCML’s supply chain management segment provides end-to-end procurement, testing and certification, logistics,trading and disposal services, throughout the entire agriculture value chain. NCML’s clients include bulk consumers,large end users and farmers.
Non-banking Finance Company (‘‘NBFC’’)
During 2016 NCML launched its wholly-owned subsidiary, NCML Finance Pvt. Ltd (‘‘NFin’’). NFin is an RBIregistered NBFC with a focus on rural and agri-business financing. With its extensive reach and over a decade ofexperience, NCML has realized that despite the presence of numerous financial entities in the rural and agriculturevalue chain, the small and marginal farmer segment remains underpenetrated. NFin provides a seamless facility forNCML’s customers to receive post-harvest financing.
While NFin intends to offer a complete suite of financial products in the agriculture and rural domain going forward,it initially started its operations by offering loans secured by warehouse receipts for commodities kept in the custodyof NCML to bulk consumers, farmer producers’ organizations and aggregators.
Additional information can also be accessed from NCML’s website www.ncml.com.
Transaction Description
On August 19, 2015 the company, through its wholly-owned subsidiary, acquired a 73.6% ownership interest inNCML by acquiring 23,326,335 newly issued common shares and 71,050,691 common shares from certain existingshareholders for an aggregate investment of $124,244 (approximately 8.1 billion Indian rupees).
Subsequently, the company acquired an additional 14.5% ownership interest in NCML by acquiring18,618,420 common shares from minority shareholders for $24,472 (approximately 1.6 billion Indian rupees). AtDecember 31, 2016 the company held 88.1% of the outstanding common shares of NCML.
At December 31, 2016 the company had appointed three of the seven NCML board members.
Key business drivers, events and risks
NCML’s key business drivers will be the long term modernization of its grain storage facilities, the development of itsnew financing subsidiary, and the expansion of its supply chain management segment.
The Food Corporation of India (‘‘FCI’’) is a government agency responsible for distribution of food grains throughoutIndia. The majority of commodity storage in India is in facilities owned or leased directly by the government withonly about 5% stored in organized private warehouses owned by companies that provide warehousing, storage andpreservation services like NCML. The current storage capacity in India is approximately 125 million metric tons, ofwhich 75% is government owned. The Government of India is reviewing the process of acquiring, storing and
62
distributing food grains with the outcome expected to result in a new distribution model that is focused on apublic/private partnership. There are a few large national-level players (like NCML) which own and/or run highquality infrastructure and provide diverse ancillary services to warehousing customers who stand to benefit frompotential changes in the industry.
As a result of recently announced fiscal and non-fiscal changes in agriculture and food policy, private companies likeNCML are enhancing their range of services provided to Indian farmers, traders, food processors, banks, thegovernment and other businesses connected to the agriculture supply chain. This is expected to significantlyimprove efficiencies to help India achieve its stated national objective of greater food security.
During the fourth quarter of 2016 the Indian agriculture commodity landscape showed mixed results in the wake ofthe demonetization decision taken by the Government of India on November 8, 2016. In the first eight weeks postdemonetization, arrivals of the summer crop harvest dropped considerably as farmers and aggregators transactlargely in cash due to the limited banking infrastructure and the increased operational ease of transacting in cash.This negatively impacted the deposits into NCML’s warehouses. In addition, the collateral management segment ofNCML saw closures of a large number of accounts as clients used the old currency to repay and close their loanaccounts, and the banks faced a lower credit demand, partly on account of the demonetization decision as well as thenon-availability of cash withdrawal facilities from banks that constrained the purchase of fresh produce fromfarmers. In view of the above developments, the warehousing and collateral management segments were negativelyimpacted and the company’s revenue and profitability decreased during this period. The other divisions of thecompany (Supply Chain, Testing and Certification and Weather Intelligence), however, performed reasonably welland partially offset the lower profitability in the warehousing and collateral management segment. The impact of thedemonetization started to ease towards the end of December 2016 and NCML anticipates a strong performance inthe first quarter of 2017.
After receiving encouraging responses from private players for the construction of six silos with a 250,000 tonnecapacity, the FCI had called for bids for building 27 additional silos which will be located in the states of Punjab,Haryana, Uttar Pradesh, West Bengal, Bihar and Gujarat, and will have an estimated combined grain storage capacityof 1.35 million metric tons. NCML submitted bids for all 27 locations and was awarded a 30 year concessionagreement to build 11 of the locations with a 550,000 metric ton capacity which will require capital expenditure ofan estimated $100 million (approximately 7.0 billion Indian rupees). NCML anticipates that most of the capitalexpenditure requirements will be able to be financed internally.
Valuation and Consolidated Financial Statement Impact
At December 31, 2015 the initial transaction price was considered to approximate fair value as there had been nosignificant changes to NCML’s business, capital structure and operating environment and the key assumptions in thecompany’s acquisition valuation model continued to be valid due to the proximity of the transaction closing date tothe year end. During 2016 the company refined its internal valuation model used in the determination of NCML’sfair value. The fair value of NCML cannot be derived from an active market and accordingly, is determined usingindustry accepted valuation techniques and models. Market observable inputs are used where possible, withunobservable inputs used where necessary. Use of unobservable inputs can involve significant judgment and maymaterially affect the reported fair value of NCML.
At December 31, 2016 the company estimated fair value using a discounted cash flow analysis based on multi-yearfree cash flow projections with assumed after-tax discount rates ranging from 11.9% to 15.8% and a long termgrowth rate of 6.0%. Free cash flow projections were based on EBITDA projections from financial information forNCML’s business units that had been prepared in the fourth quarter of 2016 by NCML’s management. Discount rateswere based on the company’s assessment of risk premiums to the appropriate risk-free rate of the economicenvironment in which NCML operates. At December 31, 2016 the company’s internal valuation model indicatedthat the fair value of the common shares was $146,586 (2015 – $146,445), resulting in an unrealized gain of $3,879(2015 – nil), largely offset by an unrealized foreign currency translation loss of $3,738 (2015 – loss of $2,271) whichwere recorded in net unrealized gains on investments in the consolidated statements of earnings and in theconsolidated statements of comprehensive income, respectively, in 2016. The net unrealized gain of $3,879 wasprimarily driven by the growth in NCML’s supply chain business and the success of the new NBFC segment.
63
FAIRFAX INDIA HOLDINGS CORPORATION
NCML’s Summarized Financial Information
The company’s fiscal year ends on December 31 and NCML’s fiscal year ends on March 31. Summarized below areNCML’s balance sheets at December 31, 2016 and March 31, 2016.
Balance Sheets(unaudited – US$ thousands)
December 31, 2016(1) March 31, 2016(1)
Current assets 84,825 80,531Non-current assets 58,915 54,582Current liabilities 45,281 36,599Non-current liabilities 22,614 21,342Shareholders’ equity 75,845 77,172
(1) The net assets of NCML were translated at December 31, 2016 at $1 U.S. dollar = 67.87 Indian rupees and at March 31,2016 at $1 U.S. dollar = 66.22 Indian rupees. The exchange rates used were the spot rates prevailing on those respectivedates.
Current assets increased by $4,294 to $84,825 at December 31, 2016 from $80,531 at March 31, 2016 primarilyreflecting an increase in inventory with the commencement of Kharif season (typically crops planted and harvestedJune through October and relate primarily to rice and corn) resulting in increased grain procurement, partially offsetby a decrease in trade receivables.
Non-current assets increased by $4,333 to $58,915 at December 31, 2016 from $54,582 at March 31, 2016 primarilydriven by an increase in property, plant and equipment relating to the capitalization of the ongoing warehousingprojects.
Current liabilities increased by $8,682 to $45,281 at December 31, 2016 from $36,599 at March 31, 2016 primarilydue to increases in short term loans and borrowings and other payables relating to customer advances for grainprocurement during Kharif season.
Non-current liabilities increased by $1,272 to $22,614 at December 31, 2016 from $21,342 at March 31, 2016primarily due to an increase in long term loans and borrowings relating to the financing obtained for the ongoingwarehousing projects.
Summarized below are NCML’s statements of earnings for the nine months ended December 31, 2016 and 2015.
Statements of Earnings(unaudited – US$ thousands)
Nine months ended Nine months endedDecember 31, 2016(1) December 31, 2015(1)
Revenue 73,153 34,062Net earnings before taxes 2,916 3,866Net earnings 2,420 3,448
(1) Amounts for the nine months ended December 31, 2016 and 2015 were translated into US$ using the average exchangerates of $1 U.S. dollar = 67.07 Indian rupees and $1 U.S. dollar = 64.74 Indian rupees prevailing during those periods,respectively.
NCML’s revenue for the nine months ended December 31, 2016 and 2015 were primarily driven by supply chainservices, storage and preservation services and collateral management segments. Revenue of $73,153 for the ninemonths ended December 31, 2016 increased from $34,062 for the nine months ended December 31, 2015principally as a result of a significant increase in the supply chain services segment, partially offset by a reduction inthe storage and preservation services segment as a result of the impact of demonetization and two consecutivedrought years. NCML’s reported net earnings of $2,420 for the nine months ended December 31, 2016 compared tonet earnings of $3,448 for the nine months ended December 31, 2015 with a year-over-year decrease of $1,028primarily resulting from lower margins in the storage and preservation services segment.
64
A normal cycle of commodities would be to receive deposits during the first quarter of a fiscal year (April to June) andthen experience a withdrawal of those commodities during the second quarter (July to September). For the ninemonths ended December 31, 2016 NCML experienced lower deposits of commodities in the first quarter andsignificantly higher withdrawals in the second quarter as a result of two consecutive droughts and the impact ofrainfall deficits resulting in depleted commodities. The drought conditions adversely affected the quality of the crops(principally cotton, coriander, mustard and turmeric) resulting in higher commodity prices and lower storagedemand. By the end of December 2016 NCML started to experience new crop deposits primarily as a result of anormal monsoon season throughout India that is improving the harvesting season.
Sanmar Chemicals Group
Business Overview
Sanmar Chemicals Group (‘‘Sanmar’’), a private company, is one of the largest suspension Poly Vinyl Chloride(‘‘PVC’’) manufacturers in India, headquartered in Chennai, India with operational presence in India and Egypt.Sanmar has an installed capacity of approximately 366,000 tonnes per annum in India and is in the process ofexpanding its PVC capacity in Egypt from 200,000 tonnes per annum to 400,000 tonnes per annum. Once theexpansion is completed, Sanmar will have a total PVC capacity of over 766,000 tonnes per annum.
Sanmar’s principal lines of business are as follows:
Chemplast
Beginning as Chemicals and Plastics India Limited in 1962, Chemplast is currently the second largest suspensionPVC manufacturer and the largest specialty PVC manufacturer in India, with the top three players capturingapproximately 90% of India’s domestic manufacturing capacity. A significant portion of Chemplast’s revenues arederived from integrated operations. Chemplast’s product range falls into four distinct groups: PVC resins, causticsoda / chlorine, chlorinated solvents and refrigerant gases. Caustic soda is mainly used in the manufacture of paperand pulp, alumina, petroleum products, soaps and detergents, and is also the basic feedstock for various chemicals.The majority of its revenues are generated through sales to end customers (rather than through distributors).
TCI Sanmar Chemicals S.A.E. (‘‘Sanmar Egypt’’)
Sanmar Egypt is the largest Indian investor in Egypt’s chemical business and the largest caustic soda and PVCmanufacturer in Egypt. Sanmar has invested approximately $1.2 billion during Phase 1 of its Egypt project and hascreated world-class manufacturing facilities for caustic soda and PVC in Port Said, Egypt. Phase 1 projects werecompleted in April 2012 at which time PVC production commenced. Phase 2 is underway with an additionalinvestment of approximately $300 million, for an aggregate investment of approximately $1.5 billion. Phase 2expansion is expected to be completed by April 2018. On completion of Phase 2, the PVC capacity will double to400,000 metric tons per annum. A new plant to produce calcium chloride granules with a capacity of 130,000 metrictons will also be established under Phase 2. Calcium chloride granules are used worldwide for dust control, de-icing,drilling operations and in bakery products.
Sanmar Egypt sells directly to end-user customers and also through distributors. PVC is mainly sold in the key targetmarkets like Egypt, Turkey and parts of western Europe. PVC is primarily used in pipes and fittings, window and doorprofiles, shoes, film, sheet, flooring and cable industries. Caustic soda is primarily used in textiles, alumina, pulp andpaper, and soaps.
Specialty Chemicals
Sanmar’s Specialty Chemicals business is engaged in the manufacturing and marketing of phytochemicals andorganic chemicals. The phytochemicals division manufactures an active pharmaceutical ingredient called colchicine(treatment of gout) from plant based raw material. The organic chemical division is involved in the manufacturing ofadvanced organic intermediates for the pharmaceutical, agro chemical, flavours and fragrances, and other finechemical applications.
Additional information can also be accessed from Sanmar’s website www.sanmargroup.com.
65

FAIRFAX INDIA HOLDINGS CORPORATION
Transaction Description
On April 8, 2016 the company announced that, through its wholly-owned subsidiaries, it had agreed to invest$300 million into Sanmar through a combination of equity and debt securities resulting in a 30% common shareequity interest in Sanmar. On April 28, 2016 the company acquired the first tranche of $250 million, comprised of$1 million in equity and $249 million in bonds. On September 26, 2016 the company acquired the second tranche of$50 million in bonds.
At December 31, 2016 the company had appointed two of the six Sanmar board members.
Key business drivers, events and risks
India continues to be a PVC deficit market with approximately 50% of the demand being met through imports.Egypt and Turkey, which are manufacturing hubs for exports to Europe, currently have a demand gap of1,000 kilotons per annum which is being met by imports from the U.S. and Asia.
Sanmar’s key business drivers will be its planned increased PVC manufacturing capacity in Egypt and India to cater tothe growing demand of PVC in North Africa, Middle East and India, as well as an overall improvement in the capacityutilization of all of its PVC production facilities.
Valuation and Consolidated Financial Statement Impact
During 2016 management undertook a valuation study to formalize valuation models and determine theappropriate separate fair values for its bond and common share investments in Sanmar. The fair value of the Sanmarinvestments cannot be derived from an active market and accordingly, are determined using industry acceptedvaluation techniques and models. Market observable inputs are used where possible, with unobservable inputs usedwhere necessary. Use of unobservable inputs can involve significant judgment and may materially affect the reportedfair value of the Sanmar investments.
Sanmar Common Stock
At December 31, 2016 the company estimated fair value using a discounted cash flow analysis based on multi-yearfree cash flow projections with assumed after-tax discount rates ranging from 15.5% to 22.5% and long term growthrates ranging from 2.0% to 3.6%. Free cash flow projections were based on EBITDA projections from financialinformation for Sanmar’s three main business operations that had been prepared in the fourth quarter of 2016 bySanmar’s management. Discount rates were based on the company’s assessment of risk premiums to the appropriaterisk-free rate of the economic environment in which Sanmar operates. At December 31, 2016 the company’s internalvaluation model indicated that the fair value of the common shares was $440, resulting in an unrealized loss of $545in 2016 which was recorded in net unrealized gains on investments in the consolidated statements of earnings.
Sanmar Bonds
The debt securities mature 7 years from the date of issuance of the first tranche, subject to earlier redemption bySanmar under certain circumstances. The company is entitled to a coupon payment payable in kind and capitalizedin lieu of payment of such amount in cash on an annual basis. A redemption premium may also be payable in kind tothe company. The Sanmar debt securities are currently rated BBB� with a stable outlook by Brickworks Ratings, anIndian rating agency.
At December 31, 2016 the company estimated fair value using an industry accepted discounted cash flow and optionpricing model that incorporated Sanmar’s assumed credit spread of 7.1% and certain redemption options embeddedin the bonds. The assumed credit spread was based on credit spreads of industry comparables with company specificadjustments for credit risk premium. At December 31, 2016 the company’s internal valuation model indicated thatthe fair value of the bonds was $299,093, resulting in an unrealized gain of $6,907 in 2016 which was recorded in netunrealized gains on investments in the consolidated statements of earnings, largely offset by an unrealized foreigncurrency translation loss of $6,814 which was recorded in the consolidated statements of comprehensive income in2016. The net unrealized gain of $6,907 was primarily related to the accretion of the security to the company’sredemption value after incorporating both the issue’s credit risk and the redemption option held by the issuer priorto maturity.
66

Sanmar’s Summarized Financial Information
On April 18, 2016 Sanmar acquired 100% of SHL Securities Alpha Limited (‘‘SHL Alpha’’) and as a result of thistransaction SHL Alpha became a wholly-owned subsidiary of Sanmar. The historical audited and interim financialstatements of Sanmar do not include the consolidated financial information of SHL Alpha and its subsidiaries.Accordingly, the balance sheets of Sanmar and SHL Alpha at March 31, 2016 were combined (‘‘Sanmar Combined’’)to give effect to the acquisition.
The company’s fiscal year ends on December 31 and Sanmar’s fiscal year ends on March 31. Summarized below areSanmar’s balance sheets at September 30, 2016 and March 31, 2016.
Balance Sheets(unaudited – US$ thousands)
September 30, 2016(1) March 31, 2016(1)
Sanmar Sanmar Combined
Current assets 283,674 148,892Non-current assets 1,254,160 1,285,258Current liabilities 383,133 463,725Non-current liabilities 1,308,636 1,062,992Shareholders’ equity (153,935) (92,567)
(1) The net assets of Sanmar were translated at September 30, 2016 at $1 U.S. dollar = 66.58 Indian rupees and at March 31,2016 at $1 U.S. dollar = 66.22 Indian rupees. The exchange rates used were the spot rates prevailing on those respectivedates.
Current assets increased by $134,782 to $283,674 at September 30, 2016 from $148,892 at March 31, 2016 primarilydue to increases in cash and cash equivalents relating to the September 26, 2016 investment from Fairfax India andbank loans received by Sanmar Egypt to finance the Phase 2 expansion project in Egypt.
Non-current assets decreased by $31,098 to $1,254,160 at September 30, 2016 from $1,285,258 at March 31, 2016primarily due to a decrease in property, plant and equipment due to depreciation for the period.
Current liabilities decreased by $80,592 to $383,133 at September 30, 2016 from $463,725 at March 31, 2016primarily due to a reduction in short term loans and borrowings relating to repayment of certain high interestbearing loans. The high interest bearing loans were repaid and new long term loans and borrowings with lowerinterest rates were entered into during the period, as noted below.
Non-current liabilities increased by $245,644 to $1,308,636 at September 30, 2016 from $1,062,992 at March 31,2016 primarily due to an increase in long term loans and borrowings principally relating to the $299,000 bondinvestment by Fairfax India and bank loans received by the Sanmar Egypt segment to finance the Phase 2 expansionproject in Egypt, partially offset by repayment of a portion of long term debt in Chemplast.
Summarized below is Sanmar’s statement of earnings for six months ended September 30, 2016.
Statement of Earnings(unaudited – US$ thousands)
Six months endedSeptember 30, 2016(1)
Sanmar
Revenue 289,204Net loss before taxes (35,394)Net loss (57,775)
(1) Amounts for the six months ended September 30, 2016 were translated into US$ using the average exchange rates of$1 U.S. dollar = 66.93 Indian rupees prevailing during that period.
67
FAIRFAX INDIA HOLDINGS CORPORATION
Sanmar’s revenue of $289,204 for the six months ended September 30, 2016 was principally comprised of revenuesfrom its Chemplast division with higher than budgeted volumes achieved in the PVC business, which was negativelyimpacted by lower revenues from the Sanmar Egypt business as a result lower production volumes stemming fromshort term plant shutdowns to address maintenance issues. Sanmar’s net loss of $57,775 for the six months endedSeptember 30, 2016 principally related to net losses in the Sanmar Egypt business as a result of lower productionvolumes as described above. Sanmar Egypt’s maintenance issues at the plant were subsequently resolved.
Privi Organics Limited
Business Overview
Privi Organics Limited (‘‘Privi’’), a private company founded in 1992, is a supplier of aroma chemicals to thefragrance industry and is located in Mumbai, India. Privi’s world-class products are the result of its very strongresearch and development team that has proven expertise in developing new products, customizing aromas percustomer specifications, scaling up products from basic research to commercial scale, and designing processimprovements to drive quality and cost optimization. With an installed capacity of 22,000 tonnes per annum ofaroma chemicals, Privi enjoys a dominant position and economies of scale in its product categories.
Privi converts waste product from paper mills into specialty aromas used as fragrance additives. The research effortsare facilitated with an advanced research infrastructure comprising two labs, both recognized by the Department ofScientific and Industrial Research. Privi has also dedicated one of these labs to focus on the development of greenproducts and technology, in an effort to help preserve the environment.
Additional information can also be accessed from Privi’s website www.privi.com.
Transaction Description
On August 26, 2016 the company, through its wholly-owned subsidiaries, acquired a 50.8% common share equityinterest in Privi for total consideration of $54,975 (approximately 3.7 billion Indian rupees).
Additionally, on July 12, 2016 the boards of directors of Fairchem and Privi approved a merger arrangement(the ‘‘Merger’’) involving the two companies, which is expected to bring significant diversification and synergies toboth. In December 2016 and February 2017 shareholder and regulatory approvals were received, respectively, for theMerger. Under the terms of the Merger, Privi shareholders will receive 27 common equity shares and 27 compulsorilyconvertible preference shares (‘‘CCPS’’) of the merged entity for every 40 Privi shares exchanged (‘‘swap ratio’’). Finalclosing of the Merger is subject to customary closing conditions, which involve the share exchange, and is expectedto occur by the end of the first quarter of 2017. Fairfax India will own approximately 49% of the merged entity, afterfactoring in the conversion of the CCPS. The swap ratio was recommended in a valuation report dated July 12, 2016issued by M/s. Walker Chandiok & Co. LLP, Independent Chartered Accountants (a member firm of Grant Thorntonin India). ICICI Securities Limited issued a fairness opinion on the swap ratio. Fairchem and Privi Board of Directorapproval was received on the swap ratio.
At December 31, 2016 the company had appointed one of the ten Privi board members.
Key business drivers, events and risks
Privi’s business drivers for growth are comprised of: (i) developing, manufacturing and supplying additional (newer)aroma chemicals to existing customers; (ii) making value added products from by-products made in manufacturingof aroma chemicals; and (iii) strengthening margins by increasing backward integration capacities.
Valuation and Consolidated Financial Statement Impact
The initial transaction price was considered to approximate fair value at December 31, 2016 as there had been nosignificant changes to Privi’s business, capital structure and operating environment and the key assumptions in thecompany’s acquisition valuation model continued to be valid due to the proximity of the transaction closing date toDecember 31, 2016. As a result, in 2016 the consolidated statements of earnings included nil in net unrealized gainson investments (2015 – nil) related to the investment in Privi.
68
At December 31, 2016 the company prepared a valuation model to determine the value of its 9,517,042 Privicommon shares using the quoted bid price of Fairchem (498.10 Indian rupees per share) and the swap ratio. Thecompany’s internal valuation model indicated a value of $94,292 and an unrealized gain of $40,392, which was notrecorded in the consolidated statements of earnings as the Merger still required regulatory approval atDecember 31, 2016.
National Stock Exchange of India Limited
Business Overview
National Stock Exchange of India Limited (‘‘NSE’’), a private company located in Mumbai, India, is India’s largeststock exchange covering various cities and towns across the country. In addition to being a platform for all exchangetraded financial products in India, NSE’s flagship index, Nifty50, is used extensively by investors in India and aroundthe world as a barometer of the Indian capital markets.
Additional information can also be accessed from NSE’s website www.nseindia.com.
Transaction Description
In the third quarter of 2016 the company, through its wholly-owned subsidiaries, acquired a 1.0% common shareequity interest in NSE for total consideration of $26,783 (approximately 1.8 billion Indian rupees).
At December 31, 2016 the company did not have any NSE board representation.
Key business drivers, events and risks
India has two main stock exchanges where most of its trading takes place, the BSE and the NSE. BSE has been inexistence since 1875, while the NSE is relatively new, with trading beginning in 1994. NSE has approximately1,300 listed firms available for trading on the exchange, while the BSE has approximately 5,500 listed firms availablefor trading. NSE’s major product categories are equities, derivatives and debentures. Almost all significant firms inIndia are listed on both the BSE and the NSE exchange but NSE enjoys a dominant market share position thatrepresents a significant portion of the exchange market with the NSE representing an 86% market share in the equitytrading cash segment, a 99% market share in the equity derivatives trading segment and a 56% market share in theforeign exchange derivatives market. With an annual GDP growth percentage between 5% and 10% per year since2010, India can expect to have a large number of businesses added to the list of exchange traded securities during thistime of economic expansion.
On June 23, 2016 NSE announced that they will be filing for an IPO in early 2017 (anticipated to be completed bySeptember 2017) and will also look to file for an overseas listing in 2017. They have appointed Citibank, JMFinancial, Kotak Mahindra and Morgan Stanley as lead investment banks to manage the IPO. The IPO was is inresponse to their dominance in the domestic equity market and will enable existing shareholders of the NSE to dilutetheir ownership in the exchange through an open offer.
On February 3, 2017 the NSE appointed Vikram Limaye (formerly the CEO of infrastructure lender IDFC Limited‘‘IDFC’’) as CEO. Mr. Limaye will be the first head of the NSE to come from outside the ranks of the NSE’s foundingteam since it was set up in 1992. Mr. Limaye had been with IDFC since 2005 and has served more than 25 years withfinancial institutions, global investment banks, international commercial banks, and global accounting firms.
Valuation and Consolidated Financial Statement Impact
The initial transaction price was considered to approximate fair value at year end due to the proximity of thetransaction closing date to December 31, 2016 and the absence of changes in factors impacting fair value since theclosing date. As a result, in 2016 the consolidated statements of earnings included nil in net unrealized gains oninvestments (2015 – nil) related to the investment in NSE.
In 2016 the consolidated statements of earnings included dividend income earned from the investment in NSE of$1,028 (2015 – nil).
69
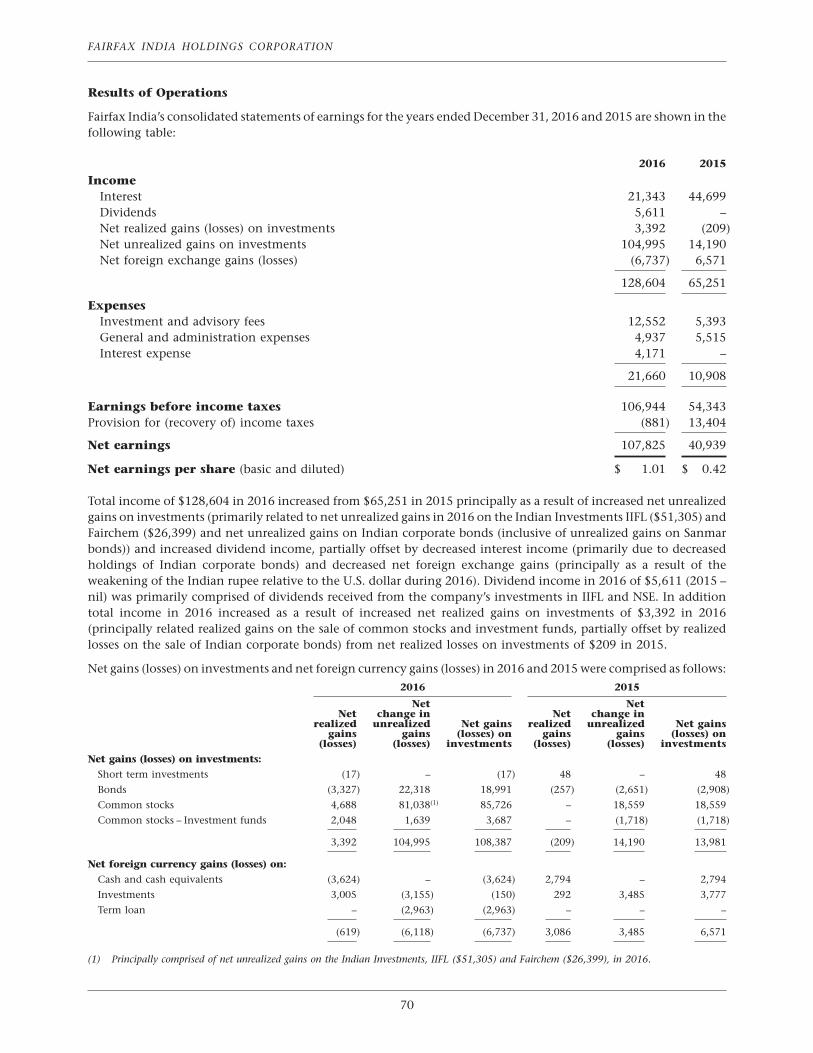
FAIRFAX INDIA HOLDINGS CORPORATION
Results of Operations
Fairfax India’s consolidated statements of earnings for the years ended December 31, 2016 and 2015 are shown in thefollowing table:
2016 2015
IncomeInterest 21,343 44,699Dividends 5,611 –Net realized gains (losses) on investments 3,392 (209)Net unrealized gains on investments 104,995 14,190Net foreign exchange gains (losses) (6,737) 6,571
128,604 65,251
ExpensesInvestment and advisory fees 12,552 5,393General and administration expenses 4,937 5,515Interest expense 4,171 –
21,660 10,908
Earnings before income taxes 106,944 54,343Provision for (recovery of) income taxes (881) 13,404
Net earnings 107,825 40,939
Net earnings per share (basic and diluted) $ 1.01 $ 0.42
Total income of $128,604 in 2016 increased from $65,251 in 2015 principally as a result of increased net unrealizedgains on investments (primarily related to net unrealized gains in 2016 on the Indian Investments IIFL ($51,305) andFairchem ($26,399) and net unrealized gains on Indian corporate bonds (inclusive of unrealized gains on Sanmarbonds)) and increased dividend income, partially offset by decreased interest income (primarily due to decreasedholdings of Indian corporate bonds) and decreased net foreign exchange gains (principally as a result of theweakening of the Indian rupee relative to the U.S. dollar during 2016). Dividend income in 2016 of $5,611 (2015 –nil) was primarily comprised of dividends received from the company’s investments in IIFL and NSE. In additiontotal income in 2016 increased as a result of increased net realized gains on investments of $3,392 in 2016(principally related realized gains on the sale of common stocks and investment funds, partially offset by realizedlosses on the sale of Indian corporate bonds) from net realized losses on investments of $209 in 2015.
Net gains (losses) on investments and net foreign currency gains (losses) in 2016 and 2015 were comprised as follows:
2016 2015
Net NetNet change in Net change in
realized unrealized Net gains realized unrealized Net gainsgains gains (losses) on gains gains (losses) on
(losses) (losses) investments (losses) (losses) investments
Net gains (losses) on investments:
Short term investments (17) – (17) 48 – 48
Bonds (3,327) 22,318 18,991 (257) (2,651) (2,908)
Common stocks 4,688 81,038(1) 85,726 – 18,559 18,559
Common stocks – Investment funds 2,048 1,639 3,687 – (1,718) (1,718)
3,392 104,995 108,387 (209) 14,190 13,981
Net foreign currency gains (losses) on:
Cash and cash equivalents (3,624) – (3,624) 2,794 – 2,794
Investments 3,005 (3,155) (150) 292 3,485 3,777
Term loan – (2,963) (2,963) – – –
(619) (6,118) (6,737) 3,086 3,485 6,571
(1) Principally comprised of net unrealized gains on the Indian Investments, IIFL ($51,305) and Fairchem ($26,399), in 2016.
70

Total expenses increased from $10,908 in 2015 to $21,660 in 2016 primarily as a result of increased investment andadvisory fees (principally as a result of increased holdings of Indian Investments) and interest expense incurred onthe 2-year secured term loan. The per annum investment and advisory fee is calculated as 0.5% of the value ofundeployed capital and 1.5% of the company’s total common shareholders’ equity less the value of undeployedcapital. For 2016, the company determined that the majority of its assets were invested in Indian Investments, whichare considered deployed capital.
The recovery of income taxes of $881 in 2016 differed from the provision for income taxes that would be determinedby applying the company’s Canadian statutory income tax rate of 26.5% to the company’s earnings before incometaxes primarily as a result of the tax rate differential on income earned outside of Canada and foreign exchangefluctuations, partially offset by unrecorded deferred taxes in Canada.
The provision for income taxes of $13,404 in 2015 differed from the provision for income taxes that would bedetermined by applying the company’s Canadian statutory income tax rate of 26.5% to the company’s earningsbefore income taxes primarily due to foreign exchange fluctuations and the unrecorded benefit of losses andtemporary differences.
The company reported net earnings of $107,825 ($1.01 net earnings per basic and diluted share) in 2016 compared tonet earnings of $40,939 ($0.42 net earnings per basic and diluted share) in 2015. The year-over-year increase inprofitability in 2016 reflected increased net unrealized gains on investments, partially offset by increased investmentand advisory fees (principally as a result of increased holdings of Indian Investments) and interest expense.
Consolidated Balance Sheet Summary
The assets and liabilities reflected on the company’s consolidated balance sheet at December 31, 2016 were impactedby the acquisitions of the Indian Investments (Sanmar, Privi, Fairchem and NSE), the sale of Indian corporate bondsand investment funds to finance those Indian Investments, and the 2-year secured $225,000 term loan.
Total Assets
Total assets at December 31, 2016 of $1,303,497 (December 31, 2015 – $1,025,451) were comprised as follows:
Total cash and investments increased to $1,261,339 at December 31, 2016 from $997,490 at December 31, 2015.The company’s cash and investments composition by the issuer’s country of domicile was as follows:
December 31, 2016 December 31, 2015
India U.S. Total India U.S. Total
Cash and cash equivalents 719(1) 165,051(2) 165,770 6,554(1) 12,367 18,921
Short term investments – U.S. treasury bills – 27,428 27,428 – 50,143 50,143
Bonds:Government of India 130,317 – 130,317 123,448 – 123,448Indian corporate 99,447 – 99,447 389,341 – 389,341Sanmar 299,093 – 299,093 – – –
528,857 – 528,857 512,789 – 512,789
Common stocks:IIFL 265,951 – 265,951 220,747 – 220,747NCML 146,586 – 146,586 146,445 – 146,445Privi 54,315 – 54,315 – – –Fairchem 45,488 – 45,488 – – –NSE 26,504 – 26,504 – – –Sanmar 440 – 440 – – –Investment funds – – – 48,445 – 48,445
539,284 – 539,284 415,637 – 415,637
Total cash and investments 1,068,860 192,479 1,261,339 934,980 62,510 997,490
(1) Included cash and cash equivalents invested in Mauritius and Canada of $716 at December 31, 2016 (December 31,2015 – $97 and restricted cash of $6,457).
(2) Included restricted cash of $18,810 at December 31, 2016 (December 31, 2015 – nil).
71

FAIRFAX INDIA HOLDINGS CORPORATION
Cash and cash equivalents increased to $165,770 at December 31, 2016 from $18,921 at December 31, 2015principally reflecting the net proceeds received from the term loan that had not yet been invested into IndianInvestments. Restricted cash of $18,810 at December 31, 2016 related to requirements under the term loan for thecompany to establish a debt service reserve account to fund the term loan interest payments compared to restricted cashof $6,457 at December 31, 2015 that related to cash in escrow arising from investments in IIFL ($3,600) and Fairchem($2,857).
Short term investments – U.S. treasury bills decreased to $27,428 at December 31, 2016 from $50,143 atDecember 31, 2015 principally reflecting the sale of short term investments to finance the investment in Privi.
Bonds and Common stocks – The company is actively seeking investment opportunities in India and willcontinue to redirect capital from its cash and cash equivalents and bond portfolio into Indian Investments as andwhen those opportunities are identified. For more information about recent Indian Investments, see the BusinessDevelopments and Indian Investments sections of this MD&A. For more information on the company’s total cashand investment holdings of $1,261,339 at December 31, 2016 (December 31, 2015 – $997,490) see note 6 (Cash andInvestments) to the consolidated financial statements for the year ended December 31, 2016.
Interest receivable decreased by $20,187 to $7,493 at December 31, 2016 from $27,680 at December 31, 2015primarily reflecting decreased interest receivable from Indian corporate bonds as a result of sales of Indian corporatebonds in 2016 where the proceeds were used to finance the Indian Investments (Sanmar, Fairchem and NSE).
Income taxes refundable was $7,326 at December 31, 2016 compared to income taxes payable of $9,386 atDecember 31, 2015, primarily reflecting income tax payments made during 2016 relating to the company’s 2015Canadian corporate tax return filing. The current income tax refundable in 2016 differed from the current incometax liability in 2015 primarily due to the impact of foreign accrual property losses (‘‘FAPL’’) and grossed up foreign taxdeduction in Canada in 2016 whereas in 2015 the company generated significant foreign accrual property income(‘‘FAPI’’) in Canada.
Other assets increased to $27,339 at December 31, 2016 from $281 at December 31, 2015 primarily relating to thereceivable of $26,525 on the sale of the company’s investment in investment funds where the sale proceeds were notreceived until January 2017.
Total Liabilities
Total liabilities at December 31, 2016 of $228,051 (December 31, 2015 – $12,122) were comprised as follows:
Payable to related parties increased to $3,673 at December 31, 2016 from $1,993 at December 31, 2015principally reflecting higher investment and advisory fees as a result of increased total common shareholders’ equity(primarily as a result of net earnings in 2016 (principally from net unrealized gains on the Indian Investments IIFLand Fairchem), partially offset by net unrealized foreign currency translation losses of $26,736).
Term loan – On September 16, 2016 the company completed a 2-year secured term loan (the ‘‘term loan’’) bearingan interest rate of LIBOR plus 350 to 500 basis points with a syndicate of Canadian banks for $225,000. AtDecember 31, 2016 the company used a portion of the net proceeds to complete the second tranche of Sanmar bonds($50,000) (see note 5 (Indian Investments) to the consolidated financial statements for the year ended December 31,2016). The term loan contained a mandatory prepayment clause that became effective when the company receivedthe net proceeds from the Offerings (see note 8 (Total Equity) to the consolidated financial statements for the yearended December 31, 2016), requiring repayment of the $225,000 principal amount of the term loan byMarch 31, 2017.
Comparison of 2015 to 2014 – Fairfax India was federally incorporated on November 25, 2014 and completed itsIPO in the first quarter of 2015, as a result there were no significant balances on the consolidated balance sheet atDecember 31, 2014 to which discussions of comparisons would apply.
Financial Condition
Capital Resources and Management
The company’s objectives when managing capital are to safeguard its ability to continue as a going concern in orderto provide returns for common shareholders and to maintain an optimal capital structure to reduce the cost ofcapital. The company will seek attractive risk-adjusted returns, but will at all times seek downside protection andattempt to minimize the loss of capital. Total capital at December 31, 2016, comprising the term loan and totalcommon shareholders’ equity, was $1,299,218 compared to $1,013,329 at December 31, 2015.
72

On September 16, 2016 the company completed a $225,000 term loan with a syndicate of Canadian banks. AtDecember 31, 2016 the company used a portion of the net proceeds to complete the second tranche of Sanmar bonds($50,000) (see note 5 (Indian Investments) to the consolidated financial statements for the year ended December 31,2016). As noted above, the term loan contained a mandatory prepayment clause requiring repayment byMarch 31, 2017.
On January 13, 2017 the company completed an underwritten public offering and concurrent with the publicoffering, Fairfax and OMERS acquired additional subordinate voting shares resulting in net proceeds of $493,504.Net proceeds from the Offerings will provide financing to acquire additional Indian Investments and will be used forgeneral corporate purposes.
Total common shareholders’ equity at December 31, 2016 increased to $1,075,446 from $1,013,329 at December 31,2015 primarily reflecting net earnings of $107,825, partially offset by unrealized foreign currency translation lossesof $26,736 in 2016.
Book Value per Share
Total common shareholders’ equity at December 31, 2016 was $1,075,446 (December 31, 2015 – $1,013,329). Thebook value per share at December 31, 2016 was $10.25 compared to $9.50 at December 31, 2015 representing anincrease in 2016 of 7.9%, primarily reflecting net earnings of $107,825, partially offset by unrealized foreign currencytranslation losses of $26,736.
December 31, 2016 December 31, 2015
Total common shareholders’ equity 1,075,446 1,013,329Number of common shares effectively outstanding 104,881,031 106,678,879Book value per share $ 10.25 $ 9.50
The company has issued and repurchased common shares since it was federally incorporated on November 25, 2014as follows:
NumberNumber of of
subordinate multiple Total Average issue/ Net proceeds/voting voting number repurchase (repurchase
Date shares shares(1) of shares price per share cost)
2014 – issuance of shares – 1 1 10.00 –2015 – issuance of shares 76,678,879 29,999,999 106,678,878 9.62 1,025,8252016 – repurchase of shares (1,797,848) – (1,797,848) 11.78 (21,178)
74,881,031 30,000,000 104,881,031
(1) Multiple voting shares that may only be issued to Fairfax or its affiliates.
On October 4, 2016 the company announced that the TSX accepted a notice filed by Fairfax India of its intention tocommence a normal course issuer bid for its subordinate voting shares by which it is authorized, until expiry of the bid onOctober 5, 2017, to acquire up to 3,500,000 subordinate voting shares representing approximately 6.4% of the publicfloat in respect of the subordinate voting shares. Decisions regarding any future repurchases will be based on marketconditions, share price and other factors including opportunities to invest capital for growth. The Notice of Intention toMake a Normal Course Issuer Bid is available, without charge, by contacting the Corporate Secretary of the company.
All of the share issuances in 2015 were pursuant to the IPO. During 2016 the company repurchased 1,797,848 subordinatevoting shares for cancellation under the terms of its normal course issuer bid.
Liquidity
The company believes that cash and cash equivalents at December 31, 2016, excluding the undeployed net proceedsreceived from the term loan, provides adequate liquidity to meet the company’s known significant expenses in 2017,which are principally comprised of investment and advisory fees, corporate income taxes and general andadministration expenses. The company expects to continue to receive investment income on its holdings of fixedincome securities and dividends from its equity investments to supplement its cash and cash equivalents.
73

FAIRFAX INDIA HOLDINGS CORPORATION
The net proceeds from the Offerings (refer to note 8 (Total Equity) to the consolidated financial statements for theyear ended December 31, 2016), together with net proceeds from the sale of a portion of the company’s U.S. treasurybills, Government of India bonds or Indian corporate bonds will be sufficient to fund the anticipated investment inBIAL, the 4.99% investment in IIFL (February 8, 2017) and the investment in Saurashtra (February 14, 2017), and willprovide the residual funding required to repay the term loan by March 31, 2017. The company has adequate workingcapital to support its operations.
Highlights in 2016 (with comparisons to 2015 except as otherwise noted) of major components of cash flow arepresented in the following table:
2016 2015
Operating activitiesCash provided by operating activities before the undernoted 17,508 2,460Net sales (purchases) of short term investments classified as FVTPL 22,590 (49,660)Purchases of bonds and common stocks classified as FVTPL (423,639) (1,228,072)Sales of bonds and common stocks classified as FVTPL 333,591 264,361Decrease (increase) in restricted cash in support of investments 6,457 (6,457)
Investing activitiesPurchases of premises and equipment (128) –
Financing activitiesIssuance of term loan, net of issuance costs 222,248 –Increase in restricted cash in support of term loan (18,810) –Issuance of subordinate voting shares, net of issuance costs – 727,972Issuance of multiple voting shares – 300,000Repurchases of subordinate voting shares (21,178) –Purchases for share-based payment awards – (451)
Increase in cash and cash equivalents during the year 138,639 10,153
Cash provided by operating activities before the undernoted is comprised of net earnings adjusted for items notaffecting cash and cash equivalents and changes in operating assets and liabilities. Cash provided by operatingactivities before the undernoted of $17,508 in 2016 increased from $2,460 in 2015, principally reflecting higherinterest and dividends received on securities, partially offset by higher income taxes paid and interest paid on theterm loan.
Net sales of short term investments classified as FVTPL of $22,590 in 2016 principally related to the sale of U.S. treasurybills to finance the investment in Privi compared to net purchases of short term investments classified as FVTPL of$49,660 in 2015 that primarily related to investing the undeployed capital received from the IPO into U.S. treasury bills.Purchases of bonds and common stock classified as FVTPL decreased from $1,228,072 in 2015 to $423,639 in 2016primarily reflecting lower purchases of both bonds and common stocks. In 2015 the company used the IPO net proceedsto purchase Indian corporate bonds and Government of India bonds, and started to deploy the capital into IndianInvestments (IIFL and NCML). In 2016 purchases of bonds and common stocks classified as FVTPL related to purchases ofIndian Investments (Sanmar, Privi, Fairchem and NSE). Sales of bonds and common stocks classified as FVTPL of$333,591 and $264,361 in 2016 and 2015, respectively, principally related to the sale of Indian corporate bonds topartially finance the deployment of capital into Indian Investments. Decrease (increase) in restricted cash in support ofinvestments in 2016 and 2015 related to cash in escrow arising from investments in IIFL ($3,600) and Fairchem ($2,857).Refer to note 15 (Supplementary Cash Flow Information) to the consolidated financial statements for the year endedDecember 31, 2016 for details of purchases and sales of investments classified as FVTPL.
Issuance of term loan, net of issuance costs, of $222,248 and increase in restricted cash in support of term loan of$18,810 in 2016 related to the 2-year secured term loan where the company used a portion of the net proceeds toinvest in the second tranche of Sanmar bonds ($50,000). Repurchases of subordinate voting shares of $21,178 in2016 related to the company’s repurchases for cancellation of 1,797,848 subordinate voting shares. Issuance ofsubordinate voting shares, net of issuance costs, of $727,972 and issuance of multiple voting shares of $300,000 in2015 reflected net proceeds received from the IPO and private placement offerings. Issuance costs were primarilycomprised of fees paid to underwriters of the subordinate voting shares. Refer to note 8 (Total Equity) to theconsolidated financial statements for the year ended December 31, 2016 for details.
74

Contractual Obligations
Under the terms of the Investment Advisory Agreement, the company and its subsidiaries are contractually obligatedto pay Fairfax an investment and advisory fee and, if applicable, a performance fee. These fees will vary based on thebook value per share of the company.
In 2016 the investment and advisory fee recorded in the consolidated statements of earnings was $12,552 (2015 –$5,393).
The performance fee is paid for the period from January 30, 2015 to December 31, 2017 and for each consecutivethree-year period thereafter, and is calculated, on a cumulative basis, as 20% of any increase in total commonshareholders’ equity (including distributions) above a 5% per annum increase. The amount of commonshareholders’ equity at any time which must be achieved before any performance fee would be payable is sometimesreferred to as the ‘‘hurdle per share’’. The company determined that no performance fee should be accrued for 2016(2015 – nil) as the book value per share of $10.25 at that date was less than the hurdle per share at that date of $10.75.
On September 16, 2016, the company completed a $225,000 term loan with a syndicate of Canadian banks. AtDecember 31, 2016 the company used a portion of the net proceeds to complete the second tranche of Sanmar bonds($50,000) (see note 5 (Indian Investments) to the consolidated financial statements for the year ended December 31,2016). The term loan contained a mandatory prepayment clause that became effective when the company receivedthe net proceeds from the Offerings (see note 8 (Total Equity) to the consolidated financial statements for the yearended December 31, 2016), requiring repayment of the $225,000 principal amount of the term loan byMarch 31, 2017.
Related Party Transactions
For details on the company’s related party transactions, please see note 12 (Related Party Transactions) to theconsolidated financial statements for the year ended December 31, 2016.
Accounting and Disclosure Matters
Management’s Evaluation of Disclosure Controls and Procedures
Under the supervision and with the participation of the company’s management, including the company’s CEO andCFO, the company conducted an evaluation of the effectiveness of its disclosure controls and procedures as ofDecember 31, 2016, as required by the Canadian securities legislation. Disclosure controls and procedures aredesigned to ensure that the information required to be disclosed by the company in the reports it files or submitsunder securities legislation is recorded, processed, summarized and reported on a timely basis and that suchinformation is accumulated and reported to management, including the company’s CEO and CFO, as appropriate, toallow required disclosures to be made in a timely fashion. Based on their evaluation, the CEO and CFO haveconcluded that as of December 31, 2016, the company’s disclosure controls and procedures were effective.
Management’s Report on Internal Control Over Financial Reporting
The company’s management is responsible for establishing and maintaining adequate internal control over financialreporting (as defined under National Instrument 52-109). The company’s internal control over financial reporting isa process designed to provide reasonable assurance regarding the reliability of financial reporting and thepreparation of financial statements for external purposes in accordance with International Financial ReportingStandards as issued by the International Accounting Standards Board. A company’s internal control over financialreporting includes those policies and procedures that (i) pertain to the maintenance of records that, in reasonabledetail, accurately and fairly reflect the transactions and dispositions of the assets of the company; (ii) providereasonable assurance that transactions are recorded as necessary to permit preparation of financial statements inaccordance with generally accepted accounting principles, and that receipts and expenditures of the company arebeing made only in accordance with authorizations of management and directors of the company; and (iii) providereasonable assurance regarding prevention or timely detection of unauthorized acquisition, use, or disposition of thecompany’s assets that could have a material effect on the consolidated financial statements.
75

FAIRFAX INDIA HOLDINGS CORPORATION
Because of its inherent limitations, internal control over financial reporting may not prevent or detectmisstatements. Also, projections of any evaluation of effectiveness to future periods are subject to the risk thatcontrols may become inadequate because of changes in conditions, or that the degree of compliance with thepolicies or procedures may deteriorate.
The company’s management assessed the effectiveness of the company’s internal control over financial reporting asof December 31, 2016. In making this assessment, the company’s management used the criteria set forth by theCommittee of Sponsoring Organizations of the Treadway Commission (‘‘COSO’’) in Internal Control – IntegratedFramework (2013). The company’s management, including the CEO and CFO, concluded that, as of December 31,2016, the company’s internal control over financial reporting was effective based on the criteria in Internal Control –Integrated Framework (2013) issued by COSO.
Critical Accounting Estimates and Judgments
Please refer to note 4 (Critical Accounting Estimates and Judgments) to the consolidated financial statements for theyear ended December 31, 2016.
Significant Accounting Policy Changes
The company completed its IPO on January 30, 2015 and commenced its investment activities shortly thereafter.Please refer to note 3 (Summary of Significant Accounting Policies) to the consolidated financial statements for theyear ended December 31, 2016 for a detailed discussion of the company’s accounting policies. There were nosignificant accounting policy changes during 2016.
Future Accounting Changes
Certain new IFRS may have a significant impact on the company’s consolidated financial reporting in the future.Each of those standards will require a moderate degree of implementation effort within the next year as describedbelow. The company does not expect to adopt any of these new standards in advance of their respective effectivedates. New IFRS standards and amendments that have been issued but are not yet effective are also described innote 3 (Summary of Significant Accounting Policies) to the consolidated financial statements for the year endedDecember 31, 2016.
IFRS 9 Financial Instruments (2014) (‘‘IFRS 9’’)
In July 2014 the IASB issued a complete version of IFRS 9 which supersedes the 2010 version currently applied by thecompany (‘‘IFRS 9 (2010)’’). IFRS 9 is effective for annual periods beginning on or after January 1, 2018, withretrospective application, and includes: requirements for the classification and measurement of financial assets andliabilities; an expected credit loss model that replaces the existing incurred loss impairment model; and new hedgeaccounting guidance.
The company has commenced evaluating the impact of IFRS 9 by assessing its business models and the cash flowcharacteristics of its financial assets to determine their appropriate classifications under the new standard. Thecompany expects equity securities held within the company’s investment portfolio to continue to be classified asFVTPL under IFRS 9, and the classification of financial liabilities to also remain largely unchanged from IFRS 9 (2010).Upon adopting IFRS 9 on January 1, 2018 the company does not expect to restate comparative periods, and willrecord any necessary adjustments to opening retained earnings as permitted by the standard.
Risk Management
Overview
The primary goals of the company’s financial risk management program are to ensure that the outcomes of activitiesinvolving elements of risk are consistent with the company’s objectives and risk tolerance, while maintaining anappropriate balance between risk and reward and protecting the company’s consolidated balance sheets from eventsthat have the potential to materially impair its financial strength. There were no significant changes in the types ofthe company’s risk exposures or the processes used by the company for managing those risk exposures atDecember 31, 2016 compared to those identified at December 31, 2015 and disclosed in the company’s 2015 AnnualReport, other than as outlined in note 11 (Financial Risk Management) to the consolidated financial statements forthe year ended December 31, 2016.
76

Risks
The following risks, among others, should be considered in evaluating the outlook for the company. Additional risksnot currently known to the company or that are currently deemed immaterial may also impair business operations.The company, its consolidated subsidiaries, Fairfax and the Portfolio Advisor monitor these risks on an on-goingbasis and take actions as needed to mitigate their impact.
Weather Risk
Certain Indian Investments (including NCML, Fairchem and Privi) are operating in industries exposed to weatherrisk. The revenues of these portfolio companies may be adversely affected during a period of severe weatherconditions in India. Because weather events are unpredictable by nature, historical results of operations of certainIndian Investments may not be indicative of their future results of operations. As a result of the occurrence of one ormore major weather catastrophes in any given period, the expected returns from Indian Investments impacted byweather risk may fall short of the company’s expectations.
A significant increase in the price of crude oil could adversely affect the Indian economy whichcould adversely affect Indian Investments
India imports a majority of its requirements of petroleum oil and petroleum products. The Government of India hasderegulated prices and has been reducing the subsidy in respect of certain oil products, resulting in internationalcrude prices having a greater effect on domestic oil prices. While global oil prices continue to be relatively subdued,any increase or volatility in oil prices, as well as the impact of Indian rupee depreciation, which makes imports moreexpensive, and the pass-through of such increases to Indian consumers could have a material adverse impact on theIndian economy, including a rise in inflation and market interest rates resulting in a significant impact on theprofitability of certain Indian Investments.
Geographic Concentration of Investments
All of the company’s investments will be made in India and in Indian businesses or other businesses with customers,suppliers or business primarily conducted in, or dependent on, India. As a result, the company’s performance will beparticularly sensitive to economic changes in India. The market value of the company’s investments, the incomegenerated by the company and the company’s performance will be particularly sensitive to changes in the economiccondition and regulatory environment in India. Adverse changes in the economic condition or regulatoryenvironment of India may have a material adverse effect on the company’s business, cash flows, financial conditionand net earnings.
Foreign Currency Fluctuation
All of the company’s investments will be made in India and Indian businesses or other businesses with customers,suppliers or business primarily conducted in, or dependent on, India, and the financial position and results for theseinvestments are principally denominated in Indian rupees. The functional currency of the company and itsconsolidated subsidiaries (FIH Mauritius and FIH Private) is the Indian rupee and the company’s presentationcurrency is the U.S. dollar.
The company presents its consolidated financial statements in U.S. dollars to provide comparability with otherNorth American investment entities.
Accordingly, the income and expenses are translated at the average rates of exchange in effect during the applicablereporting period. Assets and liabilities are translated at the exchange rates in effect at the balance sheet date. As aresult, the company’s consolidated financial position is subject to foreign currency fluctuation risk, which couldmaterially adversely impact its operating results and cash flows. Although the company may enter into currencyhedging arrangements in respect of its foreign currency cash flows, there can be no assurance that the company willdo so or, if it does, that the full amount of the foreign currency exposure will be hedged at any time.
Volatility of the Indian Securities Markets
Stock exchanges in India have, in the past, experienced substantial fluctuations in the prices of listed securities. Thestock exchanges in India have also experienced temporary exchange closures, broker defaults, settlement delays andstrikes by brokerage firm employees. In addition, the governing bodies of the stock exchanges in India have, from
77
FAIRFAX INDIA HOLDINGS CORPORATION
time to time, imposed restrictions on trading in certain securities, limitations on price movements and marginrequirements. Furthermore, from time to time, disputes have occurred between listed businesses and stockexchanges and other regulatory bodies, which in some cases may have had a negative effect on market sentiment.
Investments May Be Made In Indian Private Businesses Where Information Is Unreliable orUnavailable
In pursuing the company’s investment strategy, the company may seek to make investments in privately-heldbusinesses. As minimal public information exists about private businesses, the company could be required to makeinvestment decisions on whether to pursue a potential investment in a private business on the basis of limitedinformation, which may result in an investment in a business that is not as profitable as the company initiallybelieved, if at all. Investments in private businesses pose certain incremental risks as compared to investments inpublic businesses, including that they:
• have reduced access to the capital markets, resulting in diminished capital resources and ability to withstandfinancial distress;
• may have limited financial resources and may be unable to meet their obligations under their debt securitiesthat the company may hold, which may be accompanied by a deterioration in the value of any collateral and areduction in the likelihood of the company realizing any guarantees that it may have obtained in connectionwith its investment;
• may have shorter operating histories, narrower product lines and smaller market shares than larger businesses,which tend to render them more vulnerable to competitors’ actions and changing market conditions, as wellas general economic downturns;
• are more likely to depend on the management talents and efforts of a small group of persons; therefore, thedeath, disability, resignation or termination of one or more of these persons could have a material adverseimpact on an investment and, as a result, the company; and
• generally have less predictable operating results, may from time to time be parties to litigation, may beengaged in rapidly changing businesses with products subject to a substantial risk of obsolescence, and mayrequire substantial additional capital to support their operations, finance expansion or maintain theircompetitive position.
Valuation Methodologies Involve Subjective Judgments
For purposes of IFRS-compliant financial reporting, the company’s assets and liabilities are valued in accordance withIFRS. Accordingly, the company is required to follow a specific framework for measuring the fair value of itsinvestments and, in its audited consolidated financial statements, to provide certain disclosures regarding the use offair value measurements.
The fair value measurement accounting guidance establishes a hierarchal disclosure framework that ranks theobservability of market inputs used in measuring financing instruments at fair value. The observability of inputsdepends on a number of factors, including the type of financial instrument, the characteristics specific to thefinancial instrument and the state of the marketplace, including the existence and transparency of transactionsbetween market participants. Financial instruments with readily quoted prices, or for which fair value can bemeasured from quoted prices in active markets, generally will have a high degree of market price observability andless judgment applied in determining fair value.
A portion of the company’s portfolio investments may be in the form of securities that are not publicly traded. Thefair value of securities and other investments that are not publicly traded may not be readily determinable. Thecompany will value these securities quarterly at fair value as determined in good faith by the company and inaccordance with the valuation policies and procedures under IFRS. The company may utilize the services of anindependent valuation firm to aid it in determining the fair value of these securities. The types of factors that may beconsidered in fair value pricing of the company’s investments include the nature and realizable value of anycollateral, the portfolio business’ ability to make payments and its earnings, the markets in which the portfolioinvestment does business, comparisons to publicly traded companies, discounted cash flows and other relevantfactors. Because such valuations, and particularly valuations of private securities and private companies, areinherently uncertain, such valuations may fluctuate over short periods of time and may be based on estimates, and
78
the company’s determinations of fair value may differ materially from the values that would have been used if aready market for these securities existed. The value of the company’s total assets could be materially adverselyaffected if the company’s determinations regarding the fair value of its investments were materially higher than thevalues that it ultimately realizes upon the disposition of such securities.
The value of the company’s portfolio may also be affected by changes in accounting standards, policies or practices.From time to time, the company will be required to adopt new or revised accounting standards or guidance. It ispossible that future accounting standards that the company is required to adopt could change the valuation of thecompany’s investments.
Due to a wide variety of market factors and the nature of certain securities to be held by the company, there is noguarantee that the value determined by the company or any third-party valuation agents will represent the valuethat will be realized by the company on the eventual disposition of the investment or that would, in fact, be realizedupon an immediate disposition of the investment. Moreover, the valuations to be performed by the company or anythird-party valuation agents are inherently different from the valuation of the company’s securities that would beperformed if the company were forced to liquidate all or a significant portion of its securities, as liquidation valuationcould be materially lower.
Pace of Completing Investments
The company’s business is to identify, with the assistance of the Portfolio Advisor, suitable investment opportunities,pursuing such opportunities and consummating such investment opportunities. If the company is unable to source andmanage its investments effectively, it would adversely impact the company’s financial position and net earnings. Therecan be no assurance as to the pace of finding and implementing investment opportunities. Conversely, there may only bea limited number of suitable investment opportunities at any given time. This may cause the company, while it deployscash proceeds not yet invested, to hold significant levels of cash, cash equivalents, bonds or short term U.S. treasury bills.A lengthy period prior to which capital is deployed may adversely affect the company’s overall performance.
Minority Investments
The company may make minority equity investments in businesses in which the company does not participate inthe management or otherwise influence the business or affairs of such businesses. The company will monitor theperformance of each investment and maintain an ongoing dialogue with each business’ management team.However, it will be primarily the responsibility of the management of the business to operate the business on aday-to-day basis and the company may not have the right to influence such business.
Reliance on Key Personnel and Risks Associated with the Investment Advisory Agreement
The management and governance of the company depends on the services of certain key personnel, including thePortfolio Advisor, Fairfax, as administrator, and certain executive officers of the company. The loss of the services ofany key personnel, particularly V. Prem Watsa and Chandran Ratnaswami, could have a material adverse effect onthe company and materially adversely affect the company’s financial condition and net earnings.
The company will rely on the Portfolio Advisor and its affiliates, from time to time with respect to the sourcing of itsinvestments. Consequently, the company’s ability to achieve its investment objectives depends in large part on thePortfolio Advisor and its ability to identify and advise the company on attractive investment opportunities. Thismeans that the company’s investments are dependent upon the Portfolio Advisor’s business contacts, its ability tosuccessfully hire, train, supervise and manage its personnel and its ability to maintain its operating systems. If thecompany were to lose the services provided by the Portfolio Advisor or its key personnel or if the Portfolio Advisorfails to satisfactorily perform its obligations under the Investment Advisory Agreement, the company’s investmentsand growth prospects may decline.
The company may be unable to duplicate the quality and depth of management from the Portfolio Advisor if thecompany were to source and manage its own investments or if it were to hire another investment advisor. If thePortfolio Advisor should cease for whatever reason to be the investment advisor of the company or Fairfax shouldcease to provide investment administration services to the company, the cost of obtaining substitute services may begreater than the fees the company will pay the Portfolio Advisor and Fairfax under the Investment AdvisoryAgreement, and this may adversely affect the company’s ability to meet its objectives and execute its strategy whichcould materially and adversely affect the company’s cash flows, net earnings and financial condition.
79
FAIRFAX INDIA HOLDINGS CORPORATION
Lawsuits
The company operates in Canada, Mauritius and India and may, from time to time, become party to a variety of legalclaims and regulatory proceedings. The existence of such claims against the company and its consolidatedsubsidiaries, directors or officers could have adverse effects, including the incurrence of significant legal expensesdefending claims, even those without merit.
The company and its consolidated subsidiaries manage day-to-day regulatory and legal risk primarily byimplementing appropriate policies, procedures and controls. Internal and external counsels also work closely withthe company and its consolidated subsidiaries to identify and mitigate areas of potential regulatory and legal risk.
Significant Shareholder
Fairfax, through its subsidiaries, owns 30,000,000 multiple voting shares. During 2016, certain Fairfax subsidiariespurchased 796,864 subordinate voting shares through open market transactions. At December 31, 2016 Fairfax’smultiple and subordinate voting share holdings represented 95.3% of the voting rights and 29.4% of the equityinterest in Fairfax India (December 31, 2015 – 95.1% and 28.1% respectively). Subsequent to December 31, 2016,Fairfax acquired an additional 13,717,873 subordinate voting shares from the company by way of a privateplacement (see note 8 (Total Equity) to the consolidated financial statements for the year ended December 31, 2016)and open market transactions. After giving effect to those transactions, Fairfax’s holdings represented 93.6% of thevoting rights and 30.2% of the equity interest in Fairfax India. Fairfax has the ability to substantially influencecertain actions requiring shareholder approval, including approving an Indian Investment, liquidation or sale ofassets, electing members of the Board of Directors and adopting amendments to articles of incorporationand by-laws.
Taxation Risks
The company structures its business according to prevailing taxation law and practice in Canada, Mauritius andIndia. Any change in tax policy, tax legislation (including in relation to taxation rates), the interpretation of taxpolicy or legislation or practice could adversely affect the company’s return earned on investments and on the capitalavailable to be invested. Further, taxes and other constraints that would apply to the company and its consolidatedsubsidiaries in such jurisdictions may not apply to other parties, and such parties may therefore have a significantlylower effective cost of capital and a corresponding competitive advantage in pursuing investments. A number ofother factors may increase the effective tax rates, which would have a negative impact on net earnings. Theseinclude, but are not limited to, changes in the valuation of our deferred tax assets and liabilities, and anyreassessment of taxes by a taxation authority.
The company has tax specialist personnel for assessing the income tax consequences of planned transactions andevents and undertaking the appropriate tax planning. The company also consults with external tax professionals asneeded. Tax legislation of each jurisdiction in which the company operates is interpreted to determine income taxesand expected timing of the reversal of deferred income tax assets and liabilities. Any amendments to the capital gainsand permanent establishment articles in the India-Mauritius Double Taxation Avoidance Agreement may result incapital gains derived from the company or its investments in India becoming subject to tax in India, which couldhave a material adverse effect on the company’s business, financial condition and net earnings. During the secondquarter of 2016, India and Mauritius amended their double income tax treaty. As a result, investments acquired up toApril 1, 2017 will not be assessed by India for tax on their future disposition. After April 1, 2017, India will levy capitalgains tax at half the India domestic rate on equity investments purchased or sold through Mauritius until March 31,2019 and at the full rate from April 1, 2019 onward.
Emerging Markets
The company’s investment objective is to achieve long-term capital appreciation, while preserving capital, byinvesting in Indian Investments. Foreign investment risk is particularly high given that the company invests insecurities of issuers based in or doing business in an emerging market country.
80

The economies of emerging market countries have been and may continue to be adversely affected by economicconditions in the countries with which they trade. The economies of emerging market countries may also bepredominantly based on only a few industries or dependent on revenues from particular commodities.
Also, because publicly traded debt instruments of emerging market issuers represent a relatively recent innovation inthe world debt markets, there is little historical data or related market experience concerning the attributes of suchinstruments under all economic, market and political conditions.
Other heightened risks associated with emerging markets investments include without limitation: (i) risks due to lesssocial, political and economic stability, including the risk of war, terrorism, nationalization, limitations on theremoval of funds or other assets, or diplomatic developments that affect investments in these countries; (ii) thesmaller size of the market for such securities and a lower volume of trading, resulting in a lack of liquidity and in pricevolatility; (iii) certain national policies which may restrict the company’s investment opportunities, includingrestrictions on investing in issuers or industries deemed sensitive to relevant national interests and requirements thatgovernment approval be obtained prior to investment by foreign persons; (iv) certain national policies that mayrestrict the company’s repatriation of investment income, capital or the proceeds of sales of securities, includingtemporary restrictions on foreign capital remittances; (v) the lack of uniform accounting and auditing standardsand/or standards that may be significantly different from the standards required in Canada; (vi) less publiclyavailable financial and other information regarding issuers; (vii) potential difficulties in enforcing contractualobligations; and (viii) higher rates of inflation, higher interest rates and other economic concerns. The company mayinvest to a substantial extent in emerging market securities that are denominated in Indian rupees, subjecting thecompany to a greater degree of foreign currency risk.
As reflected in the above discussion, investments in emerging market securities involve a greater degree of risk than,and special risks in addition to the risks associated with, investments in domestic securities or in securities of foreigndeveloped countries.
Economic Risk
The Indian economy has grown rapidly during the past several years and there is no assurance that this growth ratewill be maintained. India may experience substantial (and, in some cases, extremely high) rates of inflation oreconomic recessions causing a negative effect on the Indian economy. India may also impose restrictions on theexchange or export of currency, institute adverse currency exchange rates or experience a lack of available currencyhedging instruments. Any of these events could have a material adverse effect on the Indian economy.
Trading Price of Common Shares Relative to Book Value per Share
The company is neither a mutual fund nor an investment fund, and due to the nature of its business and investmentstrategy, and the composition of its investment portfolio, the market price of its common shares, at any time, mayvary significantly from its book value per share. This risk is separate and distinct from the risk that the market price ofthe common shares may decrease.
81

FAIRFAX INDIA HOLDINGS CORPORATION
Other
Quarterly Data (unaudited)
December 31, September 30, June 30, March 31, December 31, September 30, June 30, March 31,2016 2016 2016 2016 2015 2015 2015 2015
Income 11,566 75,346 33,917 7,775 29,668 30,114 1,267 4,202Expenses 8,036 5,760 3,967 3,897 2,559 4,418 2,487 1,444
Provision for (recovery of) income taxes 1,106 3,186 (8,309) 3,136 6,318 7,378 964 (1,256)Net earnings (loss) 2,424 66,400 38,259 742 20,791 18,318 (2,184) 4,014Net earnings (loss) per share $ 0.02 $ 0.62 $ 0.36 $ 0.01 $ 0.19 $ 0.17 $ (0.02) $ 0.06
December 31, September 30, June 30, March 31, December 31,(in Indian rupees and in thousands)(1) 2016 2016 2016 2016 2015
Income 784,002 5,040,596 2,276,566 524,810 1,902,290Expenses 540,632 383,530 265,351 263,045 164,092Provision for (recovery of) income taxes 74,174 215,826 (559,268) 211,699 405,088Net earnings 169,196 4,441,240 2,570,483 50,066 1,333,110Net earnings per share 1.60 41.63 24.10 0.47 12.50
(1) Presented for the quarters starting October 1, 2015, the date upon which the company’s functional currency changed from the U.S. dollar to the Indian rupee.
Total income of $11,566 in the fourth quarter of 2016 decreased from $29,668 in the fourth quarter of 2015 primarilyas a result of decreased net unrealized gains on investments. Net unrealized gains on investments of $4,765 in thefourth quarter of 2016 included net unrealized gains on bonds of $5,702 (primarily unrealized gains on Sanmar andGovernment of India bonds) and common stock of $199 (principally related to unrealized gains on Fairchem andNCML, partially offset by unrealized losses on IIFL), while the net unrealized gains on investments of $15,776 in thefourth quarter of 2015 included net unrealized gains on common stock of $18,559 (principally related to unrealizedgains on IIFL), partially offset by net unrealized losses on bonds of $2,268 (primarily related to unrealized losses onIndian corporate bonds).
Total income also decreased in the fourth quarter of 2016 compared to the fourth quarter of 2015 as a result ofdecreased net foreign exchange gains (principally as a result of the weakening of the Indian rupee relative to the U.S.dollar during 2016), and decreased interest income (primarily due to decreased holdings of Indian corporate bonds)consistent with the company investing its capital into public and private Indian Investments commencing in thefourth quarter of 2015, partially offset by increased net realized gains on investments (principally related thedisposition of the remaining investment in investment funds in the fourth quarter of 2016).
Total expenses of $8,036 in the fourth quarter of 2016 increased from $2,559 in the fourth quarter of 2015, which isconsistent with the increased holdings of Indian Investments that resulted in higher investment and advisory fees.Total expenses in the fourth quarter of 2016 also reflected the interest expense related to the 2-year secured termloan.
The company reported net earnings of $2,424 (net earnings of $0.02 per share) in the fourth quarter of 2016compared to net earnings of $20,791 (net earnings of $0.19 per share) in the fourth quarter of 2015. The decrease inprofitability in the fourth quarter of 2016 primarily reflected decreased net unrealized gains on investments andinterest income, increased investment and advisory fees and increased interest expense.
82

Stock Prices and Share Information
At March 10, 2017 the company had 117,434,531 subordinate voting shares and 30,000,000 multiple voting sharesoutstanding (an aggregate of 147,434,531 shares effectively outstanding). Each subordinate voting share carriesone vote per share at all meetings of shareholders except for separate meetings of holders of another class of shares.Each multiple voting share carries fifty votes per share at all meetings of shareholders except for separate meetings ofholders of another class of shares. The multiple voting shares are not publicly traded.
The table that follows presents the TSX high, low and closing U.S. dollar prices of the subordinate voting shares ofFairfax India, trading under the symbol FIH.U, for each quarter of 2016 and 2015.
First Second Third FourthQuarter Quarter Quarter Quarter
(US$)
2016High 10.89 11.95 11.25 12.00Low 9.30 10.25 10.06 10.90Close 10.85 10.50 11.00 11.55
2015High 11.59 12.74 12.10 11.15Low 9.80 11.05 10.60 10.02Close 11.50 11.35 11.10 10.10
Compliance with Corporate Governance Rules
Fairfax India is a Canadian reporting issuer with securities listed on the TSX and trading in U.S. dollars under thesymbol FIH.U. It has in place corporate governance practices that comply with all applicable rules and substantiallycomply with all applicable guidelines and policies of the Canadian Securities Administrators and the practices setout therein.
The company’s Board of Directors has adopted a set of Corporate Governance Guidelines (which include a writtenmandate of the Board), established an Audit Committee and Governance, Compensation and NominatingCommittee, approved written charters for all of its committees, approved a Code of Business Conduct and Ethicsapplicable to all directors, officers and employees of the company and established, in conjunction with the AuditCommittee, a Whistleblower Policy. The company continues to monitor developments in the area of corporategovernance as well as its own procedures.
83

FAIRFAX INDIA HOLDINGS CORPORATION
Forward-Looking Statements
This annual report may contain forward-looking information within the meaning of applicable securities legislation.Forward-looking statements may relate to the company’s or an Indian Investment’s future outlook and anticipatedevents or results and may include statements regarding the financial position, business strategy, growth strategy,budgets, operations, financial results, taxes, dividends, plans and objectives of the company. Particularly, statementsregarding future results, performance, achievements, prospects or opportunities of the company, an IndianInvestment, or the Indian market are forward-looking statements. In some cases, forward-looking statements can beidentified by the use of forward-looking terminology such as ‘‘plans’’, ‘‘expects’’ or ‘‘does not expect’’, ‘‘is expected’’,‘‘budget’’, ‘‘scheduled’’, ‘‘estimates’’, ‘‘forecasts’’, ‘‘intends’’, ‘‘anticipates’’ or ‘‘does not anticipate’’ or ‘‘believes’’, orvariations of such words and phrases or state that certain actions, events or results ‘‘may’’, ‘‘could’’, ‘‘would’’,‘‘might’’, ‘‘will’’ or ‘‘will be taken’’, ‘‘occur’’ or ‘‘be achieved’’.
Forward-looking statements are based on the opinions and estimates of the company as of the date of this annualreport, and they are subject to known and unknown risks, uncertainties, assumptions and other factors that maycause the actual results, level of activity, performance or achievements to be materially different from thoseexpressed or implied by such forward-looking statements, including but not limited to the following factors:taxation of the company and its subsidiaries; substantial loss of capital; long-term nature of investment; limitednumber of investments; geographic concentration of investments; potential lack of diversification; financial marketfluctuations; pace of completing investments; control or significant influence position risk; minority investments;ranking of company investments and structural subordination; follow-on investments; prepayments of debtinvestments; risks upon dispositions of investments; bridge financings; reliance on key personnel; effect of fees;performance fee could induce Fairfax to make speculative investments; operating and financial risks of investments;allocation of personnel; potential conflicts of interest; employee misconduct at the portfolio advisor could harm thecompany; valuation methodologies involve subjective judgments; lawsuits; foreign currency fluctuation; derivativerisks; unknown merits and risks of future investments; resources could be wasted in researching investmentopportunities that are not ultimately completed; investments may be made in foreign private businesses whereinformation is unreliable or unavailable; illiquidity of investments; competitive market for investmentopportunities; use of leverage; investing in leveraged businesses; regulation; investment and repatriation restrictions;aggregation restrictions; restrictions relating to debt securities; pricing guidelines; emerging markets; corporatedisclosure, governance and regulatory requirements; legal and regulatory risks; volatility of the Indian securitiesmarkets; political, economic, social and other factors; governance issues risk; Indian tax law; changes in law;exposure to permanent establishment; enforcement of rights; smaller company risk; due diligence and conduct ofpotential investment entities; Asian economic risk; reliance on trading partners risk; natural disaster risks;government debt risk; and economic risk. Additional risks and uncertainties are described in the company’s annualinformation form which is available on SEDAR at www.sedar.com and on the company’s website atwww.fairfaxindia.ca. These factors and assumptions are not intended to represent a complete list of the factors andassumptions that could affect the company. These factors and assumptions, however, should be considered carefully.
Although the company has attempted to identify important factors that could cause actual results to differ materiallyfrom those contained in forward-looking statements, there may be other factors that cause results not to be asanticipated, estimated or intended. There can be no assurance that such statements will prove to be accurate, asactual results and future events could differ materially from those anticipated in such statements. Accordingly,readers should not place undue reliance on forward-looking statements. The company does not undertake to updateany forward-looking statements contained herein, except as required by applicable securities laws.
84

Directors of the Company Officers of the Company
Anthony F. Griffiths Jennifer AllenCorporate Director Chief Financial Officer
Christopher D. Hodgson Chandran RatnaswamiPresident Chief Executive OfficerOntario Mining Association
John VarnellAlan D. Horn Vice President, Corporate Affairs and Corporate SecretaryPresident and Chief Executive Officer
V. Prem WatsaRogers Telecommunications LimitedChairman
Deepak ParekhChairman Head OfficeHousing Development Finance Corporation Limited
95 Wellington Street WestHarsha Raghavan Suite 800Managing Director Toronto, Ontario, Canada M5J 2N7Fairbridge Capital Private Limited Telephone: (416) 367-4755
Website: www.fairfaxindia.caChandran RatnaswamiChief Executive Officer of the Company
AuditorV. Prem Watsa
PricewaterhouseCoopers LLPChairman of the Company
Transfer Agents and RegistrarsOperating Management
Computershare Trust Company of Canada, TorontoFIH Mauritius Investments Ltd.
Amy Tan Share ListingChief Executive Officer
Toronto Stock ExchangeStock Symbol: FIH.U
Annual Meeting
The annual meeting of the shareholders ofFairfax India Holdings Corporation will beheld on Thursday, April 20, 2017 at 2:00 p.m.(Toronto time) at Roy Thomson Hall,60 Simcoe Street, Toronto, Canada
85