2016 ANNUAL REPORT - Investor Relations
80
2016 ANNUAL REPORT
Transcript of 2016 ANNUAL REPORT - Investor Relations

2 0 1 6 A N N U A L R E P O R T

TO OUR SHAREHOLDERS –
2016 was a milestone year for us. With strong brand momentum, ambitious growth strategies and a powerfully connected team, we returned the company to positive earnings growth for the first time in three years.
Reflecting on our 2016 performance, I am incredibly proud of our team’s collective achievements clearly demonstrated by our passionate commitment to owning our position as the leading brand for an active, mindful lifestyle.
FINANCIAL + OPERATIONAL HIGHLIGHTS
We delivered revenue of $2.344 billion, representing topline growth of 14%, driven by a 7% constant dollar total comparable sales increase and square footage growth of 11%. And our focus on operational excellence delivered 280 basis points of gross margin improvement, primarily a result of the significant efforts towards improving our supply chain and sourcing infrastructure.
Our growth strategies remain unchanged and we are on track to deliver on our ambitious plan to reach $4 billion in revenue and double earnings by 2020.
BRAND + BUSINESS HIGHLIGHTS
2016 saw the beginning of our design-led vision, blending function and fashion, and building a solid innovation pipeline. This was best exemplified by the success of our first engineered sensation, the Align pant in Nulu™ which in just over a year became our top performing pant within our bottoms category.
Our in-store guest experience remains one of our greatest differentiators and our energy to evolve how we come to life in retail continues to drive very strong results. From new formats to connecting with new communities, our curiosity and relentless focus on guest experience fueled our store performance in North America and around the world.
We made progress in building a digital culture, along with the platforms, capabilities and tools to deliver a channel-agnostic, personalized guest experience. While early days, we are excited by the opportunities ahead as we unlock greater guest knowledge across channels and continue the seamless expansion and integration of our omni-channel strategies.
Internationally, we continued our expansion plans; opening 11 stores across Asia and Europe, including our first European flagship on London’s Regent Street, and our first three stores in China. I was fortunate to experience the brand’s momentum in these iconic destinations around the globe and look forward to accelerating our presence, particularly in China, where we see significant potential.
2017 + VISION
As we look to the year ahead, our global teams are energized to make an incredible impact on the future of lululemon. From our pipeline of product innovation to evolving guest experiences, as we unlock the power of our digital ecosystem and accelerate our global expansion, we are poised to capture and realize the unlimited opportunities ahead of us as an originator brand with a vision to touch the lives of a billion people leading an active, mindful lifestyle.
I’d like to express my gratitude to you, our shareholders, for your support, trust and commitment to our vision for lululemon.
All my best,
LAURENT POTDEVIN

UNITED STATESSECURITIES AND EXCHANGE COMMISSION
Washington, D.C. 20549_______________________________________
Form 10-K_______________________________________
ANNUAL REPORT PURSUANT TO SECTION 13 OR 15(d) OF THE SECURITIES EXCHANGE ACT OF 1934For the fiscal year ended January 29, 2017
OR
TRANSITION REPORT PURSUANT TO SECTION 13 OR 15(d) OF THE SECURITIES EXCHANGE ACT OF 1934For the transition period from to
Commission file number 001-33608_______________________________________
lululemon athletica inc.(Exact name of registrant as specified in its charter)
_______________________________________
Delaware 20-3842867(State or other jurisdiction of
incorporation or organization) (I.R.S. Employer
Identification Number)
1818 Cornwall AvenueVancouver, British Columbia V6J 1C7
(Address of principal executive offices) (Zip Code)
Registrant's telephone number, including area code: (604) 732-6124Securities registered pursuant to Section 12(b) of the Act:
Title of Each Class Name of Each Exchange on Which RegisteredCommon Stock, par value $0.005 per share Nasdaq Global Select Market
_______________________________________Indicate by check mark if the registrant is a well-known seasoned issuer, as defined in Rule 405 of the Securities Act. Yes No Indicate by check mark if the registrant is not required to file reports pursuant to Section 13 of Section 15(d) of the Act. Yes No Indicate by check mark whether the registrant (1) has filed all reports required to be filed by Section 13 or 15(d) of the Securities Exchange Act of 1934 during the preceding
12 months (or for such shorter period that the registrant was required to file such reports), and (2) has been subject to such filing requirements for the past 90 days. Yes No
Indicate by check mark whether the registrant has submitted electronically and posted on its corporate Website, if any, every Interactive Data File required to be submitted and posted pursuant to Rule 405 of Regulation S-T during the preceding 12 months (or for such shorter period that the registrant was required to submit and post such files). Yes No
Indicate by check mark if disclosure of delinquent filers pursuant to Item 405 of Regulation S-K is not contained herein, and will not be contained, to the best of registrant's knowledge, in definitive proxy or information statements incorporated by reference in Part III of this Form 10-K or any amendment to this Form 10-K.
Indicate by check mark whether the registrant is a large accelerated filer, an accelerated filer, a non-accelerated filer, or a smaller reporting company. See the definitions of "large accelerated filer," "accelerated filer" and "smaller reporting company" in Rule 12b-2 of the Exchange Act. (Check one):
Large accelerated filer Accelerated filer
Non-accelerated filer (Do not check if a smaller reporting company) Smaller reporting company
Indicate by check mark whether the registrant is a shell company (as defined in rule 12b-2 of the Act). Yes No The aggregate market value of the voting stock held by non-affiliates of the registrant on July 29, 2016 was approximately $4,913,000,000. Such aggregate market value was
computed by reference to the closing price of the common stock as reported on the Nasdaq Global Select Market on July 29, 2016. For purposes of determining this amount only, the registrant has defined affiliates as including the executive officers, directors, and owners of 10% or more of the outstanding voting stock of the registrant on July 29, 2016.
Common Stock:At March 23, 2017 there were 127,272,795 shares of the registrant's common stock, par value $0.005 per share, outstanding.Exchangeable and Special Voting Shares:At March 23, 2017, there were outstanding 9,780,927 exchangeable shares of Lulu Canadian Holding, Inc., a wholly-owned subsidiary of the registrant. Exchangeable shares
are exchangeable for an equal number of shares of the registrant's common stock.In addition, at March 23, 2017, the registrant had outstanding 9,780,927 shares of special voting stock, through which the holders of exchangeable shares of Lulu Canadian
Holding, Inc. may exercise their voting rights with respect to the registrant. The special voting stock and the registrant's common stock generally vote together as a single class on all matters on which the common stock is entitled to vote.
_______________________________________
DOCUMENTS INCORPORATED BY REFERENCE
DOCUMENT PARTS INTO WHICH INCORPORATEDPortions of Proxy Statement for the 2017 Annual
Meeting of Stockholders Part III

TABLE OF CONTENTS
Page
PART IItem 1. BUSINESS . . . . . . . . . . . . . . . . . . . . . . . . . . . . . . . . . . . . . . . . . . . . . . . . . . . . . . . . . . . . . . . . . . . . . . . . . . . . .Item 1A. RISK FACTORS. . . . . . . . . . . . . . . . . . . . . . . . . . . . . . . . . . . . . . . . . . . . . . . . . . . . . . . . . . . . . . . . . . . . . . . .Item 2. PROPERTIES . . . . . . . . . . . . . . . . . . . . . . . . . . . . . . . . . . . . . . . . . . . . . . . . . . . . . . . . . . . . . . . . . . . . . . . . . .Item 3. LEGAL PROCEEDINGS . . . . . . . . . . . . . . . . . . . . . . . . . . . . . . . . . . . . . . . . . . . . . . . . . . . . . . . . . . . . . . . .
PART IIItem 5. MARKET FOR REGISTRANT'S COMMON EQUITY, RELATED STOCKHOLDER MATTERS
AND ISSUER PURCHASES OF EQUITY SECURITIES. . . . . . . . . . . . . . . . . . . . . . . . . . . . . . . . . . . . . .Item 6. SELECTED CONSOLIDATED FINANCIAL DATA. . . . . . . . . . . . . . . . . . . . . . . . . . . . . . . . . . . . . . . . . .Item 7. MANAGEMENT'S DISCUSSION AND ANALYSIS OF FINANCIAL CONDITION AND
RESULTS OF OPERATIONS . . . . . . . . . . . . . . . . . . . . . . . . . . . . . . . . . . . . . . . . . . . . . . . . . . . . . . . . . . . . .Item 7A. QUANTITATIVE AND QUALITATIVE DISCLOSURES ABOUT MARKET RISK . . . . . . . . . . . . . . .Item 8. FINANCIAL STATEMENTS AND SUPPLEMENTARY DATA. . . . . . . . . . . . . . . . . . . . . . . . . . . . . . . . .
INDEX FOR NOTES TO THE CONSOLIDATED FINANCIAL STATEMENTS . . . . . . . . . . . . . . . . . .Item 9A. CONTROLS AND PROCEDURES . . . . . . . . . . . . . . . . . . . . . . . . . . . . . . . . . . . . . . . . . . . . . . . . . . . . . . . .
PART IIIItem 10. DIRECTORS, EXECUTIVE OFFICERS AND CORPORATE GOVERNANCE . . . . . . . . . . . . . . . . . .Item 11. EXECUTIVE COMPENSATION. . . . . . . . . . . . . . . . . . . . . . . . . . . . . . . . . . . . . . . . . . . . . . . . . . . . . . . . . .Item 12. SECURITY OWNERSHIP OF CERTAIN BENEFICIAL OWNERS AND MANAGEMENT AND
RELATED STOCKHOLDER MATTERS. . . . . . . . . . . . . . . . . . . . . . . . . . . . . . . . . . . . . . . . . . . . . . . . . . .Item 13. CERTAIN RELATIONSHIPS AND RELATED TRANSACTIONS, AND DIRECTOR
INDEPENDENCE . . . . . . . . . . . . . . . . . . . . . . . . . . . . . . . . . . . . . . . . . . . . . . . . . . . . . . . . . . . . . . . . . . . . . .Item 14. PRINCIPAL ACCOUNTANT FEES AND SERVICES . . . . . . . . . . . . . . . . . . . . . . . . . . . . . . . . . . . . . . . .
PART IVItem 15. EXHIBITS AND FINANCIAL STATEMENT SCHEDULE . . . . . . . . . . . . . . . . . . . . . . . . . . . . . . . . . . . .
15
1314
1518
1934364363
6464
64
6565
66
1
PART I
Special Note Regarding Forward-Looking Statements
This Annual Report on Form 10-K contains forward-looking statements within the meaning of Section 27A of the Securities Act of 1933, as amended and Section 21E of the Securities Exchange Act of 1934, as amended. We use words such as "anticipates," "believes," "estimates," "may," "intends," "expects," and similar expressions to identify forward-looking statements. Discussions containing forward-looking statements may be found in the material set forth under "Business", "Management's Discussion and Analysis of Financial Condition and Results of Operations", and in other sections of the report. All forward-looking statements are inherently uncertain as they are based on our expectations and assumptions concerning future events. Any or all of our forward-looking statements in this report may turn out to be inaccurate. We have based these forward-looking statements largely on our current expectations and projections about future events and financial trends that we believe may affect our financial condition, results of operations, business strategy, and financial needs. They may be affected by inaccurate assumptions we might make or by known or unknown risks and uncertainties, including the risks, uncertainties and assumptions described in the section entitled "Item 1A. Risk Factors" and elsewhere in this report. In light of these risks, uncertainties and assumptions, the forward-looking events and circumstances discussed in this report may not occur as contemplated, and our actual results could differ materially from those anticipated or implied by the forward-looking statements. All forward-looking statements in this report are made as of the date hereof, based on information available to us as of the date hereof, and we assume no obligation to update any forward-looking statement.
ITEM 1. BUSINESS
General
lululemon athletica inc. is a designer, distributor, and retailer of healthy lifestyle inspired athletic apparel. Since our inception, we have developed a distinctive corporate culture, and we have a mission to produce products which create transformational experiences for people to live happy, healthy, fun lives. We promote a set of core values in our business which include taking personal responsibility, nurturing entrepreneurial spirit, acting with honesty and courage, valuing connection, and choosing to have fun. These core values attract passionate and motivated employees who are driven to succeed and share our purpose of "elevating the world from mediocrity to greatness."
In this Annual Report on Form 10-K ("10-K" or "Report") for the fiscal year ended January 29, 2017 ("fiscal 2016"), lululemon athletica inc. (together with its subsidiaries) is referred to as "lululemon," "the Company," "we," "us" or "our."
Our Products
Our healthy lifestyle inspired athletic apparel is marketed under the lululemon and ivivva brand names. We offer a comprehensive line of apparel and accessories for women, men and female youth. Our apparel assortment includes items such as pants, shorts, tops, and jackets designed for healthy lifestyle and athletic activities such as yoga, running, training, most other sweaty pursuits, and athletic wear for female youth. We also offer fitness-related accessories, including an array of items such as bags, socks, underwear, yoga mats, and water bottles.
Although we benefit from the growing number of people that participate in yoga, we believe the percentage of our products sold for other activities will continue to increase as we broaden our product range.
Our design team continues to source and develop technically advanced fabrics and innovative functional features that we believe will help advance our product lines and differentiate us from the competition.
Our Market
Our primary target customer is a sophisticated and educated woman who understands the importance of an active, healthy lifestyle. She is increasingly tasked with the dual responsibilities of career and family and is constantly challenged to balance her work, life, and health. We believe she pursues exercise to achieve physical fitness and inner peace.
As women have continued to embrace a variety of fitness and athletic activities, including yoga, we believe we have been able to effectively address their unique fit and performance needs by incorporating style along with comfort and functionality into our products through our vertical retail strategy.
Although we were founded to address the unique needs of women, we are also successfully designing products for men and female youth who appreciate the technical rigor and premium quality of our products. In addition, we believe consumer purchase decisions are driven by both an actual need for functional products and a desire to live a particular lifestyle. As such,

2
we believe the credibility and authenticity of our brand expands our potential market beyond just athletes to those who desire to lead an active, healthy, and balanced life.
Our Segments
We primarily conduct our business through two channels: company-operated stores and direct to consumer.
We also generate net revenue from our outlets, showrooms, sales from temporary locations, sales to wholesale accounts, warehouse sales, and license and supply arrangements. The net revenue we generate from these sources is combined in our other segment.
As of January 29, 2017, we operated 406 stores located in the United States, Canada, Australia, the United Kingdom, New Zealand, China, Hong Kong, Singapore, South Korea, Germany, Puerto Rico and Switzerland. We believe our vertical retail strategy allows us to interact more directly with, and gain feedback from, our customers, whom we call guests, while providing us with greater control of our brand.
Our direct to consumer segment includes the net revenue which we generate from our lululemon and ivivva e-commerce websites, www.lululemon.com and www.ivivva.com, and other country and region specific websites.
Segment information is included in Note 16 to our consolidated financial statements included in Item 8 of Part II of this report.
Company-Operated Stores
As of January 29, 2017, our retail footprint included 406 company-operated stores. While most of our company-operated stores are branded lululemon, 55 of our company-operated stores are branded ivivva and specialize in athletic wear for female youth. Our retail stores are located primarily on street locations, in lifestyle centers, and in malls.
Our company-operated stores by brand, and by country, as of January 29, 2017 and January 31, 2016, are summarized in the table below:
January 29,2017
January 31,2016
lululemonUnited States. . . . . . . . . . . . . . . . . . . . . . . . . . . . . . . . . . . . . . . . . . . . . . . . . . . . . . . . . . . . . . . . 245 229Canada . . . . . . . . . . . . . . . . . . . . . . . . . . . . . . . . . . . . . . . . . . . . . . . . . . . . . . . . . . . . . . . . . . . . 51 48Australia . . . . . . . . . . . . . . . . . . . . . . . . . . . . . . . . . . . . . . . . . . . . . . . . . . . . . . . . . . . . . . . . . . . 27 26United Kingdom . . . . . . . . . . . . . . . . . . . . . . . . . . . . . . . . . . . . . . . . . . . . . . . . . . . . . . . . . . . . . 9 6New Zealand. . . . . . . . . . . . . . . . . . . . . . . . . . . . . . . . . . . . . . . . . . . . . . . . . . . . . . . . . . . . . . . . 5 5China. . . . . . . . . . . . . . . . . . . . . . . . . . . . . . . . . . . . . . . . . . . . . . . . . . . . . . . . . . . . . . . . . . . . . . 3 —Hong Kong . . . . . . . . . . . . . . . . . . . . . . . . . . . . . . . . . . . . . . . . . . . . . . . . . . . . . . . . . . . . . . . . . 3 2Singapore . . . . . . . . . . . . . . . . . . . . . . . . . . . . . . . . . . . . . . . . . . . . . . . . . . . . . . . . . . . . . . . . . . 3 2South Korea . . . . . . . . . . . . . . . . . . . . . . . . . . . . . . . . . . . . . . . . . . . . . . . . . . . . . . . . . . . . . . . . 2 —Germany . . . . . . . . . . . . . . . . . . . . . . . . . . . . . . . . . . . . . . . . . . . . . . . . . . . . . . . . . . . . . . . . . . . 1 1Puerto Rico . . . . . . . . . . . . . . . . . . . . . . . . . . . . . . . . . . . . . . . . . . . . . . . . . . . . . . . . . . . . . . . . . 1 1Switzerland . . . . . . . . . . . . . . . . . . . . . . . . . . . . . . . . . . . . . . . . . . . . . . . . . . . . . . . . . . . . . . . . . 1 —
351 320ivivva
United States. . . . . . . . . . . . . . . . . . . . . . . . . . . . . . . . . . . . . . . . . . . . . . . . . . . . . . . . . . . . . . . . 42 31Canada . . . . . . . . . . . . . . . . . . . . . . . . . . . . . . . . . . . . . . . . . . . . . . . . . . . . . . . . . . . . . . . . . . . . 13 12
55 43Total . . . . . . . . . . . . . . . . . . . . . . . . . . . . . . . . . . . . . . . . . . . . . . . . . . . . . . . . . . . . . . . . . . . . . . . 406 363
We opened 43 net new company-operated stores in fiscal 2016, including 12 net new stores outside of North America.

3
In fiscal 2017, our new store growth will come primarily from new company-operated stores in the United States and an acceleration in our company-operated store openings in Asia. Our real estate strategy over the next several years will not only consist of opening new company-operated stores, but also in overall square footage growth through store expansions and relocations.
We perform ongoing evaluations of our portfolio of company-operated store locations. In fiscal 2016, we closed three of our company-operated stores. As we continue our evaluation we may, in future periods, close or relocate additional company-operated stores.
We believe that our innovative retail concept and guest experience contribute to the success of our stores. During fiscal 2016, our company-operated stores open at least one year, which average approximately 2,941 square feet, averaged sales of $1,521 per square foot. The square footage of our company-operated stores excludes space used for non-retail activities such as yoga studios and office space.
Direct to Consumer
Direct to consumer is a substantial part of our business, representing approximately 19.3% of our net revenue in fiscal 2016. We believe that a direct to consumer channel is convenient for our core customer and enhances the image of our brand. Our direct to consumer channel makes our product accessible to more markets than our company-operated store channel alone. We believe this channel is effective in building brand awareness, especially in new markets.
Other Channels
Other net revenue accounted for 8.0% of total net revenue in fiscal 2016, compared to 6.9% in fiscal 2015, and 7.1% of total net revenue in fiscal 2014. Other net revenue includes sales made through the following channels:
• Outlets and warehouse sales - We utilize outlets as well as warehouse sales, which are held from time to time, to sell slow moving inventory and inventory from prior seasons to retail customers at discounted prices.
• Showrooms - Our showrooms are typically small locations that we open when we enter new markets and feature a limited selection of our product offering.
• Temporary locations - Our temporary locations are typically opened for a short period of time in markets in which we may not already have a presence.
• Wholesale - Our wholesale accounts include premium yoga studios, health clubs, and fitness centers. We believe these premium wholesale locations offer an alternative distribution channel that is convenient for our core consumer and enhances the image of our brand. We do not intend wholesale to be a significant contributor to overall sales. Instead, we use the channel to build brand awareness, especially in new markets, including those outside of North America.
• License and supply arrangements - We enter into license and supply arrangements from time to time when we believe that it will be to our advantage to partner with companies and individuals with significant experience and proven success in certain target markets.
In January 2015, we entered into a license and supply arrangement with a partner in the Middle East which grants our partner the right to operate lululemon branded retail locations in the United Arab Emirates, Kuwait, Qatar, Oman, and Bahrain for an initial term of five years. We retain the rights to sell lululemon products through our e-commerce websites in these countries. Under this arrangement we supply the partner with lululemon products, training and other support. As of January 29, 2017, there were three licensed stores in the United Arab Emirates and one licensed store in Qatar, not included in the above company-operated stores table.
In November 2016, we entered into a license and supply agreement with a partner which grants our partner the right to operate lululemon branded retail locations in Mexico for a term of ten years, subject to certain conditions. We retain the rights to sell lululemon products through our e-commerce websites in Mexico. Under this arrangement we supply the partner with lululemon products, training and other support. As of January 29, 2017 there were no licensed retail locations in operation in Mexico.
4
Community-Based Marketing
We utilize a community-based approach to building brand awareness and customer loyalty. We pursue a multi-faceted strategy which leverages our local ambassadors, digital marketing and social media, in-store community boards, and a variety of grassroots initiatives.
Product Design and Development
Our product design efforts are led by a team of designers based in Vancouver, British Columbia partnering with international designers. Our team is comprised of dedicated athletes and users of our products who embody our design philosophy and dedication to premium quality. Our design team identifies trends based on market intelligence and research, proactively seeks the input of our guests and our ambassadors and broadly seeks inspiration consistent with our goals of style, function and technical superiority.
As we strive to continue to provide our guests with technically advanced fabrics, our design team works closely with our suppliers to incorporate innovative fabrics that bring particular specifications to our products. We partner with independent inspection, verification, and testing companies, who conduct a variety of tests on our fabrics, testing performance characteristics including pilling, shrinkage, abrasion resistance, and colorfastness. We develop proprietary fabrics and collaborate with leading fabric and trims suppliers to manufacture fabrics and trims that we ultimately protect through agreements, trademarks and trade-secrets.
Sourcing and Manufacturing
We do not own or operate any manufacturing facilities. We rely on a limited number of suppliers to provide fabrics for, and to produce, our products. We work with a group of approximately 65 suppliers to provide the fabrics for our products. We work with a group of approximately 35 suppliers that manufacture our products, five of which produced approximately 63% of our products in fiscal 2016. During fiscal 2016, no single manufacturer produced more than 30% of our product offerings. During fiscal 2016, approximately 47% of our products were produced in South East Asia, approximately 28% in South Asia, approximately 15% in China, approximately 1% in North America, and the remainder in other regions.
We have developed long-standing relationships with a number of our vendors and take great care to ensure that they share our commitment to quality and ethics. We do not, however, have any long-term term contracts with the majority of our suppliers or manufacturing sources for the production and supply of our fabrics and garments, and we compete with other companies for fabrics, raw materials, and production. We require that all of our manufacturers adhere to a vendor code of ethics regarding social and environmental sustainability practices. Our product quality and sustainability teams partner with leading inspection and verification firms to closely monitor each supplier's compliance with applicable laws and our vendor code of ethics.
Distribution Facilities
We operate and distribute finished products from our owned or leased distribution facilities in the United States, Canada, and Australia. We own our distribution center in Columbus, Ohio, and lease our other distribution facilities. The approximate square footage of each facility is included in Item 2 of Part I of this report. We also utilize third-party logistics providers to warehouse and distribute finished products from their warehouse locations in Hong Kong, China, and the Netherlands.
We believe our distribution infrastructure will be sufficient to accommodate our expected store growth and expanded product offerings over the next several years.
Competition
Competition in the athletic apparel industry is principally on the basis of brand image and recognition as well as product quality, innovation, style, distribution, and price. We believe that we successfully compete on the basis of our premium brand image and our technical product innovation. In addition, we believe our vertical retail distribution strategy differentiates us from our competitors and allows us to more effectively control our brand image.
The market for athletic apparel is highly competitive. It includes increasing competition from established companies that are expanding their production and marketing of performance products, as well as from frequent new entrants to the market. We are in direct competition with wholesalers and direct sellers of athletic apparel, such as Nike, Inc., adidas AG, and Under Armour, Inc. We also compete with retailers specifically focused on women's athletic apparel including The Gap, Inc. (including the Athleta brand) and L Brands, Inc. (including the Victoria Sport assortment at Victoria's Secret).

5
Seasonality
Our business is affected by the general seasonal trends common to the retail apparel industry. Our annual net revenue is weighted more heavily toward our fourth fiscal quarter, reflecting our historical strength in sales during the holiday season, while our operating expenses are more equally distributed throughout the year. As a result, a substantial portion of our operating profits are generated in the fourth quarter of our fiscal year. For example, we generated approximately 47%, 45%, and 42% of our full year operating profit during the fourth quarters of fiscal 2016, fiscal 2015, and fiscal 2014, respectively.
Our Employees
As of January 29, 2017, we had approximately 12,500 employees, of which approximately 7,500 were employed in the United States, approximately 3,500 were employed in Canada, and approximately 1,500 were employed outside of North America. None of our employees are currently covered by a collective bargaining agreement. We have had no labor-related work stoppages by our employees and we believe our relations with our employees are excellent.
Intellectual Property
We have trademark rights on most of our products and believe having distinctive marks that are readily identifiable is an important factor in building our brand image and in distinguishing our products from the products of others. We consider our lululemon and wave design trademarks to be among our most valuable assets. In addition, we own many other trademarks for names of several of our brands, slogans, fabrics and products. We own registered and pending U.S. and foreign utility and design patents, industrial designs in Canada, and registered community designs in Europe that protect our product innovations, distinctive apparel, and accessory designs.
Securities and Exchange Commission Filings
Our website address is www.lululemon.com. We provide free access to various reports that we file with, or furnish to, the United States Securities and Exchange Commission, or the SEC, through our website, as soon as reasonably practicable after they have been filed or furnished. These reports include, but are not limited to, our annual reports on Form 10-K, quarterly reports on Form 10-Q, current reports on Form 8-K, and any amendments to those reports. Our SEC reports can also be accessed through the SEC's website at www.sec.gov. The public may read and copy any materials filed by us with the SEC at the SEC's Public Reference Room at 100 F Street, NE, Room 1580, Washington, DC 20549. The public may obtain information on the operation of the Public Reference Room by calling the SEC at 1-800-SEC-0330. Also available on our website are printable versions of our Code of Business Conduct and Ethics and charters of the Audit, Compensation, and Nominating and Governance Committees of our board of directors. Information on our website does not constitute part of this annual report on Form 10-K or any other report we file or furnish with the SEC.
ITEM 1A. RISK FACTORS
In addition to the other information contained in this Form 10-K, the following risk factors should be considered carefully in evaluating our business. Our business, financial condition or results of operations could be materially adversely affected by any of these risks. Please note that additional risks not presently known to us or that we currently deem immaterial could also impair our business and operations.
Our success depends on our ability to maintain the value and reputation of our brand.
Our success depends on the value and reputation of the lululemon brand. The lululemon name is integral to our business as well as to the implementation of our strategies for expanding our business. Maintaining, promoting, and positioning our brand will depend largely on the success of our marketing and merchandising efforts and our ability to provide a consistent, high quality product, and guest experience. We rely on social media, as one of our marketing strategies, to have a positive impact on both our brand value and reputation. Our brand and reputation could be adversely affected if we fail to achieve these objectives, if our public image was to be tarnished by negative publicity, if we fail to deliver innovative and high quality products acceptable to our guests, or if we face a product recall. Negative publicity regarding the production methods of any of our suppliers or manufacturers could adversely affect our reputation and sales and force us to locate alternative suppliers or manufacturing sources. Additionally, while we devote considerable efforts and resources to protecting our intellectual property, if these efforts are not successful the value of our brand may be harmed. Any harm to our brand and reputation could have a material adverse effect on our financial condition.
6
If any of our products are unacceptable to us or our guests, our business could be harmed.
We have occasionally received, and may in the future continue to receive, shipments of products that fail to comply with our technical specifications or that fail to conform to our quality control standards. We have also received, and may in the future continue to receive, products that are otherwise unacceptable to us or our guests. Under these circumstances, unless we are able to obtain replacement products in a timely manner, we risk the loss of net revenue resulting from the inability to sell those products and related increased administrative and shipping costs. Additionally, if the unacceptability of our products is not discovered until after such products are purchased by our guests, our guests could lose confidence in the technical attributes of our products or we could face a product recall and our results of operations could suffer and our business, reputation, and brand could be harmed.
We operate in a highly competitive market and the size and resources of some of our competitors may allow them to compete more effectively than we can, resulting in a loss of our market share and a decrease in our net revenue and profitability.
The market for technical athletic apparel is highly competitive. Competition may result in pricing pressures, reduced profit margins or lost market share, or a failure to grow or maintain our market share, any of which could substantially harm our business and results of operations. We compete directly against wholesalers and direct retailers of athletic apparel, including large, diversified apparel companies with substantial market share and established companies expanding their production and marketing of technical athletic apparel, as well as against retailers specifically focused on women's athletic apparel. We also face competition from wholesalers and direct retailers of traditional commodity athletic apparel, such as cotton T-shirts and sweatshirts. Many of our competitors are large apparel and sporting goods companies with strong worldwide brand recognition. Because of the fragmented nature of the industry, we also compete with other apparel sellers, including those specializing in yoga apparel and other activewear. Many of our competitors have significant competitive advantages, including longer operating histories, larger and broader customer bases, more established relationships with a broader set of suppliers, greater brand recognition and greater financial, research and development, store development, marketing, distribution, and other resources than we do. In addition, our technical athletic apparel is sold at a price premium to traditional athletic apparel.
Our competitors may be able to achieve and maintain brand awareness and market share more quickly and effectively than we can. In contrast to our "grassroots" marketing approach, many of our competitors promote their brands through traditional forms of advertising, such as print media and television commercials, and through celebrity endorsements, and have substantial resources to devote to such efforts. Our competitors may also create and maintain brand awareness using traditional forms of advertising more quickly than we can. Our competitors may also be able to increase sales in their new and existing markets faster than we do by emphasizing different distribution channels than we do, such as catalog sales or an extensive franchise network.
In addition, because we hold limited patents and exclusive intellectual property rights in the technology, fabrics or processes underlying our products, our current and future competitors are able to manufacture and sell products with performance characteristics, fabrication techniques, and styling similar to our products.
Our reliance on suppliers to provide fabrics for and to produce our products could cause problems in our supply chain.
We do not manufacture our products or the raw materials for them and rely instead on suppliers. Many of the specialty fabrics used in our products are technically advanced textile products developed and manufactured by third parties and may be available, in the short-term, from only one or a very limited number of sources. In fiscal 2016, approximately 63% of our products were produced by our top five manufacturing suppliers, and 40% of raw materials were produced by a single manufacturer. We have no long-term contracts with any of our suppliers or manufacturing sources for the production and supply of our fabrics and garments, and we compete with other companies for fabrics, raw materials, and production.
We have experienced, and may in the future continue to experience, a significant disruption in the supply of fabrics or raw materials from current sources and we may be unable to locate alternative materials suppliers of comparable quality at an acceptable price, or at all. In addition, if we experience significant increased demand, or if we need to replace an existing supplier or manufacturer, we may be unable to locate additional supplies of fabrics or raw materials or additional manufacturing capacity on terms that are acceptable to us, or at all, or we may be unable to locate any supplier or manufacturer with sufficient capacity to meet our requirements or to fill our orders in a timely manner. Identifying a suitable supplier is an involved process that requires us to become satisfied with its quality control, responsiveness and service, financial stability, and labor and other ethical practices. Even if we are able to expand existing or find new manufacturing or fabric sources, we may encounter delays in production and added costs as a result of the time it takes to train our suppliers and manufacturers in our methods, products, and quality control standards. Delays related to supplier changes could also arise due to an increase in shipping times if new suppliers are located farther away from our markets or from other participants in our supply chain. Any delays, interruption or increased costs in the supply of fabric or manufacture of our products could have an adverse effect on

7
our ability to meet guest demand for our products and result in lower net revenue and income from operations both in the short and long term.
An economic downturn or economic uncertainty in our key markets may adversely affect consumer discretionary spending and demand for our products.
Many of our products may be considered discretionary items for consumers. Factors affecting the level of consumer spending for such discretionary items include general economic conditions, particularly those in North America, and other factors such as consumer confidence in future economic conditions, fears of recession, the availability and cost of consumer credit, levels of unemployment, and tax rates. As global economic conditions continue to be volatile or economic uncertainty remains, trends in consumer discretionary spending also remain unpredictable and subject to reductions due to credit constraints and uncertainties about the future. Unfavorable economic conditions may lead consumers to delay or reduce purchases of our products. Consumer demand for our products may not reach our targets, or may decline, when there is an economic downturn or economic uncertainty in our key markets, particularly in North America. Our sensitivity to economic cycles and any related fluctuation in consumer demand may have a material adverse effect on our financial condition.
Our sales and profitability may decline as a result of increasing product costs and decreasing selling prices.
Our business is subject to significant pressure on costs and pricing caused by many factors, including intense competition, constrained sourcing capacity and related inflationary pressure, pressure from consumers to reduce the prices we charge for our products, and changes in consumer demand. These factors may cause us to experience increased costs, reduce our prices to consumers or experience reduced sales in response to increased prices, any of which could cause our operating margin to decline if we are unable to offset these factors with reductions in operating costs and could have a material adverse effect on our financial conditions, operating results and cash flows.
If we are unable to anticipate consumer preferences and successfully develop and introduce new, innovative and updated products, we may not be able to maintain or increase our sales and profitability.
Our success depends on our ability to identify and originate product trends as well as to anticipate and react to changing consumer demands in a timely manner. All of our products are subject to changing consumer preferences that cannot be predicted with certainty. If we are unable to introduce new products or novel technologies in a timely manner or our new products or technologies are not accepted by our guests, our competitors may introduce similar products in a more timely fashion, which could hurt our goal to be viewed as a leader in technical athletic apparel innovation. Our new products may not receive consumer acceptance as consumer preferences could shift rapidly to different types of athletic apparel or away from these types of products altogether, and our future success depends in part on our ability to anticipate and respond to these changes. Our failure to anticipate and respond in a timely manner to changing consumer preferences could lead to, among other things, lower sales and excess inventory levels. Even if we are successful in anticipating consumer preferences, our ability to adequately react to and address those preferences will in part depend upon our continued ability to develop and introduce innovative, high-quality products. Our failure to effectively introduce new products that are accepted by consumers could result in a decrease in net revenue and excess inventory levels, which could have a material adverse effect on our financial condition.
Our results of operations could be materially harmed if we are unable to accurately forecast guest demand for our products.
To ensure adequate inventory supply, we must forecast inventory needs and place orders with our manufacturers based on our estimates of future demand for particular products. Our ability to accurately forecast demand for our products could be affected by many factors, including an increase or decrease in guest demand for our products or for products of our competitors, our failure to accurately forecast guest acceptance of new products, product introductions by competitors, unanticipated changes in general market conditions, and weakening of economic conditions or consumer confidence in future economic conditions. If we fail to accurately forecast guest demand we may experience excess inventory levels or a shortage of products available for sale in our stores or for delivery to guests.
Inventory levels in excess of guest demand may result in inventory write-downs or write-offs and the sale of excess inventory at discounted prices, which would cause our gross margin to suffer and could impair the strength and exclusivity of our brand. Conversely, if we underestimate guest demand for our products, our manufacturers may not be able to deliver products to meet our requirements, and this could result in damage to our reputation and guest relationships.

8
Our inability to safeguard against security breaches with respect to our information technology systems could disrupt our operations.
Our business employs systems and websites that allow for the storage and transmission of proprietary or confidential information regarding our business, guests and employees including credit card information. Security breaches could expose us to a risk of loss or misuse of this information and potential liability. We may not have the resources or technical sophistication to be able to anticipate or prevent rapidly evolving types of cyber-attacks. Actual or anticipated attacks may cause us to incur increasing costs including costs to deploy additional personnel and protection technologies, train employees and engage third party experts and consultants. Advances in computer capabilities, new technological discoveries or other developments may result in the technology used by us to protect transaction or other data being breached or compromised. Data and security breaches can also occur as a result of non-technical issues including intentional or inadvertent breach by employees or persons with whom we have commercial relationships that result in the unauthorized release of personal or confidential information. Any compromise or breach of our security could result in a violation of applicable privacy and other laws, significant litigation and potential liability and damage to our brand and reputation or other harm to our business.
Any material disruption of our information systems could disrupt our business and reduce our sales.
We are increasingly dependent on information systems to operate our e-commerce websites, process transactions, respond to guest inquiries, manage inventory, purchase, sell and ship goods on a timely basis, and maintain cost-efficient operations. Any material disruption or slowdown of our systems, including a disruption or slowdown caused by our failure to successfully upgrade our systems, system failures, viruses, computer "hackers" or other causes, could cause information, including data related to guest orders, to be lost or delayed which could, especially if the disruption or slowdown occurred during the holiday season, result in delays in the delivery of products to our stores and guests or lost sales, which could reduce demand for our products and cause our sales to decline. If changes in technology cause our information systems to become obsolete, or if our information systems are inadequate to handle our growth, we could lose guests.
The fluctuating cost of raw materials could increase our cost of goods sold and cause our results of operations and financial condition to suffer.
The fabrics used by our suppliers and manufacturers include synthetic fabrics whose raw materials include petroleum-based products. Our products also include silver and natural fibers, including cotton. Our costs for raw materials are affected by, among other things, weather, consumer demand, speculation on the commodities market, the relative valuations and fluctuations of the currencies of producer versus consumer countries, and other factors that are generally unpredictable and beyond our control. Increases in the cost of raw materials, including petroleum or the prices we pay for silver and our cotton yarn and cotton-based textiles, could have a material adverse effect on our cost of goods sold, results of operations, financial condition, and cash flows.
Our limited operating experience and limited brand recognition in new international markets may limit our expansion strategy and cause our business and growth to suffer.
Our future growth depends in part on our expansion efforts outside of North America. We have limited experience with regulatory environments and market practices internationally, and we may not be able to penetrate or successfully operate in any new market. In connection with our expansion efforts we may encounter obstacles we did not face in North America, including cultural and linguistic differences, differences in regulatory environments, labor practices and market practices, difficulties in keeping abreast of market, business and technical developments, and foreign guests' tastes and preferences. We may also encounter difficulty expanding into new international markets because of limited brand recognition leading to delayed acceptance of our technical athletic apparel by guests in these new international markets. Our failure to develop our business in new international markets or experiencing disappointing growth outside of existing markets could harm our business and results of operations.
If we encounter problems with our distribution system, our ability to deliver our products to the market and to meet guest expectations could be harmed.
We rely on our distribution facilities for substantially all of our product distribution. Our distribution facilities include computer controlled and automated equipment, which means their operations are complicated and may be subject to a number of risks related to security or computer viruses, the proper operation of software and hardware, electronic or power interruptions, or other system failures. In addition, because substantially all of our products are distributed from four locations, our operations could also be interrupted by labor difficulties, extreme or severe weather conditions or by floods, fires or other natural disasters near our distribution centers. If we encounter problems with our distribution system, our ability to meet guest expectations, manage inventory, complete sales, and achieve objectives for operating efficiencies could be harmed.

9
Our fabrics and manufacturing technology generally are not patented and can be imitated by our competitors.
The intellectual property rights in the technology, fabrics, and processes used to manufacture our products generally are owned or controlled by our suppliers and are generally not unique to us. Our ability to obtain intellectual property protection for our products is therefore limited and we do not generally own patents or hold exclusive intellectual property rights in the technology, fabrics or processes underlying our products. As a result, our current and future competitors are able to manufacture and sell products with performance characteristics, fabrics and styling similar to our products. Because many of our competitors have significantly greater financial, distribution, marketing, and other resources than we do, they may be able to manufacture and sell products based on our fabrics and manufacturing technology at lower prices than we can. If our competitors do sell similar products to ours at lower prices, our net revenue and profitability could suffer.
Our failure or inability to protect our intellectual property rights could diminish the value of our brand and weaken our competitive position.
We currently rely on a combination of copyright, trademark, trade dress, and unfair competition laws, as well as confidentiality procedures and licensing arrangements, to establish and protect our intellectual property rights. The steps we take to protect our intellectual property rights may not be adequate to prevent infringement of these rights by others, including imitation of our products and misappropriation of our brand. In addition, intellectual property protection may be unavailable or limited in some foreign countries where laws or law enforcement practices may not protect our intellectual property rights as fully as in the United States or Canada, and it may be more difficult for us to successfully challenge the use of our intellectual property rights by other parties in these countries. If we fail to protect and maintain our intellectual property rights, the value of our brand could be diminished and our competitive position may suffer.
Changes in tax laws or unanticipated tax liabilities could adversely affect our effective income tax rate and profitability.
We are subject to the income tax laws of the United States, Canada, and several other international jurisdictions. Our effective income tax rates could be unfavorably impacted by a number of factors, including changes in the mix of earnings amongst countries with differing statutory tax rates, changes in the valuation of deferred tax assets and liabilities, changes in tax laws, the outcome of income tax audits in various jurisdictions around the world, and any repatriation of unremitted earnings for which we have not previously accrued U.S. taxes.
We and our subsidiaries engage in a number of intercompany transactions across multiple tax jurisdictions. Although we believe that these transactions reflect the accurate economic allocation of profit and that proper transfer pricing documentation is in place, the profit allocation and transfer pricing terms and conditions may be scrutinized by local tax authorities during an audit and any resulting changes may impact our mix of earnings in countries with differing statutory tax rates.
Current economic and political conditions make tax rules in any jurisdiction, including the United States and Canada, subject to significant change. There have been proposals to reform U.S. and foreign tax laws that could significantly impact how U.S. multinational corporations are taxed on foreign earnings. Although we cannot predict whether or in what form such proposals will pass, several of the proposals considered, if enacted into law, could have an adverse impact on our income tax expense and cash flows.
If we continue to grow at a rapid pace, we may not be able to effectively manage our growth and the increased complexity of our business and as a result our brand image and financial performance may suffer.
We have expanded our operations rapidly since our inception in 1998 and our net revenue has increased from $40.7 million in fiscal 2004 to $2.3 billion in fiscal 2016. If our operations continue to grow at a rapid pace, we may experience difficulties in obtaining sufficient raw materials and manufacturing capacity to produce our products, as well as delays in production and shipments, as our products are subject to risks associated with overseas sourcing and manufacturing. We could be required to continue to expand our sales and marketing, product development and distribution functions, to upgrade our management information systems and other processes and technology, and to obtain more space for our expanding workforce. This expansion could increase the strain on our resources, and we could experience operating difficulties, including difficulties in hiring, training and managing an increasing number of employees. These difficulties could result in the erosion of our brand image which could have a material adverse effect on our financial condition.
We are subject to risks associated with leasing retail and distribution space subject to long-term and non-cancelable leases.
We lease the majority of our stores under operating leases and our inability to secure appropriate real estate or lease terms could impact our ability to grow. Our leases generally have initial terms of between five and ten years, and generally can be extended only in five-year increments if at all. We generally cannot cancel these leases at our option. If an existing or new store

10
is not profitable, and we decide to close it, as we have done in the past and may do in the future, we may nonetheless be committed to perform our obligations under the applicable lease including, among other things, paying the base rent for the balance of the lease term. Similarly, we may be committed to perform our obligations under the applicable leases even if current locations of our stores become unattractive as demographic patterns change. In addition, as each of our leases expire, we may fail to negotiate renewals, either on commercially acceptable terms or at all, which could require us to close stores in desirable locations.
We also lease the majority of our distribution centers and our inability to secure appropriate real estate or lease terms could impact our ability to deliver our products to the market.
Increasing labor costs and other factors associated with the production of our products in South and South East Asia could increase the costs to produce our products.
A significant portion of our products are produced in South and South East Asia and increases in the costs of labor and other costs of doing business in the countries in this area could significantly increase our costs to produce our products and could have a negative impact on our operations, net revenue, and earnings. Factors that could negatively affect our business include a potential significant revaluation of the currencies used in these countries, which may result in an increase in the cost of producing products, labor shortage and increases in labor costs, and difficulties in moving products manufactured out of the countries in which they are manufactured and through the ports on the western coast of North America, whether due to port congestion, labor disputes, product regulations and/or inspections or other factors, and natural disasters or health pandemics. A labor strike or other transportation disruption affecting these ports could significantly disrupt our business. Also, the imposition of trade sanctions or other regulations against products imported by us from, or the loss of "normal trade relations" status with any country in which our products are manufactured, could significantly increase our cost of products imported into North America and/or Australia and harm our business.
We may not be able to successfully open new store locations in a timely manner, if at all, which could harm our results of operations.
Our growth will largely depend on our ability to successfully open and operate new stores, which depends on many factors, including, among others, our ability to:
• identify suitable store locations, the availability of which is outside of our control;
• negotiate acceptable lease terms, including desired tenant improvement allowances;
• hire, train and retain store personnel and field management;
• immerse new store personnel and field management into our corporate culture;
• source sufficient inventory levels; and
• successfully integrate new stores into our existing operations and information technology systems.
Successful new store openings may also be affected by our ability to initiate our grassroots marketing efforts in advance of opening our first store in a new market. We typically rely on our grassroots marketing efforts to build awareness of our brand and demand for our products. Our grassroots marketing efforts are often lengthy and must be tailored to each new market based on our emerging understanding of the market. We may not be able to successfully implement our grassroots marketing efforts in a particular market in a timely manner, if at all. Additionally, we may be unsuccessful in identifying new markets where our technical athletic apparel and other products and brand image will be accepted or the performance of our stores will be considered successful.
Our ability to source our merchandise profitably or at all could be hurt if new trade restrictions are imposed or existing trade restrictions become more burdensome.
The United States and the countries in which our products are produced or sold internationally have imposed and may impose additional quotas, duties, tariffs, or other restrictions or regulations, or may adversely adjust prevailing quota, duty or tariff levels. We have expanded our relationships with suppliers outside of China, which among other things has resulted in increased costs and shipping times for some products. Countries impose, modify and remove tariffs and other trade restrictions in response to a diverse array of factors, including global and national economic and political conditions, which make it impossible for us to predict future developments regarding tariffs and other trade restrictions. Trade restrictions, including tariffs, quotas, embargoes, safeguards, and customs restrictions, could increase the cost or reduce the supply of products available to us or may require us to modify our supply chain organization or other current business practices, any of which could harm our business, financial condition and results of operations.
11
The U.S. government could impose a border adjustable tax, which could have a material adverse effect on our business, financial condition and operating results. We are also dependent on international trade agreements and regulations. If the United States were to withdraw from or materially modify certain international trade agreements, our business could be adversely affected.
Our failure to comply with trade and other regulations could lead to investigations or actions by government regulators and negative publicity.
The labeling, distribution, importation, marketing, and sale of our products are subject to extensive regulation by various federal agencies, including the Federal Trade Commission, Consumer Product Safety Commission and state attorneys general in the United States, the Competition Bureau and Health Canada in Canada, as well as by various other federal, state, provincial, local and international regulatory authorities in the countries in which our products are distributed or sold. If we fail to comply with any of these regulations, we could become subject to enforcement actions or the imposition of significant penalties or claims, which could harm our results of operations or our ability to conduct our business. In addition, the adoption of new regulations or changes in the interpretation of existing regulations may result in significant compliance costs or discontinuation of product sales and could impair the marketing of our products, resulting in significant loss of net revenue.
Our international operations are also subject to compliance with the U.S. Foreign Corrupt Practices Act, or FCPA, and other anti-bribery laws applicable to our operations. In many foreign countries, particularly in those with developing economies, it may be a local custom that businesses operating in such countries engage in business practices that are prohibited by the FCPA or other U.S. and foreign laws and regulations applicable to us. Although we have implemented procedures designed to ensure compliance with the FCPA and similar laws, some of our employees, agents, or other channel partners, as well as those companies to which we outsource certain of our business operations, could take actions in violation of our policies. Any such violation could have a material and adverse effect on our business.
Our future success is substantially dependent on the continued service of our senior management.
Our future success is substantially dependent on the continued service of our senior management and other key employees. In the last several years, several members of our senior management team have left us and we have focused time and resources on recruiting the new members of our current management team. The continued turnover of senior management and the loss of key members of our executive team could have a negative impact on our ability to manage and grow our business effectively. In addition, if we're not effective with our succession planning, it may have a negative impact on our ability to fill senior management roles in a timely manner.
We do not maintain a key person life insurance policy on any of the members of our senior management team. As a result, we would have no way to cover the financial loss if we were to lose the services of members of our senior management team.
Our business is affected by seasonality.
Our business is affected by the general seasonal trends common to the retail apparel industry. This seasonality may adversely affect our business and cause our results of operations to fluctuate, and, as a result, we believe that comparisons of our operating results between different quarters within a single fiscal year are not necessarily meaningful and that results of operations in any period should not be considered indicative of the results to be expected for any future period.
Because a significant portion of our net revenue and expenses are generated in countries other than the United States, fluctuations in foreign currency exchange rates have affected our results of operations and may continue to do so in the future.
The functional currency of our foreign subsidiaries is generally the applicable local currency. Our consolidated financial statements are presented in U.S. dollars. Therefore, the net revenue, expenses, assets, and liabilities of our foreign subsidiaries are translated from their functional currencies into U.S. dollars. Fluctuations in the value of the U.S. dollar affect the reported amounts of net revenue, expenses, assets, and liabilities. Foreign exchange differences which arise on translation of our foreign subsidiaries' balance sheets into U.S. dollars are recorded as a foreign currency translation adjustment in accumulated other comprehensive income or loss within stockholders' equity. We also have exposure to changes in foreign exchange rates associated with transactions which are undertaken by our subsidiaries in currencies other than their functional currency. Such transactions include intercompany transactions and inventory purchases denominated in currencies other than the functional currency of the purchasing entity. As a result, we have been impacted by changes in exchange rates and may be impacted for the foreseeable future. The potential impact of currency fluctuation increases as our international expansion increases.
12
We currently generate a significant portion of our net revenue and incur a significant portion of our expenses in Canada. We also hold a significant portion of our net assets in Canada. The reporting currency for our consolidated financial statements is the U.S. dollar. A weakening of the U.S. dollar against the Canadian dollar results in:
• an increase in our net revenue upon translation of the sales made by our Canadian operations into U.S. dollars for the purposes of consolidation;
• an increase in our selling, general and administrative expenses incurred by our Canadian operations upon translation into U.S. dollars for the purposes of consolidation; and
• foreign exchange revaluation losses by our Canadian subsidiaries on U.S. dollar cash and receivables denominated in U.S. dollars.
During fiscal 2016, the change in the relative value of the U.S. dollar against the Canadian dollar resulted in a $41.7 million reduction in accumulated other comprehensive loss within stockholders' equity. During fiscal 2015, the change in the relative value of the U.S. dollar against the Canadian dollar resulted in a $63.2 million increase in accumulated other comprehensive loss within stockholders' equity.
A 10% appreciation in the relative value of the U.S. dollar against the Canadian dollar compared to the exchange rates in effect for fiscal 2015 would have resulted in additional income from operations of approximately $0.2 million in fiscal 2016. This assumes a consistent 10% appreciation in the U.S. dollar against the Canadian dollar throughout the fiscal year. The timing of changes in the relative value of the U.S. dollar combined with the seasonal nature of our business, can affect the magnitude of the impact that fluctuations in foreign exchange rates have on our income from operations.
We have not historically hedged foreign currency fluctuations. However, in the future, in an effort to mitigate these risks, we may at times enter into derivative financial instruments, although we have not historically done so. We do not, and do not intend to, engage in the practice of trading derivative securities for profit.
The operations of many of our suppliers are subject to additional risks that are beyond our control and that could harm our business, financial condition, and results of operations.
Almost all of our suppliers are located outside of North America. During fiscal 2016, approximately 47% of our products were produced in South East Asia, approximately 28% in South Asia, approximately 15% in China, approximately 1% in North America, and the remainder in other regions. As a result of our international suppliers, we are subject to risks associated with doing business abroad, including:
• political unrest, terrorism, labor disputes, and economic instability resulting in the disruption of trade from foreign countries in which our products are manufactured;
• the imposition of new laws and regulations, including those relating to labor conditions, quality and safety standards, imports, duties, taxes and other charges on imports, as well as trade restrictions and restrictions on currency exchange or the transfer of funds;
• reduced protection for intellectual property rights, including trademark protection, in some countries, particularly China;
• disruptions or delays in shipments; and
• changes in local economic conditions in countries where our manufacturers, suppliers, or guests are located.
These and other factors beyond our control could interrupt our suppliers' production in offshore facilities, influence the ability of our suppliers to export our products cost-effectively or at all and inhibit our suppliers' ability to procure certain materials, any of which could harm our business, financial condition, and results of operations.
Our trademarks and other proprietary rights could potentially conflict with the rights of others and we may be prevented from selling some of our products.
Our success depends in large part on our brand image. We believe that our trademarks and other proprietary rights have significant value and are important to identifying and differentiating our products from those of our competitors and creating and sustaining demand for our products. We have obtained and applied for some United States and foreign trademark registrations, and will continue to evaluate the registration of additional trademarks as appropriate. However, some or all of these pending trademark applications may not be approved by the applicable governmental authorities. Moreover, even if the applications are approved, third parties may seek to oppose or otherwise challenge these registrations. Additionally, we may face obstacles as we expand our product line and the geographic scope of our sales and marketing. Third parties may assert intellectual property claims against us, particularly as we expand our business and the number of products we offer. Our

13
defense of any claim, regardless of its merit, could be expensive and time consuming and could divert management resources. Successful infringement claims against us could result in significant monetary liability or prevent us from selling some of our products. In addition, resolution of claims may require us to redesign our products, license rights from third parties, or cease using those rights altogether. Any of these events could harm our business and cause our results of operations, liquidity, and financial condition to suffer.
We are subject to periodic claims and litigation that could result in unexpected expenses and could ultimately be resolved against us.
From time to time, we are involved in litigation and other proceedings, including matters related to product liability claims, stockholder class action and derivative claims, commercial disputes and intellectual property, as well as trade, regulatory, employment, and other claims related to our business. Any of these proceedings could result in significant settlement amounts, damages, fines or other penalties, divert financial and management resources, and result in significant legal fees. An unfavorable outcome of any particular proceeding could exceed the limits of our insurance policies or the carriers may decline to fund such final settlements and/or judgments and could have an adverse impact on our business, financial condition, and results of operations. In addition, any proceeding could negatively impact our reputation among our guests and our brand image.
Our business could be negatively affected as a result of actions of activist stockholders, and such activism could impact the trading value of our securities.
Responding to actions by activist stockholders can be costly and time-consuming, disrupting our operations and diverting the attention of management and our employees. Such activities could interfere with our ability to execute our strategic plan. In addition, a proxy contest for the election of directors at our annual meeting would require us to incur significant legal fees and proxy solicitation expenses and require significant time and attention by management and our board of directors. The perceived uncertainties as to our future direction also could affect the market price and volatility of our securities.
Anti-takeover provisions of Delaware law and our certificate of incorporation and bylaws could delay and discourage takeover attempts that stockholders may consider to be favorable.
Certain provisions of our certificate of incorporation and bylaws and applicable provisions of the Delaware General Corporation Law may make it more difficult or impossible for a third-party to acquire control of us or effect a change in our board of directors and management. These provisions include:
• the classification of our board of directors into three classes, with one class elected each year;
• prohibiting cumulative voting in the election of directors;
• the ability of our board of directors to issue preferred stock without stockholder approval;
• the ability to remove a director only for cause and only with the vote of the holders of at least 66 2/3% of our voting stock;
• a special meeting of stockholders may only be called by our chairman or Chief Executive Officer, or upon a resolution adopted by an affirmative vote of a majority of the board of directors, and not by our stockholders;
• prohibiting stockholder action by written consent; and
• our stockholders must comply with advance notice procedures in order to nominate candidates for election to our board of directors or to place stockholder proposals on the agenda for consideration at any meeting of our stockholders.
In addition, we are governed by Section 203 of the Delaware General Corporation Law which, subject to some specified exceptions, prohibits "business combinations" between a Delaware corporation and an "interested stockholder," which is generally defined as a stockholder who becomes a beneficial owner of 15% or more of a Delaware corporation's voting stock, for a three-year period following the date that the stockholder became an interested stockholder. Section 203 could have the effect of delaying, deferring or preventing a change in control that our stockholders might consider to be in their best interests.
ITEM 2. PROPERTIES
Our principal executive and administrative offices are located at 1818 Cornwall Avenue, Vancouver, British Columbia, Canada, V6J 1C7.

14
As of January 29, 2017, we operated five distribution centers located in the United States, Canada, and Australia. During fiscal 2016 we began relocating our existing leased distribution center in Vancouver, BC to a new 145,000 square foot leased premises in Vancouver, BC. This was completed in early fiscal 2017. In addition to those distribution centers, we hold inventory at warehouses managed by third-parties in Hong Kong, China, and the Netherlands.
We believe our current administrative offices, distribution centers, and the warehouse space available through our third-party logistics providers will be sufficient for our near term expansion plans.
The general location, use and approximate size of our principal owned properties at January 29, 2017, are set forth below:
Location Use Approximate Square Feet
Columbus, OH. . . . . . . . . . . . . Distribution Center 310,000Vancouver, BC. . . . . . . . . . . . . Executive and Administrative Offices 140,000Vancouver, BC. . . . . . . . . . . . . Executive and Administrative Offices 15,000
The general location, use, approximate size and lease renewal date of our principal non-retail leased properties at January 29, 2017, are set forth below:
Location Use Approximate Square Feet Lease Renewal Date
Sumner, WA. . . . . . . . . . . . . . . Distribution Center 150,000 May 2020Vancouver, BC. . . . . . . . . . . . . Distribution Center 145,000 January 2031Vancouver, BC. . . . . . . . . . . . . Distribution Center 110,000 April 2017Vancouver, BC. . . . . . . . . . . . . Executive and Administrative Offices 60,000 May 2020Vancouver, BC. . . . . . . . . . . . . Executive and Administrative Offices 25,000 June 2023Melbourne, VIC. . . . . . . . . . . . Distribution Center 55,000 July 2017Melbourne, VIC. . . . . . . . . . . . Executive and Administrative Offices 25,000 September 2019
As of January 29, 2017, we leased approximately 1.2 million gross square feet relating to 404 of our 406 stores. Our leases generally have initial terms of between five and 10 years, and generally can be extended only in five-year increments, if at all. All of our leases require a fixed annual rent, and the majority require the payment of additional rent if store sales exceed a negotiated amount. Generally, our leases are "net" leases, which require us to pay all of the cost of insurance, taxes, maintenance and utilities. We generally cannot cancel these leases at our option.
ITEM 3. LEGAL PROCEEDINGS
In addition to the legal matters described in Note 12 to our consolidated financial statements included in Item 8 of Part II of this report, we are, from time to time, involved in routine legal matters incidental to the conduct of our business, including legal matters such as initiation and defense of proceedings to protect intellectual property rights, personal injury claims, product liability claims, employment claims, and similar matters. We believe the ultimate resolution of any such current proceeding will not have a material adverse effect on our continued financial position, results of operations or cash flows.
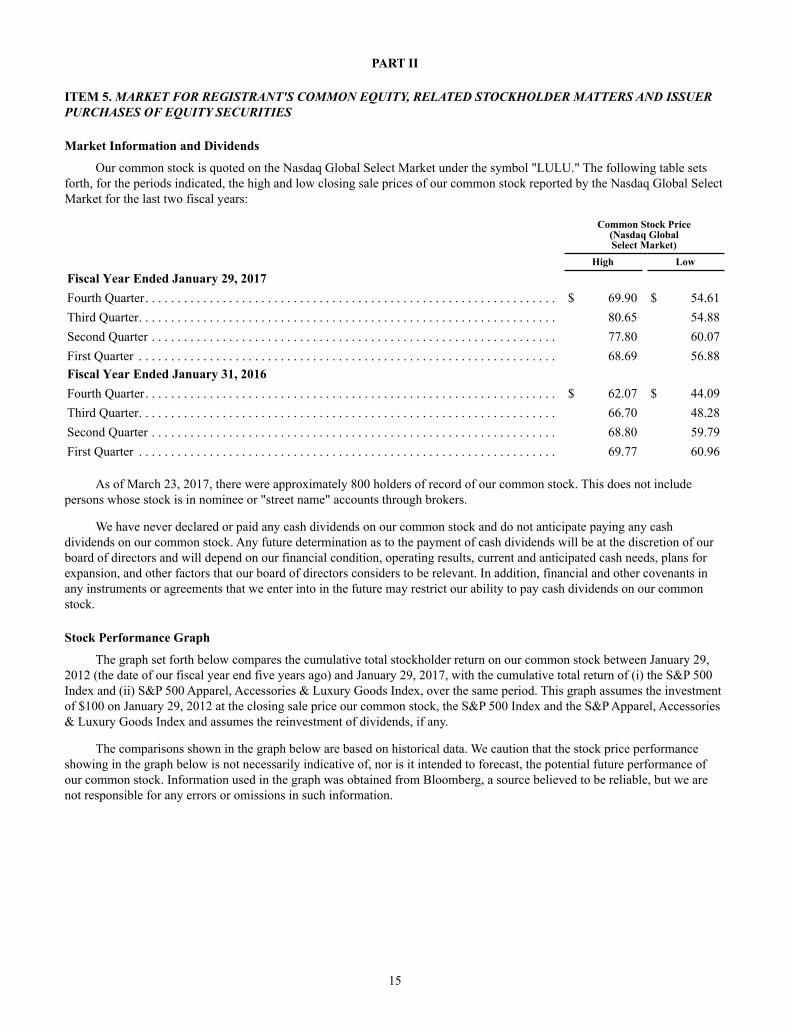
15
PART II
ITEM 5. MARKET FOR REGISTRANT'S COMMON EQUITY, RELATED STOCKHOLDER MATTERS AND ISSUER PURCHASES OF EQUITY SECURITIES
Market Information and Dividends
Our common stock is quoted on the Nasdaq Global Select Market under the symbol "LULU." The following table sets forth, for the periods indicated, the high and low closing sale prices of our common stock reported by the Nasdaq Global Select Market for the last two fiscal years:
Common Stock Price(Nasdaq GlobalSelect Market)
High Low
Fiscal Year Ended January 29, 2017Fourth Quarter. . . . . . . . . . . . . . . . . . . . . . . . . . . . . . . . . . . . . . . . . . . . . . . . . . . . . . . . . . . . . . . . $ 69.90 $ 54.61Third Quarter. . . . . . . . . . . . . . . . . . . . . . . . . . . . . . . . . . . . . . . . . . . . . . . . . . . . . . . . . . . . . . . . . 80.65 54.88Second Quarter . . . . . . . . . . . . . . . . . . . . . . . . . . . . . . . . . . . . . . . . . . . . . . . . . . . . . . . . . . . . . . . 77.80 60.07First Quarter . . . . . . . . . . . . . . . . . . . . . . . . . . . . . . . . . . . . . . . . . . . . . . . . . . . . . . . . . . . . . . . . . 68.69 56.88Fiscal Year Ended January 31, 2016Fourth Quarter. . . . . . . . . . . . . . . . . . . . . . . . . . . . . . . . . . . . . . . . . . . . . . . . . . . . . . . . . . . . . . . . $ 62.07 $ 44.09Third Quarter. . . . . . . . . . . . . . . . . . . . . . . . . . . . . . . . . . . . . . . . . . . . . . . . . . . . . . . . . . . . . . . . . 66.70 48.28Second Quarter . . . . . . . . . . . . . . . . . . . . . . . . . . . . . . . . . . . . . . . . . . . . . . . . . . . . . . . . . . . . . . . 68.80 59.79First Quarter . . . . . . . . . . . . . . . . . . . . . . . . . . . . . . . . . . . . . . . . . . . . . . . . . . . . . . . . . . . . . . . . . 69.77 60.96
As of March 23, 2017, there were approximately 800 holders of record of our common stock. This does not include persons whose stock is in nominee or "street name" accounts through brokers.
We have never declared or paid any cash dividends on our common stock and do not anticipate paying any cash dividends on our common stock. Any future determination as to the payment of cash dividends will be at the discretion of our board of directors and will depend on our financial condition, operating results, current and anticipated cash needs, plans for expansion, and other factors that our board of directors considers to be relevant. In addition, financial and other covenants in any instruments or agreements that we enter into in the future may restrict our ability to pay cash dividends on our common stock.
Stock Performance Graph
The graph set forth below compares the cumulative total stockholder return on our common stock between January 29, 2012 (the date of our fiscal year end five years ago) and January 29, 2017, with the cumulative total return of (i) the S&P 500 Index and (ii) S&P 500 Apparel, Accessories & Luxury Goods Index, over the same period. This graph assumes the investment of $100 on January 29, 2012 at the closing sale price our common stock, the S&P 500 Index and the S&P Apparel, Accessories & Luxury Goods Index and assumes the reinvestment of dividends, if any.
The comparisons shown in the graph below are based on historical data. We caution that the stock price performance showing in the graph below is not necessarily indicative of, nor is it intended to forecast, the potential future performance of our common stock. Information used in the graph was obtained from Bloomberg, a source believed to be reliable, but we are not responsible for any errors or omissions in such information.

16
29-Jan-12 03-Feb-13 02-Feb-14 01-Feb-15 31-Jan-16 29-Jan-17
lululemon athletica inc. . . . . . . . . . . . . . . . . . . . . . . . . $ 100.00 $ 105.83 $ 71.26 $ 103.31 $ 96.80 $ 104.21S&P 500 Index. . . . . . . . . . . . . . . . . . . . . . . . . . . . . . . $ 100.00 $ 114.95 $ 135.42 $ 151.56 $ 147.40 $ 174.32S&P 500 Apparel, Accessories & Luxury GoodsIndex . . . . . . . . . . . . . . . . . . . . . . . . . . . . . . . . . . . . . . $ 100.00 $ 91.54 $ 104.75 $ 107.46 $ 88.93 $ 74.60
Issuer Purchase of Equity Securities
The following table provides information regarding our purchases of shares of our common stock during the thirteen weeks ended January 29, 2017 related to our stock repurchase program:
Period(1)Total Number of
Shares Purchased(2)Average Price Paid
per Share
Total Number of Shares Purchased as Part of Publicly Announced Plans
or Programs(2)
Maximum Dollar Value of Shares that May Yet Be
Purchased Under the Plans or Programs(2)
October 31, 2016 - November 27, 2016 . . . . . . . . — $ — — $ —November 28, 2016 - January 1, 2017 . . . . . . . . . 2,984 64.44 2,984 99,807,713January 2, 2017 - January 29, 2017 . . . . . . . . . . . 8,934 64.57 8,934 99,230,880Total. . . . . . . . . . . . . . . . . . . . . . . . . . . . . . . . . . . . 11,918 11,918
__________(1) Monthly information is presented by reference to our fiscal periods during our fourth quarter of fiscal 2016.(2) Our stock repurchase program was approved by our board of directors in December 2016. Common shares are repurchased
in the open market at prevailing market prices, including under written plans complying with the provisions of Rule 10b5-1 and Rule 10b-18 of the Securities Exchange Act of 1934, with the timing and actual number of common shares repurchased depending upon market conditions, eligibility to trade, and other factors. The repurchases may be made up until December 2018, and the maximum dollar value of shares to be repurchased is $100 million.

17
The following table provides information regarding our purchases of shares of our common stock during the thirteen weeks ended January 29, 2017 related to our Employee Share Purchase Plan:
Period(1)Total Number of
Shares Purchased(2)Average Price Paid
per Share
Total Number of Shares Purchased as Part of Publicly Announced Plans
or Programs(2)
Maximum Number of Shares that May Yet Be Purchased
Under the Plans or Programs(2)
October 31, 2016 - November 27, 2016 . . . . . . . . 11,539 $ 55.83 11,539 5,063,944November 28, 2016 - January 1, 2017 . . . . . . . . . 15,012 67.70 15,012 5,048,932January 2, 2017 - January 29, 2017 . . . . . . . . . . . 9,126 67.34 9,126 5,039,806Total. . . . . . . . . . . . . . . . . . . . . . . . . . . . . . . . . . . . 35,677 35,677___________ (1) Monthly information is presented by reference to our fiscal periods during our fourth quarter of fiscal 2016.(2) Our Employee Share Purchase Plan (ESPP) was approved by our board of directors and stockholders in September 2007.
All shares purchased under the ESPP are purchased on the Nasdaq Global Select Market (or such other stock exchange as we may designate from time to time). Unless our board of directors terminates the ESPP earlier, the ESPP will continue until all shares authorized for purchase under the ESPP have been purchased. The maximum number of shares authorized to be purchased under the ESPP is 6,000,000.
Excluded from this disclosure are shares repurchased to settle statutory employee tax withholding related to the vesting of stock-based compensation awards.

18
ITEM 6. SELECTED CONSOLIDATED FINANCIAL DATA
The selected consolidated financial data set forth below is derived from our consolidated financial statements and should be read in conjunction with our consolidated financial statements for the years ended January 29, 2017, January 31, 2016, February 1, 2015, February 2, 2014 and February 3, 2013. The consolidated statement of operations and comprehensive income data for each of the years ended January 29, 2017, January 31, 2016 and February 1, 2015 and the consolidated balance sheet data as of January 29, 2017 and January 31, 2016 is derived from, and qualified by reference to, our audited consolidated financial statements and related notes appearing elsewhere in this Annual Report. The consolidated statement of operations and comprehensive income for the year ended February 3, 2013 covers a 53 week period compared to a 52 week period for the other years.
Fiscal Year EndedJanuary 29,
2017January 31,
2016February 1,
2015February 2,
2014February 3,
2013(In thousands, except per share data)
Consolidated statement of operations andcomprehensive income data:Net revenue . . . . . . . . . . . . . . . . . . . . . . . . . . . . . $ 2,344,392 $ 2,060,523 $ 1,797,213 $ 1,591,188 $ 1,370,358Cost of goods sold. . . . . . . . . . . . . . . . . . . . . . . . 1,144,775 1,063,357 883,033 751,112 607,532Gross profit . . . . . . . . . . . . . . . . . . . . . . . . . . . . . 1,199,617 997,166 914,180 840,076 762,826Selling, general and administrative expenses . . . 778,465 628,090 538,147 448,718 386,387Income from operations . . . . . . . . . . . . . . . . . . . 421,152 369,076 376,033 391,358 376,439Other income (expense), net . . . . . . . . . . . . . . . . 1,577 (581) 7,102 5,768 4,957Income before income tax expense . . . . . . . . . . . 422,729 368,495 383,135 397,126 381,396Income tax expense . . . . . . . . . . . . . . . . . . . . . . . 119,348 102,448 144,102 117,579 109,965Net income . . . . . . . . . . . . . . . . . . . . . . . . . . . . . 303,381 266,047 239,033 279,547 271,431Net income attributable to non-controllinginterest . . . . . . . . . . . . . . . . . . . . . . . . . . . . . . . . . — — — — 875Net income attributable to lululemon athleticainc.. . . . . . . . . . . . . . . . . . . . . . . . . . . . . . . . . . . . $ 303,381 $ 266,047 $ 239,033 $ 279,547 $ 270,556
Other comprehensive income (loss):Foreign currency translation adjustment. . . . . . . 36,703 (64,796) (105,339) (89,158) (459)Comprehensive income. . . . . . . . . . . . . . . . . . . . $ 340,084 $ 201,251 $ 133,694 $ 190,389 $ 270,097
Basic earnings per share . . . . . . . . . . . . . . . . . . . $ 2.21 $ 1.90 $ 1.66 $ 1.93 $ 1.88Diluted earnings per share. . . . . . . . . . . . . . . . . . $ 2.21 $ 1.89 $ 1.66 $ 1.91 $ 1.85Basic weighted-average number of sharesoutstanding . . . . . . . . . . . . . . . . . . . . . . . . . . . . . 137,086 140,365 143,935 144,913 144,000Diluted weighted-average number of sharesoutstanding . . . . . . . . . . . . . . . . . . . . . . . . . . . . . 137,302 140,610 144,298 146,043 145,806
As ofJanuary 29,
2017January 31,
2016February 1,
2015February 2,
2014February 3,
2013(In thousands)
Consolidated balance sheet data:Cash and cash equivalents. . . . . . . . . . . . . . . . . . $ 734,846 $ 501,482 $ 664,479 $ 698,649 $ 590,179Total assets . . . . . . . . . . . . . . . . . . . . . . . . . . . . . 1,657,541 1,314,077 1,296,213 1,252,388 1,052,678Total stockholders' equity . . . . . . . . . . . . . . . . . . 1,359,973 1,027,482 1,089,568 1,096,682 887,299

19
ITEM 7. MANAGEMENT'S DISCUSSION AND ANALYSIS OF FINANCIAL CONDITION AND RESULTS OF OPERATIONS
Our fiscal year ends on the Sunday closest to January 31 of the following year, typically resulting in a 52 week year, but occasionally giving rise to an additional week, resulting in a 53 week year.
Fiscal 2016, fiscal 2015, and fiscal 2014 were 52 week years. The following discussion and analysis should be read in conjunction with our consolidated financial statements and the related notes included elsewhere in this Annual Report on Form 10-K.
This discussion and analysis contains forward-looking statements based on current expectations that involve risks, uncertainties and assumptions, such as our plans, objectives, expectations, and intentions set forth in the "Special Note Regarding Forward-Looking Statements." Our actual results and the timing of events may differ materially from those anticipated in these forward looking statements as a result of various factors, including those set forth in the "Item 1A. Risk Factors" section and elsewhere in this Annual Report on Form 10-K.
Overview
Fiscal 2016 was a year in which successful execution against our long-term strategies returned the Company to positive operating income growth for the first time in three years.
We have renewed our design-led focus, blending function and fashion with a solid innovation pipeline in place to fuel our long term growth.
We continued to optimize and strategically grow our square footage in North America, exploring new concepts such as our co-located stores and Locals that are tailored and unique to each community.
We made meaningful progress towards building a robust digital ecosystem with key investments in customer relationship management, analytics, and omni-channel capabilities which will be essential in continuing to elevate our guest experience across all touch points.
We continued to expand our collective globally through our international expansion, opening 11 stores in Asia and Europe, which included our first stores in China, South Korea, and Switzerland. As of January 29, 2017, we operated a total of 54 stores across nine countries outside of North America.
Lastly, we made significant improvements to our product and supply chain infrastructure which resulted in 280 basis points of gross margin expansion from fiscal 2015.
Looking forward in fiscal 2017, we will continue to focus our growth efforts across our four key strategic pillars:
1. Within product innovation, our design-led vision will be concentrated on driving innovation in both our women's and men's categories.
2. Our digital strategy will center on pursuing our channel agnostic model, improving our web and mobile experience, and leveraging our guest database to amplify how we connect with our collective both online and in-store.
3. In North America, our priorities are to continue to optimize our square footage through tailored and curated formats that fit with each community, while expanding our omni-channel capabilities.
4. Finally, in our international markets, our focus is on accelerating our expansion through store densification in key strategic cities while driving brand awareness and guest acquisition in new and existing markets.
These priorities and investments will continue to position us well for sustainable long term profitable growth.
Financial Highlights
• Net revenue increased 14% to $2.3 billion in fiscal 2016, from $2.1 billion in fiscal 2015. On a constant dollar basis, net revenue increased 14%. Net revenue increased across all segments, and the increase in net revenue was primarily due to the addition of 43 net new company-operated stores during fiscal 2016, as well as increased comparable store sales and the growth of our direct to consumer segment.
• Total comparable sales, which includes comparable store sales and direct to consumer, increased 6% in fiscal 2016 compared to fiscal 2015, or by 7% on a constant dollar basis.
• Comparable store sales increased 4% in fiscal 2016 compared to fiscal 2015, or by 5% on a constant dollar basis, primarily as a result of increased dollar value per transaction and improved conversion rates.

20
• Direct to consumer net revenue increased 13% in fiscal 2016 compared to fiscal 2015, or by 13% on a constant dollar basis, primarily as a result of increased traffic on our e-commerce websites, increased dollar value per transaction, and improved conversion rates.
• Gross profit for fiscal 2016 increased 20% to $1.2 billion, from $1.0 billion in fiscal 2015. Gross profit as a percentage of net revenue, or gross margin, increased to 51.2% compared to 48.4% in fiscal 2015. The increase in gross margin was primarily due to lower product costs and improved average retail prices, partially offset by increased expenses related to our product and supply chain departments and increased occupancy and depreciation costs.
• Income from operations for fiscal 2016 increased 14% to $421.2 million, from $369.1 million in fiscal 2015. As a percentage of net revenue, income from operations increased to 18.0% compared to 17.9% of net revenue in fiscal 2015.
• Income tax expense for fiscal 2016 increased 16% to $119.3 million, from $102.4 million in fiscal 2015. Our effective tax rate for fiscal 2016 was 28.2% compared to 27.8% for fiscal 2015. Fiscal 2016 and fiscal 2015 included net income tax recoveries and related net interest expenses as a result of the finalization of an Advance Pricing Arrangement with the Internal Revenue Service and the Canada Revenue Agency. Our effective tax rate excluding these adjustments was 30.7% for fiscal 2016 compared to 29.5% for fiscal 2015.
• Diluted earnings per share for fiscal 2016 were $2.21 compared to $1.89 in fiscal 2015. Excluding the above tax and related interest adjustments, diluted earnings per share were $2.14 for fiscal 2016 and $1.86 for fiscal 2015.
Refer to the non-GAAP reconciliation tables contained in the "Non-GAAP Financial Measures" section of this "Item 7. Management's Discussion and Analysis of Financial Condition and Results of Operations" for reconciliations between constant dollar changes in net revenue, total comparable sales, comparable store sales, and direct to consumer net revenue, and the effective tax rate and diluted earnings per share excluding certain tax and related interest adjustments, and the most directly comparable measures calculated in accordance with GAAP.
General
Net revenue is comprised of company-operated store sales, direct to consumer sales through www.lululemon.com, www.ivivva.com, and other country and region specific websites, and other net revenue, which includes outlet sales, showroom sales, sales from temporary locations, sales to wholesale accounts, warehouse sales, and license and supply arrangement net revenue, which consists of royalties as well as sales of our products to licensees.
Cost of goods sold includes the cost of purchased merchandise, including freight, duty, and nonrefundable taxes incurred in delivering the goods to our distribution centers. It also includes occupancy costs and depreciation expense for our company-operated store locations, all costs incurred in operating our distribution centers and production, design, distribution, and merchandise departments, hemming, shrink, and inventory provision expense. The primary drivers of the costs of individual products are the costs of raw materials and labor in the countries where we source our merchandise.
Selling, general and administrative expenses consist of all operating costs not otherwise included in cost of goods sold. We expect selling, general and administrative expenses to increase in fiscal 2017 as we incur additional operating expenses to support our store and direct to consumer growth, while also making strategic investments to support the long term growth of the business.
Income tax expense depends on the statutory tax rates in the countries where we sell our products and the proportion of taxable income earned in those jurisdictions. To the extent the relative proportion of taxable income in the jurisdictions fluctuates, or the tax legislation in the respective jurisdictions changes, so will our effective tax rate. We also anticipate that, in the future, we may start to sell our products through retail locations in countries in which we have not yet operated, in which case, we would become subject to taxation based on the foreign statutory rates in the countries where these sales take place and our effective tax rate could fluctuate accordingly.
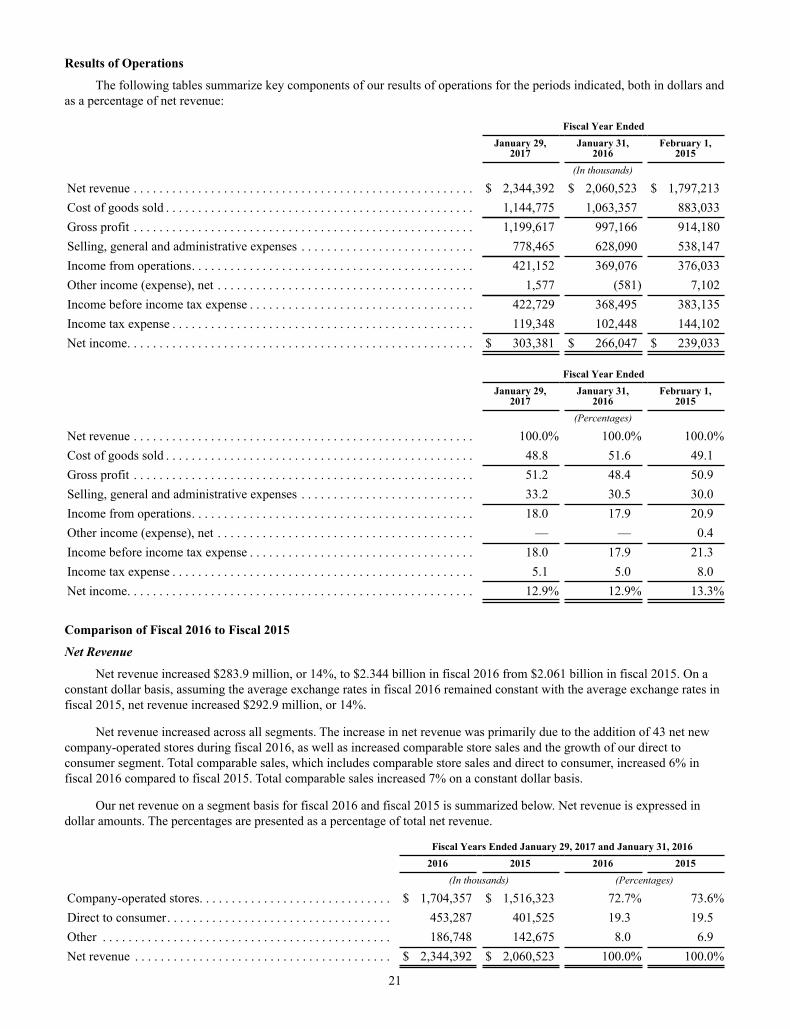
21
Results of Operations
The following tables summarize key components of our results of operations for the periods indicated, both in dollars and as a percentage of net revenue:
Fiscal Year Ended
January 29,
2017January 31,
2016February 1,
2015 (In thousands)
Net revenue . . . . . . . . . . . . . . . . . . . . . . . . . . . . . . . . . . . . . . . . . . . . . . . . . . . . . $ 2,344,392 $ 2,060,523 $ 1,797,213Cost of goods sold . . . . . . . . . . . . . . . . . . . . . . . . . . . . . . . . . . . . . . . . . . . . . . . . 1,144,775 1,063,357 883,033Gross profit . . . . . . . . . . . . . . . . . . . . . . . . . . . . . . . . . . . . . . . . . . . . . . . . . . . . . 1,199,617 997,166 914,180Selling, general and administrative expenses . . . . . . . . . . . . . . . . . . . . . . . . . . . 778,465 628,090 538,147Income from operations. . . . . . . . . . . . . . . . . . . . . . . . . . . . . . . . . . . . . . . . . . . . 421,152 369,076 376,033Other income (expense), net . . . . . . . . . . . . . . . . . . . . . . . . . . . . . . . . . . . . . . . . 1,577 (581) 7,102Income before income tax expense . . . . . . . . . . . . . . . . . . . . . . . . . . . . . . . . . . . 422,729 368,495 383,135Income tax expense . . . . . . . . . . . . . . . . . . . . . . . . . . . . . . . . . . . . . . . . . . . . . . . 119,348 102,448 144,102Net income. . . . . . . . . . . . . . . . . . . . . . . . . . . . . . . . . . . . . . . . . . . . . . . . . . . . . . $ 303,381 $ 266,047 $ 239,033
Fiscal Year EndedJanuary 29,
2017January 31,
2016February 1,
2015 (Percentages)
Net revenue . . . . . . . . . . . . . . . . . . . . . . . . . . . . . . . . . . . . . . . . . . . . . . . . . . . . . 100.0% 100.0% 100.0%Cost of goods sold . . . . . . . . . . . . . . . . . . . . . . . . . . . . . . . . . . . . . . . . . . . . . . . . 48.8 51.6 49.1Gross profit . . . . . . . . . . . . . . . . . . . . . . . . . . . . . . . . . . . . . . . . . . . . . . . . . . . . . 51.2 48.4 50.9Selling, general and administrative expenses . . . . . . . . . . . . . . . . . . . . . . . . . . . 33.2 30.5 30.0Income from operations. . . . . . . . . . . . . . . . . . . . . . . . . . . . . . . . . . . . . . . . . . . . 18.0 17.9 20.9Other income (expense), net . . . . . . . . . . . . . . . . . . . . . . . . . . . . . . . . . . . . . . . . — — 0.4Income before income tax expense . . . . . . . . . . . . . . . . . . . . . . . . . . . . . . . . . . . 18.0 17.9 21.3Income tax expense . . . . . . . . . . . . . . . . . . . . . . . . . . . . . . . . . . . . . . . . . . . . . . . 5.1 5.0 8.0Net income. . . . . . . . . . . . . . . . . . . . . . . . . . . . . . . . . . . . . . . . . . . . . . . . . . . . . . 12.9% 12.9% 13.3%
Comparison of Fiscal 2016 to Fiscal 2015
Net Revenue
Net revenue increased $283.9 million, or 14%, to $2.344 billion in fiscal 2016 from $2.061 billion in fiscal 2015. On a constant dollar basis, assuming the average exchange rates in fiscal 2016 remained constant with the average exchange rates in fiscal 2015, net revenue increased $292.9 million, or 14%.
Net revenue increased across all segments. The increase in net revenue was primarily due to the addition of 43 net new company-operated stores during fiscal 2016, as well as increased comparable store sales and the growth of our direct to consumer segment. Total comparable sales, which includes comparable store sales and direct to consumer, increased 6% in fiscal 2016 compared to fiscal 2015. Total comparable sales increased 7% on a constant dollar basis.
Our net revenue on a segment basis for fiscal 2016 and fiscal 2015 is summarized below. Net revenue is expressed in dollar amounts. The percentages are presented as a percentage of total net revenue.
Fiscal Years Ended January 29, 2017 and January 31, 2016 2016 2015 2016 2015 (In thousands) (Percentages)
Company-operated stores. . . . . . . . . . . . . . . . . . . . . . . . . . . . . . $ 1,704,357 $ 1,516,323 72.7% 73.6%Direct to consumer. . . . . . . . . . . . . . . . . . . . . . . . . . . . . . . . . . . 453,287 401,525 19.3 19.5Other . . . . . . . . . . . . . . . . . . . . . . . . . . . . . . . . . . . . . . . . . . . . . 186,748 142,675 8.0 6.9Net revenue . . . . . . . . . . . . . . . . . . . . . . . . . . . . . . . . . . . . . . . . $ 2,344,392 $ 2,060,523 100.0% 100.0%

22
Company-Operated Stores. Net revenue from our company-operated stores segment increased $188.0 million, or 12%, to $1.704 billion in fiscal 2016 from $1.516 billion in fiscal 2015. The following contributed to the increase in net revenue from our company-operated stores segment:
• Net revenue from company-operated stores we opened or significantly expanded subsequent to January 31, 2016, and therefore not included in comparable store sales, contributed $126.7 million to the increase. During fiscal 2016 we opened 43 net new company-operated stores, which included 27 stores in the United States, four stores in Canada, three stores in each of China and the United Kingdom, two stores in South Korea, and one store in each of Australia, Hong Kong, Singapore, and Switzerland.
• A comparable store sales increase of 4% in fiscal 2016 compared to fiscal 2015 resulted in a $61.3 million increase to net revenue. Comparable store sales increased 5%, or $66.4 million on a constant dollar basis. The increase in comparable store sales was primarily as a result of increased dollar value per transaction and improved conversion rates.
Direct to Consumer. Net revenue from our direct to consumer segment increased $51.8 million, or 13%, to $453.3 million in fiscal 2016 from $401.5 million in fiscal 2015. Direct to consumer net revenue increased 13% on a constant dollar basis. The increase in net revenue from our direct to consumer segment was primarily the result of increased traffic on our e-commerce websites, increased dollar value per transaction and improved conversion rates.
Other. Net revenue from our other segment increased $44.1 million, or 31%, to $186.7 million in fiscal 2016 from $142.7 million in fiscal 2015. This increase was primarily the result of an increased number of outlets which were open for the full year in fiscal 2016, increased net revenue at other existing outlets, and an increase in the number of temporary locations.
Gross Profit
Gross profit increased $202.5 million, or 20%, to $1.200 billion in fiscal 2016 from $997.2 million in fiscal 2015.
Gross profit as a percentage of net revenue, or gross margin, increased 280 basis points, to 51.2% in fiscal 2016 from 48.4% in fiscal 2015. The increase in gross margin was primarily the result of an increase in product margin of 330 basis points, primarily due to lower product costs, improved average retail prices, and lower costs related to our raw material commitments.
The increase in gross margin was partially offset by an increase in expenses related to our product and supply chain departments of 20 basis points, an increase in occupancy costs and depreciation of 20 basis points, and an unfavorable impact of foreign exchange rates of 10 basis points.
Selling, General and Administrative Expenses
Selling, general and administrative expenses increased $150.4 million, or 24%, to $778.5 million in fiscal 2016 from $628.1 million in fiscal 2015. The increase in selling, general and administrative expenses was principally comprised of:
• an increase in employee costs for our operating locations of $47.0 million, primarily from a growth in labor hours and bonuses, mainly associated with new company-operated stores;
• an increase in head office employee costs of $35.4 million to support the growth in our business;
• an increase in head office costs other than employee costs of $21.2 million primarily as a result of increased brand and community costs, increased depreciation, and increased information technology costs;
• an increase in net foreign exchange revaluation losses of $20.3 million, primarily related to the revaluation of U.S. dollar cash and receivables held in Canadian subsidiaries. There were net foreign exchange losses of $8.3 million in fiscal 2016 compared to net foreign exchange gains of $12.0 million in fiscal 2015.
• an increase in other costs of $18.5 million for our operating channels such as digital marketing expenses, repairs and maintenance costs, and increased depreciation; and
• an increase in variable costs such as credit card fees and distribution costs of $8.1 million primarily as a result of increased sales.
As a percentage of net revenue, selling, general and administrative expenses increased 270 basis points, to 33.2% in fiscal 2016 from 30.5% in fiscal 2015.
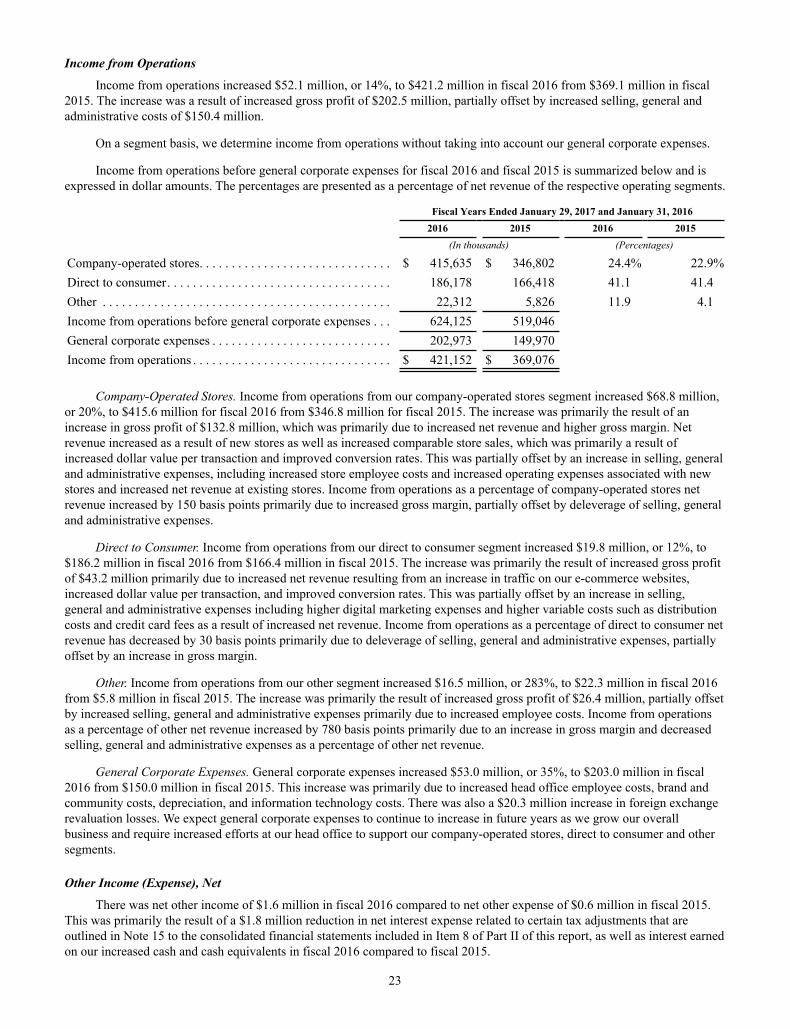
23
Income from Operations
Income from operations increased $52.1 million, or 14%, to $421.2 million in fiscal 2016 from $369.1 million in fiscal 2015. The increase was a result of increased gross profit of $202.5 million, partially offset by increased selling, general and administrative costs of $150.4 million.
On a segment basis, we determine income from operations without taking into account our general corporate expenses.
Income from operations before general corporate expenses for fiscal 2016 and fiscal 2015 is summarized below and is expressed in dollar amounts. The percentages are presented as a percentage of net revenue of the respective operating segments.
Fiscal Years Ended January 29, 2017 and January 31, 2016 2016 2015 2016 2015 (In thousands) (Percentages)
Company-operated stores. . . . . . . . . . . . . . . . . . . . . . . . . . . . . . $ 415,635 $ 346,802 24.4% 22.9%Direct to consumer. . . . . . . . . . . . . . . . . . . . . . . . . . . . . . . . . . . 186,178 166,418 41.1 41.4Other . . . . . . . . . . . . . . . . . . . . . . . . . . . . . . . . . . . . . . . . . . . . . 22,312 5,826 11.9 4.1Income from operations before general corporate expenses . . . 624,125 519,046General corporate expenses . . . . . . . . . . . . . . . . . . . . . . . . . . . . 202,973 149,970Income from operations . . . . . . . . . . . . . . . . . . . . . . . . . . . . . . . $ 421,152 $ 369,076
Company-Operated Stores. Income from operations from our company-operated stores segment increased $68.8 million, or 20%, to $415.6 million for fiscal 2016 from $346.8 million for fiscal 2015. The increase was primarily the result of an increase in gross profit of $132.8 million, which was primarily due to increased net revenue and higher gross margin. Net revenue increased as a result of new stores as well as increased comparable store sales, which was primarily a result of increased dollar value per transaction and improved conversion rates. This was partially offset by an increase in selling, general and administrative expenses, including increased store employee costs and increased operating expenses associated with new stores and increased net revenue at existing stores. Income from operations as a percentage of company-operated stores net revenue increased by 150 basis points primarily due to increased gross margin, partially offset by deleverage of selling, general and administrative expenses.
Direct to Consumer. Income from operations from our direct to consumer segment increased $19.8 million, or 12%, to $186.2 million in fiscal 2016 from $166.4 million in fiscal 2015. The increase was primarily the result of increased gross profit of $43.2 million primarily due to increased net revenue resulting from an increase in traffic on our e-commerce websites, increased dollar value per transaction, and improved conversion rates. This was partially offset by an increase in selling, general and administrative expenses including higher digital marketing expenses and higher variable costs such as distribution costs and credit card fees as a result of increased net revenue. Income from operations as a percentage of direct to consumer net revenue has decreased by 30 basis points primarily due to deleverage of selling, general and administrative expenses, partially offset by an increase in gross margin.
Other. Income from operations from our other segment increased $16.5 million, or 283%, to $22.3 million in fiscal 2016 from $5.8 million in fiscal 2015. The increase was primarily the result of increased gross profit of $26.4 million, partially offset by increased selling, general and administrative expenses primarily due to increased employee costs. Income from operations as a percentage of other net revenue increased by 780 basis points primarily due to an increase in gross margin and decreased selling, general and administrative expenses as a percentage of other net revenue.
General Corporate Expenses. General corporate expenses increased $53.0 million, or 35%, to $203.0 million in fiscal 2016 from $150.0 million in fiscal 2015. This increase was primarily due to increased head office employee costs, brand and community costs, depreciation, and information technology costs. There was also a $20.3 million increase in foreign exchange revaluation losses. We expect general corporate expenses to continue to increase in future years as we grow our overall business and require increased efforts at our head office to support our company-operated stores, direct to consumer and other segments.
Other Income (Expense), Net
There was net other income of $1.6 million in fiscal 2016 compared to net other expense of $0.6 million in fiscal 2015. This was primarily the result of a $1.8 million reduction in net interest expense related to certain tax adjustments that are outlined in Note 15 to the consolidated financial statements included in Item 8 of Part II of this report, as well as interest earned on our increased cash and cash equivalents in fiscal 2016 compared to fiscal 2015.
24
Income Tax Expense
Income tax expense increased $16.9 million, or 16%, to $119.3 million in fiscal 2016 from $102.4 million in fiscal 2015. Fiscal 2016 and fiscal 2015 included certain tax adjustments which resulted in net income tax recoveries of $10.7 million and $7.4 million, respectively, as outlined in Note 15 to the consolidated financial statements included in Item 8 of Part II of this report.
Our effective tax rate for fiscal 2016 was 28.2% compared to 27.8% for fiscal 2015. Our effective tax rate excluding the above tax and related interest adjustments was 30.7% for fiscal 2016 compared to 29.5% for fiscal 2015.
Net Income
Net income increased $37.4 million, or 14%, to $303.4 million in fiscal 2016 from $266.0 million in fiscal 2015. The increase in net income in fiscal 2016 was primarily due to a $202.5 million increase in gross profit and an increase in other income (expense), net of $2.2 million, partially offset by an increase of $150.4 million in selling, general and administrative expenses and an increase of $16.9 million in income tax expense.
Comparison of Fiscal 2015 to Fiscal 2014
Net Revenue
Net revenue increased $263.3 million, or 15%, to $2.061 billion in fiscal 2015 from $1.797 billion in fiscal 2014. On a constant dollar basis, assuming the average exchange rates in fiscal 2015 remained constant with the average exchange rates in fiscal 2014, net revenue increased $352.2 million, or 20%.
The net revenue increase was primarily driven by sales from new stores and the growth of our direct to consumer segment. Total comparable sales, which includes comparable store sales and direct to consumer, increased 5% in fiscal 2015 compared to fiscal 2014. Total comparable sales increased 10% on a constant dollar basis.
Our net revenue on a segment basis for fiscal 2015 and fiscal 2014 is summarized below. Net revenue is expressed in dollar amounts. The percentages are presented as a percentage of total net revenue.
Fiscal Years Ended January 31, 2016 and February 1, 2015 2015 2014 2015 2014 (In thousands) (Percentages)
Company-operated stores. . . . . . . . . . . . . . . . . . . . . . . . . . . . . . $ 1,516,323 $ 1,348,225 73.6% 75.0%Direct to consumer. . . . . . . . . . . . . . . . . . . . . . . . . . . . . . . . . . . 401,525 321,180 19.5 17.9Other . . . . . . . . . . . . . . . . . . . . . . . . . . . . . . . . . . . . . . . . . . . . . 142,675 127,808 6.9 7.1Net revenue . . . . . . . . . . . . . . . . . . . . . . . . . . . . . . . . . . . . . . . . $ 2,060,523 $ 1,797,213 100.0% 100.0%
Company-Operated Stores. Net revenue from our company-operated stores segment increased $168.1 million, or 12%, to $1.516 billion in fiscal 2015 from $1.348 billion in fiscal 2014.
During fiscal 2015 we opened 61 net new stores, which included 49 stores in the United States, three stores in Canada, four stores in the United Kingdom, two stores in Hong Kong, and one store in each of Germany, Puerto Rico, and Singapore.
The increase in net revenue from our company-operated stores segment resulted from an increase of $175.4 million from non-comparable stores, which includes sales from new stores that have not been open for 12 months and sales from stores which have been significantly expanded. The increase in net revenue was partially offset by a decrease of $7.3 million from comparable store sales.
Comparable store sales decreased by less than 1% in fiscal 2015 compared to fiscal 2014. Comparable store sales increased 4%, or $48.8 million on a constant dollar basis. Comparable store sales on a constant dollar basis increased primarily as the result of increased traffic which resulted in an increase in the number of transactions, and due to higher average unit retail prices.
Direct to Consumer. Net revenue from our direct to consumer segment increased $80.3 million, or 25%, to $401.5 million in fiscal 2015 from $321.2 million in fiscal 2014. Direct to consumer net revenue increased 30% on a constant dollar basis. The increase in net revenue from our direct to consumer segment was primarily the result of an increase in the number of transactions which was driven by increased traffic and higher conversion rates on our e-commerce websites.

25
Other. Net revenue from our other segment increased $14.9 million, or 12%, to $142.7 million in fiscal 2015 from $127.8 million in fiscal 2014. This increase was primarily the result of an increased number of outlets and an increased number of warehouse sales held during fiscal 2015 compared to fiscal 2014. This was partially offset by fewer temporary locations open during fiscal 2015 compared to fiscal 2014.
Gross Profit
Gross profit increased $83.0 million, or 9%, to $997.2 million in fiscal 2015 from $914.2 million in fiscal 2014.
Gross profit as a percentage of net revenue, or gross margin, decreased 250 basis points, to 48.4% in fiscal 2015 from 50.9% in fiscal 2014. The decrease in gross margin was primarily the result of:
• an increase in fixed costs, such as occupancy costs and depreciation, relative to the increase in net revenue, of 90 basis points;
• an unfavorable impact of foreign exchange rates on product costs which contributed to a decrease in gross margin of 90 basis points; and
• a decrease in product margin of 70 basis points, primarily due to an increase in markdowns and discounts, as well as other product related costs.
Selling, General and Administrative Expenses
Selling, general and administrative expenses increased $89.9 million, or 17%, to $628.1 million in fiscal 2015 from $538.1 million in fiscal 2014. The increase in selling, general and administrative expenses was principally comprised of:
• an increase in employee costs for our operating locations of $36.8 million, primarily from a growth in labor hours and bonuses, mainly associated with new company-operated stores;
• an increase in head office costs other than employee costs of $18.7 million primarily as a result of increased professional fees, including supply chain consulting costs, increased brand and community costs, and increased depreciation;
• an increase in variable costs such as distribution costs, credit card fees, and packaging of $14.6 million primarily as a result of new company-operated stores as well as increased sales volume from our direct to consumer segment;
• an increase in head office employee costs of $14.5 million to support the growth in our business; and
• an increase in other costs of $10.9 million for our operating channels such as repairs and maintenance costs, digital marketing expenses, and store community costs.
• The increase in selling, general and administrative expenses was partially offset by an increase in net foreign exchange revaluation gains of $5.6 million.
As a percentage of net revenue, selling, general and administrative expenses increased 50 basis points, to 30.5% in fiscal 2015 from 30.0% in fiscal 2014.
Income from Operations
Income from operations decreased $7.0 million, or 2%, to $369.1 million in fiscal 2015 from $376.0 million in fiscal 2014. The decrease was a result of increased selling, general and administrative costs of $89.9 million, partially offset by increased gross profit of $83.0 million.
On a segment basis, we determine income from operations without taking into account our general corporate expenses.
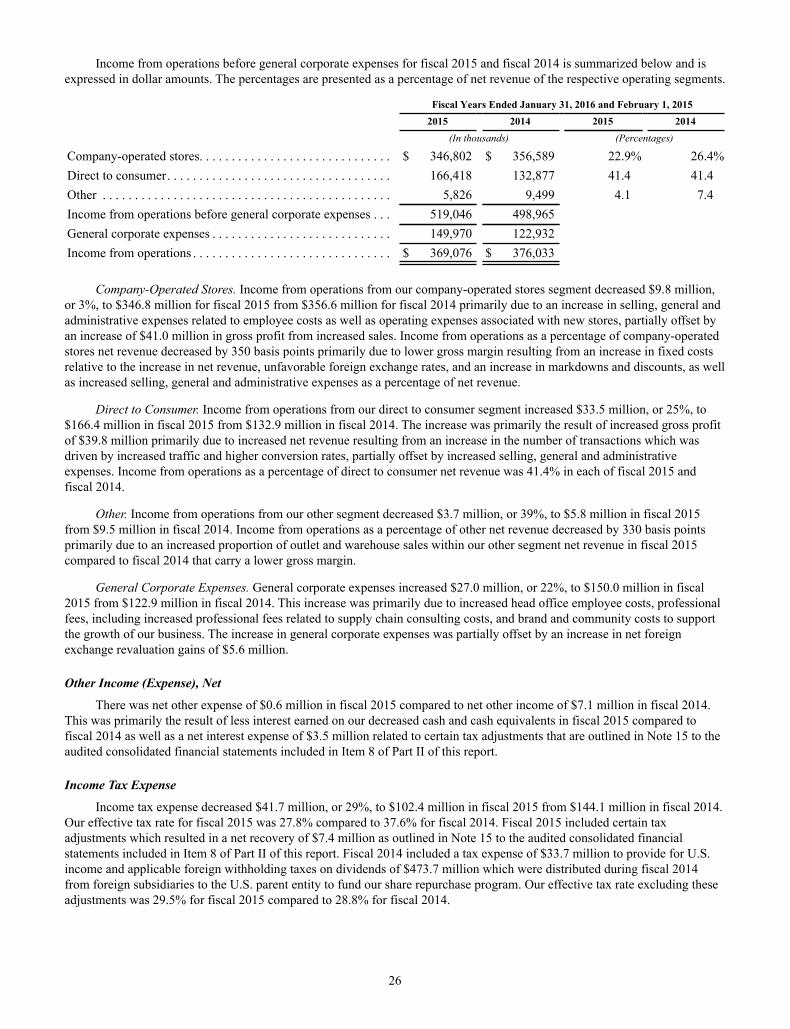
26
Income from operations before general corporate expenses for fiscal 2015 and fiscal 2014 is summarized below and is expressed in dollar amounts. The percentages are presented as a percentage of net revenue of the respective operating segments.
Fiscal Years Ended January 31, 2016 and February 1, 2015 2015 2014 2015 2014 (In thousands) (Percentages)
Company-operated stores. . . . . . . . . . . . . . . . . . . . . . . . . . . . . . $ 346,802 $ 356,589 22.9% 26.4%Direct to consumer. . . . . . . . . . . . . . . . . . . . . . . . . . . . . . . . . . . 166,418 132,877 41.4 41.4Other . . . . . . . . . . . . . . . . . . . . . . . . . . . . . . . . . . . . . . . . . . . . . 5,826 9,499 4.1 7.4Income from operations before general corporate expenses . . . 519,046 498,965General corporate expenses . . . . . . . . . . . . . . . . . . . . . . . . . . . . 149,970 122,932Income from operations . . . . . . . . . . . . . . . . . . . . . . . . . . . . . . . $ 369,076 $ 376,033
Company-Operated Stores. Income from operations from our company-operated stores segment decreased $9.8 million, or 3%, to $346.8 million for fiscal 2015 from $356.6 million for fiscal 2014 primarily due to an increase in selling, general and administrative expenses related to employee costs as well as operating expenses associated with new stores, partially offset by an increase of $41.0 million in gross profit from increased sales. Income from operations as a percentage of company-operated stores net revenue decreased by 350 basis points primarily due to lower gross margin resulting from an increase in fixed costs relative to the increase in net revenue, unfavorable foreign exchange rates, and an increase in markdowns and discounts, as well as increased selling, general and administrative expenses as a percentage of net revenue.
Direct to Consumer. Income from operations from our direct to consumer segment increased $33.5 million, or 25%, to $166.4 million in fiscal 2015 from $132.9 million in fiscal 2014. The increase was primarily the result of increased gross profit of $39.8 million primarily due to increased net revenue resulting from an increase in the number of transactions which was driven by increased traffic and higher conversion rates, partially offset by increased selling, general and administrative expenses. Income from operations as a percentage of direct to consumer net revenue was 41.4% in each of fiscal 2015 and fiscal 2014.
Other. Income from operations from our other segment decreased $3.7 million, or 39%, to $5.8 million in fiscal 2015 from $9.5 million in fiscal 2014. Income from operations as a percentage of other net revenue decreased by 330 basis points primarily due to an increased proportion of outlet and warehouse sales within our other segment net revenue in fiscal 2015 compared to fiscal 2014 that carry a lower gross margin.
General Corporate Expenses. General corporate expenses increased $27.0 million, or 22%, to $150.0 million in fiscal 2015 from $122.9 million in fiscal 2014. This increase was primarily due to increased head office employee costs, professional fees, including increased professional fees related to supply chain consulting costs, and brand and community costs to support the growth of our business. The increase in general corporate expenses was partially offset by an increase in net foreign exchange revaluation gains of $5.6 million.
Other Income (Expense), Net
There was net other expense of $0.6 million in fiscal 2015 compared to net other income of $7.1 million in fiscal 2014. This was primarily the result of less interest earned on our decreased cash and cash equivalents in fiscal 2015 compared to fiscal 2014 as well as a net interest expense of $3.5 million related to certain tax adjustments that are outlined in Note 15 to the audited consolidated financial statements included in Item 8 of Part II of this report.
Income Tax Expense
Income tax expense decreased $41.7 million, or 29%, to $102.4 million in fiscal 2015 from $144.1 million in fiscal 2014. Our effective tax rate for fiscal 2015 was 27.8% compared to 37.6% for fiscal 2014. Fiscal 2015 included certain tax adjustments which resulted in a net recovery of $7.4 million as outlined in Note 15 to the audited consolidated financial statements included in Item 8 of Part II of this report. Fiscal 2014 included a tax expense of $33.7 million to provide for U.S. income and applicable foreign withholding taxes on dividends of $473.7 million which were distributed during fiscal 2014 from foreign subsidiaries to the U.S. parent entity to fund our share repurchase program. Our effective tax rate excluding these adjustments was 29.5% for fiscal 2015 compared to 28.8% for fiscal 2014.

27
Net Income
Net income increased $27.0 million, or 11%, to $266.0 million in fiscal 2015 from $239.0 million in fiscal 2014. The increase in net income in fiscal 2015 was primarily due to a $83.0 million increase in gross profit resulting from new stores and the growth of our direct to consumer segment and a decrease of $41.7 million in income tax expense, partially offset by an increase of $89.9 million in selling, general and administrative expenses and a $7.7 million increase in other income (expense), net.
Comparable Sales
We separately track comparable store sales, which reflect net revenue from company-operated stores that have been open for at least 12 months, or open for at least 12 months after being significantly expanded. Net revenue from a store is included in comparable store sales beginning with the first month for which the store has a full month of sales in the prior year. Comparable store sales exclude sales from new stores that have not been open for at least 12 months, from stores which have not been in their significantly expanded space for at least 12 months, and from stores which have been temporarily relocated for renovations. Comparable store sales also exclude sales from direct to consumer, outlets, showrooms, temporary locations, wholesale accounts, warehouse sales, license and supply arrangements, and sales from company-operated stores that we have closed.
Total comparable sales combines comparable store sales and direct to consumer sales. We are evolving towards an omni-channel approach to support the shopping behavior of our guests. This involves country and region specific websites, mobile/tablet devices in stores, social networks, product notification emails, and online order fulfillment through stores. We therefore believe that reporting total comparable sales with comparable store sales and direct to consumer sales combined provides a relevant performance metric.
Various factors affect comparable sales, including:• the location of new stores relative to existing stores;
• consumer preferences, buying trends, and overall economic trends;
• our ability to anticipate and respond effectively to customer preferences for technical athletic apparel;
• competition;
• changes in our merchandise mix;
• pricing;
• the timing of our releases of new merchandise and promotional events;
• the effectiveness of our grassroots marketing efforts;
• the design and ease of use of our websites;
• the level of customer service that we provide in our stores and on our websites;
• our ability to source and distribute products efficiently; and
• the number of stores we open, close (including for temporary renovations), and expand in any period.
Opening new stores is an important part of our growth strategy. Accordingly, total comparable sales has limited utility for assessing the success of our growth strategy insofar as comparable sales do not reflect the performance of stores open less than 12 months. The comparable sales measures we report may not be equivalent to similarly titled measures reported by other companies.
Non-GAAP Financial Measures
Constant dollar changes in net revenue, total comparable sales, comparable store sales, and direct to consumer net revenue, and the effective tax rate and diluted earnings per share excluding certain tax and related interest adjustments, are non-GAAP financial measures.
A constant dollar basis assumes the average foreign exchange rates for the period remained constant with the average foreign exchange rates for the same period of the prior year. We provide constant dollar changes in net revenue, total comparable sales, comparable store sales, and changes in direct to consumer net revenue because we use these measures to understand the underlying growth rate of net revenue excluding the impact of changes in foreign exchange rates. We believe

28
that disclosing these measures on a constant dollar basis is useful to investors because it enables them to better understand the level of growth of our business.
We disclose the effective tax rate and diluted earnings per share excluding certain tax and related interest adjustments because of their comparability to our historical information, which we believe is useful to investors.
The presentation of this financial information is not intended to be considered in isolation or as a substitute for, or with greater prominence to, the financial information prepared and presented in accordance with GAAP. A reconciliation of the non-GAAP financial measures follows, which includes more detail on the GAAP financial measure that is most directly comparable to each non-GAAP financial measure, and the related reconciliations between these financial measures.
The below changes in net revenue, total comparable sales, comparable store sales, and direct to consumer net revenue show the change compared to the corresponding period in the prior year.
Constant dollar changes in net revenue, total comparable sales, comparable store sales, and direct to consumer net revenue
Fiscal Year Ended January 29, 2017
Fiscal Year Ended January 31, 2016
(In thousands) (Percentages) (In thousands) (Percentages)
Change in net revenue . . . . . . . . . . . . . . . . . . . . . . . . . . . . . . . . $ 283,869 14% $ 263,310 15%Adjustments due to foreign exchange rate changes. . . . . . . . . . 8,983 — 88,877 5Change in net revenue in constant dollars . . . . . . . . . . . . . . . . . $ 292,852 14% $ 352,187 20%
Fiscal Year EndedJanuary 29,
2017January 31,
2016
Change in total comparable sales1,2. . . . . . . . . . . . . . . . . . . . . . . . . . . . . . . . . . . . . . . . . . . . . . . . 6% 5%Adjustments due to foreign exchange rate changes . . . . . . . . . . . . . . . . . . . . . . . . . . . . . . . . . . . 1 5Change in total comparable sales in constant dollars1,2 . . . . . . . . . . . . . . . . . . . . . . . . . . . . . . . . 7% 10%
Fiscal Year Ended January 29, 2017
Fiscal Year Ended January 31, 2016
(In thousands) (Percentages) (In thousands) (Percentages)
Change in comparable store sales2. . . . . . . . . . . . . . . . . . . . . . . $ 61,341 4% $ (7,335) —%Adjustments due to foreign exchange rate changes. . . . . . . . . . 5,036 1 56,106 4Change in comparable store sales in constant dollars2 . . . . . . . $ 66,377 5% $ 48,771 4%
Fiscal Year EndedJanuary 29,
2017January 31,
2016
Change in direct to consumer net revenue . . . . . . . . . . . . . . . . . . . . . . . . . . . . . . . . . . . . . . . . . . 13% 25%Adjustments due to foreign exchange rate changes . . . . . . . . . . . . . . . . . . . . . . . . . . . . . . . . . . . — 5Change in direct to consumer net revenue in constant dollars . . . . . . . . . . . . . . . . . . . . . . . . . . . 13% 30%
__________1Total comparable sales includes comparable store sales and direct to consumer sales. 2Comparable store sales reflects net revenue from company-operated stores that have been open for at least 12 months, or open for at least 12 months after being significantly expanded.

29
Effective tax rate and diluted earnings per share, excluding tax and related interest adjustments
Fiscal Year EndedJanuary 29,
2017January 31,
2016February 1,
2015
Effective tax rate . . . . . . . . . . . . . . . . . . . . . . . . . . . . . . . . . . . . . . . . . . . . . . . . . 28.2% 27.8% 37.6%Tax and related interest adjustments1 . . . . . . . . . . . . . . . . . . . . . . . . . . . . . . . . . 2.5 1.7 (8.8)Effective tax rate, excluding tax and related interest adjustments . . . . . . . . . . . 30.7% 29.5% 28.8%
Fiscal Year EndedJanuary 29,
2017January 31,
2016February 1,
2015
Diluted earnings per share . . . . . . . . . . . . . . . . . . . . . . . . . . . . . . . . . . . . . . . . . . $ 2.21 $ 1.89 $ 1.66Tax and related interest adjustments1 . . . . . . . . . . . . . . . . . . . . . . . . . . . . . . . . . (0.07) (0.03) 0.23Diluted earnings per share, excluding tax and related interest adjustments . . . . $ 2.14 $ 1.86 $ 1.89
_________1Please refer to Note 15 to the audited consolidated financial statements included in Item 8 of Part II of this report for an explanation as to the nature of these items.
Liquidity and Capital Resources
Our primary sources of liquidity are our current balances of cash and cash equivalents, cash flows from operations, and capacity under our revolving credit facility. Our primary cash needs are capital expenditures for opening new stores and remodeling or relocating existing stores, making information technology system enhancements, funding working capital requirements, and making other strategic capital investments both in North America and internationally. We may also use cash to repurchase shares of our common stock. Cash and cash equivalents in excess of our needs are held in interest bearing accounts with financial institutions.
As of January 29, 2017, our working capital (excluding cash and cash equivalents) was $186.4 million, our cash and cash equivalents were $734.8 million and our capacity under our revolving credit facility was $149.2 million.
The following table summarizes our net cash flows provided by and used in operating, investing and financing activities for the periods indicated:
Fiscal Year Ended
January 29,
2017January 31,
2016February 1,
2015 (In thousands)
Total cash provided by (used in):Operating activities . . . . . . . . . . . . . . . . . . . . . . . . . . . . . . . . . . . . . . . . . . . $ 385,119 $ 298,740 $ 314,449Investing activities . . . . . . . . . . . . . . . . . . . . . . . . . . . . . . . . . . . . . . . . . . . . (149,511) (143,487) (119,733)Financing activities . . . . . . . . . . . . . . . . . . . . . . . . . . . . . . . . . . . . . . . . . . . (25,338) (273,693) (149,077)Effect of exchange rate changes. . . . . . . . . . . . . . . . . . . . . . . . . . . . . . . . . . 23,094 (44,557) (79,809)
Increase (decrease) in cash and cash equivalents . . . . . . . . . . . . . . . . . . . . . . . . $ 233,364 $ (162,997) $ (34,170)
Operating Activities
Cash flows provided by operating activities consist primarily of net income adjusted for certain items not affecting cash and the effect of changes in operating assets and liabilities.
In fiscal 2016, cash provided by operating activities increased $86.4 million, to $385.1 million compared to cash provided by operating activities of $298.7 million in fiscal 2015. The increase was primarily a result of a decrease in inventory purchases, a decrease in the change in prepaid and receivable income taxes, and an increase in net income. This was partially offset by a decrease in the change in income taxes payable, deferred income taxes, and accrued inventory liabilities.
Inventory purchases decreased during fiscal 2016 primarily as a result of actions taken to align inventory levels with forward sales trends.

30
In fiscal 2015, cash provided by operating activities decreased $15.7 million, to $298.7 million compared to cash provided by operating activities of $314.4 million in fiscal 2014. The decrease was primarily a result of an increase in inventory purchases and an increase in prepaid and receivable income taxes. This was partially offset by an increase in net income, changes in other operating assets and liabilities, and the change in items not affecting cash. The change in items not affecting cash was primarily due to an increase in depreciation related to our increased number of stores and a reduction in net deferred income tax assets.
Inventory increased during fiscal 2015 primarily due to the opening of new stores, increased inventory levels to support the sales growth in our company-operated stores and direct to consumer segments, and the timing of product deliveries.
Prepaid and receivable income taxes increased during fiscal 2015 primarily as a result of certain tax adjustments as outlined in Note 15 to the consolidated financial statements included in Item 8 of Part II of this report. These adjustments resulted in an income tax receivable in the United States and an increase in income taxes payable in Canada.
Investing Activities
Cash flows used in investing activities relate entirely to capital expenditures. Cash used in investing activities increased $6.0 million, to $149.5 million in fiscal 2016 from $143.5 million in fiscal 2015. Cash used in investing activities increased $23.8 million, to $143.5 million in fiscal 2015 from $119.7 million in fiscal 2014.
Capital expenditures for our company-operated stores segment were $75.3 million in fiscal 2016 which included $30.6 million to open 46 company-operated stores, $85.8 million in fiscal 2015 which included $49.2 million to open 62 company-operated stores, and $76.9 million in fiscal 2014 which included $38.1 million to open 49 new company-operated stores. The remaining capital expenditures for our company-operated stores segment in each period were primarily for the remodeling or relocation of certain stores, and ongoing store refurbishment.
Capital expenditures for our direct to consumer segment were $11.5 million, $8.3 million, and $10.0 million in fiscal 2016, fiscal 2015, and fiscal 2014, respectively. The capital expenditures for our direct to consumer segment in fiscal 2016 were primarily related to our global website redesign as well as mobile website enhancements, and in fiscal 2015 and 2014 were primarily related to website enhancements and country and region specific website launches.
Capital expenditures related to corporate activities and other were $62.7 million, $49.4 million, and $32.9 million in fiscal 2016, fiscal 2015, and fiscal 2014, respectively. During the second quarter of fiscal 2016, we purchased a land parcel in Vancouver, BC for general corporate purposes for $19.7 million. The capital expenditures in each period for corporate activities and other were for investments in information technology and business systems, improvements at our head office and other corporate buildings, and for capital expenditures related to opening retail locations other than company-operated stores.
Capital expenditures are expected to range between $170 million and $175 million in fiscal 2017.
Financing Activities
Cash flows used in or provided by financing activities consist primarily of cash used to repurchase shares of our common stock and certain cash flows related to stock-based compensation.
Cash used in financing activities decreased $248.4 million, to $25.3 million in fiscal 2016 from $273.7 million in fiscal 2015. Cash used in financing activities increased $124.6 million, to $273.7 million in fiscal 2015 from $149.1 million in fiscal 2014. The primary cause of these changes in cash used in financing activities was our stock repurchase program.
On June 11, 2014, our board of directors approved a program to repurchase shares of our common stock up to an aggregate value of $450.0 million. This stock repurchase program was completed during the second quarter of fiscal 2016. On December 1, 2016, our board of directors approved a program to repurchase shares of our common stock up to an aggregate value of $100.0 million.
During the fiscal years ended January 29, 2017, January 31, 2016, and February 1, 2015, 0.5 million, 5.0 million, and 3.7 million shares, respectively, were repurchased under the programs at a total cost of $29.3 million, $274.2 million, and $147.4 million, respectively.
We believe that our cash and cash equivalent balances, cash generated from operations, and borrowings available to us under our revolving credit facility will be adequate to meet our liquidity needs and capital expenditure requirements for at least the next 12 months. Our cash from operations may be negatively impacted by a decrease in demand for our products as well as the other factors described in "Item 1A. Risk Factors". In addition, we may make discretionary capital improvements with respect to our stores, distribution facilities, headquarters, or systems, which we would expect to fund through the use of cash, issuance of debt or equity securities or other external financing sources to the extent we were unable to fund such capital expenditures out of our cash and cash equivalents and cash generated from operations.

31
Revolving Credit Facility
On December 15, 2016, we entered into a credit agreement for $150.0 million under an unsecured five-year revolving credit facility. Bank of America, N.A., is administrative agent and HSBC Bank Canada is the syndication agent and letter of credit issuer, and the lenders party thereto. Borrowings under the revolving credit facility may be made, in U.S. Dollars, Euros, Canadian Dollars, and in other currencies, subject to the approval of the administrative agent and the lenders. Up to $35.0 million of the revolving credit facility is available for the issuance of letters of credit and up to $25.0 million is available for the issuance of swing line loans. Commitments under the revolving credit facility may be increased by up to $200.0 million, subject to certain conditions, including the approval of the lenders. Borrowings under the agreement may be prepaid and commitments may be reduced or terminated without premium or penalty (other than customary breakage costs). The principal amount outstanding under the credit agreement will be due and payable in full on December 15, 2021, subject to provisions that permit us to request a limited number of one year extensions annually.
Borrowings made under the revolving credit facility bear interest at a rate per annum equal to, at our option, either (a) a rate based on the rates applicable for deposits on the interbank market for U.S. Dollars or the applicable currency in which the borrowings are made ("LIBOR") or (b) an alternate base rate, plus, in each case, an applicable margin. The applicable margin is determined by reference to a pricing grid, based on the ratio of indebtedness to earnings before interest, tax depreciation, amortization and rent ("EBITDAR") and ranges between 1.00%-1.75% for LIBOR loans and 0.00%-0.75% for alternate base rate loans. Additionally, a commitment fee of between 0.125%-0.200%, also determined by reference to the pricing grid, is payable on the average daily unused amounts under the revolving credit facility.
The credit agreement contains negative covenants that, among other things and subject to certain exceptions, limit the ability of our subsidiaries to incur indebtedness, incur liens, undergo fundamental changes, make dispositions of all or substantially all of their assets, alter their businesses and enter into agreements limiting subsidiary dividends and distributions.
We are also required to maintain a consolidated rent-adjusted leverage ratio of not greater than 3.50:1.00 and we are not permitted to allow the ratio of consolidated EBITDAR to consolidated interest charges (plus rent) to be less than 2.00:1.00. The credit agreement also contains certain customary representations, warranties, affirmative covenants, and events of default (including, among others, an event of default upon the occurrence of a change of control). If an event of default occurs, the credit agreement may be terminated and the maturity of any outstanding amounts may be accelerated.
As of January 29, 2017, aside from letters of credit of $0.8 million, we had no other borrowings outstanding under this credit facility.
Contractual Obligations and Commitments
Leases. We lease certain store and other retail locations, distribution centers, offices, and equipment under non-cancelable operating leases. Our leases generally have initial terms of between five and 10 years, and generally can be extended only in five-year increments, if at all. Our leases expire at various dates between one and 15 years, excluding extensions at our option. A substantial number of our leases include renewal options and certain of our leases include rent escalation clauses, rent holidays and leasehold rental incentives, none of which are reflected in the table below. The majority of our leases for store premises also include contingent rental payments based on sales, the impact of which also are not reflected in the table below.
Product Purchase Obligations. The amounts listed for product purchase obligations in the table below represent agreements (including open purchase orders) to purchase products in the ordinary course of business that are enforceable and legally binding and that specify all significant terms. In some cases, prices are subject to change throughout the production process. The reported amounts exclude product purchase liabilities included in accounts payable and accrued inventory liabilities as of January 29, 2017.
The following table summarizes our contractual arrangements as of January 29, 2017, and the timing and effect that such commitments are expected to have on our liquidity and cash flows in future periods:
Payments Due by Fiscal Year Total 2017 2018 2019 2020 2021 Thereafter (In thousands)
Operating leases (minimum rent) . . . $ 518,613 $ 118,897 $ 106,496 $ 94,085 $ 71,973 $ 45,019 $ 82,143Product purchase obligations. . . . . . . $ 176,312 $ 176,312 $ — $ — $ — $ — $ —
Off-Balance Sheet Arrangements
We enter into standby letters of credit to secure certain of our obligations, including leases, taxes and duties. As of January 29, 2017, letters of credit totaling $0.8 million had been issued.

32
We have not entered into any transactions, agreements or other contractual arrangements to which an entity unconsolidated with us is a party and under which we have (i) any obligation under a guarantee, (ii) any retained or contingent interest in assets transferred to an unconsolidated entity that serves as credit, liquidity or market risk support to such entity, (iii) any obligation under derivative instruments that are indexed to our shares and classified as equity in our consolidated balance sheets, or (iv) any obligation arising out of a variable interest in any unconsolidated entity that provides financing, liquidity, market risk or credit support to us or engages in leasing, hedging or research and development services with us.
Critical Accounting Policies and Estimates
The preparation of financial statements in conformity with U.S. generally accepted accounting principles requires management to make estimates and assumptions. Predicting future events is inherently an imprecise activity and, as such, requires the use of judgment. Actual results may vary from our estimates in amounts that may be material to the financial statements. An accounting policy is deemed to be critical if it requires an accounting estimate to be made based on assumptions about matters that are highly uncertain at the time the estimate is made, and if different estimates that reasonably could have been used or changes in the accounting estimates that are reasonably likely to occur periodically, could materially impact our consolidated financial statements.
We believe that the following critical accounting policies affect our more significant estimates and judgments used in the preparation of our consolidated financial statements:
Revenue Recognition. Net revenue is recognized net of sales taxes, discounts, and an estimated allowance for sales returns. Sales to customers through company-operated stores and other physical locations are recognized at the point of sale, net of an estimated allowance for sales returns. Direct to consumer sales are recognized once delivery has occurred and collection is reasonably assured, net of an estimated allowance for sales returns. Other net revenue includes outlet sales, showroom sales, sales from temporary locations, sales to wholesale accounts, warehouse sales, and license and supply arrangement net revenue, which consists of royalties as well as sales of our product to licensees. Revenue is recognized when these sales occur. Employee discounts are classified as a reduction of net revenue.
Our estimated allowance for sales returns is a subjective critical estimate that has a direct impact on reported net revenue. This allowance is calculated based on a history of actual returns, estimated future returns and any significant future known or anticipated events. Consideration of these factors results in an estimated allowance for sales returns. Our standard terms for retail sales limit returns to approximately 14 days after the sale of the merchandise, however we accept returns after 14 days where the product fails to meet our guests' quality expectations.
Revenue from our gift cards is recognized when tendered for payment, or upon redemption. Outstanding customer balances are included in "Unredeemed gift card liability" on the consolidated balance sheets. There are no expiration dates on our gift cards, and we do not charge any service fees that cause a decrement to customer balances.
While we will continue to honor all gift cards presented for payment, we may determine the likelihood of redemption to be remote for certain card balances due to, among other things, long periods of inactivity. In these circumstances, to the extent we determine there is no requirement for remitting card balances to government agencies under unclaimed property laws, card balances may be recognized in the consolidated statements of operations in net revenue. The amount recognized is an estimate, based on historical customer redemption rates.
Inventory. Inventory is valued at the lower of cost and market. We periodically review our inventories and make provisions as necessary to appropriately value goods that are obsolete, have quality issues, or are damaged. The amount of the provision is equal to the difference between the cost of the inventory and its net realizable value based upon assumptions about future demand, selling prices, and market conditions. If changes in market conditions result in reductions in the estimated net realizable value of our inventory below our previous estimate, we would increase our reserve in the period in which we made such a determination. In addition, we provide for inventory shrinkage as a percentage of sales, based on historical trends from actual physical inventories. Inventory shrinkage estimates are made to reduce the inventory value for lost or stolen items. We perform physical inventory counts throughout the year and adjust the shrink provision accordingly.

33
Property and Equipment. Property and equipment are recorded at cost less accumulated depreciation. Buildings are depreciated on a straight-line basis over the expected useful life of the asset, which we estimate to be 20 years. Leasehold improvements are depreciated on a straight-line basis over the lesser of the length of the lease and the estimated useful life of the assets, up to a maximum of five years. All other property and equipment is depreciated using the declining balance method as follows:
Furniture and fixtures . . . . . . . . . . . . . . . . . . . . . . . . . . . . . . . . . . . . . . . . . . . . . . . . . . . . . . . . . . . . . . . . . . . . . . . 20%Computer hardware and software. . . . . . . . . . . . . . . . . . . . . . . . . . . . . . . . . . . . . . . . . . . . . . . . . . . . . . . . . . . . . . 20% - 30%Equipment and vehicles . . . . . . . . . . . . . . . . . . . . . . . . . . . . . . . . . . . . . . . . . . . . . . . . . . . . . . . . . . . . . . . . . . . . . 30%
Changes in circumstances (such as technological advances) can result in differences between the actual and estimated useful lives. In those cases where we determine that the useful life of a long-lived asset should be shortened, we increase depreciation expense over the remaining useful life to depreciate the asset's net book value to its estimated salvage value.
Long-Lived Assets. Long-lived assets, including intangible assets with finite useful lives are evaluated for impairment when the occurrence of events or changes in circumstances indicates that the carrying value of the assets may not be recoverable as measured by comparing their net book value to the undiscounted estimated future cash flows generated by their use and eventual disposition. Impaired assets are recorded at fair value, determined principally by the present value of the estimated future cash flows expected from their use and eventual disposition.
Income Taxes. Deferred income tax assets and liabilities are determined based on the temporary differences between the carrying amounts and the tax basis of assets and liabilities, and for tax losses, tax credit carry forwards, and other tax attributes, using the enacted tax rates that are to be in effect when these differences are expected to reverse.
Deferred income tax liabilities are provided for U.S. income taxes on the undistributed earnings of foreign subsidiaries, unless those earnings can be distributed on a tax-free basis or if the earnings are indefinitely reinvested. We determine on a regular basis the amount of undistributed earnings that will be indefinitely reinvested in our non-U.S. operations. This assessment is based on the cash flow projections and operational and fiscal objectives of each of our U.S. and foreign subsidiaries. Such estimates are inherently imprecise since many assumptions used in the projections are subject to revision. The possibility exists that amounts determined to be indefinitely reinvested outside of the U.S. may ultimately be repatriated.
U.S. income and foreign withholding taxes have not been provided on approximately $852.3 million of cumulative undistributed earnings of a Canadian subsidiary as of January 29, 2017. These earnings are indefinitely reinvested outside of the United States. Income taxes of approximately $38.4 million would be incurred if these earnings were repatriated to the United States.
As of January 29, 2017, we had cash and cash equivalents of $559.5 million outside of the United States. We do not intend to repatriate these funds to the United States.
We evaluate our tax filing positions and recognize the largest amount of tax benefit that is considered more likely than not to be sustained upon examination by the relevant taxing authorities based on the technical merits of the position. This determination requires the use of significant judgment. Income tax expense is adjusted in the period in which an uncertain tax position is effectively settled, the statute of limitations expires, facts or circumstances change, tax laws change, or new information becomes available.
Our tax positions include intercompany transfer pricing policies and the associated taxable income and deductions arising from intercompany charges between subsidiaries within the consolidated group. Although we believe that our intercompany transfer pricing policies and tax positions are reasonable, the final outcomes of tax audits or potential tax disputes may be materially different from that which is reflected in our income tax provisions and accruals.
Goodwill and Intangible Assets. Intangible assets are recorded at cost. Reacquired franchise rights are amortized on a straight-line basis over their estimated useful lives of 10 years. Goodwill represents the excess of the purchase price over the fair market value of identifiable net assets acquired and is not amortized. Goodwill is tested for impairment annually or more frequently when an event or circumstance indicates that goodwill might be impaired. Goodwill impairment testing requires us to estimate the fair value of our reporting units. We generally base our measurement of the fair value on the present value of future cash flows. Our significant estimates in the discounted cash flows model include the discount rate and long-term rates of growth. We use our best estimates and judgment based on available evidence in conducting the impairment testing.
Stock-Based Compensation. We account for stock-based compensation using the fair value method. The fair value of awards granted is estimated at the date of grant and is recognized as employee compensation expense on a straight-line basis over the requisite service period. For awards with service and/or performance conditions, the amount of compensation expense recognized is based on the number of awards that are expected to vest.

34
The estimation of the number of stock awards that will ultimately vest requires judgment, and to the extent actual results differ from our estimates, such amounts will be recorded as a cumulative adjustment in the period estimates are revised. We consider several factors when estimating the number of awards which are expected to vest, including, future profit forecasts, types of awards, size of option holder group, and anticipated employee retention. Actual results may differ substantially from these estimates.
The calculation of the grant-date fair value of stock options requires us to make certain estimates and assumptions, including, stock price volatility, and the expected life of the options. We evaluate and revise these estimates and assumptions as necessary, to reflect market conditions and our historical experience. The expected term of the options is based upon historical experience of similar awards, giving consideration to expectations of future employee behavior. Expected volatility is based upon the historical volatility of our common stock for the period corresponding with the expected term of the options. In the future, the expected volatility and expected term may change which could substantially change the grant-date fair value of future awards of stock options and, ultimately, the expense we record.
Contingencies. In the ordinary course of business, we are involved in legal proceedings regarding contractual and employment relationships and a variety of other matters. We record contingent liabilities resulting from claims against us, when a loss is assessed to be probable and the amount of the loss is reasonably estimable. Assessing probability of loss and estimating probable losses requires analysis of multiple factors, including in some cases judgments about the potential actions of third-party claimants and courts.
ITEM 7A. QUANTITATIVE AND QUALITATIVE DISCLOSURES ABOUT MARKET RISK
Market risk represents the risk of loss that may impact our financial position due to adverse changes in financial market prices and rates. Our market risk exposure is primarily a result of fluctuations in interest rates and foreign currency exchange rates. We do not hold or issue financial instruments for trading purposes.
Foreign Currency Exchange Risk. The functional currency of our foreign subsidiaries is generally the applicable local currency. Our consolidated financial statements are presented in U.S. dollars. Therefore, the net revenue, expenses, assets, and liabilities of our foreign subsidiaries are translated from their functional currencies into U.S. dollars. Fluctuations in the value of the U.S. dollar affect the reported amounts of net revenue, expenses, assets, and liabilities. Foreign exchange differences which arise on translation of our foreign subsidiaries' balance sheets into U.S. dollars are recorded as a foreign currency translation adjustment in accumulated other comprehensive income or loss within stockholders' equity.
We also have exposure to changes in foreign exchange rates associated with transactions which are undertaken by our subsidiaries in currencies other than their functional currency. Such transactions include intercompany transactions and inventory purchases denominated in currencies other than the functional currency of the purchasing entity. As a result, we have been impacted by changes in exchange rates and may be impacted for the foreseeable future. The potential impact of currency fluctuation increases as our international expansion increases.
We currently generate a significant portion of our net revenue and incur a significant portion of our expenses in Canada. We also hold a significant portion of our net assets in Canada. The reporting currency for our consolidated financial statements is the U.S. dollar. A weakening of the U.S. dollar against the Canadian dollar results in:
• an increase in our net revenue upon translation of the sales made by our Canadian operations into U.S. dollars for the purposes of consolidation;
• an increase in our selling, general and administrative expenses incurred by our Canadian operations upon translation into U.S. dollars for the purposes of consolidation; and
• foreign exchange revaluation losses by our Canadian subsidiaries on U.S. dollar cash and receivables denominated in U.S. dollars.
During fiscal 2016, the change in the relative value of the U.S. dollar against the Canadian dollar resulted in a $41.7 million reduction in accumulated other comprehensive loss within stockholders' equity. During fiscal 2015, the change in the relative value of the U.S. dollar against the Canadian dollar resulted in a $63.2 million increase in accumulated other comprehensive loss within stockholders' equity.
A 10% appreciation in the relative value of the U.S. dollar against the Canadian dollar compared to the exchange rates in effect for fiscal 2016 would have resulted in additional income from operations of approximately $0.2 million in fiscal 2016. This assumes a consistent 10% appreciation in the U.S. dollar against the Canadian dollar throughout the fiscal year. The timing of changes in the relative value of the U.S. dollar combined with the seasonal nature of our business, can affect the magnitude of the impact that fluctuations in foreign exchange rates have on our income from operations.
35
We have not historically hedged foreign currency fluctuations. However, in the future, in an effort to mitigate these risks, we may at times enter into derivative financial instruments, although we have not historically done so. We do not, and do not intend to, engage in the practice of trading derivative securities for profit.
Interest Rate Risk. Our revolving credit facility, which is described in Note 8 to the consolidated financial statements included in Item 8 of Part II of this report, provide us with available borrowings in an amount up to $150.0 million in the aggregate. Because our revolving credit facility bears interest at a variable rate, we will be exposed to market risks relating to changes in interest rates, if we have a meaningful outstanding balance. As of January 29, 2017, aside from letters of credit of $0.8 million, we had no other borrowings outstanding under this credit facility. We currently do not engage in any interest rate hedging activity and currently have no intention to do so. However, in the future, if we have a meaningful outstanding balance under our revolving facility, in an effort to mitigate losses associated with these risks, we may at times enter into derivative financial instruments, although we have not historically done so. These may take the form of forward contracts, option contracts, or interest rate swaps. We do not, and do not intend to, engage in the practice of trading derivative securities for profit.
Inflation
Inflationary factors such as increases in the cost of our product and overhead costs may adversely affect our operating results. Although we do not believe that inflation has had a material impact on our financial position or results of operations to date, a high rate of inflation in the future may have an adverse effect on our ability to maintain current levels of gross margin and selling, general and administrative expenses as a percentage of net revenue if the selling prices of our products do not increase with these increased costs.

36
ITEM 8. FINANCIAL STATEMENTS AND SUPPLEMENTARY DATA
lululemon athletica inc.INDEX TO CONSOLIDATED FINANCIAL STATEMENTS
Report of Independent Registered Public Accounting Firm . . . . . . . . . . . . . . . . . . . . . . . . . . . . . . . . . . . . . . . . . . . . . . . . .Consolidated Balance Sheets . . . . . . . . . . . . . . . . . . . . . . . . . . . . . . . . . . . . . . . . . . . . . . . . . . . . . . . . . . . . . . . . . . . . . . . . .Consolidated Statements of Operations and Comprehensive Income . . . . . . . . . . . . . . . . . . . . . . . . . . . . . . . . . . . . . . . . . .Consolidated Statements of Stockholders' Equity . . . . . . . . . . . . . . . . . . . . . . . . . . . . . . . . . . . . . . . . . . . . . . . . . . . . . . . . .Consolidated Statements of Cash Flows . . . . . . . . . . . . . . . . . . . . . . . . . . . . . . . . . . . . . . . . . . . . . . . . . . . . . . . . . . . . . . . .Index for Notes to the Consolidated Financial Statements . . . . . . . . . . . . . . . . . . . . . . . . . . . . . . . . . . . . . . . . . . . . . . . . . .
373839404243
37
REPORT OF INDEPENDENT REGISTERED PUBLIC ACCOUNTING FIRM
To the Stockholders of lululemon athletica inc.
We have audited the accompanying consolidated balance sheets of lululemon athletica inc. and its subsidiaries as of January 29, 2017 and January 31, 2016 and the related consolidated statements of operations and comprehensive income, stockholders' equity and cash flows for the 52-week periods ended January 29, 2017, January 31, 2016 and February 1, 2015. In addition, we have audited the financial statement schedule listed in the accompanying index appearing under Item 15(a)(2). We also have audited lululemon athletica inc. and its subsidiaries' internal control over financial reporting as of January 29, 2017, based on criteria established in Internal Control - Integrated Framework (2013) issued by the Committee of Sponsoring Organizations of the Treadway Commission (COSO). Management is responsible for these consolidated financial statements and financial statement schedule, for maintaining effective internal control over financial reporting and for its assessment of the effectiveness of internal control over financial reporting, included in the accompanying Management's Annual Report on Internal Control over Financial Reporting appearing under Item 9A. Our responsibility is to express an opinion on these consolidated financial statements, the financial statement schedule and the company's internal control over financial reporting based on our integrated audits.
We conducted our audits in accordance with the standards of the Public Company Accounting Oversight Board (United States). Those standards require that we plan and perform the audits to obtain reasonable assurance about whether the consolidated financial statements and the financial statement schedule are free of material misstatement and whether effective internal control over financial reporting was maintained in all material respects. Our audits of the consolidated financial statements included examining, on a test basis, evidence supporting the amounts and disclosures in the consolidated financial statements, assessing the accounting principles used and significant estimates made by management, as well as evaluating the overall consolidated financial statement presentation. Our audit of internal control over financial reporting included obtaining an understanding of internal control over financial reporting, assessing the risk that a material weakness exists, and testing and evaluating the design and operating effectiveness of internal control based on the assessed risk. Our audits also included performing such other procedures as we considered necessary in the circumstances. We believe that our audits provide a reasonable basis for our opinions.
A company's internal control over financial reporting is a process designed to provide reasonable assurance regarding the reliability of financial reporting and the preparation of financial statements for external purposes in accordance with generally accepted accounting principles. A company's internal control over financial reporting includes those policies and procedures that: (i) pertain to the maintenance of records that, in reasonable detail, accurately and fairly reflect the transactions and dispositions of the assets of the company; (ii) provide reasonable assurance that transactions are recorded as necessary to permit preparation of financial statements in accordance with generally accepted accounting principles, and that receipts and expenditures of the company are being made only in accordance with authorizations of management and directors of the company; and (iii) provide reasonable assurance regarding prevention or timely detection of unauthorized acquisition, use, or disposition of the company's assets that could have a material effect on the financial statements. Because of its inherent limitations, internal control over financial reporting may not prevent or detect misstatements. Also, projections of any evaluation of effectiveness to future periods are subject to the risk that controls may become inadequate because of changes in conditions, or that the degree of compliance with the policies or procedures may deteriorate.
In our opinion, the consolidated financial statements referred to above present fairly, in all material respects, the financial position of lululemon athletica inc. and its subsidiaries as of January 29, 2017 and January 31, 2016 and the results of their operations and their cash flows for the 52-week periods ended January 29, 2017, January 31, 2016, and February 1, 2015 in conformity with accounting principles generally accepted in the United States of America. In addition, in our opinion, the financial statement schedule listed in the index appearing under Item 15(a)(2) presents fairly, in all material respects, the information set forth therein when read in conjunction with the related consolidated financial statements. Also, in our opinion, lululemon athletica inc. and its subsidiaries maintained, in all material respects, effective internal control over financial reporting as of January 29, 2017, based on criteria established in Internal Control - Integrated Framework (2013) issued by COSO.
/s/ PricewaterhouseCoopers LLPChartered Professional AccountantsVancouver, British ColumbiaMarch 28, 2017
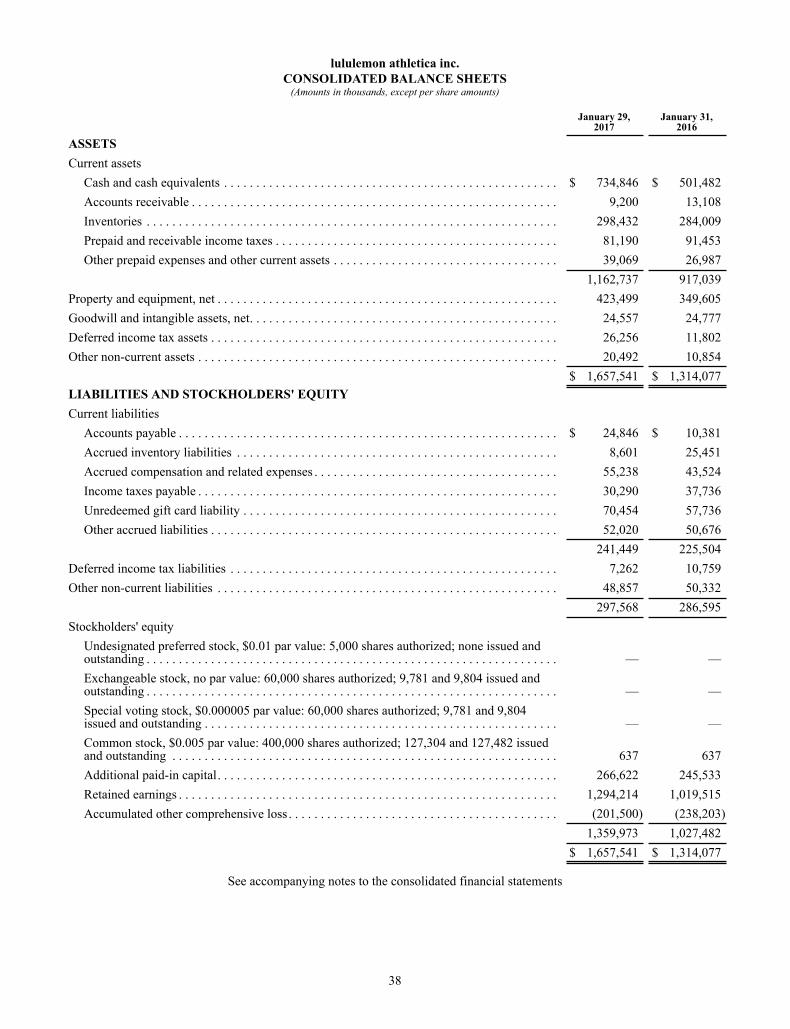
38
lululemon athletica inc.CONSOLIDATED BALANCE SHEETS
(Amounts in thousands, except per share amounts)
January 29,2017
January 31,2016
ASSETSCurrent assets
Cash and cash equivalents . . . . . . . . . . . . . . . . . . . . . . . . . . . . . . . . . . . . . . . . . . . . . . . . . . . . $ 734,846 $ 501,482Accounts receivable . . . . . . . . . . . . . . . . . . . . . . . . . . . . . . . . . . . . . . . . . . . . . . . . . . . . . . . . . 9,200 13,108Inventories . . . . . . . . . . . . . . . . . . . . . . . . . . . . . . . . . . . . . . . . . . . . . . . . . . . . . . . . . . . . . . . . 298,432 284,009Prepaid and receivable income taxes . . . . . . . . . . . . . . . . . . . . . . . . . . . . . . . . . . . . . . . . . . . . 81,190 91,453Other prepaid expenses and other current assets . . . . . . . . . . . . . . . . . . . . . . . . . . . . . . . . . . . 39,069 26,987
1,162,737 917,039Property and equipment, net . . . . . . . . . . . . . . . . . . . . . . . . . . . . . . . . . . . . . . . . . . . . . . . . . . . . . 423,499 349,605Goodwill and intangible assets, net. . . . . . . . . . . . . . . . . . . . . . . . . . . . . . . . . . . . . . . . . . . . . . . . 24,557 24,777Deferred income tax assets . . . . . . . . . . . . . . . . . . . . . . . . . . . . . . . . . . . . . . . . . . . . . . . . . . . . . . 26,256 11,802Other non-current assets . . . . . . . . . . . . . . . . . . . . . . . . . . . . . . . . . . . . . . . . . . . . . . . . . . . . . . . . 20,492 10,854
$ 1,657,541 $ 1,314,077LIABILITIES AND STOCKHOLDERS' EQUITYCurrent liabilities
Accounts payable . . . . . . . . . . . . . . . . . . . . . . . . . . . . . . . . . . . . . . . . . . . . . . . . . . . . . . . . . . . $ 24,846 $ 10,381Accrued inventory liabilities . . . . . . . . . . . . . . . . . . . . . . . . . . . . . . . . . . . . . . . . . . . . . . . . . . 8,601 25,451Accrued compensation and related expenses . . . . . . . . . . . . . . . . . . . . . . . . . . . . . . . . . . . . . . 55,238 43,524Income taxes payable . . . . . . . . . . . . . . . . . . . . . . . . . . . . . . . . . . . . . . . . . . . . . . . . . . . . . . . . 30,290 37,736Unredeemed gift card liability . . . . . . . . . . . . . . . . . . . . . . . . . . . . . . . . . . . . . . . . . . . . . . . . . 70,454 57,736Other accrued liabilities . . . . . . . . . . . . . . . . . . . . . . . . . . . . . . . . . . . . . . . . . . . . . . . . . . . . . . 52,020 50,676
241,449 225,504Deferred income tax liabilities . . . . . . . . . . . . . . . . . . . . . . . . . . . . . . . . . . . . . . . . . . . . . . . . . . . 7,262 10,759Other non-current liabilities . . . . . . . . . . . . . . . . . . . . . . . . . . . . . . . . . . . . . . . . . . . . . . . . . . . . . 48,857 50,332
297,568 286,595Stockholders' equity
Undesignated preferred stock, $0.01 par value: 5,000 shares authorized; none issued andoutstanding . . . . . . . . . . . . . . . . . . . . . . . . . . . . . . . . . . . . . . . . . . . . . . . . . . . . . . . . . . . . . . . . — —Exchangeable stock, no par value: 60,000 shares authorized; 9,781 and 9,804 issued andoutstanding . . . . . . . . . . . . . . . . . . . . . . . . . . . . . . . . . . . . . . . . . . . . . . . . . . . . . . . . . . . . . . . . — —Special voting stock, $0.000005 par value: 60,000 shares authorized; 9,781 and 9,804issued and outstanding . . . . . . . . . . . . . . . . . . . . . . . . . . . . . . . . . . . . . . . . . . . . . . . . . . . . . . . — —Common stock, $0.005 par value: 400,000 shares authorized; 127,304 and 127,482 issuedand outstanding . . . . . . . . . . . . . . . . . . . . . . . . . . . . . . . . . . . . . . . . . . . . . . . . . . . . . . . . . . . . 637 637Additional paid-in capital. . . . . . . . . . . . . . . . . . . . . . . . . . . . . . . . . . . . . . . . . . . . . . . . . . . . . 266,622 245,533Retained earnings . . . . . . . . . . . . . . . . . . . . . . . . . . . . . . . . . . . . . . . . . . . . . . . . . . . . . . . . . . . 1,294,214 1,019,515Accumulated other comprehensive loss . . . . . . . . . . . . . . . . . . . . . . . . . . . . . . . . . . . . . . . . . . (201,500) (238,203)
1,359,973 1,027,482$ 1,657,541 $ 1,314,077
See accompanying notes to the consolidated financial statements
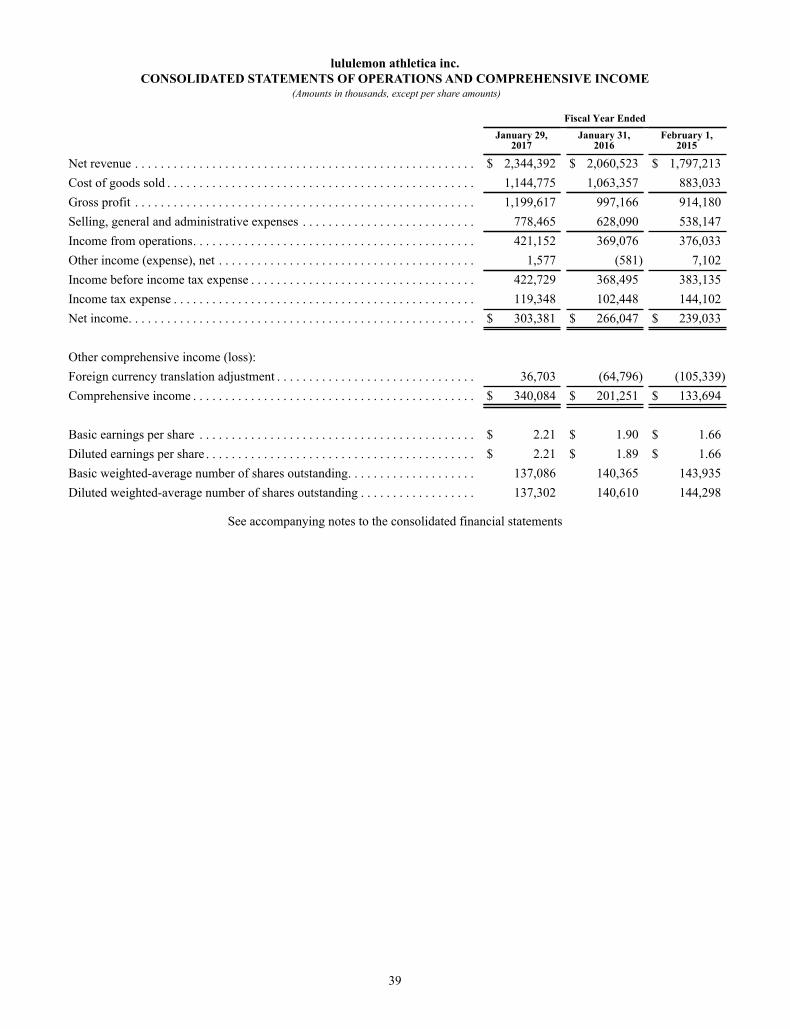
39
lululemon athletica inc.CONSOLIDATED STATEMENTS OF OPERATIONS AND COMPREHENSIVE INCOME
(Amounts in thousands, except per share amounts)
Fiscal Year EndedJanuary 29,
2017January 31,
2016February 1,
2015
Net revenue . . . . . . . . . . . . . . . . . . . . . . . . . . . . . . . . . . . . . . . . . . . . . . . . . . . . . $ 2,344,392 $ 2,060,523 $ 1,797,213Cost of goods sold . . . . . . . . . . . . . . . . . . . . . . . . . . . . . . . . . . . . . . . . . . . . . . . . 1,144,775 1,063,357 883,033Gross profit . . . . . . . . . . . . . . . . . . . . . . . . . . . . . . . . . . . . . . . . . . . . . . . . . . . . . 1,199,617 997,166 914,180Selling, general and administrative expenses . . . . . . . . . . . . . . . . . . . . . . . . . . . 778,465 628,090 538,147Income from operations. . . . . . . . . . . . . . . . . . . . . . . . . . . . . . . . . . . . . . . . . . . . 421,152 369,076 376,033Other income (expense), net . . . . . . . . . . . . . . . . . . . . . . . . . . . . . . . . . . . . . . . . 1,577 (581) 7,102Income before income tax expense . . . . . . . . . . . . . . . . . . . . . . . . . . . . . . . . . . . 422,729 368,495 383,135Income tax expense . . . . . . . . . . . . . . . . . . . . . . . . . . . . . . . . . . . . . . . . . . . . . . . 119,348 102,448 144,102Net income. . . . . . . . . . . . . . . . . . . . . . . . . . . . . . . . . . . . . . . . . . . . . . . . . . . . . . $ 303,381 $ 266,047 $ 239,033
Other comprehensive income (loss):Foreign currency translation adjustment . . . . . . . . . . . . . . . . . . . . . . . . . . . . . . . 36,703 (64,796) (105,339)Comprehensive income . . . . . . . . . . . . . . . . . . . . . . . . . . . . . . . . . . . . . . . . . . . . $ 340,084 $ 201,251 $ 133,694
Basic earnings per share . . . . . . . . . . . . . . . . . . . . . . . . . . . . . . . . . . . . . . . . . . . $ 2.21 $ 1.90 $ 1.66Diluted earnings per share . . . . . . . . . . . . . . . . . . . . . . . . . . . . . . . . . . . . . . . . . . $ 2.21 $ 1.89 $ 1.66Basic weighted-average number of shares outstanding. . . . . . . . . . . . . . . . . . . . 137,086 140,365 143,935Diluted weighted-average number of shares outstanding . . . . . . . . . . . . . . . . . . 137,302 140,610 144,298
See accompanying notes to the consolidated financial statements

40
lululemon athletica inc.CONSOLIDATED STATEMENTS OF STOCKHOLDERS' EQUITY
(Amounts in thousands)
Exchangeable
StockSpecial Voting
Stock Common Stock AdditionalPaid-inCapital
RetainedEarnings
AccumulatedOther
ComprehensiveIncome (Loss) TotalShares Shares
ParValue Shares
ParValue
Balance at February 2,2014 . . . . . . . . . . . . . . . 29,955 29,955 $ — 115,342 $ 577 $ 240,351 $ 923,822 $ (68,068) $ 1,096,682Net income. . . . . . . . . . 239,033 239,033Foreign currencytranslation adjustment . (105,339) (105,339)Common stock issuedupon exchange ofexchangeable shares. . . (20,122) (20,122) — 20,122 101 (101) —Stock-basedcompensation expense . 8,269 8,269Tax benefits fromstock-basedcompensation . . . . . . . . 413 413Common stock issuedupon settlement ofstock-basedcompensation . . . . . . . . 409 2 2,911 2,913Shares withheld relatedto net share settlementof stock-basedcompensation . . . . . . . . (104) (1) (4,971) (4,972)Repurchase of commonstock . . . . . . . . . . . . . . . (3,657) (18) (5,177) (142,236) (147,431)Balance at February 1,2015 . . . . . . . . . . . . . . . 9,833 9,833 $ — 132,112 $ 661 $ 241,695 $ 1,020,619 $ (173,407) $ 1,089,568Net income. . . . . . . . . . 266,047 266,047Foreign currencytranslation adjustment . (64,796) (64,796)Common stock issuedupon exchange ofexchangeable shares. . . (29) (29) — 29 — — —Stock-basedcompensation expense . 10,356 10,356Tax benefits fromstock-basedcompensation . . . . . . . . (1,202) (1,202)Common stock issuedupon settlement ofstock-basedcompensation . . . . . . . . 350 2 4,702 4,704Shares withheld relatedto net share settlementof stock-basedcompensation . . . . . . . . (50) — (2,857) (2,857)Repurchase of commonstock . . . . . . . . . . . . . . . (4,959) (26) (7,016) (267,151) (274,193)Registration feesassociated withprospectus supplement . (145) (145)Balance at January 31,2016 . . . . . . . . . . . . . . . 9,804 9,804 $ — 127,482 $ 637 $ 245,533 $ 1,019,515 $ (238,203) $ 1,027,482Net income. . . . . . . . . . 303,381 303,381Foreign currencytranslation adjustment . 36,703 36,703Common stock issuedupon exchange ofexchangeable shares. . . (23) (23) — 23 — — —Stock-basedcompensation expense . 16,822 16,822
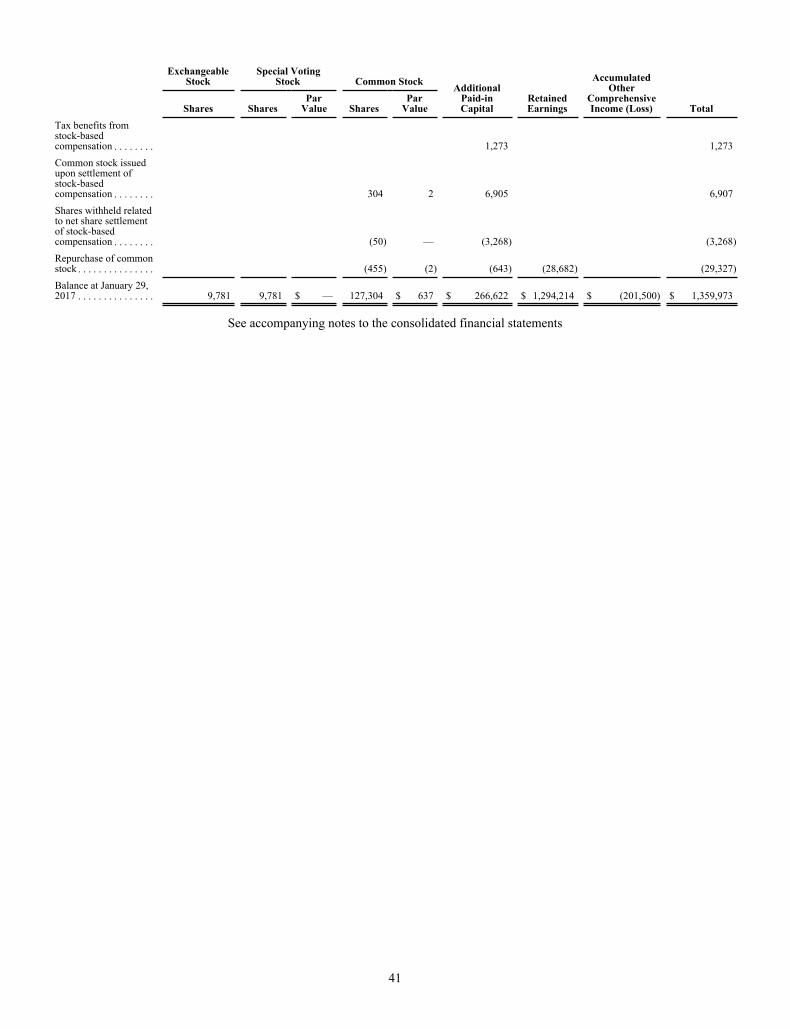
41
Exchangeable
StockSpecial Voting
Stock Common Stock AdditionalPaid-inCapital
RetainedEarnings
AccumulatedOther
ComprehensiveIncome (Loss) TotalShares Shares
ParValue Shares
ParValue
Tax benefits fromstock-basedcompensation . . . . . . . . 1,273 1,273Common stock issuedupon settlement ofstock-basedcompensation . . . . . . . . 304 2 6,905 6,907Shares withheld relatedto net share settlementof stock-basedcompensation . . . . . . . . (50) — (3,268) (3,268)Repurchase of commonstock . . . . . . . . . . . . . . . (455) (2) (643) (28,682) (29,327)Balance at January 29,2017 . . . . . . . . . . . . . . . 9,781 9,781 $ — 127,304 $ 637 $ 266,622 $ 1,294,214 $ (201,500) $ 1,359,973
See accompanying notes to the consolidated financial statements

42
lululemon athletica inc.CONSOLIDATED STATEMENTS OF CASH FLOWS
(Amounts in thousands)
Fiscal Year Ended
January 29,
2017January 31,
2016February 1,
2015
Cash flows from operating activitiesNet income . . . . . . . . . . . . . . . . . . . . . . . . . . . . . . . . . . . . . . . . . . . . . . . . . . . $ 303,381 $ 266,047 $ 239,033Items not affecting cash
Depreciation and amortization. . . . . . . . . . . . . . . . . . . . . . . . . . . . . . . . . . 87,697 73,383 58,364Stock-based compensation expense. . . . . . . . . . . . . . . . . . . . . . . . . . . . . . 16,822 10,356 8,269Derecognition of unredeemed gift card liability . . . . . . . . . . . . . . . . . . . . (4,548) (3,647) (1,468)Deferred income taxes . . . . . . . . . . . . . . . . . . . . . . . . . . . . . . . . . . . . . . . . (17,563) 11,142 2,087Tax benefits from stock-based compensation . . . . . . . . . . . . . . . . . . . . . . (1,273) 1,202 (413)
Changes in operating assets and liabilitiesInventories . . . . . . . . . . . . . . . . . . . . . . . . . . . . . . . . . . . . . . . . . . . . . . . . . (5,403) (83,286) (26,806)Prepaid and receivable income taxes . . . . . . . . . . . . . . . . . . . . . . . . . . . . . 11,537 (52,110) (15,234)Other prepaid expenses and other current assets . . . . . . . . . . . . . . . . . . . . (6,730) (3,816) (6,444)Accounts payable . . . . . . . . . . . . . . . . . . . . . . . . . . . . . . . . . . . . . . . . . . . . 14,080 1,247 (2,198)Accrued inventory liabilities . . . . . . . . . . . . . . . . . . . . . . . . . . . . . . . . . . . (18,900) 5,198 8,276Accrued compensation and related expenses. . . . . . . . . . . . . . . . . . . . . . . 9,943 14,937 11,561Income taxes payable. . . . . . . . . . . . . . . . . . . . . . . . . . . . . . . . . . . . . . . . . (10,020) 19,470 19,304Unredeemed gift card liability . . . . . . . . . . . . . . . . . . . . . . . . . . . . . . . . . . 16,010 16,574 11,326Other accrued liabilities . . . . . . . . . . . . . . . . . . . . . . . . . . . . . . . . . . . . . . . 467 19,563 3,788Other non-current assets and liabilities . . . . . . . . . . . . . . . . . . . . . . . . . . . (10,381) 2,480 5,004
Net cash provided by operating activities . . . . . . . . . . . . . . . . . . . . . . . . . . . . . . 385,119 298,740 314,449Cash flows from investing activities
Purchase of property and equipment . . . . . . . . . . . . . . . . . . . . . . . . . . . . . . . (149,511) (143,487) (119,733)Net cash used in investing activities . . . . . . . . . . . . . . . . . . . . . . . . . . . . . . . . . . (149,511) (143,487) (119,733)Cash flows from financing activities
Proceeds from settlement of stock-based compensation . . . . . . . . . . . . . . . . 6,907 4,704 2,913Tax benefits from stock-based compensation. . . . . . . . . . . . . . . . . . . . . . . . . 1,273 (1,202) 413Taxes paid related to net share settlement of stock-based compensation. . . . (3,268) (2,857) (4,972)Repurchase of common stock. . . . . . . . . . . . . . . . . . . . . . . . . . . . . . . . . . . . . (29,327) (274,193) (147,431)Registration fees associated with prospectus supplement . . . . . . . . . . . . . . . — (145) —Deferred debt financing costs . . . . . . . . . . . . . . . . . . . . . . . . . . . . . . . . . . . . . (923) — —
Net cash used in financing activities . . . . . . . . . . . . . . . . . . . . . . . . . . . . . . . . . . (25,338) (273,693) (149,077)Effect of exchange rate changes on cash. . . . . . . . . . . . . . . . . . . . . . . . . . . . . . . 23,094 (44,557) (79,809)Increase (decrease) in cash and cash equivalents . . . . . . . . . . . . . . . . . . . . . . . . 233,364 (162,997) (34,170)Cash and cash equivalents, beginning of period . . . . . . . . . . . . . . . . . . . . . . . . . $ 501,482 $ 664,479 $ 698,649Cash and cash equivalents, end of period . . . . . . . . . . . . . . . . . . . . . . . . . . . . . . $ 734,846 $ 501,482 $ 664,479
See accompanying notes to the consolidated financial statements

43
lululemon athletica inc.INDEX FOR NOTES TO THE CONSOLIDATED FINANCIAL STATEMENTS
Note 1 Nature of Operations and Basis of Presentation . . . . . . . . . . . . . . . . . . . . . . . . . . . . . . . . . . . . . . . . . . . . . . . . .Note 2 Summary of Significant Accounting Policies. . . . . . . . . . . . . . . . . . . . . . . . . . . . . . . . . . . . . . . . . . . . . . . . . . .Note 3 Inventories . . . . . . . . . . . . . . . . . . . . . . . . . . . . . . . . . . . . . . . . . . . . . . . . . . . . . . . . . . . . . . . . . . . . . . . . . . . . .Note 4 Property and Equipment . . . . . . . . . . . . . . . . . . . . . . . . . . . . . . . . . . . . . . . . . . . . . . . . . . . . . . . . . . . . . . . . . . .Note 5 Goodwill and Intangible Assets . . . . . . . . . . . . . . . . . . . . . . . . . . . . . . . . . . . . . . . . . . . . . . . . . . . . . . . . . . . . .Note 6 Other Accrued Liabilities . . . . . . . . . . . . . . . . . . . . . . . . . . . . . . . . . . . . . . . . . . . . . . . . . . . . . . . . . . . . . . . . . .Note 7 Other Non-Current Liabilities. . . . . . . . . . . . . . . . . . . . . . . . . . . . . . . . . . . . . . . . . . . . . . . . . . . . . . . . . . . . . . .Note 8 Long-Term Debt and Credit Facilities . . . . . . . . . . . . . . . . . . . . . . . . . . . . . . . . . . . . . . . . . . . . . . . . . . . . . . . .Note 9 Stockholders' Equity . . . . . . . . . . . . . . . . . . . . . . . . . . . . . . . . . . . . . . . . . . . . . . . . . . . . . . . . . . . . . . . . . . . . . .Note 10 Stock-Based Compensation and Benefit Plans. . . . . . . . . . . . . . . . . . . . . . . . . . . . . . . . . . . . . . . . . . . . . . . . . .Note 11 Earnings Per Share . . . . . . . . . . . . . . . . . . . . . . . . . . . . . . . . . . . . . . . . . . . . . . . . . . . . . . . . . . . . . . . . . . . . . . .Note 12 Commitments and Contingencies . . . . . . . . . . . . . . . . . . . . . . . . . . . . . . . . . . . . . . . . . . . . . . . . . . . . . . . . . . . .Note 13 Related Party Balances and Transactions . . . . . . . . . . . . . . . . . . . . . . . . . . . . . . . . . . . . . . . . . . . . . . . . . . . . . .Note 14 Supplemental Cash Flow Information . . . . . . . . . . . . . . . . . . . . . . . . . . . . . . . . . . . . . . . . . . . . . . . . . . . . . . . .Note 15 Income Taxes . . . . . . . . . . . . . . . . . . . . . . . . . . . . . . . . . . . . . . . . . . . . . . . . . . . . . . . . . . . . . . . . . . . . . . . . . . .Note 16 Segmented Financial Information. . . . . . . . . . . . . . . . . . . . . . . . . . . . . . . . . . . . . . . . . . . . . . . . . . . . . . . . . . . .Note 17 Quarterly Financial Information (Unaudited). . . . . . . . . . . . . . . . . . . . . . . . . . . . . . . . . . . . . . . . . . . . . . . . . . .
4444495050505151515255555757576162

44
lululemon athletica inc.NOTES TO THE CONSOLIDATED FINANCIAL STATEMENTS
1 NATURE OF OPERATIONS AND BASIS OF PRESENTATION
Nature of operations
lululemon athletica inc., a Delaware corporation, ("lululemon" and, together with its subsidiaries unless the context otherwise requires, the "Company") is engaged in the design, distribution, and retail of healthy lifestyle inspired athletic apparel, which is sold through a chain of company-operated stores, direct to consumer through e-commerce, outlets, showrooms, sales from temporary locations, sales to wholesale accounts, warehouse sales, and through license and supply arrangements. The Company operates stores in the United States, Canada, Australia, the United Kingdom, New Zealand, China, Hong Kong, Singapore, South Korea, Germany, Puerto Rico and Switzerland. There were 406, 363, and 302 company-operated stores in operation as of January 29, 2017, January 31, 2016, and February 1, 2015, respectively.
Basis of presentation
The consolidated financial statements have been presented in U.S. dollars and are prepared in accordance with United States generally accepted accounting principles ("GAAP").
The Company's fiscal year ends on the Sunday closest to January 31 of the following year, typically resulting in a 52 week year, but occasionally giving rise to an additional week, resulting in a 53 week year. Fiscal 2016, 2015, and 2014 were each 52 week years. Fiscal 2016, 2015, and 2014 ended on January 29, 2017, January 31, 2016, and February 1, 2015, respectively.
The Company's business is affected by the pattern of seasonality common to most retail apparel businesses. Historically, the Company has recognized a significant portion of its operating profit in the fourth fiscal quarter of each year as a result of increased net revenue during the holiday season.
2 SUMMARY OF SIGNIFICANT ACCOUNTING POLICIES
Principles of consolidation
The consolidated financial statements include the accounts of lululemon athletica inc. and its wholly-owned subsidiaries. All intercompany balances and transactions have been eliminated.
Cash and cash equivalents
Cash and cash equivalents consist of cash on hand, bank balances and short-term deposits with original maturities of three months or less. The Company has not experienced any losses related to these balances, and management believes its credit risk to be minimal.
Accounts receivable
Accounts receivable primarily arise out of sales to wholesale accounts, landlord lease inducements, and license and supply arrangements. The allowance for doubtful accounts represents management's best estimate of probable credit losses in accounts receivable. Receivables are written off against the allowance when management believes that the amount receivable will not be recovered. As of January 29, 2017, January 31, 2016, and February 1, 2015, the Company recorded an insignificant allowance for doubtful accounts.
Inventories
Inventories, consisting of finished goods, inventories in transit, and raw materials, are stated at the lower of cost and market value. Cost is determined using weighted-average costs. For finished goods, market is defined as net realizable value, and for raw materials, market is defined as replacement cost. Cost of inventories includes all costs incurred to deliver inventory to the Company's distribution centers including freight, non-refundable taxes, duty and other landing costs.
The Company makes provisions as necessary to appropriately value goods that are obsolete, have quality issues, or are damaged. The amount of the provision is equal to the difference between the cost of the inventory and its estimated net realizable value based upon assumptions about future demand, selling prices and market conditions. The Company wrote-off $16.1 million, $14.2 million, and $12.4 million of inventory in fiscal 2016, fiscal 2015, and fiscal 2014, respectively. In addition, the Company provides for inventory shrinkage based on historical trends from actual physical inventory counts.
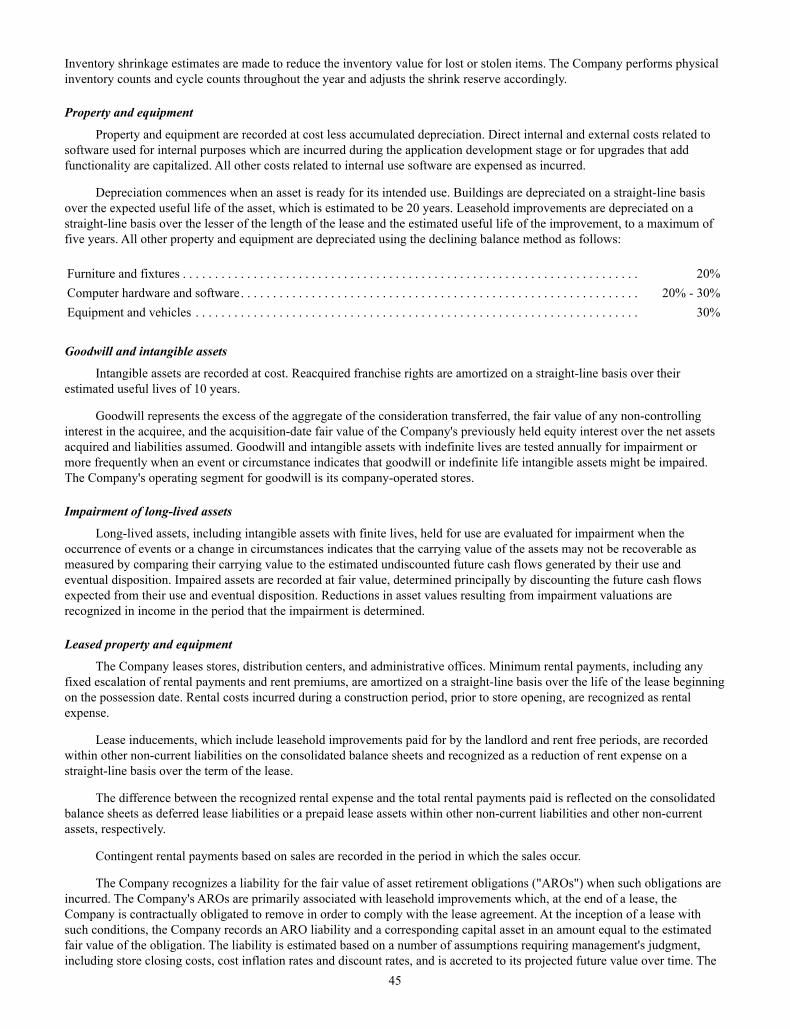
45
Inventory shrinkage estimates are made to reduce the inventory value for lost or stolen items. The Company performs physical inventory counts and cycle counts throughout the year and adjusts the shrink reserve accordingly.
Property and equipment
Property and equipment are recorded at cost less accumulated depreciation. Direct internal and external costs related to software used for internal purposes which are incurred during the application development stage or for upgrades that add functionality are capitalized. All other costs related to internal use software are expensed as incurred.
Depreciation commences when an asset is ready for its intended use. Buildings are depreciated on a straight-line basis over the expected useful life of the asset, which is estimated to be 20 years. Leasehold improvements are depreciated on a straight-line basis over the lesser of the length of the lease and the estimated useful life of the improvement, to a maximum of five years. All other property and equipment are depreciated using the declining balance method as follows:
Furniture and fixtures . . . . . . . . . . . . . . . . . . . . . . . . . . . . . . . . . . . . . . . . . . . . . . . . . . . . . . . . . . . . . . . . . . . . . . . 20%Computer hardware and software. . . . . . . . . . . . . . . . . . . . . . . . . . . . . . . . . . . . . . . . . . . . . . . . . . . . . . . . . . . . . . 20% - 30%Equipment and vehicles . . . . . . . . . . . . . . . . . . . . . . . . . . . . . . . . . . . . . . . . . . . . . . . . . . . . . . . . . . . . . . . . . . . . . 30%
Goodwill and intangible assets
Intangible assets are recorded at cost. Reacquired franchise rights are amortized on a straight-line basis over their estimated useful lives of 10 years.
Goodwill represents the excess of the aggregate of the consideration transferred, the fair value of any non-controlling interest in the acquiree, and the acquisition-date fair value of the Company's previously held equity interest over the net assets acquired and liabilities assumed. Goodwill and intangible assets with indefinite lives are tested annually for impairment or more frequently when an event or circumstance indicates that goodwill or indefinite life intangible assets might be impaired. The Company's operating segment for goodwill is its company-operated stores.
Impairment of long-lived assets
Long-lived assets, including intangible assets with finite lives, held for use are evaluated for impairment when the occurrence of events or a change in circumstances indicates that the carrying value of the assets may not be recoverable as measured by comparing their carrying value to the estimated undiscounted future cash flows generated by their use and eventual disposition. Impaired assets are recorded at fair value, determined principally by discounting the future cash flows expected from their use and eventual disposition. Reductions in asset values resulting from impairment valuations are recognized in income in the period that the impairment is determined.
Leased property and equipment
The Company leases stores, distribution centers, and administrative offices. Minimum rental payments, including any fixed escalation of rental payments and rent premiums, are amortized on a straight-line basis over the life of the lease beginning on the possession date. Rental costs incurred during a construction period, prior to store opening, are recognized as rental expense.
Lease inducements, which include leasehold improvements paid for by the landlord and rent free periods, are recorded within other non-current liabilities on the consolidated balance sheets and recognized as a reduction of rent expense on a straight-line basis over the term of the lease.
The difference between the recognized rental expense and the total rental payments paid is reflected on the consolidated balance sheets as deferred lease liabilities or a prepaid lease assets within other non-current liabilities and other non-current assets, respectively.
Contingent rental payments based on sales are recorded in the period in which the sales occur.
The Company recognizes a liability for the fair value of asset retirement obligations ("AROs") when such obligations are incurred. The Company's AROs are primarily associated with leasehold improvements which, at the end of a lease, the Company is contractually obligated to remove in order to comply with the lease agreement. At the inception of a lease with such conditions, the Company records an ARO liability and a corresponding capital asset in an amount equal to the estimated fair value of the obligation. The liability is estimated based on a number of assumptions requiring management's judgment, including store closing costs, cost inflation rates and discount rates, and is accreted to its projected future value over time. The

46
capitalized asset is depreciated using the convention for depreciation of leasehold improvement assets. Upon satisfaction of the ARO conditions, any difference between the recorded ARO liability and the actual retirement costs incurred is recognized as an operating gain or loss in the consolidated statements of operations.
The Company recognizes a liability for a cost associated with a lease exit or disposal activity when such obligation is incurred. A lease exit or disposal liability is measured initially at its fair value in the period in which the liability is incurred. The Company estimates fair value at the cease-use date of its operating leases as the remaining lease rentals, reduced by estimated sublease rentals that could be reasonably obtained for the property, even where the Company does not intend to enter into a sublease. Estimating the cost of certain lease exit costs involves subjective assumptions, including the time it would take to sublease the leased location and the related potential sublease income. The estimated accruals for these costs could be significantly affected if future experience differs from the assumptions used in the initial estimate.
Deferred revenue
Receipts from the sale of gift cards are treated as deferred revenue. Amounts received in respect of gift cards are recorded as an unredeemed gift card liability. Revenue from the Company's gift cards is recognized when tendered for payment, or upon redemption.
Revenue recognition
Net revenue is comprised of company-operated store net revenue, direct to consumer sales through www.lululemon.com, www.ivivva.com and other country and region specific websites, and other net revenue, which includes outlet sales, showroom sales, sales from temporary locations, sales to wholesale accounts, warehouse sales, and license and supply arrangement net revenue, which consists of royalties as well as sales of the Company's products to licensees.
All revenue is reported net of sales taxes collected for various governmental agencies.
Sales to customers through company-operated stores are recognized at the point of sale, net of discounts and an estimated allowance for sales returns. Sales of apparel to customers through the Company's retail websites are recognized when delivery has occurred, and collection is reasonably assured, net of an estimated allowance for sales returns. Sales of apparel to wholesale accounts are recognized when delivery has occurred and collection is reasonably assured.
Revenue from the Company's gift cards is recognized when tendered for payment, or upon redemption. Outstanding customer balances are included in unredeemed gift card liability on the consolidated balance sheets. There are no expiration dates on the Company's gift cards, and lululemon does not charge any service fees that cause a decrement to customer balances.
While the Company will continue to honor all gift cards presented for payment, management may determine the likelihood of redemption to be remote for certain card balances due to, among other things, long periods of inactivity. In these circumstances, to the extent management determines there is no requirement for remitting card balances to government agencies under unclaimed property laws, card balances may be recognized in the consolidated statements of operations in net revenue. For the years ended January 29, 2017, January 31, 2016, and February 1, 2015, net revenue recognized on unredeemed gift card balances was $4.5 million, $3.6 million, and $1.5 million, respectively.
Cost of goods sold
Cost of goods sold includes:• the cost of purchased merchandise, which includes acquisition and production costs including raw material and labor,
as applicable;
• the cost incurred to deliver inventory to the Company's distribution centers including freight, non-refundable taxes, duty, and other landing costs;
• the cost of the Company's distribution centers, such as labor, rent, utilities, and depreciation;
• the cost of the Company's production, design, distribution, and merchandising departments including salaries, stock-based compensation and benefits, and other expenses;
• occupancy costs such as minimum rent, contingent rent where applicable, property taxes, utilities, and depreciation expense for the Company's company-operated store locations;
• hemming; and
• shrink and inventory provision expense.

47
Selling, general and administrative expenses
Selling, general and administrative expenses consist of all operating costs not otherwise included in cost of goods sold. The Company's selling, general and administrative expenses include the costs of corporate and store-level wages and benefits, costs to transport the Company's products from the distribution facilities to the Company's sales locations and e-commerce guests, professional fees, marketing, information technology, human resources, accounting, legal, corporate facility and occupancy costs, and depreciation and amortization expense other than in cost of goods sold.
For the years ended January 29, 2017, January 31, 2016, and February 1, 2015, the Company incurred transportation costs of $44.9 million, $40.6 million, and $35.9 million, respectively.
Store pre-opening costs
Operating costs incurred prior to the opening of new stores are expensed as incurred as selling, general and administrative expenses.
Income taxes
The Company follows the liability method with respect to accounting for income taxes. Deferred income tax assets and liabilities are determined based on the temporary differences between the carrying amounts and the tax basis of assets and liabilities, and for tax losses, tax credit carry forwards, and other tax attributes. Deferred income tax assets and liabilities are measured using enacted tax rates that are expected to be in effect when these differences are anticipated to reverse.
Deferred income tax assets are reduced by a valuation allowance, if based on the weight of available evidence, it is more likely than not that some portion or all of the deferred tax assets will not be realized. The evaluation as to the likelihood of realizing the benefit of a deferred income tax asset is based on the timing of scheduled reversals of deferred tax liabilities, taxable income forecasts, and tax-planning strategies. The recognition of a deferred income tax asset is based upon several assumptions and forecasts, including current and anticipated taxable income, the utilization of previously unrealized non-operating loss carry forwards, and regulatory reviews of tax filings. Given the judgments and estimates required and the sensitivity of the results to the significant assumptions used, the Company believes the accounting estimates used in relation to the valuation of deferred income tax assets are subject to measurement uncertainty and are susceptible to a material change if the underlying assumptions change.
The Company provides for taxes at the enacted rate applicable for the appropriate tax jurisdiction. U.S. income taxes on undistributed earnings of foreign subsidiaries which the Company has determined to be indefinitely reinvested have not been recognized. Management periodically assesses the need to utilize these undistributed earnings to finance foreign operations. This assessment is based on the cash flow projections and operational and fiscal objectives of each of the Company's foreign subsidiaries. Such estimates are inherently imprecise since many assumptions utilized in the projections are subject to revision in the future.
The Company evaluates its tax filing positions and recognizes the largest amount of tax benefit that is considered more likely than not to be sustained upon examination by the relevant taxing authorities based on the technical merits of the position. This determination requires the use of significant judgment. Income tax expense is adjusted in the period in which an uncertain tax position is effectively settled, the statute of limitations expires, facts or circumstances change, tax laws change, or new information becomes available. The Company's policy is to recognize interest expense and penalties related to income tax matters as part of other income (expense), net. Accrued interest and penalties are included within the related tax liability on our consolidated balance sheets.
Currency translation
The functional currency for each entity included in these consolidated financial statements that is domiciled outside of the United States is generally the applicable local currency. Assets and liabilities of each foreign entity are translated into U.S. dollars at the exchange rate in effect on the balance sheet date. Net revenue and expenses are translated at the average rate in effect during the period. Unrealized translation gains and losses are recorded as a foreign currency translation adjustment, which is included in other comprehensive income or loss, which is a component of accumulated other comprehensive income or loss included in stockholders' equity.
Foreign currency transactions denominated in a currency other than an entity's functional currency are remeasured into the functional currency with any resulting gains and losses recognized in selling, general and administrative expenses, except for gains and losses arising on intercompany foreign currency transactions that are of a long-term investment nature, which are recorded as a foreign currency translation adjustment in other comprehensive income or loss.

48
The aggregate revaluation foreign exchange gains (losses) included in selling, general and administrative expenses amount to $(8.3) million, $12.0 million, and $6.4 million for the years ended January 29, 2017, January 31, 2016, and February 1, 2015, respectively.
Fair value of financial instruments
The Company's financial instruments consist of cash and cash equivalents, accounts receivable, accounts payable, accrued liabilities, and other liabilities. Unless otherwise noted, it is management's opinion that the Company is not exposed to significant interest or credit risks arising from these financial instruments. The fair value of these financial instruments approximates their carrying value, unless otherwise noted.
Concentration of credit risk
The Company is not exposed to significant credit risk on its cash and cash equivalents and accounts receivable. Cash and cash equivalents are held with high quality financial institutions. Accounts receivable are primarily from wholesale accounts, for landlord lease inducements, and from license and supply arrangements. The Company does not require collateral to support the accounts receivable; however, in certain circumstances, the Company may require parties to provide payment for goods prior to delivery of the goods. The accounts receivable are net of an allowance for doubtful accounts, which is established based on management's assessment of the credit risk of the underlying accounts.
Stock-based compensation
The Company accounts for stock-based compensation using the fair value method. The fair value of awards granted is estimated at the date of grant and is recognized as employee compensation expense on a straight-line basis over the requisite service period with the offsetting credit to additional paid-in capital. For awards with service and/or performance conditions, the amount of compensation expense recognized is based on the number of awards expected to vest and is adjusted to reflect those awards that do ultimately vest. For awards with performance conditions, the Company recognizes the compensation expense if and when the Company concludes that it is probable that the performance condition will be achieved. The Company reassesses the probability of achieving the performance condition at each reporting date. The fair value of each stock option granted is estimated on the award date using the Black-Scholes model, and the fair value of the restricted shares, performance-based restricted stock units, and restricted stock units is based on the closing price of the Company's common stock on the award date.
Earnings per share
Earnings per share is calculated using the weighted-average number of common and exchangeable shares outstanding during the period. Exchangeable shares are the equivalent of common shares in all material respects. All classes of stock have in effect the same rights and share equally in undistributed net income. Diluted earnings per share is calculated by dividing net income available to stockholders for the period by the diluted weighted-average number of shares outstanding during the period. Diluted earnings per share reflects the potential dilution from common shares issuable through stock options, performance-based restricted stock units that have satisfied their performance factor, restricted shares, and restricted stock units using the treasury stock method.
Contingencies
In the ordinary course of business, the Company is involved in legal proceedings regarding contractual and employment relationships and a variety of other matters. The Company records contingent liabilities resulting from claims against us, when a loss is assessed to be probable and the amount of the loss is reasonably estimable.
Use of estimates
The preparation of financial statements in conformity with GAAP in the United States requires management to make estimates and assumptions that affect the reported amounts of assets and liabilities and the disclosure of contingent assets and liabilities at the date of the financial statements as well as the reported amounts of net revenue and expenses during the reporting period. Actual results could differ from those estimates.
Recent accounting pronouncements
In May 2014, the Financial Accounting Standards Board ("FASB") issued ASC Topic 606, Revenue from Contracts with Customers ("ASC 606"), which supersedes the revenue recognition requirements in ASC Topic 605 Revenue Recognition, including most industry-specific revenue recognition guidance throughout the Industry Topics of the Codification. This guidance requires that an entity recognize revenue to depict the transfer of promised goods or services to customers in an
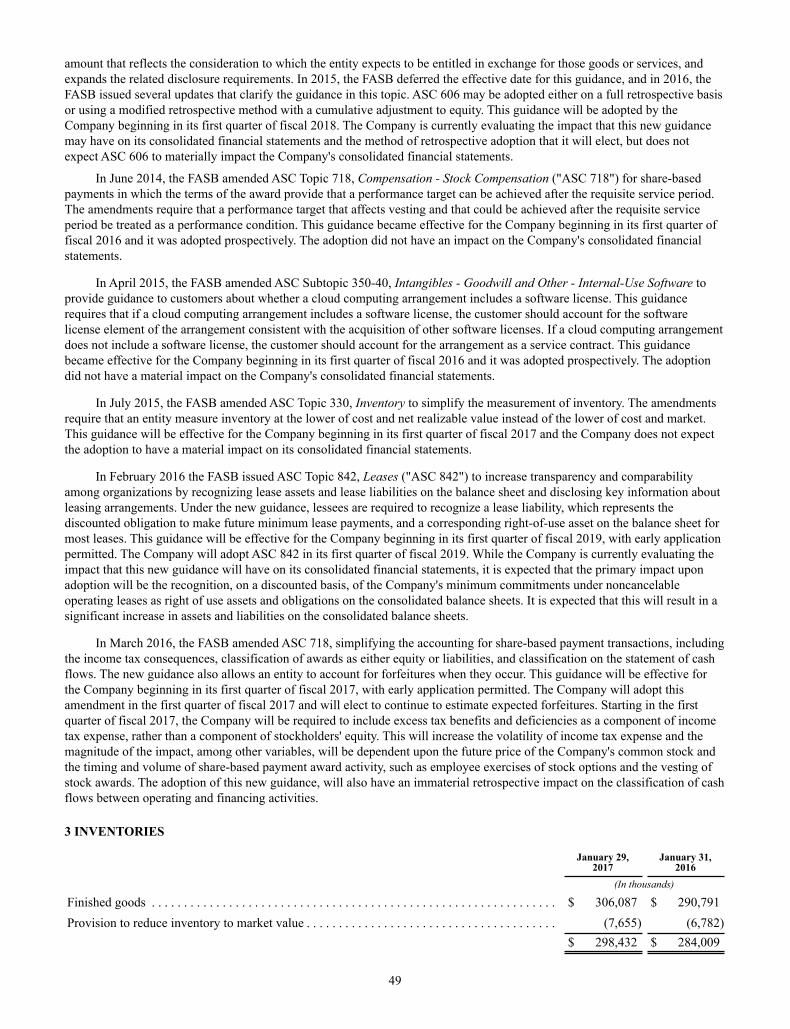
49
amount that reflects the consideration to which the entity expects to be entitled in exchange for those goods or services, and expands the related disclosure requirements. In 2015, the FASB deferred the effective date for this guidance, and in 2016, the FASB issued several updates that clarify the guidance in this topic. ASC 606 may be adopted either on a full retrospective basis or using a modified retrospective method with a cumulative adjustment to equity. This guidance will be adopted by the Company beginning in its first quarter of fiscal 2018. The Company is currently evaluating the impact that this new guidance may have on its consolidated financial statements and the method of retrospective adoption that it will elect, but does not expect ASC 606 to materially impact the Company's consolidated financial statements.
In June 2014, the FASB amended ASC Topic 718, Compensation - Stock Compensation ("ASC 718") for share-based payments in which the terms of the award provide that a performance target can be achieved after the requisite service period. The amendments require that a performance target that affects vesting and that could be achieved after the requisite service period be treated as a performance condition. This guidance became effective for the Company beginning in its first quarter of fiscal 2016 and it was adopted prospectively. The adoption did not have an impact on the Company's consolidated financial statements.
In April 2015, the FASB amended ASC Subtopic 350-40, Intangibles - Goodwill and Other - Internal-Use Software to provide guidance to customers about whether a cloud computing arrangement includes a software license. This guidance requires that if a cloud computing arrangement includes a software license, the customer should account for the software license element of the arrangement consistent with the acquisition of other software licenses. If a cloud computing arrangement does not include a software license, the customer should account for the arrangement as a service contract. This guidance became effective for the Company beginning in its first quarter of fiscal 2016 and it was adopted prospectively. The adoption did not have a material impact on the Company's consolidated financial statements.
In July 2015, the FASB amended ASC Topic 330, Inventory to simplify the measurement of inventory. The amendments require that an entity measure inventory at the lower of cost and net realizable value instead of the lower of cost and market. This guidance will be effective for the Company beginning in its first quarter of fiscal 2017 and the Company does not expect the adoption to have a material impact on its consolidated financial statements.
In February 2016 the FASB issued ASC Topic 842, Leases ("ASC 842") to increase transparency and comparability among organizations by recognizing lease assets and lease liabilities on the balance sheet and disclosing key information about leasing arrangements. Under the new guidance, lessees are required to recognize a lease liability, which represents the discounted obligation to make future minimum lease payments, and a corresponding right-of-use asset on the balance sheet for most leases. This guidance will be effective for the Company beginning in its first quarter of fiscal 2019, with early application permitted. The Company will adopt ASC 842 in its first quarter of fiscal 2019. While the Company is currently evaluating the impact that this new guidance will have on its consolidated financial statements, it is expected that the primary impact upon adoption will be the recognition, on a discounted basis, of the Company's minimum commitments under noncancelable operating leases as right of use assets and obligations on the consolidated balance sheets. It is expected that this will result in a significant increase in assets and liabilities on the consolidated balance sheets.
In March 2016, the FASB amended ASC 718, simplifying the accounting for share-based payment transactions, including the income tax consequences, classification of awards as either equity or liabilities, and classification on the statement of cash flows. The new guidance also allows an entity to account for forfeitures when they occur. This guidance will be effective for the Company beginning in its first quarter of fiscal 2017, with early application permitted. The Company will adopt this amendment in the first quarter of fiscal 2017 and will elect to continue to estimate expected forfeitures. Starting in the first quarter of fiscal 2017, the Company will be required to include excess tax benefits and deficiencies as a component of income tax expense, rather than a component of stockholders' equity. This will increase the volatility of income tax expense and the magnitude of the impact, among other variables, will be dependent upon the future price of the Company's common stock and the timing and volume of share-based payment award activity, such as employee exercises of stock options and the vesting of stock awards. The adoption of this new guidance, will also have an immaterial retrospective impact on the classification of cash flows between operating and financing activities.
3 INVENTORIES
January 29,2017
January 31,2016
(In thousands)
Finished goods . . . . . . . . . . . . . . . . . . . . . . . . . . . . . . . . . . . . . . . . . . . . . . . . . . . . . . . . . . . . . . . $ 306,087 $ 290,791Provision to reduce inventory to market value . . . . . . . . . . . . . . . . . . . . . . . . . . . . . . . . . . . . . . . (7,655) (6,782)
$ 298,432 $ 284,009
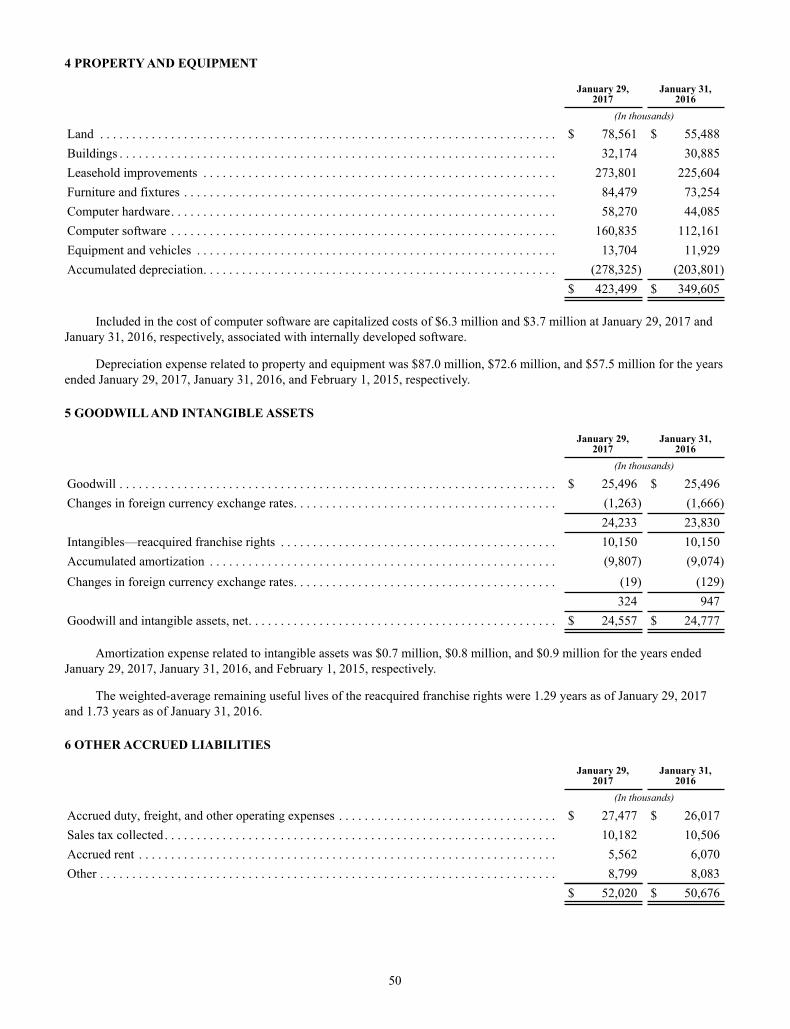
50
4 PROPERTY AND EQUIPMENT
January 29,2017
January 31,2016
(In thousands)
Land . . . . . . . . . . . . . . . . . . . . . . . . . . . . . . . . . . . . . . . . . . . . . . . . . . . . . . . . . . . . . . . . . . . . . . . $ 78,561 $ 55,488Buildings . . . . . . . . . . . . . . . . . . . . . . . . . . . . . . . . . . . . . . . . . . . . . . . . . . . . . . . . . . . . . . . . . . . . 32,174 30,885Leasehold improvements . . . . . . . . . . . . . . . . . . . . . . . . . . . . . . . . . . . . . . . . . . . . . . . . . . . . . . . 273,801 225,604Furniture and fixtures . . . . . . . . . . . . . . . . . . . . . . . . . . . . . . . . . . . . . . . . . . . . . . . . . . . . . . . . . . 84,479 73,254Computer hardware. . . . . . . . . . . . . . . . . . . . . . . . . . . . . . . . . . . . . . . . . . . . . . . . . . . . . . . . . . . . 58,270 44,085Computer software . . . . . . . . . . . . . . . . . . . . . . . . . . . . . . . . . . . . . . . . . . . . . . . . . . . . . . . . . . . . 160,835 112,161Equipment and vehicles . . . . . . . . . . . . . . . . . . . . . . . . . . . . . . . . . . . . . . . . . . . . . . . . . . . . . . . . 13,704 11,929Accumulated depreciation. . . . . . . . . . . . . . . . . . . . . . . . . . . . . . . . . . . . . . . . . . . . . . . . . . . . . . . (278,325) (203,801)
$ 423,499 $ 349,605
Included in the cost of computer software are capitalized costs of $6.3 million and $3.7 million at January 29, 2017 and January 31, 2016, respectively, associated with internally developed software.
Depreciation expense related to property and equipment was $87.0 million, $72.6 million, and $57.5 million for the years ended January 29, 2017, January 31, 2016, and February 1, 2015, respectively.
5 GOODWILL AND INTANGIBLE ASSETS
January 29, 2017
January 31, 2016
(In thousands)
Goodwill . . . . . . . . . . . . . . . . . . . . . . . . . . . . . . . . . . . . . . . . . . . . . . . . . . . . . . . . . . . . . . . . . . . . $ 25,496 $ 25,496Changes in foreign currency exchange rates. . . . . . . . . . . . . . . . . . . . . . . . . . . . . . . . . . . . . . . . . (1,263) (1,666)
24,233 23,830Intangibles—reacquired franchise rights . . . . . . . . . . . . . . . . . . . . . . . . . . . . . . . . . . . . . . . . . . . 10,150 10,150Accumulated amortization . . . . . . . . . . . . . . . . . . . . . . . . . . . . . . . . . . . . . . . . . . . . . . . . . . . . . . (9,807) (9,074)Changes in foreign currency exchange rates. . . . . . . . . . . . . . . . . . . . . . . . . . . . . . . . . . . . . . . . . (19) (129)
324 947Goodwill and intangible assets, net. . . . . . . . . . . . . . . . . . . . . . . . . . . . . . . . . . . . . . . . . . . . . . . . $ 24,557 $ 24,777
Amortization expense related to intangible assets was $0.7 million, $0.8 million, and $0.9 million for the years ended January 29, 2017, January 31, 2016, and February 1, 2015, respectively.
The weighted-average remaining useful lives of the reacquired franchise rights were 1.29 years as of January 29, 2017 and 1.73 years as of January 31, 2016.
6 OTHER ACCRUED LIABILITIES
January 29,2017
January 31,2016
(In thousands)
Accrued duty, freight, and other operating expenses . . . . . . . . . . . . . . . . . . . . . . . . . . . . . . . . . . $ 27,477 $ 26,017Sales tax collected . . . . . . . . . . . . . . . . . . . . . . . . . . . . . . . . . . . . . . . . . . . . . . . . . . . . . . . . . . . . . 10,182 10,506Accrued rent . . . . . . . . . . . . . . . . . . . . . . . . . . . . . . . . . . . . . . . . . . . . . . . . . . . . . . . . . . . . . . . . . 5,562 6,070Other . . . . . . . . . . . . . . . . . . . . . . . . . . . . . . . . . . . . . . . . . . . . . . . . . . . . . . . . . . . . . . . . . . . . . . . 8,799 8,083
$ 52,020 $ 50,676
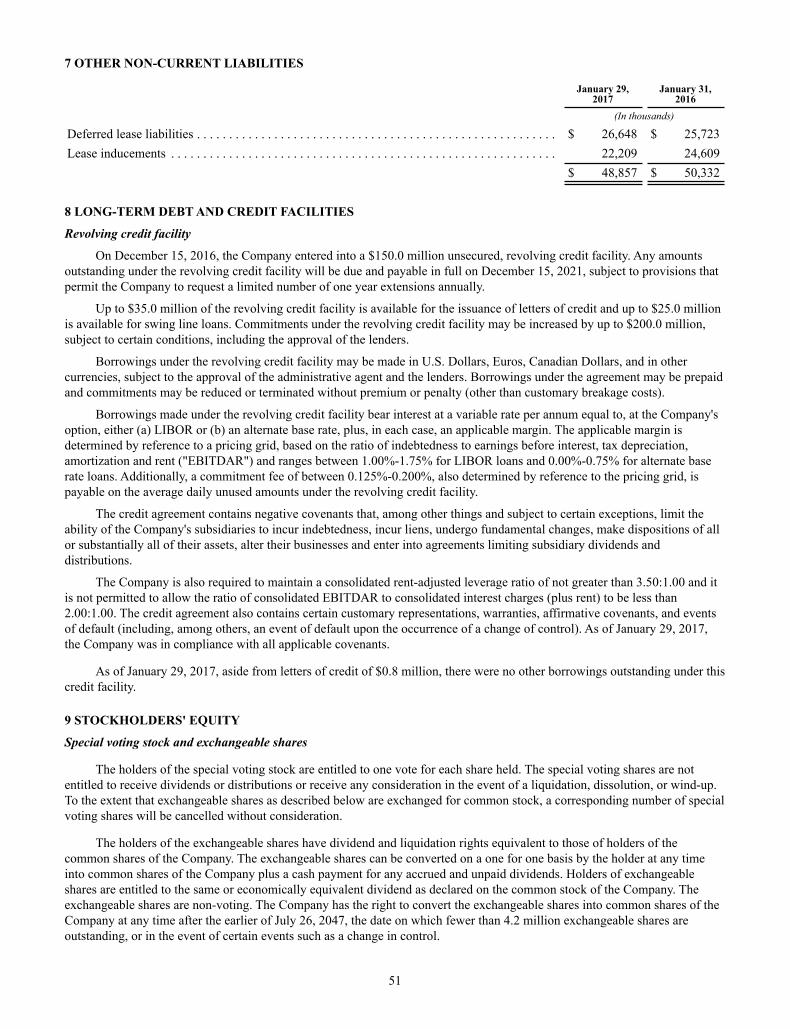
51
7 OTHER NON-CURRENT LIABILITIES
January 29,2017
January 31,2016
(In thousands)
Deferred lease liabilities . . . . . . . . . . . . . . . . . . . . . . . . . . . . . . . . . . . . . . . . . . . . . . . . . . . . . . . . $ 26,648 $ 25,723Lease inducements . . . . . . . . . . . . . . . . . . . . . . . . . . . . . . . . . . . . . . . . . . . . . . . . . . . . . . . . . . . . 22,209 24,609
$ 48,857 $ 50,332
8 LONG-TERM DEBT AND CREDIT FACILITIES
Revolving credit facility
On December 15, 2016, the Company entered into a $150.0 million unsecured, revolving credit facility. Any amounts outstanding under the revolving credit facility will be due and payable in full on December 15, 2021, subject to provisions that permit the Company to request a limited number of one year extensions annually.
Up to $35.0 million of the revolving credit facility is available for the issuance of letters of credit and up to $25.0 million is available for swing line loans. Commitments under the revolving credit facility may be increased by up to $200.0 million, subject to certain conditions, including the approval of the lenders.
Borrowings under the revolving credit facility may be made in U.S. Dollars, Euros, Canadian Dollars, and in other currencies, subject to the approval of the administrative agent and the lenders. Borrowings under the agreement may be prepaid and commitments may be reduced or terminated without premium or penalty (other than customary breakage costs).
Borrowings made under the revolving credit facility bear interest at a variable rate per annum equal to, at the Company's option, either (a) LIBOR or (b) an alternate base rate, plus, in each case, an applicable margin. The applicable margin is determined by reference to a pricing grid, based on the ratio of indebtedness to earnings before interest, tax depreciation, amortization and rent ("EBITDAR") and ranges between 1.00%-1.75% for LIBOR loans and 0.00%-0.75% for alternate base rate loans. Additionally, a commitment fee of between 0.125%-0.200%, also determined by reference to the pricing grid, is payable on the average daily unused amounts under the revolving credit facility.
The credit agreement contains negative covenants that, among other things and subject to certain exceptions, limit the ability of the Company's subsidiaries to incur indebtedness, incur liens, undergo fundamental changes, make dispositions of all or substantially all of their assets, alter their businesses and enter into agreements limiting subsidiary dividends and distributions.
The Company is also required to maintain a consolidated rent-adjusted leverage ratio of not greater than 3.50:1.00 and it is not permitted to allow the ratio of consolidated EBITDAR to consolidated interest charges (plus rent) to be less than 2.00:1.00. The credit agreement also contains certain customary representations, warranties, affirmative covenants, and events of default (including, among others, an event of default upon the occurrence of a change of control). As of January 29, 2017, the Company was in compliance with all applicable covenants.
As of January 29, 2017, aside from letters of credit of $0.8 million, there were no other borrowings outstanding under this credit facility.
9 STOCKHOLDERS' EQUITY
Special voting stock and exchangeable shares
The holders of the special voting stock are entitled to one vote for each share held. The special voting shares are not entitled to receive dividends or distributions or receive any consideration in the event of a liquidation, dissolution, or wind-up. To the extent that exchangeable shares as described below are exchanged for common stock, a corresponding number of special voting shares will be cancelled without consideration.
The holders of the exchangeable shares have dividend and liquidation rights equivalent to those of holders of the common shares of the Company. The exchangeable shares can be converted on a one for one basis by the holder at any time into common shares of the Company plus a cash payment for any accrued and unpaid dividends. Holders of exchangeable shares are entitled to the same or economically equivalent dividend as declared on the common stock of the Company. The exchangeable shares are non-voting. The Company has the right to convert the exchangeable shares into common shares of the Company at any time after the earlier of July 26, 2047, the date on which fewer than 4.2 million exchangeable shares are outstanding, or in the event of certain events such as a change in control.

52
10 STOCK-BASED COMPENSATION AND BENEFIT PLANS
Stock-based compensation plans
The Company's employees participate in various stock-based compensation plans which are provided by the Company directly.
In June 2014, the Company's stockholders approved the adoption of the lululemon athletica inc. 2014 Equity Incentive Plan ("2014 Plan"). The 2014 Plan provides for awards in the form of stock options, stock appreciation rights, restricted stock purchase rights, restricted share bonuses, restricted stock units, performance shares, performance-based restricted stock units, cash-based awards, other stock-based awards, and deferred compensation awards to employees (including officers and directors who are also employees), consultants, and directors of the Company.
The awards granted under the 2007 Equity Incentive Plan ("2007 Plan") remain outstanding and continue to vest under their original conditions. No further awards will be granted under the 2007 Plan.
The Company has granted stock options, performance-based restricted stock units, restricted stock units, and restricted shares. Stock options granted to date generally have a four-year vesting period, vest at a rate of 25% each year on the anniversary date of the grant, and expire seven years from the date of grant. Performance-based restricted stock units issued generally vest three years from the grant date and restricted shares generally vest one year from the grant date. Restricted stock units granted generally have a three-year vesting period and vest at a certain percentage each year on the anniversary date of the grant.
The Company issues previously unissued shares upon the exercise of Company options, vesting of performance-based restricted stock units or restricted stock units, and granting of restricted shares.
Stock-based compensation expense charged to income for the plans was $16.8 million, $10.4 million, and $8.3 million for the years ended January 29, 2017, January 31, 2016, and February 1, 2015, respectively.
Total unrecognized compensation cost for all stock-based compensation plans was $35.8 million as of January 29, 2017, which is expected to be recognized over a weighted-average period of 2.2 years, and was $30.3 million as of January 31, 2016 over a weighted-average period of 2.4 years.
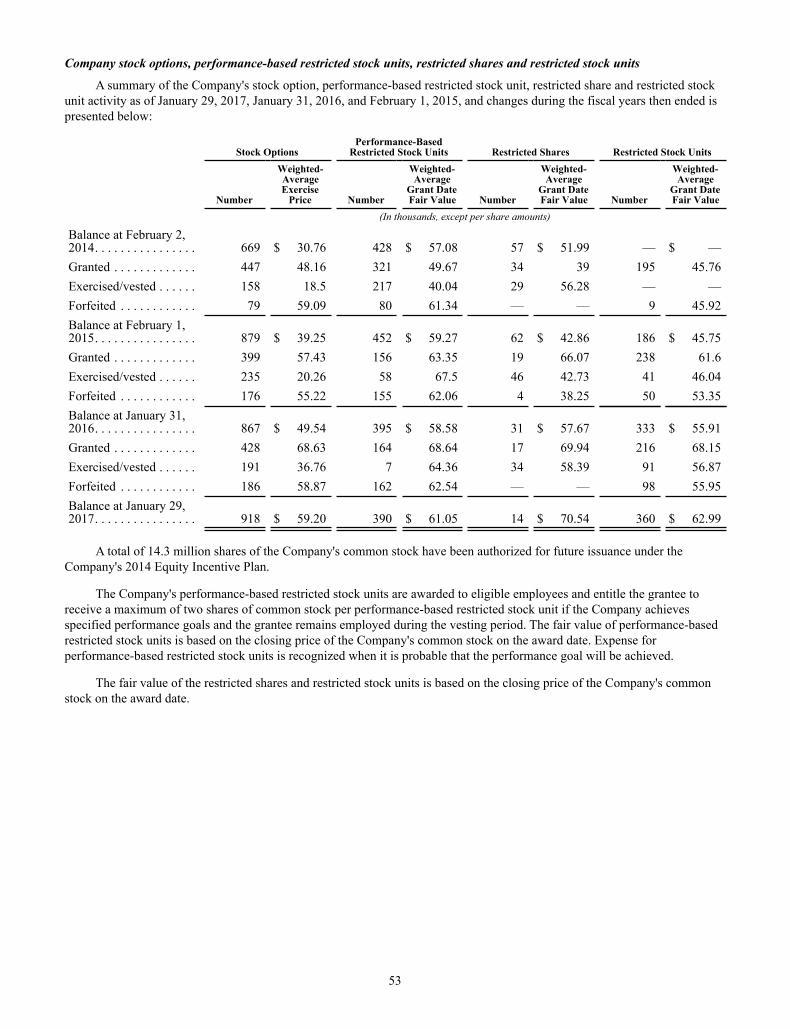
53
Company stock options, performance-based restricted stock units, restricted shares and restricted stock units
A summary of the Company's stock option, performance-based restricted stock unit, restricted share and restricted stock unit activity as of January 29, 2017, January 31, 2016, and February 1, 2015, and changes during the fiscal years then ended is presented below:
Stock OptionsPerformance-Based
Restricted Stock Units Restricted Shares Restricted Stock Units
Number
Weighted-AverageExercise
Price Number
Weighted-Average
Grant DateFair Value Number
Weighted-Average
Grant DateFair Value Number
Weighted-Average
Grant DateFair Value
(In thousands, except per share amounts)
Balance at February 2,2014. . . . . . . . . . . . . . . . 669 $ 30.76 428 $ 57.08 57 $ 51.99 — $ —Granted . . . . . . . . . . . . . 447 48.16 321 49.67 34 39 195 45.76Exercised/vested . . . . . . 158 18.5 217 40.04 29 56.28 — —Forfeited . . . . . . . . . . . . 79 59.09 80 61.34 — — 9 45.92Balance at February 1,2015. . . . . . . . . . . . . . . . 879 $ 39.25 452 $ 59.27 62 $ 42.86 186 $ 45.75Granted . . . . . . . . . . . . . 399 57.43 156 63.35 19 66.07 238 61.6Exercised/vested . . . . . . 235 20.26 58 67.5 46 42.73 41 46.04Forfeited . . . . . . . . . . . . 176 55.22 155 62.06 4 38.25 50 53.35Balance at January 31,2016. . . . . . . . . . . . . . . . 867 $ 49.54 395 $ 58.58 31 $ 57.67 333 $ 55.91Granted . . . . . . . . . . . . . 428 68.63 164 68.64 17 69.94 216 68.15Exercised/vested . . . . . . 191 36.76 7 64.36 34 58.39 91 56.87Forfeited . . . . . . . . . . . . 186 58.87 162 62.54 — — 98 55.95Balance at January 29,2017. . . . . . . . . . . . . . . . 918 $ 59.20 390 $ 61.05 14 $ 70.54 360 $ 62.99
A total of 14.3 million shares of the Company's common stock have been authorized for future issuance under the Company's 2014 Equity Incentive Plan.
The Company's performance-based restricted stock units are awarded to eligible employees and entitle the grantee to receive a maximum of two shares of common stock per performance-based restricted stock unit if the Company achieves specified performance goals and the grantee remains employed during the vesting period. The fair value of performance-based restricted stock units is based on the closing price of the Company's common stock on the award date. Expense for performance-based restricted stock units is recognized when it is probable that the performance goal will be achieved.
The fair value of the restricted shares and restricted stock units is based on the closing price of the Company's common stock on the award date.

54
The fair value of each stock option granted is estimated on the date of grant using the Black-Scholes model. The assumptions used to calculate the fair value of options granted are evaluated and revised, as necessary, to reflect market conditions and the Company's historical experience. The expected term of the options is based upon the historical experience of similar awards, giving consideration to expectations of future employee behavior. Expected volatility is based upon the historical volatility of the Company's common stock for the period corresponding with the expected term of the options. The risk-free interest rate is based on the U.S. Treasury yield curve for the period corresponding with the expected term of the options. The following assumptions were used in calculating the fair value of stock options granted in fiscal 2016, 2015, and 2014:
Fiscal Year Ended
January 29,
2017January 31,
2016February 1,
2015
Expected term . . . . . . . . . . . . . . . . . . . . . . . . . . . . . . . . . . . . . . . . . . . . . . . . . . . 4.00 years 4.00 years 4.00 yearsExpected volatility. . . . . . . . . . . . . . . . . . . . . . . . . . . . . . . . . . . . . . . . . . . . . . . . 40.07% 42.73% 45.93%Risk-free interest rate . . . . . . . . . . . . . . . . . . . . . . . . . . . . . . . . . . . . . . . . . . . . . 1.08% 0.98% 1.04%Dividend yield . . . . . . . . . . . . . . . . . . . . . . . . . . . . . . . . . . . . . . . . . . . . . . . . . . . —% —% —%
The following table summarizes information about stock options outstanding and exercisable at January 29, 2017:
Outstanding Exercisable
Range of Exercise PricesNumber of
Options
Weighted-AverageExercise
Price
Weighted-Average
RemainingLife (Years)
Number ofOptions
Weighted-AverageExercise
Price
Weighted-Average
RemainingLife (Years)
(In thousands, except per share amounts and years)
$9.00 - $48.36 . . . . . . . . . . . . . . . . . . . . . . . . . 180 $ 40.94 4.2 89 $ 36.40 3.5$52.59 - $53.79 . . . . . . . . . . . . . . . . . . . . . . . . 214 53.40 5.1 63 53.25 4.9$53.87 - $67.68 . . . . . . . . . . . . . . . . . . . . . . . . 132 63.97 5.1 35 62.88 4.6$68.69 - $68.69 . . . . . . . . . . . . . . . . . . . . . . . . 351 68.69 6.2 — — 0.0$69.30 - $76.95 . . . . . . . . . . . . . . . . . . . . . . . . 41 73.06 3.9 27 73.80 2.9
918 $ 59.20 5.3 214 $ 50.41 4.0Intrinsic value . . . . . . . . . . . . . . . . . . . . . . . . . $ 7,916 $ 3,695
As of January 29, 2017, the unrecognized compensation cost related to these options was $11.6 million, which is expected to be recognized over a weighted-average period of 2.8 years. The weighted-average grant date fair value of options granted during the years ended January 29, 2017, January 31, 2016, and February 1, 2015 was $22.39, $19.76, and $17.69, respectively.
The following table summarizes the intrinsic value of options exercised and awards that vested during fiscal 2016, 2015, and 2014:
Fiscal Year EndedJanuary 29,
2017January 31,
2016February 1,
2015(In thousands)
Stock options . . . . . . . . . . . . . . . . . . . . . . . . . . . . . . . . . . . . . . . . . . . . . . . . . . . . $ 6,072 $ 10,554 $ 4,382Performance-based restricted stock units . . . . . . . . . . . . . . . . . . . . . . . . . . . . . . 471 3,592 10,242Restricted shares . . . . . . . . . . . . . . . . . . . . . . . . . . . . . . . . . . . . . . . . . . . . . . . . . 2,283 2,739 1,567Restricted stock units. . . . . . . . . . . . . . . . . . . . . . . . . . . . . . . . . . . . . . . . . . . . . . 6,084 2,230 —
$ 14,910 $ 19,115 $ 16,191
Employee share purchase plan
The Company's board of directors and stockholders approved the Company's Employee Share Purchase Plan ("ESPP") in September 2007. Contributions are made by eligible employees, subject to certain limits as defined in the ESPP, and the Company matches one-third of the contribution. The maximum number of shares available under the ESPP is 6.0
55
million shares. During the year ended January 29, 2017, there were 0.1 million shares purchased under the ESPP in the open market.
Defined contribution pension plans
During fiscal 2016, the Company began offering defined contribution pension plans to its eligible employees in Canada and the United States. Participating employees may elect to defer and contribute a portion of their eligible compensation to a plan up to limits stated in the plan documents, not to exceed the dollar amounts set by applicable laws. The Company matches 50% to 75% of the contribution depending on the participant's length of service, and the contribution is subject to a two year vesting period. The Company's contributions were $3.2 million for the year ended January 29, 2017.
11 EARNINGS PER SHARE
The details of the computation of basic and diluted earnings per share are as follows:
Fiscal Year Ended
January 29,
2017January 31,
2016February 1,
2015(In thousands, except per share amounts)
Net income. . . . . . . . . . . . . . . . . . . . . . . . . . . . . . . . . . . . . . . . . . . . . . . . . . . . . . $ 303,381 $ 266,047 $ 239,033Basic weighted-average number of shares outstanding. . . . . . . . . . . . . . . . . . . . 137,086 140,365 143,935Assumed conversion of dilutive stock options and awards. . . . . . . . . . . . . . . . . 216 245 363Diluted weighted-average number of shares outstanding . . . . . . . . . . . . . . . . . . 137,302 140,610 144,298Basic earnings per share . . . . . . . . . . . . . . . . . . . . . . . . . . . . . . . . . . . . . . . . . . . $ 2.21 $ 1.90 $ 1.66Diluted earnings per share . . . . . . . . . . . . . . . . . . . . . . . . . . . . . . . . . . . . . . . . . . $ 2.21 $ 1.89 $ 1.66
The Company's calculation of weighted-average shares includes the common stock of the Company as well as the exchangeable shares. Exchangeable shares are the equivalent of common shares in all material respects. All classes of stock have in effect the same rights and share equally in undistributed net income. For the fiscal years ended January 29, 2017, January 31, 2016, and February 1, 2015, 0.1 million, 0.1 million, and 0.3 million stock options and awards, respectively, were anti-dilutive to earnings per share and therefore have been excluded from the computation of diluted earnings per share.
On June 11, 2014, the Company's board of directors approved a program to repurchase shares of the Company's common stock up to an aggregate value of $450.0 million. This stock repurchase program was completed during the second quarter of fiscal 2016.
On December 1, 2016, the Company's board of directors approved a program to repurchase shares of the Company's common stock up to an aggregate value of $100.0 million. The common stock is repurchased in the open market at prevailing market prices, with the timing and actual number of shares repurchased depending upon market conditions, eligibility to trade, and other factors. The repurchases may be made up until December 2018. As of January 29, 2017, the remaining aggregate value of shares available to be repurchased under this program was $99.2 million.
During the fiscal years ended January 29, 2017, January 31, 2016, and February 1, 2015, 0.5 million, 5.0 million, and 3.7 million shares, respectively, were repurchased under the programs at a total cost of $29.3 million and $274.2 million, and $147.4 million respectively.
Subsequent to January 29, 2017, and up to March 23, 2017, 35 thousand shares were repurchased at a total cost of $2.3 million.
12 COMMITMENTS AND CONTINGENCIES
Commitments
The Company has obligations under operating leases for its store and other retail locations, distribution centers, offices, and equipment. As of January 29, 2017, the lease terms of the various leases range from two to 15 years. A substantial number of the Company's leases include renewal options and certain of the Company's leases include rent escalation clauses, rent holidays and leasehold rental incentives. The majority of the Company's leases for store premises also include contingent rental payments based on sales volume. The Company is required to make deposits for rental payments pursuant to certain lease agreements, which have been included in other non-current assets. Minimum annual basic rent payments excluding other executory operating costs, pursuant to lease agreements are approximately as laid out in the table below. These amounts include

56
commitments in respect of company-operated stores that have not yet opened but for which lease agreements have been executed.
Payments Due by Fiscal Year Total 2017 2018 2019 2020 2021 Thereafter
(In thousands)
Operating leases (minimum rent) . . . $ 518,613 $ 118,897 $ 106,496 $ 94,085 $ 71,973 $ 45,019 $ 82,143
Rent expense for the years ended January 29, 2017, January 31, 2016, and February 1, 2015 was $147.4 million, $124.5 million, and $100.0 million, respectively, under operating lease agreements, consisting of minimum rental expense of $137.0 million, $113.9 million, and $89.9 million, respectively, and contingent rental amounts of $10.4 million, $10.5 million, and $10.1 million, respectively.
In January 2015, the Company entered into a license and supply arrangement with a partner in the Middle East which grants the partner the right to operate lululemon branded retail locations in the United Arab Emirates, Kuwait, Qatar, Oman, and Bahrain for an initial term of five years. Under this arrangement, the Company supplies the partner with lululemon products, training, and other support. As of January 29, 2017, there were three licensed stores in the United Arab Emirates and one licensed store in Qatar.
In November 2016, the Company entered into a license and supply agreement with a partner which grants the partner the right to operate lululemon branded retail locations in Mexico for a term of ten years, subject to certain conditions. Under this arrangement the Company supplies the partner with lululemon products, training and other support. As of January 29, 2017 there were no licensed retail locations in operation in Mexico.
Contingencies
In addition to the legal matters described below, the Company is, from time to time, involved in routine legal matters incidental to the conduct of its business, including legal matters such as initiation and defense of proceedings to protect intellectual property rights, personal injury claims, product liability claims, employment claims, and similar matters. The Company believes the ultimate resolution of any such current proceeding will not have a material adverse effect on its consolidated balance sheets, results of operations or cash flows.
On July 15, 2015, plaintiffs Hallandale Beach Police Officers and Firefighters' Personnel Retirement Fund and Laborers' District Council Industry Pension Fund filed in the Delaware Court of Chancery a derivative lawsuit on behalf of lululemon against certain current and former directors of lululemon, captioned Laborers' District Council Industry Pension Fund v. Bensoussan, et al., C.A. No. 11293-CB. The plaintiffs claimed that the individual defendants breached their fiduciary duties to lululemon by allegedly failing to investigate certain trades of lululemon stock owned by Dennis J. Wilson in 2013. The plaintiffs also claimed that Mr. Wilson breached his fiduciary duties by making his broker aware of certain non-public, material events prior to executing sales of lululemon stock on Mr. Wilson's behalf. On June 14, 2016 the Court of Chancery dismissed the action for failure to adequately plead that demand on the board was excused and for failure to state a claim upon which relief may be granted. The plaintiffs appealed the dismissal to the Supreme Court of the state of Delaware and the Supreme Court affirmed the Court of Chancery's judgment on February 3, 2017.
On October 9, 2015, certain current and former hourly employees of the Company filed a class action lawsuit in the Supreme Court of New York entitled Rebecca Gathmann-Landini et al v. lululemon USA inc. On December 2, 2015, the case was moved to the United States District Court for the Eastern District of New York. The lawsuit alleges that the Company violated various New York labor codes by failing to pay all earned wages, including overtime compensation. The plaintiffs are seeking an unspecified amount of damages. The Company intends to vigorously defend this matter.

57
13 RELATED PARTY BALANCES AND TRANSACTIONS
The Company entered into the following transactions with related parties, all of which were approved by the Company's Audit Committee in accordance with the Company's related party transaction policy:
Fiscal Year EndedJanuary 29,
2017January 31,
2016February 1,
2015(In thousands)
Payments to related partiesLease costs for one company-operated store. . . . . . . . . . . . . . . . . . . . . . . . . . . . $ 108 $ 112 $ 140Consulting fees . . . . . . . . . . . . . . . . . . . . . . . . . . . . . . . . . . . . . . . . . . . . . . . . . . $ 167 $ 354 $ 289Employment compensation . . . . . . . . . . . . . . . . . . . . . . . . . . . . . . . . . . . . . . . . . $ 274 $ 140 $ —
The Company's founder, who is a beneficial owner of more than 10% of the Company's total outstanding shares, and who was a member of the Company's board of directors until February 2, 2015, owns a retail space that the Company leases for one of its company-operated stores. Consulting fees were paid to a relative of the Company's founder.
An immediate family member of one of our executives commenced employment with the Company during fiscal 2015. The above employment compensation consists of salary, bonuses, and the grant date fair value of equity awards.
14 SUPPLEMENTAL CASH FLOW INFORMATION
Fiscal Year EndedJanuary 29,
2017January 31,
2016February 1,
2015(In thousands)
Cash paid for income taxes . . . . . . . . . . . . . . . . . . . . . . . . . . . . . . . . . . . . . . . . . $ 132,422 $ 113,534 $ 146,376Interest paid . . . . . . . . . . . . . . . . . . . . . . . . . . . . . . . . . . . . . . . . . . . . . . . . . . . . . $ 5,178 $ 52 $ 14
15 INCOME TAXES
The Company's domestic and foreign income before income tax expense and current and deferred income taxes from federal, state, and foreign sources are as follows:
Fiscal Year EndedJanuary 29,
2017January 31,
2016February 1,
2015(In thousands)
Income (loss) before income tax expenseDomestic . . . . . . . . . . . . . . . . . . . . . . . . . . . . . . . . . . . . . . . . . . . . . . . . . . . . . $ (30,955) $ 84,286 $ 94,234Foreign . . . . . . . . . . . . . . . . . . . . . . . . . . . . . . . . . . . . . . . . . . . . . . . . . . . . . . 453,684 284,209 288,901
422,729 368,495 383,135Current income tax expense (recovery)
Federal . . . . . . . . . . . . . . . . . . . . . . . . . . . . . . . . . . . . . . . . . . . . . . . . . . . . . . $ 36,245 $ (18,662) $ 54,172State . . . . . . . . . . . . . . . . . . . . . . . . . . . . . . . . . . . . . . . . . . . . . . . . . . . . . . . . 6,690 3,363 8,203Foreign . . . . . . . . . . . . . . . . . . . . . . . . . . . . . . . . . . . . . . . . . . . . . . . . . . . . . . 94,581 110,372 80,461
137,516 95,073 142,836Deferred income tax expense (recovery)
Federal . . . . . . . . . . . . . . . . . . . . . . . . . . . . . . . . . . . . . . . . . . . . . . . . . . . . . . $ (11,065) $ 8,719 $ 7,763State . . . . . . . . . . . . . . . . . . . . . . . . . . . . . . . . . . . . . . . . . . . . . . . . . . . . . . . . (1,840) 425 77Foreign . . . . . . . . . . . . . . . . . . . . . . . . . . . . . . . . . . . . . . . . . . . . . . . . . . . . . . (5,263) (1,769) (6,574)
(18,168) 7,375 1,266Income tax expense . . . . . . . . . . . . . . . . . . . . . . . . . . . . . . . . . . . . . . . . . . . . . . . $ 119,348 $ 102,448 $ 144,102

58
The Company's income tax expense for fiscal 2016, fiscal 2015 and fiscal 2014 include certain tax adjustments, as follows:
Fiscal Year EndedJanuary 29,
2017January 31,
2016February 1,
2015(In thousands)
Transfer pricing adjustments, net . . . . . . . . . . . . . . . . . . . . . . . . . . . . . . . . . . . . $ (10,706) $ (4,826) $ —Tax on repatriation of foreign earnings . . . . . . . . . . . . . . . . . . . . . . . . . . . . . . . . (38) 7,838 33,746Tax adjustment on foreign tax credit calculations. . . . . . . . . . . . . . . . . . . . . . . . — (10,455) —Total tax adjustments. . . . . . . . . . . . . . . . . . . . . . . . . . . . . . . . . . . . . . . . . . . . . . $ (10,744) $ (7,443) $ 33,746
Transfer pricing adjustments, net
The Company's tax positions include the Company's intercompany transfer pricing policies and the associated taxable income and deductions arising from intercompany charges between subsidiaries within the consolidated group.
During fiscal 2016, the Company finalized an Advance Pricing Arrangement ("APA") with the Internal Revenue Service ("IRS") and the Canada Revenue Agency ("CRA"). This agreement determines the amount of income which is taxable in each respective jurisdiction.
In the year ended January 31, 2016, the Company received communications from the IRS and CRA which led to the determination that it was more likely than not that the outcome of the APA would result in a decrease in taxable income in the United States and an increase in taxable income in Canada for fiscal 2011 through fiscal 2015. The Company recorded a net income tax recovery of $4.8 million in the year ended January 31, 2016, representing the largest amount of benefit that was considered more likely than not to be realized upon finalization of the APA.
In the year ended January 29, 2017, the APA was finalized and the final terms of the arrangement resulted in an increased amount of income tax recoverable in the United States. This resulted in the recognition of a further net income tax recovery of $10.7 million in the year ended January 29, 2017.
For the years ended January 29, 2017 and January 31, 2016, the Company recorded net interest expenses related to the APA of $1.7 million and $3.5 million, respectively. This represents accrued interest on the Canadian income tax payable related to the APA. The APA resulted in an increase in income tax payable in Canada. These interest costs were recognized in other income (expense), net. There were no similar net interest expenses during the year ended February 1, 2015.
Tax on repatriation of foreign earnings
In the year ended February 1, 2015, the Company recorded a tax expense of $33.7 million representing the estimated U.S. income tax and foreign withholding tax payable on the repatriation of earnings in the form of dividends of $473.7 million, which were distributed during fiscal 2014 by foreign subsidiaries to the U.S. parent entity to fund a share repurchase program.
In the year ended January 31, 2016, as a result of the change in the expected outcome of the APA described above, it was expected that a significant intercompany debt between one of the Company's U.S. subsidiaries and a Canadian subsidiary would arise upon the finalization of the APA. In order to finance the payment of this intercompany debt, it was expected that $156.0 million would be distributed from a Canadian subsidiary to the U.S. parent entity. As a result, these foreign earnings were no longer considered indefinitely reinvested and the Company recorded an incremental tax expense and deferred tax liability of $7.8 million to provide for U.S. income and applicable foreign withholding taxes on this expected distribution.
In the year ended January 29, 2017, the APA was finalized and a distribution of $156.0 million was made from a Canadian subsidiary to the U.S. parent entity.
The cumulative undistributed earnings of the Company's foreign subsidiaries as of January 29, 2017 were $866.2 million, including $852.3 million of cumulative undistributed earnings of a Canadian subsidiary. Income taxes of approximately $38.4 million would be incurred if these earnings were repatriated to the United States.
No deferred income tax liabilities have been recognized on any of the undistributed earnings of the Company's foreign subsidiaries as these earnings are indefinitely reinvested outside of the United States. In reaching the conclusion that these undistributed earnings are indefinitely reinvested, the Company considers its international expansion plans, projected working capital needs, projected head office capital investments outside of the United States, forecasted cash flow requirements and available liquidity within the United States, and other factors the Company believes are relevant. If the intentions of the Company change, the Company would be required to accrue the income taxes which would be due upon repatriation.
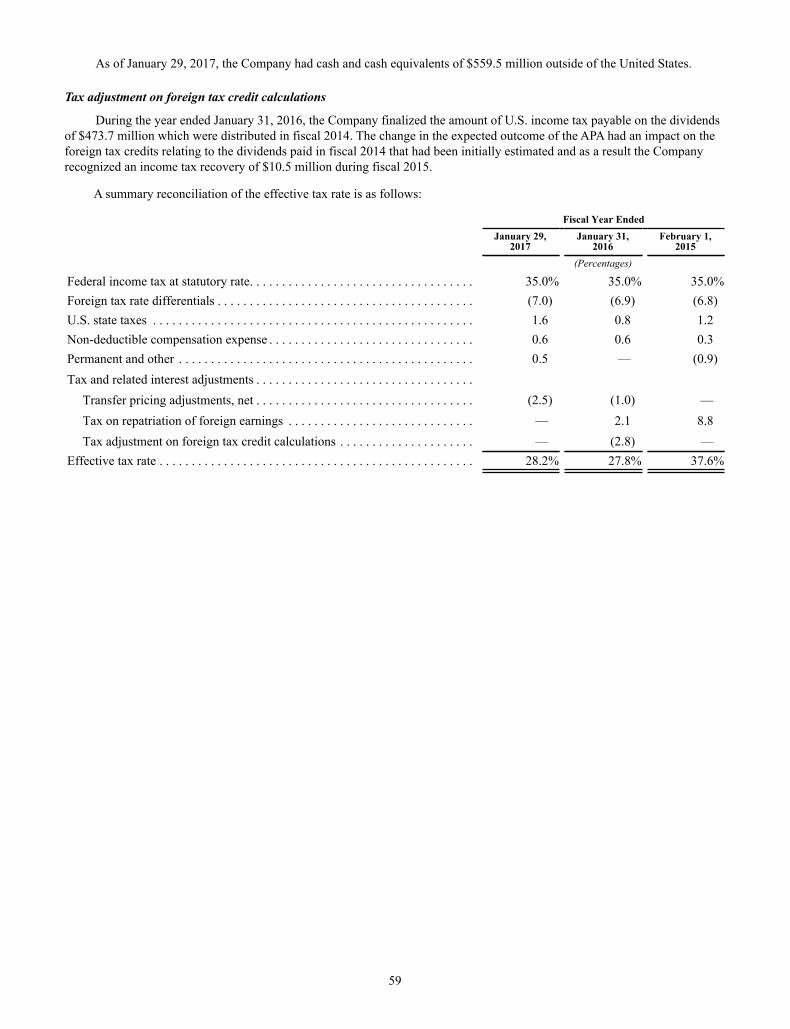
59
As of January 29, 2017, the Company had cash and cash equivalents of $559.5 million outside of the United States.
Tax adjustment on foreign tax credit calculations
During the year ended January 31, 2016, the Company finalized the amount of U.S. income tax payable on the dividends of $473.7 million which were distributed in fiscal 2014. The change in the expected outcome of the APA had an impact on the foreign tax credits relating to the dividends paid in fiscal 2014 that had been initially estimated and as a result the Company recognized an income tax recovery of $10.5 million during fiscal 2015.
A summary reconciliation of the effective tax rate is as follows:
Fiscal Year EndedJanuary 29,
2017January 31,
2016February 1,
2015(Percentages)
Federal income tax at statutory rate. . . . . . . . . . . . . . . . . . . . . . . . . . . . . . . . . . . 35.0% 35.0% 35.0%Foreign tax rate differentials . . . . . . . . . . . . . . . . . . . . . . . . . . . . . . . . . . . . . . . . (7.0) (6.9) (6.8)U.S. state taxes . . . . . . . . . . . . . . . . . . . . . . . . . . . . . . . . . . . . . . . . . . . . . . . . . . 1.6 0.8 1.2Non-deductible compensation expense . . . . . . . . . . . . . . . . . . . . . . . . . . . . . . . . 0.6 0.6 0.3Permanent and other . . . . . . . . . . . . . . . . . . . . . . . . . . . . . . . . . . . . . . . . . . . . . . 0.5 — (0.9)Tax and related interest adjustments . . . . . . . . . . . . . . . . . . . . . . . . . . . . . . . . . .
Transfer pricing adjustments, net . . . . . . . . . . . . . . . . . . . . . . . . . . . . . . . . . . (2.5) (1.0) —Tax on repatriation of foreign earnings . . . . . . . . . . . . . . . . . . . . . . . . . . . . . — 2.1 8.8Tax adjustment on foreign tax credit calculations . . . . . . . . . . . . . . . . . . . . . — (2.8) —
Effective tax rate . . . . . . . . . . . . . . . . . . . . . . . . . . . . . . . . . . . . . . . . . . . . . . . . . 28.2% 27.8% 37.6%

60
The tax effects of temporary differences that give rise to significant portions of the deferred income tax assets and deferred income tax liabilities as of January 29, 2017 and January 31, 2016 are presented below:
January 29,2017
January 31,2016
(In thousands)
Deferred income tax assetsNet operating loss carry forwards . . . . . . . . . . . . . . . . . . . . . . . . . . . . . . . . . . . . . . . . . . . . . . $ 16,280 $ 11,753Property and equipment, net. . . . . . . . . . . . . . . . . . . . . . . . . . . . . . . . . . . . . . . . . . . . . . . . . . . (21,025) (35)Deferred lease liabilities. . . . . . . . . . . . . . . . . . . . . . . . . . . . . . . . . . . . . . . . . . . . . . . . . . . . . . 8,542 55Stock-based compensation . . . . . . . . . . . . . . . . . . . . . . . . . . . . . . . . . . . . . . . . . . . . . . . . . . . . 2,354 —Inventories . . . . . . . . . . . . . . . . . . . . . . . . . . . . . . . . . . . . . . . . . . . . . . . . . . . . . . . . . . . . . . . . 4,811 —Lease inducements . . . . . . . . . . . . . . . . . . . . . . . . . . . . . . . . . . . . . . . . . . . . . . . . . . . . . . . . . . 8,142 29Foreign tax credits . . . . . . . . . . . . . . . . . . . . . . . . . . . . . . . . . . . . . . . . . . . . . . . . . . . . . . . . . . 6,818 —Other. . . . . . . . . . . . . . . . . . . . . . . . . . . . . . . . . . . . . . . . . . . . . . . . . . . . . . . . . . . . . . . . . . . . . 334 —
26,256 11,802Deferred income tax liabilities
Property and equipment, net. . . . . . . . . . . . . . . . . . . . . . . . . . . . . . . . . . . . . . . . . . . . . . . . . . . $ (10,128) $ (29,214)Tax and related interest adjustments . . . . . . . . . . . . . . . . . . . . . . . . . . . . . . . . . . . . . . . . . . . . — (8,245)Deferred lease liabilities. . . . . . . . . . . . . . . . . . . . . . . . . . . . . . . . . . . . . . . . . . . . . . . . . . . . . . 831 8,757Lease inducements . . . . . . . . . . . . . . . . . . . . . . . . . . . . . . . . . . . . . . . . . . . . . . . . . . . . . . . . . . 311 8,353Inventories . . . . . . . . . . . . . . . . . . . . . . . . . . . . . . . . . . . . . . . . . . . . . . . . . . . . . . . . . . . . . . . . — 4,015Foreign tax credits . . . . . . . . . . . . . . . . . . . . . . . . . . . . . . . . . . . . . . . . . . . . . . . . . . . . . . . . . . — 3,845Stock-based compensation . . . . . . . . . . . . . . . . . . . . . . . . . . . . . . . . . . . . . . . . . . . . . . . . . . . . — 2,192Other. . . . . . . . . . . . . . . . . . . . . . . . . . . . . . . . . . . . . . . . . . . . . . . . . . . . . . . . . . . . . . . . . . . . . 1,724 (462)
(7,262) (10,759)Net deferred income tax assets . . . . . . . . . . . . . . . . . . . . . . . . . . . . . . . . . . . . . . . . . . . . . . . . . . . $ 18,994 $ 1,043
The majority of the net operating loss carry forwards begin expiring in fiscal 2031.
The Company files income tax returns in the U.S., Canada and various foreign, state, and provincial jurisdictions. The 2012 to 2015 tax years remain subject to examination by the U.S. federal and state tax authorities. The 2010 and 2011 tax years are still open for certain state tax authorities. The 2007 to 2015 tax years remain subject to examination by Canadian tax authorities. The 2011 to 2015 tax years remain subject to examination by tax authorities in certain foreign jurisdictions. The Company does not have any significant unrecognized tax benefits arising from uncertain tax positions taken, or expected to be taken, in the Company's tax returns.

61
16 SEGMENTED FINANCIAL INFORMATION
The Company applies ASC Topic 280, Segment Reporting ("ASC 280"), in determining reportable segments for its financial statement disclosure. The Company reports segments based on the financial information it uses in managing its business. The Company's reportable segments are comprised of company-operated stores and direct to consumer. Direct to consumer represents sales from the Company's e-commerce websites. Outlets, showrooms, sales from temporary locations, sales to wholesale accounts, warehouse sales, and license and supply arrangement net revenue have been combined into other. Information for these segments is detailed in the table below:
Fiscal Year Ended
January 29,
2017January 31,
2016February 1,
2015(In thousands)
Net revenueCompany-operated stores . . . . . . . . . . . . . . . . . . . . . . . . . . . . . . . . . . . . . . . . . . $ 1,704,357 $ 1,516,323 $ 1,348,225Direct to consumer . . . . . . . . . . . . . . . . . . . . . . . . . . . . . . . . . . . . . . . . . . . . . . . 453,287 401,525 321,180Other . . . . . . . . . . . . . . . . . . . . . . . . . . . . . . . . . . . . . . . . . . . . . . . . . . . . . . . . . . 186,748 142,675 127,808
$ 2,344,392 $ 2,060,523 $ 1,797,213Income from operations before general corporate expensesCompany-operated stores . . . . . . . . . . . . . . . . . . . . . . . . . . . . . . . . . . . . . . . . . . $ 415,635 $ 346,802 $ 356,589Direct to consumer . . . . . . . . . . . . . . . . . . . . . . . . . . . . . . . . . . . . . . . . . . . . . . . 186,178 166,418 132,877Other . . . . . . . . . . . . . . . . . . . . . . . . . . . . . . . . . . . . . . . . . . . . . . . . . . . . . . . . . . 22,312 5,826 9,499
624,125 519,046 498,965General corporate expenses. . . . . . . . . . . . . . . . . . . . . . . . . . . . . . . . . . . . . . . . . 202,973 149,970 122,932Income from operations. . . . . . . . . . . . . . . . . . . . . . . . . . . . . . . . . . . . . . . . . . . . 421,152 369,076 376,033Other income (expense), net . . . . . . . . . . . . . . . . . . . . . . . . . . . . . . . . . . . . . . . . 1,577 (581) 7,102Income before income tax expense . . . . . . . . . . . . . . . . . . . . . . . . . . . . . . . . . . . $ 422,729 $ 368,495 $ 383,135
Capital expendituresCompany-operated stores . . . . . . . . . . . . . . . . . . . . . . . . . . . . . . . . . . . . . . . . . . $ 75,304 $ 85,756 $ 76,894Direct to consumer . . . . . . . . . . . . . . . . . . . . . . . . . . . . . . . . . . . . . . . . . . . . . . . 11,461 8,284 9,952Corporate and other . . . . . . . . . . . . . . . . . . . . . . . . . . . . . . . . . . . . . . . . . . . . . . . 62,746 49,447 32,887
$ 149,511 $ 143,487 $ 119,733Depreciation and amortizationCompany-operated stores . . . . . . . . . . . . . . . . . . . . . . . . . . . . . . . . . . . . . . . . . . $ 59,585 $ 50,951 $ 37,951Direct to consumer . . . . . . . . . . . . . . . . . . . . . . . . . . . . . . . . . . . . . . . . . . . . . . . 7,015 6,628 6,299Corporate and other . . . . . . . . . . . . . . . . . . . . . . . . . . . . . . . . . . . . . . . . . . . . . . . 21,097 15,804 14,114
$ 87,697 $ 73,383 $ 58,364
Intercompany amounts are excluded from the above table as they are not included in the materials reviewed by the chief operating decision maker.
The Company operates in five geographic areas — the United States, Canada, Australia and New Zealand, Europe, and Asia. Net revenue by region for the years ended January 29, 2017, January 31, 2016, and February 1, 2015 was as follows:
Fiscal Year EndedJanuary 29,
2017January 31,
2016February 1,
2015(In thousands)
United States . . . . . . . . . . . . . . . . . . . . . . . . . . . . . . . . . . . . . . . . . . . . . . . . . . . . $ 1,726,076 $ 1,508,841 $ 1,257,351Canada . . . . . . . . . . . . . . . . . . . . . . . . . . . . . . . . . . . . . . . . . . . . . . . . . . . . . . . . . 447,167 416,520 434,328Outside of North America . . . . . . . . . . . . . . . . . . . . . . . . . . . . . . . . . . . . . . . . . . 171,149 135,162 105,534
$ 2,344,392 $ 2,060,523 $ 1,797,213

62
Property and equipment, net by geographic area as of January 29, 2017 and January 31, 2016 were as follows:
January 29,2017
January 31,2016
(In thousands)
United States . . . . . . . . . . . . . . . . . . . . . . . . . . . . . . . . . . . . . . . . . . . . . . . . . . . . . . . . . . . . . . . . . $ 170,745 $ 170,823Canada. . . . . . . . . . . . . . . . . . . . . . . . . . . . . . . . . . . . . . . . . . . . . . . . . . . . . . . . . . . . . . . . . . . . . . 217,035 154,578Outside of North America. . . . . . . . . . . . . . . . . . . . . . . . . . . . . . . . . . . . . . . . . . . . . . . . . . . . . . . 35,719 24,204
$ 423,499 $ 349,605
The Company's intangible assets and goodwill relate to the reporting segment consisting of company-operated stores.
17 QUARTERLY FINANCIAL INFORMATION (UNAUDITED)
The following tables present the Company's unaudited quarterly results of operations and comprehensive income for each of the quarters in the fiscal years ended January 29, 2017 and January 31, 2016. The following tables should be read in conjunction with the Company's audited consolidated financial statements and related notes. The Company has prepared the information below on a basis consistent with its audited consolidated financial statements and has included all adjustments, consisting of normal recurring adjustments, which, in the opinion of the Company's management, are necessary to fairly present its operating results for the quarters presented. The Company's historical unaudited quarterly results of operations are not necessarily indicative of results for any future quarter or for a full year.
Fiscal 2016 Fiscal 2015
FourthQuarter
ThirdQuarter
SecondQuarter
FirstQuarter
FourthQuarter
ThirdQuarter
SecondQuarter
FirstQuarter
(Unaudited; Amounts in thousands, except per share amounts)
Net revenue. . . . . . . . . . . . . $ 789,940 $ 544,416 $ 514,520 $ 495,516 $ 704,276 $ 479,693 $ 453,010 $ 423,544Cost of goods sold . . . . . . . 362,041 265,990 260,359 256,385 349,809 254,896 240,985 217,667Gross profit . . . . . . . . . . . . . 427,899 278,426 254,161 239,131 354,467 224,797 212,025 205,877Selling, general andadministrative expenses . . . 231,270 185,451 180,202 181,542 188,184 156,619 145,446 137,841Income from operations . . . 196,629 92,975 73,959 57,589 166,283 68,178 66,579 68,036Other income (expense),net . . . . . . . . . . . . . . . . . . . . 857 628 578 (486) 938 (2,890) 842 529Income before income taxexpense . . . . . . . . . . . . . . . . 197,486 93,603 74,537 57,103 167,221 65,288 67,421 68,565Income tax expense . . . . . . 61,351 25,318 20,912 11,767 49,805 12,135 19,753 20,755Net income . . . . . . . . . . . . . $ 136,135 $ 68,285 $ 53,625 $ 45,336 $ 117,416 $ 53,153 $ 47,668 $ 47,810
Other comprehensiveincome (loss):Foreign currencytranslation adjustment. . . . . 15,941 (24,748) (28,052) 73,562 (47,369) (665) (39,368) 22,606Comprehensive income . . . $ 152,076 $ 43,537 $ 25,573 $ 118,898 $ 70,047 $ 52,488 $ 8,300 $ 70,416
Basic earnings per share . . . $ 0.99 $ 0.50 $ 0.39 $ 0.33 $ 0.85 $ 0.38 $ 0.34 $ 0.34Diluted earnings per share . $ 0.99 $ 0.50 $ 0.39 $ 0.33 $ 0.85 $ 0.38 $ 0.34 $ 0.34
The Company's quarterly results of operations have varied in the past and are likely to do so again in the future. As such, the Company believes that comparisons of its quarterly results of operations should not be relied upon as an indication of the Company's future performance.

63
ITEM 9A. CONTROLS AND PROCEDURES
Evaluation of Disclosure Controls and Procedures
Under the supervision and with the participation of our management, including our principal executive officer and principal financial officer, we conducted an evaluation of the effectiveness of the design and operation of our disclosure controls and procedures, as defined in Rules 13a-15(e) and 15d-15(e) under the Securities Exchange Act of 1934, as amended, or the Exchange Act, as of the end of the period covered by this report, or the Evaluation Date. Based upon the evaluation, our principal executive officer and principal financial officer concluded that our disclosure controls and procedures were effective as of the Evaluation Date. Disclosure controls and procedures are controls and procedures designed to reasonably ensure that information required to be disclosed in our reports filed under the Exchange Act, such as this report, is recorded, processed, summarized, and reported within the time periods specified in the SEC's rules and forms. Disclosure controls and procedures include controls and procedures designed to reasonably ensure that such information is accumulated and communicated to our management, including our chief executive officer and chief financial officer, as appropriate to allow timely decisions regarding required disclosure.
Inherent Limitations over Internal Controls
Our internal control over financial reporting is designed to provide reasonable assurances regarding the reliability of financial reporting and the preparation of financial statements for external purposes in accordance with generally accepted accounting principles. Our internal control over financial reporting includes those policies and procedures that (i) pertain to the maintenance of records that, in reasonable detail, accurately and fairly reflect the transactions and dispositions of our assets; (ii) provide reasonable assurance that transactions are recorded as necessary to permit preparation of financial statements in accordance with generally accepted accounting principles, and that our receipts and expenditures are being made only in accordance with authorizations of our management and directors; and (iii) provide reasonable assurance regarding prevention or timely detection of unauthorized acquisition, use, or disposition of our assets that could have a material effect on the financial statements. Management, including our principal executive officer and principal financial officer, does not expect that our internal controls will prevent or detect all errors and all fraud. A control system, no matter how well designed and operated, can provide only reasonable, not absolute, assurance that the objectives of the control system are met. Further, the design of a control system must reflect the fact that there are resource limitations on all control systems; no evaluation of internal controls can provide absolute assurance that all control issues and instances of fraud, if any, have been detected. Also, any evaluation of the effectiveness of controls in future periods are subject to the risk that those internal controls may become inadequate because of changes in business conditions, or that the degree of compliance with the policies and procedures may deteriorate.
Management's Annual Report on Internal Control over Financial Reporting
Management is responsible for establishing and maintaining adequate internal control over financial reporting (as defined in Rule 13a-15(f) under the Securities Exchange Act of 1934, as amended). Management conducted an evaluation of the effectiveness of our internal control over financial reporting based on the criteria set forth in Internal Control—Integrated Framework (2013) issued by the Committee of Sponsoring Organizations of the Treadway Commission, or COSO. Based on this evaluation, management concluded that we maintained effective internal control over financial reporting as of January 29, 2017. The effectiveness of our internal control over financial reporting as of January 29, 2017 has been audited by PricewaterhouseCoopers LLP our independent registered public accounting firm, as stated in their report in Item 8 of Part II of this Form 10-K.
Changes in Internal Control over Financial Reporting
There were no changes in our internal control over financial reporting during the fourth quarter of the fiscal year ended January 29, 2017 that have materially affected, or are reasonably likely to materially affect, our internal control over financial reporting.

64
PART III
ITEM 10. DIRECTORS, EXECUTIVE OFFICERS AND CORPORATE GOVERNANCE
The information required by this item concerning our directors, director nominees and Section 16 beneficial ownership reporting compliance is incorporated by reference to our definitive Proxy Statement for our 2017 Annual Meeting of Stockholders under the captions "Election of Directors," "Section 16(a) Beneficial Ownership Reporting Compliance," "Executive Officers" and "Corporate Governance."
We have adopted a written code of business conduct and ethics, which applies to all of our directors, officers and employees, including our principal executive officer and our principal financial and accounting officer. Our Code of Business Conduct and Ethics is available on our website, www.lululemon.com, and can be obtained by writing to Investor Relations, lululemon athletica inc., 1818 Cornwall Avenue, Vancouver, British Columbia, Canada V6J 1C7 or by sending an email to [email protected]. The information contained on our website is not incorporated by reference into this Annual Report on Form 10-K. Any amendments, other than technical, administrative or other non-substantive amendments, to our Code of Business Conduct and Ethics or waivers from the provisions of the Code of Business Conduct and Ethics for our principal executive officer and our principal financial and accounting officer will be promptly disclosed on our website following the effective date of such amendment or waiver.
ITEM 11. EXECUTIVE COMPENSATION
The information required by this item is incorporated by reference to our 2017 Proxy Statement under the captions "Executive Compensation" and "Executive Compensation Tables."
ITEM 12. SECURITY OWNERSHIP OF CERTAIN BENEFICIAL OWNERS AND MANAGEMENT AND RELATED STOCKHOLDER MATTERS
The information required by this item is incorporated by reference to our 2017 Proxy Statement under the caption "Principal Stockholders and Stock Ownership by Management."
Equity Compensation Plan Information (as of January 29, 2017)
Plan Category
Number of Securities to be Issued
Upon Exercise of Outstanding Options,
Warrants and Rights(1)
(A)
Weighted-Average Exercise Price of
Outstanding Options, Warrants and Rights(2)
(B)
Number of Securities Remaining Available for Future Issuance Under Equity Compensation
Plans (Excluding Securities Reflected in
Column (A))(3)
(C)
Equity compensation plans approved by stockholders . . 1,668,504 $ 59.20 19,338,881Equity compensation plans not approved bystockholders. . . . . . . . . . . . . . . . . . . . . . . . . . . . . . . . . . . — — —Total. . . . . . . . . . . . . . . . . . . . . . . . . . . . . . . . . . . . . . . . . 1,668,504 $ 59.20 19,338,881__________(1) This amount represents the following: (a) 918,143 shares subject to outstanding options, (b) 390,111 shares subject to
outstanding performance-based restricted stock units, and (c) 360,250 shares subject to outstanding restricted stock units. The options, performance-based restricted stock units and restricted stock units are all under our 2007 Equity Incentive Plan or our 2014 Equity Incentive Plan. Restricted shares outstanding under our 2014 Equity Incentive Plan have already been reflected in our total outstanding common stock balance.
(2) The weighted-average exercise price is calculated solely on the exercise prices of the outstanding options and does not reflect the shares that will be issued upon the vesting of outstanding awards of performance-based restricted stock units and restricted stock units, which have no exercise price.
(3) This includes (a) 14,299,075 shares of our common stock available for future issuance under our 2014 Equity Incentive Plan and (b) 5,039,806 shares of our common stock available for future issuance under our Employee Share Purchase Plan. The number of shares remaining available for future issuance under our 2014 Equity Incentive Plan is reduced by 1.7 shares for each award other than stock options granted and by one share for each stock option award granted. Outstanding awards that expire or are canceled without having been exercised or settled in full are available for issuance again under our 2014 Equity Incentive Plan and shares that are withheld in satisfaction of tax withholding obligations for full value awards are also again available for issuance. No further awards may be issued under the predecessor plan, our 2007 Equity Incentive Plan.

65
ITEM 13. CERTAIN RELATIONSHIPS AND RELATED TRANSACTIONS, AND DIRECTOR INDEPENDENCE
The information required by this item is incorporated by reference to our 2017 Proxy Statement under the captions "Certain Relationships and Related Party Transactions" and "Corporate Governance."
ITEM 14. PRINCIPAL ACCOUNTANT FEES AND SERVICES
The information required by this item is incorporated by reference to our 2017 Proxy Statement under the caption "Fees for Professional Services."
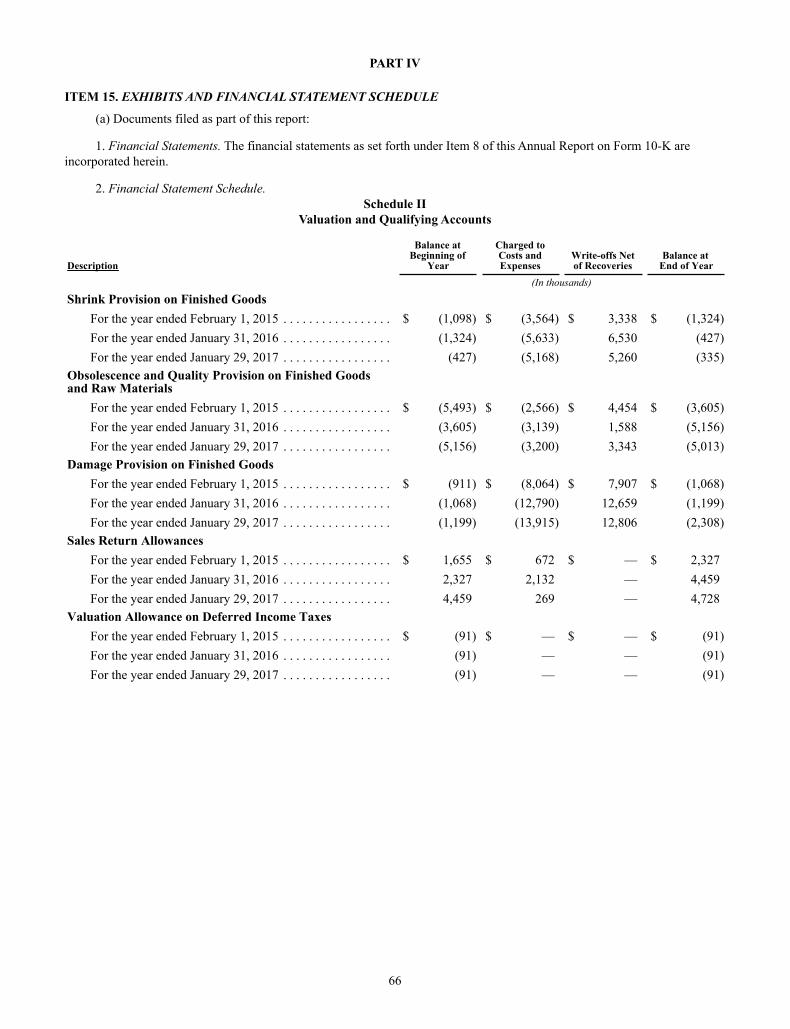
66
PART IV
ITEM 15. EXHIBITS AND FINANCIAL STATEMENT SCHEDULE
(a) Documents filed as part of this report:
1. Financial Statements. The financial statements as set forth under Item 8 of this Annual Report on Form 10-K are incorporated herein.
2. Financial Statement Schedule.Schedule II
Valuation and Qualifying Accounts
Description
Balance atBeginning of
Year
Charged toCosts andExpenses
Write-offs Netof Recoveries
Balance atEnd of Year
(In thousands)
Shrink Provision on Finished GoodsFor the year ended February 1, 2015 . . . . . . . . . . . . . . . . . $ (1,098) $ (3,564) $ 3,338 $ (1,324)For the year ended January 31, 2016 . . . . . . . . . . . . . . . . . (1,324) (5,633) 6,530 (427)For the year ended January 29, 2017 . . . . . . . . . . . . . . . . . (427) (5,168) 5,260 (335)
Obsolescence and Quality Provision on Finished Goodsand Raw Materials
For the year ended February 1, 2015 . . . . . . . . . . . . . . . . . $ (5,493) $ (2,566) $ 4,454 $ (3,605)For the year ended January 31, 2016 . . . . . . . . . . . . . . . . . (3,605) (3,139) 1,588 (5,156)For the year ended January 29, 2017 . . . . . . . . . . . . . . . . . (5,156) (3,200) 3,343 (5,013)
Damage Provision on Finished GoodsFor the year ended February 1, 2015 . . . . . . . . . . . . . . . . . $ (911) $ (8,064) $ 7,907 $ (1,068)For the year ended January 31, 2016 . . . . . . . . . . . . . . . . . (1,068) (12,790) 12,659 (1,199)For the year ended January 29, 2017 . . . . . . . . . . . . . . . . . (1,199) (13,915) 12,806 (2,308)
Sales Return AllowancesFor the year ended February 1, 2015 . . . . . . . . . . . . . . . . . $ 1,655 $ 672 $ — $ 2,327For the year ended January 31, 2016 . . . . . . . . . . . . . . . . . 2,327 2,132 — 4,459For the year ended January 29, 2017 . . . . . . . . . . . . . . . . . 4,459 269 — 4,728
Valuation Allowance on Deferred Income TaxesFor the year ended February 1, 2015 . . . . . . . . . . . . . . . . . $ (91) $ — $ — $ (91)For the year ended January 31, 2016 . . . . . . . . . . . . . . . . . (91) — — (91)For the year ended January 29, 2017 . . . . . . . . . . . . . . . . . (91) — — (91)

67
3. Exhibits
Exhibit Index
Incorporated by ReferenceExhibit
No. Exhibit TitleFiled
Herewith Form Exhibit No. File No. Filing Date
3.1 Amended and Restated Certificate of Incorporation oflululemon athletica inc.
8-K 3.1 001-33608 8/8/2007
3.2 Certificate of Amendment to Amended and RestatedCertificate of Incorporation of lululemon athletica inc.
8-K 3.1 001-33608 7/1/2011
3.3 Bylaws of lululemon athletica inc. 8-K 3.1 001-33608 6/5/2015
4.1 Form of Specimen Stock Certificate of lululemonathletica inc.
S-1/A 4.1 001-33608 7/9/2007
10.1* lululemon athletica inc. 2014 Equity Incentive Plan 8-K 10.1 001-33608 6/13/2014
10.2* Form of Non-Qualified Stock Option Agreement (foroutside directors)
10-Q 10.2 001-33608 12/6/2012
10.3* Form of Non-Qualified Stock Option Agreement (withclawback provision)
10-Q 10.1 001-33608 6/8/2016
10.4* Form of Notice of Grant of Performance Shares andPerformance Shares Agreement (with clawbackprovision)
10-Q 10.2 001-33608 6/8/2016
10.5* Form of Notice of Grant of Restricted Stock Units andRestricted Stock Units Agreement (with clawbackprovision)
10-Q 10.3 001-33608 6/8/2016
10.6* Form of Restricted Stock Award Agreement 10-Q 10.12 001-33608 12/11/2014
10.7* Amended and Restated LIPO Investments (USA), Inc.Option Plan and form of Award Agreement
S-1 10.3 333-142477 5/1/2007
10.8 Second Amended and Restated Registration RightsAgreement dated June 18, 2015 between lululemonathletica inc. and the parties named therein
10-Q 10.2 001-33608 9/10/2015
10.9 Exchange Trust Agreement dated July 26, 2007between lululemon athletica inc., Lulu CanadianHolding, Inc. and Computershare Trust Company ofCanada
10-Q 10.5 001-33608 9/10/2007
10.10 Exchangeable Share Support Agreement dated July 26,2007 between lululemon athletica inc., LululemonCallco ULC and Lulu Canadian Holding, Inc.
10-Q 10.6 001-33608 9/10/2007
10.11 Amended and Restated Declaration of Trust forForfeitable Exchangeable Shares dated July 26, 2007,by and among the parties named therein
10-Q 10.7 001-33608 9/10/2007
10.12 Amended and Restated Arrangement Agreement datedas of June 18, 2007, by and among the parties namedtherein (including Plan of Arrangement andExchangeable Share Provisions)
S-1/A 10.14 333-142477 7/9/2007
10.13 Form of Indemnification Agreement betweenlululemon athletica inc. and its directors and certainofficers
S-1/A 10.16 333-142477 7/9/2007
10.14 Purchase and Sale Agreement between 2725312Canada Inc and lululemon athletica inc., datedDecember 22, 2010
10-K 10.12 001-33608 3/17/2011
10.15* Outside Director Compensation Plan X
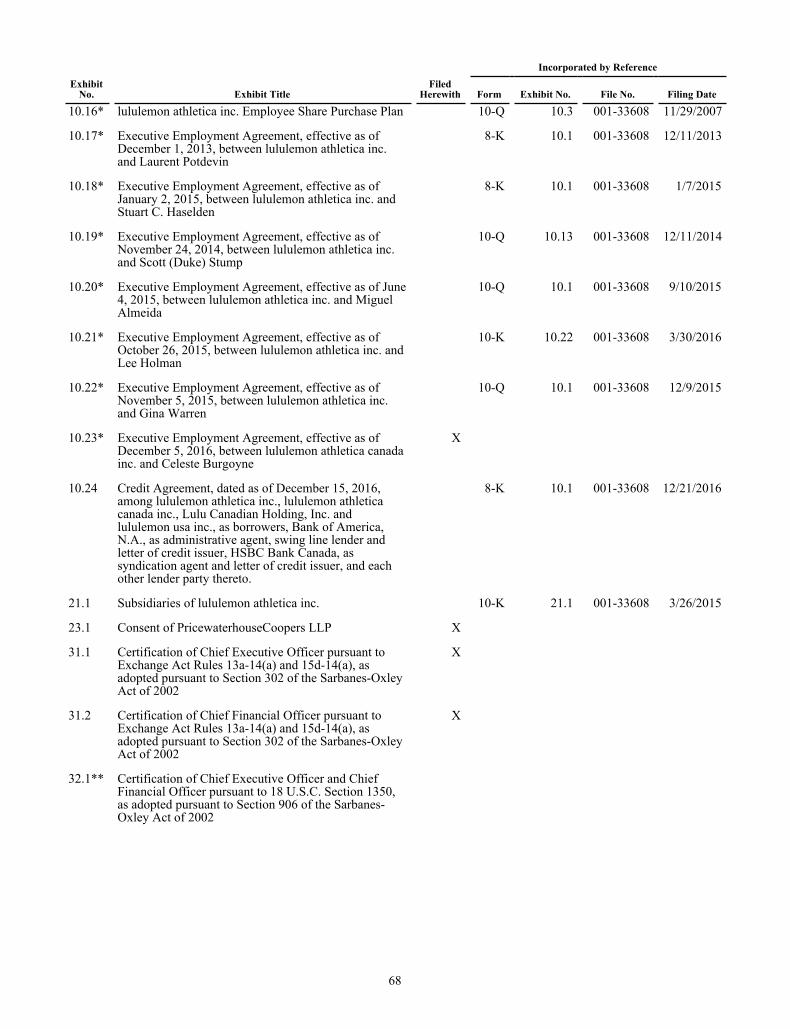
68
Incorporated by ReferenceExhibit
No. Exhibit TitleFiled
Herewith Form Exhibit No. File No. Filing Date
10.16* lululemon athletica inc. Employee Share Purchase Plan 10-Q 10.3 001-33608 11/29/2007
10.17* Executive Employment Agreement, effective as ofDecember 1, 2013, between lululemon athletica inc.and Laurent Potdevin
8-K 10.1 001-33608 12/11/2013
10.18* Executive Employment Agreement, effective as ofJanuary 2, 2015, between lululemon athletica inc. andStuart C. Haselden
8-K 10.1 001-33608 1/7/2015
10.19* Executive Employment Agreement, effective as ofNovember 24, 2014, between lululemon athletica inc.and Scott (Duke) Stump
10-Q 10.13 001-33608 12/11/2014
10.20* Executive Employment Agreement, effective as of June4, 2015, between lululemon athletica inc. and MiguelAlmeida
10-Q 10.1 001-33608 9/10/2015
10.21* Executive Employment Agreement, effective as ofOctober 26, 2015, between lululemon athletica inc. andLee Holman
10-K 10.22 001-33608 3/30/2016
10.22* Executive Employment Agreement, effective as ofNovember 5, 2015, between lululemon athletica inc.and Gina Warren
10-Q 10.1 001-33608 12/9/2015
10.23* Executive Employment Agreement, effective as ofDecember 5, 2016, between lululemon athletica canadainc. and Celeste Burgoyne
X
10.24 Credit Agreement, dated as of December 15, 2016,among lululemon athletica inc., lululemon athleticacanada inc., Lulu Canadian Holding, Inc. andlululemon usa inc., as borrowers, Bank of America,N.A., as administrative agent, swing line lender andletter of credit issuer, HSBC Bank Canada, assyndication agent and letter of credit issuer, and eachother lender party thereto.
8-K 10.1 001-33608 12/21/2016
21.1 Subsidiaries of lululemon athletica inc. 10-K 21.1 001-33608 3/26/2015
23.1 Consent of PricewaterhouseCoopers LLP X
31.1 Certification of Chief Executive Officer pursuant toExchange Act Rules 13a-14(a) and 15d-14(a), asadopted pursuant to Section 302 of the Sarbanes-OxleyAct of 2002
X
31.2 Certification of Chief Financial Officer pursuant toExchange Act Rules 13a-14(a) and 15d-14(a), asadopted pursuant to Section 302 of the Sarbanes-OxleyAct of 2002
X
32.1** Certification of Chief Executive Officer and ChiefFinancial Officer pursuant to 18 U.S.C. Section 1350,as adopted pursuant to Section 906 of the Sarbanes-Oxley Act of 2002
69
Incorporated by ReferenceExhibit
No. Exhibit TitleFiled
Herewith Form Exhibit No. File No. Filing Date
101 The following financial statements from the Company's10-K for the fiscal year ended January 29, 2017,formatted in XBRL: (i) Consolidated Balance Sheets,(ii) Consolidated Statements of Operations andComprehensive Income, (iii) Consolidated Statementsof Stockholders' Equity, (iv) Consolidated Statementsof Cash Flows (v) Notes to the Consolidated FinancialStatements
X
* Denotes a compensatory plan, contract or arrangement, in which our directors or executive officers may participate.** Furnished herewith.

70
SIGNATURES
Pursuant to the requirements of Section 13 or 15(d) of the Securities Exchange Act of 1934, as amended, the registrant has duly caused this report to be signed on its behalf by the undersigned, thereunto duly authorized.
LULULEMON ATHLETICA INC.
By: /s/ LAURENT POTDEVIN Laurent Potdevin
Chief Executive Officer (Principal Executive Officer)
Date: March 28, 2017
KNOW ALL PERSONS BY THESE PRESENTS, that each person whose signature appears below constitutes and appoints Laurent Potdevin and Stuart C. Haselden and each of them, with full power of substitution and resubstitution and full power to act without the other, as his or her true and lawful attorney-in-fact and agent to act in his or her name, place and stead and to execute in the name and on behalf of each person, individually and in each capacity stated below, and to file, any and all documents in connection therewith, with the Securities and Exchange Commission, granting unto said attorneys-in-fact and agents, and each of them, full power and authority to do and perform each and every act and thing, ratifying and confirming all that said attorneys-in-fact and agents or any of them or their and his or her substitute or substitutes, may lawfully do or cause to be done by virtue thereof.
Pursuant to the requirements of the Securities Exchange Act of 1934, as amended, this report has been signed below by the following persons on behalf of the registrant and in the capacities and on the dates indicated:
Signature Title Date
/s/ LAURENT POTDEVIN Director and Chief Executive Officer March 28, 2017Laurent Potdevin (Principal Executive Officer)
/s/ STUART C. HASELDEN Chief Financial Officer (Principal March 28, 2017Stuart C. Haselden Financial and Accounting Officer)
/s/ MICHAEL CASEY Director, Co-Chairman of the Board March 28, 2017Michael Casey
/s/ DAVID M. MUSSAFER Director, Co-Chairman of the Board March 28, 2017David M. Mussafer
/s/ ROBERT BENSOUSSAN Director March 28, 2017Robert Bensoussan
/s/ STEVEN J. COLLINS Director March 28, 2017Steven J. Collins
/s/ KATHRYN HENRY Director March 28, 2017Kathryn Henry
/s/ JON MCNEILL Director March 28, 2017Jon McNeill
/s/ MARTHA A.M. MORFITT Director March 28, 2017Martha A.M. Morfitt
/s/ EMILY WHITE Director March 28, 2017Emily White

71
Exhibit Index
Incorporated by ReferenceExhibit
No. Exhibit TitleFiled
Herewith Form Exhibit No. File No. Filing Date
3.1 Amended and Restated Certificate of Incorporation oflululemon athletica inc.
8-K 3.1 001-33608 8/8/2007
3.2 Certificate of Amendment to Amended and RestatedCertificate of Incorporation of lululemon athletica inc.
8-K 3.1 001-33608 7/1/2011
3.3 Bylaws of lululemon athletica inc. 8-K 3.1 001-33608 6/5/2015
4.1 Form of Specimen Stock Certificate of lululemonathletica inc.
S-1/A 4.1 001-33608 7/9/2007
10.1* lululemon athletica inc. 2014 Equity Incentive Plan 8-K 10.1 001-33608 6/13/2014
10.2* Form of Non-Qualified Stock Option Agreement (foroutside directors)
10-Q 10.2 001-33608 12/6/2012
10.3* Form of Non-Qualified Stock Option Agreement (withclawback provision)
10-Q 10.1 001-33608 6/8/2016
10.4* Form of Notice of Grant of Performance Shares andPerformance Shares Agreement (with clawbackprovision)
10-Q 10.2 001-33608 6/8/2016
10.5* Form of Notice of Grant of Restricted Stock Units andRestricted Stock Units Agreement (with clawbackprovision)
10-Q 10.3 001-33608 6/8/2016
10.6* Form of Restricted Stock Award Agreement 10-Q 10.12 001-33608 12/11/2014
10.7* Amended and Restated LIPO Investments (USA), Inc.Option Plan and form of Award Agreement
S-1 10.3 333-142477 5/1/2007
10.8 Second Amended and Restated Registration RightsAgreement dated June 18, 2015 between lululemonathletica inc. and the parties named therein
10-Q 10.2 001-33608 9/10/2015
10.9 Exchange Trust Agreement dated July 26, 2007between lululemon athletica inc., Lulu CanadianHolding, Inc. and Computershare Trust Company ofCanada
10-Q 10.5 001-33608 9/10/2007
10.10 Exchangeable Share Support Agreement dated July 26,2007 between lululemon athletica inc., LululemonCallco ULC and Lulu Canadian Holding, Inc.
10-Q 10.6 001-33608 9/10/2007
10.11 Amended and Restated Declaration of Trust forForfeitable Exchangeable Shares dated July 26, 2007,by and among the parties named therein
10-Q 10.7 001-33608 9/10/2007
10.12 Amended and Restated Arrangement Agreement datedas of June 18, 2007, by and among the parties namedtherein (including Plan of Arrangement andExchangeable Share Provisions)
S-1/A 10.14 333-142477 7/9/2007
10.13 Form of Indemnification Agreement betweenlululemon athletica inc. and its directors and certainofficers
S-1/A 10.16 333-142477 7/9/2007
10.14 Purchase and Sale Agreement between 2725312Canada Inc and lululemon athletica inc., datedDecember 22, 2010
10-K 10.12 001-33608 3/17/2011
10.15* Outside Director Compensation Plan X
10.16* lululemon athletica inc. Employee Share Purchase Plan 10-Q 10.3 001-33608 11/29/2007

72
Incorporated by ReferenceExhibit
No. Exhibit TitleFiled
Herewith Form Exhibit No. File No. Filing Date
10.17* Executive Employment Agreement, effective as ofDecember 1, 2013, between lululemon athletica inc.and Laurent Potdevin
8-K 10.1 001-33608 12/11/2013
10.18* Executive Employment Agreement, effective as ofJanuary 2, 2015, between lululemon athletica inc. andStuart C. Haselden
8-K 10.1 001-33608 1/7/2015
10.19* Executive Employment Agreement, effective as ofNovember 24, 2014, between lululemon athletica inc.and Scott (Duke) Stump
10-Q 10.13 001-33608 12/11/2014
10.20* Executive Employment Agreement, effective as of June4, 2015, between lululemon athletica inc. and MiguelAlmeida
10-Q 10.1 001-33608 9/10/2015
10.21* Executive Employment Agreement, effective as ofOctober 26, 2015, between lululemon athletica inc. andLee Holman
10-K 10.22 001-33608 3/30/2016
10.22* Executive Employment Agreement, effective as ofNovember 5, 2015, between lululemon athletica inc.and Gina Warren
10-Q 10.1 001-33608 12/9/2015
10.23* Executive Employment Agreement, effective as ofDecember 5, 2016, between lululemon athletica canadainc. and Celeste Burgoyne
X
10.24 Credit Agreement, dated as of December 15, 2016,among lululemon athletica inc., lululemon athleticacanada inc., Lulu Canadian Holding, Inc. andlululemon usa inc., as borrowers, Bank of America,N.A., as administrative agent, swing line lender andletter of credit issuer, HSBC Bank Canada, assyndication agent and letter of credit issuer, and eachother lender party thereto.
8-K 10.1 001-33608 12/21/2016
21.1 Subsidiaries of lululemon athletica inc. 10-K 21.1 001-33608 3/26/2015
23.1 Consent of PricewaterhouseCoopers LLP X
31.1 Certification of Chief Executive Officer pursuant toExchange Act Rules 13a-14(a) and 15d-14(a), asadopted pursuant to Section 302 of the Sarbanes-OxleyAct of 2002
X
31.2 Certification of Chief Financial Officer pursuant toExchange Act Rules 13a-14(a) and 15d-14(a), asadopted pursuant to Section 302 of the Sarbanes-OxleyAct of 2002
X
32.1** Certification of Chief Executive Officer and ChiefFinancial Officer pursuant to 18 U.S.C. Section 1350,as adopted pursuant to Section 906 of the Sarbanes-Oxley Act of 2002

73
Incorporated by ReferenceExhibit
No. Exhibit TitleFiled
Herewith Form Exhibit No. File No. Filing Date
101 The following financial statements from the Company's10-K for the fiscal year ended January 29, 2017,formatted in XBRL: (i) Consolidated Balance Sheets,(ii) Consolidated Statements of Operations andComprehensive Income, (iii) Consolidated Statementsof Stockholders' Equity, (iv) Consolidated Statementsof Cash Flows (v) Notes to the Consolidated FinancialStatements
X
* Denotes a compensatory plan, contract or arrangement, in which our directors or executive officers may participate.** Furnished herewith.

[This page intentionally left blank]
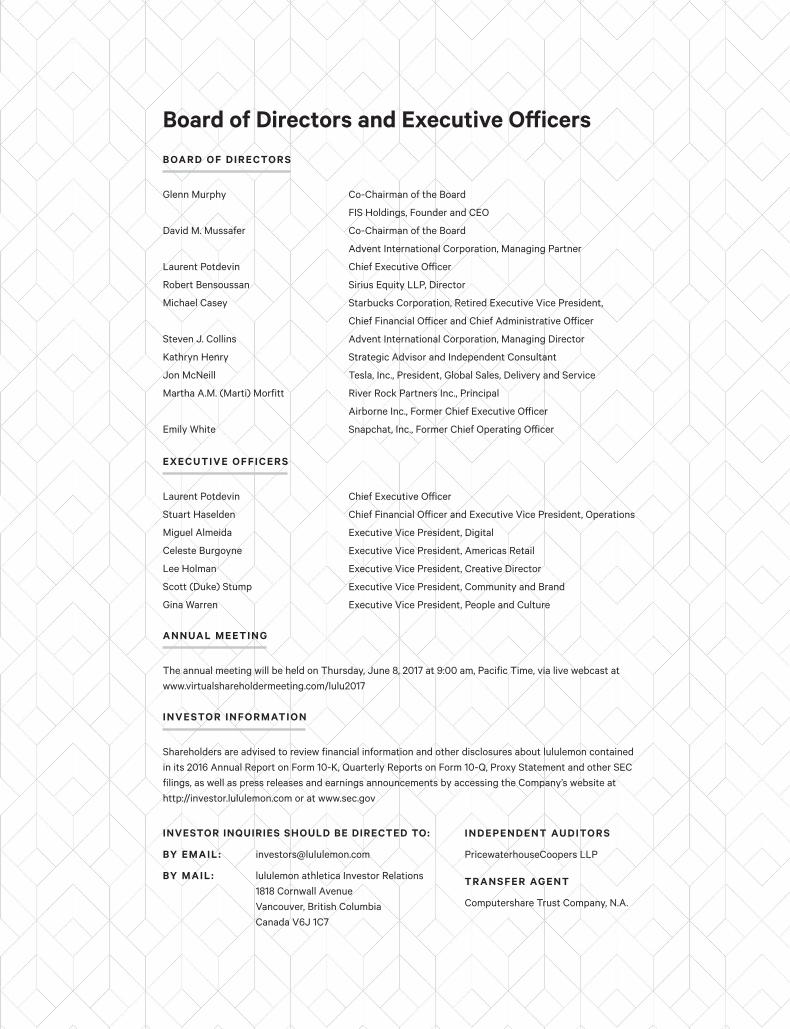
The annual meeting will be held on Thursday, June 8, 2017 at 9:00 am, Pacific Time, via live webcast at www.virtualshareholdermeeting.com/lulu2017
Shareholders are advised to review financial information and other disclosures about lululemon contained in its 2016 Annual Report on Form 10-K, Quarterly Reports on Form 10-Q, Proxy Statement and other SEC filings, as well as press releases and earnings announcements by accessing the Company’s website at http://investor.lululemon.com or at www.sec.gov
Glenn Murphy
David M. Mussafer
Laurent Potdevin
Robert Bensoussan
Michael Casey
Steven J. Collins
Kathryn Henry
Jon McNeill
Martha A.M. (Marti) Morfitt
Emily White
Laurent Potdevin
Stuart Haselden
Miguel Almeida
Celeste Burgoyne
Lee Holman
Scott (Duke) Stump
Gina Warren
INVESTOR INQUIRIES SHOULD BE DIRECTED TO:
BY EMAIL : [email protected]
BY MAIL : lululemon athletica Investor Relations 1818 Cornwall Avenue Vancouver, British Columbia Canada V6J 1C7
Co-Chairman of the Board
FIS Holdings, Founder and CEO
Co-Chairman of the Board
Advent International Corporation, Managing Partner
Chief Executive Officer
Sirius Equity LLP, Director
Starbucks Corporation, Retired Executive Vice President,
Chief Financial Officer and Chief Administrative Officer
Advent International Corporation, Managing Director
Strategic Advisor and Independent Consultant
Tesla, Inc., President, Global Sales, Delivery and Service
River Rock Partners Inc., Principal
Airborne Inc., Former Chief Executive Officer
Snapchat, Inc., Former Chief Operating Officer
Chief Executive Officer
Chief Financial Officer and Executive Vice President, Operations
Executive Vice President, Digital
Executive Vice President, Americas Retail
Executive Vice President, Creative Director
Executive Vice President, Community and Brand
Executive Vice President, People and Culture
INDEPENDENT AUDITORS
PricewaterhouseCoopers LLP
TRANSFER AGENT
Computershare Trust Company, N.A.
Board of Directors and Executive OfficersBOARD OF DIRECTORS
EXECUTIVE OFFICERS
ANNUAL MEETING
INVESTOR INFORMATION