2016 ANNUAL REPORT - PFMA · 2017-11-15 · SCP FY 2016 ANNUAL REPORT ... fewer errors than manual...
32
SCP FY 2016 ANNUAL REPORT ׀1 2016 ANNUAL REPORT
Transcript of 2016 ANNUAL REPORT - PFMA · 2017-11-15 · SCP FY 2016 ANNUAL REPORT ... fewer errors than manual...

SCP FY 2016 ANNUAL REPORT 1 ׀
2016ANNUAL REPORT

SCP FY 2016 ANNUAL REPORT 2 ׀
TABLE OF CONTENTS
YEAR IN REVIEW
Executive Director’s Message _______________________________________________________________________ 3
BACKGROUND
Overview _______________________________________________________________________________________ 4
Development ____________________________________________________________________________________ 4
Board of Advisors ________________________________________________________________________________ 5
Program Principles ________________________________________________________________________________ 6
Program Requirements ____________________________________________________________________________ 6
Program Format _________________________________________________________________________________ 6
Store Compliance ________________________________________________________________________________ 7
Current Enrollment _______________________________________________________________________________ 7
Pennsylvania Scanner Inspection Laws________________________________________________________________ 8
National Standard ________________________________________________________________________________ 9
Work With Other Groups __________________________________________________________________________ 10
PROGRAM DATA
Supermarket Inspections Overview _________________________________________________________________ 11
Convenience Store Inspections Overview _____________________________________________________________ 12
Pennsylvania Inspections by County _________________________________________________________________ 13
Supermarket Inspection Results ____________________________________________________________________ 14
Convenience Store Inspection Results _______________________________________________________________ 20
Inspection Results by State/Test Type _______________________________________________________________ 26
FINANCIAL DATA
Balance Sheet __________________________________________________________________________________ 28
Statement of Operations and Retained Earnings _______________________________________________________ 29
Statement of Cash Flows _________________________________________________________________________ 30
Notes to Financial Statements _____________________________________________________________________ 31

SCP FY 2016 ANNUAL REPORT 3 ׀
Fiscal 2016 marked the Scanning Certification Program's (SCP) 25th year of operation, and I'd characterize our silver anniversary as having been a very busy and productive year.
Membership has been steady, with over 1,000 stores from ten retail chains and numerous independent grocers participating. We're especially proud of our nearly 100 percent retention rate — only a few shuttered chain stores exited the program during 2016. We look forward to increasing our ranks in 2017 as Acme enrolls the 70+ former A & P stores that they recently acquired. We also expect to benefit from Giant Eagle's expansion into Indiana.
All key financial goals were met or exceeded last year, allowing us to keep inspection fees unchanged for 2017. The fees paid by SCP members are our sole source of funding, and we’re very careful to spend our clients' money wisely. We haven't had a fee increase since 2008, and providing good value is crucial as retailers have free inspection alternatives from state and local weights and measures agencies.
Our seven inspectors performed 1,101 unannounced price accuracy tests in seven states during fiscal 2016. We're very fortunate to have a hard-working, professional and veteran inspector team. Our most tenured auditor, Pittsburgh-based Bobbie Pietropaolo, retired in March after twenty-three years of service. Congratulations to Bobbie on her well-deserved retirement and we're pleased to have two new inspectors join the staff – Dwight Cromer and Mark Donadio.
Overall average price accuracy retreated slightly in both supermarkets and convenience stores, with performance remaining very store and, to a lesser extent, company specific. Success is strongly correlated to having store employees who understand and collaboratively follow price integrity best practices and a high level of communication and support from corporate offices regarding price changes. A core mission of the SCP is to help stores and companies find and fix their price accuracy issues.
We continue to track food retail ing and pricing technology trends, which indicate that the very notion of store and shopping and price are being turned on their head with unprecedented speed. And as the shopping experience and overall consumer drivers are changed by the millennial emphasis on convenience and cost, the SCP will need to be prepared to adapt its services in response to the evolving retail landscape.
The SCP would not be celebrating twenty-five years of success were it not for the
contributions of our volunteer Board of Advisors. This diverse group of price accuracy stakeholders helped create the SCP and provides ongoing guidance. Special thanks to Kevin Mullen, who departed our board last November when he retired from SuperValu. Kevin was a
dedicated board member since 1993 – and provided a key link to the many
SuperValu retailers in our program.
We welcome Dan Horman, Retail Technology Manager for SuperValu’s East Region, to the board as Kevin's replacement. Dan has been with SuperValu for 21 years in various retail technology positions and previously worked for Food Lion and Weis Markets. We look forward to availing ourselves of Dan's retail technology expertise.
On behalf of the entire SCP team, I'm delighted to provide you with this annual report and invite you to contact me if you have any questions about it or our program.
Sincerely,
Autumn V. ThomasAutumn V. ThomasExecutive Director
EXECUTIVE DIRECTOR’S MESSAGE
YEAR IN REVIEW

SCP FY 2016 ANNUAL REPORT 4 ׀
BACKGROUND
Developed in 1991, the Scanning Certification Program (SCP) is a voluntary best practices price accuracy program for retailers that seeks to provide price accuracy and appropriate pricing information for shoppers in Pennsylvania and other states. The core objectives of the program are to clearly identify for customers the prices of all items in the store and to ensure that customers are charged the lowest advertised price at checkout.
Program guidelines require stores to ensure that shelf tags are accurate and legible, that scanners are programmed to charge the lowest advertised price, that any errors are documented and promptly corrected, that appropriate employees receive price accuracy training and that consumers receive a free item when they are charged more than the lowest advertised price.
To receive program certification, member stores must also achieve a price accuracy rating of at least 98 percent during an annual price verification inspection. The SCP counts all errors — overcharges, undercharges and items with no price posted — in its audit process.
Retailers want to assure consumers and government officials that scanning is the most accurate method of checkout. The SCP provides public recognition to stores which achieve and maintain high standards of accuracy in the administration of their pricing and scanning systems.
The SCP is recognized by the Pennsylvania Department of Agriculture as an approved privateprice verification certification program under Act 155 of 1996.
Over 1,000 food retailers currently participate in the program. Supermarkets made up the entire membership base until 1999, at which time the first convenience store chain enrolled. Any store which sells food and uses an optical scanning checkout system is eligible to join the SCP.
Despite recent leveling off, annual average price accuracy for participating supermarkets has increased over time,from 96.90 percent in 1991 to 98.68 percent at the end of fiscal 2016. Convenience store price accuracy has see-
sawed upward since 2000, rising from an init ial average of 95.64 percent to 96.80 percent in fiscal 2016.
Error types and average cash values have varied by retail channel. For grocery stores in fiscal 2016, 35 percent of the errors were undercharges, 30 percent were overcharges and 35 percent were unpriced items. For convenience stores during the same period, those figures were 24 percent, 43 percent and 33 percent respectively. The average cash value of undercharges was larger than overcharges in both channels, with supermarkets having larger overall average error values.
The ongoing mission of the SCP is to help member stores work toward 100 percent price accuracy; ensure customer satisfaction in the realm of price accuracy and expand participation, particularly to retail segments not currently represented.
The following sections provide background information on the SCP, fiscal 2016 and cumulative inspection statistics and financial data relating to the operation of the program. Figures contained herein are as of June 30, 2016 unless otherwise indicated.
DEVELOPMENT
Despite several decades of checkout scanner experience in supermarkets nationwide, as well as the more recent mainstream application of the technology in most other retail channels, consumer skepticism remains about the accuracy of point-of-sale scanning systems. Some worry that such systems enable retailers to benefit from overcharge errors on a scale not possible with manually-entered prices.
Government data show that the scanning equipment itself is quite accurate. A 1996 Federal Trade Commission study, Price Check: A Report on the Accuracy of Checkout Scanners, found that “checkout scanners usually result in
OVERVIEW
SCP FY 2016 ANNUAL REPORT 5 ׀
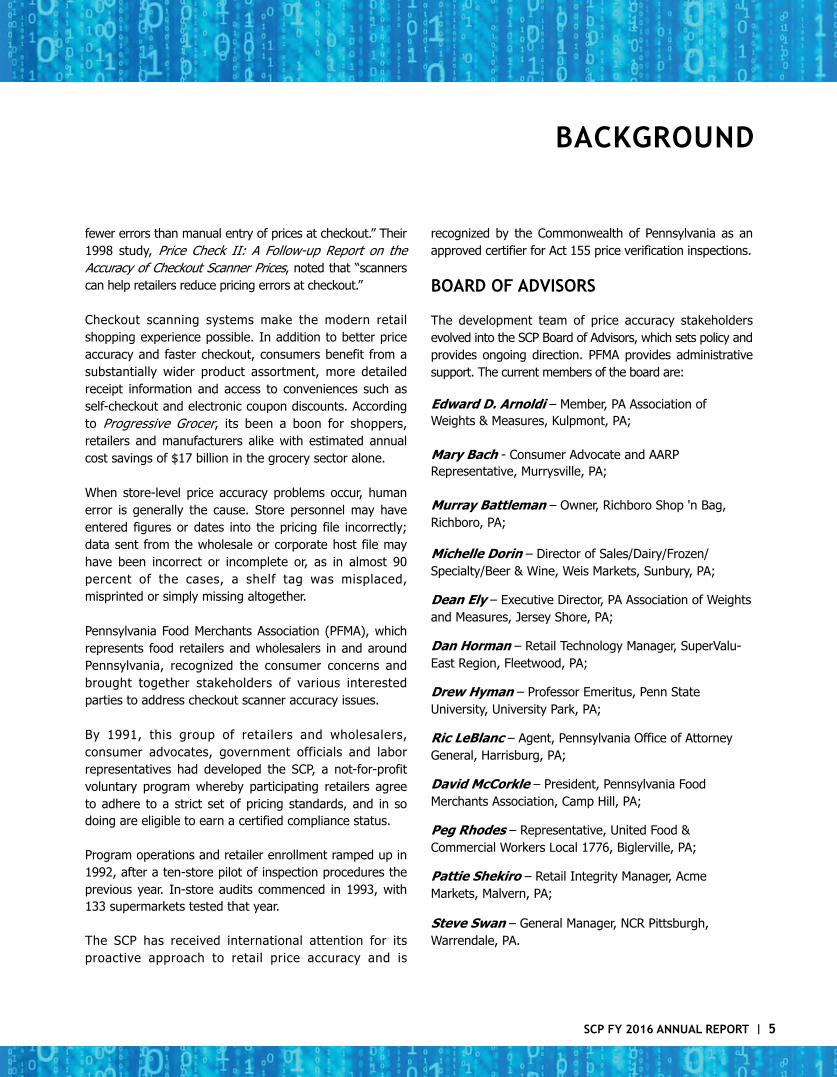
fewer errors than manual entry of prices at checkout.” Their 1998 study, Price Check II: A Follow-up Report on the Accuracy of Checkout Scanner Prices, noted that “scanners can help retailers reduce pricing errors at checkout.”
Checkout scanning systems make the modern retail shopping experience possible. In addition to better price accuracy and faster checkout, consumers benefit from a substantially wider product assortment, more detailed receipt information and access to conveniences such as self-checkout and electronic coupon discounts. According to Progressive Grocer, its been a boon for shoppers, retailers and manufacturers alike with estimated annual cost savings of $17 billion in the grocery sector alone. When store-level price accuracy problems occur, human error is generally the cause. Store personnel may have entered figures or dates into the pricing file incorrectly; data sent from the wholesale or corporate host file may have been incorrect or incomplete or, as in almost 90 percent of the cases, a shelf tag was misplaced, misprinted or simply missing altogether.
Pennsylvania Food Merchants Association (PFMA), which represents food retailers and wholesalers in and around Pennsylvania, recognized the consumer concerns and brought together stakeholders of various interested parties to address checkout scanner accuracy issues.
By 1991, this group of retailers and wholesalers, consumer advocates, government officials and labor representatives had developed the SCP, a not-for-profit voluntary program whereby participating retailers agree to adhere to a strict set of pricing standards, and in so doing are eligible to earn a certified compliance status.
Program operations and retailer enrollment ramped up in 1992, after a ten-store pilot of inspection procedures the previous year. In-store audits commenced in 1993, with 133 supermarkets tested that year.
The SCP has received international attention for its proactive approach to retail price accuracy and is
recognized by the Commonwealth of Pennsylvania as an approved certifier for Act 155 price verification inspections.
BOARD OF ADVISORS
The development team of price accuracy stakeholders evolved into the SCP Board of Advisors, which sets policy and provides ongoing direction. PFMA provides administrative support. The current members of the board are:
Edward D. Arnoldi – Member, PA Association of Weights & Measures, Kulpmont, PA;
Mary Bach - Consumer Advocate and AARP Representative, Murrysville, PA;
Murray Battleman – Owner, Richboro Shop 'n Bag, Richboro, PA;
Michelle Dorin – Director of Sales/Dairy/Frozen/ Specialty/Beer & Wine, Weis Markets, Sunbury, PA;
Dean Ely – Executive Director, PA Association of Weights and Measures, Jersey Shore, PA;
Dan Horman – Retail Technology Manager, SuperValu-East Region, Fleetwood, PA;
Drew Hyman – Professor Emeritus, Penn State University, University Park, PA;
Ric LeBlanc – Agent, Pennsylvania Office of Attorney General, Harrisburg, PA;
David McCorkle – President, Pennsylvania Food Merchants Association, Camp Hill, PA;
Peg Rhodes – Representative, United Food & Commercial Workers Local 1776, Biglerville, PA;
Pattie Shekiro – Retail Integrity Manager, Acme Markets, Malvern, PA;
Steve Swan – General Manager, NCR Pittsburgh, Warrendale, PA.
BACKGROUND

SCP FY 2016 ANNUAL REPORT 6 ׀
PROGRAM PRINCIPLES
The SCP requires all enrollees to adhere to the following three basic pricing principles:
• The store will tell the customer in the aisle — with a shelf tag, sign, manufacturer pre-price or item price — the exact price of each item;
• The point-of-sale checkout scanning system will charge that price at the register;
• The store will adopt a price accuracy policy that gives one of an item free, up to a limit of $10, to any customer who is charged more than the lowest advertised price, and will charge the correct price for any additional units of that item. Retailers may implement a more generous policy such as not having a $10 limit on the value of a free item or expanding the refund policy to include errors where the customer is charged less than the advertised price.
PROGRAM REQUIREMENTS
Stores participating in the SCP must also:
• Adhere to specific requirements regarding the size, information and placement of shelf tags and sale signs;
• Announce the price accuracy policy by posting signs at the store entrance, customer service area and at each cash register;
• Educate employees about price integrity procedures, the price accuracy policy and how to implement it if an error occurs;
• Achieve a price accuracy rating of at least 98 percent on a single-stage random sample of 200 items tested throughout the store.
Program signage and inspection requirements vary by store size. Those with smaller footprints, such as convenience stores, are only required to post price accuracy policy signs at cash registers and must achieve
a pr ice accuracy rating of at least 98 percent on a single-stage random sample of 50 items.
All program requirements and inspection procedures, which are detailed in the Scanning Certification Program Operations Manual, meet or exceed state and federal standards. Each store receives a copy of the operations manual upon enrollment.
PROGRAM FORMAT
When a retailer enrolls in the SCP, program staff will conduct an orientation seminar to familiarize appropriate store personnel with all aspects of the program. Store employees will then perform a baseline self-study of their pricing systems to gauge the store’s performance against the program standards. If performance needs improvement, store personnel will take corrective action.
When all program requirements have been fully implemented, store management will notify the program director. SCP staff will conduct an unannounced in-store inspection soon thereafter. Stores that fully meet all of the program requirements receive a one-year certification. Stores that do not meet the 98 percent accuracy standard, or have not implemented other program requirements, will be subject to another unannounced inspection within 60 days of the initial visit. In Pennsylvania, state law requires stores that score less than 98 percent accuracy and exceed one overcharge error when 50 items are sampled or four overcharges with a 200 item sample, must pass two consecutive follow-up inspections spaced approximately 30 days apart. Inspectors visit participating stores within 30 days of the store’s one-year certification anniversary date to determine continued compliance with program requirements and, if applicable, issue a new certification award.
BACKGROUND
SCP FY 2016 ANNUAL REPORT 7 ׀
Criteria for awarding certification are periodically reviewed by the Board of Advisors. No changes were made to the requirements in fiscal 2016.
In 2012, the SCP Board of Advisors approved the launch of an inspection-only program. Some retailers expressed a desire to have the SCP as their price accuracy inspection vendor, but without mandated best practices standards. Stores that opt for this program do not have to implement the SCP price accuracy policy, price integrity training or shelf tag guidelines; but the price accuracy inspection techniques, scoring criteria and inspection intervals are the same as those of the traditional SCP program.
STORE COMPLIANCE
The SCP is able to monitor store compliance, in part, through the calls shoppers place to the SCP’s toll-free ho t l i ne . The ho t l i ne number, 888-SCAN-SCP, is included on the price accuracy policy signs that retailers post in the i r s tores . Some program participants have also opted to include the SCP hotl ine number on their websites.
Consumer feedback — both positive and negative — helps to ensure that program requirements are carried out properly at store-level. Most of the calls fielded by SCP representatives involve the incorrect implementation of the price accuracy policy, which underscores the importance of ongoing price accuracy and customer service training for all store employees who interact with shoppers.
Unannounced interim inspections may be conducted periodically to verify that certified stores in the traditional SCP program adhere to all price accuracy best practices throughout the period of their certification. During an
interim inspection, the auditor will look for compliance with price accuracy policy signage, employee training and shelf tag requirements, but will not check the store’s price accuracy rate. Any areas of noncompliance are reviewed with store management and must be corrected or the store’s certification may be revoked.
All member stores also receive a semiannual newsletter, Program Notes, shown below, which features news on the work of the Board of Advisors, legislative activity, helpful hints for maintaining price accuracy and profiles
of program participants and staff. The newsletter provides an important link among retailers, the Board of Advisors, regulatory agencies and outside news sources. Program Notes and the SCP's annual report are also available online at www.pfma.net.
CURRENT ENROLLMENT
As of June 2016, 1,029 stores in P e n n s y l v a n i a , N e w J e r s e y , Maryland, Delaware, Ohio, West Virginia and Virginia were enrolled in one of the the SCP's two programs. Members include Acme Markets, Country Fair, Giant
Eagle/GetGo, Giant Food Stores, Price Chopper, Sunoco, SuperValu-Pittsburgh-supplied supermarkets, Tops Markets and Weis Markets. Equally as important are the numerous C & S-supplied and other independent grocers who are also long time participants in the SCP.
Supermarkets make up 67 percent of the membership and convenience stores account for 33 percent. Membership has been steady over the past several years, but will increase in fiscal 2017 as Acme enrolls its 70+ new locations.
The SCP’s member retention rate was excellent over the last year, hovering just below 100 percent. Usually when a store exits the program, it's an obsolete chain store location that has been closed.
BACKGROUND
SCP FY 2016 ANNUAL REPORT 8 ׀
Member stores receive increased customer trust and public recognition for making price accuracy a top priority. Adherence to program requirements helps prevent undercharges that cost retailers money and overcharges that erode consumer confidence. Auditor feedback and customized inspection reporting enables participants to pinpoint and address any price accuracy problems promptly. Certified stores in Pennsylvania also fulfill the state requirements of Act 155 and Act 169 for the annual inspection of checkout scanners.
PENNSYLVANIA SCANNER INSPECTION LAWS
Enacted by the Pennsylvania legislature in 1996, Act 155 mandates that the Pennsylvania Department of Agriculture conduct unannounced annual price verification tests of all retail stores in the state that use optical checkout scanning systems. A price accuracy rate of at least 98 percent is required.
Under Pennsylvania's Certified Universal Product Code (UPC) and Price Look-Up (PLU) Inspector Program, stores with point-of-sale scanning systems are exempt from routine annual Act 155 price verification testing by the Department of Agriculture if they are inspected at least annually, on an unannounced basis, by an approved private certification program that conforms to price verif ication standards adopted by the National Conference on Weights and Measures.
The SCP is an approved Act 155 private certification program. Our seven inspectors are registered by the Pennsylvania Department of Agriculture as certified UPC/PLU inspectors for the purpose of performing price verification tests.
The state-issued inspector certifications are valid for three years, after which time inspectors must partake in additional price verification training and reapply for cert i f icat ion. Training requires part ic ipants to demonstrate hands-on proficiency and pass a test on proper inspection techniques, reporting requirements and relevant statutes.
In November of 2013 and March of 2014, SCP inspectors
underwent continuing education mandated by Act 155, extending their state certifications for another three years. SCP management i s approval by the Pennsylvania Department of Agriculture to perform the required Act 155 training for its inspectors.
As mandated by Pennsylvania's Title 70, § 5.12, the SCP provides a copy of any inspection report for individual Pennsylvania stores to the state Weights and Measures office by the 10th day of the month following when the inspection occurred. The SCP also retains all inspection reports for three years from the date of any inspection.
Historically, the Department has not inspected certified SCP stores unless it received a customer complaint. However, Title 70 states that "the Department may evaluate the performance of a certified UPC/PLU Inspector who conducts inspections for a private certification program by conducting a follow-up inspection of any UPC scanning system or PLU device that has been inspected and tested by the certified UPC/PLU Inspector." The Department has an audit program in place to ensure that certified private certification programs and UPC/PLU inspectors are performing their duties properly and protecting the consumers and businesses they represent.
In 2012, Pennsylvania Governor Tom Corbett signed HB 2366 into law as Act 169 of 2012. Casually referred to as the parking meter bill, it transfers the responsibility to inspect parking meters from the Department of Agriculture to local government units or certified parking meter inspectors.
Perhaps more importantly, in order to improve the state's ability to perform timely inspections of the various weights and measures devices under its jurisdiction, Act 169 changes the frequency that the department must inspect all commercially used vehicle scales and other fuel dispensers from a 12-month period to intervals not greater than 18 months.
BACKGROUND

SCP FY 2016 ANNUAL REPORT 9 ׀
Checkout scanning system inspections go from being required annually to at least once every three years.
Act 169 did not change the annual price verification inspection interval requirement for inspections done by approved private certification programs. For Act 155 and Act 169 compliance, SCP members will continue to undergo annual unannounced price accuracy tests. Similarly, to date, the Pennsylvania Department of Agriculture hasn't issued any new direction to its inspectors with respect to testing price verification systems less frequently than once a year.
The City of Philadelphia also has legislation, Chapter 9-1800 of the Philadelphia Code, governing the use of checkout scanners. Certain retail food establishments in the city are required to obtain a license and pay an annual license fee to use checkout scanners. Regulated stores must also adhere to specific standards for how prices are displayed, adopt and advertise a policy to give customers a free item when a scanner overcharge occurs on a food item and document and maintain records of price errors.
On June 8, 2006, the Philadelphia City Council passed Bill No. 050790, which amended the city’s scanner law to extend the requirements for licensing to nonfood or mercantile retailers and to increase penalties for violations.
Until it was eliminated as a cost-saving measure in 2009, the Philadelphia Department of Weights and Measures performed unannounced quarterly inspections to measure city stores’ price accuracy. A random sample of items was used to calculate the “scanner overcharge ratio.” If either the number or dollar value ratio of overcharges to undercharges was 3:1 or greater, the store was in violation of the code. Three consecutive violations resulted in a store having to item-price merchandise until it passed four consecutive quarterly inspections. Phi ladelphia weights and measures duties have been handed over to the state, but it is unclear at present if or how the Philadelphia quarterly price accuracy audits will be continued.
While certification from the SCP exempts Pennsylvania participants from routine Act 155 and Act 169 inspections, it does not exempt member stores from any Philadelphia scanning system tests.
NATIONAL STANDARD
Though the SCP was started as a best practices pricing program for Pennsylvania supermarkets, it quickly gained a much wider audience.
The federal government looked to the SCP when it developed its own price verification techniques and accuracy standards back in the early 1990s. The National Institute of Standards and Technology (NIST), in cooperation with the National Conference on Weights and Measures (NCWM), developed its Examination Procedure for Price Verification (EPPV) to respond to public concerns about price accuracy.
The EPPV is an inspection procedure that provides regulatory officials and other interested parties with the test procedures and recommended enforcement practices to monitor and evaluate the pricing practices of any store.The EPPV was adopted by the NCWM in 1995, and is published in NIST's Handbook 130, Uniform Laws and Regulations in the areas of Legal Metrology and Engine Fuel Quality.
One of the two sampling methodologies described in the EPPV is randomized sampling, which was modeled on inspections techniques pioneered by the SCP's Autumn Thomas in 1991. This sampling design ensures that all items in a store have a roughly equal chance of being included in the test sample, thereby maximizing uniformity and minimizing inspector bias. Like the SCP, NIST set 98 percent as the accuracy rate which all retail stores must achieve.
Weights and Measures officials in each state determine if their offices will follow the NIST price verification standards when inspecting retail stores within their jurisdictions.
BACKGROUND

SCP FY 2016 ANNUAL REPORT 10 ׀
Pennsylvania’s Division of Weights and Measures uses Handbook 130 procedures whenever it is called on to check a store’s price accuracy.
NIST and SCP representatives have also partnered on price accuracy inspection training. In 2008, at NIST’s Gaithersburg, MD campus, SCP executive director Autumn Thomas gave a seminar for New Jersey and Michigan weights and measures inspectors about the SCP's development, policies, procedures and results.
WORK WITH OTHER GROUPS
In addition to working with NIST, the SCP’s staff and Board of Advisors have collaborated with various industry groups and other government agencies on the issues of price accuracy.
Numerous states interested in developing similar best practices programs have used the SCP as a model and Canadian and Australian officials also studied the SCP approach to price integrity.
The Federal Trade Commission, which produced reports on checkout scanner accuracy in 1996 and 1998, worked with the SCP to learn how the program was created, why stores decided to enroll and how stores work to ensure price accuracy.
SCP staff also participated in a work group led by the Food Marketing Institute that developed a document for grocers entitled Price Verification: Ensuring Accuracy at Store-Level.
SCP and Pennsylvania Division of Weights and Measures managers cooperate frequently on price accuracy and Act 155 and Act 169 compliance issues. In 2006, the Secretary of Agriculture named the SCP’s Mary Bach, Dean Ely and Autumn Thomas to the Department’s then newly created Weights and Measurement Standards Advisory Committee.
More recently, SCP managers were asked to provide input on the state's audit program for certified UPC/PLU inspectors as well as revisions that were made to the Department's price verification training program.
SCP personnel also collaborate with members of the Pennsylvania Assoc ia t ion of Weights and Measures (PAWM), the organization for the commonwealth’s local w e i g h t s a n d m e a s u r e s professionals. PAWM is represented on the SCP Board of Advisors and SCP staff part ic ipate in the association’s events. SCP vice-chair Mary Bach and executive director Autumn Thomas have been featured speakers at PAWM's a n n u a l t e c h n i c a l t r a i n i n g conferences many times over the years. The two organizations have also been involved in numerous price accuracy projects such as the regulation-writing process for Act 155.
BACKGROUND

SCP FY 2016 ANNUAL REPORT 11 ׀
SUPERMARKET INSPECTIONS OVERVIEW
SCP inspectors did 646 supermarket audits in six states last year. Chart A shows that the vast majority of inspections, 85 percent, were done in Pennsylvania. New Jersey and Ohio accounted for 7 percent and 4 percent of the tests each, and a small number of audits were performed in Delaware, Maryland and West Virginia. The drop in Ohio inspection volume between fiscal 2015 and 2016 resulted from a higher than normal number of calendar 2016 inspections occuring early in the SCP's fiscal 2017.
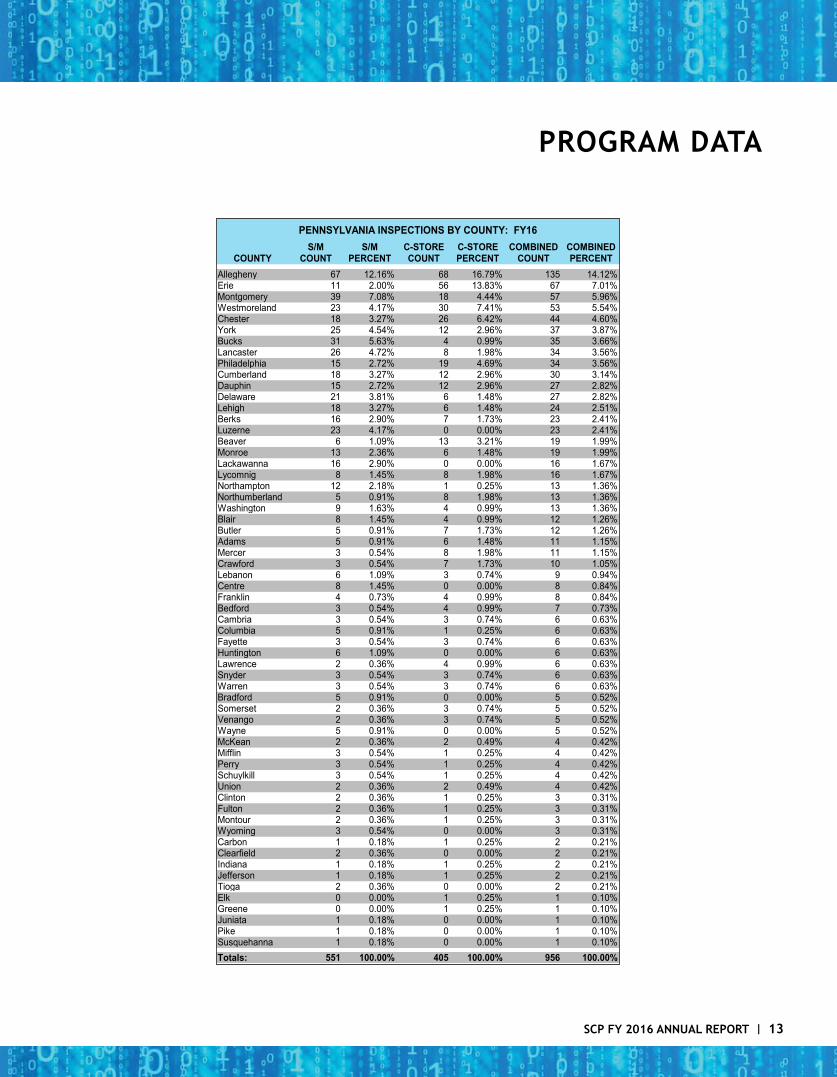
Inspections were conducted in 59 of Pennsylvania’s 67counties last year. The top counties based on inspection
volume were: Allegheny (12 percent); Montgomery (7 percent); Bucks (6 percent); Lancaster and York (5 percent each); and Delaware, Luzerne and Westmoreland (4 percent each). See page 13 for the complete county listing.
Inspections are typically performed during normal weekday business hours. In fiscal 2016, the breakdown of supermarket activity by day-of-week was: 33 percent on Monday; 18 percent on Tuesday; 32 percent on Wednesday; 7 percent on Thursday; 9 percent on Friday; 1 percent on Saturday and none on Sunday.
CHART A - SUPERMARKET INSPECTIONS BY STATE: FY14 - FY16
PROGRAM DATA
440
5575
19 7
531
57
104
16 7 3
551
4625 10 12 2
0
100
200
300
400
500
600
PA NJ OH DE MD WV
FY14 FY15 FY16

SCP FY 2016 ANNUAL REPORT 12 ׀
CONVENIENCE STORE INSPECTIONS OVERVIEW
There were 455 convenience store inspections performed in three states last year, up from 432 tests the previous year and 356 in fiscal 2014. The increase in inspection activity resulted from more stores requiring multiple inspections to earn certification as well as timing with respect to year-end inspections.
Chart B shows that almost all fiscal 2016 convenience store inspections (89 percent) were done in Pennsylvania. Virginia accounted for 6 percent of the tests and New Jersey 5 percent. A minimal number of audits were also done in Delaware and Ohio over the last three years.
Last year SCP inspectors visited convenience stores in 49Pennsylvania counties. The most inspected counties were: Allegheny (17 percent); Erie (14 percent); Westmoreland (7 percent); Chester (6 percent) and Philadelphia (5 percent). See page 13 for the complete county breakdown.
Convenience store inspections take place any day of the week, but predominantly on weekdays. The fiscal 2016 breakdown by day-of-week was: 30 percent on Monday; 22 percent on Tuesday; 28 percent on Wednesday; 7 percent on Thursday; 9 percent on Friday; 3 percent on Saturday and 1 percent on Sunday.
CHART B - CONVENIENCE STORE INSPECTIONS BY STATE: FY14 - FY16
307
24
122
2
393
181
20
405
23 27
0
50
100
150
200
250
300
350
400
450
PA NJ DE VA OH
FY14 FY15 FY16
PROGRAM DATA
SCP FY 2016 ANNUAL REPORT 13 ׀
PROGRAM DATA
S/M S/M C-STORE C-STORE COMBINED COMBINEDCOUNTY COUNT PERCENT COUNT PERCENT COUNT PERCENT
Allegheny 67 12.16% 68 16.79% 135 14.12%Erie 11 2.00% 56 13.83% 67 7.01%Montgomery 39 7.08% 18 4.44% 57 5.96%Westmoreland 23 4.17% 30 7.41% 53 5.54%Chester 18 3.27% 26 6.42% 44 4.60%York 25 4.54% 12 2.96% 37 3.87%Bucks 31 5.63% 4 0.99% 35 3.66%Lancaster 26 4.72% 8 1.98% 34 3.56%Philadelphia 15 2.72% 19 4.69% 34 3.56%Cumberland 18 3.27% 12 2.96% 30 3.14%Dauphin 15 2.72% 12 2.96% 27 2.82%Delaware 21 3.81% 6 1.48% 27 2.82%Lehigh 18 3.27% 6 1.48% 24 2.51%Berks 16 2.90% 7 1.73% 23 2.41%Luzerne 23 4.17% 0 0.00% 23 2.41%Beaver 6 1.09% 13 3.21% 19 1.99%Monroe 13 2.36% 6 1.48% 19 1.99%Lackawanna 16 2.90% 0 0.00% 16 1.67%Lycomnig 8 1.45% 8 1.98% 16 1.67%Northampton 12 2.18% 1 0.25% 13 1.36%Northumberland 5 0.91% 8 1.98% 13 1.36%Washington 9 1.63% 4 0.99% 13 1.36%Blair 8 1.45% 4 0.99% 12 1.26%Butler 5 0.91% 7 1.73% 12 1.26%Adams 5 0.91% 6 1.48% 11 1.15%Mercer 3 0.54% 8 1.98% 11 1.15%Crawford 3 0.54% 7 1.73% 10 1.05%Lebanon 6 1.09% 3 0.74% 9 0.94%Centre 8 1.45% 0 0.00% 8 0.84%Franklin 4 0.73% 4 0.99% 8 0.84%Bedford 3 0.54% 4 0.99% 7 0.73%Cambria 3 0.54% 3 0.74% 6 0.63%Columbia 5 0.91% 1 0.25% 6 0.63%Fayette 3 0.54% 3 0.74% 6 0.63%Huntington 6 1.09% 0 0.00% 6 0.63%Lawrence 2 0.36% 4 0.99% 6 0.63%Snyder 3 0.54% 3 0.74% 6 0.63%Warren 3 0.54% 3 0.74% 6 0.63%Bradford 5 0.91% 0 0.00% 5 0.52%Somerset 2 0.36% 3 0.74% 5 0.52%Venango 2 0.36% 3 0.74% 5 0.52%Wayne 5 0.91% 0 0.00% 5 0.52%McKean 2 0.36% 2 0.49% 4 0.42%Mifflin 3 0.54% 1 0.25% 4 0.42%Perry 3 0.54% 1 0.25% 4 0.42%Schuylkill 3 0.54% 1 0.25% 4 0.42%Union 2 0.36% 2 0.49% 4 0.42%Clinton 2 0.36% 1 0.25% 3 0.31%Fulton 2 0.36% 1 0.25% 3 0.31%Montour 2 0.36% 1 0.25% 3 0.31%Wyoming 3 0.54% 0 0.00% 3 0.31%Carbon 1 0.18% 1 0.25% 2 0.21%Clearfield 2 0.36% 0 0.00% 2 0.21%Indiana 1 0.18% 1 0.25% 2 0.21%Jefferson 1 0.18% 1 0.25% 2 0.21%Tioga 2 0.36% 0 0.00% 2 0.21%Elk 0 0.00% 1 0.25% 1 0.10%Greene 0 0.00% 1 0.25% 1 0.10%Juniata 1 0.18% 0 0.00% 1 0.10%Pike 1 0.18% 0 0.00% 1 0.10%Susquehanna 1 0.18% 0 0.00% 1 0.10%Totals: 551 100.00% 405 100.00% 956 100.00%
PENNSYLVANIA INSPECTIONS BY COUNTY: FY16
SCP FY 2016 ANNUAL REPORT 14 ׀
SUPERMARKET INSPECTION RESULTS
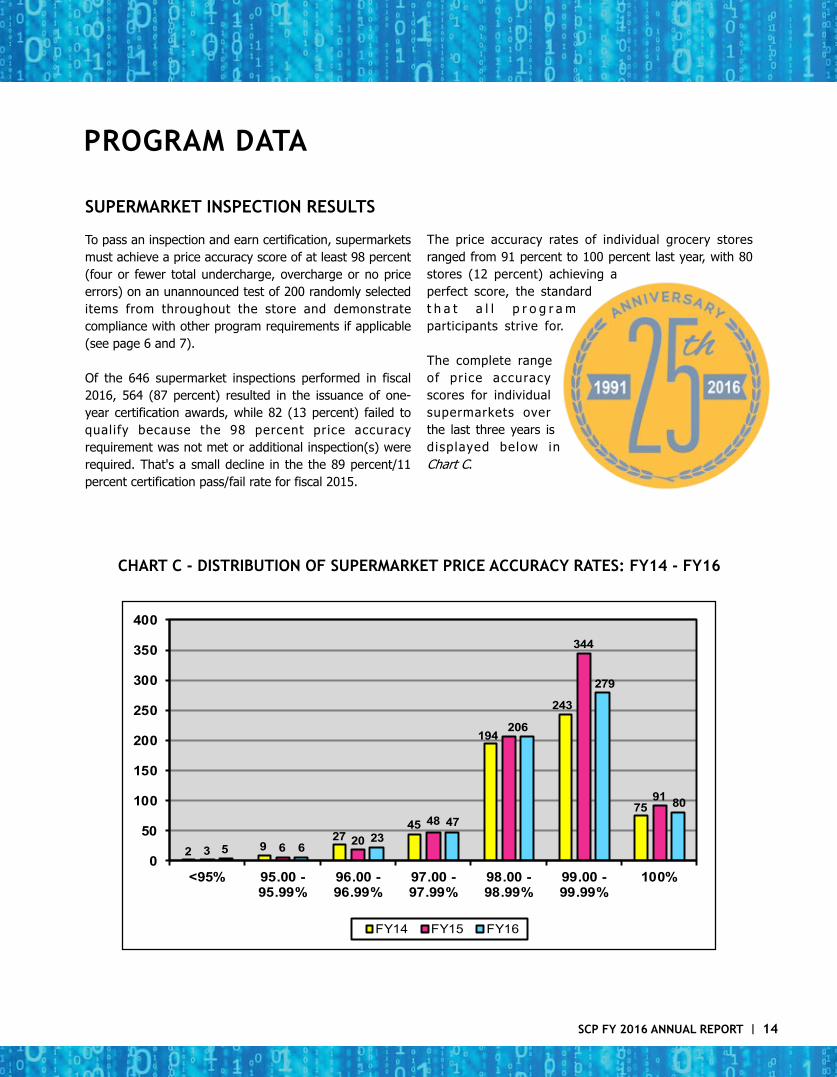
To pass an inspection and earn certification, supermarkets must achieve a price accuracy score of at least 98 percent (four or fewer total undercharge, overcharge or no price errors) on an unannounced test of 200 randomly selected items from throughout the store and demonstrate compliance with other program requirements if applicable (see page 6 and 7).
Of the 646 supermarket inspections performed in fiscal 2016, 564 (87 percent) resulted in the issuance of one-year certification awards, while 82 (13 percent) failed to qualify because the 98 percent price accuracy requirement was not met or additional inspection(s) were required. That's a small decline in the the 89 percent/11 percent certification pass/fail rate for fiscal 2015.
The price accuracy rates of individual grocery stores ranged from 91 percent to 100 percent last year, with 80 stores (12 percent) achieving a perfect score, the standard t h a t a l l p r o g r a m participants strive for.
The complete range of pr ice accuracy scores for individual supermarkets over the last three years is d isplayed below in Chart C.
CHART C - DISTRIBUTION OF SUPERMARKET PRICE ACCURACY RATES: FY14 - FY16
PROGRAM DATA
2 927
45
194
243
75
3 6 2048
344
91
5 623
47
206
279
80
0
50
100
150
200
250
300
350
400
<95% 95.00 -95.99%
96.00 -96.99%
97.00 -97.99%
98.00 -98.99%
99.00 -99.99%
100%
FY14 FY15 FY16
SCP FY 2016 ANNUAL REPORT 15 ׀
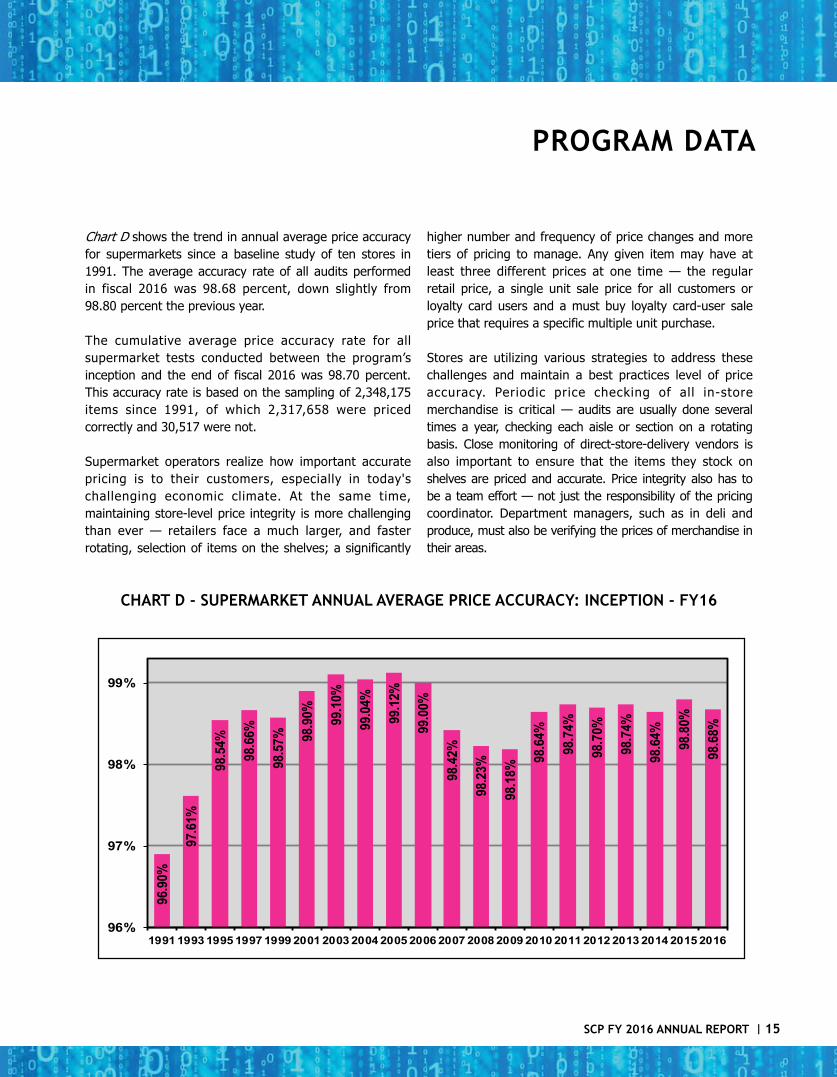
Chart D shows the trend in annual average price accuracy for supermarkets since a baseline study of ten stores in 1991. The average accuracy rate of all audits performed in fiscal 2016 was 98.68 percent, down slightly from 98.80 percent the previous year.
The cumulative average price accuracy rate for all supermarket tests conducted between the program’s inception and the end of fiscal 2016 was 98.70 percent. This accuracy rate is based on the sampling of 2,348,175 items since 1991, of which 2,317,658 were priced correctly and 30,517 were not.
Supermarket operators realize how important accurate pricing is to their customers, especially in today's challenging economic climate. At the same time, maintaining store-level price integrity is more challenging than ever — retailers face a much larger, and faster rotating, selection of items on the shelves; a significantly
higher number and frequency of price changes and more tiers of pricing to manage. Any given item may have at least three different prices at one time — the regular retail price, a single unit sale price for all customers or loyalty card users and a must buy loyalty card-user sale price that requires a specific multiple unit purchase.
Stores are utilizing various strategies to address these challenges and maintain a best practices level of price accuracy. Periodic price checking of all in-store merchandise is critical — audits are usually done several times a year, checking each aisle or section on a rotating basis. Close monitoring of direct-store-delivery vendors is also important to ensure that the items they stock on shelves are priced and accurate. Price integrity also has to be a team effort — not just the responsibility of the pricing coordinator. Department managers, such as in deli and produce, must also be verifying the prices of merchandise in their areas.
CHART D - SUPERMARKET ANNUAL AVERAGE PRICE ACCURACY: INCEPTION - FY16
PROGRAM DATA96
.90%
97.6
1%
98.5
4%
98.6
6%
98.5
7% 98.9
0% 99.1
0%
99.0
4%
99.1
2%
99.0
0%
98.4
2%
98.2
3%
98.1
8%
98.6
4%
98.7
4%
98.7
0%
98.7
4%
98.6
4%
98.8
0%
98.6
8%
96%
97%
98%
99%
1991 1993 1995 1997 1999 2001 2003 2004 2005 2006 2007 2008 2009 2010 2011 2012 2013 2014 2015 2016

SCP FY 2016 ANNUAL REPORT 16 ׀
The SCP defines any of the following as price errors: undercharges (the price at checkout is less than the lowest posted price); overcharges (the price at checkout is more than the lowest posted price) and unpriced items for which there is no shelf tag, sign or item price.
These rigorous standards are designed to ensure that customers find a price announced in the aisle and pay that same price at the checkout. Savvy retailers recognize that having clearly marked prices that match the prices charged at checkout is what gives shoppers confidence in a store's pricing system.
Pennsylvania Department of Agriculture rules are different — only overcharges are tallied as errors. Unpriced items are not scored as errors because state law does not require retailers to post a price. The state does not count undercharges as errors either because of the
impracticality of citing retailers for charging less than the advertised price.
SCP auditors checked the price accuracy of 127,600 supermarket items last year, of which 1,675 (1.32 percent) rang up incorrectly or had no price posted. Of the 1,675 errors found, 578 (35 percent) were undercharges, 503 (30 percent) were overcharges and 594 (35 percent) had no price.
Chart E depicts the trend in error types over time. Undercharges have declined from 62 percent to 35 percent of the total errors while overcharges have increased from 25 percent to 30 percent of the total errors. The percentage of unpriced items has fluctuated and doubled since 1994. Shipper displays, new items, direct-store-delivery merchandise, frozen foods, deli case products and produce are common sources of no price posted errors in supermarkets.
CHART E - SUPERMARKET ERROR TYPES: FY94 - FY16
PROGRAM DATA
62% 61%54% 53%
40%
44%
38%
31%36%
39%
30% 32%34%
35% 36%
35%
25%28% 28%
34%
43%
39%
44%38% 38% 38%
32%
41%47%
37% 37%
30%
13% 11%
18%13%
17% 17% 18% 25% 26%29% 29%
21%
32%28% 27%
0%
10%
20%
30%
40%
50%
60%
70%
1994 1996 1998 2000 2002 2004 2006 2007 2008 2009 2010 2011 2012 2013 2014 2015 2016
Undercharges Overcharges No Price

SCP FY 2016 ANNUAL REPORT 17 ׀
CHART F - DOLLAR VALUE TREND OF SUPERMARKET ERRORS: FY96 - FY16
PROGRAM DATA
In addition to tracking the volume of the three possible error types, the SCP logs the cash value of discrepancies too.
Chart F, below, depicts the dollar value trend of supermarket undercharges and overcharges. The value of the average undercharge has consistently exceeded that of the average overcharge. For fiscal 2016, the cost of the average undercharge and overcharge was $0.84 and $0.63 respectively.
From 1996 through fiscal 2016, the average undercharge increased 44 cents and the average overcharge increased 32 cents. These increases reflect both the general rise in prices over time and the increase in the number of relatively expensive items (i.e. appliances, patio furniture) carried in many supermarkets today.
Regardless of their cash value, almost all of the
undercharge and overcharge errors that SCP auditors found were caused by shelf tag miscues. Items that change price frequently, or are priced by an outside vendor, are most vulnerable. These include ad week sale items, seasonal merchandise, discontinued products and direct-store-delivery goods such as soda, sweet and salty snacks and bread.
There are, however, intended price discrepancies — such as when items go on or off sale. Store personnel cannot change prices in the system simultaneous to updating the shelf tags. To prevent from overcharging the customer, a temporary intentional undercharge is created to give staff time to hang the new shelf tags. For a price increase (decrease), that means employees will change the price on the shelf before (after) changing the price in the store's point-of-sale system. Properly documented intentional undercharges are not counted as errors by SCP inspectors or weights and measures officials.
31¢ 34¢ 35¢ 38¢ 40¢ 42¢ 44¢ 50¢ 44¢ 46¢ 41¢ 47¢64¢
57¢ 63¢
-40¢ -43¢ -48¢
-66¢-74¢ -75¢
-93¢ -94¢ -97¢ -93¢-78¢
-87¢-$1.01-83ȼ -84ȼ
-120¢
-100¢
-80¢
-60¢
-40¢
-20¢
00¢
20¢
40¢
60¢
80¢
1996 1998 2000 2002 2004 2006 2008 2009 2010 2011 2012 2013 2014 2015 2016
Avg Overcharge Avg Undercharge

SCP FY 2016 ANNUAL REPORT 18 ׀
CHART G - SUPERMARKET ERROR VALUES AS A PERCENTAGE OF POSTED PRICE: FY16
PROGRAM DATA
Chart G categoizes the 1,081 supermarket undercharge and overcharge errors according to the value of the error as a percentage of the posted price.
Two hundred and fifty-one (23 percent) of the errors were overcharges whose cash value was less than ten percent of the posted price. An example of such an error would be a two liter bottle of soda that had a posted price of $1.19, but scanned at $1.25. There was an almost equal number of undercharges (235 or 22 percent) with values that were no more than ten percent of the posted price. At the other end of the spectrum, there were only 29 overcharges (3 percent) and 21 undercharges (2 percent) that had cash values of more than 50 percent of the posted price.
Errors are also catalogued by product category and error type
as shown in the table on page 19. Frozen foods accounted for the most errors (13 percent) wi th 216 mispriced or unpriced items. Other top error categories were direct-store-delivery, health and beauty, produce and general grocery.
Each error item is assigned to only one product category, although it is not uncommon for an item to qualify for multiple categories (i.e. frozen shrimp is both a frozen food and seafood item, canned pie filling is a canned item and a baking product). In such cases, the product category deemed to be most relevent is the one selected.
21
12
36
94
180
235
251
134
45
30
14
29
0 50 100 150 200 250
> -50%
-41% to -50%
-31% to -40%
-21% to -30%
-11% to -20%
0% to -10%
0% to 10%
11% to 20%
21% to 30%
31% to 40%
41% to 50%
> 50%
Number of Stores
% Difference
fromPosted Price

SCP FY 2016 ANNUAL REPORT 19 ׀
UNDER UNDER OVER OVER NO PRICE NO PRICE TOTALERROR ERROR ERROR ERROR ERROR ERROR ERROR
PRODUCT CATEGORY COUNT % COUNT % COUNT % COUNT
Auto 0 0.00% 3 75.00% 1 25.00% 4Baby Products 9 34.62% 10 38.46% 7 26.92% 26Bakery 1 11.11% 3 33.33% 5 55.56% 9Baking 7 38.89% 5 27.78% 6 33.33% 18Batteries 3 50.00% 3 50.00% 0 0.00% 6Books/Magazines 1 100.00% 0 0.00% 0 0.00% 1Candy 31 52.54% 11 18.64% 17 28.81% 59Canned Goods 20 45.45% 14 31.82% 10 22.73% 44Cereal 9 26.47% 10 29.41% 15 44.12% 34Cleaners 6 37.50% 3 18.75% 7 43.75% 16Clothing 1 20.00% 3 60.00% 1 20.00% 5Condiments/Spices 47 40.87% 32 27.83% 36 31.30% 115Dairy 17 32.08% 17 32.08% 19 35.85% 53Deli 8 24.24% 6 18.18% 19 57.58% 33Drinks 37 33.64% 41 37.27% 32 29.09% 110DSD 62 38.75% 38 23.75% 60 37.50% 160Frozen 59 27.31% 69 31.94% 88 40.74% 216Grocery - General 34 29.06% 38 32.48% 45 38.46% 117Hardware 0 0.00% 1 100.00% 0 0.00% 1HBA 59 37.11% 61 38.36% 39 24.53% 159Housewares 18 24.00% 18 24.00% 39 52.00% 75Meat/Seafood 10 40.00% 3 12.00% 12 48.00% 25Paper Products 21 37.50% 8 14.29% 27 48.21% 56Pet 21 33.87% 23 37.10% 18 29.03% 62Produce 52 42.28% 40 32.52% 31 25.20% 123Seasonal 2 11.76% 5 29.41% 10 58.82% 17Snacks 28 35.44% 27 34.18% 24 30.38% 79Soap/Detergent 6 23.08% 7 26.92% 13 50.00% 26Stationary 5 26.32% 4 21.05% 10 52.63% 19Tobacco - - - - - - -Toys 4 57.14% 0 0.00% 3 42.86% 7
TOTALS 578 34.51% 503 30.03% 594 35.46% 1,675
SUPERMARKET ERRORS BY PRODUCT CATEGORY: FY16
PROGRAM DATA

SCP FY 2016 ANNUAL REPORT 20 ׀
CONVENIENCE STORE INSPECTION RESULTS
Convenience stores scored a passing grade of at least 98 percent accuracy in 291 of the 455 convenience stores tests done last year. That equates to a pass rate of 64 percent, down from the 68 percent pass rate in fiscal 2015.
Eleven percent of the stores that earned a passing accuracy score did not receive certification at the time of their inspection because Pennsylvania requires two consecutive pass results in certain circumstances (see page 6 for detailed information on reinspections and certification).
Key to pricing success in the convenience store setting is devot ing adequate s ta f f resources to pr i ce
integrity duties, because unlike the dedicated full-time pricing coordinator position in most supermarkets, pricing responsibilities are a part-time focus of several different employees in convenience stores.
The price accuracy rates of individual convenience stores ranged from 80 percent to 100 percent in fiscal 2016. One hundred and thirty-three stores (29 percent) had an accuracy score of 100 percent, compared to 124 stores the previous year.
The complete distribution of price accuracy scores for the last three years is shown below in Chart H.
CHART H - DISTRIBUTION OF CONVENIENCE STORE PRICE ACCURACY RATES: FY14 - FY16
PROGRAM DATA
1116 17
40 36
136
100
13 11
24
47 44
169
124
1520
28
52 49
158
133
0
50
100
150
200
>90% 90% 92% 94% 96% 98% 100%
FY14 FY15 FY16
SCP FY 2016 ANNUAL REPORT 21 ׀
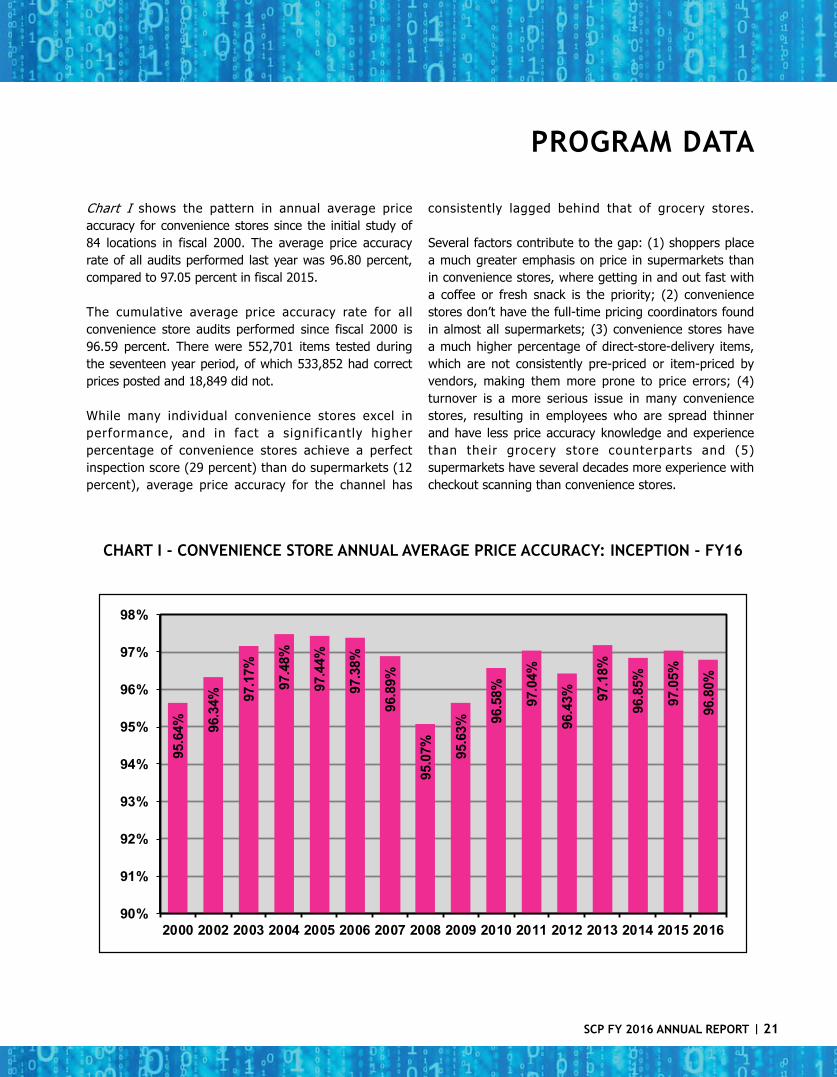
Chart I shows the pattern in annual average price accuracy for convenience stores since the initial study of 84 locations in fiscal 2000. The average price accuracy rate of all audits performed last year was 96.80 percent, compared to 97.05 percent in fiscal 2015.
The cumulative average price accuracy rate for all convenience store audits performed since fiscal 2000 is 96.59 percent. There were 552,701 items tested during the seventeen year period, of which 533,852 had correct prices posted and 18,849 did not.
While many individual convenience stores excel in performance, and in fact a signif icantly higher percentage of convenience stores achieve a perfect inspection score (29 percent) than do supermarkets (12 percent), average price accuracy for the channel has
consistently lagged behind that of grocery stores.
Several factors contribute to the gap: (1) shoppers place a much greater emphasis on price in supermarkets than in convenience stores, where getting in and out fast with a coffee or fresh snack is the priority; (2) convenience stores don’t have the full-time pricing coordinators found in almost all supermarkets; (3) convenience stores have a much higher percentage of direct-store-delivery items, which are not consistently pre-priced or item-priced by vendors, making them more prone to price errors; (4) turnover is a more serious issue in many convenience stores, resulting in employees who are spread thinner and have less price accuracy knowledge and experience than their grocery store counterparts and (5) supermarkets have several decades more experience with checkout scanning than convenience stores.
CHART I - CONVENIENCE STORE ANNUAL AVERAGE PRICE ACCURACY: INCEPTION - FY16
PROGRAM DATA95
.64% 96
.34% 97
.17%
97.4
8%
97.4
4%
97.3
8%
96.8
9%
95.0
7% 95.6
3%
96.5
8% 97.0
4%
96.4
3% 97.1
8%
96.8
5%
97.0
5%
96.8
0%
90%
91%
92%
93%
94%
95%
96%
97%
98%
2000 2002 2003 2004 2005 2006 2007 2008 2009 2010 2011 2012 2013 2014 2015 2016
SCP FY 2016 ANNUAL REPORT 22 ׀
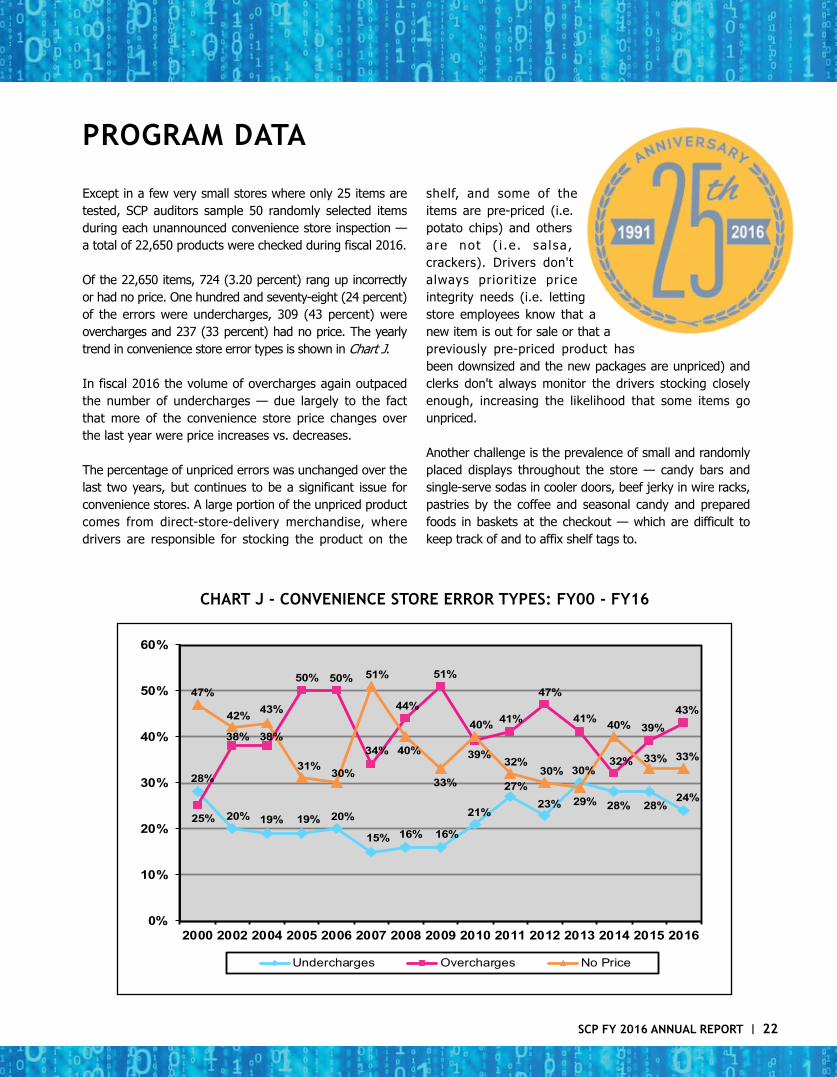
Except in a few very small stores where only 25 items are tested, SCP auditors sample 50 randomly selected items during each unannounced convenience store inspection — a total of 22,650 products were checked during fiscal 2016.
Of the 22,650 items, 724 (3.20 percent) rang up incorrectly or had no price. One hundred and seventy-eight (24 percent) of the errors were undercharges, 309 (43 percent) were overcharges and 237 (33 percent) had no price. The yearly trend in convenience store error types is shown in Chart J.
In fiscal 2016 the volume of overcharges again outpaced the number of undercharges — due largely to the fact that more of the convenience store price changes over the last year were price increases vs. decreases.
The percentage of unpriced errors was unchanged over the last two years, but continues to be a significant issue for convenience stores. A large portion of the unpriced product comes from direct-store-delivery merchandise, where drivers are responsible for stocking the product on the
shelf, and some of the items are pre-priced (i.e. potato chips) and others are not ( i .e . sa lsa , crackers). Drivers don't always priorit ize price integrity needs (i.e. letting store employees know that a new item is out for sale or that a previously pre-priced product has been downsized and the new packages are unpriced) and clerks don't always monitor the drivers stocking closely enough, increasing the likelihood that some items go unpriced.
Another challenge is the prevalence of small and randomly placed displays throughout the store — candy bars and single-serve sodas in cooler doors, beef jerky in wire racks, pastries by the coffee and seasonal candy and prepared foods in baskets at the checkout — which are difficult to keep track of and to affix shelf tags to.
CHART J - CONVENIENCE STORE ERROR TYPES: FY00 - FY16
PROGRAM DATA
28%
20% 19% 19% 20%
15% 16% 16%
21%
27%23%
30%
28% 28%24%
25%
38% 38%
50% 50%
34%
44%
51%
39%
41%
47%
41%
32%
39%43%
47%
42% 43%
31% 30%
51%
40%
33%
40%
32%30%
29%
40%
33% 33%
0%
10%
20%
30%
40%
50%
60%
2000 2002 2004 2005 2006 2007 2008 2009 2010 2011 2012 2013 2014 2015 2016
Undercharges Overcharges No Price
SCP FY 2016 ANNUAL REPORT 23 ׀
CHART K - DOLLAR VALUE TREND OF CONVENIENCE STORE ERRORS: FY00 - FY16
PROGRAM DATA
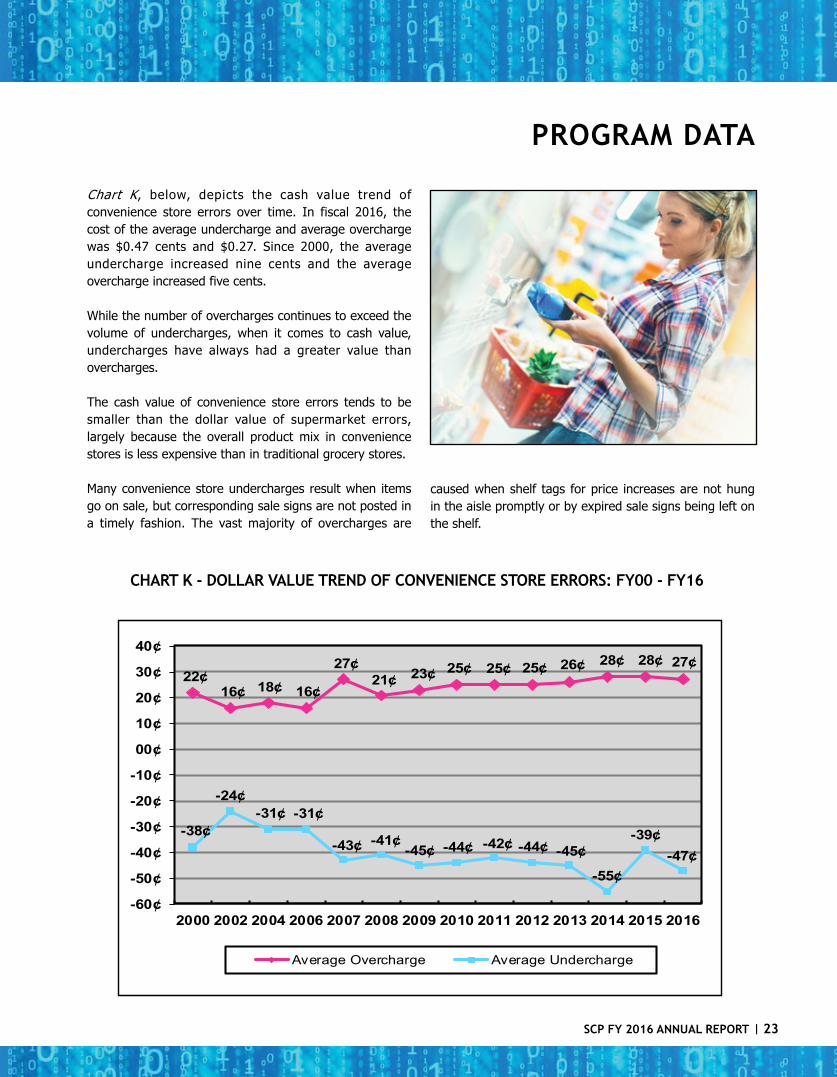
Chart K, below, depicts the cash value trend of convenience store errors over time. In fiscal 2016, the cost of the average undercharge and average overcharge was $0.47 cents and $0.27. Since 2000, the average undercharge increased nine cents and the average overcharge increased five cents.
While the number of overcharges continues to exceed the volume of undercharges, when it comes to cash value, undercharges have always had a greater value than overcharges.
The cash value of convenience store errors tends to be smaller than the dollar value of supermarket errors, largely because the overall product mix in convenience stores is less expensive than in traditional grocery stores.
Many convenience store undercharges result when items go on sale, but corresponding sale signs are not posted in a timely fashion. The vast majority of overcharges are
caused when shelf tags for price increases are not hung in the aisle promptly or by expired sale signs being left on the shelf.
22¢16¢ 18¢ 16¢
27¢21¢ 23¢ 25¢ 25¢ 25¢ 26¢ 28¢ 28¢ 27¢
-38¢
-24¢-31¢ -31¢
-43¢ -41¢-45¢ -44¢ -42¢ -44¢ -45¢
-55¢
-39¢-47¢
-60¢
-50¢
-40¢
-30¢
-20¢
-10¢
00¢
10¢
20¢
30¢
40¢
2000 2002 2004 2006 2007 2008 2009 2010 2011 2012 2013 2014 2015 2016
Average Overcharge Average Undercharge

SCP FY 2016 ANNUAL REPORT 24 ׀
CHART L - CONVENIENCE STORE ERROR VALUES AS A PERCENTAGE OF POSTED PRICE: FY16
PROGRAM DATA
There were 487 convenience store undercharge and overcharge errors found during fiscal 2016 — Chart L illustrates the number of individual cash value errors based on the percentage of difference from the error item's retail price.
Almost half (44 percent) of the errors were relatively small overcharges with cash values of no more than 10 percent of the posted price. Undercharges of the same scale accounted for 78 (16 percent) of the total errors that had a cash value.
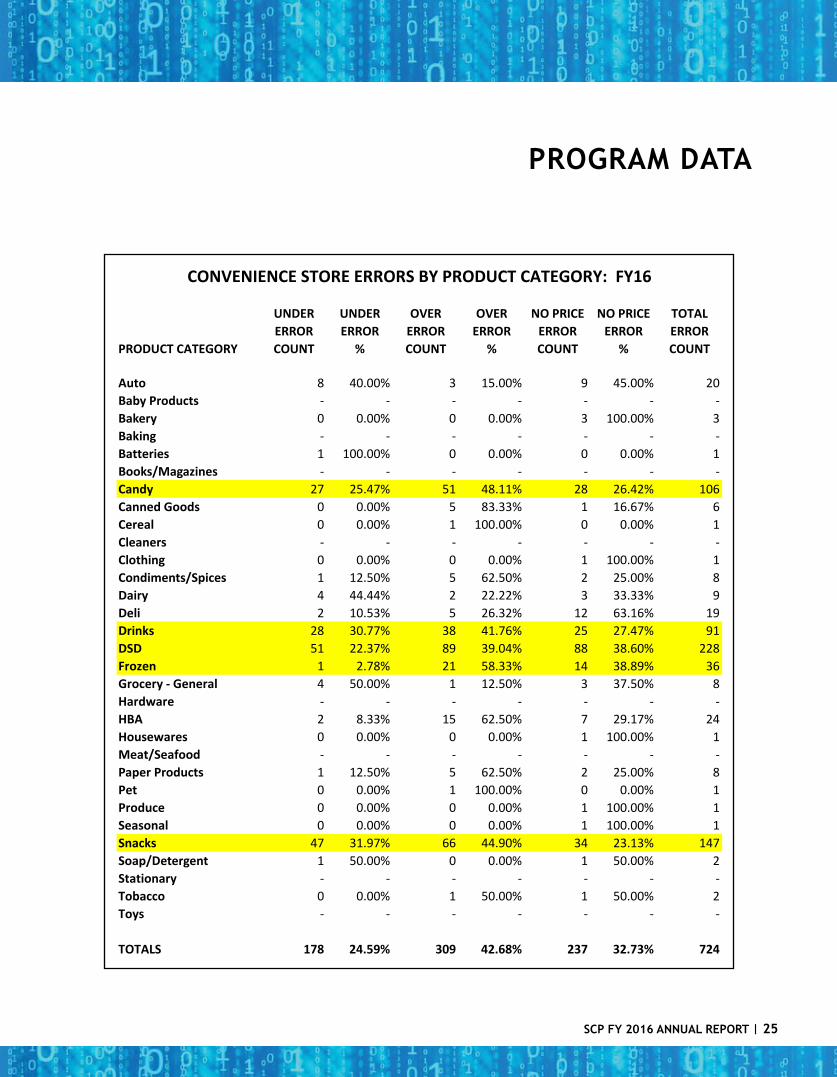
Convenience store errors are also examined by product category and error type. The table on the next page
shows that the items most often mispriced o r u n p r i c e d i n descend ing order were d i rec t-s tore-delivery, snacks, candy, drinks and frozen foods. Direct-store-delivery alone accounted for 31 percent of total convenience store errors found last year.
The prevelence of errors in these categoies is not surprising insofar as these categories represent a large percentage of the items sold in convenience stores.
2
8
10
24
43
78
214
75
13
8
8
4
0 50 100 150 200 250
> -50%
-41% to -50%
-31% to -40%
-21% to -30%
-11% to -20%
0% to -10%
0% to 10%
11% to 20%
21% to 30%
31% to 40%
41% to 50%
> 50%
Number of Stores
% Difference from
Posted Price
SCP FY 2016 ANNUAL REPORT 25 ׀
PROGRAM DATA
UNDER UNDER OVER OVER NO PRICE NO PRICE TOTALERROR ERROR ERROR ERROR ERROR ERROR ERROR
PRODUCT CATEGORY COUNT % COUNT % COUNT % COUNT
Auto 8 40.00% 3 15.00% 9 45.00% 20Baby Products - - - - - - -Bakery 0 0.00% 0 0.00% 3 100.00% 3Baking - - - - - - -Batteries 1 100.00% 0 0.00% 0 0.00% 1Books/Magazines - - - - - - -Candy 27 25.47% 51 48.11% 28 26.42% 106Canned Goods 0 0.00% 5 83.33% 1 16.67% 6Cereal 0 0.00% 1 100.00% 0 0.00% 1Cleaners - - - - - - -Clothing 0 0.00% 0 0.00% 1 100.00% 1Condiments/Spices 1 12.50% 5 62.50% 2 25.00% 8Dairy 4 44.44% 2 22.22% 3 33.33% 9Deli 2 10.53% 5 26.32% 12 63.16% 19Drinks 28 30.77% 38 41.76% 25 27.47% 91DSD 51 22.37% 89 39.04% 88 38.60% 228Frozen 1 2.78% 21 58.33% 14 38.89% 36Grocery - General 4 50.00% 1 12.50% 3 37.50% 8Hardware - - - - - - -HBA 2 8.33% 15 62.50% 7 29.17% 24Housewares 0 0.00% 0 0.00% 1 100.00% 1Meat/Seafood - - - - - - -Paper Products 1 12.50% 5 62.50% 2 25.00% 8Pet 0 0.00% 1 100.00% 0 0.00% 1Produce 0 0.00% 0 0.00% 1 100.00% 1Seasonal 0 0.00% 0 0.00% 1 100.00% 1Snacks 47 31.97% 66 44.90% 34 23.13% 147Soap/Detergent 1 50.00% 0 0.00% 1 50.00% 2Stationary - - - - - - -Tobacco 0 0.00% 1 50.00% 1 50.00% 2Toys - - - - - - -
TOTALS 178 24.59% 309 42.68% 237 32.73% 724
CONVENIENCE STORE ERRORS BY PRODUCT CATEGORY: FY16
SCP FY 2016 ANNUAL REPORT 26 ׀
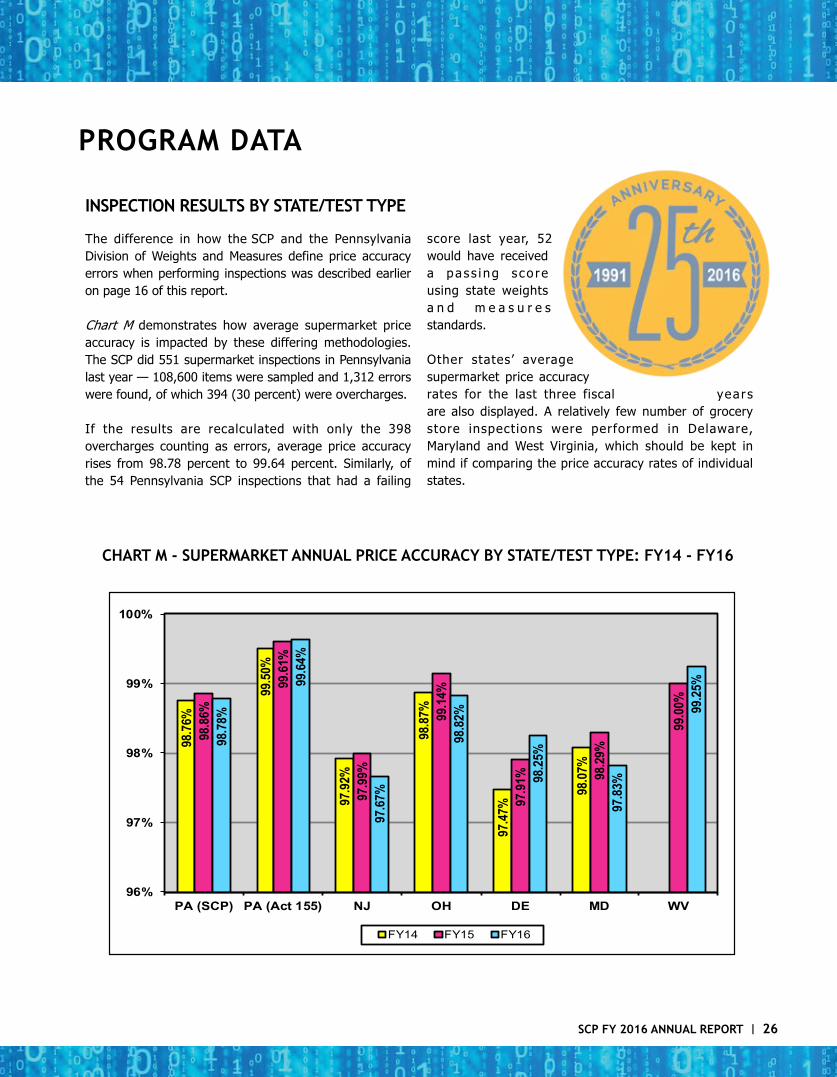
INSPECTION RESULTS BY STATE/TEST TYPE
The difference in how the SCP and the Pennsylvania Division of Weights and Measures define price accuracy errors when performing inspections was described earlier on page 16 of this report.
Chart M demonstrates how average supermarket price accuracy is impacted by these differing methodologies. The SCP did 551 supermarket inspections in Pennsylvania last year — 108,600 items were sampled and 1,312 errors were found, of which 394 (30 percent) were overcharges.
If the results are recalculated with only the 398 overcharges counting as errors, average price accuracy rises from 98.78 percent to 99.64 percent. Similarly, of the 54 Pennsylvania SCP inspections that had a failing
score last year, 52 would have received a pas s i ng s co re using state weights a n d m e a s u r e s standards.
Other states’ average supermarket price accuracy rates for the last three fiscal years are also displayed. A relatively few number of grocery store inspections were performed in Delaware, Maryland and West Virginia, which should be kept in mind if comparing the price accuracy rates of individual states.
CHART M - SUPERMARKET ANNUAL PRICE ACCURACY BY STATE/TEST TYPE: FY14 - FY16
98.7
6%
99.5
0%
97.9
2%
98.8
7%
97.4
7%
98.0
7%
98.8
6%
99.6
1%
97.9
9%
99.1
4%
97.9
1% 98.2
9%
99.0
0%
98.7
8%
99.6
4%
97.6
7%
98.8
2%
98.2
5%
97.8
3%
99.2
5%
96%
97%
98%
99%
100%
PA (SCP) PA (Act 155) NJ OH DE MD WV
FY14 FY15 FY16
PROGRAM DATA
SCP FY 2016 ANNUAL REPORT 27 ׀
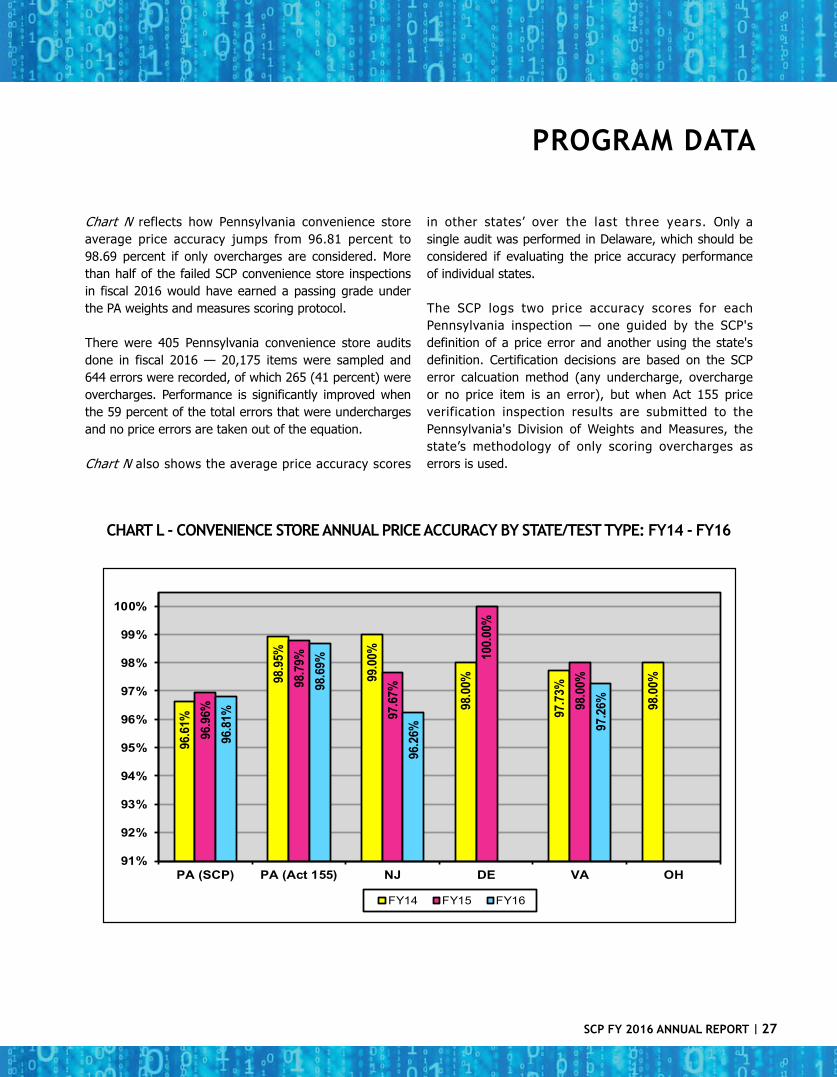
Chart N reflects how Pennsylvania convenience store average price accuracy jumps from 96.81 percent to 98.69 percent if only overcharges are considered. More than half of the failed SCP convenience store inspections in fiscal 2016 would have earned a passing grade under the PA weights and measures scoring protocol.
There were 405 Pennsylvania convenience store audits done in fiscal 2016 — 20,175 items were sampled and 644 errors were recorded, of which 265 (41 percent) were overcharges. Performance is significantly improved when the 59 percent of the total errors that were undercharges and no price errors are taken out of the equation.
Chart N also shows the average price accuracy scores
in other states’ over the last three years. Only a single audit was performed in Delaware, which should be considered if evaluating the price accuracy performance of individual states.
The SCP logs two price accuracy scores for each Pennsylvania inspection — one guided by the SCP's definition of a price error and another using the state's definition. Certification decisions are based on the SCP error calcuation method (any undercharge, overcharge or no price item is an error), but when Act 155 price verification inspection results are submitted to the Pennsylvania's Division of Weights and Measures, the state’s methodology of only scoring overcharges as errors is used.
CHART L - CONVENIENCE STORE ANNUAL PRICE ACCURACY BY STATE/TEST TYPE: FY14 - FY16
PROGRAM DATA96
.61%
98.9
5%
99.0
0%
98.0
0%
97.7
3%
98.0
0%
96.9
6%
98.7
9%
97.6
7%
100.
00%
98.0
0%
96.8
1%
98.6
9%
96.2
6% 97.2
6%
91%
92%
93%
94%
95%
96%
97%
98%
99%
100%
PA (SCP) PA (Act 155) NJ DE VA OH
FY14 FY15 FY16
SCP FY 2016 ANNUAL REPORT 28 ׀
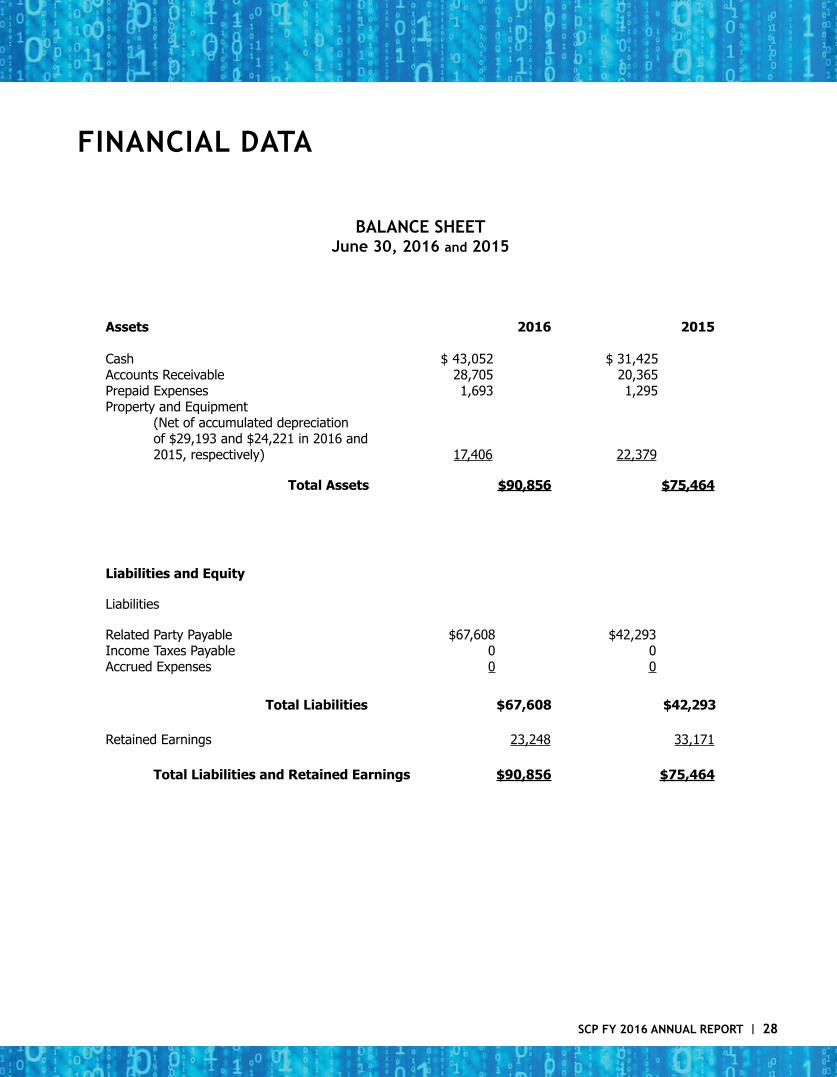
BALANCE SHEETJune 30, 2016 and 2015
Assets 2016 2015
Cash $ 43,052 $ 31,425Accounts Receivable 28,705 20,365Prepaid Expenses 1,693 1,295Property and Equipment (Net of accumulated depreciation of $29,193 and $24,221 in 2016 and 2015, respectively) 17,406 22,379
Total Assets $90,856 $75,464
Liabilities and Equity
Liabilities
Related Party Payable $67,608 $42,293Income Taxes Payable 0 0 Accrued Expenses 0 0 Total Liabilities $67,608 $42,293
Retained Earnings 23,248 33,171 Total Liabilities and Retained Earnings $90,856 $75,464
FINANCIAL DATA

SCP FY 2016 ANNUAL REPORT 29 ׀
STATEMENT OF OPERATIONS AND RETAINED EARNINGSYear ending June 30, 2016 and 2015
2016 2015
Program Revenue $115,665 $125,513
Operating Expenses Salary Expense $79,896 $70,784
Payroll Taxes 7,146 8,334
Telephone 2,348 2,440
Supplies 2,110 3,817
Travel 14,025 17,891
Other Expenses 4,543 5,447
Depreciation 4,973 2,487
Management Fee 0 0
Total Operating Expenses $115,041 $111,200
Taxes $0 $0
Net Income 624 14,313
Beginning Retained Earnings 22,624 18,858
Ending Retained Earnings $23,248 $33,171
FINANCIAL DATA

SCP FY 2016 ANNUAL REPORT 30 ׀
STATEMENT OF CASH FLOWS (DIRECT METHOD)INCREASE (DECREASE) IN CASH AND CASH EQUIVALENTS
Year Ending June 30, 2016 and 2015
Cash Flows from Operating Activities 2016 2015
Cash Received from Program Revenue $107,325 $119,425
Related Party Payable 15,315 12,887
Income Taxes Payable 0 0
Cash Paid to Suppliers and Employees (111,013) (109,041) Net Cash Provided by Operating Activities $11,627 $23,271
Cash Flows Used For Investing Activities
Purchase of Auto $0 $(24,865)
Net Cash Used For Investing Activities $0 $0
Net Increase (Decrease) in Cash and Cash Equivalents $11,627 $(1,594)
Cash and Cash Equivalents at Beginning of Period 31,425 33,019
Cash and Cash Equivalents at End of Period $43,052 $31,425
FINANCIAL DATA

SCP FY 2016 ANNUAL REPORT 31 ׀
NOTES TO FINANCIAL STATEMENTSYear Ending June 30, 2016 and 2015
Description of Activity and Significant Accounting Policies
• Description of ActivityThe Scanning Certification Program Board of Advisors creates standards and guidelines for business to follow in the administration of their scanning and related pricing programs, and offers certification for those stores which meet the standards and guidelines.
• Affiliates TheProgramisaffiliatedwiththePennsylvaniaFoodMerchantsAssociation(PFMA).
• Revenue Recognition – Revenue is recognized upon completion of the store certification examination.
• Deferred Income – Scanning Certification Program fees paid by stores in advance of certification are recorded as deferred income.
• Organization Costs – Organization costs are amortized by the straight-line method over 60 months.
• Property and Equipment – Equipment purchased is recorded at cost. Depreciation is provided by the straight-line method over five years for financial reporting and accelerated methods over five years as prescribed by income tax regulations.
Related Party Payable
Whennecessary,PFMAadvancesworkingcapitalfundsasasubsidytotheScanningCertificationProgram.AnycashgeneratedbytheScanningCertificationPrograminexcessofitsexpendituresisused to offset these advances.
Accounts Receivable
AccountsreceivableconsistoffeesduetotheScanningCertificationProgramforcompletedcertifica-tion examinations.
Income Taxes
TheScanningCertificationProgramfilesafederalincometaxreturnbutisexemptforstateincomeand franchise tax reporting purposes.
ForyearendedJune30,2016,andperiodendedJune30,2015,nosignificantdifferencesexistedbetweentheScanningCertificationProgram'sincomereportedforfinancialstatementpurposesandthat reported for tax return purposes.
FINANCIAL DATA
P.O. Box 870Camp Hill, PA 17001-0870
888-SCAN-SCP 717-730-0953 fax
e-mail: [email protected] site: www.pfma.org
For more information contact:Autumn Thomas, Executive Director
OFFICERS OF THE SCP BOARD OF ADVISORSDrew Hyman, Chairman
Mary Bach, Vice ChairwomanPattie Shekiro, Treasurer
Autumn Thomas, Secretary