2016 ACUREVIEW OF RESULTS AND AUDITED FINANCIAL STATEMENTS · review of results and audited...
43
C AUSTRALIAN CATHOLIC UNIVERSITY 2016 ACU REVIEW OF RESULTS AND AUDITED FINANCIAL STATEMENTS
Transcript of 2016 ACUREVIEW OF RESULTS AND AUDITED FINANCIAL STATEMENTS · review of results and audited...

C
AUSTRALIAN CATHOLIC UNIVERSITY
2016 ACUREVIEW OF RESULTS AND AUDITED FINANCIAL STATEMENTS

acu.edu.au
CONTENTSDIRECTORS' REPORT 2
LEAD AUDITOR'S INDEPENDENCE DECLARATION 6
AUDITED FINANCIAL STATEMENTS 8 INCOME STATEMENT 9 STATEMENT OF COMPREHENSIVE INCOME 10 BALANCE SHEET 11 STATEMENT OF CHANGES IN EQUITY 12 STATEMENT OF CASH FLOWS 13
NOTES TO THE FINANCIAL STATEMENTS 14 STATEMENT OF SIGNIFICANT ACCOUNTING POLICIES 15 REVENUE 18 EXPENSES 20 FINANCE EXPENSE 21 AUDITOR'S REMUNERATION - KPMG 21 CASH AND CASH EQUIVALENTS 22 TRADE AND OTHER RECEIVABLES 22 OTHER INVESTMENTS 22 OTHER ASSETS 22 PROPERTY, PLANT & EQUIPMENT 23 INTANGIBLE ASSETS 25 TRADE AND OTHER PAYABLES 25 EMPLOYEE BENEFITS 26 BORROWINGS 27 OTHER LIABILITIES 28 RESERVES 29 RETAINED EARNINGS 30 COMMITMENTS 30 DIRECTORS AND KEY MANAGEMENT PERSONNEL DISCLOSURES 30 RELATED PARTIES 31 FINANCIAL INSTRUMENTS DISCLOSURE 32 EQUITY 34 NOTES TO THE STATEMENT OF CASH FLOWS 34 ACQUITTAL OF COMMONWEALTH GOVERNMENT FINANCIAL ASSISTANCE 35
DIRECTORS’ DECLARATION 38
INDEPENDENT AUDIT REPORT 40
2
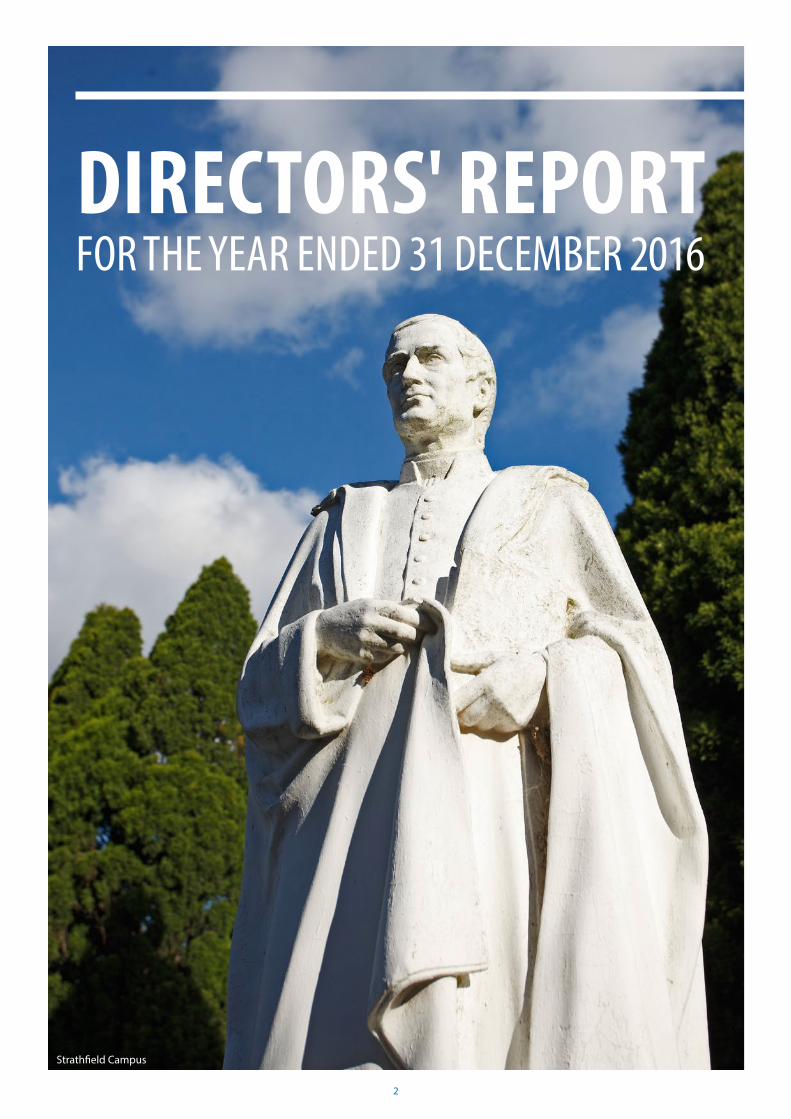
DIRECTORS' REPORT FOR THE YEAR ENDED 31 DECEMBER 2016
Strathfield Campus

3
The directors present their report together with the financial statements of Australian Catholic University Limited (the University) for the year ended 31 December 2016 and the Auditor's report thereon.
DIRECTORSThe directors of the University in office at any time during or since the end of the financial year are:
MR JOHN JOSEPH CARROLL BBus MAppFin (Macq) CPA MAIPM Financier 19 May 2006 (3 May 2016)
PROFESSOR TONY CIRO BA BEc(Hons) LLB(Hons) PhD (Monash), BCL LLM (Oxf ) University Professor 6 September 2010 (3 May 2016)
PROFESSOR GREGORY JOSEPH CRAVEN AO GCSG BA LLB(Hons) LLM (Melb) Vice-Chancellor and President 1 February 2008
THE HON JUSTICE JAMES DOUGLAS BA LLB (UQ), LLB (Cambridge) Supreme Court Judge 11 June 2013
MR STEPHEN NOEL ELDER OAM BEd (VU), DipEd (La Trobe), FAIM Educational Administrator 23 May 2008
THE HON JOHN FAHEY AC Solicitor (LPAB), DipLaw (USyd) Chancellor and former Premier of NSW 4 September 2014
PROFESSOR KAREN FLOWERS BHSc (UCCQ), GradCertLead&CathCult (ACU), MClinEd (UNSW), PhD (Griffith) RN RM University Professor 1 January 2016
DR BILL FRANZSEN BSc(Hons) (UWA), GradCertHEd (ACU), PhD (USyd) University Academic 4 May 2016
MR EAMON GLASS BNurs BPM (ACU) Student 1 January 2016
PROFESSOR MARGOT HILLEL OAM BA (La Trobe), MA (Melb), PhD (Monash) University Professor and Chair of Academic Board 16 June 2010
MS CECILIA HOLLIS-JONES BAppSc GradDipTeach(Sec) (QUT), GradDipA(Theol) (ACU) Educational Administrator 30 May 2013
PROFESSOR JAMES MCLAREN MA (Melb), DPhil (Oxf ) University Professor 16 June 2010 (3 May 2016)
MS MOIRA THERESE NAJDECKI BA (ANU), DipEd (CCAE), MA (UNSW), GradDipRelEd MEdLead (ACU) Educational Administrator 19 May 2006
MR JULIEN O’CONNELL AM DipAcct (BTS), FAICD Pro-Chancellor and Business Executive 1 January 2016
MR DAVID BRIAN O’CONNOR AM BA (UNE), CertPersAdmin (Syd Tech Coll) Retired Public Servant 14 April 2000
ASSOC PROFESSOR MICHAEL ONDAATJE BA(Hons) PhD (UWA) University Associate Professor 4 May 2016
THE HON BARBARA PERRY BA LLB (USyd) Retired Politician, Community Services Administrator 4 May 2016
THE MOST REVEREND CHRISTOPHER PROWSE BA (Monash), BTheol (MCD), LicMoralTheol (PUG), DMoralTheol (PUL) Archbishop of Canberra and Goulburn 23 May 2014
MS ANNETTE SCHMIEDE BEc (USyd) Health Administrator 1 January 2016
MS BERNADETTE MARIE THERESE STEELE BA(Hons) LLB (Melb) Lawyer 11 August 2009
MS MARGARET MARY VIDER BAppSciNurs (QIT), GradDipA(LeadSt) (ACU) Retired Health Professional 21 May 2010
4
The senior executive of Australian Catholic University Limited at the date of this report are:
VICE-CHANCELLOR AND PRESIDENTPROFESSOR GREG CRAVEN AO GCSG BA LLB(Hons) LLM (Melb) 1 February 2008
PROVOST & DEPUTY VICE-CHANCELLOR (ACADEMIC)PROFESSOR PAULINE NUGENT BAppSc (LincolnInstHlthSc) MEd (Monash) RN 14 February 2011
CHIEF OPERATING OFFICER AND DEPUTY VICE-CHANCELLORDR STEPHEN WELLER BA (USyd), MCom (UWS), MBA (UTS), PhD (VU) 1 April 2013
DEPUTY VICE-CHANCELLOR (STUDENTS, LEARNING AND TEACHING)PROFESSOR ANNE CUMMINS BEd (Canberra CAE), MA (Macq), MEdL (ACU), GradDipEd(RelSt) (CCE Sydney) 1 July 2009
DEPUTY VICE-CHANCELLOR (RESEARCH)PROFESSOR WAYNE MCKENNA BA(Hons) PhD (Leeds) 4 February 2013
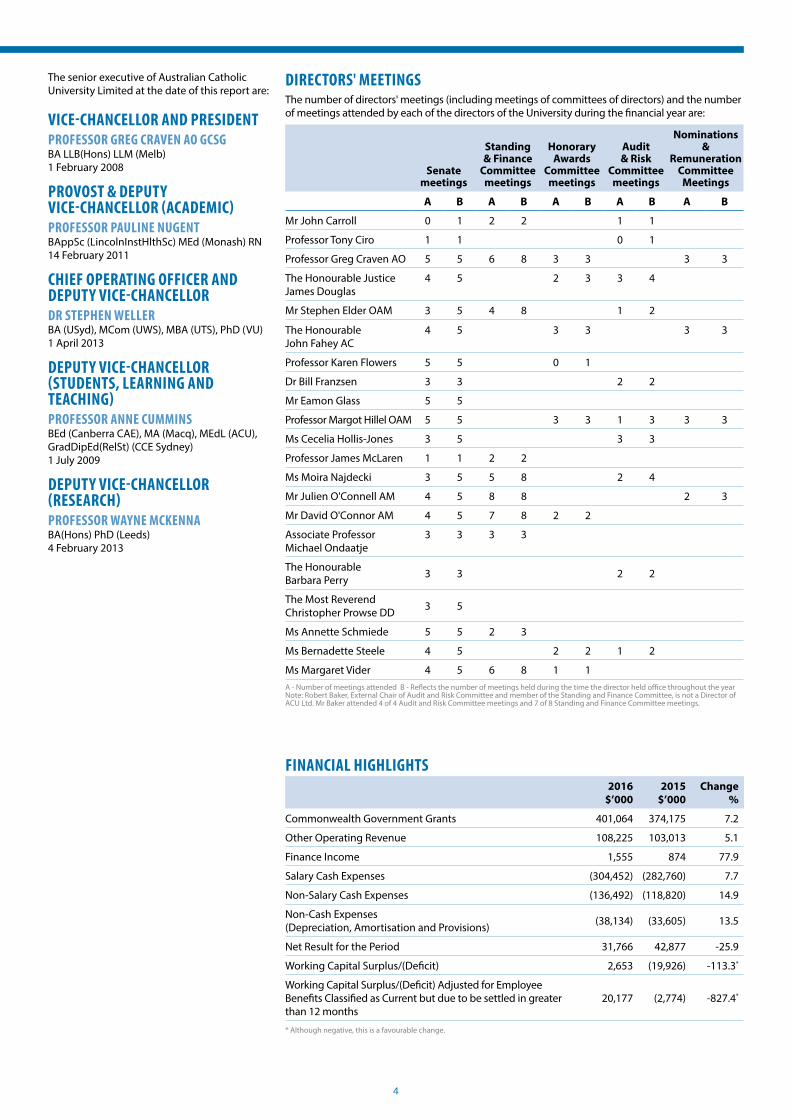
DIRECTORS' MEETINGSThe number of directors' meetings (including meetings of committees of directors) and the number of meetings attended by each of the directors of the University during the financial year are:
Senate meetings
Standing & Finance
Committee meetings
Honorary Awards
Committee meetings
Audit & Risk
Committee meetings
Nominations &
Remuneration Committee Meetings
A B A B A B A B A B
Mr John Carroll 0 1 2 2 1 1
Professor Tony Ciro 1 1 0 1
Professor Greg Craven AO 5 5 6 8 3 3 3 3
The Honourable Justice James Douglas
4 5 2 3 3 4
Mr Stephen Elder OAM 3 5 4 8 1 2
The Honourable John Fahey AC
4 5 3 3 3 3
Professor Karen Flowers 5 5 0 1
Dr Bill Franzsen 3 3 2 2
Mr Eamon Glass 5 5
Professor Margot Hillel OAM 5 5 3 3 1 3 3 3
Ms Cecelia Hollis-Jones 3 5 3 3
Professor James McLaren 1 1 2 2
Ms Moira Najdecki 3 5 5 8 2 4
Mr Julien O'Connell AM 4 5 8 8 2 3
Mr David O'Connor AM 4 5 7 8 2 2
Associate Professor Michael Ondaatje
3 3 3 3
The Honourable Barbara Perry 3 3 2 2
The Most Reverend Christopher Prowse DD 3 5
Ms Annette Schmiede 5 5 2 3
Ms Bernadette Steele 4 5 2 2 1 2
Ms Margaret Vider 4 5 6 8 1 1A - Number of meetings attended B - Reflects the number of meetings held during the time the director held office throughout the yearNote: Robert Baker, External Chair of Audit and Risk Committee and member of the Standing and Finance Committee, is not a Director of ACU Ltd. Mr Baker attended 4 of 4 Audit and Risk Committee meetings and 7 of 8 Standing and Finance Committee meetings.
FINANCIAL HIGHLIGHTS2016
$’0002015
$’000Change
%
Commonwealth Government Grants 401,064 374,175 7.2
Other Operating Revenue 108,225 103,013 5.1
Finance Income 1,555 874 77.9
Salary Cash Expenses (304,452) (282,760) 7.7
Non-Salary Cash Expenses (136,492) (118,820) 14.9
Non-Cash Expenses (Depreciation, Amortisation and Provisions) (38,134) (33,605) 13.5
Net Result for the Period 31,766 42,877 -25.9
Working Capital Surplus/(Deficit) 2,653 (19,926) -113.3*
Working Capital Surplus/(Deficit) Adjusted for Employee Benefits Classified as Current but due to be settled in greater than 12 months
20,177 (2,774) -827.4*
* Although negative, this is a favourable change.

5
PRINCIPAL ACTIVITIESThe principal activities of Australian Catholic University Ltd during the course of the financial year were those of a university operating at both an undergraduate and postgraduate level and research on seven campuses across the states of Queensland, New South Wales, Victoria, South Australia, and Australian Capital Territory, and an eighth campus in Rome, Italy. The Rome Campus is a shared facility with The Catholic University of America.
REVIEW AND RESULT OF OPERATIONSThere is a positive result for the year ended 31 December 2016 of $31.8 million (m) (2015 $42.9m), a reduction of $11.1m (25.9%).
Total revenue increased $32.8m (6.9%). There has been continued increase in Commonwealth Government Financial Assistance largely comprising Commonwealth Grants Scheme, $14.7m (6.6%), Student HECS HELP, $10.1m (7.3%) and FEE HELP $1.6m (15.7%). The grant increase reflects growth in Commonwealth Supported Places. Other Operating Revenue, excluding Finance Income and Deferred Government Contributions for Superannuation increased by $5.9m (5.7%).
Total Expenditure increased $43.9m (10.1%). Expenditure on cash related salaries increased by $21.7m (7.7%). Non salary cash expenses increased by $17.7m (14.9%).
The utilisation of cash reserves to fund capital works continues to impact the Working Capital position although it has improved significantly and is in surplus $2.7m ($19.9m deficit in 2015). The surplus is $20.2m ($2.8m deficit in 2015) after adjusting for employee benefits classified as current liabilities but expected to be settled in greater than 12 months.
SIGNIFICANT CHANGES IN THE STATE OF AFFAIRSImplementation of the University’s Infrastructure Plan to accommodate current and planned growth in student and staff numbers continued in 2016. Expenditure was largely on planning for significant new and refurbishment of current buildings to commence in 2017 on the Brisbane, North Sydney, Strathfield, Canberra and Melbourne campuses. A new physiotherapy building on the Ballarat Campus reached practical completion on 17 January 2017. Additions and refurbishment of space was undertaken on the Canberra Campus for the Health Sciences Faculty. There was also ongoing reconfiguration and refurbishment of existing spaces on all campuses.
In late 2015, the University obtained replacement funding for the $70m loan facility held with the National Australia Bank (NAB). The new funding is made up of facilities with NAB ($100m) and Catholic Development Fund ($50m). At year-end, $150m had been drawn down. The facilities will continue to be utilised during 2017 as the University continues to implement its infrastructure plan. A number of fixed interest rate swaps were executed to lock
in historically low interest rates on $70m of the borrowings drawn down.
The University undertook a ratings process during 2016 with Moody’s Investors Services and was provided with an Aa2 rating. The rating will provide the University with an opportunity to obtain alternative debt financing.
Moody’s indicated that the Aa2 issuer rating reflects the supportive institutional framework for universities in Australia with the bulk of funding coming from the Commonwealth government’s sizeable and predictable grants. Grants have risen in line with strong growth in domestic enrolment, thereby underpinning the strong operating performance of the University; although the report noted that this reliance also leads to less revenue diversity.
The rating also reflects the University's important market niche of supplying a large quantity of nurses and teachers to hospitals and schools, and its mission as one of two Catholic universities in Australia. Its low debt burden and expectations that it will remain moderate over the medium term – with the bulk of capital expenditures funded on a “pay as you as go” basis – is a positive credit factor. The rating remains constrained by very low levels of liquidity, which provide only a minimal cushion during its transition from rapid growth to a steady state and while undertaking a large capital improvement plan.
ENVIRONMENTAL REGULATIONThe University's operations are not subject to any significant environmental regulations under either Commonwealth or State legislation. However, the directors believe that the University has adequate systems in place for the management of its environmental requirements and is not aware of any breach of these environmental requirements.
MATTERS SUBSEQUENT TO THE END OF THE FINANCIAL YEARThere are no other items, transactions or events of a material or unusual nature that have arisen in the interval between the end of the financial year and the date of this report, which are likely in the opinion of directors to affect significantly the operations of the University, the results of these operations or the state of the University in subsequent financial years.
DIRECTORS’ INTERESTS AND BENEFITSDirectors’ interests and benefits are set out in notes 19 and 20.
INDEMNIFICATION OF DIRECTORS AND OFFICERSDuring the year the University renewed an agreement with its insurers to provide indemnification for all the directors and officers of the University (as listed in this report), against all liabilities to another person (other than the University) that may arise from their position as directors and officers.
DIRECTORS AND OFFICERS LIABILITY COVERDuring the year, the University paid insurance premiums of $73,000 (2015: $73,000) in respect of Directors and Officers Liability insurance contracts for directors and officers of the University. The insurance provides cover against claims made by reason of any wrongful act committed or alleged to have been committed by a director or officer of the University during the year. The University has not entered into an agreement indemnifying the current auditors, KPMG, against any claims by third parties.
PROCEEDINGS ON BEHALF OF THE UNIVERSITYThere are no proceedings being pursued on behalf of the University.
LEAD AUDITOR'S INDEPENDENCE DECLARATIONThe lead auditor's independence declaration is set out on page 8 and forms part of the directors' report for the financial year ended 31 December 2016.
NON AUDIT SERVICESAmounts paid to the University’s auditors for non audit services are outlined in note 5.
The Directors of the University are satisfied, based on advice from the Audit and Risk Committee, that the non-audit services provided are compatible with the general standard of independence for auditors imposed by the Corporations Act 2001 and do not undermine the general principles relating to auditor independence as set out in APES 110 Code of Ethics for Professional Accountants, as they did not involve reviewing or auditing the auditor’s own work, acting in a management or decision-making capacity for Australian Catholic University, acting as an advocate for Australian Catholic University or jointly sharing risks and rewards.
ROUNDING OFF The University is of a kind referred to in ASIC Corporations Instrument 2016/191 and in accordance with that Instrument, amounts in the financial statements and directors’ report have been rounded off to the nearest thousand dollars, unless otherwise stated.
Professor Greg Craven AO GCSG 10 April 2017 Director Sydney
Mr Julien O’Connell AM 10 April 2017 Director Sydney

6
LEAD AUDITOR'S INDEPENDENCE DECLARATION
Melbourne Campus

7
LEAD AUDITOR’S INDEPENDENCE DECLARATION UNDER SECTION 307C OF THE CORPORATIONS ACT 2001To: The directors of Australian Catholic University Limited
I declare that, to the best of my knowledge and belief, in relation to the audit for the financial year ended 31 December 2016 there have been:
(i) no contraventions of the auditor independence requirements as set out in the Corporations Act 2001 in relation to the audit; and
(ii) no contraventions of any applicable code of professional conduct in relation to the audit.
KPMG
Kevin Leighton Partner Sydney 10 April 2017

8
AUDITED FINANCIAL STATEMENTS FOR THE YEAR ENDED 31 DECEMBER 2016
North Sydney Campus

9
INCOME STATEMENT FOR THE YEAR ENDED 31 DECEMBER 2016
Note2016
$’0002015
$’000
Revenue from Continuing Operations
Commonwealth Government Financial Assistance Excluding HECS HELP 2.1 237,535 222,787
Higher Education Contribution Scheme (HECS - HELP)
Student Contributions 24.2 11,678 12,307
Commonwealth Payments 2.1, 24.2 135,619 124,927
FEE-HELP 2.1 11,561 9,992
SA-HELP 2.1 4,671 4,162
State & Local Government Financial Assistance 2.2 3,148 2,227
Fees and Charges 2.3 71,976 64,031
Consultancy and Contract Research 2.5 11,004 7,618
Other Revenue 2.6 22,097 29,137
Total Revenue from Continuing Operations 509,289 477,188
Expenses from Continuing Operations
Employee Benefits 3.1 310,636 290,360
Depreciation and Amortisation 3.2 31,950 26,005
Buildings and Grounds Maintenance 3.3 7,401 8,497
Consultancy 14,486 10,160
Rent 14,699 12,008
Travel 13,183 12,093
Other 3.4 84,575 75,002
Total Expenses from Continuing Operations 476,930 434,125
Net Result from Continuing Operations 32,359 43,063
Finance Income and Expense
Finance Income 2.4 1,555 874
Finance Expense 4 (2,148) (1,060)
Total Finance Income and Expense (593) (186)
Net Result Before Income Tax 31,766 42,877
Income Tax 1(c) - -
Net Result for the Period 17 31,766 42,877The income statement is to be read in conjunction with the notes to and forming part of the financial statements set out on pages 14 to 57.
10
STATEMENT OF COMPREHENSIVE INCOME FOR THE YEAR ENDED 31 DECEMBER 2016
Note2016
$’0002015
$’000
Net Result for the Period 31,766 42,877
Other Comprehensive Income
Items that will not be reclassified to profit and loss
Superannuation - Deferred Government Contributions (253) (11)
Deferred Superannuation Expense 253 11
Items that may be reclassified subsequently to profit and loss
Gain on revaluation of land and buildings 81,662 -
Gain on value of available for sale financial assets 16 1,889 4,286
Other Comprehensive Income for the Period 83,551 4,286
Total Comprehensive Income 115,317 47,163
Attributable to:
Members 115,317 47,163
Total Comprehensive Income Attributable to Members 115,317 47,163The statement of comprehensive income is to be read in conjunction with the notes to and forming part of the financial statements set out on pages 14 to 57.
11
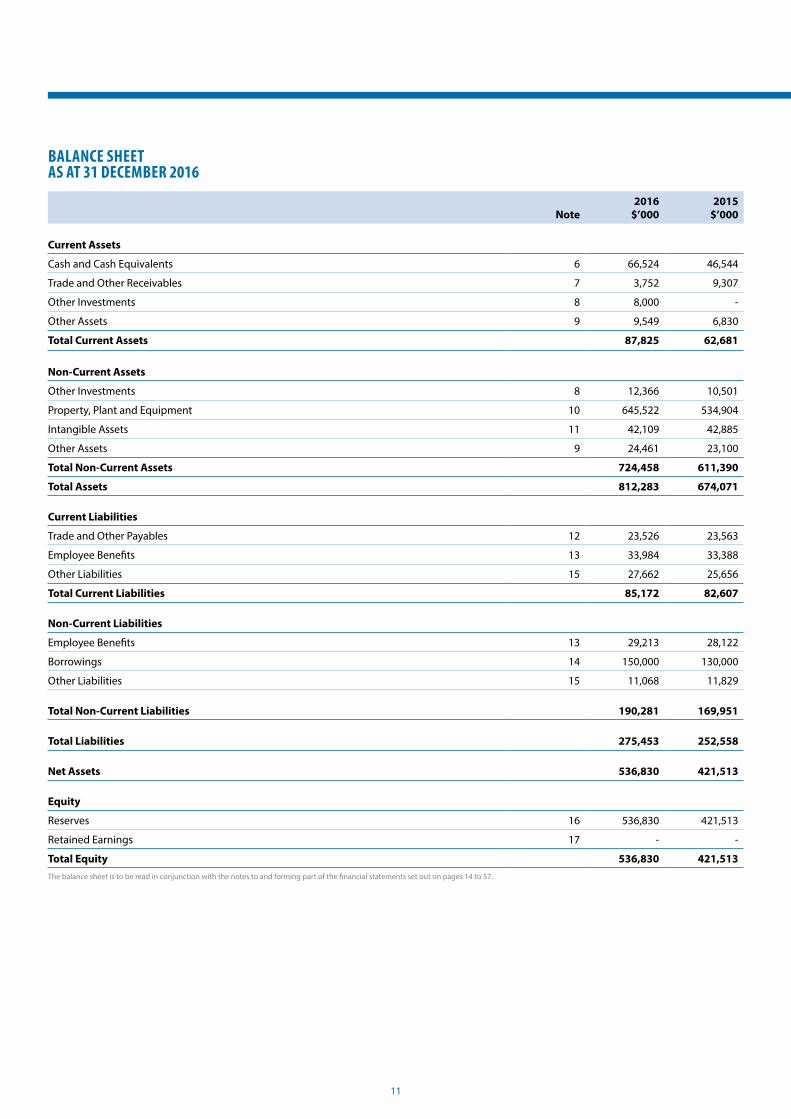
BALANCE SHEET AS AT 31 DECEMBER 2016
Note2016
$’0002015
$’000
Current Assets
Cash and Cash Equivalents 6 66,524 46,544
Trade and Other Receivables 7 3,752 9,307
Other Investments 8 8,000 -
Other Assets 9 9,549 6,830
Total Current Assets 87,825 62,681
Non-Current Assets
Other Investments 8 12,366 10,501
Property, Plant and Equipment 10 645,522 534,904
Intangible Assets 11 42,109 42,885
Other Assets 9 24,461 23,100
Total Non-Current Assets 724,458 611,390
Total Assets 812,283 674,071
Current Liabilities
Trade and Other Payables 12 23,526 23,563
Employee Benefits 13 33,984 33,388
Other Liabilities 15 27,662 25,656
Total Current Liabilities 85,172 82,607
Non-Current Liabilities
Employee Benefits 13 29,213 28,122
Borrowings 14 150,000 130,000
Other Liabilities 15 11,068 11,829
Total Non-Current Liabilities 190,281 169,951
Total Liabilities 275,453 252,558
Net Assets 536,830 421,513
Equity
Reserves 16 536,830 421,513
Retained Earnings 17 - -
Total Equity 536,830 421,513The balance sheet is to be read in conjunction with the notes to and forming part of the financial statements set out on pages 14 to 57.
12
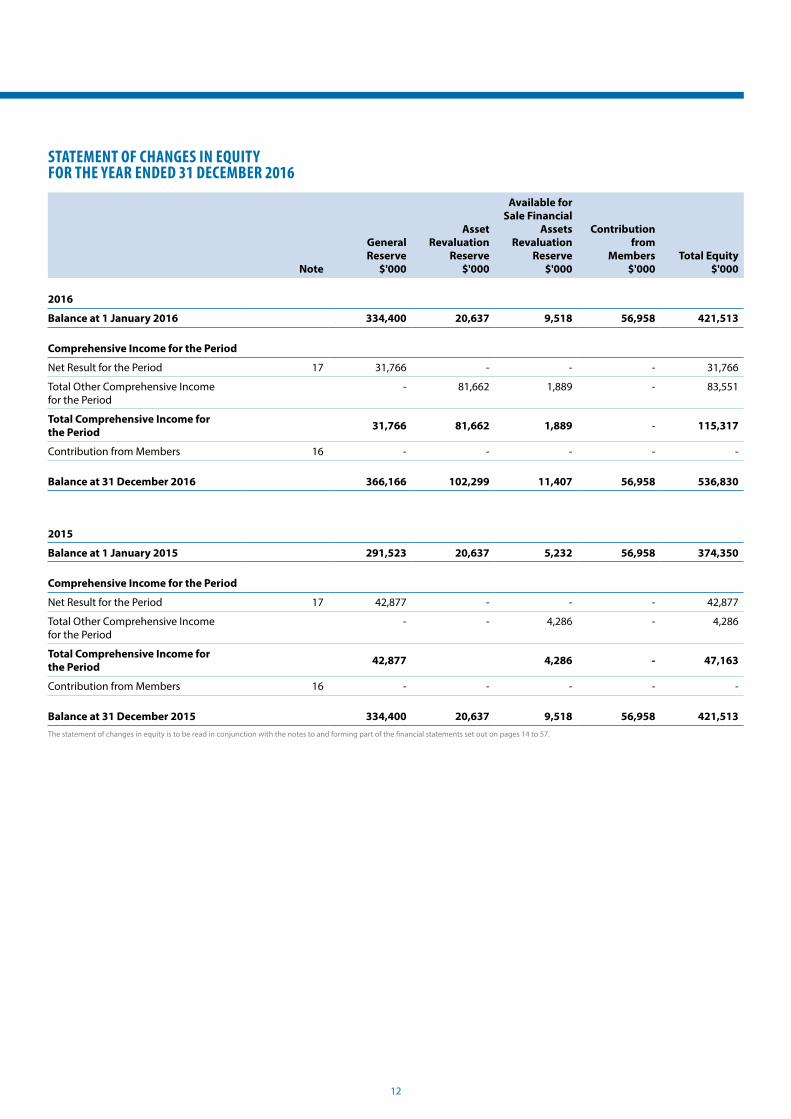
STATEMENT OF CHANGES IN EQUITY FOR THE YEAR ENDED 31 DECEMBER 2016
Note
General Reserve
$'000
Asset Revaluation
Reserve $'000
Available for Sale Financial
Assets Revaluation
Reserve $'000
Contribution from
Members $'000
Total Equity $'000
2016
Balance at 1 January 2016 334,400 20,637 9,518 56,958 421,513
Comprehensive Income for the Period
Net Result for the Period 17 31,766 - - - 31,766
Total Other Comprehensive Income for the Period
- 81,662 1,889 - 83,551
Total Comprehensive Income for the Period 31,766 81,662 1,889 - 115,317
Contribution from Members 16 - - - - -
Balance at 31 December 2016 366,166 102,299 11,407 56,958 536,830
2015
Balance at 1 January 2015 291,523 20,637 5,232 56,958 374,350
Comprehensive Income for the Period
Net Result for the Period 17 42,877 - - - 42,877
Total Other Comprehensive Income for the Period
- - 4,286 - 4,286
Total Comprehensive Income for the Period 42,877 4,286 - 47,163
Contribution from Members 16 - - - - -
Balance at 31 December 2015 334,400 20,637 9,518 56,958 421,513The statement of changes in equity is to be read in conjunction with the notes to and forming part of the financial statements set out on pages 14 to 57.

13
STATEMENT OF CASH FLOWS FOR THE YEAR ENDED 31 DECEMBER 2016
Note2016
$’0002015
$’000
Cash Flows from Operating Activities
Grant Revenue
Commonwealth Government 260,413 232,317
State Government 3,124 2,203
Higher Education Contribution Scheme
Student Payments 11,678 12,307
Commonwealth Payments 135,383 125,214
Other Inflows 109,605 102,187
Cash Receipts in the Course of Operations 520,203 474,228
Cash Payments in the Course of Operations (446,426) (406,566)
Interest Received 949 855
Interest and Other Costs of Finance (4,732) (1,040)
Net Cash from Operating Activities 23(ii) 69,994 67,477
Cash Flows from Investing Activities
Payments for Property, Plant and Equipment (62,043) (139,353)
Proceeds from Sale of Non-Current Assets 5 30
Proceeds from /Payments for Investments (7,976) (66)
Net Cash Used in Investing Activities (70,014) (139,389)
Cash Flows from Financing Activities
Proceeds from Borrowings 55,000 177,000
Repayment of Borrowings (35,000) (77,000)
Net Cash (Used in)/Provided by Financing Activities 20,000 100,000
Net (Decrease)/Increase in Cash Held 19,980 28,088
Cash and Cash Equivalents at the Beginning of the Financial Year 46,544 18,456
Cash and Cash Equivalents at the End of the Financial Year 23(i) 66,524 46,544The statement of cash flows is to be read in conjunction with the notes to and forming part of the financial statements set out on pages 14 to 57.
14
NOTES TO THE FINANCIAL STATEMENTS FOR THE YEAR ENDED 31 DECEMBER 2016
Brisbane Campus

15
1. STATEMENT OF SIGNIFICANT ACCOUNTING POLICIES
The Directors of the University comprise the Senate of the University and the terms Senator and Director are interchangeable. Australian Catholic University Ltd (the University) is domiciled in Australia and is not-for-profit. The financial statements were authorised for issue by the directors on 10 April 2017.
The significant policies which have been adopted in the preparation of these financial statements are:
(A) BASIS OF PREPARATIONSTATEMENT OF COMPLIANCEThe financial statements of the University are a general purpose financial statement which has been prepared in accordance with Australian Accounting Standards adopted by the Australian Accounting Standards Board (AASB), the Corporations Act 2001, and the disclosure requirements within the Guidelines for the Preparation of Annual Financial Statements for the 2016 Reporting Period by Australian Higher Education Institutions issued pursuant to the Higher Education Support Act 2003.
The financial statements were authorised for issue by the Senate on 10 April 2017.
USE OF ESTIMATES AND JUDGEMENTThe preparation of the financial statements, in conformity with Australian Accounting Standards, requires management to make judgements, estimates and assumptions that affect the application of policies and reported amounts of assets and liabilities, income and expenses. The estimates and associated assumptions are based on historical experience and various other factors that are believed to be reasonable under the circumstances, the results of which form the basis of making the judgements about carrying values of assets and liabilities that are not readily apparent from other sources. Actual results may differ from these estimates.
The estimates and underlying assumptions are reviewed on an ongoing basis. Revisions to accounting estimates are recognised in the period in which the estimate is revised and future periods if the revision affects both current and future periods.
Information about significant areas of estimation uncertainty and critical judgements in applying accounting policies that have the most significant impact on the amount recognised in the financial statements are described in: Note 13 measurement of defined superannuation obligations; Note 1(g) measurement of make good/rectification costs; and Note 10 property, plant and equipment.
FUNCTIONAL AND PRESENTATION CURRENCYThe financial statements are prepared in Australian dollars, which is the University’s functional currency.
The University is a Company referred to in ASIC Instrument 2016/191 and in accordance with that Instrument, all financial information has been rounded to the nearest thousand unless otherwise stated.
HISTORICAL COST CONVENTIONThe financial statements have been prepared on the basis of historical costs except for freehold land and buildings, financial instruments classified as available for sale and defined benefit superannuation liabilities. These have been stated at fair value.
Where necessary, comparative information has been reclassified to achieve consistency in disclosure with current financial year amounts and other disclosures.
The accounting policies below have been applied consistently to all periods presented in these financial statements except where stated.
(B) REVENUE RECOGNITIONRevenue is measured at the fair value of the consideration received or receivable. Amounts disclosed as revenue are net of returns, trade allowances, rebates and amounts collected on behalf of third parties.
Revenue is recognised when the amount of revenue can be reliably measured, it is probable that future economic benefits will flow to the University and specific criteria have been met for each of the University’s activities as described below. The amount of revenue is not considered to be reliably measurable until all contingencies relating to the sale have been resolved. The University bases its estimates on historical results, taking into consideration the type of customer, the type of transaction and the specifics of each arrangement.
Revenue is recognised as follows:
GOVERNMENT GRANTSCommonwealth Grant Scheme and HELP income is recognised on an accrual basis whereby it is credited to the University’s income statement in the financial year in which the goods and services are provided in exchange for the grant received.
OTHER TUITION FEE INCOMEOther tuition fee income is generated from fee-paying courses for local and overseas students. Revenue is recognised in the same period as the courses for which the fee income is derived. Pre-payments for courses being held in the next teaching year are treated as deferred income and recorded as revenue in the following financial year when the course is provided.
DONATIONS AND BEQUESTSDonations and bequests received, which are not subject to conditions under a specific trust deed, are recognised as revenue when they are received.
INTEREST INCOMEInterest income is recognised as it accrues using the effective interest method.
ASSET SALESThe net gain on asset sales is included as other income and the net loss as an expense. The profit or loss on disposal of assets is brought to account at the date the unconditional contract is signed.
EMERGING COST SUPERANNUATION SUPPLEMENTATION FROM GOVERNMENTFunding from government for Emerging Cost Superannuation supplementation is reported in the Balance Sheet, as this is in effect an agency arrangement. In accordance with AASB119, Employee Benefits, this amount is disclosed in the notes to the Financial Statements (Refer Note 13).
(C) TAXATIONThe Commissioner of Taxation has granted the University an exemption under section 50-5 of the Income Tax Assessment Act 1997 from 1 July 2000.
The University is not subject to income tax or capital gains tax but may be liable for other taxes in accordance with Federal and State legislation.
(D) CASH AND CASH EQUIVALENTSCash at bank is carried at face value of the amounts deposited or drawn and net of unpresented cheques. The carrying amount of cash at bank approximates net fair value.
Short term deposits of less than a remaining term of 90 days are classified as cash.
(E) TRADE AND OTHER RECEIVABLESSTUDENT ASSISTANCE PROGRAMStudent loans are generally settled within a 12 month period and are carried at amounts due. The collectability of debts is assessed at balance date and bad debts are written off directly to the income statement. Specific provision is made for any doubtful accounts. The carrying amount of student loans approximates net fair value.
SUNDRY RECEIVABLESSundry receivables are recognised when expenditure is incurred by the University and requires reimbursement by a third party. The carrying amount of sundry receivables approximates net fair value.
16
(F) INVESTMENTSINTEREST BEARING DEPOSITS, DEBENTURES AND BANK BONDSInterest bearing deposits, debentures, bank bonds and bank bills are measured at amortised cost using the effective interest method.
OTHER COMPANIESInvestments in listed and unlisted shares are classified as “available for sale” securities and are carried at fair value (See Note 1(o)). Changes in fair value are recorded in the Share Revaluation Reserve except for impairment losses, which are recorded directly through the income statement.
When shares governed by a trust deed are sold, the profit or loss on disposal is recognised against a trust fund liability. All other share profits and losses on disposal are recognised in the income statement.
(G) PROPERTY, PLANT AND EQUIPMENTAcquisition and additions of non-current assets are capitalised if the value is more than $3,000. These additions are recorded at cost in the year of acquisition.
Freehold land and buildings are treated as one class of asset and shown at fair value, based on periodic valuations by external independent valuers, less subsequent depreciation for buildings. Any accumulated depreciation at the date of revaluation is eliminated against the gross carrying amount of the asset and the net amount is restated to the revalued amount of the asset.
Freehold land and buildings are revalued triennially with a valuation undertaken on 31 December 2016. Increases in the carrying amounts arising on revaluation of freehold land and buildings are credited to the Asset Revaluation Reserve in equity. To the extent that the increase reverses a decrease previously recognised in the income statement, the increase is first recognised in the income statement. Decreases that reverse previous increases of the same asset class are first charged against revaluation reserves directly in equity to the extent of the remaining reserve attributable to the asset class; all other decreases are charged to the income statement.
All other property, plant and equipment is stated at historical cost less accumulated depreciation and impairment losses. Historical cost includes expenditure that is directly attributable to the acquisition of the asset. Cost also includes those costs directly attributable to bringing the asset to its working condition and an estimate of the cost of dismantling and removing the asset. The estimate of dismantling costs is based on prior experience in exiting similar sites or locations.
Subsequent costs are included in the asset’s carrying amount or recognised as a separate asset, as appropriate, only when it is probable that future economic benefits associated with the item will flow to the University and the cost of the item can be measured reliably. All other
repairs and maintenance are charged to the income statement during the financial period in which they are incurred.
DEPRECIATIONDepreciation is recognised in the income statement on a straight line basis over the estimated useful lives of each part of an item of property, plant, and equipment. The depreciation rates used for each class of asset in the current and comparative year are as follows:
Freehold Buildings 2-3%
Improvement to Intangible Rights to Occupy Buildings 2-3%
Furniture and Fittings 20%
Computer Equipment 33%
Plant and Equipment 20%
Motor Vehicles 10%
The asset's residual value and useful life is reviewed and adjusted, if appropriate, at each balance sheet date.
An asset’s carrying amount is impaired to its recoverable amount if the asset’s carrying amount is greater than its estimated recoverable amount. See note 1(h). Gains and losses on disposal are determined by comparing proceeds with the carrying amount. These are included in the income statement. When revalued assets are sold, it is University policy to transfer the amounts included in the Asset Revaluation Reserve in respect of those assets to retained earnings.
Land is not depreciated. Depreciation on other assets is calculated using the straight line method to allocate the cost or revalued amount, net of residual value, over the estimated useful life.
WORKS OF ARTAcquisitions are carried at cost and no depreciation is charged in respect of these assets.
LEASED PLANT AND EQUIPMENTLeases of plant and equipment under which the University assumes substantially all the risks and benefits of ownership are classified as finance leases. Other leases are classified as operating leases.
Leases in which a significant portion of the risks and rewards of ownership are retained by the lessor are classified as operating leases. Operating lease expenses are charged against profits in equal instalments over the accounting periods covered by the lease term, except where an alternative basis is more representative of the pattern of benefits to be derived from the leased property.
(H) IMPAIRMENT OF ASSETSImpairment arises when an asset’s carrying amount exceeds its recoverable amount. Recoverable amount is defined as the higher of an asset’s (or cash-generating unit’s) fair value less costs to sell and value in use. Value in use is (i) the present value of the future cash
flows expected to be derived from an asset or cash generating unit or (ii) the depreciated replacement cost of the asset when the future economic benefits of an asset of a not-for-profit entity are not primarily dependent on the asset’s ability to generate net cash inflows and where the entity would, if deprived of the asset, replace its remaining future economic benefits.
Assets are reviewed for impairment whenever events or changes in circumstances indicate that the carrying amount may not be recoverable. An impairment loss is recognised for the amount by which the asset’s carrying amount exceeds its recoverable amount. Impairment losses are recognised in the income statement unless an asset has previously been revalued in which case the impairment loss is recognised as a reversal of the revaluation with any excess recognised through the income statement. For assets with an indefinite useful life the recoverable amount is estimated at each balance date.
(I) INTANGIBLE ASSETSIntangible assets consist of the rights to occupy land and buildings that have been granted at nominal rates for a determined period or in perpetuity. The intangible rights are initially recorded at their fair value. Rights to occupy buildings are amortised at the greater of 3 per cent or the period of the term of the agreement. Where a right of occupancy agreement exists and stipulates the time period, the asset including rights to occupy land is amortised over the period of the right. Indefinite life intangibles are tested annually for impairment.
(J) TRADE AND OTHER PAYABLESLiabilities are recognised for amounts to be paid in the future for goods or services received, whether or not billed to the University. Trade accounts payable are normally settled within 30 days. The carrying amount of accounts payable approximates net fair value.
(K) BORROWINGSBorrowings are carried on the balance sheet at amortised cost. Interest expense is recognised on an effective interest basis.
Borrowings are classified as current liabilities unless there is an unconditional right to defer settlement of the liability and does not expect to settle the liability for at least 12 months after the date of the income statement.
(L) EMPLOYEE BENEFITSWAGES, SALARIES, AND SICK LEAVE The provisions for employee entitlements to wages and salaries represent the amount which the University has a present obligation to pay resulting from employees’ services provided up to the balance date.
The provisions have been calculated based on wage and salary rates at which they are expected to be paid and includes related on-costs. The carrying amount of the provisions approximates net fair value.

17
ANNUAL LEAVEThe liability for employee entitlements to annual leave represents the present value of the estimated future cash outflows to be made by the employer resulting from employees services provided up to the balance date. The liability is calculated from a staff member’s commencement date allowing for the probability that the member will take accrued leave. Liabilities are discounted using rates attaching to national corporate securities at balance date, which most closely match the terms of maturity of the related liabilities. The carrying amount of the provision approximates net fair value.
In determining the liability for employee entitlements, consideration has been given to the University’s experience with staff taking annual leave. Related on-costs have also been included in the liability.
LONG SERVICE LEAVEThe liability for employee entitlements to long service leave represents the present value of the estimated future cash outflows to be made by the employer resulting from employees’ services provided up to the balance date. The liability is calculated from a staff member’s commencement date allowing for the probability that the member will complete seven years of service. Staff members with seven years of service or more are included as current liabilities; those with less than seven years of service are included as non-current liabilities.
Liabilities for employee entitlements for members with less than seven years of service are discounted using the rates attaching to national corporate securities at balance date, which most closely match the terms of maturity of the related liabilities. The carrying amount of the provision approximates net fair value.
In determining the liability for employee entitlements, consideration has been given to the University’s experience with staff departures. Related on-costs have also been included in the liability.
SUPERANNUATION FUNDSThe University contributes to a range of employee superannuation funds. University contributions are recognised within employee expenses in the income statement. Refer also Note 13.
An Arrangement exists between the Australian Government and the State Government to meet the unfunded liability for the beneficiaries of the Emergency Services and State Superannuation Scheme on an emerging cost basis. This arrangement is evidenced by the State Grants (General Revenue) Amendment Act 1987, Higher Education Support Act 2003 and subsequent amending legislation. By letter dated 15 December 2005, DEST (now Department of Education and Training) confirmed the Australian Government considers the current arrangements have established a pattern of past practice and future intent that has created a valid expectation on the part of universities that the department on behalf of
the Australian Government will discharge the superannuation liability.
Accordingly the unfunded liabilities have been recognised in the Balance Sheet under Provisions with a corresponding asset recognised under Non-Current Assets. The recognition of both the asset and the liability consequently does not affect the year end net asset position.
(M) FUNDS HELD IN TRUSTDonations and bequests received, which are subject to conditions under a specific trust deed, are held in trust on behalf of that specific donor and are not recognised as revenue by the University. Unless specified in the trust deed, any net earnings on these funds are recognised as revenue by the University.
(N) GOODS AND SERVICES TAXRevenues and expenses are recognised net of the amount of goods and services tax (GST), except where the amount of GST incurred is not recoverable from the Australian Taxation Office (ATO). In these circumstances the GST is recognised as part of the cost of the acquisition of the asset or as part of an item of the expense.
Receivables and payables are stated with the amount of the GST included. The net amount of GST recoverable from, or payable to, the ATO is included as a current asset or liability in the balance sheet.
Cash flows are included in the statement of cash flows on a gross basis. The GST component of cash flow arising from investing and financing activities, which is recoverable from, or payable to, the ATO is classified as an operating cash flow.
(O) FAIR VALUEFair value of an asset is the price that would be received to sell an asset or paid to transfer a liability in an orderly transaction between market participants. The fair value of financial assets and financial liabilities must be estimated for recognition and measurement or for disclosure purposes.
The fair value of financial instruments traded in active markets (such as publicly traded derivatives, and trading and available-for-sale securities) is based on quoted market prices, adjusted for any movements in price of credit for that instrument, on the balance sheet date (Level 1). The quoted market price used for financial assets held is the current bid price; the appropriate quoted market price for financial liabilities is the current ask price.
The fair value of financial instruments that are not traded in an active market (for example, unlisted shares) is determined using valuation techniques with assumptions that are based on market conditions existing at each balance date. Quoted market prices or dealer quotes for similar instruments (Level 2) are used for long-term debt instruments held. Other techniques that are not based on observable market data (Level 3) such as estimated discounted cash flows, are used to
determine fair value for the remaining assets and liabilities.
The market value of property is the estimated amount for which a property could be exchanged on the date of valuation between a willing buyer and a willing seller in an arm’s length transaction after proper marketing wherein the parties had each acted knowledgeably, prudently and without compulsion. The University engages an independent third party to value freehold land and buildings on a periodic basis.
Within the fair value hierarchy, land and buildings fall within level two and listed shares within level one. Unlisted shares fall within Level 3, refer to note 21.
(P) NEW STANDARDS AND INTERPRETATIONS NOT YET ADOPTEDCertain new accounting standards and interpretations became mandatory for the 31 December 2015 reporting period. These new requirements have not had a material impact on either the results or disclosure of the University.
Certain new accounting standards and interpretations have been published that are not mandatory for the 31 December 2015 reporting period. The University has elected not to early adopt any of these standards.
AASB 15 – REVENUE FROM CONTRACTS WITH CUSTOMERS:The AASB 15 establishes a comprehensive framework for determining whether, how much and when revenue is recognised. It replaces existing revenue recognition guidance, including AASB 118 Revenue and AASB 111 Construction Contracts. AASB 15 is effective for annual reporting periods beginning on or after 1 January 2018, with early adoption permitted.
The University has completed an initial assessment of the potential impact on its financial statements resulting from the application of AASB 15 and determined that there is no material impact.
AASB 9 FINANCIAL INSTRUMENTSAASB 9, published in July 2014 replaces the existing guidance in AASB 139 Financial Instruments: Recognition and Measurement. AASB 9 includes revised guidance on the classification and measurement of financial instruments including a new expected credit loss model for calculating impairment on financial instruments, a new expected credit loss model for calculating impairment on financial assets, and the new general hedge accounting requirements. AASB 9 is effective for annual reporting periods beginning on or after 1 January 2018, with early adoption permitted.
The University has completed its assessment of the potential impact on its financial statements resulting from the application of AASB 9 and they are not expected to be material.

18
IFRS 16 LEASESThe IASB issued IFRS 16 Leases with an effective date of 1 January 2019. AASB 16 removes the classification of leases as either operating or finance leases – for lessee – effectively treating all leases as finance leases. Short-term leases (less than 12 months) and leases of low-value assets are exempt from the lease accounting requirements. There are also changes in accounting over the life of the lease, in particular, companies will now recognise a front-loaded pattern of expense for most leases, even when they pay constant annual rentals. Lessor accounting remains similar to current practise.
Early adoption will be permitted for entities that also adopt IFRS 15 Revenue from Contracts with Customers. The AASB approved the Australian equivalent standard, AASB 16 Leases, at the February 2016 meeting.
The University has not yet completed its assessment of the quantification of the impact on its financial statements resulting from the application of AASB 16, however it expects a significant increase in assets and liabilities due to the number of property related operating leases the university has.
2. REVENUE
Note2016
$’0002015
$’000
2.1 COMMONWEALTH GOVERNMENT FINANCIAL ASSISTANCECommonwealth Grants Scheme and Other Grants
Commonwealth Grants Scheme 24.1 221,793 208,705
Indigenous Support Fund 24.1 1,213 1,181
Disability Support Programs 24.1 95 73
Promotion of Excellence in Learning and Teaching 24.1 30 20
Partnership and Participation Funding 24.1 3,324 3,344
Total Commonwealth Grants Scheme & Other Grants 226,455 213,323
DET-Scholarships
Australian Postgraduate Awards 24.3 1,112 802
International Postgraduate Research Scholarships 24.3 62 70
Commonwealth Education Costs Scholarships 24.3 49 58
Commonwealth Accommodation Scholarships 24.3 5 -
Indigenous Access Scholarships 24.3 88 5
National Priority Scholarships 24.3 - -
Total DET-Scholarships 1,316 935
DET-Research
Joint Research Engagement Program 24.4 1,777 1,554
Research Training Scheme 24.4 2,289 2,181
Infrastructure 24.4 678 263
Sustainable Research Excellence in Universities 24.4 1,012 535
Total DET-Research 5,756 4,533
Total DET Excluding HELP (a) 233,527 218,791
Higher Education Loan Programs (HELP)
HECS-HELP Commonwealth Payments 24.2 135,619 124,927
FEE-HELP 24.2 10,550 8,836
FEE-HELP VET 24.2 1,011 1,156
SA-HELP 24.2 4,671 4,162
Total Higher Education Loan Programs 151,851 139,081
Total DET Including HELP 385,378 357,872
Australian Research Council
Discovery - Projects 24.5 1,071 1,395
Discovery Early Career Research Award 24.5 228 230
Discovery Indigenous 24.5 244 130
Future Fellowships 24.5 693 425
Linkage – Projects 24.5 695 536
Total Australian Research Council (b) 2,931 2,716
Other Commonwealth Government Financial Assistance – Non Capital
DET 1,077 1,280
Total Other Commonwealth Government Financial Assistance (c) 1,077 1,280
Total Commonwealth Government Financial Assistance 389,386 361,867
Total Commonwealth Government Financial Assistance Excluding HELP (a + b + c) 237,535 222,787
Australian Government Grants Received – Cash Basis
OS-HELP (Net) 24.6 353 (299)
Superannuation Supplementation 24.7 1,436 1,400
Total Australian Government Funding Received – Cash Basis 1,789 1,101
19
2. REVENUE CONTINUED2016
$’0002015
$’000
2.2 STATE & LOCAL GOVERNMENT FINANCIAL ASSISTANCE Deferred Victorian Government Grant (Properties) 24 24
Victorian Government Dept of Ed RTO Funding 3,124 2,203
Total State & Local Government Financial Assistance 3,148 2,227
2.3 FEES AND CHARGESFee Paying Overseas Students 48,820 45,421
Fee Paying Non Overseas Postgraduate Students 8,133 9,495
Fee Paying Non Overseas Undergraduate Students 11 7
Other
Non-Overseas Students Undertaking Non-Award
Courses 591 394
Rental Charges 7,003 2,524
Charges for Student Accommodation 3,053 2,361
Registration Fees 3,964 3,369
Library Fees 85 101
Late Fees 316 359
Total Fees and Charges 71,976 64,031
2.4 FINANCE INCOMEInterest 1,555 611
Dividends - 263
Total Finance Income 1,555 874
2.5 CONSULTANCY AND CONTRACT RESEARCHConsultancy Fees 147 232
Industry Research Grants 10,857 7,386
Total Consultancy and Contract Research 11,004 7,618
2.6 OTHER REVENUEOffshore Programs 275 39
Other Program Income 8,346 7,463
Other Grants – Health Workforce Australia - 5,479
Other Grants - Other 6,207 3,804
Donations and Bequests 1,061 167
Profit on Disposal of Assets* - 750
Other Income 6,208 11,435
Total Other Revenue 22,097 29,137* Due to Reversal of Make Good on Acquisition of Part of 23 and 33 Berry St North Sydney.
20
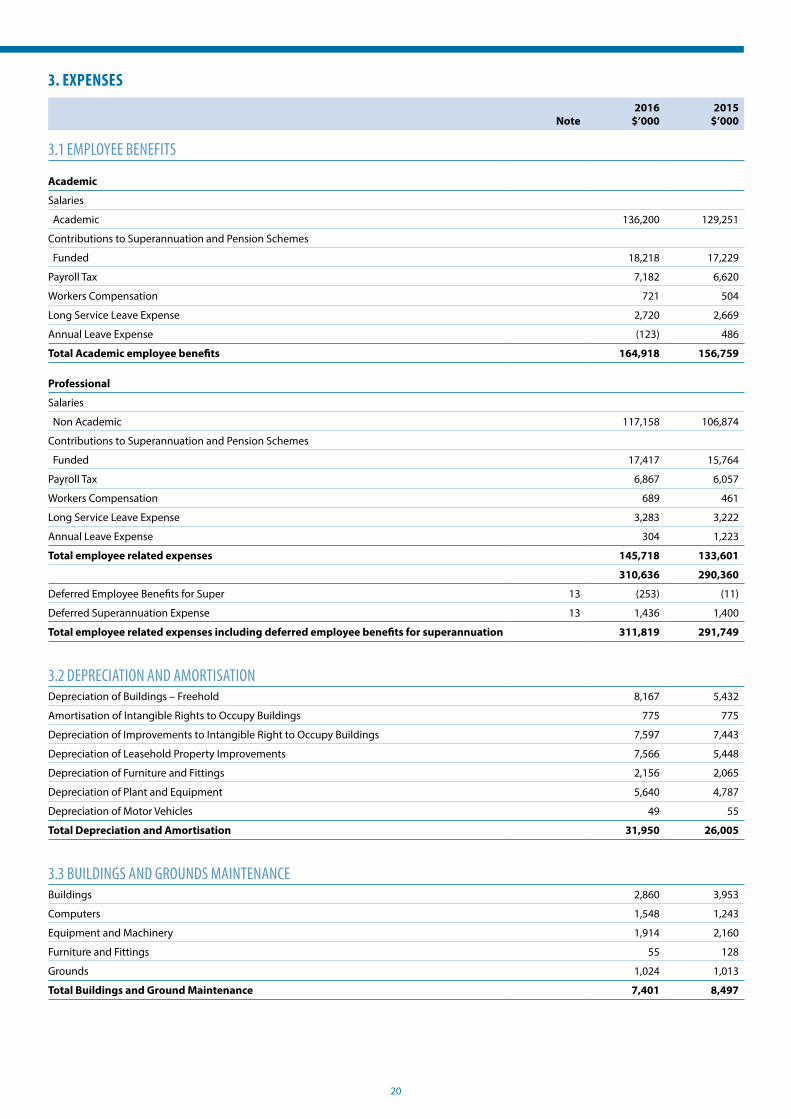
3. EXPENSES
Note2016
$’0002015
$’000
3.1 EMPLOYEE BENEFITS
Academic
Salaries
Academic 136,200 129,251
Contributions to Superannuation and Pension Schemes
Funded 18,218 17,229
Payroll Tax 7,182 6,620
Workers Compensation 721 504
Long Service Leave Expense 2,720 2,669
Annual Leave Expense (123) 486
Total Academic employee benefits 164,918 156,759
Professional
Salaries
Non Academic 117,158 106,874
Contributions to Superannuation and Pension Schemes
Funded 17,417 15,764
Payroll Tax 6,867 6,057
Workers Compensation 689 461
Long Service Leave Expense 3,283 3,222
Annual Leave Expense 304 1,223
Total employee related expenses 145,718 133,601
310,636 290,360
Deferred Employee Benefits for Super 13 (253) (11)
Deferred Superannuation Expense 13 1,436 1,400
Total employee related expenses including deferred employee benefits for superannuation 311,819 291,749
3.2 DEPRECIATION AND AMORTISATIONDepreciation of Buildings – Freehold 8,167 5,432
Amortisation of Intangible Rights to Occupy Buildings 775 775
Depreciation of Improvements to Intangible Right to Occupy Buildings 7,597 7,443
Depreciation of Leasehold Property Improvements 7,566 5,448
Depreciation of Furniture and Fittings 2,156 2,065
Depreciation of Plant and Equipment 5,640 4,787
Depreciation of Motor Vehicles 49 55
Total Depreciation and Amortisation 31,950 26,005
3.3 BUILDINGS AND GROUNDS MAINTENANCEBuildings 2,860 3,953
Computers 1,548 1,243
Equipment and Machinery 1,914 2,160
Furniture and Fittings 55 128
Grounds 1,024 1,013
Total Buildings and Ground Maintenance 7,401 8,497

21
3. EXPENSES CONTINUED
Note2016
$’0002015
$’000
3.4 OTHER EXPENSESAdvertising, Promotions, Publicity, Printing & Stationery 10,555 8,879
Cleaning and Waste Collection 4,763 3,945
Computer Software and Services 8,046 6,025
Conference Expenses 1,159 1,155
Copyright Fees 723 830
Hire of Equipment and Facilities 1,903 1,733
Insurance 897 867
Legal Fees 440 813
Library Acquisitions 7,629 6,193
Minor Equipment 3,884 4,913
Meeting Expenses 827 1,027
Net Loss on Disposal of Property, Plant and Equipment - 19
Offshore Administration 4,097 4,184
Operating Lease Rental Expenses 3,575 2,569
Publications, Subscriptions and Memberships 1,463 1,465
Scholarships and Prizes 6,102 5,202
Security Services 2,813 2,856
Staff Development & Appointment Costs 2,229 2,210
Student Grants 1,198 1,067
Telecommunications 2,438 2,138
Unrealised Foreign Exchange Loss - 28
Utilities 3,607 4,111
Other Expenses 16,227 12,773
Total Other Expenses 84,575 75,002
4. FINANCE EXPENSE
Note2016
$’0002015
$’000
Make Good on Leased Premises - Unwind of Discount on Provision 15(a) 191 (234)
Bank Loan Interest, Interest Rate Swap and Fees 1,957 1,294
Total Finance Expense 2,148 1,060
5. AUDITOR'S REMUNERATION - KPMG2016
$2015
$
Audit of the University’s Financial Statements 147,500 128,000
Other Audit and Related Services
Grant/Research Acquittal (Higher Education Research Data Collection, Indigenous Education Program, Program Access Community Engagement, Health Workforce Australia and Role M)
32,600 30,800
Other Services
Debt Advice - 660
Students Association agreed upon procedures 16,500 -
Faircall Service (Whistle Blower Hotline) 8,800 -
Total Auditor's Remuneration 205,400 159,460

22
6. CASH AND CASH EQUIVALENTS2016
$'0002015
$'000
Cash on Hand 27 26
Cash at Bank 66,497 46,518
Total Cash and Cash Equivalents 66,524 46,544
7. TRADE AND OTHER RECEIVABLES2016
$'0002015
$'000
Current
Sundry Receivables 1,927 1,775
Accrued Income 1,152 7,233
Net GST Receivable from ATO 21 -
OS-HELP Receivable 652 299
Total Trade and Other Receivables 3,752 9,307
8. OTHER INVESTMENTS2016
$'0002015
$'000
Current
Term Deposits 8,000 -
8,000 -
Non-Current
Available for Sale - Investments in Other Entities
Shares in Listed Companies 753 718
Shares in Other Companies 11,613 9,783
Total Other Investments 12,366 10,501
9. OTHER ASSETS
Note2016
$'0002015
$'000
Current
Prepayments 9,493 6,774
Lease Paid in Advance 56 56
Total Current Other Assets 9,549 6,830
Non-Current
Right to Reimbursement from Commonwealth Government for Unfunded Superannuation Liability 13 18,560 18,813
Lease Paid in Advance 3,932 3,989
Interest Rate Swap 1,969 -
Other Receivables - 298
Total Non-Current Other Assets 24,461 23,100Refer to Note 13 for an explanation of the right to reimbursement from the Commonwealth Government for the unfunded superannuation liability.
23
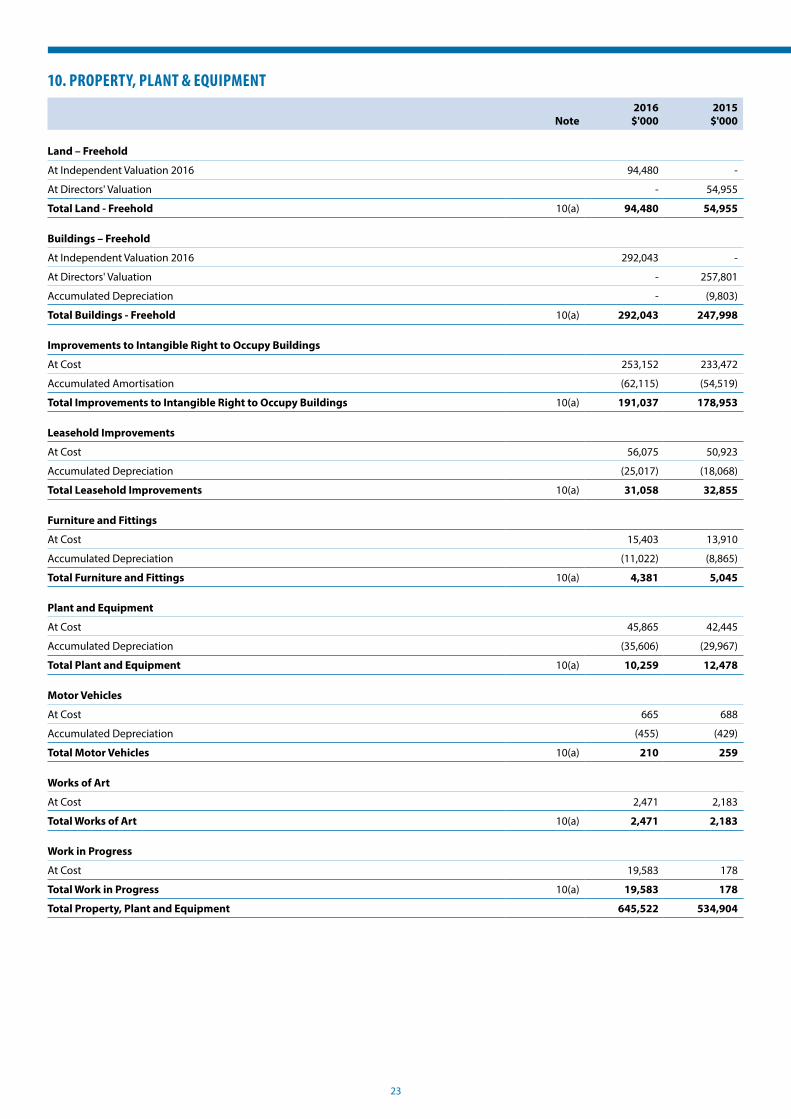
10. PROPERTY, PLANT & EQUIPMENT
Note2016
$'0002015
$'000
Land – Freehold
At Independent Valuation 2016 94,480 -
At Directors' Valuation - 54,955
Total Land - Freehold 10(a) 94,480 54,955
Buildings – Freehold
At Independent Valuation 2016 292,043 -
At Directors' Valuation - 257,801
Accumulated Depreciation - (9,803)
Total Buildings - Freehold 10(a) 292,043 247,998
Improvements to Intangible Right to Occupy Buildings
At Cost 253,152 233,472
Accumulated Amortisation (62,115) (54,519)
Total Improvements to Intangible Right to Occupy Buildings 10(a) 191,037 178,953
Leasehold Improvements
At Cost 56,075 50,923
Accumulated Depreciation (25,017) (18,068)
Total Leasehold Improvements 10(a) 31,058 32,855
Furniture and Fittings
At Cost 15,403 13,910
Accumulated Depreciation (11,022) (8,865)
Total Furniture and Fittings 10(a) 4,381 5,045
Plant and Equipment
At Cost 45,865 42,445
Accumulated Depreciation (35,606) (29,967)
Total Plant and Equipment 10(a) 10,259 12,478
Motor Vehicles
At Cost 665 688
Accumulated Depreciation (455) (429)
Total Motor Vehicles 10(a) 210 259
Works of Art
At Cost 2,471 2,183
Total Works of Art 10(a) 2,471 2,183
Work in Progress
At Cost 19,583 178
Total Work in Progress 10(a) 19,583 178
Total Property, Plant and Equipment 645,522 534,904

24
10. PROPERTY, PLANT & EQUIPMENT CONTINUED
BASIS OF VALUATIONA full valuation of Freehold Land and Buildings was undertaken by AssetVal Pty Ltd as at the end of 2016. From 2014, Plant and Equipment including Works of Arts items have been included as an asset where cost is greater than or equal to $3,000, previously, the amount was greater than or equal to $1,000.
(A) RECONCILIATIONSReconciliations of the carrying amounts for each class of property, plant and equipment are set out below:
Land – Freehold
Buildings – Freehold
Sub-Total Land and Buildings Freehold
Improvements of Intangible
Right to Occupy
BuildingsLeasehold
Improvements
Furniture and
FittingsPlant and
EquipmentMotor
VehiclesWorks of Art
Work in Progress Total
2016
Opening Balance 54,955 247,998 302,953 178,953 32,855 5,045 12,478 259 2,183 178 534,904
Additions 280 9,617 9,897 19,681 6,818 1,492 3,420 - 288 19,583 61,179
Transfer from WIP - 178 178 - (178) -
Revaluation Increment/ (Decrement)
39,245 42,417 81,662 - - - - - - - 81,662
Depreciation - (8,167) (8,167) (7,597) (7,566) (2,156) (5,639) (26) - - (31,151)
Disposals - - - - (1,049) - (23) - - (1,072)
Closing Balance 94,480 292,043 386,523 191,037 31,058 4,381 10,259 210 2,471 19,583 645,522
2015
Opening Balance 49,955 154,694 204,649 160,721 30,491 6,351 12,191 264 1,672 - 416,339
Additions 5,000 98,736 103,736 25,675 10,603 759 5,075 99 511 178 146,636
Transfer from WIP - - - - - - - - - - -
Depreciation - (5,432) (5,432) (7,443) (5,448) (2,065) (4,787) (55) - - (25,230)
Disposals - - - - (2,791) - (1) (49) - - (2,841)
Closing Balance 54,955 247,998 302,953 178,953 32,855 5,045 12,478 259 2,183 178 534,904
25
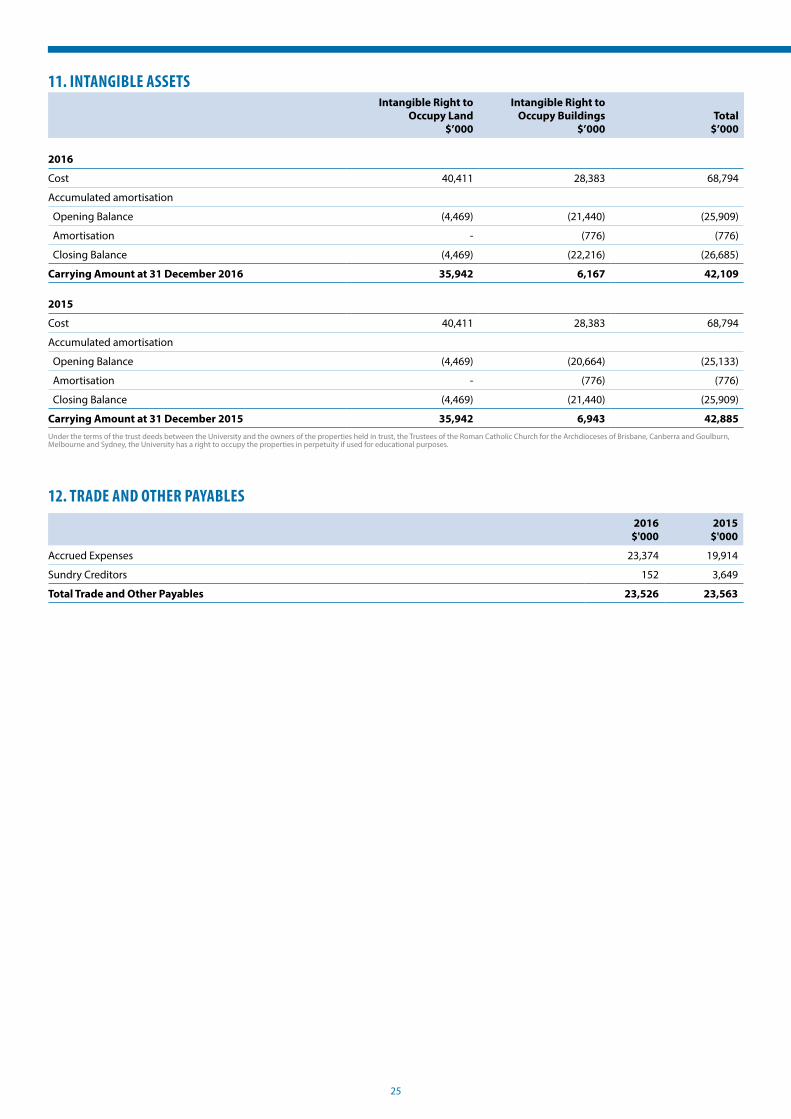
11. INTANGIBLE ASSETSIntangible Right to
Occupy Land $’000
Intangible Right to Occupy Buildings
$’000Total
$’000
2016
Cost 40,411 28,383 68,794
Accumulated amortisation
Opening Balance (4,469) (21,440) (25,909)
Amortisation - (776) (776)
Closing Balance (4,469) (22,216) (26,685)
Carrying Amount at 31 December 2016 35,942 6,167 42,109
2015
Cost 40,411 28,383 68,794
Accumulated amortisation
Opening Balance (4,469) (20,664) (25,133)
Amortisation - (776) (776)
Closing Balance (4,469) (21,440) (25,909)
Carrying Amount at 31 December 2015 35,942 6,943 42,885Under the terms of the trust deeds between the University and the owners of the properties held in trust, the Trustees of the Roman Catholic Church for the Archdioceses of Brisbane, Canberra and Goulburn, Melbourne and Sydney, the University has a right to occupy the properties in perpetuity if used for educational purposes.
12. TRADE AND OTHER PAYABLES2016
$'0002015
$'000
Accrued Expenses 23,374 19,914
Sundry Creditors 152 3,649
Total Trade and Other Payables 23,526 23,563

26
13. EMPLOYEE BENEFITS2016
$'0002015
$'000
Current
Expected to be settled within 12 months
Provision for Annual Leave 12,742 12,616
Provision for Long Service Leave 3,718 3,620
16,460 16,236
Expected to be settled after 12 months
Provision for Annual Leave 5,460 5,406
Provision for Long Service Leave 12,064 11,746
17,524 17,152
Total Current Provisions 33,984 33,388
Non-Current
Provision for Long Service Leave 10,653 9,309
Provision for Superannuation 18,560 18,813
Total Non-Current Provisions 29,213 28,122
LONG SERVICE LEAVEThe classification of current employee provisions include amounts for which there is not an unconditional right to defer settlement by one year. Despite the classification of a component of long service leave as a current liability, the University does not expect the full amount to be settled within one year of reporting date.
SUPERANNUATION The University contributes to the following employee superannuation funds:
FULLY FUNDED SCHEMES• UniSuper
• Catholic Superannuation Fund (formerly two funds) National Catholic Superannuation Fund and ii) Catholic Superannuation Fund
• Australian Catholic Superannuation & Retirement Fund (formerly Catholic Superannuation & Retirement Fund)
• Emergency Services and State Superannuation Scheme (formerly State Superannuation Fund of Victoria) – Accumulation account
• Australian Super Pty Ltd
• McKenna Retirement Fund
• HESTA
• First State Super
PARTLY FUNDED OR EMERGING COST SCHEMES• State Authorities Superannuation Scheme
(Part 2) (NSW)
• Emergency Services and State Superannuation Scheme (formerly State Superannuation Fund of Victoria).
EMERGENCY SERVICES AND STATE SUPERANNUATION SCHEME (FORMERLY STATE SUPERANNUATION FUND OF VICTORIA)The latest actuarial investigation of the Emergency Services and State Superannuation Scheme was conducted at 31 December 2016 by PriceWaterhouseCoopers. As at that date the scheme carried total liabilities, including liabilities for members’ benefits in excess of the value of the scheme’s assets.
Hence, unfunded superannuation liabilities exist which are recognised in the financial statements of the scheme.
The notional share of the scheme’s unfunded liabilities attributed to the University is assessed by the Government Superannuation Office to be $18,560,000 as at 31 December 2016 ($18,813,000 as at 30 June 2015). Information on the scheme’s position is only provided at 30 June.
An arrangement exists between the Australian Government and the State Government to meet the unfunded liability for the beneficiaries of the State Superannuation Scheme on an emerging cost basis. This arrangement is evidenced by the State Grants (General Revenue) Amendment Act 1987, Higher Education Support Act 2003 and subsequent amending legislation. By letter dated 15 December 2005, the Department of Education, Science and Training (DEST) (now Department of Education and Training) confirmed that the Australian Government considers the current arrangement establishes a pattern of past practice and future intent that has created a valid expectation on the part of universities that the department on behalf of the Australian Government will discharge the superannuation liability. Therefore a non-current receivable equal to the scheme’s unfunded liabilities attributed to the University has been recognised. DET provides annual supplementation 2016 $1,436,037 (2015: $1,400,000) to cover emerging costs of the Emergency Services and State Superannuation Scheme.
The following information has been provided by the Emergency Services and State Superannuation Scheme in accordance with the requirements under AASB 119.
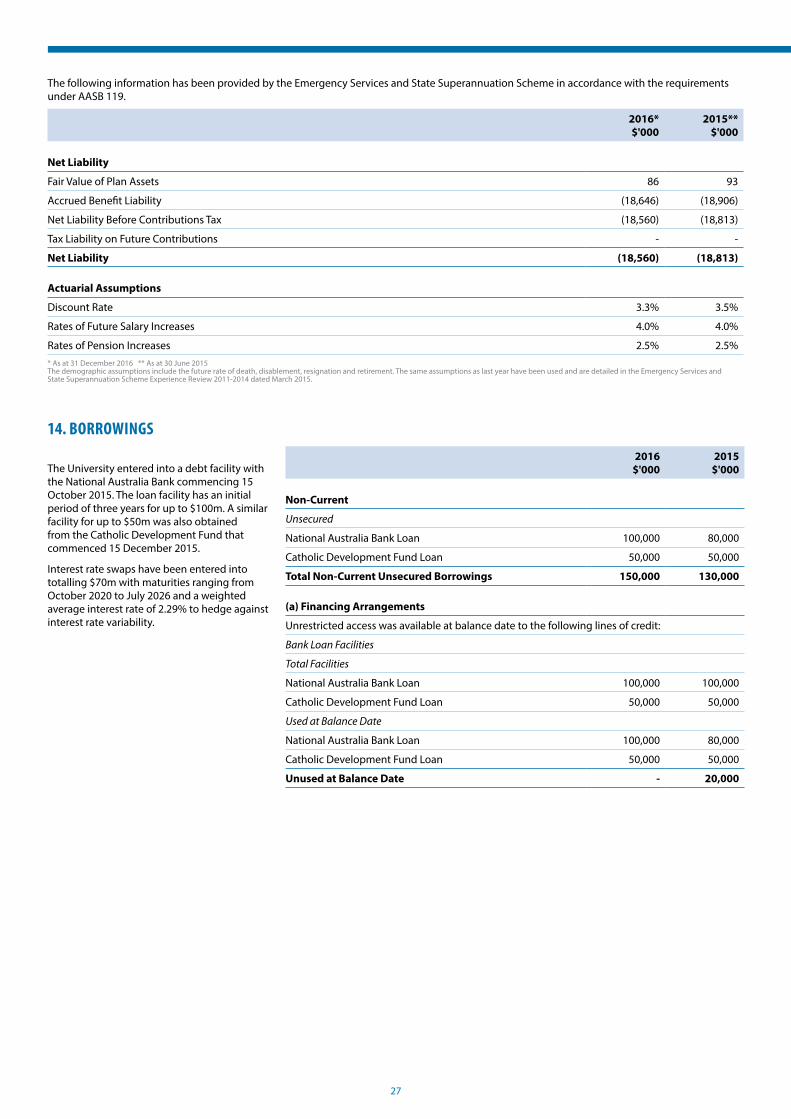
27
The following information has been provided by the Emergency Services and State Superannuation Scheme in accordance with the requirements under AASB 119.
2016* $'000
2015** $'000
Net Liability
Fair Value of Plan Assets 86 93
Accrued Benefit Liability (18,646) (18,906)
Net Liability Before Contributions Tax (18,560) (18,813)
Tax Liability on Future Contributions - -
Net Liability (18,560) (18,813)
Actuarial Assumptions
Discount Rate 3.3% 3.5%
Rates of Future Salary Increases 4.0% 4.0%
Rates of Pension Increases 2.5% 2.5%* As at 31 December 2016 ** As at 30 June 2015The demographic assumptions include the future rate of death, disablement, resignation and retirement. The same assumptions as last year have been used and are detailed in the Emergency Services and State Superannuation Scheme Experience Review 2011-2014 dated March 2015.
14. BORROWINGS
The University entered into a debt facility with the National Australia Bank commencing 15 October 2015. The loan facility has an initial period of three years for up to $100m. A similar facility for up to $50m was also obtained from the Catholic Development Fund that commenced 15 December 2015.
Interest rate swaps have been entered into totalling $70m with maturities ranging from October 2020 to July 2026 and a weighted average interest rate of 2.29% to hedge against interest rate variability.
2016 $'000
2015 $'000
Non-Current
Unsecured
National Australia Bank Loan 100,000 80,000
Catholic Development Fund Loan 50,000 50,000
Total Non-Current Unsecured Borrowings 150,000 130,000
(a) Financing Arrangements
Unrestricted access was available at balance date to the following lines of credit:
Bank Loan Facilities
Total Facilities
National Australia Bank Loan 100,000 100,000
Catholic Development Fund Loan 50,000 50,000
Used at Balance Date
National Australia Bank Loan 100,000 80,000
Catholic Development Fund Loan 50,000 50,000
Unused at Balance Date - 20,000

28
15. OTHER LIABILITIES
Note2016
$'0002015
$'000
Current
Grants Received in Advance 8,937 9,880
Fees Received in Advance 13,950 11,327
Other Income Received in Advance 2,195 2,151
Deferred Grant Income (Properties) 24 24
Sub-Total Deferred Revenue 25,106 23,382
Net GST Payable to ATO - 85
Funds Held in Trust 1,963 1,949
Bonds – Student Residences 199 96
Interest Rate Swap 394 116
Foreign Currency Forward Exchange Contract - 28
Total Current Other Liabilities 27,662 25,656
Non-Current
Deferred Grant Income (Properties) 552 576
Lease Liabilities 4,109 4,559
Leasehold Make Good Provision 15 (a) 6,142 6,556
Interest Rate Swap 265 138
Total Non-Current Other Liabilities 11,068 11,829
(a) Reconciliation
Leasehold Make Good Provision
Balance at Beginning of Financial Year 6,556 6,011
Provisions Made During the Year 1,967 1,788
Provisions Reversed During the Year (2,572) (1,009)
Unwind/Adj Discount 4 191 (234)
Balance at End of Financial Year 6,142 6,556Make good is required for leased premises. The provision is estimated based on the rate of the building, the remaining lease period and estimated costs incurred in similar situations.

29
16. RESERVES
Note2016
$'0002015
$'000
General Reserve
Balance at Beginning of Financial Year 334,400 291,523
Add: Transfers from Retained Earnings 17 31,766 42,877
Balance at End of Financial Year 366,166 334,400
Asset Revaluation Reserve
Balance at Beginning of Financial Year 20,637 20,637
Add/(Subtract): Increment/(Decrement) 81,662 -
Balance at End of Financial Year 102,299 20,637
Available for Sale Financial Assets Revaluation
Reserve
Balance at Beginning of Financial Year 9,518 5,232
Write Back Revaluation on Disposal of Listed Shares 20 (66)
Add/(Subtract): Revaluation Increment
Shares Revaluation Reserve 1,869 4,352
Balance at End of Financial Year 11,407 9,518
Contribution from Members
Balance at Beginning of Financial Year 56,958 56,958
Balance at End of Financial Year 56,958 56,958
Total Reserves 536,830 421,513
NATURE AND PURPOSE OF RESERVESGENERALThe amount standing to the credit of the general reserve includes the accumulation of prior period and current year profits for non-specific purposes and revenue for capital grants even though assets acquired may not be fully written down.
ASSET REVALUATIONThe asset revaluation reserve includes the net revaluation increments and decrements arising from the revaluation of freehold land and buildings.
AVAILABLE FOR SALE FINANCIAL ASSETS REVALUATION RESERVEShare revaluation reserve includes increments and decrements arising from changes in fair value of shares classified as available for sale.
CONTRIBUTION FROM MEMBERSThe amount reflects the contribution by members of rights to occupy and use land and buildings not owned by the University.

30
17. RETAINED EARNINGS
Note2016
$'0002015
$'000
Retained Earnings at beginning of year - -
Net Result 31,766 42,877
Transfer to General Reserve 16 (31,766) (42,877)
Retained earnings at the end of the year - -
18. COMMITMENTS
Note2016
$'0002015
$'000
(a) Capital Expenditure Commitments
Capital Expenditure Commitments not provided for in the financial statements and payable:
Within one year 14,289 36,063
Total Capital Expenditure Commitments 14,289 36,063
(b) Non-cancellable Operating Lease Expense Commitments
Future operating lease commitments of premises, plant and equipment, not provided for in the financial statements and payable:
Within one year 11,168 12,152
One year or later and no later than five years 33,503 39,814
Greater than five years 42,359 48,322
Total Non-cancellable Operating Lease Expense Commitments 87,030 100,289The University leased equipment and machinery under operating leases expiring in a range from one to five years. The University also leased commercial premises with an expiry range of one to twelve years.
19. DIRECTORS AND KEY MANAGEMENT PERSONNEL DISCLOSURES
REMUNERATION OF BOARD MEMBERSNo directors' fees are payable. The number of directors of the University whose compensation from the University or any related party falls within the following bands:
2016 2015
Nil 12 10
$10,000 - $19,999 1 1
$90,000 - $99,999 - 1
$100,000 - $109,999 1 -
$140,000 - $149,999 1 -
$180,000 - $189,999 - 1
$200,000 - $209,999 2 -
$210,000 - $219,999 - 1
$240,000 - $249,999 3 1
$1,240,000 - $1,249,999 1 -
$1,330,000 - $1,339,999* - 1
Total compensation paid, or payable or otherwise made available to all directors of the University from the University or any related party. 2,650,744 2,316,707
* Remuneration in 2015 includes the 2014 short term incentive (STI) payment of $0.1m. Commencing 2015, STI was incorporated into the base remuneration.

31
19. DIRECTORS AND KEY MANAGEMENT PERSONNEL DISCLOSURES (CONTINUED)
REMUNERATION OF KEY MANAGEMENT PERSONNEL In addition to the board members, other key management personnel of the University receiving compensation from the University or any related party falls within the following bands:
$480,000 - $489,999 - 1
$500,000 - $509,999 1 1
$510,000 - $519,999 1 -
$540,000 - $549,999 1 1
$620,000 - $629,999 - 1
$640,000 - $649,999 1 -
$1,240,000 - $1,249,999 1 -
$1,330,000 - $1,339,999* - 1
Total compensation paid, or payable or otherwise made available to all executive officers of the University from the University or any related party. 3,454,910 3,485,187
Short-term employee benefits 3,112,142 3,123,403
Post employment benefits 342,768 361,784
Total compensation paid, or payable or otherwise made available to all executive officers of the University from the University or any related party. 3,454,910 3,485,187
* Remuneration in 2015 includes the 2014 short term incentive (STI) payment of $0.1m. Commencing 2015, STI was incorporated into the base remuneration.
20. RELATED PARTIES
DIRECTORSThe names of each person holding the position of Director of the Australian Catholic University Limited during the financial year are:
Mr J J Carroll, Professor T Ciro, Professor G J Craven AO GCSG, Justice J Douglas, Mr S N Elder, Honourable J Fahey, Professor K Flowers, Dr B Franzsen, Mr E Glass, Professor M Hillel, Ms C Hollis-Jones, Professor J McLaren, Ms M T Najdecki, Mr J O'Connell, Mr D P O'Connor, Associate Professor M Ondaatje, Honourable B Perry, Reverend C Prowse, Ms A Schmiede, Ms B M T Steele, Ms M M Vider.
Details of Directors’ compensation are set out in Note 19.
Total amounts transacted with related parties are as follows
2016 $’000
2015 $’000
Income
Catholic Archdiocese of Brisbane 13 8
Catholic Archdiocese of Canberra and Goulburn 5 21
Catholic Archdiocese of Melbourne 2 105
Catholic Archdiocese of Sydney 4 5
24 139
Expenditure
Catholic Archdiocese of Brisbane 43 4
Catholic Archdiocese of Canberra and Goulburn 93 130
Catholic Archdiocese of Melbourne 876 861
Catholic Archdiocese of Sydney 231 8
Mr J O’Connell (Pro-Chancellor) 48 -
1,291 1,003
Balance Sheet
Catholic Development Funds - Loan 50,000 50,000
50,000 50,000All related party transactions are at arm’s length. Transactions between ACU and the various Catholic Archdiocese are largely in relation to rental. Mr. O’Connell is providing professional services to the University.
32
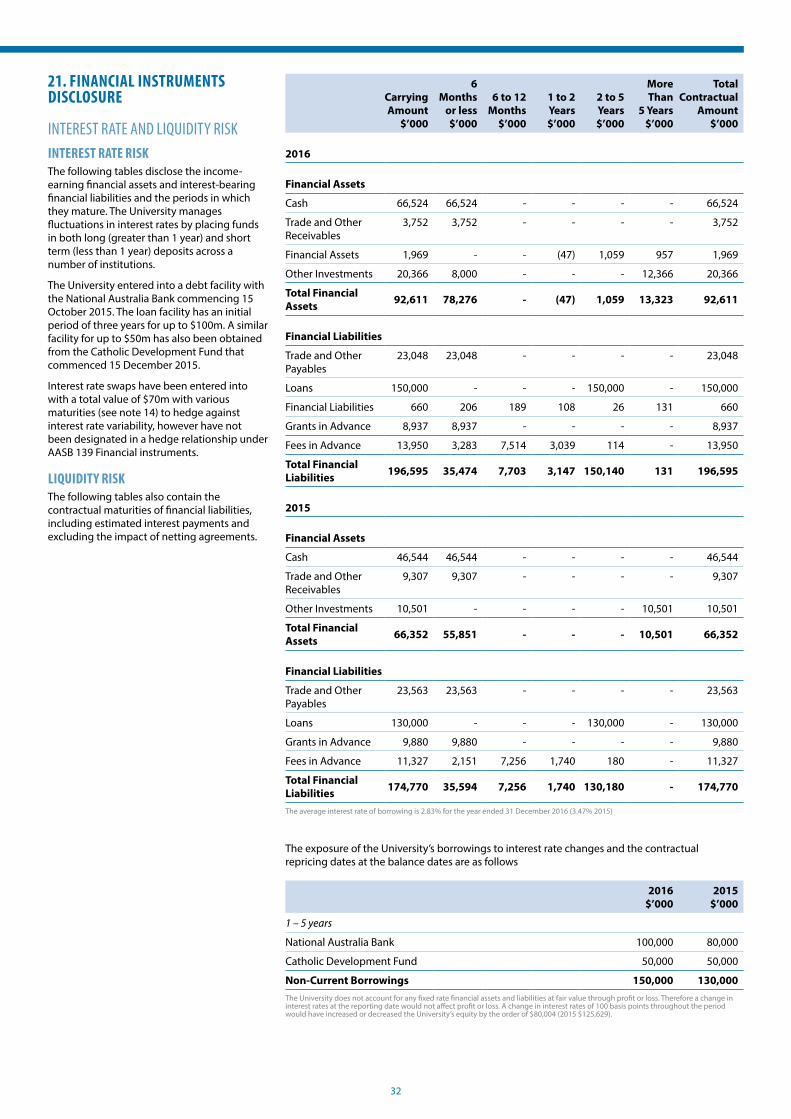
21. FINANCIAL INSTRUMENTS DISCLOSURE
INTEREST RATE AND LIQUIDITY RISKINTEREST RATE RISKThe following tables disclose the income-earning financial assets and interest-bearing financial liabilities and the periods in which they mature. The University manages fluctuations in interest rates by placing funds in both long (greater than 1 year) and short term (less than 1 year) deposits across a number of institutions.
The University entered into a debt facility with the National Australia Bank commencing 15 October 2015. The loan facility has an initial period of three years for up to $100m. A similar facility for up to $50m has also been obtained from the Catholic Development Fund that commenced 15 December 2015.
Interest rate swaps have been entered into with a total value of $70m with various maturities (see note 14) to hedge against interest rate variability, however have not been designated in a hedge relationship under AASB 139 Financial instruments.
LIQUIDITY RISKThe following tables also contain the contractual maturities of financial liabilities, including estimated interest payments and excluding the impact of netting agreements.
Carrying Amount
$’000
6 Months
or less $’000
6 to 12 Months
$’000
1 to 2 Years $’000
2 to 5 Years $’000
More Than
5 Years $’000
Total Contractual
Amount $’000
2016
Financial Assets
Cash 66,524 66,524 - - - - 66,524
Trade and Other Receivables
3,752 3,752 - - - - 3,752
Financial Assets 1,969 - - (47) 1,059 957 1,969
Other Investments 20,366 8,000 - - - 12,366 20,366
Total Financial Assets 92,611 78,276 - (47) 1,059 13,323 92,611
Financial Liabilities
Trade and Other Payables
23,048 23,048 - - - - 23,048
Loans 150,000 - - - 150,000 - 150,000
Financial Liabilities 660 206 189 108 26 131 660
Grants in Advance 8,937 8,937 - - - - 8,937
Fees in Advance 13,950 3,283 7,514 3,039 114 - 13,950
Total Financial Liabilities 196,595 35,474 7,703 3,147 150,140 131 196,595
2015
Financial Assets
Cash 46,544 46,544 - - - - 46,544
Trade and Other Receivables
9,307 9,307 - - - - 9,307
Other Investments 10,501 - - - - 10,501 10,501
Total Financial Assets 66,352 55,851 - - - 10,501 66,352
Financial Liabilities
Trade and Other Payables
23,563 23,563 - - - - 23,563
Loans 130,000 - - - 130,000 - 130,000
Grants in Advance 9,880 9,880 - - - - 9,880
Fees in Advance 11,327 2,151 7,256 1,740 180 - 11,327
Total Financial Liabilities 174,770 35,594 7,256 1,740 130,180 - 174,770
The average interest rate of borrowing is 2.83% for the year ended 31 December 2016 (3.47% 2015)
The exposure of the University’s borrowings to interest rate changes and the contractual repricing dates at the balance dates are as follows
2016 $’000
2015 $’000
1 – 5 years
National Australia Bank 100,000 80,000
Catholic Development Fund 50,000 50,000
Non-Current Borrowings 150,000 130,000The University does not account for any fixed rate financial assets and liabilities at fair value through profit or loss. Therefore a change in interest rates at the reporting date would not affect profit or loss. A change in interest rates of 100 basis points throughout the period would have increased or decreased the University’s equity by the order of $80,004 (2015 $125,629).
33
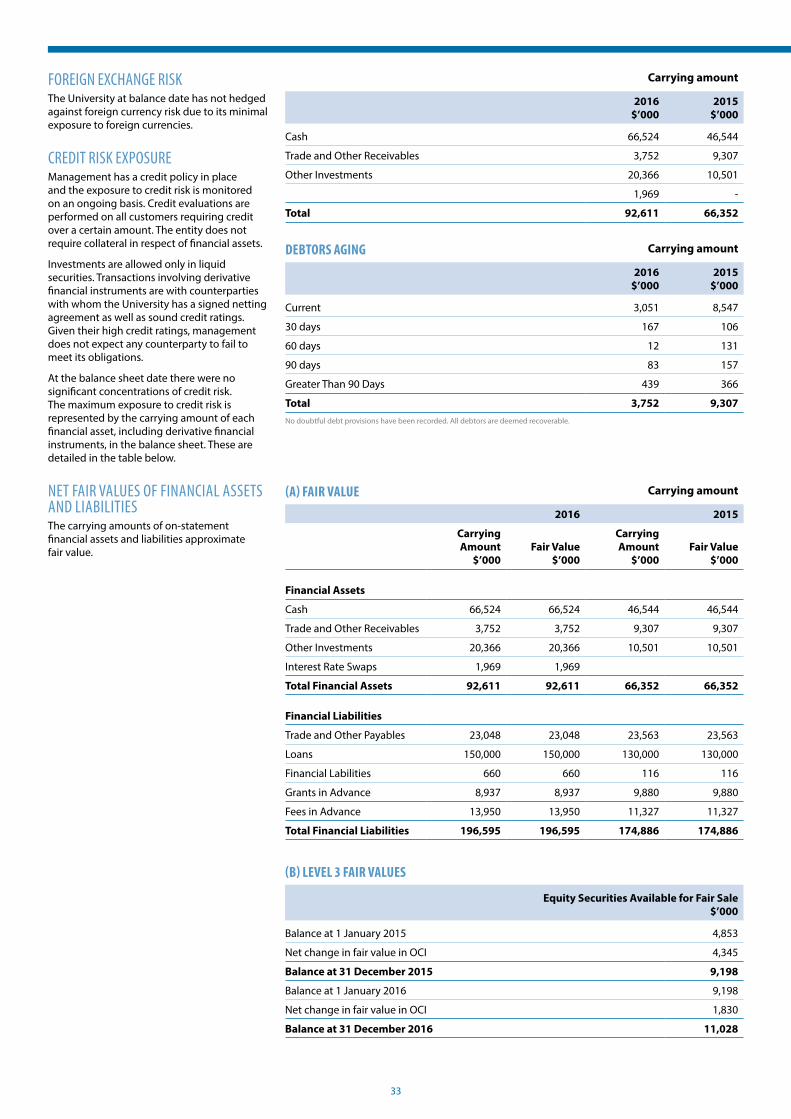
FOREIGN EXCHANGE RISKThe University at balance date has not hedged against foreign currency risk due to its minimal exposure to foreign currencies.
CREDIT RISK EXPOSUREManagement has a credit policy in place and the exposure to credit risk is monitored on an ongoing basis. Credit evaluations are performed on all customers requiring credit over a certain amount. The entity does not require collateral in respect of financial assets.
Investments are allowed only in liquid securities. Transactions involving derivative financial instruments are with counterparties with whom the University has a signed netting agreement as well as sound credit ratings. Given their high credit ratings, management does not expect any counterparty to fail to meet its obligations.
At the balance sheet date there were no significant concentrations of credit risk. The maximum exposure to credit risk is represented by the carrying amount of each financial asset, including derivative financial instruments, in the balance sheet. These are detailed in the table below.
NET FAIR VALUES OF FINANCIAL ASSETS AND LIABILITIESThe carrying amounts of on-statement financial assets and liabilities approximate fair value.
Carrying amount
2016 $’000
2015 $’000
Cash 66,524 46,544
Trade and Other Receivables 3,752 9,307
Other Investments 20,366 10,501
1,969 -
Total 92,611 66,352
DEBTORS AGING Carrying amount
2016 $’000
2015 $’000
Current 3,051 8,547
30 days 167 106
60 days 12 131
90 days 83 157
Greater Than 90 Days 439 366
Total 3,752 9,307No doubtful debt provisions have been recorded. All debtors are deemed recoverable.
(A) FAIR VALUE Carrying amount
2016 2015
Carrying Amount
$’000Fair Value
$’000
Carrying Amount
$’000Fair Value
$’000
Financial Assets
Cash 66,524 66,524 46,544 46,544
Trade and Other Receivables 3,752 3,752 9,307 9,307
Other Investments 20,366 20,366 10,501 10,501
Interest Rate Swaps 1,969 1,969
Total Financial Assets 92,611 92,611 66,352 66,352
Financial Liabilities
Trade and Other Payables 23,048 23,048 23,563 23,563
Loans 150,000 150,000 130,000 130,000
Financial Labilities 660 660 116 116
Grants in Advance 8,937 8,937 9,880 9,880
Fees in Advance 13,950 13,950 11,327 11,327
Total Financial Liabilities 196,595 196,595 174,886 174,886
(B) LEVEL 3 FAIR VALUES
Equity Securities Available for Fair Sale $’000
Balance at 1 January 2015 4,853
Net change in fair value in OCI 4,345
Balance at 31 December 2015 9,198
Balance at 1 January 2016 9,198
Net change in fair value in OCI 1,830
Balance at 31 December 2016 11,028
34
22. EQUITY No share capital has been issued by the University as it is a university limited by guarantee. The number of members of the University as at 31 December 2016 was 23 (2015: 23). The liability of each member is limited to $50.
23. NOTES TO THE STATEMENT OF CASH FLOWS
(I) RECONCILIATION OF CASHFor the purposes of the Statement of Cash Flows, cash includes cash on hand and at bank. Cash as at the end of the financial year as shown in the Statement of Cash Flows is reconciled to the related items in the balance sheet as follows:
2016 $'000
2015 $'000
Cash on Hand 27 26
Cash at Bank Net of Unpresented Cheques 66,497 46,518
Total Cash and Cash Equivalents 66,524 46,544
(II) RECONCILIATION OF NET RESULT AFTER INCOME TAX TO NET CASH PROVIDED BY OPERATING ACTIVITIES2016
$'0002015
$'000
Net Result After Income Tax 31,766 42,877
Add/(Less) Items Classified as Investing/Financing Activities:
(Profit) on Sale of Non-Current Assets - (750)
Loss on Sale of Non-Current Assets - 19
Add/(Less) Non-Cash Items:
Depreciation & Amortisation 31,950 26,005
Lease In Advance 56 56
Unwind/Adj Discount on Make Good Provision (1,020) (234)
Increase/(Decrease) in Interest Rate Swap (1,564) 254
Increase/(Decrease) in Foreign Currency (28) 28
Amounts Set aside to (utilised from) Provisions:
Employee Entitlements 1,940 3,809
Make Good of Lease Premises 606 780
Net Cash Provided by Operating Activities Before Change in Assets and Liabilities 63,706 72,844
Change in Assets and Liabilities:
(Increase)/Decrease in Accrued Income 6,081 (5,368)
(Increase)/Decrease in Sundry Debtors (152) 201
(Increase)/Decrease in Prepayments (2,719) (1,134)
(Increase)/Decrease in Other Assets 361 29
Increase/(Decrease) in Grants in Advance (1,296) 372
Increase/(Decrease) in Fees in Advance 2,624 (323)
Increase/(Decrease) in Accrued Expenses 5,367 (1,229)
Increase/(Decrease) in Sundry Creditors (3,498) 663
Increase/(Decrease) in Funds in Held in Trust 14 107
Increase/(Decrease) in Bonds – University Residences 103 (20)
Increase/(Decrease) in Other Income in Advance (18) 1,343
Increase/(Decrease) in Deferred Income (Properties) (24) (24)
Increase/(Decrease) in Net GST (105) 1,420
Increase/(Decrease) in Lease Liabilities (450) (1,404)
Net Cash Provided by Operating Activities 69,994 67,477

35
24. ACQUITTAL OF COMMONWEALTH GOVERNMENT FINANCIAL ASSISTANCE
24.1 COMMONWEALTH GRANTS SCHEME AND OTHER GRANTS
Commonwealth Grants Scheme
Indigenous Support Fund
Disability Support Programs
Note2016
$'0002015
$'0002016
$'0002015
$'0002016
$'0002015
$'000
Financial assistance received in cash during the reporting period (total cash received from the Australian Government for the programs) 227,726 203,531 1,213 1,181 94 73
Net accrual adjustments (5,933) 5,174 - - - -
Revenue for the period 2.1 221,793 208,705 1,213 1,181 94 73
Surplus/(deficit) from the previous year - - - - - -
Funds available for reporting period 221,793 208,705 1,213 1,181 94 73
Less expenses including accrued expenses (221,793) (208,705) (1,213) (1,181) (94) (73)
Surplus/(deficit) for reporting period - - - - - -
Promotion of Excellence in Learning and
TeachingPartnership and
Participation Funding
Note2016
$'0002015
$'0002016
$'0002015
$'000
Financial assistance received in cash during the reporting period (total cash received from the Australian Government for the programs) 30 20 3,324 3,344
Net accrual adjustments - -
Revenue for the period 2.1 30 20 3,324 3,344
Surplus/(deficit) from the previous year - - - -
Funds available for reporting period 30 20 3,324 3,344
Less expenses including accrued expenses (30) (20) (3,324) (3,344)
Surplus/(deficit) for reporting period - - - -
24.2 HIGHER EDUCATION LOAN PROGRAMS (HELP)
HECS HELP FEE HELP FEE HELP VET SA HELP
2016 $’000
2015 $’000
2016 $’000
2015 $’000
2016 $’000
2015 $’000
2016 $’000
2015 $’000
Financial assistance received in cash during the reporting period (total cash received from the Australian Government for the programs)
135,501 125,071 10,487 8,801 1,011 1,156 4,733 4,150
Plus contributions actually received from students 11,678 12,307 - - - - - -
Total received 147,179 137,378 10,487 8,801 1,011 1,156 4,733 4,150
Net accrual adjustments 118 (144) 63 35 - - (62) 12
Revenue for the period 147,296 137,234 10,550 8,836 1,011 1,156 4,671 4,162
Surplus/(deficit) from the previous year - - - - - - - -
Funds available for reporting period 147,296 137,234 10,550 8,836 1,011 1,156 4,671 4,162
Less expenses including accrued expenses (147,296) (137,234) (10,550) (8,836) (1,011) (1,156) (4,671) (4,162)
Surplus/(deficit) for reporting period - - - - - - - -
36
24.3 SCHOLARSHIPS
Australian Post Graduate
Awards
International Postgraduate
Research Scholarships
Commonwealth Education Costs
Scholarships
Commonwealth Accommodation
Scholarships
Indigenous Access
Scholarships
National Priority
Scholarships
Note 2016 $’000
2015 $’000
2016 $’000
2015 $’000
2016 $’000
2015 $’000
2016 $’000
2015 $’000
2016 $’000
2015 $’000
2016 $’000
2015 $’000
Financial assistance received in cash during the reporting period (total cash received from the Australian Government for the programs)
1,109 1,074 69 68 49 58 5 - 88 5 - -
Net accrual adjustments 3 (272) (7) 2 - - - - - - - -
Revenue attributed to the period 2.1 1,112 802 62 70 49 58 5 - 88 5 - -
Surplus/(deficit) from the previous year - - - - 229 18 123 118 12 7 5 5
Adj Surplus/(deficit) from the previous year - - - - - 153 - - - - - -
Funds available for reporting period 1,112 802 62 70 278 229 128 118 100 12 5 5
Less expenses including accrued expenses
1,112 (802 (62) (70) (137) - 5 - - - -
Surplus/(deficit) for reporting period - - - - 141 229 128 123 100 12 5 5
24.4 COMMONWEALTH RESEARCH FINANCIAL ASSISTANCE
Joint Research Engagement Program
Research Training Scheme Infrastructure
Sustainable Research Excellence
in Universities
Note2016
$’0002015
$’0002016
$’0002015
$’0002016
$’0002015
$’0002016
$’0002015
$’000
Financial assistance received in cash during the reporting period (total cash received from the Australian Government for the programs)
1,777 1,554 2,289 2,181 678 263 1,012 535
Net accrual adjustments - - - - - - - -
Revenue for the period 2.1 1,777 1,554 2,289 2,181 678 263 1,012 535
Surplus/(deficit) from the previous year - - - - - - - -
Funds available for reporting period 1,777 1,554 2,289 2,181 678 263 1,012 535
Less expenses including accrued expenses (1,777) (1,554) (2,289) (2,181) (678) (263) (1,012) (535)
Surplus/(deficit) for reporting period - - - - - - - -
Note: Reported surpluses for JRE, RTS, Infrastructure, ASHER, IAP, CTS and SRE are expected to be rolled over.
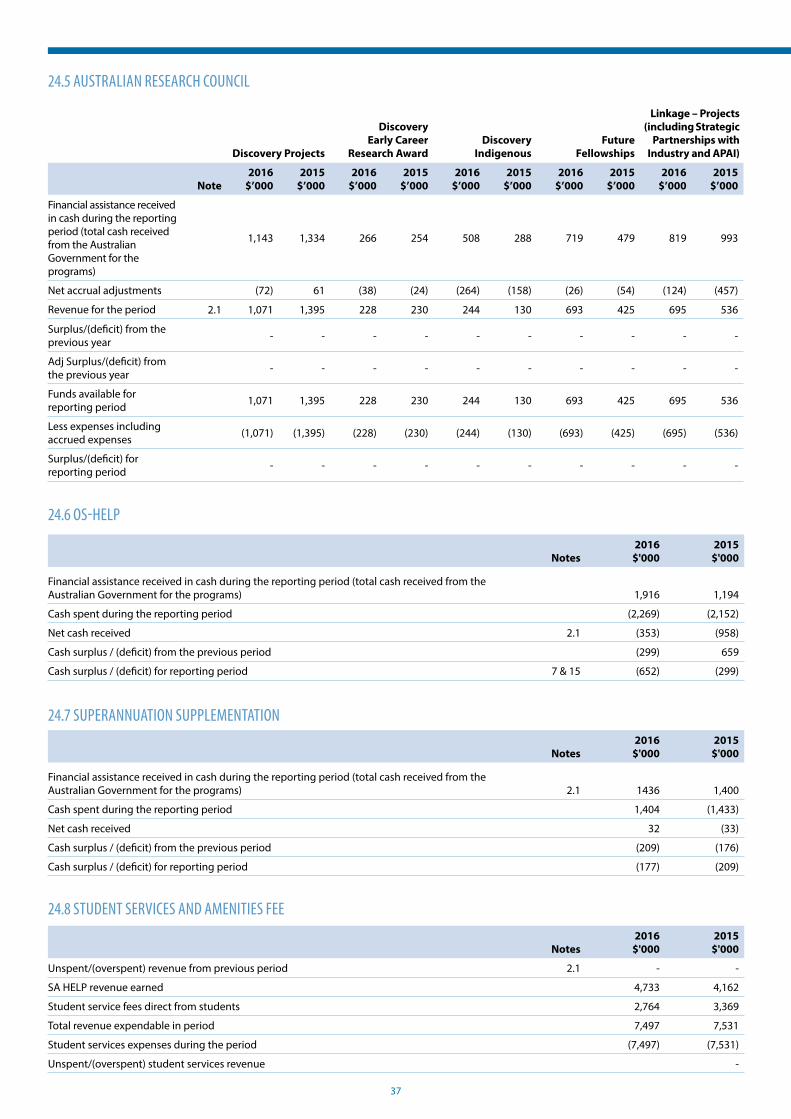
37
24.5 AUSTRALIAN RESEARCH COUNCIL
Discovery Projects
Discovery Early Career
Research AwardDiscovery
IndigenousFuture
Fellowships
Linkage – Projects (including Strategic
Partnerships with Industry and APAI)
Note2016
$’0002015
$’0002016
$’0002015
$’0002016
$’0002015
$’0002016
$’0002015
$’0002016
$’0002015
$’000
Financial assistance received in cash during the reporting period (total cash received from the Australian Government for the programs)
1,143 1,334 266 254 508 288 719 479 819 993
Net accrual adjustments (72) 61 (38) (24) (264) (158) (26) (54) (124) (457)
Revenue for the period 2.1 1,071 1,395 228 230 244 130 693 425 695 536
Surplus/(deficit) from the previous year - - - - - - - - - -
Adj Surplus/(deficit) from the previous year - - - - - - - - - -
Funds available for reporting period 1,071 1,395 228 230 244 130 693 425 695 536
Less expenses including accrued expenses (1,071) (1,395) (228) (230) (244) (130) (693) (425) (695) (536)
Surplus/(deficit) for reporting period - - - - - - - - - -
24.6 OS-HELP
Notes2016
$'0002015
$'000
Financial assistance received in cash during the reporting period (total cash received from the Australian Government for the programs) 1,916 1,194
Cash spent during the reporting period (2,269) (2,152)
Net cash received 2.1 (353) (958)
Cash surplus / (deficit) from the previous period (299) 659
Cash surplus / (deficit) for reporting period 7 & 15 (652) (299)
24.7 SUPERANNUATION SUPPLEMENTATION
Notes2016
$'0002015
$'000
Financial assistance received in cash during the reporting period (total cash received from the Australian Government for the programs) 2.1 1436 1,400
Cash spent during the reporting period 1,404 (1,433)
Net cash received 32 (33)
Cash surplus / (deficit) from the previous period (209) (176)
Cash surplus / (deficit) for reporting period (177) (209)
24.8 STUDENT SERVICES AND AMENITIES FEE
Notes2016
$'0002015
$'000
Unspent/(overspent) revenue from previous period 2.1 - -
SA HELP revenue earned 4,733 4,162
Student service fees direct from students 2,764 3,369
Total revenue expendable in period 7,497 7,531
Student services expenses during the period (7,497) (7,531)
Unspent/(overspent) student services revenue -

38
DIRECTORS' DECLARATION
Ballarat Campus
39
DIRECTORS’ DECLARATION1. In the opinion of the directors of Australian
Catholic University Limited:
(a) the financial statements and notes, as set out on pages 9 to 57, are in accordance with the Corporations Act 2001, including:
(i) giving a true and fair view of the financial position of the University as at 31 December 2016 and of its performance, as represented by the results of its operations and its cashflows, for the financial year ended on that date; and
(ii) complying with Australian Accounting Standards and the Corporation Regulations 2001; and
(b) there are reasonable grounds to believe that the University will be able to pay its debts as and when they become due and payable; and
(c) the amount of Commonwealth grants expended during the reporting period was for the purposes for which it was granted.
In addition, we are not aware at the date of signing these statements of any circumstances, which would render any particulars included in the statements to be misleading or inaccurate.
Dated at Sydney this 10th day of April 2017.
Signed in accordance with a resolution of the directors:
Professor Greg Craven AO GCSG Director
Mr Julien O’Connell AM Director
40
INDEPENDENT AUDIT REPORT TO THE MEMBERS OF AUSTRALIAN CATHOLIC UNIVERSITY LIMITED
Canberra Campus

41
INDEPENDENT AUDITOR’S REPORT TO THE MEMBERS OF AUSTRALIAN CATHOLIC UNIVERSITY
REPORT ON THE AUDIT OF THE FINANCIAL REPORTWe have audited the Financial Report of Australian Catholic University Limited (the Company).
OPINIONWe have audited the Financial Report of Australian Catholic University Limited (the Company).
In our opinion, the accompanying Financial Report of the Company is in accordance with the Corporations Act 2001, including:
• giving a true and fair view of the Company’s financial position as at 31 December 2016 and of its financial performance for the year ended on that date; and
• complying with Australian Accounting Standards and the Corporations Regulations 2001.
The Financial Report comprises:
• Balance Sheet as at 31 December 2016;
• Income Statement, Statement of Comprehensive Income, Statement of Changes in Equity and Statement of Cash Flows for the year then ended;
• Notes including a summary of significant accounting policies; and
• Directors’ Declaration.
BASIS FOR OPINIONWe conducted our audit in accordance with Australian Auditing Standards. We believe that the audit evidence we have obtained is sufficient and appropriate to provide a basis for our opinion.
Our responsibilities under those standards are further described in the Auditor’s responsibilities for the audit of the Financial Report section of our report.
We are independent of the Company in accordance with the Corporations Act 2001 and the ethical requirements of the Accounting Professional and Ethical Standards Board’s APES 110 Code of Ethics for Professional Accountants (the Code) that are relevant to our audit of the Financial Report in Australia. We have fulfilled our other ethical responsibilities in accordance with the Code.
RESPONSIBILITIES OF THE DIRECTORS FOR THE FINANCIAL REPORTThe Directors are responsible for:
• preparing the Financial Report that gives a true and fair view in accordance with Australian Accounting Standards and the Corporations Act 2001
• implementing necessary internal control to enable the preparation of a Financial Report that gives a true and fair view and is free from material misstatement, whether due to fraud or error
• assessing the Company’s ability to continue as a going concern. This includes disclosing, as applicable, matters related to going concern and using the going concern basis of accounting unless they either intend to liquidate the Company or to cease operations, or have no realistic alternative but to do so.
AUDITOR’S RESPONSIBILITIES FOR THE AUDIT OF THE FINANCIAL REPORTOur objective is:
• to obtain reasonable assurance about whether the Financial Report as a whole is free from material misstatement, whether due to fraud or error; and
• to issue an Auditor’s Report that includes our opinion.
Reasonable assurance is a high level of assurance, but is not a guarantee that an audit conducted in accordance with Australian Auditing Standards will always detect a material misstatement when it exists.
Misstatements can arise from fraud or error. They are considered material if, individually or in the aggregate, they could reasonably be expected to influence the economic decisions of users taken on the basis of this Financial Report.
A further description of our responsibilities for the Audit of the Financial Report is located at the Auditing and Assurance Standards Board website at: http://www.auasb.gov.au/auditors_files/ar3.pdf. This description forms part of our Auditor’s Report.
KPMG
Kevin Leighton Partner Sydney 10 April 2017