2016 A R - Pirelli · SIGNIFICANT EVENTS 2016 pag. 18 GROUP PERFORMANCE AND RESULTS pag. 23...
349
2016 ANNUAL REPORT 1 — 2016 ANNUAL REPORT
Transcript of 2016 A R - Pirelli · SIGNIFICANT EVENTS 2016 pag. 18 GROUP PERFORMANCE AND RESULTS pag. 23...
2016 ANNUAL REPORT
1
— 2016 ANNUAL REPORT

2016 ANNUAL REPORT
2
PIRELLI & C. Società per Azioni (Joint Stock Company) Milan Office, Viale Piero e Alberto Pirelli n. 25 Share Capital Euro 1,345,380,534.66 Register of Companies of Milan No. 00860340157 REA (Economic Administrative Index) No. 1055
2016 ANNUAL REPORT
3
— Index 01. Letters to shareholders (pag. 4)
LETTER FROM CHAIRMAN pag. 5 LETTER FROM CEO pag. 6
02. Presentation of 2016 Pirelli integrated report (pag. 7)
03. Directors’ report on operations (pag. 10) MACROECONOMIC AND MARKET SCENARIO pag. 12 SIGNIFICANT EVENTS 2016 pag. 18 GROUP PERFORMANCE AND RESULTS pag. 23 OPERATING PERFORMANCE
Consumer Business pag. 35 Industrial Business pag. 36
RESEARCH AND DEVELOPMENT ACTIVITIES pag. 38 PARENT COMPANY HIGHLIGHTS pag. 40 RISK FACTORS AND UNCERTAINTY pag. 43 SIGNIFICANT EVENTS SUBSEQUENT TO THE END OF THE YEAR pag. 53 ALTERNATIVE PERFORMANCE INDICATORS pag. 54 OTHER INFORMATION pag. 55
04. Report on value chain responsible
management (pag. 57) METHODOLOGICAL NOTE pag. 58 MANAGEMENT MODEL pag. 60 ECONOMIC DIMENSION pag. 71 ENVIRONMENTAL DIMENSION pag. 94 SOCIAL DIMENSION pag. 118
05. Consolidated financial statements (pag. 167)
FINANCIAL STATEMENTS FORMATS pag. 168 EXPLANATORY NOTES pag. 173 SCOPE OF CONSOLIDATION pag. 255
06. Parent financial statement (pag. 263)
FINANCIAL STATEMENTS FORMATS pag. 264 EXPLANATORY NOTES pag. 268 ANNEXES TO THE EXPLANATORY NOTES pag. 304 RESOLUTION pag. 309 REPORT OF THE BOARD OF STATUTORY AUDITORS OF PIRELLI & C. S.P.A. pag. 310 TO THE SHAREHOLDERS’ MEETING
07. Certifications (pag. 319)
INDEPENDENT AUDITOR’S REPORT ON THE CONSOLIDATE FINANCIAL STATEMENT pag. 320 INDEPENDENT AUDITOR’S REPORT ON THE PARENT FINANCIAL STATEMENT pag. 323 SUMMARY TABLES pag. 326 INDEPENDENT AUDITOR’S REPORT ON THE REPORT ON pag. 346 VALUE CHAIN RESPONSIBLE MANAGEMENT

2016 ANNUAL REPORT
4
01. Letters to Shareholders
2016 ANNUAL REPORT
5
Dear Stakeholders,
If 2015 was the year when the bases for the industrial project with ChemChina were laid, 2016 was the year in which we built its foundations. We have worked together to grow together and to ensure that our activities and the people who work in them have growth perspectives that are sustainable and long term.
From the start, one of our goals was to make Pirelli’s activities in the industrial sector bigger so as to make them competitive on a global scale. We have worked a great deal. Today that goal is becoming a reality with the creation, through the union of Pirelli Industrial with the other assets in the segment held by CNRC (China National Tyre & Rubber Co. Ltd), the tyre subsidiary of ChemChina, of one of the international leaders of the segment. A group, unique in the world, that will be totally focused on tyres for heavy, agricultural and off-the-road vehicles and which will be able to square off with the big players in the sector thanks to the synergies deriving from the complementary nature of the different assets being integrated at the levels of distribution, geographic presence and products.
Our strength, in fact, resides not only in our union but in our focus, which will have as its fulcrum Aeolus, a company listed on the Shangai stock exchange and controlled by CNRC. Through the new group we will be able to satisfy our clients with an ever more complete range of products, we will be able to offer specific services for each different type of consumer and we will continue to innovate and improve our offering, conducting Research and Development activities dedicated to the different segments.
For Pirelli this will mean concentrating on its ‘Consumer’ activities where today it is the leader in the Prestige segment and among the absolute top players in the Premium one thanks to the technological capabilities and innovation that have always distinguished the company. Even for the Consumer activities, then, ChemChina’s knowledge of and presence in the Asian market, beginning with the Chinese one, represent an opportunity to strengthen its position in an area of the world that today offers the most promising prospective growth. This is also thanks to the progressive evolution of consumer demand in the whole area towards more sophisticated products, in line with the offering that characterizes the Pirelli brand.
From the beginning I have declared my pride in participating in the future of a company that represents Italian excellence in the world thanks to the quality of its people, its capacity to innovate, its attention towards employees, its care for clients and its team work. Today, after one year, I can say that we have strengthened the team in preparation for the achievement of our next goal: the return to the stock exchange, which we temporarily left in order to work on our industrial project.
Today I can already see all the premises to reintroduce ourselves, in a different form and stronger, to the shareholders who will accompany us into the future. To all of you, our Stakeholders, thank you once again.
Ren Jianxin Chairman

2016 ANNUAL REPORT
6
Dear Stakeholders,
The year 2016 was an important one for the transformation of Pirelli. In line with the industrial project at the basis of the partnership with ChemChina, we worked to launch our Consumer and Industrial activities onto separate paths, to ensure both the best outlook for growth. (Pirelli) Industrial has started on its path of aggregation with Aeolus, and with the other assets of the same segment held by CNRC, to give birth to a global operator in the sector, the only one on a worldwide basis entirely focused on tyres for heavy vehicles, for agriculture and off-the-road. The technological and managerial competence of Pirelli’s world will be added to the geographical penetration of our Chinese partners into as important a market as Asia. These are the factors that will make the new group a true protagonist in the sector, able to compete with the other major players at the international level.
The Consumer activities, on the other hand, represent the centre around which we are building our return to the stock exchange in 2018, in their new incarnation as the sole ‘pure Consumer tyre company’ at the global level, with a business profile always more oriented towards Prestige and Premium clients and new mobility, and equipped with totally digitized industrial, commercial and managerial processes.
Our aim is to reinforce the leadership attained in these years in the Prestige and Premium segments, which today represent almost 65% of the revenues of our Consumer business and, thanks to their high margins, have resulted in a new profitability record (16.8% adjusted ebit margin compared with 16.2% in 2015 on a like-for-like basis).
We are adopting a business model that is ever more focused on the end consumer. Our products will therefore be flanked by an offering of services that are always more sophisticated and linked to sustainable mobility, like the bicycle, the hybrid or electric. In a rapidly evolving world, our sustainable growth and our global competitiveness will continue to be based of the responsibility and professionalism of our people, and on innovation which respects the environment and the creation of shared values. Technology remains the basis of our change. After years of work on the ‘Cyber Tyre’, the intelligent tyre, we are ready to launch Pirelli Connesso on the market, the first digital platform where the tyre, equipped with a sensor, interacts with the driver supplying information on the functioning, wear and maintenance of the tyres, as well as personalized and localized services for the person driving. A tyre which is the fruit of our Research and Development, where this year we invested 6% of our Premium revenues, and which transforms it from a commodity to one of the protagonists, together with electronics, of the acceleration that the automotive world is experiencing. A world which sees always beside our dealers, always more integrated into our Consumer experience, and of the major Premium and Prestige car makers, to develop together products that are always more evolved, more sustainable, better performing and personalized. This is the direction of our Specialty and Superspecialty products, as too for our coloured tyres: destined to the Premium and Prestige segments, the will have colours that last and are resistant to wear thanks to the use of special compounds and derivatives from our work in Formula Uno, for which we are the exclusive supplier also for the next three years. It is precisely Formula 1 which represents the most exciting challenge of our 110 years of activity in Motorsport, as well as one of the many factors which contributed, also this year, to the further strengthening of our brand.
With the same passion that saw us win the challenges of 2016 we will meet those that await us in the coming years. We have great opportunities ahead of us. To all of you, our Stakeholders, thank you once again.
Marco Tronchetti Provera Vicepresidente Esecutivo e Ceo
2016 ANNUAL REPORT
7
02. Presentation of 2016 Integrated Report
2016 ANNUAL REPORT
8
Presentation of 2016 integrated report The Pirelli 2016 integrated report (Annual Report 2016) aims to provide a comprehensive overview of the process of creating value for the Company's Stakeholders, as resulting from the integrated management of the financial, productive, intellectual, human, natural, social and relational capitals. Reporting reflects the business model adopted by Pirelli, which is inspired by the United Nations’ Global Compact, the principles of Stakeholder Engagement set forth by the AA1000, and the Guidelines of ISO 26000.
The financial capital, which comprises the company’s financial resources, drives the sustainable management of the other capitals and is in turn influenced by the value created by the latter. In 2016, business operations generated an adjusted EBIT (before non-recurring and restructuring expenses and before amortization of intangible assets related to assets recorded as a result of the Business Combination) equal to 896.6 million euro (14.8% the EBIT Margin), up 4.2% from the previous year on a like-for-like basis.
In turn, the Company's productive capital, which includes 19 tyre factories in four continents, is managed in a perspective of reducing environmental impacts, with targets by 2020 in terms of an increase in waste recovery and a reduction of the specific indices of energy consumption, emissions and water withdrawal. In this regard, the company's efforts in 2016 led to a decrease in water withdrawal and specific CO2 emissions, also thanks to the continuation of investments in renewable energy, with a substantial stability of specific energy consumption and a waste recovery equivalent to 92%. All this has helped to achieve efficiencies on costs amounting to 90.5 million euro in total.
The research and development activities, which have always been at the heart of Pirelli's strategy, contribute substantially to the improvement of environmental efficiency along the entire product life-cycle, from the innovative raw materials to the process, distribution, use and up to the end of life of tyres. In 2016, Pirelli invested 228.1 million euro in research and development, i.e. 5.9% of premium revenues and 3.8% of total revenues. In turn, Pirelli’s Green Performance products, which combine performance and respect for the environment, at the end of 2016 represent 63%1 of total tyre turnover (56% in 2015 and 54% in 2014). The strong investment in innovation also supplies Pirelli’s intellectual capital, which comprise a total portfolio of approximately 5,000 patents concerning innovations of product, process and materials, as well as a brand recognised worldwide.
The evolution of the cited capitals is closely related to human capital, at the heart of the Company’s growth. Merit, rules, ethics and sharing of strong values and clear policies, attention to welfare and diversity are accompanied by advanced instruments to attract and retain the best talent. The investment in the “culture of health and safety at work” and in training is fundamental, with an accident frequency index that in 2016 decreased by 15% compared to 2015 and an investment in training that reached 9.8 average days per employee, a further increase compared to 8.6 of the previous year, thus surpassing for the fourth consecutive year the target of 7 average-per-capita days as envisaged by the Industrial Plan only as from 2015.
–– 1 Figure obtained by weighing the value of sales of Green Performance tyres on the total value of sales of Group tyres. Green Performance products identify the tyres that Pirelli produces throughout the world and that fall under rolling resistance and wet grip classes A, B, C according to the labelling parameters set by European legislation. In 2016, new data were acquired that required a restatement on previous years.
2016 ANNUAL REPORT
9
Pirelli’s social and relational capitals are based on the continuous and transparent dialogue that the Company maintains with its Stakeholders. In February 2016, Pirelli held a Global Stakeholder Dialogue in Brussels, attended by international Stakeholders of the company including suppliers, customers, leaders of the economic and financial, academic, institutional and non-governmental world. The objectives of the Dialogue included updating Stakeholders regarding the progress against the 2020 Sustainability Targets, the discussion and collection of expectations on the evolution of Pirelli's materiality matrix, as well as a focus of future mobility, environmental impacts along the product life cycle and sustainable management of the supply chain. Similarly, in 2016, Local Stakeholder Dialogues were held in Mexico, Turkey, Germany and Romania. In methodological terms, the drafting of the Annual Report 2016 took into consideration the Integrated Reporting principles contained in the framework of the International Integrated Reporting Council (IIRC), the Financial Statements and Consolidated Financial Statements were drawn up according to IFRS international accounting standards, and socio-environmental performances meet the Sustainability Reporting Guidelines of the Global Reporting Initiative (version GRI-G4 - Comprehensive option).

2016 ANNUAL REPORT
10
03. Directors’ Report on Operations at December 31, 2016

2016 ANNUAL REPORT
11
Board of Directors 1
Chairman Ren Jianxin Executive Vice Chairman and CEO Marco Tronchetti Provera Directors Yang Xingqiang Carlo Acutis Bai Xinping Gustavo Bracco Giorgio Luca Bruno Ze'ev Goldberg Andrey Kostin Jiao Chonggao Emerson Milenski Luca Rovati Igor Sechin Yang Xun Wang Dan Zhang Haitao Secretary of the Board Alberto Bastanzio
Board of Auditors 2
Chairman Francesco Fallacara Statutory Auditors Fabrizio Acerbis Fabio Artoni Giovanni Bandera David Reali Alternate Auditors Fabio Facchini Giovanna Oddo Independent Auditing Firm Ernst & Young S.p.A. General Managers Maurizio Boiocchi (TECHNOLOGY) Luigi Staccoli (DIGITAL) –– 1. Appointment: March 15, 2016. Expiry: Shareholders’ Meeting convened for the approval of the Financial Statements at December 31, 2018. 2. Appointment: March 14, 2016. Expiry: Shareholders’ Meeting convened for the approval of the Financial Statements at December 31, 2017,
(David Reali, Giovanni Bandera and Fabrizio Acerbis appointed by the Shareholders’ Meeting on March 15, 2016).

2016 ANNUAL REPORT
12
Macroeconomic and Market Scenario
MACROECONOMIC MARKET SCENARIO The performance of the economy in 2016 was characterised by a slowdown in global trade, in investments and by high political uncertainty. Despite the gradual strengthening in economic activity during the second half of 2016, the overall growth in GDP stood at +2.5%, the worst since the financial crisis of 2009. This slowdown affected both advanced and emerging countries. Global GDP growth, (annual change in %)
__________________________________________________________________________________________________
Source: IHS Markit, January 2017.
Growth in advanced-countries stood at +1.7% for 2016, representing a slow down compared to the +2.1% recorded for 2015. In Europe, consumer and business confidence was not particularly impacted by the result of the referendum in the United Kingdom regarding the exit from the European Union, and recovery continued at a moderate pace with GDP growth at approximately +1.8% for 2016 (+2.3% for 2015).
Inflation for the Eurozone stood at +0.2% for 2016, and rose to +1.1% in the month of December, thanks to a recovery, albeit partial, in energy prices. The ECB continued with its programme of quantitative easing which has been extended until December 2017 or beyond, unless a durable adjustment for price changes is found.
In the U.S.A. GDP growth slowed to +1.6% for 2016 (following the +2.6% recorded for 2015). Despite a steady improvement in labour market conditions, consumption growth eased and non-residential investment fell, due for the most part to the very strong slow down in the energy sector. The political uncertainties of the election campaign caused a slow down in business investments in anticipation of the emergence of a clearer picture with regard to what the future developments might be. Also to be noted is that following the start of a cycle of interest rates hikes which stood at 25 basis points at the end of 2015, the state of the economy caused the Federal Government to delay the rise in interest rates, until December 2016, until after the elections.

2016 ANNUAL REPORT
13
In the Latam region the recession in Brazil for 2016 was aggravated by the decline in the price of raw materials, the adjustment of administered prices and political uncertainty. The contraction in GDP is estimated to have been around -3.5% for 2016, after the -3.8% recorded for 2015, a weakness that was inevitably reflected in other Latin America countries and contributed to the overall decline in the GDP of the area. In Argentina, following the change of Government at the end of 2015 and the introduction of a series of structural reforms, including the devaluation of the Argentine Peso, the economy signalled a marked a contraction of -2.3% for 2016 (after a growth of +2.6% for 2015 – IHS estimates).
In China, growth remained stable in 2016 which was consistent with the objectives set by the Government, that is a GDP growth of +6.7%, but which was slightly lower than the +6.9% growth of 2015. The economy was supported by a moderate strengthening in domestic demand in the second half of the year, also as a result of China's fiscal and monetary stimulus policies.
In Russia, the contraction of the economy continued for the first three quarters of 2016, but recouped ground during the fourth quarter thanks to the increase in the price of oil and the strengthening of the exchange rate.
Exchange Rates
The currency markets in 2016 were characterised by the revaluation of the US Dollar, which was also affected by the expectation of a cycle of US interest rate hikes as well as expectations of a fiscal stimulus under the new administration. The appreciation of the US Dollar against the Euro was more accentuated during the second part of 2016 together with; the rise in the U.S. benchmark rate in December, the extension of the programme for the purchase of sovereign bonds by the ECB until December 2017, and the uncertainties related to negotiations that will define the new relationships between the European Union and United Kingdom. The Euro/US Dollar exchange rate recorded an average of 1.11 US Dollars per Euro in 2016, as for the previous year, but closed 2016 at 1.05.
The Japanese Yen instead strengthened against the US Dollar during the first half of the year due to the change of expectations for the future interest rates of the respective central banks. This trend was reversed in the last months of the 2016 financial year which closed with an exchange rate of 117 Yen per US Dollar, which was weaker than the annual average of 109 Yen.
The Pound Sterling went into a steep decline following the unexpected outcome of the referendum in June. The average exchange rate stood at 0.819 against the Euro for 2016 which represented a decrease of -11% compared to the previous year.
Even the currencies of major emerging countries fell against the US Dollar in 2016. The Brazilian Real recorded an average of 3.48 Real per US Dollar for 2016, lower by -4% compared to the previous year. The average exchange rate for the Chinese Yuan Renminbi for 2016 was 6.64 versus the US Dollar, which was lower by -5% compared to the previous year.
In Egypt, on November 3, 2016 the central bank decided to eliminate the "peg" with the American dollar. The exchange rate for the Egyptian Pound went from an average of 8.88 for the third quarter of 2016 to 18.38 Egyptian Pounds per US Dollar on December 31, 2016, representing a devaluation of 52%.

2016 ANNUAL REPORT
14
Exchange rate: US Dollar vs Euro Exchange rate: Brazilian Real vs USD
Source: European Central Bank monthly figures up until December 31, 2016.
Automotive markets
The global car market registered a growth in registrations of approximately +4.6% for 2016, supported in particular by the demand in China, Western Europe and in the USA which more than offset the weakness of the Brazilian, Japanese, South Korean and Russian markets. According to IHS Markit the Premium segment confirmed a growth rate above that of the market total, to the point of representing 11% of cars sold. This trend, which resulted in the continued improvement of the vehicle fleet in circulation, was sustained particularly by the European market where the market share of high end vehicles is traditionally high, and by emerging countries such as China where growth of the Premium segment is among the highest in the world.
The European Union car market recorded a +7% growth of registrations compared to 2015 (ACEA - European Automobile Manufacturers' Association - data). Of the five most significant markets, Italy recorded a double-digit growth (+13%), followed by Spain (+9%), France (+6%), and Germany (+4%). According to ACEA data, the United Kingdom market slowed during 2016 and ended the financial year down by -1%.
In Latin America the sector's performance was strongly affected by the economic slowdown in Brazil, the region's major market, where registrations dropped by -20%. A positive trend was recorded instead for registrations in Argentina after two consecutive years of contraction. In China, the pace of sales accelerated also due to the reduction in taxes. In Japan, following a decline of -10% in registrations recorded for 2015 due to an increase in consumption tax, the market recorded a further decrease of -2%, penalised by earthquakes in April and irregularities in auto emissions testing.
Truck and bus market
The global demand for commercial vehicles showed signs of recovery by registering a +3% growth (-6% for 2015) (IHS Markit estimates). The recovery in sales in Europe (+11% for the >3.5 tons segment) and China (+25%), mitigated the decline in the USA (-10.5% for the >6.35 tons segment), Russia (-40%) and Brazil (-18%).
2016 ANNUAL REPORT
15
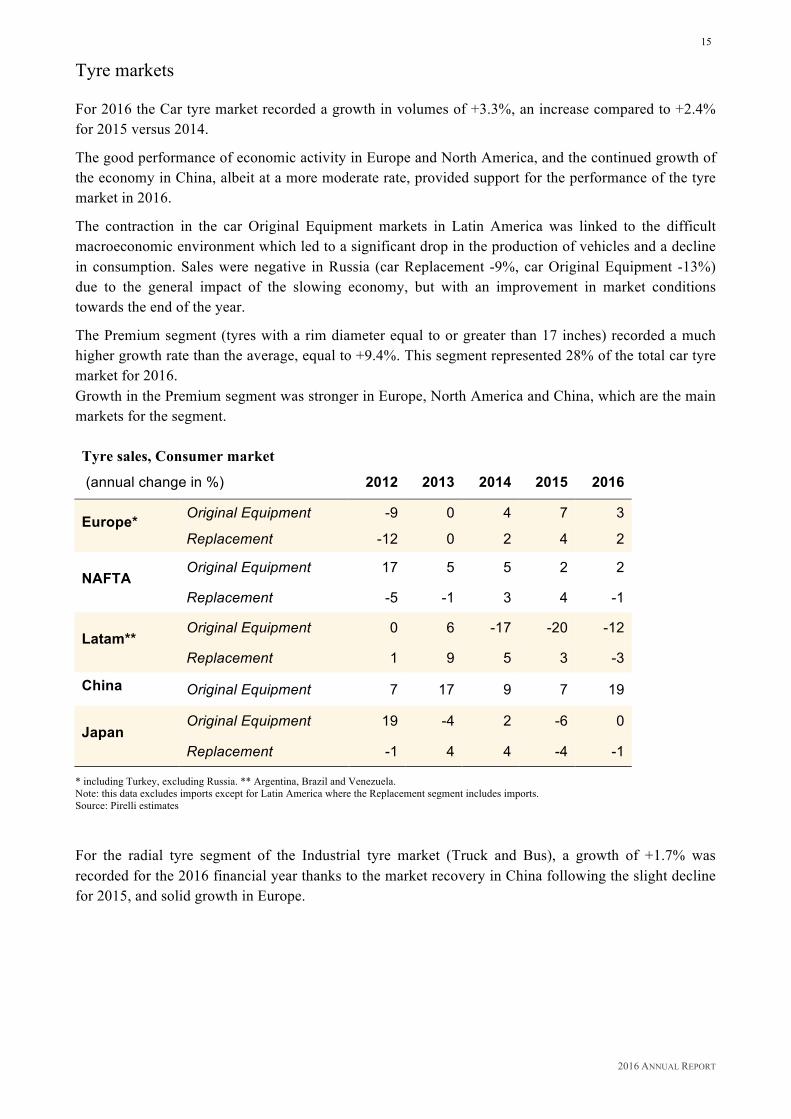
Tyre markets
For 2016 the Car tyre market recorded a growth in volumes of +3.3%, an increase compared to +2.4% for 2015 versus 2014.
The good performance of economic activity in Europe and North America, and the continued growth of the economy in China, albeit at a more moderate rate, provided support for the performance of the tyre market in 2016.
The contraction in the car Original Equipment markets in Latin America was linked to the difficult macroeconomic environment which led to a significant drop in the production of vehicles and a decline in consumption. Sales were negative in Russia (car Replacement -9%, car Original Equipment -13%) due to the general impact of the slowing economy, but with an improvement in market conditions towards the end of the year.
The Premium segment (tyres with a rim diameter equal to or greater than 17 inches) recorded a much higher growth rate than the average, equal to +9.4%. This segment represented 28% of the total car tyre market for 2016. Growth in the Premium segment was stronger in Europe, North America and China, which are the main markets for the segment. Tyre sales, Consumer market
(annual change in %) 2012 2013 2014 2015 2016
Europe* Original Equipment -9 0 4 7 3
Replacement -12 0 2 4 2
NAFTA Original Equipment 17 5 5 2 2
Replacement -5 -1 3 4 -1
Latam** Original Equipment 0 6 -17 -20 -12
Replacement 1 9 5 3 -3
China Original Equipment 7 17 9 7 19
Japan Original Equipment 19 -4 2 -6 0
Replacement -1 4 4 -4 -1
* including Turkey, excluding Russia. ** Argentina, Brazil and Venezuela. Note: this data excludes imports except for Latin America where the Replacement segment includes imports. Source: Pirelli estimates
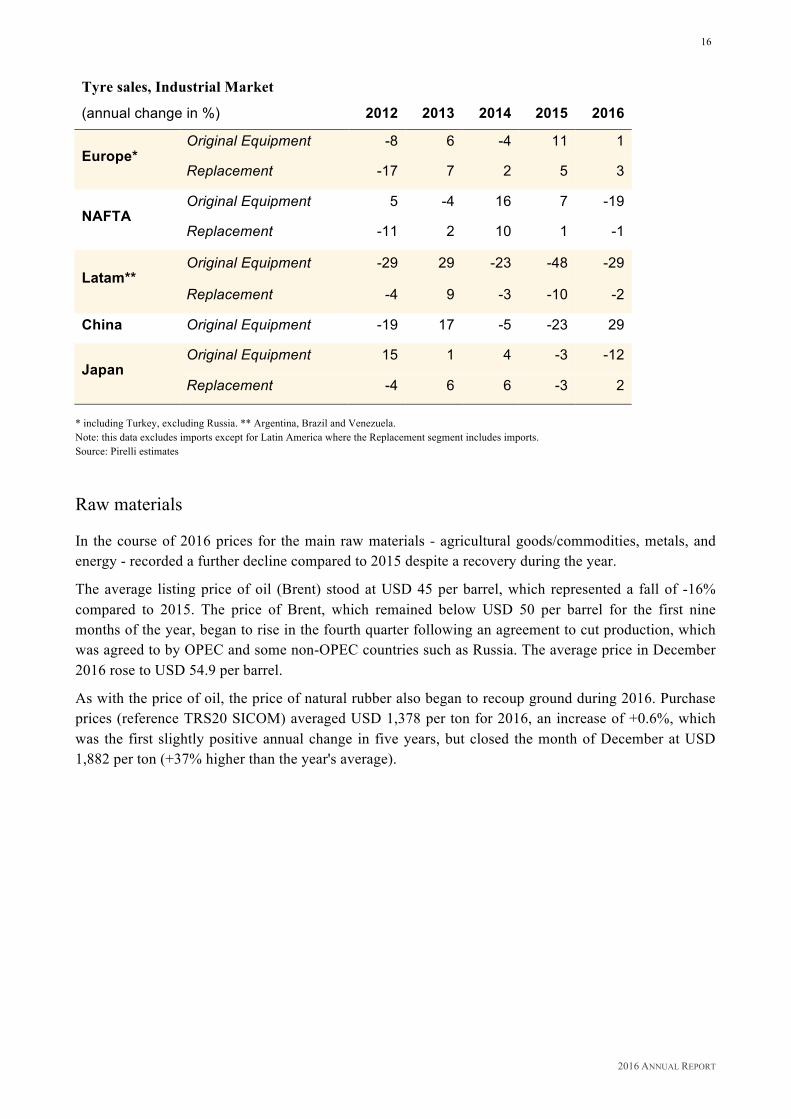
For the radial tyre segment of the Industrial tyre market (Truck and Bus), a growth of +1.7% was recorded for the 2016 financial year thanks to the market recovery in China following the slight decline for 2015, and solid growth in Europe.
2016 ANNUAL REPORT
16
Tyre sales, Industrial Market
(annual change in %) 2012 2013 2014 2015 2016
Europe* Original Equipment -8 6 -4 11 1
Replacement -17 7 2 5 3
NAFTA Original Equipment 5 -4 16 7 -19
Replacement -11 2 10 1 -1
Latam** Original Equipment -29 29 -23 -48 -29
Replacement -4 9 -3 -10 -2
China Original Equipment -19 17 -5 -23 29
Japan Original Equipment 15 1 4 -3 -12
Replacement -4 6 6 -3 2 * including Turkey, excluding Russia. ** Argentina, Brazil and Venezuela. Note: this data excludes imports except for Latin America where the Replacement segment includes imports. Source: Pirelli estimates
Raw materials
In the course of 2016 prices for the main raw materials - agricultural goods/commodities, metals, and energy - recorded a further decline compared to 2015 despite a recovery during the year.
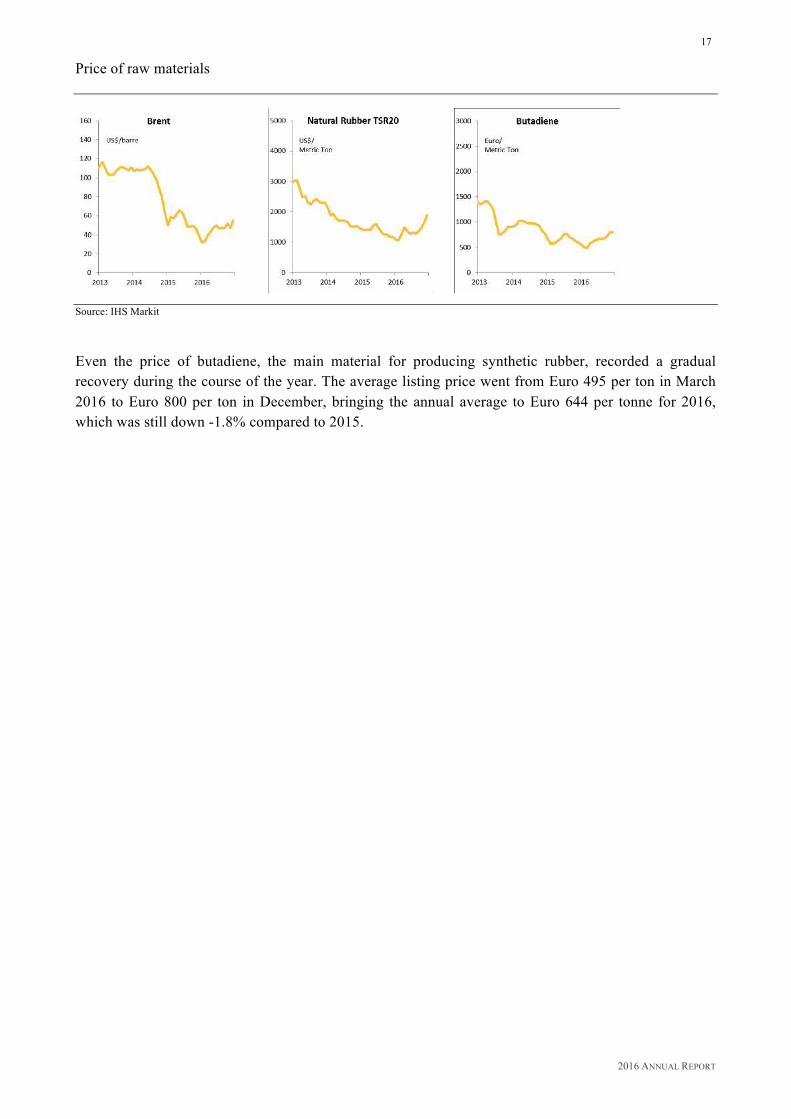
The average listing price of oil (Brent) stood at USD 45 per barrel, which represented a fall of -16% compared to 2015. The price of Brent, which remained below USD 50 per barrel for the first nine months of the year, began to rise in the fourth quarter following an agreement to cut production, which was agreed to by OPEC and some non-OPEC countries such as Russia. The average price in December 2016 rose to USD 54.9 per barrel.
As with the price of oil, the price of natural rubber also began to recoup ground during 2016. Purchase prices (reference TRS20 SICOM) averaged USD 1,378 per ton for 2016, an increase of +0.6%, which was the first slightly positive annual change in five years, but closed the month of December at USD 1,882 per ton (+37% higher than the year's average).
2016 ANNUAL REPORT
17
Price of raw materials
Source: IHS Markit
Even the price of butadiene, the main material for producing synthetic rubber, recorded a gradual recovery during the course of the year. The average listing price went from Euro 495 per ton in March 2016 to Euro 800 per ton in December, bringing the annual average to Euro 644 per tonne for 2016, which was still down -1.8% compared to 2015.
2016 ANNUAL REPORT
18
Significant Events of 2016 On February 9, 2016, Pirelli and the Lombardy Region signed a competitiveness agreement for a regional grant of euro 1.9 million for the R&D project "Total Safety System" to be conducted at the Bicocca, Milan research centre. The project, which has a duration of 24 months and a total cost of euro 5.35 million, is part of activities related to the development of a new generation of tyres based on the concept of "total safety". The project allows Pirelli to study new product mixes oriented towards higher value-added segments, and to achieve positive results in terms of the social and environmental aspects of safety on the roads, by reducing the fuel consumption of vehicles and increasing tyre mileage. On February 15, 2016, Ren Jianxin, Yang Xingqiang, Bai Xinping, Ze'ev Goldberg, Tao Haisu, Wang Dan and Zhang Junfang, who had been previously co-opted by the Board of Directors, were reappointed as Directors by the Ordinary Shareholders’ Meeting of Pirelli & C. S.p.A. On the same date, the Board of Directors approved Ren Jianxin as Chairman. The Extraordinary Shareholders’ Meeting also approved the proposal of the mandatory conversion of savings shares into newly issued special category unlisted shares without voting rights, as well as the proposal to adopt new Articles of Association. The mandatory conversion and the adoption of the new Articles of Association were also approved, within the scope of its capacity to do so, by the Special Savings Shareholders’ Meeting of Pirelli & C. S.p.A. The Extraordinary Shareholders’ Meeting of Pirelli & C. S.p.A. also approved the merger by incorporation of the holding company Marco Polo Industrial Holding S.p.A. into Pirelli & C. S.p.A. on the basis of 6.30 Pirelli shares to be assigned post-merger to Marco Polo International Holding Italy S.p.A. (Holdco) – the sole partner of Marco Polo Industrial Holding S.p.A. - for each 1 share held prior to the merger by Marco Polo International Holding Italy S.p.A. (Holdco) in Marco Polo Industrial Holding S.p.A. The merger deed was stipulated on May 6, 2016, and became effective as of June 1, 2016. On February 26, 2016 the mandatory conversion of savings shares into unlisted special shares took effect. The last day of trading on the Stock Exchange of the savings shares had been February 25, 2016. On March 15, 2016, the Ordinary Shareholders’ Meeting provided for the renewal of the entire Board of Directors and resolved to appoint for three financial years - and therefore until the Shareholders’ Meeting for the approval of the Financial Statements as at December 31, 2018, - the Board Directors being; Ren Jianxin, Yang Xingqiang, Bai Xinping, Ze'ev Goldberg, Wang Dan, Jiao Chonggao, Zhang Haitao and Yang Xun (representing the shareholder China National Tire & Rubber Corporation Ltd); Marco Tronchetti Provera, Giorgio Bruno, Luca Rovati, Carlo Acutis and Gustavo Bracco (representing the shareholder Camfin S.p.A.); Igor Sechin, Andrey Kostin and Emerson Milenski (representing the shareholder Long Term Investments.). Furthermore, in accordance with the new statutory provisions, the Shareholders' Meeting resolved to increase the number of Statutory Members of the Board of Auditors to five, by appointing Fabrizio Acerbis, Giovanni Bandera and David Reali as Statutory Auditors. The Board of Auditors is constituted by Francesco Fallacara (as Chairman), Fabrizio Acerbis, Fabio Artoni, Giovanni Bandera and David Reali (as Statutory Auditors), and Fabio Facchini and Giovanna Oddo (as Alternate Auditors) and shall expire with the approval of the Financial Statements as at December 31, 2017.
2016 ANNUAL REPORT
19
The new Board of Directors - which met after the Shareholders' Meeting - voted to approve, Ren Jianxin as Chairman, granting him the legal representation of the company as well as all other powers attributed to the Chairman under the current Articles of Association, without prejudice to the powers and prerogatives of the Board of Directors, and Marco Tronchetti Provera as Chief Executive Officer and Executive Vice Chairman, confirming the attribution to the Chairman of the powers for the operational management of Pirelli as already delegated in the previous mandate. On March 15, 2016, the Company announced that the right of withdrawal, consequent to the conversion of savings shares into special shares, had been validly exercised for 460,277 savings shares (special shares after the mandatory conversion), for a total equivalent liquidated value of euro 6,894,028.91. The aforementioned shares subject to withdrawal were offered with the right of option and the right of pre-emption to all shareholders of Pirelli & C. S.p.A. for the period March 15 - April 15, 2016. On April 5, 2016 at the Estoril circuit in Portugal, Pirelli presented the new P ZERO™ the exclusive Ultra-High Performance tyre which combines the experience Pirelli has acquired in the field of Motorsports and the collaboration of the best car manufacturing houses. The new tyre features an improved high performance grip, a reduction in noise emissions, lower rolling resistance and an improvement in the aquaplaning function. The P ZERO™ confirms Pirelli as the world leader for the prestige car sector, and contributed to the accelerated growth for the company, in the Premium car sector.
On April 20, 2016 Pirelli announced an investment to span the following three year period of USD 200 million in Mexico, for the construction of a new factory in Silao as an addition to the current existing car tyre plant in Silao. This new investment of USD 200 million was launched during the course of 2016 and adds to the approximate USD 360 million invested to date, and to the USD 50 million already earmarked for 2016 and 2017 collectively. By the end of 2018, Pirelli's total investment for the two plants in Silao will therefore amount to more than USD 600 million.
On April 21, 2016, following the outcome of the rights offer to shareholders of a total of 460,277 special shares in relation to which the right of withdrawal was validly exercised, the shareholder Marco Polo Industrial Holding S.p.A. – who exercised the option and pre-emption rights to which they were entitled – purchased all the shares which were subject to the right of withdrawal. On April 27, 2016, the Shareholders' Meeting approved the Financial Statements as at December 31, 2015, and the proposed allocation of the profits formulated by the Board of Directors. The Shareholders' Meeting also authorised the Company to purchase treasury shares for the redemption of special shares. On April 29, 2016, in exercising the right of redemption as provided for by the Articles of Association, the Company purchased from the shareholders who held special shares (other than Marco Polo Industrial Holding S.p.A. and Company shareholders), all the remaining outstanding special shares. Following the aforesaid operation, Marco Polo Industrial Holding S.p.A. – taking into account the treasury shares held by Pirelli & C. S.p.A. – as a result held 100% of the ordinary and special capital of the Pirelli Group.

2016 ANNUAL REPORT
20
On May 16, 2016 the shareholders of RCS MediaGroup S.p.A, Pirelli & C. S.p.A (4.43%), Diego Della Valle (7.32%), Mediobanca S.p.A. (6.25%) and UnipolSai Assicurazioni S.p.A. (4.59%) – stakeholders of a total of 22.6% of the capital of the publishing house - reached an agreement with International Acquisitions Holding S.à r.l (a Luxembourg company indirectly controlled by the Investindustrial VI L.P. fund, which is managed by the English company Investindustrial Advisors Limited), for the joint launch of a voluntary Public Offer for the purchase of 77.4% of the share capital of the RCS MediaGroup S.p.A. which they did not hold. The launch of the Public Offer – aimed at supporting and accelerating the restructuring process initiated by management as well as, starting from the existing business platform, at creating an international scale, multimedia publishing group – came about on June 20, 2016 through the vehicle International Media Holding S.p.A. (IMH is currently 25% owned by Pirelli & C. S.p.A.) at a unit price of euro 0.7 per share (which was increased to euro 0.8 per share on June 24, and to euro 1.00 per share on July 8, 2016). At the expiry of the subscription period on July 18, 2016 IMH announced that during the subscription period (from June 20, 2016 to July 15, 2016), as a result of the Public Offer launched by IMH, the RCS shares tendered equalled 12.9% of the RCS share capital. Taking into account (i) the RCS shares tendered as part of the IMH Public Offer, (ii) of the total shares already held by IMH shareholders, as well as (iii) the 2.17% of the share capital of RCS acquired from IMH on July 13, 2016, IMH announced on July 18, 2016, that the Terms and Conditions of the Minimum Quantity (as defined by the Public Offer prospectus) had not been fulfilled, and that they would not be exercising the right to waive this condition, and so as a consequence the Public Offer launched by IMH was to be considered as being without legal effect. The RCS shares tendered to the IMH Public Offer were therefore returned as entitled to their respective owners. On June 17, 2016 Pirelli and FIA renewed the contract for the supply of tyres for the FIA Formula 1 World Championship for another three years, from 2017 to 2019. Pirelli has been the exclusive supplier of Formula 1 tyres since 2011. The agreement was ratified at the end of the winter season during which Pirelli and FIA, in collaboration with their teams, reached a major agreement resulting in changes to the technical regulations. In 2017 in fact, new technical regulations will enter into force which will include significant modifications to the chassis and increases in tyre width. On July 15, 2016 the Ordinary Shareholders' Meeting of Aeolus Tyre Co., Ltd. approved (i) the sale to Aeolus by Pirelli Tyre S.p.A. of 10% of Pirelli Industrial S.r.l. (ii), the sale to Pirelli Tyre S.p.A. of 80% of the Aeolus car business, (iii) the integration into Aeolus, of two assets owned by the CNRC (China National Tire and Rubber) and (iv) a licensing agreement between Pirelli Tyre and Aeolus for the Industrial segment technology. As of October 1, 2016 following the attainment of all the necessary authorisations, Pirelli Tyre S.p.A. acquired control of the Aeolus car business, and sold 10% of Pirelli Industrial S.r.l. to Aeolus. On July 28, 2016, the refinancing plan was successfully completed, the main details of which had been approved by the Pirelli & C. S.p.A. Board of Directors on February 16, 2016, aimed at extending debt maturities and optimising the debt structure. The refinanced total amounted to euro 6.4 billion and was achieved at a lower overall cost of less than 3.5%.

2016 ANNUAL REPORT
21
The operation consisted of secured syndicated refinancing for a total amount of euro 4.8 billion maturing in three and five years, where the requested amount was for slightly less than twice the amount offered, as well as a secured line of credit for euro 1.6 billion with an 18 month maturity, which was the result of a club deal with a select number of lending institutions. Due to the aforesaid operation, Pirelli reimbursed the Bidco Facility and cancelled the Mergeco Facility loan made available to the company by a syndicate of banks as part of the Public Offer made to Pirelli by Marco Polo Industrial Holding S.p.A.
On September 30, 2016 Pirelli announced an investment plan of approximately euro 200 million for the 2016-2021 period, for the manufacturing centre in Slatina, Romania, a testament to the facility's strategic importance in context of the business activities of the Group. This new investment plan will allow for the creation of new jobs and the achievement of an annual production capacity of 15 million units, compared to the current 10 million. Additional planned investments as of September 2016 until the end of 2021 will ensure further improvement of Pirelli's industrial competitiveness at European level. This expansion and upgrading project also involves the Slatina production area dedicated to Motorsports which includes a Formula One manufacturing unit that acts as a back-up for Pirelli's main plant based in Turkey.
On October 13, 2016 Pirelli and the Bicocca University of Milan signed a renewal for another six years of the CORIMAV Consortium for research on advanced materials, created in 2001 by Pirelli and the University, with the aim of, developing cutting-edge technologies in the field of new materials, sustaining research activity and experimentation for the purpose of patenting, and to foster training initiatives and the professional development of young researchers. Since its inception, the CORIMAV Consortium has enabled the filing of 15 patents, and the funding of 44 scholarships and 36 doctoral fellowships in ecological and innovative materials.
On October 19, 2016, the Board of Directors of Pirelli & C. S.p.A. took favourable note of the progress being made on the integration between Pirelli Industrial and Aeolus, and examined the guidelines of the Pirelli Business Plan for the Industrial segment. The Board also approved the 2016-2018 business plan, with a view to 2020, for the Pirelli Consumer business, who is the sole global player entirely focused on the Consumer business segment and who foresees: strengthened leadership in the more lucrative Prestige and Premium segments; a business model which is increasingly more focused on the end consumer (the Consumer Centric Approach); the overseeing of the new business opportunities offered by new and sustainable mobility (Cyber Tyre and Vélo); more efficient and fully digitised industrial, commercial and managerial processes based on predictive models made possible through the use of big data analytics. In support of this position, the Board of Directors adopted an organisational model which provides for, the establishment of the new Pirelli Digital General Management, entrusted to Luigi Staccoli, to oversee all activities directed towards digitisation of the company; the aggregation of all technical structures and sales to Original Equipment under the responsibility of the General Manager Technology, Maurizio Boiocchi; the attribution of the management of all commercial structures and the Motorcycle Business Unit to the Chief Commercial Officer Consumer, Roberto Righi, in support of the Consumer Centric Approach; the appointment of Paolo Dal Pino as Chief Executive Officer of Pirelli Industrial, and the supersession of the General Manager of Operations department, as of January 1, 2017. Based on these presuppositions, the Board of Directors expressed the desire to accelerate the public listing of the company by immediately initiating all necessary actions.

2016 ANNUAL REPORT
22
The objective of proceeding, depending on how opportune the market conditions are, with the launch of the IPO during the first half year of 2018, on the Milan Stock Exchange, or in any case, on one of the major international level stock markets. Among the elements which support the success of the listing, the Board of Directors singled out the alignment of governance with international best practices, through a Board of Directors and Board Committees composed of an adequate number of independent Directors; that is corporate structure which, although starting from a concentrated shareholder structure did emerge following the Public Offer, and which will give rise to an evolution which will ensure an adequate public float able to meet the expectations of international investors: an incentive system to ensure an alignment of the interests of management with those of all shareholders.
On November 25, 2016 Pirelli announced that it had reached an agreement with Infront Sports and Media for the sponsoring of the next three editions of the International Ski Federation (FIS) World Alpine Ski Championships and the International Ice Hockey Federation (IIHF) World Championships. On December 28, 2016 Pirelli reached an agreement for the disposal of a 38% stake in Pirelli Industrial S.r.l. to a vehicle controlled by the Chinese Cinda fund for an amount totalling approximately euro 266 million. The sale of the aforesaid investment stake in Pirelli Industrial S.r.l., which is part of a wider project for the reorganisation and integration of the Industrial business, was finalised on January 13, 2017.

2016 ANNUAL REPORT
23
Group Performance and Results In this document, in addition to the financial figures as provided for by the International Financial Reporting Standards (IFRS), alternative performance indicators derived from IFRS were used in order to allow for a better assessment of the progress of the Group’s operations. These indicators are: Gross Operating Margin, Adjusted EBIT, Fixed Assets, Provisions, Operating Working Capital, Net Working Capital and Net Financial Liquidity (Debt) Position. Reference should be made to the paragraph “Alternative Performance Indicators” for a more detailed description of these indicators. By way of the effect of the reverse merger between the holding company Marco Polo Industrial Holding S.p.A. (incorporated company) into the subsidiary Pirelli & C. S.p.A. (incorporating company), which became effective as of June 1, 2016 the Directors’ Report on Operations of Pirelli & C. S.p.A. at December 31, 2016 has been prepared on a going concern basis with respect to the consolidated Financial Statements at December 31, 2015 of the holding company Marco Polo Industrial Holding S.p.A. Therefore the comparative Statement of Financial Position figures at December 31, 2015, the Income Statement figures and relative financial flows for the 2015 financial year are those of the consolidated Financial Statements of the holding company Marco Polo Industrial Holding S.p.A. For the purpose of ensuring a comparison of the performance of the Pirelli Group for 2016 as compared to 2015, the comparative figures for the Pirelli Group only ("Pirelli Group Reported") for 2015 have been presented in this Financial Report. The comments relating to Income Statement figures, unless otherwise indicated, refer to the comparison with Income Statement figures for the same period of the previous year for the Pirelli Group only. It is also to be noted that as of the financial reports at September 2016, the definitive allocation of the price paid by Marco Polo for the acquisition of the Pirelli Group was completed at the fair value of the Pirelli assets and liabilities acquired (the PPA – Purchase Price Allocation), and was recorded in the Financial Statements of Pirelli as a result of the incorporation of Marco Polo Industrial Holding S.p.A. The completion of the PPA brought about the detection of the value of the Pirelli Brand at euro 2.3 billion euros , the detection of other intangible fixed assets at euro 2.0 billion (which included Technology at euro 1.4 billion), the revaluation of tangible fixed assets to a total of euro 0.9 billion and the detection of residual Goodwill amounting to euro 2.4 billion. It is to be noted that as a consequence of the completion of the PPA, a new intermediate economic measure was introduced, namely the adjusted operating income, which derived from the operating income which did not include the amortisations relative to the intangible fixed assets identified following the PPA or the costs attributable to non-recurring and restructuring expenses. As of the moment that the acquisition date was deemed as September 1, 2015, the aforesaid allocation has been reflected in the comparative Income Statement and Statement of Financial Position figures at December 31, 2015 which have been restated. Of final note is that the deconsolidation of the Venezuelan subsidiary Pirelli de Venezuela C.A. was effective as of December 31, 2015, and that therefore the financial data for 2016 does not include the data from the Income Statement and the Statement of Financial Position of the Venezuelan subsidiary.
2016 ANNUAL REPORT
24
In order to provide a coherent representation of the new scope, the operating income (loss) is discussed in terms of an analysis of the changes which occurred compared to the same period of the preceding financial year, excluding the results for the Venezuelan subsidiary.
* * *
The Group's results for 2016 were characterised by: • with the strengthening of the Premium segment which recorded a growth in volumes of +14.2%
which was superior to that of the market trend (+9.4%) the Premium proportion of Consumer revenues reached 64.0% (61.5% for 2015, on a like-for-like basis);
• noticeable improvement in the price/mix component (+5.0%), with growth in both the Consumer (+4.7%) and Industrial (+6.4%) businesses, which in particular was due to the product mix;
• progressive improvement in volumes (+2.1% for 2016, +3.7% for the third quarter, and +5.1% for the fourth quarter), which was driven by the Consumer business (+3.5% for the first nine months, +5.5% for the third quarter, and +4.8% for the fourth quarter) with sustained growth in mature markets and a recovery in sales in emerging markets, for the Industrial segment (-3.8% for the financial year) but which continued to be impacted by the weakness in the truck and agro market particularly in South America, but with a reversal in trends for volumes during the last quarter (+6.5%), especially in the Replacement channel;
• organic growth in revenues of +7.0% net of the exchange rate effect (-5.4%) and on a consolidated like-for-like basis (an organic growth in revenues of +8.7% for the fourth quarter);
• efficiencies of euro 90.5 million (euro 22.4 million for the third quarter even though it had been impacted by the reduced level of attainment of the productive capacity in Industrial business). Since 2014, 79% of the 2014-2017 four-year plan target of euro 350 million has been reached, with overall efficiencies of euro 277.3 million for the years 2014-2015-2016 (1.5% of sales for the three years;
• improvement in the operating performance with an adjusted EBIT margin of 14.8% (+0.4 percentage points compared to 2015 net of Venezuela) due to the effectiveness of internal levers such as price/mix, efficiencies and volumes for countering the volatility of exchange rates, the increased cost of raw materials and inflation in emerging markets;
• significant reduction in the net debt which was equal to euro 418 million, thanks to: o the elevated level of ordinary cash flow generation (euro 326 million after financial and tax
expenses compared to the euro 83.1 million for 2015) as a result of the careful management of working capital and the lower tax burden;
o the cash-in amount (euro 266 million) resulting from the aforementioned entry of the Chinese Cinda fund payment into Pirelli Industrial’s capital which made it more than possible to offset the increase in indebtedness due to the change in the scope of consolidation (a higher debt level for Marco Polo Industrial Holding as of the beginning of the financial year due to the merger, and to the consolidation of the debt of the Jiaozou Aeolus Tyre business of which Pirelli acquired an 80% stake on October 1, 2016), and to the disposal of certain investments and property assets.
The net debt of the Group at December 31, 2016 amounted to euro 4,912.8 million.
2016 ANNUAL REPORT
25
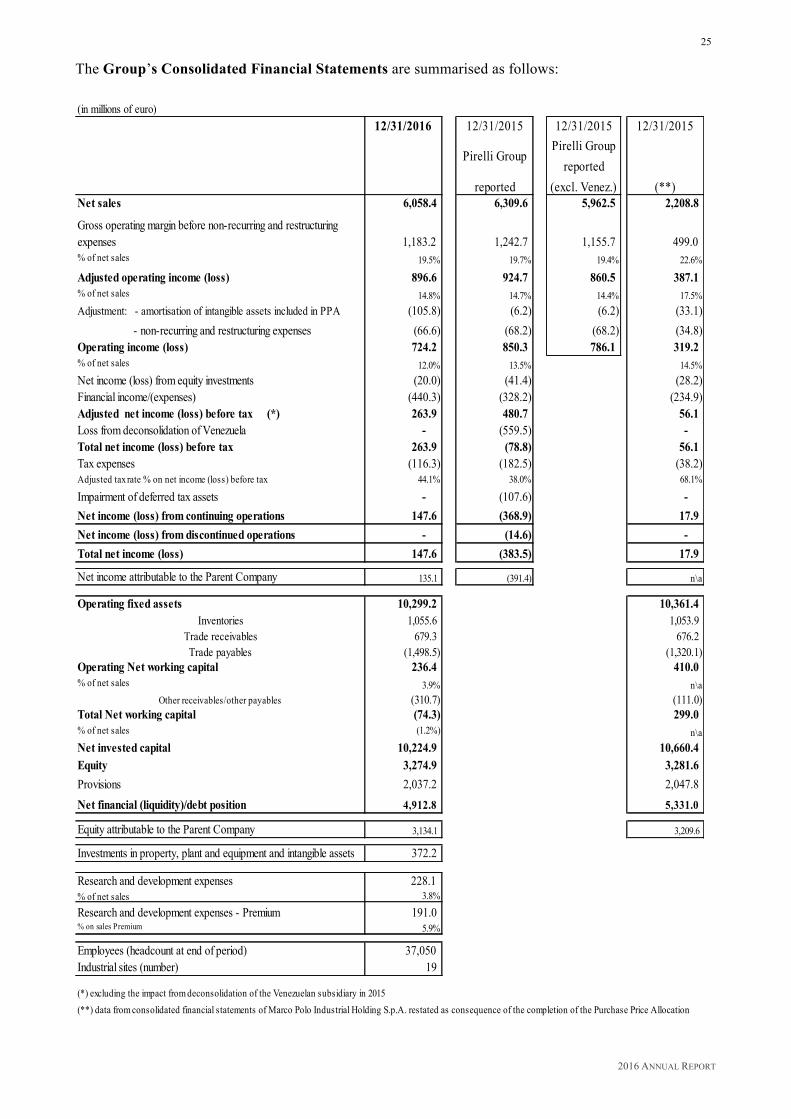
The Group’s Consolidated Financial Statements are summarised as follows: (in millions of euro)
12/31/2016 12/31/2015
Pirelli Group
reported
12/31/2015 Pirelli Group
reported (excl. Venez.)
12/31/2015
(**)Net sales 6,058.4 6,309.6 5,962.5 2,208.8
Gross operating margin before non-recurring and restructuring expenses 1,183.2 1,242.7 1,155.7 499.0 % of net sales 19.5% 19.7% 19.4% 22.6%
Adjusted operating income (loss) 896.6 924.7 860.5 387.1% of net sales 14.8% 14.7% 14.4% 17.5%Adjustment: - amortisation of intangible assets included in PPA (105.8) (6.2) (6.2) (33.1) - non-recurring and restructuring expenses (66.6) (68.2) (68.2) (34.8)Operating income (loss) 724.2 850.3 786.1 319.2% of net sales 12.0% 13.5% 14.5%Net income (loss) from equity investments (20.0) (41.4) (28.2)Financial income/(expenses) (440.3) (328.2) (234.9)Adjusted net income (loss) before tax (*) (*) 263.9 480.7 56.1Loss from deconsolidation of Venezuela - (559.5) - Total net income (loss) before tax 263.9 (78.8) 56.1Tax expenses (116.3) (182.5) (38.2)Adjusted tax rate % on net income (loss) before tax 44.1% 38.0% 68.1%
Impairment of deferred tax assets - (107.6) - Net income (loss) from continuing operations 147.6 (368.9) 17.9Net income (loss) from discontinued operations - (14.6) - Total net income (loss) 147.6 (383.5) 17.9
Net income attributable to the Parent Company 135.1 (391.4) n\a
Operating fixed assets 10,299.2 10,361.4Inventories 1,055.6 1,053.9
Trade receivables 679.3 676.2Trade payables (1,498.5) (1,320.1)
Operating Net working capital 236.4 410.0% of net sales 3.9% n\a
Other receivables/other payables (310.7) (111.0)Total Net working capital (74.3) 299.0% of net sales (1.2%) n\aNet invested capital 10,224.9 10,660.4Equity 3,274.9 3,281.6Provisions 2,037.2 2,047.8Net financial (liquidity)/debt position 4,912.8 5,331.0
Equity attributable to the Parent Company 3,134.1 3,209.6
Investments in property, plant and equipment and intangible assets 372.2
Research and development expenses 228.1 % of net sales 3.8%
Research and development expenses - Premium 191.0% on sales Premium 5.9%
Employees (headcount at end of period) 37,050 Industrial sites (number) 19
(*) excluding the impact from deconsolidation of the Venezuelan subsidiary in 2015(**) data from consolidated financial statements of Marco Polo Industrial Holding S.p.A. restated as consequence of the completion of the Purchase Price Allocation
2016 ANNUAL REPORT
26
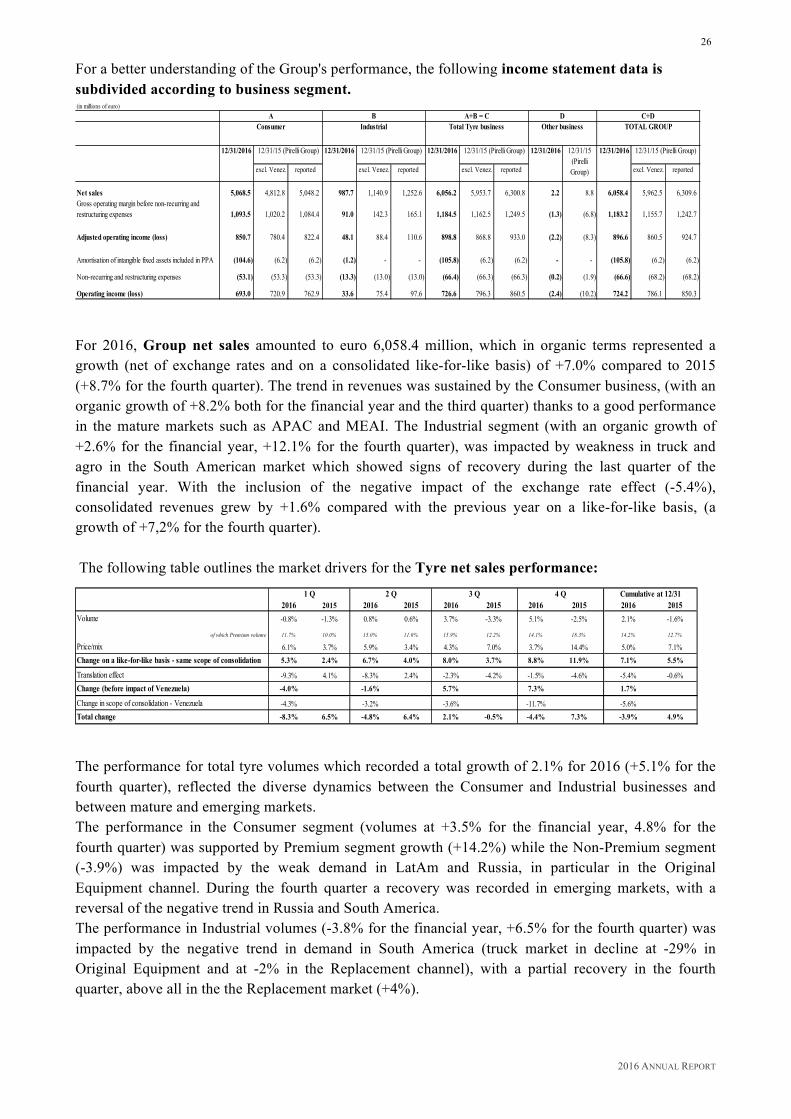
For a better understanding of the Group's performance, the following income statement data is subdivided according to business segment. (in millions of euro)
12/31/2016 12/31/2016 12/31/2016 12/31/2016 12/31/2016
excl. Venez. reported excl. Venez. reported excl. Venez. reported excl. Venez. reported
Net sales 5,068.5 4,812.8 5,048.2 987.7 1,140.9 1,252.6 6,056.2 5,953.7 6,300.8 2.2 8.8 6,058.4 5,962.5 6,309.6Gross operating margin before non-recurring and restructuring expenses 1,093.5 1,020.2 1,084.4 91.0 142.3 165.1 1,184.5 1,162.5 1,249.5 (1.3) (6.8) 1,183.2 1,155.7 1,242.7
Adjusted operating income (loss) 850.7 780.4 822.4 48.1 88.4 110.6 898.8 868.8 933.0 (2.2) (8.3) 896.6 860.5 924.7
Amortisation of intangible fixed assets included in PPA (104.6) (6.2) (6.2) (1.2) - - (105.8) (6.2) (6.2) - - (105.8) (6.2) (6.2)
Non-recurring and restructuring expenses (53.1) (53.3) (53.3) (13.3) (13.0) (13.0) (66.4) (66.3) (66.3) (0.2) (1.9) (66.6) (68.2) (68.2)
Operating income (loss) 693.0 720.9 762.9 33.6 75.4 97.6 726.6 796.3 860.5 (2.4) (10.2) 724.2 786.1 850.3
12/31/15 (Pirelli Group) 12/31/15 (Pirelli Group) 12/31/15 (Pirelli Group) 12/31/15 (Pirelli Group)
Consumer Industrial TOTAL GROUPTotal Tyre business Other business
12/31/15 (Pirelli Group)
A B A+B = C D C+D
For 2016, Group net sales amounted to euro 6,058.4 million, which in organic terms represented a growth (net of exchange rates and on a consolidated like-for-like basis) of +7.0% compared to 2015 (+8.7% for the fourth quarter). The trend in revenues was sustained by the Consumer business, (with an organic growth of +8.2% both for the financial year and the third quarter) thanks to a good performance in the mature markets such as APAC and MEAI. The Industrial segment (with an organic growth of +2.6% for the financial year, +12.1% for the fourth quarter), was impacted by weakness in truck and agro in the South American market which showed signs of recovery during the last quarter of the financial year. With the inclusion of the negative impact of the exchange rate effect (-5.4%), consolidated revenues grew by +1.6% compared with the previous year on a like-for-like basis, (a growth of +7,2% for the fourth quarter). The following table outlines the market drivers for the Tyre net sales performance:
2016 2015 2016 2015 2016 2015 2016 2015 2016 2015Volume -0.8% -1.3% 0.8% 0.6% 3.7% -3.3% 5.1% -2.5% 2.1% -1.6%
of which Premium volume 11.7% 10.0% 15.0% 11.0% 15.9% 12.2% 14.1% 18.3% 14.2% 12.7%
Price/mix 6.1% 3.7% 5.9% 3.4% 4.3% 7.0% 3.7% 14.4% 5.0% 7.1%Change on a like-for-like basis - same scope of consolidation 5.3% 2.4% 6.7% 4.0% 8.0% 3.7% 8.8% 11.9% 7.1% 5.5%
Translation effect -9.3% 4.1% -8.3% 2.4% -2.3% -4.2% -1.5% -4.6% -5.4% -0.6%Change (before impact of Venezuela) -4.0% -1.6% 5.7% 7.3% 1.7%
Change in scope of consolidation - Venezuela -4.3% -3.2% -3.6% -11.7% -5.6%Total change -8.3% 6.5% -4.8% 6.4% 2.1% -0.5% -4.4% 7.3% -3.9% 4.9%
4 Q1 Q 2 Q 3 Q Cumulative at 12/31
The performance for total tyre volumes which recorded a total growth of 2.1% for 2016 (+5.1% for the fourth quarter), reflected the diverse dynamics between the Consumer and Industrial businesses and between mature and emerging markets. The performance in the Consumer segment (volumes at +3.5% for the financial year, 4.8% for the fourth quarter) was supported by Premium segment growth (+14.2%) while the Non-Premium segment (-3.9%) was impacted by the weak demand in LatAm and Russia, in particular in the Original Equipment channel. During the fourth quarter a recovery was recorded in emerging markets, with a reversal of the negative trend in Russia and South America. The performance in Industrial volumes (-3.8% for the financial year, +6.5% for the fourth quarter) was impacted by the negative trend in demand in South America (truck market in decline at -29% in Original Equipment and at -2% in the Replacement channel), with a partial recovery in the fourth quarter, above all in the the Replacement market (+4%).
2016 ANNUAL REPORT
27
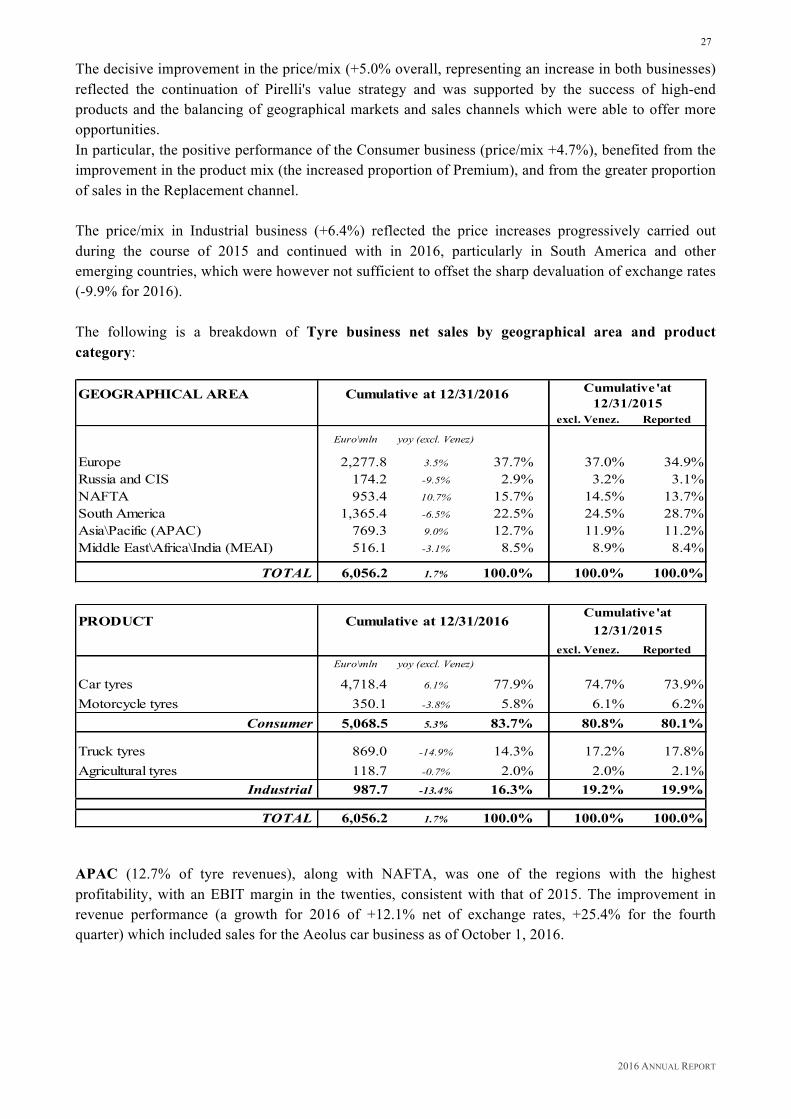
The decisive improvement in the price/mix (+5.0% overall, representing an increase in both businesses) reflected the continuation of Pirelli's value strategy and was supported by the success of high-end products and the balancing of geographical markets and sales channels which were able to offer more opportunities. In particular, the positive performance of the Consumer business (price/mix +4.7%), benefited from the improvement in the product mix (the increased proportion of Premium), and from the greater proportion of sales in the Replacement channel. The price/mix in Industrial business (+6.4%) reflected the price increases progressively carried out during the course of 2015 and continued with in 2016, particularly in South America and other emerging countries, which were however not sufficient to offset the sharp devaluation of exchange rates (-9.9% for 2016). The following is a breakdown of Tyre business net sales by geographical area and product category:
GEOGRAPHICAL AREA
excl. Venez. Reported
Euro\mln yoy (excl. Venez)
Europe 2,277.8 3.5% 37.7% 37.0% 34.9%Russia and CIS 174.2 -9.5% 2.9% 3.2% 3.1%NAFTA 953.4 10.7% 15.7% 14.5% 13.7%South America 1,365.4 -6.5% 22.5% 24.5% 28.7%Asia\Pacific (APAC) 769.3 9.0% 12.7% 11.9% 11.2%Middle East\Africa\India (MEAI) 516.1 -3.1% 8.5% 8.9% 8.4%
TOTAL 6,056.2 1.7% 100.0% 100.0% 100.0%
PRODUCT
excl. Venez. ReportedEuro\mln yoy (excl. Venez)
Car tyres 4,718.4 6.1% 77.9% 74.7% 73.9%Motorcycle tyres 350.1 -3.8% 5.8% 6.1% 6.2%
Consumer 5,068.5 5.3% 83.7% 80.8% 80.1%
Truck tyres 869.0 -14.9% 14.3% 17.2% 17.8%Agricultural tyres 118.7 -0.7% 2.0% 2.0% 2.1%
Industrial 987.7 -13.4% 16.3% 19.2% 19.9%
TOTAL 6,056.2 1.7% 100.0% 100.0% 100.0%
Cumulative at 12/31/2016
Cumulative at 12/31/2016
Cumulative'at 12/31/2015
Cumulative'at 12/31/2015
APAC (12.7% of tyre revenues), along with NAFTA, was one of the regions with the highest profitability, with an EBIT margin in the twenties, consistent with that of 2015. The improvement in revenue performance (a growth for 2016 of +12.1% net of exchange rates, +25.4% for the fourth quarter) which included sales for the Aeolus car business as of October 1, 2016.

2016 ANNUAL REPORT
28
Growth which was equal to +9.0% for the financial year and to +17.9% for the fourth quarter respectively on a like-for-like basis, was supported by the Consumer segment, thanks to the increased market exposure on the Original Equipment channel (which counted new homologations with European and local car brands) and to the expanded retail presence which now numbers 4,000 stores, 500 more than for 2015. The strategy of focusing on high-end products made it possible to limit the negative impact of the devaluation of the Yuan (total exchange rate effect for the region of -3.1% for the financial year, -1.5% for the fourth quarter) and the decline in market prices. NAFTA (15.7% of tyre revenues) recorded an organic growth in revenues of +12% (+18.6% for the fourth quarter). The performance of revenues reflected the positive trend in volumes, in particular for the Premium and Super-Premium segments thanks to the introduction of all season products and greater penetration of the retail channel. Profitability (EBIT margin) was in the low twenties which was consistent with 2015. MEAI (8.5% of tyre revenues) recorded a revenue growth net of exchange rates of +7.2% (+4.4% for the fourth quarter) with profitability in the high-teens which was stable compared to 2015. Europe (37.7% of tyre revenues) ended the financial year with profitability in the mid-teens, representing an improvement compared to 2015, thanks to the +10.0% growth of Premium segment revenues supported by good sales both on the Original Equipment and Replacement channels, and by higher winter sales. Organic growth for total revenues was equal to +5.1% (+1.9% for the fourth quarter), a performance which reflected both the progressive reduction of market exposure on the non-Premium channel and the drop in sales for the Industrial business. Russia (2.9% of tyre revenues), recorded a contraction in sales of -1.0% net of the exchange rate effect, with a reduction in volumes equal to -8.3% in the presence of a market in sharp decline (Replacement -9.0%, Original Equipment -13%), but with partial recovery combined with the appreciation of the Rouble during the final part of the year. Profitability which broke even at the end of the financial year, representing an improvement compared to the first nine months, was still slightly inferior to the results for 2015, had been impacted by worsening exchange rates and the performance in volumes. In this context, given the local competitiveness, production had mainly been intended for exports in support of improved results for Europe. A trend of marked recovery was evident for the fourth quarter with an organic growth in revenues of of +9.6% sustained primarily by the good performance for the price/mix in the presence of a reversal of the exchange rate effect (positive at +6.5% compared to the last quarter of 2015), which was consistent with the recovery in oil prices. South America (22.5% of tyre revenues) recorded a reduction in revenues for the financial year of -6.6%, impacted by the continuation of the difficult market conditions in the area, both for the Original Equipment channel (car market volumes –12% and truck -29%), and the Replacement channel (car market volumes -3% and truck -2%), with an overall decline in volumes for Pirelli of -6.2%. Excluding the relative exchange rate impact (-12.6%), organic growth asserted itself at +6.0% for 2016. The performance in organic revenues was also due to: • continued growth of the product mix, thanks to the performance in Premium and to the 01 Truck
series, • price increases in Consumer and Industrial which had been progressively implemented during the
course of 2015 and continued with in 2016 to counter the volatility of exchange rates.

2016 ANNUAL REPORT
29
Profitability was in the mid single-digits, representing a decline compared to 2015 (double digits), principally due to the performance of the Industrial business considering the difficult economic conditions, while for the Consumer business profitability was recorded in the high single digits. There was significant improvement in performance for the fourth quarter of the financial year with a revenue growth of 12% (+6.4% net of exchange rates) especially in the Industrial business which recorded an increase in volumes greater to that of the market, and the gradual improvement of the component price / mix. The Group's adjusted operating income (loss) - before non-recurring and restructuring expenses and the amortisation of the intangible fixed assets included in the PPA - amounted to euro 896.6 million (an adjusted EBIT margin of 14.8%), a growth of +4.2% compared to the euro 860.5 million recorded for 2015 on a consolidated like-for-like basis (an adjusted EBIT margin of 14.4%). Specifically, the adjusted operating income (loss) for the Group was as follows: (in millions of euro)
1 Q 2 Q 3 Q 4 QCumulative at
12/312015 Adjusted operating income (loss) - excl. Venezuela 208.5 229.4 200.3 222.3 860.5
Differences from foreign currency translation from consolidation (22.0) (22.1) (8.2) (3.0) (55.3)Price/mix 35.8 38.0 31.3 34.4 139.5Volumes (1.6) 0.7 28.3 15.4 42.8Cost of prodution factors (raw materials) (6.4) (3.8) (0.2) (6.1) (16.5)Cost of prodution factors (labour/energy/others) (23.5) (27.8) (22.5) (19.8) (93.6)Efficiencies 30.5 20.8 16.8 22.4 90.5Amortisation, depreciation and other (5.6) (21.2) (24.7) (25.9) (77.4)Other businesses 1.4 1.1 1.7 1.9 6.1
Change 8.6 (14.3) 22.5 19.3 36.1
2016 Adjusted operating income (loss) 217.1 215.1 222.8 241.6 896.6
The improvement in profitability was linked to the effect of internal levers such as price/mix, and to efficiencies achieved to counter the volatility of exchange rates, inflation and the decline of some markets mainly in the Industrial business. In particular: • improvement of the price/mix component (euro +139.5 million) compensated for the negative
impact of raw materials and exchange rates, as well as the higher depreciations, amortisations and other costs also linked to the development of the Premium segment and to the growth in territorial coverage;
• efficiencies which balanced out inflation deriving from the exposure to emerging markets. These efficiencies mainly affected the industrial area, through programmes designed to optimise production flows and to reduce the complexity of the production (optimisation of the product portfolio, and standardisation of components, etc.). Since 2014, efficiencies to the amount of euro 277.3 million have been achieved equal to 79% of the 2014-2017 four year plan target of euro 350 million (1.5% of accumulated revenue);
• positive growth in volumes of euro +42.8 million).

2016 ANNUAL REPORT
30
The operating income (loss) of the Group which amounted to euro 724.2 million, was impacted by; - non-recurring and restructuring expenses to the amount of euro 66.6 million due to structural
rationalisation, and above all the activities under way for the integration of Pirelli’s Industrial segment with the assets of China National Industrial Tire & Rubber Co. Ltd;
- euro 105.8 million relative to the amortisation of the intangible fixed assets identified during the Purchase Price Allocation.
For 2015 the operating income (loss) of the Group had amounted to euro 786.1 million, impacted by non-recurring and restructuring expenses which had amounted to euro 68.2 million, and euro 6.2 million for the amortisation of the intangible fixed assets recorded as a result of previous PPAs. Income (loss) from equity investments by the Group was negative for euro 20.0 million and was mainly due to, euro -28.7 million attributable to the adjustment of the investment in Prelios S.p.A. to the market value at December 31, 2016 (euro 0.092 per share), to the euro -21.9 million pro-rata loss attributable to the vehicle Fenice S.r.l., which holds fiscally transparent shares in Prelios and which reflected the negative performance of the Prelios share price on the stock market, to euro -8.5 million attributable to the pro-rata results of the Indonesian joint venture PT Evoluzione Tyres and to the euro -8.7 million impairment of the investment in Pirelli de Venezuela C.A. mainly attributable to the significant depreciation of the Venezuelan Bolivar against the US Dollar. These losses were partially compensated by +46.1 million relative to the pro rata portion of the positive results for the associate Eurostazioni S.p.A., attributable primarily to the gain deriving from the disposal of the investment held by Eurostazioni S.p.A. in Grandi Stazioni Retail S.p.A.. The net income of the Group at December 31, 2016 was equal to euro 147.6 million, compared to the euro 368.9 million loss for continuing operations for the 2015 financial year, which included the loss from the deconsolidation of the Venezuelan subsidiary of euro 559.5 million (otherwise positive for 2015 to the amount of euro 190.6 million excluding the net loss). In addition to the trends highlighted regarding the operating income (loss) and net income (loss) from investments, the net income performance reflects the increase in net financial expenses of euro 112.1 million (from euro 328.2 million for 2015 to euro 440.3 million for 2016), mainly attributable to, the bank debt contracted by Marco Polo Industrial Holding S.p.A. for the acquisition of the Pirelli Group (“Bidco Facility”), to the subsequent refinancing operation ("Senior Facilities"), as well as to the early repayment of the US Private Placement bond loan of USD 150 million, which, in accordance with the contract terms, resulted in higher expenses which amounted to euro 25.4 million. The average cost of debt for the period was 5.82% (while for the 2015 financial year the average cost of debt had been 5.90%). Tax expenses for 2016 amounted to euro 116.3 million due to earnings before tax of euro 263.9 million with a tax rate which stood at 44.1% which highlighted an increase of 6.6% compared to the tax rate for 2015 which had been 37.3% (adjusted by the impact of the deconsolidation of the results of the Venezualen subsidiary). This increase was due mainly to the effects of interest payables from loans activated during the course of 2016, which reduced the earnings before tax without there being a corresponding reduction in taxes for the financial year in Italy. The net income attributable to Pirelli & C. S.p.A. was positive to the amount of euro 135.1 million compared to the negative amount of euro 391.4 million for the same period of the previous financial year.
2016 ANNUAL REPORT
31
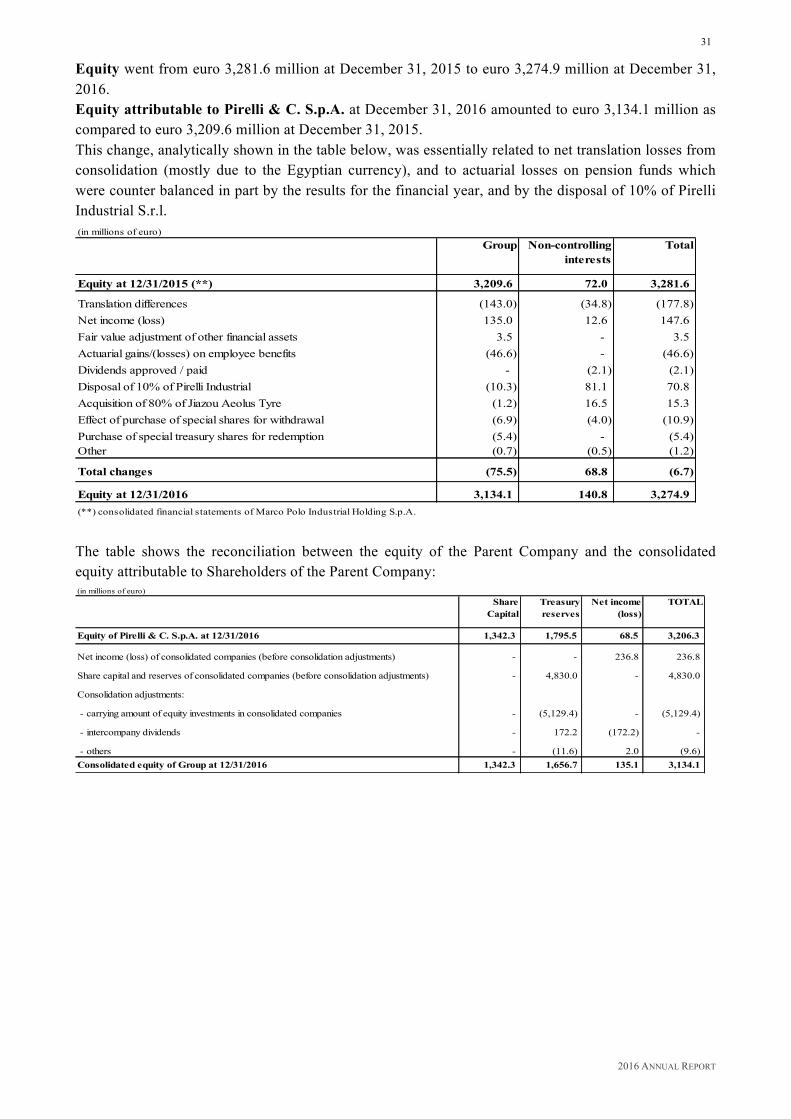
Equity went from euro 3,281.6 million at December 31, 2015 to euro 3,274.9 million at December 31, 2016. Equity attributable to Pirelli & C. S.p.A. at December 31, 2016 amounted to euro 3,134.1 million as compared to euro 3,209.6 million at December 31, 2015. This change, analytically shown in the table below, was essentially related to net translation losses from consolidation (mostly due to the Egyptian currency), and to actuarial losses on pension funds which were counter balanced in part by the results for the financial year, and by the disposal of 10% of Pirelli Industrial S.r.l. (in millions of euro)
Group Non-controlling interests
Total
Equity at 12/31/2015 (**) 3,209.6 72.0 3,281.6
Translation differences (143.0) (34.8) (177.8)Net income (loss) 135.0 12.6 147.6Fair value adjustment of other financial assets 3.5 - 3.5Actuarial gains/(losses) on employee benefits (46.6) - (46.6)Dividends approved / paid - (2.1) (2.1)Disposal of 10% of Pirelli Industrial (10.3) 81.1 70.8Acquisition of 80% of Jiazou Aeolus Tyre (1.2) 16.5 15.3Effect of purchase of special shares for withdrawal (6.9) (4.0) (10.9)Purchase of special treasury shares for redemption (5.4) - (5.4)Other (0.7) (0.5) (1.2)
Total changes (75.5) 68.8 (6.7)
Equity at 12/31/2016 3,134.1 140.8 3,274.9(**) consolidated financial statements of Marco Polo Industrial Holding S.p.A. The table shows the reconciliation between the equity of the Parent Company and the consolidated equity attributable to Shareholders of the Parent Company: (in millions of euro)
Share Capital
Treasury reserves
Net income (loss)
TOTAL
Equity of Pirelli & C. S.p.A. at 12/31/2016 1,342.3 1,795.5 68.5 3,206.3
Net income (loss) of consolidated companies (before consolidation adjustments) - - 236.8 236.8
Share capital and reserves of consolidated companies (before consolidation adjustments) - 4,830.0 - 4,830.0
Consolidation adjustments:
- carrying amount of equity investments in consolidated companies - (5,129.4) - (5,129.4)
- intercompany dividends - 172.2 (172.2) -
- others - (11.6) 2.0 (9.6) Consolidated equity of Group at 12/31/2016 1,342.3 1,656.7 135.1 3,134.1
2016 ANNUAL REPORT
32
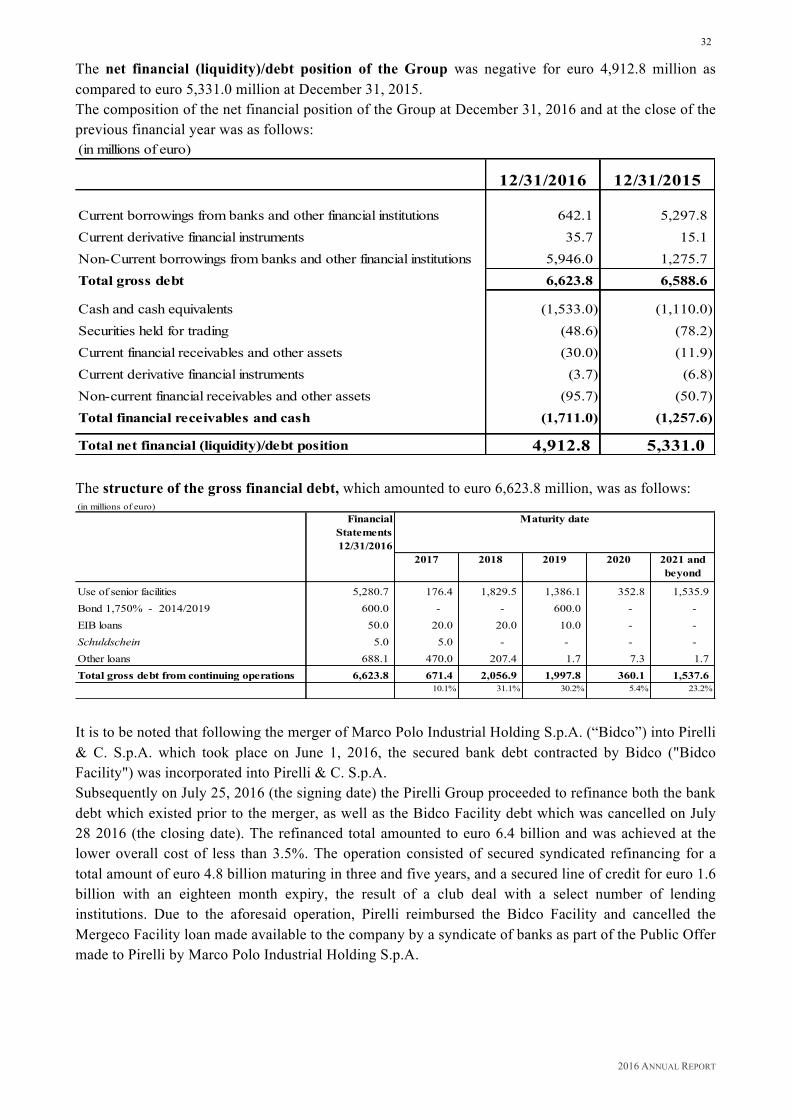
The net financial (liquidity)/debt position of the Group was negative for euro 4,912.8 million as compared to euro 5,331.0 million at December 31, 2015. The composition of the net financial position of the Group at December 31, 2016 and at the close of the previous financial year was as follows: (in millions of euro)
12/31/2016 12/31/2015
Current borrowings from banks and other financial institutions 642.1 5,297.8Current derivative financial instruments 35.7 15.1Non-Current borrowings from banks and other financial institutions 5,946.0 1,275.7Total gross debt 6,623.8 6,588.6
Cash and cash equivalents (1,533.0) (1,110.0)Securities held for trading (48.6) (78.2)Current financial receivables and other assets (30.0) (11.9)Current derivative financial instruments (3.7) (6.8)Non-current financial receivables and other assets (95.7) (50.7)Total financial receivables and cash (1,711.0) (1,257.6)
Total net financial (liquidity)/debt position 4,912.8 5,331.0 The structure of the gross financial debt, which amounted to euro 6,623.8 million, was as follows: (in millions of euro)
Financial Statements 12/31/2016
Maturity date
2017 2018 2019 2020 2021 and beyond
Use of senior facilities 5,280.7 176.4 1,829.5 1,386.1 352.8 1,535.9Bond 1,750% - 2014/2019 600.0 - - 600.0 - - EIB loans 50.0 20.0 20.0 10.0 - - Schuldschein 5.0 5.0 - - - - Other loans 688.1 470.0 207.4 1.7 7.3 1.7 Total gross debt from continuing operations 6,623.8 671.4 2,056.9 1,997.8 360.1 1,537.6
10.1% 31.1% 30.2% 5.4% 23.2% It is to be noted that following the merger of Marco Polo Industrial Holding S.p.A. (“Bidco”) into Pirelli & C. S.p.A. which took place on June 1, 2016, the secured bank debt contracted by Bidco ("Bidco Facility") was incorporated into Pirelli & C. S.p.A. Subsequently on July 25, 2016 (the signing date) the Pirelli Group proceeded to refinance both the bank debt which existed prior to the merger, as well as the Bidco Facility debt which was cancelled on July 28 2016 (the closing date). The refinanced total amounted to euro 6.4 billion and was achieved at the lower overall cost of less than 3.5%. The operation consisted of secured syndicated refinancing for a total amount of euro 4.8 billion maturing in three and five years, and a secured line of credit for euro 1.6 billion with an eighteen month expiry, the result of a club deal with a select number of lending institutions. Due to the aforesaid operation, Pirelli reimbursed the Bidco Facility and cancelled the Mergeco Facility loan made available to the company by a syndicate of banks as part of the Public Offer made to Pirelli by Marco Polo Industrial Holding S.p.A.

2016 ANNUAL REPORT
33
At December 31, 2016, the Group had a liquidity margin equal to euro 2,581.6 million composed of euro 1,000.0 million in the form of a non-utilised nominal line of credit (a contractual Senior Facilities for the total amount of euro 6,289.8 million at December 31, 2016 following the partial reimbursement of the line of credit facility of euro 1,600.0 million at the end of December 2016), and euro 1,581.6 million in cash and cash equivalents and securities held for trading. The performance in cash flows for the period was as follows: (in millions of euro)
2016 2015 Pirelli Group reported
adjusted
2016 2015 Pirelli Group reported
adjusted
2016 2015 Pirelli Group reported
adjusted
2016 2015 Pirelli Group reported
adjusted
2016 2015 Pirelli Group reported
adjusted
Adjusted operating income (loss) 217.1 215.0 215.1 239.5 222.8 207.3 241.6 262.9 896.6 924.7Amortisation and depreciation (excl. PPA amortisation) 72.9 76.9 73.6 78.2 70.6 76.5 69.5 86.4 286.6 318.0Investments in property, plant and equipment and intangible assets
(74.0) (85.6) (82.0) (103.2) (82.4) (73.0) (133.8) (129.6) (372.2) (391.4)Change in working capital/other (715.9) (895.2) 101.4 151.6 (51.7) (113.7) 737.9 707.4 71.7 (149.9)Operating net cash flow (499.9) (688.9) 308.1 366.1 159.3 97.1 915.2 927.2 882.7 701.4Financial income/(expenses) (82.7) (52.1) (198.1) (61.3) (102.6) (67.1) (56.9) (147.7) (440.3) (328.2)Tax expenses (27.2) (54.1) (25.9) (63.7) (28.6) (52.4) (34.6) (119.9) (116.3) (290.1)Ordinary net cash flow (609.8) (795.1) 84.1 241.1 28.1 (22.4) 823.7 659.5 326.1 83.1Financial (investments) / disinvestments (5.2) (14.4) - (0.4) - - (1.5) 6.6 (6.7) (14.8)Disposal of real estate - - - - 16.1 - 75 - 91.1 - Disposal of investments - - 11.1 - - - 97.9 - 109.0 - Dividends paid to non-controlling interests - (7.6) (2.4) (2.5) - - 0.3 - (2.1) (10.1)Cash Out for non-recurring and restructuring expenses (19.5) (6.4) (11.4) (2.6) (8.8) (3.7) (17.4) (15.4) (57.1) (28.1)Reversal of impairment in Venezuela included in financial expenses - - - 14.2 - 9.1 - 0.7 - 24.0Reversal of release of the provision for deferred tax liabilities included in tax expenses - - - - (22.1) - (7.4) - (29.5) - Financial expenses included in the acquisition debt - - 122.2 - - - - - 122.2 - Deferred taxes included in tax expenses - - - - - - - 107.6 - 107.6Exercise of Fenice share options - - - - - (12.2) - - - (12.2)Reversal of Bidco Facility costs post-merger / other adjustments of refinancing included in financial expenses/income - - - - - - 23.0 - 23.0 - Differences from foreign currency translation/other (70.1) 45.8 (33.1) (37.4) 13.7 22.5 (103.4) 5.1 (192.9) 36.0Net cash flow before dividends paid / extraordinary transactions (704.6) (777.7) 170.5 212.4 27.0 (6.7) 890.2 764.1 383.1 192.1Dividends paid by Parent Company - - - (179.5) - - - (179.5)Impact Steelcord disposal - 24.4 - 35.6 - (14.4) - 45.6Impact from deconsolidation of the Venezuelan subsidiary - - - - - - - (277.7) - (277.7)Change NFP Bidco from 01/01 to 05/31 - - (134.3) - - - (134.3) - Proceeds from the disposal of 38% Pirelli Industrial to Cinda - - - - - - 266.0 - 266.0 - Bidco Facility costs post-merger / adjustments of refinancing - - - - - - (23.0) - (23.0) - Impact from NFP of Aeolus Car - - - - - - (73.6) - (73.6) - Net cash flow (704.6) (753.3) 36.2 68.5 27.0 (21.1) 1,059.6 486.4 418.2 (219.5)
TOTAL1 Q 2 Q 3 Q 4 Q
The improvement in indebtedness to the amount of euro 418.2 million was mostly due to: • to the elevated level of cash flow generation (euro 326.1 million after financial and tax expenses
compared to euro 83.1 million for 2015); • to the cash-in amount (euro 266 million) resulting from the entry of the Chinese Cinda fund
payment into the capital of Pirelli Industrial S.r.l. for the 38% acquired. This operation was part of a larger project aimed at the reorganisation and integration of the industrial business.
2016 ANNUAL REPORT
34
In more detail, the operating net cash flow for 2016 was positive and amounted to euro 882.7 million (euro 701.4 million for 2015) after having sustained investments which amounted to euro 372.2 million (euro 391.4 million for 2015), which were mainly aimed at increasing the Premium segment capacity in Europe, NAFTA and China and at improvement of both the mix and quality. The improvement in the net cash flow from operating activities, as compared to 2015, was mainly due to the management of working capital. Total net cash flow before dividends paid and extraordinary transactions arising from the merger with Marco Polo Industrial Holding S.p.A. and from the reorganisation of the Industrial business was positive to the amount of euro 383.1 million, compared to euro 192.1 million for 2015. This cash flow was impacted by, in addition to the aforementioned improvement in operating performance, by the sale of certain investments and property assets for euro 200.1 million (disposal of the investment held by Eurostazioni S.p.A. in Grandi Stazioni Retail S.p.A., and the disposal of the stake in Greentech Energy System A/S and the sale of property), which more than offset the higher restructuring expenses (euro 57.1 million) and other negative components (euro 86 million the exchange rate delta and more). Total net cash flow was positive to the amount of euro 418.2 million and included the cash in amount of euro 266 million from the disposal of 38% of Pirelli Industrial S.r.l. to the Chinese Cinda fund which allowed the Company to cover:
• euro 134.3 million in increased debt held by Marco Polo Industrial Holding S.p.A. as at the beginning of the year at the time of the merger
• euro 96.6 million of further negativity of which euro 73.6 million was relative to the net debt of the Jiaozuo Aeolus Tyre Co., Ltd. of which 80% had been acquired by Pirelli as of October 1, 2016.
For 2015 the total cash flow was negative to the amount of euro 219.5 million, due to the deconsolidation of the Venezuelan subsidiary (euro -277.7 million), to dividends paid by the Group (euro -179.5 million), and to the completion of the disposal of the Steelcord business (euro +45.6 million).

2016 ANNUAL REPORT
35
CONSUMER BUSINESS The table below shows the results as compared with the corresponding period for 2015: (in millions of euro)
2016 2016 2016 2016 2016excl. Venez. reported excl. Venez. reported excl. Venez. reported excl. Venez. reported excl. Venez. reported
Net sales 1,165.7 1,177.6 1,237.4 1,303.9 1,241.7 1,284.3 1,314.4 1,191.1 1,239.9 1,284.5 1,202.4 1,286.6 5,068.5 4,812.8 5,048.2 yoy (excluding Venezuela) -1.0% 5.0% 10.4% 6.8% 5.3%
Gross operating margin before non-recurring and restructuring expenses 263.3 239.5 246.3 270.2 266.6 276.8 273.0 247.6 255.9 287.0 266.5 305.4 1,093.5 1,020.2 1,084.4
% of net sales 22.6% 20.3% 19.9% 20.7% 21.5% 21.6% 20.8% 20.8% 20.6% 22.3% 22.2% 23.7% 21.6% 21.2% 21.5%
Adjusted operating income (loss) 201.2 179.0 183.6 207.6 203.4 211.5 213.6 186.2 191.9 228.3 211.8 235.4 850.7 780.4 822.4 % of net sales 17.3% 15.2% 14.8% 15.9% 16.4% 16.5% 16.3% 15.6% 15.5% 17.8% 17.6% 18.3% 16.8% 16.2% 16.3%
Amortisation of intangible fixed assets included in PPA
(26.2) (1.6) (1.6) (26.1) (1.5) (1.5) (26.1) (1.5) (1.5) (26.2) (1.6) (1.6) (104.6) (6.2) (6.2)
Non-recurring and restructuring expenses (10.8) (1.6) (1.6) (7.3) (1.5) (1.5) (8.9) (3.1) (3.2) (26.1) (47.1) (47.0) (53.1) (53.3) (53.3)
Operating income (loss) 164.2 175.8 180.4 174.2 200.4 208.5 178.6 181.6 187.2 176.0 163.1 186.8 693.0 720.9 762.9 % of net sales 14.1% 14.9% 14.6% 13.4% 16.1% 16.2% 13.6% 15.2% 15.1% 13.7% 13.6% 14.5% 13.7% 15.0% 15.1%
2015 (Pirelli Group) 2015 (Pirelli Group) 2015 (Pirelli Group)
1 Q 2 Q 3 Q 4 Q TOTAL
2015 (Pirelli Group) 2015 (Pirelli Group)
Net sales totalled euro 5,068.5 million, with an organic growth on a like-for-like basis of +8.2%, otherwise +5.3% also including the negative exchange rates impact (-4.4%) and the positive change in scope of +1.5% due to the reorganisation of the business (with controlled distribution included entirely in the Consumer segment), thanks to: • improvement of the price/mix (+4.7%) linked to the increasing proportion of Premium (64.0% of
Consumer revenues in 2016 compared to 61.5% in 2015), to higher sales in the Replacement channel and to price increases in emerging markets to offset the exchange rates and inflation trends;
• positive contribution of the volumes component at +3.5% (+4.8% for the fourth quarter) which was linked to the sustained growth in NAFTA, MEAI, APAC, and Europe, while South America and Russia were affected by the general market downturn, even with the partial recovery in the fourth quarter.
Premium revenues amounted to euro 3.244.6 million, representing a growth of +12.3% net of the exchange rate effect, (with a total growth of +9.7%) thanks to the excellent performance of sales in Europe, North America and APAC as a result of continuous product innovation and increased penetration of the market due to the increase in the number of sales outlets in all geographical areas. The analysis of the change in net sales is as follows:
2016 2015 2016 2015 2016 2015 2016 2015 2016 2015Volume 1.7% 0.4% 2.1% 2.2% 5.5% -1.4% 4.8% -0.1% 3.5% 0.3%
of which Premium volume 11.7% 10.0% 15.0% 11.0% 15.9% 12.2% 14.1% 18.3% 14.2% 12.7%
Price/mix 5.2% 4.7% 5.8% 4.1% 4.5% 7.8% 3.4% 14.1% 4.7% 7.6%Change on a like-for-like basis - same scope of consolidation 6.9% 5.1% 7.9% 6.3% 10.0% 6.4% 8.2% 14.0% 8.2% 7.9%
Change in scope of consolidation Consumer/Industrial -0.3% 4.6% 2.2% -0.8% 1.5%
Translation effect -7.6% 4.5% -7.5% 4.5% -1.8% -1.1% -0.6% -1.5% -4.4% 1.6%Change (before impact of Venezuela) -1.0% 5.0% 10.4% 6.8% 5.3%
Change in scope of consolidation - Venezuela -4.8% -3.5% -4.4% -7.0% -4.9%Total change -5.8% 9.6% 1.5% 10.8% 6.0% 5.3% -0.2% 12.5% 0.4% 9.5%
1 Q 2 Q 3 Q 4 Q Cumulative at 12/31

2016 ANNUAL REPORT
36
There was improvement in profitability for 2016 with an adjusted operating income (loss) of euro 805.7 million (+9.0% for 2015 on a like-for-like basis) and a margin of 16.8% (16.2% for 2015), thanks to the positive contribution of internal levers (price/mix, volumes and efficiencies) which largely compensated inflation, the higher amortisations, depreciations and other costs connected to the development of the Premium segment and to the growth of territorial coverage. Operating income (loss) amounted to euro 693.0 million (with a margin of 13.7%), impacted by non-recurring and restructuring expenses of euro 53.1 million and the amortisation of intangible assets included in the PPA which amounted to euro 104.6 million. For 2015 the operating income (loss) amounted to euro 720.9 million (with a margin of 15.0%), impacted by non-recurring and restructuring expenses of euro 53.3 million and the amortisation of intangible fixed assets included in the PPA which amounted to euro 6.2 million.
INDUSTRIAL BUSINESS The table below shows results as compared with 2015: (in millions of euro)
2016 2016 2016 2016 2016excl. Venez. reported excl. Venez. reported excl. Venez. reported excl. Venez. reported excl. Venez. reported
Net sales 269.4 317.9 327.9 227.9 315.5 324.1 249.6 288.4 291.4 240.8 219.1 309.2 987.7 1,140.9 1,252.6 yoy (excluding Venezuela) -15.3% -27.8% -13.5% - 9.9% -13.4%
Gross operating margin before non-recurring and restructuring expenses 26.9 45.0 47.2 18.9 39.9 42.3 20.5 27.9 29.5 24.7 29.5 46.1 91.0 142.3 165.1
% of net sales 10.0% 14.2% 14.4% 8.3% 12.6% 13.1% 8.2% 9.7% 10.1% 10.3% 13.5% 14.9% 9.2% 12.5% 13.2%
Adjusted operating income (loss) 16.4 31.4 33.3 8.1 27.7 29.7 9.5 16.1 17.4 14.1 13.2 30.2 48.1 88.4 110.6 % of net sales 6.1% 9.9% 10.2% 3.6% 8.8% 9.2% 3.8% 5.6% 6.0% 5.9% 6.0% 9.8% 4.9% 7.7% 8.8%
Amortisation of intangible fixed assets included in PPA (0.3) - - (0.3) - - (0.3) - - (0.3) - - (1.2) - -
Non-recurring and restructuring expenses (4.5) (0.4) (0.4) (0.9) - - (2.8) (0.7) (0.6) (5.1) (11.9) (12.0) (13.3) (13.0) (13.0)
Operating income (loss) 11.6 31.0 32.9 6.9 27.7 29.7 6.4 15.4 16.8 8.7 1.3 18.2 33.6 75.4 97.6 % of net sales 4.3% 9.8% 10.0% 3.0% 8.8% 9.2% 2.6% 5.3% 5.8% 3.6% 0.6% 5.9% 3.4% 6.6% 7.8%
2015 (Pirelli Group)
1 Q 2 Q 3 Q
2015 (Pirelli Group) 2015 (Pirelli Group)
4 Q TOTAL
2015 (Pirelli Group) 2015 (Pirelli Group)
Industrial business performance was impacted by the continued negative economic conditions in South America (the region constitutes 50% of business turnover), in particular the drop in the Brazilian GDP which was forecast to decline by approximately -3.5% for 2016 (following the -3.8% recorded in 2015), while the decline in industrial production and the rise in unemployment continued. In this context, demand in the truck and agro market suffered a further contraction of volumes in 2016 with declines respectively of –29% in truck Original Equipment and –2% in truck Replacement. Net sales totalled euro 987.7 million, a decline of -13.4% compared to 2015 (euro 1.140.9 million excluding Venezuela), with an organic growth of +2.6% net of both the exchange rate effect (-9.9%) and the change of scope (-6.1%) relative to the reorganisation of the business (with controlled distribution included entirely in the Consumer segment). The decline in volumes (-3.8% for the financial year, +6.5% for the fourth quarter) was impacted by the aforementioned decline in the Latin American markets and the slowdown of the Chinese market. There was a positive performance in the price/mix component (+6.4%) thanks to the improvement in the product and channel mix, and to price increases progressively implemented during the course of 2015 and continued with in 2016 in South America and other emerging markets characterised by the devaluation of local currencies.
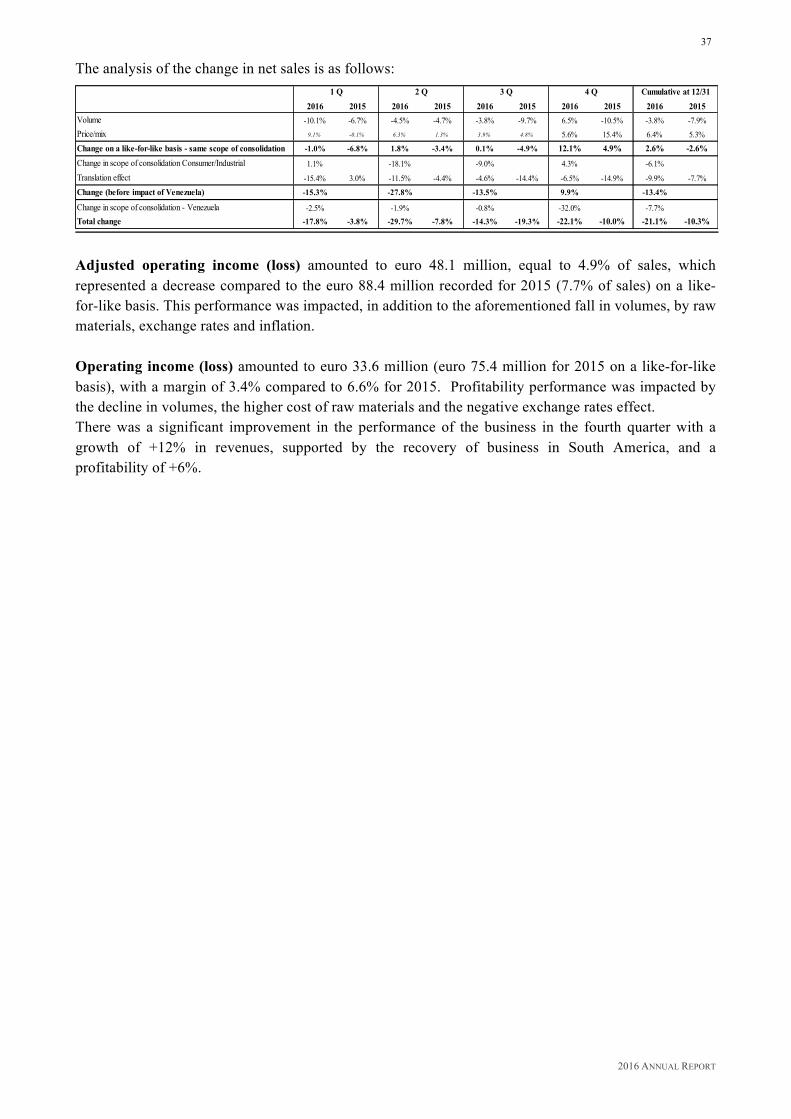
2016 ANNUAL REPORT
37
The analysis of the change in net sales is as follows:
2016 2015 2016 2015 2016 2015 2016 2015 2016 2015Volume -10.1% -6.7% -4.5% -4.7% -3.8% -9.7% 6.5% -10.5% -3.8% -7.9%Price/mix 9.1% -0.1% 6.3% 1.3% 3.9% 4.8% 5.6% 15.4% 6.4% 5.3%
Change on a like-for-like basis - same scope of consolidation -1.0% -6.8% 1.8% -3.4% 0.1% -4.9% 12.1% 4.9% 2.6% -2.6%Change in scope of consolidation Consumer/Industrial 1.1% -18.1% -9.0% 4.3% -6.1%
Translation effect -15.4% 3.0% -11.5% -4.4% -4.6% -14.4% -6.5% -14.9% -9.9% -7.7%
Change (before impact of Venezuela) -15.3% -27.8% -13.5% 9.9% -13.4%
Change in scope of consolidation - Venezuela -2.5% -1.9% -0.8% -32.0% -7.7%Total change -17.8% -3.8% -29.7% -7.8% -14.3% -19.3% -22.1% -10.0% -21.1% -10.3%
1 Q 2 Q 3 Q 4 Q Cumulative at 12/31
Adjusted operating income (loss) amounted to euro 48.1 million, equal to 4.9% of sales, which represented a decrease compared to the euro 88.4 million recorded for 2015 (7.7% of sales) on a like-for-like basis. This performance was impacted, in addition to the aforementioned fall in volumes, by raw materials, exchange rates and inflation. Operating income (loss) amounted to euro 33.6 million (euro 75.4 million for 2015 on a like-for-like basis), with a margin of 3.4% compared to 6.6% for 2015. Profitability performance was impacted by the decline in volumes, the higher cost of raw materials and the negative exchange rates effect. There was a significant improvement in the performance of the business in the fourth quarter with a growth of +12% in revenues, supported by the recovery of business in South America, and a profitability of +6%.

2016 ANNUAL REPORT
38
Research and Development Activities Pirelli has always placed the ability to innovate products, processes and materials at the centre of its growth strategy. Research and development expenses for 2016 totalled euro 228.1 million corresponding to 3.8% of sales of which euro 191.0 million were earmarked for the Premium business (5.9% of Premium revenues). Research and development activity focused on high end range products and with significant results, with over 200 newly achieved approvals and certifications obtained from the main prestige and premium manufacturers which took the Pirelli portfolio to the top of range, exceeding 1900 homologations. The new P ZERO™ was launched during 2016, and is an exclusive Ultra High Performance product which combines the experience acquired by Pirelli through Motorsports competition as well as through its collaboration with the best car manufacturing houses, guaranteeing the perfect solution for the performance of each car. This new tyre, presented at the Estoril circuit in Portugal, has been fitted to many of the most powerful and fascinating cars in the world. Pirelli developed the unique technological characteristics of the P ZERO ™ in three different versions in order to guarantee the perfect solution for many different car models including luxury sedans, sports cars and super cars. Even the Cinturato range was enriched in 2016 to produce a new model, the Cinturato Winter. This is a winter tyre that provides for maximum performance on wet and snow covered surfaces thanks to a series of new ideas implemented during the project. The new Cinturato Winter comprises three important innovations, which can be summed up under Active Safety: the first is the Snow Wear Indicator. The English phrase "Now Snow", has been engraved into one of the tyre slats. The letter "w", however, is less deep than the others and when the tyre wear exceeds the limit of 4 mm the sentence will simply read "No Snow", indicating that it is necessary to replace them. The second new feature is the Water Escape Accelerator — namely, new channels that allow the tread pattern to more efficiently convey water away from the sides of the car. According to data presented by Pirelli, the water displacement capacity of these tyres has increased by 76%, with an additional consequential reduction of the hydroplaning phenomenon by 8%. Finally, the third feature includes the new 4D tyre slats, which compress during braking improving braking capacity, while during acceleration, the tyres widen thereby increasing their capacity to displace water or snow. With regards to the motorcycle business, Metzeler, thanks to their efforts and developments brought about by their experience with competitive road racing, launched two new tyres suited to the race track: the RACETEC™ RR SLICK designed for the Superbike class of the various international/national championships and for the same Superbike class for road racing, and the RACETEC™ RR COMPK SLICK tyre made from a more versatile compound mix designed to deliver higher mileage, which is therefore more suitable for training on the track as well as for amateur or recreational use. In April the ROADTEC™ 01, was presented which is a brand new METZELER brand Sport Touring Radial designed to provide motorbike riders with a high level of grip in different climatic conditions. Two new products, the ANGEL™ SCOOTER and the DIABLO ROSSO™ SCOOTER were also introduced to the market, which feature a wide and comprehensive range of sizes, and which will, during the course of 2017 gradually replace and expand the current DIABLO™ and ANGEL™ SCOOTER range on offer. These tyres are dedicated to those who use a scooter all year round, not only in an urban environment but also with a passenger. These tyres suit situations that require durability, comfort, safety when braking, easily handling and predictable behavior in all conditions, even wet conditions.
2016 ANNUAL REPORT
39
The DIABLO ROSSO™ SCOOTER is inspired by the DNA of the DIABLO™ family, in particular by the DIABLO ROSSO™ range which represents the super sport range of Pirelli tyres. This tyre derives its tread pattern from another pillar of the Pirelli range, the DIABLO ROSSO™ III, which made its debut this year and which immediately garnered the admiration of so many motorcyclists worldwide. Instead as part of the Industrial business Pirelli presented the Pirelli MC: 01 suitable for city use - developed for the latest generation Iveco bus - and which allows high mileage and a low rolling resistance, resulting in reduced fuel consumption. At the international Bus Expo in Rimini, Italy, in addition to the MC: 01, Pirelli presented the H:01 Coach line for long range passenger transport. This is a tyre designed with a load index in line with the requirements of the latest generation of vehicles and comprises all the best features for travelling in maximum safety thanks to the improvement in steering wheel response, to its trajectory precision and its wet road grip. Further recognition of the high quality and reliability of Pirelli tyres for heavy vehicles was demonstrated with the forty new homologations for MAN trucks & buses in Europe. The agreement focuses primarily on the 01 Series which is the the latest in the Pirelli product line. From the R:01 designed for use on regional roads, to the G:01which is ideal for vehicles used in quarrying and construction, and even the MC: 01 for urban use. Pirelli tyres from the :01 Series are at the top of the range in all existing performance classes and carry the European certification label for tyres which means, security, lower CO2 emissions and low rolling resistance. At the Trade Fair in Essen, Germany the new regional R:01 Triathlon tyre intended for the European market was also presented. Pirelli Research and Development enabled the Group to initiate the Total Safety System project during the course of the year, which is part of the activities related to the development of a new generation of tyres based on the concept of "Total Safety". The project received a non-repayable grant from the Lombardy region of euro 1.9 million. In May, Pirelli was awarded the Oscar Masi Prize for industrial innovation for 2016, organised by AIRI, the Italian Association for Industrial Research. This prestigious recognition was awarded to Pirelli researchers for the "CVA Prototype: Automatic Visual Tyre Inspections" project, a system which provides for the automatic visual inspection of the quality of the finished product through the use of innovative technologies such as artificial vision and automation. The project was developed in collaboration with major Universities such as the Information Technology Department in Science and Engineering at the University of Bologna and the Department of Automation and Information Technology at the Polytechnic University of Turin, as proof of the growing support that Pirelli provides for the world of Italian research. In Motorsport, where Pirelli's presence in the racing world comprises more than 300 championships in 40 countries, Pirelli renewed their agreement as the sole supplier of tyres to the FIA Formula 1 World Championship for another three year term, until 2019. In this context, Pirelli and FIA, in collaboration with their teams, reached a major agreement in making changes to the technical regulations. In 2017 in fact, new technical regulations will come into force which will include significant modifications to the chassis and increases in tire width. This experience with Formula 1 has allowed Pirelli to develop new simulation models within their R&D department that allows further reduction of the 'time-to-market' process and an improvement in the quality of road product designs, rendering them better performing consistent with the highest of requirements, as well as the improvement of their understanding of dynamics, based on functioning temperatures and the behaviour of materials.

2016 ANNUAL REPORT
40
Parent Company Highlights The table below shows a summary of the main Income Statement and Statement of Financial Position figures:
(in millions of euro) 12/31/2016 12/31/2015Operating income (loss) 63.2 (2.4) Financial income / (expenses) (236.9) (13.9) Net income (loss) from equity investments 172.5 122.3 Tax expenses 69.7 (107.7) Net income (loss) 68.5 (1.7)
Financial assets 5,146.3 1,475.3 Equity 3,206.2 1,913.9 Net financial (liquidity)/debt position 3,658.6 (346.7) The operating income (loss) mainly includes gains on the disposal of buildings (euro 29.4 million) in Milan, Italy used for R&D for euro 27.2 million, and in San Donato Milanese, Italy for euro 2,2 million, in addition to the increase reported for structural reorganisation and the consequent expansion of services rendered to the Italian subsidiaries of the Group. The item financial income (expenses) essentially comprises financial expenses related to the term loan for euro 65.2 million in addition to the euro 167.4 million deriving from the use of the secured bank facility, closed on July 28, 2016, contracted and subscribed to by Marco Polo Industrial Holding S.p.A. with a syndicate of banks to finance the acquisition of the Pirelli Group. The item income (loss) from equity investments includes:
• Eurostazioni dividends (euro 52.1 million for 2016 compared to euro 1.7 million for 2015) and the extraordinary distribution by the same of capital and reserves for euro 48.2 million;
• Pirelli Tyre S.p.A. dividends (euro 169 million compared to euro 163 million for 2015); • decreased dividends which amounted to euro 9.8 million which was almost unchanged
compared to 2015; • losses connected to the valuation of investments (euro 107.2 million compared to euro 52.3
million for 2015) mainly refer to the investment in Eurostazioni S.p.A. (euro 46.7 million), in Prelios S.p.A (euro 28.3 million) and in Fenice S.r.l. (euro 19.1 million).
Taxes for the 2016 financial year mainly included corporate income tax (IRES) from consolidation which was positive to the amount of euro 54.4 million, while for 2015 the item included losses for euro 103.0 million related to the impairment of deferred tax assets on tax losses directly attributable to the revision of forecasts for the future taxable income of the companies participating in Italian tax consolidation, for which a significant reduction in taxable income was expected due to the new financial structure that the Group would take on consequent to the reverse merger with Marco Polo Industrial Holding S.p.A. which took place during the first half of 2016.
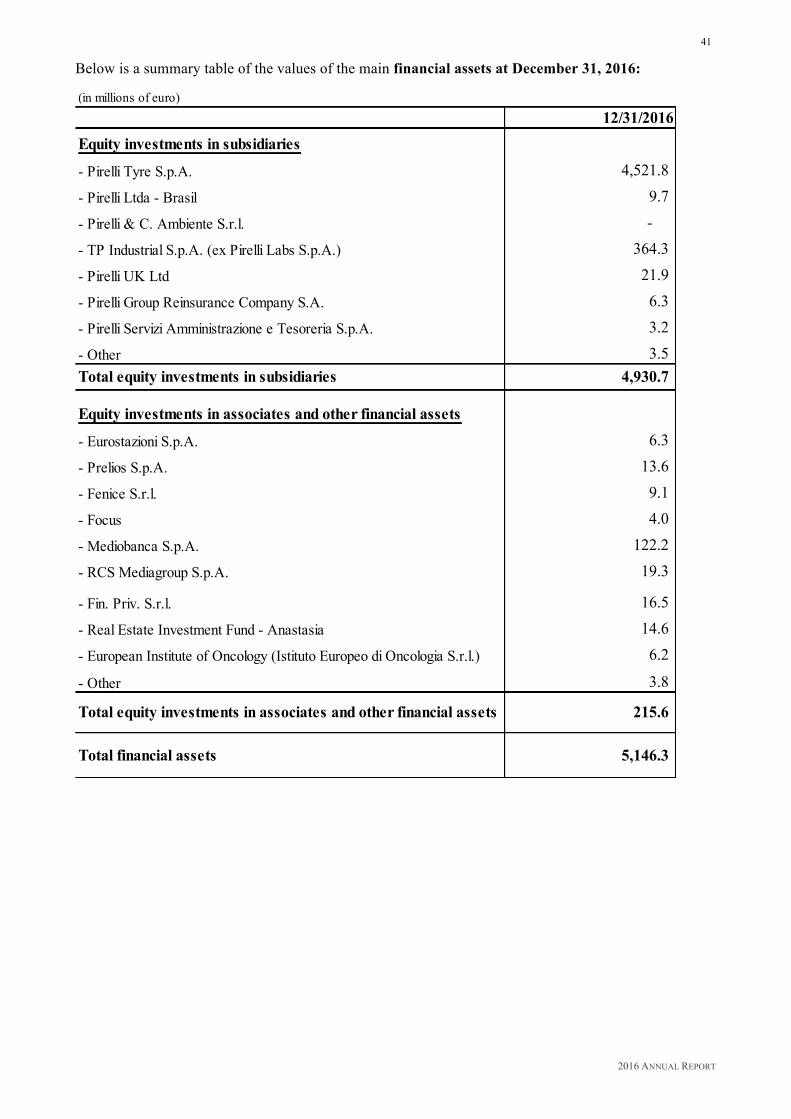
2016 ANNUAL REPORT
41
Below is a summary table of the values of the main financial assets at December 31, 2016:
(in millions of euro)12/31/2016
Equity investments in subsidiaries
- Pirelli Tyre S.p.A. 4,521.8
- Pirelli Ltda - Brasil 9.7
- Pirelli & C. Ambiente S.r.l. -
- TP Industrial S.p.A. (ex Pirelli Labs S.p.A.) 364.3
- Pirelli UK Ltd 21.9
- Pirelli Group Reinsurance Company S.A. 6.3
- Pirelli Servizi Amministrazione e Tesoreria S.p.A. 3.2
- Other 3.5 Total equity investments in subsidiaries 4,930.7
Equity investments in associates and other financial assets
- Eurostazioni S.p.A. 6.3
- Prelios S.p.A. 13.6
- Fenice S.r.l. 9.1
- Focus 4.0
- Mediobanca S.p.A. 122.2
- RCS Mediagroup S.p.A. 19.3
- Fin. Priv. S.r.l. 16.5
- Real Estate Investment Fund - Anastasia 14.6
- European Institute of Oncology (Istituto Europeo di Oncologia S.r.l.) 6.2
- Other 3.8
Total equity investments in associates and other financial assets 215.6
Total financial assets 5,146.3

2016 ANNUAL REPORT
42
Equity increased from euro 1,913.9 million to euro 3,206.2 million, due above all to the merger with Marco Polo Industrial Holding S.p.A. as per the following table: (in millions of euro)
Equity at 12/31/2015 1,913.9Net income (loss) 68.5Merger with Marco Polo Industrial Holding S.p.A. 1,244.2Gains/(losses) recognised directly in Equity (20.5)Equity at 12/31/2016 3,206.2
The table below shows the composition of equity at December 31, 2016 and the comparison with the previous financial year: (in millions of euro)
12/31/2016 12/31/2015
Share capital 1,342.3 1,343.3Legal reserve 152.1 152.1Business combination reserve 12.4 12.4IAS reserve 80.2 96.5Retained earnings 305.4 311.3Merger reserve 1,245.3 - Net icome (loss) 68.5 (1.7)
3,206.2 1,913.9

2016 ANNUAL REPORT
43
Risk Factors and Uncertainty
Volatility in the macroeconomic context, financial market instability, the complexity of management processes and continuous legislative and regulatory developments demands the renewed capacity to protect and maximise the tangible and intangible sources of value that characterise the corporate business model. Pirelli has adopted a proactive risk governance model, which through the systematic identification, analysis and assessment of risk areas is able to provide the Board of Directors and Management with the tools needed to anticipate and manage the effects of these risks. The Pirelli Risk Model systematically assesses three categories of risk:
1. External risks Risks which occur outside the sphere of influence of the company. This category includes risks related to macroeconomic trends, changes in demand, competitor strategies, technological innovation, the introduction of new rules and regulations, and country-specific risks (economic, security related, political and environmental risks).
2. Strategic Risks Risks that are typical for a specific business sector, for which proper management is a source of
competitive advantage, or on the contrary, the cause for the failure to achieve financial objectives. This category includes risks linked to markets, product innovation and development, human resources, raw material costs, production processes, financial risks and risks connected to merger and acquisition operations.
3. Operational Risks Risks generated by the organisation and by corporate processes, whose occurrence do not
necessarily result in any kind of competitive advantage. These types of risks include information technology, business interruption, legal & compliance, health, safety & environment and security related risks.
Transverse to the aforesaid risks are corporate social responsibility risks, environmental and business ethics risks. These are risks associated with the non-compliance with local and international regulations and corporate policies regarding respect for human and labour rights, the environment and business ethics and can be generated both by the organisation and as part of its relative value chain, as well as within the supply chain. These risks in turn can lead to reputational risks. Reputational risks are related to actions or events that could cause a negative perception of the company on the part of its major stakeholders. The main areas of risk in this category are, in addition to the aforementioned risks related to corporate social-environmental responsibility and to business ethics, as well as to the inherent risks of leadership, and the quality and level of product innovation.
System of risk management and internal control relative to the financial reporting process
The company has implemented a specific and detailed system of risk management and internal control, supported by the application of dedicated information technology in the preparation of the annual and separate consolidated Financial Statements.
2016 ANNUAL REPORT
44
In general, the internal control system implemented by the company aims to ensure the safeguarding of the company's equity, the compliance with laws and regulations, the efficiency and effectiveness of corporate operations as well as the reliability, accuracy and timeliness of financial reporting.
In particular, the process of preparing financial reports takes place through the appropriate administrative and accounting procedures that have been drawn up in accordance with criteria established in Internal Control - Integrated Framework issued by the Committee of Sponsoring Organisations of the Treadway Commission.
The administrative/accounting procedures for the preparation of Financial Statements and all other financial reports are prepared under the responsibility of the Chief Financial Officer, who periodically attests to (in any case, in the annual/consolidated Financial Statements) their adequacy and effective application.
In order to enable the attestation by the Chief Financial Officer, the companies and the relevant processes that feed and generate the data for the Income Statement, the Statement of Financial Position or the Financial Statements have been mapped. The identification of companies that belong to the Group and the relevant processes is carried out annually on the basis of quantitative and qualitative criteria. The quantitative criterion involves the identification of the Group companies which, in relation to the selected processes, represent an aggregate value which exceeds a certain threshold of materiality.
Qualitative criteria involve the examination of processes and companies which, in the opinion of the Chief Executive Officer may present potential areas of risk despite not falling within the aforesaid quantitative parameters.
For each selected process, the risk/control objectives associated with the preparation of the Financial Statements and any related disclosures, as well as to the effectiveness/efficiency of the internal control system in general, have been identified.
For each control objective, specific verification procedures have been implemented and specific responsibilities have been assigned.
A supervisory system has been implemented on the controls carried out by way of a mechanism of chain attestations. Any problems that emerge within the evaluation process are subject to action plans whose implementation is verified in subsequent closings.
The quarterly issue of a declaration of the reliability and accuracy of the data supplied for the purposes of preparing the Group's consolidated Financial Statements is also ultimately provided by the Chief Executive Officer and the Chief Financial Officer of each subsidiary.
In the lead up to the dates of the Board of Directors' Meeting which approve the consolidated data at June 30 and December 31st, the results of the verification procedures are discussed by the Chief Financial Officer and the Chief Financial Officers of the Group subsidiaries.
In summary, a system has been adopted of continuous and systematic controls which provide a reasonable assurance regarding the reliability of the information reported in the Income and Financial Statements.
The Internal Audit Department performs regular audits aimed at verifying the adequacy of the design and effectiveness of the controls on the subsidiaries, as well as the sampling procedures, selected on the basis of materiality criteria.
2016 ANNUAL REPORT
45
1. External risks
Risks associated with general economic conditions and changing demand in the medium-term Pirelli expects an improvement in the growth prospects of the global economy in 2017, driven by a marked acceleration in the US economy, which should more than offset the slight slowdown in the European and Chinese economies. Consistent with what has already been highlighted for 2016, global economic recovery will continue to be patchy, as some emerging markets will continue to be impacted by a high degree of geopolitical uncertainty, combined with the increasing risk of capital leakage towards the more mature markets (in particular the United States). Further uncertainty may arise not only from a worsening of the current slowdown of China's economy (and subsequent repercussions on the financial markets) but also by the approach of a series of electoral events in Europe and the uncertainty related to the post-Brexit scenario. In the medium to long-term there remains however a degree of uncertainty on the possible repercussions of the potentially protectionist measures promised by the new president of the United States, both in terms of impacts on the domestic market and in terms of impacts on global trade. Country Risk Pirelli has adopted - where appropriate - a local-for-local strategy, creating a productive presence in rapidly developing countries in order to respond to the local demand with competitive industrial and logistical costs. This strategy increases the competitiveness of the Group, by also allowing the Group to overcome the phenomenon of the strengthening of trading blocs, and increasing protectionist measures (customs barriers or other measures such as technical prerequisites, product certification, and administrative costs related to import procedures, etc.). In the context of this strategy, Pirelli operates in countries (Argentina, Brazil, Mexico, Russia, China, Egypt, and Turkey) where the general economic and political situation and tax regime may prove unstable in future. In fact, structural elements of risk persist in the in the northern part of Africa especially in Egypt, where, to date, political and social instability is still high, and has led over the past few years, to an alteration in normal market dynamics and, more generally, in the operating conditions of business. Added to this scenario of uncertainty, is the recent political instability in Turkey, whose medium to long-term implication remains to this day still very uncertain. The Group constantly monitors the changes in risks (political, economic/financial and security related risks) connected to the countries in which it operates in order to continue to adopt timely (and if possible advance) measures to mitigate the potential impacts of changes arising at local level. Moreover, in situations of under utilisation of the capacity of some factories, the reallocation of production between Group plants is possible. Risks related to changes in demand in the long-term Over the last few decades, certain social and technological trends have emerged that might potentially have a material impact in the medium to long-term on the automotive sector, and indirectly on the tyre market.
2016 ANNUAL REPORT
46
On the one hand, these are represented by growing urbanisation (according to the latest United Nations estimates, about 70% of the global population will live in urban areas by 2050) and, on the other hand, by changes in the values and behaviour of younger generations (increase in the average age when a driver’s license is obtained, loss of importance of owning a car, increased use of various types of car sharing). Added to these factors is the increasing spread of information technologies which increasingly encourages, the use of e-commerce and/or telecommuting, along with frequent regulatory interventions both in the mature as well as emerging economies, aimed at limiting the presence of polluting vehicles within and near metropolitan areas. These dynamics may give rise to a change in automotive sector demand (from changes to vehicle dimensions/types of engine power, to the possible resizing of the car in accordance with the transportation preferences of citizens), with a potential impact on the dynamics of the tyre sector. Pirelli constantly monitors the evolving trends in automotive sector demand by actively participating in international working groups, such as the group connected to the Sustainable Mobility 3.0 (SMP 3.0) project sponsored by the World Business Council for Sustainable Development (WBCSD). The principal aim of SMP 3.0 is to study the possible long-term evolution of urban mobility and to promote solutions that might improve the social, environmental and economic well-being of the urban population. 2. External risks
Risks related to Price Trends and the availability of Raw Materials Natural rubber, synthetic rubber and raw materials linked to oil (in particular chemicals and carbon black) will continue to be a factor of uncertainty in the costs structure of the Group, given their strong volatility in recent years and their impact on the cost of the finished product. For the main raw materials purchased by the Group, the possible price scenarios are constantly simulated in relation to the historical volatility and/or the best information available on the market (for example, forward prices). On the basis of different scenarios, increases in sale prices and/or the different internal actions for the recovery of costs efficiency (use of alternative raw materials, reduction of product weight, improvement of the process quality and reduction in waste levels) are identified. This is necessary to ensure the expected levels of profitability. Financial Risk The Group is exposed to financial risks, mainly related to exchange rates, to obtaining financial resources on the market, to fluctuations in interest rates, to the ability of customers to meet their obligations to the Group, and to the price of financial assets held as investments. Financial risk management is an integral part of the Group's business management and is performed centrally in accordance with the guidelines issued by the Finance Department as part of the risk management strategies more generally defined by the Managerial Risk Committee.
2016 ANNUAL REPORT
47
Exchange Rate Risk The geographical distribution of Pirelli's production and commercial activities entails exposure to exchange rate risks such as transaction risk and translation risk. Transaction risk is generated by transactions of a commercial and financial nature carried out in individual companies in currencies other than the functional currency, due to fluctuations in exchange rates between the time when the commercial/financial relationship originates and the time when the transaction is settled (collection/payment).
The Group's policy is to minimise the impact of transaction risk linked to volatility, and for this reason the Group's procedures provide that the Operating Units are responsible for collecting all the relevant information pertaining to positions subject to transaction risk (mainly represented by receivables and payables in foreign currency). Coverage is then provided in the form of forward contracts which are entered into where possible with the Group Treasury.
The positions subject to exchange rate risk are mainly represented by receivables and payables in foreign currency.
The Group's Treasury is responsible for hedging the resulting net position for each currency and, in accordance with the established guidelines and restrictions, it provides in turn for the closure of all risk positions by trading derivative hedging contracts on the market, typically forward contracts.
Furthermore, as part of the one year and three year planning process, the Group formulates exchange rate forecasts on the basis of the best available information on the market. Any fluctuation in an exchange rate between the time of planning and the time when a commercial or financial transaction originates, results in a translation risk on future transactions with respect to the objectives communicated to the market.
From time to time the Group assesses the opportunity to engage in currency hedging on future transactions for which it typically makes use of either forward buy or sell operations, or optional operations such as risk reversal (eg, zero cost collars).
Pirelli owns controlling interests in companies that prepare their Financial Statements in currencies other than the Euro which is the currency used to prepare the consolidated Financial Statements. This exposes the Group to currency translation risk, due to the conversion into Euro of the assets and liabilities of subsidiaries operating in other currencies. The main exposures to currency translation risk are constantly monitored. It is currently not considered necessary to adopt specific policies to hedge this exposure.
The 2016 financial year saw significant depreciation of the main currencies of emerging countries which were of interest to Pirelli against the US Dollar, in particular the Argentine Peso, the Turkish Lira, the China Yuan Renminbi and the Egyptian Pound. In particular on November 3, 2016, the Egyptian Central Bank decided to eliminate the peg with the US Dollar at 8.88 Egyptian Pounds per US Dollar with the subsequent devaluation of the Egyptian Pound.
This general depreciation trend for the currencies of emerging countries was partly due to external factors - such as the monetary policies of the US Federal Reserve - and specific internal macroeconomic conditions, which resulted in overall negative conditions for the Group.

2016 ANNUAL REPORT
48
For 2017, Pirelli expects - consistent with the major market players - a continuation of the current trend of depreciation of the main currencies of emerging countries, once again attributable to the effect of the change in monetary policies by the US Federal Reserve and to specific elements of country risk. In particular, the Group expects strong volatility in exchange rate markets and persistent weakness or further devaluation of the currencies of the emerging countries where Pirelli operates, whether against the Euro or the US Dollar.
As regards the Euro vs the US Dollar, Pirelli expects a weaker Euro for 2017 on average, compared with levels at mid-2016. In this case also, there remain important elements of uncertainty, which, amongst others are, the timing with which the US Federal Reserve will implement the future interest rate hikes (in the light of the economic policy of the new US administration), plus the choices of the ECB with the possible further extension of the Quantitative Easing programme to beyond 2017, given the current signals of economic recovery and inflation from the Eurozone.
Liquidity risk The principal instruments used by the Group to manage the risk of insufficient available financial resources to meet the financial and commercial obligations within the terms and deadlines established are its one year and three year financial plans and its treasury plans. These allow for the complete and correct detection and measurement of incoming and outgoing cash flows. The differences between the plans and actual data are constantly analysed. The Group has implemented a centralised system for the management of cash flows and payments in compliance with various local currency and tax regulations. Banking relationships are negotiated and managed centrally, in order to ensure coverage for short and medium-term financial needs at the lowest possible cost. The procurement of medium and long-term resources on the capital market is also streamlined through centralised management. The prudent management of the aforesaid risk requires the maintenance of an adequate level of cash or cash equivalents and/or highly liquid short-term financial instruments, plus the availability of funds obtainable through an adequate amount of committed lines of credit and/or the use of the capital market. In addition to the available portion of the committed line of credit (the revolving credit facility) for a total of euro 1,000 million which on December 31, 2016 resulted as being completely unused, the Pirelli Group has resorted to the capital market to diversify both products and deadlines in order to seize the best opportunities available from time to time. Interest Rate Risk Fluctuations in interest rates affect the market value of the financial assets and liabilities of the Group and the net financial expenses. Group policy tends to maintain the following ratio between fixed rate and variable rate exposures, in the order of 70% fixed and 30% variable. In order to maintain this target ratio, the Group sets up derivative contracts, typically interest rate swaps. Price Risk Associated with Financial Assets The Group's exposure to price risk is limited to the volatility of financial assets, such as listed and unlisted stocks and bonds which represent 1.7% of the Group's total assets. Derivatives are not normally set up to limit the volatility of these assets.

2016 ANNUAL REPORT
49
Credit Risk Credit risk represents the Group's exposure to potential losses resulting from the non-fulfilment of the commercial and financial obligations undertaken by counterparties. As regards these commercial counterparties, in order to limit this risk, Pirelli has implemented procedures to evaluate customer potential and financial creditworthiness, and to monitor expected incoming cash flows and to take credit recovery action if and when necessary. The aim of these procedures is to define customer credit limits. Further supplies are suspended when those limits are exceeded. In certain cases customers are asked to provide guarantees. These consist mainly of bank guarantees issued by parties with the highest credit or personal standing. Less frequently, mortgage guarantees may be requested. Other instruments used for commercial credit risk management is the taking out of insurance policies. As of January 2012, the company signed a master agreement which expired in December 2016, with a leading insurance company for worldwide coverage (Egypt and Venezuela were excluded from the policy) for credit risk mainly related to sales on the Replacement channel (with an approximate 65% acceptance rate in December 2016). The insurance coverage has been extended to cover 2017. During the course of 2016, the general situation for trade receivables remained essentially consistent with that at the closing of the previous financial year. The Group operates only with highly rated financial counterparties for the management of its temporary cash surpluses or for trading in derivative instruments. Pirelli does not hold public debt instruments from any European country, and constantly monitors its net credit exposure to the banking system, and does not hold any significant concentrations of credit risk. 3. Operational Risks
Risks Related to Environmental Issues The activities and products of the Pirelli Group are subject to numerous environmental laws that vary between the countries where the Group operates. These regulations have in common their tendency to evolve in an ever more restrictive manner, also because of the growing concern of the international community over the issue of environmental sustainability. Pirelli expects the gradual introduction of ever stricter laws in relation to the various environmental aspects on which companies may impact (atmospheric emissions, waste generation, impacts on soil and water use, etc.) by virtue of which the Group expects to have to continue to make investments and/or incur costs that may be significant. With regard to the impacts of climate change: no significant risks have been found in relation to the production processes or markets in which the Company operates in the short to medium-term. In the long run, the uncertainties related to climate change should also be taken into consideration in terms of the possible evolution of the regulatory conditions in both mature and emerging markets, which is in any case monitored by the company through sensitivity analyses. On the other hand, opportunities present themselves for the growth in sales of Pirelli Green Performance tyres or products with less environmental impact, also due to the possible regulatory developments in this regard in many countries, in the wake of European labelling.
2016 ANNUAL REPORT
50
Employee Health And Safety Risks The Pirelli Group, in carrying out its activities, incurs expenses and costs for the actions necessary to ensure full compliance with the obligations provided for by the regulations regarding health and safety in the workplace. Particularly in Italy the law relating to health and safety at work (Legislative Decree no. 81/08) and subsequent amendments (Legislative Decree No. 106/09) have introduced new obligations that have impacted on the management of activities at Pirelli sites, and on the models for allocating liabilities. Failure to comply with current health and safety regulations entails criminal and/or civil penalties against those responsible, but in some cases, the penalties for the violation of regulations are borne by the Companies themselves in accordance with a European model of objective liability for companies incorporated in Italy (Legislative Decree No. 231/01). Defective Product Risk As with all manufacturers of goods for sale to the public, Pirelli is subject to potential liability claims related to any alleged defects of the materials sold or may be required to launch recall campaigns for products. Although in recent years there have been no significant cases and such events are however covered from an insurance point of view, their occurrence could have a negative impact on the reputation of the Pirelli brand. For this reason, the tyres manufactured by Pirelli are subjected to careful quality analyses before being placed on the market, and the entire production process is subject to specific quality assurance procedures aimed at safety, as well as at constantly elevated performance. Litigation Risks In carrying out its activities, Pirelli may become involved in legal, fiscal, commercial or labour law disputes. The Group adopts the necessary measures to prevent and mitigate any penalties that may result from such proceedings. Risks Associated With Human Resources The Group is exposed to the risk of the loss of human resources in key positions or with critical know how. To address this risk, the Group adopts remuneration policies that are periodically updated but also based on changes occurring in the general macroeconomic scenario, as well as on the basis of salary benchmarks. Also planned are long-term incentive plans and specific non-competition agreements (also with a retention effect) designed amongst other things, to fit the risk profiles of the activities related to the business. Finally, specific management policies have been adopted to motivate and retain talent. Risks Related To Information Systems And Network Infrastructure With the growing role of information systems in the support of business activities and for the purpose of achieving their objectives, during 2016 Pirelli also worked intensely to increasingly improve, both in terms of risk prevention related to the breakdown or malfunction of systems, and in terms of mitigating any impacts resulting there from. Similarly Pirelli undertook measures to enhance the security of the corporate network against unauthorised access, as well as to extend and enrich the existing systems of Business Continuity and Disaster Recovery. More specifically: • redundancy solutions for the geographical data network have been planned in order to improve
reliability, thus reducing the risk of possible inefficiency of the same;
2016 ANNUAL REPORT
51
• a new centralised governance solution was implemented for configuring the corporate network and
the application and management of the access rules for its various sections (factory networks, office networks, external networks);
• the procedure for the segregation of different factory networks from the office networks of different branches of the Group was continued with. Within the factory networks security solutions were implemented even for individual computers (the Eagle solution);
• procedures for the compatibility of the Server and Client environments with the gradual upgrade of operating systems and infrastructure hardware in order to reduce their vulnerability were also continued.
• the new infrastructure for Disaster Recovery was made operational and began to be activated gradually as of the beginning of 2017;
• for the Cloud environments used, the security architecture was set up in accordance with the standards of the Group. This architecture was also set up and activated through the Cloud service providers.
Business Interruption Risks The territorial fragmentation of the operating activities of the Group and their interconnection, expose it to risk scenarios that could cause the interruption of business operations for more or less prolonged periods, with the consequent impact on the operational capabilities and results of the Group itself. Risk scenarios related to natural events or accidents (fires, floods, earthquakes, etc.), to wilful misconduct (vandalism, sabotage, etc.), to breakdowns of the auxiliary plants or to the interruption of the supply of utilities can, in fact, cause significant property damage, and the reduction and/or interruption of production, particularly if the event concerns high volume or specific product (high-end) production sites. Pirelli monitors their vulnerability to catastrophic natural events (in particular flood, hurricane and earthquake) with estimates of any potential damage (based on the given probability of occurrence) for all the Group's production sites. The analyses confirm the adequate monitoring of business interruption risks, thanks to a complex series of security measures, systems of prevention of harmful events and the mitigation of potential impacts on the business, also in light of the current business continuity plans as well as the insurance policies in place to cover property damage and business interruption. Regarding earthquake risk, and specifically the facility in Turkey, any particularly significant seismic events could result in losses exceeding the insured limits resulting in a negative impact on the operating results. Even the Pirelli supply chain, with particular attention to Tier-1 suppliers, is subject to assessment relative to the potential business interruption risks. The Group is carrying out an audit of the aforementioned suppliers in order to determine a series of mitigation measures to reduce the vulnerability of the supply chain; particularly the extension of the portfolio of approved plants for each supplier, the approval of materials/the qualifications of alternative suppliers, and the increased levels of safety stock for critical materials, etc.

2016 ANNUAL REPORT
52
Reputational risk and corporate social-environmental responsibility
Reputational Risks Pirelli has developed an ad hoc digital tool for the identification, measurement and management of reputational risk, which is measured in terms of probability of occurrence and impact on reputation. Reputational risk is a current or prospective risk that might result in a loss in gains and affect the propensity to buy due to a negative perception of the Company by one or more stakeholders. While on the one hand, reputational risk is construed as a possible consequence of the occurrence of an adverse event related to one of the three aforementioned macro-risk families, on the other hand it is managed as an independent event precisely because its scope depends on the expectations of the stakeholders concerned, and the impact of the negative event. The chosen methodology has led to the identification of a specific set of reputational risks. This mapping derives from an analysis of a series of internal and external drivers including: negative events with an impact on reputation which have occurred in the sector worldwide over the last ten years; interviews with external Key Opinion Leaders on sector trends, especially on aspects of mobility and sustainability; interviews with internal Key Opinion Leaders with particular reference to the analysis of the probability of the occurrence of the risks identified. The risk events identified were then subjected to the qualitative-quantitative assessments of a sample representative of the general public in the five key Pirelli countries, which led to the definition of the governance and management structures and the preparation of mitigation and/or crisis management plans. Risks in terms of Corporate Social and Environmental Responsibility, Business Ethics, and Third-Party Audits. Risk management at Pirelli is enterprise-wide and includes the identification, analysis and monitoring of environmental, social, economic/financial and business ethics risks that are directly or indirectly attributable to the company, through Pirelli affiliates or from within relations with them, such as the sustainability of the supply chain. Before entering a specific market, ad hoc assessments are carried out in order to assess any political, financial, environmental and social risks, including those connected with human and labour rights. Together with constant centralised co-ordination and monitoring, the ongoing verification of the application of Pirelli's requirements regarding financial, social (especially human and labour rights) and environmental sustainability and business ethics, occurs through periodic audits commissioned by Pirelli from specialised independent firms, and through extensive internal audit activities. Particular attention is dedicated to the sustainability of both Pirelli sites and sites belonging to suppliers operating in emerging countries. During 2016 Pirelli again commissioned third-party audits of its suppliers, in addition to continuing the internal monitoring through the activities of the Internal Audit Department. For more details on the sustainable management of the supply chain, please refer to the paragraph entitled "Our suppliers" in the Report on the responsible management of the value chain.
2016 ANNUAL REPORT
53
Significant Events subsequent to the end of the year On February 9, 2017 Pirelli announced price increases in all European and North American markets for car tyres, light truck tyres, and motorcycle tyres, in all product ranges (summer, all season and winter) and for all the Group’s brands. The increase, which will take effect from April 1, 2017, will be up to 9%. The increase was due to the costlier prices for the main raw materials, plus a growing investment in the development of products with a high technological content.
On February 14, 2017 Pirelli celebrated the opening of the new season for Motorsports which sees the company committed - in addition to the Formula One World Championship - to over 340 championships, including for cars and motorcycles, for a total of 2,200 events spread across all five continents. The celebration which coincided with the 110 year anniversary in Motorsports for Pirelli was held at the Turin Automobile Museum. On March 7, 2017 Pirelli presented two new products at the Geneva Motor Show, consistent with its strategy of focusing on the Premium and Prestige segments and of expanding the range of services for the consumer: - the colored editions of the P Zero and the Winter Sottozero tyres, for which Pirelli
engineers have developed, thanks to Pirelli’s experience with F1, innovative materials and finishes capable of ensuring bright and long lasting colors;
- Pirelli Conneso offers a digital platform which is integrated into the P Zero and Winter Sottozero tyres, available on the replacement market in black or colored, which thanks to the sensor fixed to the hollow recess of the tyre (i.e., on the inner wall of the tyre itself) is connected to an app and is able to communicate with the motorist and provide information on certain basic parameters concerning the functioning of the rubber, as well as a range of personalised services.
This double innovation, which signals the entrance of Pirelli as a key player into the digital tyre market, is part of the tailor made strategy for the long P, which aims at manufacturing customised tyres designed to meet personalised needs, safety and performance requirements, as well as reducing consumption. On March 13, 2017 Pirelli Industrial S.r.l. (indirectly controlled by Pirelli through TP Industrial Holding) with the aim to ensure full financial autonomy, subscribed a loan of euro 600 million having a 3-year duration (renewable to a maximum of 5 years) with Bank of America Merrill Lynch International Limited, China Construction Bank (Europe) S.A., HSBC Bank plc. and ING Bank N.V., Milan branch. In March 2017 in order to ensure an autonomous growth path and independent group strategies, the two areas of activity – Consumer and Industrial – have been separated into two distinct companies controlled by their common shareholder Marco Polo International Italy following the assignation to the latter by Pirelli of the shares of TP Industrial Holding, the company into which the industrial assets of Pirelli were conferred. TP Industrial Holding and Pirelli are thus 100% controlled by Marco Polo International Italy, the vehicle of the partnership between CNRC (65%), Camfin (22.4%) and Long-Term investments Luxemburg (12.6%). Further, with effect from April 1, 2017, as a consequence of the completion of the separation of the Industrial business from Pirelli’s consumer activities, Pirelli Industrial will change its company name to “Prometeon Tyre Group S.r.l.” (“PTG”).
2016 ANNUAL REPORT
54
Alternative Performance Indicators This document, in addition to the financial measures as provided for by the International Financial Reporting Standards (IFRS), also includes measures derived from the latter even though not provided for by the IFRS (Non-GAAP Measures). These measures are presented in order to allow for a better assessment of the results of Group operations and must not be considered as alternatives to those required by IFRS. In particular, the Non-GAAP Measures used are as follows: - Gross operating margin: an intermediate economic measure which derives from the operating
income which excludes the amortisation of intangible assets and the depreciation of tangible assets (property, plant and equipment);
- Adjusted operating income: an intermediate measure, which derives from the operating income but which excludes the amortisation of intangible assets related to assets detected as a consequence of Business Combinations, and operational costs due to non-recurring and restructuring expenses. Of particular note are the amortisable intangible fixed assets from the PPA. It is to be noted that these assets are related to activities that are continuously regenerated internally within the company and which incur costs that are not capitalised, and which end up duplicating the amortisations created by way of the effect of the PPA. Therefore, in order to neutralise this effect and render the financial data for 2016 more comparable with that of previous periods, a new intermediate economic measure was introduced, namely the Adjusted operating income;
- Fixed assets: this measure is constituted by the sum of the items "Property, plant and equipment", "Intangible assets", "Investments in associates and joint ventures" and "Other financial assets";
- Provisions: this measure is constituted by the sum of "Provisions for liabilities and charges (current and non-current)", "Employee benefit obligations" and "Provisions for deferred taxes";
- Operating working capital: this measure is constituted by the sum of "Inventory", "Trade receivables" and "Trade payables";
- Net working capital: this measure consists of the operating working capital and other receivables and payables not included in the “Net financial position";
- Net financial position: this measure is represented by gross financial debt less cash and cash equivalents as well as financial receivables.
2016 ANNUAL REPORT
55
Other Information Business outlook for 2017
Following the assignment by Pirelli & C. S.p.A. of the investment in TP Industrial Holding S.p.A. (the company which owns the assets of Pirelli Industrial) to Marco Polo International Italy S.p.A., which took place in March 2017, the new scope of Pirelli & C. S.p.A. is essentially represented solely by the Consumer business (Car + Motorcycle). During the course of 2017, Pirelli will continue with the strategy of strengthening the Prestige and Premium segments through an increasingly end-consumer oriented approach. Expectations for the current financial year include improvements in the key economic indicators and the progressive reduction of indebtedness. Role of the Board of Directors
The Board of Directors is responsible for the strategic guidance and supervision of the overall business activities, has the power to address the administration as a whole, and is empowered in the undertaking of the most important financial/strategic decisions and decisions which have a structural impact on operations or are functional decisions, as well as to exercise the control and direction of Pirelli. The Chairman is endowed with the legal representation of the Company including in the legal proceedings of the Company, as well as all other powers attributable to the Chairman in accordance with the Articles of Association. The Executive Vice Chairman and CEO are exclusively delegated powers for the ordinary management of the Company and the Group, as well as the power to propose business plans and budgets to the Board of Directors, as well as any resolutions concerning any strategic industrial partnerships and joint ventures of which Pirelli is a part. The Board has internally instituted the following Committees with advisory tasks: - Strategies Committee - Remuneration Committee - Nominations and Successions Committee - Audit Committee (with expertise also in the field of internal control, risk, sustainability and the
Group's corporate governance guidelines).
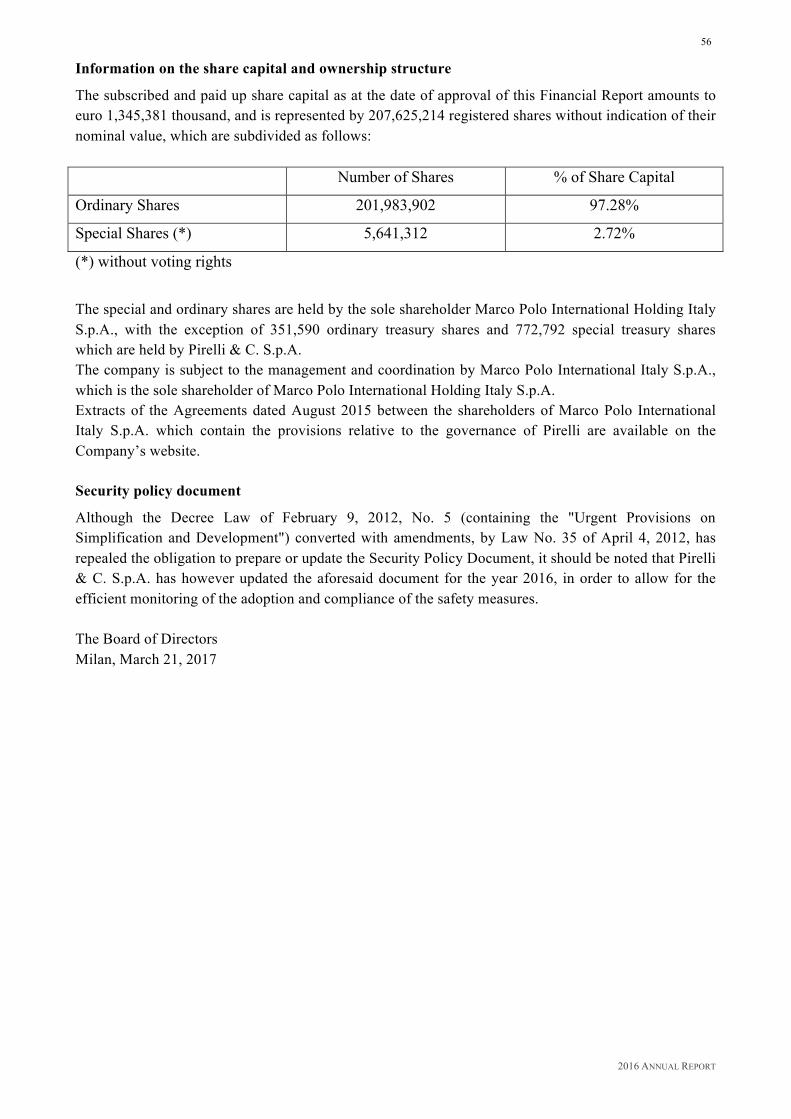
2016 ANNUAL REPORT
56
Information on the share capital and ownership structure
The subscribed and paid up share capital as at the date of approval of this Financial Report amounts to euro 1,345,381 thousand, and is represented by 207,625,214 registered shares without indication of their nominal value, which are subdivided as follows:
Number of Shares % of Share Capital
Ordinary Shares 201,983,902 97.28%
Special Shares (*) 5,641,312 2.72%
(*) without voting rights
The special and ordinary shares are held by the sole shareholder Marco Polo International Holding Italy S.p.A., with the exception of 351,590 ordinary treasury shares and 772,792 special treasury shares which are held by Pirelli & C. S.p.A. The company is subject to the management and coordination by Marco Polo International Italy S.p.A., which is the sole shareholder of Marco Polo International Holding Italy S.p.A. Extracts of the Agreements dated August 2015 between the shareholders of Marco Polo International Italy S.p.A. which contain the provisions relative to the governance of Pirelli are available on the Company’s website. Security policy document
Although the Decree Law of February 9, 2012, No. 5 (containing the "Urgent Provisions on Simplification and Development") converted with amendments, by Law No. 35 of April 4, 2012, has repealed the obligation to prepare or update the Security Policy Document, it should be noted that Pirelli & C. S.p.A. has however updated the aforesaid document for the year 2016, in order to allow for the efficient monitoring of the adoption and compliance of the safety measures. The Board of Directors Milan, March 21, 2017
2016 ANNUAL REPORT
57
04. Report on Value Chain Responsible Management

2016 ANNUAL REPORT
58
Methodological Note This section of the Annual Report 2016, entitled “Report on Value Chain Responsible Management” (hereinafter “the Report”), explores the Sustainable Management Model adopted by Pirelli, the governance tools to support maintenance and creation of values, relationships with Stakeholders and related connection with the development of financial, productive, intellectual, human, natural, social and relational capitals, which was mentioned in the “Presentation of 2016 Integrated Report”. The Report reflects the integrated Business model adopted by the Group, inspired by the United Nations’ Global Compact, the principles of Stakeholder Engagement set forth by the AA1000, and the Guidelines of ISO 26000. The content of the report is prepared in accordance with the Guidelines of the Global Reporting Initiative (GRI) in the G4 version, Comprehensive option, and considering the principles of integrated reporting contained in the Framework of the International Integrated Reporting Council (IIRC). The set of indicators covered by the Report is wider than the list of specific material issues indicated in the materiality matrix, this in order to provide a more complete and transversal view on the Company’s performance, for the benefit of all stakeholders. The report shows the sustainability performance of the Group in 2016 compared to 2015 and 2014, with respect to the targets set for 2016 and with a view to the 2017 and/or long-term targets envisaged in the Industrial Plan. As integral part of the Annual Report 2016, the Report is published annually (the previous Pirelli Annual Report was published in March 2016 with reference to the year 2015) and is approved by the Group Board of Directors. The Report covers the entire perimeter of the Group Consolidated Financial Statements, with the sole exception of the Chinese production site Jiaozuo, partially consolidated in the 2016 performance2 as it is under Pirelli’s operational control since October; the performance of this factory will be fully consolidated and reported as of the Annual Report 2017. It is also noted that the exit of “Pirelli de Venezuela” from the perimeter of the Group on 31 December 2015 resulted in the recalculation of the performance of the year 2015 and 2014 published in the Annual Report 2015. The information systems that contribute to collect the data accounted in the Report are: CSR-DM (Corporate Social Responsibility Data Management), HSE-DM (Health, Safety and Environment Data Management), SAP HR (SAP Human Resources) and HFM (Hyperion Financial Management). The sustainability performance and GHG Emission data accounted in the Report are subject to limited assurance by an independent firm (EY S.p.A.) in accordance with the criteria indicated in the principle International Standard on Assurance Engagements 3000 - Assurance Engagements other than Audits or Reviews of Historical Financial Information (ISAE 3000), issued by the International Auditing and Assurance Standards Board. For further information, reference is made to the related Assurance Letter provided at the end of the Annual Report. Data on GHG emissions have also been subjected to a specific limited assurance process in accordance with the criteria indicated in the principle International Standard on Assurance Engagements 3410 - Assurance Engagements on Greenhouse Gas Statements
–– 2 The report highlight any case in which the performance disclosed includes Jiaozuo.
2016 ANNUAL REPORT
59
(ISAE 3410), issued by the International Auditing and Assurance Standards Board as part of the communication process to the Carbon Disclosure Project (CDP). The Report is structured into four main areas:
• an introductory section related to the sustainable management Model adopted by the Company, related Policies and activities of Governance and Compliance, Stakeholder Engagement, long-term planning;
• an “Economic Dimension”, in which the distribution of added value is detailed along with the management and performance relating to customers and suppliers;
• an “Environmental Dimension”, which describes the management of environmental aspects and impacts throughout the entire product cycle;
• a “Social Dimension”, which brings together the paragraphs dedicated to: governance of human rights, the internal community and the external community.
At the end of the Annual Report 2016, before the third-party Audit Report mentioned above, the following summary Tables are available:
- a GRI Content Index, which shows the full list of indicators accounted based on the comprehensive GRI-G4 option, indicating the relative page in the Annual Report 2016;
- a table of correlation dedicated to “GRI-G4 Aspects” associated with the issues identified as most relevant in the materiality matrix;
- a table of correlation between indicators accounted based on the comprehensive GRI-G4 option and the United Nations’ Global Compact Principles;
- a table of correlation between the performance/targets of the Group and the Sustainable Development Goals of the United Nations that the aforementioned performance and Targets impact on.
For any clarifications and further information on the content of the Report, reference is made to the “Contacts” page of the section “Sustainability” of the website www.pirelli.com.
2016 ANNUAL REPORT
60
Management Model The Sustainability Model adopted by Pirelli is inspired by the United Nations’ Global Compact, the principles of Stakeholder Engagement set forth by the AA1000 and the Guidelines of ISO 26000. Pirelli’s Responsible management runs through the entire value chain. Every operating unit integrates economic, social and environmental responsibility in its own activity, while cooperating constantly with other units and with stakeholders, implementing the Group strategic guidelines. The main management systems adopted include ISO 9001, ISO/TS 16949, ISO/IEC 17025, ISO 14001, ISO 14064 and OHSAS 18001 certifications. Moreover, from 2004 the Company is inspired by the requirements of Standard SA8000® as a reference tool for managing Social Responsibility at its Affiliates and along the supply chain. Details on the coverage of these certifications and reference tools have been given in the “Our Customers”, “Our Suppliers”, “Environmental Dimension”, “Industrial Relations” and “Occupational Health, Safety and Hygiene” sections of this report. The Board of Directors approves the objectives and targets of sustainable management brought into the Industrial Plan alongside the annual financial statements. Governance finds its organisational foundations in the Sustainability Steering Committee, a body appointed in 2004 and made up of Top Management of the Company representing all businesses and all functions responsibilities. The Committee meets ordinarily at least once a year and guides the development of Sustainability within the Company. The organisational structure is thus made up of Group Sustainability and Risk Governance Department, which has oversight of sustainability management at a Group level and proposes plans for sustainable development to the Sustainability Steering Committee. The Sustainability Department receives support from the Country Sustainability Managers for overseeing activities covering all affiliates of the Group. The role of the Country Sustainability Manager is currently held by country CEOs, who are supported by their first line in the operational management of country plans. The process of sustainable management planning is characterised by specific operational steps aimed at continuous improvements in performance: evaluation of the context through benchmarks, dialogue with stakeholders, collection of needs raised by internal functions, identification of risks and opportunities for growth, definition of projects and targets, implementation, monitoring and reporting. The long-term sustainability targets integrate the Industrial Plan and support the sustainable development of the Company. The Industrial Plan, available on the Group's website, has been developed in accordance with the “Value Driver” model drawn up by the UN PRI (United Nations Principles for Responsible Investment) and UN Global Compact and sets targets that combine growth, productivity, governance and risk management. The targets and related performance (for extensive discussion of which reference is made to the related sections in this report) foresee, among other things:
• growth in Green Performance product revenues; • reduction of the rolling resistance of Car tyres of 40% in 2020 vs. 2007; • research and development of raw materials with low environmental impact with a view to the
progressive replacement of fossil-derived materials; • reduction in the accident frequency index by 90% by 2020 compared to 2009;
2016 ANNUAL REPORT
61
• reduction of 15% in CO2 specific emissions, of 18% in specific energy consumption and 58% in
specific water withdrawal by 2020 compared to the 2009 figures; • zero waste to landfill; • increasing investment in Business Interruption risk mitigation; • investment in employees training of at least an average of 7 man days; • adoption of increasingly advanced models for the management of economic, social and
environmental responsibility in the supply chain. All Countries where the Group is present with commercial and manufacturing affiliates have a Country Sustainability Plan with specific targets identified in alignment to the Group’s sustainability targets. The targets of the Country Plans, transversal to management, include the constant monitoring of Compliance with the SA8000® Standard, the specific reduction in the accident frequency index, the specific reduction (weighted on the total finished product) in energy consumption and water withdrawal, the increase in waste recovery, control of the sustainability of the supply chain, dissemination and local implementation of Group Policies and engagement with stakeholders. The performance of the Sustainability Plan of each Country is included in the Performance Management objectives of the related CEOs.
UNITED NATIONS’ SUSTAINABLE DEVELOPMENT GOALS (SDGs) The 2020 targets of the Group Plan are perfectly integrated with the Sustainable Development Goals (SDGs) presented by the United Nations in September 2015 with the objective of accompanying the activities of sustainable companies until 2030. In particular, it is possible to note the strong connection between the targets mentioned in the previous paragraph and the following SDGs:
• 3 - Good Health and Well-being; • 4 - Quality Education; • 6 - Clean Water and Sanitation; • 7 - Affordable and Clean Energy; • 9 - Industry, Innovation and Infrastructure; • 12 - Responsible Consumption and Production; • 13 - Climate Action.
The Sustainable Goals listed above are not the only ones in which the Company is engaged; in addition to the above, this Report describes initiatives and activities that refer to other SDGs:
• 8 - Decent Work and Economic Growth, in the paragraphs dedicated to the Internal Community and in the paragraph “Our Suppliers”;
• 10 - Reduced Inequalities, in the paragraph “Diversity Management”; • 11 - Sustainable Cities and Communities, in the paragraph “WBCSD” with reference to the
project “Sustainable Mobility 3.0”; • 17 - Partnerships for the Goals, in the paragraphs “Road Safety”, with reference to the
partnership with FIA, “Sustainability in the natural rubber chain”, with reference to the partnership with Kirana Megatara, and “WBCSD”, with reference to the project “Sustainable Mobility”

2016 ANNUAL REPORT
62
It is noted that the sub-paragraphs relating to “Corporate Initiatives on behalf of the External Community” indicate the main SDGs that the projects and initiatives described impact directly on.
STAKEHOLDER ENGAGEMENT The role of Pirelli in the economic and social context is tied to its capacity to create value through a multi-stakeholder approach, i.e. by sustainable and lasting growth that can reconcile the interests and expectations of all those with whom the Company interacts and especially;
• customers, since the Pirelli way of doing business is based on customer satisfaction; • employees, who make up the knowledge assets and driving force of the Group; • shareholders, investors and the financial community; • suppliers, with which it shares a responsible approach to business; • competitors, because improved customer service and market position depend on fair
competition; • the environment, institutions, government and non-government bodies; • the communities of the various Countries where the Group operates on a stable basis, while
being aware of its global responsibilities as a Corporate Global Citizen. To the stakeholders mentioned, a paragraph is dedicated within this report, to which reference is made for further qualitative and quantitative information. The interactions that take place between stakeholders conform to the AA1000 Model adopted by the Company and are analysed in detail in order to effectively manage the relations with them and to create sustainable and shared value. Dialogue, interaction and involvement are calibrated to meet the needs of consultation of the various types of stakeholder and include meetings, interviews, surveys, joint analyses, road-shows and focus groups. In February 2016, Pirelli held a Global Stakeholder Dialogue in Brussels, attended by international Stakeholders of the Company including Suppliers, Customers, leaders of the economic and financial, academic, institutional and non-governmental world. The objectives of the Dialogue included updating Stakeholders regarding the progress of the 2020 Sustainability Targets, the comparison and collection of expectations on the evolution of Pirelli's materiality matrix, as well as specific focuses on future mobility, environmental impacts along the product life cycle and sustainable management of the supply chain, with particular reference to human and labour rights in the more distant tiers of the supply chain. Similarly, in 2016, Country level Stakeholder Dialogues were held in Mexico, Turkey, Germany and Romania. The various Countries dealt with material issues for local sustainable development, including energy management, technical training and availability of adequate skills among the working population, road safety, circular economy, engagement of human capital and environmental sustainability of cities. Local Dialogues were attended by stakeholders, institutional and not, most representative of the interests and topics discussed. The Dialogues will continue in 2017 in other Countries where Pirelli operates. Feedback received from stakeholders contributed to the corporate evaluation of the priorities for action, influencing the Group development strategy set out in the Industrial Plan and the Group materiality matrix.

2016 ANNUAL REPORT
63
MATERIALITY ANALYSIS
In 2016 Pirelli initiated and completed the process of updating the materiality matrix elaborated in 2013. The materiality matrix comes from an in-depth activity of Stakeholder Engagement that led to compare the expectations of key stakeholders on a panel of sustainability issues and the importance that these issues play in the success of the business depending on the experience and expectations of the Top Management and Sustainability Managers that support the Top Management in the various Countries where Pirelli operates. Given the complexity and the international extent of corporate stakeholders and the variety of their expectations, the panel of stakeholders from which feedback was requested included:
• the biggest original equipment customers; • 1,800 end customers belonging to the most representative markets; • the most important dealers; • numerous employees in the various nations where the Group is present; • several Group suppliers; • the leading financial analysts; • national and supranational institutions and public administrations; • journalists from domestic and international newspapers; • international and local NGOs present in the various Countries in which Pirelli has manufacturing
activities; • universities that have collaborations with the Group.
The stakeholders were involved through a request, in local language, of attribution of priorities for action on a selection of ESG (Environmental, Social, Governance) issues relevant to the global and sustainable development of the automotive and auto components sectors, identified by considering the risks and opportunities arising from regulatory developments, the expectations of the communities, government and other institutions, and financial markets. The issues the stakeholders evaluated are the following:
• Product eco-innovation: research & innovation commitment to improve product impact on the environment (e.g. by reducing the tyre rolling resistance in the use phase allowing for fuel saving and thus CO2 emissions reduction, more mileage);
• Product performance & safety innovation: research & innovation commitment to improve product performance/safety for the driver (e.g. tyre performance in wet conditions, reduction of braking distance.);
• Service to customers: grant full “customer delight” with the most qualitative and innovative services, offer “the future” to today’s customers;
• Raw materials eco and safety innovation: research & innovation commitment to identify new materials that, compared to traditional ones, are impacting less on the environment while increasing safety during product manufacturing, use and disposal;
• Circular economy/end of life tyres (ELT): commitment to responsibly manage resources and end of life tyres with the aim of maximising a safe reuse and recycling;
• Disclosure and transparency: company transparency in reporting economic, social and environmental performances, goals and challenges;
• Business integrity: company compliance with local and international laws, regulations, universal principles of fairness, morality and justice;

2016 ANNUAL REPORT
64
• Responsible use of natural resources: commitment to protect biodiversity and natural capital
along the product life cycle, reducing water withdrawal, energy consumption, air and water emissions and increasing waste recovery;
• Road safety: commitment to spread road safety culture through training, awareness-raising campaigns and innovative technological solutions for sustainable mobility;
• Employment governance and responsibility: commitment to safeguard and continuously improve workplace environment, with a strong focus on health and safety, employees’ welfare & work-life balance, training & development, engagement and adequate remuneration, ensuring equal opportunities in the workplace while exploiting diversity as a business asset;
• Future mobility: company capability to setting a long-term vision, anticipating market expectations and adapting its business model to contribute to sustainable mobility evolution;
• Stakeholder dialogue: engage in a pro-active dialogue with company Stakeholders, from employees to communities, clients, end-consumers, suppliers, institutions and non-governmental organizations, to integrate their expectations into Company development Strategy;
• Financial health: ensure economic and financial stability in the medium-long term; • Corporate governance: ensure a solid, sound governance aligned with international best
practices; • Sustainable procurement: align group supply chain to Pirelli's social, economic and
environmental responsibility expectations, with a partnership approach aimed at creating shared innovation and value.
The priorities expressed by Pirelli and stakeholders have been represented in a materiality matrix setting out, on the vertical axis, the expectations of several external and internal stakeholders, while on the horizontal one, the importance that the Management attributes to individual business success factors. The result of such consolidation was presented and approved at the Sustainability Steering Committee held in January 2017 and is outlined below. The position of the various sustainability elements inside the matrix is due to the greater or less priority recognized to the above mentioned pre-selected ESG issues. It shall be underlined that all the ESG issues pre-identified through the aforementioned analysis are relevant for the development of Pirelli, thus addressed and managed in accordance with best international practices. It is right and appropriate to underline the fact that consolidation of the materiality matrix at Group level tends, by its very nature, to vary strongly from the materiality matrixes at country level. Sustainability elements located in an area of low materiality in the consolidated Group matrix may be highly material for a number of Countries or specific stakeholders who are more directly affected. Just like the Plan targets set by the Company take into account the expectations expressed by stakeholders involved in the definition of the previous sustainability matrix, the revision of the matrix carried out in 2016 will be functional to the preparation of the next Group Industrial & Sustainability Plan, in addition to having already had an impact on refining the current 2020 targets.
2016 ANNUAL REPORT
65
MAIN POLICIES The Sustainable Management Model throughout the value chain is reflected in the main Group Policies, published on Pirelli's website in multiple languages and communicated to all employees in their local language. In particular, the following Policies are recalled:
• “The Values and the Ethical Code”; • the “Code of Conduct”; • the “Premium Integrity” Program; • the “Global Antitrust and Fair Competition” Policy; • the Group “Equal Opportunities Statement”; • the “Health, Safety and Environment” Policy; • the “Global Human Rights” Policy; • the “Product Stewardship” Policy; • the “Quality” Policy; • the “Green Sourcing” Policy; • the “Social Responsibility Policy for Occupational Health, Safety, Rights and Environment”; • the “Global Tax Policy”; • the “Corporate Lobbying” Policy; • the “Global Personal Data Protection” Policy; • the Group “Whistleblowing” Policy.
2016 ANNUAL REPORT
66
The contents of the aforementioned Policies and the related implementation are addressed in the sections of this report that deal with the related issues. Following, there is a focus on the “Anti-corruption - Premium Integrity” Programme, the “Antitrust” Compliance Programme and the Whistleblowing Policy Focus: Anti-corruption and Antitrust Compliance Programmes During the course of 2016 the process of analysing and implementing the “Anti-corruption - Premium Integrity” Programme proceeded in the main countries where the Group operates. The activity of training and communication on companies’ administrative liability foreseen under Legislative Decree 231/2001 on the existing Model was completed for the entire population of Italian companies. Similarly, during the year, in the face of new offences introduced by the legislator and the organizational changes, the Organizational Model 231/2001 was updated, and its adoption is expected in the first quarter of 2017. The Group Anti-corruption Program (available in twenty-two different languages on the website of the Company) is the corporate reference in the matter of preventing corruptive practices and represents a collection of principles and rules aimed at preventing or reducing the risk of corruption. In the document, the Pirelli principles already set out in the Ethical Code and the Code of Conduct, including zero tolerance of “corruption in any guise or form, or in any jurisdiction, or even in places where such activity is admissible in practice, tolerated, or not challenged in the courts” are restated. Among the provisions of the program is the prohibition, for the recipients of the Code, of offering gifts and other benefits that might meet conditions of a breach of rules, or which are in conflict with the Code, or may, if made public, constitute prejudice even only to the image of Pirelli. Additionally, Pirelli “defend and protect its corporate assets, and shall procure the means of preventing acts of embezzlement, theft, and fraud against the Group” and “condemns the pursuit of personal interest and/or that of third parties to the detriment of social interests”. Pirelli analyses profiles of corruption risk in the various Countries where the Company is present, assessing compliance with local laws in force, the adequacy of corporate oversight updating the risk analysis where there is a change in the perimeter with the “entry” into Countries of “high risks” (on the basis of the Transparency index), defining training and awareness programmes where appropriate. In details, the analysis of Risk Profiles is implemented considering:
• the perceived risks deriving from a combination of a perceived level of corruption, associated with the Corruption Perception Index calculated by Transparency International, with the perception of Management as to the level of risk in each country;
• the adequacy of oversight provided derived from combination of the guaranteed protection in areas deemed to be exposed to contingent corruption risks associated with the benchmark provided by the Internal Audit Function on the Internal Control System.
A mapping has emerged showing the ranking of vulnerability for the Countries subjected to analysis, as shown in the following figure:

2016 ANNUAL REPORT
67
In 2017, training and updating activities are scheduled with particular reference to anti-corruption aspects, which will involve some of the most important Countries of the Pirelli Group, considered priority in receiving such training also due to the specificity of the local legislation. Referring to the contributions to the External Community and sponsoring activities, Pirelli has for many years adopted internal procedures defining the roles and responsibilities of the function involved, and the operational process of planning, achieving, monitoring and controlling the results. The Pirelli procedure specifies that initiatives may not be promoted for the benefit of beneficiaries in respect of whom there is direct or indirect evidence of failure to abide by the labour and human rights, the environment, or business ethics. The “Pirelli Values and Ethical Code” set forth in their turn that the Company “does not provide contributions, advantages, or other benefits to political parties or trade union organizations, or to their representatives or candidates, this without prejudice to its compliance with any relevant legislation”. Concerning institutional relations of the Group, and especially activities of corporate lobbying, the Company has adopted a Corporate Lobbying Policy for ensuring this is done in abidance with principles ratified by the Ethical Code and the Group Anti-corruption Compliance Program and in line with International Corporate Governance Network principles and in compliance with laws and regulations enforced in the countries where Pirelli operates. In terms of prevention and control, the audits carried out by Internal Audit Department at Group affiliates include monitoring of crime risks, among which corruption and fraud figure. In this regard it is specified that, also in respect of 2016, there has been no case of corruption to report, nor any public legal action concerning corruption practices. Additionally, during the course of 2016 the implementation of the Functional Segregation model (so-called Segregation of Duties) proceeded, aimed at strengthening the system of internal controls and preventing the committing of fraud. During the course of 2016 continued the support for the activities of Transparency International, organization to which Pirelli adheres as a supporter in projects on education aimed at promoting an active role of civic and moral education in strengthening civil society against crime and corruption,

2016 ANNUAL REPORT
68
believing that it is only through proactive and firm actions of value promotion can a general improvement in the quality of life be achieved. In 2016, the process of analysis and structuring of the Pirelli “Antitrust Programme” also continued. In line with the provisions of its Global Antitrust and Fair Competition Policy, Pirelli operates in accordance with fair and proper competition for the purpose of development of the company and at the same time, the market. Pirelli has formulated a Group Antitrust Programme in line with international best practices, also in order to pursue increasingly effective coordination of existing initiatives in the various Countries where it operates. The Antitrust programme consists of new training activities that will be implemented over the course of 2017 in all Countries where Pirelli operates, as well as business assistance activities to facilitate the management of antitrust issues in the daily performance of business activities or relationships with other operators. Focus - Reporting procedure: Whistleblowing Policy The Whistleblowing Policy supports the internal compliance and control systems of the Group. It is directed both towards employees and external stakeholders. Notified to all employees in local language and made available to the External Community on the Pirelli Internet website, the Policy governs the modalities of reporting breaches, suspected breaches and inducement to breaches in the matter of law and regulations, principles ratified by the Ethical Code, including, obviously, equal opportunities, principles of internal auditing, corporate rules, policies and procedures, and any other behaviour of commission or omission that might directly or indirectly lead to economic, financial or reputational damage, for the Group and/or its companies. The Whistleblowing channel is additionally incorporated expressly into the Sustainability Clauses included in every supply order / contract. Reports may be made also in an anonymous form and protection of utmost confidentiality is at all times restated, as is zero tolerance in respect of acts of reprisal of any kind. Reports may concern directors, auditors, management, employees of the Company and, in general, anyone operating in Italy or abroad for Pirelli or engaging in business relations with the Group, including partners, customers, suppliers, consultants, collaborators, auditing companies, institutions and public entities. The e-mail [email protected] is made available to those who wish to submit a report and applies to all the Group's affiliates, as well as to the External Community, and is managed centrally by the independent Internal Audit function. Internal Audit Department has the task of analysing all reports received, involving corporate functions required for the necessary verification activities, in addition to scheduling specific action plans. If it is ascertained that a report is founded, the adoption of fitting disciplinary and/or legal actions for the protection of the Company is foreseen. In respect of reports received in the 2016, 2015 and 2014, here below is a summary table and more details on the reports from 2016.
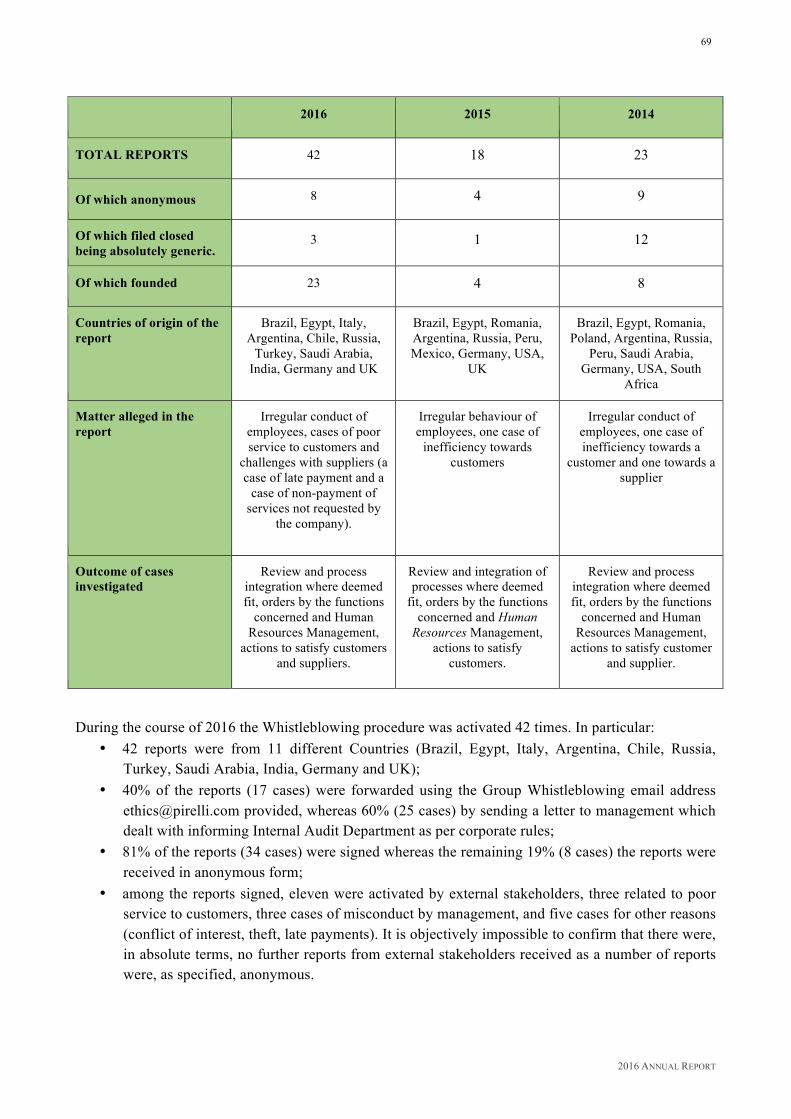
2016 ANNUAL REPORT
69
2016 2015 2014
TOTAL REPORTS 42 18 23
Of which anonymous 8 4 9
Of which filed closed being absolutely generic.
3 1 12
Of which founded 23 4 8
Countries of origin of the report
Brazil, Egypt, Italy, Argentina, Chile, Russia,
Turkey, Saudi Arabia, India, Germany and UK
Brazil, Egypt, Romania, Argentina, Russia, Peru, Mexico, Germany, USA,
UK
Brazil, Egypt, Romania, Poland, Argentina, Russia,
Peru, Saudi Arabia, Germany, USA, South
Africa
Matter alleged in the report
Irregular conduct of employees, cases of poor service to customers and
challenges with suppliers (a case of late payment and a
case of non-payment of services not requested by
the company).
Irregular behaviour of employees, one case of
inefficiency towards customers
Irregular conduct of employees, one case of inefficiency towards a
customer and one towards a supplier
Outcome of cases investigated
Review and process integration where deemed fit, orders by the functions
concerned and Human Resources Management,
actions to satisfy customers and suppliers.
Review and integration of processes where deemed
fit, orders by the functions concerned and Human
Resources Management, actions to satisfy
customers.
Review and process integration where deemed fit, orders by the functions
concerned and Human Resources Management,
actions to satisfy customer and supplier.
During the course of 2016 the Whistleblowing procedure was activated 42 times. In particular: • 42 reports were from 11 different Countries (Brazil, Egypt, Italy, Argentina, Chile, Russia,
Turkey, Saudi Arabia, India, Germany and UK); • 40% of the reports (17 cases) were forwarded using the Group Whistleblowing email address
[email protected] provided, whereas 60% (25 cases) by sending a letter to management which dealt with informing Internal Audit Department as per corporate rules;
• 81% of the reports (34 cases) were signed whereas the remaining 19% (8 cases) the reports were received in anonymous form;
• among the reports signed, eleven were activated by external stakeholders, three related to poor service to customers, three cases of misconduct by management, and five cases for other reasons (conflict of interest, theft, late payments). It is objectively impossible to confirm that there were, in absolute terms, no further reports from external stakeholders received as a number of reports were, as specified, anonymous.

2016 ANNUAL REPORT
70
In general, the topics reported concerned, almost totally, alleged irregular conduct by employees or, in the remaining cases, alleged inefficiencies towards customers, complaints made by suppliers and cases of non-compliance with Group policies and/or procedures. Of the forty-two reports received during 2016, at the beginning of 2017 four are still under verification, whereas thirty-eight are concluded. In respect of these latter, specific activities of verification involving, where necessary, the corporate functions concerned were conducted. On the basis of the analyses performed and the documentation made available, it came to light that:
• in 15 cases objective corroborating evidence was not detected such as to hold the facts contended in the reports received to be true;
• in the remaining 23 cases, the substantial truth of the facts attributed was found, in particular, 13 cases were related to irregular conduct of employees, 2 cases for poor service to customers and 8 cases for other reasons (including cases of theft, conflict of interest, delays in payments to a supplier). The Company then took steps implementing the necessary actions, which concerned;
o disciplinary sanctions: o actions aimed at removing the complaints received from customers and suppliers; o internal actions to improve the internal control system.
In all cases, at the outcome of inquiries, Internal Audit Department additionally carried out specific audit actions on the corporate processes involved in the reports. The Internal Audit Department periodically reported the reports received and the progress of the analyses carried out to the competent corporate bodies of Pirelli & C. S.p.A.
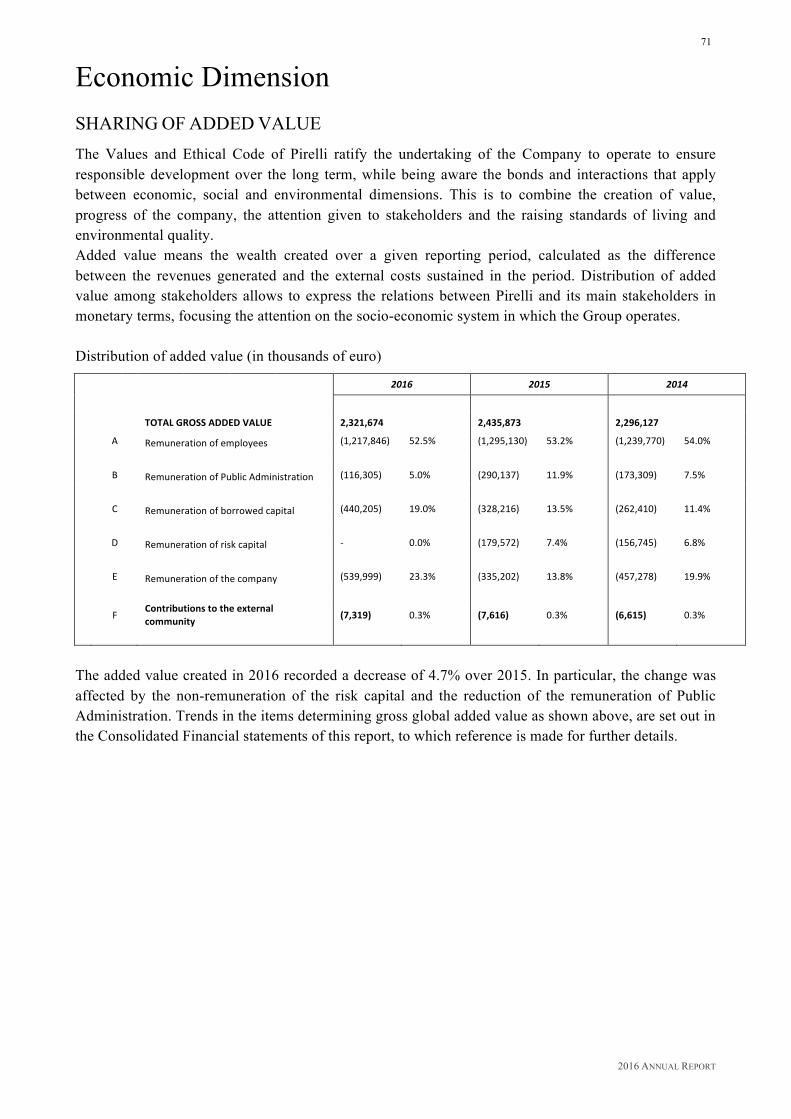
2016 ANNUAL REPORT
71
Economic DimensionSHARING OF ADDED VALUE The Values and Ethical Code of Pirelli ratify the undertaking of the Company to operate to ensure responsible development over the long term, while being aware the bonds and interactions that apply between economic, social and environmental dimensions. This is to combine the creation of value, progress of the company, the attention given to stakeholders and the raising standards of living and environmental quality. Added value means the wealth created over a given reporting period, calculated as the difference between the revenues generated and the external costs sustained in the period. Distribution of added value among stakeholders allows to express the relations between Pirelli and its main stakeholders in monetary terms, focusing the attention on the socio-economic system in which the Group operates. Distribution of added value (in thousands of euro)
2016 2015 2014
TOTALGROSSADDEDVALUE 2,321,674 2,435,873 2,296,127
A Remunerationofemployees (1,217,846) 52.5% (1,295,130) 53.2% (1,239,770) 54.0%
B RemunerationofPublicAdministration (116,305) 5.0% (290,137) 11.9% (173,309) 7.5%
C Remunerationofborrowedcapital (440,205) 19.0% (328,216) 13.5% (262,410) 11.4%
D Remunerationofriskcapital - 0.0% (179,572) 7.4% (156,745) 6.8%
E Remunerationofthecompany (539,999) 23.3% (335,202) 13.8% (457,278) 19.9%
F Contributionstotheexternal
community (7,319) 0.3% (7,616) 0.3% (6,615) 0.3%
The added value created in 2016 recorded a decrease of 4.7% over 2015. In particular, the change was affected by the non-remuneration of the risk capital and the reduction of the remuneration of Public Administration. Trends in the items determining gross global added value as shown above, are set out in the Consolidated Financial statements of this report, to which reference is made for further details.
2016 ANNUAL REPORT
72
Contributions to the External Community The impact of expenses for corporate initiatives in 2016 for the external community on the net result of the Group amounted to 5.0% (4.4% in 2015 and 2.0% in 2014). CONTRIBUTIONS TO THE EXTERNAL COMMUNITY (in thousands of euros)
2016 2015 2014
TrainingandResearch 807 876
810
Socio-culturalinitiatives 5,014 4,864
4,541
Sportsandsolidarity 1,498 1,876
1,264
7,319 7,616
6,615
For further study of the main initiatives supported by the contributions indicated above and relating to the governance model, please refer to the paragraphs in this report dedicated to “Company Initiatives for the external community”. In line with what is set forth in the Ethical Code, Pirelli “does not provide contributions, advantages, or other benefits to political parties or trade union organizations, or to their representatives or candidates, this without prejudice to its compliance with any relevant legislation”. LOANS AND CONTRIBUTIONS RECEIVED FROM PUBLIC ADMINISTRATION Romania. In March 2012 the European Investment Bank (EIB) granted Euro 10 million to Pirelli Tyres Romania S.r.l. as last tranche of a financing agreement for a total of Euro 50 million as support for an investment of Euro 263 million to be used to expand the Pirelli plant in Slatina, Romania, for the production of car tyres and light commercial vehicles. The financing sits alongside a similar one granted in 2007 and fully reimbursed at the end of the 2013 accounting period and received to support the construction of the same production site. The first tranche of this loan, amounting to 20 million euro, will be repaid in May 2017. Also reported is: S.C. Pirelli Tyres Romania S.r.l. received 46.1 million euro in total from the Romanian State by way of incentive for local investment and of which 7.8 million was in 2016. Italy. During the year 2016, there were no collections related to government grants. Mexico. Since 2012 Pirelli Neumaticos S.A. de C.V. (Mexico) has received grant contributions from the Government of the State of Guanajuato (Mexico) for investments and generation of employment for 12.5 million euro in totale. The company also received grant contributions from the Mexican Federal Government for investments and generation of employment related to the ProMexico project totalling 8.8 million euro, of which 0.7 million received during 2016 (the incentives were paid starting 2012). United Kingdom. In the 2013 and 2014 accounting periods Pirelli Tyres Ltd. (United Kingdom) received government grant contributions under the RGF–Regional Growth Fund for investments and generation of employment tied to introducing new UHP products at the Carlisle factory for 2.6 million euro in total. During the course of 2016 no further government contributions were received.
2016 ANNUAL REPORT
73
OUR CUSTOMERS Pirelli business operations are represented by two main segments: Consumer (tyres for cars, SUV, light commercial vehicles and motorcycles) and Industrial (tyres for buses, trucks, agricultural equipment). These businesses are in turn pursued through two sales channels:
• Original Equipment, addressed directly to the world’s leading car and truck makers; • Replacement, for the replacement of tyres on vehicles already in circulation.
Within Original Equipment for Cars, SUV and light commercial vehicles, in Europe Pirelli can count on a market share of Premium customers of over 22% in 2016 compared to 14%, at which the Company stood in 2011. In the Prestige segment, which is the highest of the range, Pirelli approaches 45%, with an increase of 36% compared to 2011. As part of Replacement, there are two broad types of customers: Specialised Resellers and Distributors. Specialised Resellers are tyre specialists operating on the market in the role of independent businesses; specialised dealers constitute a fundamental point of contact between the Group and the end consumer. Particular attention is devoted to specialised dealers in terms of shared development to enhance the product offering integrated with a high quality level of service, in compliance with Pirelli values and consumer expectations. In 2016, Pirelli can count on about 12,000 Loyal Resellers globally, with a particular concentration in Europe, Asia-Pacific and South America (about 80% of the total points of sale). The degree of affiliation varies according to the market and the very presence of Pirelli, ranging from a softer loyalty (fidelity Club), which has as main objective for Pirelli territorial coverage and for the dealer sales support; to franchise programmes, in which through the exclusive partnership there is strong focus on business development point of sale overall; up to the maximum degree of affiliation, represented by the presence of points of sale owned by Pirelli (311 points of sale worldwide). “Distributors” are partners who are fundamental to guaranteeing continuity in the supply of tyres to other specialised and non-specialised resellers. They do so by offering local delivery and distribution services throughout the entire territory. Customer Focus
Customer focus is a central element of the Group “Values and Ethical Code”, the “Quality Policy” and “Product Stewardship Policy” of Pirelli. These documents outline the company positioning and are therefore communicated to all employees in the local language and are available in many languages on the Pirelli website. Among the essential elements of the Pirelli approach, the following are highlighted:
• consideration of the impact of its actions and behaviour on the customer; • exploitation of every opportunity offered by doing business to satisfy the customer’s needs; • anticipation of customer needs; • safety, reliability, high performance of products and services offered, in accordance with local
regulations and the most advanced national and international applicable standards , as well as excellence of production systems and processes;
• information to customers and end users to guarantee an adequate understanding of the environmental impacts and the safety features of Pirelli products, as well as of the safest ways to usethem.
2016 ANNUAL REPORT
74
Pirelli also adopted a clear procedure to grant a feedback to any customer claim, which involves immediate intervention with respect to the interlocutor. The "General Purchase Conditions" applied by the Group companies conform to the principles mentioned above. Transparency in Communication to the Customer
In the context of advertising communication, Pirelli has defined a traceable and transparent process for all decisions relating to advertising campaigns and related media planning, both in the case of promotional activities managed centrally and locally with central supervision. In terms of production of advertising campaigns and media planning, Pirelli uses specific auditing and certification structures that place the Company at the highest levels in terms of transparency and traceability in its advertising investment strategies. The Pirelli Group endorses the IAB (Interactive Advertising Bureau) and is associated with the UPA (Associated Advertising Users), where it sits on the Steering Committee, among other things dedicating on-going commitment to support the Advertising Code of Corporate Governance of the association. Through the UPA, Pirelli is a member of the WFA (World Federation of Advertisers), which commits participating firms to pursue honest, truthful and fair competition and communication in compliance with the code of conduct and self-regulation which they adopt. Consumer protection is also guaranteed by the choice of suppliers in the communication sector (creative agencies, media centres, production companies) that in turn belong to business and professional associations governed by proper communication ethical codes. Compliance
Also in 2016: • no cases emerged of non-compliance with regulations or voluntary codes concerning marketing
activities, including advertising, promotion and sponsorship; • no significant final penalties were levied and/or paid relating to infringement of laws or
regulations, including those relating to the supply and use of the Group’s products and/or services;
• no cases emerged of non-compliance with regulations or voluntary codes concerning information and labelling of products/services;
• no cases of non-compliance with regulations or voluntary codes concerning health and safety impacts of products/services during their life cycle;
• there were no documented complaints concerning both violation of privacy and/or the loss of consumers’ data;
• there was no prohibition to sell any Pirelli product, and the sales of no product was challenged. Customer Information and Training
Pirelli provides information to customer-distributors and end customers on a continual basis. This information concerns both the product and related initiatives, and is disseminated in a variety of ways, including online communication, and is complemented by information distributed in hard copy format, as well as the range of off-line and online training activities.

2016 ANNUAL REPORT
75
In the general scenario in which online is confirmed to be a key touch point in the process of finding and buying tyres, the consolidation and growth of the Pirelli digital ecosystem continued in 2016, with an approach that sees us increasingly closer and more connected with the consumer. Mobile accesses is constantly increasing, reaching a global average of 39%, confirming the fact that consumers are increasingly more informed and seeking clear and immediate answers on the web. In this context, the role of customer services on digital platforms is crucial: the product catalogue, the dealer locator, the fitment chart are the most accessed from desktop and mobile devices. In 2016, Pirelli continued to inform its customers with a digital newsletter, Paddock News, whose main objective is to provide an additional means of communication and contact with the trade, and which consists of an international edition, coordinated centrally from headquarters, and local-language edition for each market in which Pirelli operates. Paddock News features a gallery of new products and news from the Company and its Business Units: Car, Motorcycle, Motorsport and Truck. In terms of paper publications, the company magazines “Pirelli World” and, for Brazil, “Giro”, continue to play a key role. As for online communication relating to industrial tyres, in 2016, wide coverage was given to the launch of the new Triathlon series through the Pirelli sites and the specialized digital press. The FleetApp has been improved, the application for transport professionals, available free of charge in Italian, English, Spanish, German and Turkish for Android and IOS, on Google Play and Apple Store. In just a few steps you can get all the information on the intended use, available sizes and labelling values, technical specifications, tread design and peculiarities of each tyre in the Pirelli range as well as the Formula range, for the transport of persons and/or goods. The application also includes an integrated simulation tool that measures the possible fuel savings through using tyres providing higher performance from an energy point of view. Numerous exhibitions, events and initiatives in which Pirelli took part in 2016 include:
• Reifen Essen 2016, the world's leading trade fair of the tyre industry, where Pirelli was present with a stand featuring tyres for car, motorcycle and truck;
• the launch of the new Triathlon series, event held at the original UNESCO site, a former industrial complex, Zollverein, near Essen with the participation of over 200 people including journalists, dealers and fleets from 12 countries, followed by wide coverage on specialized communication media;
• IBE 2016, International Bus Expo in Rimini, three days dedicated to bus transport (more than 4,500 companies in Italy alone), with the participation of nearly 7,000 professionals, where Pirelli was present with a stand dedicated to truck;
• Formula Truck 2016, Pirelli, sole sponsor for tyres, was the key player of the hit Brazilian motorsport event dedicated exclusively to truck racing: 10 locations from March to December involving fans, fleets and manufacturers of industrial vehicles.
The training of customers on the product even in 2016 was intense in all markets, both at the points of sale and at the Pirelli sites with visits to the factory, R&D laboratories, and simulations of tyre performance. More than 22,000 participations of dealers coming from the 33 main markets were registered for classroom training courses on Pirelli products, technology and tyre sales and visited the two plants in Settimo Torinese (Italy) and Izmit (Turkey) in addition to the circuit in Vizzola (Italy) and the R&D Center in Milan. Information and training are therefore conducted with a 360º approach.

2016 ANNUAL REPORT
76
During the year, the complete revamping was launched of the online training platform Tyre-Campus “The road to Success”, which now covers 23 markets in 16 different languages. The first evolution of the platform concerned the transformation from desktop site to mobile site with the clear goal of reaching, even better, all the players of the tyre distribution chain, including employees of the points of sale. Product training is provided in an engaging and customized way on the various types of distribution channel, however maintaining a homogeneous approach; thus, no longer a single path that leads to the final objective of certification, but several paths linked to individual product families. Pirelli also continues to certify all its dealers who complete the product training successfully. The certified dealer status is then indicated in the dealer locator on a plaque placed at the point of sale. This way, consumers can recognize which dealers are the most specialized and qualified on the technical features and benefits of all the products of the Pirelli range. The dissemination project of the new platform is well advanced; in 2017, it is expected to complete its customization on the various markets based on the distribution channels and extension to other markets, introducing new technical and commercial topics. In order to support the product trainers, a library of technical content was developed for classroom courses and the instrument “Tyre Campus Houses”, which aims to concretely demonstrate the characteristics of Pirelli tyres, the raw materials used for their manufacturing and the differences between the different tread. With these tools, Pirelli trainers around the world have concrete and innovative support that allows customers to personally understand and verify the key characteristics and advanced technology of Pirelli products. Listening And Exchanging Ideas As Sources For Continuous Improvement Customer relationships are managed by Pirelli principally through two channels:
• the local sales organization, which has direct contact with the customer network and which, thanks to advanced information management systems, is able to process and respond to all information requirements of the interlocutor on site. From May 2015 to February 2016, the sales structure (of the 10 main countries) was subject to an assessment of product and sales experts; at the end of this process and thanks to the results of the assessment, the entire educational offer of the Commercial Academy was redeveloped (one of the 10 company Academies) dedicated to the sales force and a training plan was planned for all countries;
• the Pirelli Tyre Contact Centers, 32 worldwide with more than 150 employees, performing business operations in IT support and order management (inbound), telemarketing and teleselling (outbound).
In 2016, all the major social media channels of Pirelli have seen a significant increase in the fan-base. Pirelli's presence on Facebook has reached over 1.9 million followers, with a growth of 23% over the previous year. Also on Twitter, the Pirelli accounts have seen an increase in followers, reaching more than 213,000 people, over 33% more than 2015. A very important step forward was on Instagram, where Pirelli channels reach more than 262,000 followers, an increase, year-on-year, of 118%. Finally, Pirelli has more than 10,000 followers on the leading online video platform, YouTube. The year 2016 was also the year of the www.pirelli.com website, the digital Pirelli magazine launched in late 2015. On the new digital communication platform, Pirelli has published more than 500 articles - regarding product, motorsport, culture and sustainability - accompanied by more than 80 videos, with more than 3.3 million visits and about 2.5 million unique users, of which more than half through social
2016 ANNUAL REPORT
77
networks. Results achieved thanks to the full integration of the publishing plans of the digital magazine and social media channels. As for the Motorcycle Business Unit, we reserve a mention for the digital projects of the Metzeler and Pirelli brands. For Metzeler, in addition to the web page present in 10 Countries worldwide, a page dedicated to bikers has been active on Facebook since 2012, with 270,000 fans and content posted in 14 different Countries in the relevant local languages. There has been very positive feedback, over the years, from the activation of the Metzeler Maps, the Ridexperience blog and “Answers” feature that involves the users on the site. To maintain relations with consumers, the channel @metzelermoto on Twitter and Youtube was also created some time ago. For the Pirelli Moto brand, a presence on Facebook is important, with more than 600,000 fans connected and content posted in many Countries in the world, and special attention is dedicated to Asian Countries where Pirelli is developing its social media presence. The Diablo Super Biker mobile application is also of great importance, currently accounting for more than 350,000 downloads, and is greatly appreciated by the biker community. In 2016, a very important update was launched, which guarantees greater precision in calculating data thanks to new algorithms, detection of weather and road surface conditions, direct links to social media and the possibility of sharing sessions.The CRM project occupies a priority position in the Motorcycle Business Unit, considering the biker community as a group of product enthusiasts. Also in 2016, the end customer direct listening activity was performed through the Brand Tracking survey in the Top Ten Markets of Pirelli (Italy, Germany, Spain, France, United Kingdom, Brazil, China, United States, Turkey and Russia). The on-going changes made to this study over the years have made it possible to refine and improve the precision of business insights into the brand role, image profile and characteristics of the different touch points that influence the end customer’s purchase decision. Pirelli also monitors its competitive position and its brand image among end users through the detection of Key Performance Indicators (KPI) such as Top of Mind, Brand Awareness and Brand Consideration. The 2016 survey confirmed the position of Pirelli as one of the top two best recognised tyre brands in Italy, Germany, Spain and the United Kingdom. In Italy, Pirelli has also confirmed its leadership in terms of Brand Consideration. Performance in terms of Brand Consideration improved in Germany, where Pirelli earned two positions in the ranking (from sixth to fourth place) and in France, where Pirelli went up from fifth to third place. Second place was confirmed in the ranking in Spain and third in the UK. Outside Europe, Pirelli in Brazil was confirmed in first place for each brand KPI; in China, it was confirmed in third place as the best-known brand and in second place as a brand considered for purchase; in the USA, there were significant increases in both Top of Mind and Brand Consideration for Pirelli; Russia recorded increasing values of brand awareness, which consolidate Pirelli’s position in fourth place. In general in all the countries, performance is even more positive in the key target premium, with values of all the indicators higher compared to the more general target of car owners: in particular in 2016, this target had significant increases of Top of Mind in China and the USA and Brand Awareness in China, the USA and Russia. There are two reference documents for brand positioning. One is the Brand Pyramid, which summarises the values, personality and distinctive features of the Brand. The other is the Brand Key, a work scheme created with the aim of giving unity to product communication in terms of emotional benefits, functional benefits, reason to believe, differential elements, target of reference.
2016 ANNUAL REPORT
78
In 2016, the Tyre Talk project also continued: a listening project for trade customers, truly innovative for the tyre industry, based on an innovative web-based research platform, which can now count on the participation of more than 1,000 members in five markets that form a select panel of partners-customers, able to contribute to the understanding of the market dynamics, the development of new marketing levers and business opportunities. Through constant search, contact and collection of feedback which includes the innovative and transparent involvement of customers in various types of surveys and online forums, studies are conducted on various marketing issues such as: the launch of new products, the management promotional activities or materials at points of sale, the management of F1-related activities, the evaluation of the Pirelli B2B portal and the knowledge of approved tyres. The key issue is to collect the opinion of customers on the behaviour of end consumers, not only at the points of sale, but also in relation to the purchase process, the perception of the brand and product, the use of the labels introduced by the new European legislation, service expectations related to tyre change. In 2016, timely surveys conducted through Tyre Talk allowed promoting targeted action plans to improve the perception of customers regarding the performance of Pirelli in the areas: Product, Marketing, Quality, Sales & Marketing and Customer Service. Quality and Product Certification
ISO 9001: since 1970, the Group has had its own Quality Management System introduced gradually at all production centres and, since 1993, Pirelli has obtained certification of its quality system under the ISO 9001 standard. Today, 100% of Pirelli facilities are certified with ISO 9001:2008, including the logistics hub in Manresa, Spain and the Plant in Jiaozuo, China, acquired in 2016. ISO/TS 16949: In 1999, the Group obtained certification for its Quality Management System in compliance with ISO/TS 16949 and it has since maintained compliance with the standard as currently applicable. All plants, whether new or acquired, that are suppliers of the automotive sector have obtained or continue to maintain this quality certification. ISO/IEC 17025: Since 1993 the Materials and Experimentation Laboratory of the Group and since 1996 the Experimentation Laboratory of Pirelli Pneus (Latin America) hold the Quality Management System, and have been accredited under the ISO/IEC 17025 standard. This system is maintained in accordance with the standard in force and the ability of the laboratories to perform accredited tests is evaluated annually. The labs participate in proficiency tests organised by the International Standard Organisation, by ETRTO or by international circuits organised by auto manufacturers. Specifically in regard to car tyres, the focus on quality is confirmed by Pirelli’s supremacy in numerous product tests. It is also guaranteed by its collaboration on product development and experimentation with the most prestigious partners (auto manufacturers, specialised magazines, driving schools, etc.). The Product Certifications, which allow the commercialization of the products in the various markets in accordance with the regulations laid down by the different countries, are regularly managed by a department dedicated to the area of Research & Development. The main Certifications secured by the Pirelli Group concern the markets of EMEA (Europe, Middle East and Africa), NAFTA (North America Free Trade Agreement), Brazil, Argentina, Uruguay, China, Taiwan, India, Indonesia and South Korea and involve all Pirelli plants. These certifications call for annual audits by ministerial bodies of the countries in question or organisations delegated by them, which verify the compliance of the product at the certified plant.

2016 ANNUAL REPORT
79
Focus On Human Health And The Environment In 2016, the evaluation continued of new raw materials and new auxiliary products prior to their use by the operating units of the Group, in order to identify potentially unacceptable critical issues for human health and/or the environment. The assessment is performed on a centralised basis and the results are extended to all Countries where Pirelli operates, taking account not only of the requirements imposed by European regulations concerning the management of hazardous substances, but also standards and know-how currently available internationally (specifications, databases, etc.), thereby fully implementing the Company’s “Health, Safety and Environment Policy” related provisions. The monitoring also continued of manufacturers and suppliers of raw materials used by the Group worldwide, especially regarding the registration process of these substances, in compliance with the specific provisions of Regulation (EC) no. 1907/2006, also known as “REACH Regulation”. Product Safety, Performance And Eco-Sustainability
The commitment to the development of products that are increasingly focused on combining eco-sustainability and safety has led to renewal of the product lines. Compared with the previous generation, this guarantees the use of increasingly innovative materials and significant reductions in parameters like rolling resistance, as well as further braking performance on surfaces with low grip. In 2016, the commercial offer for the Car, SUV and Van segment recorded a further improvement in the average level of grading related to performance thanks to the use of increasingly innovative materials designed to reduce rolling resistance, and thus reduce CO2 emissions, while allowing a more and more effective wet braking, substantially contributing to road safety. In addition, new tread pattern solutions have led to a marked reduction in noise of the Pirelli range. In April 2016, the new P Zero was launched, the first UHP product with a range covering all Pirelli technologies, from PNCS to control the noise inside the passenger compartment, to those of extended mobility such as the Run flat and the Seal Inside, which play a key role for driving safety thanks to the possibility to continue driving even after a puncture, allowing to avoid risky stops for a possible tyre change besides avoiding potentially dangerous situations due to a rapid deflation of the tyre. Compared to the previous generation of P Zero, the use of new materials and compounds has allowed a marked improvement in the performance of rolling resistance and fuel consumption efficiency. In June 2016, the Cinturato Winter was introduced in the European market, developed to guarantee excellent levels of safety in any winter condition. The tyre is equipped with a "talking" indicator on the tread that warns the consumer when it is necessary to change the winter tyres to maintain optimal performance on snow. In addition, the 4D layer system allows maximum grip on snow, while the design of the recesses allows the best performance in aquaplaning in the interest of safe driving on wet roads. Finally, an optimized pitch sequence allows the reduction of noise: therefore, lower environmental impact and better driving comfort. The year 2016 was also the year of the introduction of an all-season tyre in the Carrier range, dedicated to light commercial vehicles. The Carrier All Season, compared to its predecessor, recorded a 10% improvement in safety performance related to wet braking and aquaplaning. Furthermore, the change in the compound and tread pattern has guaranteed an improvement in mileage duration performance and a consequent reduction in rolling resistance.

2016 ANNUAL REPORT
80
Finally, the new Cinturato P6, dedicated to the Asia Pacific market, was developed to meet the needs of Asian consumers in terms of safety on both wet and dry roads, comfort and fuel consumption. The tread pattern designed for a better distribution of pressure, allows a reduction in rolling resistance, while the square footprint allows excellent braking performance on dry. The same approach in terms of performance for people and for the environment characterizes the products for industrial vehicles, such as the tyres of the Series:01, that combines energy efficiency - and thus, the containment of fuel consumption and related CO2 emissions - to maximum performance in terms of grip on wet roads. In particular, in 2016 an innovative design and the use of new materials have made it possible to produce increasingly more performing tyres in terms of balance between rolling resistance and duration of use of the tyre in the first life, and retreadability of the tyre for subsequent use, with the obvious environmental benefits of using less resources. The apex of this development is reflected in the new Triathlon line, whose products are also excellent in terms of road safety, as evidenced by the 3PMSF marking on the side of the product, signifying high grip capacity in winter use. The expansion of the range has also continued, as part of freight transport, of tyres: 01 XL which, thanks to the increased load index, can rely on greater resistance and integrity even in the event of heavy use. Road Safety Culture and International Initiatives
International initiatives and commitments are discussed in the paragraphs “Corporate Initiatives for the
External Community”.
2016 ANNUAL REPORT
81
OUR SUPPLIERS
As is set forth in the “Values and Ethical Code” of Pirelli, suppliers and external collaborators play a fundamental role in improving the overall competitiveness of the Company. While seeking the keenest competitive edge, the Group bases its relations with suppliers and external workers on fairness, impartiality, and ensuring equal opportunities for all parties concerned. In its turn, the “Social Responsibility Policy for Occupational Health, Safety and Rights and Environment” specifies that the sustainable development strategies of the Group require, among other things, a commitment to continuous improvement in issues of the environment, health and safety at work connected with its activities, firmly abiding and supporting the content of the Declaration of Universal Human Rights, the Declaration of the International Labour Organisation on Fundamental Principles and Rights at Work, the Rio Declaration on the Environment and Development and the United Nations Convention against Corruption. Likewise, the Policy lays down that Pirelli is committed to establishing and maintaining active the procedures necessary for assessing and selecting suppliers and sub-suppliers on the basis of their level of social and environmental responsibility. The sustainable management of the supply chain is also the subject of the “Green Sourcing Policy” and an integral part of the “Health, Safety and Environment Policy”, the “Global Human Rights Policy”, the “Quality Policy” and “Product Stewardship Policy” of the Group. The Policies mentioned are available in various languages on the Pirelli website, Sustainability Section, to which reference is made for full details. Supply Chain Sustainable Management System
Procurement processes and partnership relations with suppliers are guided by Pirelli Purchasing Department and by specialists present in the various affiliates worldwide. Responsible management that is integrated in economic, social, environmental and governance terms characterises the relations between Pirelli and its suppliers. The “quality” of companies that provide goods and services is also a fundamental element in realising the Pirelli premium strategy. The Pirelli supply chain Sustainable Management System was audited by an independent third party in accordance with the AA1000 Assurance Standard (2008) since 2011 (as documented in the assurance statements accompanying the Sustainability Reports for 2011, 2013, 2014 and 2015). The social, environmental and business ethics responsibilities of a Pirelli supplier are assessed together with the economic and product or service quality to be supplied, right from the selection as potential supplier. Analysis of ESG performance (Environment, Social Governance) continues through the qualification stage and then is “contractualised” though the Sustainability and business ethics Clauses included in every contract/purchasing order. Verification of the supplier’s sustainability performance at the post-contract stage is achieved through independent third-party audits. The aforementioned Management Model and the related documentation are available on the institutional Pirelli website, in the “Suppliers Area” (Pirelli.com/suppliers) section, dedicated to the world of supply and accessible to current and potential Pirelli suppliers, as well as anyone with an interest in knowing the approach and procedures adopted by the Company in the areas of purchases of good and service around the world. The communication channel is aimed at the utmost clarity and sharing of Values, Guidelines, documentation and standards adopted by the Company in relations with suppliers.

2016 ANNUAL REPORT
82
The ESG Elements analysed during the selection and qualification phases
Pirelli uses the same ESG performance approach throughout the entire process of interactions with a supplier, although in different ways among them, consistently with the intensity of the interactions characterising the specific procedural steps. During a first phase of selection (or scouting), and thus assessment of possible offers for good or services in the marketplace, a buyer who has been adequately trained is able to gain a first impression of the supplier possible abidance or not by the Pirelli ESG and product/service requirements. This allows the Company to identify and delete from the list of potential suppliers those who are in a clear possible breach of Pirelli expectations. Pirelli asks suppliers who gain access to the qualification (or on-boarding) phase to use the portal available in local language. By accessing it, the supplier views and simultaneously accepts Pirelli's requests in terms of economic, social, environment and business ethics responsibilities (in case of non-acceptance, the qualification process cannot initiate), to then proceed to fill in a questionnaire concerning respect for fundamental Human and Labour Rights, considered key by the Company such that the absence of just one of them will not allow the continuation of the qualification process. These questions require the potential supplier to attest that its company: checks workers’ ages before hiring them and ascertains that all of its employees satisfy the minimum legal working age; employs workers provided with a written labour contract and who work on a voluntary basis exclusively; abides by workers’ rights of freedom of association and participation in trade-union activities; pays wages that meet at least the minimum legal standards; manages disciplinary practices, if any, abiding by the law; abides by and applies legislative/contract provisions in the matter of work schedules, overtime and rest periods. The process continues with the request to include quality, environmental and health and safety certifications; to document their approach to responsible management by attaching their Policies and Codes; to provide data in respect of the rate of accidents at work; to attest to compliance with labour laws as set forth above and a litigation there may be. Information is also requested relating to loss prevention, key elements not only to prevent future cases of "business interruption", but also closely related to the safety of workers employed at the supplier's site. For all potential new suppliers and/or plants of raw material, which by their nature can become long-term partners of the Company, and which are also attributed much of the spending of purchases, Pirelli conducts a third-party preliminary on-site audit during the qualification phase (which in the case of raw materials is called "approval") to verify the level of compliance of the potential supplier with respect to the principal national and international regulations on issues related to Labour, Environment and Business Ethics. The non-acceptance of the audit and/or not signing a recovery plan aimed at eliminating the non-compliances shall block the supplier's approval. With regard to the contractual stage, from 2008 the Sustainability and Business Ethics Clauses (including anti-corruption) have been systematically included in contracts and orders for the purchase of goods and/or services and/or works, both with private suppliers and with the Public Administration (or institutes/enterprises under public control) or NGOs, worldwide. In particular, the clauses;
• require awareness on the part of suppliers of the principles, commitments and values contained in Pirelli’s Sustainability documents, being “Values and the Ethical Code”; the Code of Conduct” (including anti-corruption) and the “Social Responsibility Policy for Occupational
2016 ANNUAL REPORT
83
Health, Safety and Rights, and Environment” published and accessible on the web and which ratify the principles to which the management of Pirelli activities with third parties conform to, disciplined or not by contract;
• require that Suppliers confirm their commitment to: o not using or supporting the use of child labour and forced labour; o ensuring equal opportunity, freedom of association and promotion of the development of
each individual; o opposing the use of corporal punishment, mental or physical coercion, or verbal abuse; o complying with the laws and industry standards concerning working hours and ensuring
that wages are sufficient to cover the basic needs of personnel; o not tolerating any type of bribery and corruption in any form or manner and in any legal
jurisdiction, even where such practices are effectively permitted, tolerated, or not subject to prosecution;
o assess and reduce the environmental impact of its own products and services throughout their entire life cycle;
o using resources responsibly with the aim of achieving sustainable development in compliance with the principles of respect for the environment and the rights of future generations;
o establishing and maintaining the necessary procedures to evaluate and select suppliers and sub-suppliers on the basis of their commitments to social and environmental responsibility, and overseeing, on a regular basis, their compliance with these obligations;
• specify that Pirelli reserves the right to verify at any time through activities of audit, either directly or through third parties, the fulfilment of the obligations assumed by a supplier (see further details in the next paragraph).
The Sustainability Clauses have been translated into 24 languages so as to ensure maximum clarity and transparency towards suppliers on the contract duties that they assume, not only in respect of the Company itself, but also at their own site in relations with their own suppliers. From the standpoint of utmost assurance suppliers of the Pirelli Group have available the Whistleblowing Reporting Procedure ([email protected]), which has been indicated expressly in the clauses and by means of which any breach or suspected breach they discern in relations with Pirelli referring to the contents of the “Values and Ethical Code”, “Code of Conduct (anti-corruption) and “Social Responsibility Policy for Occupational Health, Safety and Rights, and Environment” of the Group can be reported in total confidentiality. In 2016, among the whistleblowing reports received, three involved Suppliers: one related to a late payment, founded, and which was followed by action to the satisfaction of the reporting Supplier; a second one related to the non-payment of dues for the services challenged with the supplier, partially confirmed and therefore, as a result of the involvement of the competent corporate functions, steps were taken for supplier settlement, and a third concerning an alleged conflict of interest by an employee in relation to the management of a supplier, for which the verifications carried out did not show elements in support of the cases challenged. It is objectively impossible to confirm that there were, in absolute terms, no further reports from other suppliers received as a number of reports were anonymous, as is specified in the paragraph “Reporting Procedure – Whistleblowing”, to which reference is made for further details.
2016 ANNUAL REPORT
84
In addition, each purchase contract gives the name of the contact buyer so that the counterparty always has access to a company channel to use to transmit any feedback. According to the matter concerned, the buyer will then address the issue to the correct person/function who can deal with it. Focus: “Green Sourcing” Policy
As at December 2012 Pirelli drafted and issued the “Green Sourcing” Policy with the aim of stimulating and incentivising an environmental conscience along the entire supply chain and encouraging choices that might reduce the impact on the environment of procurement activity of goods and services by Pirelli. The Green Sourcing Policy implementation system inside Pirelli and in supplier relationships was defined in 2013 and includes:
• the Pirelli Green Sourcing Manual, an internal document containing operational Guidelines aimed at directing the activities of Pirelli’s functions involved in the process of Green Sourcing;
• the Pirelli Green Purchasing Guidelines, a document intended for Pirelli suppliers as part of the Contract for supply and based on the Green Sourcing Manual, containing the KPIs (Key Performance Indicators) for assessing the Green Performance of these suppliers;
• integration of Green Performance in the traditional process of measuring supplier performance (vendor rating).
The Pirelli Green Sourcing Manual defines four areas of Green Sourcing: Materials, Capex, Opex and Logistics. Interdepartmental working groups, comprised of Purchasing, R&D, Quality, HSE and Sustainability analysed the Green Sourcing process associated with the product categories falling within the four areas mentioned above. Green Engineering Guidelines were also defined for the Materials and Capex areas, where the design component (that is conceived in-house) is material to the Pirelli core business. For the Opex and Logistic areas characterised by goods categories in respect of which the design component is not equally significant, Green Operating Guidelines have been defined by referring to internationally recognised best practices. So, the Green Sourcing Manual is a unique document that contains:
• the general part on Green Sourcing issues; • the Green Engineering Guidelines (Materials, Capex); • the Green Operating Guidelines (Opex, Logistics).
The Green Sourcing Manual will also be adopted by the Pirelli Training Academy for training purposes by the functions involved in the process of Green Sourcing. Since 2014, and on the basis of the Guidelines of the Green Sourcing Manual, the Pirelli Green Purchasing Guidelines were published on the website www.pirelli.com, so making them available both to Pirelli suppliers and to other stakeholders. In China, Mexico, United States, Russia and Italy, by-invitation seminars have been held at Pirelli offices on the Green Sourcing Guidelines for local suppliers so as to inform and receive direct feedback on the way they work. Additionally, in 2015 Pirelli developed an IT platform to support the launch of a campaign the measure the Green Performance of Pirelli Suppliers through an electronic questionnaire to be filled out online, a campaign implemented in April 2016. Pirelli shared its “Green” approach at the Future Tire Conference 2016 (24-25 May 2016) Essen, Germany during the “Future Factories and Supply Chain Forum” session with a presentation titled “Green sourcing in the tire supply chain”. On this occasion, an "Overview" of the Green Survey was also presented that showed particularly high participation by Raw Material Suppliers (Response Rate of
2016 ANNUAL REPORT
85
77%) justified by the activities of "engagement" of such Suppliers by R&D, Quality and Sustainability, actively involved in the supply chain and innovation of the tyre. Focus: Policy On Conflict Minerals
The concept of Conflict Minerals was introduced by Section 1502 of the Dodd-Frank Act, a federal United Sates law, in 2010. The term “conflict minerals” refers to gold, columbite-tantalite (coltan) cassiterite, wolframite and their derivates like tantalum, tin and tungsten that come from (or are extracted in) the Democratic Republic of Congo and/or bordering Countries. The objective of the rules in respect of Conflict Minerals (Conflict Mineral Rules) is to discourage the use of minerals whose sale might finance violent conflicts in Central Africa where grave violations of human rights have been recorded for many years. Under Conflict Mineral Rules, listed companies in the United States are required to perform reasonable due diligence in tracing the provenance of these materials, reporting the findings to the SEC and publishing them on their website, with the first report to be published by 31 May 2014 (in respect of 2013) and updated subsequently each year. In turn, in November 2016, the European institutions reached an agreement on the final text of the "regulation establishing a European system of self-certification of the exercise of due diligence in the supply chain for responsible importers of tin, tungsten, tantalum, their minerals and gold, originating from areas of conflict and at high-risk". The regulation introduces a system of due diligence that is obligatory for the upstream part of the supply chain (with some exceptions) and voluntary for the downstream part. The new provisions will apply from January 2021. Pirelli expresses its position on the management of the issue in a dedicated paragraph in its “Global Human Rights Policy”, where it is stated that the Company “requires that its suppliers conduct proper due diligence within their supply chain in order to certify that the products and materials supplied to Pirelli are "conflict free" throughout the whole supply chain (i.e. not coming from mines or smelters operating in conflict zones identified as such in the relevant conflict minerals regulations, unless they are certified as “conflict free”). Pirelli reserves the right to terminate relations with suppliers in cases where there is clear evidence of supplying conflict minerals and however in case of any violation of Human Rights”. The Policy is published in multiple foreign languages in the Sustainability section of the pirelli.com website. To give an idea of the scale of the phenomenon for Pirelli, it is worthwhile stating that the impact is very limited: the volume of minerals (3T+G) used by Pirelli Tyre in one year in fact weighs less than a ton, a quantity amounting to approximately one millionth of the volume of raw materials used annually by the Company and which is equally distributed among most of the tyres produced. To give an example, a tyre weighing 10 kg contains about 10 mg (milligrams) equivalent of tin, in the extremely low concentration of 1ppm (one part per million). With a view to procurement covering only minerals that are "conflict free", Pirelli has conducted a comprehensive investigation on its supply chain, in order to have full visibility up to the mines or foundries in order to identify the existence of any "conflict minerals". The Company has asked its suppliers to complete the CFSI-CMRT (Conflict-Free Sourcing Initiative – Conflict Minerals Reporting Template), developed by EICC (Electronic Industry Citizenship Coalition) and GeSI (Global e-Sustainability Initiative). The suppliers polled cover 100% of the “conflict minerals” risk tied to Group products. More than 90% of suppliers polled have already given precise indications concerning the source of the materials in question and listing foundries as required by the procedure and there was no evidence of the presence of
2016 ANNUAL REPORT
86
conflict minerals. At the end of 2016, a minimum number of suppliers, corresponding to 0.01% of spending of Pirelli purchasing, are still investigating their chain. Monitoring of ESG Performance
Supplier performance is monitored by using the Vendor Rating system, aimed at defining the quality level of supplies, the quality of the commercial relationship, the technical-scientific collaboration and, through on-site audits by third parties, verifying performance in relation to human and labour rights, health and safety, environmental management and business ethics, followed by the periodic monitoring of the progress of the actions set down in the recovery plans signed with the supplier. The Vendor Rating and monitoring of sustainability of suppliers cover all the goods and services from all the geographical purchasing areas and is an integral part of commercial negotiations. The results of the Audits are analyzed by the Purchasing Department and the Sustainability and Risk Governance Department, commented and discussed to identify eventual corrective actions or to improve performance along with suppliers. At methodological level, the Purchasing Department and the Sustainability and Risk Governance Department of the Group define the Guidelines for the selection of suppliers to be audited, supporting the Purchasing Managers and Sustainability Managers that locally coordinate the auditing activities. Since 2009, in fact, Buyers and local Sustainability Mangers are asked to identify a roster of suppliers who, on the basis of the findings of proper Risk Assessment, they feel to be worthwhile to be audited by third party at the time of the Annual Audit Campaign. The risk assessment and thus the “criticality” of suppliers envisage an assessment based on the following guiding parameters:
• the supplier is bound to Pirelli by multi-year contracts; • the replacement of the supplier may be complex; • the economic burden of the purchase is significant and for this reason an on-site verification of
the supplier’s compliance with Pirelli ESG expectations, signed at the contract stage, is advised, via third party audit commissioned by Pirelli;
• the supplier operates in a Country at ESG risk; • the supplier has not yet undergone an ESG audit by Pirelli or special criticalities have been
detected in previous audits; • there is information, a perception or doubt concerning possible breaches on the part of the
supplier in the matter of social, environmental and/or business ethics responsibilities. The external auditors carry out verification on the basis of a checklist of parameters of sustainability deriving from the Pirelli Ethical Code, the SA8000® standard (a tool of reference officially adopted by the Group for managing social responsibility since 2004) and the “Social Responsibility Policy for Occupational Health, Safety and Rights, and Environment” (in its turn consistently with the areas of social, environmental and governance sustainability dictated by Global Compact of the United Nations). Third-party audits, each of which lasting on average 2 days in the field, include interviews with workers, management and trade union representatives. Between the end of 2009 and the start of 2010, 72 audits were carried out; between the end of 2010 and the start of 2011, a further 56 were done; in the second half of 2012, 62 new audits were commenced on suppliers of raw materials, machinery, logistics and services which concluded in 2013. In 2014, 78 audits were performed and in 2015 a further 93 audits were begun on suppliers in all the categories mentioned, including potential suppliers of raw materials, to continue with 64 new audits in 2016 (of
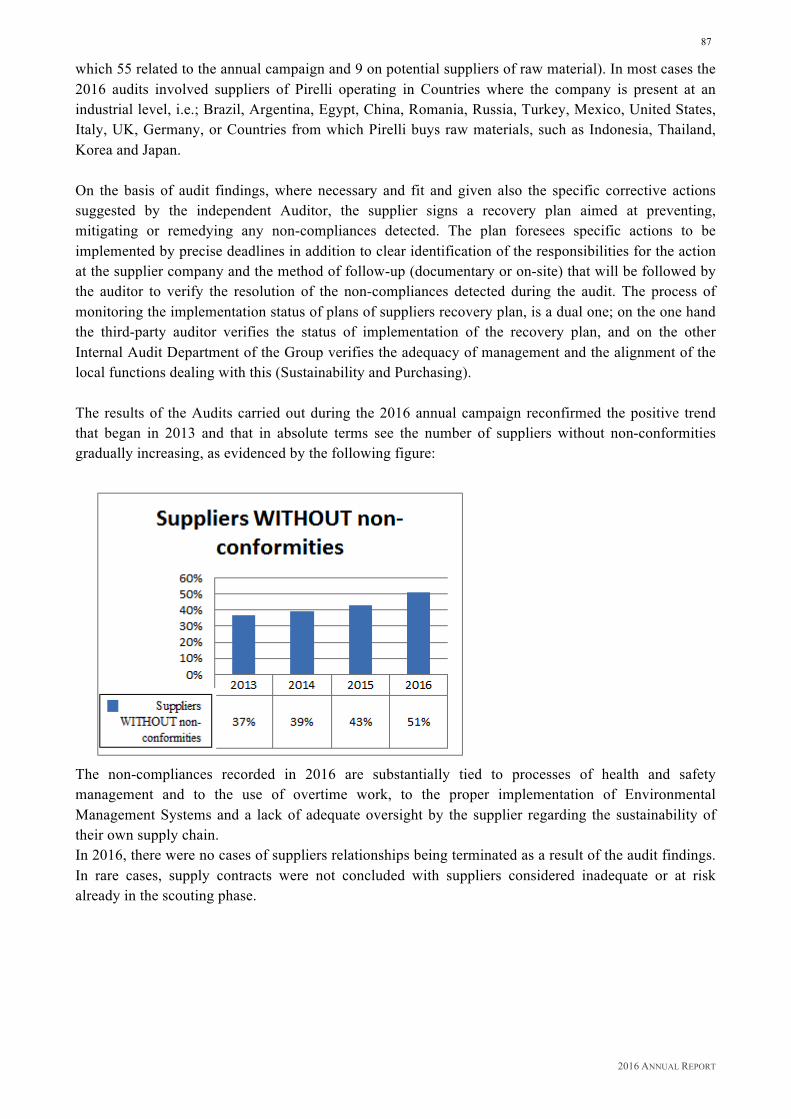
2016 ANNUAL REPORT
87
which 55 related to the annual campaign and 9 on potential suppliers of raw material). In most cases the 2016 audits involved suppliers of Pirelli operating in Countries where the company is present at an industrial level, i.e.; Brazil, Argentina, Egypt, China, Romania, Russia, Turkey, Mexico, United States, Italy, UK, Germany, or Countries from which Pirelli buys raw materials, such as Indonesia, Thailand, Korea and Japan. On the basis of audit findings, where necessary and fit and given also the specific corrective actions suggested by the independent Auditor, the supplier signs a recovery plan aimed at preventing, mitigating or remedying any non-compliances detected. The plan foresees specific actions to be implemented by precise deadlines in addition to clear identification of the responsibilities for the action at the supplier company and the method of follow-up (documentary or on-site) that will be followed by the auditor to verify the resolution of the non-compliances detected during the audit. The process of monitoring the implementation status of plans of suppliers recovery plan, is a dual one; on the one hand the third-party auditor verifies the status of implementation of the recovery plan, and on the other Internal Audit Department of the Group verifies the adequacy of management and the alignment of the local functions dealing with this (Sustainability and Purchasing). The results of the Audits carried out during the 2016 annual campaign reconfirmed the positive trend that began in 2013 and that in absolute terms see the number of suppliers without non-conformities gradually increasing, as evidenced by the following figure:
The non-compliances recorded in 2016 are substantially tied to processes of health and safety management and to the use of overtime work, to the proper implementation of Environmental Management Systems and a lack of adequate oversight by the supplier regarding the sustainability of their own supply chain. In 2016, there were no cases of suppliers relationships being terminated as a result of the audit findings. In rare cases, supply contracts were not concluded with suppliers considered inadequate or at risk already in the scouting phase.
2016 ANNUAL REPORT
88
Materiality of ESG Impacts Along the Supply Chain
The environmental impacts of the supply chain are prevalent in the category of raw materials, in terms of their impact on emissions and performance of the Pirelli product, and in the use of water in natural rubber transformation processes. Downstream of the natural rubber supply chain is also the risk of deforestation and damage to biodiversity. Social impacts (related to human and labour rights in particular) are evidenced, on the other hand, in all categories of purchases with reference to suppliers operating in Countries considered at a higher risk from the standpoint of compliance with domestic and international labour legislation. Engagement and Sustainability
Pirelli believes that activities involving suppliers are essential in creating environmental and social value, and that are inseparably tied to the creation of shared economic value. There are several activities operated by the Company to that effect. R&D Partnerships
Pirelli has established several partnerships with strategic suppliers and universities for the development of innovative materials with low environmental impact (materials described in the paragraphs dedicated to environmental management of products of this report). As part of the development activities of new nano-fillers, for example, pursued since the early 2000s through research contracts with universities in collaboration with suppliers, Pirelli has started to industrially introduce materials of mineral origin in partial replacement of precipitated Silica and Carbon Black. Compared to the production processes of the replaced raw materials, the mentioned innovations have granted water savings and more than 75% reduction in CO2 emissions, saving in 2016 respectively 1,800 tons of CO2 (vs. 1,400 in 2015) and 10,000 tons of water (vs. 7,500 in 2015). This innovation includes economic benefits related directly to the material for about 150,000 euro, although the real sustainable business driver is the performance that the product acquires, thus becoming more competitive. Sustainability of the natural rubber chain
The economic, social and environmental sustainability of the natural rubber supply chain is among the priorities of Pirelli, with the full awareness that the origins of its rubber supply chain impact on forests. Pirelli has no plantations of natural rubber, which it buys from processors, which in turn only in a small number directly own plantations and generally purchase the materials from traders (Dealers) or directly from small plantations. This is a very complex supply chain, fragmented, where the supplying plantations are of minimum extension. Thus for Pirelli, the possibility of impacting this system can only go through the analysis of the context and the involvement and engagement of direct suppliers. In terms of analysis of the context, in 2016, Pirelli conducted third-party on-site audits on its direct suppliers, in order to evaluate the sustainable performance level at the processing sites, but also to understand the related direct/indirect control capabilities of their own supply chain up to identification of the supplying plantations. This mapping is a priority in order to plan the resources and operating procedures necessary to impact the origin of the chain. Said analysis and mapping are an essential work base for 2017 in terms of engagement across the entire chain. A virtuous example of engagement is the partnership that has tied Pirelli to Kirana Megatara since 2014. Kirana Megatara is a large natural rubber processor in Indonesia, one of the leading suppliers of Pirelli
2016 ANNUAL REPORT
89
worldwide. The Project of Kirana and Pirelli aims to support local farmers through training on the most effective methods to improve the productivity of plantations and through scholarships for their children. Increasing the productivity of plantations is a key factor: it allows farmers to increase their income while decreasing the risk of deforestation resulting from the abandonment of unproductive plantations. Training on production quality, including the provision of controlled origin plants by agronomist specialists, takes place throughout the year at the farmers communities involved in the project, impacting, in a stable and continuous way about 100 farmers. Each year, Pirelli and Kirana Megatara organize an event called tapping competition, which sees the best "tappers" of the place in a friendly challenge on the best tapping methods in a day of celebration for the community that is also an important opportunity for training and spreading awareness among farmers present regarding the best growing and tapping techniques, necessary to obtain an increasingly purer product, free from contamination and therefore characterized by its high level of quality, necessary to increase the earnings of families and simultaneously reduce the impacts of deforestation. In the evening, the three best tappers are then chosen who, thanks to perfect carving, are awarded prizes for themselves and their families. Even in 2016, more than 270 farmers and their families attended the event, which was held in the south of the island of Sumatra. Although the focus on productivity remains essential for the competitiveness of the entire natural rubber sector in Indonesia, but is not enough. A truly sustainable future shall also count on proper training and development of new generations, and this can only be achieved through the education of local youngsters. For this reason, Pirelli and Kirana Megatara every year also grant scholarships to local farmers’ children, with the objective of trying to ensure adequate education. In 2016, a total of 65 scholarships were granted. CDP Supply Chain
For years, Pirelli has participated in Climate Change and Water programmes promoted by the Carbon Disclosure Project (CDP). Implementing its Green Sourcing Policy since 2014 Pirelli has decided to extend the request for CDP assessment to its own key suppliers at a Group level, identified in accordance with criteria of environmental and economic materiality. In 2016, the selection concerned the suppliers with the most material impact on the Carbon Footprint of the Group, in the Raw Materials and Energy supply categories. The CDP Supply Chain supports Pirelli in monitoring Scope 3 emissions from its supply chain and ensures adequate awareness of suppliers in terms of climate change so as to identify and activate all possible opportunities for reducing emissions of climate-altering gases. In 2016, Pirelli suppliers that responded to the assessment obtained an overall score higher than the global average of the panel of suppliers that responded to the CDP, and the analysis of the results showed that in 2016, thanks to the actions aimed at emissions reduction implemented by Pirelli’s suppliers, it was possible to globally avoid the emission of about 29 million tons of CO2 equivalent, which are associated with estimated cost savings of 162 million dollars. First company among tyre manufacturers to have globally introduced the CDP Supply Chain in its own supply chain, Pirelli intends to expand the number of suppliers involved in the programme to include other supply categories, and aims to increase the response rate Raw Materials suppliers of from 74% in 2016 to 90% in 2020.
2016 ANNUAL REPORT
90
Suppliers Sustainability training
Since 2012, Pirelli has provided training to its suppliers, identifying from year to year the reference participants based on strategic issues, spending value, operations of suppliers in countries considered at risk. In 2016, training was provided in e-learning mode to strategic industrial services suppliers.. The activity involved elements of labour law, human rights, respect for the environment and business ethics. The training involved 186 suppliers in China, England, Russia, Brazil, Venezuela, Argentina, Indonesia, Mexico, Egypt, Turkey, Italy, Romania, Germany and the United States of America. The tool used for training was a platform specifically developed for this purpose by the Pirelli Group. After receiving a personal ID and password, the supplier could connect with the online platform and participate in training activities at any time. The course included many practical examples and allowed participants to verify the levels of compliance by their own organisations with the various ESG elements.. In order to track both the clarity and the effectiveness of the training, a questionnaire was submitted to participants at the end of the training session. Supplier Award
The Pirelli Supplier Award, which is assigned each year to suppliers of excellence, aims to constantly improve relations with parties from the standpoint of shared development. The 2016 edition of the Supplier Award was held at the Pirelli headquarters in Bicocca (Milan) with the Pirelli CEO who gave the prizes to nine suppliers operating in Indonesia, Germany, Italy, China, India and the United States, which had distinguished themselves in quality, innovation, speed, sustainable performance, global presence, and level of assistance and service. A specific award was granted to sustainable performance so as to acknowledge those “responsibility” strategies that really make a difference, by bringing benefits to the entire value chain. In 2016, the Sustainability award was attributed to a raw material supplier able to significantly reduce the environmental impact of Pirelli tyres.
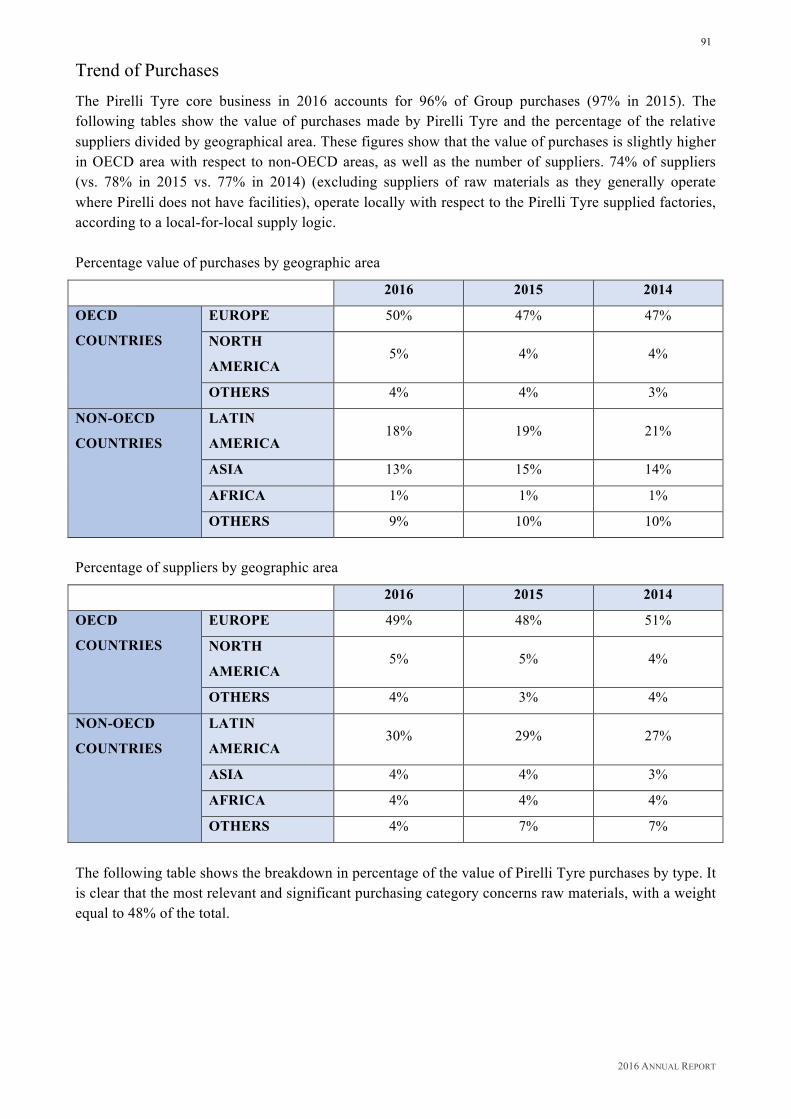
2016 ANNUAL REPORT
91
Trend of Purchases
The Pirelli Tyre core business in 2016 accounts for 96% of Group purchases (97% in 2015). The following tables show the value of purchases made by Pirelli Tyre and the percentage of the relative suppliers divided by geographical area. These figures show that the value of purchases is slightly higher in OECD area with respect to non-OECD areas, as well as the number of suppliers. 74% of suppliers (vs. 78% in 2015 vs. 77% in 2014) (excluding suppliers of raw materials as they generally operate where Pirelli does not have facilities), operate locally with respect to the Pirelli Tyre supplied factories, according to a local-for-local supply logic. Percentage value of purchases by geographic area
2016 2015 2014
OECD
COUNTRIES
EUROPE 50% 47% 47%
NORTH
AMERICA 5% 4% 4%
OTHERS 4% 4% 3%
NON-OECD
COUNTRIES
LATIN
AMERICA 18% 19% 21%
ASIA 13% 15% 14%
AFRICA 1% 1% 1%
OTHERS 9% 10% 10%
Percentage of suppliers by geographic area
2016 2015 2014
OECD
COUNTRIES
EUROPE 49% 48% 51%
NORTH
AMERICA 5% 5% 4%
OTHERS 4% 3% 4%
NON-OECD
COUNTRIES
LATIN
AMERICA 30% 29% 27%
ASIA 4% 4% 3%
AFRICA 4% 4% 4%
OTHERS 4% 7% 7%
The following table shows the breakdown in percentage of the value of Pirelli Tyre purchases by type. It is clear that the most relevant and significant purchasing category concerns raw materials, with a weight equal to 48% of the total.
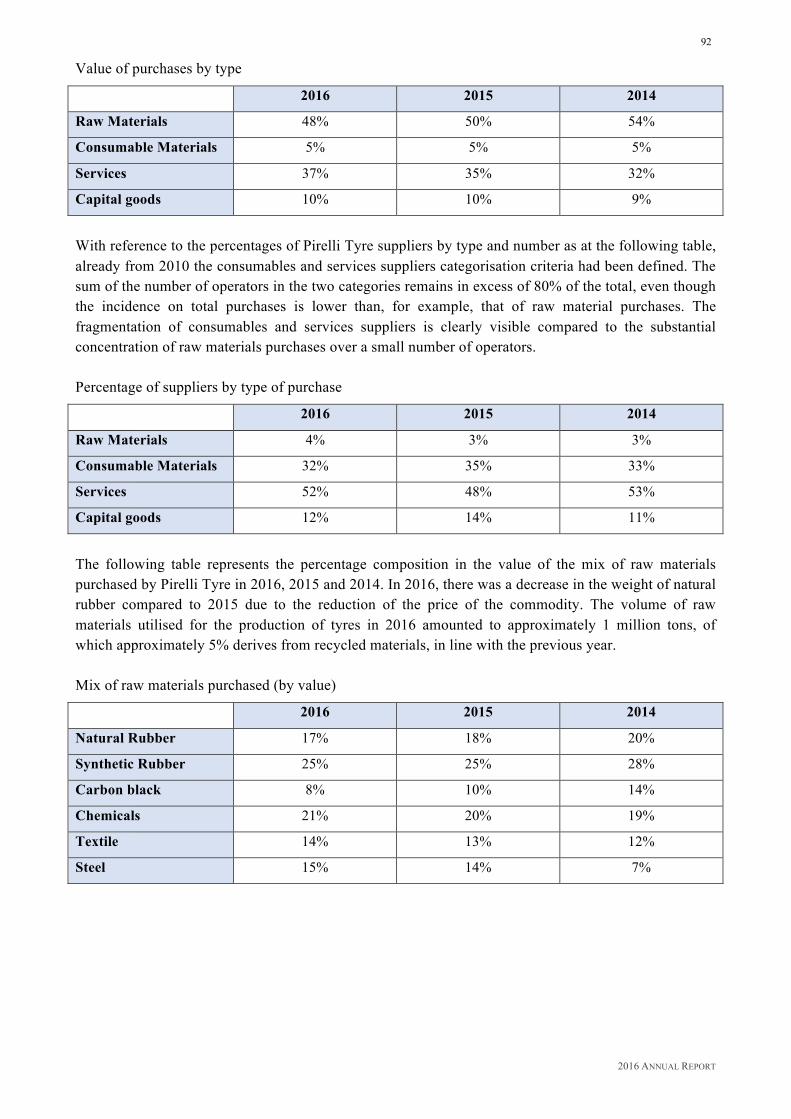
2016 ANNUAL REPORT
92
Value of purchases by type
2016 2015 2014
Raw Materials 48% 50% 54%
Consumable Materials 5% 5% 5%
Services 37% 35% 32%
Capital goods 10% 10% 9%
With reference to the percentages of Pirelli Tyre suppliers by type and number as at the following table, already from 2010 the consumables and services suppliers categorisation criteria had been defined. The sum of the number of operators in the two categories remains in excess of 80% of the total, even though the incidence on total purchases is lower than, for example, that of raw material purchases. The fragmentation of consumables and services suppliers is clearly visible compared to the substantial concentration of raw materials purchases over a small number of operators. Percentage of suppliers by type of purchase
2016 2015 2014
Raw Materials 4% 3% 3%
Consumable Materials 32% 35% 33%
Services 52% 48% 53%
Capital goods 12% 14% 11%
The following table represents the percentage composition in the value of the mix of raw materials purchased by Pirelli Tyre in 2016, 2015 and 2014. In 2016, there was a decrease in the weight of natural rubber compared to 2015 due to the reduction of the price of the commodity. The volume of raw materials utilised for the production of tyres in 2016 amounted to approximately 1 million tons, of which approximately 5% derives from recycled materials, in line with the previous year. Mix of raw materials purchased (by value)
2016 2015 2014
Natural Rubber 17% 18% 20%
Synthetic Rubber 25% 25% 28%
Carbon black 8% 10% 14%
Chemicals 21% 20% 19%
Textile 14% 13% 12%
Steel 15% 14% 7%
2016 ANNUAL REPORT
93
Targets for 2017
• CDP Supply Chain: increase in the response rate of suppliers of Raw Materials from 74% in 2016 to 90% in 2020;
• Sustainability of the Natural Rubber supply chain: engagement activities with suppliers (processors) in order to impact social and environmental sustainability starting from plantations downstream of the chain;
• new training session on ESG issues dedicated to the Group's strategic suppliers belonging to the different product categories with particular focus on human rights, health and safety and environmental management in emerging countries.
2016 ANNUAL REPORT
94
Environmental Dimension The Pirelli Group considers environmental protection as a fundamental value in the exercise and development of its activities. The Pirelli approach to environmental management is inspired by the United Nations Global Compact, in which Pirelli has participated since 2004 (in addition to having a seat on the Steering Committee of the Global Compact LEAD), and the “Rio Declaration on Environment and Development”. The Pirelli Values and Ethical Code states that “A key consideration in investment and business decisions is environmental sustainability, with the Group supporting eco-compatible growth, not least through the adoption of special technologies and production methods (where this is operationally feasible and economically viable) that allow for the reduction of the environmental impact of Group operations, in some cases even below statutory limits”. The environmental management model adopted is detailed in the Group Policies: “Health, Safety and Environment” Policy, “Product Stewardship” Policy, “Quality” Policy, “Social Responsibility Policy for Occupational Health, Safety and Rights, and Environment”, “Green Sourcing” Policy, based on which Pirelli undertakes to:
• assess and reduce the environmental impact of its own products and services throughout their entire life cycle, as of products and services purchased;
• develop products and production processes that are safe and designed to minimize polluting emissions, waste generation, consumption of natural resources available and the causes of climate change, in order to preserve the environment, biodiversity and ecosystems;
• manage its environmental activities in full compliance with applicable laws and with the highest international standards;
• monitor and communicate to its stakeholders the environmental performance associated with processes, products and services throughout the entire life cycle, promoting its culture of environmental protection;
• monitor the environmental impacts of its suppliers by requesting them to adopt the same business model along the related supply chain;
• support customers and end consumers in understanding the environmental impacts of its products, informing them of the safest use and disposal methods, facilitating recycling or re-use where possible;
• empower and train its workers in order to extend adequate culture of environmental capital conservation.
All the documents mentioned above are communicated to the Group's employees in the local language and published in the Sustainability section of the pirelli.com website, available to the external community, in multiple languages. THE PIRELLI GROUP ENVIRONMENTAL STRATEGY Management of environmental issues has always played a key role in Pirelli business strategy. With a view to long-term management, Pirelli monitors the Carbon Footprint and Water Footprint of its entire organisation and is committed to the progressive reduction of the related impacts on resources, climate and ecosystems. The Group has set up a control and monitoring system that allows the identification of the materiality of environmental impacts throughout the life cycle of the product: the infographic on the following pages

2016 ANNUAL REPORT
95
shows Pirelli's approach to environmental management and the specific long-term targets defined in the Industrial Plan, the 2016 performance of which is reported below in this report. As is readily apparent, the materiality of environmental impacts is highly concentrated in the use phase of the tyre. As part of the Carbon Footprint (and similarly in the case of the Water Footprint) the use phase weighs about 91% of total impacts along the entire life cycle of the product, compared to a production phase that weighs only 2.4 % of total impacts. The graph can be read either horizontally, following the stages of life of a tyre one by one, or vertically, thus being able to appreciate the objectives of reducing the impacts that the Company has defined for each of the different stages of life, which will be explored later in this chapter. From a methodological point of view, these life cycle phases have been analysed using the Life Cycle Assessment, as defined by the ISO 14040 family of standards. This method is capable of validating the results and strategic decisions related to it as objectively as possible. Moreover, reporting of the emissions impacts also complies with the provisions of the GHG Protocol and GRI-G4 Guidelines. All impacts listed by the standards that are not mentioned, both upstream and downstream of the industrial activity of Pirelli, either do not apply or are not significant. The values are shown as a percentage, as the objective of this infographic is to show the difference in materiality between the various life stages. To determine the Carbon Footprint and Water Footprint, Pirelli’s calculation model respectively follows the technical specification ISO-TS 14067 and ISO 14046. The main environmental impacts are generated by various activities related to the different stages of the lifecycle. In the case of raw materials procurement, the main impact derives from the related production and distribution. In the case of tyre production, the main impact is related to the consumption of electricity and natural gas: in particular the main pressure in terms of emissions into the atmosphere and water consumption is attributed to the production of the latter. In the case of the distribution of new tyres and their use by customers, the impact derives from the fuel consumption of vehicles (only the fuel consumption related to the power absorbed by the rolling resistance of the tyres is allocated to customers). Finally, in the last phase of lifecycle considered, the impact derives from the preparation of end-of-life tyres for recovery thereof as energy or recycled raw material. With reference to the Carbon Footprint, the infographic (see the "Driver" part) also includes a breakdown of emissions in the three Scope categories provided by the GHG Protocol. The central part of the infographic shows the actual quantification, in percentage terms, of the Carbon Footprint and Water Footprint. These two aspects are summarised by four principal indicators: Primary Energy Demand (PED), Global Warming Potential (GWP), Blue Water Consumption (BWC) and Eutrophication Potential (EP). The values are managed in GJ of energy, tons of CO2 equivalent, cubic meters of water and kilograms of phosphate equivalents. Primary Energy Demand refers to the quantity of renewable or non-renewable energy that is taken directly from the hydrosphere, the atmosphere or the geosphere. The Global Warming Potential concerns the effect on the climate of anthropic activities and is calculated, as mentioned, in tons of CO2 equivalent (the greenhouse effect potential of the gas considered is assessed in relation to CO2, considering a residence time in the atmosphere of 100 years). Blue Water Consumption is given by the volume of surface and underground water consumed as a result of the production of a good or service. Consumption refers to the fresh water used and then evaporated or incorporated in the product. The Eutrophication Potential is the enrichment of nutrients in a specific aquatic or terrestrial ecosystem. Air pollution, water emissions and agricultural fertilisers all contribute to eutrophication. The result in
2016 ANNUAL REPORT
96
aquatic systems is accelerated growth of algae, which does not allow sunlight to penetrate the surface of the water basins. This reduces photosynthesis and thus reduces the production of oxygen. Low concentrations of oxygen may cause mass death of fish and anaerobic decomposition of organic material, seriously compromising the entire ecosystem. In terms of environmental materiality, the use phase of the tyre is the most predominant in each of the four indicators mentioned above. In terms of economic materiality the amount of corporate spending in the manufacturing phase is the most relevant, which results in the opportunity to reduce impacts through investments in energy efficiency. In its response strategy, which may be consulted in the lower part of the infographic and corresponding to what is also stated in the Industrial Plan, Pirelli has adopted adequate management models for the monitoring and managing of environmental issues, and has also voluntarily adopted specific targets to reduce its impact in each phase of the product life cycle.
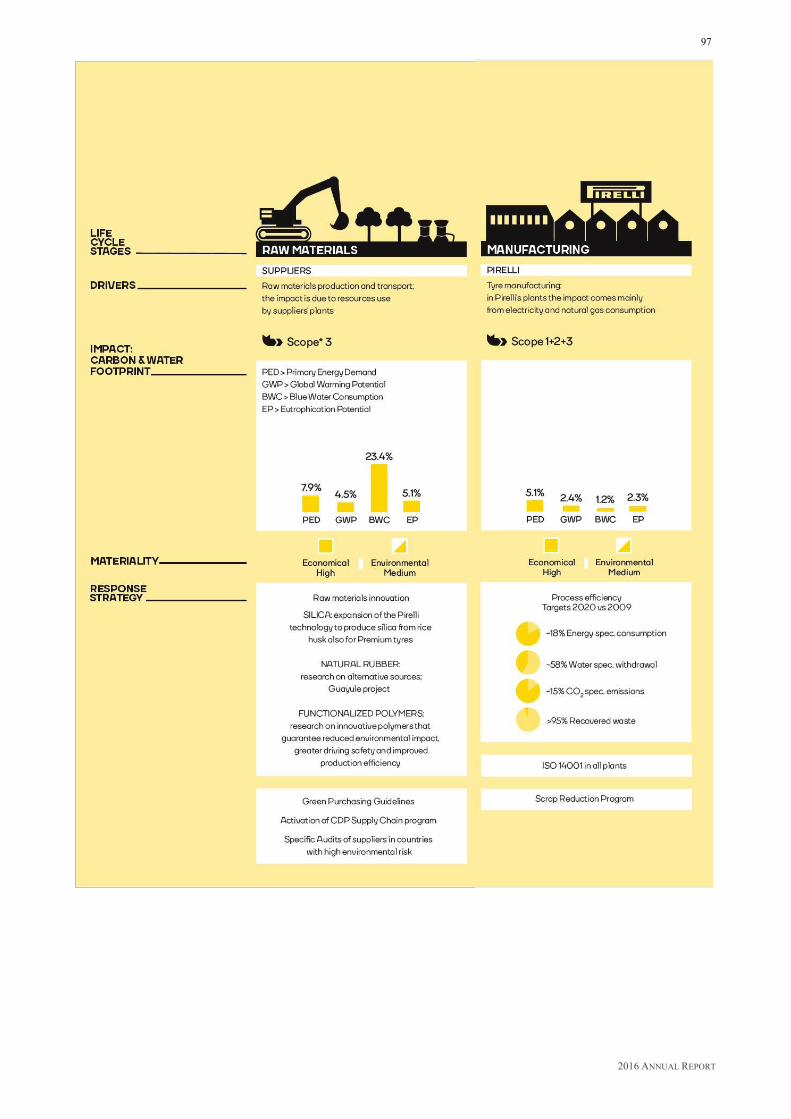
2016 ANNUAL REPORT
97

2016 ANNUAL REPORT
98

2016 ANNUAL REPORT
99
RESEARCH AND DEVELOPMENT OF RAW MATERIALS The research and development of innovative materials are key to the design and fabrication of ever-more sustainable tyres that guarantee reduced environmental impact, during the use and end-of-life phases, greater driving safety and production efficiency. Pirelli has activated several Joint Development Agreements with leading suppliers for the study of new polymers that are able to further improve the characteristics of tyres for rolling resistance, low temperature performance, mileage and road grip. In this regard, Pirelli Research & Development focuses, among other things, on:
• high-dispersion silica for wet grip, rolling resistance and durability; • biomaterials, such as silica from renewable sources, biofillers such as lignin and
plasticisers/resins of plant origin; • nanofillers for more stable compounds, lighter structures and highly impermeable liners; • new silica surfactants to guarantee performance stability and processability; • vulcanisation agents and stabilisers with reduced environmental impact.
The Joint Labs agreement (2012-2017) between Pirelli and Politecnico of Milan, aimed at research and training in the tyre industry covers nanotechnology, the development of new synthetic polymers, new bifunctional chemicals and new biopolymers. Research continues aimed at diversifying the potential supply sources of natural rubber, to reduce pressure on biodiversity in producer Countries and allow the Company to manage the potential scarcity of raw materials with greater flexibility. Among alternative sources, there is rubber from guayule (Parthenium argentatum), a non-edible shrub that needs little water and no pesticides, and represents an alternative biomaterial to natural rubber, thanks also to its hypo-allergenic properties, unlike the more common rubber from Hevea brasiliensis. Thanks to research, Pirelli has developed a tread composition with a specific grade of natural rubber, which it patented and then tested on UHP – Ultra High Performance tyres. Remaining in the field of biomaterials, Pirelli also focused on silica derived from rice husk. Rice husk is the outer shell of grain and constitutes 20% of raw rice by weight, which is the main waste of this crop and is available in large quantities in many areas of the world where it is still not valued but burned in the open without exploiting its full potential. In one of these areas, in Brazil, Pirelli has developed a production process capable of obtaining industrial silica from husk, 18% of the weight of which consists precisely of silica. The Pirelli industrial process for the extraction of this raw material is considered thermally autonomous thanks to the combustion of the carbonaceous part of husk: this allows a reduction of more than 90% of the quantity of CO2 emitted per kg of silica compared to the conventional process, which instead exploits fossil energy sources. Research and innovation of raw materials also entails the improvement of the environmental impact of end-of-life tyres. In this regard, in collaboration with Università degli Studi of Milan Bicocca, as part of the Consortium for Research on Advanced Materials (CORIMAV) and through the Fondazione Silvio Tronchetti Provera, a new selective devulcanisation technology is being studied for the recycling of materials derived from compounds of End-of-Life Tyres, which allows a significant reduction of production costs as well as the related environmental impact.

2016 ANNUAL REPORT
100
As part of new nano-fillers, Pirelli has started to industrially introduce materials of mineral origin in partial replacement of precipitated Silica and Carbon Black. Compared to the production processes of the replaced raw materials, the mentioned innovations have granted water savings and more than 75% reduction in CO2 emissions, saving in 2016 respectively 1,800 tons of CO2 (vs. 1,400 in 2015) and 10,000 tons of water (vs. 7,500 in 2015). In addition, in collaboration with Università degli Studi of Milan Bicocca and Politecnico of Milan, Pirelli is developing Silica particles with an elongated shape that will allow to further reduce fuel consumption. PRODUCT AND USE PHASE: GREEN PERFORMANCE TARGETS In line with its position in the Premium and Prestige segments, Pirelli develops and introduces increasingly sophisticated products on the market, responding to a macroeconomic scenario in constant and rapid evolution. The major corporate investment in research and development on compounds, structures and tread patterns allows Pirelli products to achieve extremely high performance in terms of braking in dry and wet conditions and, at the same time, improved environmental performance such as:
• less rolling resistance – lower CO2 emissions; • less noise – reduced noise pollution; • increased mileage – lengthening of tyre life and reduced exploitation of resources; • improved retreadability – less waste needing disposal; • reduced weight – less use of raw materials and lower impact on natural resources.
Pirelli has adopted targets for improvement of the environmental performance of its products in an objective, measurable and transparent manner. In terms of materiality regarding the entire life cycle of the product, it was seen that the rolling resistance related to the use phase of the tyre constitutes by far the factor with most impact in environmental terms. In this regard, Pirelli has committed to reduce by 2020, compared to the 2007 average, the weighted average rolling resistance of its products by 40% with regard to Car tyres, by 20% for Truck products and 10% for Motorcycle products, as shown in the graphs below. At the end of 2016, the above objectives were achieved to an extent > 50%.

2016 ANNUAL REPORT
101
CAR
TRUCK
MOTO
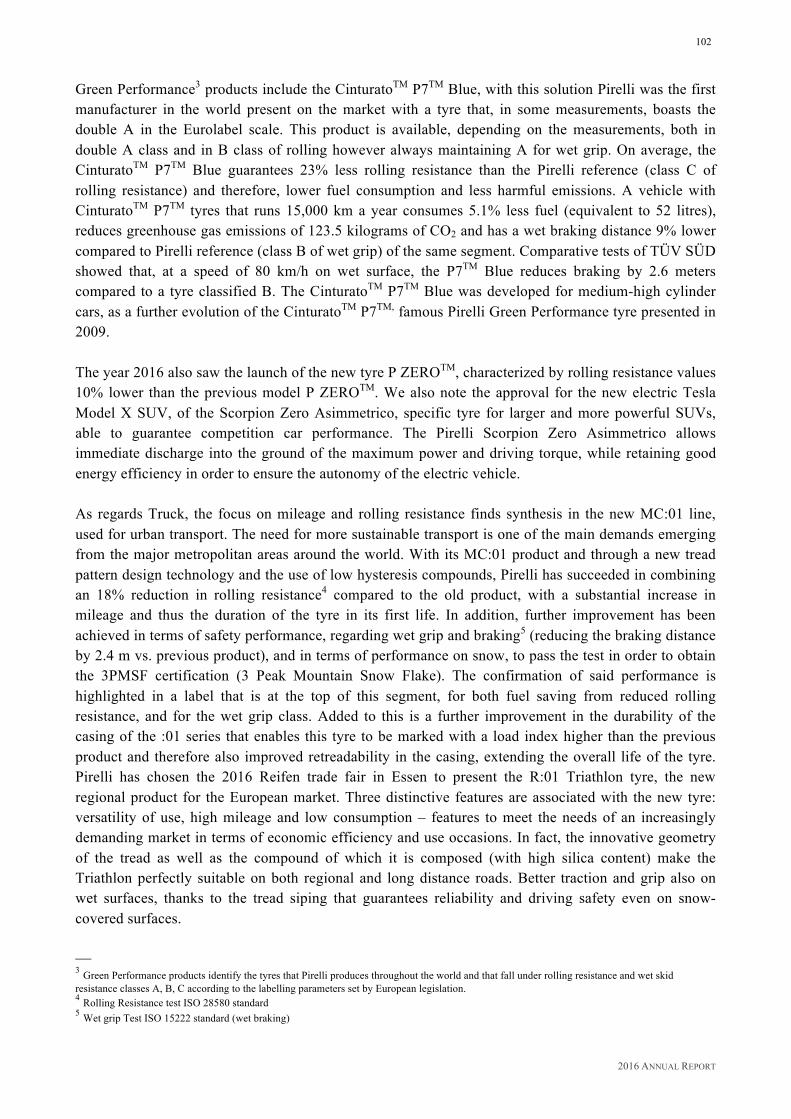
2016 ANNUAL REPORT
102
Green Performance3 products include the CinturatoTM P7TM Blue, with this solution Pirelli was the first manufacturer in the world present on the market with a tyre that, in some measurements, boasts the double A in the Eurolabel scale. This product is available, depending on the measurements, both in double A class and in B class of rolling however always maintaining A for wet grip. On average, the CinturatoTM P7TM Blue guarantees 23% less rolling resistance than the Pirelli reference (class C of rolling resistance) and therefore, lower fuel consumption and less harmful emissions. A vehicle with CinturatoTM P7TM tyres that runs 15,000 km a year consumes 5.1% less fuel (equivalent to 52 litres), reduces greenhouse gas emissions of 123.5 kilograms of CO2 and has a wet braking distance 9% lower compared to Pirelli reference (class B of wet grip) of the same segment. Comparative tests of TÜV SÜD showed that, at a speed of 80 km/h on wet surface, the P7TM Blue reduces braking by 2.6 meters compared to a tyre classified B. The CinturatoTM P7TM Blue was developed for medium-high cylinder cars, as a further evolution of the CinturatoTM P7TM, famous Pirelli Green Performance tyre presented in 2009. The year 2016 also saw the launch of the new tyre P ZEROTM, characterized by rolling resistance values 10% lower than the previous model P ZEROTM. We also note the approval for the new electric Tesla Model X SUV, of the Scorpion Zero Asimmetrico, specific tyre for larger and more powerful SUVs, able to guarantee competition car performance. The Pirelli Scorpion Zero Asimmetrico allows immediate discharge into the ground of the maximum power and driving torque, while retaining good energy efficiency in order to ensure the autonomy of the electric vehicle. As regards Truck, the focus on mileage and rolling resistance finds synthesis in the new MC:01 line, used for urban transport. The need for more sustainable transport is one of the main demands emerging from the major metropolitan areas around the world. With its MC:01 product and through a new tread pattern design technology and the use of low hysteresis compounds, Pirelli has succeeded in combining an 18% reduction in rolling resistance4 compared to the old product, with a substantial increase in mileage and thus the duration of the tyre in its first life. In addition, further improvement has been achieved in terms of safety performance, regarding wet grip and braking5 (reducing the braking distance by 2.4 m vs. previous product), and in terms of performance on snow, to pass the test in order to obtain the 3PMSF certification (3 Peak Mountain Snow Flake). The confirmation of said performance is highlighted in a label that is at the top of this segment, for both fuel saving from reduced rolling resistance, and for the wet grip class. Added to this is a further improvement in the durability of the casing of the :01 series that enables this tyre to be marked with a load index higher than the previous product and therefore also improved retreadability in the casing, extending the overall life of the tyre. Pirelli has chosen the 2016 Reifen trade fair in Essen to present the R:01 Triathlon tyre, the new regional product for the European market. Three distinctive features are associated with the new tyre: versatility of use, high mileage and low consumption – features to meet the needs of an increasingly demanding market in terms of economic efficiency and use occasions. In fact, the innovative geometry of the tread as well as the compound of which it is composed (with high silica content) make the Triathlon perfectly suitable on both regional and long distance roads. Better traction and grip also on wet surfaces, thanks to the tread siping that guarantees reliability and driving safety even on snow-covered surfaces.
–– 3 Green Performance products identify the tyres that Pirelli produces throughout the world and that fall under rolling resistance and wet skid resistance classes A, B, C according to the labelling parameters set by European legislation. 4 Rolling Resistance test ISO 28580 standard 5 Wet grip Test ISO 15222 standard (wet braking)

2016 ANNUAL REPORT
103
MANAGEMENT OF END-OF-LIFE TYRES In terms of materiality, the end-of-life phase of the product has a low proportion of the total impact of the tyre on the environment, as already highlighted in the infographic related to the Group’s environmental strategy. In Europe, about 96% of end-of-life tyres (ELTs) are recovered (Source ETRMA 2015 End-of-Life Tyre report), in Japan the value is 92% (source: JATMA - Tyre Industry of Japan 2016), while in the US the amount of recovered tyres comes to 88% (source: RMA - 2015 US Scrap Tyre Management). For years, Pirelli has been engaged in the management of ELTs. The Company actively collaborates with the main reference entities at national and international level, promoting the identification and development of solutions to enhance and promote the sustainable recovery of ELTs, shared with the various stakeholders and based on the Circular Economy model. In particular, Pirelli is active in the Tyre Industry Project (TIPG) of the World Business Council for Sustainable Development (WBCSD), in the ELT working group of ETRMA (European Tyres and Rubber Manufacturers’ Association) and, at national and local level, it interacts directly with leading organisations active in the recovery and recycling of ELTs. As a member of TIPG, Pirelli Tyre has collaborated on the publication of a report on the management of ELTs, taking a proactive approach to raising the awareness both within emerging Countries and those that do not yet have a system for recycling ELTs, in order to promote their recycling and reuse according to defined management models, which have already been launched successfully. The tyre is a mixture of many valuable materials that at end-of-life allow two paths of recovery: recovery of material or energy. In the recovery of material, the reclaimed rubber is already reused by Pirelli in the compounds for new tyres, thus contributing to the reduction of the related environmental impact. In order to increase this recovery rate, research activities continue with various university centers aimed at improving the quality of recovered materials in terms of affinity with the other ingredients present in the compounds.
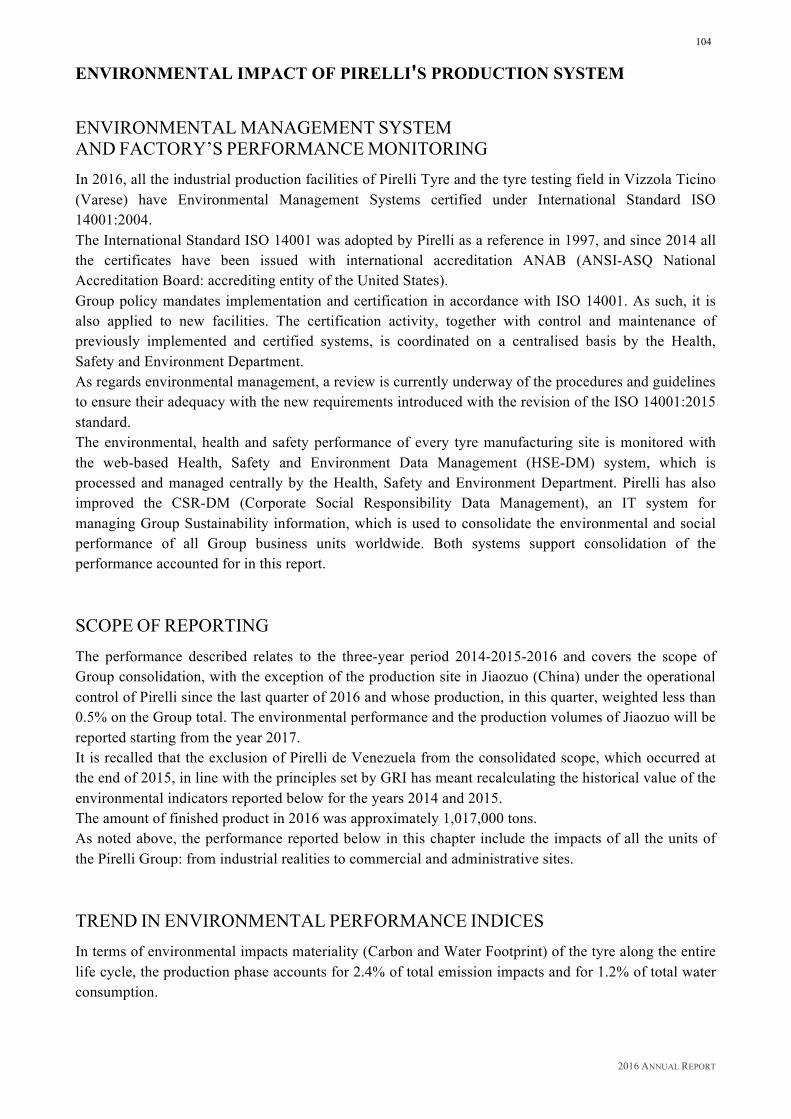
2016 ANNUAL REPORT
104
ENVIRONMENTAL IMPACT OF PIRELLI'S PRODUCTION SYSTEM ENVIRONMENTAL MANAGEMENT SYSTEM AND FACTORY’S PERFORMANCE MONITORING In 2016, all the industrial production facilities of Pirelli Tyre and the tyre testing field in Vizzola Ticino (Varese) have Environmental Management Systems certified under International Standard ISO 14001:2004. The International Standard ISO 14001 was adopted by Pirelli as a reference in 1997, and since 2014 all the certificates have been issued with international accreditation ANAB (ANSI-ASQ National Accreditation Board: accrediting entity of the United States). Group policy mandates implementation and certification in accordance with ISO 14001. As such, it is also applied to new facilities. The certification activity, together with control and maintenance of previously implemented and certified systems, is coordinated on a centralised basis by the Health, Safety and Environment Department. As regards environmental management, a review is currently underway of the procedures and guidelines to ensure their adequacy with the new requirements introduced with the revision of the ISO 14001:2015 standard. The environmental, health and safety performance of every tyre manufacturing site is monitored with the web-based Health, Safety and Environment Data Management (HSE-DM) system, which is processed and managed centrally by the Health, Safety and Environment Department. Pirelli has also improved the CSR-DM (Corporate Social Responsibility Data Management), an IT system for managing Group Sustainability information, which is used to consolidate the environmental and social performance of all Group business units worldwide. Both systems support consolidation of the performance accounted for in this report. SCOPE OF REPORTING The performance described relates to the three-year period 2014-2015-2016 and covers the scope of Group consolidation, with the exception of the production site in Jiaozuo (China) under the operational control of Pirelli since the last quarter of 2016 and whose production, in this quarter, weighted less than 0.5% on the Group total. The environmental performance and the production volumes of Jiaozuo will be reported starting from the year 2017. It is recalled that the exclusion of Pirelli de Venezuela from the consolidated scope, which occurred at the end of 2015, in line with the principles set by GRI has meant recalculating the historical value of the environmental indicators reported below for the years 2014 and 2015. The amount of finished product in 2016 was approximately 1,017,000 tons. As noted above, the performance reported below in this chapter include the impacts of all the units of the Pirelli Group: from industrial realities to commercial and administrative sites. TREND IN ENVIRONMENTAL PERFORMANCE INDICES In terms of environmental impacts materiality (Carbon and Water Footprint) of the tyre along the entire life cycle, the production phase accounts for 2.4% of total emission impacts and for 1.2% of total water consumption.

2016 ANNUAL REPORT
105
The year 2016 saw a stabilization of production volumes: tons of finished product grew by around half a percentage point compared to 2015 (value calculated on a comparable basis). The 2016 environmental performance indicators, calculated on tons of finished product, show a general consolidation of the specific indices of energy consumption and waste recovery, and an improvement of the specific indices related to water withdrawal and greenhouse gas emissions. By contrast, the indicators normalized on the Operating Income show a deterioration caused by the decline in PBIT (Profit Before Interest and Tax) for the same production volumes. It should be noted that the trend of the above indices is significantly impacted by the production focus adopted. Pirelli production is focused on Premium and Prestige tyres and the relevant production processes are characterized by higher energy intensity, more stringent quality specifications, more complex processing and smaller production batches compared to production processes for medium-low end tyres. In the aforementioned context, the reduction of the indices, has a strong environmental and economic impact, in terms of consumption and emissions avoided, unused resources, and avoided costs. Energy Management Pirelli monitors, manages and reports its energy consumption through three main indicators:
• absolute consumption, measured in GJ, which includes the total consumption of electrical energy, thermal energy, natural gas and petroleum derivatives (fuel oil, gasoline, diesel, and LPG);
• specific consumption, measured in GJ per ton of finished product, which indicates the energy used to produce one ton of finished product;
• specific consumption, as measured in GJ per euro of Operating Income. The Industrial Plan with Vision and target 2020 provides for a reduction of 18% of specific energy consumption by 2020 compared to 2009 values. In the course of 2016, the energy efficiency plan continued at all Group plants, already initiated in recent years and characterised by actions aimed at:
• improving energy management systems, through measurement consumption and a daily focus on technical indicators;
• optimizing the procurement of energy resources, direct or indirect; • improving the quality of energy transformation; • improving the efficiency of distribution plants; • improving the efficiency of production plants; • recovering energy for secondary uses; • applying targeted maintenance plans in order to reduce energy waste.
With a view to Life Cycle Assessment, the specific consumption of each production machinery is also mapped, so as to increase the standard indicators of reference, compare similar machinery families and assess in detail the energy content of the different families of products and sub-products. In terms of “compliance”, every industrial facility completely fulfils the indications of law regarding energy consumption and management. The legislative situation affecting the Company includes the introduction of periodic audit mechanisms on energy management and use, as well as possible tariff incentives. In this regard, there were no critical elements or non-conformities.

2016 ANNUAL REPORT
106
Actions and investments for energy efficiency are alongside the assessment of environmental impacts to economic sustainability criteria normally applied to all Pirelli projects. The areas for technical action both concern the traditional themes applied to each industrial area, such as modernisation of thermal insulation, maintenance of distribution plants, use of technologies using inverters, and special projects assessed according to the needs of each manufacturing site. In 2016, various interventions were made. In particular, the installation continues of LED lighting systems (Light Emitting Diode) to replace less efficient systems. To speed up the replacement plan, Pirelli also uses “Light Service” contracts, which guarantee both energy savings of more than 50% and the quality of light achieved. Centrifugal compressors have been installed to replace volumetric compressors, with a recovery of electrical efficiency greater than 10%. Great attention to efficiency in thermal energy conversion. Specific projects on steam generators, related to the automation of combustion, to the cleaning of the inner surfaces, to the insertion of drivers of supply pumps. As occurred in 2015, also in 2016 the economic slowdown of the South American context, Brazil in particular, has hindered the improvement of the Group's specific energy index (weighted on tons of finished product), which is practically stable compared to the figure in 2015 (+0.3%), while remaining more than 7% lower compared to 2009, the year on which the 2020 target of the Group is based. The energy efficiency plan applied to factories in 2016 allowed saving about 99,130 GJ. This value was calculated for each factory on the basis of the production volumes of the reporting year and the change in efficiencies achieved in 2016 from the previous year. The absolute and specific consumption data reported in the following table were calculated by using direct measurements according to procedure (GHG Corporate Standard) and were subsequently converted into GJ by using heating values from official IPCC sources. 2014 2015 2016
Absolute
consumption
GJ 13,011,096 13,329,117 13,415,824
Specific
consumption
GJ/tonFP 12.85 13.15 13.19
GJ/k€ 15.53 15.68 18.53
The same figures in 2016, weighed in economic terms, showed a decrease compared to 2015 due to the decline in PBIT for the same production volumes.
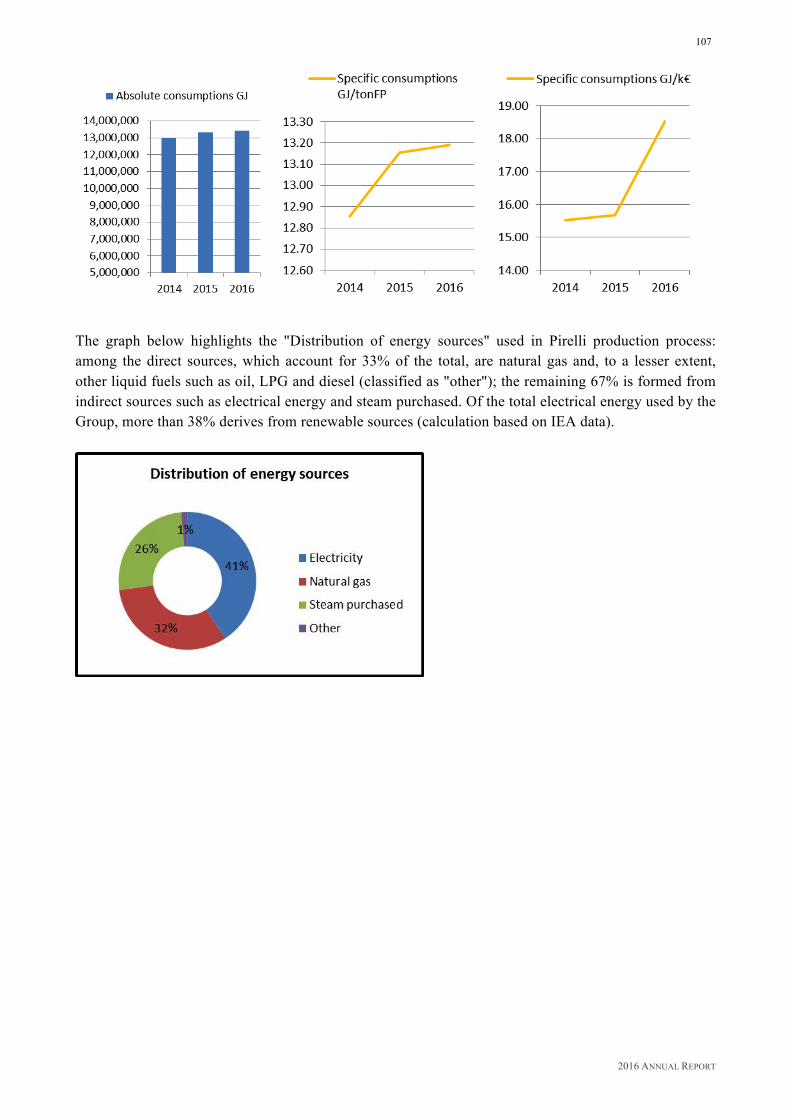
2016 ANNUAL REPORT
107
The graph below highlights the "Distribution of energy sources" used in Pirelli production process: among the direct sources, which account for 33% of the total, are natural gas and, to a lesser extent, other liquid fuels such as oil, LPG and diesel (classified as "other"); the remaining 67% is formed from indirect sources such as electrical energy and steam purchased. Of the total electrical energy used by the Group, more than 38% derives from renewable sources (calculation based on IEA data).
2016 ANNUAL REPORT
108
Management of Greenhouse Gas Emissions and Carbon Action Plan
Pirelli monitors and reports its6 emissions of greenhouse gases through the calculation of CO2eq, which takes into account the contribution of carbon dioxide and of methane (CH4) and nitrous oxide (N2O). To quantify emissions, the energy consumption of local units included in the scope of reporting are collected annually through the CSR-DM IT system. Greenhouse gases are generated by the combustion of hydrocarbons at production sites, mainly to operate heat generators that power Group plants, and particularly those that produce steam for vulcanisers, or by the consumption of electrical or thermal energy. The first are called “direct emissions”, or Scope 1 emissions, insofar as they are produced at Company production sites, while the emissions resulting from electrical power or thermal energy consumption are defined as “indirect emissions”, or Scope 2 emissions insofar as they are not produced within the perimeter of company production sites but at the plants that generate the energy and steam purchased and consumed. The Scope 2 emissions are reported in two separate ways: location-based and market-based (new methodology introduced by the GHG Protocol Scope 2 Guidance). It is recalled that the Scope 3 emissions, related to the specific activities of Pirelli Suppliers, are discussed in the section "Our Suppliers"/"CDP Supply Chain", to which reference is made for further information. Performance as measured by energy and greenhouse gas emissions is calculated on the basis of emission factors obtained from the following sources:
• IPCC: Guidelines for National Greenhouse Gas Inventories (2006)7; • Within Scope 2 location-based:
o National emission factors8 taken from IEA: CO2 Emissions from Fuel Combustion9; • Within Scope 2 market-based:
o Specific emission factors of suppliers where available; o Residual-mix emission factors10 taken from RE-DISS AIB (EU)11 and Green-e (US)12; o Emission factors used in the context of location-based if other sources of data are not
available; and are reported according to the models proposed by:
• GHG Protocol: A Corporate Accounting and Reporting Standard; • GHG Protocol Scope 2 Guidance.
Regarding Scope 2 CO2eq emissions, the national average coefficients are defined with respect to the last year available on the above reports. It must be pointed out that tyre manufacturing industry is not carbon intensive: in fact, it is covered by the European Emission Trading Scheme only in reference to thermal plants having more than 20 MW of installed power. The Company is not subject to other specific regulations at the global level.
–– 6 GHG inventory perimeter indicated in paragraph "SCOPE OF REPORTING" 7 Emission factors expressed in CO2 equivalent, obtained by considering the GWP (Global Warming Potential) coefficients based on 100 years of the IPCC Fifth Assessment Report, 2014 (AR5) 8 Emission factors expressed in CO2/kWh 9 2016 Publication with update to the 2014 figure 10 Emission factors expressed in CO2/kWh 11 2016 Publication with update to the 2015 figure 12 2016 Publication with update to the 2015 figure

2016 ANNUAL REPORT
109
As in the case of energy, Pirelli monitors and accounts for its direct CO2 (Scope 1) and indirect (Scope 2) by using three principal indicators:
• absolute emissions, as measured in tons; • specific emissions, as measured in tons per ton of finished product; • specific emissions, as measured in tons per euro of Operating Income.
The GHG emission data obtained limited assurance against the ISAE 3000 and ISAE 3410 Standards. According to the Guidelines of the GHG Protocol Guide, the level of inventory uncertainty was evaluated as "Good". The current Industrial Plan envisages a reduction in specific emissions (on tons of finished product) of CO2 equal to -15% by 2020 compared to 2009 values. At the time, the target was developed according to the methodology in force, i.e. Scope 1 and Scope 2 "location-based". The following tables show the performance of the last three-year period:
In 2016, Pirelli recorded a reduction in specific emissions (weighted on tons of finished product) of 2.2% compared to 2015 and 3.6% compared to 2009, the year on which the 2020 target is based. As regards biogenic CO2 generated from the small production facility of silica from rice husk, Pirelli emitted in 2016 about 7,400 tons of CO2eq. This quantity is not counted in the Group's absolute emissions mentioned above, as generated by biogenic fuel. The portion of indirect emissions generated by the projects implemented in Silao (Mexico) and Campinas (Brazil) - described below - was reported in the manner prescribed by the Guidelines of the GHG Protocol, respectively for the procurement of electrical energy from renewable sources and steam from biomass.
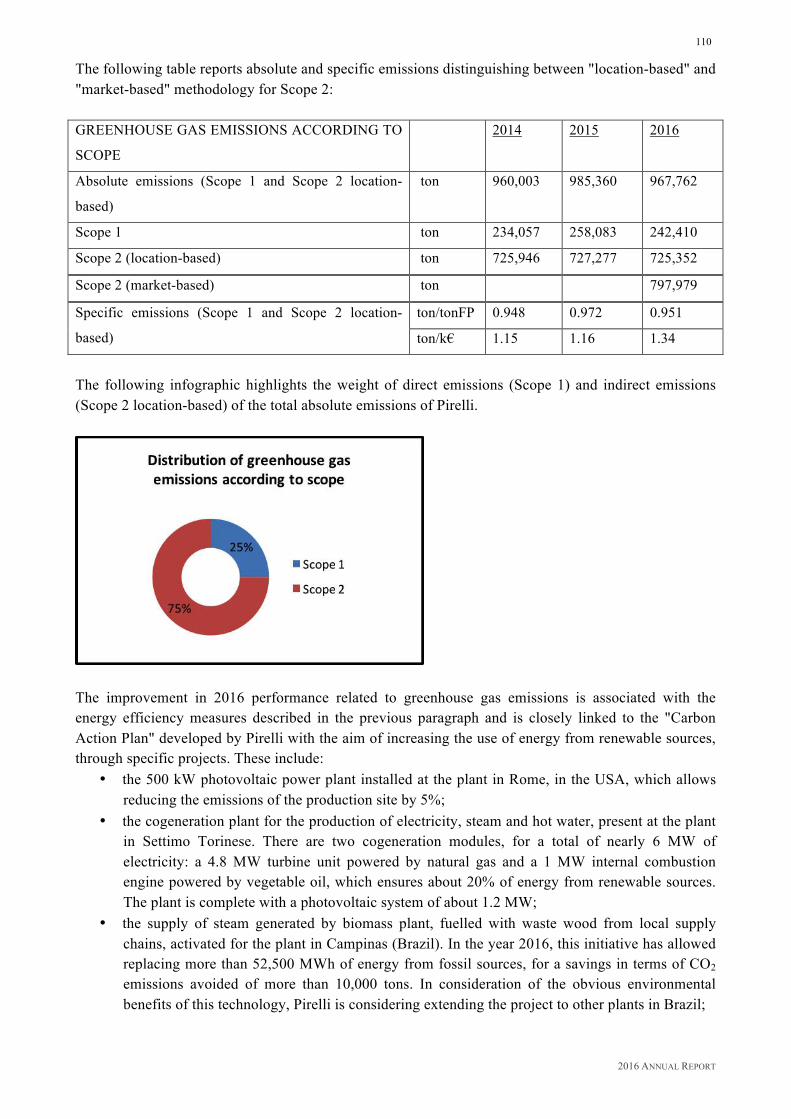
2016 ANNUAL REPORT
110
The following table reports absolute and specific emissions distinguishing between "location-based" and "market-based" methodology for Scope 2: GREENHOUSE GAS EMISSIONS ACCORDING TO
SCOPE
2014 2015 2016
Absolute emissions (Scope 1 and Scope 2 location-
based)
ton 960,003 985,360 967,762
Scope 1 ton 234,057 258,083 242,410
Scope 2 (location-based) ton 725,946 727,277 725,352
Scope 2 (market-based) ton 797,979
Specific emissions (Scope 1 and Scope 2 location-
based)
ton/tonFP 0.948 0.972 0.951
ton/k€ 1.15 1.16 1.34
The following infographic highlights the weight of direct emissions (Scope 1) and indirect emissions (Scope 2 location-based) of the total absolute emissions of Pirelli.
The improvement in 2016 performance related to greenhouse gas emissions is associated with the energy efficiency measures described in the previous paragraph and is closely linked to the "Carbon Action Plan" developed by Pirelli with the aim of increasing the use of energy from renewable sources, through specific projects. These include:
• the 500 kW photovoltaic power plant installed at the plant in Rome, in the USA, which allows reducing the emissions of the production site by 5%;
• the cogeneration plant for the production of electricity, steam and hot water, present at the plant in Settimo Torinese. There are two cogeneration modules, for a total of nearly 6 MW of electricity: a 4.8 MW turbine unit powered by natural gas and a 1 MW internal combustion engine powered by vegetable oil, which ensures about 20% of energy from renewable sources. The plant is complete with a photovoltaic system of about 1.2 MW;
• the supply of steam generated by biomass plant, fuelled with waste wood from local supply chains, activated for the plant in Campinas (Brazil). In the year 2016, this initiative has allowed replacing more than 52,500 MWh of energy from fossil sources, for a savings in terms of CO2 emissions avoided of more than 10,000 tons. In consideration of the obvious environmental benefits of this technology, Pirelli is considering extending the project to other plants in Brazil;
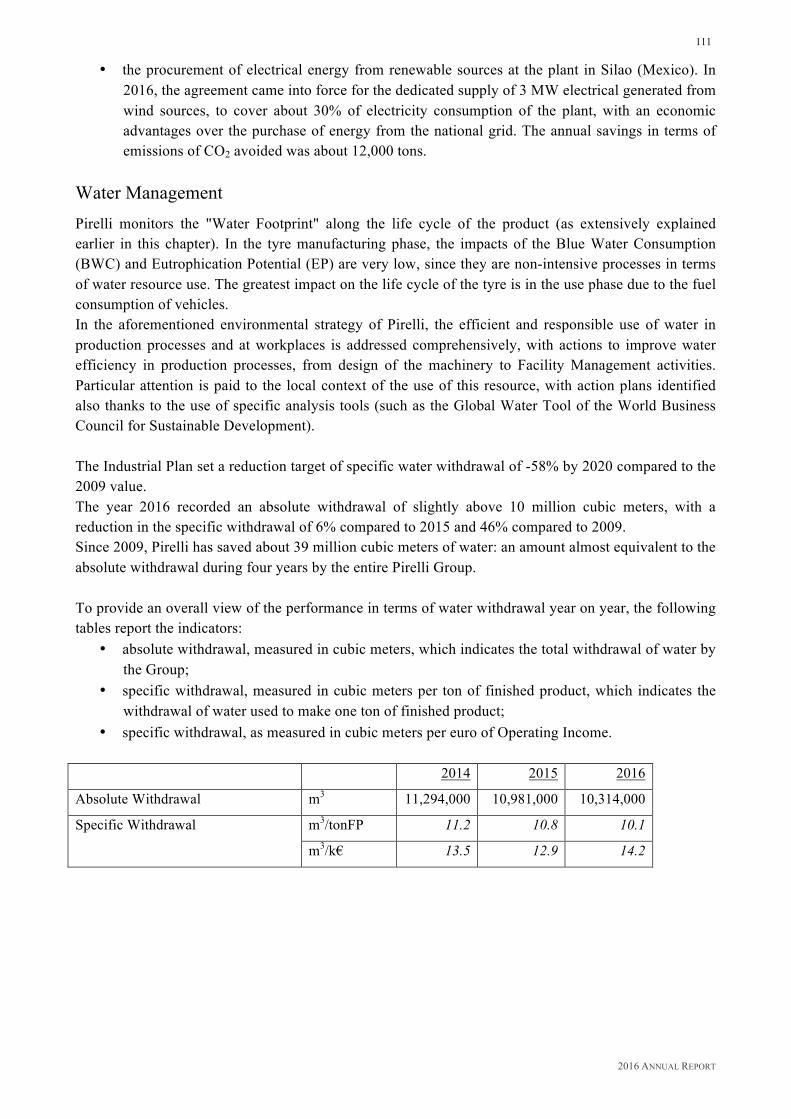
2016 ANNUAL REPORT
111
• the procurement of electrical energy from renewable sources at the plant in Silao (Mexico). In
2016, the agreement came into force for the dedicated supply of 3 MW electrical generated from wind sources, to cover about 30% of electricity consumption of the plant, with an economic advantages over the purchase of energy from the national grid. The annual savings in terms of emissions of CO2 avoided was about 12,000 tons.
Water Management Pirelli monitors the "Water Footprint" along the life cycle of the product (as extensively explained earlier in this chapter). In the tyre manufacturing phase, the impacts of the Blue Water Consumption (BWC) and Eutrophication Potential (EP) are very low, since they are non-intensive processes in terms of water resource use. The greatest impact on the life cycle of the tyre is in the use phase due to the fuel consumption of vehicles. In the aforementioned environmental strategy of Pirelli, the efficient and responsible use of water in production processes and at workplaces is addressed comprehensively, with actions to improve water efficiency in production processes, from design of the machinery to Facility Management activities. Particular attention is paid to the local context of the use of this resource, with action plans identified also thanks to the use of specific analysis tools (such as the Global Water Tool of the World Business Council for Sustainable Development). The Industrial Plan set a reduction target of specific water withdrawal of -58% by 2020 compared to the 2009 value. The year 2016 recorded an absolute withdrawal of slightly above 10 million cubic meters, with a reduction in the specific withdrawal of 6% compared to 2015 and 46% compared to 2009. Since 2009, Pirelli has saved about 39 million cubic meters of water: an amount almost equivalent to the absolute withdrawal during four years by the entire Pirelli Group. To provide an overall view of the performance in terms of water withdrawal year on year, the following tables report the indicators:
• absolute withdrawal, measured in cubic meters, which indicates the total withdrawal of water by the Group;
• specific withdrawal, measured in cubic meters per ton of finished product, which indicates the withdrawal of water used to make one ton of finished product;
• specific withdrawal, as measured in cubic meters per euro of Operating Income. 2014 2015 2016
Absolute Withdrawal m3 11,294,000 10,981,000 10,314,000
Specific Withdrawal m3/tonFP 11.2 10.8 10.1
m3/k€ 13.5 12.9 14.2
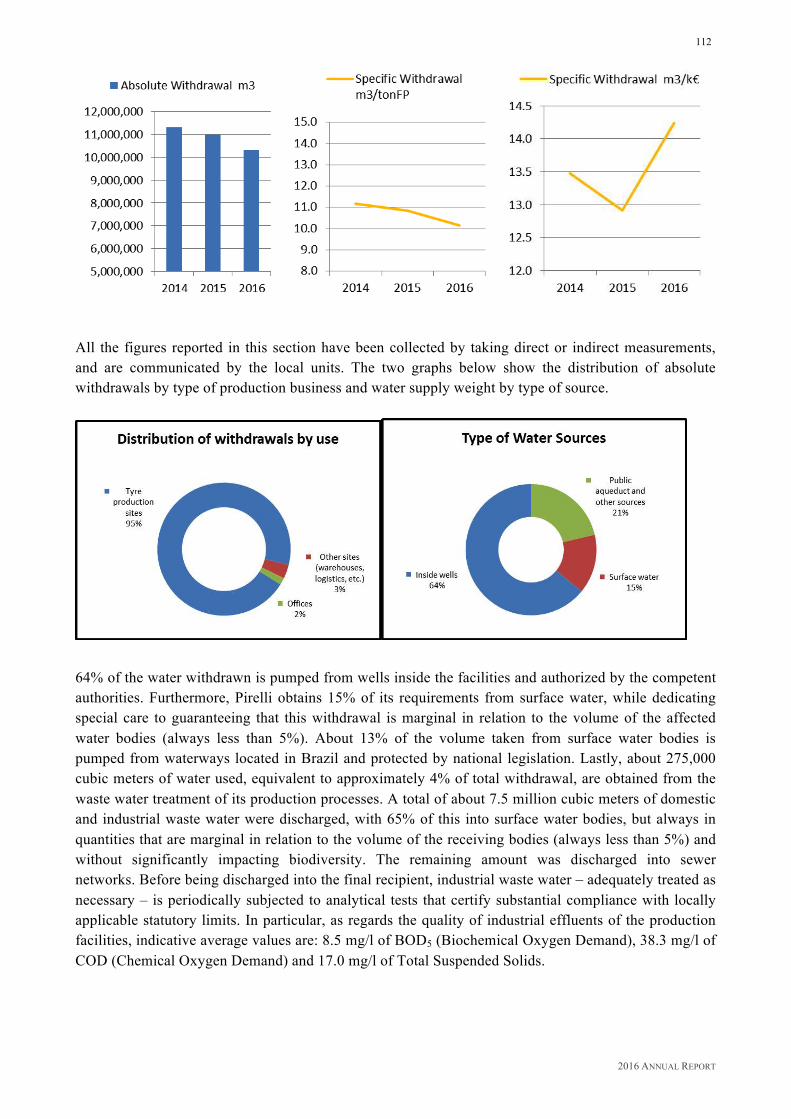
2016 ANNUAL REPORT
112
All the figures reported in this section have been collected by taking direct or indirect measurements, and are communicated by the local units. The two graphs below show the distribution of absolute withdrawals by type of production business and water supply weight by type of source.
64% of the water withdrawn is pumped from wells inside the facilities and authorized by the competent authorities. Furthermore, Pirelli obtains 15% of its requirements from surface water, while dedicating special care to guaranteeing that this withdrawal is marginal in relation to the volume of the affected water bodies (always less than 5%). About 13% of the volume taken from surface water bodies is pumped from waterways located in Brazil and protected by national legislation. Lastly, about 275,000 cubic meters of water used, equivalent to approximately 4% of total withdrawal, are obtained from the waste water treatment of its production processes. A total of about 7.5 million cubic meters of domestic and industrial waste water were discharged, with 65% of this into surface water bodies, but always in quantities that are marginal in relation to the volume of the receiving bodies (always less than 5%) and without significantly impacting biodiversity. The remaining amount was discharged into sewer networks. Before being discharged into the final recipient, industrial waste water – adequately treated as necessary – is periodically subjected to analytical tests that certify substantial compliance with locally applicable statutory limits. In particular, as regards the quality of industrial effluents of the production facilities, indicative average values are: 8.5 mg/l of BOD5 (Biochemical Oxygen Demand), 38.3 mg/l of COD (Chemical Oxygen Demand) and 17.0 mg/l of Total Suspended Solids.
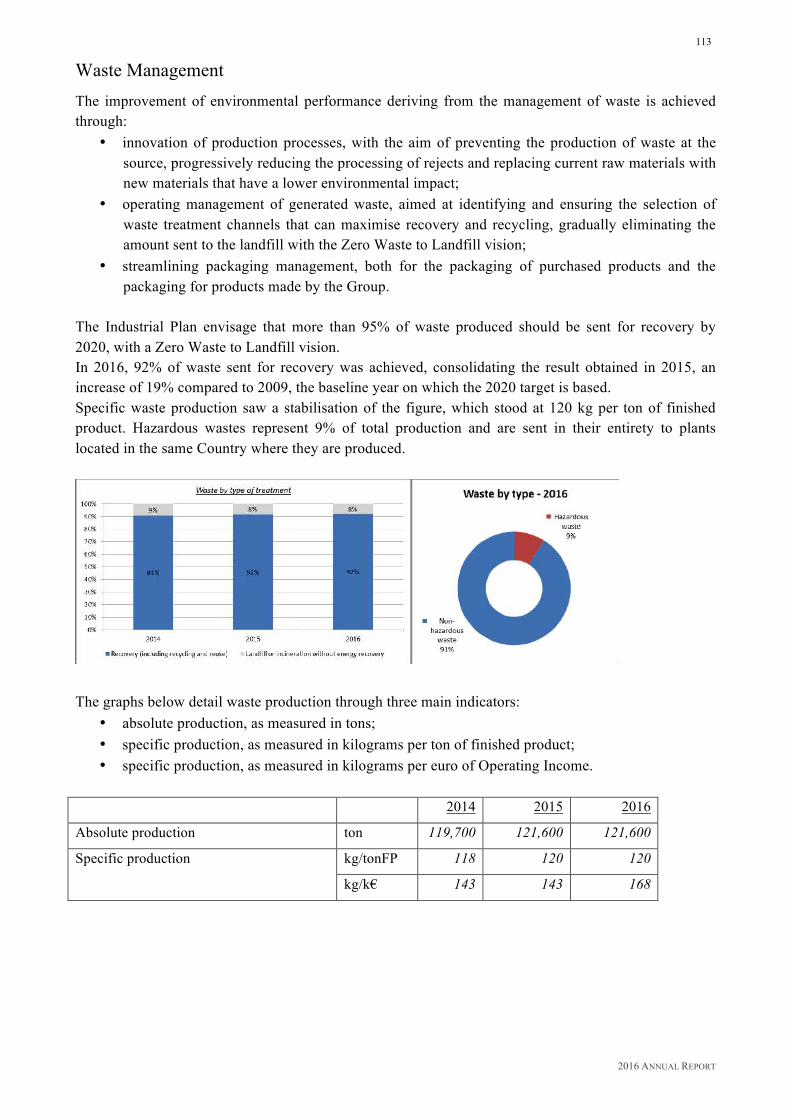
2016 ANNUAL REPORT
113
Waste Management The improvement of environmental performance deriving from the management of waste is achieved through:
• innovation of production processes, with the aim of preventing the production of waste at the source, progressively reducing the processing of rejects and replacing current raw materials with new materials that have a lower environmental impact;
• operating management of generated waste, aimed at identifying and ensuring the selection of waste treatment channels that can maximise recovery and recycling, gradually eliminating the amount sent to the landfill with the Zero Waste to Landfill vision;
• streamlining packaging management, both for the packaging of purchased products and the packaging for products made by the Group.
The Industrial Plan envisage that more than 95% of waste produced should be sent for recovery by 2020, with a Zero Waste to Landfill vision. In 2016, 92% of waste sent for recovery was achieved, consolidating the result obtained in 2015, an increase of 19% compared to 2009, the baseline year on which the 2020 target is based. Specific waste production saw a stabilisation of the figure, which stood at 120 kg per ton of finished product. Hazardous wastes represent 9% of total production and are sent in their entirety to plants located in the same Country where they are produced.
The graphs below detail waste production through three main indicators:
• absolute production, as measured in tons; • specific production, as measured in kilograms per ton of finished product; • specific production, as measured in kilograms per euro of Operating Income.
2014 2015 2016
Absolute production ton 119,700 121,600 121,600
Specific production kg/tonFP 118 120 120
kg/k€ 143 143 168
2016 ANNUAL REPORT
114
Other Environmental Aspects
Solvents
Solvents are used as ingredients in processing, mainly to reactivate vulcanised rubber, during the fabrication and finishing of tyres. Pirelli is committed to the progressive reduction of these substances, both by optimising their use, and by spreading solvent-free technologies for operations that may be performed even without their use. This resulted in a further reduction in the specific consumption of solvents of more than 5% at the end of 2016 compared to the previous year and of 39% compared to 2009, with related emissions overall slightly lower than total consumption. 2014 2015 2016
Absolute consumption ton 2,238 1,985 1,944
Specific consumption kg/tonFP 2.2 2.0 1.9
Biodiversity
Pirelli pays the utmost attention to ensuring that corporate activities do not interfere with the biodiversity characteristic of the contexts in which the Company operates. Currently, there are two Pirelli facilities located within protected and high value areas for biodiversity: the facility in Vizzola Ticino (Varese, Italy) and the facility in Gravataí (Brazil). The Vizzola Ticino site contains the tyre test
2016 ANNUAL REPORT
115
track, has an area of 0.26 square kilometers and is part of the area of Parco del Ticino in Lombardy, an MAB area (Man and Biosphere, a collection of 425 biosphere reserves located in 95 Countries around the world) defined by UNESCO. It features 21 species included on the IUCN Red List, of which: 15 are classified as “of least concern (LC)”, 1 as “near threatened (NT)”, 3 as “vulnerable (V)”, 1 as “endangered (EN)” and one as “Critically Endangered (CR)”. To ensure the utmost protection of the natural environment in which the Vizzola test track is located, Pirelli has implemented an ISO 14001 certified Environmental Management System in accordance with the Parco del Ticino. Environmental impact on biodiversity in the area are not significant; however, several interventions were carried out, both directly by the Company and by the Park Authority, to mitigate and improve the interactions of Pirelli’s activities with the natural environment, as stipulated in the agreement signed in 2001. A recent air quality monitoring campaign carried out at the Vizzola site showed that the impacts of the activity are negligible with respect to the context. The Gravataí site measures 0.54 square kilometers, of which 0.16 sq km of land ecosystem protected under federal law. Here again, Pirelli has implemented an ISO 14001 certified environmental management system to guarantee that all potential impact on the environment and on biodiversity, while deemed relatively insignificant, should be duly considered and managed in every case to reduce all possible interference to a minimum. In 2016, Pirelli continued in the compensation project of CO2 emissions produced the previous year by its fleet of company cars, using carbon credits. Direct result of the Pirelli car policy, this initiative promotes the choice of vehicles that have lower environmental impact and supports a project to save forests. The cars of the Italian company's fleet in 2015 issued 1,157 tons of CO2. In order to offset this impact on the climate, Pirelli purchased carbon credits through two projects: an international one related to the production of energy from renewable sources and an Italian one based on sustainable forest management. The first project, realized in Belo Horizonte (Brazil), consists in the collection, transport and treatment of fugitive emissions of biogas from a controlled waste landfill, which allows producing and feeding in grid electricity from renewable sources, while avoiding emissions in atmosphere of gases with climate-changing effect higher than that of CO2. The second project is located in Lombardy, near the basin of the Po River in the Cava Manara area. Pirelli’s contribution enabled the maintenance of 39 hectares of land and the care of about 40,000 plants, with the ultimate objective of rebuilding a forest that can evolve naturally, thus ensuring the survival of a large ecological corridor distributed along the banks of the river Po. The project is being carried out with the collaboration of Consorzio Forestale Unione Agricoltori di Pavia (Forest Consortium Farmers Union of Pavia). The activities financed with Pirelli’s contribution will be carried out in 2017. The union of the two projects has allowed the decrease of 175% of 2015 emissions, thus going well beyond what is required by our corporate policy with a view to increasing environmental responsibility. NOX Emissions
NOx emissions derive directly from the energy-generating processes used. In 2016, the index based on tons of finished product marked a decrease of 1% compared to the 2015 figure and a decrease of 5% compared to 2014. The emissions have been calculated by applying, to energy consumption data, the emission factors defined by the BUWAL 250 and IDEMAT 2001 databases. 2014 2015 2016
Absolute emissions tonNOX 1,994 1,918 1,903
Specific emissions kgNOX/tonFP 1.97 1.89 1.87
2016 ANNUAL REPORT
116
The following graph shows the 2016 weight of direct and indirect NOX emissions out of total NOX
emissions.
Other Emissions and Environmental Aspects
The production process does not directly use substances that are harmful to the ozone layer. These are instead contained in certain closed circuits of the cooling and air conditioning plants. Therefore, except for accidental and unforeseeable losses, there are no free emissions into the atmosphere that can be correlated with Pirelli manufacturing activities. Direct emissions of SOX, caused by the combustion of diesel and fuel oil, was estimated to be about 19 tons in 2016 (U.S. EPA emissions standards). As regards the management of packaging, tyres are generally sold without packaging. The environmental management systems implemented at the production units have assured constant and prompt monitoring and intervention regarding potential emergency situations that may arise, as well as the reports received from stakeholders. In 2016, as in the previous year, there were no significant environmental spills, and there were no significant complaints related to environmental issues. In 2016, the Company “Ecosil – Industria Quimica do Brasil” paid a fine of about 12,000 euro for an anomaly in water management occurred in 2014. The Company activated, in cooperation with the competent local authorities, all necessary measures to prevent the recurrence of such events in the future.

2016 ANNUAL REPORT
117
Expenses and Investments
In the three-year period 2014-2016, environmental expenditure related to the production process exceeded Euro 54.5 million, of which about 29% was allocated in 2016. About 94% of this amount concerned normal management and administration of factories, while the remaining 6% was dedicated to preventive measures and improvement in environmental management. Lastly, it should be noted that, consistent with the materiality analysis at the beginning of this section of the report, the most significant expenses that Pirelli dedicates to the environment are those relating to product Research & Development: in 2016, the Company invested 228.1 million euro in research and innovation of its products, with a constant focus on safety performance, reduction of environmental impacts and, simultaneously, production efficiency.

2016 ANNUAL REPORT
118
Social Dimension HUMAN RIGHTS GOVERNANCE
This paragraph describes Pirelli's approach to the protection of Human Rights in its Value chain, referring to dedicated paragraphs for in-depth discussion of specific management areas and relative performance. Pirelli bases its activities on compliance with the universally established Human Rights, as fundamental and indispensable values of its culture and business strategy, working to manage and reduce potential risks of violations and in order to avoid causing – or contributing to causing – adverse impacts to these rights in the international, multi-racial, socially and economically diverse context in which it operates. Pirelli promotes respect for Human Rights and adherence to international standards applicable at its Partners and Stakeholders and conforms its governance to the Global Compact of the United Nations, to the ISO 26000 Guidelines, to the dictates of the SA8000® Standard and underlying international standards, and the recommendations contained in the UN Guiding Principles for Business and Human Rights, implementing the Protect, Respect and Remedy Framework. Pirelli's commitment to human rights is covered extensively in the Group "Global Human Rights" Policy, as well as in "The Values and Ethical Code", in the "Social Responsibility Policy for Occupational Health, Safety and Rights, and Environment", in the "Health, Safety and Environment" Policy, in the "Privacy" Policy, and in the "Equal Opportunities Statement". These documents were communicated to employees in the local language and published on Pirelli's website in multiple languages. In particular, Pirelli's "Global Human Rights" Policy describes the management model adopted by the Company in respect of core Rights and Values such as occupational health and safety, non-discrimination, freedom of association, refusal of forced labour, guarantee of decent work conditions in economic and sustainable terms and in terms of working hours, protection of rights and values of local communities, refusal of any form of corruption, protection of privacy. To identify, assess, prevent and mitigate the risks of violation of Human Rights, the Company:
• ensures awareness among its workers through information and training starting from the course for new recruits (in this regard, reference is made to the section “Focus: Training on Sustainability” in this report);
• manages its supply chain responsibly and specifically includes respect for human rights in the selection parameters of its suppliers, the contractual clauses and verifications carried out by third-party audits. Pirelli also requires its suppliers to implement a similar business model on their supply chain, including adequate due diligence aimed at certifying that the products and materials provided to Pirelli are "conflict free" throughout the procurement chain. For an in-depth discussion on the management of Human Rights in the supply chain and on the issue of Conflict Minerals, reference is made to the paragraph "Our Suppliers" in this report;
• is open to cooperation with governmental and non-governmental, sectoral and academic entities in relation to the development of global policies and principles aimed at protecting human rights. In this regard, the risks of violation of Human and Labour Rights in the farthest tiers of the supply chain were the subject of discussion during the “Pirelli Global Stakeholder Dialogue 2016”, held in Brussels and outlined in the section of this report dedicated to Stakeholder Engagement, to which reference is made for further information;

2016 ANNUAL REPORT
119
• before investing in a specific market, conducts ad hoc assessments of any political, financial,
environmental and social risks, including those related to the respect of human and labour rights. The internal and external context is monitored in those Countries where the Company does operate, in view of preventing negative impacts on human rights in the sphere of corporate influence, and if so, remedying them;
• provides its Stakeholders with a dedicated channel for reports, also anonymous, of any situations that constitute or may constitute a risk of violation of Human Rights ("Whistleblowing Policy" published on Pirelli's website). In this regard, it is specified that also in 2016, no reports involved alleged violations of human rights or the ILO Core Labour Standards, with specific reference to forced and child labour, freedom of association and collective bargaining, discrimination. A paragraph in this report is dedicated to the "Reporting Procedure - Whistleblowing ", to which reference is made for further information on reports received in the last three years.
The human rights management processes are handled by the Pirelli Sustainability & Risk Governance Department, which acts in concert with the affected and responsible functions, central and in the various Countries, with reference to both the Internal and External Community. In terms of materiality in the corporate value chain, the respect for human rights and labour rights assumes particular importance in human resources and the supply chain management. The management of human and labour rights in the Internal Community is outlined in the paragraph on “Compliance with statutory and contractual obligations governing overtime, time off, association and negotiation, equal opportunities and non-discrimination, bans on child and forced labour”, to which reference is made for related details. The management of human rights in the supply chain is reported in the section “Our Suppliers” of this report, to which reference is made for more details. In 2017, with the support of the Sustainability Managers of the various countries where Pirelli operates and the reference local NGOs, Pirelli will perform an update of the assessment on risk of violations of human and labour rights considering the entire value chain.

2016 ANNUAL REPORT
120
INTERNAL COMMUNITY The Human Capital Sustainable Management Model is inspired by the Global Compact principles, the SA8000® Standard, which for years has been the reference tool for the Group’s social responsibility management, and the ISO 26000 Guidelines. This results in Values and in the specific commitments that the Company states in the “Ethical Code”, in the “Global Human Rights” Policy, in the “Health, Safety and Environment” Policy, in the “Social Responsibility Policy for Occupational Health, Safety and Rights, and Environment” and in the “Equal Opportunities Statement”, communicated to all employees in the local language and made available to all stakeholders in the Sustainability section of the website www.pirelli.com. PIRELLI EMPLOYEES AROUND THE WORLD Pirelli's employees at December 31, 2016 – expressed in Full Time Equivalent - amounted to 37,050 resources (vs. 35,856 in 2015 and 35,910 in 2014) and include 986 resources of the Chinese plant of Jiaozuo that joined the Group in October 2016; on a like-for-like basis, there was thus an increase of 208 resources over the previous year.
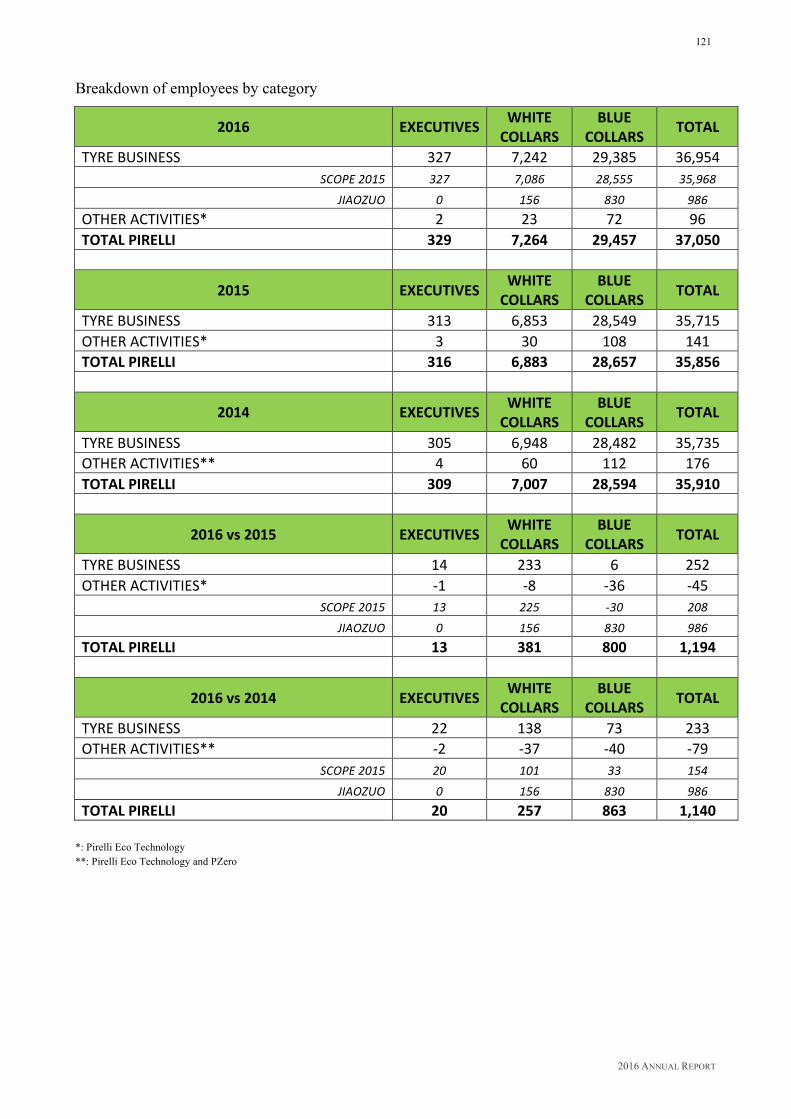
2016 ANNUAL REPORT
121
Breakdown of employees by category
2016 EXECUTIVES WHITECOLLARS
BLUECOLLARS TOTAL
TYREBUSINESS 327 7,242 29,385 36,954SCOPE2015 327 7,086 28,555 35,968
JIAOZUO 0 156 830 986OTHERACTIVITIES* 2 23 72 96TOTALPIRELLI 329 7,264 29,457 37,050
2015 EXECUTIVES WHITE
COLLARSBLUE
COLLARS TOTAL
TYREBUSINESS 313 6,853 28,549 35,715OTHERACTIVITIES* 3 30 108 141TOTALPIRELLI 316 6,883 28,657 35,856
2014 EXECUTIVES WHITECOLLARS
BLUECOLLARS TOTAL
TYREBUSINESS 305 6,948 28,482 35,735OTHERACTIVITIES** 4 60 112 176TOTALPIRELLI 309 7,007 28,594 35,910
2016vs2015 EXECUTIVES WHITE
COLLARSBLUE
COLLARS TOTAL
TYREBUSINESS 14 233 6 252OTHERACTIVITIES* -1 -8 -36 -45
SCOPE2015 13 225 -30 208JIAOZUO 0 156 830 986
TOTALPIRELLI 13 381 800 1,194
2016vs2014 EXECUTIVES WHITE
COLLARSBLUE
COLLARS TOTAL
TYREBUSINESS 22 138 73 233OTHERACTIVITIES** -2 -37 -40 -79
SCOPE2015 20 101 33 154JIAOZUO 0 156 830 986
TOTALPIRELLI 20 257 863 1,140 *: Pirelli Eco Technology **: Pirelli Eco Technology and PZero

2016 ANNUAL REPORT
122
Breakdown of employees by geographical area*** and gender
2016 TYREBUSINESS OTHERACTIVITIES TOTALPIRELLI Men Women Total Men Women Total Men Women TotalEUROPE 12,537 2,336 14,873 50 45 95 12,587 2,382 14,969NAFTA 1,761 336 2,097 0 0 0 1,761 336 2,097SOUTHAMERICA 11,071 707 11,779 0 0 0 11,071 707 11,779MEA 3,226 105 3,331 0 0 0 3,226 105 3,331ASIAPACIFIC 3,913 961 4,874 1 0 1 3,914 961 4,875TOTAL 32,508 4,446 36,954 51 45 96 32,559 4,491 37,050
2015 TYREBUSINESS OTHERACTIVITIES TOTALPIRELLI Men Women Total Men Women Total Men Women TotalEUROPE 12,327 2,351 14,678 78 62 140 12,405 2,413 14,818NAFTA 1,436 284 1,720 0 0 0 1,436 284 1,720SOUTHAMERICA 11,402 741 12,144 0 0 0 11,402 741 12,144MEA 3,239 80 3,319 0 0 0 3,239 80 3,319ASIAPACIFIC 3,056 799 3,855 1 0 1 3,057 799 3,856TOTAL 31,460 4,255 35,715 79 62 141 31,539 4,317 35,856
2014 TYREBUSINESS OTHERACTIVITIES TOTALPIRELLI Men Women Total Men Women Total Men Women TotalEUROPE 12,172 2,388 14,561 90 85 175 12,262 2,473 14,735NAFTA 1,260 195 1,455 0 0 0 1,260 195 1,455SOUTHAMERICA 12,359 752 13,111 0 0 0 12,359 752 13,111MEA 2,751 73 2,824 0 0 0 2,751 73 2,824ASIAPACIFIC 3,008 776 3,784 1 0 1 3,009 776 3,785TOTAL 31,550 4,184 35,735 91 85 176 31,641 4,269 35,910
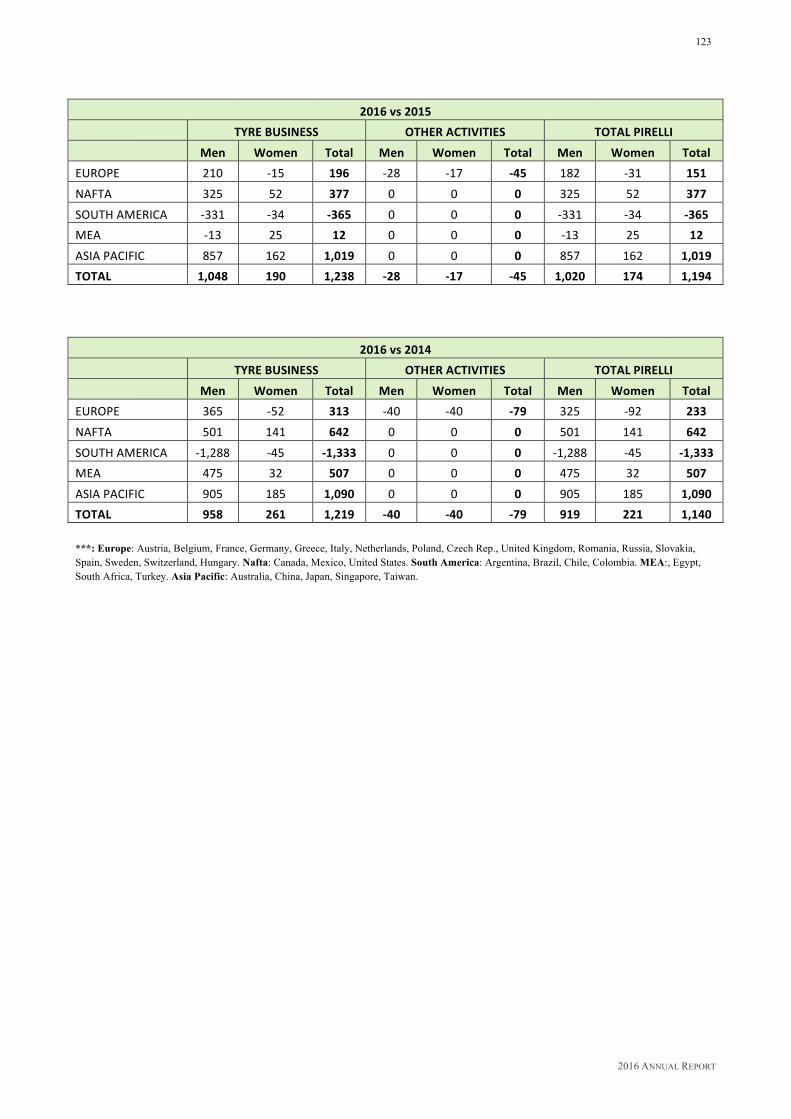
2016 ANNUAL REPORT
123
2016vs2015 TYREBUSINESS OTHERACTIVITIES TOTALPIRELLI Men Women Total Men Women Total Men Women TotalEUROPE 210 -15 196 -28 -17 -45 182 -31 151NAFTA 325 52 377 0 0 0 325 52 377SOUTHAMERICA -331 -34 -365 0 0 0 -331 -34 -365MEA -13 25 12 0 0 0 -13 25 12ASIAPACIFIC 857 162 1,019 0 0 0 857 162 1,019TOTAL 1,048 190 1,238 -28 -17 -45 1,020 174 1,194
2016vs2014 TYREBUSINESS OTHERACTIVITIES TOTALPIRELLI Men Women Total Men Women Total Men Women TotalEUROPE 365 -52 313 -40 -40 -79 325 -92 233NAFTA 501 141 642 0 0 0 501 141 642SOUTHAMERICA -1,288 -45 -1,333 0 0 0 -1,288 -45 -1,333MEA 475 32 507 0 0 0 475 32 507ASIAPACIFIC 905 185 1,090 0 0 0 905 185 1,090TOTAL 958 261 1,219 -40 -40 -79 919 221 1,140***: Europe: Austria, Belgium, France, Germany, Greece, Italy, Netherlands, Poland, Czech Rep., United Kingdom, Romania, Russia, Slovakia, Spain, Sweden, Switzerland, Hungary. Nafta: Canada, Mexico, United States. South America: Argentina, Brazil, Chile, Colombia. MEA:, Egypt, South Africa, Turkey. Asia Pacific: Australia, China, Japan, Singapore, Taiwan.
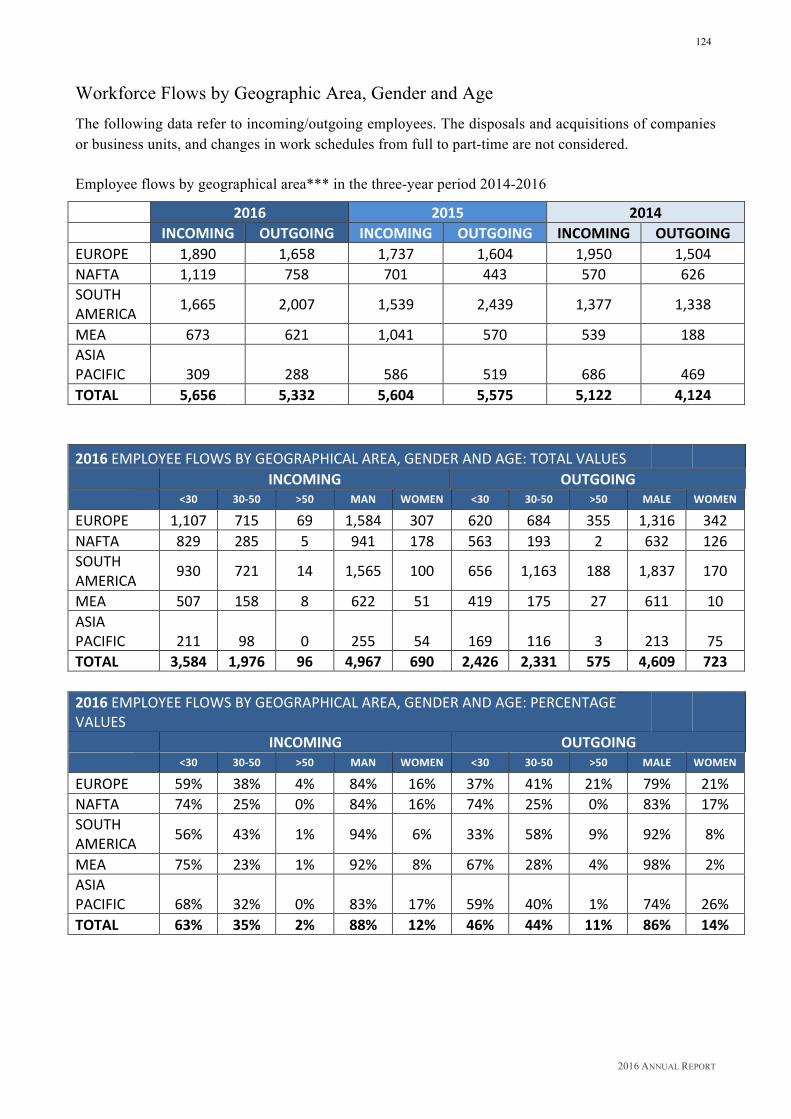
2016 ANNUAL REPORT
124
Workforce Flows by Geographic Area, Gender and Age
The following data refer to incoming/outgoing employees. The disposals and acquisitions of companies or business units, and changes in work schedules from full to part-time are not considered. Employee flows by geographical area*** in the three-year period 2014-2016
2016 2015 2014 INCOMING OUTGOING INCOMING OUTGOING INCOMING OUTGOINGEUROPE 1,890 1,658 1,737 1,604 1,950 1,504NAFTA 1,119 758 701 443 570 626SOUTHAMERICA 1,665 2,007 1,539 2,439 1,377 1,338
MEA 673 621 1,041 570 539 188ASIAPACIFIC 309 288 586 519 686 469TOTAL 5,656 5,332 5,604 5,575 5,122 4,124
2016EMPLOYEEFLOWSBYGEOGRAPHICALAREA,GENDERANDAGE:TOTALVALUES INCOMING OUTGOING <30 30-50 >50 MAN WOMEN <30 30-50 >50 MALE WOMENEUROPE 1,107 715 69 1,584 307 620 684 355 1,316 342NAFTA 829 285 5 941 178 563 193 2 632 126SOUTHAMERICA 930 721 14 1,565 100 656 1,163 188 1,837 170
MEA 507 158 8 622 51 419 175 27 611 10ASIAPACIFIC 211 98 0 255 54 169 116 3 213 75TOTAL 3,584 1,976 96 4,967 690 2,426 2,331 575 4,609 723
2016EMPLOYEEFLOWSBYGEOGRAPHICALAREA,GENDERANDAGE:PERCENTAGEVALUES INCOMING OUTGOING <30 30-50 >50 MAN WOMEN <30 30-50 >50 MALE WOMENEUROPE 59% 38% 4% 84% 16% 37% 41% 21% 79% 21%NAFTA 74% 25% 0% 84% 16% 74% 25% 0% 83% 17%SOUTHAMERICA 56% 43% 1% 94% 6% 33% 58% 9% 92% 8%
MEA 75% 23% 1% 92% 8% 67% 28% 4% 98% 2%ASIAPACIFIC 68% 32% 0% 83% 17% 59% 40% 1% 74% 26%TOTAL 63% 35% 2% 88% 12% 46% 44% 11% 86% 14%

2016 ANNUAL REPORT
125
2015EMPLOYEEFLOWSBYGEOGRAPHICALAREA,GENDERANDAGE:TOTALVALUES INCOMING OUTGOING <30 30-50 >50 MAN WOMEN <30 30-50 >50 MALE WOMEN
EUROPE 1,049 600 88 1,449 288 570 647 388 1,240 364NAFTA 500 198 3 558 143 304 132 7 378 65SOUTHAMERICA 888 635 17 1,375 164 1,134 1,156 150 2,263 176
MEA 635 392 14 1,030 11 416 132 22 561 9ASIAPACIFIC 401 185 0 493 93 316 202 1 445 74TOTAL 3,473 2,009 122 4,905 699 2,739 2,269 568 4,887 6882015EMPLOYEEFLOWSBYGEOGRAPHICALAREA,GENDERANDAGE:PERCENTAGEVALUES INCOMING OUTGOING <30 30-50 >50 MAN WOMEN <30 30-50 >50 MALE WOMENEUROPE 60% 35% 5% 83% 17% 36% 40% 24% 77% 23%NAFTA 71% 28% 0% 80% 20% 69% 30% 2% 85% 15%SOUTHAMERICA 58% 41% 1% 89% 11% 46% 47% 6% 93% 7%
MEA 61% 38% 1% 99% 1% 73% 23% 4% 98% 2%ASIAPACIFIC 68% 32% 0% 84% 16% 61% 39% 0% 86% 14%TOTAL 62% 36% 2% 88% 12% 49% 41% 10% 88% 12%
2014EMPLOYEEFLOWSBYGEOGRAPHICALAREA,GENDERANDAGE:TOTALVALUES INCOMING OUTGOING <30 30-50 >50 MAN WOMEN <30 30-50 >50 MALE WOMENEUROPE 1,294 531 124 1,698 252 766 533 205 1,257 247NAFTA 363 198 9 554 16 384 226 16 612 14SOUTHAMERICA 902 463 13 1,245 132 654 597 87 1,198 140
MEA 505 34 0 538 1 84 90 14 184 4ASIAPACIFIC 512 174 0 620 66 335 129 5 401 68TOTAL 3,576 1,400 146 4,655 467 2,223 1,574 327 3,651 473

2016 ANNUAL REPORT
126
2014EMPLOYEEFLOWSBYGEOGRAPHICALAREA,GENDERANDAGE:PERCENTAGEVALUES INCOMING OUTGOING <30 30-50 >50 MAN WOMEN <30 30-50 >50 MALE WOMENEUROPE 66% 27% 6% 87% 13% 51% 35% 14% 84% 16%NAFTA 64% 35% 2% 97% 3% 61% 36% 3% 98% 2%SOUTHAMERICA 65% 34% 1% 90% 10% 49% 45% 7% 90% 10%
MEA 94% 6% 0% 100% 0% 45% 48% 7% 98% 2%ASIAPACIFIC 75% 25% 0% 90% 10% 72% 28% 1% 85% 15%TOTAL 70% 27% 3% 91% 9% 54% 38% 8% 89% 11%***: Europe: Austria, Belgium, France, Germany, Greece, Italy, Netherlands, Poland, Czech Rep., United Kingdom, Romania, Russia, Slovakia, Spain, Sweden, Switzerland, Hungary. Nafta: Canada, Mexico, United States. South America: Argentina, Brazil, Chile, Colombia. MEA:, Egypt, South Africa, Turkey. Asia Pacific: Australia, China, Japan, Singapore, Taiwan.
During the year, the Company operated internationally to rebalance the employment level aligning it to the needs of volume related to high market volatility, obtaining a positive occupational balance compared to 2015. Considering mature Countries (Countries where Pirelli operates, internationally defined as “mature” or “non-emerging” markets), in Italy, there was the strengthening of HQ structures mainly in the areas dedicated to research and development. As for emerging markets (Countries where Pirelli operates, internationally defined as “emerging”, namely Romania, Russia, Argentina, Brazil, Chile, Colombia, Mexico, Venezuela, Egypt, Turkey, China), in addition to the aforementioned acquisition of the Chinese facility of Jiaozuo, the Company increased the number of employees mainly in Romania and Mexico, acting on the organisation and production processes in line with market requirements. As for Brazil, the reorganization process of the production structure continued and led to a downsizing of the workforce especially in the plants of Santo André and Bahia following the crisis situation of the country and the related negative impact in the Tyre sector. The year 2016 finally showed stability of inflows in the face of a reduction in outflows over the previous year. Pirelli does not employ anyone under the age of 15. There are 41 young people aged between 15 and 18 (17 in Brazil, 12 in Germany, 6 in the UK, 4 in Switzerland and 2 in Sweden), each for training and integration plans, in harmony with local laws. DIVERSITY MANAGEMENT Pirelli is characterised by a multinational context where individuals manifest a great diversity, whose conscious management simultaneously creates a competitive advantage for the Company and a shared social value. Pirelli’s commitment to compliance with equal opportunities and the enhancement of diversity in the workplace is expressed in the main Group Sustainability documents: the “Ethical Code” approved by the Board of Directors, the “Social Responsibility Policy for Occupational Health, Safety and Rights, Environment” and the “Equal Opportunities Statement”, both signed by the Chairman.

2016 ANNUAL REPORT
127
These documents have been distributed to all employees in their local language and published on the institutional website www.pirelli.com/Sustainability. While respecting the cultural differences of the individual Countries, what necessarily unites all Pirelli affiliates in the same culture are its shared corporate values, policies and rules, which are applied at Group level and communicated in the local language. In 2015, remote training was provided in 24 countries on issues of diversity management at the company and related value, already initiated in 2014 in Italy. The course, developed centrally in collaboration with local representatives in order to ensure maximum effectiveness, has been translated into 11 languages and offered to all group employees, on line or in print copy. Pirelli monitors the level of acceptance and appreciation of diversity perceived by employees within their own reality. The survey is conducted as part of the annual “My Voice” climate survey, conducted in the local language at Group level (reference is made to the dedicated paragraph in this report). The results of the survey, conducted in late 2016, as every year have been particularly appreciable with regard to the perception of respect and management of Diversities, which remains a distinctive feature of the corporate culture of Pirelli. The results of the survey carried out at the end of 2016 will instead be communicated to employees in the first quarter of 2017. A functional tool for the management of equal opportunities and the prevention of risk of breach thereof is the Group Whistleblowing Procedure, through which employees, suppliers and the External Community can anonymously report any suspected violation. Also in 2016, there were no whistleblowing reports concerning acts of discrimination.For further information on reports received in 2016, 2015 and 2014, reference is made to the paragraph “Reporting Procedure – Whistleblowing”. Internationality and multiculturalism are the characteristic elements of the Group: Pirelli operates in over 160 Countries on five continents, and 91.2% of employees (at December 31, 2016) worked outside of Italy. Awareness of the cultural differences that create the identity of the Company entails displaying the utmost confidence in management of local origin: 80% of Senior Managers work in their Country of origin, where Senior Managers are those reporting directly to the Chairman and CEO at December 31, 2016. In order to develop the innovative and managerial potential inherent in multiculturalism and in dealings with different professional environments, the Company promotes the growth of its managers through international mobility: 60% of active Senior Managers in 2016 have in fact experienced at least one inter-company assignment during their professional experience within the Pirelli Group. At the end of 2016, moreover, 13.2% of expatriates were women (up from 13% in 2015). Below is a breakdown of employees by gender, expressed as the percentage weight of women against the total number of employees in each job category, with reference to the three-year period 2014-2015-2016, the data shown in the following table show substantial stability in 2016 compared to 2015, with an increase compared to 2014. The percentage of women of the total Pirelli population stood at 12.1%, of total executives at 9.1%, of total managerial positions at 18.6% and of total workers at 8%. However, the percentage of women in Executive positions rose to 21%, the latter being an important element as this category constitutes a growth pool.
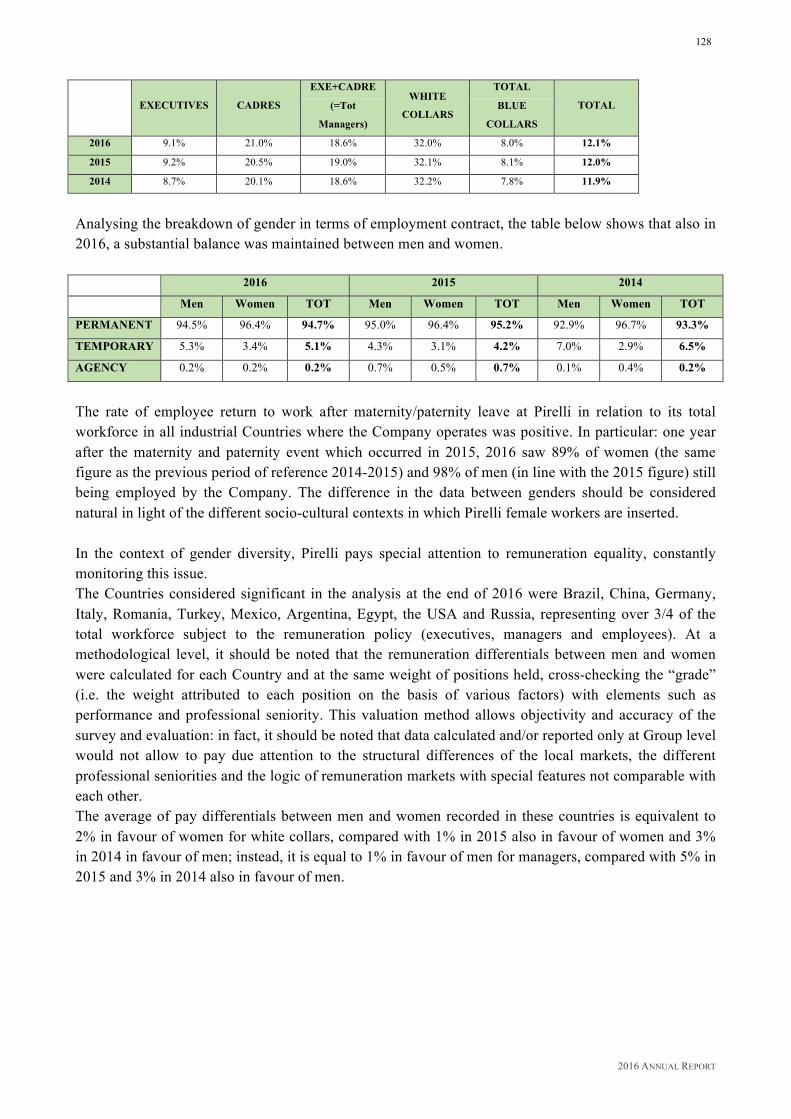
2016 ANNUAL REPORT
128
EXECUTIVES CADRES
EXE+CADRE WHITE
COLLARS
TOTAL
TOTAL (=Tot
Managers)
BLUE
COLLARS
2016 9.1% 21.0% 18.6% 32.0% 8.0% 12.1%
2015 9.2% 20.5% 19.0% 32.1% 8.1% 12.0%
2014 8.7% 20.1% 18.6% 32.2% 7.8% 11.9%
Analysing the breakdown of gender in terms of employment contract, the table below shows that also in 2016, a substantial balance was maintained between men and women.
2016 2015 2014
Men Women TOT Men Women TOT Men Women TOT
PERMANENT 94.5% 96.4% 94.7% 95.0% 96.4% 95.2% 92.9% 96.7% 93.3%
TEMPORARY 5.3% 3.4% 5.1% 4.3% 3.1% 4.2% 7.0% 2.9% 6.5%
AGENCY 0.2% 0.2% 0.2% 0.7% 0.5% 0.7% 0.1% 0.4% 0.2%
The rate of employee return to work after maternity/paternity leave at Pirelli in relation to its total workforce in all industrial Countries where the Company operates was positive. In particular: one year after the maternity and paternity event which occurred in 2015, 2016 saw 89% of women (the same figure as the previous period of reference 2014-2015) and 98% of men (in line with the 2015 figure) still being employed by the Company. The difference in the data between genders should be considered natural in light of the different socio-cultural contexts in which Pirelli female workers are inserted. In the context of gender diversity, Pirelli pays special attention to remuneration equality, constantly monitoring this issue. The Countries considered significant in the analysis at the end of 2016 were Brazil, China, Germany, Italy, Romania, Turkey, Mexico, Argentina, Egypt, the USA and Russia, representing over 3/4 of the total workforce subject to the remuneration policy (executives, managers and employees). At a methodological level, it should be noted that the remuneration differentials between men and women were calculated for each Country and at the same weight of positions held, cross-checking the “grade” (i.e. the weight attributed to each position on the basis of various factors) with elements such as performance and professional seniority. This valuation method allows objectivity and accuracy of the survey and evaluation: in fact, it should be noted that data calculated and/or reported only at Group level would not allow to pay due attention to the structural differences of the local markets, the different professional seniorities and the logic of remuneration markets with special features not comparable with each other. The average of pay differentials between men and women recorded in these countries is equivalent to 2% in favour of women for white collars, compared with 1% in 2015 also in favour of women and 3% in 2014 in favour of men; instead, it is equal to 1% in favour of men for managers, compared with 5% in 2015 and 3% in 2014 also in favour of men.
2016 ANNUAL REPORT
129
A few examples:
• Italy, which has a difference between average remuneration for men and average remuneration for women of around 1% in favour of women for the category of white collars (compared to 13% in 2015 and 5% in 2014 in favour of men) and 2% also in favour of women for the category of managers (1% in 2015 and 2% in 2014);
• Turkey, where the differential is in favour of men for 15.7% for the category of white collars (4% in 2015 and 5% in 2014);
• Romania, where for the category of white collars the differential is equal to 1% in favour of men (compared to 5% in 2015 and 7% in 2014 in favour of women);
• Brazil, where for the category of white collars there is substantial equal pay for men and women (5% in favour women in 2015 and 4% in favour of men in 2014) and the same applies for the category of managers (4% in favour of men in 2015, 1% also for men in 2014);
• Germany, which showed a difference between average remuneration for men and average remuneration for women of around 3% in favour of men for the category of white collars (4% in 2015 and 5% in 2014) and 6% also in favour of men for the category of managers (3% in 2015 and 2% in 2014).
Finally, with reference to the population of executives, of which women account for 9% (figure unchanged compared to 2015 and 2014), there is an average remuneration difference of 8% in favour of women (in 2015, the ratio was 5% in favour of women, while in 2014 the ratio was 6% in favour of men). In the various markets, the “professional seniority” factor, still on average of benefit of men, continues to have a strong impact on the remuneration trend. On the other hand, the number of women who enter the labour market will contribute in the medium term to an increasing balance between genders, also in terms of professional seniority. In regard to the standard salary of new hires during their first year of work at Pirelli, this is greater than the minimums prescribed by local legislation and there are no differences between men and women or related to other diversity factors. The inclusive culture by which Pirelli is guided in its way of doing business permeates corporate life even in the case of disability, as explained in the Pirelli Policy on equal opportunities, applied at all affiliates of the Group. Under applicable local laws, approximately 1.1% of total employees in 2016 (vs. 1.2% in 2015) have some form of disability, however with the following considerations: the percentage measurement of disabled employees in the multinational context of the company clashes with the objective difficulty of measuring their number, both because in many countries where the Group is present, there are no specific laws or regulations promoting their employment and therefore disabilities are not automatically detected, and because in many countries this information is deemed confidential and protected by privacy laws; it is therefore likely that the actual percentage of disabled persons working at Pirelli might be higher than the above figure. With reference to the “age” factor of the company population, as can be seen from the table below, it is homogeneous between gender.
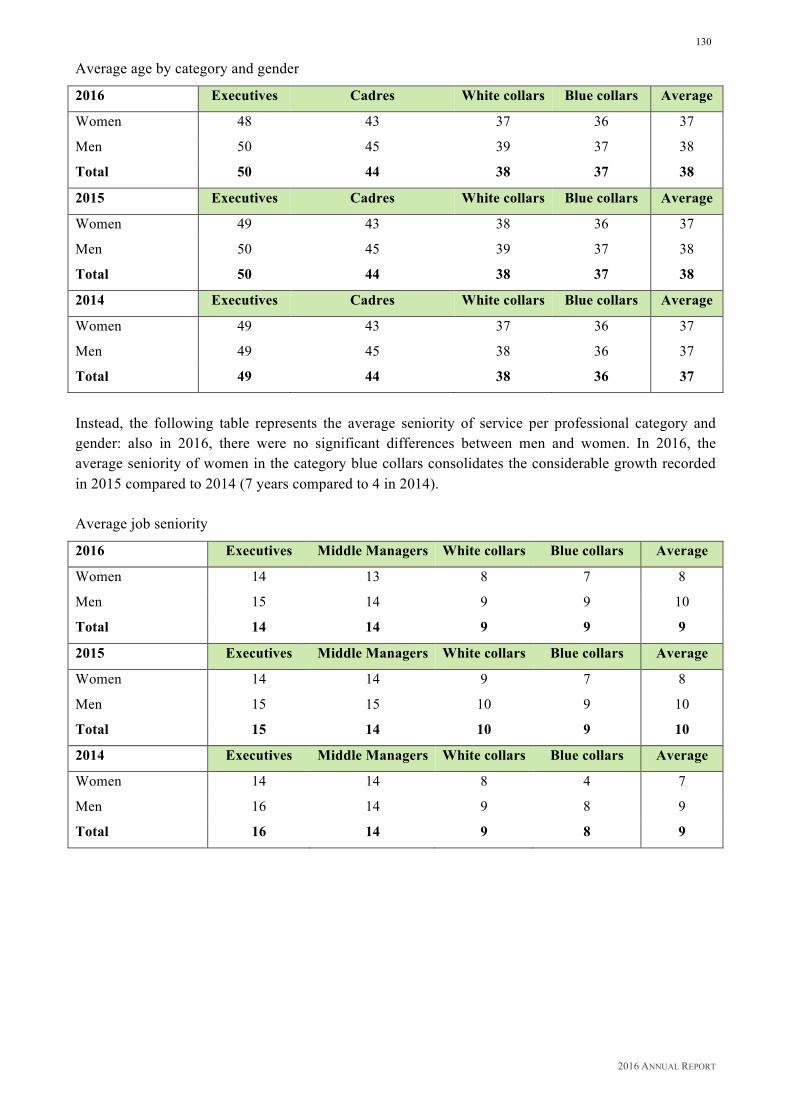
2016 ANNUAL REPORT
130
Average age by category and gender
2016 Executives Cadres White collars Blue collars Average
Women 48 43 37 36 37
Men 50 45 39 37 38
Total 50 44 38 37 38
2015 Executives Cadres White collars Blue collars Average
Women 49 43 38 36 37
Men 50 45 39 37 38
Total 50 44 38 37 38
2014 Executives Cadres White collars Blue collars Average
Women 49 43 37 36 37
Men 49 45 38 36 37
Total 49 44 38 36 37
Instead, the following table represents the average seniority of service per professional category and gender: also in 2016, there were no significant differences between men and women. In 2016, the average seniority of women in the category blue collars consolidates the considerable growth recorded in 2015 compared to 2014 (7 years compared to 4 in 2014). Average job seniority
2016 Executives Middle Managers White collars Blue collars Average
Women 14 13 8 7 8
Men 15 14 9 9 10
Total 14 14 9 9 9
2015 Executives Middle Managers White collars Blue collars Average
Women 14 14 9 7 8
Men 15 15 10 9 10
Total 15 14 10 9 10
2014 Executives Middle Managers White collars Blue collars Average
Women 14 14 8 4 7
Men 16 14 9 8 9
Total 16 14 9 8 9
2016 ANNUAL REPORT
131
The following procedures and activities to promote equal opportunities have been well-established for years:
• the use, as far as possible, of candidate lists with a significant presence of women in recruitment processes;
• the use of training to promote cultural change connected with the promotion of diversity, with specific modules dedicated to “Diversity Management,” beginning with courses for new hires (e.g. Pirelli’s Way Joining the Group);
• the taking of positive measures regarding cultural and religious diversity (such as different foods that are clearly marked in company canteens so that everyone may freely comply with their own religious dietary restrictions);
• “multilingual” book stores at the factories; • welcome kits for those joining Pirelli at a facility in a country other than their home country; • welfare and work-life balance initiatives (in regard, refer to the paragraph “Welfare and
initiatives for the Internal Community” in this report); • participation, at the end of 2016, in a survey sponsored by BCG and Value D "Women at the
top" on the perception of careers for women in the company. The survey results will be available in early 2017 and will be analyzed internally along with the results of the opinion survey "My Voice 2016" (to which a paragraph is dedicated in this report) in order to read the results in an integrated manner and also define action plans that are as comprehensive and effective as possible.
REMUNERATION AND SUSTAINABILITY The remuneration policies adopted by Pirelli aim to ensure fair remuneration in line with the individual’s contribution to the success of the Company, recognising the performance and quality of the individual’s professional input, in a philosophy of sustainable remuneration. The purpose is twofold: on the one hand to attract, retain and motivate critical employees, while on the other to reward and promote conduct that is as far as possible consistent with the corporate culture and values. Compensation policies and processes for Group management (intended as the overall executives) are managed by the central Human Resources and Organisation department, while for non-executive personnel they are handled on an individual Country basis. Once again in 2016, and in accordance with market best practices, the impact of the (short-term and medium-term) variable component on the aggregate remuneration of Group management remained very high, which means that there is a strict correlation between remuneration and performance. Members of Management in general are connected to the Annual Incentive Plan (MBO) linked to the achievement of annual economic-financial objectives of the Group and/or Business Unit and/or Region and the assessment resulting from the Performance Management Tool, which allows greater relevance to be attributed to organisational conduct (how), and not simply the results achieved (how much). The Performance Management of all Country CEOs includes economic sustainability, social and environmental objectives. For further details in this regard, reference is made to the paragraph "Performance Management" of this report. In 2014, some changes and improvements were made to the annual incentive system (MBO) which is no longer related to the Triennial Incentive Plan (LTI) but includes a form of deferred payment to the following year of a part (25%) of the annual incentive accrued subject to accrual of the MBO of the following year. Payment of an additional amount equal to a variable percentage of the entire MBO
2016 ANNUAL REPORT
132
accrued during the previous year will be paid in line with the degree that the MBO is achieved in the following year. The changed shareholder structure and the simultaneous delisting at the end of 2015 meant that the company's long-term average targets should be revised in the 2016-2018 three-year period. By resolution of the Board of Directors of December 22, 2015, the 2014-2016 Long Term Incentive – LTI was terminated early at the end of 2015 (a year before the natural expiry). With a view to retaining management, the Board of Directors also approved the payment in 2 instalments (April 2016 and April 2017) on the basis of reporting the newly measured goals – even in terms of percentage opportunities for each individual participant – on the values for the two-year period (2014-2015). At the beginning of 2016, a new three-year incentive plan (LTI 2016-2018) was launched and extended to the majority of Executives of the Group, in line with the variable remuneration mechanisms adopted at international level, totally self-financed as the related expenses are included in the economic data of the Industrial Plan. The General Policy on Remuneration will be reviewed in 2017 by the Board of Directors of Pirelli, establishing principles and Guidelines to which Pirelli abides in order to determine and monitor the application of related remuneration practices of Directors with special powers/offices, General Managers and Executives with strategic responsibilities; Senior Managers and other Group Executives. Specifically, the Remuneration Guidelines for the above management figures will also cover:
• fixed and variable remuneration, both short and medium-long term (it is noted in this regard that Pirelli currently has no existing forms of remuneration through equity);
• compensation in case of dismissal; • resignation and termination of employment; • clawback clauses for Top Management.
INTERNATIONAL MOBILITY The theme of international mobility has always been important to Pirelli, with a view to achieving cultural and value integration while still respecting diversity, an approach that the Company considers crucial to maintaining and creating value in the long term. The dissemination of the Pirelli industrial culture throughout the world and the transfer of valuable technical and managerial know-how to new start-ups is also a key instrument in support of the Group’s geographical expansion strategy. In 2016, about 80 new inter-company expatriates were recorded, compared with about 90 postings in 2015 and about 50 in 2014. About a third of new postings were to major industrial Countries, such as China and Russia, and mobility flows continued from emerging Countries to mature Countries. At December 31, 2016, the expatriate population totalled about 227 persons (vs. 217 in 2015 and 214 in 2014), belonging to 19 nationalities and who moved to 33 different Countries on five continents, of which 13% women. The overall expatriate population consists in equal amounts (50%) of Italian and foreign citizens, demonstrating the concrete progress being made towards the goal of creating an increasingly international management team. The Pirelli International Mobility Policy has been standardised and shared within all the affiliates, with common treatment rules in order to enable uniform management of the expatriate personnel of the entire Group. It includes a principle of fiscal neutrality pursued through the implementation of a so-called “tax equalisation” policy, which allows neutralising of the tax differences that arise in the destination country
2016 ANNUAL REPORT
133
with respect to the country of origin, ensuring the application of equitable and appropriate remuneration principles, in addition to the assignment of certain benefits closely related to care for expatriates and their accompanying families. EMPLOYER BRANDING Pirelli considers it crucial to enter the market by transmitting drivers that distinguish the group, that is, Business, People and Change, which include the cardinal principles on which the Company bases its business approach, such as technological know-how and product innovation, technological and commercial leadership in the highest segment of the market, the tension of the people towards results and the meritocracy that always ensures the best growth for employees, both locally and internationally. In addition to disseminating the company principles, Employer Branding is also a valuable tool to give visibility to job opportunities aimed at recent graduates and profiles with experience, not only in the Italian market but globally. Considering only the countries where Pirelli has a presence with one or more production plants in Europe, the United States, South America, the Middle East, Africa, Russia and Asia-Pacific, over 200 events, projects and meetings were organised in 2016, where the Company promoted its own Employer Branding initiatives. These activities are carried out also thanks to the network of contacts and partnerships with some prestigious universities in the various countries, such as the Beijing University of Chemical Technology in Beijing, the University of Munich in Germany, the Nottingham Trent University in the United Kingdom, the Politehnica University of Bucharest in Romania, the ESIC - Business Marketing School in Spain, the Universidad de Buenos Aires in Argentina, the Universidad Tecnológica del Centro in Venezuela, the Instituto Tecnológico de Estudios Superiores de México, the Keio University in Japan, the American University of Cairo in Egypt. Pirelli is also collaborating actively, at corporate level in Italy, with Politecnico di Milano, Politecnico di Torino, Università Bocconi, Università Cattolica and Università degli Studi di Torino. The latter Universities are located close to the Pirelli offices in Italy and the Company has always considered them to be a benchmark for economic and engineering education of young people. With these institutions, Pirelli has organised Career Days, roundtables, Job Fairs, as well as company presentations and opportunities to meet with students directly at the company, aimed at “personally experiencing” the reality of the Group. The business-education partnerships described above are placed within the context of the “European Pact for Youth” of which Pirelli is a co-initiator, a Pact that was signed during the last Enterprise 2020 Summit (held in November 2015 in Brussels) by the European Commission, CSR Europe and a group of companies. The Pact aims to promote the growth of new generations through the promotion of partnerships with Universities, training courses, internships and masters’ courses: the objective of reducing the skills gap between different countries and different cultures is fundamental, trying as much as possible to ensure that young people receive the training needed to enter the new professions required by a labour market whose expectations are constantly evolving. Among the channels of Employer Branding used by Pirelli, the internet plays an important role: on its pirelli.com website, the Company provides a channel for those who wish to submit their application for specific open positions, as well as providing full disclosure on its corporate history, management models adopted, objectives and results achieved; targeted channels are also used by Pirelli for the
2016 ANNUAL REPORT
134
publication of its job offers, including LinkedIn where in the last year, Pirelli has doubled its audience (in terms of engagement and views), remaining the most visited profile among tyre manufacturers.
DEVELOPMENT Performance Management Performance Management (PM) means the process whereby the contribution of each employee in an organisation is defined, observed and assessed at Pirelli, a unique and fundamental opportunity for the development and orientation of each with respect to a series of predefined indicators that are critical to the success of the Company and the employee. During the process, particular value is given at the time of feedback, which provides a transparent and open dialogue between the manager and the employee, from the phase of defining the individual objectives to that of assessment of the results achieved. The Performance Management process involves all staff worldwide (executives, managers and employees) and in 2016 saw a “redemption” rate (2015 assessment sheets completed compared to the total of open sheets) equal to 96%, of which the completion rate by women involved in the process was 94%. To support the quality of assessments, Pirelli has introduced the so-called Calibration Meetings. These are meetings organised by the managers of the individual functions, Business Units and countries, with their direct reports, and with the heads of Human Resources of reference, during which the assessments of people who belong to a specific organisational unit are pooled with the objective of ensuring a shared and balanced distribution of the assessment, to ensure a process that is as consistent, homogeneous and objective as possible. The Performance Management of all Country CEOs includes economic sustainability, social and environmental objectives. In particular, the performance obtained regarding the Sustainability Plan of the country is evaluated, which envisages targets of compliance with the SA8000® Standard, reduction in injury frequency indexes, specific reduction (weighted on the total finished product) in energy consumption and water withdrawal, increase in waste recovery, control of the sustainability of the supply chain, dissemination and implementation of Group Policies and engagement with stakeholders. Talent Review
The Talent Review process aims to place “people in the right place”, or to ensure business continuity through the coverage of strategic positions with the best “talents”, both centrally and at each Affiliate. Key positions are those positions that have a direct impact on the strategic success and competitive advantage of the organisation. Each of these positions also includes a vacancy risk identification in the following 12-18 months, in such a way that concrete mitigation actions can be implemented, where necessary. Talents are employees who, in addition to having demonstrated positive performance in the previous 2 years, possess the potential to hold, immediately or within the next two years, key positions within the organisation. In fact, they represent the future of the Company for the coverage of strategic positions. The focus on talents is also demonstrated by the numerous skills assessment projects concluded in 2016, following increasing focus on the analysis of the talent of people to support the company strategy. The talent management process also includes meeting and discussion sessions between managers, which aim to share and standardise the criteria for the definition of talent within the organisation.
2016 ANNUAL REPORT
135
Pirelli is established as a company with a strong predisposition to developing talent from within: 95% of the people who hold key positions have grown and been promoted internally. The pipeline of talents has a strong international and multicultural connotation, as their origin includes as many as 27 different nationalities. In 2017, the development process of talents within the Group will continue, through consolidation of career plans, also with a view to providing the means for structured growth within the organisation and mitigating the retention risk of talents. TRAINING All Pirelli affiliates have adopted the Training@Pirelli training model, organized, structured and equipped system to respond to "Group" needs as well as any needs that may emerge locally at any time. The training offer is based on the strategic priorities of the organization and of the various functions, which are alongside the needs that emerge annually from the Performance Management process (evaluation and development tool based on dialogue between the manager and the employee). The three “pillars” on which Training@Pirelli is based are the Professional Academy, the School of Management and the Local Education. The first two are designed centrally and, according to the cases, provided centrally or locally, while Local Education is managed and implemented directly in the individual countries to meet the specific local needs. The entire training offering is communicated and managed via the online training portal called LearningLab. Also in 2016, Pirelli was called in various international locations to illustrate its Training Model, recognized as benchmark of quality and robustness, already awarded in 2015 with the Silver Award by the Global Council of Corporate Universities, in the category "Best Corporate University embodying the identity, the culture and the brand of the Organization in its stakeholders", award dedicated to the most important Corporate Universities worldwide. Professional Academies
There are ten Pirelli Professional Academies: Product Academy, Manufacturing Academy, Commercial Academy, Quality Academy, Supply Chain Academy, Purchasing Academy, Finance Academy, Planning & Control Academy, Human Resources Academy, Information Technology Academy. Sustainable Management elements are throughout the Academies, with focus for example on product life cycle (LCA – Life Cycle Assessment), environmental efficiency of the process, health and safety, sustainable management of the supply chain, risk management, diversity management, etc. The Academies target the entire corporate population and aim to provide continuous training, encourage cross-functional collaboration, ensure the exchange of expertise and know-how among countries and support the implementation of tools and procedures within the organisation. The teachers of the Academy are mainly internal trainers, experts from the specific functions who, based on the training needs and logistical needs, act at central, regional and local level, or through online seminars and webinar sessions. The internal trainers are certified as such following adequate training, with homogeneous methods at all affiliates.

2016 ANNUAL REPORT
136
Participation in the internal “Train the trainer” course is a fundamental requirement to ensure and align the skills of all trainers regarding classroom management methods and delivery of the technical content of the Academy. Pirelli is currently certifying more than 400 internal trainers in the world on various disciplinary and professional subject areas. The Academy model involves a significant figure from the function guiding each Academy, supported by one or more professionals from the same function and from the Group Training function, which ensures consistency in the methods of approach, delivery and evaluation of learning in addition to ensuring collaboration with the local training teams. Every year, the Professional Academies meet both the Top Management and the local training representatives, with the objective of strategic alignment and sharing of the results achieved. In 2016, the Professional Academies offered 210 courses globally. School Of Management The School of Management (SOM) is the training structure dedicated to the development of the management culture within Pirelli. Its target are the populations of Executives, Global Talents, Middle Management/Senior Professionals and Recent Graduates/Junior. The focus of management training is calibrated and outlined every year based on the business challenges that the Company is required to face. The training aimed at executives is preferably provided centrally (Milan) in order to allow participants to discuss company strategies directly with Senior Management and share them at inter-departmental and geographical level. The training model of managerial skills was revised and modified in 2016 to make training topics even more consistent with the need to develop a skilled managerial class and able to face the new challenges of the Company. The new model is based on the skills of Learning Agility, which Pirelli has simultaneously adopted also as a model of development and evaluation of management potential. Consistently with the adoption of this model, which indicates in the 4 main dimensions of Learning Agility (People Agility, Change Agility, Results Agility, Mental Agility) the specific lines of skills development, 4 specular training courses were designed that aim to strengthen specific skills and related aptitudes. Even the proposed learning method is new for Pirelli: in fact, it no longer concerns "one shot" courses but paths that are divided into several months and that involve alternation of online activities, also collaborative as well as individual, and classroom. Each participation is also related to specific performance improvement KPI. In 2016, 4 editions of the programmes of the School of Management were delivered to Executives and Global Talents of the Group, and more than 50 editions were delivered to Middle Management and Senior Professionals, held in 11 countries of the Group for a total attendance of about 800 people. Also in 2016, in response to a need that emerged from the My Voice climate survey, several workshops were organised on “feedback management” in the manager-employee relationship, involving the whole central management population of the Group in the various countries, for a total of about 250 people. The School of Management also offers constantly updated online tools through the “Train your Brain” section, available to all managers on the LearningLab international platform. As for the population of recent graduates, in 2016 the two-year course Warming Up@Pirelli continued; it was launched in 2013 at global level and in 2016 it was attended by about 160 young graduates from every country.
2016 ANNUAL REPORT
137
The programme aims to provide a homogeneous view of the Pirelli reality for all young new recruits in the different countries. The main themes include: the Sustainable Management Model adopted by the Company, the strategies, the product, processes, customers, markets and all other matters regarding basic skills that Pirelli considers important for a young person who wishes to become part of the company’s future. During the two-year training course, participants have the opportunity to work on various company projects of interest proposed by various functions, in order to apply innovative approaches and develop cross-functional teamwork. The macro-structure of the course, defined centrally in terms of content and process steps, is organised in various countries with appropriate adjustments aimed at enhancing the local specificities. Local Education
The training provided locally responds to the specific training needs of the local context and culture of the country of reference. The seminars cover areas of expertise ranging from the improvement of interpersonal skills to stress management, from the development of IT, language and regulatory skills up to seminars on issues of welfare and diversity at the Company. In the latter area, the following more innovative courses deserve a mention:
• “Genitori al Lavoro” (Parents at Work), dedicated to the parents of children aged 0 to 6 with the aim of identifying the best ways to use the parenting experience as a “gym” for the development and consolidation of managerial skills and behaviour to be used in the workplace as well.
• "Working with Generation Y", to create culture and awareness regarding the different ways of approaching work and leadership that characterize the generation of "millennials", in order to facilitate the generational exchange between millennials, colleagues and senior managers.
Focus: Training on Sustainability
In 2016, training continued on the Pirelli Sustainable Management Model, with update on the state of the Company's Sustainability Plan. Reference was already made to training on specific sustainable management processes spanning all Group Academies and Local Education. In addition, there is institutional training in the International Course "PLunga", which presents the Group's Sustainable Management strategy to all new employees, starting from the multi-stakeholder approach contextualized in the integrated economic, environmental and social management. Training on the Pirelli Model draws the attention of new recruits also to the Group's Sustainability Policy and related commitments, as expressed through the “Ethical Code”, “Code of Conduct”, “Equal Opportunity Policy”, “Social Responsibility Policy for Occupational Health, Safety and Rights and Environment”, in addition to the requirements of the SA8000® Standard and internationally recognized human rights, starting with the prohibition of forced and child labour, up to the freedom of bargaining, equal opportunities and non-discrimination. The foregoing is also the subject of continuous training for all Group Sustainability Managers and Purchasing Managers. Each year, Pirelli dedicates a training session that brings together all the Group's Sustainability Managers for three days. The "Pirelli Sustainability Manager Workshop 2016" was held in Milan in September at the headquarters. The event involved the active participation of the entire Top Management of the Company, with strong cross-functional alignment with a view to achieving the Group targets as well as demonstrating the fundamental teamwork that enables the Company to prevent risks and, above all, create lasting and shared value. The long-term management strategies adopted by
2016 ANNUAL REPORT
138
the Company, the new scenarios and future objectives were shared, with specific managerial training on best practices of Stakeholder Dialogue and Engagement as a strategic lever for business development. Pirelli Training Performance
In 2016, Pirelli’s investment in Training continued with an extremely positive trend, recording a number of average days of training per capita of 9.8 (vs. 8.6 in 2015 and 8.4 in 2014), thus for the fourth consecutive year surpassing the target of 7 days on average per capita promised in the Industrial Plan, which was only expected to be achieved from 2015. With reference to the people involved, the average days of training for blue collars in 2016 rose to 10.6 (vs. 9.6 in 2015 and 9.4 in 2014), of which 71% consisting of training on the job activities and also the number of average days for management and white collars increased, reaching in 2016 5.6 (vs. 5.1 in 2015 and 4.3 in 2014). Pirelli intends to maintain increasingly structured homogeneity of the training offer, continuing in the coming years to deliver a number of average days of training per capita greater than or equal to 7 and reaching, with at least one day per capita, 90% of employees by 2017. In 2016, training involved 93% of the workforce (vs. 87% in 2015) with at least one day on average per capita and recorded a participation to the courses that substantially reflects the gender distribution of employees, with a substantial balance in terms of equality of training access. Of the total training provided in 2016, about 82% was in the Professional Academy. Focus continued on health and safety issues, which totalled 11.5% of the total hours of training delivered globally. The increase in training expenditure for 2016 is due, in a nutshell, to important "reskilling" programmes of the population of operators in countries such as Romania, Russia, Brazil, Argentina and robust and consistent "induction" programmes for new employees in Mexico, the latter also with the aim of increasing loyalty to the Company of new employees responding to the important turnover present in past years. These actions – equal to others on several fronts such as welfare – contributed precisely to a decrease in turnover in 2016, particularly white collars, for the first time down to around 8.6%. Finally, in all countries and production sites, the use of continuous on-the-job training was spread with increasing rigour and structuring, also thanks to the help of a growing number of internal technical trainers, certified and qualified according to Group standards (reference is made to the paragraph dedicated to the Professional Academies). On-the-job training, which involves mentoring during work activities, is a substantial investment but also of extreme importance to improve the professional skills of operators, such that it covers 63% of the total training provided at Pirelli. In line with the targets of the Industrial Plan, in 2017, it is expected to maintain the training level over 7 days on average per employee (as per the Industrial Plan and related Target), with at least an average day per capita for 90% of employees, with continuous and on-the-job training at the factory, and with a focus on the challenges of the digital transformation undertaken by the company.

2016 ANNUAL REPORT
139
Average Days of Training per capita
* of which 63% is on-the-job training
** of which 71% is on-the-job training
*** of which 7% is on-the-job training
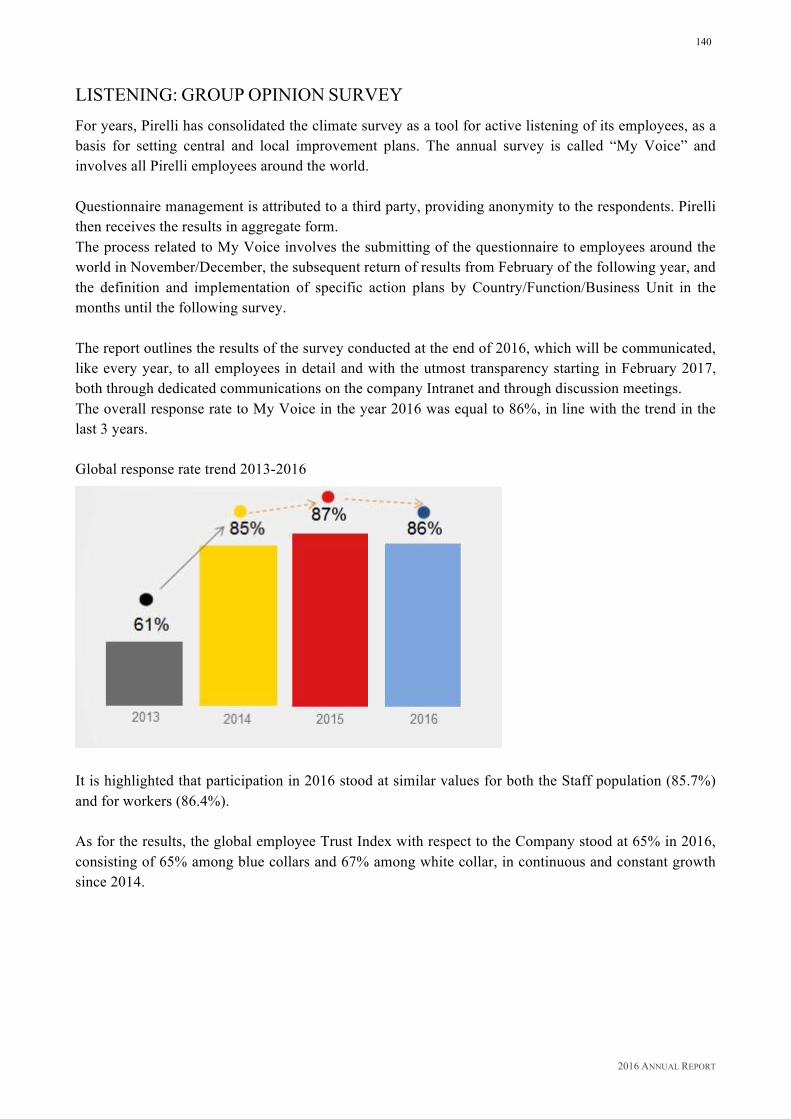
2016 ANNUAL REPORT
140
LISTENING: GROUP OPINION SURVEY For years, Pirelli has consolidated the climate survey as a tool for active listening of its employees, as a basis for setting central and local improvement plans. The annual survey is called “My Voice” and involves all Pirelli employees around the world. Questionnaire management is attributed to a third party, providing anonymity to the respondents. Pirelli then receives the results in aggregate form. The process related to My Voice involves the submitting of the questionnaire to employees around the world in November/December, the subsequent return of results from February of the following year, and the definition and implementation of specific action plans by Country/Function/Business Unit in the months until the following survey. The report outlines the results of the survey conducted at the end of 2016, which will be communicated, like every year, to all employees in detail and with the utmost transparency starting in February 2017, both through dedicated communications on the company Intranet and through discussion meetings. The overall response rate to My Voice in the year 2016 was equal to 86%, in line with the trend in the last 3 years. Global response rate trend 2013-2016
It is highlighted that participation in 2016 stood at similar values for both the Staff population (85.7%) and for workers (86.4%). As for the results, the global employee Trust Index with respect to the Company stood at 65% in 2016, consisting of 65% among blue collars and 67% among white collar, in continuous and constant growth since 2014.
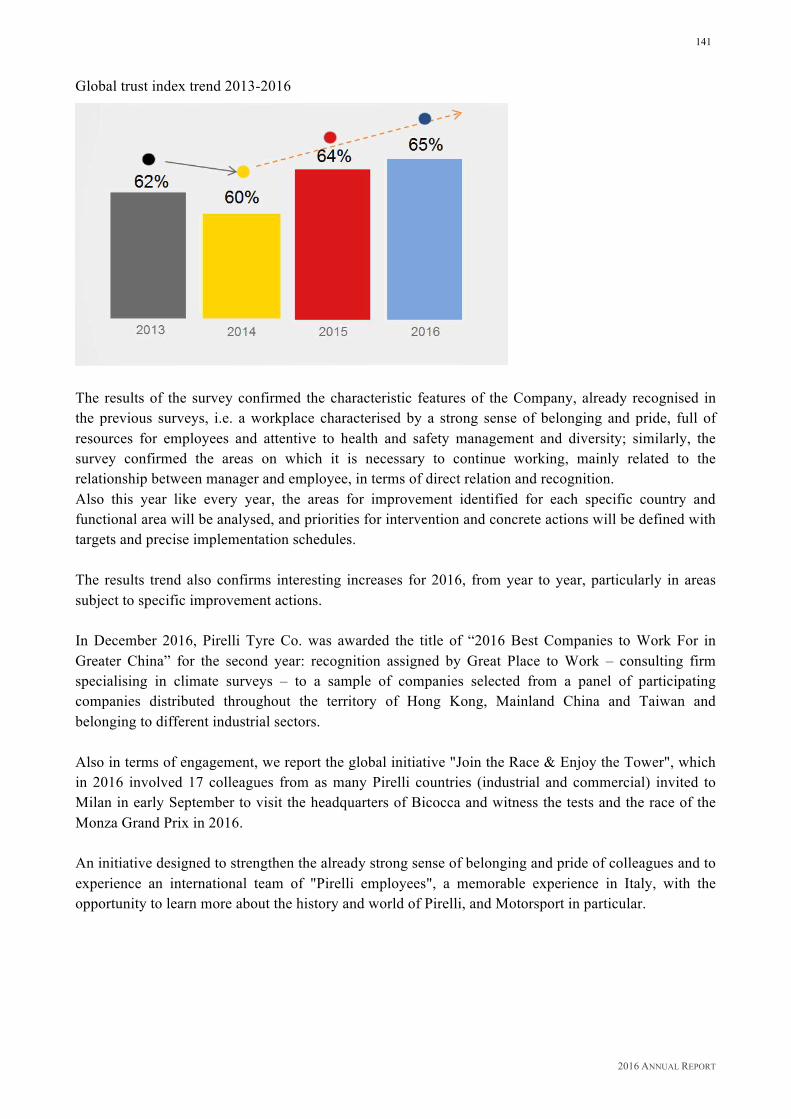
2016 ANNUAL REPORT
141
Global trust index trend 2013-2016
The results of the survey confirmed the characteristic features of the Company, already recognised in the previous surveys, i.e. a workplace characterised by a strong sense of belonging and pride, full of resources for employees and attentive to health and safety management and diversity; similarly, the survey confirmed the areas on which it is necessary to continue working, mainly related to the relationship between manager and employee, in terms of direct relation and recognition. Also this year like every year, the areas for improvement identified for each specific country and functional area will be analysed, and priorities for intervention and concrete actions will be defined with targets and precise implementation schedules. The results trend also confirms interesting increases for 2016, from year to year, particularly in areas subject to specific improvement actions. In December 2016, Pirelli Tyre Co. was awarded the title of “2016 Best Companies to Work For in Greater China” for the second year: recognition assigned by Great Place to Work – consulting firm specialising in climate surveys – to a sample of companies selected from a panel of participating companies distributed throughout the territory of Hong Kong, Mainland China and Taiwan and belonging to different industrial sectors. Also in terms of engagement, we report the global initiative "Join the Race & Enjoy the Tower", which in 2016 involved 17 colleagues from as many Pirelli countries (industrial and commercial) invited to Milan in early September to visit the headquarters of Bicocca and witness the tests and the race of the Monza Grand Prix in 2016. An initiative designed to strengthen the already strong sense of belonging and pride of colleagues and to experience an international team of "Pirelli employees", a memorable experience in Italy, with the opportunity to learn more about the history and world of Pirelli, and Motorsport in particular.
2016 ANNUAL REPORT
142
WELFARE AND INITIATIVES FOR THE INTERNAL COMMUNITY At organisational level, Pirelli for years, has had the figure of the “Group Welfare Manager”, who is entrusted with the supervision of welfare activities, jointly with the many central and local functions concerned, including Health and Safety at Work, Industrial Relations and Equal Opportunity Managers of the Group. The welfare initiatives that Pirelli offers to its employees vary from country to country, in accordance with the specific needs identified in different social contexts in which the affiliates operate. All Group affiliates have the opportunity to share local best practices through a special section dedicated to welfare on the corporate Intranet. Overall, welfare activities activated at Pirelli affiliates in the world are attributable to four macro areas of action:
• health (e.g. health care, information and awareness campaigns); • family (e.g. scholarships, summer camps for employees’ children, inter-company kindergarden); • free time (e.g. open days, sporting and cultural activities); • workplace (e.g. flexible working hours, facility, individual development training, cultural
growth and group celebrations). Historically, Pirelli at all its production units provides infirmaries at which health operators and medical specialists are available to all employees during working hours. These facilities provide counselling for health problems outside work as well as first aid care and health supervision for workers exposed to specific risks. At the Milan Bicocca health centre, for example, over 300,000 healthcare services were provide to Pirelli employees in 2016. The infirmaries also support the various health-related promotional campaigns that are launched at local level, as well as prevention campaigns. For example, the following are some of the welfare activities activated locally. At the headquarters in Milan Bicocca and at the New York offices in 2016, Pirelli launched the pilot phase of the Smart Working Project. Thanks to the opportunities provided by new technologies, smart working allows working in part also outside the office, in agreement with the manager and in compliance with the rules defined by the Company. This way, both autonomy and individual responsibility are promoted in achieving results through a more flexible organization of work activities, which enables a balance between business and personal needs. In support of the work – life balance and in particular saving time, as increasingly valuable factor, in 2016, the offer of the Pirelli Italian Portal "People Care" was further expanded, completely dedicated to welfare. The new services and consolidation of those already existing is the result of the consultation of employees, through a survey designed to gather input and suggestions with respect to new activities to be introduced while surveying the level of satisfaction with respecting the current offer. At the end of 2016, the services offered are definitely linked to the concept of "saving time", and include laundry, private parcel reception, shoemaker, payment of bills, purchase organic groceries, as well as numerous affiliations at subsidized prices for the purchase of goods and services. Also in Italy in 2016, the “Bambini in Bicocca” (Children at Bicocca) project continued, guaranteeing babysitting and kids club service for employees’ children of school age (5-10) during school holidays.
2016 ANNUAL REPORT
143
Similarly, in Brazil, the initiative "Férias Dirigidas and Acampamento de Férias" annually provides recreational activities and integration in the vicinity of the Pirelli plants, for employees' children aged 6 to 17, during business hours and during the period of school closure. There were numerous prevention and awareness campaigns for a healthy lifestyle, among which we highlight the "Wellness Change" initiatives launched in the US and the "Smile Campaign" conducted in Romania, where already for 7 years, a team of dentists, in collaboration with a team of doctors at the Milan hospital Niguarda, have provided specialist services for the children of employees. In turn, the "Faz Bem" project in Brazil promotes the improvement of the quality of life in particular through Sport, with various communication and involvement initiatives, like the Campaign "#sentirmibene" launched in Italy at the end of 2014 and which is divided into a series of initiatives to promote healthy lifestyles and well-being. Also of importance is the “Employee Assistance & Wellbeing” programme called ICAS, launched in Mexico in September 2015: a consulting and telephone listening service, active 24/7, which provides counselling, support in the emotional and practical management of day-to-day activities and life management services to support employees. Moments of inclusiveness and sharing characterize the "Open Days", which take place at numerous affiliates in the world: these are days dedicated to employees' families, with educational workshops, visits to departments, games and music. The well-being of workers also comes from a working environment that is psycho-socially adequate and stimulating, where they feel valued and in which psychosocial risks and work-related stress are effectively prevented and countered. To this end, as part of the Company’s global programme called “Excellence in Safety”, Pirelli performs in-depth analyses and acts on key areas and issues such as improvement of the organisational structure, clarity of tasks and roles, empowerment of workers, improvement of communication in the organisation, sharing of objectives and motivation with respect to a common strategy, as key elements for the prevention and mitigation of occupational stress. INDUSTRIAL RELATIONS The Industrial Relations Policy adopted by the Group is based on respect for constructive dialogue, fairness and roles. Guaranteeing and respecting free trade union activities is one of the key values on which Pirelli bases its own Human Capital Management System. Relations and negotiations with trade unions are managed locally by each affiliate in accordance with the laws, national and/or company-level collective bargaining agreements, and the prevailing customs and practices in each country. At this level, these activities are supported by the central departments, which coordinate the activities and ensure that the aforementioned principles are observed throughout the Group. Industrial Relations also have an active role in the Group’s commitment in terms of health and safety, characterised by active participation on the part of the unions and workers. In fact, 79% of the Group’s employees are covered by representative bodies that periodically, with the Company, monitor and address, with the support of specialists, the current issues and awareness and intervention plans/programmes in a perspective of continuous dialogue aimed the improvement of the various activities carried out by Pirelli to safeguard the health and safety of employees. In 2016, the Industrial Relations activities reached important negotiating results. Several collective agreements were renewed, without any conflict, in Turkey, the United Kingdom, Brazil, Argentina and Mexico.
2016 ANNUAL REPORT
144
During the year, the Company operated internationally to rebalance the employment level, aligning it to the needs of volume related to high market volatility, maintaining a Group occupational balance at the end of 2016 in line with that of 2015. In Brazil, the Company has completed the process of reorganisation launched in the last months of 2015, in the face of the continuing crisis of the country that has also generated a sharp decline in consumption in the automotive industry, with a commensurate impact on the Tyre market. Specifically, there was a production rebalancing and the consequent downsizing of personnel, both white collars, and blue collars within the plants of Campinas, Santo André, Gravataí and Feira di Santana, acting primarily on reducing flexibility and work organisation. This organisational rationalisation, managed through the trade union dialogue, was based on specific trade agreements at site level At the same time, in Romania, Mexico and China, the Company increased the workforce acting on the organisation and production processes in line with market needs. In Italy, central Functions related to product research and development and innovation have been further strengthened. European Works Council (EWC)
The Pirelli European Works Council (EWC), formed in 1998, holds its ordinary meeting once a year after presentation of the Group Integrated Annual Report, where it is informed about the operating performance, operating and financial forecasts, investments made and planned, progress in research, and, as occurred at the annual meeting in 2016, about the progress of the Company’s Sustainability Plan. The agreement establishing the EWC provides for the possibility of holding other extraordinary meetings to fulfil the information requirements of delegates, in light of transnational events concerning significant changes to the corporate structure: opening, restructuring or closing of premises, important and widespread changes in work organisation. EWC delegates are provided with the IT tools they need to perform their duties and a connection to the corporate Intranet system, for the real-time communication of official Company press releases. Compliance with statutory and contractual obligations governing overtime, time off, association and negotiation, equal opportunities and non-discrimination, bans on child and forced labour
Group policy has always promoted compliance with all legal and/or contractual requirements concerning working hours, the use of overtime and the right to regular days of rest. These requirements are often the subject of agreements with trade unions, in line with the regulatory context of each country. There are no restrictions on any worker’s right to use his/her total number of holidays. The holiday period is generally agreed between the worker and the Company. Pirelli verifies the application of requirements in terms of respect for human and labour rights through periodic audits, both commissioned to specialized third-party companies and conducted by the Internal Audit Department, in application of its Policies, in particular the "Social Responsibility Policy for Occupational Health, Safety and Rights, and Environment", the "Global Human Rights" Policy and the "Health, Safety and Environment" Policy, and in accordance with the requirements of the SA8000® International Standard (adopted since 2004 as a reference tool for the management of social responsibility at its affiliates and in the supply chain). The responsible management of the supply chain regarding human and labour rights was described in the paragraph "Our Suppliers", to which reference is made for further details.

2016 ANNUAL REPORT
145
With reference to the Pirelli sites, they are all covered by the three-year Internal Auditing Plan. Normally every audit is carried out by two auditors and takes three weeks on-site. The Internal Audit Team received training on the environmental, social and business ethics elements of an audit from function directors to enable them to carry out an effective, clear and structured audit, granting Pirelli effective control over all aspects of sustainability. If compliance violations are found during these audits, an action plan is agreed between the local managers and central management, with precise implementation dates and responsibilities. The Internal Audit Department monitors the development of the shared action plans, through specific follow-ups. All managers from the affiliates involved in the audits are adequately trained and informed on the audit object and procedures by the applicable central functions, in particular Sustainability and Industrial Relations. The auditors carry out verifications on the basis of a checklist of sustainability parameters deriving from the SA8000® Standard and the Pirelli Policies mentioned above. Considering the last four years, in 2013, the Internal Audit Department carried out audits in Argentina, the USA, Romania and Brazil; in 2014, in Italy, the United Kingdom and China; in 2015, in Mexico, Russia (Voronezh plant) and the United Kingdom. In 2016, the audits continued in Germany, Russia (Kirov plant) and the United Kingdom (follow-up). The non-conformities emerged as a result of the audits mentioned above were the subject of the action plans agreed between the local managers and central management, and will be subject to follow-ups in 2017 by the Internal Audit Department. None of the audits revealed any breach of ILO Core Labour Standards, with specific reference to forced labour or child labour, freedom of association and collective bargaining, and non-discrimination. Labour and Social Security Lawsuits
In 2016, as in previous years, the level of work and social security litigation remained low. Just as in previous years the level of litigation remains high in Brazil, to the point of representing about 90% of all the labour lawsuits currently pending against the entire Group. Labour lawsuits are extremely common in this country and depend on the peculiarities of the local culture. As such, they affect not only Pirelli but also the other multinational companies operating there. Labour lawsuits are generally initiated when an employment contract is terminated, and they usually involve the interpretation of regulatory, legal and contractual issues that have long been controversial. The Company has made a major commitment to prevent and resolve these conflicts – to the extent possible – including through settlement procedures. Unionisation Levels And Industrial Action
It is impossible to measure exactly the consolidated percentage of union membership at Group companies, since this information is not legitimately available in all countries where Pirelli has a presence (over 160 countries on five continents). However, it is estimated that 50% of Pirelli employees are trade union members. As to the percentage of workers covered by collective agreement, in 2016 it stood at 79% (vs. 80% in 2015). This figure is associated with the historical, regulatory and cultural differences between each country. Collective agreements were renewed without any conflict and strikes. Occupational Retirement and Health-Care Plans
The Group has defined contribution and defined benefit funds, with a substantial prevalence of the former kind over the latter. To date, the only defined benefit plans are:
• in the United Kingdom, where the fund relating to the tyre business has been closed to new employees since 2001 for the introduction of a defined contribution scheme (and closed to
2016 ANNUAL REPORT
146
future accumulations for all active employees as of April 1, 2010), while the funds related to the cable business sold in 2005 were closed to future accumulations in the same year;
• in the United States, where the fund was closed in 2001 (since 2003, it has not been tied to salary increases) for the introduction of a contribution scheme (and only applies to retired employees);
• in Germany, where the fund was closed to new hires from 1982. Other defined benefit plans exist in Holland and Sweden, but they represent a relatively insignificant liability for the Group. The Group also maintains various supplemental Company medical benefit plans at its affiliates according to local requirements. These healthcare schemes vary from country to country in terms of allocation levels and the types of coverage provided. The plans are managed by insurance companies or funds created ad hoc, in which the Company participates by paying a fixed amount as is done in Italy, or an insurance premium as is done in Brazil and the United States. For the economic-equity measurement of the above benefits, reference is made to the Consolidated Financial Statements, notes “Employee funds” and “Personnel Costs”. OCCUPATIONAL HEALTH, SAFETY AND HYGIENE
Management Model And System Pirelli's approach to responsible management of occupational health, safety and hygiene is based on the principles and commitments expressed in "The Values and Ethical Code" of the Group, in the "Health, Safety and Environment Policy" in the "Global Human Rights Policy" and in the "Quality Policy", in accordance with the Sustainability Model envisaged by the Global Compact of the United Nations, with the "Declaration of the International Labour Organization on fundamental Principles and rights at Work" and with the "Universal Declaration of Human Rights" of the United Nations. In particular, the "Health, Safety and Environment" Policy, issued in 2016, expresses the commitment of Pirelli to:
• manage its activities regarding occupational health and safety protection in compliance with the laws and all the commitments undertaken, as well as according to the most qualified international management standards;
• pursue objectives of "zero injuries to people", by implementing actions for early identification, assessment and prevention of risks for occupational health and safety aimed at a continuous reduction in the number and severity of injuries and occupational illnesses, activating health surveillance plans in order to protect workers from specific risks associated with their business duties;
• develop and implement emergency management programmes to prevent and avoid injury to persons;
• define, monitor and communicate to its Stakeholders specific targets of continuous improvement of occupational health and safety;
• empower, train and motivate its employees to work safely involving all levels of the organization in an ongoing programme of training and information, aimed at promoting a culture of safety at work;
• promote information and awareness-raising on health and safety issues; • provide ongoing and concrete support aimed at facilitating the work-life balance;
2016 ANNUAL REPORT
147
• manage its supply chain responsibly by including issues of occupational health and safety in the
supplier selection criteria, the contractual clauses and the audit criteria, also requiring suppliers to implement a similar management model in their supply chain (for an outline on responsible management of the supply chain, reference is made to the paragraph "Our Suppliers");
• make available to all its Stakeholders a channel (the "Whistleblowing Policy " published on Pirelli's website) dedicated to reporting, even anonymously, of any situations that constitute or may constitute a risk for the protection of the health, safety and well-being of people (reference is made to the Paragraph "Reporting Procedure - Whistleblowing" of this Chapter for an outline of reports received in the last three years, none of which regarding health and safety).
All the Documents mentioned above are communicated to Group employees in their local languages and are published in the Sustainability section of the Pirelli website, which should be consulted for full display of the content. The occupational safety management system was developed in compliance with procedures and guidelines elaborated centrally in order to consolidate a "common language" that guarantees sharing, alignment and effective management in the Group. Pirelli adopts an occupational health and safety management system structured and certified according to OHSAS 18001:2007. All certificates are issued with ANAB international accreditation (ANSI-ASQ National Accreditation Board - US accrediting body). Also in 2016, RINA Services S.p.A. was the evaluator of conformity of the health and safety management systems of Pirelli. At the end of 2016, all the production facilities are certified according to OHSAS 18001:2007, with the exception of the facility in Jiaozuo that joined the Group in the last quarter of the year, and the facility in Rome (United States), where a management system is operative, applied under the OSHA Standards, similar to the OHSAS 18001 Standard and such that an activity of parallel certification in the content would be of relative value. Safety Culture
“The Zero Accidents Target” is a precise and strong corporate position. Pirelli strongly believes that leaders play a strategic role in risk prevention. Their behaviour must therefore be an example for all employees. From an industrial point of view, this objective is pursued through investments aimed at technical improvement of work conditions, while constantly insisting on the cultural and behavioural aspect of all Company players. It is necessary to pursue the safety culture in accordance with the rules, while maintaining a very clear idea of everyone’s responsibilities to themselves, others, and their own family. This approach, together with the involvement and continuous internal dialogue between management and workers, has allowed a sharp decline in historical injury indexes. In 2013, the Company signed a global agreement with DuPont Sustainable Solutions for the global implementation of the “Excellence in Safety” Programme, in support of the management model outlined above and with particular focus on the implementation of a standard approach to behavioural safety in the Group. The Programme began in 2014, extending gradually in 2015-2016 to all production sites of the Group. A specific Steering Committee, chaired by the Operations General Manager, monitors the progress of the programme. In particular, in addition to the strengthening and consolidation of the safety culture concepts based on conduct, the focus on Leading Indicators was further developed, namely measuring what preventive

2016 ANNUAL REPORT
148
measures should be implemented and how this should be done, rather than Lagging Indicators, namely reactive indicators, such as the number or frequency of accidents. The sharing of the Safety Culture was also supported by the monthly newsletters like the Safety Bulletin, and the periodic publication of significant events through the traditional channels of internal communication. As part of the collaboration with DuPont Sustainable Solutions, Pirelli in 2016 continued to develop the theme of prevention of psychosocial risks and work-related stress. Some of the most important areas of intervention of the “Excellence in Safety” Programme are in fact related to the improvement of the organisational structure, the clarity of the tasks and roles, empowering workers, improving communication within the organisation, the sharing of objectives, motivation with respect to a common strategy: all substantial issues for a work environment that is psycho-socially appropriate and stimulating, in which workers feel valued and the psychosocial risks are effectively prevented and countered. The management of work-related stress was also the subject of the Campaign of the European Agency for Health and Safety in the Workplace (EU-OSHA) for the 2014-2015 two-year period, of which Pirelli was the usual partner. For the two-year period 2016-2017, Pirelli adheres to the Campaign of the European Agency dedicated to "Healthy workplaces for all ages". Safety Training
In addition to safety training offered locally at every Pirelli location (which is illustrated in the section of this report dedicated to employee training), special mention should be made of Group activities and projects, which simultaneously target several countries by allowing an alignment of culture and vision, fully benefiting pursuit of the Company’s own improvement targets. The Manufacturing Academy merits a special mention. This is the Pirelli Professional Academy dedicated to the sphere of factories, where health, safety and environment issues are discussed in detail. It must be pointed out that 11.5% of the training provided by Pirelli in 2016 addressed occupational health and safety issues. In 2016, the eighth edition of the Pirelli Health, Safety and Environment Global Meeting was also held. The annual meeting in 2016 was held at the Pirelli German production site in Breuberg. The purpose of this meeting, which brings together all managers responsible for Health and Safety in the Group, is to pool the best practices applied by the various Pirelli sites in the world, with a view to promoting continuous improvement. Performance Monitoring
Alongside establishing specific guidelines and procedures for implementing management systems, Pirelli uses the web-based Health, Safety and Environment Data Management (HSE-DM) system, elaborated and managed centrally by the Health, Safety and Environment Department. This system makes it possible to monitor HSE performance and prepare numerous types of reports as necessary for management or operating purposes. The HSE-DM system collects all the information on accidents occurred at the factories, Group fitting units, European and Brazilian equities and logistics units managed directly by Pirelli (accident analysis, corrective action taken, etc.). If the dynamics of a particular case are significant, all the plants are not only provided with the information via a system called Safety Alert, but are also urged to conduct an internal audit as to whether conditions similar to the ones that caused the injury also exist at their plants and to define any possible corrective measures. By using this system, every site is able to audit the solutions adopted by other plants in order to share the best choices.

2016 ANNUAL REPORT
149
Performance
The performance reported below relates to the three-year period 2014-2015-2016 and covers the scope of Group consolidation, with the exception of the production site in Jiaozuo (China), under the operational control of Pirelli since the last quarter of 2016 and the performance of which will be reported starting in 2017. It is recalled that the exclusion of Pirelli de Venezuela from the consolidated scope, which occurred at the end of 2015, in line with the principles set by GRI has meant recalculating the historical value of the indicators reported below for the years 2014 and 2015. The 2020 target of the Industrial Plan is for a reduction by 2020 in the Frequency Index of 90% compared to 2009. In 2016, Pirelli reached an injury Frequency Index (FI) of 0.36 with a reduction of 15% compared to 2015 and 80% compared to 2009. The Injury Frequency Index, analysed by gender, is also significantly lower for women in 2016, reflecting the fact that the female population is generally engaged in activities with lower risk than the male population. Below is a summary table of the FI values by gender in the last three-year period:
2016 2015 2014
Frequency Index (FI) 0.36 0.42 0.48
FI Men 0.39 0.47 0.54
FI Women 0.11 0.14 0.12
FI = number of injuries/number of hours actually worked x 100,000
The injury Severity Index (SI) in the Group in 2016 was 0.14, an improvement of over 15% compared to 2015. Below is a summary table of the SI values in the last three-year period: 2016 2015 2014
Severity Index (SI) 0.14 0.17 0.15
SI = number of days absence per injury/number of hours actually worked x 1,000
The most representative injuries concern events involving contusions, cuts and fractures of the upper limbs. Both in the case of the Frequency Index and the Severity Index, Asia Pacific has a lower rate than the other geographical areas where Pirelli operates (Europe, Africa, Latin America, North America and Oceania), which have all been steadily declining for years.
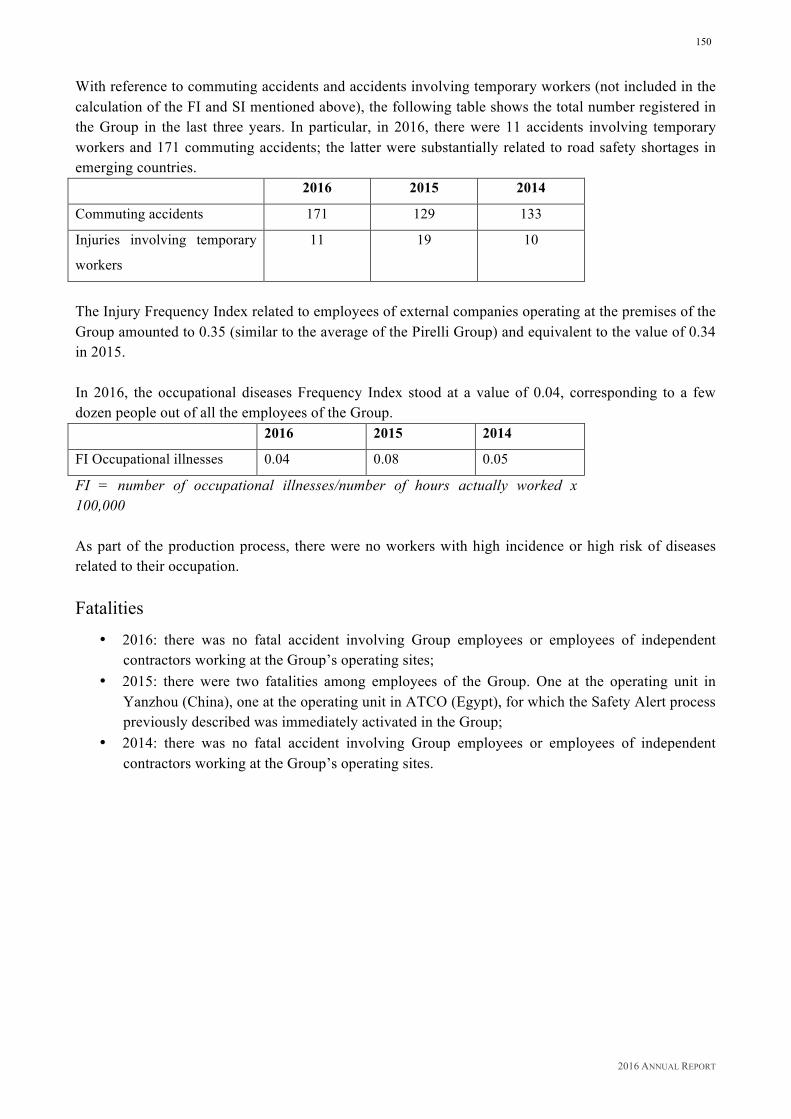
2016 ANNUAL REPORT
150
With reference to commuting accidents and accidents involving temporary workers (not included in the calculation of the FI and SI mentioned above), the following table shows the total number registered in the Group in the last three years. In particular, in 2016, there were 11 accidents involving temporary workers and 171 commuting accidents; the latter were substantially related to road safety shortages in emerging countries. 2016 2015 2014
Commuting accidents 171 129 133
Injuries involving temporary
workers
11 19 10
The Injury Frequency Index related to employees of external companies operating at the premises of the Group amounted to 0.35 (similar to the average of the Pirelli Group) and equivalent to the value of 0.34 in 2015. In 2016, the occupational diseases Frequency Index stood at a value of 0.04, corresponding to a few dozen people out of all the employees of the Group. 2016 2015 2014
FI Occupational illnesses 0.04 0.08 0.05
FI = number of occupational illnesses/number of hours actually worked x 100,000 As part of the production process, there were no workers with high incidence or high risk of diseases related to their occupation. Fatalities
• 2016: there was no fatal accident involving Group employees or employees of independent contractors working at the Group’s operating sites;
• 2015: there were two fatalities among employees of the Group. One at the operating unit in Yanzhou (China), one at the operating unit in ATCO (Egypt), for which the Safety Alert process previously described was immediately activated in the Group;
• 2014: there was no fatal accident involving Group employees or employees of independent contractors working at the Group’s operating sites.
2016 ANNUAL REPORT
151
Best Practices 2016
Ten Pirelli manufacturing plants were “sites of excellence” in 2016, since no employees were injured there in the year:
• Burton MIRS • Capuava • CMP • Ecosil • Hurlingam • Santo André HQ • Slatina Motorsport • Sorocaba • TLM Campinas • TLM Santo André
These results should be attributed to the constant focus on leading indicators, namely in terms of prevention. Health And Safety Expenditure
In the three-year period 2014-2016, expenditure for health and safety by the Group exceeded Euro 40 million, of which over 30% was invested in 2016. The expenditure made targeted improvements on machines and plant and, more in general, the workplace environment as a whole (ex. improvement of microclimate and lighting conditions, changes in layout for ergonomic improvement of activities, measures to protect the healthfulness of infrastructure, etc.). Health And Safety Targets
• 2020: reduction in the Accident Frequency Index of 90% compared to 2009 (underway); • 2013-2017: implementation and consolidation of the systems BBS-Behaviour Based Safety,
LOTO-LockOut/TagOut, POWRA-Point of Work Risk Assessment (underway); • 2014-2018: global implementation of the “Excellence in Safety” programme (underway); • 2015-2018: completion of integration of Health, Safety and Environment KPIs for the
sale/commercial/equities areas (underway).
2016 ANNUAL REPORT
152
EXTERNAL COMMUNITY INSTITUTIONAL RELATIONS OF THE PIRELLI GROUP In all the countries where Pirelli operates, the aim of Institutional Relations Management is directed towards creating corporate value through managing structural relations with institutional stakeholders so as to ensure adequacy of representation of their interests. The activities are based on the utmost transparency, legitimacy and accountability, with respect to both the information disseminated in public venues, and to relations managed with institutional interlocutors, in line with the Group’s Ethical Code and as governed by the “Institutional Relations Policy - Corporate Lobbying”, by the Anti-corruption Compliance Program, in line with the principles of the International Corporate Governance Network (ICGN) and however in compliance with the laws and regulations of the countries where Pirelli operates. The geographical scope of the Pirelli Group’s industrial and economic interests therefore calls for an extended network of institutional relations on a national, European and international level. In the area of institutional relations, Pirelli acts above all via active monitoring and in-depth analysis of the institutional and legislative context so as to verify any implications of concern and identify stakeholders of reference. Institutional dialogue is further enhanced by projects and initiatives carried out in collaboration with institutional players in promoting and supporting corporate matters in the public interest. Institutional Relations Management is engaged in global political-economic dynamics and additionally keeps watch over developments in the main matters of corporate interest, also thanks to collaboration with various selected think tanks that are recognised worldwide, among which the collaboration with the Institute for International Political studies, the International Affairs Institute, The Trilateral Commission, The Foundation for the Analysis, Study and Research into Reform of Democratic Institutions, the Aspen Institutes and the Italy-China Foundation, stand out. At an international level Pirelli interacts with the main interlocutors present in the countries where its production sites are located. When necessary, the Group promotes moments of discussion and dialogue directed towards mutual understanding and with the purpose of promoting representation of its interests through a strategy based on a clear perception of the industrial objectives related to business developments. Moreover, among the various tools of “economic diplomacy”, in addition to a series of bilateral initiatives, Pirelli takes an active part in a number of Business Councils with: Egypt, Mexico, Thailand and China, where it has held presidency since 2016. With reference to the initiatives of major international importance, there is that of the Italy-China Business Forum, held in Italy. As part of the economic relations between the two countries, the Italy-China Business Forum represents a context of permanent interaction between Italian and Chinese entrepreneurs. To further develop relations between the two countries, the third working session of the Business Forum was held in Rome in June on the sidelines of a major Intergovernmental Committee that was attended by key Italian and Chinese business leaders and Ministers of Foreign Affairs of the two countries. The plenary session was opened by Marco Tronchetti Provera, Executive Vice Chairman and Chief Executive Office of the Pirelli Group and Co-Chairman of the Italy-China Business Forum, and by Tian Guoli, Chairman of Bank of China. Activities concerning institutional relations also involved quite constant distribution of information relating to international Pirelli initiatives towards qualified institutional interlocutors as well as ongoing monitoring and analysis of the institutional and political dynamics. In April, on the occasion of the State visit of the President of the Italian Council in Mexico, Pirelli announced a new investment in the next three years involving the opening of a new factory in addition to the existing car tyre factory in Silao in the State of Guanajuato. In the country, Pirelli maintains constant of dialogue with the various institutions at both the federal level and at the local level.

2016 ANNUAL REPORT
153
As part of the enhancement of the historical relations between the Company and the United States of America, where Pirelli has industrial and commercial facilities, work continued on a number of initiatives related to institutional projects and activities at the United States Council for International Business, European American Chamber of Commerce and Italian American Chamber of Commerce. In Brazil, at the opening of the Olympic Games in 2016 and on the occasion of the visit of the President of the Italian Council of Ministers, Pirelli celebrated the strong bond that unites this country and Italy, illuminating with the Italian flag the monument of Corcovado Christ the Redeemer in collaboration with the Archdiocese of Rio de Janeiro. Even in Romania, Pirelli promotes constant dialogue with key institutional interlocutors in order to accompany industrial development phases in Slatina. As evidence of the strategic importance of Romania as part of the Group’s activities, in 2016 Pirelli celebrated ten years of industrial presence in Romania with a visit to the production center of Slatina by the Romanian Prime Minister, accompanied by the Minister of Finance and by the Minister of Labour. Relations with European Institutions also focus on consolidating relations with stakeholders of reference and monitoring legislation. The ongoing dialogue and discussion with the Commission and the European Parliament concern a wide range of matters of corporate interest; transport, energy and environmental policy, industrial policy, research and innovation In line with Group standards, during the various stages of processing and forming European regulation, Pirelli represents Group interests with community stakeholders with an approach that is at all times directed towards utmost transparency and propriety. The Pirelli Group is enrolled with the European Registry for Transparency, which was instituted by an institutional agreement between the European Parliament and the European Commission. In Italy, the Group interacts with a system of relations that involve the main institutional bodies, both central and local. In parliamentary and government contexts, Pirelli maintains constant relations with the main structures of reference and with the entities related to them. Especially important among the usual activities, there appear the initiatives promoted in the matters of: questions relating to the industrial presence of the Group; promoting and strengthening international relations in countries where the Group is present with industrial sites, analysing and studying in-depth impacts relating to the regulatory governance of tyres and their entire life-cycle; matters relating to road safety and environmental sustainability, both as regards production processes and in respect of the product itself. PRINCIPAL INTERNATIONAL COMMITMENTS FOR SUSTAINABILITY The attention of Pirelli to sustainability is also expressed through participation in numerous projects and programmes promoted by international organisations and institutions in the area of social responsibility. The following are some of the main commitments undertaken by the Group worldwide (numerous activities and agreements existing locally at the affiliated companies are not included). UN Global Compact Lead
In addition to being an active member of the Global Compact since 2004, Pirelli is part of the Global Compact Lead Companies, an initiative launched in 2011 at the World Economic Forum in Davos by United Nations Secretary-General Ban Ki-moon, where it has been on the Steering Committee since 2013. Pirelli endorses the “Blueprint for Corporate Sustainability Leadership”, leadership model envisaged in the Global Compact to inspire advanced and innovative sustainability performance in terms of management capacity for the creation of sustainable value. In 2016, the Global Compact Lead activated a series of initiatives to provide support in the definition of strategies and partnerships for the pursuit of Sustainable Development Goals (SDGs) launched in September 2015 in New York with the aim of accompanying the activities of sustainable companies until 2030.

2016 ANNUAL REPORT
154
This context includes the publication of several SDGs Industry Matrix, documents aimed to collect examples of application of the SDGs to business activities; Pirelli has shared several business cases, directly contributing to the Industry Matrix of the Transportation sector. Since 2014, Pirelli has been a Founding Participant of the SSE Corporate Working Group, the group of companies that provide their own evaluations and indications as part of the Sustainable Stock Exchanges (SSE) initiative promoted by UNPRI, United Nations Conference on Trade and Development, United Nations Environment Programme Finance initiative and the UN Global Compact. The initiative is based on a platform for exchange of ideas and assessments, which aims to increase the attention of world stock markets, investors, regulators and companies to the sustainable performance of companies. ETRMA – European Tyre And Rubber Manufacturers Association ETRMA is the main partner of the EU institutions for the sustainable development of new European policies for the sector and for their proper implementation. With the institutional support of the Pirelli Group, in 2016, the association continued to raise awareness of the European Commission and European Union Member Countries on the implementation of market surveillance for monitoring compliance with regulations on the general safety of vehicles and tyres and on energy efficiency, as well as the labelling of tyres in European Countries, and through the strengthening of the partnership with the national associations of the sector of which Pirelli is an active member. In 2016, ETRMA adhered to the new programme of the European Commission on Competitiveness and Sustainable Growth of the Auto Industry (GEAR 2030), which aims to face the new challenges arising from technological changes (alternative fuels, autonomous driving), globalization and new approaches to mobility. The programme, which lasts two years, will develop strategies for the competitive integration in the globalized world of the EU Auto Industry, the adaptation of the EU value chain to new technological challenges and emerging from the market, and develop a work plan on autonomous driving vehicles. Moreover, ETRMA is heavily involved in the implementation of the Emission Trading Scheme, with the aim of reducing the economic impact of European energy policies and the European Innovation Partnership on Raw Materials and guaranteeing fair and unrestricted access to key raw materials for the sector. Finally, the association supports the European Commission in the definition of policies on the Circular Economy for the sector and is successfully continuing in promoting sustainable manufacturer responsibility practices for the management of end-of-life tyres, thanks to which Europe maintains a more than 95% recovery rate, through close collaboration with the various operating partnerships existing in European countries. The good ETRMA (and European) practices constitute an international benchmark. IRSG – International Rubber Study Group
Pirelli, in representation of the European Commission, is a member of the Industry Advisory Panel of the International Rubber Study Group (IRSG) based in Singapore, an intergovernmental organisation that brings together producers and consumers of rubber (both natural and synthetic), acting as a valuable platform for discussion on issues regarding the supply and demand for natural and synthetic rubber. It is the principal source of information and analysis on all aspects related to the rubber industry. As part of the IRSG, since 2012, Pirelli has been, among other things, engaged in the Sustainability Rubber Project, which aims to create a World Standard of Sustainable Management for the rubber industry, which led to the launch in 2014, during the World Rubber Summit, of the Sustainable Natural Rubber initiative, and in 2015 of the pilot test on a voluntary basis involving all stakeholders of the supply chain; at the end of 2016, about 40 stakeholders adhered to the self-declaration of compliance with the

2016 ANNUAL REPORT
155
standard. It should be mentioned that about 85% of natural rubber is produced by small farmers owning less than 3 hectares of land; the decision to plant trees and produce natural rubber therefore depends on opportunity cost and therefore an adequate long-term plan to ensure stable growth that must be based on sustainability. In this regard, the initiative indicated above also aims to create conditions of economic, environmental and social sustainability in the natural rubber chain, so that there is attention to affordability but also to the support of farmers, respect for human and labour rights, and to the preservation of primary forests. WBCSD – World Business Council For Sustainable Development Pirelli actively participated in the WBCSD – World Business Council for Sustainable Development - in 2016. This is a Geneva-based association of about 200 multinational companies based in over 30 Countries that have made a voluntary commitment to link economic growth to sustainable development. In particular, Pirelli endorses two projects: Tire Industry Project and Sustainable Mobility Project. The Tire Industry Project (TIP), whose members account for about 65% of global production capacity of tyres, was launched in 2006 with the objective to seizing and anticipating the challenges of sustainable development through the assessment of the potential impact on health and environment of tyres throughout their life cycle. The project extends its evaluation activities to raw materials, tyre debris and nano-materials. On the latter issue, in collaboration with the Organization for Economic Co-Operation and Development (OECD), a specific guide was developed for the sectors that contains best practices of reference for research, development and industrialisation of new nano-materials, so as to ensure that the use of any nano-material is safe for people and the environment; the document is available at the link: http://www.oecd.org/chemicalsafety/nanosafety/nanotechnology-and-tyres-9789264209152-en.htm. The TIP is also finalizing the development of a proposal for "product category rules" (PCR) needed to perform the analysis of the life cycle (life cycle assessments - LCAs) and develop "environmental product declarations (EPDs)" for tyres so that the results are comparable between tyre manufacturers, as well as common KPI on HSE performance related to production to be used for aggregate reporting. The TIP group members also continued promotion in emerging countries, including China and Russia, of best practice on the management of ELT tyres and on enhancing the recovery and reuse of the same as a resource (secondary raw material), with the aim of reducing the exploitation of raw materials and the environmental impact that it involves. The Sustainable Mobility Project (now SMP 3.0), in which Pirelli has participated since 2013, has developed a vision at 2050 linked to an idea of urban mobility that is universally accessible and with low environmental impact, as regards the transport of both passengers and goods in urban context. The project (2013-2017) involves international companies in the automotive, auto & parts, transportation, oil & gas and information and communication technology sectors. The project led to the development of a set of sustainable mobility indicators, the creation of a “tool box” of solutions available in the public domain as the result of in-house innovation and their implementation in six pilot cities (Hamburg, Bangkok, Campinas, Chengdu, Indore, Lisbon), with which a cooperation project has been started for the development of their sustainable mobility plans. Among the six pilot cities selected, Campinas (Brazil), in addition to being the site of an important Group plant, saw Pirelli taking on the role of task force leader for the project. At the conclusion of this first phase of the project (SMP 2.0), Pirelli has helped the city authorities to redefine the sustainable urban mobility plan bringing attention to sustainable mobility, road safety and highly polluting emissions.
2016 ANNUAL REPORT
156
EU-OSHA – European Agency For Safety And Health At Work
For the eighth consecutive year, Pirelli continued to be an official partner of the European Occupational Safety and Health Agency (EU-OSHA) in 2016. Every two years, the Agency tackles a different issue. The 2016-2017 campaign "Healthy Workplaces for All Ages" recognizes the need to prepare a sustainable working environment, which guarantees the health and safety of employees throughout their entire working life. In endorsing the Campaign, Pirelli launched a series of targeted initiatives, confirming its commitment to promoting a healthy work environment, where employees feel valued and where dialogue and the sharing of know-how between different generations is encouraged. CSR Europe
Since 2010, Pirelli has been a member of the Board of CSR Europe, represented by the Chief Sustainability and Risk Governance Director. CSR Europe is a network of companies in Europe that are leaders in the area of corporate social responsibility. Its members include more than forty-five multinational companies and forty-one national partner organisations from thirty-three European countries. In addition to several collaboration projects between companies for the improvement of corporate management performance, in 2016, CSR Europe continued with the initiative "European Pact for Youth" launched in 2015 and undertook the new campaign "Sustainable Business Exchange", to support the achievement of the sustainable development goals of the United Nations. The Pact for Youth, supported by the European Commission and aimed at supporting the increased employment of young people through education and training as essential tools to match the skills of young people to the new skills required by the market, has seen Pirelli as a co-initiator of the initiative; the Group contributes to the realization of these goals through a network of collaborations with high schools and universities in the various countries in which it operates. In 2016, thanks to its acknowledged expertise in the field of social and environmental responsibility, Pirelli chose CSR Europe to organise the Pirelli Global Stakeholder Dialogue held in Brussels in February. The success of the event in Brussels has led the Company to confirm CSR Europe as coordinator of the Local Dialogues that took place between the second half of 2016 and the first months of 2017 in Romania, Mexico, Germany, Turkey and Egypt. International Commitments Against Climate Change
For years Pirelli has renewed its commitment to the fight against climate change, promoting the adoption of adequate energy policies for the reduction of CO2 emissions. During 2016, Pirelli participated in several events on the topic, including the Climate Conference in Marrakech (COP22), an event that brought together the signatory countries of the Paris Agreement to agree on a plan of implementation of the commitments undertaken a year earlier. In 2015, Pirelli joined the “Business for COP 21 Initiative” and participated in various side events organised during the Climate Change Conference in Paris. Throughout 2014, the Group joined the "Road to Paris 2015" project and signed three initiatives consistent with its sustainable development strategy:
• Responsible Corporate Engagement in Climate Policy; • Put a Price on Carbon; • Climate Change Information in Mainstream Filings of Companies Communication.
Also in 2014, the Company signed the Trillion Tonne Communiqué, the document that requires global emissions over the next 30 years to remain below the trillion tonnes of greenhouse gases in order to

2016 ANNUAL REPORT
157
avoid a rise in average global temperature higher than 2°C and thus avoid disruptive climate impacts that are inevitably associated. In 2012, Pirelli signed The Carbon Pricing Communiqué; in 2011, it signed the 2nd Challenge Communiqué, while in 2010 it signed the Cancún Communiqué and in 2009, it signed the Copenhagen Communiqué and in 2007 it signed the Bali Communiqué, the first document for the development of concrete strategies through joint work by Governments on a comprehensive global climate agreement. COMPANY INITIATIVES FOR THE EXTERNAL COMMUNITY As specified in the Group “Ethical Code”, Pirelli provides support to educational, cultural, and social initiatives for promoting personal development and improving living standards. The Company does not provide contributions, advantages, or other benefits to political parties or trade union organisations, or to their representatives or candidates, this without prejudice to its compliance with any relevant legislation. Since the founding in 1872, Pirelli has been aware that an important role in the promotion of civil progress in all the communities where it operates and, capitalising on the Company’s natural strengths, it has identified three focus areas: road safety, technical training and solidarity through sporting activities for young people. Pirelli for some years has adopted an internal procedure to regulate the distribution of gifts and contributions to the External Community by Group companies, in relation to the roles and responsibilities of the functions involved, the operational process of planning, realisation and monitoring the initiatives and the disclosures regarding the same. Essential support in the identifying of the actions that best satisfy local requirements comes from the dialogue with locally operating NGOs. Priority is given to those initiatives whose positive effects on the External Community are tangible and measurable according to objective criteria. The internal procedure also specifies that initiatives may not be promoted for the benefit of beneficiaries in respect of whom there is direct or indirect evidence of failure to abide by the human rights, workers, the environment, or business ethics. The contributions to the External Community by Group companies are part of a broader strategy to support the achievement of the Sustainable Development Goals of the United Nations (SDGs), already mentioned above in the report, in the paragraphs "Sustainable Governance Model and Planning " and "UN Global Compact Lead". To better understand the links between the philanthropic activities of the Group and the UN Goals, at the end of each of the following sub-paragraphs are the SDGs that are most directly impacted by the Company's activities described herein. Road Safety
Pirelli is synonymous worldwide not only with high performance, but also safety. Together with environmental protection, road safety is the key element of the Green Performance strategy that inspires the Group’s industrial and commercial choices. Pirelli’s commitment to road safety takes the form of numerous training and awareness-raising activities, but above all it translates into research and the ongoing application of innovative technological solutions for sustainable transport. In 2016, Pirelli confirmed its commitment to the promotion of road safety through adherence to the "Action for Road Safety Campaign" of FIA, developed in support of the decade of actions for road safety organised by the United Nations in late 2011. The FIA campaign promotes initiatives and training and information campaigns aimed at encouraging more responsible driver behaviour and having safer roads and cars. As a Global Partner of this campaign, Pirelli has also signed the "Ten Golden Rules" for road safety, undertaking to disseminate them to its distribution network and to initiate training programmes and

2016 ANNUAL REPORT
158
awareness-raising projects for safe driving that will be channelled through the FIA clubs in the world starting in 2017. Regarding road safety, Pirelli is also a signatory of the European Road Safety Charter, through which it undertakes to:
• contribute to consumer knowledge about the fundamentals of road safety, through experience and safe driving courses;
• increase the awareness of young drivers on the causes of road accidents through specific initiatives;
• provide information material on winter road safety at the points of sale, with the support of the Pirelli website (potential reach of 9 million users worldwide in one year) and sites dedicated to information on winter ordinances;
• organise training seminars, in collaboration with associations, on issues of road safety related to the tyre and its related uses;
• train international dealers on the importance of the tyre in road safety and the performance differences between winter, summer and all-season tyres; the activity has been ongoing for over two years and has involved most of the countries in which Pirelli has a direct presence; in 2016, there were more than 900 classroom training sessions for dealers from around the world with more than 22,000 participations;
• actively participate in national programmes on road safety, in agreement with associations, institutions, universities, manufacturers of cars and motorcycles or collaborating with law enforcement agencies for the preparation of a useful module for detection of the state of use of the tyre.
Also at Group level, since 2013, Pirelli has participated in the WBCSD Sustainable Mobility project that proposes solutions for the redefinition of urban mobility with a focus on the issues of sustainable mobility and road safety. For further details on Pirelli's involvement in this project, reference is made to the paragraph "WBCSD" of this report. In Italy, Pirelli dealt with the definition of summer/winter tests regarding Assogomma and actively participated in road tests with the involvement of journalists, automotive specialists and government agencies such as the traffic police. As in previous years, also in 2016, Pirelli dedicated a website to the collection of updates related to the winter ordinances in force on Italian territory (www.ordinanzeinvernali.it). There are many road safety initiatives implemented by the countries in which the Group operates: in the USA and Canada, the "Tyre Safety Week" initiative was organised on safe driving that also involved other tyre manufacturers; in Mexico, a major campaign was organised for safe driving with the support of the Rally driver Benito Guerra; in the UK, several information campaigns were organised that involved both lessons on the safety of tyres within local schools and practical lessons for drivers with the goal of teaching the importance of measuring the tread to ensure vehicle safety. These initiatives have led Pirelli UK to be awarded the "Safety in the Community" prize; in Egypt, during the year, Pirelli provided training to about 300 truck and bus drivers; other courses on tyres and safety were also held in four different Chinese universities. In regard to heavy vehicle transport, in 2016, Pirelli Industrial continued the activities it had already undertaken in previous years, dedicated to sustainable mobility and road safety. There is an important tutorial on the CyberFleet system on the Pirelli.com/tyre website, which offers fleet managers the opportunity to quantify the benefits of a correct measurement of the pressure and temperature of the tyres in terms of regularity of wear, fuel economy and road safety. In parallel, meetings have been organised during the year at European level with fleets and dealers, aimed at raising awareness on

2016 ANNUAL REPORT
159
sustainability in freight transport through the introduction of tools for tyre pressure monitoring (Cyber and FleetCheck systems). There were many initiatives in favour of education for road safety also by the Pirelli Motorcycle Business Unit, which in 2016 continued the collaboration with driving schools for the development of practical and safe on-road and off-road experience. SDGs - Reference Targets:
• 3.6, dedicated to reducing the number of deaths and injuries due to road accidents; • 11.2, in support of safer, more accessible and sustainable transport systems, with particular
attention to the needs of the most vulnerable groups.
Training
The promotion of technical education and training are very old values that are well-established in the history of Pirelli. The Group continues to benefit from technical and research cooperation with various universities around the world, beginning with the Milan and Turin Polytechnic Universities, the Milan Bicocca University and also the Qingdao University in China, the University of Craiova in Romania and the Universities of Baden-Wuerttemberg, Darmstadt and Aschaffenburg in Germany, among others. In Romania, Pirelli collaborates with several local universities on technical training courses: among the most important in 2016 were the IT Academy and the Master Automotive. Moreover, in collaboration with local authorities, Pirelli participates in the START programme, aimed at training the unemployed. Technical training has a fundamental role in the creation of a skilled labour pool needed to maximise plant productivity. In Mexico, the Piero Pirelli Institute for technical training, inaugurated in 2015, is equipped with the most advanced learning tools (virtual simulator, automatic controls, pneudraulic systems, electrical, electro-mechanical, mechanical and measurement systems), and can train more than 100 students per month. Within the institute, there are numerous classrooms, a showroom on the process, materials and 3D models of the product, production workstations that use both virtual reality and physical warehouse simulators, service areas and offices. In Russia, Pirelli has collaborated with the Vyatka State University to train specialists in the manufacture of tyres, and sponsoring a research project on rubber materials. In Spain and Argentina, Pirelli sponsored scholarships. The Merlo factory in Argentina also hosted 12 technical students offering an internship programme. In China, Pirelli sponsored an Award for Technical Innovation and signed an agreement with the Qingdao University for Science and Technology, which provides 30 scholarships for outstanding students. In Germany, the company supported the schools of Hoechst, Bad Koenig and Breuberg. In Brazil, Pirelli supports Educandario Imaculado Coracao de Maria in Amélia Rodrigues, an elementary school run by Italian nuns and attended by 940 children. Training does not only concern the production process at the factory; for Pirelli, the entire life cycle of the tyre is important. In fact, the Group focuses heavily on disseminating sustainable agriculture practices for raw materials such as natural rubber. In Indonesia, in collaboration with the supplier Kirana Megatara, Pirelli continued the "Rubber Productivity Enhancement Project" with two main objectives:
• Educating natural rubber farmers by teaching the correct procedures for rubber extraction enabling the protection of natural resources (maximising productivity and maintaining and extending the life of trees). Training is on three fronts: theory, extraction, and quality;
• Giving scholarships to the children of natural rubber growers, to allow them to go to school and buy school books.
2016 ANNUAL REPORT
160
SDGs - Reference Targets:
• 4.4, dedicated to increased technical training to youth and adults, aimed at increasing manual skills and entrepreneurship;
• 9.5, referring to support for scientific research and increased technological capabilities of the industrial sectors.
Sport And Social Responsibility
There is a close link between solidarity and sport, in a virtuous circle where commitment to sports becomes synonymous with the commitment to promoting solidarity and ethics, especially amongst young people. Getting young people involved in sport is a way to teach the notion of integration to children from different social groups, and helps prevent negative situations like isolation and solitude. Pirelli signed a global agreement not only for the sponsorship of the professional football club FC Internazionale Milano (“Inter”), but also as a partner of the global social project Inter Campus. Since 1997, Inter Campus has developed social, flexible cooperation and long-term actions, in 29 countries around the world with the support of 200 local operators, using football as an educational tool to offer to boys and girls in need, aged between 6 and 13, the right to play. Since 2008, Inter and Pirelli, along with a local partner, have been running the Inter Campus social project in Slatina, Romania. The sports and recreational activities are organised for the entire year, involving over 100 children from different social contexts who have been learning team spirit, social integration and the values of friendship through football for many years now. Since 2012, Pirelli and Inter have replicated the experience of Inter Campus in Mexico: Inter Campus Silao, near the Pirelli factory, inaugurated by President Felipe Calderon, involves more than 100 children in the area. In the United States, the first Inter Campus was inaugurated in 2014 by Pirelli and Inter along with the Youri Djorkaeff Foundation. The Campus is located in the community of Inwood, a neighbourhood in New York City, and involves more than 120 children. Also in 2014, Pirelli and Inter launched an Inter Campus project together in Voronezh, Russia, involving two local orphanages with about 100 children. In Brazil, Pirelli sponsors basketball, volleyball, football, surfing and tennis activities. In the United States, Pirelli sponsored the local team Rome Braves in Georgia, as well as various sporting events related to philanthropy, including the donation to R.A.C.E. (Racing Awareness Charity Events of Rome). Even in the United Kingdom, Pirelli sponsored various sporting events related to philanthropic fundraising and helped to donate funds for the construction of a new sports field. In Germany, Pirelli made donations for youth sports clubs. In Kirov, Russia, Pirelli sponsored the ice hockey "Pirelli Cup", involving several teams of adults and children of seven countries in the area (60 adult participants plus 120 children). In Voronezh, also in Russia, Pirelli was a partner for a sailing regatta. In Egypt, Pirelli built a sports centre for youths on a plot of 3,000 square metres donated by the Ministry of Youth. And in China, as in other countries, Pirelli organized football games to promote health and wellness. SDGs - Reference Targets:
• 3, dedicated to guaranteeing a healthy lifestyle and promoting well-being for everyone, at all ages.
Solidarity
The responsible approach taken by Pirelli to involvement and inclusion takes the form of social solidarity activities worldwide. The Company supports educational and didactic programmes that are able to give less fortunate children the tools to improve their condition; it contributes scholarships and research projects, firmly believing in training as vital to individual growth and the economic growth of a

2016 ANNUAL REPORT
161
country. In Brazil, where Pirelli has been historically active in the local community with social projects, the Company provided for about 120 children in the city of Feira de Santana, near the Pirelli factory, in an after-school programme with 15 different types of activities. A similar project is near the Gravatai factory, which is aimed at social inclusion and includes music and dance activities as well as more traditional teaching. Also in Brazil, Pirelli supports the kindergartens Dr. Klaide in Santo André and Escadinha do Tempo to Meleiros, which guarantee for 270 children not only educational activities but also medical, dental and psychological visits, in addition to food. Pirelli supports the Fundació Mambre in Spain, a foundation that operates as a facilitator in social inclusion processes, supporting homeless people on their individual growth paths. In addition, the Company supports programmes providing food for needy families, and a warehouse for the storage of food for the poor. Pirelli collaborates with the AMPANS Association, dedicated to the cognitively disabled. Pirelli has also contributed to a solidarity project aimed at the integration of children at risk of social exclusion, and to the Casa degli Italiani (House of Italians) in Barcelona to help the needy. In Russia, the Moscow employees organised fundraising activities to finance 1,200 private lessons for orphans, while in Kirov, Pirelli employees dedicated part of their time to entertainment of children in a kindergarten and, with the support of the Arifmetika Dobra foundation, organised a visit to the factory for older children. A group of employees of the Moscow office took part in a race in support of "Naked Hearts", the association run by Natalia Vodyanova. In Turkey, Pirelli financed a dinner for 3,000 citizens in need during Ramadan. In Germany, Pirelli made donations to the Finkennest home for children and to an entity that deals with safe playgrounds in the Odenwald area. In the UK, Pirelli has dealt with many community initiatives, including, in particular, the donation of toys for hospital children and a prize of "local heroes" giving visibility to local initiatives such as "Me & Dee", which offers holidays to people in need. In China, Pirelli has made a donation to the Jining orphanage, supporting about 70 orphans and poor children. In the United States, Pirelli, with the support of some employees, has contributed to fundraising for the purchase of food for the needy, and has made a donation of children's toys. SDGs - Reference Targets:
• 1, on the eradication of poverty in all its forms; • 2, related to the elimination of hunger in the world; • 11, dedicated to the development of cities and social environments that are inclusive, safe and
sustainable. Health Pirelli considers contributing to improving the health services of the communities where it operates to be important. Since 2008, Pirelli Tyres Romania, in collaboration with the Niguarda Hospital in Milan, has supported the professional training of medical and nursing professionals and the donation of medical equipment and devices to Slatina Hospital. Over 270 professionals were trained in this programme, and specifically in oncology, paediatric care and emergency care. Pirelli Tyres Romania has also provided dental treatment to many children in Slatina through the project Overland for Smile. In Mexico, Pirelli organized a "Health Week" promoting healthy and active lifestyle in the local community. In the United States, a "Wellness Challenge" was organized, which attracted 53 participants. In the UK, the philanthropic activities of Pirelli in the field of health include sponsorships, fundraisers and donations for research and medical care. Among them, in 2016, Pirelli raised funds for hospices and

2016 ANNUAL REPORT
162
hospitals in the areas of Burton on Trent and Carlisle, where the two factories are located. Other funds were intended for associations to support the blind and leukemia patients. In Spain, Pirelli participated in the Day of Solidarity Somos Uno, raising funds for biomedical research for serious childhood diseases and the prevention of Alzheimer's. Since 2010, Pirelli has supported the Pequeno Principe Hospital in Curitiba, the biggest paediatric hospital in Brazil. In Argentina, Pirelli is the official sponsor of the Marathon for the rights of children of the Italian Hospital who have had cancer; the race involved more than 1,500 participants. SDGs - Reference Targets:
• 3, dedicated to guaranteeing a healthy lifestyle and promoting well-being for everyone, at all ages.
Environmental Initiatives Many Pirelli employees around the world enthusiastically participate every year in environmental projects. In Egypt, a competition was also promoted in 2016 for the best ideas about recycling of factory waste materials (pieces of wood, building materials, etc.): six teams participated, representing six local villages. Among the very useful projects: expansion of a kindergarten, strengthening of the roofs of 12 houses, construction of directional signs for traffic for 33 villages, construction of sheds and furniture for the reception of a gym and projects to build for bins for garbage collection. The commitment of the Egyptian factory in these projects, as well as the commitment of the same in work-life balance initiatives for employees, has led Pirelli Egypt to obtain the "Pioneer Business to Achieve Sustainable Development" award. In Romania and Russia, groups of employees have volunteered for local environmental clean-up projects. In Mexico, Russia, Turkey, Romania and China, days were organised to plant trees. A major project to preserve the forest areas was Kirana Megatara in Indonesia, already described in this chapter in the section on training, aimed at maximizing productivity and maintaining and extending the useful life of natural rubber trees. SDGs - Reference Targets:
• 12.5, aimed at reducing the generation of waste through reduction, recycling and reuse; • 15.2, related to the promotion of sustainable forest management, to reduce deforestation and
increase reforestation. Culture And Social Value The internationality of Pirelli also emerges from the love for culture, with initiatives in many countries worldwide also in 2016. The attention to culture, and even more the commitment to preserve it, spread it and enhance it, are part of the DNA of the creation of social value. Pirelli is among the sponsors of the Museum of Modern Art of Sao Paulo, one of the most important structures in Latin America which, in addition to the permanent collection, every year offers major exhibitions, seminars, events and courses. Also in Brazil, Pirelli supported the exhibition of the collection of the banker Roger Wright at the Pinacoteca de Sao Paulo, a selection of more than 170 Brazilian works of the 60s and modern installations. Pirelli also supports the exhibition of Marinella Pirelli, on 50 years of artistic activities with a particular focus on the poetic creatiove process and luminous objects. Pirelli provided support to the event ArtRio, a collection of 100 national and international galleries. In Brumadinho, Pirelli supports the Instituto Inhotim, with a famous collection of contemporary art and a collection of plants
2016 ANNUAL REPORT
163
from around the world. In the field of music, Pirelli sponsors the Mozarteum project, which presents great international orchestras of classical music in Brazil and in Argentina, at the famous Teatro Colon. In Romania, Pirelli sponsors theatre days for the community, in collaboration with the Cultural Center of Slatina "Eugen Ionescu". In Russia, Pirelli organizes trips to the museum for children, and supports young talents. In 2016, the company also raised funds for the preservation of historic buildings. Also in Russia, an exhibition of the Pirelli Calendar was presented at the Multimedia Art Museum in Moscow. In the United States, Pirelli sponsors the Council for the Arts in Rome, Georgia. Pirelli is also very attentive to the preservation of local cultures. Among these, one of the most important initiatives is the support of research on Confucianism through support to the China Confucius Website and the Confucius Culture Month. SDGs - Reference Targets:
• 4, aimed at promoting quality education and all forms of equitable and inclusive learning. FONDAZIONE PIRELLI (PIRELLI FOUNDATION) One of the missions of the Fondazione Pirelli, or Pirelli Foundation, established in 2009, is the preservation of the Group’s historic and cultural heritage and the promotion of its corporate culture through local initiatives having a strong social impact, exhibitions, as well as collaborations with other cultural institutions. Numerous projects were carried out again in 2016 to promote the Pirelli archives. Among these, the following are noted in particular:
• Design and implementation of the exhibition "Pirelli, sustainable culture. Raw materials, research, processes and products, people. Our story through the historical heritage of the company" in the spaces of the Foundation to explore, from the Historical Archive documents, the evolution of sustainable management as a lever of competitiveness from 1872 to the present. The exhibition première was attended by industry journalists invited to the press conference "Pirelli Green lunch. The dimensions of sustainability: achievements and future goals". Guided tours of the exhibition were also offered to customers and guests of the company, to universities and academic master's students, and as part of the "Learning Lab" for Pirelli employees;
• Realisation of exhibition paths, among which: "The industry Architectures: from the Bicocca Project to the Industrial Centre of Settimo Torinese. A tour of places and stories of the Pirelli" set up at the Milan Headquarters for the XXI International Exhibition of Milan Triennale of which Pirelli was Official Partner; "Pirelli: an industry of design and language. A story that has spoken Italian for over 140 years" created as part of the XVI week of the Italian language in the world promoted by the Ministry of Foreign Affairs and International Cooperation, hosted at the Italian Embassy Cultural Centre in New Delhi and Kuwait; "50+! The big game of the industry", exhibition dedicated to "Made in Italy" excellence, in collaboration with Museimpresa, in which Pirelli took part with advertising and historical photographs of the Cinturato tyre. The exhibition has been exported to China, Jordan, Venezuela, Israel, Turkey, Malaysia, Oman;
• Constitution of the Bicocca District, network of institutions and companies that share the goal of creating, also through the involvement of citizens, a central hub for the area north of the metropolitan city, linking education, research, culture and companies. Leader of the project, together with Pirelli Foundation and Pirelli HangarBicocca, the University of Milan-Bicocca;
• Digital and library projects: in addition to the website fondazionepirelli.org, restyled in 2016, the Foundation constantly feeds its own Facebook page and Instagram and Pinterest accounts. During the year, the digital library was implemented on the website with the publication of the reportage relating to the Pirelli skyscraper (in English and Italian version). The work continued

2016 ANNUAL REPORT
164
for cataloging and digitization of the materials of the Historical Archives: house organ and publications such as "Paginas Pirelli" (Argentina), "Noticias Pirelli" (Brazil), "Fatti e notizie", training notebooks, and photographs related to racing and bicycle tyres;
• Analysis, restoration and digitization of materials for the publication of the volume “La pubblicità con la P maiuscola” (Advertising with a capital A) (working title). The volume, followed by “Una musa tra le ruote (A muse in the wheels) Pirelli: a century of art at the service of the product", which is expected to be released in mid-2017, aims to enhance the archival collection of Pirelli advertising communication between the seventies and nineties of the twentieth century. Over 200 folders of print work registered, about 250 works restored and over 400 advertising materials digitized;
• Opening of the Pirelli corporate libraries of Milan Bicocca and Bollate as part of the project #ioleggoperchè in support of reading. More than 3,500 titles already available for employees to borrow and consult;
• Initiatives to promote Corporate Culture: - Organization of the concert "Children of Beethoven" (L. van Beethoven, R. Schumann) at the Pirelli Headquarters Auditorium in the Festival MITO SettembreMusica; - participation with guided visits to open archives, initiative by Rete Fotografia (Photography Network, of which the Foundation is part) to promote knowledge of photographic assets (attended by about 150 people); - participation in the XV Week of Corporate Culture, promoted by Confindustria, on the theme "The beautiful factory: culture, creativity, sustainability", with animated guided tours by professional actors, children's workshops, bike tours and the play "The words from the factory ", in collaboration with the Theatre Franco Parenti (attended by over 650 people);
• Creation of a path set up for the community of Pirelli employees on the theme of Christmas told through the pages of the magazine "Pirelli" (attended by about 450 employees);
• Pirelli Foundation Educational Project for students with the aim of bringing them closer to the world of work and the values of the Pirelli corporate culture. There were over 150 educational courses, which involved over 3,000 children. Among the additions of 2016, a promotional video of educational activities and guided tours for high schools to the Industrial Centre of Settimo Torinese and establishment Next Mirs of Bicocca. In agreement with the Research and Development Department of Pirelli, a collaboration was initiated with the Association "Friends of the school G.B. Pirelli" and with the University of Milan-Bicocca for support in the X Edition of the "Festival of educational robotics". The Pirelli Foundation has also collaborated in the project "Bullying in offside" launched by the MUIR Ministry of Education, University, Research and promoted by Inter;
• Educational activities for university students from leading Italian and foreign universities (University of Milan-Bicocca, Università Cattolica del Sacro Cuore, University Luigi Bocconi, Politecnico di Milano, Princeton University, Business School at the University of Illinois, etc.);
• Bambini in Bicocca project: for the fourth consecutive year the Foundation collaborated in the project with the Pirelli Human Resources Department, creating the educational courses aimed at employees’ children being welcomed into the Company during school holidays. Through a visit to the Historical Archives, the children had the opportunity to experience in-depth the relationship between Pirelli and the world of art. The project involved more than 250 children aged between 5 and 10 for 9 days.
In 2013, approximately 9,000 researchers, students, historians and designers visited the Foundation headquarters and conducted research at the Pirelli Historical Archive in 2016. About 2,000 of its materials were provided for exhibitions and publications, also internationally.
2016 ANNUAL REPORT
165
PIRELLI HANGARBICOCCA Pirelli HangarBicocca, which with its 15,000 square metres is one of the largest exhibition venues in Europe, is a space dedicated to the production, exhibition and promotion of contemporary art, created in 2004 from the reconversion of a vast industrial facility that belonged to Ansaldo-Breda. The programming of solo exhibitions by the most important international artists is distinguished by a character of research and experimentation and special attention to site-specific projects which are capable og maintaining a dialogue with the unique features of the space. The 2016 artistic programme, curated by Artistic Director Vicente Todolí and curator Roberta Tenconi, presented artists of great international profile, alternating exhibitions of very successful names with exhibitions of emerging artists. The programme managed to attract an Italian and international audience composed of art experts, representatives of the most important museums, trade journalists and the general press, as well as an equally large number of enthusiasts, families and students. During the year, there were a total of 200,000 visitors who visited the 5 large exhibition projects dedicated to international artists as well as the exhibition held on the occasion of the XXI Triennale International Exhibition Milan 2016:
• Philippe Parreno, “Hypothesis” • Petrit Halilaj, “Space Shuttle in the Garden” • Architecture as Art, XXI International Exhibition Triennale di Milano • Carsten Höller. “Doubt” • Kishio Suga, “Situations” • Laure Prouvost, “GDM-Grand Dad’s Visitor Center”
The vocation of Pirelli HangarBicocca is that of a place open to the city and its hinterland, of an institution that accompanies the normal exhibition activity with a range of programmes intended to attract even the non-specialised public to contemporary art. In 2016, the Public Program accompanied the exhibitions with a full calendar of events, guided tours to the exhibitions and the district, projections and meetings with the key players in art and culture. During the year, there were about 15 cultural events (day and/or evening) that involved more than 7,000 participants in activities related to ongoing exhibitions, including a concert by pianist Michael Rudy attended by over 1,000 people, as well as a 2-day summer festival in July, which was attended by over 2,000 people. On April 1, 2016, a paid membership project was launched that reached 335 cards sold in December, with a calendar of dedicated events, discounts and facilities. HB Kids and HB Family activities for children aged between 4 and 14, saw the participation of 2,460 children and young people, in line with the figures of the previous years. Instead, the number of participants who took part in the HB School activities reached 7,400. The education department also continued its guided tours proposing activities in Italian and foreign language in addition to the format "Art on Sunday" involving cultural mediators in Sunday lessons on the history of art related to the exhibitions and Bike Tours to discover the neighbourhood for school students of all levels. With a view to enhancing the Seven Heavenly Palaces of Anselm Kiefer, the space hosted two important musical moments co-produced with established Milan-based companies: the concert of the Boerdomes group in collaboration with the Terraform festival (May 31, 2016) and the concert Le Noir de L'Etoile with Percussion du Strasbourg, first of a multi-year collaboration with the Milano Musica festival (November 12, 2016). In April 2016, a new Bookshop opened, with a selection of books and catalogues relating to current exhibitions, children's books, non-fiction related to art, reference books.
2016 ANNUAL REPORT
166
Moreover, in 2016, Pirelli HangarBicocca activated an agreement with the Milan Bicocca University Centre, becoming part of a working table of the District Bicocca. In the course of the year, the website has seen an increase of 145% over the previous year. During the year, Pirelli HangarBicocca also hosted 9 large, private events including Sky Arte, Order of Chartered Accountants, Aippi. The activities of Pirelli HangarBicocca generate, among other things, significant induced employment: in 2016, the creation of exhibitions and major initiatives involved 45 companies and generated 9,750 days/worker.
2016 ANNUAL REPORT
167
05. Consolidated Financial Statements at December 31, 2016
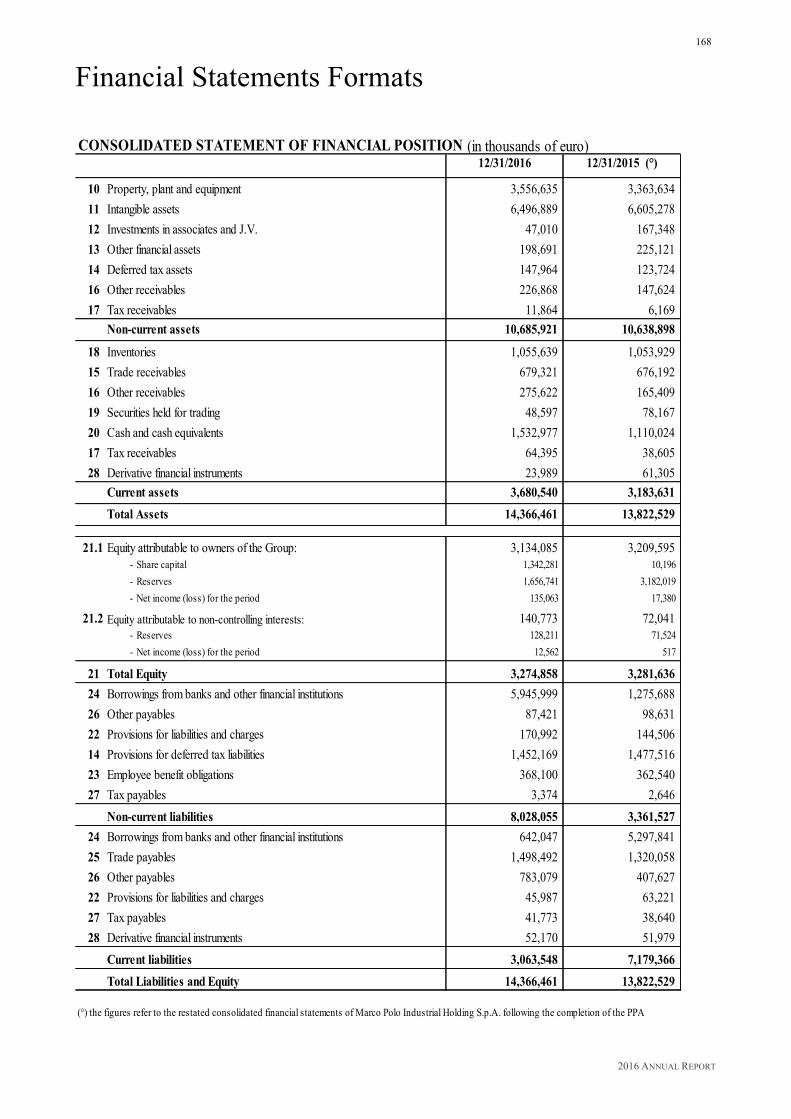
2016 ANNUAL REPORT
168
Financial Statements Formats CONSOLIDATED STATEMENT OF FINANCIAL POSITION (in thousands of euro)
10 Property, plant and equipment 3,556,635 3,363,63411 Intangible assets 6,496,889 6,605,27812 Investments in associates and J.V. 47,010 167,34813 Other financial assets 198,691 225,12114 Deferred tax assets 147,964 123,72416 Other receivables 226,868 147,62417 Tax receivables 11,864 6,169
Non-current assets 10,685,921 10,638,898
18 Inventories 1,055,639 1,053,92915 Trade receivables 679,321 676,19216 Other receivables 275,622 165,40919 Securities held for trading 48,597 78,16720 Cash and cash equivalents 1,532,977 1,110,02417 Tax receivables 64,395 38,60528 Derivative financial instruments 23,989 61,305
Current assets 3,680,540 3,183,631Total Assets 14,366,461 13,822,529
21.1 Equity attributable to owners of the Group: 3,134,085 3,209,595- Share capital 1,342,281 10,196- Reserves 1,656,741 3,182,019- Net income (loss) for the period 135,063 17,380
21.2 Equity attributable to non-controlling interests: 140,773 72,041- Reserves 128,211 71,524- Net income (loss) for the period 12,562 517
21 Total Equity 3,274,858 3,281,63624 Borrowings from banks and other financial institutions 5,945,999 1,275,68826 Other payables 87,421 98,63122 Provisions for liabilities and charges 170,992 144,50614 Provisions for deferred tax liabilities 1,452,169 1,477,51623 Employee benefit obligations 368,100 362,54027 Tax payables 3,374 2,646
Non-current liabilities 8,028,055 3,361,52724 Borrowings from banks and other financial institutions 642,047 5,297,84125 Trade payables 1,498,492 1,320,05826 Other payables 783,079 407,62722 Provisions for liabilities and charges 45,987 63,22127 Tax payables 41,773 38,64028 Derivative financial instruments 52,170 51,979
Current liabilities 3,063,548 7,179,366Total Liabilities and Equity 14,366,461 13,822,529
(°) the figures refer to the restated consolidated financial statements of Marco Polo Industrial Holding S.p.A. following the completion of the PPA
12/31/2016 12/31/2015 (°)
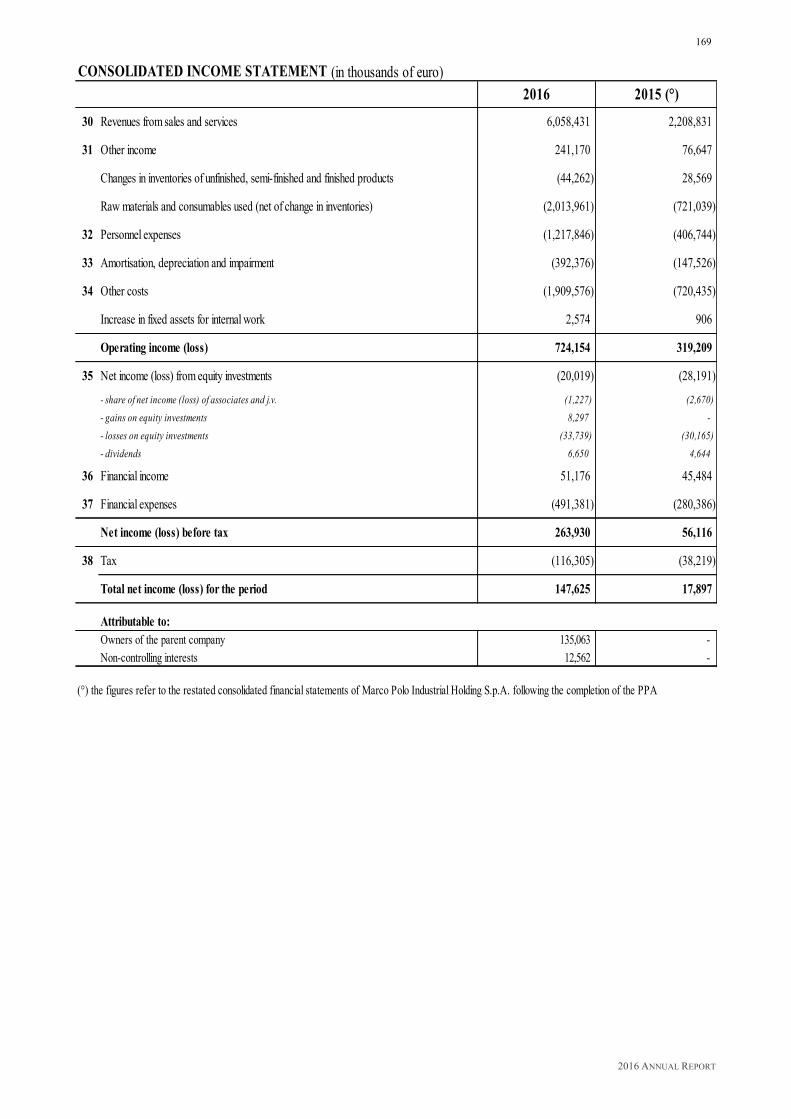
2016 ANNUAL REPORT
169
30 Revenues from sales and services 6,058,431 2,208,831
31 Other income 241,170 76,647
Changes in inventories of unfinished, semi-finished and finished products (44,262) 28,569
Raw materials and consumables used (net of change in inventories) (2,013,961) (721,039)
32 Personnel expenses (1,217,846) (406,744)
33 Amortisation, depreciation and impairment (392,376) (147,526)
34 Other costs (1,909,576) (720,435)
Increase in fixed assets for internal work 2,574 906
Operating income (loss) 724,154 319,209
35 Net income (loss) from equity investments (20,019) (28,191)
- share of net income (loss) of associates and j.v. (1,227) (2,670)- gains on equity investments 8,297 - - losses on equity investments (33,739) (30,165)- dividends 6,650 4,644
36 Financial income 51,176 45,484
37 Financial expenses (491,381) (280,386)
Net income (loss) before tax 263,930 56,116
38 Tax (116,305) (38,219)
Total net income (loss) for the period 147,625 17,897
Attributable to:Owners of the parent company 135,063 - Non-controlling interests 12,562 -
(°) the figures refer to the restated consolidated financial statements of Marco Polo Industrial Holding S.p.A. following the completion of the PPA
2016 2015 (°)CONSOLIDATED INCOME STATEMENT (in thousands of euro)
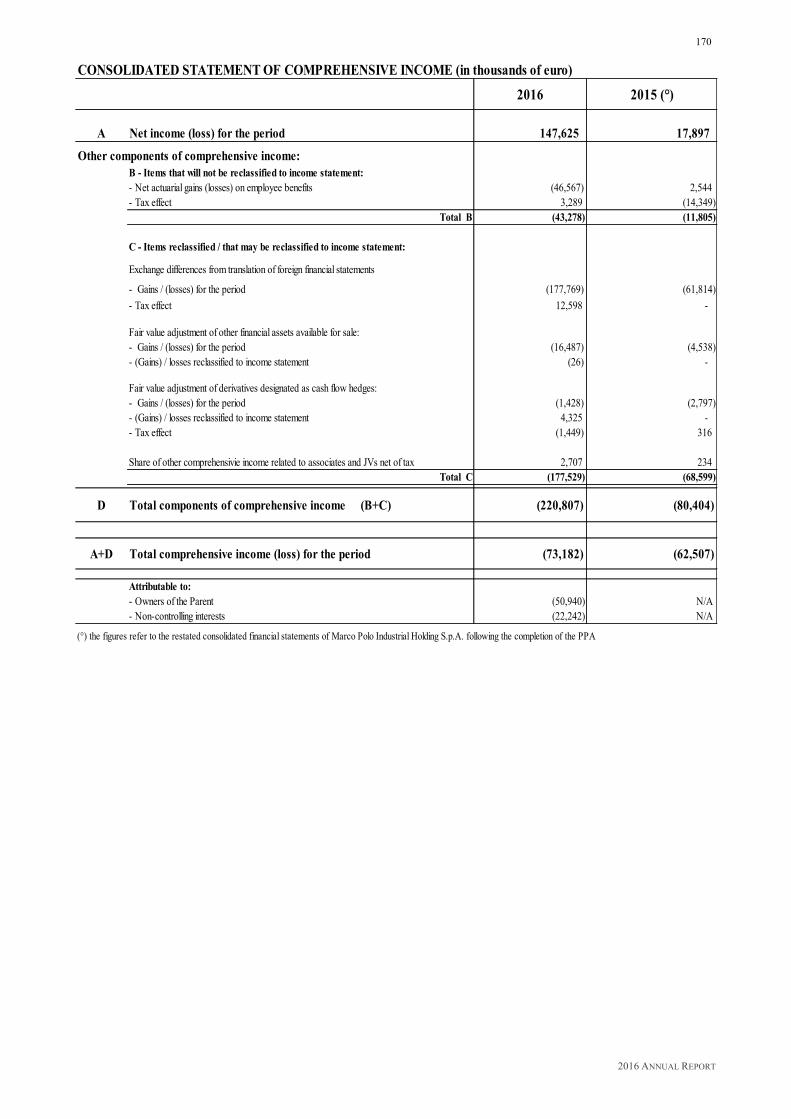
2016 ANNUAL REPORT
170
CONSOLIDATED STATEMENT OF COMPREHENSIVE INCOME (in thousands of euro)
2016 2015 (°)
A Net income (loss) for the period 147,625 17,897
B - Items that will not be reclassified to income statement:- Net actuarial gains (losses) on employee benefits (46,567) 2,544 - Tax effect 3,289 (14,349)
Total B (43,278) (11,805)
C - Items reclassified / that may be reclassified to income statement:
Exchange differences from translation of foreign financial statements
- Gains / (losses) for the period (177,769) (61,814)- Tax effect 12,598 -
Fair value adjustment of other financial assets available for sale:- Gains / (losses) for the period (16,487) (4,538)- (Gains) / losses reclassified to income statement (26) -
Fair value adjustment of derivatives designated as cash flow hedges:- Gains / (losses) for the period (1,428) (2,797)- (Gains) / losses reclassified to income statement 4,325 - - Tax effect (1,449) 316
Share of other comprehensivie income related to associates and JVs net of tax 2,707 234 Total C (177,529) (68,599)
D Total components of comprehensive income (B+C) (220,807) (80,404)
A+D Total comprehensive income (loss) for the period (73,182) (62,507)
Attributable to:- Owners of the Parent (50,940) N/A- Non-controlling interests (22,242) N/A
(°) the figures refer to the restated consolidated financial statements of Marco Polo Industrial Holding S.p.A. following the completion of the PPA
Other components of comprehensive income:
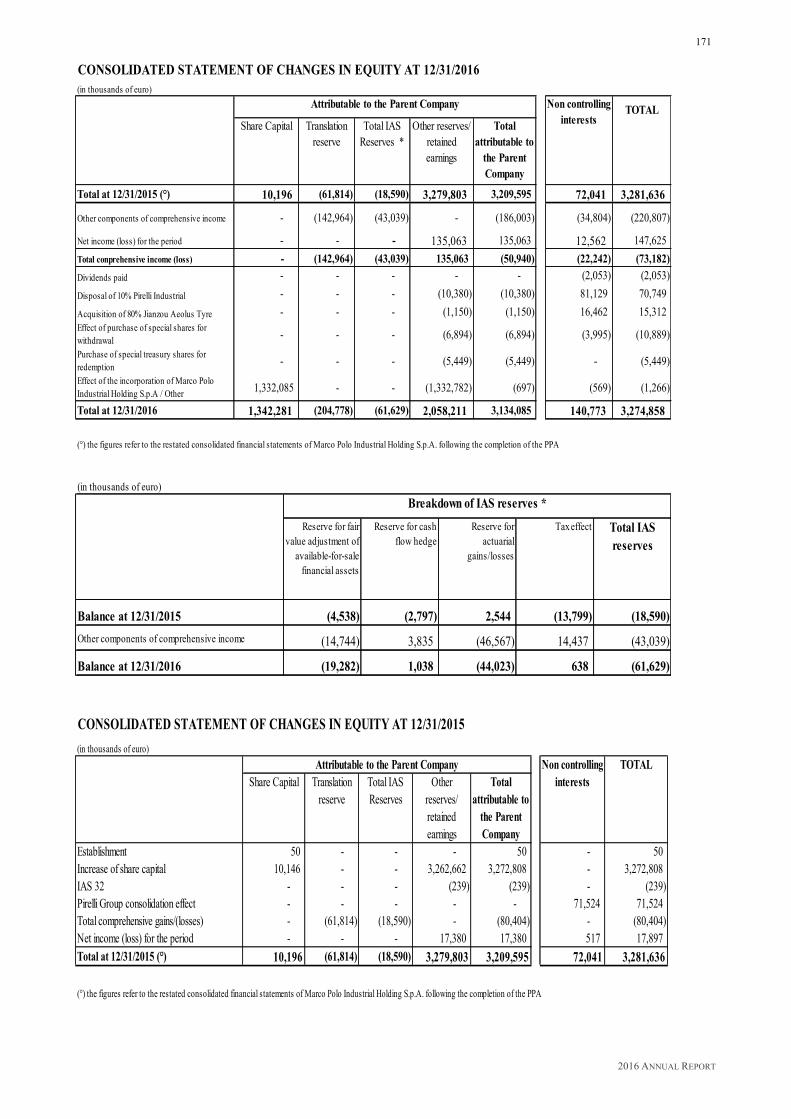
2016 ANNUAL REPORT
171
CONSOLIDATED STATEMENT OF CHANGES IN EQUITY AT 12/31/2016(in thousands of euro)
TOTALShare Capital Translation
reserveTotal IAS
Reserves *Other reserves/
retained earnings
Total attributable to
the Parent Company
Total at 12/31/2015 (°) 10,196 (61,814) (18,590) 3,279,803 3,209,595 72,041 3,281,636
Other components of comprehensive income - (142,964) (43,039) - (186,003) (34,804) (220,807)
Net income (loss) for the period - - - 135,063 135,063 12,562 147,625 Total conprehensive income (loss) - (142,964) (43,039) 135,063 (50,940) (22,242) (73,182) Dividends paid - - - - - (2,053) (2,053) Disposal of 10% Pirelli Industrial - - - (10,380) (10,380) 81,129 70,749 Acquisition of 80% Jianzou Aeolus Tyre - - - (1,150) (1,150) 16,462 15,312 Effect of purchase of special shares for withdrawal - - - (6,894) (6,894) (3,995) (10,889) Purchase of special treasury shares for redemption - - - (5,449) (5,449) - (5,449) Effect of the incorporation of Marco Polo Industrial Holding S.p.A / Other 1,332,085 - - (1,332,782) (697) (569) (1,266)
Total at 12/31/2016 1,342,281 (204,778) (61,629) 2,058,211 3,134,085 140,773 3,274,858
(°) the figures refer to the restated consolidated financial statements of Marco Polo Industrial Holding S.p.A. following the completion of the PPA
Attributable to the Parent Company Non controlling interests
(in thousands of euro)
Reserve for fair value adjustment of
available-for-sale financial assets
Reserve for cash flow hedge
Reserve for actuarial
gains/losses
Tax effect Total IAS reserves
Balance at 12/31/2015 (4,538) (2,797) 2,544 (13,799) (18,590) Other components of comprehensive income (14,744) 3,835 (46,567) 14,437 (43,039)
Balance at 12/31/2016 (19,282) 1,038 (44,023) 638 (61,629)
Breakdown of IAS reserves *
(in thousands of euro)TOTAL
Share Capital Translation reserve
Total IAS Reserves
Other reserves/ retained earnings
Total attributable to
the Parent Company
Establishment 50 - - - 50 - 50 Increase of share capital 10,146 - - 3,262,662 3,272,808 - 3,272,808 IAS 32 - - - (239) (239) - (239) Pirelli Group consolidation effect - - - - - 71,524 71,524 Total comprehensive gains/(losses) - (61,814) (18,590) - (80,404) - (80,404) Net income (loss) for the period - - - 17,380 17,380 517 17,897 Total at 12/31/2015 (°) 10,196 (61,814) (18,590) 3,279,803 3,209,595 72,041 3,281,636
(°) the figures refer to the restated consolidated financial statements of Marco Polo Industrial Holding S.p.A. following the completion of the PPA
CONSOLIDATED STATEMENT OF CHANGES IN EQUITY AT 12/31/2015
Attributable to the Parent Company Non controlling interests

2016 ANNUAL REPORT
172
CONSOLIDATED STATEMENT OF CASH FLOWS (in thousands of euro)
Net income (loss) before taxes 263,930 56,116Reversals of amortisation, depreciation, impairment losses and restatement of property, plant and equipment and intangible assets 392,376 147,526Reversal of Financial expenses 491,381 - Reversal of Financial income (51,176) - Reversal of Dividends (6,650) - Reversal of gains/(losses) on equity investments 25,442 - Reversal of share of net income from associates and joint ventures 1,227 - Ordinary taxes (116,305) (161,268)Change in Inventories 29,184 20,660Change in Trade receivables 19,771 403,818Change in Trade payables 226,855 320,143Change in Other receivables/Other payables (53,950) 185,096Change in Provisions for employee benefit obligations and Other provisions (54,570) (317,834)Other changes (40,238) (63,681)
A Net cash flows provided by / (used in) operating activities 1,127,277 590,576Investments in property, plant and equipment (363,466) (66,583)Disposal of property, plant and equipment 91,626 - Investments in intangible assets (8,717) (2,862)Repayment of share capital and reserves from Eurostazioni S.p.A. 100,353 - Disposals (Acquisition) of investments in associates and JV (4,692) - Disposals (Acquisition) of financial assets 9,145 10,581Business combinations (6,919,041)Disposal of 38% of Pirelli Industrial to Cinda fund 266,200 - Disposal of 10% of Pirelli Industrial 70,749 - Acquisition of 80% of Jiaozou Aeolus Tyre Co. Ltd (net of cash acquired) (53,395) - Dividends received 6,650 -
B Net cash flows provided by / (used in) investing activities 114,453 (6,977,905)Increase (reduction) in equity - 2,895,595Change in Financial payables (298,567) 3,834,441Change in Financial receivables/Securities held for trading 15,389 - Financial income / (expenses) (440,205) - Dividends paid (2,053) -
C Net cash flows provided by / (used in) financing activities (725,436) 6,730,036
D Total cash flows provided / (used) during the period (A+B+C) 516,294 342,707
E Cash and cash equivalents at the beginning of the period 1,094,457 751,750
F Exchange differences from translation of cash and cash equivalents (86,823) -
G Cash and cash equivalents at the end of the period (D+E+F) (°) 1,523,928 1,094,457
(°) of which:cash and cash equivalents 1,532,977 1,110,024passive current accounts (9,049) (15,567)
2016 2015 (*)
(*) the figures refer to the restated consolidated financial statements of Marco Polo Industrial Holding S.p.A. following the completion of the PPA
2016 ANNUAL REPORT
173
Explanatory Notes 1. General information Pirelli & C. S.p.A. is a corporation organised under the laws of the Republic of Italy. Founded in 1872 it is a Parent Company that manages, coordinates and finances the activities of its subsidiaries and is principally active in the tyre sector.
The registered Head Office of the Company is located in Milan, Italy.
These Financial Statements have been prepared using the Euro as the reporting currency with all values rounded to the nearest thousand euro unless otherwise indicated.
On March 21, 2017 the Board of Directors authorised the publication of these consolidated Financial Statements. As a result of, the Public Offer launched during 2015 by Marco Polo Industrial Holding S.p.A., of the conversion of savings shares into special shares, of the withdrawal operation relating to the special shares, as well as the subsequent redemption of the remaining outstanding special shares carried out by the Company on April 29, 2016, and of the merger of Marco Polo Industrial Holding S.p.A. (the Shareholder which directly held the entire outstanding share capital of the Company) into Pirelli & C. S.p.A. (with the legal effects of the merger effective as of June 1, 2016), at the date of this document:
- Pirelli & C. S.p.A. had no shares listed on any regulated markets; - the capital of the Company (ordinary and special category) was wholly owned - taking into
account the treasury shares held by Pirelli & C. S.p.A. – by the sole shareholder Marco Polo International Holding Italy S.p.A. (who prior to the merger was the sole shareholder of the incorporated company Marco Polo Industrial Holding S.p.A.).
Pirelli & C. S.p.A. is subject to the management and coordination of Marco Polo International Italy S.p.A., a company which holds the entire share capital of Marco Polo International Holding Italy S.p.A. (the shareholder which directly controls Pirelli & C. S.p.A.). Both the aforementioned companies are indirectly controlled by China National Chemical Corporation ("ChemChina"), a state owned enterprise (SOE) governed by Chinese law with registered its office in Beijing, and which reports to the Central Government of the People’s Republic of China. Refer to Note 42 which contains the data pursuant to Art. 2497-bis of the Italian Civil Code.
2016 ANNUAL REPORT
174
2. Basis of Presentation
FINANCIAL STATEMENTS The consolidated Financial Statements at December 31, 2016 consist of the Statement of Financial Position, the Income Statement, the Statement of Comprehensive Income, the Statement of Changes in Equity, the Statement of Cash Flows and the Explanatory Notes, and are accompanied by the Directors’ Report on Operations.
Due to the effect of the reverse merger between the Holding Company Marco Polo Industrial Holding S.p.A. (incorporated company) into the subsidiary Pirelli & C. S.p.A. (incorporating company), effective as of June 1, 2016, the Financial Statements of Pirelli & C. S.p.A. at December 31, 2016 have been prepared on a going concern basis with respect to the consolidated Financial Statements at December 31, 2015 of the holding company Marco Polo Industrial Holding S.p.A. Therefore the comparative data of the Statement of Financial Position at December 31, 2015 are those of the same aforesaid holding company at December 31, 2015, and the comparative Income Statement data and financial flows are those of the consolidated Financial Statement of Marco Polo Industrial Holding S.p.A. It should also be noted that the comparative figures at December 31, 2015 were subject to restatement as a result of the completion of the Purchase Price Allocation, and recognised on a provisional basis at December 31, 2015 in accordance with the provisions of IFRS 3 - Business Combinations.
Based on the aforesaid, it should be noted that the comparative financial data for 2015 is not comparable to that of 2016 in that it includes the results of the Pirelli Group for only four months (as of the acquisition date, September 2015).
The format adopted for the Statement of Financial Position provides for the distinction of assets and liabilities according to whether they are current or non-current. The Group has opted to present the components of gains/losses for the financial year in a separate Income Statement, rather than include these components directly in the Statement of Comprehensive Income. The Income Statement adopted provides for the classification of costs by nature. The Statement of Comprehensive Income includes the results for the period and, for the homogeneous categories, income and costs are recognised directly in equity, in accordance with the IFRS.
The Group has opted for the presentations of tax effects, as well as the reclassifications to the Income Statement of gains/losses which were recognised in equity in previous years, directly in the Statement of Comprehensive Income and not in the Explanatory Notes.
The Statement of Changes in Equity sets forth, in addition to the total gains/losses of the period, the amounts from transactions with equity holders and the changes which occurred during the period in the retained earnings.

2016 ANNUAL REPORT
175
In the Statement of Cash Flows, the financial flows derived from operating activities are presented using the indirect method, by way of which the gains or losses for the period have been adjusted by the effects of non-monetary transactions, by any deferment or accrual of past or future collections or payments for operating activities, and by any revenue or cost items connected with the financial flows arising from any investment or financing activities.
SCOPE OF CONSOLIDATION
The scope of consolidation includes the subsidiaries, associates and agreements for joint control, i.e. joint arrangements.
Subsidiaries are defined as all the companies over which the Group, at the same time, holds:
- the power of decision making, or the ability to direct the relevant activities of the subsidiary, that is activities that have a significant influence on the results of the subsidiary;
- the right to the variable results (positive or negative) resulting from the investment in the entity;
- the capacity to use its own power of decision making to determine the amounts of the results arising from the investment in the entity.
The Financial Statements of subsidiaries are included in the consolidated Financial Statements as of the date when control is assumed until such time as when control ceases to exist. The portions of net income (loss) and equity attributable to non-controlling interests have been separately reported respectively in the consolidated Statement of Financial Position and in the consolidated Income Statement.
All companies for which the Group can exercise significant influence as defined by IAS 28 – Investments in Associates and Joint Operations, are considered associates. This influence is legally presumed to exist when the Group holds a percentage of voting rights of between 20% and 50%, or when - even in the case of a lower share of voting rights – it has the power to participate in determining financial and operating policies by virtue of specific legal relationships, such as, for example, participation in shareholders' agreements together with other forms of significant exercise of governance rights.
Joint arrangements are agreements under which two or more parties have joint control under a contract. Joint control is the shared control of a business activity, established by agreement and only exists when decisions relative to the activity require the unanimous consent of all parties who share control. These agreements may give rise to joint ventures or joint operations.
A joint venture is an agreement for the joint control of an entity whereby the parties that have joint control, have rights to the net assets of the said entity. Joint ventures are distinguished from joint operations that are configured instead as agreements that give the parties of the agreement, which have joint control of the initiative, the rights to individual assets and the obligations for individual liabilities relating to the agreement. In the case of joint operations, the assets, liabilities, costs and revenues of the agreement must mandatorily be recognised in accordance with the applicable accounting standards. The Group does not currently have any agreements for joint operations.
The main change in the scope of consolidation which occurred during the 2016 financial year relates to the acquisition on October 1, 2016 from Aeolus Tyre Co., Ltd. of an 80% share of the share capital of the Chinese company Jiaozuo Aeolus Tyre Co., Ltd.

2016 ANNUAL REPORT
176
INFORMATION ON SUBSIDIARIES These consolidated Financial Statements include the assets and liabilities of approximately 100 legal entities. The following is a list of the significant subsidiaries:
Registered Office% of the Group
% of non-controlling interests
% of the Group
% of non-controlling interests
Pirelli Tyre Co. Ltd Yanzhou (China) 90.00% 10.00% 90.00% 10.00%Alexandria Tire Company S.A.E. Alessandria (Egypt) 89.11% 10.89% 89.11% 10.89%Pirelli China Tyre N.V. Heinenoord (The Netherlands) 100.00% 100.00%Pirelli Deutschland GmbH Breuberg/Odenwald (Germany) 100.00% 100.00%Deutsche Pirelli Reifen Holding GmbH Breuberg/Odenwald (Germany) 100.00% 100.00%E-VOLUTION Tyre B.V. Heinenoord (The Netherlands) 65.00% 35.00% 65.00% 35.00%Jiaozuo Aeolus Tyre Co., Ltd Jiazou (China) 80.00% 20.00% -Pirelli Tyre S.p.A. Milan (Italy) 100.00% 100.00%Pirelli Industrial S.r.l. Milan (Italy) 90.00% 10.00% -Pirelli Neumaticos S.A.I.C. Buenos Aires (Argentina) 100.00% 100.00%Pirelli Industrie Pneumatici S.r.l. Settimo Torinese (Italy) 100.00% 100.00%Pirelli Neumaticos S.A. de C.V. Mexico City (Mexico) 100.00% 100.00%Pirelli International Plc Burton on Trent (United Kingdom) 100.00% 100.00%Pirelli Pneus Ltda Santo Andrè (Brazil) 100.00% 100.00%TP Industrial de Pneus Brasil Ltda Sao Paulo (Brazil) 100.00% 100.00%Comercial e Importadora de Pneus Ltda Sao Paulo (Brazil) 64.00% 36.00% 64.00% 36.00%Pirelli Tyres Ltd Burton on Trent (United Kingdom) 100.00% 100.00%Pirelli Tire LLC Rome (USA) 100.00% 100.00%S.C. Pirelli Tyres Romania S.r.l Slatina (Romania) 100.00% 100.00%Turk-Pirelli Lastikleri A.S. Istanbul (Turkey) 100.00% 100.00%Limited Liability Company Pirelli Tyre Russia Moscow (Russia) 100.00% 100.00%Closed Joint Stock Company "Voronezh Tyre Plant" Voronezh (Russia) 100.00% 100.00%
12/31/2016 12/31/2015
The complete list of subsidiaries is contained in the attachment “Scope of consolidation - list of companies included in Consolidation using the line by line method". Non-controlling interests in the subsidiaries of the Group are not relevant either individually or in aggregate form. CONSOLIDATION PRINCIPLES For consolidation purposes, the Financial Statements of the companies included in the scope of consolidation prepared at the reporting date of the Financial Statements of the Parent Company were adjusted to conform to the IAS/IFRS as applied by the Group.
The Financial Statements expressed in foreign currencies have been translated into Euro at the period-end exchange rates for the items in the Statement of Financial Position, and at the average exchange rates for the Income Statement, with the exception, where applicable, of the Financial Statements of companies operating in high-inflation countries whose Income Statements have been translated at the period-end exchange rates.
The differences arising from the conversion of the initial net equity at period-end exchange rates have been recognised in the reserve for translation differences, together with the difference arising from the translation of the result for the period at period-end exchange rates instead of the average exchange rate. The reserve for translation differences was reversed to the Income Statement at the time of the disposal of the company which generated the reserve.
The criteria for consolidation may be summarised as follows:
• subsidiaries are consolidated using the line-by-line method on the basis of which:
2016 ANNUAL REPORT
177
− the assets and liabilities, revenues and expenses of the Financial Statements of subsidiaries are
assumed in their entirety, regardless of the percentage of investment held;
− the carrying amount of investments is eliminated against the related share of equity;
− the financial and operating transactions between companies consolidated on a line-by-line basis, including dividends distributed within the Group, are eliminated;
− non-controlling interests are reported under equity, and the share of gain or loss attributable to non-controlling interests is similarly shown separately in the Income Statement;
− at the time of disposal of the subsidiary and the consequent loss of control, in determining the gain or loss arising from the disposal, any goodwill that can be allocated to the subsidiary is taken into account;
− in the case of a shareholding acquired after the assumption of control, any difference between the purchase cost and the corresponding share of equity acquired is recognised in equity; similarly, the effects deriving from the disposal of non-controlling interests without loss of control are also recognised in equity.
• investments in associates and joint ventures are accounted for under the equity method, on the basis of which the carrying amount of the investments is adjusted by:
− the investor’s share of the financial results of the subsidiary after the acquisition date;
− the share of gains and losses are recognised directly in the equity of the subsidiary, in accordance with the applicable standards;
− dividends are paid by the subsidiary;
− when the Group’s share in the losses of the associate/joint venture exceeds the carrying amount of the investment in the Financial Statements, the carrying amount of the investment is reset to zero and the share of any further losses is recognised under “Provisions for liabilities and charges,” to the extent to which the Group has a contractual or implicit obligation to cover the losses;
− gains resulting from sales made by associate companies to joint ventures or other associates are eliminated in proportion to the share of ownership held by the acquiring entity.
3. Accounting Standards Adopted
As a result of the approval by the Shareholders of the mandatory conversion of the savings shares into newly issued unlisted special category shares without voting rights, as of February 26, 2016, the Company no longer had any shares listed on the Milan Stock Exchange. The company shall continue to prepare the consolidated Financial Statements in accordance with the IFRS, availing itself of the option granted by Art. 3 of Legislative Decree No. 38/2005. IFRS include the IFRS international accounting standards in force, issued by the International Accounting Standards Board (IASB) and approved by the European Union at December 31, 2016 as well as all the revised accounting standards (IAS) and all the interpretations of the International Financial Reporting Interpretations Committee (IFRIC), formerly the Standing Interpretations Committee (SIC). The consolidated Financial Statements have been prepared in accordance with the historical cost method, with the exception of derivative financial instruments, securities held for trading and financial assets available for sale, which have been measured at their fair value.
2016 ANNUAL REPORT
178
BUSINESS COMBINATIONS Corporate acquisitions are accounted for under the acquisition method.
When a controlling interest in a company is acquired, goodwill is initially recognised at cost and calculated as the difference between the:
- fair value of the price plus any non-controlling interests in the acquired company, measured at fair value (if this option was chosen for the acquisition in question) or in proportion to the share of the non-controlling interest in the net assets of the acquired company;
- fair value of the acquired assets and liabilities.
In cases where the aforesaid difference is negative, the difference is immediately recognised as income in the Income Statement.
In the case of the acquisition of control of a company in which a non-controlling interest is already held (step acquisition), the previously held investment is measured at fair value, and the effects of this adjustment is recognised the Income Statement. The costs of business combination operations are recognised in the Income Statement. Contingent considerations, that is, the obligations of the acquiring company to transfer additional assets or shares to the seller in cases where certain future events occur or specific conditions are fulfilled, are recognised at fair value as at the acquisition date as part of the amount transferred in exchange for the acquisition itself. Any subsequent changes in the fair value of these agreements are normally recognised in the Income Statement. INTANGIBLE ASSETS Intangible assets with finite useful lives are measured at cost, net of any accumulated amortisation and impairment. Amortisation is calculated on a straight-line basis and begins when the asset is available for use or is capable of operating in the opinion of management, and ceases on the date when the asset is classified as held for sale or is derecognised from the accounts. Capital gains and capital losses resulting from the divestment or disposal of an intangible asset are determined as the difference between the net proceeds from disposal and the carrying amount of the asset. Goodwill
Goodwill is an intangible asset with an indefinite useful life and is therefore not subject to amortisation.. Goodwill is subjected to evaluation at least on an annual basis in order to identify any loss of value, or whenever there are any indications of a loss of value, and as such it is allocated to the cash generating units for this purpose. Trademarks and licenses
Trademarks and licenses for which the conditions for classification as intangible assets with an indefinite useful life have not been met, are evaluated at cost, net of the accumulated amortisation and impairment. This cost is amortised for the duration of the contract or the duration of the useful life of the asset, whichever is shorter. The trademarks for which the conditions for classification as intangible assets with an indefinite useful life have been met, are not systematically amortised but are subjected to an impairment test at least once a year.

2016 ANNUAL REPORT
179
Software
Software license costs, including incidental expenses, are capitalised and recognised net of any accumulated amortisation and impairment. Software is amortised for the duration of its useful life. Customer relationships
Customer relationships are intangible assets acquired in a business combination and are recognised in Financial Statements at their fair value as at the purchase date. They are amortised for the duration of their useful life.
Technology
The value of technology refers mainly to product technology, process technology as well as product development technology identified during the Purchase Price Allocation. It is recognised in the Financial Statements at its fair value at the date of acquisition, and is amortised on the basis of its useful life. Research and development costs
Research costs for new products and/or processes are expensed as they occur. There were no development costs that satisfied the requisites for capitalisation as provided for by IAS 38. PROPERTY, PLANT AND EQUIPMENT Property, plant and equipment are recognised at their purchase or production cost, which includes any directly attributable incidental expenses. Any costs incurred subsequent to the acquisition of goods, plus the cost of replacing certain parts of property, plant and equipment, are capitalised only if they increase the future economic benefits inherent to the asset. All other costs are recognised in the Income Statement as they occur. When the cost of replacing certain parts of property, plant and equipment is capitalised, the residual value of the replaced parts is recognised in the Income Statement. Property, plant and equipment are recognised at cost net of any accumulated depreciation and impairment, except for land which is not depreciated but is recognised at cost net of any accumulated impairment. Depreciation is recorded starting from the month in which the asset is available for use or is potentially capable of providing the financial benefits associated with it. Depreciation is charged on a straight-line basis once per month at rates that allow for the depreciation of assets until the end of their useful life or, in the case of disposal, until the last month of use.

2016 ANNUAL REPORT
180
The depreciation rates applied are as follows: Buldings 3% - 10%Plant 7% - 20%Machinery 5% - 20%Equipment 10% - 33%Furniture 10% - 33%Motor vehicles 10% - 25% It is to be noted that during the 2016 financial year the Purchase Price Allocation was completed which resulted in the detection of significant surplus value for the Group's productive assets due mainly to their optimally maintained condition which resulted in an extension of their residual lives. The assets subject to evaluation for the purposes of the Purchase Price Allocation were depreciated, starting as of the date of acquisition of control by Marco Polo Industrial Holding S.p.A. on the basis of the new remaining useful lives determined at the time of the evaluation. This evaluation was carried out by an independent third party. Government grants related to property, plant and equipment are recognised as deferred income and credited to the Income Statement for the duration of the depreciation of the relevant assets. Financial expenses which are directly attributable to the purchase, construction or production of an asset that requires a significant amount of time in order to be available for use (a qualifying asset) are capitalised as part of the cost of the asset. The capitalisation of financial expenses ceases when essentially all the activities necessary to render the qualifying asset available for use have been completed. Leasehold improvements are classified as tangible assets, in keeping with the nature of the cost incurred. The depreciation period corresponds to the remaining useful life of the asset or the residual period of the lease agreement, whichever is shorter. Spare parts of significant value are capitalised and depreciated for the duration of the estimated useful life of their respective assets. Any dismantling costs are estimated and added to the cost of the property, plant and equipment with a corresponding accrual to the provision for liabilities and charges when the conditions for accruing the provision are met. They are then depreciated for the duration of the remaining useful life of their respective assets. Assets acquired under finance lease agreements, through which essentially all the risks and rewards of ownership are transferred to the Group, are recognised as property, plant and equipment at their fair value or, if lower, at the current value of the minimum lease payments, with a corresponding entry for the relevant financial payable. The lease payment is separated into two components; as a financial expense which is recognised in the Income Statement, and as the reimbursement of capital and is recorded as a reduction of the financial payable. Leases in which the lessor essentially retains all the risks and rewards associated with ownership of the asset are classified as operating leases. Costs associated with an operating lease are recognised as an expense on a straight-line basis in the Income Statement for the duration of the leasing contract. Property, plant and equipment are derecognised from the Statement of Financial Position at the time of disposal or permanent retirement from use and, as a consequence no future economic benefits is expected can be derived from their disposal or use. Any gains or losses resulting from the divestment or disposal of property, plant and equipment are determined as the difference between the net proceeds from disposal and the carrying amount of the asset.

2016 ANNUAL REPORT
181
IMPAIRMENT OF ASSETS Property, plant and equipment and intangible assets
Whenever there are specific indicators of a loss of value, at least annually for intangible assets with an indefinite useful life, including goodwill, both property, plant and equipment and intangible assets are subjected to impairment tests in order to verify any loss of value. The test consists of an estimate of the recoverable amount for the asset compared to its carrying amount. The recoverable amount of an asset is either its fair value less the costs of sale, or its use value, whichever is higher, where the latter is the current value of estimated future financial flows arising from the use of the asset plus those deriving from its disposal at the end of its useful life, net of taxes, plus the application of a discount rate, net of taxes, which reflects the current market assessment of the time value of money and the risks specific to the asset. It is not necessary to estimate both amounts in order to verify the absence of a loss of value as it is sufficient that one of the two configured amounts is higher than the carrying amount. If the recoverable amount of an asset is lower than the carrying amount, the latter is reduced and adjusted to the recoverable amount. This reduction in value constitutes an impairment which is then recorded in the Income Statement. In order to evaluate an impairment, assets are aggregated at the lowest level at which their independent cash flows are separately identifiable (cash generating units). Specifically, goodwill must be allocated to the cash generating units or group of cash generating units in compliance with the maximum aggregation limit which cannot exceed that of the operating segment. In the presence of indications that any impairment recognised in previous financial years for property, plant and equipment or intangible assets other than goodwill, may no longer exist or may have been reduced, the recoverable amount is estimated again. If it results higher than the net carrying amount, then the net carrying amount is increased up to, but not exceeding, the recoverable amount. The restatement of a value must not exceed the carrying amount that would have been determined (net of impairment, depreciation or amortisation) had no loss of value been detected in previous financial years. The restatement of the value of an asset other than goodwill is recognised in the Income Statement. An impairment which has been detected for goodwill can not be restated in subsequent financial years. Any loss due to a reduction of value recorded for goodwill on the interim (half year) Financial Statements can not be restated in subsequent financial years.
2016 ANNUAL REPORT
182
Investments in associates and joint ventures
Following the application of the equity method, in the presence of the indication of a loss of value, the value of investments in associates and joint ventures must be compared with the recoverable amount (the so-called impairment test). The recoverable amount corresponds to the higher amount between the fair value less the costs of the sale, and the use value. For the purposes of impairment testing, the fair value of an investment in an associate or joint venture with shares listed on an active market is always equal to its market value, irrespective of the percentage of ownership. In the case of investments in unlisted companies, the fair value is determined using estimates based on the best available information. For the purposes of determining the use value of an associate or joint venture, an estimate is made for the pro-rata share owned of the current value of future cash flows which are expected to generated by the associate or joint venture, including financial flows deriving from the operating activities of the associate or joint venture, and the amount that will be received for the final disposal of the investment (known as the Discounted Cash Flow – on the asset side). When there is evidence that any impairment recognised in previous financial years may no longer exist or or may have been reduced, the recoverable amount of the investment is estimated again, and if it is results as higher than the amount of the investment, then the latter amount is increased up to and not exceeding the recoverable amount. The restatement of a value may not exceed the value of the investment that would have been determined (net of impairment) had no loss of value been recognised in previous financial years. The restatement of the value of investments in associates and joint ventures is recognised in the Income Statement. FINANCIAL ASSETS AVAILABLE FOR SALE This item includes investments in entities other than subsidiaries, associates and joint ventures, and other financial instruments not held for trading. They are recorded in the Statement of Financial Position as “Other financial assets.” They are measured at fair value, if their fair value can be reliably determined. Gains and losses deriving from changes in their fair value are recognised in a specific equity reserve. When a reduction in fair value has been recognised directly in equity and there is objective evidence that the financial asset has lost value (has been impaired), the losses recognised in equity up until that time, are reversed to the Income Statement. A prolonged (meaning more than 12 months) or significant (meaning exceeding 50% for instruments issued by the banking sector, and which exceed one-third for instruments issued by entities operating in other sectors) reduction in the fair value of equity instruments as compared to their cost is considered as evidence of impairment. Any impairment of a financial asset available for sale recognised in the Income Statement may be restated in the Income Statement, with the exception of any impairment detected for shares classified as available for sale, which instead may not be restated with effect on the Income Statement. Financial assets available for sale, whether debt or equity instruments whose fair value is not available, are recorded at cost and eventually impaired on the basis of the best market information available at the reporting date. The acquisitions and sales of financial assets available for sale are recorded at the settlement date.

2016 ANNUAL REPORT
183
INVENTORIES Inventories are valued either at cost determined under the FIFO (first in first out) method, or their estimated realisable value, whichever is lower. The evaluation of inventories includes the direct costs of materials and labour as well as indirect costs. The impairment provisions for obsolete and low rotation inventories, are calculated by taking their estimated future use and realisable value into account. The realisable value is the estimated selling price, net of all costs estimated to complete the asset including any sales and distribution costs that will be incurred. These costs are increased by incremental expenses and financial expenses which are eligible for capitalisation, similar to what has been described for property, plant and equipment. RECEIVABLES Receivables are initially recognised at their fair value, which normally corresponds to the amount agreed or to the present value of the amount that will be collected. They are subsequently measured at amortised cost, which is reduced in the case of impairment. The amortised cost is calculated by using the effective interest rate method, which is equivalent to the discount or actualisation rate which, when applied to future cash flows, renders the present value of such cash flows equal to the initial fair value.
Impairment losses on receivables are calculated according to the counter-party default risk, which is determined by taking the available information on the solvency of the counter-party plus their historical data into consideration. The carrying amount of receivables is reduced indirectly by the recognition of a provision. Significant individual positions that are objectively detected to be partially or wholly uncollectable are subject to individual impairment.
The amount of impairment takes into account the estimate for recoverable future cash flows, the applicable date for collection, recovery costs and expenses, and the fair value of any guarantees. Any positions that are not subject to individual impairment are included in groups with similar characteristics in terms of credit risk, and are impaired on a collective basis in accordance with the rising percentages for overdue periods. This collective impairment procedure is also applied to receivables not yet due. The impairment percentages are determined on the basis of historical experience as well as statistical data.
When the conditions that brought about the impairment of receivables no longer exist, the impairment losses recorded for previous financial years are restated as credits to the Income Statement, up to but not exceeding the amortised cost that would have been determined had no impairment loss been recognised. Receivables in currencies other than the functional currency of the individual companies are adjusted to the financial year-end exchange rates and also recorded in the Income Statement. Receivables are derecognised when the right to receive cash flows is extinguished, when all the risks and rewards connected with holding the receivable essentially have been transferred, or in cases when the receivable is considered definitively irrecoverable after all the necessary recovery procedures have been completed. When the receivable is derecognised, the relative provision is also reversed if the receivable had previously been impaired.
PAYABLES Payables are initially recognised at their fair value, which normally corresponds to the amount agreed or to the present value of the amount that will be collected. They are subsequently valued at the amortised cost. The amortised cost is calculated by using the effective interest rate method, which is equivalent to the discount or actualisation rate which, when applied to future cash flows, renders the present value of

2016 ANNUAL REPORT
184
such cash flows equal to the initial fair value. Payables in currencies other than the functional currency of the individual companies are adjusted to the financial year-end exchange rates and are also recorded in the Income Statement. Payables are derecognised from Financial Statements when the specific contractual obligation is extinguished. FINANCIAL ASSETS CARRIED AT FAIR VALUE RECORDED IN THE INCOME STATEMENT This category includes, securities purchased mainly to be sold in the short-term and classified under current assets as “Securities held for trading", financial assets, which when initially recognised are stated at fair value and recorded in the Income Statement classified as “Other financial assets,” and derivatives (with the exception of those designated as effective hedging instruments) classified as “Derivative financial instruments.” They are measured at fair value and also recorded in the Income Statement. Additional costs are expensed in the Income Statement. The acquisitions and sales of financial assets available for sale are recorded at the settlement date. CASH AND CASH EQUIVALENTS Cash and cash equivalents include bank deposits, postal deposits, cash and cash equivalents on hand, and other forms of short-term investment whose original maturity is three months or less. Current account overdrafts are recognised as current liabilities under financial payables. The items included in cash and cash equivalents are recognised at their fair value and any changes are recognised in the Income Statement. PROVISIONS FOR LIABILITIES AND CHARGES Provisions for liabilities and charges include accruals for current obligations (legal or implicit) deriving from a past event, the fulfilment of which will likely require the necessary use of resources, and whose amounts can be estimated in a reliable manner. Changes in estimates are recognised in the Income Statement for the financial year in which the change occurs. If the effect of discounting or actualisation is significant, provisions are stated at their current value. EMPLOYEE BENEFIT OBLIGATIONS
Employee benefits paid after the termination of employment of the defined benefit plans type, and other long-term benefits, are subject to actuarial valuations. The liability recognised in the Financial Statements is representative of the current value of the Group’s obligation, net of the fair value of any assets servicing the plans. For defined benefit plans, the actuarial gains and losses deriving from adjustments based on past experience and any changes in actuarial assumptions, are fully recognised in equity for the financial year in which they occur. For other long-term benefits, the actuarial gains and losses are immediately recognised in the Income Statement. The provision for employees' leaving indemnities (TFR) for Italian companies with at least 50 employees, is considered a defined benefit plan only for the portions accrued prior to January 1, 2007 (and not yet paid at the reporting date), whereas the portions accrued subsequent to that date are considered a defined contribution plan.

2016 ANNUAL REPORT
185
The net interest calculated on net liabilities is classified under financial expenses. The costs relating to defined contribution plans are recognised in the Income Statement as they are occur. DERIVATIVE FINANCIAL INSTRUMENTS DESIGNATED AS HEDGING INSTRUMENTS Consistent with IAS 39, financial hedging instruments are recorded in accordance with hedge accounting provisions only when: - at the commencement of hedging there is the formal designation and documentation of the hedging
relationship between the hedging derivative and the hedged item; - the forecast is that the hedging instrument will be highly effective; - its effectiveness can be reliably measured; - the hedge remains highly effective throughout the financial reporting periods for which it is
designated. These derivative instruments are recognised at fair value. The following accounting treatments are applied on the basis of the type of coverage: - Fair value hedge – if a derivative financial instrument is designated as a hedge against exposure to
changes in the fair value of an asset or liability attributable to a specific risk, the gain or loss resulting from any subsequent changes in the fair value of the hedging instrument is recognised in the Income Statement. The gain or loss on the hedged item, to the extent attributable to the hedged risk, entails an adjustment to the carrying amount of the hedged item (basis adjustment) and is also recognised in the income statement;
- Cash flow hedge – if a derivative instrument is designated as a hedge against exposure to the variable financial flows of an asset or liability recognised in the Financial Statements, or against a highly probable future transaction, the effective portion of the change in the fair value of the hedging instrument is recognised directly in equity, while the ineffective portion is immediately recognised in the Income Statement. The amounts recognised directly in equity are reclassified to the Income Statement for the financial year in which the hedged item produced an effect on the Income Statement.
When a hedging instrument expires or is sold, terminated, exercised, or no longer meets the conditions to be designated as a hedging instrument, or if designation is revoked voluntarily, hedge accounting is discontinued. The fair value adjustments accumulated in equity remain in suspended equity until the hedged item manifests an impact on the Income Statement. Subsequently they are reclassified to the Income Statement for the financial years during which the acquired financial asset or the assumed financial liability manifests an impact on the Income Statement. When the hedged item is no longer expected to have any impact on the Income Statement, the fair value adjustments accumulated in equity are immediately recorded in the Income Statement. For derivative instruments that do not satisfy the prerequisites established by IAS 39 for the adoption of hedge accounting, refer to the section “Financial assets carried at fair value recorded in the Income Statement”. The acquisitions and sales of derivative financial instruments are recorded at the settlement date. DETERMINATION OF THE FAIR VALUE OF FINANCIAL INSTRUMENTS The fair value of financial instruments traded on an active market is based on market prices at the reporting date. The market price used for financial assets is the bid price, while for financial liabilities it is the ask price. The fair value of financial instruments not traded on an active market is determined
2016 ANNUAL REPORT
186
using valuation techniques based on a series of methods and assumptions linked to market conditions at the reporting date. The fair value of interest rate swaps is calculated on the basis of the current value of expected future cash flows. The fair value of forward exchange contracts is determined by using the forward exchange rates at the reporting date. INCOME TAXES Current taxes are determined on the basis of a realistic forecast of the charges payable under the current tax regulations of the country. Deferred taxes are calculated according to the temporary differences which exist between the asset and liability amounts in the Financial Statements and their tax value (full liability method), and are classified under non-current assets and liabilities. Deferred tax assets on tax losses carried forward, as well as on temporary differences, are only recognised when there is a likelihood of future recovery during the time frame covered by the forecasts of the business plans. Current and deferred tax assets and liabilities are compensated when the income taxes are levied by the same taxation authority and when there is a legally enforceable right to offset. Deferred tax assets and liabilities are determined at the tax rates that are expected to be applicable to taxable income in the respective jurisdictions in which the Group operates, for the financial years during which the temporary differences will arise or be extinguished.
With regard to taxable temporary differences associated with investments in subsidiaries, associates and joint ventures, the related deferred tax liabilities are not recognised in cases where the investing entity is able to control the reversal of the temporary differences and it is probable that it will not occur in the foreseeable future. Deferred taxes are not discounted. Deferred tax assets and liabilities are credited or debited to equity if they refer to items that have been credited or debited directly in equity during the financial year or during previous financial years. NET EQUITY Treasury shares
Treasury shares are deducted from (shareholders') equity. If they are sold, reissued or cancelled, the resulting gains or losses are recognised in equity. Costs of equity transactions
Costs that are directly attributable to the equity transactions of the Parent Company are recorded as deductions to equity.

2016 ANNUAL REPORT
187
RECOGNITION OF REVENUE Revenue is measured at the fair value of the amount received for the sale of products or provision of services. Sales of products
Revenue from sales of products is recognised when all the following conditions are met: − significant risks and rewards of ownership of the goods are transferred to the buyer; − effective control over the goods and the normal continuing level of activities associated with
ownership have ceased; − the value of revenue can be reliably determined; − it is likely that the financial benefits deriving from the sale will be enjoyed by the enterprise; − costs incurred or to be incurred can be reliably determined.
In cases where the nature and extent of involvement of the seller are such to cause that the risks and rewards of ownership are not in fact transferred, then the recognition date of the revenues is deferred until the date on which the transfer can be considered to have taken place.
Provision of services
Revenue from the provision of services is recognised only when the results of the transaction can be reliably estimated, with reference to the state of completion of the transaction at the reporting date. The results of a transaction can be reliably estimated only when all the following conditions have been satisfied: − amount of revenue can be determined reliably; − it is likely that the business will enjoy the financial benefits of the transaction; − the stage of completion of the transaction at the reporting date can be reliably measured; − costs incurred for the transaction and the costs to be incurred to complete it can be reliably
determined. Interests
Interests are recognised on a time criterion basis that takes the effective yield of the asset into consideration. Royalties
Royalties are recognised on an accrual basis, in accordance with the provisions of the relevant agreement. Dividends
Dividends are recognised when the right to collect is established, which normally corresponds to a resolution approved by the Shareholders for the distribution of dividends.
2016 ANNUAL REPORT
188
OPERATING SEGMENTS The operating segment is one part of the Group that engages in business activities from which it may earn revenues and incur expenses, whose operating results are regularly reviewed by top management in view of making decisions regarding resources to be allocated to the segment, and assessing its performance, and for which separate financial information is available. FOREIGN CURRENCY OPERATIONS Foreign currency transactions are recorded at the prevailing exchange rates on the date of the transaction. Monetary foreign currency assets and liabilities are translated at the prevailing exchange rates at the reporting date. Exchange rate differences generated by the extinction of monetary items or by their translation at rates different than those of their initial recognition at the beginning of the financial year or than those of the previous financial year-end, are recognised in the separate consolidated Income Statements. Whenever conditions arise, as provided by IAS 21.15, for the designation of intercompany monetary items as “net investments in foreign operations”, pursuant to the provisions of IAS 21.32, the translation difference is recognised directly in the consolidated Statement of Comprehensive Income as of the date of designation. ACCOUNTING POLICIES FOR HYPER-INFLATIONARY COUNTRIES Group companies operating in high-inflation countries recalculate the values for their non-monetary assets and liabilities in their original individual Financial Statements to eliminate the distorting effects caused by the loss of purchasing power of the currency. The inflation rate used to implement the inflation treatment corresponds to the consumer price index. Companies, operating in countries where the cumulative inflation rate over a three-year period approximates or exceeds 100%, adopt inflation accounting and discontinue it in the event that the cumulative inflation rate over a three-year period falls below 100%. Gains or losses on the net monetary position are recognised in the Income Statement. It should be noted that none of the companies of the Group operated in countries characterised by hyper-inflation as defined by IAS 29 during the 2016 financial year. None of the companies which fell within the scope of consolidation for 2016 operated in high-inflation countries. NON-CURRENT ASSETS HELD FOR SALE AND DISPOSAL GROUPS Non-current assets and disposal groups are classified as held for sale if their carrying value is recoverable mainly through their sale rather than through their continuous use. This occurs if the non-current asset or disposal group is available for sale under current conditions and the sale is highly probable, or if a binding program for sale has already begun, or activities to find a buyer have already commenced and it is expected that the sale will be completed within one year following their classification date. In the consolidated Statement of Financial Position, the non-current assets held for sale and the current and non-current assets/liabilities of the disposal group are presented as a separate item from other assets and liabilities, and their totals are reflected in current assets and liabilities, respectively. Non-current assets classified as held for sale and disposal groups are either valued as either the same as the carrying amount, or the fair value net of sales costs, whichever is lower.
2016 ANNUAL REPORT
189
Property, plant and equipment and intangible assets classified as held for sale are not depreciated or amortised. DISCONTINUED OPERATIONS A discontinued operation is a component that has been disposed of or classified as held for sale and represents an important independent business unit or geographical area of activity, and pertains to a single, coordinated disposal programme. In the consolidated Income Statement for the period, the Net income (loss) for discontinued operations, as well as the gains or losses resulting from the fair value measurement, net of the costs of sale or from disposal of the assets or disposal groups constituting the discontinued operation, are combined in a single item near the end of the Income Statement separately from the results for continuing operations. The cash flows for discontinued operations are shown separately in the Statement of Cash Flows. The aforesaid information is also presented for the comparative period.
2016 ANNUAL REPORT
190
3.1 Accounting standards and interpretations approved and in force as of January 1, 2016 In accordance with IAS 8 "Accounting Policies, changes in accounting estimates and errors" the IFRS effective as of January 1, 2016 are as follows: • Amendments to IAS 19 - Employee Benefits - defined benefit plans: contributions from employees
or third parties. These amendments apply to the contributions that employees or third parties pay to defined-benefit pension funds to simplify the accounting in certain specific circumstances. There were no effects due to the application of such changes.
• Improvements to IFRS 2010-2012 (issued by the IASB in December 2013). The IASB issued a series of amendments to 7 standards in force, in particular regarding: the definition of vesting conditions in IFRS 2 – Share-based payments; the recognition of contingent consideration in a business combination in IFRS 3 – Business Combinations; the aggregation of operating segments and the reconciliation of the total assets of the reportable segments assets compared to the total assets of the entity in IFRS 8 – Operating Segments; the proportional restatement of depreciation accumulated in IAS 16 – Property, Plant and Equipment and IAS 38 – Intangible Assets; identification and certain disclosures related to key managers in IAS 24 – Related Party Disclosures. There was no significant impact on the Financial Statements or on the Group's disclosures due to the application of these amendments.
• Amendments to IFRS 11 – Joint Arrangements – Accounting for Acquisitions of Interests in Joint Operations. The amendments to IFRS 11 specify the accounting treatment to be applied in case of acquisition of interests in joint operations that constitute a business as defined by IFRS 3. These amendments have had no impact on the Group's Financial Statements since there were no acquisitions of interests in joint operations for the period.
• Amendments to IAS 16 and IAS 38 – Explanation of Acceptable Methods of Depreciation and Amortisation With these amendments, the IASB intended to clarify that the use of methods based on revenues for the calculation of depreciation was not correct in that the revenues generated by an asset reflect factors other than the consumption of the future financial benefits embodied in the asset itself. This consumption must represent the base principle for the calculation of depreciation and amortisation. The aforesaid amendments had no impact on these Financial Statements since the Group does not use methods based on revenues to calculate depreciation.
• Amendments to IAS 27 – Application of the Equity Method in Separate Financial Statements Following these amendments, the use of the equity method shall be allowed as an option in the accounting of investments in subsidiaries, associates and joint ventures, as well as retroactively in the respective separate Financial Statements. The Group did dot avail themselves of this option.
2016 ANNUAL REPORT
191
• Improvements to IFRS 2012-2014 (issued by the IASB in September 2014). The IASB has issued a series of amendments to four standards that are currently in force, relative to the following aspects: amendment to the method of divestiture in IFRS 5 - Non-current assets held for sale and discontinued operations; service contracts and applicability of the amendments to IFRS 7 to interim Financial Statements in IFRS 7 - Financial Instruments: discount rate to be applied in IAS 19 - Employee Benefits; disclosure of information presented in other parts of the interim Financial Statements in IAS 34 - Interim Financial Statements. The application of these amendments did not have any impact on the Group's Financial Statements.
• Amendment to IAS 1 - Disclosure Initiative Amendments to IAS 1 relate to the disclosure initiative project, aim to clarify and improve the requirements of IAS 1 and not to amend it substantially. Following the application of these amendments, in the Statement of Comprehensive Income, the portion of other Comprehensive Income Statement components related to associates and joint ventures was classified among the items that may or may not be reclassified to the Income Statement.
• Amendments to IFRS 10, IFRS 12 and IAS 28 - Investment Entities: Applying the Consolidation Exception These amendments introduce certain clarifications regarding the requirements to be met in the accounting treatment required for investment entities. These changes had no impact on the Group, since none of the entities belonging to the Group qualifies as an investment entity under IFRS 10.
3.2 International Accounting Standards and/or interpretations that have been issued but not yet
been approved and/or entered into force Pursuant to IAS 8 – Accounting Policies, Changes in Accounting Estimates and Errors - the new standards and interpretations that have been issued but have not yet come into force or have not yet been approved by the European Union at December 31, 2016, and which are therefore not applicable, are as follows:. None of these standards and interpretations has been adopted in advance by the Group. • Amendments to IFRS 10 and IAS 28 - Sales or contributions of Assets between an Investor and its
Associate/Joint Venture The IASB issued these amendments to eliminate any inconsistency between IFRS 10 and IAS 28, stating that if the assets sold/transferred constitute a business as defined by IFRS 3, the possible gains or losses must be fully recognised; otherwise any gains or losses shall be recognised only for the related portion. These amendments, which came into force have been deferred indefinitely, and have not yet been endorsed by the European Union. No effects are expected on the Financial Statements due to the future application of these amendments since the current accounting treatment is already compliant.

2016 ANNUAL REPORT
192
• IFRS 9 – Financial Instruments IFRS 9, which will replace IAS 39 – Financial Instruments: Recognition and measurement, is subdivided into 3 parts: 1. Classification and measurement of financial instruments based on the entity's business model,
and the characteristics of the cash flows generated by the financial instruments themselves; 2. Impairment of financial instruments on the basis of a new and unique impairment model based
on the recognition of the expected losses of an entity. This model does not apply to equity instruments and provides for operational simplifications for trade receivables;
3. Hedge accounting, based on a more flexible approach than the one contained in IAS 39. This standard, endorsed by the European Union, shall apply as of January 1, 2018. The Group is currently evaluating the early adoption of the new standard as of January 1, 2017. Based on a preliminary analysis, the Group does not envisage any significant impacts for all three of the standard’s sub-categories. The amendments relative to financial liabilities were not applicable to the Group.
• IFRS 15 - Revenue from Contracts with Customers The new model for revenue recognition is based on the identification of the various performance obligations contained within each individual sales contract and on revenue recognition based on the fulfilment of the individual contractual obligations. This standard, endorsed by the European Union, shall apply as as January 1, 2018. The Group expects to apply the new standard as of the date of its entry into force. Based on a preliminary analysis the Group does not envisage significant impacts from the future application of the standard, since contracts involving multiple services and/or variable fees are very few.
• IFRS 16 - Leases The new standard on leases, which will replace the current IAS 17, provides a single accounting model for the lessee under which all leases will have to be recognised in the Statement of Financial Position. In fact the concept of operational leasing has disappeared. The lessee must recognise the asset being leased in the Statement of Financial Position under the item property, plant and equipment, and must simultaneously recognise financial liabilities equal to the present value of future payments. The only allowed exceptions are short-term leases (with a duration of less than or equal to 12 months) and leasing of small assets (eg. office furniture, computers, etc) for which the accounting treatment is similar to that currently used for operating leases. If a leasing contract includes the provision of a service, the latter may not be capitalised. This standard which is expected to come into force on January 1, 2019, has not yet been endorsed by the European Union. The Group expects to apply the new standard as of the date of its entry into force. During the course of 2017, the Group will complete a preliminary analysis in order to quantify the potential impacts of the new standard on the consolidated Financial Statements, both in terms of the Statement of Financial Position and the Income Statement.
2016 ANNUAL REPORT
193
• Amendment to IAS 7 - Disclosure Initiative The goal of these changes is to improve disclosures regarding the net cash flow generated/absorbed by investing activities and the entity's liquidity, especially in the presence of restrictions on the use of cash and cash equivalents in the Statement of Cash Flows. The amendments also require the disclosure of changes in assets/liabilities by distinguishing those that are monetary from the non-monetary items (eg. changes caused by the acquisition or by the loss of control of subsidiaries or other businesses, the effect of exchange rate fluctuations and changes in fair value). This principle, which was expected to come into force as of January 1, 2017, has not yet been endorsed by the European Union. The impacts on the disclosures of the consolidated Financial Statements are currently being analysed.
• Clarifications to IFRS 15 - Revenue from Contracts with Customers These clarifications do not change the underlying principle but clarify how the principle should be applied, especially with reference to three aspects:
o identification of contractual performance obligations; o distinction between principal e agent; o recognition of revenue related to the granting of licenses at a point in time or over time.
Furthermore, these changes introduce additional simplifications in order to reduce the costs and complexities associated with the first application. These clarifications, which are expected to come into force on January 1, 2018, have not yet been endorsed by the European Union, and its relative impacts are still being analysed.
• Amendments to IAS 12 - Recognition of Deferred Tax Assets for Unrealised Losses These amendments clarify how to account for deferred tax assets related to debt instruments measured at fair value. This principle, which was expected to come into force on January 1, 2017, has not yet been endorsed by the European Union. These changes were not applicable to the Group.
• Amendments to IFRS 2 - Share-based Payment The aim of these amendments is to clarify the accounting treatment of certain share-based payments. These amendments, which are expected to come into force January 1, 2018, have not yet been endorsed by the European Union. The future application of these amendments is not expected to have any impact on the Group's Financial Statements.
• Amendments to IFRS 4 - Application of IFRS 9 - Financial Instruments with IFRS 4 - Insurance Contracts These changes govern the implementation of the new standard for Financial Instruments - IFRS 9, and prior to that for the IFRS 4 to which the IASB is currently making further changes. These amendments, which are expected to come into force January 1, 2018, have not yet been endorsed by the European Union.
• Improvements to IFRS 2014-2016 (issued by the IASB in December 2016). The IASB has issued a series of amendments to three standards currently in place, regarding the following aspects in particular: clarification regarding the scope of IFRS 12 - Disclosure of Interests in Other Entities - in the presence of entities falling within the scope of IFRS 5 - Non-Current Assets Held for Sale and Discontinued Operations; the evaluation of associates and joint ventures at fair value in the presence of investment entities in IAS 28 - Investment in Associates; and the elimination of short-term exemptions for those who adopt the IFRS for the first time in IFRS 1 - First Time Adoption of the International Financial Reporting Standards. These amendments, which were expected to come into force on January 1, 2017 (IFRS 12) and on January 1, 2018 (IFRS 1 and IAS 28), have not yet been endorsed by the European Union. The

2016 ANNUAL REPORT
194
amendments to IAS 28 and IFRS 1 are not applicable to the Group, while the amendments to IFRS 12 are applicable only in the presence of entities falling within the scope of IFRS 5.
• IFRIC 22 - Foreign Currency Transactions and Advance Consideration The aim of this interpretation is to determine the exchange rate to be used in the translation of advance payments paid or received in foreign currency. In the presence of paid or received advance payments, the exchange rate to be used to translate assets, liabilities, revenues or expenses recognised at a later date is the same used to translate the advance payment. This amendment, which is expected to come into force on January 1, 2018, has not yet been endorsed by the European Union. The impact of this interpretation on the Group's financial statements is currently being analysed.
• Amendments to IAS 40 - Transfers of Investment Property These changes further clarify the situations in which it is possible to reclassify a real estate asset from within or from outside the category of Investment Property. These amendments, which are expected to come into force January 1, 2018, have not yet been endorsed by the European Union and are not applicable to the Group's Financial Statements.
4. Financial Risk Management Policy
The Group is exposed to financial risks which are principally associated with foreign exchange rates, with fluctuations in interest rates, with the price of financial assets held as investments, with the ability of customers to meet their obligations to the Group (credit risk), and with raising funds on the market (liquidity risk). Financial risk management is an integral part of the Group's business management and is performed centrally in accordance with the guidelines issued by the Finance Department as part of the risk management strategies more generally defined by the Managerial Risk Committee. 4.1 Types of Financial Risks
Exchange rate risk
The geographical distribution of Group production and commercial activities entails exposure to transaction and translation exchange rate risk.
a) Transaction Risk
This risk is generated by the commercial and financial transactions of the individual companies that are executed in currencies other than the functional currency. Exchange rate fluctuations between the time when the commercial or financial relationship is established and the time when the transaction is completed (collection or payment) may generate exchange rate gains or losses.
2016 ANNUAL REPORT
195
The Group aims to minimise the impact of transaction exchange rate risk related to volatility. In order to achieve this objective, the Group's procedures provide that the Operating Units are responsible for the collection of all information inherent to positions subject to transaction risk. Coverage is then provided in the form of forward contracts which are entered into with the Group Treasury. The positions subject to exchange rate risk are mainly represented by receivables and payables in foreign currency. The Group Treasury is responsible for hedging the net position for each currency and, in accordance with the established guidelines and restrictions, it closes all risk positions by trading derivative hedging contracts on the market, which typically take the form of forward contracts. The Group does not consider it necessary to avail itself of the option for hedge accounting as provided for by IAS 39, in that the representation of the impacts on the Income Statement and the Statement of Financial Position of a hedging strategy for transaction risk is nevertheless substantially guaranteed even without the aforementioned option. Furthermore, as part of the annual and three-year planning process, the Group makes exchange rate forecasts by using the best information available on the market. The fluctuation in exchange rates between the time when the forecast is made and the time when the commercial or financial transaction occur represents the exchange rate risk on future transactions. In accordance with established policy, the Group monitors the opportunity to hedge future transactions, with each hedge being authorised by the Finance Department on a case-by-case basis. Hedge accounting is used whenever the requisite conditions as provided for by IAS 39 are met.
b) Translation Risk
The Group owns controlling interests in companies that prepare their Financial Statements in currencies other than the Euro, which is the currency used to prepare the consolidated Financial Statements. This exposes the Group to currency translation risk, which is generated by the conversion into Euro of the assets and liabilities of these subsidiaries. The principal exposures to currency translation risk are constantly monitored, but it is not currently deemed necessary to adopt specific policies to hedge this exposure. Approximately 44.8% of the total consolidated net equity at December 31, 2016 was expressed in Euros (compared to approximately 23% at December 31, 2015). The most important currencies for the Group other than the Euro were the Brazilian Real (13.7%; 15.6% at December 31, 2015), the Turkish Lira (4.6%; 5.6% at December 31, 2015), the Chinese Renminbi (15.3%; 14.7% at December 31, 2015), the Romanian Leu (8.8%; 12.8% at December 31, 2015), the Egyptian Pound (1.5%; 3.8% at December 31, 2015), the Pound Sterling (3.6%; 6.8% at December 31, 2015), the Argentine Peso (0.2%; 1.6% at December 31, 2015) the US Dollar (3.0%; 3.2% at December 31, 2015) and the Mexican Peso (4.1%; 6.2% at December 31, 2015).
2016 ANNUAL REPORT
196
The effects on consolidated equity deriving from a hypothetical appreciation/depreciation of the above listed currencies against the euro, with all other conditions being equal, were as follows: (in thousands of euro)
12/31/2016 12/31/2015 12/31/2016 12/31/2015
Brazilian Real 49,933 40,700 (40,854) (33,300)
Turkish Lira 16,622 14,667 (13,600) (12,000)
Chinese Renminbi 55,707 38,311 (45,579) (31,345)
Romanian Leu 32,108 33,267 (26,271) (27,218)
Egyptian Pound (5,448) 9,889 4,458 (8,091)
British Pound 13,075 17,722 (10,698) (14,500)
Argentinian Pesos 892 4,267 (730) (3,491)
US Dollar 11,078 8,367 (9,064) (6,845)Mexican Pesos 15,090 16,156 (12,346) (13,218)
Total on consolidated equity 189,057 183,346 (154,683) (150,008)
Appreciation of 10% Depreciation of 10%
Interest rate risk Interest rate risk is represented by the exposure to any change in the fair value or the future cash flows of a financial asset or liability due to fluctuations in the market interest rates. The Group's policy is to attempt to maintain the following ratio between fixed rate and floating rate exposures: 70% fixed and 30% floating. In order to maintain this trend ratio, the Group sets up derivative contracts, typically interest rate swaps, for hedging purposes. For such derivatives, hedge accounting is used when the requisite conditions as provided for by IAS 39 are met. The table below shows the effects on net income (loss) deriving from an increase or decrease of 0.50% in the level of interest rates of all currencies to which the Group is exposed – all other conditions being equal: (in thousands of euro)
12/31/2016 12/31/2015 12/31/2016 12/31/2015
Impact on net income (loss) (19,785) (2,240) 19,785 2,246
+0,50% -0,50%
Price risk associated with financial assets The Group’s exposure to price risk is limited to the volatility of financial assets such as listed and unlisted equities and bonds, which constituted approximately 1.7% of the total consolidated assets at December 31, 2016 (4.2% at December 31, 2015). These assets were classified as financial assets available for sale and securities held for trading. No derivatives were put in place to cover the volatility risk for these assets. Financial assets available for sale represented by listed securities amounted to euro 141,496 thousand (euro 154,355 thousand at December 31, 2015) and those represented by securities indirectly associated with securities (Fin. Priv. S.r.l. and Emittenti Titoli) amounted to euro 19,200 thousand (euro 23,576
2016 ANNUAL REPORT
197
thousand at December 31, 2015). These financial assets constitute 65% of the total financial assets subject to price risk (58.7% at December 31, 2015). A positive change of +5% in the aforesaid securities prices, all other conditions being equal, would result in a positive change to the Group's equity of euro 7,073 thousand (positive at euro 7,716 thousand at December 31, 2015) while a negative change of -5% in the aforesaid securities prices, all other conditions being equal, would result in a negative change of euro 7,073 thousand to the Group's equity (at December 31, 2015 a negative change of euro 6,998 thousand to the Group's equity and a negative change of euro 718 thousand to the net income (loss) of the Group. Credit risk Credit risk represents the Group's exposure to potential losses resulting from the non-fulfilment of the commercial and financial obligations undertaken by counter-parties. The Group is exposed to credit risk as part of its operating activities and financing activities. To limit commercial counter-party default risk, the Group has implemented procedures to evaluate its customers’ potential and financial solidity, to monitor expected incoming cash flows and take credit recovery action if necessary. The aim of these procedures is to define customer credit limits. Further supplies are suspended when those limits are exceeded. In certain cases customers are asked to provide guarantees. These mainly consist of bank guarantees issued by parties with the highest credit standing, or personal guarantees. Less frequently, mortgage guarantees may be requested. Another instrument used by the Group to manage commercial credit risk are the insurance policies, which aim to prevent the risk of non-payment through careful selection of the customer portfolio which is carried out jointly with the insurance company which undertakes to guarantee compensation in the case of insolvency. The Group operates only with highly rated financial counter-parties for the management of its temporary cash surpluses or for the trading of derivative instruments, and constantly monitors its exposure to individual counter-parties. The Group does not hold public debt instruments of any European country, and constantly monitors its net credit exposure to the banking system. The Group does not have significant concentrations of credit risk. The disclosure on the maximum exposure to credit risk is represented by the gross value of receivables and is contained in the following Notes 15 and 16 respectively entitled “trade receivables" and "other receivables.” Liquidity risk Liquidity risk represents the risk that the Company’s available financial resources may be insufficient to meet its financial and commercial obligations pursuant to the contractual terms and conditions. The principal instruments used by the Group to manage liquidity risk are comprised of its one and three year financial plans, and its treasury plans. These allow for the complete and correct detection and measurement of incoming and outgoing cash flows. The differences between the plans and actual data are constantly analysed. The Group has implemented a centralised system for the management of cash flows and payments in compliance with various local currency and tax regulations. Banking relationships are negotiated and managed centrally, in order to ensure coverage for short and medium-term financial needs at the lowest possible cost. The prudent management of the aforesaid risk requires the maintenance of an adequate level of cash or cash equivalents and/or highly liquid short-term financial instruments, the availability of funds
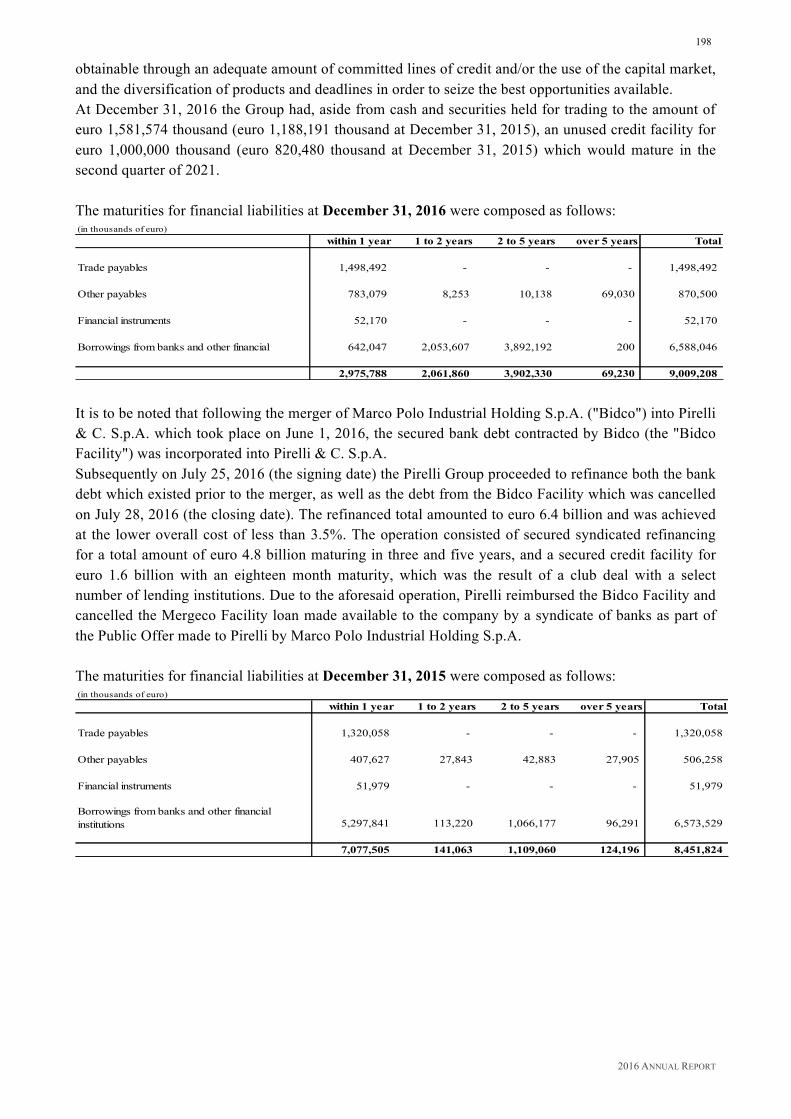
2016 ANNUAL REPORT
198
obtainable through an adequate amount of committed lines of credit and/or the use of the capital market, and the diversification of products and deadlines in order to seize the best opportunities available. At December 31, 2016 the Group had, aside from cash and securities held for trading to the amount of euro 1,581,574 thousand (euro 1,188,191 thousand at December 31, 2015), an unused credit facility for euro 1,000,000 thousand (euro 820,480 thousand at December 31, 2015) which would mature in the second quarter of 2021. The maturities for financial liabilities at December 31, 2016 were composed as follows: (in thousands of euro)
within 1 year 1 to 2 years 2 to 5 years over 5 years Total
Trade payables 1,498,492 - - - 1,498,492
Other payables 783,079 8,253 10,138 69,030 870,500
Financial instruments 52,170 - - - 52,170
642,047 2,053,607 3,892,192 200 6,588,046
2,975,788 2,061,860 3,902,330 69,230 9,009,208
Borrowings from banks and other financial
It is to be noted that following the merger of Marco Polo Industrial Holding S.p.A. ("Bidco") into Pirelli & C. S.p.A. which took place on June 1, 2016, the secured bank debt contracted by Bidco (the "Bidco Facility") was incorporated into Pirelli & C. S.p.A. Subsequently on July 25, 2016 (the signing date) the Pirelli Group proceeded to refinance both the bank debt which existed prior to the merger, as well as the debt from the Bidco Facility which was cancelled on July 28, 2016 (the closing date). The refinanced total amounted to euro 6.4 billion and was achieved at the lower overall cost of less than 3.5%. The operation consisted of secured syndicated refinancing for a total amount of euro 4.8 billion maturing in three and five years, and a secured credit facility for euro 1.6 billion with an eighteen month maturity, which was the result of a club deal with a select number of lending institutions. Due to the aforesaid operation, Pirelli reimbursed the Bidco Facility and cancelled the Mergeco Facility loan made available to the company by a syndicate of banks as part of the Public Offer made to Pirelli by Marco Polo Industrial Holding S.p.A. The maturities for financial liabilities at December 31, 2015 were composed as follows: (in thousands of euro)
within 1 year 1 to 2 years 2 to 5 years over 5 years Total
Trade payables 1,320,058 - - - 1,320,058
Other payables 407,627 27,843 42,883 27,905 506,258
Financial instruments 51,979 - - - 51,979
5,297,841 113,220 1,066,177 96,291 6,573,529
7,077,505 141,063 1,109,060 124,196 8,451,824
Borrowings from banks and other financial institutions
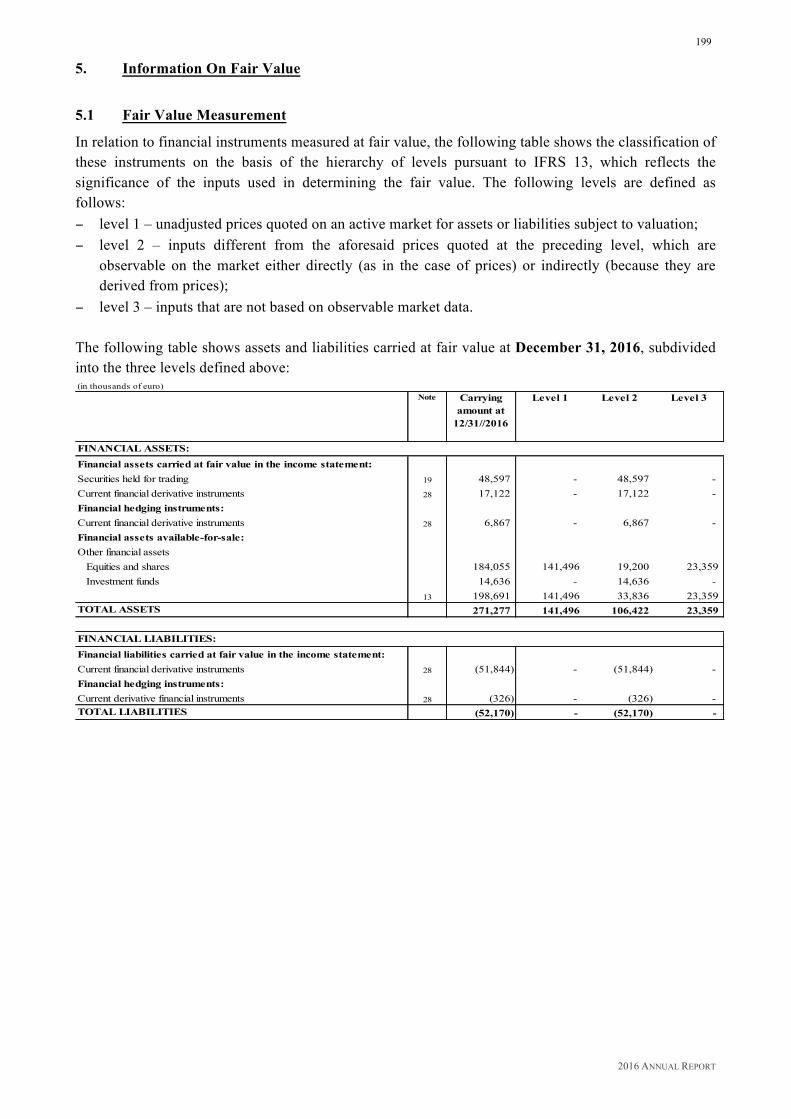
2016 ANNUAL REPORT
199
5. Information On Fair Value
5.1 Fair Value Measurement
In relation to financial instruments measured at fair value, the following table shows the classification of these instruments on the basis of the hierarchy of levels pursuant to IFRS 13, which reflects the significance of the inputs used in determining the fair value. The following levels are defined as follows: − level 1 – unadjusted prices quoted on an active market for assets or liabilities subject to valuation; − level 2 – inputs different from the aforesaid prices quoted at the preceding level, which are
observable on the market either directly (as in the case of prices) or indirectly (because they are derived from prices);
− level 3 – inputs that are not based on observable market data. The following table shows assets and liabilities carried at fair value at December 31, 2016, subdivided into the three levels defined above: (in thousands of euro)
Note Carrying amount at
12/31//2016
Level 1 Level 2 Level 3
FINANCIAL ASSETS:Financial assets carried at fair value in the income statement:Securities held for trading 19 48,597 - 48,597 - Current financial derivative instruments 28 17,122 - 17,122 - Financial hedging instruments:Current financial derivative instruments 28 6,867 - 6,867 - Financial assets available-for-sale: Other financial assets Equities and shares 184,055 141,496 19,200 23,359 Investment funds 14,636 - 14,636 -
13 198,691 141,496 33,836 23,359TOTAL ASSETS 271,277 141,496 106,422 23,359
FINANCIAL LIABILITIES:Financial liabilities carried at fair value in the income statement:Current financial derivative instruments 28 (51,844) - (51,844) - Financial hedging instruments:Current derivative financial instruments 28 (326) - (326) - TOTAL LIABILITIES (52,170) - (52,170) -
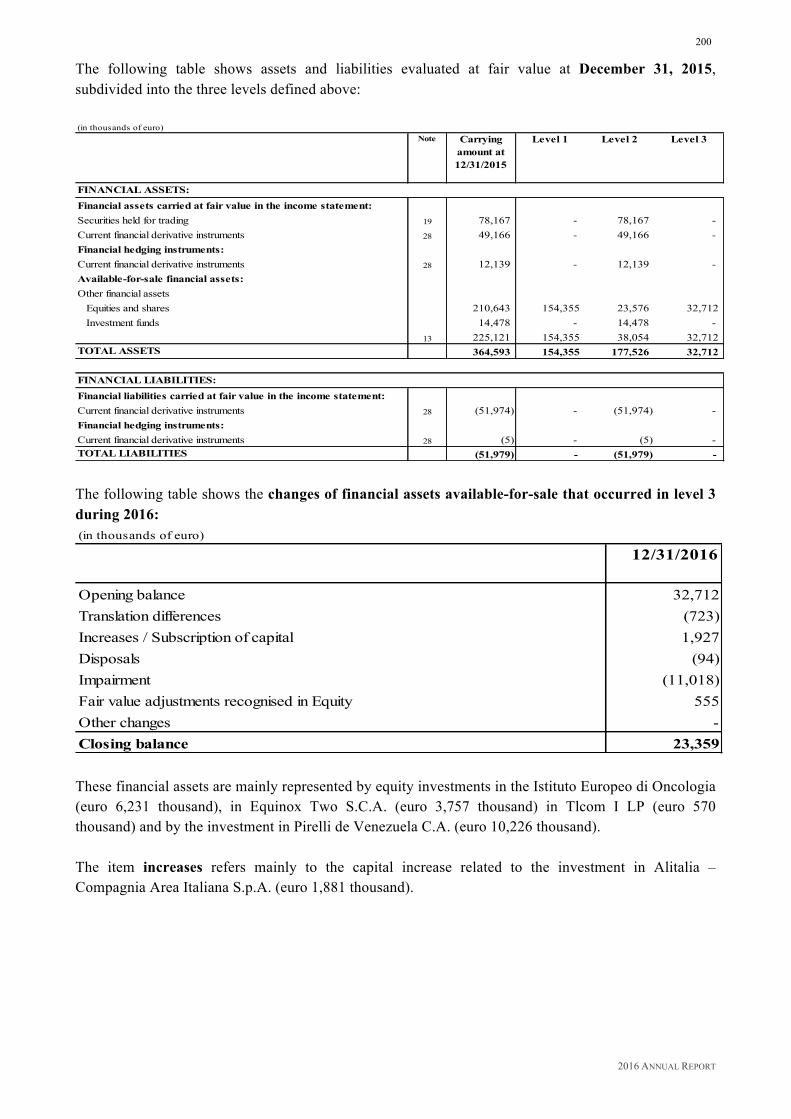
2016 ANNUAL REPORT
200
The following table shows assets and liabilities evaluated at fair value at December 31, 2015, subdivided into the three levels defined above: (in thousands of euro)
Note Carrying amount at 12/31/2015
Level 1 Level 2 Level 3
FINANCIAL ASSETS:Financial assets carried at fair value in the income statement:Securities held for trading 19 78,167 - 78,167 - Current financial derivative instruments 28 49,166 - 49,166 - Financial hedging instruments:Current financial derivative instruments 28 12,139 - 12,139 - Available-for-sale financial assets: Other financial assets Equities and shares 210,643 154,355 23,576 32,712 Investment funds 14,478 - 14,478 -
13 225,121 154,355 38,054 32,712TOTAL ASSETS 364,593 154,355 177,526 32,712
FINANCIAL LIABILITIES:Financial liabilities carried at fair value in the income statement:Current financial derivative instruments 28 (51,974) - (51,974) - Financial hedging instruments:Current financial derivative instruments 28 (5) - (5) - TOTAL LIABILITIES (51,979) - (51,979) - The following table shows the changes of financial assets available-for-sale that occurred in level 3 during 2016: (in thousands of euro)
12/31/2016
Opening balance 32,712 Translation differences (723)Increases / Subscription of capital 1,927 Disposals (94)Impairment (11,018)Fair value adjustments recognised in Equity 555 Other changes - Closing balance 23,359 These financial assets are mainly represented by equity investments in the Istituto Europeo di Oncologia (euro 6,231 thousand), in Equinox Two S.C.A. (euro 3,757 thousand) in Tlcom I LP (euro 570 thousand) and by the investment in Pirelli de Venezuela C.A. (euro 10,226 thousand). The item increases refers mainly to the capital increase related to the investment in Alitalia – Compagnia Area Italiana S.p.A. (euro 1,881 thousand).
2016 ANNUAL REPORT
201
The item impairment refers mainly to the investments in Pirelli de Venezuela C.A. (euro 8,651 thousand), and in Alitalia-Compagnia Area Italiana S.p.A (euro 1,881 thousand). During the 2016 financial year, there were no transfers from level 1 to level 2 or vice versa, nor from level 3 to other levels or vice versa. The fair value of financial instruments which are traded on active markets is based on the price quotations published at the reporting date. These instruments, included in level 1, primarily comprise equity investments classified as financial assets available for sale. The fair value of financial instruments not traded on active markets (e.g. derivatives) is measured by means of evaluation techniques that maximise the use of observable and available market data, using widely accepted financial valuation techniques:
- market prices for similar instruments; - the fair value of interest rate swaps is calculated by discounting estimated future cash flows
based on observable yield curves; - the fair value of foreign exchange derivatives (forward contracts) is determined by using the
forward exchange rate at the reporting date.
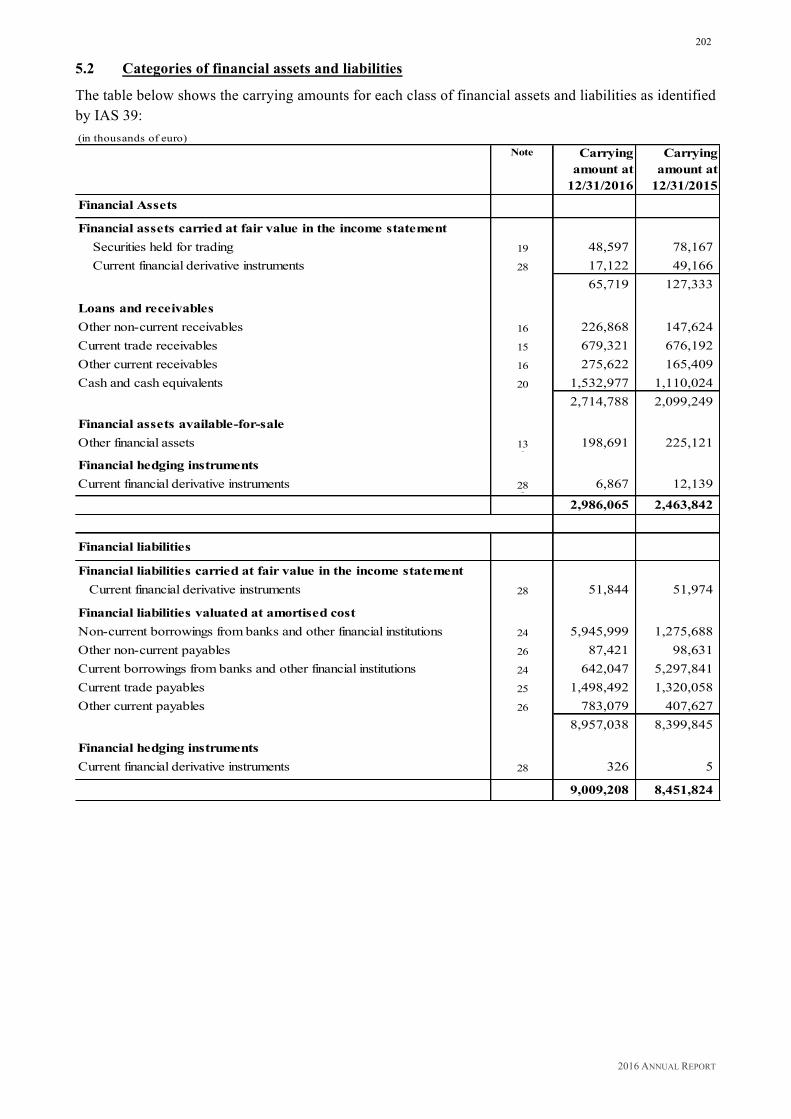
2016 ANNUAL REPORT
202
5.2 Categories of financial assets and liabilities
The table below shows the carrying amounts for each class of financial assets and liabilities as identified by IAS 39: (in thousands of euro)
Note Carrying amount at
12/31/2016
Carrying amount at
12/31/2015Financial Assets
Financial assets carried at fair value in the income statement Securities held for trading 19 48,597 78,167 Current financial derivative instruments 28 17,122 49,166
65,719 127,333
Loans and receivablesOther non-current receivables 16 226,868 147,624 Current trade receivables 15 679,321 676,192 Other current receivables 16 275,622 165,409 Cash and cash equivalents 20 1,532,977 1,110,024
2,714,788 2,099,249
Financial assets available-for-sale Other financial assets 13 198,691 225,121 0
Financial hedging instrumentsCurrent financial derivative instruments 28 6,867 12,139 0
2,986,065 2,463,842
Financial liabilities
Financial liabilities carried at fair value in the income statement Current financial derivative instruments 28 51,844 51,974
Financial liabilities valuated at amortised costNon-current borrowings from banks and other financial institutions 24 5,945,999 1,275,688 Other non-current payables 26 87,421 98,631 Current borrowings from banks and other financial institutions 24 642,047 5,297,841 Current trade payables 25 1,498,492 1,320,058 Other current payables 26 783,079 407,627
8,957,038 8,399,845
Financial hedging instrumentsCurrent financial derivative instruments 28 326 5
9,009,208 8,451,824

2016 ANNUAL REPORT
203
6. Capital Management Policy The Company’s objective is to maximise the return on net invested capital while maintaining the ability to operate over time, in order to ensure adequate returns for its shareholders and benefits for other stakeholders by providing for the gradual deleveraging of the financial structure of the Group, which is to be achieved over a short to medium-term period. In order to achieve these objectives, as well as pursue satisfactory earnings results and generate cash flows, the Group may adjust its dividend policy and the configuration of the Company’s capital. 7. Estimates And Assumptions
The preparation of the consolidated Financial Statements entails the necessity of management making estimates and assumptions which, under certain circumstances are based on difficult and subjective assessments and estimates based on historical experience, as well as assumptions that are from time to time considered reasonable and realistic in light of the circumstances. It is possible that the actual results could actually differ from these estimates. The estimates and assumptions are reviewed periodically and the effects of any changes made to them are reflected in the Income Statement for the period in which the estimate is revised. If such estimates and assumptions, based on the best evaluation currently available, should differ from actual circumstances, they are modified accordingly for the period in which the change of the circumstances occurred.
Estimates and assumptions refer mainly to the evaluation of the recoverability of intangible assets, to the definition of the useful lives of property, plant and equipment and intangible assets, to the evaluation of the recoverability of investments in associated companies, to the recoverability of receivables, to the recognition/valuation of provisions for liabilities and charges, to the evaluation of pension schemes and other post-employment benefits, and to the designation of intercompany receivables due to from the Egyptian subsidiaries as a “net investment in foreign operations”.
ESTIMATES ENTAILING GREATER SUBJECTIVITY AND HAVING A PARTICULARLY MATERIAL IMPACT
There following is a brief description of the accounting standards which more than others require greater subjectivity by management when preparing estimates, and for which a change in the underlying conditions of the assumptions used could have a significant impact on the consolidated Financial Statements, or where the risk exists that significant adjustments to the carrying value of assets and liabilities may emerge during the financial year following the financial year of the financial statements.
Goodwill In accordance with the accounting standards adopted for the preparation of the Financial Statements, goodwill is tested annually in order to ascertain the existence of any impairment to be recognised in the Income Statement. In particular, the test involves the allocation of goodwill to the cash generating units and the determination of the recoverable amount, being the higher amount between either the fair value and the use value. If the recoverable amount proves to be lower than the carrying amount of the cash generating units, the goodwill allocated to them must be impaired.
2016 ANNUAL REPORT
204
Determination of the recoverable amount for the cash generating units entails using estimates that depend on subjective assessments and on factors that can change over time, with consequent and possibly significant effects on the valuations made by management. Impairment of property, plant and equipment and intangible assets
In accordance with the accounting standards, property, plant and equipment and intangible assets are tested in order to ascertain whether there has been a loss of value when there are signs that difficulties are to be expected for the recovery of their relative net carrying amount through their use. The verification of the existence of impairment indicators requires the Directors to make make subjective judgements based on the information available from both internal and external sources, and on historical experience. Moreover, if it is determined that a potential impairment may have been generated, the loss in value is calculated using the appropriate assessment techniques. The proper identification of indicator elements for the existence of a potential loss in value, as well as the estimates used to determine the impairment depend on a subjective valuation and on factors that may change over time and influence the valuations and estimates made by management. Impairment of investments in associates and joint ventures
Following the application of the equity method, in the presence of indicators of a loss of value, the value of investments in associates and joint ventures must be compared with the recoverable amount (the so-called impairment test). The recoverable amount corresponds to the higher amount between the fair value less the costs of the sale, and the use value. For the purpose of the impairment test of Fenice S.r.l., an associated company with unlisted shares, the fair value was determined on the basis of an appraisal prepared by an independent third party professional, making use of estimates based on the best available information. In particular, an income approach was used based on the criteria of available options.
Pension funds
The Group companies have in place, pension plans, health insurance plans and other defined benefit plans for their employees, primarily in the United States and the United Kingdom. These funds were closed to new contributions and therefore the actuarial risk relates only to the previous deficit. Management uses different actuarial assumptions to calculate the liabilities and assets servicing these pension plans. The actuarial assumptions of a financial nature concern the discount rate, the rate of inflation and the trend in medical costs. The actuarial assumptions of a demographic nature essentially concern mortality rates. The Group has identified discount or actualisation rates which it deems are balanced, given the context. Deferred tax assets
Deferred tax assets are accounted for on the basis of expected future taxable earnings prospects. The evaluation of expected income for the purpose of recording deferred taxes depends on factors that may change over time and significantly impact the measurement of deferred tax assets.
2016 ANNUAL REPORT
205
To determine the adjustment, forecast figures and business plans consistent with those used for the impairment tests and described in the previous paragraph in relation to the recoverable amount of non-current assets have been taken into account. It is further maintained that the adjustments recorded are sufficient to cover the risk of a deterioration compared to the assumptions of the plan, taking into account the fact that the net deferred tax assets relate to the temporary differences/tax losses which, to a significant extent, can be recovered over a very long period, the recoverability of which is therefore compatible with scenarios in which the actual data could deviate negatively compared to the assessments made by management. Provisions for liabilities and charges
In view of legal and tax liabilities, provisions for the risk of of adverse outcomes have been recognised. The value of provisions recognised in respect of these risks represents the best estimate to date made by management made for legal and tax issues covering a vast range of issues which are pending in the jurisdictions of various countries. This estimate entails the adoption of assumptions that depend on factors that may change over time and which could therefore have a significant impact on the current estimates made by management in preparing the consolidated Financial Statements. Designation of intercompany receivables due from the Egyptian subsidiariesas a “net investment in foreign operations”.
The worsening of the macroeconomic situation in Egypt, the deterioration of the exchange rates as well as the continuing fall in the availability of US dollars in the country which could be purchased through the official currency exchange mechanisms, led to the emergence of a situation for which the Group believes that, in reference to intercompany receivables outstanding at October 31, 2016 from the Egyptian subsidiaries, Alexandria Tire Company S.A.E. and International Tire Company Ltd, the conditions as provided for by IAS 21.15 for the designation of such receivables as net investments in foreign operations, had been met, as their collection is unpredictable in the foreseeable future. Therefore, in accordance with the provisions of IAS 21.32 the exchange rate difference matured on those positions, was recognised directly, as of the date of designation, in the Statement of Comprehensive Income and will be reversed in the consolidated Income Statement at the time of disposal of the investment. 8. Business Combinations
On August 11, 2015 - following the acquisition by Marco Polo Industrial Holding S.p.A, of 20.34% of Pirelli & C. S.p.A. from Camfin S.p.A., and the signing of the Pirelli Shareholders' Agreement, in addition to the acquired shares, Pirelli was also interested in the 5.85% share of capital indirectly held by Camfin S.p.A. in Pirelli & C. S.p.A. through Cam 2012 S.p.A., and as an additional result of the Public Offer, which had been mandatory for Pirelli ordinary shares and voluntary for Pirelli savings shares, and by way of the subsequent procedure through which the offerer acquired the remaining residual ordinary shares, Marco Polo Industrial Holding S.p.A, in the course of 2015, acquired 100% of the outstanding Pirelli & C. S.p.A. ordinary shares and 95.9% of the outstanding savings shares.
2016 ANNUAL REPORT
206
Through these transactions China National Tire & Rubber Co. Ltd (CNRC - the controlling shareholder of Marco Polo Industrial Holding S.p.A.), by means of the vehicle Marco Polo Industrial Holding S.p.A., acquired control of the Pirelli Group and therefore this transaction was accounted for in accordance with the requirements of IFRS 3 - Business Combinations, in the consolidated Financial Statements of Marco Polo Industrial Holding S.p.A. As regards the accounting for the acquisition, it is maintained that the individual steps by which control of the Pirelli Group was acquired should be considered as a single transaction. On the basis of the aforesaid considerations it is maintained that, the CNRC by means of the vehicle Marco Polo Industrial Holding S.p.A., as of the end of the first phase (the acquisition of 20.34% of the share capital of Pirelli & C. S.p.A. from Camfin, and the signing of the Pirelli Shareholders' Agreement), had gained control of the Pirelli Group, in particular:
- already as of the beginning of the first phase, the objective of the CNRC was to obtain control of Pirelli;
- in order to achieve the goal of obtaining control of Pirelli & C. SpA., China National Tire & Rubber Co. Ltd (CNRC), a subsidiary of ChemChina (ChemChina), Camfin S.p.A. (Camfin) and the shareholders of Camfin S.p.A. (Coinv S.p.A. and Long Term Investments Luxembourg S.A.), signed a binding agreement for a long-term industrial partnership with Pirelli, which established the terms and conditions for the acquisition and the subsequent industrial reorganisation;
- the purchase price of euro 15 per share fully reflects the premium price for the control of Pirelli & C. S.p.A, confirming the desire of the CNRC to control Pirelli & C. S.p.A.;
- management considered it reasonable that CNRC could control Pirelli at the end of the Public Offer.
On the basis of the aforesaid, in consideration of August 11, 2015 as the date of the acquisition of control, the management of CNRC designated September 1, 2015 to the terms and conditions of the contract, as the first effective date for the consolidation of Pirelli & C. S.p.A. and its subsidiaries. As a result of the reverse merger, which involved the incorporation of the acquiring company Marco Polo Industrial Holding S.p.A., into the subsidiary Pirelli & C. S.p.A., the accounting effects of the Purchase Price Allocation are reflected in the Financial Statements of the surviving entity, Pirelli & C. S.p.A.
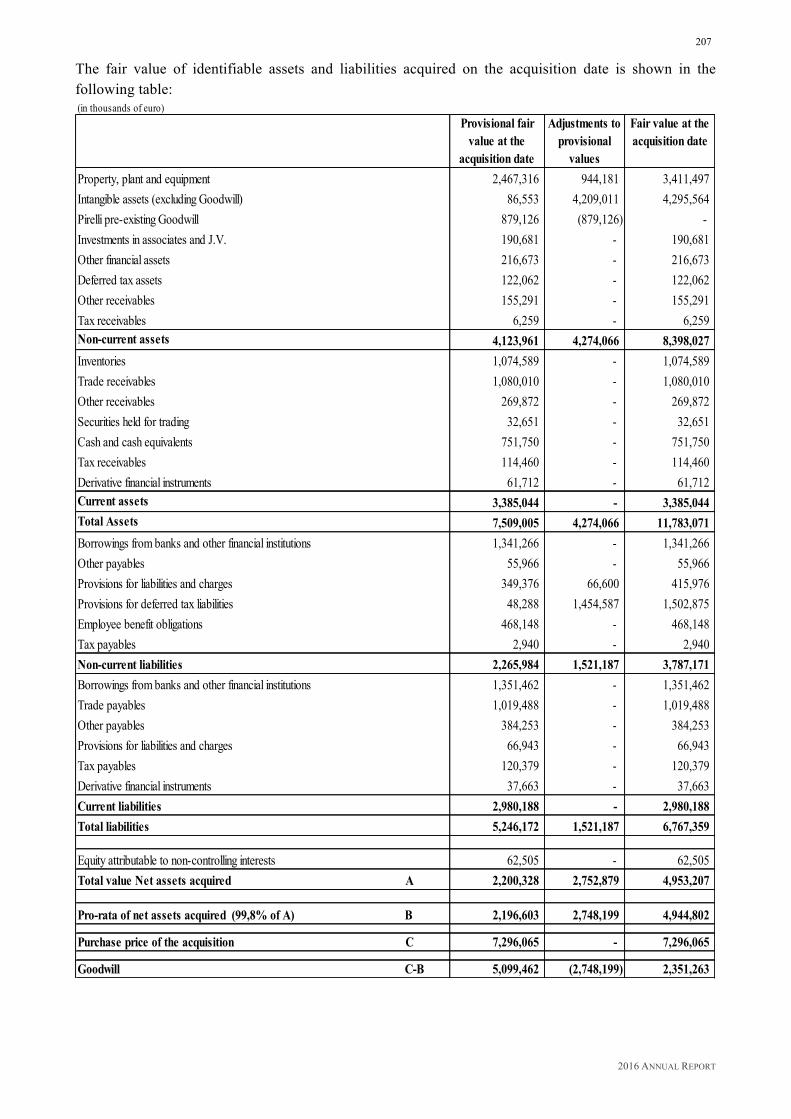
2016 ANNUAL REPORT
207
The fair value of identifiable assets and liabilities acquired on the acquisition date is shown in the following table: (in thousands of euro)
Provisional fair value at the
acquisition date
Adjustments to provisional
values
Fair value at the acquisition date
Property, plant and equipment 2,467,316 944,181 3,411,497Intangible assets (excluding Goodwill) 86,553 4,209,011 4,295,564Pirelli pre-existing Goodwill 879,126 (879,126) - Investments in associates and J.V. 190,681 - 190,681Other financial assets 216,673 - 216,673Deferred tax assets 122,062 - 122,062Other receivables 155,291 - 155,291Tax receivables 6,259 - 6,259Non-current assets 4,123,961 4,274,066 8,398,027Inventories 1,074,589 - 1,074,589Trade receivables 1,080,010 - 1,080,010Other receivables 269,872 - 269,872Securities held for trading 32,651 - 32,651Cash and cash equivalents 751,750 - 751,750Tax receivables 114,460 - 114,460Derivative financial instruments 61,712 - 61,712Current assets 3,385,044 - 3,385,044Total Assets 7,509,005 4,274,066 11,783,071Borrowings from banks and other financial institutions 1,341,266 - 1,341,266Other payables 55,966 - 55,966Provisions for liabilities and charges 349,376 66,600 415,976Provisions for deferred tax liabilities 48,288 1,454,587 1,502,875Employee benefit obligations 468,148 - 468,148Tax payables 2,940 - 2,940Non-current liabilities 2,265,984 1,521,187 3,787,171Borrowings from banks and other financial institutions 1,351,462 - 1,351,462Trade payables 1,019,488 - 1,019,488Other payables 384,253 - 384,253Provisions for liabilities and charges 66,943 - 66,943Tax payables 120,379 - 120,379Derivative financial instruments 37,663 - 37,663Current liabilities 2,980,188 - 2,980,188Total liabilities 5,246,172 1,521,187 6,767,359
Equity attributable to non-controlling interests 62,505 - 62,505Total value Net assets acquired A 2,200,328 2,752,879 4,953,207
Pro-rata of net assets acquired (99,8% of A) B 2,196,603 2,748,199 4,944,802
Purchase price of the acquisition C 7,296,065 - 7,296,065
Goodwill C-B 5,099,462 (2,748,199) 2,351,263

2016 ANNUAL REPORT
208
As a result of the completion of the Purchase Price Allocation, the following main adjustments to the fair value of the acquired assets and liabilities were performed:
- detection of the value of the Pirelli brand at euro 2,270 million (euro 1,637 million net of tax effects) for which it was maintained that the requirements for it to be classified as an intangible fixed asset with an indefinite useful life had been met;
- detection within the intangible fixed assets of the value of the Metzler brand at euro 67 million (euro 48 million net of tax effects);
- detection within the intangible fixed asset of the value of Technology at euro 1,437 million (euro 1,036 million net of tax effects);
- detection within the intangible fixed assets of the value of Customer Relationships at euro 479 million (euro 345 million net of tax effects);
- the revaluation of tangible fixed assets to a total of euro 944 million (euro 676 million net of tax effects).
It is also to be noted that on October 1, 2016, an 80% share of the share capital of the Chinese company Jiaozuo Aeolus Tyre Co., Ltd. was acquired from the Aeolus Tyre Co., Ltd. This operation took the form of a business combination occurring between entities under common control. Therefore the provisions of IFRS 3 – Business Combinations were not applicable to the transaction. The value of the assets and liabilities acquired have been recorded as the same values as the carrying amounts recorded in the Financial Statements of the acquired company, while the difference detected between the amount paid (euro 67 million) and the net value of the assets acquired was recognised in equity.

2016 ANNUAL REPORT
209
9. Operating Segments
The operating segments which were subject to separate disclosure were as follows: • Consumer segment: including tyres for cars and motorbikes, destined for both the Original
Equipment channel and the Replacement channel; • Industrial segment: including tyres for truck and vehicles for agricultural use, destined for both the
Original Equipment channel and the Replacement channel. The results subdivided by sector for the 2016 financial year were as follows:
(in thousands of euro) CONSUMER INDUSTRIAL OTHER BUSINESS 2016
Total net sales 5,068,502 987,702 2,227 6,058,431
Gross operating margin 1,040,350 77,644 (1,464) 1,116,530
Depreciation and amortisation (347,348) (44,050) (978) (392,376)
Operating income (loss) 693,002 33,594 (2,442) 724,154
Net income (loss) from equity investments (20,019)
Financial income (expenses) (440,205)
Net income (loss) before tax 263,930
Taxes (116,305)
Net income (loss) 147,625 Assets, liabilities and investments subdivided by sector at December 31, 2016 were as follows: (in thousands of euro)
CONSUMER INDUSTRIAL OTHER BUSINESS OTHER TOTAL 12/31/2016
Goodwill 1,877,363 473,900 - - 2,351,263 Allocated assets 8,781,533 1,125,020 4,023 - 9,910,576 Unallocated assets - - - 2,104,622 2,104,622 TOTAL ASSETS 10,658,896 1,598,920 4,023 2,104,622 14,366,461
Allocated liabilities 3,295,839 608,416 1,055 - 3,905,310 Unallocated liabilities - - - 7,186,293 7,186,293 TOTAL LIABILITIES 3,295,839 608,416 1,055 7,186,293 11,091,603 Investments:- property, plant and equipment 334,742 28,667 57 - 363,466 - intangible assets 7,501 1,216 - - 8,717 The assets of the business consist mainly of property, plant and equipment and intangible assets, assets acquired under finance leases, inventories, trade receivables and other receivables.
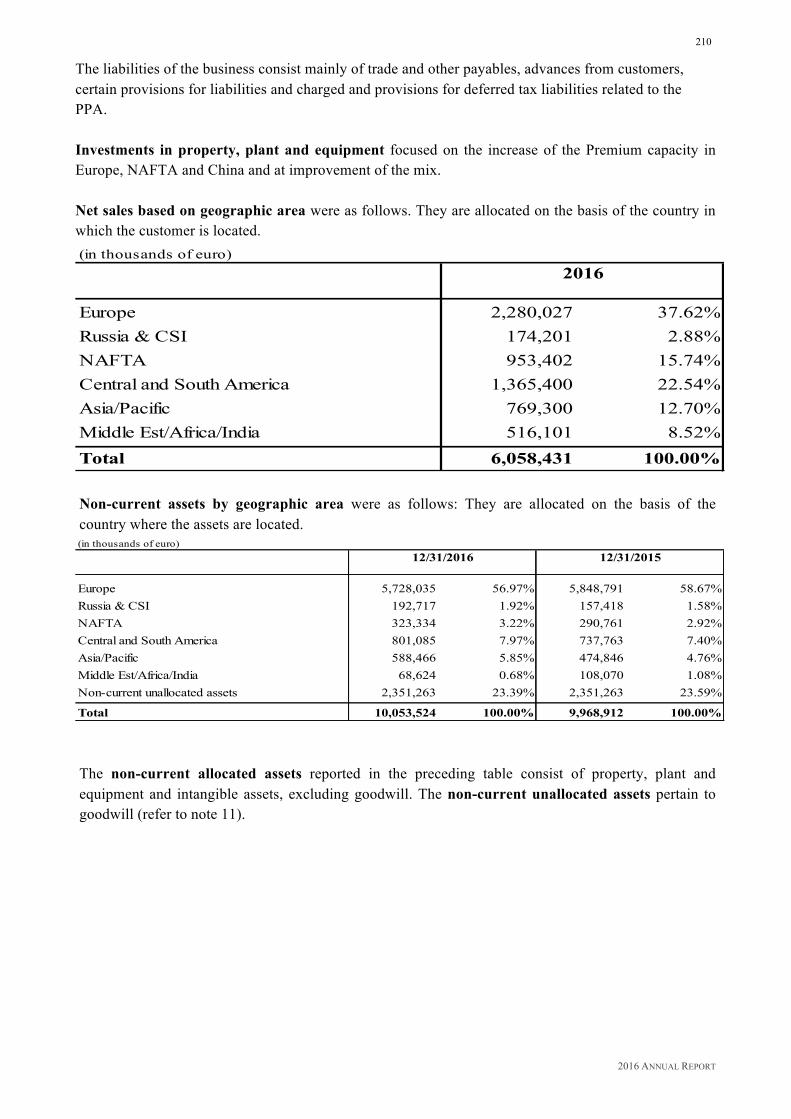
2016 ANNUAL REPORT
210
The liabilities of the business consist mainly of trade and other payables, advances from customers, certain provisions for liabilities and charged and provisions for deferred tax liabilities related to the PPA. Investments in property, plant and equipment focused on the increase of the Premium capacity in Europe, NAFTA and China and at improvement of the mix. Net sales based on geographic area were as follows. They are allocated on the basis of the country in which the customer is located. (in thousands of euro)
Europe 2,280,027 37.62%Russia & CSI 174,201 2.88%NAFTA 953,402 15.74%Central and South America 1,365,400 22.54%Asia/Pacific 769,300 12.70%Middle Est/Africa/India 516,101 8.52%Total 6,058,431 100.00%
2016
Non-current assets by geographic area were as follows: They are allocated on the basis of the country where the assets are located. (in thousands of euro)
Europe 5,728,035 56.97% 5,848,791 58.67%Russia & CSI 192,717 1.92% 157,418 1.58%NAFTA 323,334 3.22% 290,761 2.92%Central and South America 801,085 7.97% 737,763 7.40%Asia/Pacific 588,466 5.85% 474,846 4.76%Middle Est/Africa/India 68,624 0.68% 108,070 1.08%Non-current unallocated assets 2,351,263 23.39% 2,351,263 23.59%- 0.00% - 0.00%Total 10,053,524 100.00% 9,968,912 100.00%
12/31/2016 12/31/2015
The non-current allocated assets reported in the preceding table consist of property, plant and equipment and intangible assets, excluding goodwill. The non-current unallocated assets pertain to goodwill (refer to note 11).

2016 ANNUAL REPORT
211
10. Property, Plant And Equipment
The composition and changes for property, plant and equipment were as follows: (in thousands of euro)
Gross Value Accumulated Depreciation
Net Value Gross Value Accumulated Depreciation
Net Value
Land 326,216 - 326,216 335,049 - 335,049Buildings 776,003 (45,462) 730,541 723,299 (12,522) 710,777Plant and machinery 2,384,295 (236,794) 2,147,501 2,064,716 (66,341) 1,998,375Industrial and trade equipment 378,662 (77,755) 300,907 291,641 (21,313) 270,328Other assets 70,643 (19,173) 51,470 54,291 (5,186) 49,105
3,935,819 (379,184) 3,556,635 3,468,996 (105,362) 3,363,634
12/31/2016 12/31/2015 restated
NET VALUE (in thousands of euro)
12/31/2015 PPA 12/31/2015 restated
Change in scope
Translation differ.
Increases Decreases Reclassif. Depreciation Other 12/31/2016
Land 95,599 239,450 335,049 7,139 (1,939) 70 (13,628) (57) - (418) 326,216Buildings 593,816 116,961 710,777 39,641 14,600 29,625 (37,814) 3,759 (32,940) 2,893 730,541Plant and machinery 1,504,359 494,016 1,998,375 75,738 (922) 269,499 - (21,701) (170,453) (3,035) 2,147,501Industrial and trade equipment 177,659 92,669 270,328 9,910 6,160 43,836 - 23,652 (56,442) 3,463 300,907Other assets 48,020 1,085 49,105 4,614 (746) 20,436 (446) (5,653) (13,987) (1,853) 51,470
2,419,453 944,181 3,363,634 137,042 17,153 363,466 (51,888) - (273,822) 1,050 3,556,635 The change in scope refers to property, plant and equipment of the Chinese company Jiaozuo Aeolus Tyre Co., Ltd. which was acquired in the month of October 2016. The item increases totalling euro 363,466 thousand was mainly aimed at increasing the Premium capacity in Europe, NAFTA and China and at improvement of the mix. The ratio of investments to amortisations for the 2016 financial year was equal to 1.33. Property, plant and equipment in progress at December 31, 2016 included in the individual fixed asset categories totalled euro 178,424 thousand (euro 140,103 thousand at December 31, 2015).
It is also to be noted that as part of the secured loan (Senior Facilities) granted to Pirelli & C. S.p.A. and Pirelli International Plc (refer to Note 24), the companies of the Group have pledged as guarantee, plants and machinery for an equivalent total value of euro 549,278 thousand, and as part of other financing operations mainly in Brazil and Argentina, plants and machinery for an equivalent total velue of euro 8,725 thousand (euro 41,159 thousand at December 31, 2015). The value of the buildings and other assets for which the Company entered into a financial leasing agreement is included in the respective categories of property, plant, and equipment. The changes which occurred were composed as follows: (in thousands of euro)
Cost Accumulated Depreciation
Net value Cost Accumulated Depreciation
Net value
Leased buldings 1,925 (1,354) 571 2,519 (1,549) 970Other leased assets 2,118 (2,043) 75 2,325 (2,092) 233Leased plant and machinery 92 (92) - 107 (107) -
4,135 (3,489) 646 4,951 (3,748) 1,203
12/31/2016 12/31/2015
Payables for financial leases have been included in financial payables (refer to Note 24).
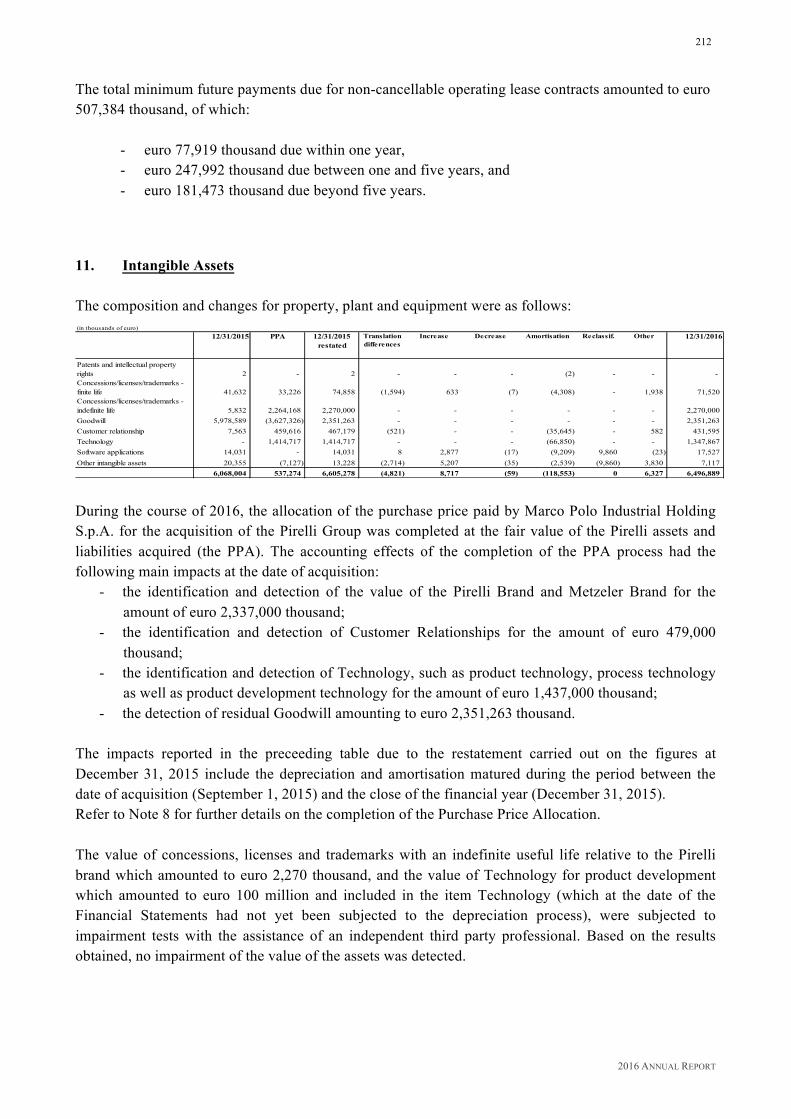
2016 ANNUAL REPORT
212
The total minimum future payments due for non-cancellable operating lease contracts amounted to euro 507,384 thousand, of which:
- euro 77,919 thousand due within one year, - euro 247,992 thousand due between one and five years, and - euro 181,473 thousand due beyond five years.
11. Intangible Assets The composition and changes for property, plant and equipment were as follows: (in thousands of euro)
PPA
Patents and intellectual property rights 2 - 2 - - - (2) - - - Concessions/licenses/trademarks - finite life 41,632 33,226 74,858 (1,594) 633 (7) (4,308) - 1,938 71,520Concessions/licenses/trademarks - indefinite life 5,832 2,264,168 2,270,000 - - - - - - 2,270,000Goodwill 5,978,589 (3,627,326) 2,351,263 - - - - - - 2,351,263Customer relationship 7,563 459,616 467,179 (521) - - (35,645) - 582 431,595Technology - 1,414,717 1,414,717 - - - (66,850) - - 1,347,867Software applications 14,031 - 14,031 8 2,877 (17) (9,209) 9,860 (23) 17,527Other intangible assets 20,355 (7,127) 13,228 (2,714) 5,207 (35) (2,539) (9,860) 3,830 7,117
6,068,004 537,274 6,605,278 (4,821) 8,717 (59) (118,553) 0 6,327 6,496,889
12/31/201612/31/2015 12/31/2015 restated
Translation differences
Increase Decrease Amortisation Reclassif. Other
During the course of 2016, the allocation of the purchase price paid by Marco Polo Industrial Holding S.p.A. for the acquisition of the Pirelli Group was completed at the fair value of the Pirelli assets and liabilities acquired (the PPA). The accounting effects of the completion of the PPA process had the following main impacts at the date of acquisition:
- the identification and detection of the value of the Pirelli Brand and Metzeler Brand for the amount of euro 2,337,000 thousand;
- the identification and detection of Customer Relationships for the amount of euro 479,000 thousand;
- the identification and detection of Technology, such as product technology, process technology as well as product development technology for the amount of euro 1,437,000 thousand;
- the detection of residual Goodwill amounting to euro 2,351,263 thousand.
The impacts reported in the preceeding table due to the restatement carried out on the figures at December 31, 2015 include the depreciation and amortisation matured during the period between the date of acquisition (September 1, 2015) and the close of the financial year (December 31, 2015). Refer to Note 8 for further details on the completion of the Purchase Price Allocation. The value of concessions, licenses and trademarks with an indefinite useful life relative to the Pirelli brand which amounted to euro 2,270 thousand, and the value of Technology for product development which amounted to euro 100 million and included in the item Technology (which at the date of the Financial Statements had not yet been subjected to the depreciation process), were subjected to impairment tests with the assistance of an independent third party professional. Based on the results obtained, no impairment of the value of the assets was detected.
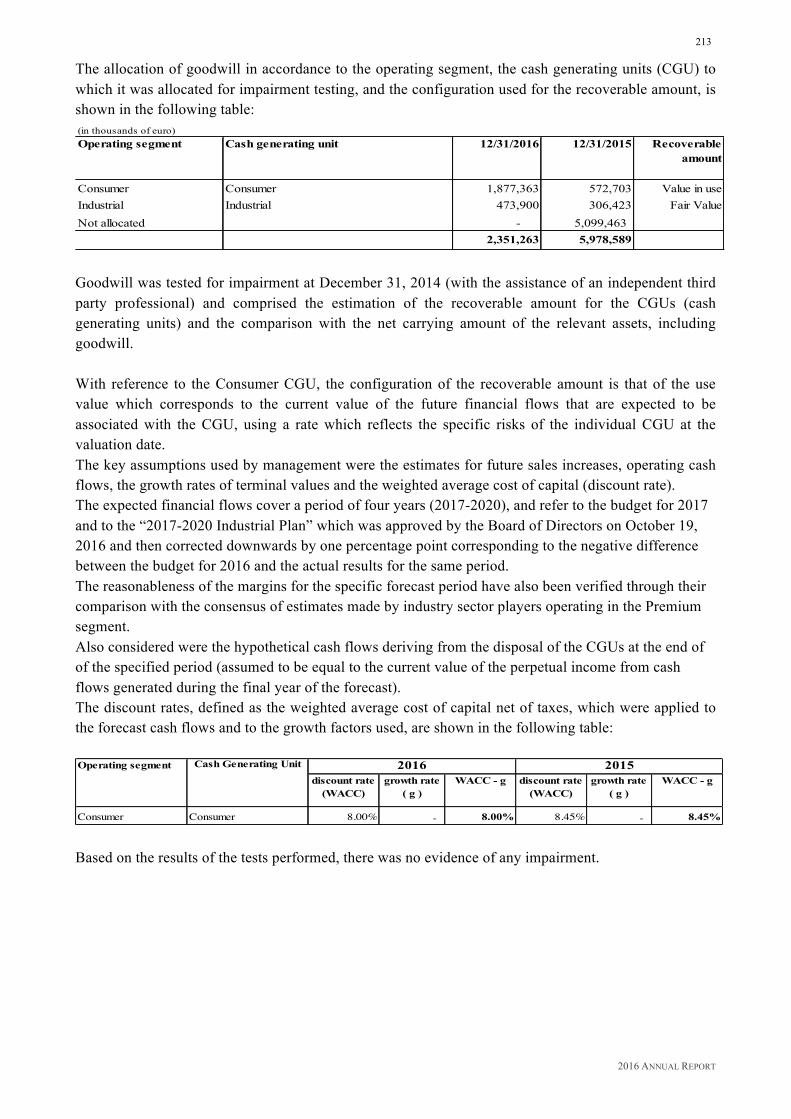
2016 ANNUAL REPORT
213
The allocation of goodwill in accordance to the operating segment, the cash generating units (CGU) to which it was allocated for impairment testing, and the configuration used for the recoverable amount, is shown in the following table: (in thousands of euro)Operating segment Cash generating unit 12/31/2016 12/31/2015 Recoverable
amount
Consumer Consumer 1,877,363 572,703 Value in useIndustrial Industrial 473,900 306,423 Fair ValueNot allocated - 5,099,463
2,351,263 5,978,589 Goodwill was tested for impairment at December 31, 2014 (with the assistance of an independent third party professional) and comprised the estimation of the recoverable amount for the CGUs (cash generating units) and the comparison with the net carrying amount of the relevant assets, including goodwill. With reference to the Consumer CGU, the configuration of the recoverable amount is that of the use value which corresponds to the current value of the future financial flows that are expected to be associated with the CGU, using a rate which reflects the specific risks of the individual CGU at the valuation date. The key assumptions used by management were the estimates for future sales increases, operating cash flows, the growth rates of terminal values and the weighted average cost of capital (discount rate). The expected financial flows cover a period of four years (2017-2020), and refer to the budget for 2017 and to the “2017-2020 Industrial Plan” which was approved by the Board of Directors on October 19, 2016 and then corrected downwards by one percentage point corresponding to the negative difference between the budget for 2016 and the actual results for the same period. The reasonableness of the margins for the specific forecast period have also been verified through their comparison with the consensus of estimates made by industry sector players operating in the Premium segment. Also considered were the hypothetical cash flows deriving from the disposal of the CGUs at the end of of the specified period (assumed to be equal to the current value of the perpetual income from cash flows generated during the final year of the forecast). The discount rates, defined as the weighted average cost of capital net of taxes, which were applied to the forecast cash flows and to the growth factors used, are shown in the following table: Operating segment Cash Generating Unit
discount rate (WACC)
growth rate ( g )
WACC - g discount rate (WACC)
growth rate ( g )
WACC - g
Consumer Consumer 8.00% - 8.00% 8.45% - 8.45%
2016 2015
Based on the results of the tests performed, there was no evidence of any impairment.
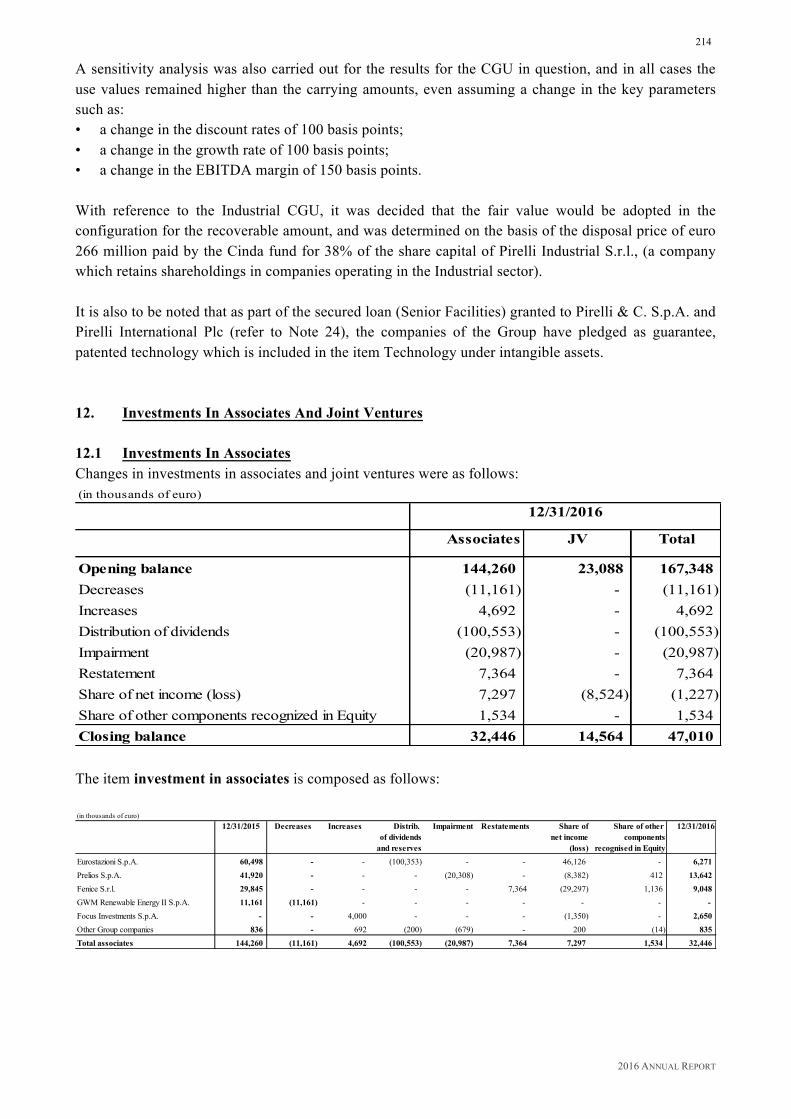
2016 ANNUAL REPORT
214
A sensitivity analysis was also carried out for the results for the CGU in question, and in all cases the use values remained higher than the carrying amounts, even assuming a change in the key parameters such as: • a change in the discount rates of 100 basis points; • a change in the growth rate of 100 basis points; • a change in the EBITDA margin of 150 basis points. With reference to the Industrial CGU, it was decided that the fair value would be adopted in the configuration for the recoverable amount, and was determined on the basis of the disposal price of euro 266 million paid by the Cinda fund for 38% of the share capital of Pirelli Industrial S.r.l., (a company which retains shareholdings in companies operating in the Industrial sector). It is also to be noted that as part of the secured loan (Senior Facilities) granted to Pirelli & C. S.p.A. and Pirelli International Plc (refer to Note 24), the companies of the Group have pledged as guarantee, patented technology which is included in the item Technology under intangible assets. 12. Investments In Associates And Joint Ventures 12.1 Investments In Associates Changes in investments in associates and joint ventures were as follows: (in thousands of euro)
Associates JV Total
Opening balance 144,260 23,088 167,348Decreases (11,161) - (11,161)Increases 4,692 - 4,692Distribution of dividends (100,553) - (100,553)Impairment (20,987) - (20,987)Restatement 7,364 - 7,364Share of net income (loss) 7,297 (8,524) (1,227)Share of other components recognized in Equity 1,534 - 1,534Closing balance 32,446 14,564 47,010
12/31/2016
The item investment in associates is composed as follows: (in thousands of euro)
12/31/2015 Decreases Increases Distrib. Impairment Restatements Share of Share of other 12/31/2016of dividends net income components
and reserves (loss) recognised in EquityEurostazioni S.p.A. 60,498 - - (100,353) - - 46,126 - 6,271Prelios S.p.A. 41,920 - - - (20,308) - (8,382) 412 13,642Fenice S.r.l. 29,845 - - - - 7,364 (29,297) 1,136 9,048GWM Renewable Energy II S.p.A. 11,161 (11,161) - - - - - - - Focus Investments S.p.A. - - 4,000 - - - (1,350) - 2,650Other Group companies 836 - 692 (200) (679) - 200 (14) 835Total associates 144,260 (11,161) 4,692 (100,553) (20,987) 7,364 7,297 1,534 32,446

2016 ANNUAL REPORT
215
With reference to the investment in Fenice S.r.l., in continuation of the previous financial year, even though the percentage of ownership exceeded 50% of the capital (69.88%), the situation did not entail control for Pirelli over the company, due to the provisions of the Shareholders' Agreements. The item decreases refers to the investment in GWM Renewable Energy II S.p.A. In particular, as a result of the completion on March 30, 2016 of the swap operation, Pirelli & C. S.p.A. received in exchange, following their withdrawal from the company GWM Renewable Energy II S.p.A., an amount of shares of the Danish listed company Greentech Energy Systems A/S equal to 11.93% of the share capital. The investment in Greentech Energy Systems A/S (which was subsequently sold) was recorded at an amount equal to its fair value (stock market value at March 30, 2016) under the item “Other financial assets”, and qualified as a financial asset available for sale. The operation generated a negative impact on the Income Statement of euro 1,692 thousand (including the reversal to the Income Statement of the cash flow hedge reserve which was negative to the amount of euro 1,172 thousand) which was recorded under the item "Losses from equity investments". The item increases refers euro 4,000 million for the subscription on January 12, 2016 by Pirelli & C. S.p.A. to 111,111 class C shares of Focus Investments S.p.A. equal to 8.33% of the share capital, to 25% of the capital with voting rights, and to 4.26% of the financial interests, taking into consideration the equity instruments issued by the company and subscribed to by Prelios S.p.A. This company was created as a part of an extraordinary spin off operation for business activities related to investments and co-investments in property belonging to Prelios S.p.A. and activities related to services. The item impairment refers mainly to the investment in Prelios S.p.A. In particular, it was maintained that the significant difference between the carrying amount of the investment, after the application of the equity method, and the stock market value at December 31, 2016 represented evidence of potential impairment. Therefore the value of the investment was adjusted to its fair value equal to the market value at December 31, 2016 (equal to euro 0.092 per share). The item restatement refers to the investment in Fenice S.r.l. and refers to the release to the Income Statement of a part of the impairments effected in previous years as a result of the comparison between the recoverable amount of the investment evaluated using the equity method, and its fair value including the liquidation preference. In order to estimate the fair value, the income approach was used based on the criteria of available options and with the use of level 2 inputs. The pro rata share of net income (positive at euro 7,297 thousand) refers mainly to the investment in Eurostazioni S.p.A. which was positive to the amount of euro 46,126 thousand and mainly attributable to the gains realised from the disposal by the subsidiary, of the investment held in Grandi Stazioni Retail. This positive result was offset by the pro-rata loss for Prelios S.p.A. (euro 8,382 thousand) and for the vehicle Fenice S.r.l. (euro 29,297 thousand) due to the effect of the significant reduction in the stock market value of the investment held in the subsidiary Prelios S.p.A. The Financial Statements of Prelios S.p.A. used in applying the equity method refer to a different closing date than that of December 31, 2016, and include the pro-rata loss for the fourth quarter of 2015 and for the first nine months of 2016.

2016 ANNUAL REPORT
216
12.2 Investments In Joint Ventures
The Group holds an investment of 60% (ownership unchanged from the previous financial year) in PT Evoluzione Tyres, an entity which operates in Indonesia and is active in tyre production. Even though the company is 60% owned, as a result of the contractual agreements between shareholders it falls under the definition of a joint venture since the governance regulations explicitly require unanimous consensus for significant business decisions. The investment was evaluated using the equity method. The share of net income (loss) which was negative to the amount of euro 8,524 thousand refers to the pro rata amount of the loss for the 2016 financial year. 13. Other Financial Assets
These amounted to euro 198,691 thousand compared to euro 225,121 thousand at December 31, 2015 and refer to financial assets available for sale, measured at fair value, with any changes to the fair value recognised in equity. They are composed as follows:
(in thousands of euro)12/31/2016
Opening balance 225,121Translation differences (715)Increases 12,594Decreases (10,761)Impairment (11,067)Fair value adjustments recognised in Equity (16,513)Other 32Closing balance 198,691
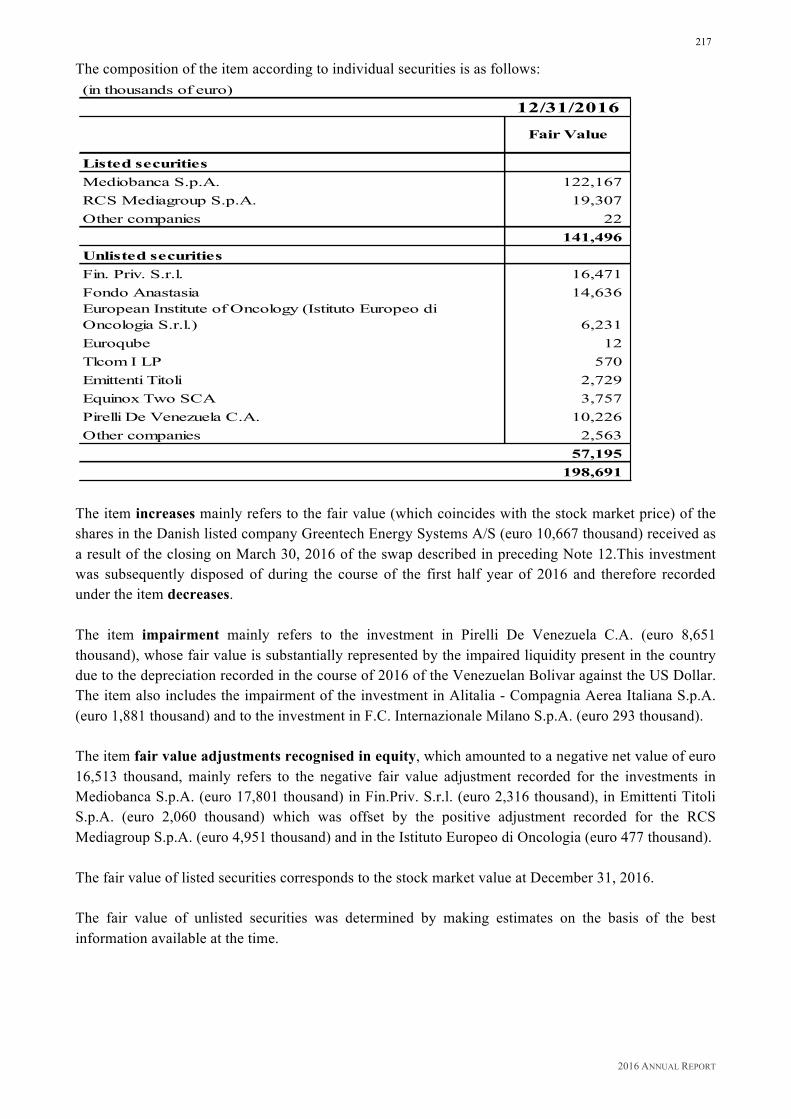
2016 ANNUAL REPORT
217
The composition of the item according to individual securities is as follows:
(in thousands of euro)
Fair Value
Listed securitiesMediobanca S.p.A. 122,167 RCS Mediagroup S.p.A. 19,307 Other companies 22
141,496 Unlisted securitiesFin. Priv. S.r.l. 16,471 Fondo Anastasia 14,636 European Institute of Oncology (Istituto Europeo di Oncologia S.r.l.) 6,231 Euroqube 12 Tlcom I LP 570 Emittenti Titoli 2,729 Equinox Two SCA 3,757 Pirelli De Venezuela C.A. 10,226 Other companies 2,563
57,195 198,691
12/31/2016
The item increases mainly refers to the fair value (which coincides with the stock market price) of the shares in the Danish listed company Greentech Energy Systems A/S (euro 10,667 thousand) received as a result of the closing on March 30, 2016 of the swap described in preceding Note 12.This investment was subsequently disposed of during the course of the first half year of 2016 and therefore recorded under the item decreases. The item impairment mainly refers to the investment in Pirelli De Venezuela C.A. (euro 8,651 thousand), whose fair value is substantially represented by the impaired liquidity present in the country due to the depreciation recorded in the course of 2016 of the Venezuelan Bolivar against the US Dollar. The item also includes the impairment of the investment in Alitalia - Compagnia Aerea Italiana S.p.A. (euro 1,881 thousand) and to the investment in F.C. Internazionale Milano S.p.A. (euro 293 thousand). The item fair value adjustments recognised in equity, which amounted to a negative net value of euro 16,513 thousand, mainly refers to the negative fair value adjustment recorded for the investments in Mediobanca S.p.A. (euro 17,801 thousand) in Fin.Priv. S.r.l. (euro 2,316 thousand), in Emittenti Titoli S.p.A. (euro 2,060 thousand) which was offset by the positive adjustment recorded for the RCS Mediagroup S.p.A. (euro 4,951 thousand) and in the Istituto Europeo di Oncologia (euro 477 thousand). The fair value of listed securities corresponds to the stock market value at December 31, 2016. The fair value of unlisted securities was determined by making estimates on the basis of the best information available at the time.
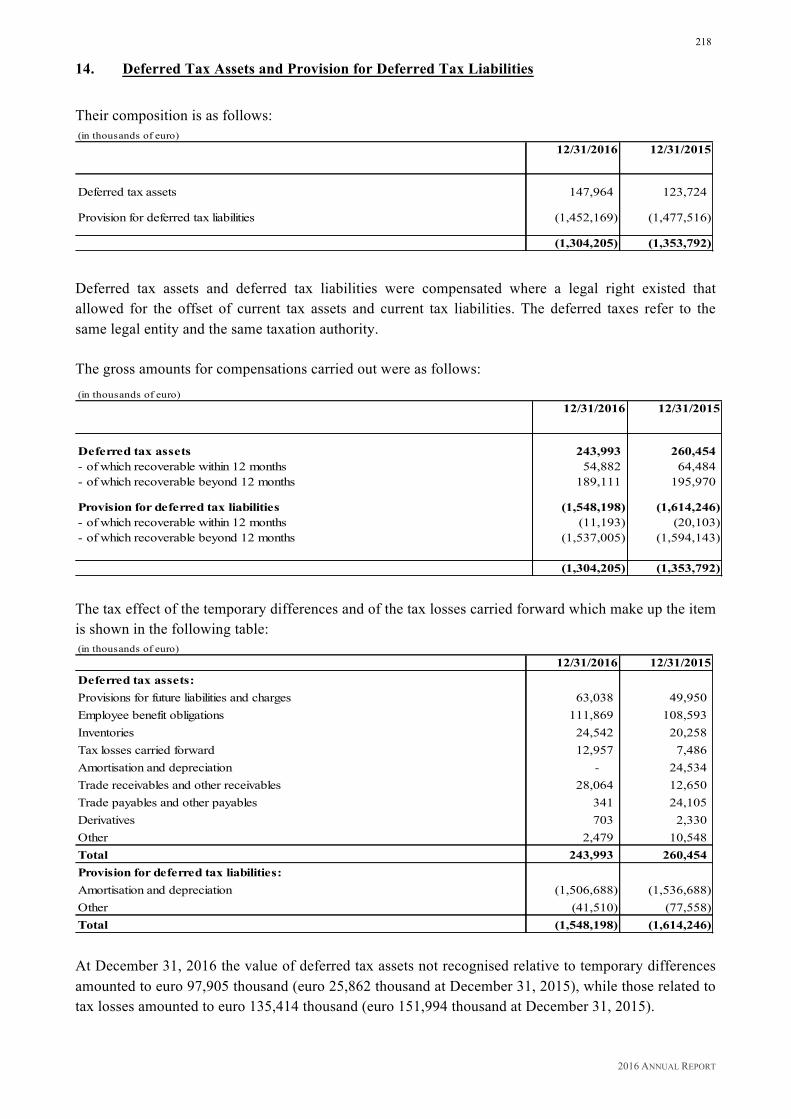
2016 ANNUAL REPORT
218
14. Deferred Tax Assets and Provision for Deferred Tax Liabilities
Their composition is as follows: (in thousands of euro)
12/31/2016 12/31/2015
Deferred tax assets 147,964 123,724
Provision for deferred tax liabilities (1,452,169) (1,477,516)
(1,304,205) (1,353,792)
Deferred tax assets and deferred tax liabilities were compensated where a legal right existed that allowed for the offset of current tax assets and current tax liabilities. The deferred taxes refer to the same legal entity and the same taxation authority. The gross amounts for compensations carried out were as follows: (in thousands of euro)
12/31/2016 12/31/2015
Deferred tax assets 243,993 260,454 - of which recoverable within 12 months 54,882 64,484 - of which recoverable beyond 12 months 189,111 195,970
Provision for deferred tax liabilities (1,548,198) (1,614,246) - of which recoverable within 12 months (11,193) (20,103) - of which recoverable beyond 12 months (1,537,005) (1,594,143)
(1,304,205) (1,353,792) The tax effect of the temporary differences and of the tax losses carried forward which make up the item is shown in the following table: (in thousands of euro)
12/31/2016 12/31/2015Deferred tax assets:Provisions for future liabilities and charges 63,038 49,950 Employee benefit obligations 111,869 108,593 Inventories 24,542 20,258 Tax losses carried forward 12,957 7,486 Amortisation and depreciation - 24,534 Trade receivables and other receivables 28,064 12,650 Trade payables and other payables 341 24,105 Derivatives 703 2,330 Other 2,479 10,548 Total 243,993 260,454 Provision for deferred tax liabilities:Amortisation and depreciation (1,506,688) (1,536,688) Other (41,510) (77,558) Total (1,548,198) (1,614,246) At December 31, 2016 the value of deferred tax assets not recognised relative to temporary differences amounted to euro 97,905 thousand (euro 25,862 thousand at December 31, 2015), while those related to tax losses amounted to euro 135,414 thousand (euro 151,994 thousand at December 31, 2015).

2016 ANNUAL REPORT
219
The value of the tax losses reallocated in accordance to their expiration date, for which deferred tax assets were not recognised, were as follows: (in thousands of euro)Year of maturity 12/31/2016 12/31/2015
2016 3,666 3,651 2017 10,093 10,106 2018 7,696 7,686 2019 3,626 3,631 2020 6,370 6,380 2021 4,354 3,996 2022 6,022 6,025 2023 3,075 1,949 2024 1,818 1,818 2025 5,053 - without maturity date 474,974 539,574
526,747 584,816 Of the total for tax losses with no expiration date, euro 341,968 thousand was incurred by the Parent Company Pirelli & C. S.p.A. while euro 45,309 thousand was attributable to the English subsidiary Pirelli UK Ltd for which sufficient taxable income was not expected in order to justify their recoverability. The tax effect of gains and losses recognised directly in equity was positive for euro 1,840 thousand (negative for euro 14,033 thousand for 2015) and are shown in the Statement of Comprehensive Income. These changes were mainly due to tax effects connected to actuarial gains/losses on employee benefits and to the fair value adjustment of derivatives in cash flow hedges.

2016 ANNUAL REPORT
220
15. Trade Receivables
Trade receivables were analysed as follows: (in thousands of euro)
Total Non-current Current Total Non-current Current
Customers 965,948 - 965,948 942,000 - 942,000Provision for bad debts (286,627) - (286,627) (265,808) - (265,808)
679,321 - 679,321 676,192 - 676,192
12/31/2016 12/31/2015
Of the total trade receivables which amounted to euro 965,948 thousand (euro 942,000 thousand at December 31, 2015) and recorded gross of the provision for bad debts, euro 441,483 thousand had expired (euro 375,798 thousand at December 31, 2015). The expired receivables due from Pirelli de Venezuela C.A. which had been impaired in previous financial years amounted euro 229,304 thousand (euro 220,725 thousand sat December 31, 2015). Receivables which were past due and not yet due were evaluated according to the Group's policy, described in the section on adopted accounting principles. Impaired receivables include both significant single positions subject to individual impairment and positions sharing similar credit risk characteristics that were grouped together and impaired on a collective basis. The changes in the provision for bad debts were as follows: (in thousands of euro)
12/31/2016 12/31/2015
Opening balance 265,808 265,431Translation differences 11,060 (2,108) Accruals 18,173 14,181 Decreases (8,474) (11,904) Other 60 208 Closing balance 286,627 265,808 Accruals to the provision for bad debts were recognised in the Income Statement as “Other” (refer to Note 34). The carrying amount for trade receivables is considered to approximate their fair value. It is also to be noted that as part of the secured loan (Senior Facilities) granted to Pirelli & C. S.p.A. and Pirelli International Plc (refer to Note 24), the companies of the Group have pledged as guarantee, trade receivables from third parties for an equivalent value of euro 260,101 thousand.
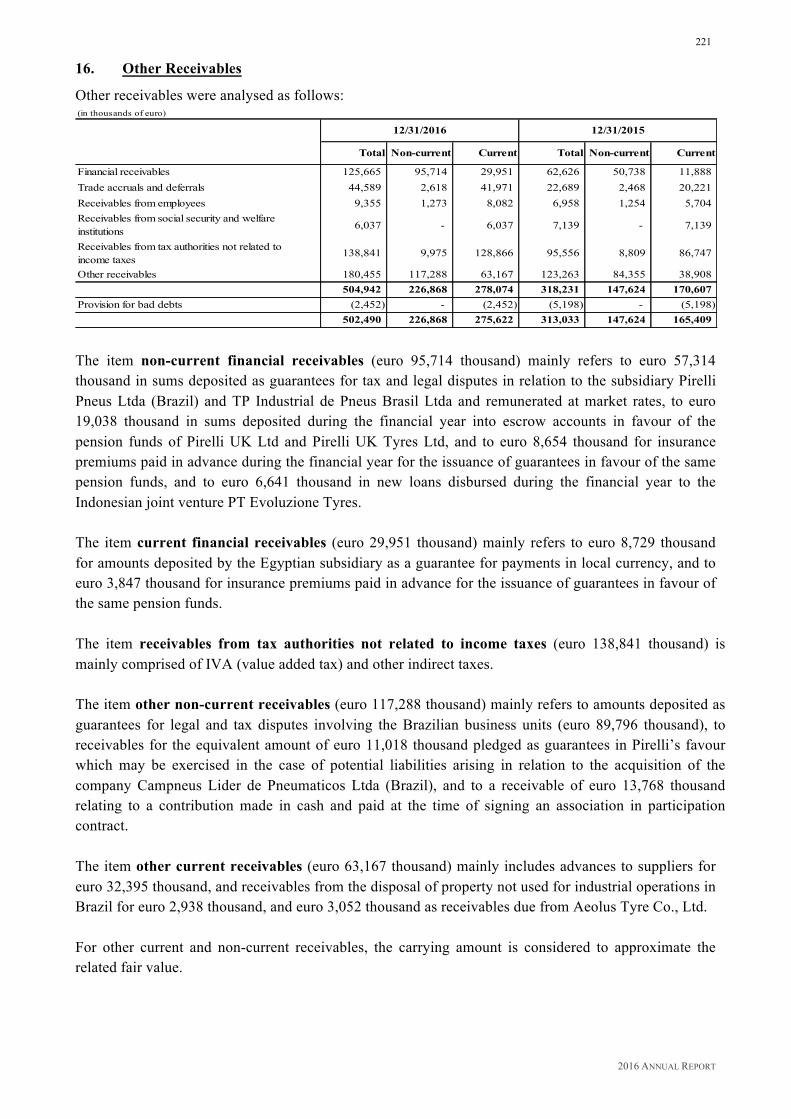
2016 ANNUAL REPORT
221
16. Other Receivables
Other receivables were analysed as follows: (in thousands of euro)
Total Non-current Current Total Non-current Current
Financial receivables 125,665 95,714 29,951 62,626 50,738 11,888Trade accruals and deferrals 44,589 2,618 41,971 22,689 2,468 20,221Receivables from employees 9,355 1,273 8,082 6,958 1,254 5,704Receivables from social security and welfare institutions 6,037 - 6,037 7,139 - 7,139
Receivables from tax authorities not related to income taxes
138,841 9,975 128,866 95,556 8,809 86,747
Other receivables 180,455 117,288 63,167 123,263 84,355 38,908504,942 226,868 278,074 318,231 147,624 170,607
Provision for bad debts (2,452) - (2,452) (5,198) - (5,198)502,490 226,868 275,622 313,033 147,624 165,409
12/31/2016 12/31/2015
The item non-current financial receivables (euro 95,714 thousand) mainly refers to euro 57,314 thousand in sums deposited as guarantees for tax and legal disputes in relation to the subsidiary Pirelli Pneus Ltda (Brazil) and TP Industrial de Pneus Brasil Ltda and remunerated at market rates, to euro 19,038 thousand in sums deposited during the financial year into escrow accounts in favour of the pension funds of Pirelli UK Ltd and Pirelli UK Tyres Ltd, and to euro 8,654 thousand for insurance premiums paid in advance during the financial year for the issuance of guarantees in favour of the same pension funds, and to euro 6,641 thousand in new loans disbursed during the financial year to the Indonesian joint venture PT Evoluzione Tyres. The item current financial receivables (euro 29,951 thousand) mainly refers to euro 8,729 thousand for amounts deposited by the Egyptian subsidiary as a guarantee for payments in local currency, and to euro 3,847 thousand for insurance premiums paid in advance for the issuance of guarantees in favour of the same pension funds. The item receivables from tax authorities not related to income taxes (euro 138,841 thousand) is mainly comprised of IVA (value added tax) and other indirect taxes. The item other non-current receivables (euro 117,288 thousand) mainly refers to amounts deposited as guarantees for legal and tax disputes involving the Brazilian business units (euro 89,796 thousand), to receivables for the equivalent amount of euro 11,018 thousand pledged as guarantees in Pirelli’s favour which may be exercised in the case of potential liabilities arising in relation to the acquisition of the company Campneus Lider de Pneumaticos Ltda (Brazil), and to a receivable of euro 13,768 thousand relating to a contribution made in cash and paid at the time of signing an association in participation contract. The item other current receivables (euro 63,167 thousand) mainly includes advances to suppliers for euro 32,395 thousand, and receivables from the disposal of property not used for industrial operations in Brazil for euro 2,938 thousand, and euro 3,052 thousand as receivables due from Aeolus Tyre Co., Ltd. For other current and non-current receivables, the carrying amount is considered to approximate the related fair value.
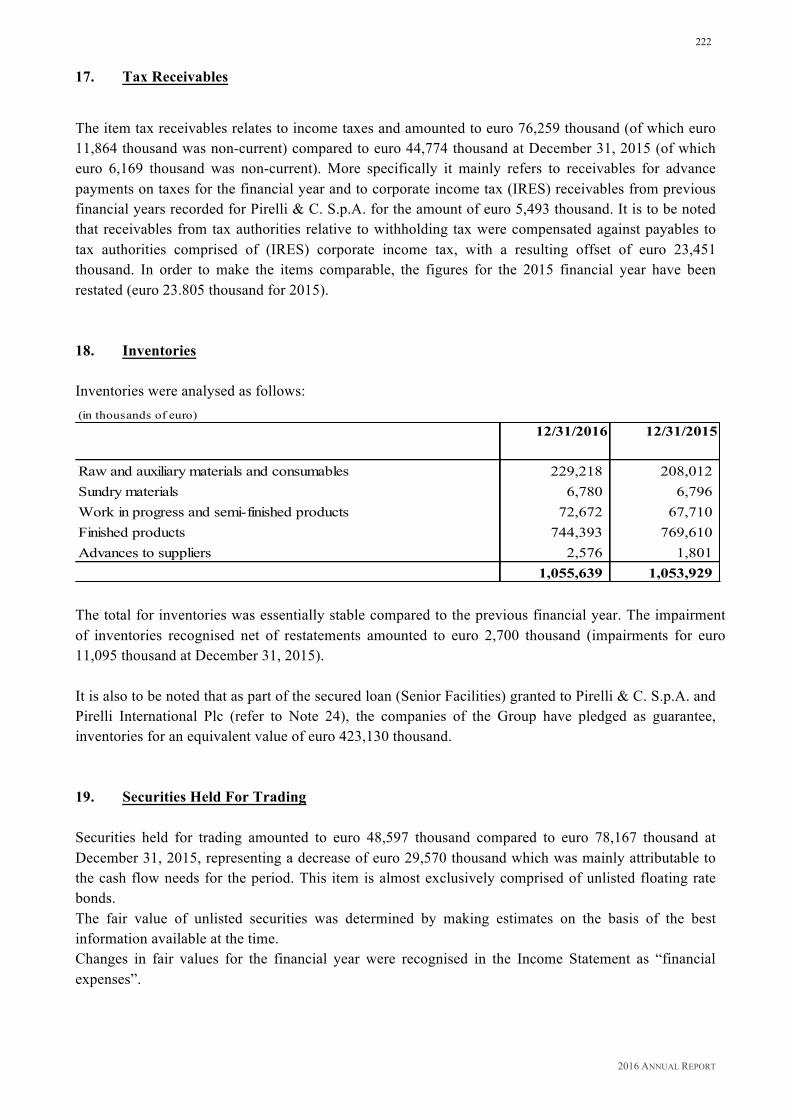
2016 ANNUAL REPORT
222
17. Tax Receivables
The item tax receivables relates to income taxes and amounted to euro 76,259 thousand (of which euro 11,864 thousand was non-current) compared to euro 44,774 thousand at December 31, 2015 (of which euro 6,169 thousand was non-current). More specifically it mainly refers to receivables for advance payments on taxes for the financial year and to corporate income tax (IRES) receivables from previous financial years recorded for Pirelli & C. S.p.A. for the amount of euro 5,493 thousand. It is to be noted that receivables from tax authorities relative to withholding tax were compensated against payables to tax authorities comprised of (IRES) corporate income tax, with a resulting offset of euro 23,451 thousand. In order to make the items comparable, the figures for the 2015 financial year have been restated (euro 23.805 thousand for 2015). 18. Inventories Inventories were analysed as follows: (in thousands of euro)
12/31/2016 12/31/2015
Raw and auxiliary materials and consumables 229,218 208,012Sundry materials 6,780 6,796Work in progress and semi-finished products 72,672 67,710Finished products 744,393 769,610Advances to suppliers 2,576 1,801
1,055,639 1,053,929 The total for inventories was essentially stable compared to the previous financial year. The impairment of inventories recognised net of restatements amounted to euro 2,700 thousand (impairments for euro 11,095 thousand at December 31, 2015). It is also to be noted that as part of the secured loan (Senior Facilities) granted to Pirelli & C. S.p.A. and Pirelli International Plc (refer to Note 24), the companies of the Group have pledged as guarantee, inventories for an equivalent value of euro 423,130 thousand. 19. Securities Held For Trading Securities held for trading amounted to euro 48,597 thousand compared to euro 78,167 thousand at December 31, 2015, representing a decrease of euro 29,570 thousand which was mainly attributable to the cash flow needs for the period. This item is almost exclusively comprised of unlisted floating rate bonds. The fair value of unlisted securities was determined by making estimates on the basis of the best information available at the time. Changes in fair values for the financial year were recognised in the Income Statement as “financial expenses”.
2016 ANNUAL REPORT
223
20. Cash and Cash Equivalents Cash and cash equivalents went from euro 1,110,024 thousand at December 31, 2015 to euro 1,532,977 thousand at December 31, 2016. These were concentrated in the finance companies of the Group and in companies that generate cash and use it locally. These were essentially invested on the short-term maturity deposits market through leading banking counter-parties at interest rates consistent with the prevailing market conditions. In the Statement of Cash Flows, the balance of cash and cash equivalents has been stated net of negative current bank accounts and amounted to euro 9,049 thousand at December 31, 2016. It is also to be noted that as part of the secured loan (Senior Facilities) granted to Pirelli & C. S.p.A. and Pirelli International Plc (refer to Note 24), the companies of the Group have pledged as guarantee, current bank accounts for an equivalent value of euro 851,361 thousand. 21. Equity
21.1 Attributable to the owners of Parent Company The equity attributable to the Parent Company went from euro 3,209,595 thousand at December 31, 2015 to euro 3,134,085 thousand at December 31, 2016. The decrease was mainly due to translation differences from foreign Financial Statements (negative at euro 142,965 thousand of which euro 98,716 thousand euro was related to exchange rate differences matured on intercompany receivables, due from the Egyptian subsidiaries, designated as net investments in foreign operations – refer to Note 7 for further details), to actuarial losses on pension funds excluding the related tax effect (negative for euro 46,567 thousand), and to the fair value adjustment of investments available for sale (negative for euro 16,513 thousand) offset by the net income for the financial year (positive at euro 135,063 thousand). Furthermore, the Group's equity decreased due to the effect of the acquisition of treasury shares pursuant to the withdrawal exercised by some shareholders due to the reverse merger of Marco Polo Industrial Holding S.p.A. into Pirelli & C. S.p.A. (euro 6,894 thousand), as well as to the effect of the subsequent redemption carried out by the Company on the remaining outstanding shares (euro 5,449 thousand). Other descreases to the Group’s equity were attributable to the disposal of 10% of the share capital of Pirelli Industrial S.r.l. (euro 10,380 thousand, equal to the difference between the cash proceed and the carrying amount of the disposed net asset) as well as to the acquisition of 80% of the company Jiaozuo Aeolus Tyre Co., Ltd. which, configured as a Business Combination under common control was recorded using the same values recorded in the Financial Statements of the acquired company, with the difference detected between the amount paid and the net value of the assets acquired being recognised in equity (euro 1,150 thousand). The subscribed and paid-up share capital at December 31, 2016 (including treasury shares held) is represented by 201,983,902 ordinary shares and 5,641,312 special shares, without nominal value, for a total value of euro 1,345,381 thousand. The share capital is represented net of the value of treasury shares held (351,590 ordinary shares and 772,792 special shares) and therefore amounts to euro 1,342,281 thousand.

2016 ANNUAL REPORT
224
The increase in share capital from euro 10,196 thousand to euro 1,342,281 was connected to the effects of the reverse merger with the holding company Marco Polo Industrial Holding S.p.A., which led to an alignment of the share capital of the surviving entity Pirelli & C. S.p.A. with that of the holding company, with the consequent reduction of the premium share reserve. 21.2 Attributable to Non-Controlling Interests The equity attributable to non-controlling interests went from euro 72,041 thousand at December 31, 2015 to euro 140,733 thousand at December 31, 2016. The change was mainly due to the disposal of the 10% of the investment in Pirelli Industrial S.r.l. (euro 81,129 thousand), to 20% of the investment in Jiaozuo Aeolus Tyre Co., Ltd. (euro 16,462 thousand) owned by Aeolus Tyre Co., Ltd, to translation differences (negative at euro 34,804 thousand) and to the results for the financial year (positive at euro 12,562 thousand)
22. Provisions for Liabilities and Charges
The changes that occurred during the financial year are shown below:
PROVISION FOR LIABILITIES AND CHARGES - NON-CURRENT PORTION (in thousands of euro)12/31/2016
Opening balance 144,506Translation differences 15,048Increases 21,083Uses (9,422)Reversals (12,759)Other 12,536Closing balance at 12/31/2016 170,992 The non-current portion mainly refers to provisions made by the subsidiaries Pirelli Pneus Ltda and TP Industrial de Pneus Brasil Ltda based in Brazil for tax and legal disputes (euro 45,428 thousand) and for labour lawsuits (euro 29,774 thousand), and to provisions made by the parent company Pirelli & C. S.p.A. for tax disputes (euro 4,871 thousand), for commercial risks, site remediation and labour disputes (euro 6,066 thousand), and for occupational diseases litigation (euro 7,887 thousand), to provisions made by Pirelli Tyre S.p.A for tax risks (euro 4,711 thousand), and for potential liabilities (whose outlay was not considered likely) which were indentified during the Purchase Price Allocation pursuant to paragraph 23 of the IFRS 3 to the amount of euro 33,500 thousand, attributable to the European Commission decision made at the conclusion of the antitrust investigation regarding the energy cable business, which foresaw sanctions against Prysmian of approximately euro 104 million, of which a part totalling euro 67 million, Pirelli, despite having been found as not involved in the alleged cartel, was held as being jointly liable with Prysmian, based solely on the application of the principle of so-called parental liability, in that during part of the period of the alleged infringement, Prysmian was a subsidiary of Pirelli. The item increases mainly refers to provisions for the labour disputes of the subsidiaries Pirelli Pneus Ltda and TP Industrial de Pneus Brasil Ltda (Brazil), and provisions for tax disputes.
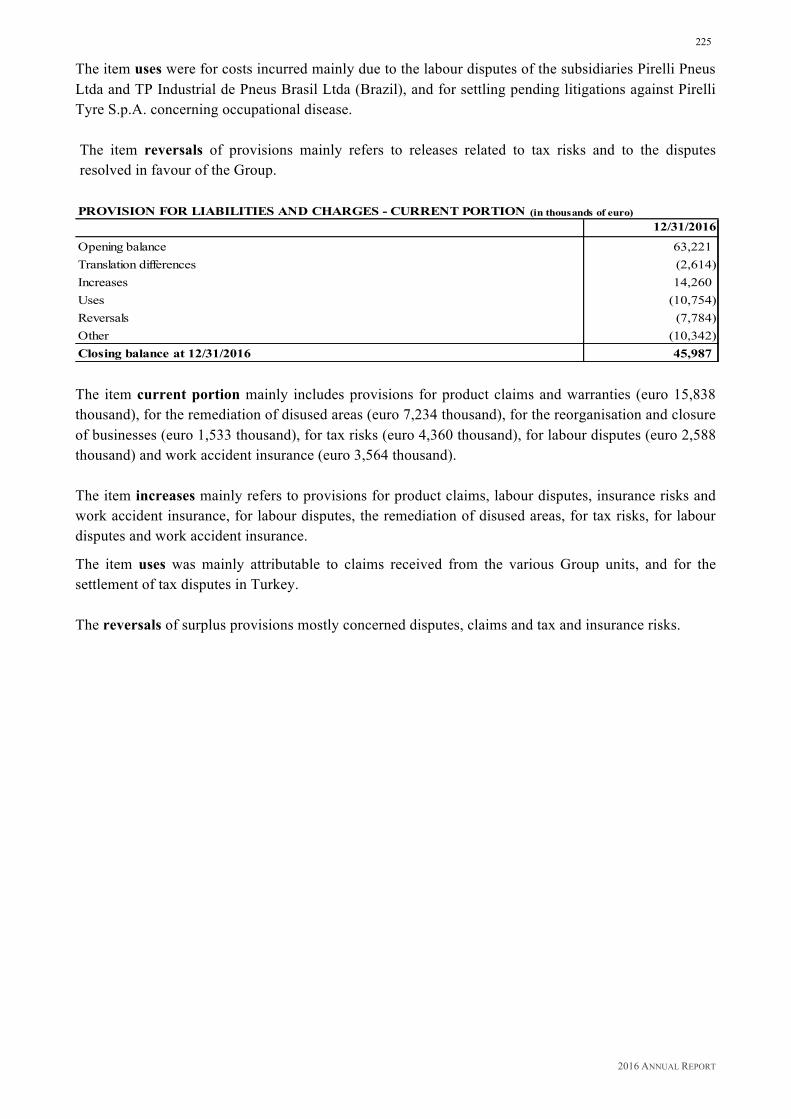
2016 ANNUAL REPORT
225
The item uses were for costs incurred mainly due to the labour disputes of the subsidiaries Pirelli Pneus Ltda and TP Industrial de Pneus Brasil Ltda (Brazil), and for settling pending litigations against Pirelli Tyre S.p.A. concerning occupational disease. The item reversals of provisions mainly refers to releases related to tax risks and to the disputes resolved in favour of the Group.
PROVISION FOR LIABILITIES AND CHARGES - CURRENT PORTION (in thousands of euro)
12/31/2016
Opening balance 63,221Translation differences (2,614)Increases 14,260Uses (10,754)Reversals (7,784)Other (10,342)Closing balance at 12/31/2016 45,987 The item current portion mainly includes provisions for product claims and warranties (euro 15,838 thousand), for the remediation of disused areas (euro 7,234 thousand), for the reorganisation and closure of businesses (euro 1,533 thousand), for tax risks (euro 4,360 thousand), for labour disputes (euro 2,588 thousand) and work accident insurance (euro 3,564 thousand). The item increases mainly refers to provisions for product claims, labour disputes, insurance risks and work accident insurance, for labour disputes, the remediation of disused areas, for tax risks, for labour disputes and work accident insurance.
The item uses was mainly attributable to claims received from the various Group units, and for the settlement of tax disputes in Turkey. The reversals of surplus provisions mostly concerned disputes, claims and tax and insurance risks.
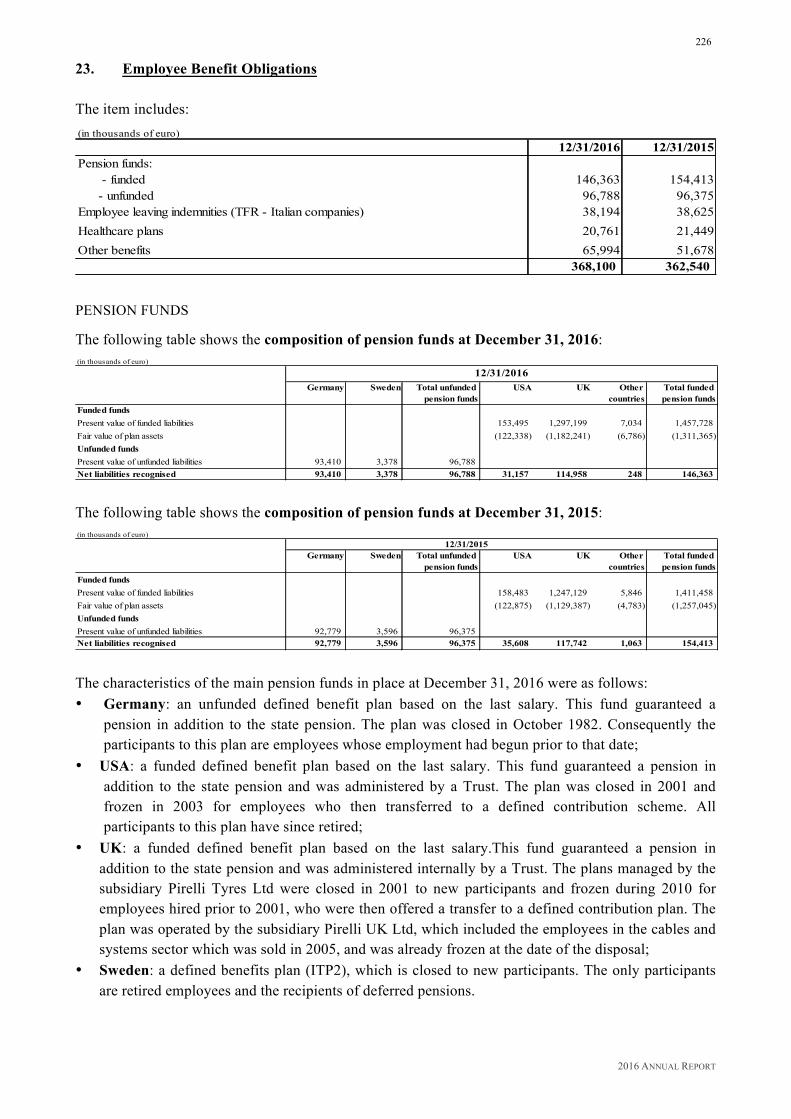
2016 ANNUAL REPORT
226
23. Employee Benefit Obligations The item includes: (in thousands of euro)
12/31/2016 12/31/2015Pension funds: - funded 146,363 154,413 - unfunded 96,788 96,375Employee leaving indemnities (TFR - Italian companies) 38,194 38,625Healthcare plans 20,761 21,449Other benefits 65,994 51,678
368,100 362,540 PENSION FUNDS The following table shows the composition of pension funds at December 31, 2016: (in thousands of euro)
Germany Sweden Total unfunded pension funds
USA UK Other countries
Total funded pension funds
Funded fundsPresent value of funded liabilities 153,495 1,297,199 7,034 1,457,728Fair value of plan assets (122,338) (1,182,241) (6,786) (1,311,365)Unfunded fundsPresent value of unfunded liabilities 93,410 3,378 96,788 - - - - Net liabilities recognised 93,410 3,378 96,788 31,157 114,958 248 146,363
12/31/2016
The following table shows the composition of pension funds at December 31, 2015: (in thousands of euro)
Germany Sweden Total unfunded pension funds
USA UK Other countries
Total funded pension funds
Funded fundsPresent value of funded liabilities 158,483 1,247,129 5,846 1,411,458Fair value of plan assets (122,875) (1,129,387) (4,783) (1,257,045)Unfunded fundsPresent value of unfunded liabilities 92,779 3,596 96,375Net liabilities recognised 92,779 3,596 96,375 35,608 117,742 1,063 154,413
12/31/2015
The characteristics of the main pension funds in place at December 31, 2016 were as follows: • Germany: an unfunded defined benefit plan based on the last salary. This fund guaranteed a
pension in addition to the state pension. The plan was closed in October 1982. Consequently the participants to this plan are employees whose employment had begun prior to that date;
• USA: a funded defined benefit plan based on the last salary. This fund guaranteed a pension in addition to the state pension and was administered by a Trust. The plan was closed in 2001 and frozen in 2003 for employees who then transferred to a defined contribution scheme. All participants to this plan have since retired;
• UK: a funded defined benefit plan based on the last salary.This fund guaranteed a pension in addition to the state pension and was administered internally by a Trust. The plans managed by the subsidiary Pirelli Tyres Ltd were closed in 2001 to new participants and frozen during 2010 for employees hired prior to 2001, who were then offered a transfer to a defined contribution plan. The plan was operated by the subsidiary Pirelli UK Ltd, which included the employees in the cables and systems sector which was sold in 2005, and was already frozen at the date of the disposal;
• Sweden: a defined benefits plan (ITP2), which is closed to new participants. The only participants are retired employees and the recipients of deferred pensions.

2016 ANNUAL REPORT
227
Changes for the 2016 financial year in the net liabilities of defined benefits (refers to funded and non-funded pension funds) were as follows: (in thousand of euro)
Present value of gross liabilities
Fair value of plan assets
Total net liabilities
Opening balance at January 1, 2016 1,507,833 (1,257,045) 250,788Translation difference (183,676) 167,003 (16,673)Movements through income statement:- current service cost 989 - 989- interest expense / (income) 50,661 (43,766) 6,895
51,650 (43,766) 7,884Remeasurements recognized in equity:- actuarial (gains) / losses from change in demographic assumptions 1,816 - 1,816- actuarial (gains) / losses from change in financial assumptions 272,810 - 272,810- experience adjustment (gains) losses (22,656) - (22,656)- return on plan assets, net of interest income - (205,275) (205,275)
251,970 (205,275) 46,695
Employer contributions - (41,035) (41,035)Employee contributions 24 (24) - Benefits paid (72,838) 66,766 (6,072)Settlements - - - Other (447) 2,011 1,564
Closing balance at December 31, 2016 1,554,516 (1,311,365) 243,151 Changes for the 2015 financial year in the net liabilities of defined benefits (refers to funded and non-funded pension funds) were as follows: (in thousand of euro)
Present value of gross liabilities
Fair value of plan assets
Total net liabilities
Opening balance at January 1, 2015 1,477,209 (1,166,127) 311,082Translation difference 92,124 (77,050) 15,074Movements through income statement:- current service cost 1,093 - 1,093- interest expense / (income) 54,996 (45,993) 9,003
56,089 (45,993) 10,096Remeasurements recognized in equity:- actuarial (gains) / losses from change in demographic assumptions 3,964 - 3,964- actuarial (gains) / losses from change in financial assumptions (38,623) - (38,623)- experience adjustment (gains) losses (4,807) - (4,807)- return on plan assets, net of interest income - 5,576 5,576
(39,466) 5,576 (33,890)
Employer's contributions - (51,992) (51,992)Employee contributions 24 (24) - Benefits paid (77,120) 77,120 - Settlements (342) - (342)Other (684) 1,446 760
Closing balance at December 31, 2015 1,507,833 (1,257,045) 250,788 The cost of this service is included in the item "Personnel expenses" (refer to Note 32). Net interests payable are included in "Financial expenses" (refer to Note 37).
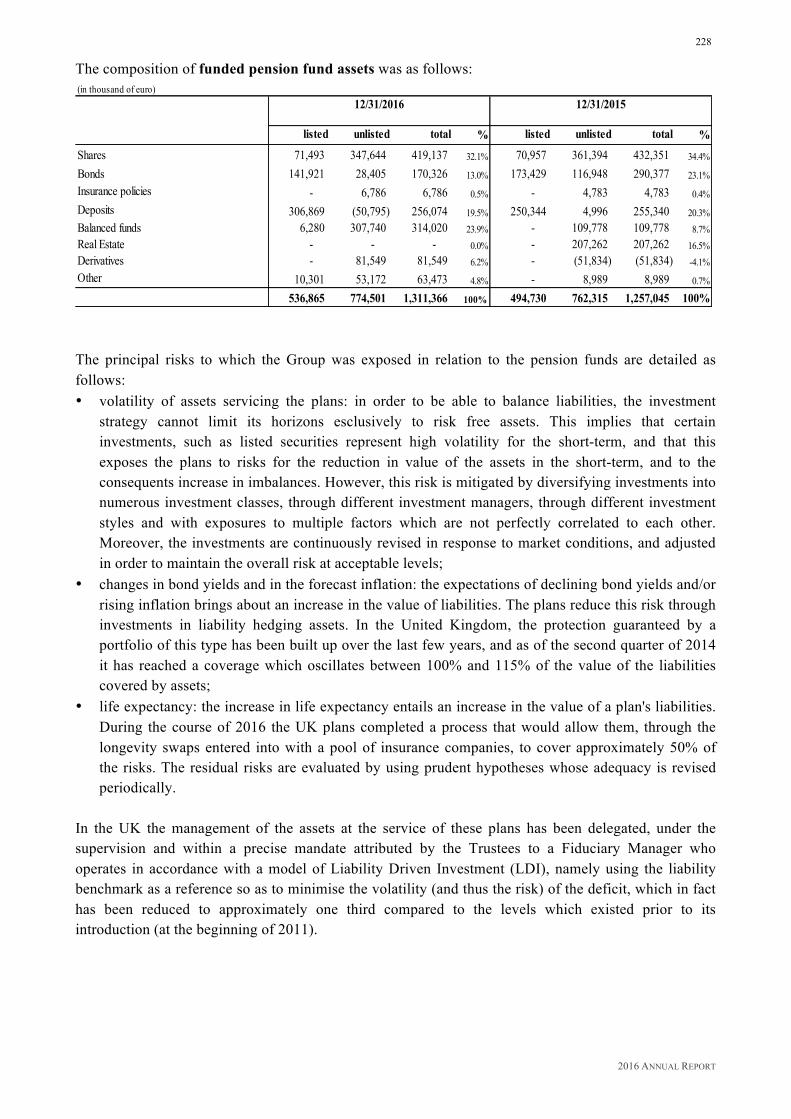
2016 ANNUAL REPORT
228
The composition of funded pension fund assets was as follows: (in thousand of euro)
listed unlisted total % listed unlisted total %Shares 71,493 347,644 419,137 32.1% 70,957 361,394 432,351 34.4%
Bonds 141,921 28,405 170,326 13.0% 173,429 116,948 290,377 23.1%Insurance policies - 6,786 6,786 0.5% - 4,783 4,783 0.4%Deposits 306,869 (50,795) 256,074 19.5% 250,344 4,996 255,340 20.3%Balanced funds 6,280 307,740 314,020 23.9% - 109,778 109,778 8.7%Real Estate - - - 0.0% - 207,262 207,262 16.5%Derivatives - 81,549 81,549 6.2% - (51,834) (51,834) -4.1%Other 10,301 53,172 63,473 4.8% - 8,989 8,989 0.7%
536,865 774,501 1,311,366 100% 494,730 762,315 1,257,045 100%
12/31/201512/31/2016
The principal risks to which the Group was exposed in relation to the pension funds are detailed as follows: • volatility of assets servicing the plans: in order to be able to balance liabilities, the investment
strategy cannot limit its horizons esclusively to risk free assets. This implies that certain investments, such as listed securities represent high volatility for the short-term, and that this exposes the plans to risks for the reduction in value of the assets in the short-term, and to the consequents increase in imbalances. However, this risk is mitigated by diversifying investments into numerous investment classes, through different investment managers, through different investment styles and with exposures to multiple factors which are not perfectly correlated to each other. Moreover, the investments are continuously revised in response to market conditions, and adjusted in order to maintain the overall risk at acceptable levels;
• changes in bond yields and in the forecast inflation: the expectations of declining bond yields and/or rising inflation brings about an increase in the value of liabilities. The plans reduce this risk through investments in liability hedging assets. In the United Kingdom, the protection guaranteed by a portfolio of this type has been built up over the last few years, and as of the second quarter of 2014 it has reached a coverage which oscillates between 100% and 115% of the value of the liabilities covered by assets;
• life expectancy: the increase in life expectancy entails an increase in the value of a plan's liabilities. During the course of 2016 the UK plans completed a process that would allow them, through the longevity swaps entered into with a pool of insurance companies, to cover approximately 50% of the risks. The residual risks are evaluated by using prudent hypotheses whose adequacy is revised periodically.
In the UK the management of the assets at the service of these plans has been delegated, under the supervision and within a precise mandate attributed by the Trustees to a Fiduciary Manager who operates in accordance with a model of Liability Driven Investment (LDI), namely using the liability benchmark as a reference so as to minimise the volatility (and thus the risk) of the deficit, which in fact has been reduced to approximately one third compared to the levels which existed prior to its introduction (at the beginning of 2011).
2016 ANNUAL REPORT
229
The key parameters of this mandate were as follows: • a mix of assets subjected to dynamic management over time, rather than a fixed allocation strategy; • a hedge which covers approximately 100% - 115% of the risk associated with interest rates and
inflation - where the percentage represents the value of assets - through the use of debt instruments such as government bonds and derivatives;
• the management of exchange rate risk which aims at covering at least 70% of the exposure to foreign currencies held in the portfolio through the use of forward contracts.
Furthermore, during 2016, following the increase in financial leverage resulting from the merger of Pirelli & C. S.p.A. with Marco Polo Industrial Holding S.p.A. and of the impact deriving from the covenants of the Group, an agreement (the Pension Framework Agreement) was entered into from within the refinancing process with the UK pension funds, through which, a package of measures (entered into with a pool of insurance companies, the so called Credit Support Guarantees, comprising of limited payments by way of restricted deposits into escrow accounts, the recognition of a portion of pension liablities on a pari passu status with the lenders, and the definition of an accelerated contributions plan limited to a period of extraordinary leverage) was put in place to guarantee the "synthetic" restoration of these covenants to levels which existed prior to the acquisition of the Pirelli Group by Marco Polo Industrial Holding S.p.A., for the purposes of continuing the work of the gradual settlement of the relative deficits previously imposed. Lastly a series of exercises were initiated, defined as Liability Management Exercises, as a further measure to reduce the risks for the Group in exchange for incentives and greater flexibility. In the United Kingdom, the funding arrangements and funding policies are revised every three years. The next funding evaluation is expected in 2017. In the United States funding evaluations are carried out on an annual basis. The contributions which are expected to be paid into the unfunded pension funds during the 2017 financial year amounts to euro 6,268 thousand, while for funded pension funds the amount expected is euro 44,283 thousand. EMPLOYEES’ LEAVING INDEMNITIES (TFR) Changes for the financial year for employees’ leaving indemnities provision were as follows: (in thousands of euro)
12/31/2016 12/31/2015
Opening balance 38,625 42,451 Movements through income statement:- current service cost 629 207 - interest expense 814 737 Remeasurements recognized in equity:- actuarial (gains) losses arising from changes in financial assumptions 1,974 (1,932) Indemnities/advanced payments (3,587) (2,053) Other (261) (785)
Closing balance 38,194 38,625 The current cost for services rendered by employees is included in the item “Personnel expenses” (refer to Note 32) while interest payables are included in the item “Financial expenses” (refer to Note 37).
2016 ANNUAL REPORT
230
HEALTHCARE PLANS This item refers exclusively to the healthcare plan in place in the United States. (in thousands of euro)
USA
Liabilities recognised in the Financial Statements at 12/31/2016 20,761Liabilities recognised in the Financial Statements at 12/31/2015 21,449
The following changes occurred during the period: (in thousands of euro)
12/31/2016 12/31/2015
Opening balance 21,449 22,337Translation differences 638 2,508Movements through income statement:- current service cost 4 5- interest expense 792 821Remeasurements recognized in equity:- actuarial (gains) losses arising from changes in financial assumptions 266 (632)- actuarial (gains) losses arising from changes in demographic assumptions 132 (392)- experience adjustment (gains) losses (1,350) (1,970)Benefits paid (1,170) (1,228)
Closing balance 20,761 21,449 The cost for the service is included in the item "Personnel expenses" (refer to Note 32), and net interests payable is included in "Financial expenses" (refer to Note 37). Contributions which are expected to be paid into the healthcare plan during the 2017 financial year amount to euro 1,597 thousand.
2016 ANNUAL REPORT
231
ADDITIONAL INFORMATION REGARDING POST-EMPLOYMENT BENEFITS Net actuarial losses accrued during the 2016 financial year and recognised directly in equity amounted to euro 46,567 thousand. The main actuarial assumptions used at December 31, 2016 were as follows:
Italy Germany Netherlands Sweden UK USA
Discount rate 1.50% 1.50% 1.50% 2.15% 2.70% 3.90%Inflation rate 1.00% 1.50% 1.50% 1.50% 3.18% N/A The main actuarial assumptions used at December 31, 2015 were as follows:
Italy Germany Netherlands Sweden UK USA
Discount rate 2.10% 2.10% 2.10% 2.75% 3.90% 4.05%Inflation rate 1.25% 1.75% 1.75% 1.50% 3.05% N/AExpected rate of wage and salary increases - 3.00% 2.00% - - N/AHealthcare cost trend rates - initial - - - - - 8.00%Healthcare cost trend rates - final - - - - - 4.50% The following table presents an analysis of the payment deadlines regarding post-employment benefits: (in thousands of euro)
within 1 year 1 to 2 years 3 to 5 years over 5 years Total
Pension funds 66,640 68,911 211,147 367,659 714,358
Employees' leaving indemnities (TFR) 1,783 2,090 7,233 12,585 23,691
Healthcare plan 1,597 1,573 4,643 7,236 15,050
70,019 72,575 223,024 387,480 753,097 The weighted average term for bonds for post-employment benefits is equal to 16.17 years (15.36 years at December 31, 2015).
2016 ANNUAL REPORT
232
The sensitivity analysis for the relevant actuarial assumptions at the end of the 2016 financial year was as follows: (in %)
Change in assumptions
Discount rate 0.25% decrease of 6.53% increase of 4.17%Inflation rate (only UK plans) 0.25% increase of 3.47% decrease of 2.77%
Impact on post employment benefits Increase in assumptions Decrease in assumptions
At the end of the 2015 financial year the situation was as follows: (in %)
Change in assumptions
Discount rate 0.25% decrease of 3.61% increase of 3.83%Inflation rate (only UK plans) 0.25% increase of 3.15% decrease of 2.63%
Impact on post employment benefits Increase in assumptions Decrease in assumptions
The sole purpose of the analysis outlined above was to estimate the changes in liability in relation to changes in the discount rates and inflation rates in the UK in comparison to the central hypothesis for the same rates, rather than comparing them to an alternative set of hypotheses. The sensitivity analysis on the liabilities related to post-employment benefits is based on the same methodology used to calculate the liability recognised in the Financial Statements. OTHER LONG-TERM BENEFITS The composition of other benefits is as follows: (in thousands of euro)
12/31/2016 12/31/2015Long-term incentive plans 15,072 -
Jubilee awards 18,303 17,348Leaving indemnities - non Italian companies 25,778 26,881Other long-term benefits 6,841 7,449
65,994 51,678 The item Long-Term Incentive plans is directly attributable to the amount allocated in 2016 for the new Long-Term Incentive Plan intended for the Management sector of the Pirelli Group.
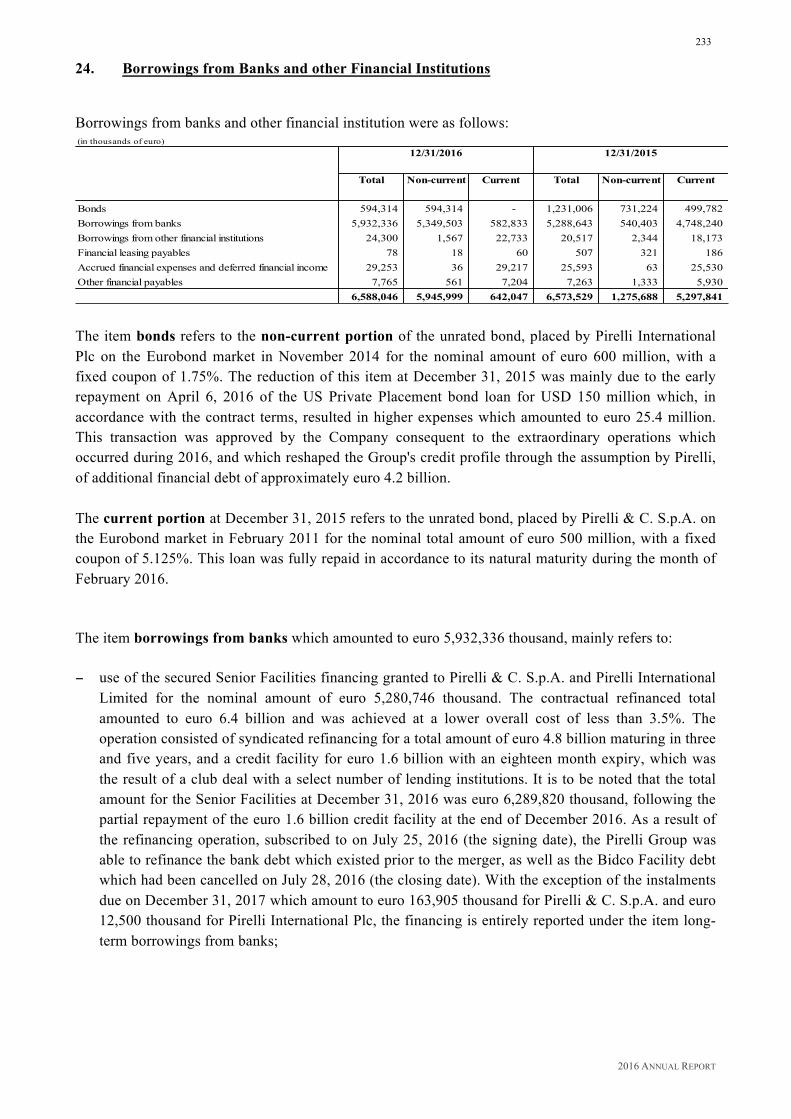
2016 ANNUAL REPORT
233
24. Borrowings from Banks and other Financial Institutions
Borrowings from banks and other financial institution were as follows: (in thousands of euro)
Total Non-current Current Total Non-current Current
Bonds 594,314 594,314 - 1,231,006 731,224 499,782Borrowings from banks 5,932,336 5,349,503 582,833 5,288,643 540,403 4,748,240Borrowings from other financial institutions 24,300 1,567 22,733 20,517 2,344 18,173Financial leasing payables 78 18 60 507 321 186Accrued financial expenses and deferred financial income 29,253 36 29,217 25,593 63 25,530Other financial payables 7,765 561 7,204 7,263 1,333 5,930
6,588,046 5,945,999 642,047 6,573,529 1,275,688 5,297,841
12/31/2016 12/31/2015
The item bonds refers to the non-current portion of the unrated bond, placed by Pirelli International Plc on the Eurobond market in November 2014 for the nominal amount of euro 600 million, with a fixed coupon of 1.75%. The reduction of this item at December 31, 2015 was mainly due to the early repayment on April 6, 2016 of the US Private Placement bond loan for USD 150 million which, in accordance with the contract terms, resulted in higher expenses which amounted to euro 25.4 million. This transaction was approved by the Company consequent to the extraordinary operations which occurred during 2016, and which reshaped the Group's credit profile through the assumption by Pirelli, of additional financial debt of approximately euro 4.2 billion. The current portion at December 31, 2015 refers to the unrated bond, placed by Pirelli & C. S.p.A. on the Eurobond market in February 2011 for the nominal total amount of euro 500 million, with a fixed coupon of 5.125%. This loan was fully repaid in accordance to its natural maturity during the month of February 2016.
The item borrowings from banks which amounted to euro 5,932,336 thousand, mainly refers to:
− use of the secured Senior Facilities financing granted to Pirelli & C. S.p.A. and Pirelli International Limited for the nominal amount of euro 5,280,746 thousand. The contractual refinanced total amounted to euro 6.4 billion and was achieved at a lower overall cost of less than 3.5%. The operation consisted of syndicated refinancing for a total amount of euro 4.8 billion maturing in three and five years, and a credit facility for euro 1.6 billion with an eighteen month expiry, which was the result of a club deal with a select number of lending institutions. It is to be noted that the total amount for the Senior Facilities at December 31, 2016 was euro 6,289,820 thousand, following the partial repayment of the euro 1.6 billion credit facility at the end of December 2016. As a result of the refinancing operation, subscribed to on July 25, 2016 (the signing date), the Pirelli Group was able to refinance the bank debt which existed prior to the merger, as well as the Bidco Facility debt which had been cancelled on July 28, 2016 (the closing date). With the exception of the instalments due on December 31, 2017 which amount to euro 163,905 thousand for Pirelli & C. S.p.A. and euro 12,500 thousand for Pirelli International Plc, the financing is entirely reported under the item long-term borrowings from banks;

2016 ANNUAL REPORT
234
− loans granted by the European Investment Bank (EIB) in favour of S.C. Pirelli Tyres Romania S.r.l.
for local industrial investments for a total amount of euro 50,000 thousand (euro 150,000 thousand at December 31, 2015), were fully used, with euro 20,000 thousand reported under current borrowings from banks, while the residual part of euro 30,000 thousand has been reported under non-current borrowings from banks. Also of note is that during the first half year of 2016 Pirelli Tyre S.p.A. repaid the loan outstanding at December 31, 2016 disbursed by European Investment Bank (EIB) for a total of euro 100,000 thousand;
− euro 47,351 thousand refer in particular to certain loans classified as current borrowings from banks granted to the Mexican subsidiaries by the HSBC Bank for euro 28,575 thousand, and by Banco Santander for euro 13,919 thousand, and by Banco BBVA for euro 4,640 thousand. These loans have a maturity of between 150 and 365 days and are not covered by any type of guarantee;
− euro 37,737 thousand representing two long-term loans granted by the Yapi Kredi and AKbank institutions to the subsidiary Pirelli Otomobil Lastikleri (Turkey), classified as long-term borrowings from banks which will mature in January 2018;
− euro 5,000 thousand related to the Schuldschein (originally for the total nominal value of euro 155,000 thousand which at December 31, 2015 amounted to euro 37,000 thousand), a syndicated loan issued by the lender on the basis of a debt certificate governed by German law, granted to Pirelli International Plc and disbursed on December 14, 2012 and classified under short-term borrowings from banks as a result of the change of control as provided for by the contractual conditions of the financial instrument itself. On June 14, 2016, the natural date of maturity, the tranche amounting to euro 32,000 thousand was repaid;
− use of credit facilities at local level in Argentina, Brazil, Colombia, Egypt, the United Kingdom and the USA for euro 508,475 thousand, of which euro 331,861 thousand is classified as current borrowings from banks, with the remainder amounting to euro 176,614 thousand, classified as other non-current borrowings from banks.
At December 31, 2016, the Group had a liquidity margin equal to euro 2,581.6 million composed of euro 1,000.0 million in the form of a non-utilised nominal credit facility (the total amount for the Senior Facilities at December 31, 2016 was euro 6,289.8 million, following the partial repayment of the euro 1,600.0 million credit facility at the end of December 2016), and euro 1,581.6 million in cash and cash equivalents and securities held for trading. Accrued financial expenses and deferred financial income (euro 29,253 thousand) refers mainly to accrued interest on loans granted by banks for euro 24,902 thousand (euro 853 thousand at December 31, 2015), to commitment fees accrued on the new loan for euro 2,337 thousand, and to the accrued interest payable on bonds of euro 1,237 thousand (euro 23,757 thousand at December 31, 2015). Current and non-current financial payables backed by secured guarantees (pledges and mortgages) totalled euro 5,290,188 thousand and refer mainly to the secured Senior Facilities financing granted to Pirelli & C. S.p.A., Pirelli Tyre S.p.A. and Pirelli International Plc for the nominal amount of euro 5,280,746 thousand.
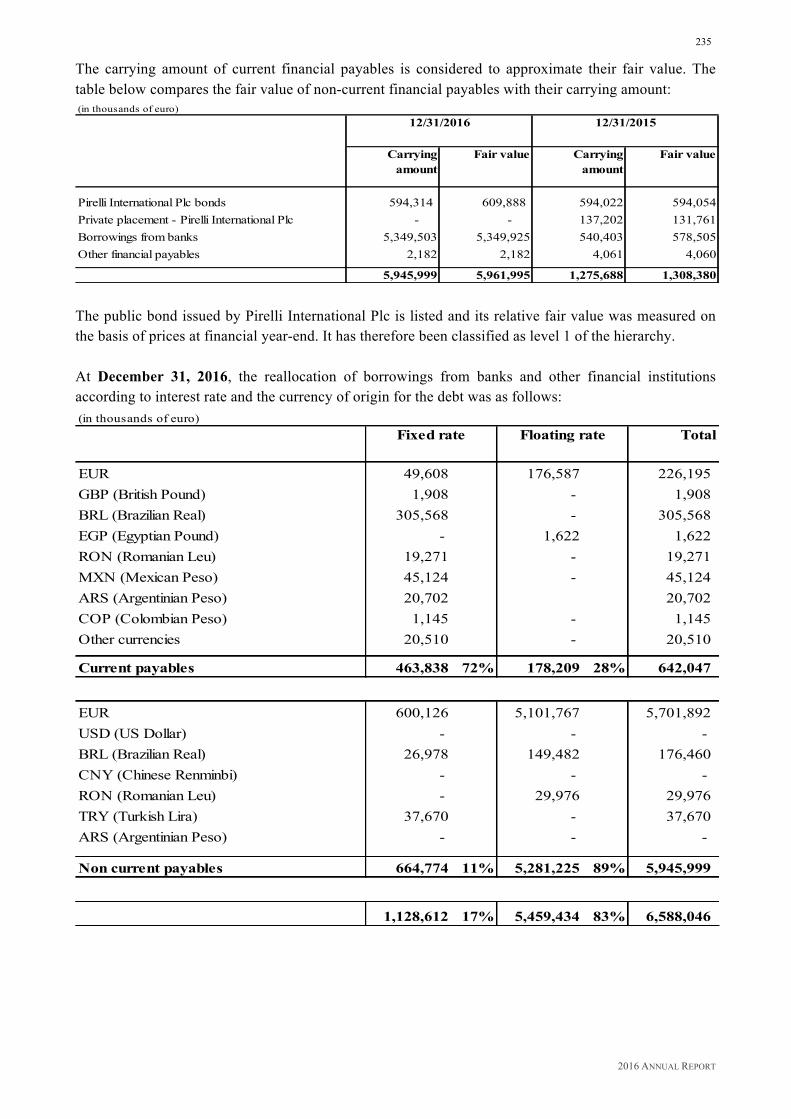
2016 ANNUAL REPORT
235
The carrying amount of current financial payables is considered to approximate their fair value. The table below compares the fair value of non-current financial payables with their carrying amount: (in thousands of euro)
Carrying amount
Fair value Carrying amount
Fair value
Pirelli International Plc bonds 594,314 609,888 594,022 594,054Private placement - Pirelli International Plc - - 137,202 131,761Borrowings from banks 5,349,503 5,349,925 540,403 578,505Other financial payables 2,182 2,182 4,061 4,060
5,945,999 5,961,995 1,275,688 1,308,380
12/31/201512/31/2016
The public bond issued by Pirelli International Plc is listed and its relative fair value was measured on the basis of prices at financial year-end. It has therefore been classified as level 1 of the hierarchy. At December 31, 2016, the reallocation of borrowings from banks and other financial institutions according to interest rate and the currency of origin for the debt was as follows: (in thousands of euro)
Total
EUR 49,608 176,587 226,195GBP (British Pound) 1,908 - 1,908BRL (Brazilian Real) 305,568 - 305,568EGP (Egyptian Pound) - 1,622 1,622RON (Romanian Leu) 19,271 - 19,271MXN (Mexican Peso) 45,124 - 45,124ARS (Argentinian Peso) 20,702 20,702COP (Colombian Peso) 1,145 - 1,145Other currencies 20,510 - 20,510
Current payables 463,838 72% 178,209 28% 642,047
EUR 600,126 5,101,767 5,701,892USD (US Dollar) - - - BRL (Brazilian Real) 26,978 149,482 176,460CNY (Chinese Renminbi) - - - RON (Romanian Leu) - 29,976 29,976TRY (Turkish Lira) 37,670 - 37,670ARS (Argentinian Peso) - - -
Non current payables 664,774 11% 5,281,225 89% 5,945,999
1,128,612 17% 5,459,434 83% 6,588,046
Fixed rate Floating rate

2016 ANNUAL REPORT
236
At December 31, 2015 the situation was as follows:
At December 31, 2016, as at December 31, 2015 there were no derivative hedging instruments in place for floating rate payables. The Group’s exposure to fluctuations in interest rates on financial payables, both in terms of the type of rate and in terms of the date of the renegotiation of the same (resetting) was as follows: (in thousands of euro)
Total Fixed rate Floating rate Total Fixed rate Floating rateUp to 6 months 438,500 436,265 2,235 1,136,210 1,095,032 41,178From 6 to 12 months 224,328 38,963 185,365 4,536 4,536 - From 1 to 5 years 5,925,029 653,195 5,271,834 5,336,728 692,467 4,644,261More than 5 years 189 189 - 96,055 96,055 - - - - - - -
6,588,046 1,128,612 5,459,434 6,573,529 1,888,090 4,685,439
12/31/2016 12/31/2015
The average cost of debt during the 2016 financial year was equal to 5.82% (5.90% for 2015).
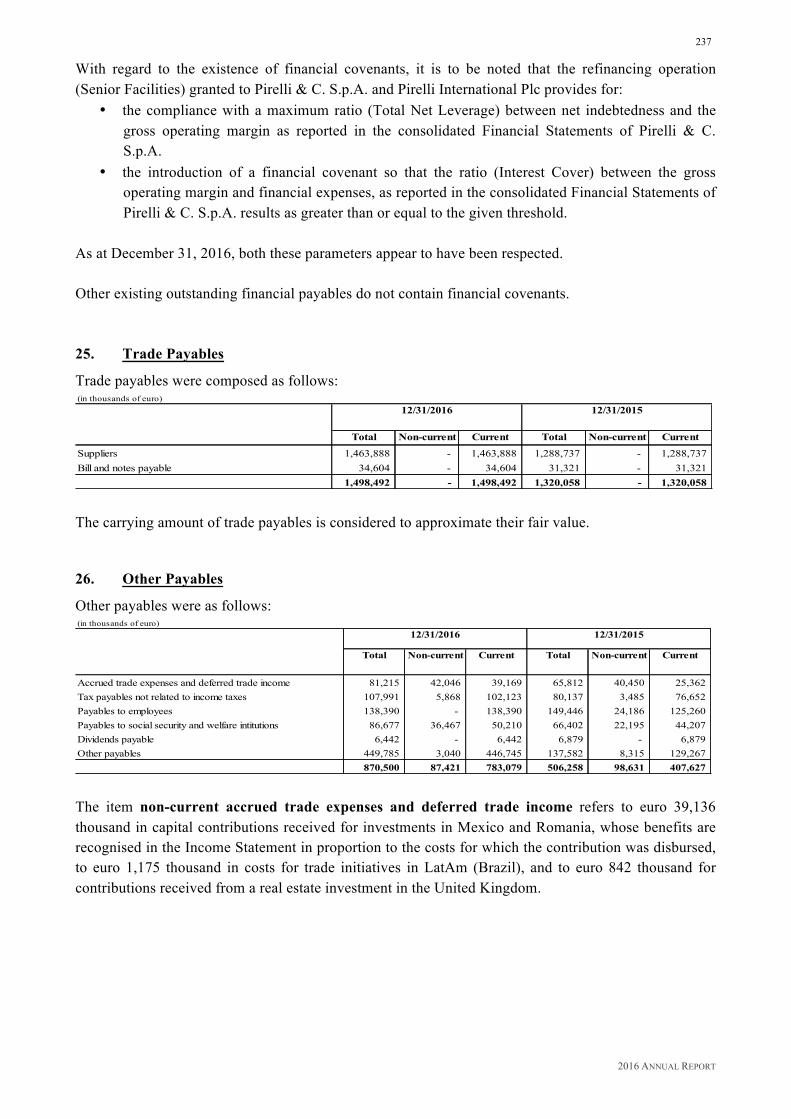
2016 ANNUAL REPORT
237
With regard to the existence of financial covenants, it is to be noted that the refinancing operation (Senior Facilities) granted to Pirelli & C. S.p.A. and Pirelli International Plc provides for:
• the compliance with a maximum ratio (Total Net Leverage) between net indebtedness and the gross operating margin as reported in the consolidated Financial Statements of Pirelli & C. S.p.A.
• the introduction of a financial covenant so that the ratio (Interest Cover) between the gross operating margin and financial expenses, as reported in the consolidated Financial Statements of Pirelli & C. S.p.A. results as greater than or equal to the given threshold.
As at December 31, 2016, both these parameters appear to have been respected. Other existing outstanding financial payables do not contain financial covenants. 25. Trade Payables
Trade payables were composed as follows: (in thousands of euro)
Total Non-current Current Total Non-current Current
Suppliers 1,463,888 - 1,463,888 1,288,737 - 1,288,737Bill and notes payable 34,604 - 34,604 31,321 - 31,321
1,498,492 - 1,498,492 1,320,058 - 1,320,058
12/31/2016 12/31/2015
The carrying amount of trade payables is considered to approximate their fair value.
26. Other Payables
Other payables were as follows: (in thousands of euro)
Total Non-current Current Total Non-current Current
Accrued trade expenses and deferred trade income 81,215 42,046 39,169 65,812 40,450 25,362Tax payables not related to income taxes 107,991 5,868 102,123 80,137 3,485 76,652Payables to employees 138,390 - 138,390 149,446 24,186 125,260Payables to social security and welfare intitutions 86,677 36,467 50,210 66,402 22,195 44,207Dividends payable 6,442 - 6,442 6,879 - 6,879Other payables 449,785 3,040 446,745 137,582 8,315 129,267
870,500 87,421 783,079 506,258 98,631 407,627
12/31/2016 12/31/2015
The item non-current accrued trade expenses and deferred trade income refers to euro 39,136 thousand in capital contributions received for investments in Mexico and Romania, whose benefits are recognised in the Income Statement in proportion to the costs for which the contribution was disbursed, to euro 1,175 thousand in costs for trade initiatives in LatAm (Brazil), and to euro 842 thousand for contributions received from a real estate investment in the United Kingdom.
2016 ANNUAL REPORT
238
The item current accrued trade expenses and deferred trade income includes euro 14,316 thousand for various trade initiatives realised in Germany and Brasil, euro 11,443 thousand in government grants and tax incentives received mainly in Italy, Romania and Brazil, euro 2,104 thousand for costs related to insurance coverage in some European countries, Argentina and Turkey, euro 1,777 thousand for insurance reimbursements which impact on two financial years, and euro 1,149 thousand for various promotional initiatives (trade discounts received). The item tax payables for taxes not related to income is mainly comprised of payables for IVA (value added tax) and other indirect taxes, withholding tax for employees and taxes not related to income. The item payables to employees mainly includes amounts accrued during the financial year but not yet paid, as well as the residual payables from the previous three year Long-Term Incentive plan 2014-2016 intended for Pirelli Management which was closed during the preceding financial year. The item other current payables (euro 446,745 thousand) mainly includes: • euro 307,270 thousand in advance payments received (euro 4,747 thousand at December 31,
2015), in particular the amount of euro 265,045 thousand received as advanced payment from the Chinese Cinda fund on December 30, 2016 for the disposal of 38% of the investment of Pirelli Industrial S.r.l, which was then finalised during the month of January 2017, while the residual portion was for advance payments received from customers in particular by companies in the LatAm area;
• euro 66,789 thousand for the purchase of property, plant and equipment (euro 78,333 thousand at December 31, 2015);
• euro 21,367 thousand in payables to representatives, agents, professionals and consultants (euro 6,467 thousand at December 31, 2015);
• euro 12,476 thousand for withholding taxes on income (euro 9,914 thousand at December 31, 2015);
• euro 7,617 thousand in payables to directors, auditors and supervisory bodies (euro 6,851 thousand at December 31, 2015);
• euro 4,652 thousand for debts relating to customs duties, import and transport costs.
For other current and non-current payables, it is considered that their value approximates their fair value. 27. Tax Payables
Tax payables recorded net of receivables for withholding tax amounted to euro 23,451 (23,805 thousand for receivables for withholding tax used as reconciliation at December 31, 2015 – for the restated figures refer to Note 17 “Tax receivables”), were for the most part related to national and regional income taxes in different countries and amounted to euro 45,147 thousand (of which euro 3,374 thousand was for non-current liabilities), compared to euro 41,286 thousand at December 31, 2015 (of which euro 2,646 thousand was for non-current liabilities).

2016 ANNUAL REPORT
239
28. Derivative Financial Instruments
The item includes the fair value of derivative instruments and is composed as follows: (in thousands of euro)
Current Assets Current Liabilities Current Assets Current Liabilities
Without adoption of hedge accountingExchange rate derivatives - trade positions 13,403 (16,102) 42,327 (36,825) Exchange rate derivatives - included in net financial position 3,718 (35,742) 6,840 (15,149)
Hedge accounting adopted- cash flow hedge:Exchange rate derivatives - trade transactions 1,196 - - - Interest rate derivatives - - 11,608 - Other derivatives 5,672 (326) 530 (5)
23,989 (52,170) 61,305 (51,979)
- Total derivatives included in net financial position 3,718 (35,742) 6,840 (15,149)
12/31/201512/31/2016
Derivative financial instruments not in hedge accounting
The value of exchange rate derivatives corresponds to the fair value evaluation of purchases/sales using the forward exchange rate in effect at the closing date of the period. These were hedge operations for the trade and financial transactions of the Group for which hedge accounting option had not been adopted. The fair value was determined by using the forward exchange rate at the reporting date. 29. Commitments and Contingencies
COMMITMENTS FOR THE PURCHASE OF PROPERTY, PLANT AND EQUIPMENT The commitments to purchase property, plant and equipment amounted to euro 232,605 thousand and refer mainly to companies in Romania, Brazil, Italy and Mexico (euro 131,074 thousand at December 31, 2015).
COMMITMENTS FOR THE PURCHASE OF EQUITY INVESTMENTS/FUND SHARES These refer to commitments to purchase shares in Equinox Two S.c.a., a private equity company which specialises in investments in listed and unlisted companies with a high growth potential, for an amount equal to a maximum of euro 1,849 thousand.
OTHER COMMITMENTS As a consequence of the merger of Marco Polo Industrial Holding S.p.A. into Pirelli & C. S.p.A. and to the subsequent operation of refinancing the debt of the Group, which was successfully completed on July 28, 2016, insurance guarantees were subscribed to for the benefit of the pension funds of Pirelli UK Limited and Pirelli Tyres Limited - Credit Support Guarantees (“CSG”), thanks to the ability to procure GBP 300 million from leading companies.

2016 ANNUAL REPORT
240
The insurance protection agreement covers a time period of approximately 42 months from September 2016 to March 2020, and provides for a counter-guarantee system under which the Group, selected as indemnitors of the operation, shall jointly indemnify the insurers from any cost (“Indemnified liabilities”).
GUARANTEES ISSUED FOR THE DISPOSAL OF OLIMPIA S.P.A. During the disposal of the investment in Olimpia S.p.A., the sellers (Pirelli and Sintonia) contractually retained the burden of tax risks for the taxable period up until the date of disposal. Litigation, which is still ongoing can be summarised as follows. At the end of the 2006 financial year, the Italian tax authority (Agenzia delle Entrate) served Olimpia S.p.A. a notice of assessment for Italian regional income tax (IRAP) for the 2001 financial year. More precisely, on the basis of an assumption which Pirelli maintains is entirely unfounded both in legal and financial terms, the tax agency had ascertained an assessment on the non-existent financial income for the Bell bonds which were repayable in Olivetti shares, resulting in regional income taxes (IRAP) amounting to euro 26.5 million (the pro-rata share for Pirelli & C. amounted to euro 21.2 million) plus sanctions for the same amount. Olimpia S.p.A. appealed against this tax assessment on the basis of the manifestly non-existent taxable income ascertained by the tax agency. The regional tax commission of the 1st level, (Commissione Tributaria di 1° grado) upheld the company's appeal by cancelling the assessment. The tax agency then appealed this decision. This appeal was also rejected by the regional tax commission. Despite the twice unexceptionable negative judgements, the tax agency filed an appeal in the Supreme Court (Corte di Cassazione) which Olimpia S.p.A. has consistently opposed. During the hearing on December 21, 2016, the Prosecutor General unexpectedly ruled, without any legal or procedural basis, in favour of accepting the appeal of the tax agency attorneys and referred the claim for reconsideration to another section of the regional tax commission. At the end of the hearing Pirelli’s legal defence presented a justified brief opposing the decision. The ruling of the Supreme Court is still pending along with the handing down of its decision and its reasons. It is nevertheless reasonable to maintain, by virtue of the strength of our defensive arguments as confirmed by our legal advisers, which are not in our opinion weakened by the Prosecutor General's ruling, that the assessment of risk is such as to not require the allocation of any specific provision in the annual Financial Statements at December 31, 2016.
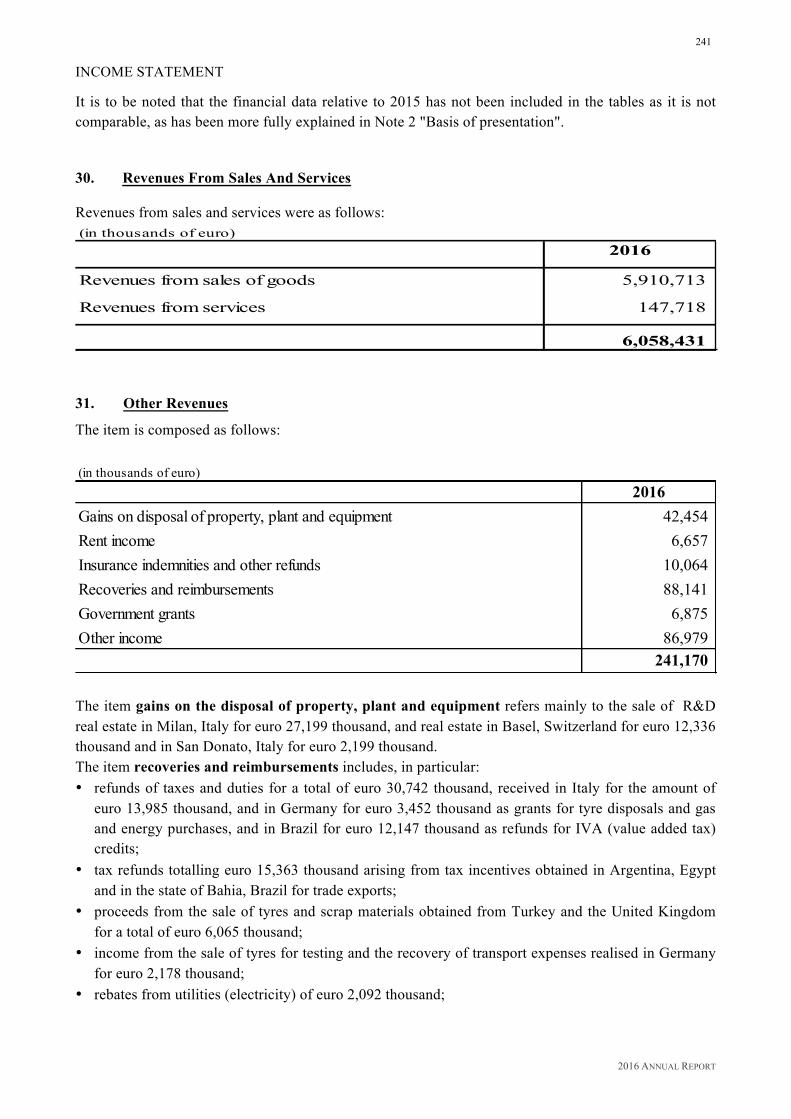
2016 ANNUAL REPORT
241
INCOME STATEMENT It is to be noted that the financial data relative to 2015 has not been included in the tables as it is not comparable, as has been more fully explained in Note 2 "Basis of presentation".
30. Revenues From Sales And Services
Revenues from sales and services were as follows: (in thousands of euro)
2016
Revenues from sales of goods 5,910,713 - Revenues from services 147,718
6,058,431 31. Other Revenues
The item is composed as follows: (in thousands of euro)
2016Gains on disposal of property, plant and equipment 42,454Rent income 6,657Insurance indemnities and other refunds 10,064Recoveries and reimbursements 88,141Government grants 6,875Other income 86,979
241,170 The item gains on the disposal of property, plant and equipment refers mainly to the sale of R&D real estate in Milan, Italy for euro 27,199 thousand, and real estate in Basel, Switzerland for euro 12,336 thousand and in San Donato, Italy for euro 2,199 thousand. The item recoveries and reimbursements includes, in particular: • refunds of taxes and duties for a total of euro 30,742 thousand, received in Italy for the amount of
euro 13,985 thousand, and in Germany for euro 3,452 thousand as grants for tyre disposals and gas and energy purchases, and in Brazil for euro 12,147 thousand as refunds for IVA (value added tax) credits;
• tax refunds totalling euro 15,363 thousand arising from tax incentives obtained in Argentina, Egypt and in the state of Bahia, Brazil for trade exports;
• proceeds from the sale of tyres and scrap materials obtained from Turkey and the United Kingdom for a total of euro 6,065 thousand;
• income from the sale of tyres for testing and the recovery of transport expenses realised in Germany for euro 2,178 thousand;
• rebates from utilities (electricity) of euro 2,092 thousand;

2016 ANNUAL REPORT
242
The item other includes income from sporting activities of euro 39,753 thousand, from the release of provisions for liabilities and charges of euro 13,143 thousand, from the release of the provision for bad debts of euro 1,691 thousand, income from hire equipment of euro 4,961 thousand, and income from Germany and for the disposal of a retail outlet of euro 1,000 thousand. 32. Personnel Expenses
The item is composed as follows
(in thousands of euro)2016
Wages and salaries 911,901Social security and welfare contributions 203,590Costs for employee leaving indemnities and similar 29,954Costs for defined contribution pension funds 22,632Costs for defined benefit pension funds 989Costs for jubilee awards 5,214Costs for defined contribution healthcare plans 35,084Other costs 8,482
1,217,846 33. Depreciation, Amortisation And Impairments
The item is composed as follows (in thousands of euro)
2016
Amortisation 118,554
Depreciation 273,822
Impairment of property, plant and equipment - 392,376
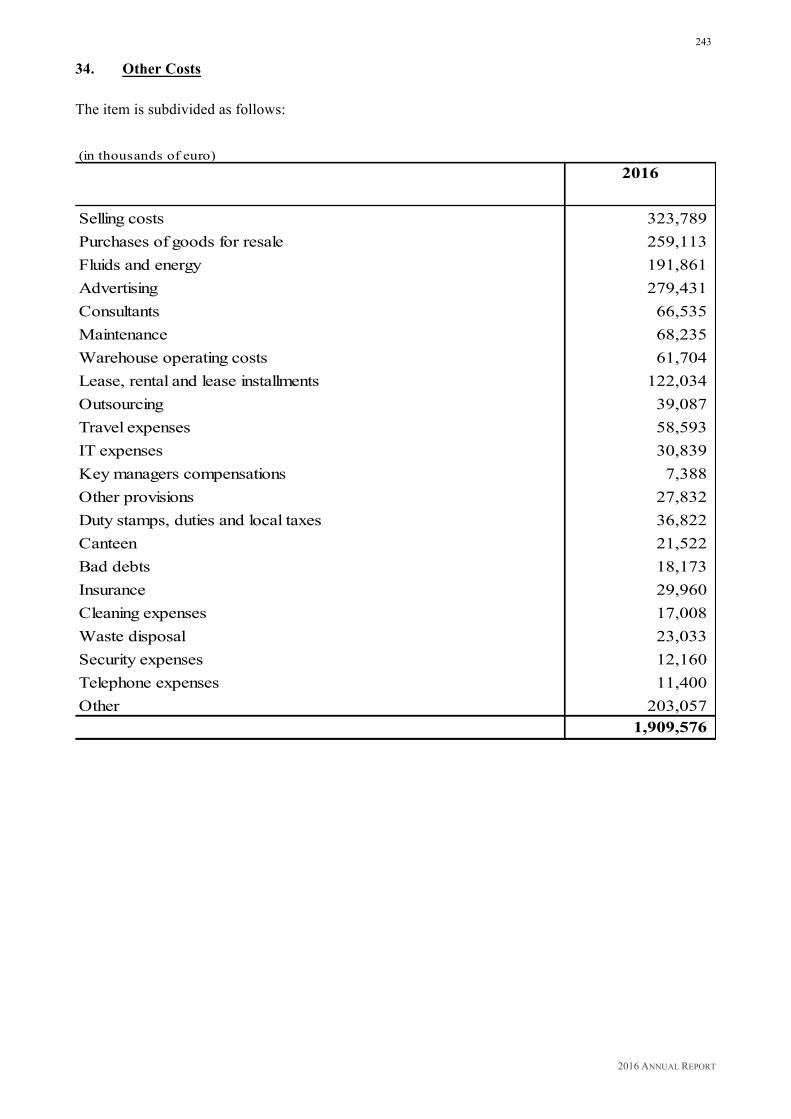
2016 ANNUAL REPORT
243
34. Other Costs The item is subdivided as follows:
(in thousands of euro)2016
Selling costs 323,789Purchases of goods for resale 259,113Fluids and energy 191,861Advertising 279,431Consultants 66,535Maintenance 68,235Warehouse operating costs 61,704Lease, rental and lease installments 122,034Outsourcing 39,087Travel expenses 58,593IT expenses 30,839Key managers compensations 7,388Other provisions 27,832Duty stamps, duties and local taxes 36,822Canteen 21,522Bad debts 18,173Insurance 29,960Cleaning expenses 17,008Waste disposal 23,033Security expenses 12,160Telephone expenses 11,400Other 203,057
1,909,576

2016 ANNUAL REPORT
244
35. Net income (loss) from Equity Investments 35.1 Share of net income (loss) of Associates and Joint Ventures The share of the net income (loss) from equity investments in associates and joint ventures was evaluated using the equity method and was negative for euro 1,227 thousand, and refers mainly to investments in Fenice S.r.l. (negative for euro 29,297 thousand), in Prelios S.p.A. (negative for euro 8,382 thousand), in Focus Investments S.p.A. (negative for euro 1,350 thousand), and in the joint venture PT Evolution Tyres in Indonesia (negative for euro 8,524 thousand), and was offset by the pro-rata portion of the results for Eurostazioni S.p.A. which was positive at euro 46,126 thousand. For further details reference should be made to preceding Note 12 "Investments in associates." 35.2 Gains on Equity Investments
Gains on equity investments amounted to euro 8,297 thousand and refer mainly to the release of impairments effected in previous financial years on the associate Fenice S.r.l (euro 7,364 thousand). For further details reference should be made to previous Note 12 "Investments in associates." 35.3 Losses on Equity Investments This item amounted to euro 33,739 thousand for the 2016 financial year and refers mainly to the investment in Prelios S.p.A. (euro 20,308 thousand), Pirelli de Venezuela C.A. (euro 8,651 thousand) and in Alitalia (euro 1,881 thousand) as well as to the withdrawal from the company GWM Renewable Energy II S.p.A. by Pirelli & C. S.p.A. (euro 1,692 thousand of which euro 1,172 thousand was for the reversal to the Income Statement of the cash flow hedge reserve), which was exchanged for shares of the Danish listed company Greentech Energy Systems A/S. For further details reference should be made to previous Note 12 "Investments in associates." 35.4 Dividends The item amounted to euro 6,650 thousand and mainly includes didvidends received from Mediobanca S.p.A. for the amount of euro 4,253 thousand (euro 3,938 thousand for 2015), from Emittenti Titoli S.p.A. for the amount of euro 1,727 thousand, (euro 202 thousand for 2015) and from Fin. Priv. S.r.l for the amount of euro 554 thousand (euro 513 thousand for 2015.).
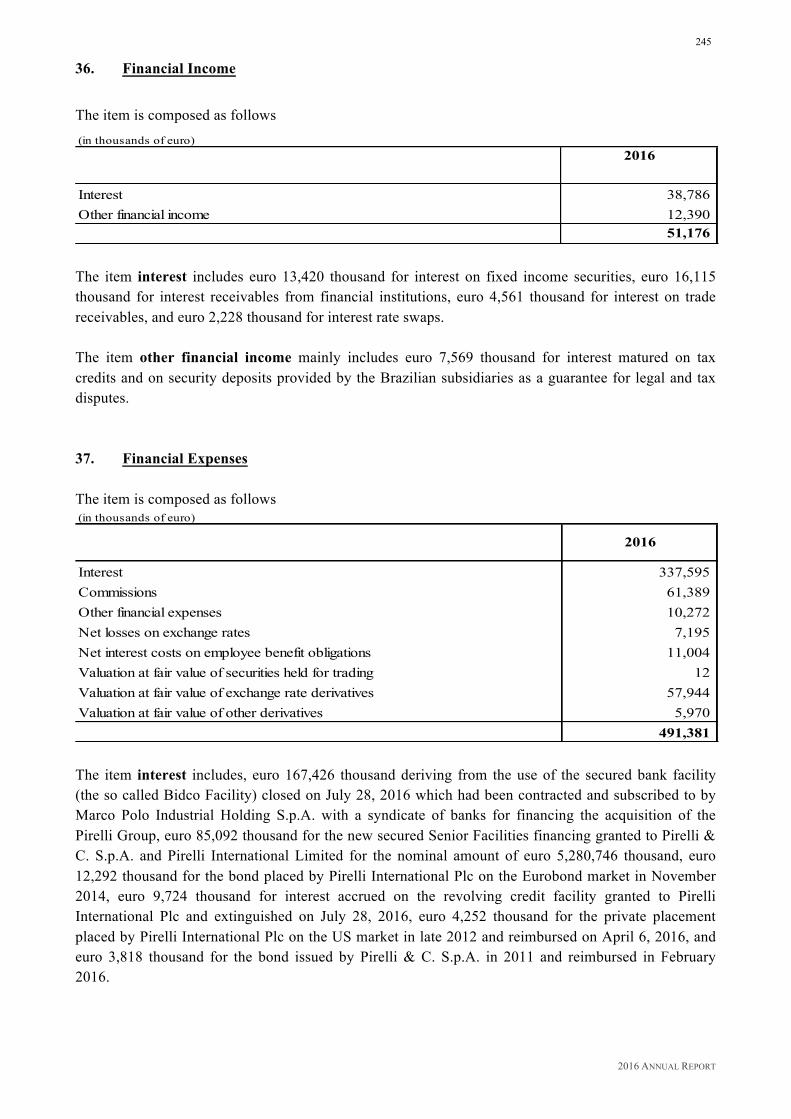
2016 ANNUAL REPORT
245
36. Financial Income
The item is composed as follows (in thousands of euro)
2016
Interest 38,786Other financial income 12,390
51,176 The item interest includes euro 13,420 thousand for interest on fixed income securities, euro 16,115 thousand for interest receivables from financial institutions, euro 4,561 thousand for interest on trade receivables, and euro 2,228 thousand for interest rate swaps. The item other financial income mainly includes euro 7,569 thousand for interest matured on tax credits and on security deposits provided by the Brazilian subsidiaries as a guarantee for legal and tax disputes. 37. Financial Expenses The item is composed as follows (in thousands of euro)
2016
Interest 337,595Commissions 61,389Other financial expenses 10,272Net losses on exchange rates 7,195Net interest costs on employee benefit obligations 11,004Valuation at fair value of securities held for trading 12Valuation at fair value of exchange rate derivatives 57,944Valuation at fair value of other derivatives 5,970
491,381 The item interest includes, euro 167,426 thousand deriving from the use of the secured bank facility (the so called Bidco Facility) closed on July 28, 2016 which had been contracted and subscribed to by Marco Polo Industrial Holding S.p.A. with a syndicate of banks for financing the acquisition of the Pirelli Group, euro 85,092 thousand for the new secured Senior Facilities financing granted to Pirelli & C. S.p.A. and Pirelli International Limited for the nominal amount of euro 5,280,746 thousand, euro 12,292 thousand for the bond placed by Pirelli International Plc on the Eurobond market in November 2014, euro 9,724 thousand for interest accrued on the revolving credit facility granted to Pirelli International Plc and extinguished on July 28, 2016, euro 4,252 thousand for the private placement placed by Pirelli International Plc on the US market in late 2012 and reimbursed on April 6, 2016, and euro 3,818 thousand for the bond issued by Pirelli & C. S.p.A. in 2011 and reimbursed in February 2016.
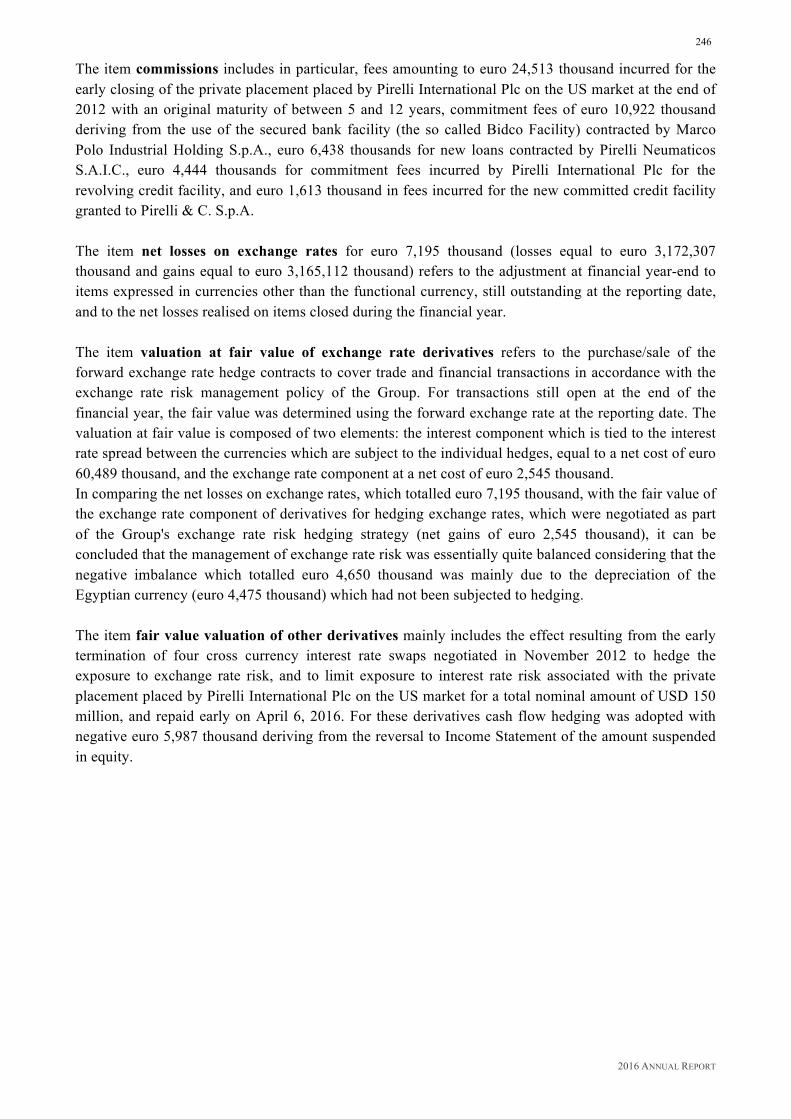
2016 ANNUAL REPORT
246
The item commissions includes in particular, fees amounting to euro 24,513 thousand incurred for the early closing of the private placement placed by Pirelli International Plc on the US market at the end of 2012 with an original maturity of between 5 and 12 years, commitment fees of euro 10,922 thousand deriving from the use of the secured bank facility (the so called Bidco Facility) contracted by Marco Polo Industrial Holding S.p.A., euro 6,438 thousands for new loans contracted by Pirelli Neumaticos S.A.I.C., euro 4,444 thousands for commitment fees incurred by Pirelli International Plc for the revolving credit facility, and euro 1,613 thousand in fees incurred for the new committed credit facility granted to Pirelli & C. S.p.A. The item net losses on exchange rates for euro 7,195 thousand (losses equal to euro 3,172,307 thousand and gains equal to euro 3,165,112 thousand) refers to the adjustment at financial year-end to items expressed in currencies other than the functional currency, still outstanding at the reporting date, and to the net losses realised on items closed during the financial year. The item valuation at fair value of exchange rate derivatives refers to the purchase/sale of the forward exchange rate hedge contracts to cover trade and financial transactions in accordance with the exchange rate risk management policy of the Group. For transactions still open at the end of the financial year, the fair value was determined using the forward exchange rate at the reporting date. The valuation at fair value is composed of two elements: the interest component which is tied to the interest rate spread between the currencies which are subject to the individual hedges, equal to a net cost of euro 60,489 thousand, and the exchange rate component at a net cost of euro 2,545 thousand. In comparing the net losses on exchange rates, which totalled euro 7,195 thousand, with the fair value of the exchange rate component of derivatives for hedging exchange rates, which were negotiated as part of the Group's exchange rate risk hedging strategy (net gains of euro 2,545 thousand), it can be concluded that the management of exchange rate risk was essentially quite balanced considering that the negative imbalance which totalled euro 4,650 thousand was mainly due to the depreciation of the Egyptian currency (euro 4,475 thousand) which had not been subjected to hedging. The item fair value valuation of other derivatives mainly includes the effect resulting from the early termination of four cross currency interest rate swaps negotiated in November 2012 to hedge the exposure to exchange rate risk, and to limit exposure to interest rate risk associated with the private placement placed by Pirelli International Plc on the US market for a total nominal amount of USD 150 million, and repaid early on April 6, 2016. For these derivatives cash flow hedging was adopted with negative euro 5,987 thousand deriving from the reversal to Income Statement of the amount suspended in equity.
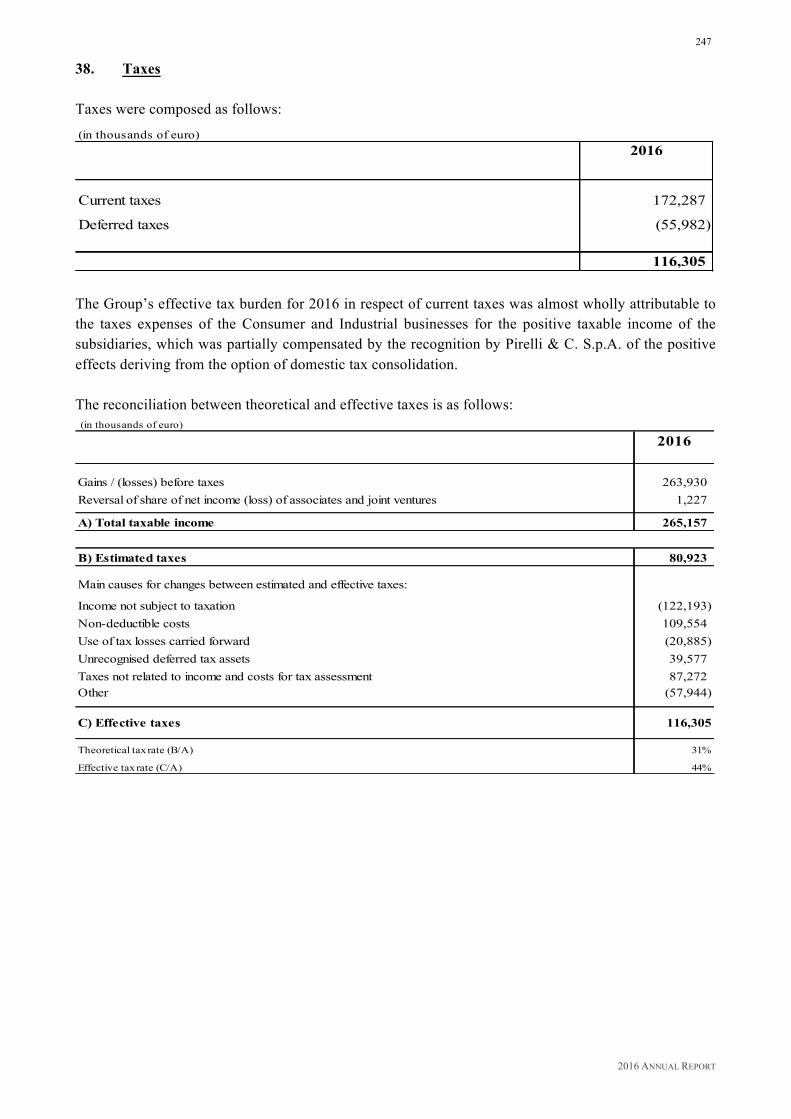
2016 ANNUAL REPORT
247
38. Taxes Taxes were composed as follows:
(in thousands of euro)2016
Current taxes 172,287
Deferred taxes (55,982)
116,305 The Group’s effective tax burden for 2016 in respect of current taxes was almost wholly attributable to the taxes expenses of the Consumer and Industrial businesses for the positive taxable income of the subsidiaries, which was partially compensated by the recognition by Pirelli & C. S.p.A. of the positive effects deriving from the option of domestic tax consolidation. The reconciliation between theoretical and effective taxes is as follows: (in thousands of euro)
2016
Gains / (losses) before taxes 263,930Reversal of share of net income (loss) of associates and joint ventures 1,227 - A) Total taxable income 265,157
B) Estimated taxes 80,923
Main causes for changes between estimated and effective taxes: - Income not subject to taxation (122,193)Non-deductible costs 109,554Use of tax losses carried forward (20,885)Unrecognised deferred tax assets 39,577Taxes not related to income and costs for tax assessment 87,272Other (57,944) -
C) Effective taxes 116,305
Theoretical tax rate (B/A) 31%
Effective tax rate (C/A) 44%

2016 ANNUAL REPORT
248
The Group’s theoretical tax burden is calculated by taking into account the nominal tax rates of the countries where the Group’s principal companies operate, as shown below:
2016 2015
EuropeItaly 31.40% 31.40%Germany 30.00% 29.58%Romania 16.00% 16.00%Great Britain 20.00% 20.00%Turkey 20.00% 20.00%Russia 20.00% 20.00%NAFTAUSA 38.00% 38.00%Mexico 30.00% 30.00%Central and South AmericaArgentina 35.00% 35.00%Brazil 34.00% 34.00%Asia / PacificChina 25.00% 25.00%Middle East / AfricaEgypt 22.50% 22.50% 39. Dividends Per Share In 2016, Pirelli & C. S.p.A did not distribute any dividends to its shareholders.

2016 ANNUAL REPORT
249
40. Related Party Transactions Related party transactions, including inter-company transactions, are neither unusual nor exceptional, but are part of the ordinary course of business for Group companies. Such transactions, when not concluded under standard conditions or dictated by specific regulatory conditions, are in any case governed by conditions consistent with those of the market and carried out in compliance with the provisions of the Procedure for Related Party Transactions which the Company has adopted. The effects of the related party transactions, contained in the Income Statement and the Statement of Financial Position, on the consolidated data for the Pirelli & C. Group at December 31, 2016 were composed as follows: TRANSACTIONS WITH ASSOCIATES AND JOINT VENTURES(in millions of euro)
Revenues from sales/services and other income 2.3
The amount refers mainly to rental income and related rental property management fees received from the Prelios Group (euro 1.9 million), and for services rendered to PT Evoluzione Tyres (euro 0.3 million).
Other costs 29.0
This item includes costs for energy purchases and equipment hire from Industriekraftwerk Breuberg GmbH (euro 21.4 million), costs for the purchase of products from PT Evoluzione Tyres (euro 6.6 million), for services rendered by the consortium CORIMAV (euro 0.2 million), and a penalty (euro 0.7 million) for the early termination of the lease with the Prelios Group S.p.A.
Financial income 0.2 The amount refers to interest on the loan granted by Pirelli International Plc to PT Evoluzione Tyres.
Other non-current receivables 6.6 This item refers to the loan granted by Pirelli International Plc to PT Evoluzione Tyres.
Current trade receivables 2.8 This item includes receivables for services rendered to Prelios S.p.A. group (euro 1.7 million) and PT Evoluzione Tyres (euro 1.0 million).
Other current receivables 3.2 The amount refers to advances received from PT Evoluzione Tyres (euro 1.4 million), to financial receivables from Phoenix S.r.l. (euro 0.2 million) and from International Media Holding S.p.A. (euro 1.5 million).
Non-current borrowings from banks and other financial institutions
0.6 This item refers to the security deposit received from Prelios S.p.A. to guarantee the lease of the Milan office (long-term).
Current borrowings from banks and other financial institutions
0.8 This item refers to the short term portion of the security deposit received from Prelios S.p.A. to guarantee of the lease of the Milan office (short-term).
Current trade payables 22.6 The amount mainly refers to payables for the purchase of energy from Industriekraftwerk Breuberg GmbH.
TRANSACTIONS WITH OTHER RELATED PARTY (in milllions of euro)Revenues from sales and services 3.5 This item mainly includes the sale of goods and services rendered by Pirelli
Tyre S.p.A. (euro 2.6 million) and Pirelli Pneus Ltda (euro 0.8 million) to Pirelli de Venezuela C.A.
Other costs 0.7 This item refers to commissions/fees/charges incurred by Pirelli & C. S.p.A. for refinancing operations with regards to ChemChina.
Other current receivables 3.0 This item refers to receivables from Aeolus Tyre Co., Ltd. Benefits for key managers of the company As December 31, 2016, the compensation to which key managers with strategic responsibilities were entitled to amounted to euro 16,342 thousand. The portion relative to employee benefits was recognised in the Income Statement under “Personnel expenses” for euro 8,954 thousand and under the item “Other Costs” for euro 7,388 thousand also in the Income Statement. The remuneration also includes euro 1,052 thousand for employee’s leaving indemnities (TFR) and retirement benefits.
2016 ANNUAL REPORT
250
41. Significant events subsequent to the end of the year On December 28, 2016 Pirelli reached an agreement for the disposal of 38% of the share capital of Pirelli Industrial S.r.l. to a vehicle controlled by the Chinese Cinda fund for an amount totalling euro 266 million. The sale of the aforesaid shareholding in Pirelli Industrial S.r.l., which is part of the wider project of the reorganisation and integration of the Industrial business, was finalised on January 13, 2017.
On February 9, 2017 Pirelli announced price increases in all European and North American markets for car tyres, light truck tyres, and motorcycle tyres, in all product ranges (summer, all season and winter) and for all the Group’s brands. The increase, which will take effect from April 1, 2017, will be up to 9%. The increase was due to the costlier prices for the main raw materials, plus a growing investment in the development of products with a high technological content.
On February 14, 2017 Pirelli celebrated the opening of the new season for Motorsports which sees the company committed - in addition to the Formula One World Championship - to over 340 championships, including for cars and motorcycles, for a total of 2,200 events spread across all five continents. The celebration which coincided with the 110 year anniversary in Motorsports for Pirelli was held at the Turin Automobile Museum. On March 7, 2017 Pirelli presented two new products at the Geneva Motor Show, consistent with its strategy of focusing on the Premium and Prestige segments and of expanding the range of services for the consumer: - the colored editions of the P Zero and the Winter Sottozero tyres, for which Pirelli engineers
have developed, thanks to Pirelli’s experience with F1, innovative materials and finishes capable of ensuring bright and long lasting colors;
- Pirelli Conneso offers a digital platform which is integrated into the P Zero and Winter Sottozero tyres, available on the replacement market in black or colored, which thanks to the sensor fixed to the hollow recess of the tyre (i.e., on the inner wall of the tyre itself) is connected to an app and is able to communicate with the motorist and provide information on certain basic parameters concerning the functioning of the rubber, as well as a range of personalised services.
This double innovation, which signals the entrance of Pirelli as a key player into the digital tyre market, is part of the tailor made strategy for the long P, which aims at manufacturing customised tyres designed to meet personalised needs, safety and performance requirements, as well as reducing consumption.

2016 ANNUAL REPORT
251
On March 13, 2017 Pirelli Industrial S.r.l. (indirectly controlled by Pirelli through TP Industrial Holding) with the aim to ensure full financial autonomy, subscribed a loan of euro 600 million having a 3-year duration (renewable to a maximum of 5 years) with Bank of America Merrill Lynch International Limited, China Construction Bank (Europe) S.A., HSBC Bank plc. and ING Bank N.V., Milan branch. In March 2017 in order to ensure an autonomous growth path and independent group strategies, the two areas of activity – Consumer and Industrial – have been separated into two distinct companies controlled by their common shareholder Marco Polo International Italy following the assignation to the latter by Pirelli of the shares of TP Industrial Holding, the company into which the industrial assets of Pirelli were conferred. TP Industrial Holding and Pirelli are thus 100% controlled by Marco Polo International Italy, the vehicle of the partnership between CNRC (65%), Camfin (22.4%) and Long-Term investments Luxemburg (12.6%). Further, with effect from April 1, 2017, as a consequence of the completion of the separation of the Industrial business from Pirelli’s consumer activities, Pirelli Industrial will change its company name to “Prometeon Tyre Group S.r.l.” (“PTG”).

2016 ANNUAL REPORT
252
42. Other Information RESEARCH AND DEVELOPMENT EXPENSES Research expenses for the 2016 financial year amounted to euro 228.1 million and represented 3.8% of sales. These were expensed in the Income Statement as they did not meet the requirements of the IFRS principles with regards to their capitalisation. COMPENSATION FOR DIRECTORS AND STATUTORY AUDITORS Compensation paid to the Directors and Statutory Auditors of Pirelli & C. S.p.A. was as follows:
(in thousands of euro)2016
Directors 6,594
Statutory Auditors 2806,874
AVERAGE EMPLOYEE HEADCOUNT The average headcount, subdivided by employment category, for the employees of the companies included in the scope of consolidation was as follows:
2016
Executives and white collar staff 7,162 Blue collar staff 26,986 Temporary workers 2,255
36,403
COMPENSATION FOR THE AUDITING FIRM
Pursuant to the applicable legislation the following table presents the total remuneration for the 2016 financial year for auditing services and services other than auditing, rendered by the company Ernst & Young S.p.A. and entities belonging to its network.
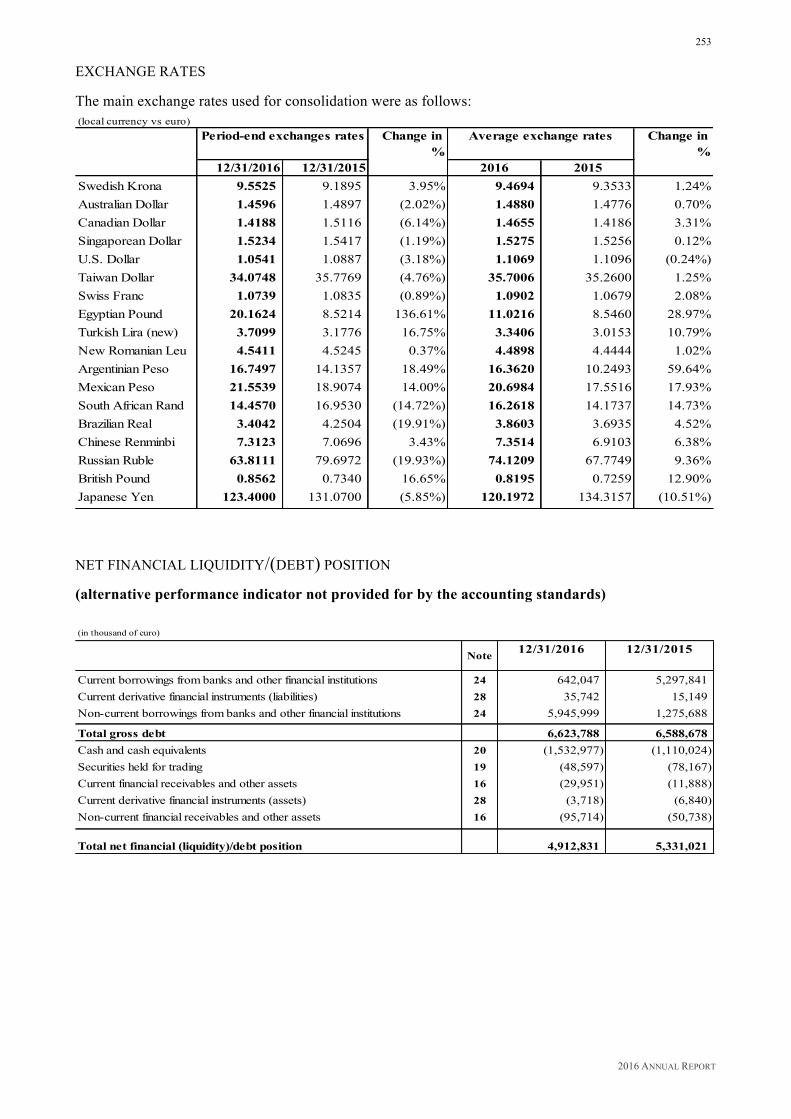
2016 ANNUAL REPORT
253
EXCHANGE RATES The main exchange rates used for consolidation were as follows: (local currency vs euro)
Period-end exchanges rates Change in %
Average exchange rates Change in %
12/31/2016 12/31/2015 2016 2015Swedish Krona 9.5525 9.1895 3.95% 9.4694 9.3533 1.24%Australian Dollar 1.4596 1.4897 (2.02%) 1.4880 1.4776 0.70%Canadian Dollar 1.4188 1.5116 (6.14%) 1.4655 1.4186 3.31%Singaporean Dollar 1.5234 1.5417 (1.19%) 1.5275 1.5256 0.12%U.S. Dollar 1.0541 1.0887 (3.18%) 1.1069 1.1096 (0.24%)Taiwan Dollar 34.0748 35.7769 (4.76%) 35.7006 35.2600 1.25%Swiss Franc 1.0739 1.0835 (0.89%) 1.0902 1.0679 2.08%Egyptian Pound 20.1624 8.5214 136.61% 11.0216 8.5460 28.97%Turkish Lira (new) 3.7099 3.1776 16.75% 3.3406 3.0153 10.79%New Romanian Leu 4.5411 4.5245 0.37% 4.4898 4.4444 1.02%Argentinian Peso 16.7497 14.1357 18.49% 16.3620 10.2493 59.64%Mexican Peso 21.5539 18.9074 14.00% 20.6984 17.5516 17.93%South African Rand 14.4570 16.9530 (14.72%) 16.2618 14.1737 14.73%Brazilian Real 3.4042 4.2504 (19.91%) 3.8603 3.6935 4.52%Chinese Renminbi 7.3123 7.0696 3.43% 7.3514 6.9103 6.38%Russian Ruble 63.8111 79.6972 (19.93%) 74.1209 67.7749 9.36%British Pound 0.8562 0.7340 16.65% 0.8195 0.7259 12.90%Japanese Yen 123.4000 131.0700 (5.85%) 120.1972 134.3157 (10.51%) NET FINANCIAL LIQUIDITY/(DEBT) POSITION (alternative performance indicator not provided for by the accounting standards) (in thousand of euro)
Note
Current borrowings from banks and other financial institutions 24 642,047 5,297,841Current derivative financial instruments (liabilities) 28 35,742 15,149Non-current borrowings from banks and other financial institutions 24 5,945,999 1,275,688 - - Total gross debt 6,623,788 6,588,678Cash and cash equivalents 20 (1,532,977) (1,110,024)Securities held for trading 19 (48,597) (78,167)Current financial receivables and other assets 16 (29,951) (11,888)Current derivative financial instruments (assets) 28 (3,718) (6,840)Non-current financial receivables and other assets 16 (95,714) (50,738) - -
Total net financial (liquidity)/debt position 4,912,831 5,331,021
12/31/201512/31/2016

2016 ANNUAL REPORT
254
THE ESSENTIAL DATA OF THE STATUTORY FINANCIAL STATEMENTS AT DECEMBER 31, 2015 OF MARCO POLO INTERNATIONAL ITALY S.P.A., THE COMPANY WHICH EXCERCISES MANAGEMENT AND COORDINATION, WAS AS FOLLOWS: STATEMENT OF FINANCIAL POSITION(in thousands of euro)
Investments in subsidiaries 3,273,773Other non-current assets 3Cash and cash equivalent 8,289Other current receivables 11TOTAL ASSETS 3,282,076Equity 2,792,321
Other current payables 489,755TOTAL LIABILITIES AND EQUITY 3,282,076
INCOME STATEMENT(in thousands of euro) 12/31/2015Costs for services (63)Other costs (2)Financial expenses (689)NET INCOME (LOSS) (754)
12/31/2015

2016 ANNUAL REPORT
255
Scope of Consolidation
Companies consolidated line-by-lineCompany Business Headquarter Currency Share Capital % holding Held by
Europe
Austria
Pirelli GmbH Tyre Wien Euro 726,728 100.00% Pirelli Tyre (Suisse) SA
Belgium
Pirelli Tyres Belux S.A. Tyre Brussels Euro 700,000 100.00% Pirelli Tyre (Suisse) SA
France
Pneus Pirelli S.A.S. Tyre Villepinte Euro 1,515,858 100.00% Pirelli Tyre S.p.A.
Germany
Deutsche Pirelli Reifen Holding GmbH TyreBreuberg / Odenwald Euro 7,694,943 100.00% Pirelli Tyre S.p.A.
Drahtcord Saar Geschaeftsfuehrungs GmbH I.L (in liquidation) Tyre Merzig Euro 60,000 50.00% Pirelli Deutschland GmbHDrahtcord Saar GmbH & Co. KG I.L. in liquidation Tyre Merzig Euro 30,000,000 50.00% Pirelli Deutschland GmbH
Driver Handelssysteme GmbH TyreBreuberg / Odenwald Euro 26,000 100.00% Deutsche Pirelli Reifen Holding GmbH
Pirelli Deutschland GmbH TyreBreuberg / Odenwald Euro 23,959,100 100.00% Deutsche Pirelli Reifen Holding GmbH
Pirelli Personal Service GmbH TyreBreuberg / Odenwald Euro 25,000 100.00% Deutsche Pirelli Reifen Holding GmbH
PK Grundstuecksverwaltungs GmbH TyreHoechst /
Odenwald Euro 26,000 100.00% Deutsche Pirelli Reifen Holding GmbH
Pneumobil GmbH TyreBreuberg / Odenwald Euro 259,225 100.00% Deutsche Pirelli Reifen Holding GmbH
TP Industrial Deutschland GmbH TyreBreuberg / Odenwald Euro 500,000 100.00% Pirelli Industrial S.r.l.
Greece
Elastika Pirelli C.S.A. TyreElliniko-
Argyroupoli Euro 11,630,000 99.90% Pirelli Tyre S.p.A.
0.10% Pirelli Tyre (Suisse) SA
Pirelli Hellas S.A. (in liquidation) Tyre Athens US $ 22,050,000 79.86% Pirelli Tyre S.p.A.The Experts in Wheels - Driver Hellas C. S.A. Tyre
Elliniko-Argyroupoli Euro 100,000 72.80% Elastika Pirelli C.S.A.

2016 ANNUAL REPORT
256
Company Business Headquarter Currency Share Capital % holding Held by
Italy
Driver Italia S.p.A. Tyre Milan Euro 350,000 71.48% Pirelli Tyre S.p.A.
Driver Servizi Retail S.p.A. Tyre Milan Euro 120,000 100.00% Pirelli Tyre S.p.A.
HB Servizi S.r.l. Services Milan Euro 10,000 100.00% Pirelli & C. S.p.A.
Maristel S.p.A. Services Milan Euro 1,020,000 100.00% Pirelli & C. S.p.A.Pirelli & C. Ambiente S.r.l. Sustainable mobility Milan Euro 10,000 100.00% Pirelli & C. S.p.A.
Pirelli Industrie Pneumatici S.r.l. TyreSettimo
Torinese (To) Euro 40,000,000 100.00% Pirelli Tyre S.p.A.TP Industrial Holding S.p.A. (ex-Pirelli Labs S.p.A.) Services Milan Euro 203,666,000 100.00% Pirelli & C. S.p.A.Newco TP S.r.l. Tyre Milan Euro 10,000 100.00% Pirelli Industrial S.r.l.Pirelli Servizi Amministrazione e Tesoreria S.p.A. Services Milan Euro 2,047,000 100.00% Pirelli & C. S.p.A.
Pirelli Sistemi Informativi S.r.l. Information Systems Milan Euro 1,010,000 100.00% Pirelli & C. S.p.A.Pirelli Industrial S.r.l. (ex-Pirelli Tyre Commerciale Italia S.r.l.) Tyre Milan Euro 10,000 100.00% Pirelli Tyre S.p.A.Pirelli Industrial S.r.l. Tyre Milan Euro 100,000,000 38.00% Pirelli Tyre S.p.A.
52.00%TP Industrial Holding S.p.A. (ex-
Pirelli Labs S.p.A.)10.00% Aeolus Tyre Co., Ltd
Pirelli Tyre S.p.A. Tyre Milan Euro 558,154,000 100.00% Pirelli & C. S.p.A.
Poliambulatorio Bicocca S.r.l. Services Milan Euro 10,000 100.00% Pirelli Tyre S.p.A.
Servizi Aziendali Pirelli S.C.p.A. Services Milan Euro 104,000 92.25% Pirelli & C. S.p.A.
2.95% Pirelli Tyre S.p.A.
0.98% Pirelli Industrial S.r.l.
0.98% Pirelli Industrie Pneumatici S.r.l.
0.95%Pirelli Servizi Amministrazione e
Tesoreria S.p.A.
0.95%TP Industrial Holding S.p.A. (ex-
Pirelli Labs S.p.A.)
0.95% Pirelli Sistemi Informativi S.r.l.
The Netherlands
E-VOLUTION Tyre B.V. Tyre Rotterdam Euro 261,700,000 65.00% Pirelli Tyre S.p.A.Pirelli China Tyre N.V. Tyre Rotterdam Euro 38,045,000 100.00% Pirelli Tyre S.p.A.Pirelli Tyres Nederland B.V. Tyre Rotterdam Euro 18,152 100.00% Pirelli Tyre (Suisse) SA
Poland
Driver Polska Sp. z o.o. Tyre Warsaw Pol. Zloty 100,000 67.50% Pirelli Polska Sp. z o.o.Pirelli Polska Sp. z o.o. Tyre Warsaw Pol. Zloty 625,771 100.00% Pirelli Tyre S.p.A.TP Industrial Polska Sp. z o.o. Tyre Warsaw Pol. Zloty 5,000,000 100.00% Pirelli Industrial S.r.l.

2016 ANNUAL REPORT
257
Company Business Headquarter Currency Share Capital % holding Held by
United Kingdom
CTC 2008 Ltd TyreBurton on
Trent British Pound 100,000 100.00% Pirelli UK Tyres Ltd
Pirelli Cif Trustees Ltd FinancialBurton on
Trent British Pound 4 25.00%Pirelli General Executive Pension
Trustees LTD
25.00%Pirelli General & Overseas Pension
Trustees LTD
25.00%Pirelli Tyres Executive Pension
Trustees LTD
25.00% Pirelli Tyres Pension Trustees LTD
Pirelli International plc FinancialBurton on
Trent Euro 250,000,000 100.00% Pirelli Tyre S.p.A.
Pirelli Motorsport Services Ltd TyreBurton on
Trent British Pound 1 100.00% Pirelli Tyre S.p.A.Pirelli General Executive Pension Trustees Ltd Financial
Burton on Trent British Pound 1 100.00% Pirelli UK Ltd
Pirelli General & Overseas Pension Trustees Ltd Financial
Burton on Trent British Pound 1 100.00% Pirelli UK Ltd
Pirelli Tyres Executive Pension Trustees Ltd Financial
Burton on Trent British Pound 1 100.00% Pirelli Tyres Ltd
Pirelli Tyres Ltd TyreBurton on
Trent British Pound 16,000,000 100.00% Pirelli UK Tyres Ltd
Pirelli Tyres Pension Trustees Ltd TyreBurton on
Trent British Pound 1 100.00% Pirelli Tyres Ltd
Pirelli UK Ltd FinancialBurton on
Trent British Pound 163,991,278 100.00% Pirelli & C. S.p.A.
Pirelli UK Tyres Ltd TyreBurton on
Trent British Pound 85,000,000 100.00% Pirelli Tyre S.p.A.
TP Industrial UK Limited TyreBurton on
Trent British Pound 1,200,001 100.00% Pirelli Industrial S.r.l.
Slovakia
Pirelli Slovakia S.R.O. Tyre Bratislava Euro 6,639 100.00% Pirelli Tyre S.p.A.
Romania
S.C. Pirelli & C. Eco Technology RO S.r.l. Sustainable mobility
Oras Bumbesti-Jiu Rom. Leu 40,000,000 100.00% Pirelli & C. Ambiente S.r.l.
S.C. Pirelli Tyres Romania S.r.l. Tyre Slatina Rom. Leu 853,912,300 100.00% Pirelli Tyre S.p.A.
Russia
Closed Joint Stock Company "Voronezh Tyre Plant" Tyre Voronezh Russian Rouble 1,520,000,000 100.00%
Limited Liability Company Pirelli Tyre Russia
Limited Liability Company Pirelli Tyre Services Tyre Moscow Russian Rouble 54,685,259 95.00% Pirelli Tyre (Suisse) SA
5.00% Pirelli Tyre S.p.A.Limited Liability Company "AMTEL-Russian Tyres" Tyre Moscow Russian Rouble 10,000 100.00%
Limited Liability Company Pirelli Tyre Russia
Limited Liability Company Pirelli Tyre Russia Tyre Moscow Russian Rouble 4,000,000 99.91% E-VOLUTION Tyre B.V.
0.09% OOO Pirelli Tyre ServicesLimited Liability Company "Vyatskaya Shina" Tyre Kirov Russian Rouble 4,912,000 100.00%
Open Joint Stock Company "Kirov Tyre Plant"
Open Joint Stock Company "Kirov Tyre Plant" Tyre Kirov Russian Rouble 354,088,639 100.00%
Limited Liability Company Pirelli Tyre Russia
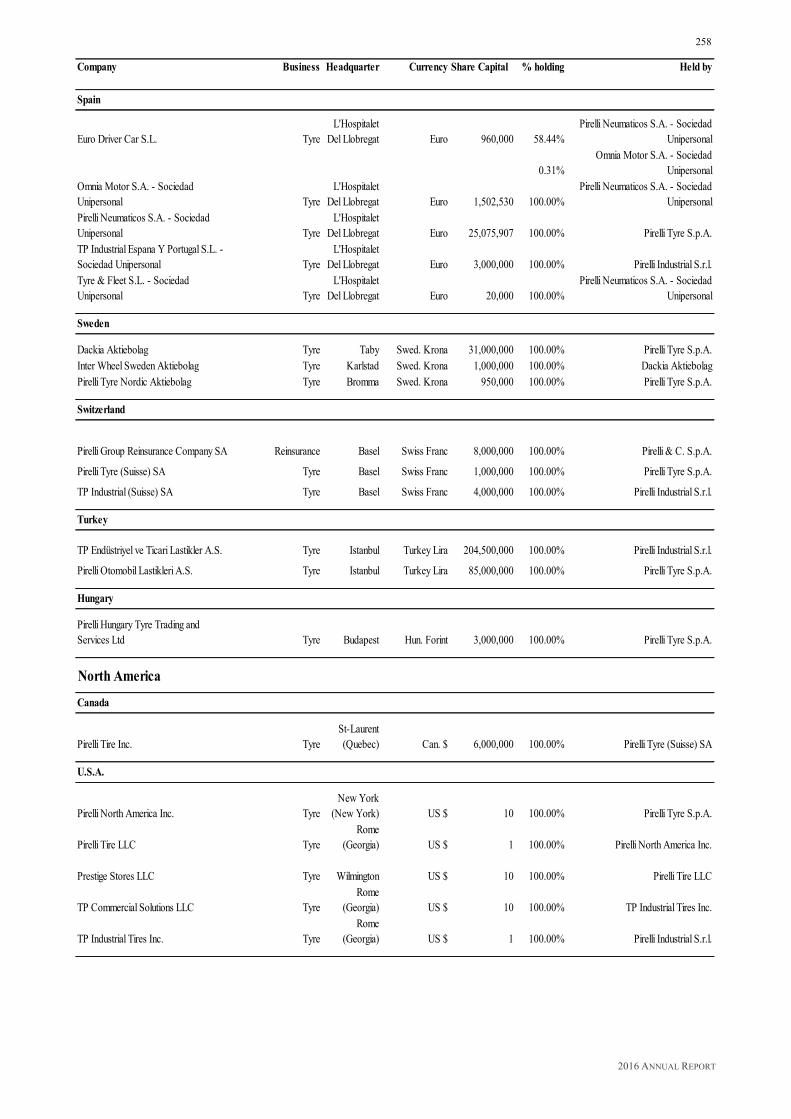
2016 ANNUAL REPORT
258
Company Business Headquarter Currency Share Capital % holding Held by
Spain
Euro Driver Car S.L. TyreL'Hospitalet
Del Llobregat Euro 960,000 58.44%Pirelli Neumaticos S.A. - Sociedad
Unipersonal
0.31%Omnia Motor S.A. - Sociedad
UnipersonalOmnia Motor S.A. - Sociedad Unipersonal Tyre
L'Hospitalet Del Llobregat Euro 1,502,530 100.00%
Pirelli Neumaticos S.A. - Sociedad Unipersonal
Pirelli Neumaticos S.A. - Sociedad Unipersonal Tyre
L'Hospitalet Del Llobregat Euro 25,075,907 100.00% Pirelli Tyre S.p.A.
TP Industrial Espana Y Portugal S.L. - Sociedad Unipersonal Tyre
L'Hospitalet Del Llobregat Euro 3,000,000 100.00% Pirelli Industrial S.r.l.
Tyre & Fleet S.L. - Sociedad Unipersonal Tyre
L'Hospitalet Del Llobregat Euro 20,000 100.00%
Pirelli Neumaticos S.A. - Sociedad Unipersonal
Sweden
Dackia Aktiebolag Tyre Taby Swed. Krona 31,000,000 100.00% Pirelli Tyre S.p.A.Inter Wheel Sweden Aktiebolag Tyre Karlstad Swed. Krona 1,000,000 100.00% Dackia AktiebolagPirelli Tyre Nordic Aktiebolag Tyre Bromma Swed. Krona 950,000 100.00% Pirelli Tyre S.p.A.
Switzerland
Pirelli Group Reinsurance Company SA Reinsurance Basel Swiss Franc 8,000,000 100.00% Pirelli & C. S.p.A.
Pirelli Tyre (Suisse) SA Tyre Basel Swiss Franc 1,000,000 100.00% Pirelli Tyre S.p.A.
TP Industrial (Suisse) SA Tyre Basel Swiss Franc 4,000,000 100.00% Pirelli Industrial S.r.l.
Turkey
TP Endüstriyel ve Ticari Lastikler A.S. Tyre Istanbul Turkey Lira 204,500,000 100.00% Pirelli Industrial S.r.l.
Pirelli Otomobil Lastikleri A.S. Tyre Istanbul Turkey Lira 85,000,000 100.00% Pirelli Tyre S.p.A.
Hungary
Pirelli Hungary Tyre Trading and Services Ltd Tyre Budapest Hun. Forint 3,000,000 100.00% Pirelli Tyre S.p.A.
North America
Canada
Pirelli Tire Inc. TyreSt-Laurent (Quebec) Can. $ 6,000,000 100.00% Pirelli Tyre (Suisse) SA
U.S.A.
Pirelli North America Inc. TyreNew York
(New York) US $ 10 100.00% Pirelli Tyre S.p.A.
Pirelli Tire LLC TyreRome
(Georgia) US $ 1 100.00% Pirelli North America Inc.
Prestige Stores LLC Tyre Wilmington US $ 10 100.00% Pirelli Tire LLC
TP Commercial Solutions LLC TyreRome
(Georgia) US $ 10 100.00% TP Industrial Tires Inc.
TP Industrial Tires Inc. TyreRome
(Georgia) US $ 1 100.00% Pirelli Industrial S.r.l.

2016 ANNUAL REPORT
259
Company Business Headquarter Currency Share Capital % holding Held by
Central/South America
Argentina
Pirelli Neumaticos S.A.I.C. Tyre Buenos Aires Arg. Peso 101,325,176 66.50% Pirelli Tyre S.p.A.
28.50% Pirelli Industrial S.r.l.
5.00% Pirelli Pneus Ltda
TP Industrial Tyres S.A. Tyre Buenos Aires Arg. Peso 100,000 95.00% Pirelli Tyre S.p.A.
5.00% Pirelli Pneus Ltda
Brazil
Comercial e Importadora de Pneus Ltda Tyre Sao Paulo Bra. Real 101,427,384 64.00% Pirelli Comercial de Pneus Brasil LtdaCPA - Comercial e Importadora de Pneus Ltda Tyre Barueri Bra. Real 200,000 100.00%
Comercial e Importadora de Pneus Ltda
Ecosil - Industria Quimica do Brasil Ltda Tyre Meleiro Bra. Real 9,699,055 97.88% Pirelli Pneus Ltda
Pirelli Comercial de Pneus Brasil Ltda Tyre Sao Paulo Bra. Real 509,328,303 100.00% Pirelli Tyre S.p.A.
Pirelli Latam Participaçoes Ltda Tyre Sao Paulo Bra. Real 2,690,670 100.00% Pirelli Tyre S.p.A.
Pirelli Ltda Financial Sao Paulo Bra. Real 14,000,000 100.00% Pirelli & C. S.p.A.
Pirelli Pneus Ltda Tyre Santo Andrè Bra. Real 241,698,353 100.00% Pirelli Tyre S.p.A.
Pirelli Properties Ltda Financial Santo Andrè Bra. Real 2,000,000 100.00% Pirelli LtdaRF Centro de Testes de Produtos Automotivos Ltda Tyre
Elias Fausto (Sao Paulo) Bra. Real 6,812,000 100.00% Pirelli Pneus Ltda
TP Industrial de Pneus Brasil Ltda Tyre San Paolo Bra. Real 90,020,522 100.00% Pirelli Industrial S.r.l.TLM - Total Logistic Management Serviços de Logistica Ltda Tyre Santo Andrè Bra. Real 3,074,417 99.98% Pirelli Pneus Ltda
0.02% Pirelli Ltda
Chile
Pirelli Neumaticos Chile Ltda Tyre Santiago Chile Peso/000 1,918,451 84.98% Pirelli Comercial de Pneus Brasil Ltda
15.00% Pirelli Latam Participaçoes Ltda0.02% Pirelli Ltda
Colombia
Pirelli de Colombia SAS TyreSanta Fe De
Bogota Col. Peso/000 3,315,070 96.12% TP Industrial de Pneus Brasil Ltda
2.28% Pirelli de Venezuela C.A.
1.60%TLM - Total Logistic Management
Serviços de Logistica Ltda
Pirelli Tyre Colombia S.A.S. TyreSanta Fe De
Bogota Col. Peso/000 222,522 85.00% Pirelli Comercial de Pneus Brasil Ltda15.00% Pirelli Latam Participaçoes Ltda
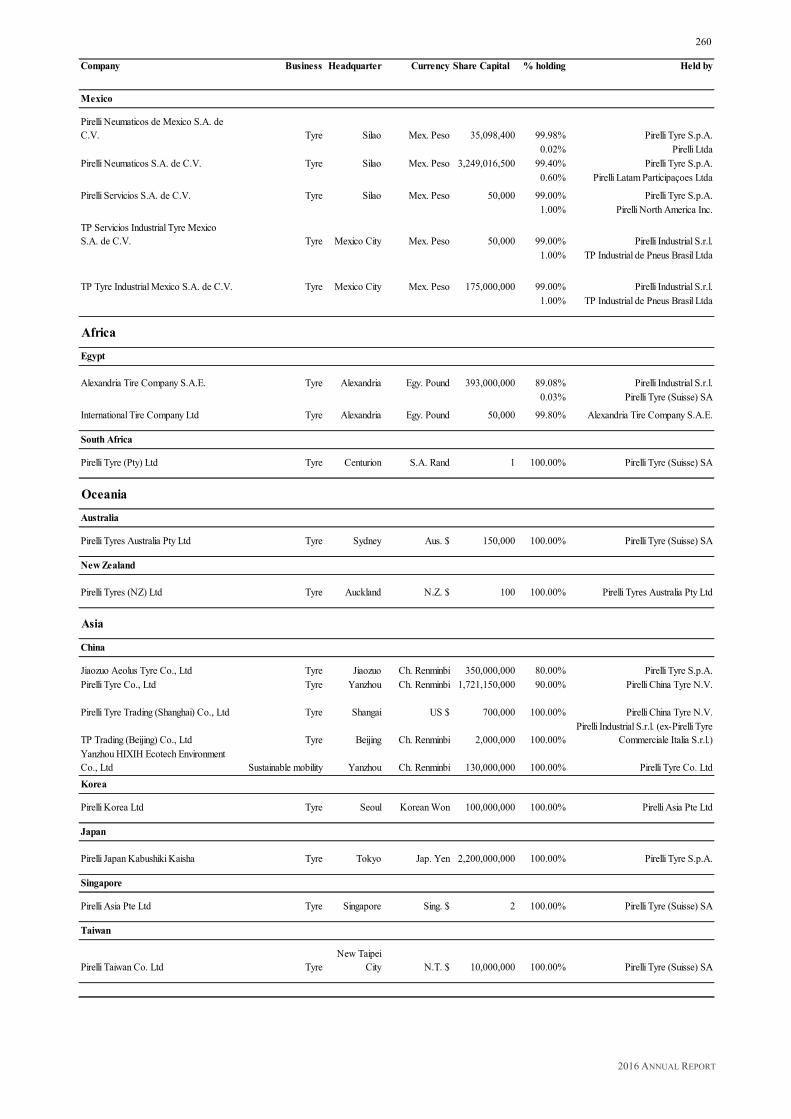
2016 ANNUAL REPORT
260
Company Business Headquarter Currency Share Capital % holding Held by
Mexico
Pirelli Neumaticos de Mexico S.A. de C.V. Tyre Silao Mex. Peso 35,098,400 99.98% Pirelli Tyre S.p.A.
0.02% Pirelli LtdaPirelli Neumaticos S.A. de C.V. Tyre Silao Mex. Peso 3,249,016,500 99.40% Pirelli Tyre S.p.A.
0.60% Pirelli Latam Participaçoes Ltda
Pirelli Servicios S.A. de C.V. Tyre Silao Mex. Peso 50,000 99.00% Pirelli Tyre S.p.A.1.00% Pirelli North America Inc.
TP Servicios Industrial Tyre Mexico S.A. de C.V. Tyre Mexico City Mex. Peso 50,000 99.00% Pirelli Industrial S.r.l.
1.00% TP Industrial de Pneus Brasil Ltda
TP Tyre Industrial Mexico S.A. de C.V. Tyre Mexico City Mex. Peso 175,000,000 99.00% Pirelli Industrial S.r.l.1.00% TP Industrial de Pneus Brasil Ltda
Africa
Egypt
Alexandria Tire Company S.A.E. Tyre Alexandria Egy. Pound 393,000,000 89.08% Pirelli Industrial S.r.l.0.03% Pirelli Tyre (Suisse) SA
International Tire Company Ltd Tyre Alexandria Egy. Pound 50,000 99.80% Alexandria Tire Company S.A.E.
South Africa
Pirelli Tyre (Pty) Ltd Tyre Centurion S.A. Rand 1 100.00% Pirelli Tyre (Suisse) SA
Oceania
Australia
Pirelli Tyres Australia Pty Ltd Tyre Sydney Aus. $ 150,000 100.00% Pirelli Tyre (Suisse) SA
New Zealand
Pirelli Tyres (NZ) Ltd Tyre Auckland N.Z. $ 100 100.00% Pirelli Tyres Australia Pty Ltd
Asia
China
Jiaozuo Aeolus Tyre Co., Ltd Tyre Jiaozuo Ch. Renminbi 350,000,000 80.00% Pirelli Tyre S.p.A.Pirelli Tyre Co., Ltd Tyre Yanzhou Ch. Renminbi 1,721,150,000 90.00% Pirelli China Tyre N.V.
Pirelli Tyre Trading (Shanghai) Co., Ltd Tyre Shangai US $ 700,000 100.00% Pirelli China Tyre N.V.
TP Trading (Beijing) Co., Ltd Tyre Beijing Ch. Renminbi 2,000,000 100.00%Pirelli Industrial S.r.l. (ex-Pirelli Tyre
Commerciale Italia S.r.l.)Yanzhou HIXIH Ecotech Environment Co., Ltd Sustainable mobility Yanzhou Ch. Renminbi 130,000,000 100.00% Pirelli Tyre Co. LtdKorea
Pirelli Korea Ltd Tyre Seoul Korean Won 100,000,000 100.00% Pirelli Asia Pte Ltd
Japan
Pirelli Japan Kabushiki Kaisha Tyre Tokyo Jap. Yen 2,200,000,000 100.00% Pirelli Tyre S.p.A.
Singapore
Pirelli Asia Pte Ltd Tyre Singapore Sing. $ 2 100.00% Pirelli Tyre (Suisse) SA
Taiwan
Pirelli Taiwan Co. Ltd TyreNew Taipei
City N.T. $ 10,000,000 100.00% Pirelli Tyre (Suisse) SA
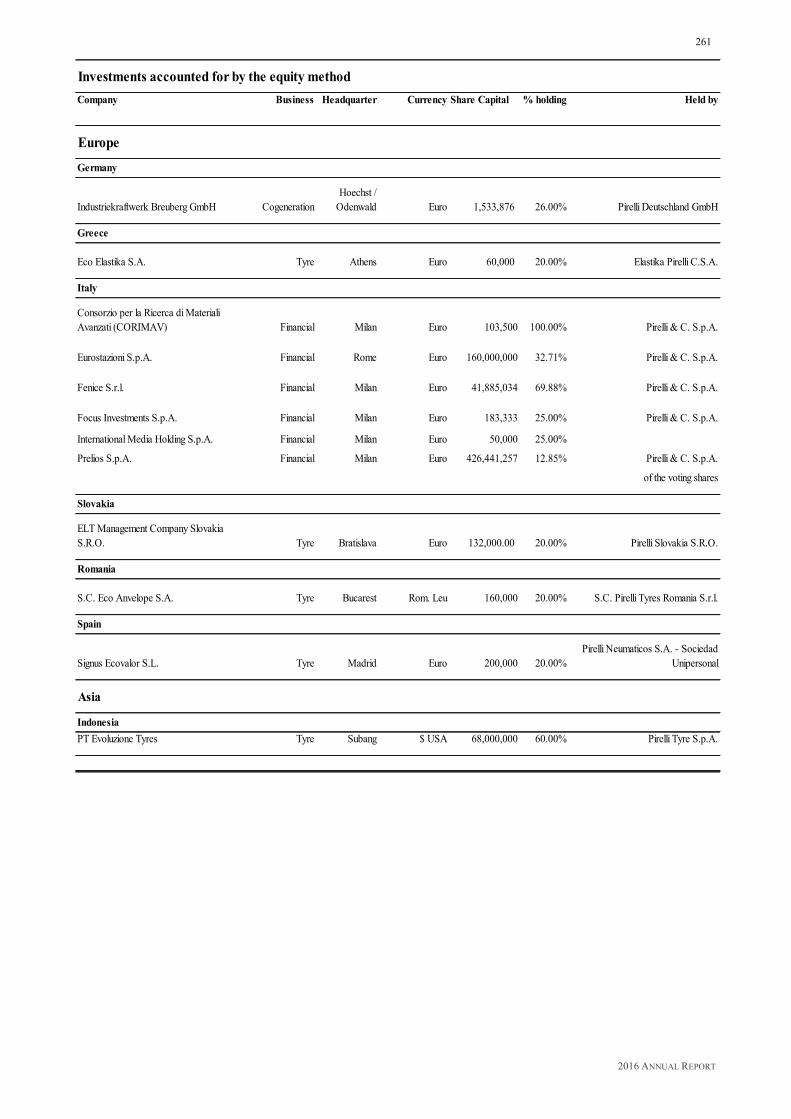
2016 ANNUAL REPORT
261
Investments accounted for by the equity methodCompany Business Headquarter Currency Share Capital % holding Held by
Europe
Germany
Industriekraftwerk Breuberg GmbH CogenerationHoechst /
Odenwald Euro 1,533,876 26.00% Pirelli Deutschland GmbH
Greece
Eco Elastika S.A. Tyre Athens Euro 60,000 20.00% Elastika Pirelli C.S.A.
Italy
Consorzio per la Ricerca di Materiali Avanzati (CORIMAV) Financial Milan Euro 103,500 100.00% Pirelli & C. S.p.A.
Eurostazioni S.p.A. Financial Rome Euro 160,000,000 32.71% Pirelli & C. S.p.A.
Fenice S.r.l. Financial Milan Euro 41,885,034 69.88% Pirelli & C. S.p.A.
Focus Investments S.p.A. Financial Milan Euro 183,333 25.00% Pirelli & C. S.p.A.
International Media Holding S.p.A. Financial Milan Euro 50,000 25.00%
Prelios S.p.A. Financial Milan Euro 426,441,257 12.85% Pirelli & C. S.p.A.
of the voting shares
Slovakia
ELT Management Company Slovakia S.R.O. Tyre Bratislava Euro 132,000.00 20.00% Pirelli Slovakia S.R.O.
Romania
S.C. Eco Anvelope S.A. Tyre Bucarest Rom. Leu 160,000 20.00% S.C. Pirelli Tyres Romania S.r.l.
Spain
Signus Ecovalor S.L. Tyre Madrid Euro 200,000 20.00%Pirelli Neumaticos S.A. - Sociedad
Unipersonal
Asia
IndonesiaPT Evoluzione Tyres Tyre Subang $ USA 68,000,000 60.00% Pirelli Tyre S.p.A.

2016 ANNUAL REPORT
262
Other investments considered Company Business Headquarter Currency Share Capital % holding Held by
Belgium
Euroqube S.A. (in liquidation) Services Brussels Euro 84,861,116 17.79% Pirelli & C. S.p.A.
France
Aliapur S.A. Tyre Lion Euro 262,500 14.29% Pneus Pirelli S.A.S.
Italy
Fin. Priv. S.r.l. Financial Milan Euro 20,000 14.29% Pirelli & C. S.p.A.
Poland
Centrum Utylizacji Opon Organizacja Odzysku S.A. Tyre Warsaw Pol. Zloty 1,008,000 14.29% Pirelli Polska Sp. ZO.O.
United Kingdom
Tlcom I Ltd Partnership Financial London Euro 1,154 10.83% Pirelli UK Ltd
Czech Republic
ELT Management Company Czech Republic S.R.O. Tyre Kasirova Czech crown 5,940,000.00 16.67% Pirelli Tyre (Suisse) SA
Venezuela
Pirelli de Venezuela C.A. Tyre Valencia Ven. Bolivar/000 20,062,679 96.22% Pirelli Tyre S.p.A.
(*) Subsidiary deconsolidated at 31.12.2015 with 96.22% of share capital in possession
2016 ANNUAL REPORT
263
06. Parent Financial Statements at December 31, 2016

2016 ANNUAL REPORT
264
Financial Statements Format STATEMENT OF FINANCIAL POSITION (in euro)
7 Property, plant and equipment 43,420,596 95,168,6618 Intangible assets 2,275,835,098 6,595,4759 Investments in subsidiaries 4,930,701,308 1,141,926,126
10 Investments in associates 33,077,976 134,332,22711 Other financial assets 182,561,819 199,062,05812 Other receivables 14,829,806 15,499,628
Non-current assets 7,480,426,603 1,592,584,17513 Trade receivables 61,691,992 41,687,15112 Other receivables 651,850,183 984,868,24514 Cash and cash equivalents 1,805,342 146,15215 Tax receivables 84,621,445 38,300,31716 Derivative financial instruments 515,329 339,959
Current assets 800,484,291 1,065,341,824Total assets 8,280,910,894 2,657,925,999
Equity:- Share capital 1,342,280,641 1,343,285,421- Other reserves 1,490,073,812 261,111,674- Retained earnings reserve 305,401,651 311,232,731- Net income (loss) for the period 68,477,271 (1,701,751)
17 Total Equity 3,206,233,375 1,913,928,075
184,103,995,774 101,332,467
22 Other payables 310,771 6,562,75119 Provisions for liabilities and charges 45,950,392 14,346,12720 Employee benefit obligations 3,964,639 2,103,61723 Provision for deferred tax liabilities 633,330,000 -
Non-current liabilities 4,787,551,576 124,344,962
18 192,055,076 523,734,31321 Trade payables 32,425,237 40,932,46422 Other payables 37,125,846 34,374,69619 Provisions for liabilities and charges 5,476,807 400,00124 Tax payables 20,042,977 20,211,488
Current liabilities 287,125,943 619,652,962
Total Liabilities and Equity 8,280,910,894 2,657,925,999
12/31/2016 12/31/2015
Borrowings from banks and other financial institutions
Borrowings from banks and other financial institutions
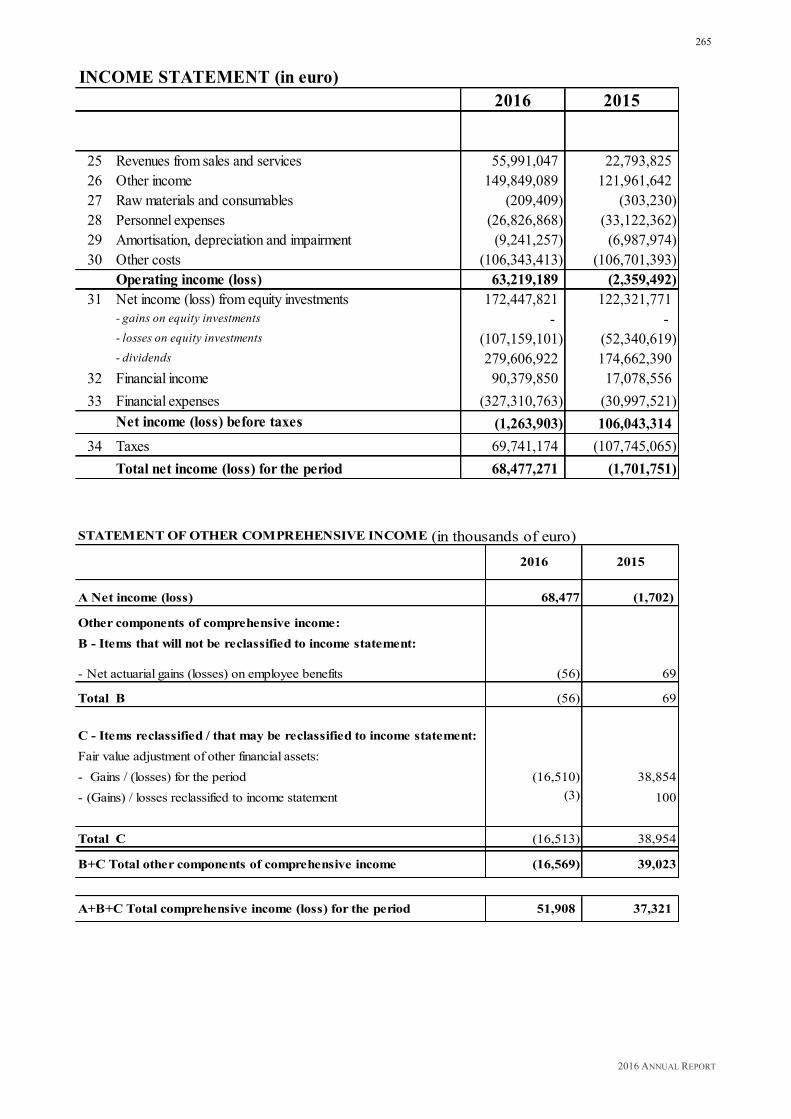
2016 ANNUAL REPORT
265
INCOME STATEMENT (in euro)
25 Revenues from sales and services 55,991,047 22,793,82526 Other income 149,849,089 121,961,64227 Raw materials and consumables (209,409) (303,230)28 Personnel expenses (26,826,868) (33,122,362)29 Amortisation, depreciation and impairment (9,241,257) (6,987,974)30 Other costs (106,343,413) (106,701,393)
Operating income (loss) 63,219,189 (2,359,492)31 Net income (loss) from equity investments 172,447,821 122,321,771
- gains on equity investments - - - losses on equity investments (107,159,101) (52,340,619)- dividends 279,606,922 174,662,390
32 Financial income 90,379,850 17,078,55633 Financial expenses (327,310,763) (30,997,521)
Net income (loss) before taxes (1,263,903) 106,043,31434 Taxes 69,741,174 (107,745,065)
Total net income (loss) for the period 68,477,271 (1,701,751)
20152016
STATEMENT OF OTHER COMPREHENSIVE INCOME (in thousands of euro)
2016 2015
A Net income (loss) 68,477 (1,702)
Other components of comprehensive income:B - Items that will not be reclassified to income statement:
- Net actuarial gains (losses) on employee benefits (56) 69
Total B (56) 69
C - Items reclassified / that may be reclassified to income statement:Fair value adjustment of other financial assets:- Gains / (losses) for the period (16,510) 38,854 - (Gains) / losses reclassified to income statement (3) 100
Total C (16,513) 38,954 - -
B+C Total other components of comprehensive income (16,569) 39,023
A+B+C Total comprehensive income (loss) for the period 51,908 37,321

2016 ANNUAL REPORT
266
Share Capital
Legal Reserve
Merger Reserve
(Pirelli & C.)
Other reserves
IAS Reserve
Merger Reserve
(BidCo acquisition)
Cash Flow Hedge
Reserve
Retained earnings Reserve
Net Income
(loss) for the period
Total
Total at 12/31/2014 1,343,285 139,215 12,467 - 57,510 - - 245,739 257,964 2,056,180 Profit Allocation as per resolution of May 14, 2015: - - Dividends - - - - - - - - (179,572) (179,572)- Legal Reserve - 12,898 - - - - - - (12,898) - - Reatined Earnings - - - - - - - 65,494 (65,494) - Other components of comprehensive income - - - - 39,021 - - - - 39,021
Net income (loss) for the period - - - - - - - - (1,702) (1,702)Total at 12/31/2015 1,343,285 152,113 12,467 - 96,531 - - 311,233 (1,702) 1,913,928
Profit Allocation as per resolution of April 27, 2016 - - Dividends - - - - - - - - - - - Legal Reserve - - - - - - - - - - - Retained Earnings - - - - - - - (1,702) 1,702 - Other components of comprehensive income - - - - (16,569) - - - - (16,569)Other changes - - - 92,535 (92,535) - 270 315 - 585Purchase of special shares (1,004) - - - - - - (4,444) - (5,448)
Merger with Marco Polo Industrial Holding S.p.A. - - - - - 1,245,261 - - - 1,245,261Net income (loss) for the period - - - - - - - - 68,477 68,477Total at 12/31/2016 1,342,281 152,113 12,467 92,535 (12,573) 1,245,261 270 305,402 68,477 3,206,233
STATEMENT OF CHANGES IN EQUITY (in thousands of euro)
(in thousands of euro)Reserve for Fair
Value adjustment of financial assets
available-for-sale
Reserve for actuarial
gains/losses
Total
Balance at 12/31/2014 55,512 1,998 57,510 Other components of comprehensive income 38,952 69 39,021
Balance at 12/31/2015 94,464 2,067 96,531 Other components of comprehensive income (16,513) (56) (16,569) Other (92,535) - (92,535)
Balance at 12/31/2016 (14,584) 2,011 (12,573)
IAS Reserve
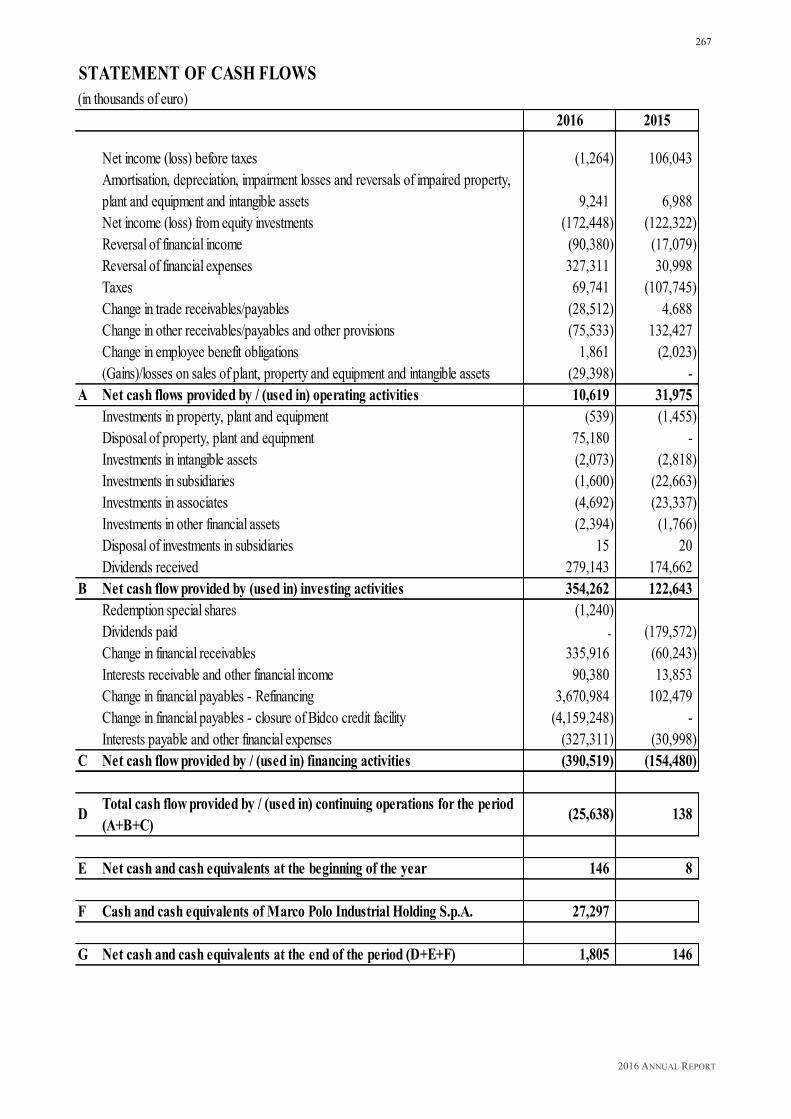
2016 ANNUAL REPORT
267
STATEMENT OF CASH FLOWS(in thousands of euro) 2016 2015
Net income (loss) before taxes (1,264) 106,043Amortisation, depreciation, impairment losses and reversals of impaired property, plant and equipment and intangible assets 9,241 6,988Net income (loss) from equity investments (172,448) (122,322)Reversal of financial income (90,380) (17,079)Reversal of financial expenses 327,311 30,998Taxes 69,741 (107,745)Change in trade receivables/payables (28,512) 4,688Change in other receivables/payables and other provisions (75,533) 132,427Change in employee benefit obligations 1,861 (2,023)(Gains)/losses on sales of plant, property and equipment and intangible assets (29,398) -
A Net cash flows provided by / (used in) operating activities 10,619 31,975Investments in property, plant and equipment (539) (1,455)Disposal of property, plant and equipment 75,180 - Investments in intangible assets (2,073) (2,818)Investments in subsidiaries (1,600) (22,663)Investments in associates (4,692) (23,337)Investments in other financial assets (2,394) (1,766)Disposal of investments in subsidiaries 15 20Dividends received 279,143 174,662
B Net cash flow provided by (used in) investing activities 354,262 122,643Redemption special shares (1,240)Dividends paid - (179,572)Change in financial receivables 335,916 (60,243)Interests receivable and other financial income 90,380 13,853Change in financial payables - Refinancing 3,670,984 102,479Change in financial payables - closure of Bidco credit facility (4,159,248) - Interests payable and other financial expenses (327,311) (30,998)
C Net cash flow provided by / (used in) financing activities (390,519) (154,480)
D Total cash flow provided by / (used in) continuing operations for the period (A+B+C)
(25,638) 138
E Net cash and cash equivalents at the beginning of the year 146 8
F Cash and cash equivalents of Marco Polo Industrial Holding S.p.A. 27,297
G Net cash and cash equivalents at the end of the period (D+E+F) 1,805 146
2016 ANNUAL REPORT
268
Explanatory Notes
1. General Information
Pirelli & C. S.p.A. (hereinafter also the “Company” or “Parent Company”) is a company with legal status organised pursuant to the laws of the Italian Republic. Founded in 1872 it is a Parent Company that manages, coordinates and finances the operations of its subsidiaries (hereinafter the Pirelli Group). As of the date of these separate Financial Statements ("separate Financial Statements") the Company's main investments are its shareholding in Pirelli Tyre S.p.A. - a company active in the tyre sector - of which it owns 100% of the share capital, and 100% of TP Industrial Holding S.p.A., a holding company which indirectly controls, as of December 31, 2016, 52% of the Pirelli Industrial sector. On December 31, 2016 the demerger between Pirelli Tyre S.p.A., the demerged company, and TP Industrial Holding S.p.A. (formerly Pirelli Labs S.p.A.) the beneficiary company, came into effect. As a result of this demerger the company receiving the majority shareholding of 52%, was assigned the share capital of Pirelli Industrial S.r.l. for a net carrying amount of euro 198,666 thousand. The registered Head Office of the Company is located in Milan, Italy. As a result of the Public Offer launched during 2015 by Marco Polo Industrial Holding S.p.A., ("Marco Polo") and the subsequent acquisition of the ordinary shares of Pirelli & C. S.p.A. which led to Marco Polo owning 100% of the shares of that category, the ordinary shares acquired on October 6, 2015 have been delisted. Furthermore, the Extraordinary Shareholders’ Meeting of Pirelli & C. S.p.A. on February 15, 2016, approved the proposal for the mandatory conversion of the savings shares into newly issued special category unlisted shares without voting rights. It was also as a result of this resolution that the savings shares were delisted, as of February 26, 2016. Subsequently the Company took advantage of the option of redemption provided for by the Articles of Association and acquired the special category shares held by minority shareholders. The merger for the incorporation of Marco Polo Industrial Holding S.p.A. into Pirelli & C. S.p.A., (the so-called inverse merger), became effective as of June 1, 2016. As of the aforesaid date, the Company is subject to the management and coordination of Marco Polo International Italy S.p.A., which fully controls the share capital of Marco Polo International Holding Italy S.p.A., the current sole shareholder of Pirelli & C. S.p.A..

2016 ANNUAL REPORT
269
The essential data of the statutory Financial Statements at December 31, 2015 of Marco Polo International Italy S.p.A., the company which excercises management and coordination, was as follows:
STATEMENT OF FINANCIAL POSITION(in thousands of euro)
Investments in subsidiaries 3,273,773Other non-current assets 3Cash and cash equivalent 8,289Other current receivables 11TOTAL ASSETS 3,282,076Equity 2,792,321
Other current payables 489,755TOTAL LIABILITIES AND EQUITY 3,282,076
INCOME STATEMENT(in thousands of euro) 12/31/2015Costs for services (63)Other costs (2)Financial expenses (689)NET INCOME (LOSS) (754)
12/31/2015
The merger generated in the incorporating company Pirelli & C. S.p.A. a merger deficit of euro 5,394 million and a merger reserve of euro 1,245 million. In applying the provisions of the document, the Assirevi Preliminary Guidelines for the IFRS OPI No. 2 (Revised), issued by Assirevi, the Italian Association of Auditors, the Company has allocated the merger deficit in accordance with that recorded in the consolidated Financial Statements due to the effects of the completion of the Purchase Price Allocation. The adjustments to the fair value of the assets and liabilities were as follows:
- detection under intangible assets of the value of the Pirelli Brand at euro 2,270 million (euro 1,637 million net of tax effects) for which it was maintained that the requirements for it to be classified as an intangible fixed asset with an indefinite useful life had been met;
- allocation to the investments in Pirelli Tyre S.p.A. (the amount of euro 3,630 million) and in TP Industrial Holding S.p.A. (the amount of euro 162 million).
- detection of a provision for contingent liabilities identified during the Purchase Price Allocation (for the amount of euro 34 million).

2016 ANNUAL REPORT
270
2. Basis of Presentation
FINANCIAL STATEMENTS The separate Financial Statements at December 31, 2016 consist of the Statement of Financial Position, the Income Statement, the Statement of Comprehensive Income, the Statement of Changes in Equity, the Statement of Cash Flows and the Explanatory Notes, and are accompanied by the Directors’ Report on Operations.
The format adopted for the Statement of Financial Position classifies assets and liabilities as current and non-current. The components of gains/losses for the financial year have been presented in a separate Income Statement, rather than include these components directly in the Statement of Comprehensive Income. The format adopted for the Income Statement provides for the classification of costs by nature. The Statement of Other Comprehensive Income includes the results for the financial year and, for the homogeneous categories, the revenues and expenses are recognised directly in equity in accordance with the IFRS. The Company has opted to present both the tax effects and reclassifications in the Income Statement. These were recognised directly in the Statement of Comprehensive Income under Equity in previous financial years, and not in the Explanatory Notes. The Statement of Changes in Equity includes the amounts from operations with equity holders and the changes in retained earnings which occurred during the financial year.
In the Statement of Cash Flows, the cash flows deriving from operating activities have been presented using the indirect method and according to which profit or loss for the period was subject to adjustment by the effects of non-monetary items or by any deferment or accrual of the past or future collection or operating payments, and by any revenue or cost items connected with any cash flows arising from investment or financial activities.
The Statement of Financial Position and Income Statement are presented in euro, while the Statement of Comprehensive Income, the Statement of Cash Flows, the Statement of Changes in Equity and the values stated in the Explanatory Notes, are presented in thousands of euro unless otherwise specified.
3. Accounting Standards
As a result of the approval by the Shareholders of the mandatory conversion of the savings shares into newly issued unlisted special category shares without voting rights, as of February 26, 2016, the Company no longer had any shares listed on the Milan Stock Exchange. The company shall continue to prepare the consolidated Financial Statements in accordance with the IFRS, availing itself of the option granted by Art. 3 of Legislative Decree No. 38/2005. IFRS include the IFRS international accounting standards in force, issued by the International Accounting Standards Board (IASB) and approved by the European Union at December 31, 2016 as well as all the revised accounting standards (IAS) and all the interpretations of the International Financial Reporting Interpretations Committee (IFRIC), formerly the Standing Interpretations Committee (SIC). The separate Financial Statements have been prepared using the historical costs basis except for derivative financial instruments and financial assets available for sale, which have been reported at their fair value. The separate Financial Statements have been prepared on a going concern basis. Information concerning the principal risks and uncertainties has been summarised in the Directors’ Report on Operations.

2016 ANNUAL REPORT
271
The accounting standards used to prepare the separate Financial Statements are the same as those used for the preparation of the consolidated Financial Statements where applicable, except for the evaluation of the investments in subsidiaries and associates, and dividends, as described below. With regard to the international accounting standards and/or interpretations which have been issued but have not yet entered into force and/or have not yet been approved, the findings regarding IFRS 9 - Financial Instruments, IFRS 15 - Revenue from Contracts with Customers and IFRS 16 – Leases, were as follows:
• as regards the new IFRS 9, the Company is evaluating the early adoption on January 1, 2017. Based on a preliminary analysis, the company expects that the main impacts could derive from the application of the new impairment rules for financial assets;
• as regards the new IFRS 15, the Company expects to apply the new standard as of the date of its entry into force. Based on a preliminary analysis the Group does not envisage significant impacts from the future application of the standard. In any case, an analysis is currently underway of the royalties contracts, for which the moment as to when revenue is recognised could be different from the current standard;
• as regards the new IFRS 16, the Group expects to apply the new standard as of the date of its entry into force. During the course of 2017, the Group will conduct a preliminary analysis in order to quantify the potential effects of the new standard on the Financial Statements, both in terms of the Statement of Financial Position and the Income Statement.
INVESTMENTS IN SUBSIDIARIES AND ASSOCIATES Investments in subsidiaries and associates have been recognised at cost and adjusted for any impairment in accordance the provisions of IAS 27. In the event that any loss attributable to the Company exceeds the carrying amount for the investment and whereby the investing Company is obliged to fulfill the legal or implicit obligations of the subsidiary or associate, or in any case to cover its losses, any excess in the carrying amount is recognised in a specific reserve for liabilities under Provisions for Liabilities and Charges. In the presence of specific impairment indicators, the value of investments is subjected to impairment tests. For the purposes of the impairment test, the carrying value of the investment is compared with the recoverable value, defined as the higher amount between the fair value less costs to sell, and the value in use. If the recoverable amount of an investment is lower than the carrying amount, the latter is reduced to the recoverable amount. This reduction constitutes an impairment, which is recognised in the Income Statement. For the purposes of impairment testing, in the case of investments in listed companies, the fair value is determined by referring to the market value of the investment regardless of the percentage of ownership. In the case of investments in unlisted companies, the fair value is determined using estimates based on the best available information. The use value is determined by applying the Discounted Cash Flow – asset side criterion, which is acceptable under the relevant accounting standards, and which consists of calculating the present value of the future cash flows estimated to be generated by the subsidiary or associate, including cash flows arising from operating activities and the final payment deriving from the disposal of the investment. If the reason for any previous impairment ceases to exist, the carrying amount for the investment is restored and allocated to the Income Statement, but not exceeding the original cost.

2016 ANNUAL REPORT
272
DIVIDENDS Dividends are recognised in the Income Statement when the right to collect is established, which normally corresponds to a resolution approved by the Shareholders’ Meeting for the distribution of dividends. 4. Financial Risk Management Policy
The Pirelli Group is exposed to financial risks which are principally associated with exchange rates, fluctuations in interest rates, the price of financial assets held as investments, the ability of customers to meet their obligations to the Group (credit risk), and raising funds on the market (liquidity risk). Financial risk management is an integral part of the Group's business management and is performed centrally in accordance with the guidelines issued by the Finance Department as part of the risk management strategies more generally defined by the Managerial Risk Committee. 4.1 Types of Financial Risks
EXCHANGE RATE RISK This risk is generated by commercial and financial transactions executed in currencies other than the Euro. Exchange rate fluctuations between the time when the commercial or financial relationship is established and the time when the transaction is completed (collection or payment) may generate exchange rate gains or losses.
The Group's policy is to minimise the impact on the Income Statement of transaction risk linked to volatility. In order to achieve this objective, the Group's procedures provide that the Operating Units are responsible for the collection of all information inherent to positions subject to transaction risk. Coverage is then provided in the form of forward contracts which are entered into with the Group Treasury. The items subject to exchange rate risk are mainly represented by receivables and payables denominated in foreign currency. The Group Treasury is responsible for hedging the net position for each currency and, in accordance with the established guidelines and restrictions, it closes all risk positions by trading derivative hedging contracts on the market, which typically take the form of forward contracts. The Group does not consider it necessary to avail itself of the option for hedge accounting as provided for by IAS 39, in that the representation of the impacts on the Income Statement and the Statement of Financial Position of a hedging strategy for transaction risk is nevertheless substantially guaranteed even without the aforementioned option. Also to be noted is that as part of the one year and three year planning process, exchange rate forecasts are formulated for these time horizons, using the best information available on the market. The fluctuation in exchange rates between the time when the forecast is made and the time when the commercial or financial transaction occurs represents the transaction risk on future transactions. The opportunity to carry out hedging operations for future transactions are authorised on a case by case basis by the Finance Department and is subjected to continuous monitoring. Hedge accounting is used whenever the requisite conditions as provided for by IAS 39 are met.
2016 ANNUAL REPORT
273
INTEREST RATE RISK Interest rate risk is represented by the exposure to any change in the fair value or the future cash flows of a financial asset or liability due to fluctuations in the market interest rates.
The Group's policy tends to maintain the following ratio between fixed rate and variable rate exposures, in the order of 70% fixed and 30% variable. In order to maintain this trend ratio, the Group sets up derivative contracts, typically interest rate swaps, for hedging purposes. For such derivatives, hedge accounting is used when the requisite conditions as provided for by IAS 39 are met. As part of this policy the individual Group companies may present situations of greater or lesser exposure to changes in interest rates. The details at December 31, 2016, show that the Company reported a negative net financial (liquidity)/debt position with all its financial payables at variable rates, and with its financial receivables predominantly at variable rates. At December 31, 2015, the Company recorded a net financial (liquidity)/debt position where financial payables showed an allocation of 80% fixed rate and 20% variable rate, and financial receivables showed an allocation of 52% fixed rate and 48% variable rate. All other conditions being equal, a hypothetical increase or decrease of 0.50% in the level of interest rates - in the arc of a financial year - would result in a positive net impact on the Income Statement to the amount of euro 12,222 thousand in the event of an increase, and a negative net impact of euro 12,222 thousand in the event of a decrease. PRICE RISK ASSOCIATED WITH FINANCIAL ASSETS The Group's exposure to price risk is limited to the volatility of financial assets, such as listed and unlisted stocks and bonds. These assets are classified as financial assets available for sale. Derivatives hedges are not normally set up to limit the volatility of these assets. A positive change of +5% in the share price, all other conditions being equal, would result in a positive change to equity of euro 7,993 thousand (euro 8,860 thousand at December 31, 2015). A negative change of -5% in the share price, all other conditions being equal, would result in a negative change to equity of euro 7,993 thousand (euro 8,142 thousand at December 31, 2015). CREDIT RISK Credit risk represents the Group's exposure to potential losses resulting from the non-fulfilment of the commercial or financial obligations undertaken by counterparties. The Company's exposure to the commercial obligations is mainly in the form of receivables due from companies of the Group for financial obligations which are fully due from the companies of the Group. In order to limit the risk from commercial obligations towards third parties, Pirelli has implemented procedures to evaluate its customers’ potential and financial creditworthiness, to monitor expected incoming collection and payment outflows, and to take credit recovery action if and when necessary. The Company operates only with highly rated financial counterparties for the management of its temporary cash surpluses and constantly monitors its exposure to individual counterparties. The Company does not hold public debt instruments from any European country, and constantly monitors its net credit exposure to the banking system.
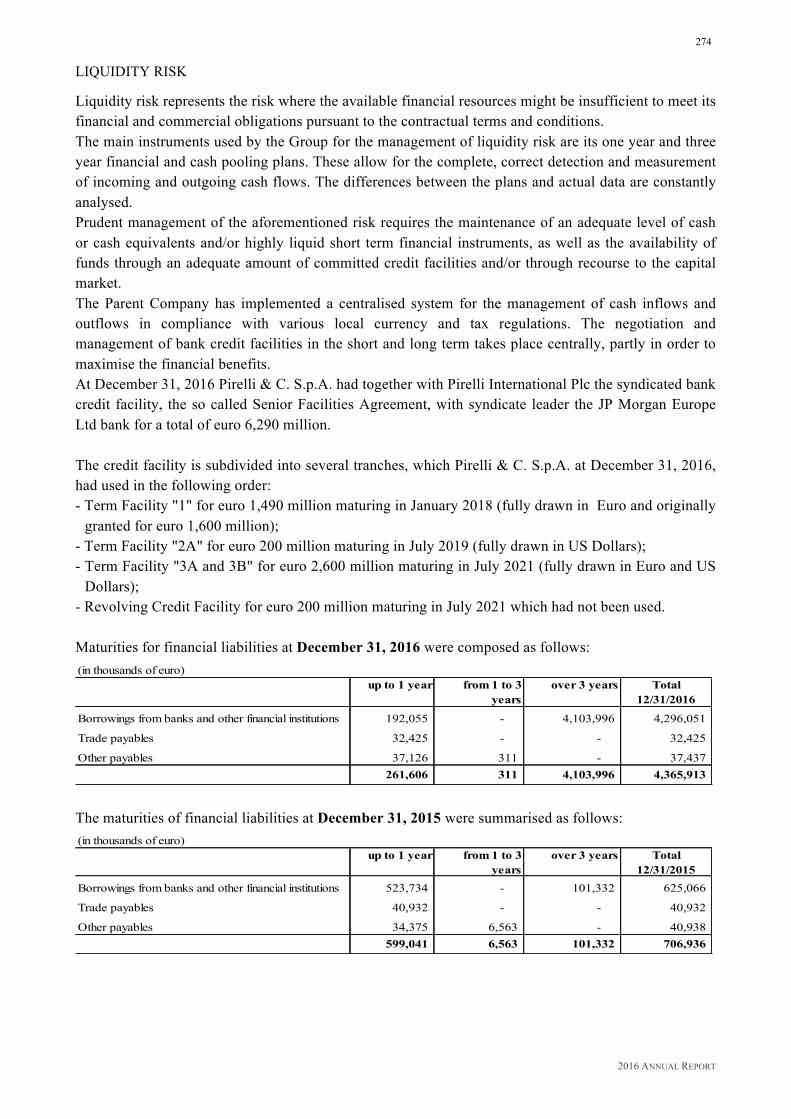
2016 ANNUAL REPORT
274
LIQUIDITY RISK Liquidity risk represents the risk where the available financial resources might be insufficient to meet its financial and commercial obligations pursuant to the contractual terms and conditions. The main instruments used by the Group for the management of liquidity risk are its one year and three year financial and cash pooling plans. These allow for the complete, correct detection and measurement of incoming and outgoing cash flows. The differences between the plans and actual data are constantly analysed. Prudent management of the aforementioned risk requires the maintenance of an adequate level of cash or cash equivalents and/or highly liquid short term financial instruments, as well as the availability of funds through an adequate amount of committed credit facilities and/or through recourse to the capital market. The Parent Company has implemented a centralised system for the management of cash inflows and outflows in compliance with various local currency and tax regulations. The negotiation and management of bank credit facilities in the short and long term takes place centrally, partly in order to maximise the financial benefits. At December 31, 2016 Pirelli & C. S.p.A. had together with Pirelli International Plc the syndicated bank credit facility, the so called Senior Facilities Agreement, with syndicate leader the JP Morgan Europe Ltd bank for a total of euro 6,290 million. The credit facility is subdivided into several tranches, which Pirelli & C. S.p.A. at December 31, 2016, had used in the following order: - Term Facility "1" for euro 1,490 million maturing in January 2018 (fully drawn in Euro and originally
granted for euro 1,600 million); - Term Facility "2A" for euro 200 million maturing in July 2019 (fully drawn in US Dollars); - Term Facility "3A and 3B" for euro 2,600 million maturing in July 2021 (fully drawn in Euro and US
Dollars); - Revolving Credit Facility for euro 200 million maturing in July 2021 which had not been used. Maturities for financial liabilities at December 31, 2016 were composed as follows: (in thousands of euro)
up to 1 year from 1 to 3 years
over 3 years Total 12/31/2016
Borrowings from banks and other financial institutions 192,055 - 4,103,996 4,296,051
Trade payables 32,425 - - 32,425
Other payables 37,126 311 - 37,437 261,606 311 4,103,996 4,365,913
The maturities of financial liabilities at December 31, 2015 were summarised as follows: (in thousands of euro)
up to 1 year from 1 to 3 years
over 3 years Total 12/31/2015
Borrowings from banks and other financial institutions 523,734 - 101,332 625,066
Trade payables 40,932 - - 40,932
Other payables 34,375 6,563 - 40,938 599,041 6,563 101,332 706,936

2016 ANNUAL REPORT
275
5. Information Regarding Fair Value
5.1 Fair Value Measurement
In relation to financial instruments measured at fair value, the following table shows the classification of these instruments on the basis of the hierarchy of levels pursuant to IFRS 13, which reflects the significance of the inputs used in determining the fair value. The following levels are defined as follows: − level 1 – unadjusted quotations recorded on an active market for assets or liabilities subject to
valuation; − level 2 – inputs different from the aforesaid prices quoted at the preceding level, which are
observable on the market either directly (as in the case of prices) or indirectly (because they are derived from prices);
− level 3 – inputs that are not based on observable market data. The following table shows assets valuated at fair value as at December 31, 2016, subdivided into the three levels defined above: (in thousands of euro)
Note Carrying amount at 12/31/2016
Level 1 Level 2 Level 3
Available-for-sale financial assets:Other financial assets-equities and shares 11 167,925 141,476 19,201 7,248 -investment funds 11 14,636 - 14,636 - Derivative hedging instrumentsCurrent derivative financial instruments 16 515 - 515 - Total 183,076 141,476 34,352 7,248 The repartitions at December 31, 2015 were as follows (in thousands of euro)
Note Carrying amount at 12/31/2015
Level 1 Level 2 Level 3
Available-for-sale financial assets:Other financial assets-equities and shares 11 184,584 154,324 23,576 6,684 -investment funds 11 14,478 - 14,478 - Derivative hedging instrumentsCurrent derivative financial instruments 16 340 - 340 - Total 199,402 154,324 38,394 6,684 During 2016, there were no transfers from level 1 to level 2 or vice versa. The following table shows the changes for financial assets which occurred in level 3: (in thousands of euro)
12/31/2016 12/31/2015Opening balance 6,684 12,295Increases 2,395 1,767Decreases (94) - Reclassification (3) 100 Valuation adjustment (2,290) (7,852) Fair value adjustments recognized in Equity 556 374Closing balance 7,248 6,684 During the course of the financial year, there were no transfers from level 3 to other levels or vice versa (refer to Note 11).
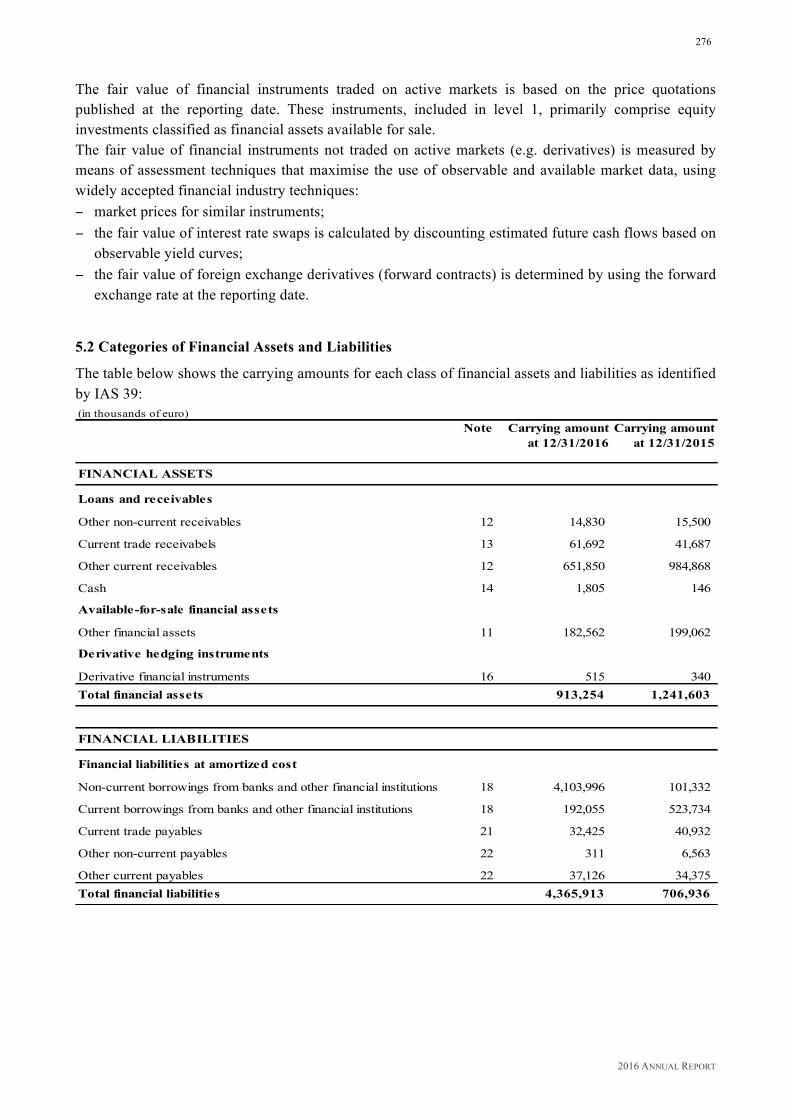
2016 ANNUAL REPORT
276
The fair value of financial instruments traded on active markets is based on the price quotations published at the reporting date. These instruments, included in level 1, primarily comprise equity investments classified as financial assets available for sale. The fair value of financial instruments not traded on active markets (e.g. derivatives) is measured by means of assessment techniques that maximise the use of observable and available market data, using widely accepted financial industry techniques: − market prices for similar instruments; − the fair value of interest rate swaps is calculated by discounting estimated future cash flows based on
observable yield curves; − the fair value of foreign exchange derivatives (forward contracts) is determined by using the forward
exchange rate at the reporting date. 5.2 Categories of Financial Assets and Liabilities
The table below shows the carrying amounts for each class of financial assets and liabilities as identified by IAS 39: (in thousands of euro)
Note Carrying amount at 12/31/2016
Carrying amount at 12/31/2015
FINANCIAL ASSETS
Loans and receivables
Other non-current receivables 12 14,830 15,500
Current trade receivabels 13 61,692 41,687
Other current receivables 12 651,850 984,868
Cash 14 1,805 146
Available-for-sale financial assets
Other financial assets 11 182,562 199,062
Derivative hedging instruments
Derivative financial instruments 16 515 340 Total financial assets 913,254 1,241,603
FINANCIAL LIABILITIES
Financial liabilities at amortized cost
Non-current borrowings from banks and other financial institutions 18 4,103,996 101,332
Current borrowings from banks and other financial institutions 18 192,055 523,734
Current trade payables 21 32,425 40,932
Other non-current payables 22 311 6,563
Other current payables 22 37,126 34,375 Total financial liabilities 4,365,913 706,936

2016 ANNUAL REPORT
277
6. Capital Management Policy
The Company’s objective is to maximise the return on net invested capital while maintaining the ability to operate over time, ensuring adequate returns for its shareholders and benefits for the other stakeholders through a sustainable financial structure. In order to achieve these objectives, in addition to the pursuance of satisfactory financial results and the generation of cash flows, the Company may intervene in the dividends policy and the configuration of the Company’s capital.
7. Property, Plant and Equipment
Changes which occurred during the 2015-2016 two year period are summarised in the following table: (in thousands of euro)GROSS VALUE Balance at
12/31/2014Increases Decreases Balance at
12/31/2015Increases Decreases Balance at
12/31/2016
Land 21,112 - - 21,112 - (12,091) 9,021Buildings 110,852 - - 110,852 475 (55,910) 55,417Plant and machinery 5,066 923 - 5,989 - (1,303) 4,686
Industrial and commercial equipment 1,193 - - 1,193 - (208) 985Other assets 14,155 532 (21) 14,666 64 (118) 14,612
152,378 1,455 (21) 153,812 539 (69,630) 84,721
ACCUMULATED DEPRECIATION
Balance at 12/31/2014
Depreciation Decreases Balance at 12/31/2015
Depreciation Decreases Balance at 12/31/2016
Buildings (39,348) (4,018) - (43,366) (3,974) 22,217 (25,123)Plant and machinery (4,806) (61) - (4,867) (219) 1,284 (3,802)Industrial and commercial equipment (1,158) (11) - (1,169) (7) 208 (968)Other assets (8,591) (671) 21 (9,241) (725) 76 (9,890)
(53,903) (4,761) 21 (58,643) (4,925) 23,785 (39,783)
IMPAIRMENT PROVISION
Balance at 12/31/2014
Impairment Decreases Balance at 12/31/2015
Impairment Decreases Balance at 12/31/2016
Buildings - - - - (1,515) - (1,515)Plant and machinery - - - - (4) - (4)
- - - - (1,518) - (1,518)
NET VALUE Balance at 12/31/2014
Increases/Decreases
Depreciation Balance at 12/31/2015
Increases/Decreases
Depreciation Balance at 12/31/2016
Land 21,112 - - 21,112 (12,091) - 9,021Buildings 71,504 - (4,018) 67,486 (56,950) 18,244 28,780Plant and machinery 260 923 (61) 1,122 (1,307) 1,065 880
Industrial and commercial equipment 35 - (11) 24 (208) 201 17Other assets 5,564 532 (671) 5,425 (54) (649) 4,722
98,475 1,455 (4,761) 95,169 (70,609) 18,861 43,421 No financial expenses were capitalised on property, plant and equipment. During the course of the 2016 financial year, buildings, plant and machinery located in the Bicocca – Milan area were impaired to the amount of euro 1,518 thousand. The decreases for the financial year refer to the disposal of the R&D building located in Milan, Italy and to the disposal of a building located in San Donato Milanese, Italy.

2016 ANNUAL REPORT
278
8. Intangible Assets
Changes which occurred during the 2015-2016 two year period were as follows:
(in thousands of euro)12/31/2014 Increases Amortisation 12/31/2015 Increases Decreases Reclassification Effect from PPA Amortisation 12/31/2016
Trademarks - - - - - - - 2,270,000 - 2,270,000
Software licenses 856 837 (268) 1,425 171 (35) -140 - (343) 1,078
Other:
- software expenses 180 - (132) 48 727 - - - (77) 698
- expenses for other projects 4,969 1,981 (1,828) 5,122 1,175 - 140 - (2,378) 4,059
TOTAL 6,005 2,818 (2,228) 6,595 2,073 (35) - 2,270,000 (2,798) 2,275,835
Increases for the financial year mainly include the expenses incurred for the acquisition of licenses (euro 171 thousand), for the implementation of management systems for staff (a project in the phases of development for euro 247 thousand), for the treasury (euro 178 thousand), plus euro 750 thousand for other projects also in the phases of development, and for the purchase of software applications (euro 726 thousand). The allocation of the effect from PPA of euro 2,270,000 thousand to the Pirelli Brand was consistent with the consolidated Financial Statements resulting from the completion of the Purchase Price Allocation. No impairment was carried out in the course of the 2016 financial year.
9. Investments in Subsidiaries
These amounted to euro 4,930,701 thousand (euro 1,141,926 thousand at December 31, 2015) which was an increase of euro 3,788,775 thousand compared to the previous financial year. These were composed as follows: (in thousands of euro)
12/31/2016 12/31/2015
Pirelli Servizi Amministrazioni e Tesoreria S.p.A. 3,238 3,238 Maristel S.p.A. 1,315 1,315 T.P. Industrial Holding S.p.A. già Pirelli Labs S.p.A. 364,351 4,079 Pirelli Sistemi Informativi S.r.l. 1,655 1,655 Pirelli & C. Ambiente S.r.l. - 2,878 Pirelli Tyre S.p.A. 4,521,792 1,090,755 Servizi Aziendali Pirelli S.C.p.A. 103 103 HB Servizi S.r.l. 364 - Pirelli Ltda 9,666 9,666 Pirelli UK ltd. 21,871 21,871 Pirelli Group Reinsurance Company S.A. 6,346 6,346 Pirelli Consumer Italia S.r.l. - 20TOTAL 4,930,701 1,141,926 A detailed statement pursuant to Article 2427 of the Italian Civil Code is provided in the attachments.

2016 ANNUAL REPORT
279
The changes which occurred are as follows: (in thousands of euro)
12/31/2016 12/31/2015Opening balance 1,141,926 1,141,058
Increases 200,266 27,557
Impairment (4,114) (21,775)
Decreases (198,686) (4,914)
Effect from PPA 3,791,309 -
Closing balance 4,930,701 1,141,926 The item increases refers mainly to the investment in TP Industrial Holding S.p.A., which totalled euro 198,666 thousand due to the effect of the demerger of Pirelli Tyre S.p.A., and to the payment into the capital account of HB Services S.r.l. of euro 1,600 thousand. The item impairment refers to the investment in Pirelli & C. Ambiente S.r.l. (euro 2,877 thousand) and in HB Servizi S.r.l. (euro 1,236 thousand). The value of the investments has been adjusted to its fair value which is estimated to be the carrying amount for equity. The item decreases which amounts to euro 198,686 thousand refers to euro 198,666 thousand for the reduction in value of the investment in Pirelli Tyre S.p.A. due to the effects of the demerger, and to the liquidation of Pirelli Consumer S.r.l. for euro 20 thousand. The allocation of the effect from PPA of euro 3,791,309 thousand, of which euro 3,629,703 thousand was allocated to the investment in Pirelli Tyre S.p.A. which holds 100% of the Consumer sector and 38% of the Industrial sector, and of which euro 161,606 thousand was allocated to the investment in T.P. Industrial Holding S.p.A. which in turn holds 52% of the investment in Pirelli Industrial S.r.l., (a sub-holding of the investment in the Pirelli industrial sector) was consistent with the evaluation carried out for the Industrial sector by an independent third party expert.
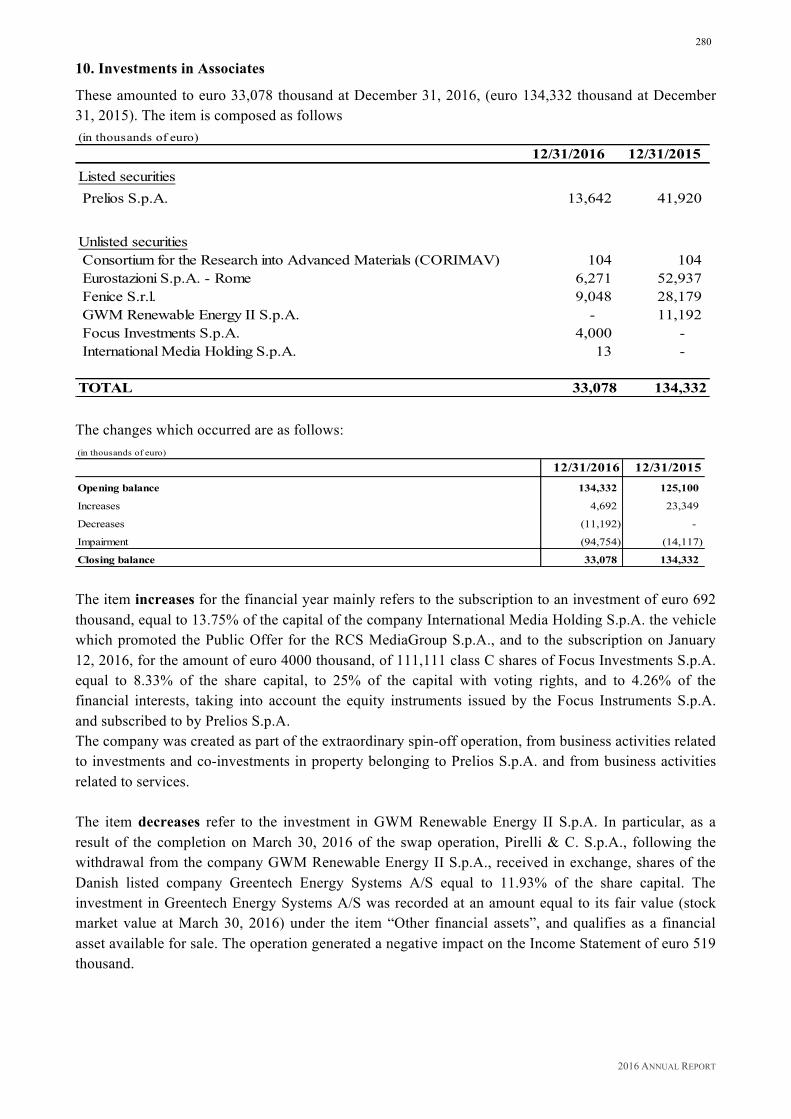
2016 ANNUAL REPORT
280
10. Investments in Associates
These amounted to euro 33,078 thousand at December 31, 2016, (euro 134,332 thousand at December 31, 2015). The item is composed as follows (in thousands of euro)
12/31/2016 12/31/2015Listed securities Prelios S.p.A. 13,642 41,920
Unlisted securities Consortium for the Research into Advanced Materials (CORIMAV) 104 104 Eurostazioni S.p.A. - Rome 6,271 52,937 Fenice S.r.l. 9,048 28,179 GWM Renewable Energy II S.p.A. - 11,192 Focus Investments S.p.A. 4,000 - International Media Holding S.p.A. 13 -
TOTAL 33,078 134,332 The changes which occurred are as follows: (in thousands of euro)
12/31/2016 12/31/2015Opening balance 134,332 125,100
Increases 4,692 23,349
Decreases (11,192) -
Impairment (94,754) (14,117)
Closing balance 33,078 134,332 The item increases for the financial year mainly refers to the subscription to an investment of euro 692 thousand, equal to 13.75% of the capital of the company International Media Holding S.p.A. the vehicle which promoted the Public Offer for the RCS MediaGroup S.p.A., and to the subscription on January 12, 2016, for the amount of euro 4000 thousand, of 111,111 class C shares of Focus Investments S.p.A. equal to 8.33% of the share capital, to 25% of the capital with voting rights, and to 4.26% of the financial interests, taking into account the equity instruments issued by the Focus Instruments S.p.A. and subscribed to by Prelios S.p.A. The company was created as part of the extraordinary spin-off operation, from business activities related to investments and co-investments in property belonging to Prelios S.p.A. and from business activities related to services. The item decreases refer to the investment in GWM Renewable Energy II S.p.A. In particular, as a result of the completion on March 30, 2016 of the swap operation, Pirelli & C. S.p.A., following the withdrawal from the company GWM Renewable Energy II S.p.A., received in exchange, shares of the Danish listed company Greentech Energy Systems A/S equal to 11.93% of the share capital. The investment in Greentech Energy Systems A/S was recorded at an amount equal to its fair value (stock market value at March 30, 2016) under the item “Other financial assets”, and qualifies as a financial asset available for sale. The operation generated a negative impact on the Income Statement of euro 519 thousand.
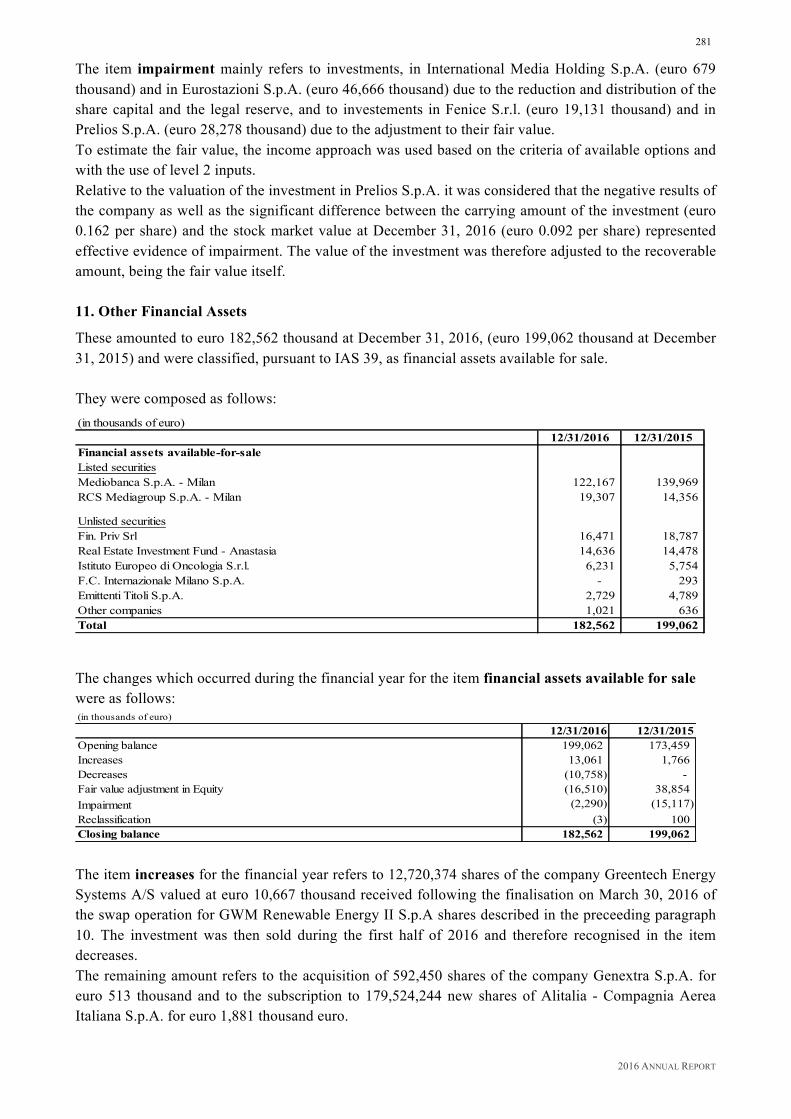
2016 ANNUAL REPORT
281
The item impairment mainly refers to investments, in International Media Holding S.p.A. (euro 679 thousand) and in Eurostazioni S.p.A. (euro 46,666 thousand) due to the reduction and distribution of the share capital and the legal reserve, and to investements in Fenice S.r.l. (euro 19,131 thousand) and in Prelios S.p.A. (euro 28,278 thousand) due to the adjustment to their fair value. To estimate the fair value, the income approach was used based on the criteria of available options and with the use of level 2 inputs. Relative to the valuation of the investment in Prelios S.p.A. it was considered that the negative results of the company as well as the significant difference between the carrying amount of the investment (euro 0.162 per share) and the stock market value at December 31, 2016 (euro 0.092 per share) represented effective evidence of impairment. The value of the investment was therefore adjusted to the recoverable amount, being the fair value itself. 11. Other Financial Assets
These amounted to euro 182,562 thousand at December 31, 2016, (euro 199,062 thousand at December 31, 2015) and were classified, pursuant to IAS 39, as financial assets available for sale. They were composed as follows: (in thousands of euro)
12/31/2016 12/31/2015Financial assets available-for-saleListed securitiesMediobanca S.p.A. - Milan 122,167 139,969 RCS Mediagroup S.p.A. - Milan 19,307 14,356
Unlisted securitiesFin. Priv Srl 16,471 18,787 Real Estate Investment Fund - Anastasia 14,636 14,478 Istituto Europeo di Oncologia S.r.l. 6,231 5,754 F.C. Internazionale Milano S.p.A. - 293 Emittenti Titoli S.p.A. 2,729 4,789 Other companies 1,021 636 Total 182,562 199,062
The changes which occurred during the financial year for the item financial assets available for sale were as follows: (in thousands of euro)
12/31/2016 12/31/2015Opening balance 199,062 173,459Increases 13,061 1,766Decreases (10,758) - Fair value adjustment in Equity (16,510) 38,854Impairment (2,290) (15,117)Reclassification (3) 100Closing balance 182,562 199,062 The item increases for the financial year refers to 12,720,374 shares of the company Greentech Energy Systems A/S valued at euro 10,667 thousand received following the finalisation on March 30, 2016 of the swap operation for GWM Renewable Energy II S.p.A shares described in the preceeding paragraph 10. The investment was then sold during the first half of 2016 and therefore recognised in the item decreases. The remaining amount refers to the acquisition of 592,450 shares of the company Genextra S.p.A. for euro 513 thousand and to the subscription to 179,524,244 new shares of Alitalia - Compagnia Aerea Italiana S.p.A. for euro 1,881 thousand euro.
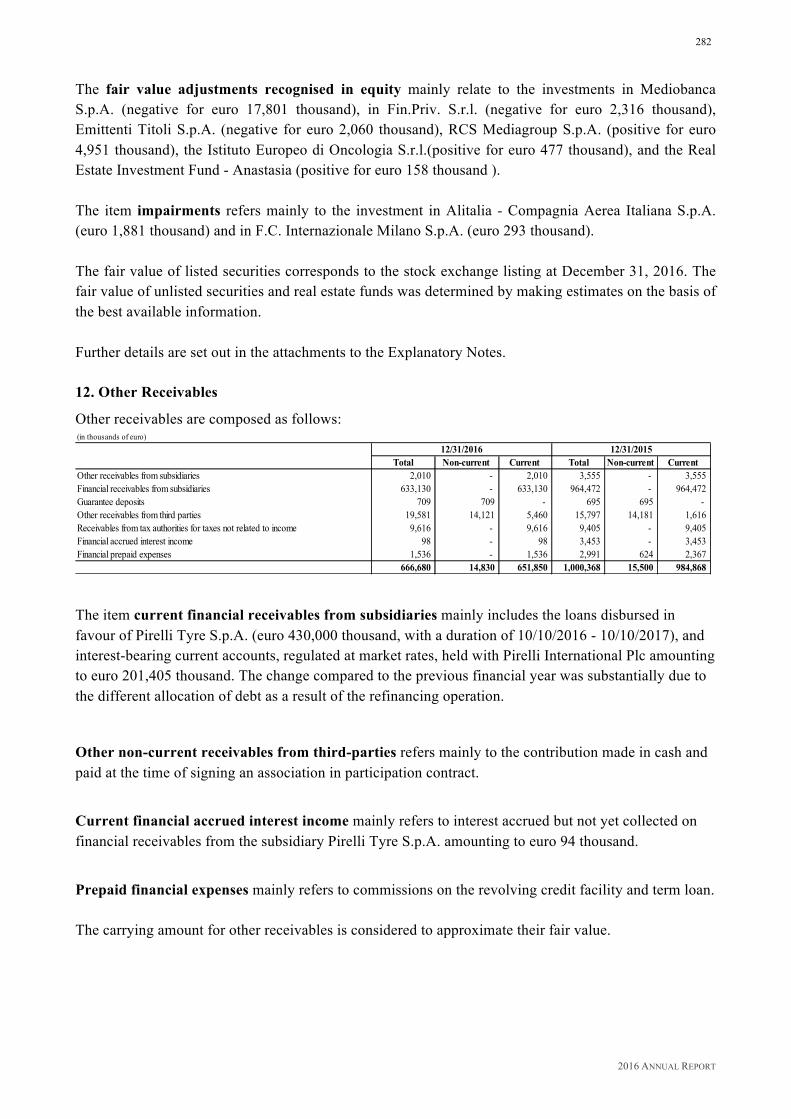
2016 ANNUAL REPORT
282
The fair value adjustments recognised in equity mainly relate to the investments in Mediobanca S.p.A. (negative for euro 17,801 thousand), in Fin.Priv. S.r.l. (negative for euro 2,316 thousand), Emittenti Titoli S.p.A. (negative for euro 2,060 thousand), RCS Mediagroup S.p.A. (positive for euro 4,951 thousand), the Istituto Europeo di Oncologia S.r.l.(positive for euro 477 thousand), and the Real Estate Investment Fund - Anastasia (positive for euro 158 thousand ). The item impairments refers mainly to the investment in Alitalia - Compagnia Aerea Italiana S.p.A. (euro 1,881 thousand) and in F.C. Internazionale Milano S.p.A. (euro 293 thousand). The fair value of listed securities corresponds to the stock exchange listing at December 31, 2016. The fair value of unlisted securities and real estate funds was determined by making estimates on the basis of the best available information. Further details are set out in the attachments to the Explanatory Notes. 12. Other Receivables
Other receivables are composed as follows: (in thousands of euro)
Total Non-current Current Total Non-current Current Other receivables from subsidiaries 2,010 - 2,010 3,555 - 3,555Financial receivables from subsidiaries 633,130 - 633,130 964,472 - 964,472Guarantee deposits 709 709 - 695 695 - Other receivables from third parties 19,581 14,121 5,460 15,797 14,181 1,616Receivables from tax authorities for taxes not related to income 9,616 - 9,616 9,405 - 9,405Financial accrued interest income 98 - 98 3,453 - 3,453Financial prepaid expenses 1,536 - 1,536 2,991 624 2,367
666,680 14,830 651,850 1,000,368 15,500 984,868
12/31/2016 12/31/2015
The item current financial receivables from subsidiaries mainly includes the loans disbursed in favour of Pirelli Tyre S.p.A. (euro 430,000 thousand, with a duration of 10/10/2016 - 10/10/2017), and interest-bearing current accounts, regulated at market rates, held with Pirelli International Plc amounting to euro 201,405 thousand. The change compared to the previous financial year was substantially due to the different allocation of debt as a result of the refinancing operation.
Other non-current receivables from third-parties refers mainly to the contribution made in cash and paid at the time of signing an association in participation contract.
Current financial accrued interest income mainly refers to interest accrued but not yet collected on financial receivables from the subsidiary Pirelli Tyre S.p.A. amounting to euro 94 thousand.
Prepaid financial expenses mainly refers to commissions on the revolving credit facility and term loan. The carrying amount for other receivables is considered to approximate their fair value.
2016 ANNUAL REPORT
283
13. Trade Receivables
These amounted to euro 61,692 thousand at December 31, 2016, compared to euro 41,687 thousand for the previous financial year. They are composed as follows:
(in thousands of euro)12/31/2016 12/31/2015
Receivables from subsidiaries 55,830 36,902
Receivables from associates 1,085 406
Receivables from other companies 8,836 7,481
Total receivables 65,751 44,789
Provision for bad debts (4,059) (3,102)61,692 41,687
Of the total trade receivables which amounted to euro 65,751 thousand (euro 44,789 thousand at December 31, 2015), euro 8,836 thousand were receivable from other companies (euro 7,481 thousand at December 31, 2015) of which euro 7,068 thousand fell due on December 31, 2016. The increase in trade receivables due from subsidiaries mainly refers to the revision of the service contract. Trade receivables which were due and past due have been impaired based on the Group's policies described in the paragraph on the management of credit risk under “Financial Risk Management Policy”. The impaired receivables include both significant individual positions subject to separate impairment, and positions with similar characteristics in terms of credit risk but which have been grouped and impaired on a collective basis.
The analysis of trade receivables by geographical area is as follows:
Receivables from subsidiaries
Receivables from other companies
Receivables from subsidiaries
Receivables from other companies
Italy 91.33% 67.26% 92.42% 79.26%
Rest of Europe 7.85% 1.42% 6.88% 20.40%
Other 0.82% 31.32% 0.70% 0.34%
100.00% 100.00% 100.00% 100.00%
12/31/2016 12/31/2015
Changes in the provision for bad debts are shown below: (in thousands of euro)
12/31/2016 12/31/2015
Opening balance 3,102 3,102
Increases/Decreases 957 -
Closing balance 4,059 3,102 The carrying amount for trade receivables is considered to approximate their fair value.
2016 ANNUAL REPORT
284
14. Cash and Cash Equivalents
These amounted to euro 1,805 thousand at December 31, 2016, (euro 146 thousand at December 31, 2015). (in thousands of euro)
12/31/2016 12/31/2015
Bank deposits 1,803 140
Cash on hand 2 6
1,805 146 15. Tax Receivables
These amounted to euro 84,621 thousand at December 31, 2016, (euro 38,300 thousand at December 31, 2015). Receivables from tax authorities relative to withholding taxes incurred abroad were compensated against payables to tax authorities comprised of IRES (corporate income tax) with a resulting offset of euro 23,451 thousand. In order to make the items comparable, the figures for the 2015 financial year have been restated (euro 23,805 thousand for 2015). The amount mainly includes: − receivables from Group companies participating in tax consolidation to the amount of euro 77,840
thousand (euro 27,842 thousand at December 31, 2015). This increase as compared to the previous financial year was largely due to the greater contribution of positive taxable income on the part of Pirelli Tyre S.p.A.;
− receivables from tax authorities for corporate income tax (IRES) for 2008/2014 of euro 5,347 thousand (euro 5,343 thousand at December 31, 2015).
16. Derivative Financial Instruments
This item amounted to euro 515 thousand at December 31, 2016, (euro 340 thousand at December 31, 2015) and refers to the accrual on hedging derivatives.
2016 ANNUAL REPORT
285
17. Equity
Equity amounted to euro 3,206,233 thousand at December 31, 2016, (euro 1,913,928 thousand at December 31, 2015). A merger reserve of euro 1,245 million was generated as a result of the reverse merger which took place on June 1, 2016. The analyses of these changes and their composition are provided in the main attachments to the Financial Statements. 17.1 Share Capital
The share capital at December 31, 2016 amounted to euro 1,345,381 thousand, and was represented by 201,983,902 ordinary shares and 5,641,312 special shares with no indication of the nominal value. The share capital, net of treasury shares, amounted to euro 1,310,635 thousand for ordinary shares and euro 31,646 thousand for special shares and therefore totalled euro 1,342,281 thousand. The total number of treasury shares, comprised 351,590 shares and 772,792 special shares, which represent 0.54% of the share capital. The table below shows an analysis of the availability and distributability of the individual equity items. (in thousands of euro)
Amount Possible use Available share
Summary of reserves use in
2013-2015
Share capital (1) 1,342,281 - - - Legal reserve 152,114 B 152,114 - Other reserves
- Merger Reserve (Pirelli & C. S.p.A.) 12,467 A, B, C 12,467 - - Other Reserves 92,535 A, B, C 92,535 - - IAS Reserve (12,573) - - - Merger Reserve (BidCo acquisition) (2) 1,245,261 A, B, C 1,245,261- Cash flow hedge Reserve 270
Retained earnings 305,401 A, B, C 305,401 - Total 3,137,756 1,807,778Residual available share 1,807,778
A to increase the share capital
B to cover losses
C to distribute to the shareholders
(1) Total value of euro 3.100 thousand net of nr. 351.590 ordinary shares and nr.772.792 savings shares without nominal value (2) distributable once the limit of the legal reserve has been reached according to the former art. 2430 of the Italian Civil Code
Following the merger by incorporation (the so called reverse merger) of Marco Polo Industrial Holding S.p.A. into Pirelli & C. S.p.A., an alignment was carried out of the IAS reserve values relative to the valuation at fair value of the investments available for sale at the effective accounting date of the merger, with the data recorded in the consolidated Financial Statements.
2016 ANNUAL REPORT
286
18. Borrowings from Banks and other Financial Institutions
The item borrowings from banks and other financial institutions is composed as follows: (in thousands of euro)
Total Non current Current Total Non current CurrentBonds - - - 499,833 - 499,833 Borrowings from banks 4,267,340 4,103,435 163,905 100,000 100,000 - Other financial payables 3,817 561 3,817 3,137 1,332 1,805 Accrued liabilities 24,333 - 24,333 22,096 - 22,096
4,295,490 4,103,996 192,055 625,066 101,332 523,734
12/31/2016 12/31/2015
The item bonds at December 31, 2015, was relative to the unrated bond placed by Pirelli & C. S.p.A. on the Eurobond market during February 2011 for the nominal total amount of euro 500 million, with a fixed coupon of 5.125%. This loan was fully reimbursed in accordance to its natural maturity, during the month of February 2016. The item borrowings from banks which includes borrowings from credit institutions for euro 4,267,340 thousand comprises term loans for 18 months and for 3 and 5 five years and refers to the use of the secured loan (Senior Facilities) granted to Pirelli & C. S.p.A. and the subsidiary Pirelli International Plc. The contractual refinanced total amounted to euro 6.4 billion and was achieved at a lower overall cost of less than 3.5%. The operation which consisted of syndicated refinancing for the total amount of euro 4.8 billion maturing in three and five years, and a credit facility for euro 1.6 billion maturing in eighteen months, was the result of a club deal with a select number of lending institutions. It is to be noted that the total amount for the Senior Facilities at December 31, 2016 was euro 6,289,820 thousand, following the partial repayment of the euro 1.6 billion credit facility at the end of December 2016. As a result of this refinancing operation, signed on July 25, 2016 (the signing date), the Pirelli Group was able to refinance the bank debt which existed prior to the merger, as well as the Bidco Facility debt which had been cancelled on July 28, 2016 (the closing date). The financing is entirely reported under the item long-term borrowings from banks with the exception of the instalments due at December 31, 2017 which amount to euro 163,905 thousand. ; The item accrued liabilities essentially refers to interest accrued on the term loans but not yet paid (euro 17,651 thousand). The fair value of borrowings from banks and other financial institutions, compared with the relevant carrying amount is as follows: (in thousands of euro)
12/31/2016 12/31/2015 12/31/2016 12/31/2015Bond - 499,833 - 502,935Other non-current financial borrowings 4,103,996 101,332 4,103,996 101,332
4,103,996 601,165 4,103,996 604,267
Carrying amount Fair value
Borrowings from banks and other financial institutions are denominated in euro.
2016 ANNUAL REPORT
287
19. Provisions for Liabilities and Charges
The changes which occurred during the financial year are as follows: (in thousands of euro)
Total Non-current Current Total Non-current CurrentOpening balance 14,746 14,346 400 19,713 17,056 2,657Increases 14,873 9,396 5,477 664 264 400Reversals (8,405) (8,405) - (410) (410) - Uses (3,287) (2,887) (400) (5,221) (2,564) (2,657)Effect from PPA 33,500 33,500 - - - -
51,427 45,950 5,477 14,746 14,346 400
31/12/2016 31/12/2015
The item increases refers mainly to the allowance for the adjustment of the provision for legal and tax issues. The item reversals mainly refers mainly to the release of provisions for taxes. The item uses substantially refers to the payment of tax to the German tax authorities. The allocation of the effect from PPA of euro 33,500 thousand refers to potential liabilities (whose outlay was not considered likely) which were indentified during the Purchase Price Allocation pursuant to paragraph 23 of the IFRS 3 which were attributable to the European Commission decision made at the conclusion of the antitrust investigation regarding the energy cable business, which foresaw sanctions against Prysmian of approximately euro 104 million, of which a part totalling euro 67 million, Pirelli, despite having been found as not involved in the alleged cartel, was held as being jointly liable (with Prysmian), based solely on the application of the principle of so-called parental liability, in that during part of the period of the alleged infringement, Prysmian was a subsidiary of Pirelli. The item provisions for non-current liabilities and charges amounted euro 49,950 thousand and mainly refers to the potential liabilities identified during the Purchase Price Allocation as decribed in the preceding paragraph. The item provisions for current liabilities and charges amounted euro 5,477 thousand and refers to the provision for a surplus in the carrying amount and the adjustment of the value of the investment in Pirelli & C. Ambiente S.r.l..
2016 ANNUAL REPORT
288
20. Employee Benefit Obligations
Employee benefit obligations amounted to euro 3,965 thousand at December 31, 2016, (euro 2,104 thousand at December 31, 2015). This item includes the provision for employee leaving indemnities which amounted to euro 1,248 thousand (euro 1,548 thousand at December 31, 2015) and other employee benefits of euro 2,717 thousand (euro 555 thousand at December 31, 2015). The increase is attributable to the Long Term Incentive Plan 2016-2018 intended for the management of the Pirelli Group, approved by the Board of Directors of December 22, 2015, the objectives of which have been set by the subsequent Board of Directors of October 19, 2016. Employees’ leaving indemnities (TFR)
The changes which occurred during the 2016 financial year for the employees’ leaving indemnities provision are as follows:
(in thousands of euro)
Balance at 12/31/2014 1,489
Movements through income statement 89
Actuarial (gains)/losses recognized in Equity (69)
Indemnities, advance payments, relocations 39
Balance at 12/31/2015 1,548
Movements through income statement 92
Actuarial (gains)/losses recognized in Equity 55
Indemnities, advance payments, relocations (447)
Balance at 12/31/2016 1,248 The amounts shown in the Income Statement have been included in the item “Personnel Expenses” (refer to Note 28). Net actuarial gains (losses) accrued during the 2016 financial year and recognised directly in equity amounted to euro 56 thousand. The cumulative amount at December 31, 2016 of net income recognised directly in equity was euro 2,010 thousand (euro 2,066 thousand at December 31, 2015). The main actuarial assumptions used at December 31, 2016 are as follows: 2016Discount rate 1.5%Inflation rate 1.0% The main actuarial assumptions used at December 31, 2015 were as follows: 2015Discount rate 2.1%Inflation rate 1.3% The employees in service at December 31, 2016 came to 134 units (131 units as at December 31, 2015).

2016 ANNUAL REPORT
289
All other conditions being equal, a hypothetical change of 0.25% in the discount rate would result a reduction in liabilities of 2.54% in the event of an increase (2.57% at December 31, 2015) and an increase in liabilities of 2.61% in the event of a decrease (2.64% at December 31, 2015). 21. Trade Payables
The composition of trade payables was as follows: (in thousands of euro)
12/31/2016 12/31/2015
Payables to subsidiaries 605 825Payables to associates 975 607Payables to other companies 30,845 39,500
32,425 40,932 The carrying amount for trade payables is considered to approximate their fair value. 22. Other Payables
These were composed as follows: (in thousands of euro)
Total Non-current Current Total Non-current Current
Payables to subsidiaries 11,196 - 11,196 10,796 - 10,796Payables to social security and welfare institutions 2,480 - 2,480 2,296 - 2,296Payables to employees 10,032 - 10,032 17,017 6,182 10,835Other payables 9,798 311 9,487 9,834 381 9,453Accrued liabilities 250 - 250 - - - Deferred income 3,681 - 3,681 995 - 995
37,437 311 37,126 40,938 6,563 34,375
12/31/2016 12/31/2015
The item payables to subsidiaries mainly refers to consolidated IVA (value added tax). Payables to social security and welfare institutions mainly comprised contributions which were payable to INPS and INAIL. Payables to employees refers to wages be paid to employees. This item mainly includes payables related to the Long-Term Incentive Plan 2014-2016 as a result of the early closure of the Long-Term Incentive Plan 2014-2016 as approved by the Board of Directors of Pirelli & C. S.p.A. of December 22, 2015 which will be liquidated during the course of 2017. The item other payables includes liabilities for salaries payable to Directors and Auditors, as well as withholding taxes on income for the self-employed and employees, and other minor items. The carrying amount for other payables is considered to approximate their fair value.

2016 ANNUAL REPORT
290
23. Provision For Deferred Taxes
This provision amounted to euro 633,300 thousand and was due to the deferred taxes related to the recognition of the Pirelli Brand. 24. Tax Payables
This item amounted to euro 20,043 thousand (euro 20,211 thousand at December 31, 2015), and was comprised mainly of payables for withholding tax incurred abroad (euro 19,301 thousand). Tax payables were recorded net of credits for withholding tax which amounted to euro 23,451 thousand (credits for withholding tax used as compensation at December 31, 2015 amounted to euro 23,805 thousand) – for the restated figures refer to Note 15 “Tax receivables”. 25. Revenues From Sales And Services
These mainly refer to: (in thousands of euro)
2016 2015
Sales of services to subsidiaries 55,270 22,062
Sales of services to other companies 721 732
55,991 22,794 The increase was essentially due to the reorganisation of structures with the consequent expansion of services rendered to the Group's Italian subsidiaries.
26. Other Revenues
These amounted to euro 149,849 thousand, (euro 121,962 thousand for the previous financial year), and were composed as follows:
(in thousands of euro)
2016 2015
Other income from subsidiaries 110,524 110,571
Other income from other companies 39,325 11,391
149,849 121,962 Other income from subsidiaries includes royalties paid by the Group’s companies for the use of the Pirelli trademark (euro 79,879 thousand for 2016 – euro 83,865 thousand for 2015), the recovery of expenses and other income (euro 21,783 thousand for 2016 – euro 17,603 thousand for 2015), also rents and the recovery of management fees for rental properties (euro 8,496 thousand for 2016 – euro 9,102 thousand for 2015). Other income from other companies consists mainly of capital gains derived from, the disposal of the R&D building located in Milan, Italy for euro 27,199 thousand and the disposal of the building located in San Donato, Italy for euro 2,199 thousand, from royalties paid by other companies for the use the Pirelli trademark (euro 2,882 thousand for 2016 - euro 3,579 thousand for 2015), from the reversal of excess provisions (euro 1,006 thousand for 2016 - euro 260 thousand for 2015), from the recovery of
2016 ANNUAL REPORT
291
expenses and other incomes (euro 2,997 thousand for 2016 - euro 3,775 thousand for 2015), and from rents and the recovery of management fees on rental properties (euro 3,043 thousand for 2016 - euro 3,777 thousand for 2015). 27. Raw Materials and Consumables
These amounted to euro 209 thousand (euro 303 thousand for 2015) and includes the purchase of advertising materials, fuel and other materials. 28. Personnel Expenses
These amounted to euro 26,827 thousand (euro 33,122 thousand for 2015) and were composed as follows:
(in thousands of euro)
2016 2015
Wages and salaries 20,450 27,136
Social security and welfare contributions 4,799 4,497
Employee leaving indemnities (TFR) 107 72
Retirement and similar obbligations 1,123 1,075
Other costs 348 342
26,827 33,122 The number of staff in service on average was as follows: • Executives 36 • Employees 94 • Workers 3
29. Amortisation, Deprecation And Impairment
This item was composed as follows: (in thousands of euro)
2016 2015
Depreciation - property, plant and equipment 4,925 4,761
Amortisation - intangible assets 2,798 2,227
Impairment of tangible assets 1,518 -
9,241 6,988

2016 ANNUAL REPORT
292
30. Other Costs
The composition of other costs is as follows: (in thousands of euro)
2016 2015
Services rendered by subsidiaries 6,904 5,664
Advertising 28,181 29,728 Consultancy and collaboration services 11,377 18,446 Accruals for the provision of future liabilities and charges 7,954 265
Legal and notarial expenses 2,996 3,882
Travel expenses 10,746 10,514
Compensation of Board members and Supervisory Board 2,719 2,813
Membership fees and contributions 1,532 5,031
Rental and lease instalments 8,187 9,602
IT expenses 2,457 2,295
Energy, gas and water expenses 1,717 2,032
Security service 2,477 2,200
Insurance premiums 3,428 1,627
Patents and trademarks expenses 640 1,339
Cleaning and property ordinary maintenance expenses 1,618 278
Property maintenance 1,009 1,111
Other 12,401 9,874
106,343 106,701
2016 ANNUAL REPORT
293
31. Net income (loss) from Equity Investments
31.1 Losses on Equity Investments
These amounted to euro 107,159 thousand, (euro 52,341 thousand for the 2015 financial year), and were composed as follows:
(in thousands of euro)
2016 2015
Impairment losses on equity investments in subsidiaries:
- Pirelli & C. Ambiente S.r.l. 8,354 18,766
- HB Servizi S.r.l. 1,236 3,410
Impairment losses on equity investments in associates:
- Prelios S.p.A. 28,278 14,117
- Fenice S.r.l. 19,131 -
- Eurostazioni S.p.A. 46,666 -
- International Media Holding S.p.A. 679 -
Impairment losses on other financial assets:
- Alitalia S.p.A. - Compagnia Aerea Italiana S.p.A. 1,881 7,115
- RCS Mediagroup S.p.A. - 7,265
- Movincom Servizi S.p.A. 16 337
- GWM Renewable Energy II S.p.A. 519 -
- Others 399 400
Losses on disposals:
- Sirio S.p.A. - 931
107,159 52,341 For further details preference should be made to the Notes on Equity investments in Subsidiaries (Note 9), Associates (Note 10) and Other Financial Assets (Note 12).
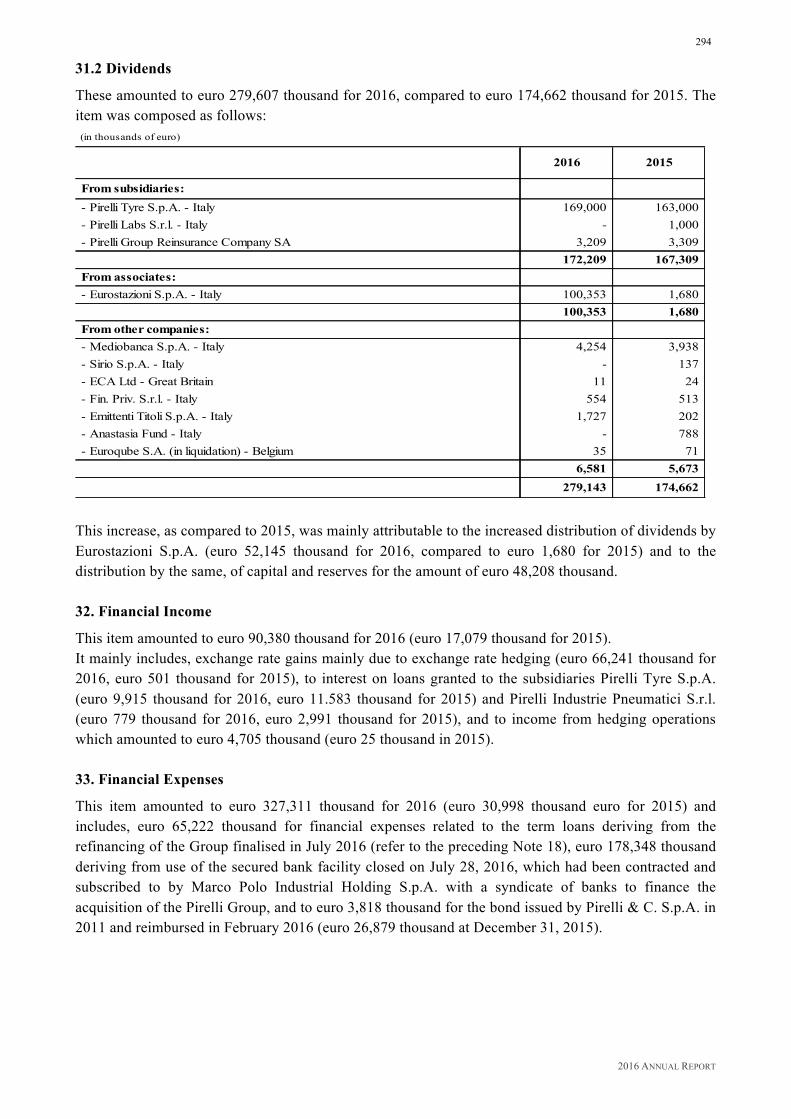
2016 ANNUAL REPORT
294
31.2 Dividends
These amounted to euro 279,607 thousand for 2016, compared to euro 174,662 thousand for 2015. The item was composed as follows: (in thousands of euro)
2016 2015
From subsidiaries: - Pirelli Tyre S.p.A. - Italy 169,000 163,000 - Pirelli Labs S.r.l. - Italy - 1,000 - Pirelli Group Reinsurance Company SA 3,209 3,309
172,209 167,309 From associates: - Eurostazioni S.p.A. - Italy 100,353 1,680
100,353 1,680 From other companies: - Mediobanca S.p.A. - Italy 4,254 3,938 - Sirio S.p.A. - Italy - 137 - ECA Ltd - Great Britain 11 24 - Fin. Priv. S.r.l. - Italy 554 513 - Emittenti Titoli S.p.A. - Italy 1,727 202 - Anastasia Fund - Italy - 788 - Euroqube S.A. (in liquidation) - Belgium 35 71
6,581 5,673279,143 174,662
This increase, as compared to 2015, was mainly attributable to the increased distribution of dividends by
Eurostazioni S.p.A. (euro 52,145 thousand for 2016, compared to euro 1,680 for 2015) and to the distribution by the same, of capital and reserves for the amount of euro 48,208 thousand.
32. Financial Income
This item amounted to euro 90,380 thousand for 2016 (euro 17,079 thousand for 2015). It mainly includes, exchange rate gains mainly due to exchange rate hedging (euro 66,241 thousand for 2016, euro 501 thousand for 2015), to interest on loans granted to the subsidiaries Pirelli Tyre S.p.A. (euro 9,915 thousand for 2016, euro 11.583 thousand for 2015) and Pirelli Industrie Pneumatici S.r.l. (euro 779 thousand for 2016, euro 2,991 thousand for 2015), and to income from hedging operations which amounted to euro 4,705 thousand (euro 25 thousand in 2015). 33. Financial Expenses
This item amounted to euro 327,311 thousand for 2016 (euro 30,998 thousand euro for 2015) and includes, euro 65,222 thousand for financial expenses related to the term loans deriving from the refinancing of the Group finalised in July 2016 (refer to the preceding Note 18), euro 178,348 thousand deriving from use of the secured bank facility closed on July 28, 2016, which had been contracted and subscribed to by Marco Polo Industrial Holding S.p.A. with a syndicate of banks to finance the acquisition of the Pirelli Group, and to euro 3,818 thousand for the bond issued by Pirelli & C. S.p.A. in 2011 and reimbursed in February 2016 (euro 26,879 thousand at December 31, 2015).
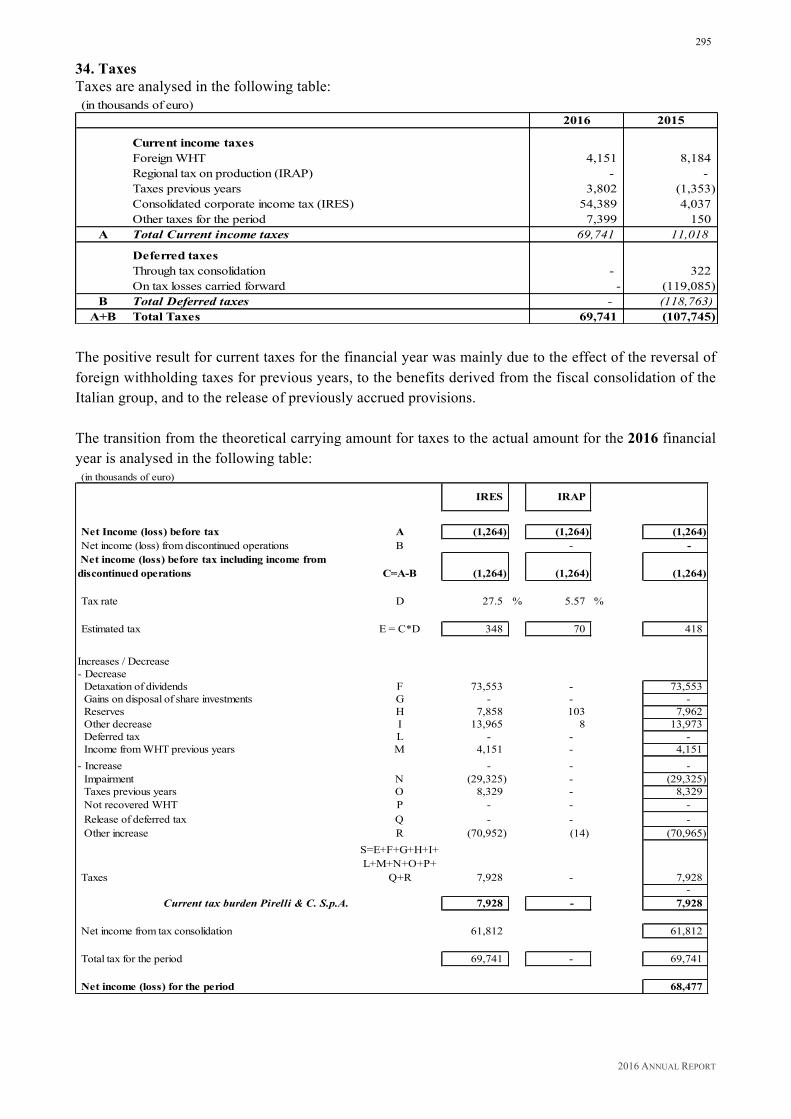
2016 ANNUAL REPORT
295
34. Taxes Taxes are analysed in the following table: (in thousands of euro)
2016 2015
Current income taxes Foreign WHT 4,151 8,184Regional tax on production (IRAP) - - Taxes previous years 3,802 (1,353)Consolidated corporate income tax (IRES) 54,389 4,037Other taxes for the period 7,399 150
A Total Current income taxes 69,741 11,018
Deferred taxesThrough tax consolidation - 322On tax losses carried forward - (119,085)
B Total Deferred taxes - (118,763)A+B Total Taxes 69,741 (107,745)
The positive result for current taxes for the financial year was mainly due to the effect of the reversal of foreign withholding taxes for previous years, to the benefits derived from the fiscal consolidation of the Italian group, and to the release of previously accrued provisions. The transition from the theoretical carrying amount for taxes to the actual amount for the 2016 financial year is analysed in the following table:
(in thousands of euro)
IRES IRAP
Net Income (loss) before tax A (1,264) (1,264) (1,264) Net income (loss) from discontinued operations B - -
Net income (loss) before tax including income from discontinued operations C=A-B (1,264) (1,264) (1,264)
Tax rate D 27.5 % 5.57 %
Estimated tax E = C*D 348 70 418
Increases / Decrease- Decrease
Detaxation of dividends F 73,553 - 73,553 Gains on disposal of share investments G - - - Reserves H 7,858 103 7,962 Other decrease I 13,965 8 13,973 Deferred tax L - - - Income from WHT previous years M 4,151 - 4,151
- Increase - - - Impairment N (29,325) - (29,325) Taxes previous years O 8,329 - 8,329 Not recovered WHT P - - - Release of deferred tax Q - - - Other increase R (70,952) (14) (70,965)
Taxes
S=E+F+G+H+I+L+M+N+O+P+
Q+R 7,928 - 7,928 -
Current tax burden Pirelli & C. S.p.A. 7,928 - 7,928
Net income from tax consolidation 61,812 61,812
Total tax for the period 69,741 - 69,741
Net income (loss) for the period 68,477

2016 ANNUAL REPORT
296
The transition from the theoretical carrying amount for taxes to the actual amount for the 2015 financial year is analysed in the following table:
(in thousands of euro)
IRES IRAP
Net Income (loss) before tax A 106,043 106,043 106,043 Net income (loss) from discontiuned operations B - -
Net income (loss) before tax including income from discontiuned operations C=A-B 106,043 106,043 106,043
Tax rate D 27.5 % 5.57 %
Estimated tax E = C*D (29,162) (5,907) (35,069)
- DecreaseDetaxation of dividends F 45,425 18,485 63,909 Gains on disposal of share investments G - - - Reserves H 1,342 - 1,342 Other decrease I 373 961 1,334 Deferred tax L - - - Income from WHT previous years M 8,184 - 8,184 - Increase - Impairment N (14,138) - (14,138) Taxes previous years O (521) - (521) Not recovered WHT P - - - Release of deferred tax Q (102,970) - (102,970) Other increase R (3,346) (13,539) (16,885)
Taxes
S=E+F+G+H+I+L+M+N+O+P+
Q+R (94,813) - (94,813) -
Current tax burden Pirelli & C. S.p.A. (94,813) - (94,813)
Net income from tax consolidation (12,932) (12,932)
Total tax (107,745) - (107,745)
Net income (loss) (1,702) TAX CONSOLIDATION It is to be noted that as of the start of the 2004 financial year, the Company as consolidator, has exercised the option for consolidated taxation pursuant to Article 117, and in accordance with the Italian Income Tax Code (TUIR), which governs operations arising from the adhesion to consolidation through the application of a special "Regulation", which provides for a common procedure for the implementation of legal and regulatory provisions. The aforesaid regulation has been updated in the years since 2004 as a result of amendments made on the part of the companies participating in the agreement and the related shareholding structure, and in light of the corrective and supplementary amendments to the applicable legislation. The aforesaid amendments mainly concerned the remuneration of the tax losses used by the companies participating in the consolidation. The adoption of consolidation allows for compensation to the parent company Pirelli & C. S.p.A. of the taxable gains or losses of the Parent Company itself with that of the resident subsidiaries which exercised the option, taking into account that the tax losses accrued during periods prior to the introduction of Group taxation may only be used by companies that generated the taxable income or loss.

2016 ANNUAL REPORT
297
35. Related Party Transactions
Related party transactions, including intra-group transactions, are not classifiable as unusual or exceptional, but are instead considered part of the ordinary course of business for Group companies. Such transactions, when not carried out under standard conditions or dictated by specific regulatory conditions, are in any case conducted under market conditions The following tables disclose the main transactions with related parties for the financial years ended December 31, 2016 and December 31, 2015 (amounts are expressed in millions of euro). Year 2016TRANSACTIONS WITH SUBSIDIARIES(in millions of euro)ITEMS OF BALANCE SHEET
Current assets
Trade receivables 55.8 This item refers mainly to receivables for euro 47.5 million from Pirelli Tyre S.p.A., for euro 4.0 million from Pirelli Tyre Russia, and for euro 2.8 million from Pirelli Industrial S.r.l., for professional and other services rendered.
Other receivables 633.5 This item refers mainly to euro 430.0 million for loans granted to, and related interest accrued not paid by Pirelli Tyre S.p.A. and to euro 201.4 million for the intra-group current account held with Pirelli International Plc.
Tax receivables 77.8 This amount refers to receivables from Group companies which adhere to tax consolidation (mainly euro 74.8 million from Pirelli Tyre S.p.A., and euro 3 million from Pirelli Industrie Pneumatici S.r.l).
Financial instruments 0.5 The sum refers to receivables for hedging income and related accruals from Pirelli International Plc.
Currents liabilities
Trade payables 0.8 This item refers mainly to payables for the provision of services (the main ones are: euro 0.1 million to Pirelli Tyre S.p.A., euro 0.3 million to Pirelli Amministrazione e Tesoreria S.p.A., and to euro 0.3 million to TP Trading (Beijing) Co).
Other payables 14.9
This item refers mainly to payables to Group companies which adhere to IVA (value added tax) consolidation. The main ones are: euro 10.6 million to Pirelli Tyre S.p.A., euro 0,1 million to Driver Servizi Retail S.r.l., to euro 0.5 million for deferred income to Pirelli Tyre S.p.A. and to euro 3.2 million for trade receivables reimbursable to Pirelli Tyre S.p.A.
Tax payables 19.8 This item refers to payables to subsidiaries which adhere to tax consolidation, mainly euro 13.9 million to Pirelli Tyre, and to euro 5.7 million to Pirelli Industrial S.r.l.

2016 ANNUAL REPORT
298
ITEMS OF INCOME STATEMENT
Revenues from sales and services 55.2
The amount mainly refers to service agreements. The main relationships are: euro 51.0 million from Pirelli Tyre S.p.A., euro 2.8 million from Pirelli Industrial S.r.l., euro 0.4 million from Pirelli & C. Ambiente S.r.l., euro 0.4 million from Pirelli Sistemi Informativi S.r.l., euro 0.3 milion from Pirelli Servizi Amministrazione e Tesoreria S.p.A., and euro 0.2 million from HB Servizi S.r.l.).
Other income 109.2
The amount mainly refers to brand licensing agreements (euro 78.5 million from Pirelli Tyre S.p.A., euro 1.3 million from Pirelli Tyre Russia); to other recoveries (euro 20.7 million from Pirelli Tyre S.p.A., euro 0.8 million from Pirelli International Plc, euro 0.4 million from Pirelli Tyre Co.Ltd.); and to lease agreements (euro 0.8 million from Pirelli Sistemi Informativi S.r.l., euro 5.7 million from Pirelli Tyre S.p.A., euro 0.3 million Pirelli Servizi Amministrazione e Tesoreria S.p.A., euro 0.4 million from Pirelli Industrial S.r.l).
Other costs (6.0)
The amount mainly refers to charges for services and various costs (euro 1.2 million for Pirelli Servizi Amministrazione e Tesoreria S.p.A., euro 1.7 million for Pirelli Sistemi Informativi S.r.l., euro 1.4 million for Pirelli Tyre S.p.A., euro 0.7 million for Pirelli Tyre Trading (Shangai) Co Ltd., and euro 0.4 million for Servizi Aziendali Pirelli S.c.p.a.).
Net income (loss) from equity investments - Dividends
172.0 This item refers to euro 169.0 million for Pirelli Tyre S.p.A. and to euro 3.2 million for Pirelli Group Reinsurance Company S.A.
Financial income 88.1 Income from loans granted (euro 9,9 million from Pirelli Tyre S.p.A. and euro 0.8 million for Pirelli Industrie Pneumatici S.r.l.) and from hedging transactions and exchange rate gains of euro 77.4 million from Pirelli Internatonal Plc.
Taxes 93.4 This item refers to income and expenses due from Group companies which adhere to tax consolidation. For tax income the main items are: Pirelli Tyre S.p.A. euro 90.5 million, Pirelli Sistemi Informativi S.r.l. euro 0.3 million, Pirelli Industrie Pneumatici S.r.l. euro 2.6 mllion.
СASH FLOW INVESTMENTS AND DISINVESTMENTS
Investments in subsidiaries 1.6 The amount refers to the capital contribution to HB Servizi S.r.l.
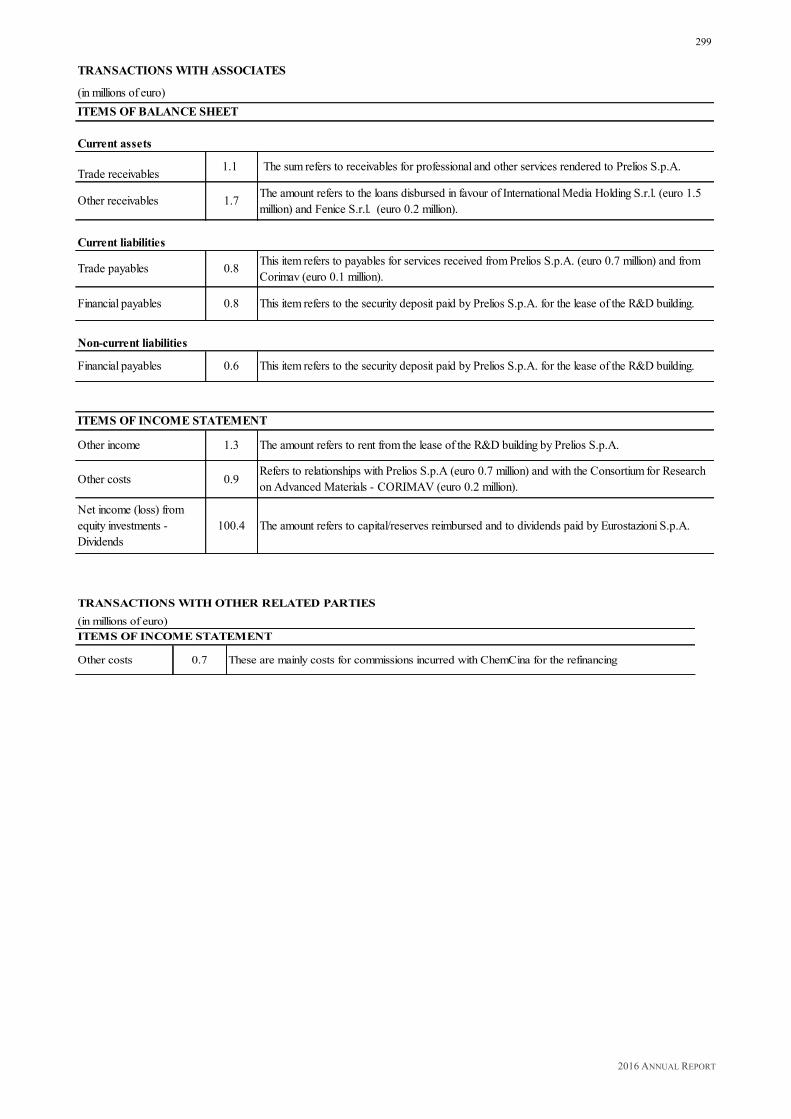
2016 ANNUAL REPORT
299
TRANSACTIONS WITH ASSOCIATES
(in millions of euro)ITEMS OF BALANCE SHEET
Current assets
Trade receivables 1.1 The sum refers to receivables for professional and other services rendered to Prelios S.p.A.
Other receivables 1.7 The amount refers to the loans disbursed in favour of International Media Holding S.r.l. (euro 1.5 million) and Fenice S.r.l. (euro 0.2 million).
Current liabilities
Trade payables 0.8 This item refers to payables for services received from Prelios S.p.A. (euro 0.7 million) and from Corimav (euro 0.1 million).
Financial payables 0.8 This item refers to the security deposit paid by Prelios S.p.A. for the lease of the R&D building.
Non-current liabilities
Financial payables 0.6 This item refers to the security deposit paid by Prelios S.p.A. for the lease of the R&D building.
ITEMS OF INCOME STATEMENT
Other income 1.3 The amount refers to rent from the lease of the R&D building by Prelios S.p.A.
Other costs 0.9 Refers to relationships with Prelios S.p.A (euro 0.7 million) and with the Consortium for Research on Advanced Materials - CORIMAV (euro 0.2 million).
Net income (loss) from equity investments - Dividends
100.4 The amount refers to capital/reserves reimbursed and to dividends paid by Eurostazioni S.p.A.
TRANSACTIONS WITH OTHER RELATED PARTIES(in millions of euro)ITEMS OF INCOME STATEMENT
Other costs 0.7 These are mainly costs for commissions incurred with ChemCina for the refinancing
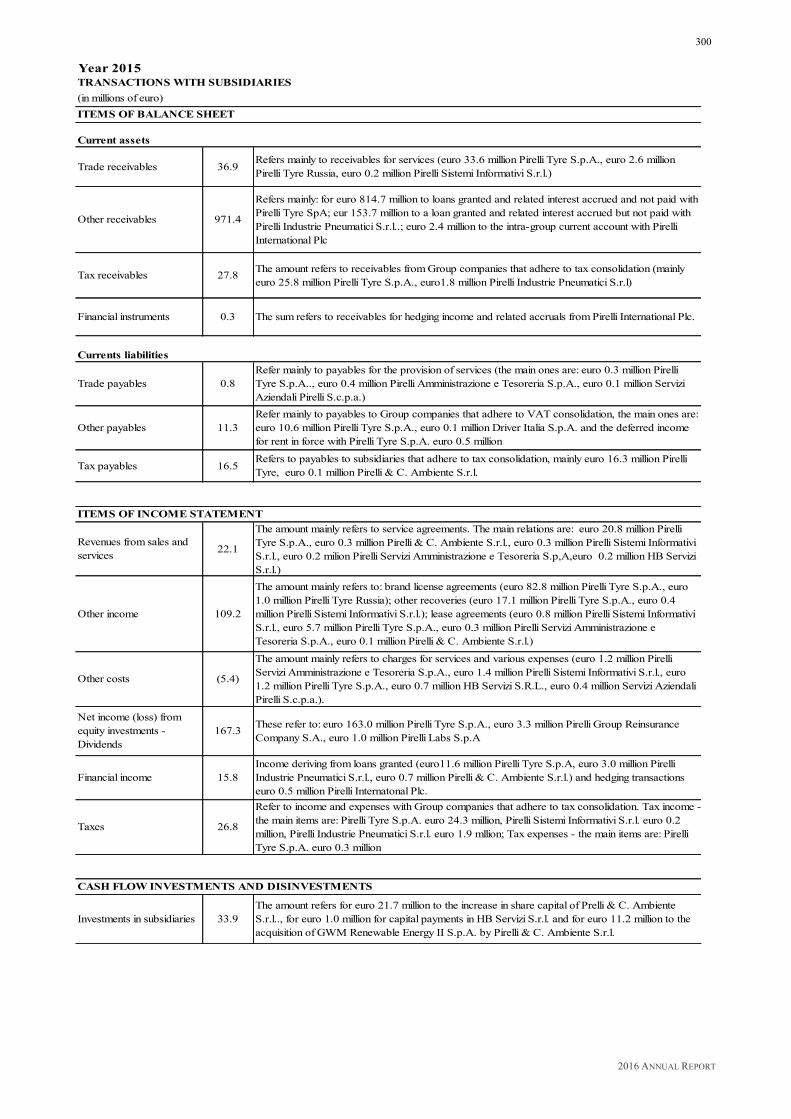
2016 ANNUAL REPORT
300
Year 2015TRANSACTIONS WITH SUBSIDIARIES(in millions of euro)ITEMS OF BALANCE SHEET
Current assets
Trade receivables 36.9 Refers mainly to receivables for services (euro 33.6 million Pirelli Tyre S.p.A., euro 2.6 million Pirelli Tyre Russia, euro 0.2 million Pirelli Sistemi Informativi S.r.l.)
Other receivables 971.4
Refers mainly: for euro 814.7 million to loans granted and related interest accrued and not paid with Pirelli Tyre SpA; eur 153.7 million to a loan granted and related interest accrued but not paid with Pirelli Industrie Pneumatici S.r.l..; euro 2.4 million to the intra-group current account with Pirelli International Plc
Tax receivables 27.8 The amount refers to receivables from Group companies that adhere to tax consolidation (mainly euro 25.8 million Pirelli Tyre S.p.A., euro1.8 million Pirelli Industrie Pneumatici S.r.l)
Financial instruments 0.3 The sum refers to receivables for hedging income and related accruals from Pirelli International Plc.
Currents liabilities
Trade payables 0.8 Refer mainly to payables for the provision of services (the main ones are: euro 0.3 million Pirelli Tyre S.p.A.., euro 0.4 million Pirelli Amministrazione e Tesoreria S.p.A., euro 0.1 million Servizi Aziendali Pirelli S.c.p.a.)
Other payables 11.3 Refer mainly to payables to Group companies that adhere to VAT consolidation, the main ones are: euro 10.6 million Pirelli Tyre S.p.A., euro 0.1 million Driver Italia S.p.A. and the deferred income for rent in force with Pirelli Tyre S.p.A. euro 0.5 million
Tax payables 16.5 Refers to payables to subsidiaries that adhere to tax consolidation, mainly euro 16.3 million Pirelli Tyre, euro 0.1 million Pirelli & C. Ambiente S.r.l.
ITEMS OF INCOME STATEMENT
Revenues from sales and services 22.1
The amount mainly refers to service agreements. The main relations are: euro 20.8 million Pirelli Tyre S.p.A., euro 0.3 million Pirelli & C. Ambiente S.r.l., euro 0.3 million Pirelli Sistemi Informativi S.r.l., euro 0.2 milion Pirelli Servizi Amministrazione e Tesoreria S.p,A,euro 0.2 million HB Servizi S.r.l.)
Other income 109.2
The amount mainly refers to: brand license agreements (euro 82.8 million Pirelli Tyre S.p.A., euro 1.0 million Pirelli Tyre Russia); other recoveries (euro 17.1 million Pirelli Tyre S.p.A., euro 0.4 million Pirelli Sistemi Informativi S.r.l.); lease agreements (euro 0.8 million Pirelli Sistemi Informativi S.r.l., euro 5.7 million Pirelli Tyre S.p.A., euro 0.3 million Pirelli Servizi Amministrazione e Tesoreria S.p.A., euro 0.1 million Pirelli & C. Ambiente S.r.l.)
Other costs (5.4)
The amount mainly refers to charges for services and various expenses (euro 1.2 million Pirelli Servizi Amministrazione e Tesoreria S.p.A., euro 1.4 million Pirelli Sistemi Informativi S.r.l., euro 1.2 million Pirelli Tyre S.p.A., euro 0.7 million HB Servizi S.R.L., euro 0.4 million Servizi Aziendali Pirelli S.c.p.a.).
Net income (loss) from equity investments - Dividends
167.3 These refer to: euro 163.0 million Pirelli Tyre S.p.A., euro 3.3 million Pirelli Group Reinsurance Company S.A., euro 1.0 million Pirelli Labs S.p.A
Financial income 15.8 Income deriving from loans granted (euro11.6 million Pirelli Tyre S.p.A, euro 3.0 million Pirelli Industrie Pneumatici S.r.l., euro 0.7 million Pirelli & C. Ambiente S.r.l.) and hedging transactions euro 0.5 million Pirelli Internatonal Plc.
Taxes 26.8
Refer to income and expenses with Group companies that adhere to tax consolidation. Tax income - the main items are: Pirelli Tyre S.p.A. euro 24.3 million, Pirelli Sistemi Informativi S.r.l. euro 0.2 million, Pirelli Industrie Pneumatici S.r.l. euro 1.9 mllion; Tax expenses - the main items are: Pirelli Tyre S.p.A. euro 0.3 million
СASH FLOW INVESTMENTS AND DISINVESTMENTS
Investments in subsidiaries 33.9 The amount refers for euro 21.7 million to the increase in share capital of Prelli & C. Ambiente S.r.l.., for euro 1.0 million for capital payments in HB Servizi S.r.l. and for euro 11.2 million to the acquisition of GWM Renewable Energy II S.p.A. by Pirelli & C. Ambiente S.r.l.
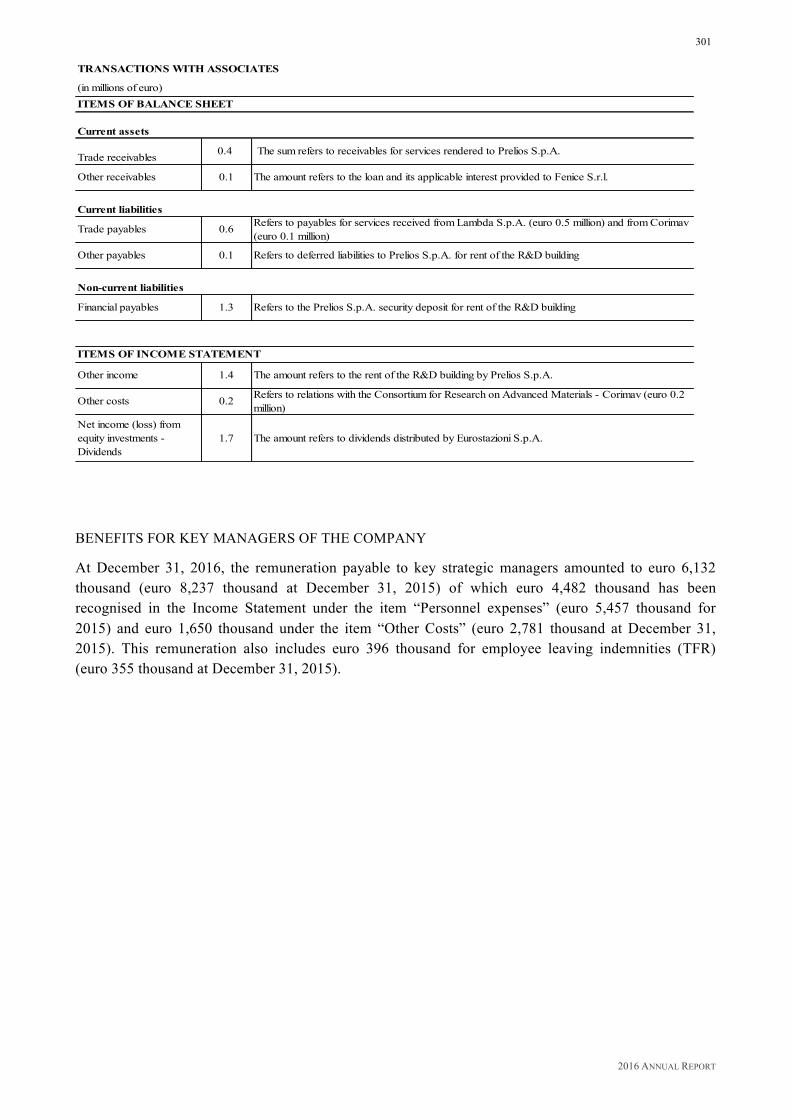
2016 ANNUAL REPORT
301
TRANSACTIONS WITH ASSOCIATES
(in millions of euro)ITEMS OF BALANCE SHEET
Current assets
Trade receivables 0.4 The sum refers to receivables for services rendered to Prelios S.p.A.
Other receivables 0.1 The amount refers to the loan and its applicable interest provided to Fenice S.r.l.
Current liabilities
Trade payables 0.6 Refers to payables for services received from Lambda S.p.A. (euro 0.5 million) and from Corimav (euro 0.1 million)
Other payables 0.1 Refers to deferred liabilities to Prelios S.p.A. for rent of the R&D building
Non-current liabilities
Financial payables 1.3 Refers to the Prelios S.p.A. security deposit for rent of the R&D building
ITEMS OF INCOME STATEMENT
Other income 1.4 The amount refers to the rent of the R&D building by Prelios S.p.A.
Other costs 0.2 Refers to relations with the Consortium for Research on Advanced Materials - Corimav (euro 0.2 million)
Net income (loss) from equity investments - Dividends
1.7 The amount refers to dividends distributed by Eurostazioni S.p.A.
BENEFITS FOR KEY MANAGERS OF THE COMPANY At December 31, 2016, the remuneration payable to key strategic managers amounted to euro 6,132 thousand (euro 8,237 thousand at December 31, 2015) of which euro 4,482 thousand has been recognised in the Income Statement under the item “Personnel expenses” (euro 5,457 thousand for 2015) and euro 1,650 thousand under the item “Other Costs” (euro 2,781 thousand at December 31, 2015). This remuneration also includes euro 396 thousand for employee leaving indemnities (TFR) (euro 355 thousand at December 31, 2015).
2016 ANNUAL REPORT
302
36. Commitments and Contingencies
Guarantees issued in the interests of subsidiaries and other companies
These guarantees were issued for the loans and contractual obligations of the subsidiaries for the amount of euro 1,112,383 thousand. This amount includes euro 1,103,617 thousand for garantees issued in favour of Pirelli Tyre Ltd (UK) and Pirelli UK Ltd relative to local pension funds. Other risks As a consequence of the merger of Marco Polo Industrial Holding S.p.A. into Pirelli & C. S.p.A. and to the subsequent operation of refinancing the debt of the Pirelli Group, which was successfully completed on July 28, 2016, insurance guarantees were subscribed to for the benefit of the pension funds of Pirelli UK Limited and Pirelli Tyres Limited - Credit Support Guarantees (“CSG”), thanks to the ability to procure GBP 300 million from leading companies. The insurance protection agreement covers a time period of approximately 42 months from September 2016 to March 2020, and provides for a counter-guarantee system under which the Group, selected as indemnitors of the operation, shall jointly indemnify the insurers from any cost (“Indemnified liabilities”). The garantees issued for the refinancing operations amounted to euro 5,162,820 thousand.
Guarantees issued during the disposal of Olimpia
During the disposal of the investment in Olimpia S.p.A., the sellers (Pirelli and Sintonia) contractually retained the burden of tax risks for the taxable period up until the date of disposal. Litigation, which is still ongoing can be summarised as follows. At the end of 2006, the Italian Internal Revenue Agency (“Agenzia delle Entrate”) served Olimpia S.p.A. a notice of assessment for Italian regional income tax (IRAP) for the 2001 financial year. More precisely, on the basis of an assumption, which Pirelli, maintains is entirely unfounded in both legal and financial terms, the tax agency had ascertained an assessment the non-existent financial income for the Bell Bond which were repayable in Olivetti shares, in regional income taxes (IRAP) amounting to euro 26.5 million (the pro-rata share for Pirelli & C. amounted to euro 21.2 million) plus sanctions for the same amount. The Company/Olimpia S.p.A. appealed against this tax assessment on the basis of the manifestly non-existent taxable income ascertained by the tax agency. The regional tax commission of the 1st level, (Commissione Tributaria di 1° grado) upheld the company's appeal by cancelling the assessment. The tax agency then appealed this decision. This appeal was also rejected by the regional tax commission. Despite the twice unexceptionable negative judgements, the tax agency filed an appeal in the Supreme Court (Corte di Cassazione) which the Company/Olimpia S.p.A. has consistently opposed. During the hearing on December 21, 2016, the Prosecutor General unexpectedly ruled, without any legal or procedural basis, in favour of accepting the appeal of the tax agency attorneys and referred the claim for reconsideration to another section of the regional tax commission. At the end of the hearing Pirelli’s legal defence presented a justified brief opposing the decision. The ruling of the Supreme Court is still pending along with the handing down of its decision and its reasons. It is nevertheless reasonable to maintain, by virtue of the strength of our defensive arguments as confirmed by our legal advisers, which are not in our opinion weakened by the Prosecutor General's ruling, that the assessment of risk is such as to not require the allocation of any specific provision in the annual Financial Statements at December 31, 2016.
2016 ANNUAL REPORT
303
37. Significant Events Subsequent To The End Of The Year
On March 6, 2017 the Shareholders’ Meeting of Pirelli & C. S.p.A. approved the remodeling of the Company's capital structure and ascribed the amount of euro 116,962 thousand to the legal reserve which had been drawn from retained earnings, as reported in the aforementioned Statement of Financial Position of the Company at June 30, 2016 approved by the same Shareholders’ Meeting, who also took note that, as a result of the allocation, the amount of the legal reserve then amounted to euro 269,076 thousand, equal to 20% of the share capital. In March 2017 in order to ensure an autonomous growth path and independent group strategies, the two areas of activity – Consumer and Industrial – have been separated into two distinct companies controlled by their common shareholder Marco Polo International Italy following the assignation to the latter by Pirelli of the shares of TP Industrial Holding, the company into which the industrial assets of Pirelli were conferred. TP Industrial Holding and Pirelli are thus 100% controlled by Marco Polo International Italy, the vehicle of the partnership between CNRC (65%), Camfin (22.4%) and Long-Term investments Luxemburg (12.6%). Further, with effect from April 1, 2017, as a consequence of the completion of the separation of the Industrial business from Pirelli’s consumer activities, Pirelli Industrial will change its company name to “Prometeon Tyre Group S.r.l.” (“PTG”).
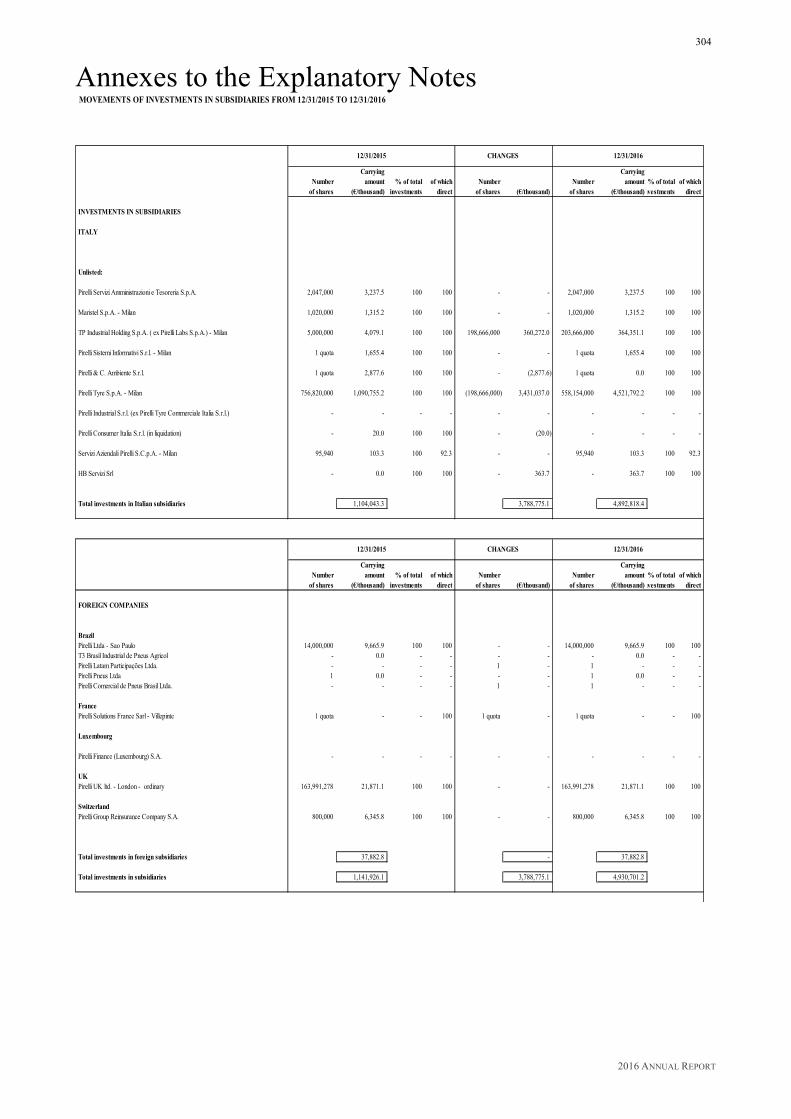
2016 ANNUAL REPORT
304
Annexes to the Explanatory Notes MOVEMENTS OF INVESTMENTS IN SUBSIDIARIES FROM 12/31/2015 TO 12/31/2016
CHANGES
Carrying Carrying Number amount % of total of which Number Number amount % of total of which
of shares (€/thousand) investments direct of shares (€/thousand) of shares (€/thousand) investments direct
INVESTMENTS IN SUBSIDIARIES
ITALY
Unlisted:
Pirelli Servizi Amministrazioni e Tesoreria S.p.A. 2,047,000 3,237.5 100 100 - - 2,047,000 3,237.5 100 100
Maristel S.p.A. - Milan 1,020,000 1,315.2 100 100 - - 1,020,000 1,315.2 100 100
TP Industrial Holding S.p.A. ( ex Pirelli Labs S.p.A.) - Milan 5,000,000 4,079.1 100 100 198,666,000 360,272.0 203,666,000 364,351.1 100 100
Pirelli Sistemi Informativi S.r.l. - Milan 1 quota 1,655.4 100 100 - - 1 quota 1,655.4 100 100
Pirelli & C. Ambiente S.r.l. 1 quota 2,877.6 100 100 - (2,877.6) 1 quota 0.0 100 100
Pirelli Tyre S.p.A. - Milan 756,820,000 1,090,755.2 100 100 (198,666,000) 3,431,037.0 558,154,000 4,521,792.2 100 100
Pirelli Industrial S.r.l. (ex Pirelli Tyre Commerciale Italia S.r.l.) - - - - - - - - - -
Pirelli Consumer Italia S.r.l. (in liquidation) - 20.0 100 100 - (20.0) - - - -
Servizi Aziendali Pirelli S.C.p.A. - Milan 95,940 103.3 100 92.3 - - 95,940 103.3 100 92.3
HB Servizi Srl - 0.0 100 100 - 363.7 - 363.7 100 100
Total investments in Italian subsidiaries 1,104,043.3 3,788,775.1 4,892,818.4
CHANGES
Carrying Carrying Number amount % of total of which Number Number amount % of total of which
of shares (€/thousand) investments direct of shares (€/thousand) of shares (€/thousand) investments direct
FOREIGN COMPANIES
Brazil Pirelli Ltda - Sao Paulo 14,000,000 9,665.9 100 100 - - 14,000,000 9,665.9 100 100 T3 Brasil Industrial de Pneus Agricol - 0.0 - - - - - 0.0 - - Pirelli Latam Participações Ltda. - - - - 1 - 1 - - - Pirelli Pneus Ltda 1 0.0 - - - - 1 0.0 - - Pirelli Comercial de Pneus Brasil Ltda. - - - - 1 - 1 - - -
France Pirelli Solutions France Sarl - Villepinte 1 quota - - 100 1 quota - 1 quota - - 100
Luxembourg
Pirelli Finance (Luxembourg) S.A. - - - - - - - - - -
UK Pirelli UK ltd. - London - ordinary 163,991,278 21,871.1 100 100 - - 163,991,278 21,871.1 100 100
Switzerland Pirelli Group Reinsurance Company S.A. 800,000 6,345.8 100 100 - - 800,000 6,345.8 100 100
Total investments in foreign subsidiaries 37,882.8 - 37,882.8
Total investments in subsidiaries 1,141,926.1 3,788,775.1 4,930,701.2
12/31/2015 12/31/2016
12/31/2015 12/31/2016
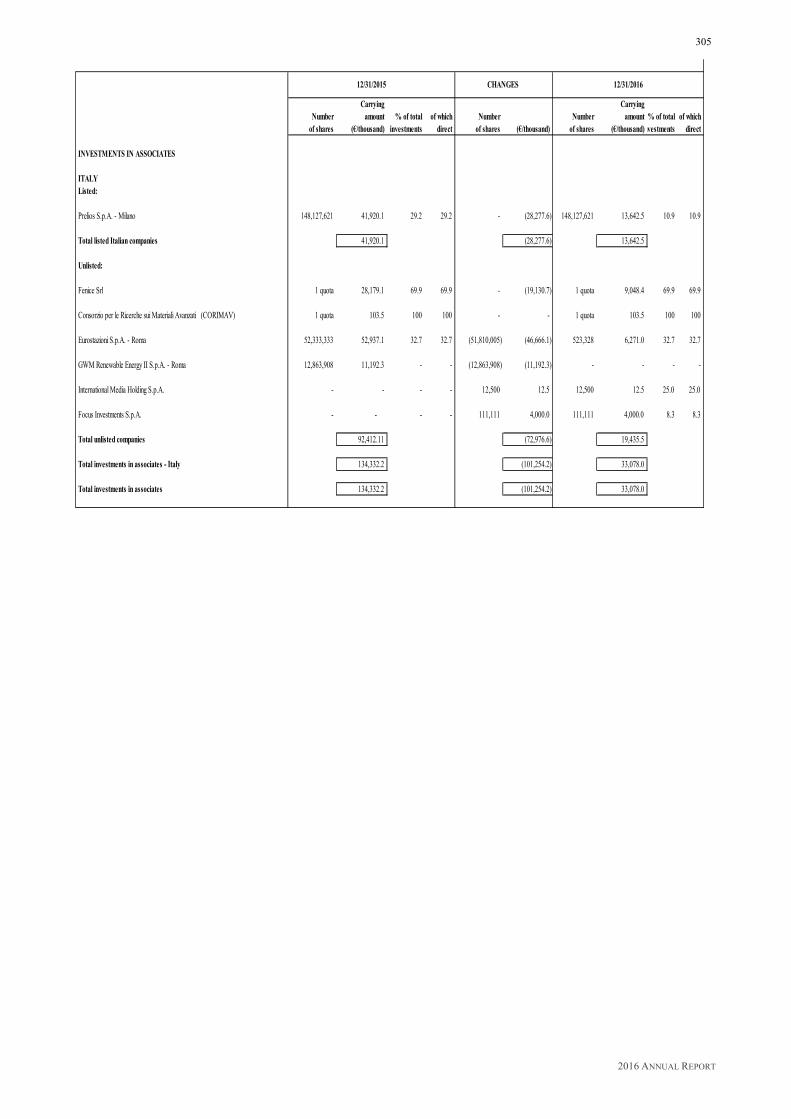
2016 ANNUAL REPORT
305
CHANGES
Carrying Carrying Number amount % of total of which Number Number amount % of total of which
of shares (€/thousand) investments direct of shares (€/thousand) of shares (€/thousand) investments direct
INVESTMENTS IN ASSOCIATES
ITALY Listed:
Prelios S.p.A. - Milano 148,127,621 41,920.1 29.2 29.2 - (28,277.6) 148,127,621 13,642.5 10.9 10.9
Total listed Italian companies 41,920.1 (28,277.6) 13,642.5
Unlisted:
Fenice Srl 1 quota 28,179.1 69.9 69.9 - (19,130.7) 1 quota 9,048.4 69.9 69.9
Consorzio per le Ricerche sui Materiali Avanzati (CORIMAV) 1 quota 103.5 100 100 - - 1 quota 103.5 100 100
Eurostazioni S.p.A. - Roma 52,333,333 52,937.1 32.7 32.7 (51,810,005) (46,666.1) 523,328 6,271.0 32.7 32.7
GWM Renewable Energy II S.p.A. - Roma 12,863,908 11,192.3 - - (12,863,908) (11,192.3) - - - -
International Media Holding S.p.A. - - - - 12,500 12.5 12,500 12.5 25.0 25.0
Focus Investments S.p.A. - - - - 111,111 4,000.0 111,111 4,000.0 8.3 8.3
Total unlisted companies 92,412.11 (72,976.6) 19,435.5
Total investments in associates - Italy 134,332.2 (101,254.2) 33,078.0
Total investments in associates 134,332.2 (101,254.2) 33,078.0
12/31/201612/31/2015

2016 ANNUAL REPORT
306
MOVEMENTS OF OTHER FINANCIAL ASSETS FROM 12/31/2015 TO 12/31/2016
Fair Value valuation
at Carrying 12/31/2016 Number Number Carrying
Number amount % of total of which of shares (€/thousand) of shares amount % of total of which of shares (€/thousand) investments direct (€/thousand) (€/thousand) investments direct
INVESTMENTS IN OTHER COMPANIES
ITALIAN LISTED COMPANIES
Mediobanca S.p.A. - Milan 15,753,367 139,968.7 1.8 1.8 (17,801.3) - (17,801.3) 15,753,367 122,167.4 1.8 1.8
RCS Mediagroup S.p.A. - Milan 23,135,668 14,355.7 4.4 4.4 4,951.1 - 4,951.1 23,135,668 19,306.8 4.4 4.4
Intek Group S.p.A. (Ex Fin Breda S.p.A. in liquidation) - Milan 1,561,000 - 0.4 0.4 - (1,549,175) 2.4 11,825 2.4 0.0 0.0
Total other Italian listed companies 154,324.4 (12,850.2) (12,847.8) 141,476.6
FOREIGN LISTED COMPANIES
Greentech Energy Systems A/S - Copenhagen K - Denmark - - - - - - - - - - -
Total other foreign listed companies - - - -
Total other listed companies 154,324.4 (12,850.2) (12,847.8) 141,476.6
12/31/2015 Fair Value valuation
at - Carrying - - 12/31/2016 Number Number Carrying - -
Number amount % of total of which of shares (€/thousand) of shares amount % of total of which (€/thousand) (€/thousand) (€/thousand)
ITALIAN UNLISTED COMPANIES
Aree Urbane S.r.l. (in liquidation) - Milan 1 quota - - - - - - 1 quota - - - -
C.I.R.A. - Centro Italiano di Ricerche Aerospaziali S.c.p.A. - Capua (CE) 30 - 0.1 0.1 - - - 30 - 0.1 0.1
Alitalia Compagnia Aerea Italiana S.p.A. - Rome 908,019,130 - 1.5 1.5 - 179,524,244 - 1,087,543,374 - 1.7 1.7
CEFRIEL - Società Consortile a Responsabilità limitata 1 quota - 5.2 5.2 - - - 1 quota - 5.2 5.2
Consorzio DIXIT (in liquidation) - Milan 1 quota - 14.3 14.3 - - - 1 quota - 14.3 14.3
MIP Politecnico di Milano - Graduate School of Business società consortile per azioni già Consorzio per L'Innovazione nella Gestione di Azienda -Mip -(Master Imprese Politecnico) Milan 12,000 - 3.4 3.4 - - - 12,000 - 3.4 3.4
Consorzio Milano Ricerche - Milan 1 quota - 7.1 7.1 - - - 1 quota - 7.1 7.1
Societa' Generale per la Progettazione Consulenze e Partecipazioni ( ex Italconsult ) S.p.A. - Rome 1,100 - 3.7 3.7 - - - 1,100 - 3.7 3.7
Emittenti Titoli S.p.A. - Milan 229,000 4,788.8 2.8 2.8 (2,059.6) - (2,059.6) 229,000 2,729.2 2.8 2.8
F.C. Internazionale Milano S.p.A. - Milan 55,805,625 292.9 0.5 0.5 - - (292.9) 55,805,625 - 0.5 0.5
Fin. Priv. S.r.l. - Milan 1 quota 18,787.3 14.3 14.3 (2,315.6) - (2,315.6) 1 quota 16,471.7 14.3 14.3 -
Istituto Europeo di Oncologia S.r.l. - Milan 1 quota 5,753.8 6.1 6.1 477.0 - 477.0 1 quota 6,230.8 6.1 6.1 -
Nomisma - Società di Studi Economici S.p.A. - Bologna 959,429 160.4 3.3 3.3 75.8 - 75.8 959,429 236.2 3.3 3.3
Redaelli Sidas S.p.A. (in liquidation) - Milan 750,000 - 4.6 4.6 - - - 750,000 - 4.6 4.6 -
S.In.T S.p.A. - Turin 90,000 94.5 10.0 10.0 - (90,000) (94.5) - - - - -
Consorzio Movincom scrl 1 3.2 5.9 5.9 2.5 - 2.5 1 5.7 5.9 5.9
Movincom Servizi S.p.A. 135,102 135.1 4.4 4.4 - - (15.1) 135,102 120.0 4.4 4.4
Tiglio I S.r.l. - Milan 1 quota 107.3 0.6 0.6 - - (9.6) 1 quota 97.7 0.6 0.6
Genextra S.p.A. - - - - - 592,450 513.2 592,450 513.2 0.6 0.6
Total other Italian unlisted companies 30,123.3 (3,819.9) (3,718.8) 26,404.5
12/31/2015 Changes 12/31/2016
12/31/2016Changes
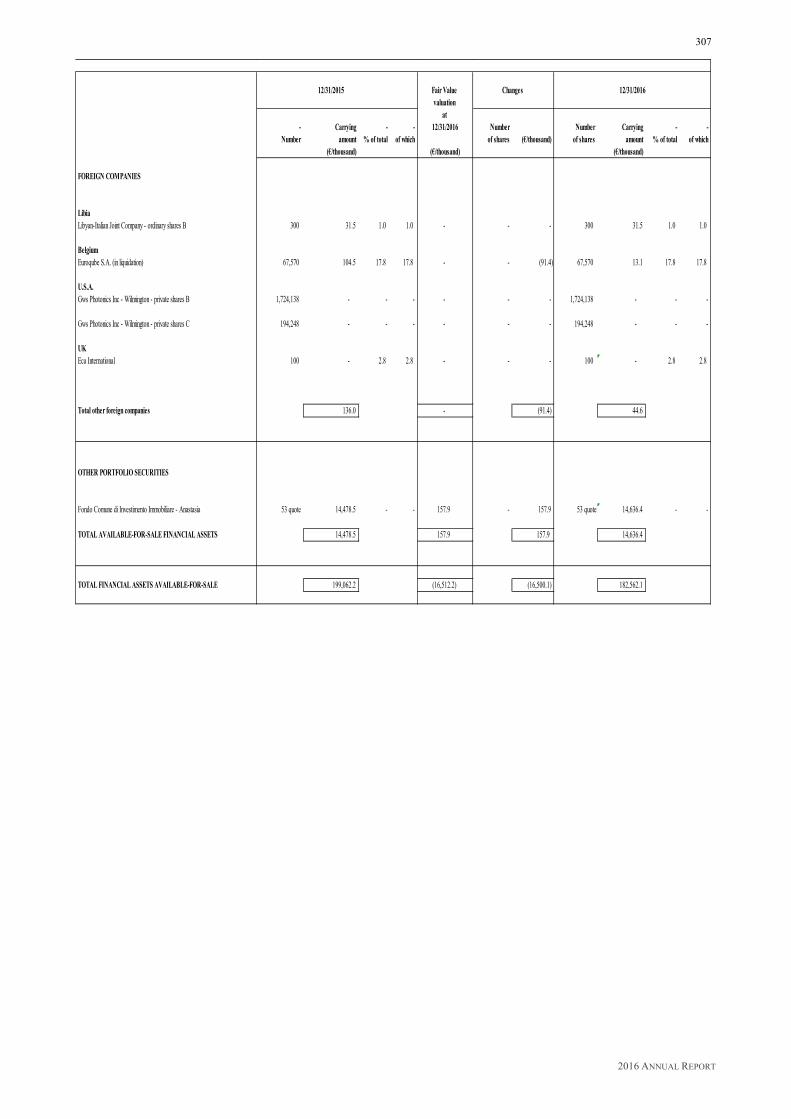
2016 ANNUAL REPORT
307
12/31/2015 Fair Value valuation
at - Carrying - - 12/31/2016 Number Number Carrying - -
Number amount % of total of which of shares (€/thousand) of shares amount % of total of which (€/thousand) (€/thousand) (€/thousand)
FOREIGN COMPANIES
Libia Libyan-Italian Joint Company - ordinary shares B 300 31.5 1.0 1.0 - - - 300 31.5 1.0 1.0
Belgium Euroqube S.A. (in liquidation) 67,570 104.5 17.8 17.8 - - (91.4) 67,570 13.1 17.8 17.8
U.S.A. Gws Photonics Inc - Wilmington - private shares B 1,724,138 - - - - - - 1,724,138 - - -
Gws Photonics Inc - Wilmington - private shares C 194,248 - - - - - - 194,248 - - -
UK Eca International 100 - 2.8 2.8 - - - 100 - 2.8 2.8
Total other foreign companies 136.0 - (91.4) 44.6
OTHER PORTFOLIO SECURITIES
Fondo Comune di Investimento Immobiliare - Anastasia 53 quote 14,478.5 - - 157.9 - 157.9 53 quote 14,636.4 - -
TOTAL AVAILABLE-FOR-SALE FINANCIAL ASSETS 14,478.5 157.9 157.9 14,636.4
TOTAL FINANCIAL ASSETS AVAILABLE-FOR-SALE 199,062.2 (16,512.2) (16,500.1) 182,562.1
Changes 12/31/2016
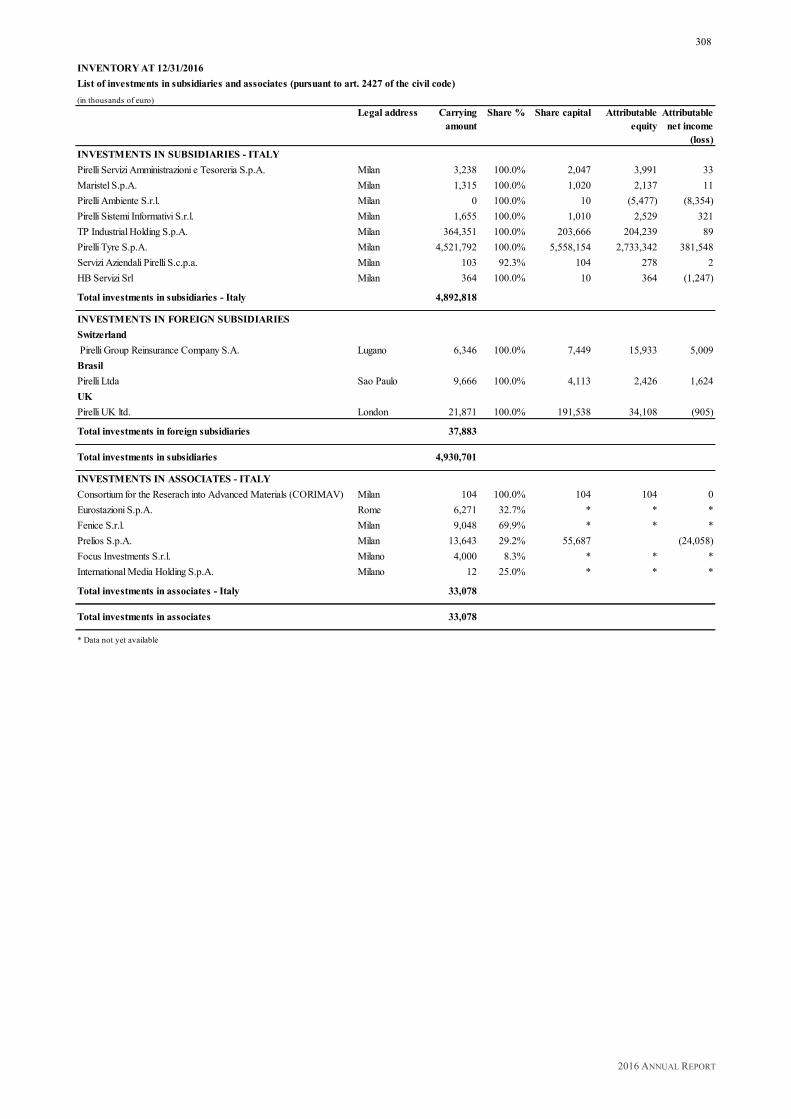
2016 ANNUAL REPORT
308
INVENTORY AT 12/31/2016List of investments in subsidiaries and associates (pursuant to art. 2427 of the civil code)(in thousands of euro)
Legal address Carrying amount
Share % Share capital Attributable equity
Attributable net income
(loss)INVESTMENTS IN SUBSIDIARIES - ITALYPirelli Servizi Amministrazioni e Tesoreria S.p.A. Milan 3,238 100.0% 2,047 3,991 33Maristel S.p.A. Milan 1,315 100.0% 1,020 2,137 11Pirelli Ambiente S.r.l. Milan 0 100.0% 10 (5,477) (8,354)Pirelli Sistemi Informativi S.r.l. Milan 1,655 100.0% 1,010 2,529 321TP Industrial Holding S.p.A. Milan 364,351 100.0% 203,666 204,239 89Pirelli Tyre S.p.A. Milan 4,521,792 100.0% 5,558,154 2,733,342 381,548Servizi Aziendali Pirelli S.c.p.a. Milan 103 92.3% 104 278 2HB Servizi Srl Milan 364 100.0% 10 364 (1,247)
Total investments in subsidiaries - Italy 4,892,818
INVESTMENTS IN FOREIGN SUBSIDIARIES Switzerland Pirelli Group Reinsurance Company S.A. Lugano 6,346 100.0% 7,449 15,933 5,009BrasilPirelli Ltda Sao Paulo 9,666 100.0% 4,113 2,426 1,624UKPirelli UK ltd. London 21,871 100.0% 191,538 34,108 (905)
Total investments in foreign subsidiaries 37,883
Total investments in subsidiaries 4,930,701
INVESTMENTS IN ASSOCIATES - ITALYConsortium for the Reserach into Advanced Materials (CORIMAV) Milan 104 100.0% 104 104 0Eurostazioni S.p.A. Rome 6,271 32.7% * * *Fenice S.r.l. Milan 9,048 69.9% * * *Prelios S.p.A. Milan 13,643 29.2% 55,687 (24,058)Focus Investments S.r.l. Milano 4,000 8.3% * * *International Media Holding S.p.A. Milano 12 25.0% * * *
Total investments in associates - Italy 33,078
Total investments in associates 33,078
* Data not yet available

2016 ANNUAL REPORT
309
Resolution Dear Shareholders, The financial year at December 31, 2016 closed with a gain of euro 68,477,271.04 The Board of Directors, having taken into account that following the Shareholders' Meeting on March 6, 2017, the legal reserve had been finalised and had reached the limit as provided for by Art. 2430 of the Italian Civil Code, propose to retain the earnings for the financial year totalling euro 68,477,271.04. Should you be in agreement with our proposals, we invite you to approve the following
RESOLUTIONS
The Shareholders' Meeting, • having examined the Annual Financial Report at December 31, 2016; • having acknowledged the Statutory Auditors Report; • having acknowledged the Independent Auditors' Report;
RESOLVES
a) to approve the Financial Statements of the Company for the financial year closed at December
31, 2016 as presented by the Board of Directors, in their entirety with the individual entries and proposed allocations therein, which report a gain of euro 68,477,271.04;
b) to retain the earnings totalling euro 68,477,271.04

2016 ANNUAL REPORT
310
Report of the Board of Statutory Auditors of Pirelli & C. S.p.A. to the Shareholders' Meeting Dear Shareholders, The Board of Statutory Auditors, pursuant to Art. 2429, paragraph 2, of the Italian Civil Code must disclose to the Shareholders' Meeting, the results for the financial year, the activities performed in the fulfilment of their duties, and make comments and proposals regarding the Financial Statements and their approval. During the course of the financial year the Board of Statutory Auditors has carried out its supervisory tasks in the time allowed by the current regulation and has taken into account the standards of conduct as recommended by the Consiglio Nazionale dei Dottori Commercialisti e degli Esperti Contabili (the Italian equivalent National Board for Chartered Accountants and Auditors), with regard to the internal controls and activities of the Board of Statutory Auditors. It is to be noted here in the introduction, that as a result of (i) the Public Offer launched during the course of 2015 by Marco Polo Industrial Holding S.p.A., (ii) the conversion of savings shares into special shares, of the withdrawal operation relating to the special shares, (iii) the subsequent redemption of the outstanding special shares carried out by the Company on April 29, 2016, and (iv) the merger of Marco Polo Industrial Holding S.p.A. (the Shareholder which directly held the entire outstanding share capital of the Company) into Pirelli & C. S.p.A. (legally effective as of June 1, 2016) as at the date of the Financial Statements, Pirelli & C. S.p.A. no longer had any shares listed on any regulated markets. As a result of the aforesaid, as regards the following, the governance of the listed companies and the powers exercised by the Board of Statutory Auditors regarding this matter are to be construed as limited to the portion of the period during which the shares of the Company were listed.
* * * The parent company Pirelli & C. S.p.A. closed the financial year with a net gain of euro 68,477 thousand (a net loss of euro 1,701 thousand for 2015), revenues which totalled euro 55,991 thousand (euro 22,794 thousand for 2015) and a shareholders' equity which totalled euro 3,206,233 thousand (euro 1,913,928 thousand at December 31, 2015). The consolidated Financial Statements for the 2016 financial year presents revenues of euro 6,058,431 thousand, an operating income (EBIT) of euro 724,154 thousand, with a margin which stood at 11.95% of revenues. Total consolidated net gains amounted to euro 147,625 thousand. It is to be noted, as explained in Note 2 of the consolidated Financial Statements, that as a result of the reverse merger of the holding company Marco Polo Industrial Holding S.p.A. (incorporated company) into the subsidiary Pirelli & C. S.p.A. (incorporating company), effective as of June 1, 2016, that the Financial Statements of Pirelli & C. S.p.A. have been prepared on a going concern basis with respect to the consolidated Financial Statements at December 31, 2015 of the holding company Marco Polo Industrial Holding S.p.A. Therefore the comparative data of the Statement of Financial Position at December 31, 2015 are those of the same aforesaid holding company at December 31, 2015, and the comparative Income Statement data and financial flows are those of the consolidated Financial Statements of Marco Polo Industrial Holding S.p.A. It is also to be noted that the comparative figures at December 31, 2015 were subject to restatement as a result of the completion of the Purchase Price Allocation, and recognised on a provisional basis at December 31, 2015 in accordance with the provisions of IFRS 3 - Business Combinations.
2016 ANNUAL REPORT
311
Based on the aforesaid, it is also to be noted that the comparative consolidated Income Statement data for 2015 is not comparable to that for 2016 as it includes the results for the Pirelli Group for only four months (as of the acquisition date - September 2015). The consolidated net financial position was negative to the amount of euro 4,912,831 thousand (euro 5,331,021 thousand at 2015 year-end). It is to be noted that both the separate and consolidated Financial Statements at December 31, 2016:
§ include the Statement of Financial Position, the Income Statement, the Statement of Comprehensive Income, the Statement of Changes in Equity, the Statement of Cash Flows and the Explanatory Notes;
§ have been prepared in accordance with the International Financial Reporting Standards IAS/IFRS issued by the International Accounting Standards Board (IASB) as approved by the European Union and in force at December 31, 2016. As of February 26, 2016 the Company no longer had any securities listed on the Milan Stock Exchange. The Company has already stated in the consolidated Financial Statements at December 31, 2015 that it would continue to prepare the consolidated Financial Statements in accordance with the IFRS, availing itself of the option granted by Article 3 of Legislative Decree No. 38/2005, an intent confirmed in the Financial Statements at December 31, 2016;
§ are accompanied by the Directors' Report on Operations which contains - among other things - a summary of the main risks and uncertainties as well as an account of the foreseeable outlook for operations.
* * * Appointment of the Board of Statutory Auditors
The appointed Board of Statutory Auditors at the date of these Financial Statements was composed as follows:
- Mr Francesco Fallacara (as Chairman), appointed by the Shareholders’ Meeting on March 14, 2015.
- Mr Fabio Artoni (as Statutory Auditor), appointed by the Shareholders’ Meeting on March 14, 2015.
- Mr Fabrizio Acerbis (as Statutory Auditor), appointed by the Shareholders’ Meeting on March 15, 2016.
- Mr Giovanni Bandera (as Statutory Auditor), appointed by the Shareholders’ Meeting on March 15, 2016.
- Mr David Reali (as Statutory Auditor), appointed by the Shareholders’ Meeting on March 15, 2016.
Mr Fabio Facchini and Ms Giovanna Oddo were the Alternate Auditors. The appointment of the Board of Statutory Auditors, having completed its mandate shall expire with the Shareholders’ Meeting convened for the approval of the Financial Statements at December 31, 2017. Significant events subsequent to the end of the financial year In their report the Directors have illustrated the significant events which occurred subsequent to the end of the financial year. In this regard it is to be noted that:
§ on December 28, 2016 Pirelli reached an agreement for the disposal of 38% of the share capital of Pirelli Industrial S.r.l. to an entity controlled by the Chinese Cinda fund for an amount totalling approximately euro 266 million. The transfer of the aforesaid investment share in Pirelli Industrial S.r.l., which is part of a wider project for the reorganisation and integration of the Industrial business, was finalised on January 13, 2017;
2016 ANNUAL REPORT
312
§ on March 6, 2017 the Shareholders’ Meeting approved the restructuring of the Company's
capital structure and ascribed the amount of euro 116,962 thousand to the legal reserve, which had been drawn from retained earnings as reported in the Statement of Financial Position of the Company at June 30, 2016 and approved by the same Shareholders’ Meeting, which also acknowledged that as a result of the allocation the amount of the legal reserve then amounted to euro 269,076 thousand, equal to 20% of the share capital;
§ during the month of March, 2017 the Shareholders' Meeting of Pirelli & C. S.p.A. resolved to distribute in kind to the sole shareholder, the retained earnings and a part of the surplus merger reserve for a total amount of euro 364,351,082 through the assignment of the entire investment held in TP Industrial Holding S.p.A. constituted by 203,666,000 (two hundred and three million, six hundred and sixty six thousand) ordinary shares with a nominal value of 1 (one) euro each, at a value equal to the carrying amount of the same as calculated above, and therefore equal to euro 364,351,082.
Intra-group or related party transactions
Related party transactions are indicated in the Explanatory Notes attached to the Financial Statements and the consolidated Financial Statements of the Company, which also contain the Income Statement and Statement of Financial Position figures. Pursuant to Article 2391-bis of the Italian Civil Code and to CONSOB Resolution No. 17221 of March 12, 2010 on "Regulations for related party transactions", subsequently modified with CONSOB Resolution No. 17389 of June 23, 2010, on November 3, 2010 the Board of Directors of Pirelli & C. S.p.A., following the favourable approval of the competent Committee composed exclusively of independent Directors (appointed for this reason pursuant to Article 4 of the aforesaid Regulation by a special resolution by the Board of Directors) did unanimously approve the "Procedure for related party transactions". During the course of the 2016 financial year related party transactions whether intra-group or with third parties, were carried out. Related party transactions, including intra-group transactions, are neither unusual nor exceptional, but are part of the ordinary course of business for Group companies. Such transactions, when not settled under standard conditions, or are dictated by specific regulatory conditions, are in any case regulated by conditions consistent with those of the market. Following the delisting of all shares, on March 15, 2016 the Board of Directors also revoked, amongst others, the aforementioned procedure. Impairment Testing Procedure
It is to be noted that following the delisting, the Board of Directors were no longer held, as suggested by the document jointly issued by the Bank of Italy/CONSOB/ISVAP (Italian insurance regulators) on March 3, 2010, to autonomously and preventively approve at the time of the approval of the Financial Statements, that the impairment testing procedure conformed to the requirements of International Accounting Standard IAS 36, following the disclosure of the same by the Audit, Risks, Sustainability and Corporate Governance Committee and the Board of Statutory Auditors. The impairment testing procedures were performed by the Company on the goodwill allocated to the Consumer cash generating unit and were presented at the meeting for the preliminary approval of the draft Financial Statements, prior to the resolution for their approval on March 21, 2016. The Explanatory Notes to the Financial Statements provide the information and results of the evaluation process conducted with the assistance of a highly qualified expert.
***

2016 ANNUAL REPORT
313
Supervisory activities pursuant to Legislative Decree No. 39/2010 "Statutory audits of accounts"
Pursuant to Article 13 of Legislative Decree No. 39/2010, the Board of Statutory Auditors, in conjunction with the Audit, Risks, Sustainability and Corporate Governance Committee did supervise:
§ the financial reporting process; § the effectiveness of the Company's internal control, internal audit and risk management systems; § the statutory audit of the annual and consolidated accounts; § the independence of the Independent Auditing Firm, in particular with regard to the provision of
non-audit services.
Supervision on the financial reporting process
The Board of Statutory Auditors has verified the existence of appropriate regulations and processes to oversee the process for the preparation of financial reports and therefore expresses a positive assessment of the adequacy of the process for preparing financial reports and maintains that there are no irregularities to be submitted to the Shareholders' Meeting. Supervisory activities on the effectiveness of the Company's internal control, internal audit and risk management systems and the statutory audit of the annual and consolidated accounts
During the first half of the year, the Board of Statutory Auditors together with the Audit, Risks, Sustainability and Corporate Governance Committee, and subsequently together with the Audit Committee established on May 12, 2016 (which also has expertise with regard to internal control, risks, sustainability and the corporate governance guidelines of the Group), did periodically meet with the Internal Audit Director and were informed in relation to the results of audit interventions aimed at verifying the adequacy and effectiveness of the Internal Control System, the respect for the law, the Company's procedures and processes as well as the activities for the implementation of its relative plans for improvement, without detecting any critical issues. The Director also received the Audit Plan for the financial year and the relative final financial data. The Board of Statutory Auditors also met the head of Sustainability and Risk Governance, who was informed as to the activities carried out and the plans for future activities. The Board of Statutory Auditors, having also acknowledged reports from the Chief Financial Officer, at the time of the approval of the draft Financial Statements, did confirm the adequacy and suitability of the powers and resources conferred to him by the Board of Directors of the Company. He also confirmed having had direct access to all the information necessary for the production of the accounting data, without the need for any authorisation. The Board of Auditors also acknowledged that the Chief Financial Officer reported that he had participated in internal information flows for accounting purposes and to have approved all the Company procedures that had had an impact on the Income Statement, Statement of Financial Position and Financial Statements of the Company. The Board of Statutory Auditors therefore expresses a positive assessment of the adequacy of the internal control and risk management system as a whole and maintains that there are no irregularities to be submitted to the Shareholders' Meeting. The Board of Statutory Auditors did periodically meet, at least quarterly, with the Independent Auditing Firm. There emerged from those meetings no key issues regarding the audit procedure nor any significant deficiencies in the internal control system relative to the financial reporting process, also pursuant to the provisions of Article 19, paragraph 3 of Legislative Decree No. 39/2010.
2016 ANNUAL REPORT
314
Supervisory activities on the independence of the Independent Auditing Firm, in particular with regard to the provision of non-audit services.
The Board of Statutory Auditors did supervise the independence of the Independent Auditing Firm and, in particular, has received periodic evidence of tasks other than for auditing services to be allocated (or allocated by virtue of specific statutory provisions) to the Statutory Auditor of accounts. With regard to the independence of the Independent Auditing Firm, a detailed group-level procedure has been defined and issued, which establishes that it is forbidden for all the companies of the Pirelli Group to assign appointments to companies belonging to the network of the appointed Statutory Auditor without the prior authorisation of the Chief Financial Officer who, with the assistance of the Internal Audit Director, has the task of verifying that the allocatable assignment is not included amongst those not permitted by Article 17 of the aforementioned Legislative Decree No. 39/2010 and that, in any case, given its characteristics, does not impact on the independence of the auditor. All appointments other than the for the statutory audit of accounts, or those required by law which provide for an annual fee of more than euro 50 thousand are preventively submitted for examination to the Board of Statutory Auditors of Pirelli & C. S.p.A., without prejudice to any justified and specific reasons. The Internal Audit Director did on a quarterly basis provide the Board of Statutory Auditors with a list of non-audit services assigned to the Statutory Auditor. During the course of the 2016 financial year, Ernst & Young S.p.A. carried out the activities summarised below for the Group: (amounts in thousands of euro)
Entity providing the service
Recipient Partial fees Total fees
Audit and certification services
Ernst & Young S.p.A.
Pirelli & C. S.p.A.
474
Audit and certification services
Ernst & Young S.p.A.
Subsidiary companies
670
Audit and certification services
Ernst & Young Network
Subsidiary companies
1,710 2,854 85.8%
Non-audit services
Ernst & Young S.p.A.
Pirelli & C. S.p.A.
433
Non-audit services
Ernst & Young S.p.A.
Subsidiary companies
-
Non-audit services
Ernst & Young Network
Subsidiary companies
39 472 14.2%
3,326 100% The Board of Statutory Auditors maintains that the aforementioned fees are adjusted in accordance to the size, complexity and characteristics of the work performed and also maintains that the appointments (and the relative remuneration) other than for auditing services are not such as to affect the independence of the Statutory Auditor.
2016 ANNUAL REPORT
315
Conferment of the new appointment for the statutory audit of accounts
The Board of Statutory Auditors notes that with the Financial Statements at December 31, 2016 the current audit appointment entrusted to Ernst & Young S.p.A. ceased. Pirelli & C. S.p.A., in consultation with the Board of Statutory Auditors, invited proposals for the three year period 2017-2019, for the purpose of selecting the new Auditor to be appointed for the activities in question to be carried out on all the companies of the Group. Three proposals were submitted to the Company, and an internal selection process was initiated through meetings between management and the invited entities. The selection process was completed on March 9, 2017. On the aforesaid date the undersigned Statutory Auditors, having been required to provide pursuant to Article 13 of Legislative Decree No. 39 of January 27, 2010, as amended by Legislative Decree No. 135 of July 17, 2016 (the "Decree") a substantiated, non-binding recommendation concerning the nomination of the appointee for the role of Statutory Auditor of accounts, did provide a proposal which will be submitted for the deliberation of the Shareholders’ Meeting convened for the approval of the Financial Statements at December 31, 2016.
*** In the performance of their actual functions the Board of Statutory Auditors, as provided for by Article 149 of the Consolidated Law on Financial Intermediation, also supervised:
§ the compliance with laws and the Articles of Association; § the adherence to the principles of proper management; § the adequacy, for the areas falling under its competence, of the Company's organisational
structure.
It is to be noted that a paragraph has been inserted in the Directors’ Report on Operations which contains a description of the main characteristics of the existing risk management and internal control system in relation to the financial reporting process, including the consolidated financial reporting process. The Board of Statutory Auditors acknowledges:
§ that the Directors’ Report on Operations conforms to the current regulations, is consistent with the decisions of the Board of Directors and the results reported in the Financial Statements, and contains adequate information on the activities of the financial year and on intra-group transactions. The section containing the information on related party transactions was inserted in the Explanatory Notes for the Financial Statements in compliance with the IFRS;
§ having verified the rationality of the valuation methods applied and their compliance with the logic of the international accounting standards with particular reference to the financial assets;
§ that the Financial Statements for the financial year and the consolidated Financial Statements of the Company were prepared in accordance with the structure and methods imposed by the current regulations;
§ that on the Boards of Directors of the main subsidiaries are Directors and/or executives of the Parent Company which ensure the coordinated management and the adequate flow of notifications, supported by the appropriate accounting information.
It is also to be noted that the Board of Statutory Auditors:
§ did obtain from the Directors, at least quarterly, also in compliance with the provisions of the specific relevant procedure approved by the Board of Directors, information on activities performed and on operations carried out by the Company of significant importance regarding the Company’s strategy, the Income Statement, the Statement of Financial Position and the
2016 ANNUAL REPORT
316
Financial Statements of the Company. The Board of Statutory Auditors acquired the information needed to perform the tasks of general supervision both through the constant attendance of the Meetings of the Board of Directors, and through interviews with management. On the basis of the information received, the the Board of Statutory Auditors can reasonably assure that the operations that were approved and implemented were in compliance with the law and the Articles of Association, were not manifestly imprudent, or risky, or in conflict of interest, or contrary to the resolutions adopted by the Shareholders' Meetings, or were such as to compromise the integrity of the Company's equity;
§ did receive from the Supervisory Board, established pursuant to Legislative Decree No. 231, of June 8, 2001, information regarding the results of its control activities, and examined the report issued by the Board periodically every half-year, from which it results there emerged no anomalies or censurable facts;
§ did hold regular meetings with representatives of the Independent Auditing Firm in order to exchange with it, as required by Article 150, paragraph 3 of the Consolidated Law on Financial Intermediation, data and information relevant to the performance of its task. In that regard, it is to be noted that no significant data and information emerged that should be indicated in this report;
§ did obtain information from the corresponding Boards of the major subsidiaries concerning the administration and control systems and the general performance of the business (pursuant to paragraphs 1 and 2 of Article 151 of Legislative Decree No. 58/1998).
§ did not receive or issue any complaints pursuant to Article 2408 of the Italian Civil Code; § did express, during the course of the financial year the opinions required by law on the
remuneration of Directors vested with special duties, by expressing opinions as provided for by Article 2389 of the Italian Civil Code, and
§ did issue, during the course of the financial year, opinions pursuant to Article 2437-ter of the Italian Civil Code regarding the fairness of the liquidation value of shares in the case of the exercise of the right of withdrawal.
In relation to the Independent Auditing Firm, the Board of Statutory Auditors notes that Ernst & Young S.p.A.:
§ issued a report on April 4, 2017 containing its assessment of the conformity of the Financial Statements and consolidated Financial Statements with the legislative framework and the applicable accounting standards, with a favourable opinion;
§ confirmed the declaration by the Company with regard to the fact that there were no other appointments of parties linked through continuous relationships to the Independent Auditing Firm itself.
Organisational Structure
The Board of Statutory Auditors has assessed the organisational structure of the Company as adequate for the needs of the same, and appropriate in ensuring compliance with the principles of proper administration.
2016 ANNUAL REPORT
317
Activities of corporate bodies
In addition, the Board of Statutory Auditors with regard to corporate bodies, notes that: § the current Board of Directors - appointed on March 15, 2016 and expiring with the
Shareholders’ Meeting convened for the approval of the Financial Statements at December 31, 2018 - at the date of this report was composed of 16 Directors;
§ the Board of Directors, during the course of 2016, met 10 times; § on May 12, 2016 the Board of Directors established the following Committees with advisory
tasks:
- the Strategies Committee, which during the course of 2016 met 4 times;
- the Remuneration Committee, which during the course of 2016 met 3 times;
- the Nominations and Successions Committee, which during the course of 2016 did not meet;
- the Audit Committee, which during the course of 2016 met 1 time.
The Board of Statutory Auditors has always attended the Board of Directors' Meetings and the Board Committees' Meetings as well as the Shareholders' Meetings. The Board of Statutory Auditors acknowledges:
§ to have verified on the part of its members, the requirements of independence; § to have noted that the Directors' Report, attached to the Financial Statements of the Company,
describes the principal risks and uncertainties to which the company is exposed.
In the course of the supervisory activity performed and on the basis of the information obtained from the Independent Auditing Firm, no omissions, censurable facts, irregularities or in any case other significant facts were detected that would require reporting or mentioning in this report. The previously described activities performed in either collective or individual form, have been acknowledged in the minutes of 8 Board of Statutory Auditors’ Meetings held during the course of 2016.
2016 ANNUAL REPORT
318
Proposal for the Shareholders' Meeting Financial Statements at December 31, 2016
The Board of Statutory Auditors expresses its opinion in favour of the approval of the Financial Statements at December 31, 2016 and has no objections to the proposed resolutions presented by the Board of Directors on the allocation of the results for the financial year. Other proposed matters
As regards the other matters submitted for your approval the Board of Statutory Auditors has no comments. Reference should be made to the specific opinion regarding the non-binding proposal to be rendered as part of the appointment for the statutory audit of the accounts.
**** Milan, April 4, 2017 Mr Francesco Fallacara _____________________ (Chairman) Mr Fabrizio Acerbis _____________________ Mr Fabio Artoni _____________________ Mr Giovanni Bandera _____________________ Mr David Reali _____________________

2016 ANNUAL REPORT
319
07. Certifications

2016 ANNUAL REPORT
320
Independent auditor’s report on the consolidate financial statement

2016 ANNUAL REPORT
321
2016 ANNUAL REPORT
322

2016 ANNUAL REPORT
323
Independent auditor’s report on the parent financial statement
2016 ANNUAL REPORT
324
2016 ANNUAL REPORT
325

2016 ANNUAL REPORT
326
Summary Tables
2016 ANNUAL REPORT
327
GRI G-4 CONTENT INDEX Indicators Description References
STRATEGY AND ANALYSIS
G4-1
Relevance of sustainability to the organization and the organization’s strategy for addressing sustainability 8-9; 58-61
G4-2 Description of key impacts, risks, and opportunities 12-17; 43-52
ORGANIZATIONAL PROFILE
G4-3 Name of the Organisation 173
G4-4 Primary brands, products, and services 38-39; 173
G4-5 Location of the organization’s headquarters 173
G4-6 Countries where the organization operates 8-9; 175
G4-7 Ownership and legal form 56; 173
G4-8 Markets served 27-28
G4-9 Scale of the organization 25-26; 120-121
G4-10 Workforce characteristics 120-121; 127-130
G4-11 Employees covered by collective bargaining agreements 143
G4-12 Organization’s supply chain 91-92
G4-13
Significant changes regarding the organization’s size, structure, ownership, and its supply chain 18-22; 120-123; 175
G4-14 Precautionary approach in risk management 43-52
G4-15
Externally economic, environmental and social charters, principles endorsed by the company
58-59; 85-86; 94-96; 118-119; 144-145; 153-157
G4-16 Memberships of associations 153-157
IDENTIFIED MATERIAL ASPECTS AND BOUNDARIES
G4-17 Entities included in the scope of reporting 58-59; 175-176; 255-260
G4-18 Definition of report content 58-59
G4-19 Material Aspects identified 63-65; 340
G4-20 Material Aspect within the organization 63-65; 340
G4-21 Material Aspect outside the organization 63-65; 340
G4-22 Restatements of information 175-176
G4-23 Significant changes from previous reporting periods in the Scope and Aspect Boundaries 175-176
2016 ANNUAL REPORT
328
Indicators Description References
STAKEHOLDER ENGAGEMENT
G4-24 List of stakeholder groups engaged 62
G4-25 Identification and selection of stakeholders 62
G4-26 Approach to stakeholder engagement 62-65; 68-70; 73-74; 81; 88-90; 140-141; 145-146; 157
G4-27 Key topics and concerns raised through stakeholder engagement 62-65
REPORT PROFILE
G4-28 Reporting period From 01/01/16 to 12/31/16
G4-29 Date of most recent previous report March 2016
G4-30 Reporting cycle Annual
G4-31 Contact point for questions regarding the report 59
G4-32 GRI Content Index 327-339
G4-33 Assurance 58-59; 346
GOVERNANCE
G4-34 Governance structure 55; 60-61
G4-35 Delegated authority for economic, environmental and social topics 55; 60-61
G4-36 Positions with responsibility for economic, environmental and social topics 55; 60-61
G4-37
Processes for consultation between stakeholders and the highest governance body on economic, environmental and social topics 60-61; 63-65
G4-38
Composition of the highest governance body and its committees 11; 55
G4-39 Executive Role of the Chairman 55
G4-40
Nomination and selection processes for the highest governance body and its committees
Website: www.pirelli.com/corporate, sec. governance/bylaws e sec. investors/shareholderinformation/shareholdersagreements
G4-41
Processes for the highest governance body to ensure conflicts of interest are avoided and managed
Website: www.pirelli.com/corporate, sec. Sustainability/Pirelliandsustainablegrowth/policies/codeofconduct and sec. governance/bylaws
G4-42
Highest governance body’s and senior executives’ roles in the development, approval, and updating of the organization’s purpose, value or mission statements, strategies, policies, and goals related to economic, environmental and social impacts
60-61

2016 ANNUAL REPORT
329
Indicators Description References
G4-43
Measures taken to develop and enhance the highest governance body’s collective knowledge of economic, environmental and social topics. 43-52
G4-44 Evaluation of the highest governance body’s performance *
G4-45
Highest governance body’s role in the identification and management of economic, environmental and social impacts, risks, and opportunities
43; 60; Website: www.pirelli.com/corporate, sec. governance/enterpriseriskmanagement/governance
G4-46
Highest governance body’s role in reviewing the effectiveness of the organization’s risk management processes for economic, environmental and social topics
43; 60; Website: www.pirelli.com/corporate, sec. governance/enterpriseriskmanagement/governance
G4-47
Frequency of the highest governance body’s review of economic, environmental and social impacts, risks, and opportunities
43; 60; Website: www.pirelli.com/corporate, sec. governance/enterpriseriskmanagement/governance
G4-48
Highest committee or position that formally reviews and approves the organization’s sustainability report 55; 60-61
G4-49 Process for communicating critical concerns to the highest governance body. 60-61
G4-50
Nature and total number of critical concerns that were communicated to the highest governance body 60-61
G4-51 Remuneration policies for the highest governance body and senior executives 131-132
G4-52 Process for determining remuneration 131-132
G4-53
How stakeholders’ views are sought and taken into account regarding remuneration 63-65; 131-132
G4-54
Ratio of the annual total compensation for the organization’s highest-paid individual to the median annual total compensation for all employees **
G4-55
Ratio of percentage increase in annual total compensation for the organization’s highest-paid individual to the median percentage increase in annual total compensation for all employees
**
ETHICS AND INTEGRITY
G4-56 Values, principles, standards and norms of behavior
58-61; 65-68, 85-86, 95; 118-119; 144-145; 153-157; Sito Website: www.pirelli.com/corporate, sec. Sustainability/Pirelliandsustainablegrowth/policies
2016 ANNUAL REPORT
330
Indicators Description References
G4-57 Internal and external mechanisms for seeking advice on ethical and lawful behavior 68-70
G4-58
Internal and external mechanisms for reporting concerns about unethical or unlawful behavior 68-70
CATEGORY: ECONOMIC
Economic Performance
G4-DMA Disclosure on Management Approach 49-50; 71-72; 145-146
G4-EC1 Direct economic value generated and distributed 71
G4-EC2
Financial implications and other risks and opportunities for the organization's activities due to climate change 49-50; 91
G4-EC3 Coverage of the organization's defined benefit plan obligations 145-146; 288-289; 291
G4-EC4 Financial assistance received from government 72
Market Presence
G4-DMA Disclosure on Management Approach 126-127, 129
G4-EC5
Ratios of standard entry level wage by gender compared to local minimum wage at significant locations of operation 129
G4-EC6
Proportion of senior management hired from the local community at significant locations of operation 127
Indirect Economic Impacts
G4-DMA Disclosure on Management Approach 71-72; 157-163
G4-EC7 Development and impact of infrastructure investments and services supported 71-72; 157-163
G4-EC8 Significant indirect economic impacts, including the extent of impacts 71-72; 88-89; 159-160
Procurement Practices
G4-DMA Disclosure on Management Approach 81; 91
G4-EC9 Proportion of spending on local suppliers at significant locations of operation 91
CATEGORY: ENVIRONMENTAL
Materials
G4-DMA Disclosure on Management Approach 94-96; 99-100
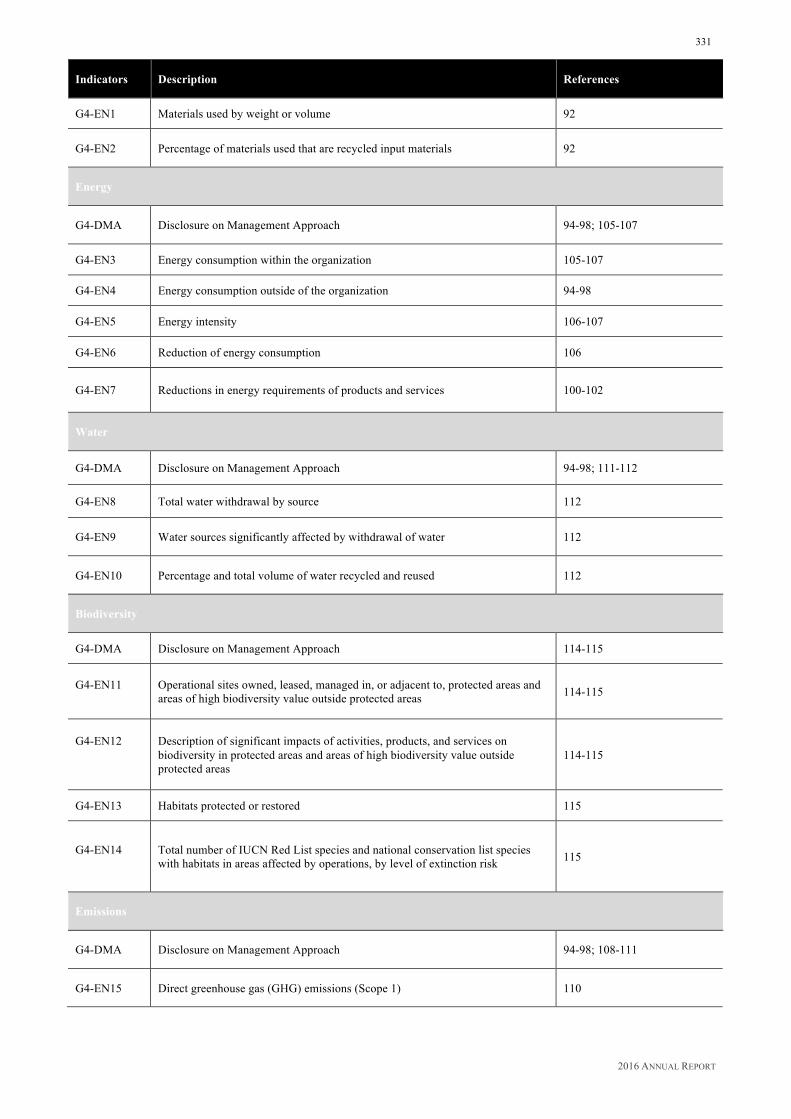
2016 ANNUAL REPORT
331
Indicators Description References
G4-EN1 Materials used by weight or volume 92
G4-EN2 Percentage of materials used that are recycled input materials 92
Energy
G4-DMA Disclosure on Management Approach 94-98; 105-107
G4-EN3 Energy consumption within the organization 105-107
G4-EN4 Energy consumption outside of the organization 94-98
G4-EN5 Energy intensity 106-107
G4-EN6 Reduction of energy consumption 106
G4-EN7 Reductions in energy requirements of products and services 100-102
Water
G4-DMA Disclosure on Management Approach 94-98; 111-112
G4-EN8 Total water withdrawal by source 112
G4-EN9 Water sources significantly affected by withdrawal of water 112
G4-EN10 Percentage and total volume of water recycled and reused 112
Biodiversity
G4-DMA Disclosure on Management Approach 114-115
G4-EN11
Operational sites owned, leased, managed in, or adjacent to, protected areas and areas of high biodiversity value outside protected areas 114-115
G4-EN12
Description of significant impacts of activities, products, and services on biodiversity in protected areas and areas of high biodiversity value outside protected areas
114-115
G4-EN13 Habitats protected or restored 115
G4-EN14
Total number of IUCN Red List species and national conservation list species with habitats in areas affected by operations, by level of extinction risk 115
Emissions
G4-DMA Disclosure on Management Approach 94-98; 108-111
G4-EN15 Direct greenhouse gas (GHG) emissions (Scope 1) 110
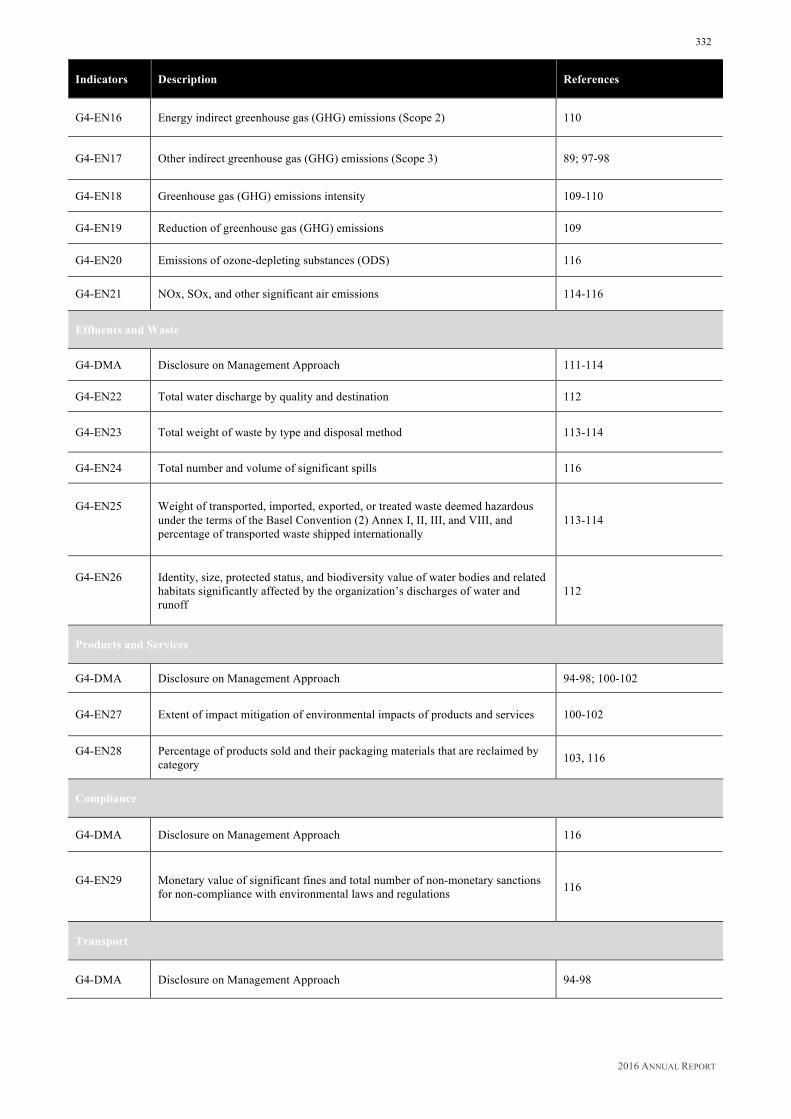
2016 ANNUAL REPORT
332
Indicators Description References
G4-EN16 Energy indirect greenhouse gas (GHG) emissions (Scope 2) 110
G4-EN17 Other indirect greenhouse gas (GHG) emissions (Scope 3) 89; 97-98
G4-EN18 Greenhouse gas (GHG) emissions intensity 109-110
G4-EN19 Reduction of greenhouse gas (GHG) emissions 109
G4-EN20 Emissions of ozone-depleting substances (ODS) 116
G4-EN21 NOx, SOx, and other significant air emissions 114-116
Effluents and Waste
G4-DMA Disclosure on Management Approach 111-114
G4-EN22 Total water discharge by quality and destination 112
G4-EN23 Total weight of waste by type and disposal method 113-114
G4-EN24 Total number and volume of significant spills 116
G4-EN25
Weight of transported, imported, exported, or treated waste deemed hazardous under the terms of the Basel Convention (2) Annex I, II, III, and VIII, and percentage of transported waste shipped internationally
113-114
G4-EN26
Identity, size, protected status, and biodiversity value of water bodies and related habitats significantly affected by the organization’s discharges of water and runoff
112
Products and Services
G4-DMA Disclosure on Management Approach 94-98; 100-102
G4-EN27 Extent of impact mitigation of environmental impacts of products and services 100-102
G4-EN28
Percentage of products sold and their packaging materials that are reclaimed by category 103, 116
Compliance
G4-DMA Disclosure on Management Approach 116
G4-EN29
Monetary value of significant fines and total number of non-monetary sanctions for non-compliance with environmental laws and regulations 116
Transport
G4-DMA Disclosure on Management Approach 94-98
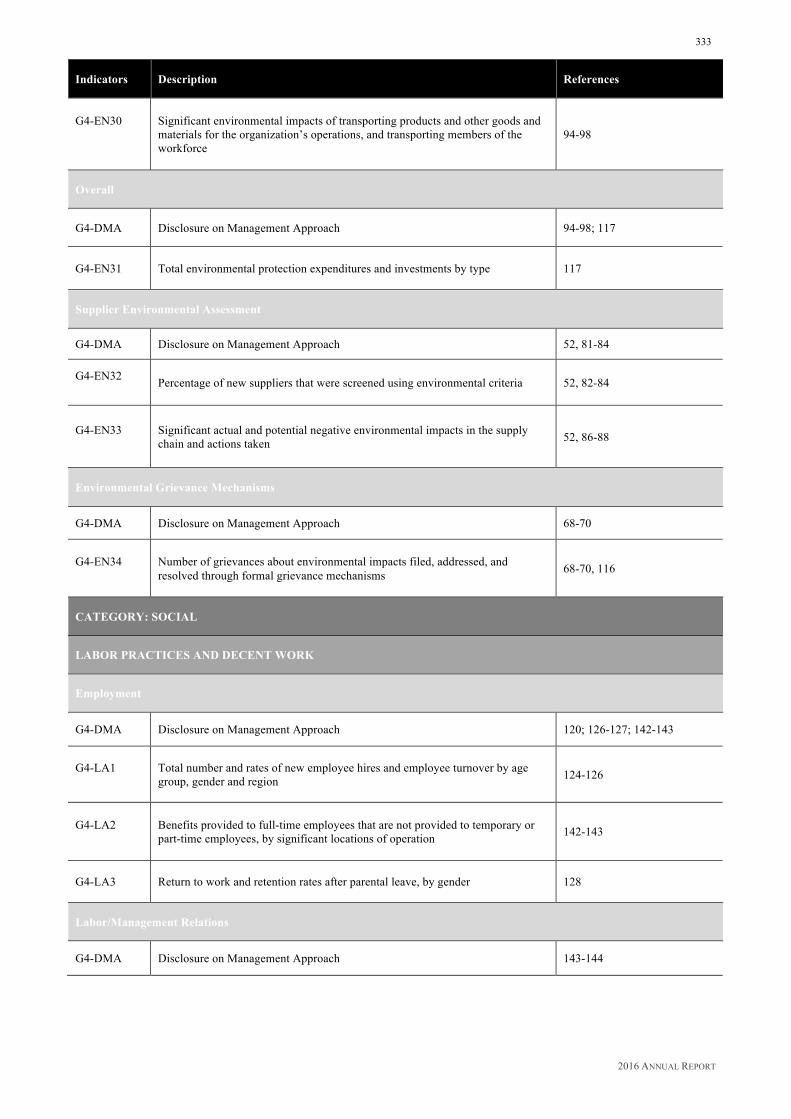
2016 ANNUAL REPORT
333
Indicators Description References
G4-EN30
Significant environmental impacts of transporting products and other goods and materials for the organization’s operations, and transporting members of the workforce
94-98
Overall
G4-DMA Disclosure on Management Approach 94-98; 117
G4-EN31 Total environmental protection expenditures and investments by type 117
Supplier Environmental Assessment
G4-DMA Disclosure on Management Approach 52, 81-84
G4-EN32 Percentage of new suppliers that were screened using environmental criteria 52, 82-84
G4-EN33
Significant actual and potential negative environmental impacts in the supply chain and actions taken 52, 86-88
Environmental Grievance Mechanisms
G4-DMA Disclosure on Management Approach 68-70
G4-EN34
Number of grievances about environmental impacts filed, addressed, and resolved through formal grievance mechanisms 68-70, 116
CATEGORY: SOCIAL
LABOR PRACTICES AND DECENT WORK
Employment
G4-DMA Disclosure on Management Approach 120; 126-127; 142-143
G4-LA1
Total number and rates of new employee hires and employee turnover by age group, gender and region 124-126
G4-LA2
Benefits provided to full-time employees that are not provided to temporary or part-time employees, by significant locations of operation 142-143
G4-LA3 Return to work and retention rates after parental leave, by gender 128
Labor/Management Relations
G4-DMA Disclosure on Management Approach 143-144

2016 ANNUAL REPORT
334
Indicators Description References
G4-LA4
Minimum notice periods regarding operational changes, including whether these are specified in collective agreements 143-144
Occupational Health and Safety
G4-DMA Disclosure on Management Approach 143-144; 146-148
G4-LA5
Percentage of total workforce represented in formal joint management–worker health and safety committees that help monitor and advise on occupational health and safety programs
143
G4-LA6
Type of injury and rates of injury, occupational diseases, lost days, and absenteeism, and total number of work-related fatalities, by region and by gender 149-150
G4-LA7 Workers with high incidence or high risk of diseases related to their occupation 150
G4-LA8 Health and safety topics covered in formal agreements with trade unions 143-144
Training and Education
G4-DMA Disclosure on Management Approach 134-139
G4-LA9
Average hours of training per year per employee by gender, and by employee category 138-139
G4-LA10
Programs for skills management and lifelong learning that support the continued employability of employees and assist them in managing career endings 134-135
G4-LA11
Percentage of employees receiving regular performance and career development reviews, by gender and by employee category 134
Diversity and Equal Opportunity
G4-DMA Disclosure on Management Approach 126-127
G4-LA12
Composition of governance bodies and breakdown of employees per employee category according to gender, age group, minority group membership, and other indicators of diversity
120-123; 127-128
Equal Remuneration for Women and Men
G4-DMA Disclosure on Management Approach 128-129
G4-LA13
Ratio of basic salary and remuneration of women to men by employee category, by significant locations of operation 128-129
Supplier Assessment for Labor Practices

2016 ANNUAL REPORT
335
Indicators Description References
G4-DMA Disclosure on Management Approach 52; 81-84
G4-LA14 Percentage of new suppliers that were screened using labor practices criteria 52; 82-86
G4-LA15
Significant actual and potential negative impacts for labor practices in the supply chain and actions taken 52; 86-88
Labor Practices Grievance Mechanisms
G4-DMA Disclosure on Management Approach 68-70
G4-LA16
Number of grievances about labor practices filed, addressed, and resolved through formal grievance mechanisms 68-70, 117
HUMAN RIGHTS
Investment
G4-DMA Disclosure on Management Approach 81-84; 118-119
G4-HR1
Total number and percentage of significant investment agreements and contracts that include human rights clauses or that underwent human rights screening 82-84; 86-88
G4-HR2
Total hours of employee training on human rights policies or procedures concerning aspects of human rights that are relevant to operations, including the percentage of employees trained
118-119; 137-138
Non-discrimination
G4-DMA Disclosure on Management Approach 126-127
G4-HR3 Total number of incidents of discrimination and corrective actions taken 68-70; 127
Freedom of Association and Collective Bargaining
G4-DMA Disclosure on Management Approach 52; 81-84; 118-119; 143-145
G4-HR4
Operations and suppliers identified in which the right to exercise freedom of association and collective bargaining may be violated or at significant risk, and measures taken to support these rights
52; 86-88; 118-119; 143-145
Child Labor
G4-DMA Disclosure on Management Approach 52; 81-84; 118-119; 143-145

2016 ANNUAL REPORT
336
Indicators Description References
G4-HR5
Operations and suppliers identified as having significant risk for incidents of child labor, and measures taken to contribute to the effective abolition of child labor
52; 86-88; 118-119; 143-145
Forced or Compulsory Labor
G4-DMA Disclosure on Management Approach 52; 81-84; 118-119; 143-145
G4-HR6
Operations and suppliers identified as having significant risk for incidents of forced or compulsory labor, and measures to contribute to the elimination of all forms of forced or compulsory labor
52; 86-88; 118-119; 143-145
Security Practices
G4-DMA Disclosure on Management Approach 52; 81-84; 90; 118-119; 137-138; 144-145
G4-HR7
Percentage of security personnel trained in the organization’s human rights policies or procedures that are relevant to operations 90; 137-138
Indigenous Rights
G4-DMA Disclosure on Management Approach 68-70; 118-119; 144-145
G4-HR8
Total number of incidents of violations involving rights of indigenous peoples and actions taken 68-70
Assessment
G4-DMA Disclosure on Management Approach 52; 81-84; 86-87;118-119; 143-145
G4-HR9
Total number and percentage of operations that have been subject to human rights reviews or impact assessments 52; 118-119; 144-145
Supplier Human Rights Assessment
G4-DMA Disclosure on Management Approach 52; 82-85; 118-119
G4-HR10 Percentage of new suppliers that were screened using human rights criteria 52; 82-85
G4-HR11
Significant actual and potential negative human rights impacts in the supply chain and actions taken 52; 85-88
Human Rights Grievance Mechanisms
G4-DMA Disclosure on Management Approach 68-70; 118-119; 144-145
G4-HR12
Number of grievances about human rights impacts filed, addressed, and resolved through formal grievance mechanisms 68-70
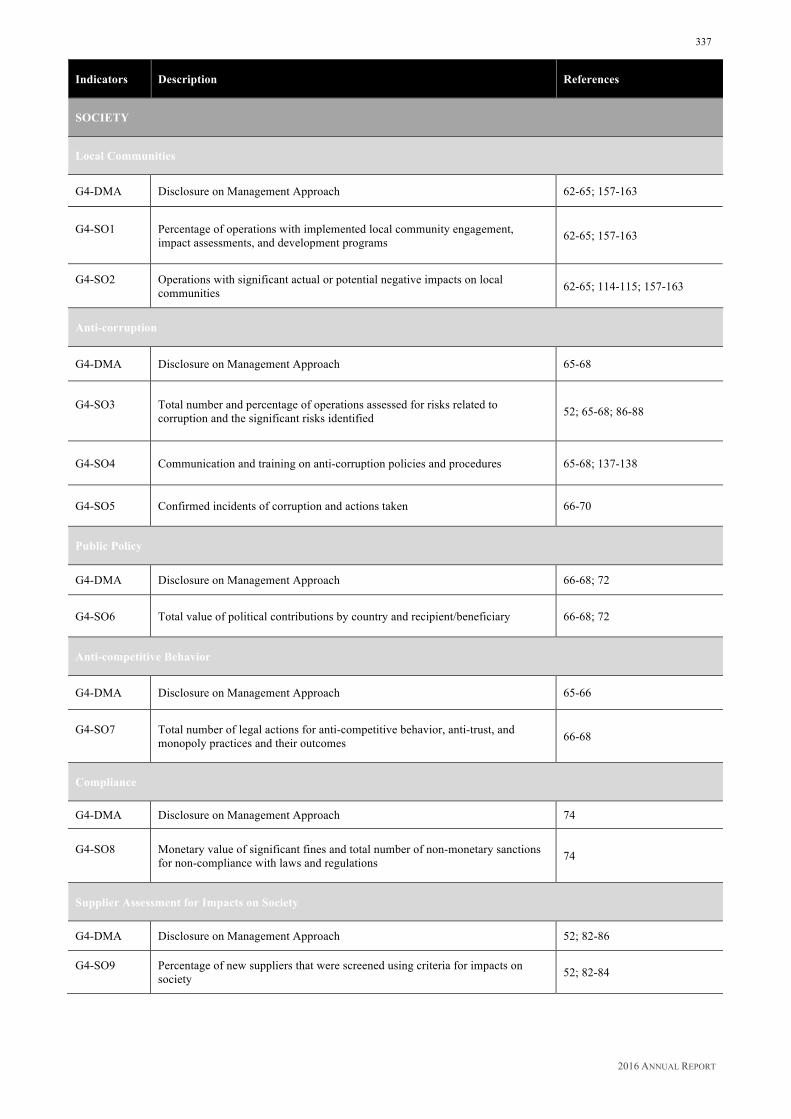
2016 ANNUAL REPORT
337
Indicators Description References
SOCIETY
Local Communities
G4-DMA Disclosure on Management Approach 62-65; 157-163
G4-SO1
Percentage of operations with implemented local community engagement, impact assessments, and development programs 62-65; 157-163
G4-SO2
Operations with significant actual or potential negative impacts on local communities 62-65; 114-115; 157-163
Anti-corruption
G4-DMA Disclosure on Management Approach 65-68
G4-SO3
Total number and percentage of operations assessed for risks related to corruption and the significant risks identified 52; 65-68; 86-88
G4-SO4 Communication and training on anti-corruption policies and procedures 65-68; 137-138
G4-SO5 Confirmed incidents of corruption and actions taken 66-70
Public Policy
G4-DMA Disclosure on Management Approach 66-68; 72
G4-SO6 Total value of political contributions by country and recipient/beneficiary 66-68; 72
Anti-competitive Behavior
G4-DMA Disclosure on Management Approach 65-66
G4-SO7
Total number of legal actions for anti-competitive behavior, anti-trust, and monopoly practices and their outcomes 66-68
Compliance
G4-DMA Disclosure on Management Approach 74
G4-SO8
Monetary value of significant fines and total number of non-monetary sanctions for non-compliance with laws and regulations 74
Supplier Assessment for Impacts on Society
G4-DMA Disclosure on Management Approach 52; 82-86
G4-SO9
Percentage of new suppliers that were screened using criteria for impacts on society 52; 82-84

2016 ANNUAL REPORT
338
Indicators Description References
G4-SO10
Significant actual and potential negative impacts on society in the supply chain and actions taken 52; 86-88
Grievance Mechanisms for Impacts on Society
G4-DMA Disclosure on Management Approach 68-70
G4-SO11
Number of grievances about impacts on society filed, addressed, and resolved through formal grievance mechanisms 68-70
PRODUCT RESPONSIBILITY
Customer Health and Safety
G4-DMA Disclosure on Management Approach 78-79
G4-PR1
Percentage of significant product and service categories for which health and safety impacts are assessed for improvement 78-80
G4-PR2
Total number of incidents of non-compliance with regulations and voluntary codes concerning the health and safety impacts of products and services during their life cycle, by type of outcomes
74
Product and Service Labeling
G4-DMA Disclosure on Management Approach 74-76
G4-PR3
Type of product and service information required by the organization’s procedures for product and service information and labeling, and percentage of significant products and service categories subject to such information requirements
74-78
G4-PR4
Total number of incidents of non-compliance with regulations and voluntary codes concerning product and service information and labeling, by type of outcomes
74
G4-PR5 Results of surveys measuring customer satisfaction 76-78
Marketing Communications
G4-DMA Disclosure on Management Approach 74-76
G4-PR6 Sale of banned or disputed products 74
G4-PR7
Total number of incidents of non-compliance with regulations and voluntary codes concerning marketing communications, including advertising, promotion, and sponsorship, by type of outcomes
74
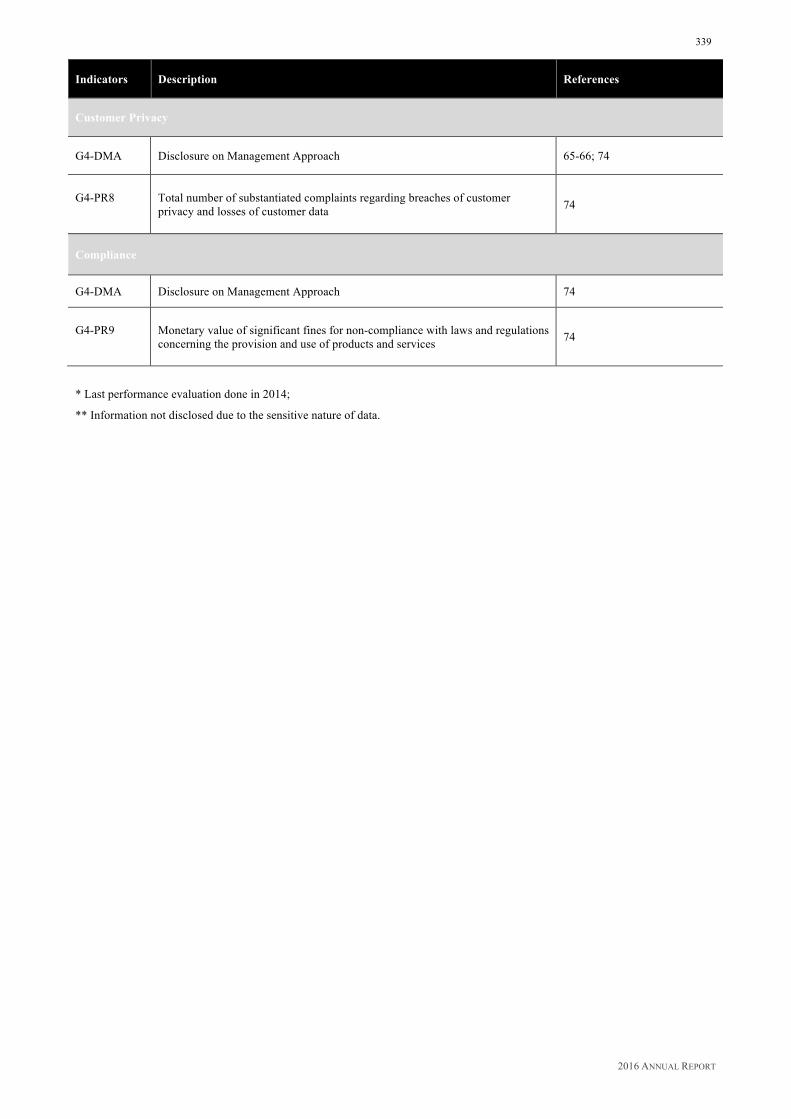
2016 ANNUAL REPORT
339
Indicators Description References
Customer Privacy
G4-DMA Disclosure on Management Approach 65-66; 74
G4-PR8
Total number of substantiated complaints regarding breaches of customer privacy and losses of customer data 74
Compliance
G4-DMA Disclosure on Management Approach 74
G4-PR9
Monetary value of significant fines for non-compliance with laws and regulations concerning the provision and use of products and services 74
* Last performance evaluation done in 2014;
** Information not disclosed due to the sensitive nature of data.
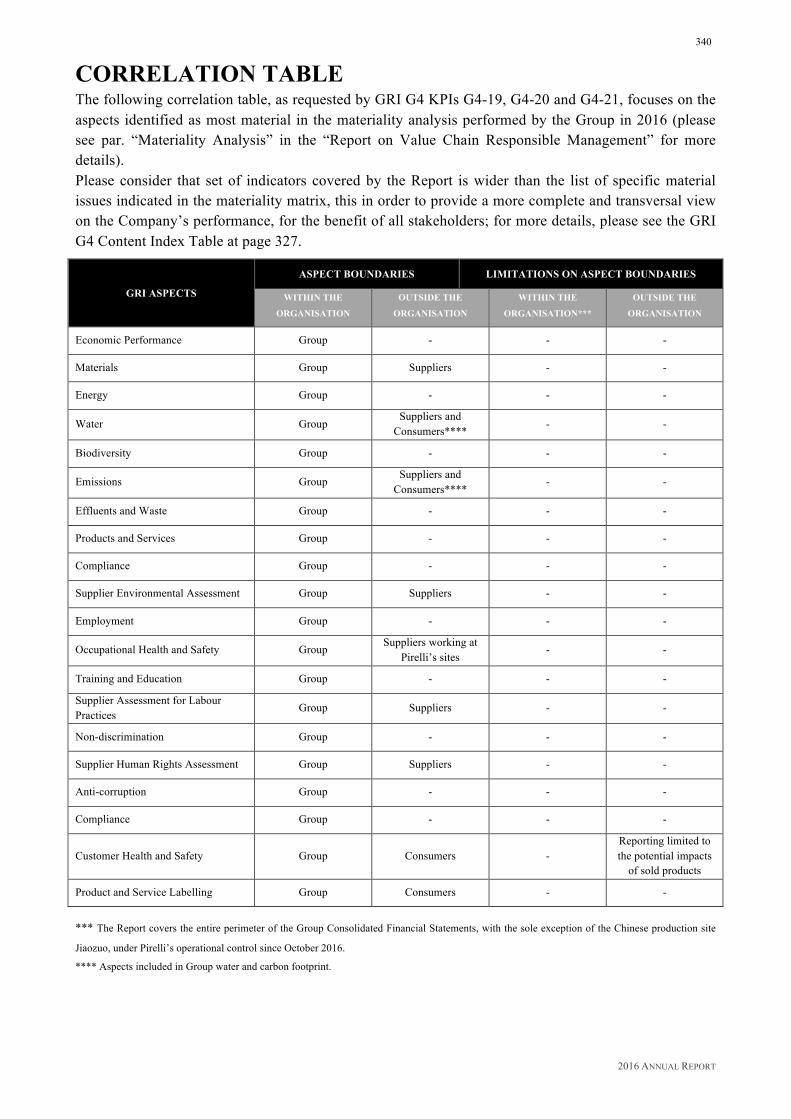
2016 ANNUAL REPORT
340
CORRELATION TABLE
The following correlation table, as requested by GRI G4 KPIs G4-19, G4-20 and G4-21, focuses on the aspects identified as most material in the materiality analysis performed by the Group in 2016 (please see par. “Materiality Analysis” in the “Report on Value Chain Responsible Management” for more details). Please consider that set of indicators covered by the Report is wider than the list of specific material issues indicated in the materiality matrix, this in order to provide a more complete and transversal view on the Company’s performance, for the benefit of all stakeholders; for more details, please see the GRI G4 Content Index Table at page 327.
GRI ASPECTS
ASPECT BOUNDARIES LIMITATIONS ON ASPECT BOUNDARIES
WITHIN THE
ORGANISATION
OUTSIDE THE
ORGANISATION
WITHIN THE
ORGANISATION***
OUTSIDE THE
ORGANISATION
Economic Performance Group - - -
Materials Group Suppliers - -
Energy Group - - -
Water Group Suppliers and
Consumers**** - -
Biodiversity Group - - -
Emissions Group Suppliers and
Consumers**** - -
Effluents and Waste Group - - -
Products and Services Group - - -
Compliance Group - - -
Supplier Environmental Assessment Group Suppliers - -
Employment Group - - -
Occupational Health and Safety Group Suppliers working at
Pirelli’s sites - -
Training and Education Group - - -
Supplier Assessment for Labour Practices
Group Suppliers - -
Non-discrimination Group - - -
Supplier Human Rights Assessment Group Suppliers - -
Anti-corruption Group - - -
Compliance Group - - -
Customer Health and Safety Group Consumers - Reporting limited to the potential impacts
of sold products
Product and Service Labelling Group Consumers - -
*** The Report covers the entire perimeter of the Group Consolidated Financial Statements, with the sole exception of the Chinese production site
Jiaozuo, under Pirelli’s operational control since October 2016.
**** Aspects included in Group water and carbon footprint.
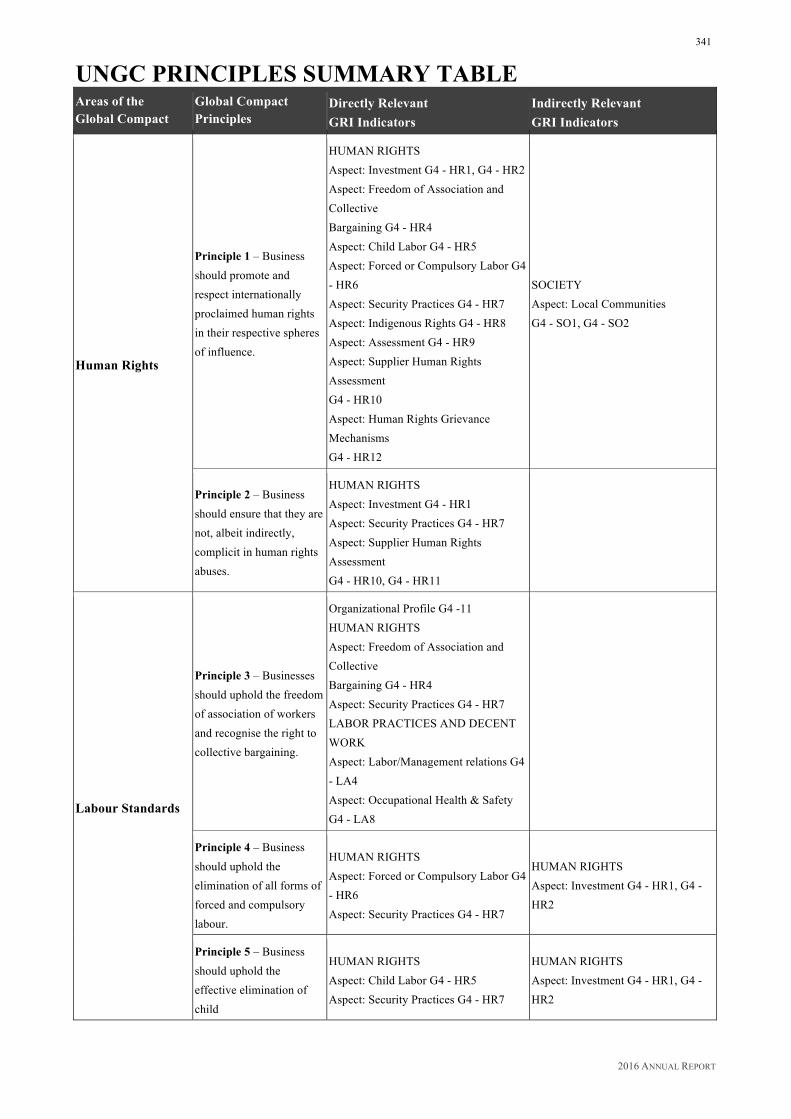
2016 ANNUAL REPORT
341
UNGC PRINCIPLES SUMMARY TABLE Areas of the Global Compact
Global Compact Principles
Directly Relevant GRI Indicators
Indirectly Relevant GRI Indicators
Human Rights
Principle 1 – Business should promote and respect internationally proclaimed human rights in their respective spheres of influence.
HUMAN RIGHTS Aspect: Investment G4 - HR1, G4 - HR2 Aspect: Freedom of Association and Collective Bargaining G4 - HR4 Aspect: Child Labor G4 - HR5 Aspect: Forced or Compulsory Labor G4 - HR6 Aspect: Security Practices G4 - HR7 Aspect: Indigenous Rights G4 - HR8 Aspect: Assessment G4 - HR9 Aspect: Supplier Human Rights Assessment G4 - HR10 Aspect: Human Rights Grievance Mechanisms G4 - HR12
SOCIETY Aspect: Local Communities G4 - SO1, G4 - SO2
Principle 2 – Business should ensure that they are not, albeit indirectly, complicit in human rights abuses.
HUMAN RIGHTS Aspect: Investment G4 - HR1 Aspect: Security Practices G4 - HR7 Aspect: Supplier Human Rights Assessment G4 - HR10, G4 - HR11
Labour Standards
Principle 3 – Businesses should uphold the freedom of association of workers and recognise the right to collective bargaining.
Organizational Profile G4 -11 HUMAN RIGHTS Aspect: Freedom of Association and Collective Bargaining G4 - HR4 Aspect: Security Practices G4 - HR7 LABOR PRACTICES AND DECENT WORK Aspect: Labor/Management relations G4 - LA4 Aspect: Occupational Health & Safety G4 - LA8
Principle 4 – Business should uphold the elimination of all forms of forced and compulsory labour.
HUMAN RIGHTS Aspect: Forced or Compulsory Labor G4 - HR6 Aspect: Security Practices G4 - HR7
HUMAN RIGHTS Aspect: Investment G4 - HR1, G4 - HR2
Principle 5 – Business should uphold the effective elimination of child
HUMAN RIGHTS Aspect: Child Labor G4 - HR5 Aspect: Security Practices G4 - HR7
HUMAN RIGHTS Aspect: Investment G4 - HR1, G4 - HR2
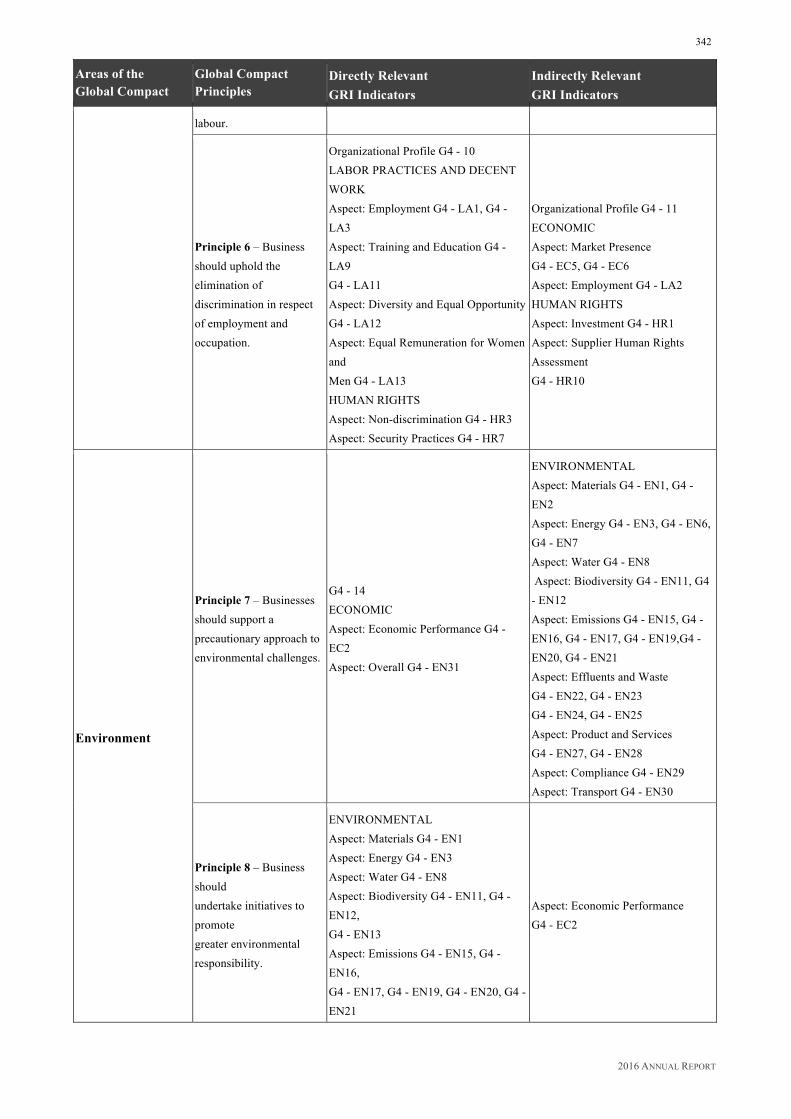
2016 ANNUAL REPORT
342
Areas of the Global Compact
Global Compact Principles
Directly Relevant GRI Indicators
Indirectly Relevant GRI Indicators
labour.
Principle 6 – Business should uphold the elimination of discrimination in respect of employment and occupation.
Organizational Profile G4 - 10 LABOR PRACTICES AND DECENT WORK Aspect: Employment G4 - LA1, G4 - LA3 Aspect: Training and Education G4 - LA9 G4 - LA11 Aspect: Diversity and Equal Opportunity G4 - LA12 Aspect: Equal Remuneration for Women and Men G4 - LA13 HUMAN RIGHTS Aspect: Non-discrimination G4 - HR3 Aspect: Security Practices G4 - HR7
Organizational Profile G4 - 11 ECONOMIC Aspect: Market Presence G4 - EC5, G4 - EC6 Aspect: Employment G4 - LA2 HUMAN RIGHTS Aspect: Investment G4 - HR1 Aspect: Supplier Human Rights Assessment G4 - HR10
Environment
Principle 7 – Businesses should support a precautionary approach to environmental challenges.
G4 - 14 ECONOMIC Aspect: Economic Performance G4 - EC2 Aspect: Overall G4 - EN31
ENVIRONMENTAL Aspect: Materials G4 - EN1, G4 - EN2 Aspect: Energy G4 - EN3, G4 - EN6, G4 - EN7 Aspect: Water G4 - EN8 Aspect: Biodiversity G4 - EN11, G4 - EN12 Aspect: Emissions G4 - EN15, G4 - EN16, G4 - EN17, G4 - EN19,G4 - EN20, G4 - EN21 Aspect: Effluents and Waste G4 - EN22, G4 - EN23 G4 - EN24, G4 - EN25 Aspect: Product and Services G4 - EN27, G4 - EN28 Aspect: Compliance G4 - EN29 Aspect: Transport G4 - EN30
Principle 8 – Business should undertake initiatives to promote greater environmental responsibility.
ENVIRONMENTAL Aspect: Materials G4 - EN1 Aspect: Energy G4 - EN3 Aspect: Water G4 - EN8 Aspect: Biodiversity G4 - EN11, G4 - EN12, G4 - EN13 Aspect: Emissions G4 - EN15, G4 - EN16, G4 - EN17, G4 - EN19, G4 - EN20, G4 - EN21
Aspect: Economic Performance G4 - EC2
2016 ANNUAL REPORT
343
Areas of the Global Compact
Global Compact Principles
Directly Relevant GRI Indicators
Indirectly Relevant GRI Indicators
Aspect: Effluents and Waste G4 - EN22, G4 - EN23, G4 - EN24, G4 - EN25 Aspect: Product and Services G4 - EN28 Aspect: Compliance G4 -EN29 Aspect: Transport G4 - EN30 Aspect: Overall G4 - EN31 Aspect: Supplier Environmental Assessment G4 - EN32, G4 - EN33 Aspect: Environmental Grievance Mechanisms G4 - EN34
Principle 9 – Businesses should encourage the development and diffusion of environmentally friendly technologies.
ENVIRONMENTAL Aspect: Materials G4 - EN2 Aspect: Energy G4 - EN6, G4 - EN7 Aspect: Water G4 - EN10 Aspect: Emissions G4 - EN19 Aspect: Product and Services G4 - EN27
Anti-Corruption
Principle 10 – Businesses should work against corruption in all its forms, including extortion and bribery.
ETHICS AND INTEGRITY G4 - 56, G4 - 57, G4 - 58 SOCIETY Aspect: Anti-corruption G4 - SO3, G4 - SO4, G4 - SO5 Aspect: Compliance G4 - SO8
ETHICS AND INTEGRITY G4 - 56, G4 - 57, G4 - 58 SOCIETY Aspect: Anti-corruption G4 - SO3, G4 - SO4, G4 - SO5 Aspect: Compliance G4 - SO8

2016 ANNUAL REPORT
344
SDGs SUMMARY TABLE Sustainable Development Goals (SDGs) Paragraphs describing the Group’s
activities in support of the SDGs and relevant targets
1 - No Poverty Company Initiatives for the External Community (Solidarity p.160-161)
2 - Zero Hunger Company Initiatives for the External Community (Solidarity p. 160-161)
3 - Good Health and Well-being
Welfare and Initiatives for the Internal Community (pp.142-143)
Occupational Health, Safety and Hygiene (pp. 146-151)
Company Initiatives for the External Community (Road Safety pp.157-159, Sport and Social Responsibility pp.161, Health p.161-162) Target: • Accident Frequency Index: -90% by 2020 compared to 2009
4 - Quality Education
Training (pp.135-139)
Company Initiatives for the External Community (Training pp.159-160, Culture and Social Value p.162-163) Target: • Employee Training: more than 7 days per capita in a year
5 - Gender Equality Diversity Management (pp. 126-131)
6 - Clean Water and Sanitation
Water Management (pp. 111-112) Target: • Water Specific Withdrawal: -58% by 2020 compared to 2009
7 - Affordable and Clean Energy
Energy Management (pp. 105-107)
Management of Greenhouse Gas Emissions and Carbon Action Plan (pp.108-111) Targets: • Specific Energy Consumption: -18% by 2020 compared to 2009 • Specific CO2 Emissions: -15% in 2020 compared to 2009
8 - Decent Work and Economic Growth Our Suppliers (pp. 81-84)
Internal Community (pp. 120, 144-146, 146-151)
9 - Industry, Innovation and Infrastructure
Company Initiatives for the External Community (Training pp. 159-160) Target: • Investments in R&D amounting to 7% of Premium Revenues
10 - Reduced Inequalities Diversity Management (pp. 126-131)
2016 ANNUAL REPORT
345
11 - Sustainable Cities and Communities
Principal International Commitments for Sustainability (WBCSD pp. 155) Company Initiatives for the External Community (Road Safety pp. 157-159, Solidarity p.160-161) Target: • Improvements in Rolling Resistance of car segment tires (reducing CO2
emissions): -40% by 2020 compared to 2009
12 - Responsible Consumption and Production
Energy Management (pp. 105-107)
Management of Greenhouse Gas Emissions and Carbon Action Plan (pp. 108-111)
Water Management (pp. 111-112)
Waste Management (pp. 113-114)
Company Initiatives for the External Community (Training pp.159-160) Targets: • Specific Energy Consumption: -18% by 2020 compared to 2009 • Specific CO2 Emissions: -15% in 2020 compared to 2009 • Water Specific Withdrawal: -58% by 2020 compared to 2009 • Waste Recovery: >95% by 2020
13 - Climate Action
CDP Supply Chain (pp.89)
Management of Greenhouse Gas Emissions and Carbon Action Plan (pp. 108-111)
Principal International Commitments for Sustainability (International Commitments against Climate Change pp. 156-157) Targets: • Specific CO2 Emissions: -15% in 2020 compared to 2009 • Improvements in Rolling Resistance of car segment tires (reducing CO2
emissions): -40% by 2020 compared to 2009
14 - Life below Water Water Management (pp. 111-112)
15- Life on Land Sustainability of the Natural Rubber Supply Chain (pp. 88-89)
Company Initiatives for the External Community (Training pp.159-160)
16- Peace, Justice and Strong Institutions Focus: Anti-corruption and Antitrust Compliance Programmes (pp. 66-68)
17 - Partnerships for the Goals
Sustainability of the Natural Rubber Supply Chain (pp. 88-89)
Principal International Commitments for Sustainability (WBCSD pp. 155)
Company Initiatives for the External Community (Road Safety pp. 157-159)
2016 ANNUAL REPORT
346
Independent auditor’s Report on the report on value chain responsible management
2016 ANNUAL REPORT
347
2016 ANNUAL REPORT
348
2016 ANNUAL REPORT
349