2015.03.25 - CSMP Draft Final - City of · PDF fileBFP belt filter press ... CMOM capacity,...
29
Collection System Master Plan CITY OF PENDLETON MARCH 2015 Murray, Smith & Associates, Inc. engineers|planners draft
Transcript of 2015.03.25 - CSMP Draft Final - City of · PDF fileBFP belt filter press ... CMOM capacity,...

Collection System Master Plan
CITY OF PENDLETON
MARCH 2015
Murray, Smith & Associates, Inc.engineers|planners
draft
13-1442 MSA-ID 03/15
COLLECTION SYSTEM MASTER PLAN
FOR
THE CITY OF PENDLETON
MARCH 2015
MURRAY, SMITH & ASSOCIATES, INC. 345 Bobwhite Court, Suite 230
Boise, ID 83706 208.947.9033
13-1442 City of Pendleton March 2015 Acknowledgments Collection System Master Plan
ACKNOWLEDGMENTS Appreciation is expressed to all who contributed to the completion of this report.
The City of Pendleton Jeff Brown Wayne Green Mark Milne Bob Patterson, P.E. Tim Simons, P.E.
Murray, Smith & Associates, Inc. Dené Breakfield Mark Cummings, P.E. Joe Foote, P.E. Dennis Galinato, P.E. Michelle Hall, P.E. LaDonne Harris David Stangel, P.E.
Galardi Rothstein Group Deborah Galardi
Geo-spatial Solutions Alex Friant Rusty Merritt
DRAFT
13-1442 City of Pendleton March 2015 Acronyms & Abbreviations Collection System Master Plan
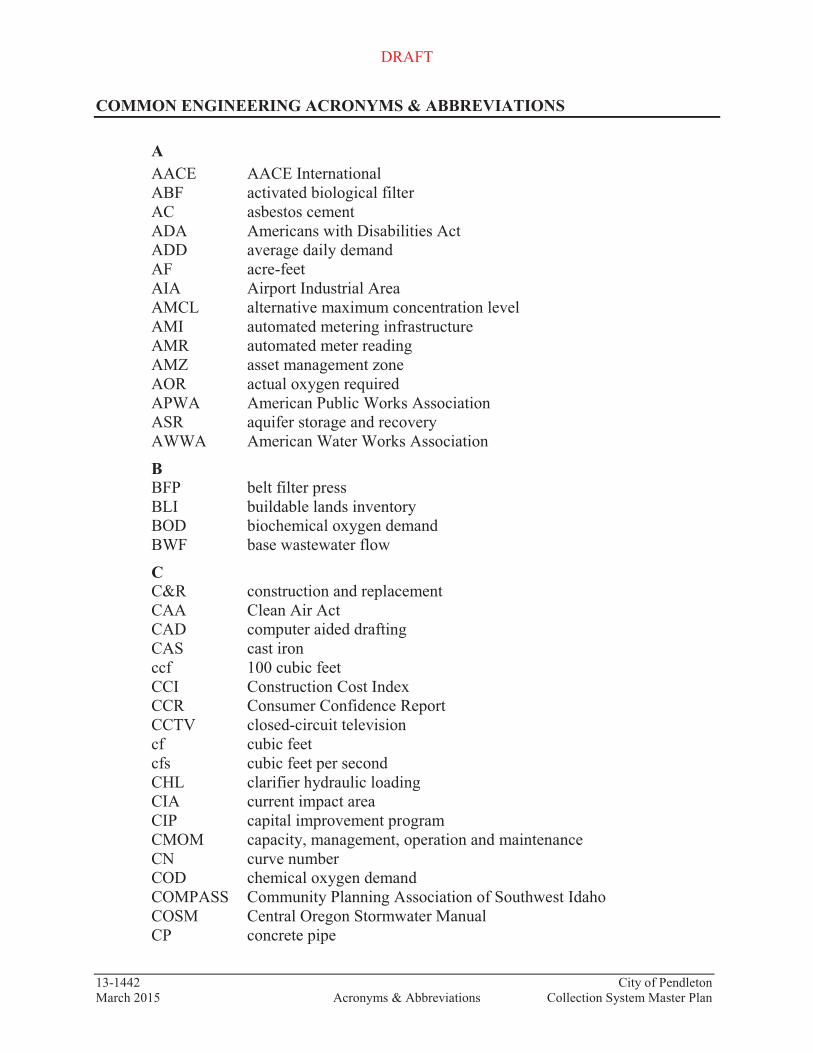
COMMON ENGINEERING ACRONYMS & ABBREVIATIONS
A AACE AACE International ABF activated biological filter AC asbestos cement ADA Americans with Disabilities Act ADD average daily demand AF acre-feet AIA Airport Industrial Area AMCL alternative maximum concentration level AMI automated metering infrastructure AMR automated meter reading AMZ asset management zone AOR actual oxygen required APWA American Public Works Association ASR aquifer storage and recovery AWWA American Water Works Association
B BFP belt filter press BLI buildable lands inventory BOD biochemical oxygen demand BWF base wastewater flow
C C&R construction and replacement CAA Clean Air Act CAD computer aided drafting CAS cast iron ccf 100 cubic feet CCI Construction Cost Index CCR Consumer Confidence Report CCTV closed-circuit television cf cubic feet cfs cubic feet per second CHL clarifier hydraulic loading CIA current impact area CIP capital improvement program CMOM capacity, management, operation and maintenance CN curve number COD chemical oxygen demand COMPASS Community Planning Association of Southwest Idaho COSM Central Oregon Stormwater Manual CP concrete pipe

DRAFT
13-1442 City of Pendleton March 2015 Acronyms & Abbreviations Collection System Master Plan
CPI-U Consumer Price Index, Urban Consumers CSL clarifier solids loading CSMP Collection System Master Plan CTUIR Confederated Tribes of the Umatilla Indian Reservation CWA Clean Water Act
D DBP disinfection byproducts d/D depth to diameter ratio D/DBP disinfectants and disinfection byproducts DEQ Department of Environmental Quality DIP ductile iron pipe DOD depth of flow over diameter of pipe DOE Department of Ecology DWF dry weather flow
E ENR Engineering News Record EOCI Eastern Oregon Correctional Institution EPA U.S. Environmental Protection Agency ERP Emergency Response Plan EUAC Equivalent Uniform Annual Cost
F FEMA Federal Emergency Management Agency FM flow monitors FMB flow meter basin FOG fats, oils, grease fps feet per second ft foot, feet FTE full-time equivalent FV future value FY fiscal year
G GAC granular activated carbon GBT gravity belt thickener GIS geographical information system gpapd gallons per acre per day gpcpd gallons per capita per day gpd gallons per day gpm gallons per minute GPS Global Positioning System gpupd gallons per unit per day GWI groundwater infiltration
DRAFT
13-1442 City of Pendleton March 2015 Acronyms & Abbreviations Collection System Master Plan
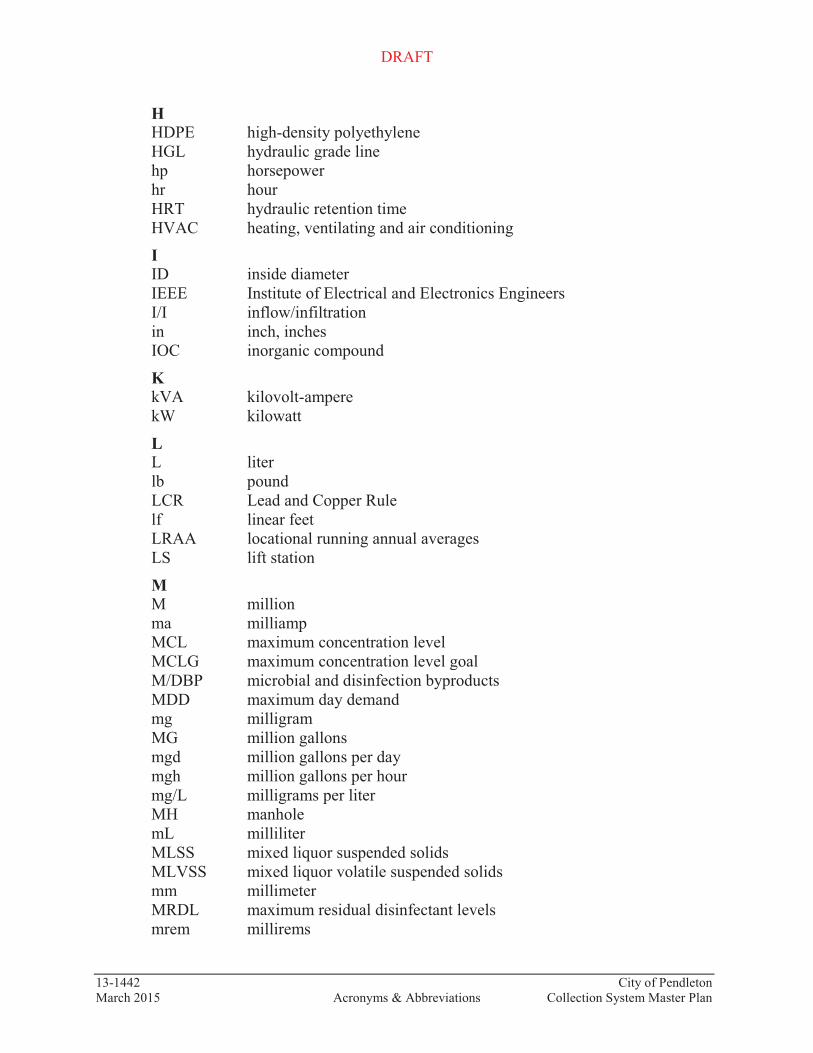
H HDPE high-density polyethylene HGL hydraulic grade line hp horsepower hr hour HRT hydraulic retention time HVAC heating, ventilating and air conditioning
I ID inside diameter IEEE Institute of Electrical and Electronics Engineers I/I inflow/infiltration in inch, inches IOC inorganic compound
K kVA kilovolt-ampere kW kilowatt
L L liter lb pound LCR Lead and Copper Rule lf linear feet LRAA locational running annual averages LS lift station
M M million ma milliamp MCL maximum concentration level MCLG maximum concentration level goal M/DBP microbial and disinfection byproducts MDD maximum day demand mg milligram MG million gallons mgd million gallons per day mgh million gallons per hour mg/L milligrams per liter MH manhole mL milliliter MLSS mixed liquor suspended solids MLVSS mixed liquor volatile suspended solids mm millimeter MRDL maximum residual disinfectant levels mrem millirems

DRAFT
13-1442 City of Pendleton March 2015 Acronyms & Abbreviations Collection System Master Plan
MSA Murray, Smith & Associates, Inc. MSL mean sea level
N NPDES National Pollutant Discharge Elimination System NPV net present value
O O&M operations and maintenance OAR Oregon Administrative Rules ODOT Oregon Department of Transportation
P % percent (use with numerals – e.g., 13%) PAL provisionally accredited levee pCi/L picoCuries per liter PDF peak design flow PDWF peak dry weather flow PER Preliminary Engineering Report PFP Public Facility Plan pH measure of acidity of alkalinity PHD peak hour demand ppb parts per billion ppm parts per million PRS pressure-reducing stations PRV pressure reducing valve psi pounds per square inch PSV pressure-sustaining valve PUD public utility district PV present value PVC polyvinyl chloride PWMP Public Works Management Practices Manual PWWF peak wet weather flow
Q QA quality assurance QC quality control
R RDII rainfall dependent infiltration/inflow ROW right-of-way RRF resource recovery facility RSSD Rieth Sanitary Sewer District
S SBOD soluble biochemical oxygen demand SCADA supervisory control and data acquisition SDC system development charge
DRAFT
13-1442 City of Pendleton March 2015 Acronyms & Abbreviations Collection System Master Plan
SDR standard dimension ratio sec second (measurement of time) SOC synthetic organic compound SOW SRT
scope of work solids retention time
SSOAP Sanitary Sewer Overflow Analysis and Planning SVI sludge volume index SWMP Stormwater Master Plan
T TAZ traffic analysis zones Tc time of concentration TCR Total Coliform Rule TDH total dynamic head TMDL total maximum daily load TP transite pipe T/S transit/storage TSS total suspended solids Tt travel time TTHM total trihalomethanes
U UGA urban growth area UGB urban growth boundary UIC underground injection control USACE United States Army Corps of Engineers USBR United States Bureau of Reclamation USDA United States Department of Agriculture USFS United States Forest Service USFWS United States Fish and Wildlife Service USGS United States Geological Survey
V VFD variable-frequency drive VCP vitrified clay pipe VFD variable frequency drive VOC volatile organic compound VSS volatile suspended solids
W WAS waste-activated sludge WFP water filtration plant WRF water reclamation facility WSMP Water System Master Plan WWTP wastewater treatment plant

13-1442 i City of Pendleton March 2015 Table of Contents Collection System Master Plan
TABLE OF CONTENTS
Page 1. EXECUTIVE SUMMARY
Introduction ................................................................................................................ 1-1 How This Plan Should Be Used ................................................................................. 1-1 Scope of Work ............................................................................................................ 1-1 Organization of the CSMP ......................................................................................... 1-2 Existing System Description ...................................................................................... 1-3 Population Projections ................................................................................................ 1-3 Wastewater Flow Projections ..................................................................................... 1-5 System Analysis ......................................................................................................... 1-6 Operations and Maintenance ...................................................................................... 1-6 Capital Improvement Program ................................................................................... 1-7 Financial Plan ........................................................................................................... 1-10 Summary and Overall CSMP Recommendations .................................................... 1-14 Policy Recommendations ......................................................................................... 1-15 2. EXISTING SYSTEM DESCRIPTION Introduction ................................................................................................................ 2-1 Location, Climate, and Soil Characteristics ............................................................... 2-1 System Management and Overview ........................................................................... 2-1 Collection system Service Area ................................................................................. 2-2 Inventory of Existing System and Facilities ............................................................... 2-6 3. POPULATION AND WASTEWATER FLOW PROJECTIONS Introduction ................................................................................................................ 3-1 Planning Period .......................................................................................................... 3-1 Wastewater Flow Components ................................................................................... 3-1 Base Wastewater Flow Projection .............................................................................. 3-2 Non-Residential Growth ............................................................................................ 3-7 BWF Unit Flow Factors ............................................................................................. 3-7 Future Base Wastewater Flow .................................................................................... 3-8 Existing and Future BWF by Flow Meter Basins ...................................................... 3-9 Groundwater Infiltration .......................................................................................... 3-11 Peak Dry Weather Flow ........................................................................................... 3-12 Wet Weather Flow Projection .................................................................................. 3-15 Future Wet Weather Flow ........................................................................................ 3-16 Total Wastewater Flow Projections (Wet and Dry) ................................................. 3-17 Summary .................................................................................................................. 3-17
13-1442 ii City of Pendleton March 2015 Table of Contents Collection System Master Plan
4. SYSTEM ANALYSIS Introduction ................................................................................................................ 4-1 Hydraulic Model Development .................................................................................. 4-1 Flow Meters ................................................................................................................ 4-2 Model Calibration ...................................................................................................... 4-4 Design and Planning Criteria ................................................................................... 4-16 System Analysis ....................................................................................................... 4-18 Summary .................................................................................................................. 4-25 5. OPERATIONS AND MAINTENANCE Introduction ................................................................................................................ 5-1 O&M Regulations and Guidelines ............................................................................. 5-1 System Overview, O&M Staff, and Certification Status ........................................... 5-2 Current O&M Practices and Procedures .................................................................... 5-5 Benchmark Comparisons ......................................................................................... 5-12 Conclusions and Recommendations ......................................................................... 5-17 Summary .................................................................................................................. 5-24 6. CAPITAL IMPROVEMENT PROGRAM Introduction ................................................................................................................ 6-1 Project Cost Estimates ................................................................................................ 6-1 Capital Improvements ................................................................................................ 6-2 Annual Replacement Program .................................................................................... 6-2 Non-Airport Capacity Projects ................................................................................... 6-2 Airport Industrial Area Projects ............................................................................... 6-11 Summary .................................................................................................................. 6-17 7. FINANCIAL PLAN Introduction ................................................................................................................ 7-1 Background ................................................................................................................ 7-1 Financial Plan ............................................................................................................. 7-3 Recommendations .................................................................................................... 7-11 LIST OF TABLES Table 1-1 – CSMP Organization ........................................................................................... 1-2 Table 1-2 – Population Projections ........................................................................................ 1-5 Table 1-3 – System-Wide Wastewater Flow Projections ...................................................... 1-5 Table 1-4 – CIP Summary ..................................................................................................... 1-9 Table 1-5 – Additional Revenue Requirements (10-Year Period) ...................................... 1-13

13-1442 iii City of Pendleton March 2015 Table of Contents Collection System Master Plan
Table 2-1 – Gravity Pipe Materials ........................................................................................ 2-8 Table 2-2 – Gravity Pipe Diameter and Installation Date...................................................... 2-8 Table 2-3 – Lift Station Summary ......................................................................................... 2-9 Table 2-4 – Force Main Summary ......................................................................................... 2-9 Table 3-1 – Comprehensive Plan Population Data ................................................................ 3-2 Table 3-2 – Residential Density Ranges ................................................................................ 3-2 Table 3-3 – 20-Year Population Projections.......................................................................... 3-4 Table 3-4 – Build-Out Population Projections ...................................................................... 3-5 Table 3-5 – Non-Residential Growth Projections .................................................................. 3-7 Table 3-6 – BWF Unit Flow Factor Assumptions and Calculations ..................................... 3-8 Table 3-7 – Additional BWF Projections .............................................................................. 3-9 Table 3-8 – Base Wastewater Flow Projections by Flow Meter Basin ............................... 3-10 Table 3-9 – River-Dependent Infiltration Factors for Existing Flow Meter Basins ............ 3-12 Table 3-10 – Dry Weather Flow Projection Summary ........................................................ 3-14 Table 3-11 – Wet Weather Characterization ....................................................................... 3-16 Table 3-12 – Existing Wet Weather Parameters .................................................................. 3-16 Table 3-13 – Future Wet Weather Parameters ..................................................................... 3-17 Table 3-14 – Wet Weather Flow Projections ....................................................................... 3-17 Table 3-15 – Total Wastewater Flow Projections by Basin ................................................ 3-18 Table 3-16 – Total Wastewater Flow Projections Summary ............................................... 3-19 Table 4-1 – Dry Weather Calibration Results ........................................................................ 4-7 Table 4-2 – 2013 Storm Events ............................................................................................. 4-9 Table 4-3 – RTK Parameters ............................................................................................... 4-10 Table 4-4 – Wet Weather Calibration Results ..................................................................... 4-13 Table 4-5 – Wet Weather Verification Results .................................................................... 4-15 Table 4-6 – Hydraulic Design and Planning Criteria .......................................................... 4-17 Table 4-7 – Design Criteria – Minimum Slopes .................................................................. 4-18 Table 4-8 – Location of Build-Out System Deficiencies ..................................................... 4-22 Table 4-9 – Lift Station Analysis ......................................................................................... 4-23 Table 4-10 – Force Main Analysis....................................................................................... 4-23 Table 5-1 – Certification Status of Personnel ........................................................................ 5-3 Table 5-2 – Lift Stations ........................................................................................................ 5-7 Table 5-3 – CCTV Inspection and Cleaning Schedule .......................................................... 5-8 Table 5-4 – Benchmarking – Performance Indicators ......................................................... 5-13 Table 5-5 – Benchmarking – Service Areas ........................................................................ 5-13 Table 5-6 – Benchmarking – Flow Rates ............................................................................ 5-14 Table 5-7 – Benchmarking – Gravity Pipe .......................................................................... 5-14 Table 5-8 – Benchmarking – Lift Stations and Force Mains ............................................... 5-14 Table 5-9 – Benchmarking – Collection System O&M Staff .............................................. 5-15 Table 5-10 – Benchmarking - Budget .................................................................................. 5-15 Table 5-11 – Benchmarking - Financing ............................................................................. 5-15 Table 5-12 – Benchmarking – Budget Allocation ............................................................... 5-16

13-1442 iv City of Pendleton March 2015 Table of Contents Collection System Master Plan
Table 5-13 – Pipe Replacement Prioritization ..................................................................... 5-19 Table 6-1 – CIP Capacity Projects ......................................................................................... 6-9 Table 6-2 – Airport Industrial Area CIP .............................................................................. 6-14 Table 6-3 – CIP Summary ................................................................................................... 6-17 Table 7-1 – Summary of Forecast O&M Costs ..................................................................... 7-5 Table 7-2 – Summary of Forecast CIP Costs ......................................................................... 7-6 Table 7-3 – Summary of CIP Funding Sources ..................................................................... 7-6 Table 7-4 – Current and Projected Revenue Requirements from Rates ................................ 7-8 Table 7-5 – Projected Operating Results ............................................................................. 7-10 Table 7-6 – Projected Residential Bills ............................................................................... 7-11 LIST OF FIGURES Figure 1-1 – CIP Projects....................................................................................................... 1-4 Figure 1-2 – Historical Operating Expense Comparison (Combined Water & Sewer) ....... 1-11 Figure 1-3 – Projected Sewer System Revenue Requirements from Rates ......................... 1-12 Figure 2-1 – State Map .......................................................................................................... 2-3 Figure 2-2 – Organizational Chart ......................................................................................... 2-4 Figure 2-3 – Existing Collection System ............................................................................... 2-5 Figure 3-1 – UGB Land Use .................................................................................................. 3-3 Figure 3-2 – Projected Growth Areas .................................................................................... 3-6 Figure 3-3 – Basin D Diurnal Curve .................................................................................... 3-13 Figure 3-4 – City of Pendleton Collection System Design Storm ....................................... 3-15 Figure 4-1 – Flow Meter Basins ............................................................................................ 4-3 Figure 4-2 – Typical Collection System Diurnal Curve ........................................................ 4-5 Figure 4-3 – Dry Weather Calibration Results at the RRF .................................................... 4-8 Figure 4-4 – Calibration and Verification Storms – Rainfall Distribution ............................ 4-9 Figure 4-5 – RDII Volume and Peak Storm Intensity ......................................................... 4-11 Figure 4-6 – RDII Volume and Storm Depth ...................................................................... 4-11 Figure 4-7 – Wet Weather Calibration Results at the RRF ................................................. 4-14 Figure 4-8 – Wet Weather Verification Results at the RRF ................................................ 4-16 Figure 4-9 – Existing to Build-Out Deficiencies ................................................................. 4-24 Figure 5-1 – Organizational Chart ......................................................................................... 5-4 Figure 5-2 – Inspection & Cleaning Program ........................................................................ 5-9 Figure 5-3 – Low-Velocity Gravity Mains .......................................................................... 5-11 Figure 5-4 – Gravity Main Replacement Prioritization ....................................................... 5-20 Figure 6-1 – CIP Projects......................................................................... Section 6 Map Pocket

13-1442 v City of Pendleton March 2015 Table of Contents Collection System Master Plan
Figure 6-2 – Airport CIP ...................................................................................................... 6-16 Figure 7-1 – Historical Operating Expense Comparison (Combined Water & Sewer) ......... 7-2 LIST OF APPENDICES Appendix A: River Influence Appendix B: Wastewater Collection System Maintenance Program Appendix C: 2004 Rieth Wastewater System Agreement Appendix D: Routine Sewer Cleaning/Problem Spots Appendix E: Cost Estimating Methodology and Assumptions

SECTION 1Executive Summary

DRAFT
13-1442 Page 1 - 1 City of Pendleton March 2015 Executive Summary Collection System Master Plan
SECTION 1 EXECUTIVE SUMMARY Introduction The City of Pendleton (City) owns and operates a sewer collection system serving the residents and businesses within its service area. This Collection System Master Plan (CSMP) serves as a planning document to help evaluate growth to build-out of the City’s urban growth boundary (UGB), which will approximately double the number of current residents and projected sewer loadings. The UGB covers an area of 13.4 square miles and defines the extent to which the City may expand in the future; it was used as the boundary for build-out projections within this CSMP. This CSMP addresses the City’s sewer collection system only, and does not include any evaluation or improvement recommendations for the Resource Recovery Facility (RRF). The Pendleton Wastewater Treatment Facility Plan completed in 2007 provides recommendations for the RRF. How This Plan Should Be Used This CSMP serves as the guiding document for future collection system improvements, and should:
� Be reviewed annually in coordination with other utilities to prioritize and budget needed improvements.
� Have its mapping updated regularly to reflect ongoing development and construction.
� Have its specific system improvement recommendations regarded as conceptual. (The location, size and timing of projects may change as additional site-specific details and potential alternatives are investigated and analyzed in the preliminary engineering phase of project design.)
� Update and refine its cost estimates with preliminary engineering and final project designs.
Scope of Work The City selected Murray, Smith & Associates, Inc. (MSA) to create master plans for the potable water, stormwater, and sewer collection systems. The scope of work (SOW) for this CSMP includes the following major tasks and deliverables:
� Describe the City’s existing collection system. � Develop and calibrate a hydraulic model.

DRAFT
13-1442 Page 1 - 2 City of Pendleton March 2015 Executive Summary Collection System Master Plan
� Develop population and dry weather sewer flow projections consistent with the City’s 2011 Comprehensive Plan Update.
� Develop infiltration and inflow dependent wet weather flow projections. � Develop design and planning criteria. � Evaluate the collection system’s hydraulic capacity to identify deficiencies for
existing (2013), 5-year, 10-year, 20-year, and build-out planning horizons. � Conduct and summarize benchmarking data comparing the City’s operations and
maintenance (O&M) practices to similar municipalities. � Review the City’s current O&M program and present recommendations. � Develop an ongoing repair and replacement program for lifts stations, system piping
and manholes. � Develop capital improvement program (CIP) recommendations and cost opinions for
projects required through build-out. � Develop a specific future improvement plan for the Airport Industrial Area (AIA) in
northwest Pendleton. � Develop a collection system financial plan that identifies a funding strategy for the
CIP, aging infrastructure repair and replacement, and staffing. Organization of the CSMP This CSMP is organized into seven sections, as described in Table 1-1. Detailed technical information and support documents are included in the appendices.
Table 1-1
CSMP Organization
Section Description
1 – Executive Summary Purpose and scope of the CSMP and summary of key components of each part of the plan.
2 – Existing System Description Description of the service area and overview of the existing system and facilities.
3 – Population and Wastewater Flow Projections
Population projections, dry weather and wet weather estimates for existing and future sewer flows.
4 – System Analysis Calibration methodology and results, overview of the evaluation criteria and approach, discussion of hydraulic deficiencies for existing and future planning horizons.
5 – Operations and Maintenance
Describes current operations and maintenance procedures, summary of benchmarking results comparing the City to similar municipalities, summary of recommendations.
6 – Capital Improvement Program
Improvement recommendations including cost opinions and timeframe for implementation.
7 – Financial Evaluation Strategy for funding collection system improvements.

DRAFT
13-1442 Page 1 - 3 City of Pendleton March 2015 Executive Summary Collection System Master Plan
Existing System Description The Public Works Director manages the City-owned collection system and supervises the Public Works Superintendent, who oversees the system’s operation. Prior to the planning process, MSA and the City undertook an effort to create a Geographic Information System (GIS) of the water, collection and storm systems. Prior to the creation of the GIS, information on the system was generally maintained in CAD, however in some cases hard copy maps provided the most accurate record of the size and location of infrastructure. The new GIS was used as the basis for this planning effort including the development of the hydraulic model. The City recently hired a GIS Coordinator who is working to improve the quality of the information in addition to collecting new data points and attributes. As part of this CSMP, the City’s service area was separated into 11 sewer basins shown in Figure 1-1. The collection system consists of approximately 87 miles of gravity pipelines, two miles of force mains, and five lift stations that convey sewage to the RRF. The City’s collection system serves approximately 17,600 people within the City’s urbanized area. The Eastern Oregon Correctional Institution is the City’s single largest sewer contributor housing approximately 1,600 people and contributing approximately 10% of the City’s wastewater flows. In addition, the City receives and conveys flows from the Confederated Tribes of the Umatilla Indian Reservation (CTUIR) and Rieth Sanitary Sewer District (RSSD) for treatment at the City’s RRF. Population Projections Population growth and flow projections were developed for; existing, 5-, 10-, 20-year and build-out intervals. Existing flows were estimated based on flow meter data, RRF influent data, existing winter water consumption records and wastewater diurnal patterns. Future flows were based on residential and non-residential flow factors derived from existing wastewater flow characteristics, non-residential area projections, and population projections. Population projections were based on land use and zoning designations, current and future population, densities, vacancy rates and other assumptions consistent with the City’s 2011 Comprehensive Plan Update. The location and rate of anticipated development was based on a review of the developable land and input from City staff. Population projections are presented in Table 1-2.

R7SL
R7SL
R7SL
R7SL
R7SL
çYFRR
R7SL
R7SL
R7SL
R7SL R7SL
R7SL
R7SL
R7SL
gW
8"
12"
16"
12"
6" 8"
16"
18"
10"
12"
18"
16"
12"
18"
10"
8"8"
12"
16"
12"
6"
18" 24
"16
"
16"
L-6
F-2
G-3
F-1
G-7
G-9
G-6
G-1
G-5
G-8G-11
G-1G
-2
G-1
0
L-2
L-1A
, L-1
B
G-12
G-16
G-1
4 G-17
G-1
8
G-13
G-19
G-15
12"
8"
F-3
4"
10"
16"
F-5
F-4
Rie
th L
S
McK
ay L
S
Bar
tsch
LS
Wes
tgat
e LS
28th
Stre
et L
S
L-5
L-3
L-4
Basi
n A
Basi
n B
Basi
n F
Basi
n E
Basi
n K
Basi
n I
Basi
n C
Basi
n G
Basi
n H
Basi
n D
Basi
n J
§̈¦I-84
§̈¦I-84
§̈¦I-84
Tutuilla CreekUm
atil
la R
iver
Mckay Creek
Nelson Creek
Birch Creek
Tutuilla Creek
Mckay Creek
Um
atil
la R
iver
Um
atil
la R
iver
Umatilla
Rive
rW
ES
TGAT
E
RIET
H RD
SOUTHGATE
SE C
OU
RT
AVE
TUTUILLA RD
SW 2
8TH
DR
STAG
E G
ULC
H R
D
MU
RIE
TTA
RD
S MAIN ST
SW C
OU
RT
AVE
NW
A A
VE
AIRPORT RD
SW 44TH ST
SE B
YERS
AVE
SW F
RAZ
ER A
VE
NW
CA
RD
EN
AVE
NW 12TH ST
NW 5TH ST
NORTHGATE
SW H
AILE
Y AV
E
NW 9TH ST
SW E
MIG
RAN
T AV
E
NW 10TH ST
NW 8TH ST
N MAIN ST
OLD AIRPORT RD
SW 37
TH ST
NW
C A
VE
NE
RIV
ER
SID
E A
VE
SW P
ERKI
NS
AV
E
NW 4TH ST
NW 7TH ST
SW 30TH ST
NW
B A
VE
SE F
RAZ
ER A
VE
SW N
YE
AV
ESE
NY
E A
VE
SW J
AY A
VE
SW 41ST ST
MAI
N ST
SW 4TH ST
SW 28TH ST
NW 49TH ST
SE GOAD RD
SE 3RD ST
SE 4TH ST
NW 6TH ST
NW
J A
VE
NE
ELL
IS P
L
SE C
OU
RT
PL
SE 6TH STSW
ISAA
C A
VE
SUNSET DR
SW 18TH ST
SE 9TH ST
NW 21ST ST
SW ATHENS AVE
SW COURT PL
SW K
IRK
EX
T
NW K
ING
AVE
SE 7TH ST
SW QUIN
NEY AVE
NW 56TH DR
SE 2ND ST
SE IS
AAC
AVE
SW M
AR
SH
ALL
AV
E
SW 33RD ST
NW 14TH ST
SW 29TH ST
SW 23RD ST
SE 8TH ST
SW L
AD
OW
AV
E
SW T
HE
TA C
T
SE 10TH ST
SW 12TH DR
NW
PIO
NE
ER P
L
NE 42ND ST
SE B
YE
RS
PL
SW 2ND ST
SW 1ST ST
SE K
IRK
AV
E
NW
H P
L
NE R
IVER
SIDE
PL
NW
K A
VE
SW J
AY E
XT
SE 1ST ST
SE 14TH ST
SW 19TH ST
SE G
OO
DW
IN A
VE
NW
GO
LDE
N A
VESW
BYE
RS
AV
E
NW 3RD ST
SE 3RD ST
SW 1ST ST
MAI
N ST
SW P
ERKI
NS
AV
E
SW 2ND STSE 1ST ST
SW 18TH ST
SE 7TH ST
SW 1ST ST
SW H
AILE
Y AV
E
Lege
ndC
IP P
roje
ctLi
ft S
tatio
n P
roje
ctR7
SLIm
med
iate
R7SL
Bey
ond
20Ye
ars
R7SL
Dec
omm
issi
onD
iver
sion
Pro
ject
gWIm
med
iate
Gra
vity
Mai
n P
roje
ctIm
med
iate
10-y
ear
20-y
ear
Bey
ond
20 Y
ears
Aba
ndon
Forc
e M
ain
Pro
ject
Imm
edia
teB
eyon
d 20
Yea
rsAb
ando
nAI
P A
rea
Exis
ting
Faci
litie
sçYFRR
Res
ourc
e R
ecov
ery
Faci
lity
R7SL
Lift
Sta
tion
Gra
vity
Tru
nkG
ravi
ty L
ater
alFo
rce
Mai
nR
ailro
adU
GB
Cit
y o
f P
end
leto
nC
oll
ecti
on
Sys
tem
Mas
ter
Pla
n©
Fig
ure
1-1
CIP
Pro
ject
s
13-1
442
Ma
rch
20
15
03,
000
1,50
0Fe
et
I:\BOI_Projects\13\1442\GIS Data\MXD\Collection System\Executive Summary Figures\Fig 1_1 Builout System CIP - MSA11x17L.mxd 2/20/2015 8:51:45 AM myh
Con
nect
ion
From
Con
fede
rate
d Tr
ibes
of t
he
Um
atill
a In
dian
Res
erva
tion
Rie
th S
anita
ry S
ewer
Dis
trict

DRAFT
13-1442 Page 1 - 5 City of Pendleton March 2015 Executive Summary Collection System Master Plan
Table 1-2 Population Projections
Planning Horizon Population
Existing 17,611 5-Year 19,716 10-Year 21,897 20-Year 23,970
Build-Out 31,324 Wastewater Flow Projections Projected wastewater flows are made up of three components: base wastewater flows (BWF), groundwater infiltration (GWI) and rainfall-dependent infiltration/inflow (RDII). BWF is the average domestic wastewater from residential, commercial, industrial and institutional sources. GWI is groundwater entering the collection system unrelated to a rain event, which in the City’s case is from the Umatilla River and its tributary streams for two to three months each spring. RDII is storm water that enters the collection system though infiltration and inflow. Together, the average BWF and GWI make up average dry weather flow (DWF). Peak DWF is the peak hour of DWF during a typical day with maximum GWI contribution. Peak RDII from the design storm that occurs at the same hour as peak DWF results in the peak design flow (PDF). Peak DWF and PDF were used to analyze the collection system under dry- and wet-weather conditions, respectively. Wastewater flow projections are presented in Table 1-3.
Table 1-3
System-Wide Wastewater Flow Projections
Scenario Wastewater Flow1
Unit Existing (2013) 5-Year 10-Year 20-Year Build-Out
Average Dry Weather Flow
gpm2 1,943 2,427 2,791 3,112 4,350 mgd3 2.8 3.5 4.0 4.5 6.3
Peak Dry Weather flow gpm 2,612 3,170 3,619 4,005 5,854 mgd 3.8 4.6 5.2 5.8 8.4
Peak Wet Weather Flows
gpm 3,885 4,416 4,869 5,258 8,965 mgd 5.6 6.4 7.0 7.6 12.9
Peak Design Flow4 gpm 6,497 7,585 8,488 9,265 14,819 mgd 9.4 10.9 12.2 13.3 21.3
1 Per Resolution No. 1065, agreement with the CTUIR, and City input, a permitted flow of 350 gpm, 525 gpm,700 gpm, and 700 gpm was included for 5-year, 10-year, 20-year, and build-out scenarios, respectively.
2 gpm = Gallons per minute. 3 mgd = Million gallons per day. 4 Total flow when the maximum dry weather flow and peak RDII from the design storm occur at the same time, with
the peak hour contribution coinciding with the peak storm intensity.
DRAFT
13-1442 Page 1 - 6 City of Pendleton March 2015 Executive Summary Collection System Master Plan
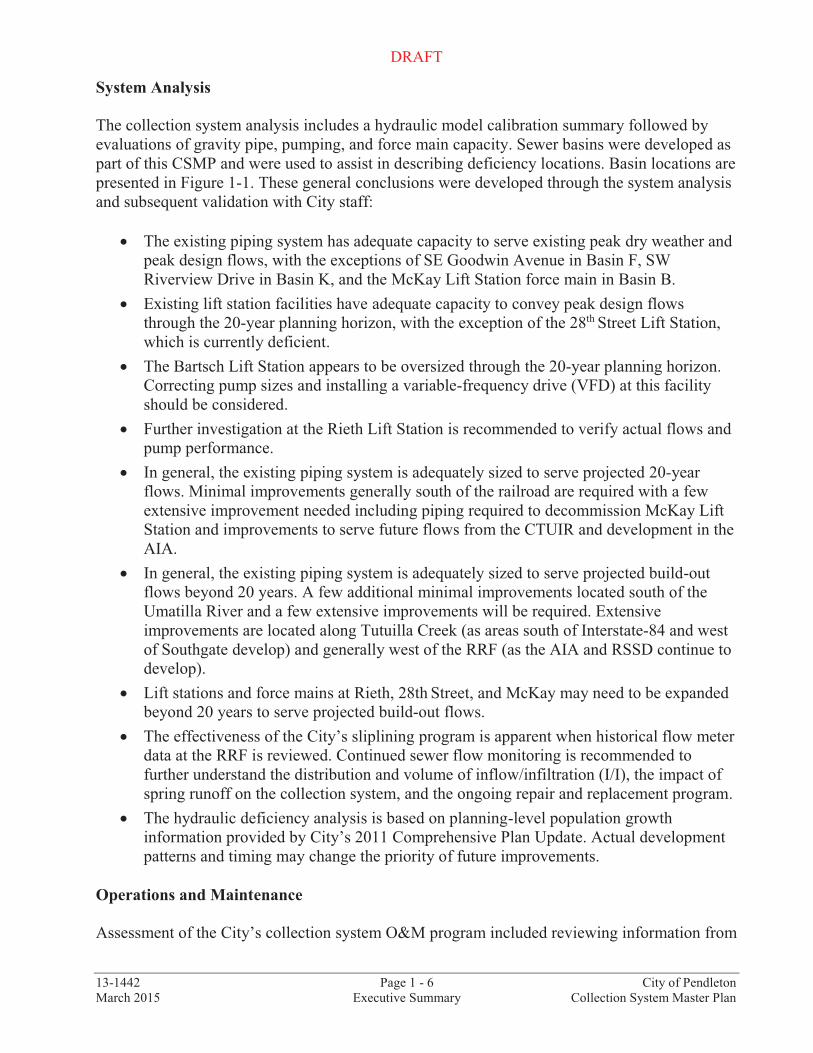
System Analysis The collection system analysis includes a hydraulic model calibration summary followed by evaluations of gravity pipe, pumping, and force main capacity. Sewer basins were developed as part of this CSMP and were used to assist in describing deficiency locations. Basin locations are presented in Figure 1-1. These general conclusions were developed through the system analysis and subsequent validation with City staff:
� The existing piping system has adequate capacity to serve existing peak dry weather and peak design flows, with the exceptions of SE Goodwin Avenue in Basin F, SW Riverview Drive in Basin K, and the McKay Lift Station force main in Basin B.
� Existing lift station facilities have adequate capacity to convey peak design flows through the 20-year planning horizon, with the exception of the 28th Street Lift Station, which is currently deficient.
� The Bartsch Lift Station appears to be oversized through the 20-year planning horizon. Correcting pump sizes and installing a variable-frequency drive (VFD) at this facility should be considered.
� Further investigation at the Rieth Lift Station is recommended to verify actual flows and pump performance.
� In general, the existing piping system is adequately sized to serve projected 20-year flows. Minimal improvements generally south of the railroad are required with a few extensive improvement needed including piping required to decommission McKay Lift Station and improvements to serve future flows from the CTUIR and development in the AIA.
� In general, the existing piping system is adequately sized to serve projected build-out flows beyond 20 years. A few additional minimal improvements located south of the Umatilla River and a few extensive improvements will be required. Extensive improvements are located along Tutuilla Creek (as areas south of Interstate-84 and west of Southgate develop) and generally west of the RRF (as the AIA and RSSD continue to develop).
� Lift stations and force mains at Rieth, 28th Street, and McKay may need to be expanded beyond 20 years to serve projected build-out flows.
� The effectiveness of the City’s sliplining program is apparent when historical flow meter data at the RRF is reviewed. Continued sewer flow monitoring is recommended to further understand the distribution and volume of inflow/infiltration (I/I), the impact of spring runoff on the collection system, and the ongoing repair and replacement program.
� The hydraulic deficiency analysis is based on planning-level population growth information provided by City’s 2011 Comprehensive Plan Update. Actual development patterns and timing may change the priority of future improvements.
Operations and Maintenance Assessment of the City’s collection system O&M program included reviewing information from
DRAFT
13-1442 Page 1 - 7 City of Pendleton March 2015 Executive Summary Collection System Master Plan
City staff, comparing the City’s O&M practices with those of four similarly sized regional utilities, and consulting regulatory requirements. The City’s Sewer Utility and Streets Division staff are responsible for the O&M of the wastewater treatment and collection system, respectively. The Sewer Utility and Streets Division currently operates with nine full-time equivalent employees (FTEs); two of these FTEs are under the direction of the PW Superintendent and are responsible for the collection system’s O&M, storm system O&M, weed spraying, and street maintenance. The City would like to have dedicated O&M staff for each utility with some sharing of resources as needed. Four other utilities where surveyed to compare their O&M practices to the City’s current program including: Walla Walla, Washington; Pullman, Washington; Redmond, Oregon; and Asotin County Public Utility District, Washington. The performance indicators show that each FTE in the City is responsible for more wastewater collected (annual average), total length of gravity system, and total number of lift stations than most of the utilities surveyed. In general, the City operates with fewer staff than the rest of the survey group. Routine collection system operations include monthly visits to all lift stations, periodic inspection and cleaning of the gravity mains, and responding to customer inquiries and complaints. The City is working to update their program through pursuing Public Works Accreditation, which is implementation of best practices as outlined in the American Public Works Association’s Public Works Management Practices Manual-8th Edition (PWMP Manual). The following list summarizes key recommendations based on a review of the City’s O&M practices, accreditation goals, and benchmarking of other collection systems:
� Update, adopt, and implement the 2007 Wastewater Collection System Maintenance Program (Appendix B) based on incorporation of the PWMP Manual best management practices to provide consistent long-term O&M.
� Hire 2.5 additional FTEs. Two FTEs are required to implement the Cleaning and Inspection Program, and a partial FTE is required to implement the O&M program and any associated record keeping.
� Hire 1.5 additional FTEs, which will be part of a second crew of four full time staff with dedicated equipment to perform the ongoing pipe replacement program on a 100-year cycle. The other 2.5 FTEs on the crew would be shared and funded with the Water and Storm Utilities.
Capital Improvement Program The CIP describes projects identified to address existing and future capacity deficiencies and to plan for ongoing repair and replacement of aging infrastructure. Recommended projects are grouped into three categories: capacity projects needed to convey future flows through the existing system (excluding the airport), projects needed to serve future development in the AIA, and an annual replacement program to address aging infrastructure.

DRAFT
13-1442 Page 1 - 8 City of Pendleton March 2015 Executive Summary Collection System Master Plan
Implementation timeframes for these projects include immediate, 10-year, 20-year and beyond 20 years (build-out). Regular CSMP updates are also recommended and budgeted for approximately every five years. The total expected cost by timeframe, per category and infrastructure type, is shown in Table 1-4. All CIP projects (excluding ongoing repair and replacement) are presented in Figure 1-1. In general, the existing gravity system is adequately sized to serve flows over the next 20 years. This CIP includes $22,777,000 in improvements over the next 20 years. There are $88,470,000 in improvements to serve build-out flows including; capacity projects, AIA projects, and 100 years of an annual replacement program. Most of the expense within the next 20 years is for development of the AIA and the lifecycle cost of replacing the existing system. A project summary follows:
� The estimated total cost of an annual program to replace aging infrastructure including gravity main, force main and lift stations over a 100-year cycle is $67,200,000.
� The annual replacement program cost will start at $250,000 per year for first five years and increase incrementally to $672,000 per year after five years and to approximately $699,000 per year beyond 20 years.
� The total estimated cost for all non-airport capacity projects to convey build-out flows is $12,420,000.
� Immediate capacity projects to be constructed within the next five years include constructing approximately 800 feet of gravity main (including one diversion structure), upgrading capacity at one lift station and installing new motors and VFDs at a second lift station. The total estimated cost is $778,000.
� In order to convey 10-year design flows, it is recommended that approximately 300 feet of gravity main be constructed for a total estimated capacity project cost of $104,000.
� In order to convey 20-year design flows, approximately 3,300 feet of gravity main and lift station decommission will be needed in addition to approximately 3,600 feet of gravity main needed if CTUIR flows increase to the contracted amounts, for a total estimated cost of $1,715,000. Wastewater treatment costs associated with additional flow from the CTUIR were not included in this CIP.
� In order to convey build-out flows beyond 20 years, it is recommended that the City construct approximately 19,900 feet of gravity main for a total estimated cost of $5,127,000, and approximately 10,300 feet of force main for a total estimated cost of $785,000.
� Recommended lift station improvements to convey build-out flows beyond 20 years include increasing the firm capacity at two lift stations. The total estimated cost is $3,911,000.
� The CSMP should be updated approximately every five years at a cost of $150,000 per update.
� A budgetary allowance of $370,000 has been provided for the purchase of a combo truck to replace the current combo truck that is being transferred to the Storm Utility in the

DRAFT
13-1442 Page 1 - 9 City of Pendleton March 2015 Executive Summary Collection System Master Plan
immediate timeframe. This cost assumes an estimated $420,000 to purchase a new truck and a $50,000 transfer of funds from the Storm Utility to the Sewer Utility for the current combo truck.
� To convey build-out flows from the AIA, approximately 21,800 feet of gravity main, 6,600 feet of force main, and three lift stations are required. The total estimated cost is $7,880,000.
Table 1-4
CIP Summary
Project Category
Project Description
CIP Schedule and Project Cost Summary1 0-5 Years
(Immediate) 6-10 Years 11-20 Years
Beyond 20 Years Total
Gravity Main
Capacity Projects $204,000 $104,000 $1,715,000 $5,127,000 $7,150,000 AIA2 Projects $3,025,000 $597,000 $3,622,000
Annual Replacement
Program1 $1,250,000 $2,645,000 $5,290,000 $43,715,000 $52,900,000
Subtotal $4,479,000 $3,346,000 $7,005,000 $48,842,000 $63,672,000
Lift Station
Capacity Projects $574,000 $3,911,000 $4,485,000 AIA Projects $3,791,000 $3,791,000
Annual Replacement
Program3 $690,000 $1,380,000 $11,730,000 $13,800,000
Subtotal $4,365,000 $690,000 $1,380,000 $15,641,000 $22,076,000
Force Main
Capacity Projects $785,000 $785,000 AIA Projects $467,000 $467,000
Annual Replacement
Program3 $25,000 $50,000 $425,000 $500,000
Subtotal $467,000 $25,000 $50,000 $1,210,000 $1,752,000
Other
Collection System Master Plan Updates
$150,000 $150,000 $300,000 TBD $600,000
Combo Truck4 $370,000 $370,000 Subtotal $520,000 $150,000 $300,000 TBD $970,000
CIP Total $9,831,000 $4,211,000 $8,735,000 $65,693,000 $88,470,000 1 Cost are based on the Engineering News Record December 2013 Construction Cost Index. 2 Airport Industrial Area (AIA). 3 Cost based on 100 years of annual replacement programs. 4 Cost is based on an estimated $50,000 trade-in value for the current truck that will go toward the estimated
$420,000 cost of a new truck.

DRAFT
13-1442 Page 1 - 10 City of Pendleton March 2015 Executive Summary Collection System Master Plan
Financial Plan Background The sewer system is an enterprise fund of the City, and is supported by sewer system fees and charges, as opposed to general City revenues. The primary funding source is monthly sewer rates charged to customers inside and outside the City. The current monthly sewer rate for a residential dwelling unit is $28.35 inside the City, and $42.50 for a residential retail customer outside the City. The City charges outside-City wholesale customers 110% of the inside-City rates, per prior contract agreements with CTUIR and RSSD. Rates for non-residential customers include both a fixed monthly service charge, and an additional volume charge on water usage over 1,100 cubic feet (cf) for commercial customers. According to the 2013 Washington/Oregon Water Rate Survey by Raftelis Financial Consultants, Inc., the City’s residential sewer bill is the seventh lowest out of the 41 utilities surveyed. The median bill was $39.73 per month, compared to the City’s current bill of $28.35 per month. This represents just the sewer portion of monthly bills and does not include water or other service charges. The City established an annual inflationary adjustment to its water and sewer rates in 2006. In April of each year, rates are adjusted by an amount equal to the lesser of either 3.5%, or the year-to-year percentage change in the Portland-Salem Consumer Price Index, Urban Consumers (CPI-U). Rate increases beyond inflationary adjustments have been limited to regulatory-driven cost increases. Non-inflationary rate changes over the past ten years are as follows:
� 2005 – 18% increase � 2006 – 4.6% increase � 2007 – 98% increase � 2014 – 7% decrease
Financial Capacity Since the inflationary adjustment was implemented in 2006, it has not kept pace with rising costs for water and sewer system operations. Figure 1-2 shows a comparison of inflation-adjusted operating expenses for the water and sewer systems combined, compared to actual historical expenses. The CPI-U (used to adjust rates annually) has increased at an average annual rate of 2.3% since 2007, compared to an average increase in operating costs of about 5.3%. This disparity is due to a number of factors, including higher cost escalation for electricity and chemicals (a large part of the sewer system operating costs), franchise fees (related to non-inflationary rate increases), and City-allocated services costs (primarily personnel costs).

DRAFT
13-1442 Page 1 - 11 City of Pendleton March 2015 Executive Summary Collection System Master Plan
Figure 1-2 Historical Operating Expense Comparison (Combined Water & Sewer)
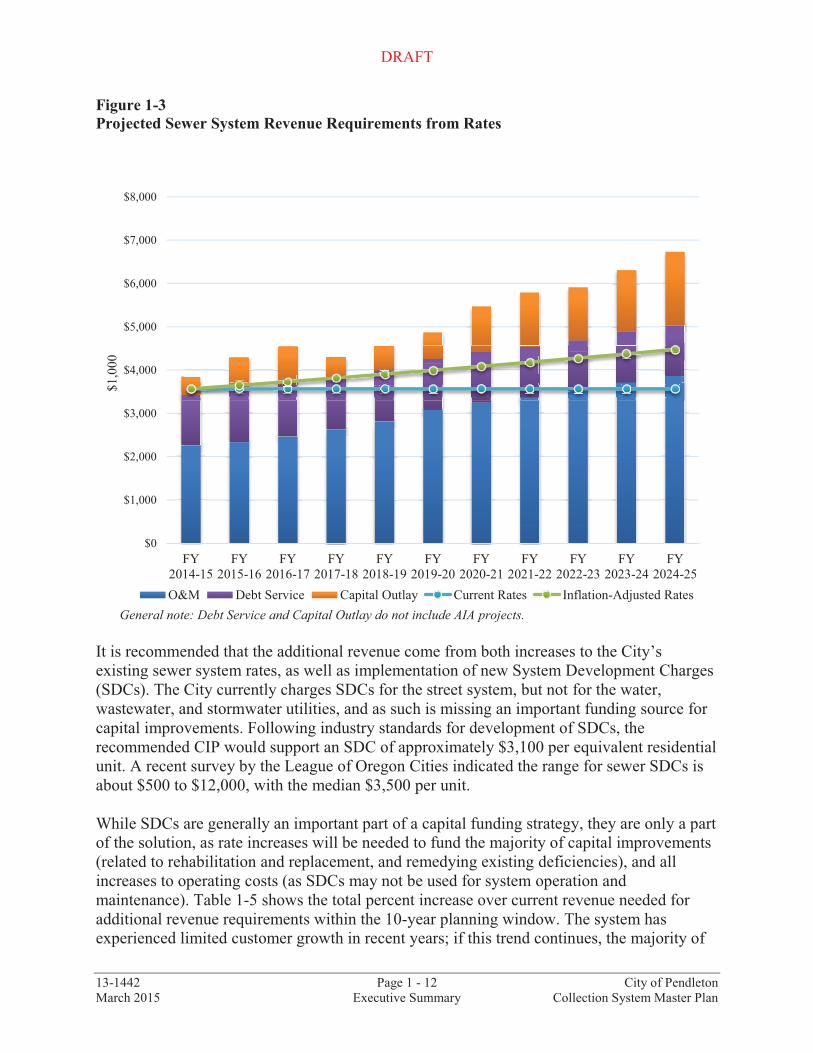
Given that the historical rate increases have not kept pace with operating cost inflation, and the City has not increased rates for non-CPI related cost increases (like funding capital improvements related to rehabilitation and repair, and collection system capacity expansion) since 2007, the current rates do not provide sufficient financial capacity to address the future projected system needs (both operating or capital). Figure 1-3 shows the forecasted current and inflation-adjusted rate revenue, compared to projected annual operating, debt service, and capital outlay requirements for the next 10 years (capital requirements shown in this figure do not include improvements associated with Airport Industrial Area projects). In fiscal year (FY) 2015-16, current rates adjusted for the historical average CPI of 2.3% would just cover current operating costs (about $2.4 million) and debt service ($1.2 million). The City has funded other capital-related expenses in the current budget year (FY2014-15) by drawing down existing operating fund balances. Given the significant capital improvement costs and additional staffing requirements identified in this CSMP, along with other repair and replacement needs for the RRF, additional revenue will be needed beginning in fiscal year 2015-16 to adequately fund the system. Although a transfer from the sewer fund to a fund intended for improvements at the RRF is included in the financial analysis, no evaluation of the improvements needed or adequacy of this funding amount for the RRF are included in this CSMP.
3.0
3.2
3.4
3.6
3.8
4.0
4.2
4.4
4.6
2007 2008 2009 2010 2011 2012 2013
$ M
illio
ns
Inflation-Adjusted Actual
DRAFT
13-1442 Page 1 - 12 City of Pendleton March 2015 Executive Summary Collection System Master Plan
Figure 1-3 Projected Sewer System Revenue Requirements from Rates
General note: Debt Service and Capital Outlay do not include AIA projects.
It is recommended that the additional revenue come from both increases to the City’s existing sewer system rates, as well as implementation of new System Development Charges (SDCs). The City currently charges SDCs for the street system, but not for the water, wastewater, and stormwater utilities, and as such is missing an important funding source for capital improvements. Following industry standards for development of SDCs, the recommended CIP would support an SDC of approximately $3,100 per equivalent residential unit. A recent survey by the League of Oregon Cities indicated the range for sewer SDCs is about $500 to $12,000, with the median $3,500 per unit. While SDCs are generally an important part of a capital funding strategy, they are only a part of the solution, as rate increases will be needed to fund the majority of capital improvements (related to rehabilitation and replacement, and remedying existing deficiencies), and all increases to operating costs (as SDCs may not be used for system operation and maintenance). Table 1-5 shows the total percent increase over current revenue needed for additional revenue requirements within the 10-year planning window. The system has experienced limited customer growth in recent years; if this trend continues, the majority of
$0
$1,000
$2,000
$3,000
$4,000
$5,000
$6,000
$7,000
$8,000
FY2014-15
FY2015-16
FY2016-17
FY2017-18
FY2018-19
FY2019-20
FY2020-21
FY2021-22
FY2022-23
FY2023-24
FY2024-25
$1,0
00
O&M Debt Service Capital Outlay Current Rates Inflation-Adjusted Rates

DRAFT
13-1442 Page 1 - 13 City of Pendleton March 2015 Executive Summary Collection System Master Plan
increased revenue will need to come from sewer rate increases. The required increases shown in Table 1-5 are total for the 10-year planning period. Options for phasing the increases based on the projected timing of capital improvements and staffing modifications will be provided to the City Council.
Table 1-5 Additional Revenue Requirements (10-Year Period)
Item Annual Cost Required Percentage Increase
Current Rate Revenue $3,565,000 Additional Requirements1 New Staff $386,073 11% Franchise Fee on Rate Increase $235,268 7% Other Operating Costs $936,095 26% Rate-supported CIP Costs $757,277 21% RRF Transfer $600,000 17% Debt Service AIA Projects $545,043 15% Other Projects $0 0% Reserve on New Debt $196,698 6%
Total Additional Requirements $3,656,455 103% 1 Annual amount needed in FY 2024-25 above current (FY 2014-15) requirements including projected inflation.
Recommendations The following recommendations related to funding the additional staffing and capital improvements as identified in this CSMP are offered for the City’s consideration:
� Adopt a new SDC based on the growth-related portion of this CSMP and completed Phase I RRF improvements. Adjust the SDC annually for inflation based on the Engineering News Record (ENR) Construction Cost index (20-city average). Update SDCs as necessary to incorporate significant changes to the CIP, including Phase II improvements at the RRF.
� Budget an annual operating contingency equal to 30 to 90 days of O&M costs (consistent with industry standards).
� Change the index for annual inflation-adjustments to rates from the CPI to the ENR. The current index has not kept pace with utility cost increases since it was adopted in 2006. The average annual increase in the ENR (20-city average) has been 3.0%, compared to 2.3% for the CPI.
� Maintain existing capital reserves of $3.8 million to fund Phase II of the RRF expansion.
DRAFT
13-1442 Page 1 - 14 City of Pendleton March 2015 Executive Summary Collection System Master Plan
� Set sewer rates sufficient to fund additional cash reserves for ongoing repair and replacement of existing facilities beyond those included in this CSMP (currently estimated at $600,000 per year for the RRF).
� Cash fund annual repair and replacement collection system CIP costs. Limit additional debt funding for major projects, including AIA improvements.
� Review the financial plan annually, and make modifications to planned rate increases and capital phasing as needed to meet system performance targets.
Summary and Overall CSMP Recommendations This CSMP constituted a major investment of time and resources for City staff and the consultant team. The City and, in particular, the Public Works Department should be commended for its foresight in initiating such a comprehensive scope of work in order to successfully operate, maintain, design and improve the City’s collection system. This CSMP utilized industry standard approaches by compiling and converting information to a GIS database and utilizing hydraulic modeling software to successful ends. Prior to this CSMP no single collection system inventory nor hydraulic model existed. Collecting and compiling system data allowed for a more accurate and comprehensive look at the collection system as a whole than what was previously available. The hydraulic modeling allowed for the evaluation of collection system alternatives based on system hydraulics. The capital projects that have been identified, provide the City with a plan, phased over the next 20 years and beyond that is affordable and implementable. Based on the findings in this CSMP, the following recommendations are made:
� Implement the improvements in the short term (1-10 years) as identified in the CIP to address existing capacity and condition issues as well as provide for planned development in the AIA. In order to maintain infrastructure an annual repair and replacement program should be implemented.
� Operation and maintenance programs should be implemented to increase the lifecycle of infrastructure and to reduce unplanned maintenance.
� Reassess long-term improvements (beyond 10 years) using future CSMP updates: the GIS, hydraulic model and flow monitoring information
� Continue improving the quality of available collection system information, specifically: o Continue to collect flow monitoring information to understand the impact of wet
weather events and river influence on available capacity and system performance o Continue collecting CCTV information related to pipe condition and link to the
GIS database o Continue utilizing the hydraulic model as a tool for predicting flows in the system
DRAFT
13-1442 Page 1 - 15 City of Pendleton March 2015 Executive Summary Collection System Master Plan
� Hire four additional FTEs to support operation and maintenance programs and the annual replacement program.
Policy Recommendations In order to prevent unnecessary large expenditures in the future, it is recommended that the City reconsider its financial and planning review policies, as follows: Planning Review Policies Although planning documents have detailed collection system upgrades, there are no policies in place requiring regular updates, public discussion, or review. Consequently, as updated information becomes available and changes in the system occur, planning may be altered and significant investments could be made when an alternative based on new information may be a better option. The following policy recommendations will better define the requirements of future collection system planning and help future City councils and the public plan for future investments long before they are needed:
� Require City staff to provide an annual review to Council on the status of the master plan.
� Provide an updated or new master plan to City Council every five years for adoption. Once the City revises its policies, it is crucial that future City councils and staff understand the rationale behind these policies. To realize the potential impact of any future policy revisions, the historical context and reasoning behind existing policies must be clearly understood.