
2015 - eprints.kfupm.edu.saeprints.kfupm.edu.sa/139572/1/Thesis.pdf · v ACKNOWLEDGMENTS All praise...
133
Transcript of 2015 - eprints.kfupm.edu.saeprints.kfupm.edu.sa/139572/1/Thesis.pdf · v ACKNOWLEDGMENTS All praise...


iii
© Ahmad Abdellatif
2015

iv
DEDICATION
To Dad, Mom, Brother, Sister, and my lovely Fiancé
for their love and sacrifice

v
ACKNOWLEDGMENTS
All praise and glory are due to Allah for giving me the strength, patience, and guidance to
complete my thesis.
I would like to take this opportunity to express my sincere thanks to my great supervisor
Dr. Mohammad Alshayeb for his support, guidance, and assistance at so many levels
throughout my study at the King Fahd University for Petroleum and Minerals. Also, I
would like to thank everyone in the Information and Computer Science Department.
I would like to deeply thank Dr. Mahmood Niazi (committee member), Dr. Moataz Ahmad
(committee member), and Dr. Sami Zahran for their time and efforts in reviewing this
work.
I would like to extend my deepest gratitude to my parents, who deserve the special mention
for their great support all the time and for putting the foundations of my learning character,
raised me with their caring and love. I want also to thanks my brother Mohammad, sister
Saja, uncle Abdel-Rahmman, and aunt Shahenaz for their support and caring.
Words fail me to express my gratefulness and appreciation to my fiancé Rawan for her
support, encouragement, and caring during my thesis work.
Finally, my appreciation is to all my friends for their concerns and moral supports.
This project was funded by National Plan for Science, Technology and Innovation
(MAARIFAH) - King Abdulaziz City for Science and Technology - through the Science
& Technology Unit at King Fahd University of Petroleum & Minerals (KFUPM) - The
Kingdom of Saudi Arabia, award number 12-INF3012-04.

vi
TABLE OF CONTENTS
ACKNOWLEDGMENTS ............................................................................................................. V
TABLE OF CONTENTS ............................................................................................................. VI
LIST OF TABLES ........................................................................................................................ IX
LIST OF FIGURES ...................................................................................................................... XI
LIST OF ABBREVIATIONS ................................................................................................... XIII
ABSTRACT ............................................................................................................................... XVI
الرسالة ملخص ............................................................................................................................ XVIII
CHAPTER 1 .............................................................................................................................. 19
INTRODUCTION .................................................................................................................... 19
CHAPTER 2 ................................................................................................................................ 22
LITERATURE REVIEW ........................................................................................................... 22
Software Quality ........................................................................................................................... 22
Software Quality Models .............................................................................................................. 25
2.2.1 McCall’s Quality Model .............................................................................................................. 25
2.2.2 Bohem’s Quality Model .............................................................................................................. 28
2.2.3 Dromey’s Quality Model ............................................................................................................ 30
2.2.4 ISO 9126 Quality Model ............................................................................................................. 30
2.2.5 Software Quality Observatory for Open Source Software Quality Model ................................. 32
2.2.6 Olsina’s Quality Model ............................................................................................................... 33
2.2.7 Franke’s Quality Model .............................................................................................................. 34
2.2.8 Zahra’s Quality Model ................................................................................................................ 35
Software Process improvement .................................................................................................... 36

vii
Approaches to Software Process Improvement ............................................................................ 37
2.4.1 CMMI .......................................................................................................................................... 37
2.4.2 SPICE (ISO/IEC 15504) ................................................................................................................ 45
2.4.3 ISO 9000 ..................................................................................................................................... 47
2.4.4 TRILLIUM .................................................................................................................................... 48
2.4.5 BOOTSTRAP ................................................................................................................................ 48
Maturity Models ........................................................................................................................... 49
Certification models ...................................................................................................................... 53
CHAPTER 3 ................................................................................................................................ 63
TECHNICAL-CAPABILITY MATURITY MODEL INTEGRATION (T-
CMMI) ........................................................................................................................................ 63
CHAPTER 4 ................................................................................................................................ 68
PRODUCT MATURITY MODEL OF INTEGRATION (PMMI) ........................................ 68
PMMI Structure ............................................................................................................................ 68
PMMI Stakeholders....................................................................................................................... 75
PMMI Quality Attributes ............................................................................................................... 76
PMMI Quality Metrics ................................................................................................................... 80
PMMI Software Product Maturity Levels and Capability levels ..................................................... 87
PMMI Flexibility ............................................................................................................................ 89
CHAPTER 5 ................................................................................................................................ 90
PRODUCT MATURITY ASSESSMENT METHOD (PMAM) ............................................ 90
PMAM Team ................................................................................................................................. 94
Product Maturity Assessment Input .............................................................................................. 96
Product Maturity Assessment Processes ....................................................................................... 99
Product Maturity Assessment Output ......................................................................................... 101
PMAM Flexibility ......................................................................................................................... 104

viii
CHAPTER 6 ............................................................................................................................. 105
EXAMPLE ................................................................................................................................ 105
Discussion ................................................................................................................................... 117
Threats to Validity ....................................................................................................................... 118
CHAPTER 7 ........................................................................................................................... 119
CONCLUSION AND FUTURE WORK ......................................................................... 119
7.1 Future work ................................................................................................................................ 120
REFERENCES.......................................................................................................................... 121
APPENDIX A ........................................................................................................................... 130
VITAE ....................................................................................................................................... 133

ix
LIST OF TABLES
Table 2.1 Major views of quality ...................................................................................... 23
Table 2.2 Mccall's quality model factors and criteria ....................................................... 26
Table 2.3 Bohem's quality model ..................................................................................... 28
Table 2.4 Maturity levels of cmmi in staged representation ............................................. 41
Table 2.5 Capability levels of cmmi in continuous representation. .................................. 42
Table 2.6 Spice capability levels and process attributes ................................................... 46
Table 2.7 SMMM maturity levels [50] ............................................................................. 50
Table 2.8 A software component quality model, with the sub-characteristics [51] ......... 51
Table 2.9 Sample of component quality attributes for runtime sub- characteristics[51] .. 51
Table 2.10 Generic goals and generic properties of the achievement level [54] .............. 55
Table 2.11 Certification criteria acheivement level [53] .................................................. 58
Table 2.12 LSPCM's certification levels [53] ................................................................... 58
Table 2.13 Rating table for duplication property .............................................................. 61
Table 4.1 PMMI quality attribute with their definitions ................................................... 78
Table 4.2 Recommended list of metrics for PMMI quality attributes .............................. 80
Table 4.3 Capability levels of software product quality attributes ................................... 88
Table 6.1 PMMI stakeholders checklist for DEV-Stage of project X ............................ 105
Table 6.2 PMMI stakeholders checklist for REL-Stage of project X ............................. 106
Table 6.3 PMMI quality attribute checklist .................................................................... 106
Table 6.4 DEV quality attributes with their weights ...................................................... 107
Table 6.5 REL quality attributes with their weights ....................................................... 107
Table 6.6 PMMI metrics checklist for the identified quality attribute in DEV-Stage .... 108
Table 6.7 PMMI metrics checklist for the identified quality attribute in REL-Stage..... 109
Table 6.8 Metrics thresholds and association with capability levels .............................. 110

x
Table 6.9 Product maturity assessment input checklist for project X............................. 110
Table 6.10 List of metrics of each quality attribute on each PMMI stage ...................... 111
Table 6.11 Metric value associated with each capability level for DEV-Stage .............. 112
Table 6.12 Assessment results of DEV-Stage ................................................................ 113
Table 6.13 Product maturity assessment process checklist of project x for DEV-Stage 114
Table 6.14 Each metric value that associated with the capability level of REL-Stage .. 114
Table 6.15 Assessment results of REL-Stage ................................................................. 115
Table 6.16 Product maturity assessment process checklist of project x for REL-Stage . 116
Table 6.17 Product maturity assessment output checklist for DEV-Stage in project X . 116
Table 6.18 Product maturity assessment output checklist for REL-Stage in project X .. 117
Table a.1 PMMI DEV-Stage stakeholders checklist ...................................................... 130
Table a.2 PMMI REL-Stage stakeholders checklist ....................................................... 130
Table a.3 PMMI quality attribute checklist .................................................................... 130
Table a.4 Product maturity assessment input checklist .................................................. 131
Table a.5 Product maturity assessment process checklist for DEV and REL stages ...... 132
Table a.6 Product maturity assessment output checklist for DEV and REL stages ....... 132

xi
LIST OF FIGURES
Figure 2.1 THE DROMEY'S QUALITY MODEL .......................................................... 30
Figure 2.2 ISO 9126 quality model for external and internal quality [26] ....................... 31
Figure 2.3 ISO 9126 quality model for quality in use [26] ............................................... 31
Figure 2.4 SQO-OSS Quality Model ................................................................................ 33
Figure 2.5 ISO 9126 quality model with Olsina's extension [29] ..................................... 34
Figure 2.6 FrankE's Mobile software Quality Model [30] ................................................ 34
Figure 2.7 Zahra's Mobile software Quality Model [31] .................................................. 35
Figure 2.8 History of CMMI [7] ....................................................................................... 39
Figure 2.9 CMMI Maturity Levels ................................................................................... 41
Figure 2.10 CMMI Model with staged representation [8] ................................................ 43
Figure 2.11 CMMI model with continuous representation [8] ......................................... 44
Figure 2.12 SPQMM quality maturity levels [4] .............................................................. 49
Figure 2.13 Concepts of the Certification Model [54] ...................................................... 54
Figure 2.14 Software product area with their elements [54] ............................................ 55
Figure 2.15 Software Component Certification Process [5] ............................................. 57
Figure 2.16 relationship system properties and sub-characteristics [57] .......................... 59
Figure 2.17 Mapping system properties and maintainability sub-characteristics [57] ..... 60
Figure 2.18 Mapping system properties and maintainability sub-characteristics of [61] . 60
Figure 2.19 Certification Level ......................................................................................... 62
Figure 3.1 T-CMMI Architecture ..................................................................................... 64
Figure 3.2 Methodology used in developing T-CMMI .................................................... 67
Figure 4.1 Components of the Product Maturity Model Integration (PMMI) .................. 70
Figure 4.2 PMMI Structure ............................................................................................... 71
Figure 4.3 DEV-Stage scope ............................................................................................. 73
xii
Figure 4.4 REL-Stage scope ............................................................................................. 74
Figure 4.5 PMMI Software Product Maturity Levels ....................................................... 87
Figure 5.1 PMAM Phases ................................................................................................. 92
Figure 5.2 product maturity assessment input Assessment Steps ..................................... 96
Figure 5.3 product maturity assessment process Assessment Steps ................................. 99
Figure 5.4 PMAM Steps ................................................................................................. 103

xiii
LIST OF ABBREVIATIONS
PMMI : Product Maturity Model Integration
SEI : Software Engineering Institute
CMU : Carnegie Mellon University
CMM : Capability Maturity Model
CMMI : Capability Maturity Model of Integration
CMMI-DEV : CMMI for Development
CMMI-ACQ : CMMI for Acquisition
CMMI-SVC : CMMI for Services
SW-CMM : Capability Maturity Model for Software
EIA : Electronic Industries Alliance Standard
PA : Process Area
ARC : Appraisal Requirement for CMMI
SCAMPI : Standard CMMI Appraisal Method for Process
Improvement
ISO : International Organization for Standardization
IEC : International Electrotechnical commission
SQO-OSS : Software Quality Observatory for Open Source Software

xiv
SPI : Software Process Improvement
SPICE : Software Process Improvement and Capability
Determination
SPQMM : Software Product Quality Maturity Model
SMmm : Software Maintenance Maturity Model
SCMM : Software Component Maturity Model
CQM : Component Quality Model
SQuaRE : Software product quality requirements and evaluation
OSMM : Open Source Maturity Model
GQM : Goal-Question-Metric
LaQuSo : Laboratory for Quality Software
LSPCM : LaQuSo Software Product Certification Model
SIG : Software Improvement Group
T¨UViT : T¨UV Informationstechnik GmbH
T-CMM : Technical-Capability Maturity Model
DEV-Stage : Development Stage
REL-Stage : product integration & release stage
PMA : Product Maturity Assessment

xv
FC : Fully Compliant
LC : Largely Compliant
PC : Partially Compliant
NC : Not Compliant
PMAM : Product Maturity Assessment Method

xvi
ABSTRACT
Full Name : [Ahmad Hazzaa Khader Abdellatif]
Thesis Title : [A Framework For Measuring Software Product Maturity]
Major Field : [Software Engineering]
Date of Degree : [May 2015]
The importance of software quality is increasing with the rapid development of different
types of software. Software quality has an important role in developing different types of
software applications. Many organizations use CMMI to assess software products by
assessing the development process that is used in developing the software. However,
previous research has shown that the quality of the product does not depend on the quality
of the process that is used to develop the product.
The objective of this work is to propose a framework to measure software product maturity
called Technical-Capability Maturity Model Integration (T-CMMI) in order to assess the
final software product without depending on the development process of that software. T-
CMMI contains a reference model and an assessment method. The reference model is
called Product Maturity Model Integration (PMMI). PMMI has four different product
maturity levels and two stages. These stages are concerned with the internal and external
quality attributes. Each stage has its own stakeholders, set of quality attributes, and metrics
to measure these quality attributes. The T-CMMI assessment method is called Product
Maturity Assessment Method (PMAM) which contains guidelines on how to use PMMI to
measure the maturity level of software.
xvii
T-CMMI helps software organizations in evaluating software products to ensure that they
meet the desired quality before releasing them. T-CMMI also helps software clients in
assessing software to ensure that it meets the desired quality levels in order to purchase it.
xviii
ملخص الرسالة
عبداللطيفأحمد هزاع خضر :االسم الكامل
إطار لقياس نضج المنتج البرمجي :عنوان الرسالة
هندسة البرمجيات التخصص:
2015مايو :تاريخ الدرجة العلمية
أهمية جودة البرمجيات تتزايد مع التطور السريع ألنواع مختلفة من البرمجيات. جودة البرمجيات تلعب دورا هاما في
( CMMIالعديد من المؤسسات تستخدم نموذج نضج القدرات المتكامل ) البرمجية.تطوير أنواع مختلفة من التطبيقات
لتقييم المنتج البرمجي من خالل تقييم عملية التطوير المستخدمة لتطوير المنتج. و لكن, األبحاث السابقة اظهرت ان
.جودة المنتج البرمجي ال تعتمد على جودة "عملية التطوير" المستخدمة لصناعة البرنامج
لنموذج –الهدف من خالل هذا العمل اقتراح اطار لقياس نضج المنتج البرمجي. اسم هذا المقترح هو االطار الفني
الذي يهدف الى تقييم المنتج البرمجي النهائي من دون االعتماد على "عملية (T-CMMI)نضج القدرات المتكامل
تتكون من قسمين: النموذج المرجعي و طريقة التقييم. النموذج المرجعي يسمى T-CMMIالتطوير البرمجي". ال
تتكون من اربع مستويات للنضج و مرحلتين.هذه المراحل تركز PMMI. ال (PMMI)نضج المنتج نموذج التكامل
المعنية, سمات على قياس سمات الجودة الداخلية و الخارجية للمنتج البرمجي. كل مرحلة من المراحل لها الجهات
التي تحتوي (PMAM)تسمى طريقة تقييم نضج المنتج T-CMMIالجودة, و المقاييس الخاصة بها. طريقة التقييم بال
لقياس نضج المنتج. (PMMI)على تعليمات عن كيفية استخدام ال
قه. مرغوبة قبل اطالتساعاد مؤسسات التطوير على قياس المنتج البرمجي للتأكد انه يطابق الجودة ال T-CMMIال
T-CMMI .تساعد عمالء المنتج البرمجي بالتأكد انه يطابق جودتهم المرغوبة قبل القيام بشراء المنتج البرمجي

19
Chapter 1
Introduction
Software quality has gained a lot of attention from academia and industry due to its important role
in modern-day business success [2]. The quality of software is critical and especially important in
real-time systems that may lead to loss of human life if a failure occurs in the system. A lot of
research in software engineering is done to assess the quality of software [3-7].
Capability Maturity Model Integration (CMMI) is a process improvement framework that was
defined by the Software Engineering Institute (SEI) of Carnegie Mellon University (CMU). SEI
philosophy in their concentration on the process is that the produced product quality is highly
affected by the quality of the process that is used to develop the software product [7]. In other
words, CMMI focus is to improve the development process in an organization based on the
following premise “the quality of a system or product is highly influenced by the quality of the
process used to develop and maintain it” [7, 8]. However, previous research has been convincing
that dealing with “process quality” is not sufficient to ensure the product quality, hence the
assessment of “software product quality” is also needed [9]. Moreover CMMI requires processes
used by software development organizations such as project planning, resolving issues in the
project, and other measures that are used in the project to be documented [7]. The documents are
required to assess the maturity level of the organization’s processes or to describe the
organization’s overall performance [7]. This leads to the proposal of a framework that enables the

20
assessment of the final software product (code) without depending on the development process of
the software. The proposed framework can evaluate the software product quality without requiring
a documented process or a software development methodology thereby making the assessment of
the software product much easier. The objective of this thesis is to “propose a product quality
maturity model for product evaluation”. The proposed framework is called Technical-
Capability Maturity Model Integration (T-CMMI). The new framework measures the quality of
the product from two perspectives, the developers perspective (internal quality attributes) and users
perspective (external quality attributes). T-CMMI will help software organizations and developers
to assess and improve the quality of their software products. It will also help customers to assess
the software product before purchasing it or to compare between the quality of different software
products in order to find which one meets their needs without depending on the development
process.
The major contributions to the proposed work in this thesis are as follows:
1. Propose T-CMMI framework to assess the quality of the final software product without
depending on the development process or methodology that is used. T-CMMI is
compromised from reference mode and assessment method.
2. Development of the PMMI model (T-CMMI reference model) that describes the common
basis for the assessors to assess the software product. It describes the maturity levels of
software product that it can achieve.
3. Development of PMAM (T-CMMI assessment method) assessment method which
contains guidelines and checklists to illustrate how the assessors follow the guidelines in
order to measure the capability level and product maturity level for both of PMMI’s focus-
areas.

21
The rest of this thesis is organized as follows. Chapter 2 presents the related work in the literature.
Chapter 3 describes the T-CMMI (Technical-Capability Maturity Model Integration) and PMMI
that will be presented in chapter 4. Chapter 5 outlines the assessment method of the PMMI. Chapter
6 presents an example of using PMAM. Chapter 7 concludes the work and presents the future
work.

22
Chapter 2
Literature Review
In this section, a large set of related study will be presented.
Software Quality
The term quality is non-specific and there is no general consensus on a definition of the word
quality. Gillies [10] defines quality as how successfully a product can satisfy people who use it
and how successfully it enables them to realize the benefits of using it. Pressman [11] stated that
quality is “conformance to explicitly stated functional and performance requirements, explicitly
documented development standards, and implicit characteristics that are expected of all
professionally developed software.”
ISO defines quality as “the totality of characteristics of an entity that bear on its ability to satisfy
stated and implied needs” [12]. On the hand IEEE defines quality as “the degree to which a system,
component, or process meets specified requirements and customer (user) needs
(expectations)”[13].
Hence, there are many definitions of quality in terms of both technical and non-technical properties
from the user perspective like availability, usability, and maintainability, i.e. are the user
requirements and needs satisfied? Generally, quality can be assessed from two main points of view:
the first is technical and the other is user-oriented. Process and product assessments focus on
technical aspects. These days rigor has increased in the development process to produce a reusable,

23
maintainable and robust final product this being the software engineers’ view. On the other hand
a user oriented perspective concentrates on user satisfaction with the product.
Garvin [14] provided a more complex definition of quality. Garvin defines quality from five
perspectives in different domains and categorizes them in two groups as shown in Table 2.1. The
manufacturing-based view is the approach that is most popular with software engineers and lies
under waterfall development methodology [10]. The two approaches of the people-oriented
category are more common than other approaches.
TABLE 2.1 MAJOR VIEWS OF QUALITY
Technical views
Transcendent approach: there is no specific definition for quality. In
other words, the term quality can be gained thorough experience not
through specific definition.
Product-based approach defines quality as a quantitative variable that
can be measured through a certain set of attributes that are possessed by
the product.
Manufacturing-based approach: define quality as how the final product
is conformed to the requirements. This approach is concerned on the
engineering and manufacturing side.
People-oriented view
User-based approach defines the quality as how the product can satisfy
the needs of the consumers? This approach is the most approach that
has a subjective definition of the quality than other approaches.
Value-based approach: they define quality in terms of prices and cost
of the performance of the product that the customer can afford.
These days academia and industry pay much attention to software quality because they play
important roles in modern-day business, and to some extent modern-day living. In the last decade
software quality has improved significantly because new techniques and technologies have been
adopted to improve software product quality [15].
Software development companies are recognizing that managing the development process will
lead to the production of better quality software [15-18]. Software process improvement (SPI)

24
approach is widely used to address the effective management of the development process.
Research has shown that organizations using SPI in their software development process will lead
to production of high quality products, decrease development time and cost, and increase the
development productivity [16, 17, 19, 20]. The following studies describe the impact of using SPI
on software quality:
Staples and Niazi [16] performed a systematic literature review in order to investigate the
reasons organizations had for adopting CMM-based SPI approaches. The results showed
that 70% of the organizations had adopted CMM-based SPI approaches to improve the
quality of their products.
Yamamura [18] made a survey of an organization that had been assessed as SW-CMM
level 5 before and after applying the process improvement. The result showed that there is
a correlation between process improvement and satisfaction of employees. Employee
satisfaction increased by 26% and average satisfaction moved from neutral to very
satisfied.
Diaz and Sligo [21] showed that the defect rate decreased by half as the CMM level
increased, also defect injection in projects at level 2 was eight times higher than projects at
level 5.
J. Herbsleb and D. Goldenson [22] showed that increases in the maturity level led to greater
success in meeting schedule and budget goals, increased staff morale and customer
satisfaction. For example the ability to meet schedules and the budgets increased from 40%
for companies at CMMI level 1 to 80% and 78% for companies at CMMI level 3. Customer
satisfaction increased from 80% for companies at CMMI level 1 to 100% for companies at
CMMI level 3.

25
Software Quality Models
Nowadays software quality plays an important role in developing different types of software
applications. The quality of software is critical and important, especially in real-time systems that
may lead to loss of human life when a failure occurs in the system. There is no general consensus
on the definition of software quality. A model can be defined as an abstract view of the reality that
eliminates the details. There are different types of models such as the cost estimation model,
maturity model, quality model, etc. Quality models help software engineers, developers, project
managers, software customer, etc. in assessing the quality of the software product to decide
whether it meets their requirements or not. Also software organizations use quality models to
evaluate their final product to decide if the product is ready for deployment. Software metrics are
used to assess the desired related quality attributes in the quality models. Usually software quality
models are organized in multi-levels. The highest level contains the software quality attributes
(called quality characteristics or factors) like: maintainability, testability, etc. External quality
attributes comprise a set of internal quality attributes (called sub-characteristics) which depend on
them such as: coupling, cohesion, etc.
There are several quality models in the literature for different types of applications such as desktop,
mobile, components, web-services and web applications. The focus here will be on popular
software quality models.
2.2.1 McCall’s Quality Model
McCall et al. [23] defined the software product quality model to guide acquisition managers in
U.S. Air Force Electronic Systems Divisions and Rome Air Development Centers. McCall’s model
is one of the most well-known quality models in software engineering. It consists of a hierarchy
26
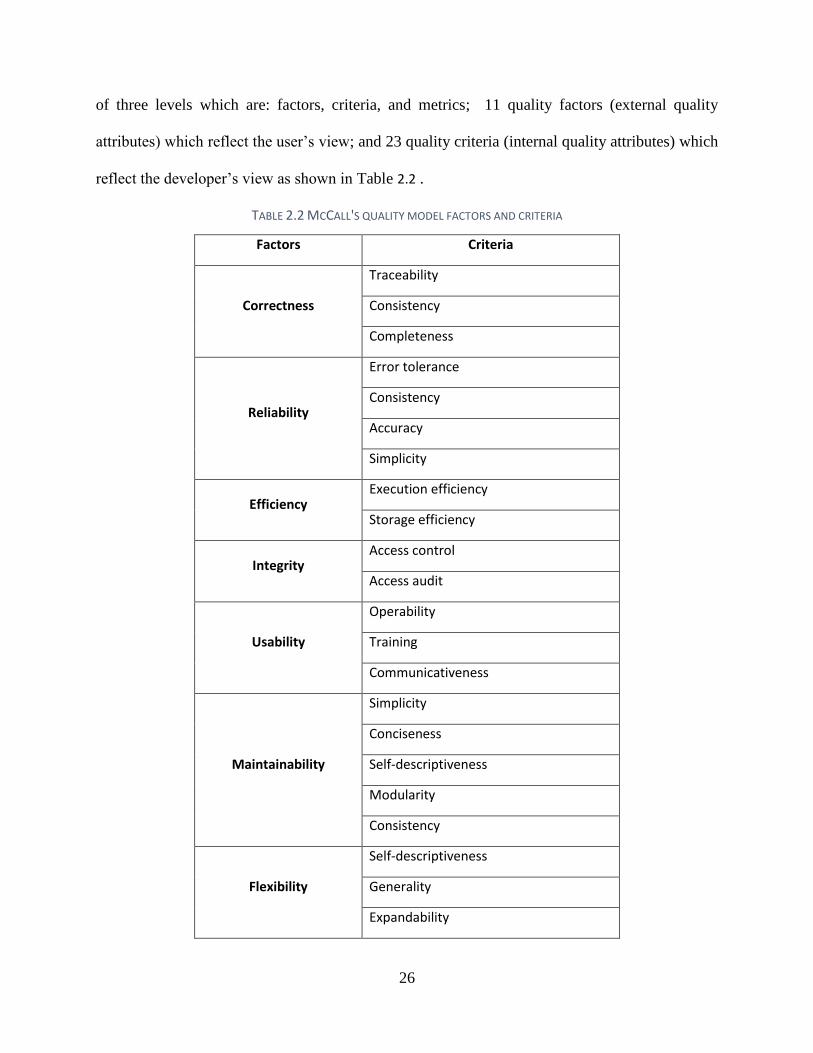
of three levels which are: factors, criteria, and metrics; 11 quality factors (external quality
attributes) which reflect the user’s view; and 23 quality criteria (internal quality attributes) which
reflect the developer’s view as shown in Table 2.2 .
TABLE 2.2 MCCALL'S QUALITY MODEL FACTORS AND CRITERIA
Factors Criteria
Correctness
Traceability
Consistency
Completeness
Reliability
Error tolerance
Consistency
Accuracy
Simplicity
Efficiency Execution efficiency
Storage efficiency
Integrity Access control
Access audit
Usability
Operability
Training
Communicativeness
Maintainability
Simplicity
Conciseness
Self-descriptiveness
Modularity
Consistency
Flexibility
Self-descriptiveness
Generality
Expandability

27
Modularity
Testability
Simplicity
Modularity
Instrumentation
Self-descriptiveness
Portability
Modularity
Self-descriptiveness
Machine independence
Software system independence
Reusability
Generality
Modularity
Software system independence
Machine independence
Self-descriptiveness
Interoperability
Modularity
Communications commonality
Data commonality
Each Factor in McCall’s quality model can be defined as follows:
1. Correctness: The extent that the program can fulfill the user requirements.
2. Reliability: The ability to perform the job preciously as required.
3. Efficiency: The amount of resources required to perform a task.
4. Integrity: The extent to which the program can protect itself from unauthorized activities.
5. Usability: The required effort from the user in order to use the program without difficulties.
6. Maintainability: The ease of finding and fixing bugs in the program.
7. Flexibility: The required effort needed to modify the program.
8. Testability: The ease of testing the program to make sure it meets the requirements.
28
9. Portability: The effort required to move the program from one environment to another.
10. Reusability: The ease of using the software in other applications.
11. Interoperability: The required effort to link two systems.
2.2.2 Bohem’s Quality Model
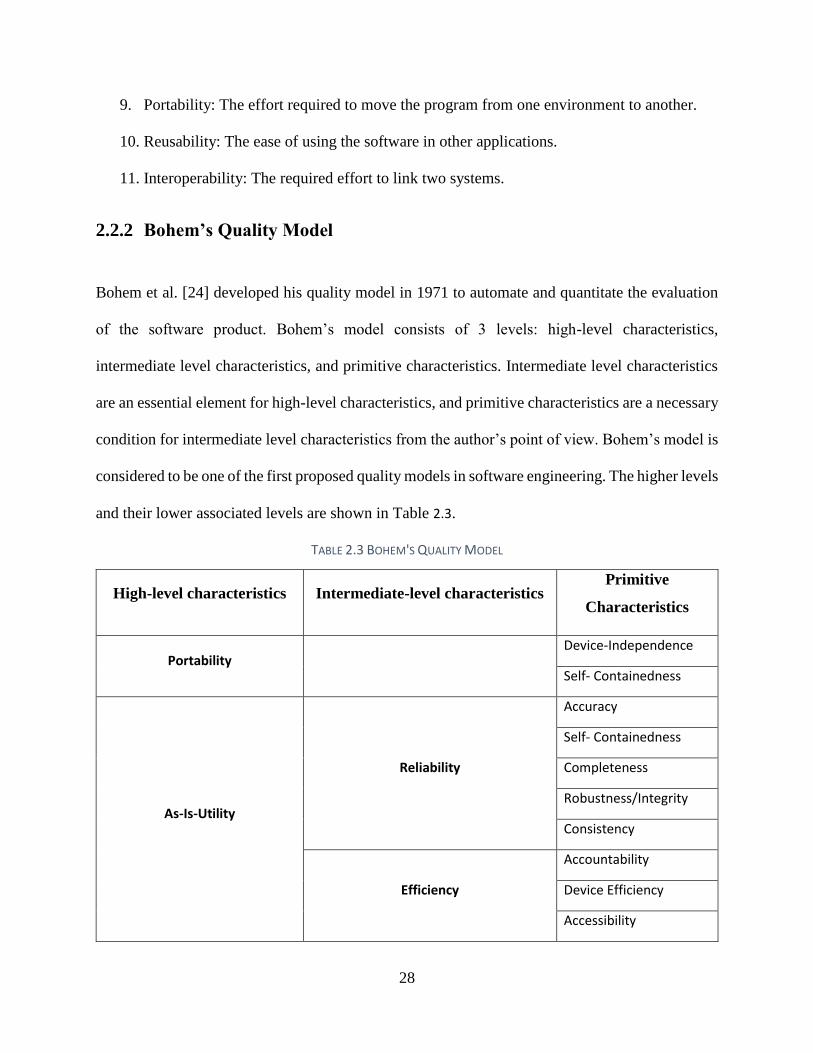
Bohem et al. [24] developed his quality model in 1971 to automate and quantitate the evaluation
of the software product. Bohem’s model consists of 3 levels: high-level characteristics,
intermediate level characteristics, and primitive characteristics. Intermediate level characteristics
are an essential element for high-level characteristics, and primitive characteristics are a necessary
condition for intermediate level characteristics from the author’s point of view. Bohem’s model is
considered to be one of the first proposed quality models in software engineering. The higher levels
and their lower associated levels are shown in Table 2.3.
TABLE 2.3 BOHEM'S QUALITY MODEL
High-level characteristics Intermediate-level characteristics Primitive
Characteristics
Portability Device-Independence
Self- Containedness
As-Is-Utility
Reliability
Accuracy
Self- Containedness
Completeness
Robustness/Integrity
Consistency
Efficiency
Accountability
Device Efficiency
Accessibility

29
Human Engineering
Robustness/Integrity
Accessibility
Communicativeness
Maintainability
Testability
Accountability
Accessibility
Communicativeness
Self-Descriptiveness
Structuredness
Understandability
Consistency
Self-Descriptiveness
Structuredness
Conciseness
Legibility
Modifiability Structuredness
Augmentability
The quality attributes in the intermediate-level characteristics of Bohem’s quality model can be
defined as follows:
1. Reliability: The extent to which the program can perform its intended job accurately.
2. Efficiency: The extent to which the program can operate without wasting resources.
3. Human Engineering: The extent to which the program can be used easily by the user.
4. Testability: The extent to which the program meets the requirements.
5. Understandability: The ease of reading the code and clearly comprehending its purpose.

30
2.2.3 Dromey’s Quality Model
Dromey [25] developed a software product quality model. Dromey’s model recognizes that the
quality evaluation of each product is different. Dromey linked the product properties with the
quality attributes in standard ISO-9126. As shown in Figure 2.1, there are four categories of
product properties and seven quality attributes.
FIGURE 2.1 THE DROMEY'S QUALITY MODEL
2.2.4 ISO 9126 Quality Model
The International Organization for Standardization and International Electrotechnical Commission
[26] published the first version of ISO/IEC 9126 standard in 1991 which is an international
standard for evaluation of software product quality. After that, ISO and IEC expanded ISO/IEC
9126 into the following parts:
1. ISO/IEC IS 9126-1: quality model
2. ISO/IEC TR 9126-2: external metrics
3. ISO/IEC TR 9126-3: internal metrics

31
4. ISO/IEC TR 9126-4: quality in use metrics
This quality model contains 6 characteristics which are divided into 27 sub-characteristics for
internal and external quality attributes and 4 quality-In-Use characteristics as shown in Figure 2.2
and Figure 2.3 respectively.
FIGURE 2.2 ISO 9126 QUALITY MODEL FOR EXTERNAL AND INTERNAL QUALITY [26]
FIGURE 2.3 ISO 9126 QUALITY MODEL FOR QUALITY IN USE [26]
We can measure the characteristic by using the metrics of the sub-characteristics and using an
appropriate aggregation method to combine the values of the measurements into a single value.
The developer, evaluator, or the quality manager can modify the metrics or add metrics which are
not listed in the quality models.
The external/internal quality attributes can be defined as the following:
1. Functionality: The extent to which the software functionality meets the requirements under
the specified conditions.
2. Reliability: The ability of the software to operate under the specified conditions.
3. Usability: The ease of learning and using the system.

32
4. Efficiency: The extent to which the software can operate with performance that is relative
to the resources that are used.
5. Maintainability: The ease of modifying the software, fixing bugs, and adding additional
features.
6. Portability: The ability of the software to be moved from one environment to another.
The quality-in-use quality attributes can be defined as the following (definitions of the quality-in-
use attributes as quoted from [26]):
1. Effectiveness: “The capability of the software product to enable users to achieve specified
goals with accuracy and completeness in a specified context of use.”
2. Productivity: “The capability of the software product to enable users to expend appropriate
amounts of resources in relation to the effectiveness achieved in a specified context of use.”
3. Safety: “The capability of the software product to achieve acceptable levels of risk of harm
to people, business, software, property or the environment in a specified context of use.”
4. Satisfaction: “The capability of the software product to satisfy users in a specified context
of use.”
2.2.5 Software Quality Observatory for Open Source Software Quality Model
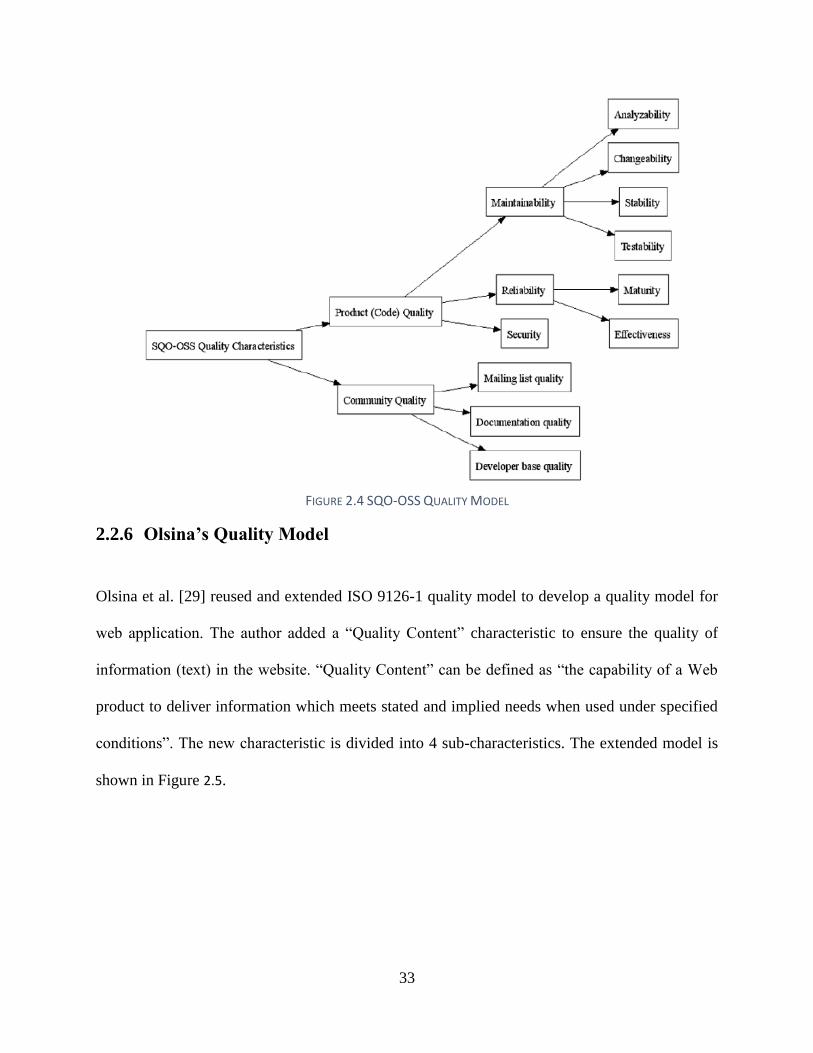
Samoladas et al. [27] defined a quality model to evaluate open source systems. The new quality
model called Software Quality Observatory for Open Source Software (SQO-OSS). The SQO-
OSS model is constructed using GQM approach [28] and ISO-9126 model [26]. The authors
provide metrics to measure the quality attributes of the model based on its definition on ISO-9126
[26]. SQO-OSS model is shown in Figure 2.4.
33
FIGURE 2.4 SQO-OSS QUALITY MODEL
2.2.6 Olsina’s Quality Model
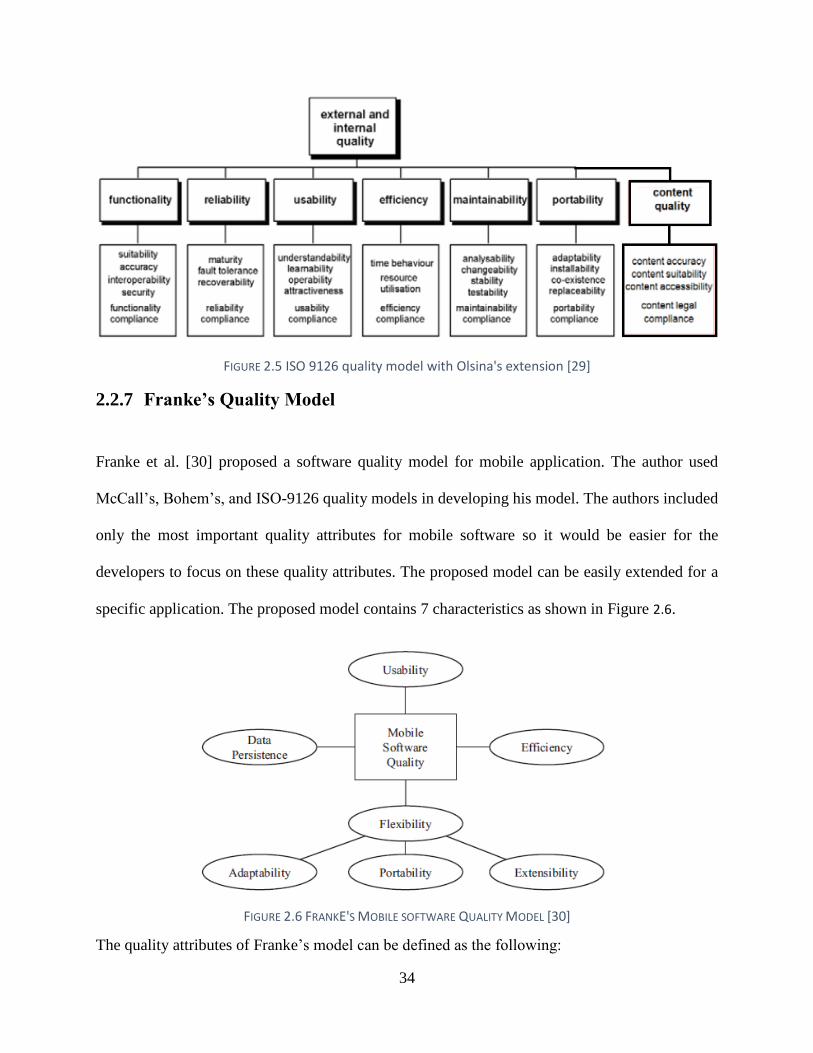
Olsina et al. [29] reused and extended ISO 9126-1 quality model to develop a quality model for
web application. The author added a “Quality Content” characteristic to ensure the quality of
information (text) in the website. “Quality Content” can be defined as “the capability of a Web
product to deliver information which meets stated and implied needs when used under specified
conditions”. The new characteristic is divided into 4 sub-characteristics. The extended model is
shown in Figure 2.5.
34
FIGURE 2.5 ISO 9126 quality model with Olsina's extension [29]
2.2.7 Franke’s Quality Model
Franke et al. [30] proposed a software quality model for mobile application. The author used
McCall’s, Bohem’s, and ISO-9126 quality models in developing his model. The authors included
only the most important quality attributes for mobile software so it would be easier for the
developers to focus on these quality attributes. The proposed model can be easily extended for a
specific application. The proposed model contains 7 characteristics as shown in Figure 2.6.
FIGURE 2.6 FRANKE'S MOBILE SOFTWARE QUALITY MODEL [30]
The quality attributes of Franke’s model can be defined as the following:

35
1. Flexibility: The effort required to modify the software so as to be able to work on it in
another environment.
2. Extensibility: The effort required to extend the software.
3. Adaptability: The extent to which the software can be adapted to changes.
4. Portability: The effort required to make the software runs on a different platform.
5. Usability: The ease of using the software for an end user.
6. Efficiency: The amount of resources used by the software to do the work.
7. Data Persistence: The capability of the software to save its state.
2.2.8 Zahra’s Quality Model
Zahra et al. [31] proposed a quality model for mobile application. The proposed model is derived
from ISO-9126 characteristics and sub-characteristics that can be applied to mobile applications.
Zahra’s quality model is a general model where the developers can tailor the model for a specific
application. The model contains 6 characteristics and 4 sub-characteristics as shown in Figure 2.7.
FIGURE 2.7 ZAHRA'S MOBILE SOFTWARE QUALITY MODEL [31]

36
The characteristics of Zahra’s model can be defined as follows:
1. Functionality: The extent to which the software meets the requirements and the
specification of the user.
2. Usability: The ease of using the software and having an interactive interface.
3. Efficiency: The amount of resources that the software uses as well as the time it takes to
do a specific task.
4. Maintainability: The effort required to add extra functionality to the software and the ability
of the software to adapt to environment changes.
5. Data Integrity: The ability of the software to save the information in case of crash or
pausing the software.
6. Portability: The extent to which the software can run on different platforms.
Software Process improvement
Efforts have been made for several decades to improve the quality of software. Software
organizations have long been concerned about the quality of their products[32-34]. Many software
organizations place customer satisfaction as their highest priority in order to compete with other
quality software [16, 35]. Software quality becomes more important as it is increasingly depended
upon to run our day-to-day lives [15-18]. Software process improvement is the approach that is
most commonly used [36] of several approaches that have been developed to address software
quality issues.
SPI offers a powerful way for software organizations to measure their capabilities to develop
systems and for them to discover their strong and weak points. Organizations, after identifying
their strengths and weaknesses, are able to start process improvement programs and to clearly

37
define achievable goals. SPI helps software organizations understand their development process.
These organizations can then identify areas that can be controlled in order to achieve a specific
product outcome [37].
Rico [38] defined the SPI as “the discipline of characterizing, defining, measuring, and improving
software management and engineering processes, leading to successful software engineering
management, higher product quality, greater product innovation, faster cycle times, and lower
development costs, simultaneously” . O'Regan [39] defined SPI as “A program of activities
designed to improve the performance and maturity of the organization's software processes and
the results of such a program”. Sommerville [15] stated that “SPI involves understanding existing
processes and changing these processes to improve product quality and/or reduce costs and
development time”. Process improvement does not mean to apply a specific method or tool that is
used by others, rather process improvement should be adopted as an activity peculiar to the
organization [15]. Rico and Sommerville focus on the SPI definition to increase the quality of
software while decreasing development time and cost.
Approaches to Software Process Improvement
There are many studies in software process improvement. We will present the most popular
software process improvement approaches in the literature which their focus on the quality of the
software.
2.4.1 CMMI
Capability Maturity Model of Integration (CMMI) [8] is a process improvement framework that
was defined by the Software Engineering Institute (SEI) of a Carnegie Mellon University (CMU).

38
CMMI improves the processes performance through providing a set of practices to organizations.
CMMI process improvement identifies the strengths and weaknesses in an organization’s
processes, then it converts weaknesses into strengths by bringing about process changes [40].
CMMI has been adopted by over 5000 organizations all over the world [41]. CMMI has a set of
best practices that help to improve quality, efficiency, and effectiveness in organizations. The
complete list of practices and process area can be found in [40] and [42] respectively.
CMMI defines three constellations that can be defined as a collection of best practices and process
improvement goals that are used to build models, appraise related documents, and develop training
material for an organization’s interest area. These goals and practices are grouped into different
process areas. The constellations are:
1. CMMI for Development (CMMI-DEV): model is used in process improvement and
developing the quality of the services and products in the organizations
2. CMMI for Acquisition (CMMI-ACQ): process model that provides guidance to the
organizations for managing the acquisition of services and products that meet customer
needs
3. CMMI for Services (CMMI-SVC): model that guides organizations in initiating,
managing and deploying the services that meet the customers and end-users requirements
CMMI for development (CMMI-Dev) v 1.3 [7] is the latest model from the Software Engineering
Institute (SEI) that was released in 2010. CMMI is an integration of three source models -
Capability Maturity Model for Software (SW-CMM), Electronic Industries Alliance standard 731
(EIA 2002a), and Integrated Product Development Capability Maturity Model (IPD-CMM) - that
were selected based on their successful adoption in processes improvement in organizations.
CMMI was created to overcome the use of multiple CMMs. The CMMI framework can suit

39
multiple disciplines: software engineering, systems engineering, hardware engineering and
Integrated Process and Product Development [43]. It also gives flexibility by supporting two
different representations (staged and continuous representations).
CMMI was built using information from well-known models, software development practices of
organizations which have a high CMM maturity level and have practiced these models for a long
time, and the knowledge of the best systems. Figure 2.8 shows the models that were used over
time that led to CMMI v 1.3.
Figure 2.8 History of CMMI [7]

40
The main objective of the CMMI is to measure the degree to which processes are well-defined and
managed in organizations, in other words it measures an organization’s capability. CMMI
describes an evolutionary path to develop and improve the organizations’ processes from immature
and chaotic processes to mature and optimized processes. The CMMI consists of five maturity
levels. These levels are: Initial, Managed, Defined, Quantitatively Managed, and Optimizing
(shown in Figure 2.9). Maturity level 1 represents the lowest state and the starting point in the
staged representation whereas maturity level 5 represents the highest state of maturity that the
organization can achieve in the staged representation.
CMMI-Dev contains several process areas (PAs). There are twenty-two PAs in CMMI-Dev that
are split as the following: sixteen core PAs that are common to all CMMI models, one shared PA
that is shared between at least two CMMI models, and five specific PAs. Each maturity level
contains several PAs that should be satisfied to achieve that maturity level, and for each PA there
are different goals (both generic and specific) that are described and must be presented to satisfy
the PA. For each goal several practices are identified and described in order to help organizations
understand how to achieve the goals and the expected results of adopting these practices. For a
particular maturity level to be achieved by an organization, all the goals that are associated with
the PAs for that level and the lower levels must be satisfied. Applying the practices of higher level
maturity without completing all the practices in the lower levels will put at risk their success
because the basis of the higher level maturity practices will be incomplete (lower level maturity
practices not having been put into practice first) [7].

41
Figure 2.9 CMMI Maturity Levels
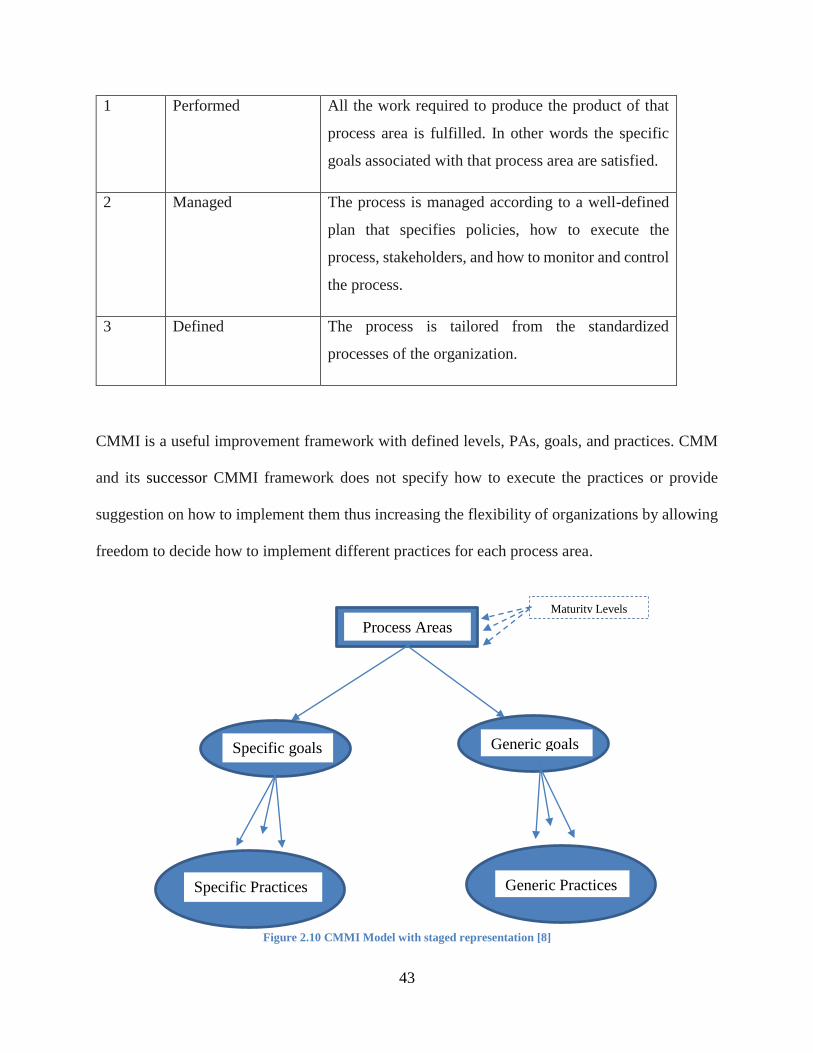
There are two representations in CMMI: staged and continuous. In the staged representation, the
maturity levels offer an ordered and recommended way of improving the organization processes
in stages as shown in Figure 2.10. There are PAs within each maturity level and within each PA
there are generic and specific goals which contain generic and specific practices. All of these goals
and practices in a particular level and lower levels should be maintained to achieve a particular
level. There are five maturity levels in the staged representation with the description of each level
shown in Table 2.4.
Table 2.4 Maturity Levels of CMMI in Staged Representation
Level Maturity Level Description
Level 2: Managed
Level 3: Defined
Level 1: Initial
Level 4:
Quantitatively
Managed
Level 5: Optimizing

42
1 Initial The processes are chaotic, there is no defined plan. Success mainly
depends on employee experience.
2 Managed The processes are managed, monitored, and controlled according to
a defined plan and involve experienced people and stakeholders to
produce the desired output.
3 Defined The processes are well-defined in standards, methods, and tools.
These standards are used to maintain consistency across all projects
by tailoring standards.
4 Quantitatively
Managed
The methods used to quantify the quality and performance of
processes to manage projects in order to satisfy end-users have been
established.
5 Optimizing The processes have been continuously improved based on
quantitative objectives.
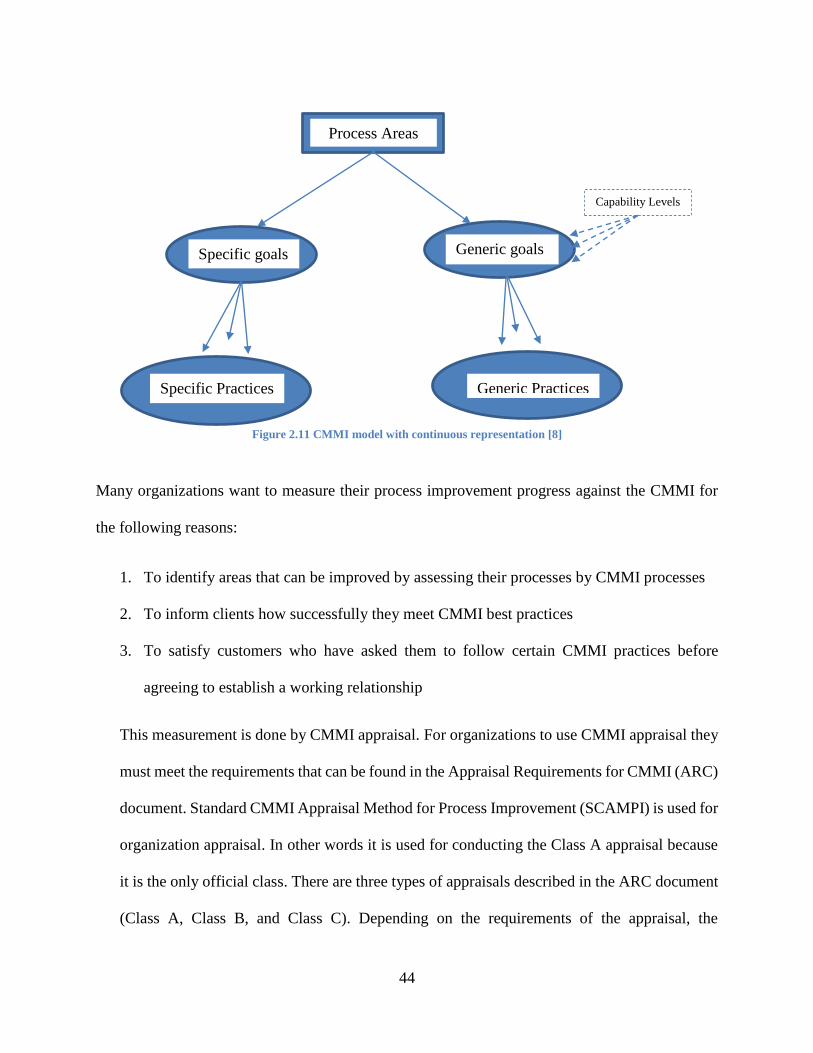
In continuous representation, shown in Figure 2.11, specific goals organize specific practices and
generic goals organize generic practices and each practice is associated with a capability level.
Continuous representation is used by software organizations that are interested in improving a
specific process area in the company. There are four capability levels in continuous representation
as shown in Table 2.5 with the description of each level.
Table 2.5 Capability Levels of CMMI in Continuous Representation.
Level Capability Level Description
0 Incomplete The process is not performed or not fully performed
(chaotic process).
43
1 Performed All the work required to produce the product of that
process area is fulfilled. In other words the specific
goals associated with that process area are satisfied.
2 Managed The process is managed according to a well-defined
plan that specifies policies, how to execute the
process, stakeholders, and how to monitor and control
the process.
3 Defined The process is tailored from the standardized
processes of the organization.
CMMI is a useful improvement framework with defined levels, PAs, goals, and practices. CMM
and its successor CMMI framework does not specify how to execute the practices or provide
suggestion on how to implement them thus increasing the flexibility of organizations by allowing
freedom to decide how to implement different practices for each process area.
Figure 2.10 CMMI Model with staged representation [8]
Process Areas
Specific goals Generic goals
Specific Practices Generic Practices
Maturity Levels
44
Figure 2.11 CMMI model with continuous representation [8]
Many organizations want to measure their process improvement progress against the CMMI for
the following reasons:
1. To identify areas that can be improved by assessing their processes by CMMI processes
2. To inform clients how successfully they meet CMMI best practices
3. To satisfy customers who have asked them to follow certain CMMI practices before
agreeing to establish a working relationship
This measurement is done by CMMI appraisal. For organizations to use CMMI appraisal they
must meet the requirements that can be found in the Appraisal Requirements for CMMI (ARC)
document. Standard CMMI Appraisal Method for Process Improvement (SCAMPI) is used for
organization appraisal. In other words it is used for conducting the Class A appraisal because
it is the only official class. There are three types of appraisals described in the ARC document
(Class A, Class B, and Class C). Depending on the requirements of the appraisal, the
Process Areas
Specific goals Generic goals
Specific Practices Generic Practices
Capability Levels

45
organization can decide which class is suitable. The appraisal classes with the definition of
each class are shown as follows:
1. Class A: Used by the organization after implementing a significant process improvement.
It is the only appraisal that utilizes an official method and provides the maturity level in
the staged representation or the capability level in the continuous representation. This
method is conducted by certified people from the Software Engineer Institute.
2. Class B: This appraisal requires less time and money when compared with the Class A. It
is conducted to find the maturity level (unofficial) of the organization where it can be
located.
3. Class C: This appraisal is the most flexible, takes less time, and is cheaper than Class A or
Class B. It is done by people who are well-trained on CMMI and the organization
processes. This method is conducted in order to address the needs that are output from gap
analysis.
2.4.2 SPICE (ISO/IEC 15504)
SPICE is a set International Standard for Software Process Assessment [44]. SPICE provides a
reference model that encourages self-assessment of software processes. The reference model
describes software engineering processes that include best practices and activities. The purpose of
this model is to provide a common basis of different software process assessment models, in such
a way that it can help report the results of assessment in a common context even if different process
assessment models are used, this will help in comparing between different software process
assessment results. The architecture of the reference model has two dimensions: a process
dimension and a process capability dimension. It also has nine parts:

46
Part 1: Concepts and introductory guide
Part 2: A reference model for processes and process capability
Part 3: Performing an assessment
Part 4: Guide to performing assessments
Part 5: An assessment model and indicator guidance
Part 6: Guide to competency of assessors
Part 7: Guide for use in process improvement
Part 8: Guide for use in determining supplier process capability
Part 9: Vocabulary
The process dimension describes what has to be achieved in order to reach the defined process’s
purpose using measurements. The process capability dimension is characterized by process
attributes which are grouped into six capability levels which have been assigned an ordinal scale.
Each higher capability level represents an improvement to the management, performance, and
control of the process. Table 2.6 shows the capability levels and the associated process attributes
that can be measured as a percentage scale:
TABLE 2.6 SPICE CAPABILITY LEVELS AND PROCESS ATTRIBUTES
Capability Level Capability Level Name Process Attributes
Level 0 Incomplete process -
Level 1 Performed process Process performance attribute
Level 2 Managed process Performance management attribute
Work product management attribute
Level 3 Established process Process definition attribute
Process resource attribute
Level 4 Predictable process Measurement attribute

47
Process control attribute
Level 5 Optimizing process Process change attribute
Continuous improvement attribute
In order to achieve a specific capability level all the lower capability levels should be completed
and all the process attributes of the desired level should be achieved to a certain rate specified by
the model for each attribute in the desired level. The process assessment is done by a qualified
assessor or by using certain tools for data collection which have been approved by an assessor.
SPICE harmonizes the existing approaches to process improvement but it does not specify how to
achieve the process improvements or specify a way of achieving them. It leaves the determination
of the method of specific improvement to the organization.
2.4.3 ISO 9000
ISO 9000 is a family of quality system standards [45]. The ISO 9000 contains a family of standards
that are concerned with creating a common standard for quality management systems. ISO 9000
standards provide tools and methods to ensure that the product created by the organization
regardless of its size or the complexity of the product meets the requirements defined by the
customer.
ISO 9001: Quality systems – Is a standard in the ISO 9000 series of standards that can be applied
to software development and maintenance. Model for quality assurance in design/development,
production, installation and servicing [46] ISO 9001 is a model used to ensure that suppliers
confirm the specified requirements during design, development, production, installation and
servicing. This model aims to achieve customer satisfaction during all stages from design to

48
servicing, and it encourages organizations to inspect their internal quality management. In 1991
the International Standards Organization published ISO 9000-3, “Quality management and quality
assurance standards -- Part 3: Guidelines for the application of ISO 9001:1994 to the development,
supply, installation and maintenance of computer software” [47].
ISO 9001:2000 has replaced 20 points from the previous version ISO 9001:1994 standard [48].
ISO 9001:1994 and ISO 9003:1994 quality standards are obsolete.
2.4.4 TRILLIUM
Bell Northen Research and Northen Telecom developed the first version of TRILLIUM in 1991
which is an assessment model designed from the customer perspective [6]. TRILLIUM is designed
for embedded telecommunication systems and includes: hardware, software, documentation, and
training and support services. This model is based on the SEI’s CMM that it considers the product
development and support processes as a part from the organization’s processes. TRILLIUM has
eight capability areas, and each capability area compromises a roadmap. Each roadmap contains a
set of practices that were derived from benchmark exercises.
2.4.5 BOOTSTRAP
BOOTSTRAP is a methodology for process assessment and improvement of software developed
by European industry and the ESPRIT project in 1992 [49]. This methodology compatible with
ISO/IEC 15504 contains three main phases which are: preparation, execution, and improvement
planning phases. BOOTSTRAP contains five capability levels to assess an organization’s
processes capability for achieving their defined goals.
49
Maturity Models
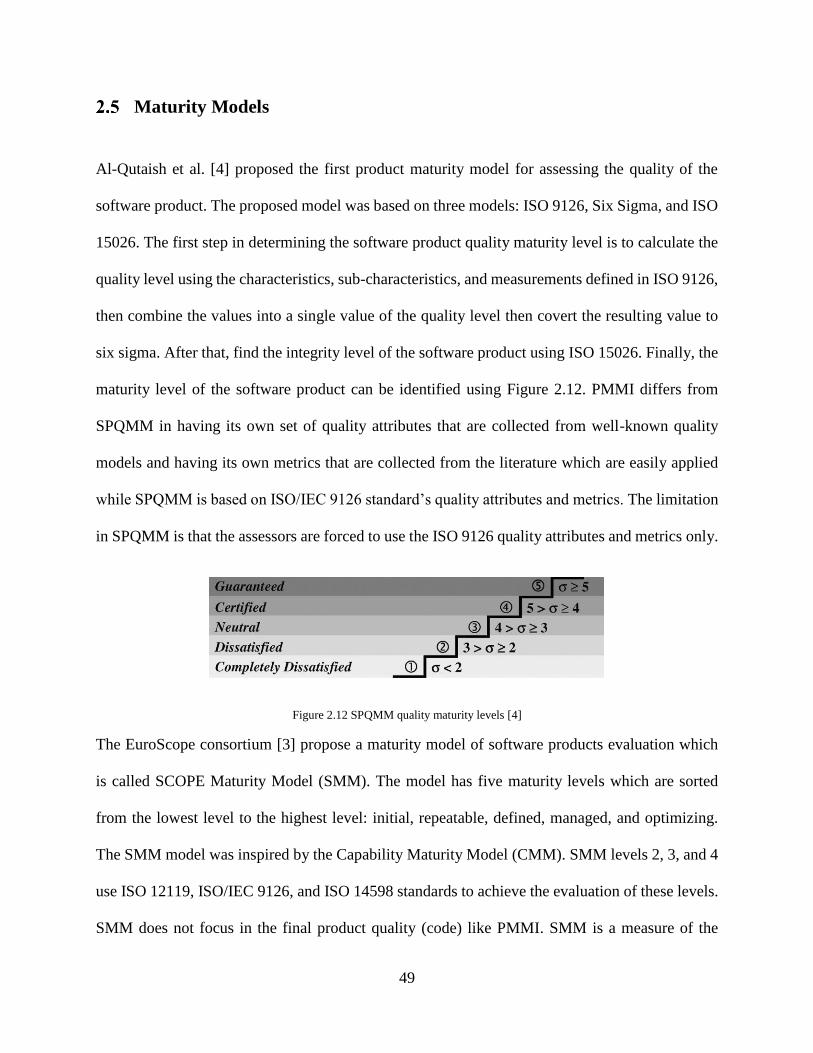
Al-Qutaish et al. [4] proposed the first product maturity model for assessing the quality of the
software product. The proposed model was based on three models: ISO 9126, Six Sigma, and ISO
15026. The first step in determining the software product quality maturity level is to calculate the
quality level using the characteristics, sub-characteristics, and measurements defined in ISO 9126,
then combine the values into a single value of the quality level then covert the resulting value to
six sigma. After that, find the integrity level of the software product using ISO 15026. Finally, the
maturity level of the software product can be identified using Figure 2.12. PMMI differs from
SPQMM in having its own set of quality attributes that are collected from well-known quality
models and having its own metrics that are collected from the literature which are easily applied
while SPQMM is based on ISO/IEC 9126 standard’s quality attributes and metrics. The limitation
in SPQMM is that the assessors are forced to use the ISO 9126 quality attributes and metrics only.
Figure 2.12 SPQMM quality maturity levels [4]
The EuroScope consortium [3] propose a maturity model of software products evaluation which
is called SCOPE Maturity Model (SMM). The model has five maturity levels which are sorted
from the lowest level to the highest level: initial, repeatable, defined, managed, and optimizing.
The SMM model was inspired by the Capability Maturity Model (CMM). SMM levels 2, 3, and 4
use ISO 12119, ISO/IEC 9126, and ISO 14598 standards to achieve the evaluation of these levels.
SMM does not focus in the final product quality (code) like PMMI. SMM is a measure of the

50
quality in terms of matching stated specifications or requirements, and tests are executed to assess
the degree to which a product meets the required specifications. SMM requires the process to be
documented to ensure a product matches the specifications.
April et al. [50] proposed the Software Maintenance Maturity Model (SMmm) that is a
complement to the CMMI model. SMmm addresses the unique activities that are not addressed in
CMMI or other models. There are five maturity levels shown in TABLE 2.7. The steps of building
this model is the same steps of building Trillium. SMmm focus only on maintainability but PMMI
focus on different product quality attributes including maintainability. Also SMmm does not
measure the product maturity level.
TABLE 2.7 SMMM MATURITY LEVELS [50]
Alvaro et al. [51] proposed a Software Component Maturity Model (SCMM). The model is based
on ISO/IEC9126 and ISO/IEC 14598 standards. SCMM contains five levels, the lowest level is
SCMM-I and the highest is SCMM-V. SCMM depends mainly on the CQM (component quality
model) model which has seven characteristics where each characteristic compromises a set of life-
cycle and run time characteristics as show in Table 2.8. Each sub-characteristic has a set of
attributes that represent the entity and a metric to measure these attributes as shown in Table 2.9.
SCMM measures only the maturity of the components and it cannot assess different types of
product such as enterprise applications, web-services …etc.

51
Table 2.8 A SOFTWARE COMPONENT QUALITY MODEL, WITH THE SUB-CHARACTERISTICS [51]
Characteristics Sub-Characteristics
(Runtime)
Sub-
Characteristics
(Life cycle)
Functionality Accuracy
Security
Suitability
Interoperability
Compliance
Self-contained
Reliability Fault Tolerance
Recoverability
Maturity
Usability Configurability Understandability
Learnability
Operability
Efficiency Time Behavior
Resource Behavior
Scalability
Maintainability Stability Changeability
Testability
Portability Deployability Replaceability
Adaptability
Reusability
Marketability Development time
Cost
Time to market
Targeted market
Affordability
Table 2.9 Sample Of Component Quality Attributes For Runtime Sub- Characteristics[51]
Sub-
Characteristics
(Runtime)
Attributes Metrics Kind of
Metrics
Accuracy
1. Correctness Test results/
precision R
Security 2. Data
Encryption
Mechanism
implemented P
3. Controllability N. of interfaces /
kind of
controllability
R

52
4. Auditability Mechanism
implemented P
Recoverability 5. Error Handling Mechanism
implemented P
Fault Tolerance
6. Mechanism
available
Mechanism
identification P
7. Mechanism
efficiency
Ammount of errors
tolerate / total
errors found
R
Configurability 8. Effort for
configure
Time spend to
configure correctly IV
Golden et al. [52] proposed the Open Source Maturity Model (OSMM). OSMM which helps IT
organizations assess and make comparisons between open source software products to identify
which one is the best for a defined application. This assessment method requires three phases:
1. Assess element’s maturity (define requirements, locate resources, assess element maturity,
and assign element score).
2. Assign for each element weighting factors.
3. Calculate overall product maturity score.
Unfortunately, OSMM evaluates the maturity of open source products only without assessing
the quality of these software products. OSMM is not primarily used to assess software product
quality attributes or product maturity but to help organizations perform a comparison between
open source systems.

53
Certification models
Certifying software will increase confidence in software that passes certification. It will also make
it easier to sell or purchase because there will be a reduced need for testing prior to purchase.
Software certification can be granted for different types of software such as final software products
[53, 54] and components [5]. Certification can be provided by independent agencies which
function like other quality agencies such as: Software Engineering Institute which appraises
CMMI Class A or ISO which grants ISO certification. Involving external agencies in providing
the certificate will increase trust in the certification as Voas [55] says that “completely independent
product certification offers the only approach that consumers can trust”. Most of the certification
methods are process-based [56], from the process they can determine the quality of the final
product. However, certifying the software development process only does not guarantee the quality
of the final product [9].
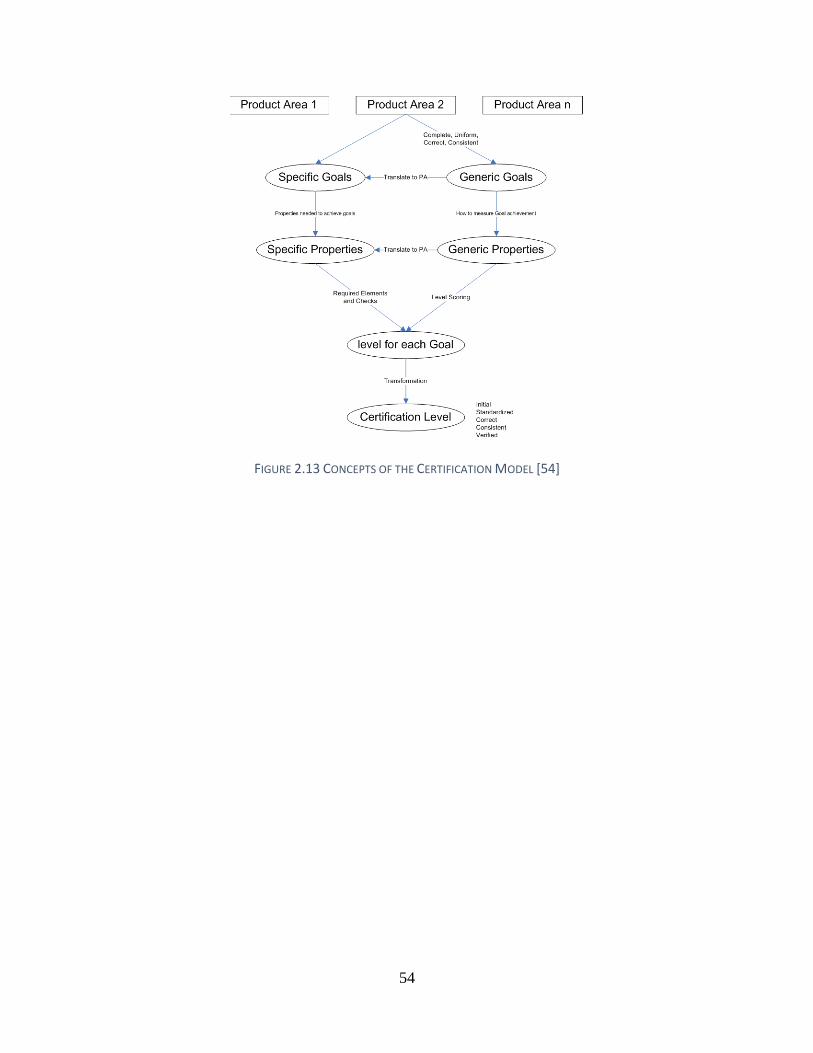
Heck et al. [54] used the concept shown in Figure 2.13 to propose a Software Product Certification
Model for Dependable Systems. The proposed model consists of five certification levels and six
product areas represented in Figure 2.14 with their interrelation. Each product area is comprised
of a set of elements and should achieve four generic goals (complete, uniform, correct, and
consistent) as shown in Table 2.10. The generic goals contain a set of specific goals and properties
that must be achieved to satisfy a certain level. Heck’s model depends on the development process
in its evaluation.
54
FIGURE 2.13 CONCEPTS OF THE CERTIFICATION MODEL [54]

55
Figure 2.14 Software product area with their elements [54]
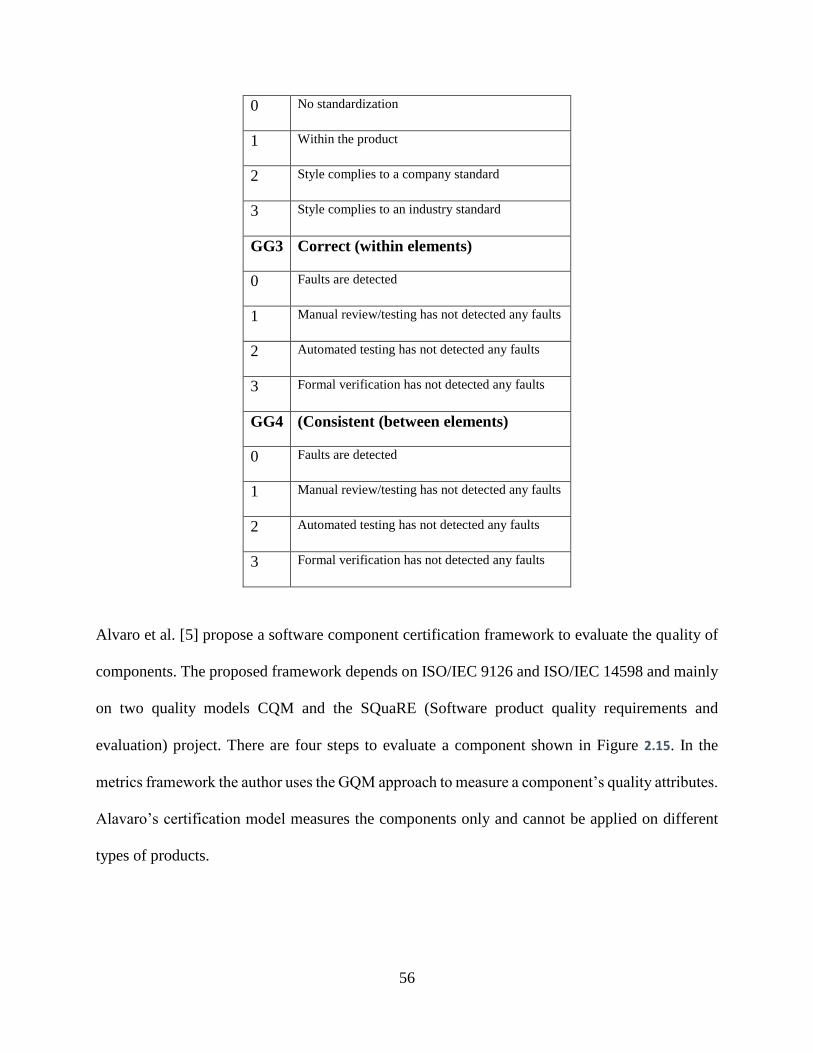
Table 2.10 GENERIC GOALS AND GENERIC PROPERTIES OF THE ACHIEVEMENT LEVEL [54]
GG1 Complete
0 Some required elements are missing
1 All required elements are present
2 Semi-formal elements have been added
3 Formal elements have been added
GG2 Uniform
Context
Stakeholders
Business Processes /
Environment
User Requirements
Use Cases or
Funct. Req.
Behavioral
Properties
Non-Functional
Requirements Objects
High-Level Design
System
RequiremenUser
Interface
Component
Model
Object
Model
Implementation
System Documentation
Installation/
User Manual
Detailed Design
Component
Specificatio
Interface
Specification
Algorithms &
Data
HW/SW
Environme
Unit &
Integration Test
System Test
Acceptance
Test
56
0 No standardization
1 Within the product
2 Style complies to a company standard
3 Style complies to an industry standard
GG3 Correct (within elements)
0 Faults are detected
1 Manual review/testing has not detected any faults
2 Automated testing has not detected any faults
3 Formal verification has not detected any faults
GG4 (Consistent (between elements)
0 Faults are detected
1 Manual review/testing has not detected any faults
2 Automated testing has not detected any faults
3 Formal verification has not detected any faults
Alvaro et al. [5] propose a software component certification framework to evaluate the quality of
components. The proposed framework depends on ISO/IEC 9126 and ISO/IEC 14598 and mainly
on two quality models CQM and the SQuaRE (Software product quality requirements and
evaluation) project. There are four steps to evaluate a component shown in Figure 2.15. In the
metrics framework the author uses the GQM approach to measure a component’s quality attributes.
Alavaro’s certification model measures the components only and cannot be applied on different
types of products.

57
FIGURE 2.15 SOFTWARE COMPONENT CERTIFICATION PROCESS [5]
Heck et al. [53] proposed a software product certification model which is called LaQuSo
(Laboratory for Quality Software) Software Product Certification Model (LSPCM) that is based
on CMMI. The proposed model has five certification levels that represent the maturity of the
software products. LSPCM consist of six product areas which are the main deliverables of the
development phase and each area is split into smaller parts which are called elements. The
proposed model contains three certification criteria: completeness, uniformity, and conformance;
and each of the certification criteria contain 4 levels as shown in Table 2.11. The model contains
specific criteria that help achieve specific levels of certification criteria. The certification level of
the final product can be computed through calculation of the certification criteria of each product
area, then taking the minimum of these calculations. LSPCM’s certification levels are shown in
TABLE 2.12.
Heck's model evaluates the software quality based on specific criteria which do not represent all
the software quality attributes; also it depends on the development process in its evaluation.

58
TABLE 2.11 CERTIFICATION CRITERIA ACHEIVEMENT LEVEL [53]
TABLE 2.12 LSPCM'S CERTIFICATION LEVELS [53]
Correia et. al [57] proposed a technical quality certification for software products that is based
mainly on ISO-9126. The authors focus on technical quality instead of functional requirements
due to limitations in this approach. The focus of the study was on “Maintainability” but it can be

59
applied for other quality attributes such as reliability. The certification is based on the relationship
between the system properties and the ISO-9126 standard which can be shown in Figure 2.16. The
raw value of the system properties are collected using metrics. After that these attributes are
mapped to the sub-characteristics of maintainability as shown in
Figure 2.17. In order to find a single value of maintainability, all the calculated values of sub-
characteristics’ that are found from the metrics are aggregated in one value that represents the
characteristic which is maintainability.
FIGURE 2.16 relationship system properties and sub-characteristics [57]
Properties
Dupli
cati
on
Tes
t qual
ity
Unit
com
ple
xit
y
Unit
siz
e
Volu
me
ISO
91
26
mai
nta
inab
ilit
y
Analyzability
Changeability
Stability
Testability

60
Figure 2.17 Mapping system properties and maintainability sub-characteristics [57]
Baggen et. al [58] proposed a maintainability certificate for software products. The approach uses
the maintainability definition in ISO 9126 [59] standard. The Software Improvement Group (SIG)
group identifies 6 system properties which are:
1. Volume: The size of the software.
2. Redundancy: The same code can be found in different places.
3. Unit size: The units should be small and responsible for a low number of functions, in other
words the unit must be cohesive.
4. Complexity: The simplicity of the code
5. Unit interface size: The number of parameters that is needed for a particular interface.
6. Coupling: The coupling between components
The above system properties are mapped with 4 sub-characteristics of the maintainability
characteristic based on the impact of each system property on the maintainability’s sub-
characteristics which is decided by other studies [60] and expert opinion as shown in Figure 2.18.
FIGURE 2.18 Mapping system properties and maintainability sub-characteristics of [61]
After measuring each system property using metrics, the values of each quality attribute will be
rated (each property has a separate rating table). After that the rated values will be aggregated to
find a single maintainability value of the software, and certificate will be issued from T¨UV
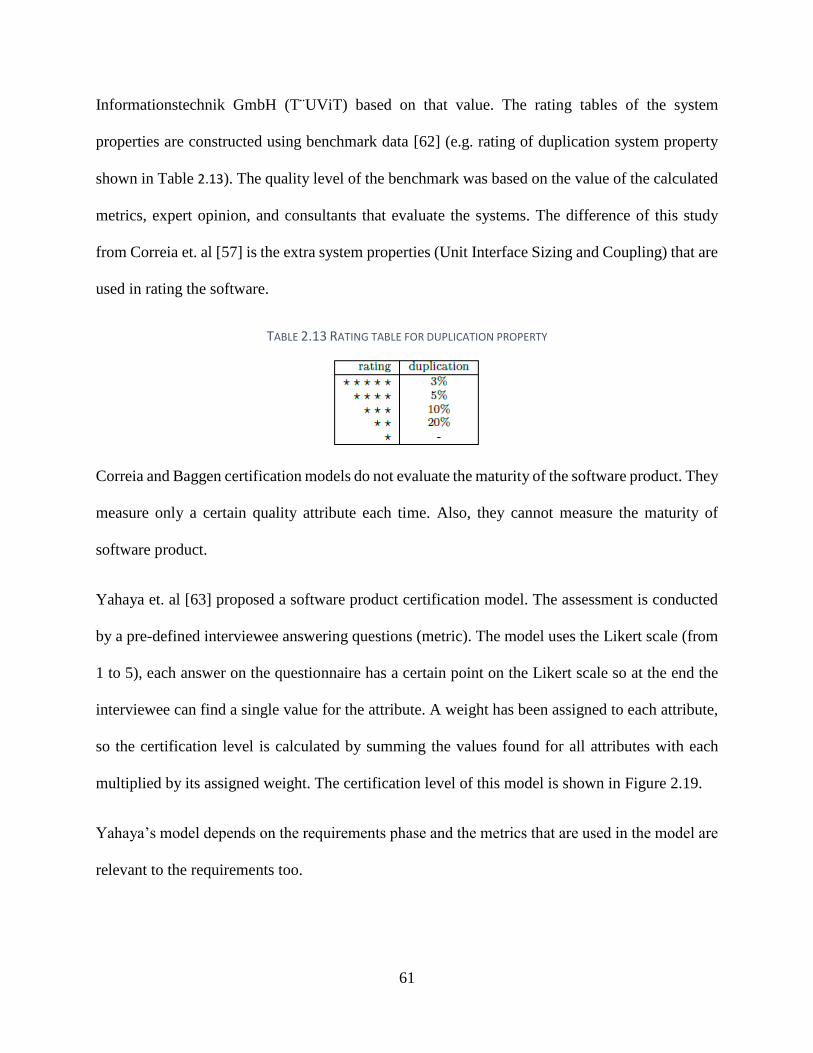
61
Informationstechnik GmbH (T¨UViT) based on that value. The rating tables of the system
properties are constructed using benchmark data [62] (e.g. rating of duplication system property
shown in Table 2.13). The quality level of the benchmark was based on the value of the calculated
metrics, expert opinion, and consultants that evaluate the systems. The difference of this study
from Correia et. al [57] is the extra system properties (Unit Interface Sizing and Coupling) that are
used in rating the software.
TABLE 2.13 RATING TABLE FOR DUPLICATION PROPERTY
Correia and Baggen certification models do not evaluate the maturity of the software product. They
measure only a certain quality attribute each time. Also, they cannot measure the maturity of
software product.
Yahaya et. al [63] proposed a software product certification model. The assessment is conducted
by a pre-defined interviewee answering questions (metric). The model uses the Likert scale (from
1 to 5), each answer on the questionnaire has a certain point on the Likert scale so at the end the
interviewee can find a single value for the attribute. A weight has been assigned to each attribute,
so the certification level is calculated by summing the values found for all attributes with each
multiplied by its assigned weight. The certification level of this model is shown in Figure 2.19.
Yahaya’s model depends on the requirements phase and the metrics that are used in the model are
relevant to the requirements too.

62
FIGURE 2.19 CERTIFICATION LEVEL
Therefore, it is established that there is no maturity model that measures the quality of the final
product; most of the models in the literature only focus on the quality of the development processes
as does CMMI rather than the quality of the final product based on the following premise “the
quality of a system or product is highly influenced by the quality of the process used to develop
and maintain it” [7]. This work will fill this gap by developing a maturity model that will measure
the quality of the final product. The proposed Product Maturity Model Integration (PMMI), will
measure the different software quality attributes of the final product. Also PMMI looks at the
quality of the software product not the quality of the software development processes like CMMI
because the quality of the processes does not guarantee the quality of the final product [9]. There
has not been much work done on this area of software product assessment. Moreover PMMI is not
restricted to certain software quality models or a set of metrics. PMMI gives flexibility to assessors
to choose quality attributes that the stakeholders are interested in measuring. Furthermore PMMI
can be applied to any software regardless of size and type which are developed by organizations
of any size and using any software development methodologies. As a result, PMMI is a more
flexible framework for the measurement of software product quality.

63
Chapter 3
Technical-Capability Maturity Model Integration
(T-CMMI)
This chapter describes the capability maturity model that will be proposed to assess the maturity
of the software product. Technical-Capability Maturity Model Integration (T-CMMI) for assessing
the final software products were defined. T-CMMI is complement with CMMI in defining the
reference model and assessment method. T-CMMI consists of two parts which are:
1. Reference Model that describes the common basis for the assessors to assess the software
product. The reference model describes the maturity levels of software product that it can
achieve. It also provides a set of quality attributes and metrics.
2. Assessment Method that describes how to use the reference model in assessing the final
software product. It also provides guidelines and checklists that help in the assessment
process and to ensure a common base of judgment.
Both reference model and the assessment method of the T-CMMI are shown in Figure 3.1.

64
Figure 3.1 T-CMMI Architecture
The structure of T-CMMI was taken from CMMI structure which contains a reference model and
an assessment method. The reference model for the T-CMMI is called Product Maturity Model
Integration (PMMI) which contains the capability and product maturity levels. Also PMMI
contains a set of recommended quality attributes and metrics to measure these quality attributes.
PMMI is comprised of two focus-areas which concentrate on the internal and external quality
attributes of the product. The purpose of the Reference Model is to provide a platform and a focus
for gathering evidence for product quality indicators that will be used to assess the product maturity
level during the Product Maturity Assessment. The next chapter will describe in detail the PMMI
reference model.
The assessment method is called Product Maturity Assessment Method (PMAM). PMAM assess
the final software product according to the reference model. PMAM contains guidelines and
checklists with an example to illustrate how the assessors follow the guidelines in order to measure
the capability level and product maturity level for both of PMMI’s focus-areas which concentrate
T-CMMI
Product Maturity
Assessment Method (PMAM)
Product Maturity
Model Integration (PMMI)
Reference Model Assessment Method

65
on the internal and external quality attributes. The purpose of the Product Maturity Assessment is
to provide a standard method for assessing the product maturity/capability by assessing the degree
to which the product conforms to the stakeholders required quality attributes. PMAM will be
described in detail in chapter 5.
In order to propose a maturity model that help in evaluating the quality of the final software product
the following methodology is used:
1. List product quality models and their classifications from the literature. After that,
select a recommended list of product quality attributes with their definitions to be
included in the framework from the identified list of the product quality models. The
quality attributes list will be as base for the assessor to select from.
2. Identify the general structure of the PMMI including the scope of each component in
the framework.
3. Define, for each PMMI stage, the recommended list of product quality attributes based
on the defined scope of that stage.
4. Define the recommended stakeholders (user, developer, or supplier) for each PMMI
phase based on the interest of the stakeholder in that particular stage.
5. Conduct an in-depth literature review for the available software product metrics to
identify, assess, and analyze the related metrics in the literature to the identified quality
attributes in step 1.
6. Evaluate and select the metrics to measure the product quality attributes (recommended
list of metrics). These metrics will be used to determine the maturity of the software
product.

66
7. Develop a maturity scale which includes capability and maturity levels with their
thresholds. The maturity scale describes the quality of the software based on the
maturity level it belongs to. So the users can determine from the maturity level of the
product if it meets his quality requirements or not
8. Develop the PMMI after its structure, stages, stages’ scope, stakeholders, quality
attributes, and metrics are available.
9. Develop product maturity assessment input phase which its output is a document that
include mainly the quality attributes to be measured, metrics to be used in
measurement, and the desired capability and maturity level of software product.
10. Develop product maturity assessment process phase which includes steps on how to
calculate capability and maturity level of software product.
11. Develop product maturity assessment output phase which focuses on documenting and
reporting the results to assessment sponsors.
12. Develop product maturity assessment method (PMAM) after its all phases (product
maturity assessment input, process, and output phases) are available.
The above methodology is summarized as shown in Figure 3.2.
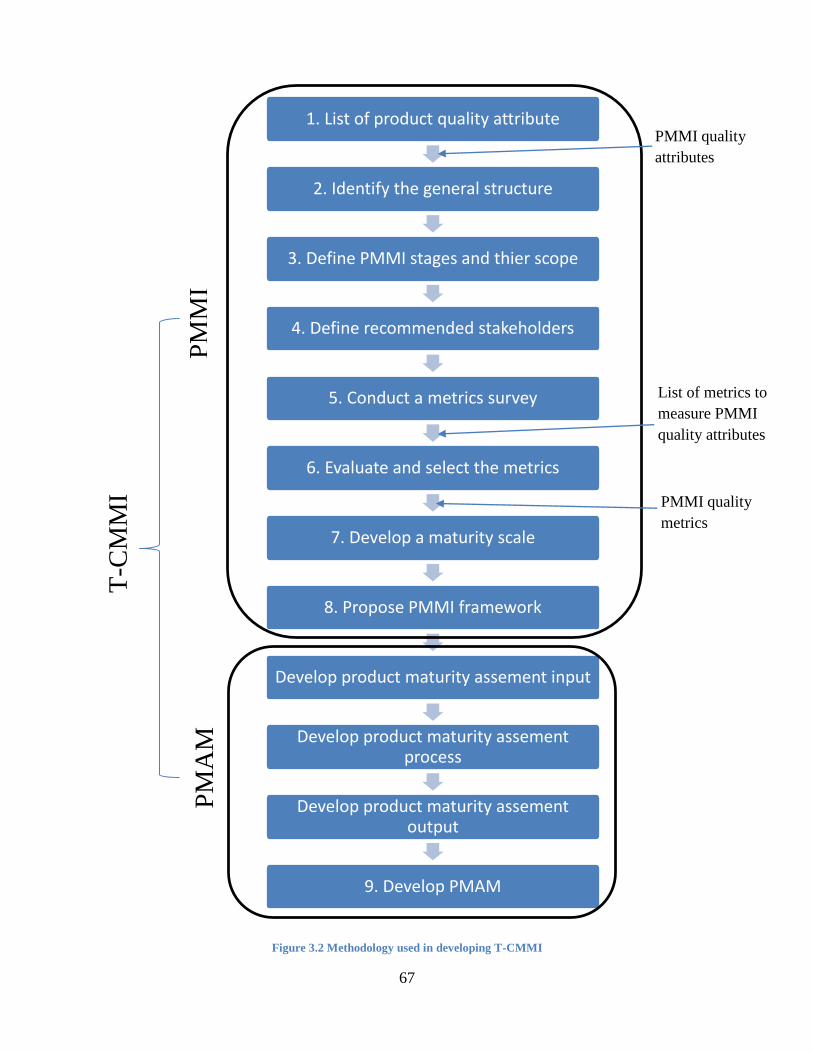
67
Figure 3.2 Methodology used in developing T-CMMI
1. List of product quality attribute
2. Identify the general structure
3. Define PMMI stages and thier scope
4. Define recommended stakeholders
5. Conduct a metrics survey
6. Evaluate and select the metrics
7. Develop a maturity scale
8. Propose PMMI framework
Develop product maturity assement input
Develop product maturity assement process
Develop product maturity assement output
9. Develop PMAM
PM
MI
PM
AM
T-C
MM
I
List of metrics to
measure PMMI
quality attributes
PMMI quality
attributes
PMMI quality
metrics

68
Chapter 4
Product Maturity Model of Integration (PMMI)
Product Maturity Model Integration (PMMI) is a quality maturity model for assessing final
software product (code) capability level and maturity level. In this chapter we will discuss the
following: structure of the model, PMMI stakeholders, PMMI quality attributes, PMMI list of
metrics that are used to measure the PMMI quality attributes, PMMI capability levels of the quality
attributes and PMMI product maturity levels.
PMMI Structure
Based on our research we considered two representations of maturity models to represent PMMI
which are the Fixed-level maturity models and Focus-Area Maturity Models [64]. Fixed-level
maturity models specify a fixed number of maturity levels, where a number of processes associated
with each maturity level should be implemented to satisfy that level of maturity, CMMI [7] is
considered an example of a Fixed-level maturity model. On the other hand the focus area maturity
models [65] are “based on the concept of a number of focus areas that have to be developed to
achieve maturity in a functional domain” [64]. We adopted the Focus-Area Maturity Model
representation for PMMI over the Fixed-level maturity model due to the following reasons:
1. The variability of the product’s quality attributes that need to be assessed. Stakeholders
have different interests on which quality attributes want to measure.
2. There is no fixed set of quality attributes that are valid across all types of software products.
Rather the set of quality attributes has to be defined by the product stakeholders.

69
We adopted Focus-Area Maturity Model as proposed in [64] .The Focus-Area Maturity Models
consist of the following parts:
1. Functional Domain: is the all activities and actors that are involved in a defined function
(area addressed by maturity assessment).
In PMMI there are two functional domains which are:
A. Dev Functional Domain: consists of all the activities, responsibilities and actors
involved in the software development and testing (prior to Integration and pre-
release checks).
B. Rel Functional Domain: comprises all the activities, responsibilities and actors
involved in the Software Integration, User Acceptance Testing (UAT) and pre-
release testing (verification & validation).
2. Focus Area: should be developed to achieve maturity in the functional domain. There are
two focus areas in PMMI which are DEV-Stage and REL-Stage which will be described
later in this section.
3. Capability: defined as “an ability to achieve a predefined goal that is associated with a
certain maturity level” [64]. In our PMMI model, the product capabilities are defined by
the level of the product’s compliance with the quality requirements. The results of tests
(quality metrics) are the indicators of the level of compliance.
PMMI is compromised from several components as shown in Figure 4.1. The figure shows the
main components for each PMMI stage. On the left hand side are DEV-Stage components were
they focus on measuring internal quality attributes. While on the right hand side are REL-Stage
components were their focus on external quality attributes. Product maturity assessment
component where the metrics for each quality attribute are executed and the results were collected

70
to calculate the capability level for each quality attribute. Then, the capability level of all quality
attributes will be fetched into PMMI internal/external quality attributes component. In PMMI
internal/external quality attributes component, the weighted average capability values of all quality
attributes will be calculated to measure the stage maturity level. Finally, the calculated maturity
level will be the input to Aggregated DEV/REL Stage Maturity Level component where the
rounded down of the maturity level value will be done to find the stage maturity level. The rounded
down is done to the aggregated maturity level because the value that is located between 2 levels
does not belong to the higher level.
Figure 4.1 Components of the Product Maturity Model Integration (PMMI)
Aggregated DEV Stage Maturity
Level
PMMI internal Quality Attributes
Product Maturity Assessment #1
Aggregated REL Stage Maturity
Level
PMMI external Quality Attributes
Product Maturity Assessment #2
Measurement results
from assessment
Weighted average capability
values of the quality attributes
DEV Stage Maturity Level REL Stage Maturity Level

71
Figure 4.2 PMMI Structure
Figure 4.2 shows the PMMI structure which contains two focus areas (DEV-Stage and REL-Stage)
and two quality gates (PMA#1 and PMA#2) which are presented as diamonds. The first focus area
is the Development stage (DEV-Stage) that covers all the processes and activities of software
development and testing (unit testing) of the software product. The output of the DEV-stage is the
tested code which is assessed against internal quality attributes at the first quality gate when the
code is ready to be moved to the next phase of system/product integration testing and release. The
main goal of the first quality gate is to ensure that the software product (source code) satisfies the
desired capability levels of the selected internal quality attributes and the product maturity level
that are determined by the assessment sponsors for the DEV-Stage. Each focus area has its own
stakeholders and quality attributes. The quality gates have a suggested list of metrics that will be
executed to measure the quality attributes of the output product from the focus area and to measure
the maturity of the software product. PMA#1 quality gate tests the output of the DEV-Stage and
PMA#2 quality gate tests the output of the REL-Stage.
Product Maturity Assessment Method (PMAM)
Focus Area 1:
DEV-Stage
Focus Area 2:
REL-Stage Finish Start
REL Product Maturity
Assessment (PMA#2)
DEV Product Maturity
Assessment (PMA#1)
Pass? Pass?
NO
NO
Yes Yes
72
Figure 4.2 shows that the output of the DEV-Stage which is the developed and tested (unit testing)
software will be tested against internal quality attributes at the first quality gate (PMA#1) to check
if the output satisfies the desired capability and maturity level of DEV-Stage. If the output meets
the quality requirements that are defined by the assessment sponsor, it will go the next stage (REL-
Stage) otherwise the software will go back to DEV-Stage to be improved in order to match the
expectations. In REL-Stage the output is the product after making integration testing and pre-
release testing will be tested against external quality attributes at the second quality gate (PMA#2)
to ensure that the output meets the sponsor quality expectations of REL-Stage by meeting the
desired capability and maturity levels. If the output product does not meet the expectation it will
go back to the REL-Stage for improvement otherwise the product will be ready for release.
Each focus area has its scope which contains the processes that are performed to produce the output
of the software product where it is the same output of the focus area. Figure 4.3 shows the processes
and their definitions [1] which is the scope of the DEV-Stage (recommended scope).

73
Figure 4.3 DEV-Stage scope
The second focus area is the product integration & release stage (REL-Stage) that covers system
integration and pre-release product testing. The output of the second focus area is the user
acceptance tested product which is tested using external quality attributes thereby establishing the
maturity level of the product. This assessment is carried out at the second quality gate when the
software product is ready to be shipped to the external stakeholders (e.g. customers, users,
resellers, etc.). Figure 4.4 shows the scope of the REL-Stage (recommended scope) which are the
processes and their definitions, the first process is from [1] and the “Pre-Release Verification”
process is added to ensure that the final software product (after integration) meets the stakeholders
expectations.
Scope
ENG1.1 System Requirements & Design • Establishing the system requirements
ENG1.2 Software Requirements analysis
• Establishing the requirements of the software components of the system
ENG1.3 Software Design process
• Define a design for the software to implement the requirements
ENG1.4 Software Construction • Produce executable software units and verify that they reflect the software
design
ENG1.5 Software Integration • Combine the software units , producing integrated software items
ENG1.6 Software Testing
• Test the integrated software unit to satisfy the software requirements
DEV Stage

74
Figure 4.4 REL-Stage scope
The scope of the PMMI model covers an integrated view of the end-to-end lifecycle starting with
a product and ending with product integration, testing & release (hence the word integration).We
treat the whole software development lifecycle as a black-box, because this will give the model
the flexibility to be suitable for any type of development lifecycle which is used in software
development. In other words the focus is on the final software product (code) without looking into
how it is developed.
We did not include the product-in-use phase due to the fact that the product–in-use environment
could be vastly different and variable depending on external factors that are mostly not-predictable.
So our concentration is on the internal and external quality attributes which are relevant in the
DEV-Stage and REL-Stage respectively.
Scope
ENG1.7 System integration and testing process [1] • Integrate the software components and other
components producing a complete system.
Pre-Release Verification
• Final Verification of the integrated system to ensure that it complies with the External Quality Attributes defined by the stakeholders and that it will satisfy the stakeholders expectations expressed in the system requirements
REL Stage

75
PMMI Stakeholders
As we discussed in the previous section, there are two focus areas in the structure of PMMI. DEV
and REL stages that are concerned with internal and external quality attributes respectively. Also,
they have their own stakeholders for each focus area. PMMI suggests a list of stakeholders for
each focus area. We identified the following stakeholders that might be of interest in DEV-Stage
and REL-Stage. Here is the list of the stakeholders for the DEV-Stage:
1. Project Managers & Team Leaders
2. Requirements Engineers
3. Solution Designers / Architects
4. Developers (Coders & Unite Testers)
5. Maintenance Teams
6. IT Security Teams
And here is the list of stakeholders for the REL stage:
1. Product Users (who use the product)
2. Product Customers (Who purchase the product)
3. Sales & Marketing Teams
4. Product Sellers (Who sell the product)
5. IT Security Teams
6. Maintenance Teams
7. Product Resellers (Who integrate the product within their "final" product which they sell)
8. User Acceptance Teams
9. Release Teams

76
The assessment sponsor and the competent assessor can select from the PMMI stakeholders’ list
to help the assessors in describing the missing points in output of the stage or resolve the
inconsistency in the documents. These are done by interviewing the stakeholders of each stage by
the assessor team before executing the metrics.
PMMI Quality Attributes
Based on the software quality literature review that we did in Chapter 3, we selected the quality
attributes from well-known quality models. The selection of the quality attributes was based on
the following selection criteria:
1. Is not a duplicated quality attribute (on name).
2. Quality attribute definitions in one quality model are not covered by a wider definition of
another quality attribute in other quality the same quality model. However some quality
attributes may overlap in their definitions.
3. The quality attribute relates to the quality of the code.
4. The quality attribute can be measured in the code.
Table 4.1 shows the selected quality attributes with their definitions, the name of the quality model
that was selected from, and the name of the PMMI stage that the quality attribute belongs to
whether it be to the DEV-Stage, REL-Stage, or both stages based on the stakeholders. One of the
important stakeholders for the release stage is the user. Therefore, quality attributes that relate to
users are considered as REL-Stage quality attributes. The definitions of the quality attributes are
directly quoted from their references except for “maintainability” wherein we added to McCall’s
definition to make the “Maintainability” quality attribute include preventive, corrective, and

77
adaptive maintenance. We also added the “Complexity” quality attribute based on expert
suggestion.
The sponsors and the competent assessors can select from the list of quality attributes of the DEV
and REL stages that they are interested in measuring in each focus area from Table 4.1. Once the
sponsors and the competent assessor selected the quality attributes then the assessor will select the
list of metrics to measure the selected quality attributes in the software product. PMMI provides a
recommended list of metrics for each quality attribute that will be described in the next section.

78
Table 4.1 PMMI Quality Attribute with their definitions
Quality Attribute Definition Model Name
Focus Area
Consistency
“Code possesses characteristic internal consistency to the extent that it contains uniform notation, terminology and symbology within itself, and external consistency to the extent that the content is traceable to the requirements. Internal consistency implies that coding standards are homogeneously adhered to; e.g., comments should not be unnecessarily extensive or wordy in one place or insufficiently informative in another. The number of arguments in subroutine calls match with subroutine header, etc. External consistency implies that variable names and definitions, including physical units, are consistent with a glossary; or there is a one-to-one relationship between functional flow chart entities and coded routines or modules, etc.”
Bohem[24] DEV
Efficiency “The capability of the software product to provide appropriate performance, relative to the amount of resources used, under stated conditions.”
ISO9126[26] REL
Maintainability “Effort required to locate and fix an error in an operational program”. Maintainability contains correction, prevention, and adaptive maintenance (text in red was added by me).
McCall[23] Both
Reliability
“Code possesses the characteristic reliability to the extent that it can be expected to perform its intended functions satisfactorily. This implies that the program will compile, load, and execute, producing answers of the requisite accuracy; and that the program will continue to operate correctly, except for a tolerably small number of instances, while in operational use. It also implies that it is complete and externally consistent, etc.”
Bohem[24] Both
Testability “The capability of the software product to enable modified software to be validated.”
ISO9126[26] DEV
Understandability
“Code possesses the characteristic understandability to the extent that its purpose is clear to the inspector. This implies that variable names or symbols are used consistently, modules of code are self-descriptive, and the control structure is simple or in accordance with a prescribed standard, etc.”
Bohem[24] DEV
Usability “The capability of the software product to be understood, learned, used and found to be attractive by the user, when used under specified conditions.”
ISO9126[26] REL
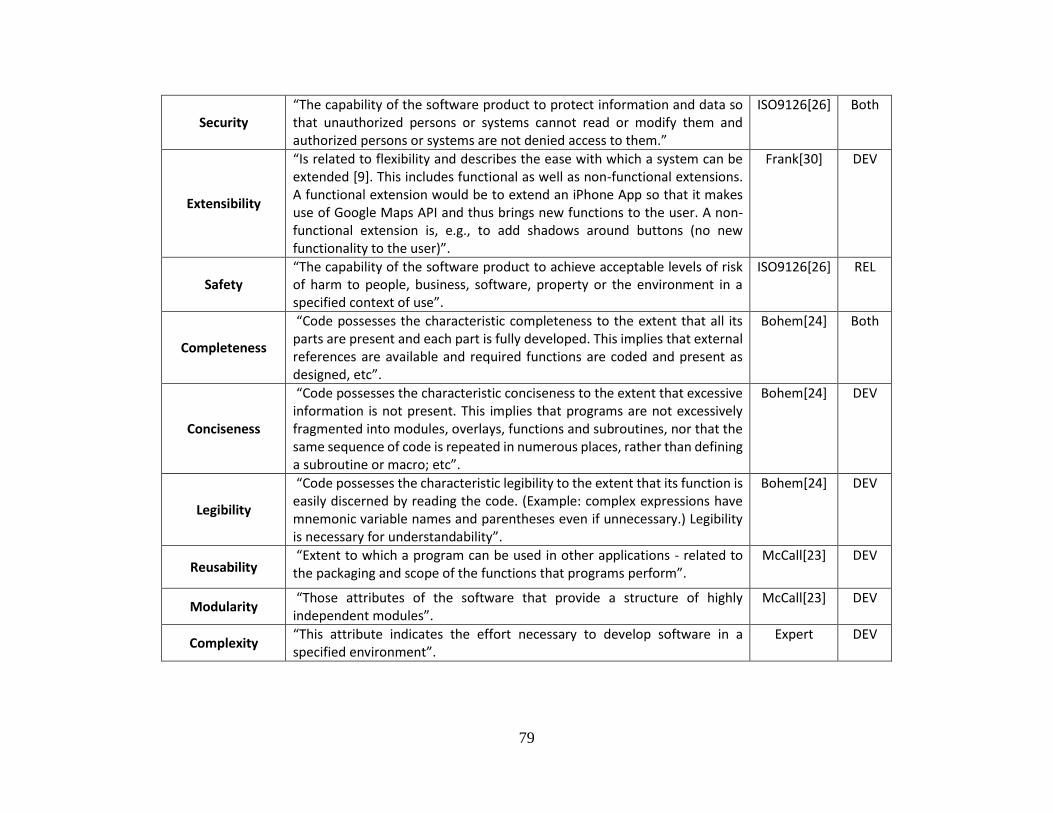
79
Security “The capability of the software product to protect information and data so that unauthorized persons or systems cannot read or modify them and authorized persons or systems are not denied access to them.”
ISO9126[26] Both
Extensibility
“Is related to flexibility and describes the ease with which a system can be extended [9]. This includes functional as well as non-functional extensions. A functional extension would be to extend an iPhone App so that it makes use of Google Maps API and thus brings new functions to the user. A non-functional extension is, e.g., to add shadows around buttons (no new functionality to the user)”.
Frank[30] DEV
Safety “The capability of the software product to achieve acceptable levels of risk of harm to people, business, software, property or the environment in a specified context of use”.
ISO9126[26] REL
Completeness
“Code possesses the characteristic completeness to the extent that all its parts are present and each part is fully developed. This implies that external references are available and required functions are coded and present as designed, etc”.
Bohem[24] Both
Conciseness
“Code possesses the characteristic conciseness to the extent that excessive information is not present. This implies that programs are not excessively fragmented into modules, overlays, functions and subroutines, nor that the same sequence of code is repeated in numerous places, rather than defining a subroutine or macro; etc”.
Bohem[24] DEV
Legibility
“Code possesses the characteristic legibility to the extent that its function is easily discerned by reading the code. (Example: complex expressions have mnemonic variable names and parentheses even if unnecessary.) Legibility is necessary for understandability”.
Bohem[24] DEV
Reusability “Extent to which a program can be used in other applications - related to the packaging and scope of the functions that programs perform”.
McCall[23] DEV
Modularity “Those attributes of the software that provide a structure of highly independent modules”.
McCall[23] DEV
Complexity “This attribute indicates the effort necessary to develop software in a specified environment”.
Expert DEV

80
PMMI Quality Metrics
Based on our survey we identified a set of recommended metrics that will be provided by
PMMI for each quality attribute (presented in Table 4.1) in the model. Table 4.2 represents
the quality attributes (header) that are targeted by the metrics, and under each quality
attribute the name of the metrics with the metric reference and the description of usage of
that metric are presented. Also we specify the measurement scale of each metric whether
its nominal, ordinal, interval, ratio, or absolute. The measurement scale will help the
assessors to identify the thresholds of these metrics.
Each quality attribute has its own set of metrics. The selection of these sets of metrics are
based on covering different aspects of measurement of that quality attribute and the
ease of calculating of those sets of metrics. The assessors can select the list of metrics
from the recommended list of metrics that is provided by PMMI in order to measure the
quality attributes that are identified by the sponsors and the competent assessor. The
assessors can select any number of metrics they need to measure a certain quality attribute.
Table 4.2 Recommended list of metrics for PMMI quality attributes
Consistency
Metric Name with Paper ID Description of the Use Measurement
Type
coherence coefficient (c coeff) [66]
“Extract words contained in the comment and compare it to the words contained in the method name.”
Ratio
Distinct Argument Ratio (DAR) [67]
“where na is the Argument Count of the interface”
Ratio
EFFICIENCY
Metric Name with Paper ID Description of the Use Measurement
Type

81
Efficiency [68] Efficiency = (Code Area / Execution Time) * Qr where “Qr = Quality Quotient (on a scale of 1 to 10 given by user).”
Ratio
Response Time [69]
Ri = Wi + Si
Si: Average server time of resource i, when one
transaction process access resource i every time.
Wi: Average wait time of queue i, when one transaction
process access queue i every time.
Ri: Average response time of queue i, when one
transaction process in queue i.
Absolute
the number of transactions [69]
Ni = Niw + Nis, it measures (throughput) Absolute
resource utilizations [69]
Ui=Xi x Si “Example: In 120s, one resource executes 45 transaction processes. Each transaction process cost 19.0ms. During this time, what is this resource utilization? Ui = Xi x Si = 45 x 0.019 = 0.855 =85.5%”
Ratio
Function call efficiency [70]
“The ratio between FUNCTION CALLS and STATEMENTS” Ratio
MAINTAINABILITY
Metric Name with Paper ID Description of the Use Measurement
Type
Maintainability metric [71]
Summation of maintinabilities of individual changes, that bases on the size of classes
Ratio
Number of 3rd Party Components (No3C) [72]
“This is the count of the number of components that have been acquired from outside vendors. “
Absolute
Number of Components (NoC) [72]
“total number of architectural units that can be found in the system of interest “
Absolute
Total Number of External Interfaces (TNEI) [72]
“number of connectors that allow the component to interact with other components outside the subsystem “
Absolute
Total Number of Internal Interfaces (TNII) [72]
“number of connectors that allow components to interact with other components within a subsystem or layer “
Absolute
Number of Functionally Critical Components (NFCC) [72]
“counts the number of components whose failure would affect the system’s functionality drastically“
Absolute
Number of Versions (NoV) [72]
“number of releases the product has undergone. “ Absolute

82
Number of Subsystems (NoSS) [72]
“number of units that are logical or physical clusters of components“
Absolute
Number of Services (NOS) [72]
“number of different services that are offered by a system“ Absolute
Number of Concurrent Components (NCC) [72]
“number of components that operate concurrently “ Absolute
Class stability metric (CSM) [73]
“Measure the stability of the class based on a set of factors“ Ratio
Number of children (NOC) [74]
“number of immediate subclasses subordinated to a class in the class hierarchy. “
Absolute
RELIABILITY
Metric Name with Paper ID Description of the Use Measurement
Type
Mean Time Between Failure (MTBF) [75]
“MTBF(T) = This Def from Ref_117 MTTF provides the mean time it takes for the system to reach one of the designated failure states, given that the system starts in a good or working state. The failed states are made absorbing states. “
Absolute
software reliability [76]
the formula depends on defining: 1 - total expected number of faults latent in a system prior to operation 2 - detection rate per fault not leading to an unsafe state 3 - detection rate per fault leading to an unsafe state 4 - content proportion of faults not leading to an unsafe state 5 - content proportion of faults leading to an unsafe state 6 - expected number of faults not leading to an unsafe state that are detected during n executions of input data 7 - expected number of faults leading to an unsafe state that are detected during n executions of input data (The probability that a software will operate without causing a software failure)
Ratio
TESTABILITY
Metric Name with Paper ID Description of the Use Measurement
Type
testability measurement TM [77]
“Combine the statement coverage and branch coverage“
Ratio
UNDERSTANDABILITY
Metric Name with Paper ID Description of the Use Measurement
Type

83
Rate of Component Observability (RCO) [78]
“percentage of readable properties in all fields implemented within the Facade class of a component “ Ratio
Code spatial complexity (CSC) [79]
“compute code-spatial complexity of a module (MCSC): sum of Distance over n .. where n represents count of calls/uses of that module and Distance i is equal to the absolute difference in number of lines between the module definition and the corresponding call/use .. for the system equal : sum of all MCSC over number of modules in the system“
Ratio
USABILITY
Metric Name with Paper ID Description of the Use Measurement
Type
Usability Metric for User Experience (UMUX) [80]
This metric include a questionnaire ( 4 questions) based on the answer the usability will be calculated Ratio
Essential efficiency [81]
“Measure how near is the user interface design from the ideal use case for making a particular task. That is, it is a ratio between the number of essential steps that are needed for a user to get an objective and the number of steps actually needed to get it. “ Ratio
System Usability Scale (SUS) [82] It consist from 10 questions
Ratio
Security
Metric Name with Paper ID Description of the Use Measurement
Type
Critical Element Ratio (CER) [83]
“Critical Elements Ratio = Critical Data Elements in an Object / Total Number of Elements in the Object“ Ratio
Security Resource Indicator (SRI) [84]
“The security resource indicator is based on four items: documentation of the security implications of configuring and installing the application, a dedicated e-mail alias to report security problems, a list or database of security vulnerabilities specific to the application, and documentation of secure development practices. “
Ratio
Critical Classes Coupling (CCC) [85]
Ratio
Critical Classes Extensibility (CCE) [85]
“The ratio of the number of the non-finalised critical classes in a design to the total number of critical classes in that design. “
Ratio

84
Critical Design Proportion (CDP) [85]
“The ratio of number of critical classes to the total number of classes in a design. “
Ratio
Extensibility
Metric Name with Paper ID Description of the Use Measurement
Type
Class extensibility Metric [86]
“number of abstract methods divided by the total number of methods (concrete plus abstract) of a class“
Ratio
Plugin Pollution Index [87]
“Formula Depending on : set of methods that module calls, transitive closure of the method calls, set of methods that are in the module that are in transitive closure of method calls“
Ratio
Safety
Metric Name with Paper ID Description of the Use Measurement
Type
software safety [76]
“The probability that a software system will not cause an unsafe condition can be measured using the following equation: “ “P(i) is the probability that I i (subset of input that cause a software failure that lead to unsafe state) is selected when a system is executed“
Ratio
COMPLETENESS
Metric Name with Paper ID Description of the Use Measurement
Type
Requirement Fulfillment [88]
“M5 = #requirements associated with artifacts in the model / #requirements in RS“ Ratio
Completeness metric [88]
Ratio
CONCISENESS
Metric Name with Paper ID Description of the Use Measurement
Type
LEN(S) [89] “the average length of sequences (size of fragments) in clone set S“
Ratio
POP(S) [89] “the number of S fragments“ Absolute
NIF(S) [89] “The number of source files that include any S fragments“ Absolute
LEGIBILITY
Metric Name with Paper ID Description of the Use Measurement
Type
Design legibility [90] “Percentage of functional elements (interfaces, methods, configurable parameters (e.g., public attributes) ) with long names (>20 chars) - Average length of FE names“
Ratio
Design legibility [90] “Average length of functional elements names “ Ratio

85
Imported Software Parts (ISP) [91]
“ISP = number of software parts imported and used by a software part“
Absolute
REUSABILITY
Metric Name with Paper ID Description of the Use Measurement
Type
Number of 3rd Party Components (No3C) [72]
“This is the count of the number of components that have been acquired from outside vendors.“
Absolute
Number of Components (NoC) [72]
“total number of architectural units that can be found in the system of interest“
Absolute
Number of Versions (NoV): [72]
“number of releases the product has undergone“ Absolute
Number of Redundant Components (NoRC): [72]
“counts the number of redundant components“ Absolute
Number of Subsystems (NoSS) [72]
“number of units that are logical or physical clusters of components “
Absolute
Reusability Metric [92] “Number of reused classes / Number of total classes“ Ratio
Degree of Inheritance of a Class(DIC) for method [93]
“Number of inherited Methods X (4 - level) if level <= 3,Number of Inherited Methods x (level - 3) if level >= 4“
Absolute
Degree of Inheritance of a Class(DIC) for attribute [93]
“Number of inherited Attributes x (4 - level) if level <= 3 ,Number of inherited Attributes x (level - 3) if level >= 4“
Absolute
Modularity
Metric Name with Paper ID Description of the Use Measurement
Type
Modularity ratio [94]
Absolute
Module Interaction Index [95]
“The ratio of the number of calls made to function from other functions external to module to the summation of calls made to a function from other functions internal or external to module “
Ratio
Complexity
Metric Name with Paper ID Description of the Use Measurement
Type
Weighted Operation in Module (WOM) [96]
“Counts the number of operations in a given module“ Absolute
MAXIMUM DIT (MaxDIT) [97]
“It is the maximum of the DIT (Depth of Inheritance Tree) values obtained for each class of the class diagram. The DIT value for a class within a generalization hierarchy is the longest path from the class to the root of the hierarchy. “
Absolute
FE [98] “count the number of file operations including open, read, write and close“
Absolute

86
EL [98] “count the number of external functions, libraries and files linked“
Absolute
VE [98] “count the number of variables declaration“ Absolute
EditedFunctionCC (CC) [99]
“the summation of the CC for functions edited during code change“
Absolute
Fan-in+ Fan-out (F-(J+O)) [100]
“obtained from fan-in + fan-out“
Absolute
ZIP- coefficient of compression (ZCC) [101]
“The ratio of size of ZIP archive to size of project“ Ratio
Numberof Children(NOC) [74]
“number of immediate subclasses subordinated to a class in the class hierarchy“
Absolute
Response For a Class (RFC) [74]
“set of methods that can potentially be executed in response to a message received by an object of that class“
Absolute
Mean Method Complexity [102]
Ratio
Number of Trivial Methods [102]
“counting the number of methods in a class with complexity equal to one“
Absolute
Number of lines of code [103]
“counts all lines, including comments, with the exception that multiple-line comments are counted as a single line“
Absolute
Number of blocks [103] “The number of block constructs in a method“ Absolute
Number of temporary variables and method arguments [103] “number of temporary variables and arguments. “
Absolute
Number of external assignments [103]
“Number of external assignments in a method (that is assignments to variables other than temporary variables). “
Absolute
API complexity (methods) [90]
“Percentage of methods without arguments“ Ratio
API complexity (Constructor) [90]
“Ratio of constructors per class“ Ratio
Number of classes [104] “the number of classes in a class diagram“ Absolute
Number of methods [104]
“the number of methods defined in a class diagram, including those defined at class and instance level, but not including inherited methods “
Absolute
Number of attributes [104]
“the total number of attributes defined in a class diagram, including those defined at class and instance level, but not including inherited attributes or attributes defined within methods“
Absolute
Number of associations [104]
“the number of association relationships in a class diagram “ Absolute
Number of dependencies [104]
“the number of dependency relationships in a class diagram “ Absolute
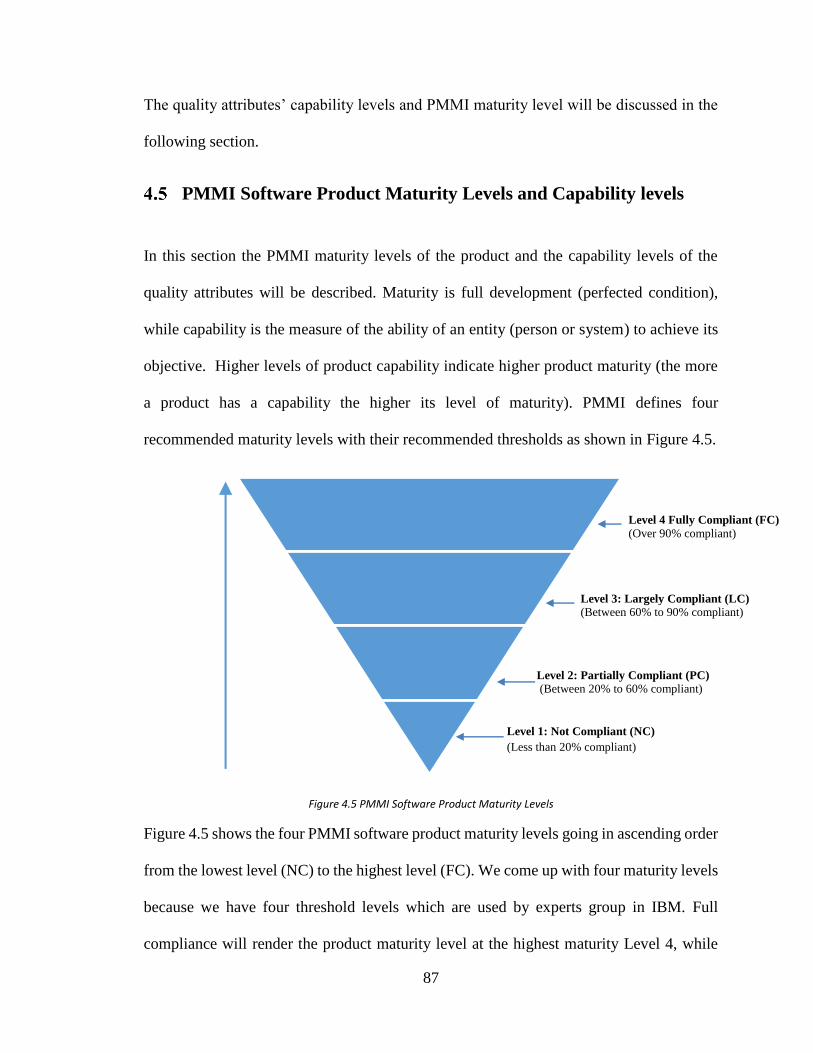
87
The quality attributes’ capability levels and PMMI maturity level will be discussed in the
following section.
PMMI Software Product Maturity Levels and Capability levels
In this section the PMMI maturity levels of the product and the capability levels of the
quality attributes will be described. Maturity is full development (perfected condition),
while capability is the measure of the ability of an entity (person or system) to achieve its
objective. Higher levels of product capability indicate higher product maturity (the more
a product has a capability the higher its level of maturity). PMMI defines four
recommended maturity levels with their recommended thresholds as shown in Figure 4.5.
Figure 4.5 PMMI Software Product Maturity Levels
Figure 4.5 shows the four PMMI software product maturity levels going in ascending order
from the lowest level (NC) to the highest level (FC). We come up with four maturity levels
because we have four threshold levels which are used by experts group in IBM. Full
compliance will render the product maturity level at the highest maturity Level 4, while
Level 1: Not Compliant (NC)
(Less than 20% compliant)
Level 2: Partially Compliant (PC)
(Between 20% to 60% compliant)
Level 3: Largely Compliant (LC)
(Between 60% to 90% compliant)
Level 4 Fully Compliant (FC)
(Over 90% compliant)

88
deviation from full compliance will render the product maturity level at a lower level (with
a decreasing scale as the deviation increases). NC maturity level is the lowest level and the
default level for any software product. Software products that are located in the NC
maturity level are of poor quality. On the other hand software products located in the FC
maturity level are of excellent quality. Also each quality attribute has four recommended
capability levels with their thresholds that are shown in Table 4.3 which are sorted in
ascending order where “NC” is the lowest and “FC” is the highest level. The quality
attribute that is assigned “NC” is at poor level in this product, but those that are assigned
“FC” are at an excellent level in the product.
Table 4.3 Capability Levels of Software Product Quality Attributes
Level Number Capability Level Name Recommended Thresholds
1 Not Compliant (NC) Less than 20% compliant
2 Partially Compliant (PC) Between 20% - 60% compliant
3 Largely Compliant (LC) Between 60% - 90% compliant
4 Fully Compliant (FC) Over 90% compliant
Calculating the overall capability level for each quality attribute will is discussed in detail
in the next chapter. In general product quality leads to product capability & maturity
because software products that are fully compliant with the stakeholders quality attributes
possess more capability and maturity than those which are partially compliant with those
quality attributes. Also the degree of product compliance with the quality attributes is
defined by the capability levels of those quality attributes.
We want to note that the provided capability levels and product maturity levels that are
provided with PMMI are recommended not mandatory.

89
PMMI Flexibility
PMMI is flexible to be suitable for any type of development methodology is used in the
software development like: waterfall, agile, incremental …etc. It also can be applied to any
organization and software size because PMMI treats the whole software development
lifecycle as a black-box. It does not require any information about the organization which
developed the software. Also, PMMI provides flexibility in:
Identifying stakeholders: the assessors can identify their own set of stakeholders
for DEV and REL stages, or they can combine these lists and choose from both of
them.
Selecting quality attributes: the assessors can come up with their own set of quality
attributes that they are interested in for DEV and REL stages. Also, the sponsors
and the competent assessors could change the default focus area of the quality
attributes if this was called for.
Selecting metrics: The metrics that provided by PMMI are a suggested list of
metrics that the assessors can use. In other words, the assessors can customize or
bring their own set of metrics for any quality attribute based on the selected quality
attribute and the type of software product that will be assessed.
Identifying capability and maturity levels: the assessors have the ability to identify
their own capability levels and product maturity levels with their thresholds. Also,
PMMI gives the assessors the ability to identify the thresholds of each used metric
and map these thresholds to the identified capability levels. The identification of
the maturity levels, capability levels, and metric thresholds are based on the
software size and software domain.

90
Chapter 5
Product Maturity Assessment Method (PMAM)
In this chapter the Product Maturity Assessment Method (PMAM) is described. The
PMAM covers all of the activities necessary to determine the extent of a product capability
to perform in a full compliance with stakeholders’ quality requirements. The scope of the
assessment is to assess a software product's degree of compliance with the quality attributes
defined by the stakeholders (agreed with the assessment sponsor) that covers an integrated
view of the end-to-end lifecycle starting with the product and ending with product
integration, testing & release. The purpose of the PMAM is to provide a standard method
for assessing the level of the product maturity/capability by assessing the degree of the
product’s conformance with the stakeholders required quality attributes. The PMAM
method is compliant with “Guidance on Performing an Assessment” ISO model (ISO
15504-3) [105] framework for software assessment in specifying and defining:
1. Assessment Input.
2. Assessment Process.
3. Assessment Output.

91
4. Identity of assessment sponsors
5. Identity of Assessors.
6. Responsibilities of each PMAM team member.
7. Expected assessment output and minimum data that should be included in the final
assessment report
Following “Guidance on Performing an Assessment” ISO model [105] will ensure that the
assessment results are reliable, repeatable, and representative. To be in line with “Guidance
on Performing an Assessment” ISO model, the PMAM is divided into three phases:
1. Product Maturity Assessment Input phase.
2. Product Maturity Assessment Processes phase.
3. Product Maturity Assessment Output phase.
In Product Maturity Assessment Input phase, the sponsor and assessors identify
stakeholders for each PMMI stage, PMMI stage scope, quality attributes to be measured,
and select metrics to measure the identified quality attributes. These are the output of
Product Maturity Assessment Input phase which will be fetched in the next phase. In
Product Maturity Assessment Processes phase, the assessors perform the assessments
according to the document from the previous phase. The assessment results are the output
of the Product Maturity Assessment Processes phase and will be input for the last phase.
In Product Maturity Assessment Output phase the results will be documented and reported

92
to the assessment sponsors. This process is represented in Figure 5.1. Each phase will be
discussed in details on following sections.
Figure 5.1 PMAM Phases
The assessment purpose is aligned with business goals for the organization that developed
the software and for the software customers. The organization perspective will enable the
development organization to ensure that the produced software product is of high quality
and can reach the targeted maturity level. This will enable the organization to market their
final software product as a high quality product. From the customer perspective, the
customer can assess the software product even when the processes of developing the
Start
Product Maturity
Assessment Input
Product Maturity
Assessment Process
Product Maturity
Assessment Output
FinishStart Finish
Input
Output
Document contains: stage stakeholders,
stage scope, quality attributes, and metrics Assessment results
Document contains: stage stakeholders,
stage scope, quality attributes, and metrics Assessment results

93
software are not documented (black-box) to ensure that the software product which is being
considered for purchase is a high quality product.
The Product Maturity Assessment Method (PMAM) is performed for one or more of the
following purposes:
1. Before the acceptance of the software product by one or more stakeholders (for
example, the customer, the users, Sales & Marketing, Maintenance & upgrade
teams, customization/tailoring teams, etc.
2. Before the sales & distribution of the product (for example if the product is a
commercial package) to verify that the product satisfies the original functional and
non-functional requirements and conforms with the Internal Quality Attributes
(PMA#1 after DEV) and External Quality Attributes (PMA#2 after REL)
3. By standards organization and/or regulatory organizations to ensure that the
product is compliant with the relevant standards.
4. By any other stakeholders who may need to check/ensure that the product will
achieve their expected level of performance in its target environments, and identify
any gaps between the expected and actual performance.

94
PMAM Team
In this section, the PMAM main team members’ roles and responsibilities. The main
PMAM team members are assessment sponsors and assessors.
The sponsor of the assessment could be the organization of the developed product
itself, the client who wants to purchase the software product, or anyone interested
in assessing the product quality. Each focus area could have its own assessment
sponsor, but it could be the same sponsor for both focus areas.
The assessors that assess the software product can be an external assessors (outside
the organization), they could be from the organizations itself which develops the
software product (internal assessment), or a combination of both. In all cases the
assessors must have the following skills to perform the assessment:
1. Experience in software development.
2. Knowledge of the PMMI.
3. Aware of the PMAM.
4. Knowledge of different software metrics and how to apply them.
All assessors must satisfy these requirements before they start the process of
assessing the software product. The assessors responsibilities are to help the sponsors
identify the set of suitable metrics for these quality attributes, perform the

95
assessment, and provide a detailed report to the sponsors to let them know where the
weakness of the product lie in order to improve it.

96
Product Maturity Assessment Input
Figure 5.2 product maturity assessment input Assessment Steps
Step 1 Selection of product to measure
Step 2 Selection of competent asseessor
Step 3 Selection of the assessor.
Step 4 Define the Focus Area scope.
Step 5 List the Typical Products of the phase
Step 6 Identify stakeholders of stages
Step 7 Ensure the access to required documents.
Step 8 Identify the quality attribute with thier weights.
Step 9 Identify the capability levels and Product maturity levels.
Step 10 Identify metrics with their thresholds.
Step 11 Schedule the assessment process.
Step 12 Check the availability of the assessor, assessees, and stakeholders.
Step 13 Fill product maturity assessment input checklist

97
In this section we will describe the first phase of PMAM. Product maturity assessment
input will be conducted during the data collection phase before the assessment starts using
the following steps:
Step 1: The sponsors of the focus area select the product to be measured.
Step 2: The sponsors select the competent assessor who will be responsible for the
assessment process of the software product.
Step 3: The sponsors and competent assessor select the qualified assessors that will be
included in the assessment steps.
Step 4: The sponsors and the competent assessors should define the Focus Area scope
and its objectives.
Step 5: The sponsors and the competent assessors should list the Typical Products
(Code deliverables and testing results) of the phase.
Step 6: The sponsors and the competent assessors should identify the stakeholders for
DEV and REL stage. They can choose the stakeholders from the PMMI stakeholders
recommended list or they can identify other stakeholders for each phase. If they decided
to use the PMMI stakeholders recommended list the competent assessor should fill the
PMMI stakeholders’ checklist (Table A.1and Table A.2 that can be found in Appendix
A).
Step 7: The sponsors should ensure that the assessors can access to all the required
documents.
Step 8: The sponsors in consultation with the assessors identify the set of quality
attributes to be measured for each PMMI stage (DEV and REL) with the weight of each
quality attribute (The summations of all weights for each PMMI stage must be out of
98
100.) The sponsors and the assessors can select from the lists that are provided by
PMMI (Table A.3 is available in Appendix A) or they can identify a different set of
quality attributes they are interested in.
Step 9: (The sponsors and the competent assessor should identify the capability level
and the desired capability level for each quality attribute in DEV and REL stages and
the maturity level and the desired maturity level of the software product in both stages.
Also they should define the quality attribute thresholds which meet the sponsors’
expectations.)
Step 10: The assessors identify suitable metrics in order to measure the selected quality
attributes that were identified in the previous steps. (The assessors can select the
metrics from the recommended list of metrics that are provided by PMMI or they can
identify other suitable metrics to measure the selected quality attributes. The selection
of these metrics is based on the selected quality attributes and type of the software to
be assessed. The assessors should identify thresholds that should be associated with
each capability levels for each metric. Also the sponsors should identify the required
threshold of each metric (Test Threshold).)
Step 11: The sponsors and the competent assessors schedule the assessment process.
Step 12: The competent assessor ensures the availability of all assessors, and
stakeholders during the assessment period.
Step 13: The competent assessors fill the product maturity assessment input checklist
(Table A.4) that can be found in Appendix A to ensure everything is complete.
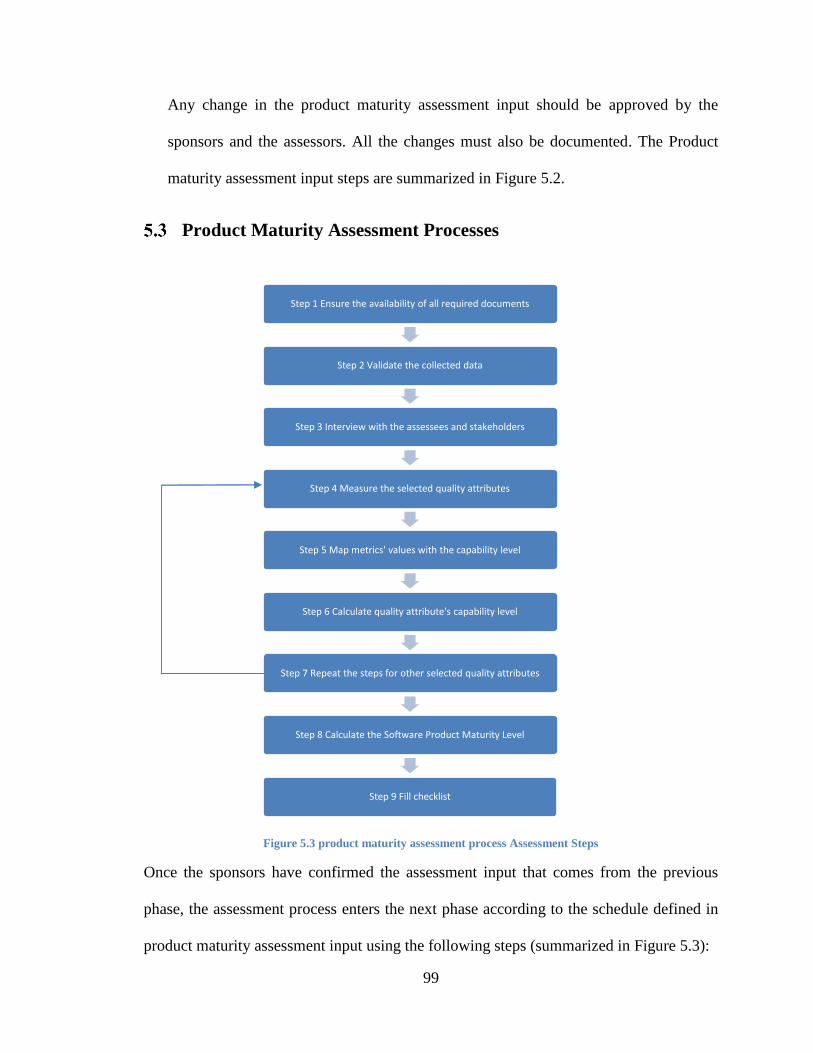
99
Any change in the product maturity assessment input should be approved by the
sponsors and the assessors. All the changes must also be documented. The Product
maturity assessment input steps are summarized in Figure 5.2.
Product Maturity Assessment Processes
Figure 5.3 product maturity assessment process Assessment Steps
Once the sponsors have confirmed the assessment input that comes from the previous
phase, the assessment process enters the next phase according to the schedule defined in
product maturity assessment input using the following steps (summarized in Figure 5.3):
Step 1 Ensure the availability of all required documents
Step 2 Validate the collected data
Step 3 Interview with the assessees and stakeholders
Step 4 Measure the selected quality attributes
Step 5 Map metrics' values with the capability level
Step 6 Calculate quality attribute's capability level
Step 7 Repeat the steps for other selected quality attributes
Step 8 Calculate the Software Product Maturity Level
Step 9 Fill checklist
100
Step 1: The competent assessor ensures that all required documents that are needed for
the assessment are available.
Step 2: The competent assessor validates the collected data to ensure the data are valid
and consistent.
Step 3: The assessors conduct an interview with the stage’s stakeholders if needed.
The competent assessor in our example finds that all required documents to assess the
project X are available and complete. There is no need to conduct an interview with
this stage’s stakeholders since everything is complete, clear, and consistence.
Step 4: The assessors measure each selected quality attribute independently using the
selected list of metrics for that quality attribute. (Where the quality attributes, metrics,
and the associated thresholds that will be used in this step should be defined in the
product maturity assessment input.)
Step 5: A map is created with each metric that is used to measure a certain quality
attribute with the capability levels based on the compliance of the test value of the
metric with the test threshold that should be defined in the product maturity assessment
input.
Step 6: Calculate the average value of the capability levels from the metrics that are
used to measure the quality attribute; this will be the capability level of that quality
attribute.
Step 7: Repeat steps 4 to 6 for all selected quality attributes in product maturity
assessment input.
Step 8: Calculate the maturity of the product by doing the following:

101
a. Calculate the average weighted capability level by multiplying the average
of capability levels of each quality attribute with its weight (defined in
product maturity assessment input).
b. Summing the results of ‘a’ of all quality attributes
The result of ‘b’ will be the maturity of software product where the product compliance
with quality requirements will be revealed. These steps are applied on the DEV quality
gate. Moving the software product to the next phase (REL) requires the sponsors’ approval
on the results which should be documented and reported as in product maturity assessment
output that will be discussed on the next section. After the sponsors approve the results of
the first quality gate, then the same steps in the product maturity assessment process will
be applied to the REL quality gate. The assessment inputs for REL stage are already defined
in product maturity assessment input.
Step 9: The competent assessors fill the product maturity assessment process checklist
(Table A.5) that can be found in Appendix A for each PMMI stage assessment (DEV and
REL).
Product Maturity Assessment Output
In this section we will discuss documenting the output result from the product maturity
assessment process. Product maturity assessment output phase is the result documenting
and reporting after each phase. The competent assessor is responsible to report the
assessment results in a document to the assessment sponsor that include the following:
1. The assessment input including the set of quality attributes that are used in the
measurement and the focus areas and its scope and objectives. Also the set of

102
metrics with their thresholds (with the associated capability levels) that are used to
measure the selected quality attributes should be included in product maturity
assessment input as well. The identified product maturity levels with their
thresholds should be included in the report.
2. The actual assessment schedule.
3. The results of product maturity assessment process including the capability levels
for all selected quality attributes and the maturity level of the software product for
each PMMI phase.
The competent assessors fill product maturity assessment output checklist (Table A.6) that
can be found in Appendix A for each PMMI stage assessment (DEV and REL).
The assessment results should be documented and reported to the sponsors of the
assessment after the assessment process finishes for each PMMI stage.
Figure 5.4 describes the PMAM steps. The figure shows that the output of the DEV-Stage
will be tested against internal quality attributes at DEV-Stage Assessment phase where the
metrics are executed. Then, the results from the metrics execution will be documented and
reported in the result report phase to the assessment sponsors in order to ensure that the
actual quality test results meet the desired quality results. The sponsors should review and
confirm the final results and take a management decision in order to proceed into the REL
stage. Otherwise, the sponsors should discuss their notes with the competent assessor to
decide the required changes (return it to development team to fix defects which found while
testing specific quality attributes if necessary) and to manage these changes. The
management decision to be taken depends on the degree of the product’s compliance with
the quality requirements and maturity level. Again, the same steps will be repeated for the

103
output of REL-Stage except that the software product will be tested against external quality
attributes in REL-Stage Assessment phase. If the software product meets the sponsors’
expectations, the product will be ready for release. Otherwise, it will go back to the REL-
Stage for improvement.
Figure 5.4 PMAM Steps
DEV
StageDEV-Stage
Assessment
Result
Report
Meet
desired
level?
Product is ready for release
REL
StageREL-Stage
Assessment
Result
Report
Meet
desired
level?
No
Yes
No
Yes
Start
104
PMAM Flexibility
PMAM is flexible where it can be applied to:
All software domains
Different software sizes and complexity such as enterprise applications, embedded-
software systems, and web-services.
Organizations of any size because its focus on the final product (source code) not
on the process, development methodology or techniques that the organization used
to develop the software product (e.g. waterfall, iterative, agile).

105
Chapter 6
Example
The example will be described in details in this chapter to illustrate each step in the PMAM
phases. In this example we will suppose that the manager of an organization wants to assess
a certain project to check if it satisfies the desired capability level for a certain set quality
attributes and if it satisfies the desired maturity level for DEV and REL stages for releasing
the software if it matches the expectations of the manager.
The manager of the organization (sponsor for DEV and REL stage) selects project
X for assessment.
The sponsor selects the competent assessor that will be responsible for assessing
project X.
The sponsor and the competent assessor select the PMMI default focus area scope,
assessors and the stakeholders for DEV and REL stages from the PMMI
recommended list of stakeholders as shown in Table 6.1 and Table 6.2 respectively.
The sponsor ensures that the assessors can access all required documents for the
project to perform the assessment.
Table 6.1 PMMI Stakeholders checklist for DEV stage of project X
Stakeholders Selected
Project Managers & Team Leaders
Requirements Engineers
Solution Designers / Architects
Developers (Coders & Unite Testers)
Integration Teams & Integration Testers

106
Maintenance Teams
IT Security Teams
Table 6.2 PMMI Stakeholders checklist for REL stage of project X
Stakeholders Selected
Product Users
Product Customers
Sales & Marketing Teams
Product Sellers
IT Security Teams
Maintenance Teams
Product Resellers
User Acceptance Teams
Release Teams
The competent assessor and the sponsor decide to use the PMMI
recommended list of quality attributes and to select from the list of quality
attributes that need to be measured in project X as shown in Table 6.3. Since
the objective of DEV-Stage and REL-Stage might be the same, some quality
attributes might be overlapped or related such as the complexity affects the
maintainability [8] in the example.
Table 6.3 PMMI Quality Attribute Checklist
Quality Attribute Selected Stage
Consistency
Efficiency
Maintainability REL
Reliability REL
Testability DEV
Understandability
Usability REL

107
Security
Extensibility
Safety
Completeness
Conciseness
Legibility
Reusability
Modularity
Complexity DEV
The assessment sponsor and the competent assessor identify the weights,
capability levels (PMMI recommended capability levels), and desired
capability level of each quality attribute which are shown in Table 6.4 and
Table 6.5 for DEV and REL respectively. (From Table 6.4 and Table 6.5
we can notice that the summation of quality attributes’ weights for each
phase is 100.) The sponsor and competent assessor also decide to use the
recommended maturity levels that are provided by PMMI. Also they
identified the Product Maturity level for the DEV-Stage and for REL-Stage
which are 2 (PC) and 3 (LC) respectively.
Table 6.4 DEV Quality attributes with their weights
Quality Attribute Weight Desired Capability Level
Testability 30% 2 (PC)
Complexity 70% 2 (PC)
Table 6.5 REL Quality attributes with their weights
Quality Attribute Weight Desired Capability Level
Maintainability 60% 3 (PC)
Usability 80% 4 (FC)
Reliability 20% 3 (LC)

108
The assessors decide to use the PMMI recommended list of metrics with
which to measure the selected quality attributes and to identify threshold for
each one of them. The selected metrics are shown in Table 6.6 for DEV-
Stage and Table 6.7 for REL-Stage.
The sponsor also identifies the required threshold (Test threshold) for each
metric as shown in Table 6.8.
Table 6.6 PMMI Metrics checklist for the identified quality attribute in DEV-Stage
TESTABILITY Metric Name Selected
Testability measurement TM
Complexity Metric Name Selected
Weighted Operation in Module (WOM)
MAXIMUM DIT (MaxDIT) FE
EL
VE
EditedFunctionCC (CC)
Fan-in+ Fan-out (F-(J+O))
ZIP- coefficient of compression (ZCC)
Numberof Children(NOC)
Response For a Class (RFC)
Mean Method Complexity
Number of Trivial Methods
Number of lines of code Number of blocks
Number of temporary variables and method arguments
Number of external assignments
API complexity (methods)
API complexity (constructor)
Number of classes
Number of methods
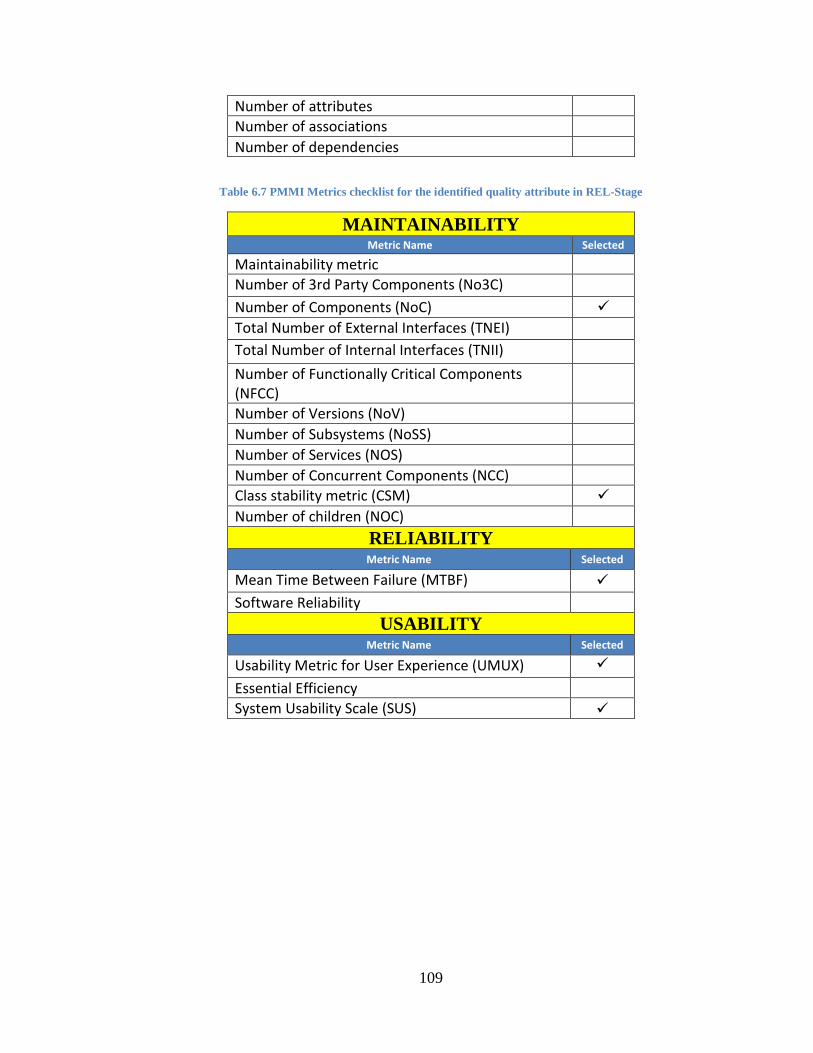
109
Number of attributes
Number of associations
Number of dependencies
Table 6.7 PMMI Metrics checklist for the identified quality attribute in REL-Stage
MAINTAINABILITY Metric Name Selected
Maintainability metric
Number of 3rd Party Components (No3C)
Number of Components (NoC)
Total Number of External Interfaces (TNEI)
Total Number of Internal Interfaces (TNII)
Number of Functionally Critical Components (NFCC)
Number of Versions (NoV)
Number of Subsystems (NoSS)
Number of Services (NOS)
Number of Concurrent Components (NCC)
Class stability metric (CSM)
Number of children (NOC)
RELIABILITY Metric Name Selected
Mean Time Between Failure (MTBF)
Software Reliability
USABILITY Metric Name Selected
Usability Metric for User Experience (UMUX)
Essential Efficiency
System Usability Scale (SUS)

110
Table 6.8 Metrics thresholds and association with capability levels
Test Threshold
Met
ric
Nam
e
Testability Metric (TM) 92
Number of lines of code 11830
Number of trivial methods
721
MAXIMUM DIT 7
Class Stability Metric (CSM)
0.97
Number of Components 842
System Usability Scale (SUS)
8
Usability Metric for User Experience (UMUX)
4
Mean Time Between Failure (MTBF)
450
The sponsor and the competent assessor scheduled the assessment process of
the project X.
The competent assessor ensures that all the assessors and stakeholders are
available during the assessment period.
The competent assessor fills the checklist as shown in Table 6.9 for project X.
Once all steps are completed the sponsors confirm the input of the assessment
before going to the next phase (PMAM) which is the product maturity
assessment output.
Table 6.9 product maturity assessment input checklist for project X
Name: Ahmad Abdellatif
Date: 3/17/2015
Project Name: Project X
Comments
1. Project is selected
2. Competent assessor is selected
3. Assessors are selected

111
4. Focus Area scope and its objectives are defined
5. Typical Products of the phase are selected
6. Dev-Stage’s stakeholders are selected
7. REL-Stage’s stakeholders are selected
8. All required documents can be accessed
9. Identify Quality attribute to measure in DEV-Stage
10. Weights are assigned to all Quality Attribute in DEV-Stage
11. Identify Quality attribute to measure in REL-Stage
12. Weights are assigned to all Quality Attribute in REL-Stage
13. Identify metrics to measure selected quality attribute
14. Identify thresholds for each metrics
15. Assessment process is scheduled
16. Assessors, and stakeholders are available during
assessment period
After the product maturity assessment input is ready, the assessors use the identified
metrics in product maturity assessment input to measure the selected quality
attributes. The selected metrics for each quality attribute on each PMMI stage are
shown in Table 6.10.
Table 6.10 List of metrics of each quality attribute on each PMMI stage
PMMI Stage Quality Attribute Metrics
DEV-Stage
Testability Testability Metric (TM)
Complexity
Number of lines of code
Number of trivial methods
MAXIMUM DIT
REL-Stage
Maintainability
Class Stability Metric
(CSM)
Number of Components
Usability
System Usability Scale
(SUS)
Usability Metric for User
Experience (UMUX)

112
Reliability Mean Time Between
Failure (MTBF)
The results of measurement of each metric in DEV-Stage for project X with the
mapping of each metric value to certain capability level are shown in Table 6.11.
The mapping between the metrics value and the capability level is based on the
thresholds that are defined in the product maturity assessment input. We want to
emphasize that if the metric value is better than the expected value then the test
result compliance will be 100% and the capability level of that metrics will be 4
(FC). On the other hand, if the value is worse than the expected value then the test
result compliance is needed to be calculated to find the capability level of that
metric. The worse value could be higher or lower than the expected value, this
depends on the metric itself.
Table 6.11 Metric value associated with each capability level for DEV-Stage
Quality
Attribute
Metric
Nu
mb
er
Metrics Test
Threshold
Test
value
Test Result
Compliance
Cap
ab
ility
Lev
el
Testability Metric
1
Testability
Metric (TM) 92 77 83% 3
Complexity
Metric
1
Number of
lines of code 11830 10529 89% 3
Metric
2
Number of
trivial
methods 721 700 97% 4
Metric
3
MAXIMUM
DIT 7 1 14% 1

113
The assessors perform the measurement across all identified quality attributes,
they can now calculate the average weighted capability level of each identified
quality attribute in DEV-Stage and the Maturity Level of the product can be
found by summing the average weighted capability level as shown in
Table 6.12.
Table 6.12 Assessment Results of DEV-Stage
Quality
Attribute
Metric1
Cap
ability
Lev
el
Metric2
Cap
ability
Lev
el
Metric3
Cap
ability
Lev
el
Average
Quality
Attribute
Capability
Level
Quality
Attribute
Capability
Level
Quality
Attribute
Weight
Average
Weighted
capability
level
Testability 3 NA NA 3 3 30% 0.9
Complexity 3 4 1 2.66 2 70% 1.86
TOTAL 2.76
Product Maturity Level 2
We notice that all the selected quality attributes satisfy the desired capability levels in
the project X, also the actual maturity level of the product in DEV-Stage satisfies the
desired maturity level of project X which is level 2 (PC).
The competent assessors for the project X filled the product maturity
assessment process checklist for DEV-Stage assessment as shown in
Table 6.13. The results should be documented and reported to the assessment
sponsors based on the product maturity assessment output phase.
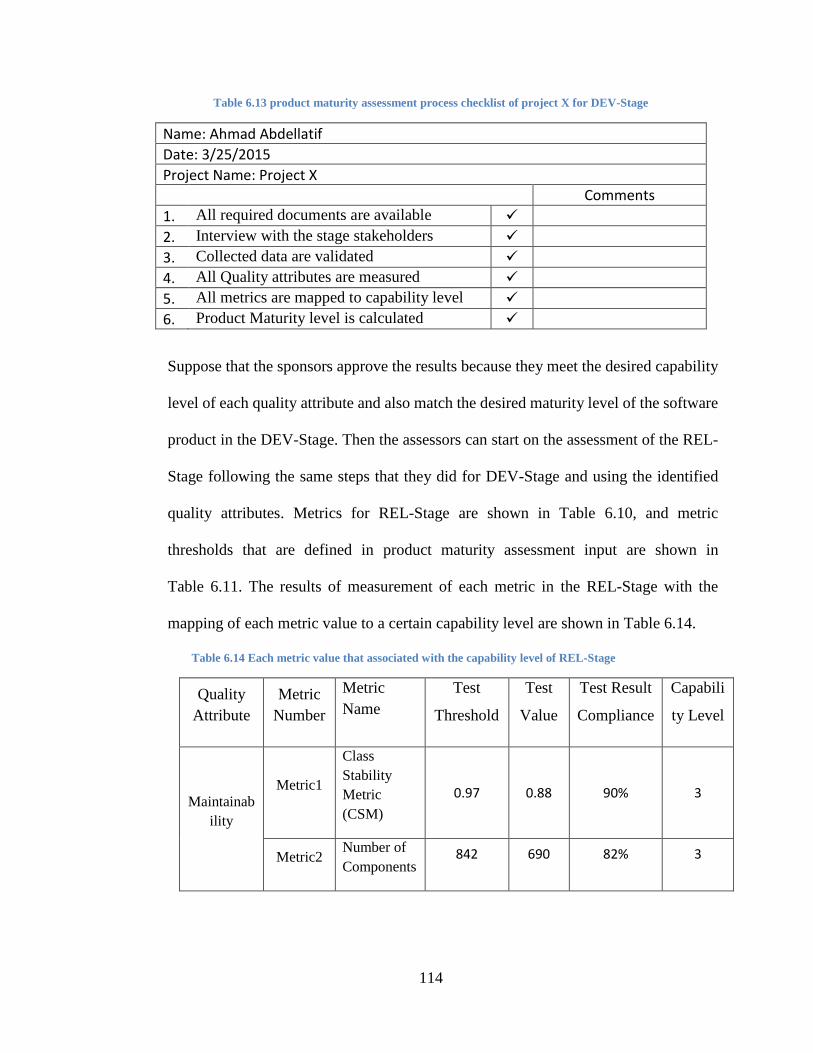
114
Table 6.13 product maturity assessment process checklist of project X for DEV-Stage
Name: Ahmad Abdellatif
Date: 3/25/2015
Project Name: Project X
Comments
1. All required documents are available
2. Interview with the stage stakeholders
3. Collected data are validated
4. All Quality attributes are measured
5. All metrics are mapped to capability level
6. Product Maturity level is calculated
Suppose that the sponsors approve the results because they meet the desired capability
level of each quality attribute and also match the desired maturity level of the software
product in the DEV-Stage. Then the assessors can start on the assessment of the REL-
Stage following the same steps that they did for DEV-Stage and using the identified
quality attributes. Metrics for REL-Stage are shown in Table 6.10, and metric
thresholds that are defined in product maturity assessment input are shown in
Table 6.11. The results of measurement of each metric in the REL-Stage with the
mapping of each metric value to a certain capability level are shown in Table 6.14.
Table 6.14 Each metric value that associated with the capability level of REL-Stage
Quality
Attribute
Metric
Number
Metric
Name
Test
Threshold
Test
Value
Test Result
Compliance
Capabili
ty Level
Maintainab
ility
Metric1
Class
Stability
Metric
(CSM)
0.97 0.88 90% 3
Metric2 Number of
Components 842 690 82% 3
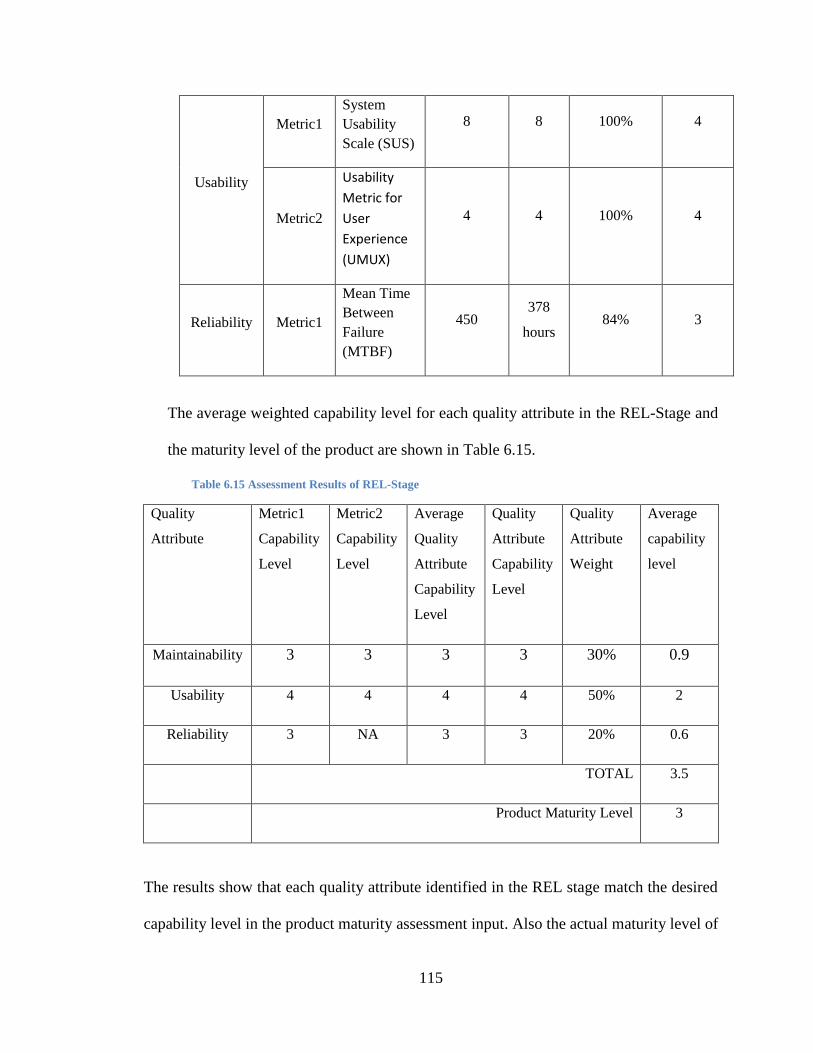
115
Usability
Metric1
System
Usability
Scale (SUS)
8 8 100% 4
Metric2
Usability
Metric for
User
Experience
(UMUX)
4 4 100% 4
Reliability Metric1
Mean Time
Between
Failure
(MTBF)
450 378
hours 84% 3
The average weighted capability level for each quality attribute in the REL-Stage and
the maturity level of the product are shown in Table 6.15.
Table 6.15 Assessment Results of REL-Stage
Quality
Attribute
Metric1
Capability
Level
Metric2
Capability
Level
Average
Quality
Attribute
Capability
Level
Quality
Attribute
Capability
Level
Quality
Attribute
Weight
Average
capability
level
Maintainability 3 3 3 3 30% 0.9
Usability 4 4 4 4 50% 2
Reliability 3 NA 3 3 20% 0.6
TOTAL 3.5
Product Maturity Level 3
The results show that each quality attribute identified in the REL stage match the desired
capability level in the product maturity assessment input. Also the actual maturity level of

116
the product in the REL-Stage meets the desired maturity level that is defined in product
maturity assessment input. The competent assessor fills in the product maturity assessment
process checklist for the REL-Stage as shown in Table 6.16. The results documentation
and reporting will be discussed in the next section.
Table 6.16 product maturity assessment process checklist of project X for REL-Stage
Name: Ahmad Abdellatif
Date: 4/7/2015
Project Name: Project X
Comments
1. All required documents are available
2. Interview with the stage stakeholders
3. Collected data are validated
4. All Quality attributes are measured
5. All metrics are mapped to capability level
6. Product Maturity level is calculated
The competent assessor also fills the product maturity assessment output checklist for DEV
and REL stages after each product maturity assessment process of these stages is finished
as shown in Table 6.17 and Table 6.18 respectively. The sponsor approves the final results
of the REL stages because the actual capability and maturity level matches the desired
capability and maturity levels. So the product is ready for release.
Table 6.17 PRODUCT MATURITY ASSESSMENT OUTPUT checklist for DEV-Stage in Project X
Name: Ahmad Abdellatif
Date: 3/27/2015
Project Name: Project X
Comments
1. All assessment input is available
2. The list of stakeholders is available
3. The list of assessors is available
4 All required documents that used are mentioned
5 Actual schedule assessment
6. Results of product maturity assessment process

117
7. Product Maturity level
Table 6.18 PRODUCT MATURITY ASSESSMENT OUTPUT checklist for REL-Stage in Project X
Name: Ahmad Abdellatif
Date: 4/8/2015
Project Name: Project X
Comments
1. All assessment input is available
2. The list of stakeholders is available
3. The list of assessors is available
4 All required documents that used are mentioned
5 Actual schedule assessment
6. Results of product maturity assessment process
7. Product Maturity level
Discussion
In the example, a set of quality attributes were selected by the assessment sponsor to be
measured for DEV-Stage and REL-Stage. Some of these quality attributes are related like
complexity and maintainability [8]. Firstly, the assessor evaluated the output of DEV-Stage
(development and unit testing) by executing the selected metrics to measure the identified
quality attributes (internal quality attributes) at the DEV-Stage. The assessors found that
the actual results of the assessment met the desired results that are identified by the
assessment sponsor where the capability levels for all quality attributes (PC) matched the
desired capability level (PC). Also, the desired maturity level (PC) met the actual maturity
level (PC) of the software product. Since the results met the expectations and there is no
need to return the software product back to DEV-Stage for improvement, the assessment
sponsor accepted to move the software product to REL-Stage. Again, the assessors
evaluated the software product after REL-Stage (integration and acceptance tests) by

118
executing the selected metrics to measure the identified quality attributes (external quality
attributes) at the REL-Stage. The assessors found that the software product matched the
desired capability levels for the identified quality attributes in REL-Stage, also the maturity
level of the software product. Since the actual quality results matched the desired results,
the product is ready for release.
Threats to Validity
There are a number of threats that may affect the validity of the proposed framework. The
first threat is that the thresholds of PMMI maturity and capability levels are based on expert
judgment. However, we mitigate this threat by providing the flexibility to the assessment
sponsor and assessors to modify these thresholds. Another threat to validity is that the
recommended list of stakeholders, quality attributes, and metrics might not be a
comprehensive list. However, this threat can be neutralized by giving the flexibility to the
assessment sponsor and assessors to select their own lists of stakeholders, quality attributes,
metrics, capability and maturity levels thresholds. A third threat is that the proposed
framework has not been validated in an industrial settings. However, we plan to validate
the framework by evaluating a software which is developed by a CMMI certified company
and compare the results from the framework with the CMMI maturity of the software.

119
Chapter 7
CONCLUSION AND FUTURE WORK
In this thesis, we have proposed a Product Maturity Model framework to measure the
quality of the software product. PMMI gives the ability to measure the maturity of a
software product of any size in all software domains. The proposed framework does not
depend on measurement of the software development process (e.g. waterfall, agile, etc.).
PMMI has two focus areas (DEV and REL stage) to measure the internal and external
quality attributes of the software. For each focus area there is a recommended list of
stakeholders, quality attributes, metrics, which can be used by the assessors to evaluate the
software product. PMMI measures the level of the product compliance with the stakeholder
quality requirements by measuring the capability and maturity level of the software
product. There are four capability levels and four product maturity levels which are
recommended to be used by the assessors in the evaluation of software products. PMMI
gives the flexibility to the assessors to define their stakeholders, quality attributes, and
metrics to measure the quality attributes, thresholds, capability and maturity levels. And
all of these are defined based on the size and domain of the software product. We provided
an assessment method called Product Maturity Assessment Method (PMAM). PMAM is
complement with ISO 15504-3 to make the assessment results reliable, repeatable, and
representative. PMAM provides a guideline and checklist for evaluation the quality of the
software product based on the PMMI. There are three phases in PMAM which are:

120
1. Product Maturity Assessment Input.
2. Product Maturity Assessment Processes.
3. Product Maturity Assessment Output.
Each phase compromises a set of steps that need to be followed by the assessor to measure
the quality of the software product. Also the reporting and documenting of the assessment
results are discussed in PMAM.
7.1 Future work
Validation of the T-CMMI framework on real software applications is under consideration
for future work. In addition, we plan to apply PMMI and PMAM to different software
domains such as: embedded systems and enterprise applications. Work will also be done
to validate the relationship between PMMI and CMMI frameworks.

121
References
[1] ISO/IEC, "15504-2: Information Technology - Process Assessment - Part 2 - A
reference model for processes and process capability No. 15504-2," 2003.
[2] E. van Veenendaal and J. McMullan, Achieving software product quality: UTN
Publishers, 1997.
[3] M. O. D. a. T. P. Allan Baktoft Jakobsen, "Towards a maturity model for software
product evaluations," in Proceedings of 10th european conference on software cost
estimation (ESCOM’99), 1999.
[4] R. E. A. Al-Qutaish, Alain;, "A maturity model of software product quality,"
Journal of Research and Practice in Information Technology, vol. 43, pp. 307-327, 2011.
[5] A. Alvaro, E. S. d. Almeida, and S. L. Meira, "Towards a Software Component
Certification Framework," presented at the Proceedings of the Seventh International
Conference on Quality Software, 2007.
[6] A. April and F. Coallier, "Trillium: a model for the assessment of telecom
software system development and maintenance capability," in Software Engineering
Standards Symposium, 1995. (ISESS'95) 'Experience and Practice', Proceedings., Second
IEEE International, 1995, pp. 175-183.
[7] C. P. Team, "CMMI® for Development, Version 1.3," CMU/SEI-2010-TR-
0332010.
[8] F. B. Abreu, M. Goulão, and R. Esteves, "Toward the design quality evaluation of
object-oriented software systems," in Proceedings of the 5th International Conference on
Software Quality, Austin, Texas, USA, 1995, pp. 44-57.
[9] T. Maibaum and A. Wassyng, "A product-focused approach to software
certification," Computer, vol. 41, pp. 91-93, 2008.
[10] A. C. Gillies. (1997). Software Quality (2nd).
[11] R. S. PRESSMAN. (2004). Software engineering: A practitioner’s approach.
[12] I. I.-I. technology, "Software product evaluation - Part 1," 1999.
[13] IEEE, "Standard Glossary of Software Engineering Terminology. New York, NY,
USA, Institute of Electrical and Electronics Engineers.," 1990.

122
[14] D. A. Garvin, What Does “Product Quality” Really Mean?: sloan management
review, 4., 1984.
[15] I. Sommerville, Software Engineering. UK: Addison-Wesley, 2007.
[16] M. S. a. M. Niazi, "Systematic review of organizational motivations for adopting
CMM-based SPI," Information and Software Technology Journal, vol. 50, pp. 605-620,
2008.
[17] B. Pitterman, "Telcordia Technologies: The journey to high maturity,," IEEE
Software, vol. 17, pp. 89-96, 2000.
[18] G. Yamamura, "Software process satisfied employees," IEEE Software, pp. 83-
85, 1999.
[19] N. Ashrafi, "The impact of software process improvement on quality: in theory
and practice," Information & Management, vol. 40, pp. 677-690, 2003.
[20] G. K. James J. Jianga, Hsin-Ginn Hwang, Jack Huang, and Shin-Yuan Hung, "An
exploration of the relationship between software development process maturity and
project performance," Information & Management, pp. 279-288, 2004.
[21] M. D. a. J. Sligo. (1997, How Software Process Improvement Helped Motorola.
14, 75-81.
[22] J. H. a. D. Goldenson, "A systematic survey of CMM experience and results,"
presented at the 18th international conference on software engineering (ICSE-18), Berlin,
Germany, 1996.
[23] J. A. McCall, P. K. Richards, and G. F. Walters, "Factors in software quality.
volume i. concepts and definitions of software quality," DTIC Document1977.
[24] B. W. Boehm, J. R. Brown, and M. Lipow, "Quantitative evaluation of software
quality," in Proceedings of the 2nd international conference on Software engineering,
1976, pp. 592-605.
[25] R. G. Dromey, "A model for software product quality," Software Engineering,
IEEE Transactions on, vol. 21, pp. 146-162, 1995.
[26] I. O. f. S. (ISO), "ISO/IEC IS 9126: Software Product Evaluation - Quality
Characteristics and Guidelines for their Use," 1991.
[27] I. Samoladas, G. Gousios, D. Spinellis, and I. Stamelos, "The SQO-OSS quality
model: measurement based open source software evaluation," in Open source
development, communities and quality, ed: Springer, 2008, pp. 237-248.

123
[28] V. R. Basili, G. Caldiera, and H. D. Rombach, "The Goal Question Metric
Approach, Chapter in Encyclopedia of Software Engineering," ed: Wiley, 1994.
[29] L. Olsina, R. Sassano, and L. Mich, "Towards the Quality of Web 2.0
Applications," in 8th International Workshop on Web Oriented Software Technology
(IWWOST2009), 2009.
[30] D. Franke, S. Kowalewski, and C. Weise, "A mobile software quality model," in
Quality Software (QSIC), 2012 12th International Conference on, 2012, pp. 154-157.
[31] S. Zahra, A. Khalid, and A. Javed, "An Efficient and Effective New Generation
Objective Quality Model for Mobile Applications," International Journal of Modern
Education and Computer Science (IJMECS), vol. 5, p. 36, 2013.
[32] M. Lepmets, "Which Process Model Practices Support Project Success? ,"
presented at the 17th European Conference, EuroSPI 2010, , 2010.
[33] M. N. Mark Staples, Ross Jeffery, Alan Abrahams, and a. R. M. Paul Byatt, "An
exploratory study of why organizations do not adopt CMMI," The Journal of Systems and
Software, vol. 80, pp. 883-895, 2007.
[34] S. Zahran. (1999). Software process improvement: practical guidelines for
business success.
[35] C. V. W. Mark C. Paulk, Bill Curtis, and Mary Beth Chrissis. (1994). The
Capability Maturity Model: Guidelines for Improving the Software Process. California,
US.
[36] SEI. (2008). Process Maturity Profiles. Available:
http://www.sei.cmu.edu/appraisal-program/profile/pdf/CMMI/2008MarCMMI.pdf
[37] W. S. Humphrey. (1995). A Discipline for Software Engineering.
[38] D. F. Rico. (1997, 6-10-2014). Software Process Improvement (Impacting the
Bottom Line by using Powerful “Solutions”). Available:
http://davidfrico.com/spipaperpdf.htm
[39] G. O'Regan. (2010). Introduction to software process improvement.
[40] C. Institute. (14-10-2014). CMMI Overview. Available:
http://cmmiinstitute.com/cmmi-overview/
[41] C. Institute, "What is CMMI?."
[42] C. Institute. (14-10-2014). CMMI Process Areas. Available:
http://cmmiinstitute.com/cmmi-overview/cmmi-process-areas/

124
[43] J. Persse, Project Management Success with CMMI: Seven CMMI Process Areas:
Prentice Hall, 2007.
[44] I. I. 15504, "Information technology - Software process assessment," Type 21998.
[45] I. S. Organization. ISO-9000. Available: http://www.iso.org/iso/iso_9000
[46] D. Ince. (1994). ISO 9001 and software quality assurance.
[47] I. S. Organization. (11-10-2014). ISO 9000-3:1991. Available:
http://www.iso.org/iso/home/store/catalogue_ics/catalogue_detail_ics.htm?csnumber=16
532
[48] M. Martínez-Costa, T. Y. Choi, J. A. Martínez, and A. R. Martínez-Lorente, "ISO
9000/1994, ISO 9001/2000 and TQM: The performance debate revisited," Journal of
Operations Management, vol. 27, pp. 495-511, 12// 2009.
[49] P. Kuvaja, "BOOTSTRAP 3.0 - A SPICE Conformant Software Process
Assessment Methodology," Software Quality Control, vol. 8, pp. 7-19, 1999.
[50] A. April, J. Huffman Hayes, A. Abran, and R. Dumke, "Software Maintenance
Maturity Model (SMmm): the software maintenance process model," Journal of Software
Maintenance and Evolution: Research and Practice, vol. 17, pp. 197-223, 2005.
[51] A. Alvaro, E. S. de Almeida, and S. L. Meira, "A Software Component Maturity
Model (SCMM)," in Software Engineering and Advanced Applications, 2007. 33rd
EUROMICRO Conference on, 2007, pp. 83-92.
[52] B. Golden. (2005). Succeeding with open source.
[53] P. Heck, M. Klabbers, and M. van Eekelen, "A software product certification
model," Software Quality Journal, vol. 18, pp. 37-55, 2010/03/01 2010.
[54] P. M. Heck, "A Software Product Certification Model for Dependable Systems "
Eindhoven: Technische Universiteit Eindhoven2006.
[55] J. Voas, "Developing a usage-based software certification process," Computer,
vol. 33, pp. 32-37, 2000.
[56] J. Morris, G. Lee, K. Parker, G. A. Bundell, and C. P. Lam, "Software component
certification," Computer, vol. 34, pp. 30-36, 2001.
[57] J. P. Correia and J. Visser, "Certification of technical quality of software
products," in Proc. of the Int’l Workshop on Foundations and Techniques for Open
Source Software Certification, 2008, pp. 35-51.

125
[58] R. Baggen, J. P. Correia, K. Schill, and J. Visser, "Standardized code quality
benchmarking for improving software maintainability," Software Quality Journal, vol.
20, pp. 287-307, 2012.
[59] I. O. f. S. I. I. 9126-1, "Software engineering - product quality - part 1: Quality
model."
[60] J. P. Correia, Y. Kanellopoulos, and J. Visser, "A survey-based study of the
mapping of system properties to iso/iec 9126 maintainability characteristics," in Software
Maintenance, 2009. ICSM 2009. IEEE International Conference on, 2009, pp. 61-70.
[61] B. Luijten and J. Visser, "Faster defect resolution with higher technical quality of
software," Delft University of Technology, Software Engineering Research Group 1872-
5392, 2010.
[62] J. P. Correia and J. Visser, "Benchmarking technical quality of software
products," in Reverse Engineering, 2008. WCRE'08. 15th Working Conference on, 2008,
pp. 297-300.
[63] J. H. Yahaya, A. Deraman, and A. R. Hamdan, "SCfM_PROD: A software
product certification model," in Information and Communication Technologies: From
Theory to Applications, 2008. ICTTA 2008. 3rd International Conference on, 2008, pp. 1-
6.
[64] M. van Steenbergen, R. Bos, S. Brinkkemper, I. van de Weerd, and W. Bekkers,
"The design of focus area maturity models," in Global perspectives on design science
research, ed: Springer, 2010, pp. 317-332.
[65] M. van Steenbergen, M. van den Berg, and S. Brinkkemper, "A balanced
approach to developing the enterprise architecture practice," in Enterprise Information
Systems, ed: Springer, 2008, pp. 240-253.
[66] D. Steidl, B. Hummel, and E. Juergens, "Quality analysis of source code
comments," in Program Comprehension (ICPC), 2013 IEEE 21st International
Conference on, 2013, pp. 83-92.
[67] M. A. Boxall and S. Araban, "Interface metrics for reusability analysis of
components," in Software Engineering Conference, 2004. Proceedings. 2004 Australian,
2004, pp. 40-51.
[68] J. B. Dundas, "Understanding Code Patterns Analysis, Interpretation and
Measurement," in Computer and Electrical Engineering, 2008. ICCEE 2008.
International Conference on, 2008, pp. 150-154.

126
[69] Y. Yuan, "Efficiency metrics model for component-based embedded application
software," in Embedded Software and Systems, 2005. Second International Conference
on, 2005, p. 7 pp.
[70] M. Becucci, A. Fantechi, M. Giromini, and E. Spinicci, "A comparison between
handwritten and automatic generation of C code from SDL using static analysis,"
Software: Practice and Experience, vol. 35, pp. 1317-1347, 2005.
[71] N. Tagoug, "Maintainability assessment in object-oriented system design," in
Information Technology and e-Services (ICITeS), 2012 International Conference on,
2012, pp. 1-5.
[72] S. Kalyanasundaram, K. Ponnambalam, A. Singh, B. Stacey, and R. Munikoti,
"Metrics for software architecture: a case study in the telecommunication domain," in
Electrical and Computer Engineering, 1998. IEEE Canadian Conference on, 1998, pp.
715-718.
[73] M. Alshayeb, M. Naji, M. O. Elish, and J. Al-Ghamdi, "Towards measuring
object-oriented class stability," Software, IET, vol. 5, pp. 415-424, 2011.
[74] S. R. Chidamber and C. F. Kemerer, Towards a metrics suite for object oriented
design vol. 26: ACM, 1991.
[75] K. Kim and C. Wu, "A software reliability model in the embedded system," in
Software Testing, Reliability and Quality Assurance, 1994. Conference Proceedings.,
First International Conference on, 1994, pp. 59-63.
[76] S. Yamada, K. Tokuno, and Y. Kasano, "Quantitative assessment models for
software safety/reliability," Electronics and Communications in Japan (Part II:
Electronics), vol. 81, pp. 33-43, 1998.
[77] S.-T. Lai and C.-C. Yang, "A software metric combination model for software
reuse," in Software Engineering Conference, 1998. Proceedings. 1998 Asia Pacific,
1998, pp. 70-77.
[78] H. Washizaki, H. Yamamoto, and Y. Fukazawa, "A metrics suite for measuring
reusability of software components," in Software Metrics Symposium, 2003. Proceedings.
Ninth International, 2003, pp. 211-223.
[79] J. K. Chhabra, K. Aggarwal, and Y. Singh, "Code and data spatial complexity:
two important software understandability measures," Information and software
Technology, vol. 45, pp. 539-546, 2003.
[80] K. Finstad, "The usability metric for user experience," Interacting with
Computers, vol. 22, pp. 323-327, 2010.

127
[81] V. Penichet, C. Calero, M. D. Lozano, and M. Piattini, "using WQM For
Classifying Usability Metrics," in Proceedings of the IADIS International Conference
WWW/Internet, 2006.
[82] J. Brooke, "SUS-A quick and dirty usability scale," Usability evaluation in
industry, vol. 189, pp. 4-7, 1996.
[83] I. Chowdhury, B. Chan, and M. Zulkernine, "Security metrics for source code
structures," in Proceedings of the fourth international workshop on Software engineering
for secure systems, 2008, pp. 57-64.
[84] J. Walden, M. Doyle, G. A. Welch, and M. Whelan, "Security of open source web
applications," in Proceedings of the 2009 3rd international Symposium on Empirical
Software Engineering and Measurement, 2009, pp. 545-553.
[85] B. Alshammari, C. Fidge, and D. Corney, "Security metrics for object-oriented
designs," in Software Engineering Conference (ASWEC), 2010 21st Australian, 2010, pp.
55-64.
[86] E. A. de Oliveira Junior, I. Gimenes, and J. Maldonado, "A metric suite to support
software product line architecture evaluation," in XXXIV Conferencia Latinaoamericana
de Informatica (CLEI 2008), 2008, pp. 489-498.
[87] S. Sarkar, A. C. Kak, and G. M. Rama, "Metrics for measuring the quality of
modularization of large-scale object-oriented software," Software Engineering, IEEE
Transactions on, vol. 34, pp. 700-720, 2008.
[88] S. Sehestedt, C.-H. Cheng, and E. Bouwers, "Towards quantitative metrics for
architecture models," in WICSA Companion, 2014, p. 5.
[89] Y. Higo, T. Kamiya, S. Kusumoto, and K. Inoue, "Method and implementation
for investigating code clones in a software system," Information and Software
Technology, vol. 49, pp. 985-998, 2007.
[90] M. F. Bertoa, J. M. Troya, and A. Vallecillo, "Measuring the usability of software
components," Journal of Systems and Software, vol. 79, pp. 427-439, 2006.
[91] L. C. Briand, S. Morasca, and V. R. Basili, "Defining and validating measures for
object-based high-level design," Software Engineering, IEEE Transactions on, vol. 25,
pp. 722-743, 1999.
[92] K. Liu, S. Zhou, and H. Yang, "Quality metrics of object oriented design for
software development and re-development," in Quality Software, 2000. Proceedings.
First Asia-Pacific Conference on, 2000, pp. 127-135.

128
[93] G. Makkar, J. K. Chhabra, and R. K. Challa, "Object oriented inheritance metric-
reusability perspective," in Computing, Electronics and Electrical Technologies
(ICCEET), 2012 International Conference on, 2012, pp. 852-859.
[94] P. Bhattacharya, M. Iliofotou, I. Neamtiu, and M. Faloutsos, "Graph-based
analysis and prediction for software evolution," in Proceedings of the 34th International
Conference on Software Engineering, 2012, pp. 419-429.
[95] S. Sarkar, A. C. Kak, and N. Nagaraja, "Metrics for analyzing module interactions
in large software systems," in Software Engineering Conference, 2005. APSEC'05. 12th
Asia-Pacific, 2005, p. 8 pp.
[96] C. Babu and R. Vijayalakshmi, "Metrics-based design selection tool for aspect
oriented software development," ACM SIGSOFT Software Engineering Notes, vol. 33, p.
4, 2008.
[97] M. Genero, M. Piattini, and C. Calero, "Empirical validation of class diagram
metrics," in Empirical Software Engineering, 2002. Proceedings. 2002 International
Symposium n, 2002, pp. 195-203.
[98] X. Liu, "An Empirical Study of Source Level Complexity," in Computational and
Information Sciences (ICCIS), 2013 Fifth International Conference on, 2013, pp. 1991-
1994.
[99] R. G. Kula, K. Fushida, N. Yoshida, and H. Iida, "Experimental Study of
Quantitative Analysis of Maintenance Effort using Program Slicing-based Metrics," in
Software Engineering Conference (APSEC), 2012 19th Asia-Pacific, 2012, pp. 50-57.
[100] S. Sarala and P. A. Jabbar, "Information flow metrics and complexity
measurement," in Computer Science and Information Technology (ICCSIT), 2010 3rd
IEEE International Conference on, 2010, pp. 575-578.
[101] O. Panchenko, S. H. Mueller, and A. Zeier, "Measuring the quality of interfaces
using source code entropy," in Industrial Engineering and Engineering Management,
2009. IE&EM'09. 16th International Conference on, 2009, pp. 1108-1111.
[102] J. Michura and M. A. Capretz, "Metrics suite for class complexity," in
Information Technology: Coding and Computing, 2005. ITCC 2005. International
Conference on, 2005, pp. 404-409.
[103] S. L. Burbeck, "Real-time complexity metrics for Smalltalk methods," IBM
Systems Journal, vol. 35, pp. 204-226, 1996.
[104] M. Genero Bocco, D. L. Moody, and M. Piattini, "Assessing the capability of
internal metrics as early indicators of maintenance effort through experimentation,"

129
Journal of software maintenance and evolution: Research and practice, vol. 17, pp. 225-
246, 2005.
[105] ISO/IEC, "15504-3: Information Technology - Process Assessment - Part 3 -
Guidance on Performing an Assessment No. 15504-3," 2004.

130
Appendix A
Table A.1 PMMI DEV-Stage Stakeholders Checklist
Stakeholders Selected
Project Managers & Team Leaders Requirements Engineers
Solution Designers / Architects
Developers (Coders & Unite Testers)
Integration Teams & Integration Testers
Maintenance Teams
IT Security Teams
Table A.2 PMMI REL-Stage Stakeholders Checklist
Stakeholders Selected
Product Users
Product Customers
Sales & Marketing Teams
Product Sellers
IT Security Teams
Maintenance Teams
Product Resellers
User Acceptance Teams
Release Teams
Table A.3 PMMI Quality Attribute Checklist
Quality Attribute Selected Stage
Consistency
Efficiency
Maintainability
Reliability
Testability
Understandability

131
Usability
Security
Extensibility
Safety
Completeness
Conciseness
Legibility
Reusability
Modularity
Complexity
Table A.4 product maturity assessment input checklist
Name:
Date:
Project Name:
Comments
1. Project is selected
2. Competent assessor is selected
3. Assessors are selected
4. Focus Area scope and its objectives are defined
5. Typical Products of the phase are selected
6. Dev-Stage’s stakeholders are selected
7. REL-Stage’s stakeholders are selected
8. All required documents can be accessed
9. Identify Quality attribute to measure in DEV-Stage
10. Weights are assigned to all Quality Attribute in DEV-Stage
11. Identify Quality attribute to measure in REL-Stage
12. Weights are assigned to all Quality Attribute in REL-Stage
13. Identify metrics to measure selected quality attribute
14. Identify thresholds for each metrics
15. Assessment process is scheduled
16. Assessors and stakeholders are available during assessment
period
=OK =Action needed

132
Table A.5 product maturity assessment process checklist for DEV and REL Stages
Name:
Date:
Project Name:
Comments
1. All required documents are available
2. Interview with the stage stakeholders
3. Collected data are validated
4. All Quality attributes are measured
5. All metrics are mapped to capability level
6. Product Maturity level is calculated
=OK =Action needed
Table A.6 PRODUCT MATURITY ASSESSMENT OUTPUT checklist for DEV and REL Stages
Name:
Date:
Project Name:
Comments
1. All assessment input is available
2. The list of stakeholders is available
3. The list of assessors is available
4. All required documents that used are mentioned
5. Actual schedule assessment
6. Results of product maturity assessment process
7. Product Maturity level =OK =Action needed

133
Vitae
Name :Ahmad Hazzaa Khader Abdellatif
Nationality :Jordanian
Date of Birth :11/12/1987
Email :[email protected]
Address :Tulkarem - Palestine
Academic Background :
Ahmad Abdellatif earned his Bachelors of Engineering degree in Computer
Engineering from An-Najah National University, Nablus, Palestine in May 2010.
His research interests include software metrics, software development, quality
models, and maturity models.


![2015 - eprints.kfupm.edu.saeprints.kfupm.edu.sa/139874/1/MSc_Thesis_Report_Yasin_Jemal_Yasin... · Full Name : [Yasin Jemal Yasin] Thesis Title : [GIS application and environmental](https://static.fdocuments.us/doc/165x107/5cabaee188c99320248cfa4e/2015-full-name-yasin-jemal-yasin-thesis-title-gis-application-and-environmental.jpg)