2015 - South Dakota Department of Health - DOH · South Dakota Health Care Workforce Needs...
44
2015 Healthcare Workforce Report
-
Upload
hoangkhanh -
Category
Documents
-
view
215 -
download
0
Transcript of 2015 - South Dakota Department of Health - DOH · South Dakota Health Care Workforce Needs...

2015 Healthcare Workforce Report

Table of Contents
Background ........................................................................................................ 1 Employment in South Dakota’s Health Care Industry ......................................... 2 Educational Supply ............................................................................................ 8 Profiles for Individual Occupations
Athletic Trainers .................................................................................... 13 Audiologists .......................................................................................... 14 Certified Nurse Practitioners (CNPs) ..................................................... 15 Chiropractors ........................................................................................ 16 Dental Assistants .................................................................................. 17 Dental Hygienists .................................................................................. 18 Dentists ................................................................................................. 19 Dietitians and Nutritionists ..................................................................... 20 Emergency Medical Technicians (EMTs) and Paramedics .................... 21 Health Information Administrators ......................................................... 23 Licensed Practical Nurses (LPNs) ......................................................... 24 Massage Therapists .............................................................................. 25 Medical and Clinical Laboratory Technicians ........................................ 26 Medical and Clinical Laboratory Technologists ..................................... 26 Medical Assistants ................................................................................ 27 Medical Records and Health Information Technicians ........................... 28 Nurse Anesthetists (CRNAs) ................................................................. 29 Occupational Therapists ....................................................................... 30 Occupational Therapist Assistants ........................................................ 31 Optometrists ......................................................................................... 32 Pharmacists .......................................................................................... 33 Pharmacy Technicians .......................................................................... 34 Physical Therapist Assistants................................................................ 35 Physical Therapists ............................................................................... 36 Physician Assistants ............................................................................. 37 Physicians............................................................................................. 38 Radiology
Radiologic Technologists and Technicians .................................... 39 Medical Radiologic Technology/Science-Radiation Therapists ...... 39
Registered Nurses (RNs) ...................................................................... 40 Respiratory Therapists .......................................................................... 41 Speech-Language Pathologists ............................................................ 42

South Dakota Health Care Workforce Needs Assessment 2015 Page 1
Background
Recognizing the importance of a highly trained and available healthcare workforce, the South Dakota Department of Health established the Healthcare Workforce Center to help address the healthcare workforce needs of the State. The purpose of the Center is to function as a clearinghouse for healthcare workforce-related data and information. The Center is also designed to develop and implement programs and projects that assist individuals, agencies and facilities in their efforts to ensure a competent and qualified healthcare workforce to meet the health needs of all South Dakota residents.
Based on population and employment statistics, projections indicate that thousands of healthcare workers will be needed in the healthcare industry in the next decade. This profile of healthcare professions serves as an aid in planning for the healthcare workforce needs in the future. The report draws upon labor statistics, educational preparation data, and current health professions’ licensing registries. The report profiles the healthcare workforce projected needs in the future and workforce distribution by geography, age, and profession. The report is designed to be used by policy-makers in the development and coordination of healthcare education and recruitment programs to meet the healthcare workforce needs of the future.
For more information contact the Healthcare Workforce Center at the Department of
Health at (605) 773-3361.

South Dakota Health Care Workforce Needs Assessment 2015 Page 2
Employment in South Dakota’s Healthcare Industry
South Dakota’s healthcare industry has experienced substantial and steady growth since 1972 when record keeping began. Growth of the healthcare industry is projected to continue for the foreseeable future and is projected to be one of South Dakota’s largest growth industries over the next decade. The industry’s demand for workers is driven in part by:
an aging patient population;
an expanding general population;
technological advances in the workplace requiring additional staff;
a growing emphasis on disease management; and
an aging healthcare workforce who must be replaced as they retire.
The number of workers (covered by unemployment insurance) in South Dakota’s healthcare industry increased by 83.4 percent from 1990 to 2013, as shown in Figure 1 below.
Figure 1: Growth in Number of Healthcare Covered Workers from 1990 to 2013
Source: Labor Market Information Center, South Dakota Department of Labor and Regulation [Covered workers includes Ambulatory Health Care Services, Hospitals and Nursing/Residential Care Facilities]
Healthcare occupations that provide direct health care services are among the fastest growing professions in South Dakota and are projected to make up approximately 14% of the state’s projected new jobs between 2012 and 2022.
There are many ways to analyze the demand for an occupation. Characteristics of demand include how fast an occupation is projected to grow, how many total job openings are projected through industry growth and the need to replace retiring workers. All of these factors can help evaluate whether an occupation is expected to encounter shortages, but no factor tells the entire story alone.
The South Dakota Department of Labor and Regulation (see Table 1) projections of health occupation needs in the future are consistent with the needs of an aging population.
32,013
42,473
51,579
0
10,000
20,000
30,000
40,000
50,000
60,000
Cove
red
W
ork
ers
South Dakota Health Care Workforce Needs Assessment 2015 Page 3
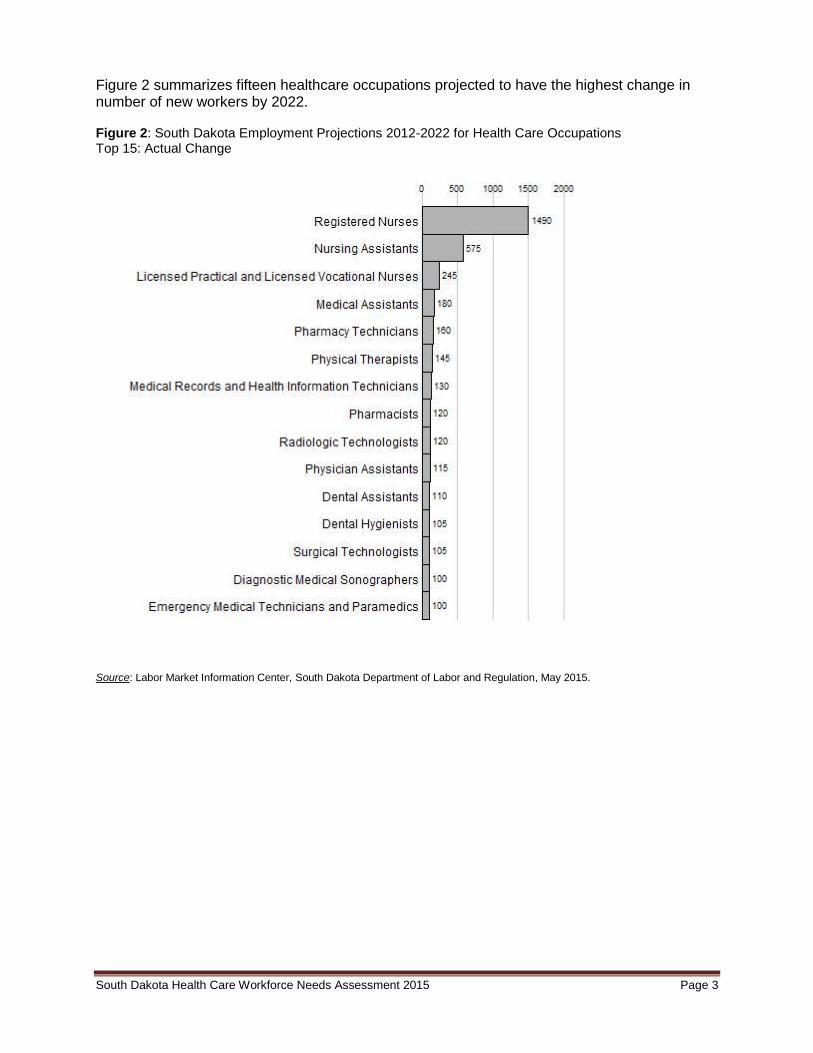
Figure 2 summarizes fifteen healthcare occupations projected to have the highest change in number of new workers by 2022. Figure 2: South Dakota Employment Projections 2012-2022 for Health Care Occupations Top 15: Actual Change
Source: Labor Market Information Center, South Dakota Department of Labor and Regulation, May 2015.

South Dakota Health Care Workforce Needs Assessment 2015 Page 4
In addition to actual change in number of positions, percent change in number of positions is also a helpful metric to identify emerging occupations which are projected to see growth in the future. A review of the top fifteen occupations to see the largest percent change in positions from 2012-2022 indicates a growth in many of the technical support occupations (Figure 3). Readers are encouraged to look at the percent change along with the projected actual change in positions to obtain a true sense of occupation needs in the future. See Table 1 and Figures 4 and 5 for a comparison of all the health professions for which projection data was available from the South Dakota Department of Labor and Regulation.
Figure 3: South Dakota Employment Projections 2012-2022 for Health Care Occupations Top 15: Percent Change
Source: Labor Market Information Center, South Dakota Department of Labor and Regulation, May 2015.

South Dakota Health Care Workforce Needs Assessment 2015 Page 5
Table 1: South Dakota Employment Projections 2012-2022 for Healthcare Occupations
Occupational Title 2012
Workers 2022
Workers Numeric Change
Percent Change
Average Annual Openings
Anesthesiologists 30 35 5 16.7% 1
Athletic Trainers 95 100 5 5.3% 4
Audiologists 40 50 10 25.0% 2
Cardiovascular Technologists and Technicians 190 235 45 23.7% 8
Chiropractors 300 320 20 6.7% 8
Dental Assistants 865 975 110 12.7% 29
Dental Hygienists 490 595 105 21.4% 22
Dentists, General 505 540 35 6.9% 15
Diagnostic Medical Sonographers 300 400 100 33.3% 14
Dietitians and Nutritionists 195 215 20 10.3% 4
Emergency Medical Technicians and Paramedics 940 1,040 100 10.6% 36
Family and General Practitioners 500 515 15 3.0% 14
Health Educators 170 190 20 11.8% 6
Health Specialties Teachers, Postsecondary 125 165 40 32.0% 6
Home Health Aides 945 1,030 85 9.0% 27
Internists, General 205 210 5 2.4% 5
Licensed Practical and Licensed Vocational Nurses 2,135 2,380 245 11.5% 76
Magnetic Resonance Imaging Technologists 45 50 5 11.1% 2
Massage Therapists 130 155 25 19.2% 3
Medical and Clinical Laboratory Technicians 370 435 65 17.6% 16
Medical and Clinical Laboratory Technologists 810 865 55 6.8% 27
Medical and Health Services Managers 665 745 80 12.0% 24
Medical Assistants 1,095 1,275 180 16.4% 39
Medical Equipment Preparers 140 160 20 14.3% 5
Medical Records and Health Information Technicians 1,025 1,155 130 12.7% 40
Medical Transcriptionists 785 755 -30 -3.8% 15
Nuclear Medicine Technologists 165 190 25 15.2% 4
Nurse Anesthetists 305 340 35 11.5% 10
Nurse Practitioners 360 440 80 22.2% 15
Nursing Assistants 6,310 6,885 575 9.1% 177
Nursing Instructors and Teachers, Postsecondary 145 190 45 31.0% 6
Obstetricians and Gynecologists 45 45 0 0.0% 1
Occupational Therapists 340 395 55 16.2% 11
Ophthalmic Medical Technicians 50 60 10 20.0% 1
Opticians, Dispensing 460 520 60 13.0% 19
Optometrists 160 180 20 12.5% 7
Orthotists and Prosthetists 25 35 10 40.0% 1
Pediatricians, General 55 55 0 0.0% 1
Pharmacists 1,030 1,150 120 11.7% 37
Pharmacy Aides 30 30 0 0.0% 0
Pharmacy Technicians 1,245 1,405 160 12.9% 28
Phlebotomists 220 245 25 11.4% 7
Physical Therapist Aides 65 75 10 15.4% 3
Physical Therapist Assistants 240 305 65 27.1% 11
Physical Therapists 645 790 145 22.5% 31
Physician Assistants 470 585 115 24.5% 20
Physicians and Surgeons, All Other 545 590 45 8.3% 18
Psychiatrists 20 20 0 0.0% 0
Radiation Therapists 40 45 5 12.5% 1
Radiologic Technologists 955 1,075 120 12.6% 25
Recreational Therapists 35 35 0 0.0% 1
Registered Nurses 11,380 12,870 1,490 13.1% 370
Respiratory Therapists 335 380 45 13.4% 9
Speech-Language Pathologists 405 445 40 9.9% 10
Surgeons 225 250 25 11.1% 9
Surgical Technologists 450 555 105 23.3% 15
Veterinarians 285 295 10 3.5% 10
Veterinary Assistants and Laboratory Animal Caretakers 205 205 0 0.0% 4
Veterinary Technologists and Technicians 275 320 45 16.4% 8
Source: Labor Market Information Center, South Dakota Department of Labor and Regulation, May 2015

South Dakota Health Care Workforce Needs Assessment 2015 Page 6
Figure 4: South Dakota Employment Projections 2012-2022 for Health Care Occupations Actual Change (From Table 1)
Source: Labor Market Information Center, South Dakota Department of Labor and Regulation, May 2015.

South Dakota Health Care Workforce Needs Assessment 2015 Page 7
Figure 5: South Dakota Employment Projections 2012-2022 for Health Care Occupations Percent Change
Source: Labor Market Information Center, South Dakota Department of Labor and Regulation, May 2015.
Notes Related to South Dakota Department of Labor and Regulation Employment Projections Data: Data for occupations with less than 20 jobs in 2010 is not included. Data presented for occupations will not sum to totals due to data for additional occupations and non-publishable data for additional occupations being included in totals. Demand data is the summation of job openings estimated due to projected employment growth (for those occupations for which the 2010-2020 actual change is positive) and job openings projected to be created due to replacement need of current workers. Replacement need is estimated by multiplying occupational employment estimates by national replacement rates supplied by the U.S. Bureau of Labor Statistics (BLS). These rates estimate the number of job openings, by occupation, which will be attributed to a worker permanently leaving an occupation (e.g. retirement, death, exits the workforce, etc.). Average annual demand data are calculated by dividing by ten, the number of years in the projection period. For more information, see http://dol.sd.gov/lmic/projections_methodology.aspx.

South Dakota Health Care Workforce Needs Assessment 2015 Page 8
Educational Supply Many of the healthcare occupations included in this report require some level of postsecondary education. Training programs exist in South Dakota for many of the major occupations. Data on program completers summarized in Table 2 was drawn from the South Dakota Board of Regents and Table 3 from the National Center for Educational Statistics’ Integrated Postsecondary Education Data System (IPEDS) for private universities, tribal colleges and universities, and postsecondary technical institutes. Table 2: Selected Health Care Occupations – Degrees Conferred by Public Universities, by year.
Major Description Univ. Degree 2010 2011 2012 2013 2014 5-Year Total
5-Year Average
Athletic Training SDSU B 12 15 12 19 12 70 14
SDSU M 0 4 4 2 6 16 3.2
Audiology USD AuD 3 5 2 3 4 17 3.4
Dental Hygiene USD A 30 30 31 30 NA 121 24.2
USD B 38 27 32 32 33 162 32.4
Dietetics specialization
SDSU B 14 25 18 13 15 85 17
SDSU M 0 0 2 2 3 7 1.4
Health Information Technology
DSU A 8 8 19 13 15 63 12.6
Health Information Administrator
DSU B 5 7 11 10 12 45 9
Medical Lab Science Medical Technology Clinical Laboratory Science
NSU B 0 0 4 8 3 15 3
SDSU B 8 10 10 16 12 56 11.2
USD B 16 19 22 8 9 74 14.8
Medicine (MD) USD MD 46 51 51 53 52 253 50.6
Nursing
AS Nursing USD A 272 278 243 269 268 1330 266
Nursing RN Upward Mobility
SDSU B 56 57 79 NA NA 192 38.4
BS Nursing SDSU B 229 230 259 348 331 1397 279.4
MS Nursing Total SDSU M 43 30 48 21 10 152 30.4
MS Nursing, Family Nurse Practitioner
SDSU M 32 17 38 * * 87 17.4
MS Nursing, Neonatal Nurse Practitioner
SDSU M 1 2 0 * * 3 0.6
MS Nursing, Psychiatric Nurse Practitioner
SDSU M 0 3 0 * * 3 0.6
MS Nursing, Nursing Administrator
SDSU M 6 2 2 * * 10 2
MS Nursing, Nursing Educator
SDSU M 4 6 8 * * 18 3.6
Occupational Therapy
USD M 18 22 26 25 24 115 23
Pharmacy SDSU PharmD 70 66 69 68 77 350 70
Physical Therapy USD M/DPT 26 25 26 35 36 148 29.6
Physician Assistant USD B 0 0 0 0 0 0 0
USD M 20 20 21 19 19 99 19.8
Respiratory Care Therapy
DSU A 13 17 19 16 17 82 16.4
DSU B 4 3 2 3 3 15 3
Speech-Language Pathology
USD M 19 25 34 30 21 129 25.8
* Data not available

South Dakota Health Care Workforce Needs Assessment 2015 Page 9
Table 3: Selected Health Care Occupation Graduates Reported by Private Universities/Other Institutions in South Dakota for the last three academic years, as reported in the National Center for Educational Statistics’ Integrated Postsecondary Education Data System (IPEDS).
Discipline Field Institution 2011 2012 2013 3 Year Total
3 Year Average
Athletic Training
Augustana 2 10 5 17 5.7
DWU 3 8 6 17 5.7
NAU-RC 4 3 0 7 2.3
Dental Assistant Lake Area Tech 49 33 40 122 40.7
Health Information Technology
NAU-SF 1 5 9 15 5.0
Massage Therapy
NAU-SF 13 11 16 40 13.3
Headlines Academy 24 24 18 66 22.0
Globe University-SF 17 14 10 41 13.7
Medical/Clinical Assistant
Presentation College 6 6 4 16 5.3
Colorado Tech 31 25 16 72 24.0
Lake Area Tech 21 20 14 55 18.3
Mitchell Tech 15 14 17 46 15.3
NAU-SF 15 15 7 37 12.3
Globe University-SF 11 12 12 35 11.7
West Dak Tech 3 11 13 27 9.0
Clinical/Medical Laboratory Technician
Lake Area Tech 7 13 8 28 9.3
Mitchell Tech 12 14 17 43 14.3
Clinical Lab Science/Medical Tech
Mount Marty College 2 0 0 2 0.7
Clinical/Med Lab Science & Allied Professionals, Other
Southeast Tech 28 24 16 68 22.7
West Dak Tech 18 24 19 61 20.3
Nursing (LPN)
Lake Area Tech 64 54 64 182 60.7
Southeast Tech 96 77 92 265 88.3
West Dak Tech 47 27 25 99 33.0
Sinte Gleska 6 11 11 28 9.3
Nursing – Bachelor (RN)
Augustana College 54 46 53 153 51.0
DWU 10 5 10 25 8.3
Mount Marty College 25 41 30 96 32.0
NAU-RC 15 10 5 30 10.0
NAU-SF 3 0 3 6 2.0
Presentation College 56 55 56 167 55.7
U of Sioux Falls 13 34 64 111 37.0
Nursing – Associate (RN)
DWU 64 54 47 165 55.0
Oglala Lakota 12 11 10 33 11.0
Presentation College 11 16 6 33 11.0
Sisseton Wahpeton 15 11 10 36 12.0
Nurse Anesthetist (CRNA) Mount Marty College 37 37 32 106 35.3
Occupational Therapy Assistants
Lake Area Tech 17 17 16 50 16.7
Pharmacy Technician
NAU-SF 12 7 6 25 8.3
Southeast Tech 25 13 28 66 22.0
West Dak Tech 32 25 16 73 24.3
Physical Therapy Assistants
Lake Area Tech 17 20 23 60 20.0
Radiological Technology/Technician Medical Radiological Technology Science-Radiation Therapist
Presentation College 8 22 14 44 14.7
MTI 16 12 11 39 13.0
Avera Sacred Heart 5 6 6 17 5.7
Sanford 28 27 14 69 23.0
Avera McKennan 10 0 0 10 3.3
Mount Marty College 8 8 10 26 8.7
U of Sioux Falls 10 0 0 10 3.3

South Dakota Health Care Workforce Needs Assessment 2015 Page 10
Profiles For Individual Occupations

South Dakota Health Care Workforce Needs Assessment 2015 Page 11
Data Sources In addition to employment projection data provided by the South Dakota Department of
Labor and Regulation, data from the licensing and certification boards was also obtained. The intent of collecting information from the licensing and certification boards was to expand upon the South Dakota Department of Labor and Regulation data by providing a summation of the current licensed/certified workforce using geographic and age descriptors.
Individual occupational profile descriptions were adapted from The Integrated Postsecondary Education Data System’s Classification of Instructional Programs. Table 4: Professional Licensing Boards and Professions Data Sources
Professional Licensing Board Professions
South Dakota Board of Chiropractic Examiners Chiropractors
South Dakota Board of Dentistry Dentists
Dental Assistants
Dental Hygienists
South Dakota Board of Massage Therapy Massage Therapists
South Dakota Board of Medical and Osteopathic Examiners Athletic Trainers
Dietitians and Nutritionists
Emergency Medical Technicians & Paramedics
Medical Assistants
Occupational Therapists
Occupational Therapist Assistants
Physical Therapists
Physical Therapist Assistants
Physicians
Physician Assistants
Respiratory Therapists
South Dakota Board of Nursing Certified Nurse Practitioners (CNPs)
Licensed Practical Nurses (LPNs)
Nurse Anesthetists (CRNAs)
Registered Nurses (RNs)
South Dakota Board of Optometry Optometrists
South Dakota Board of Pharmacy Pharmacists

South Dakota Health Care Workforce Needs Assessment 2015 Page 12
Geographic Distribution
The distribution of providers was examined by regions. The map of South Dakota
illustrates the population distribution and the seven regions.
Region Counties
Region 1 Aurora, Brule, Bon Homme, Buffalo, Charles Mix, Clay, Davison, Douglas, Hanson, Hutchinson, McCook, Turner, Union, Yankton
Region 2 Minnehaha, Lincoln
Region 3 Beadle, Brookings, Clark, Codington, Deuel, Grant, Hamlin, Hand, Jerauld, Kingsbury, Lake, Miner, Moody, Sanborn
Region 4 Butte, Corson, Dewey, Harding, Lawrence, Meade, Perkins, Ziebach
Region 5 Brown, Campbell, Day, Edmunds, Faulk, Marshall, McPherson, Roberts, Spink, Walworth
Region 6 Bennett, Gregory, Haakon, Hughes, Hyde, Jackson, Jones, Lyman, Mellette, Potter, Stanley, Sully, Tripp, Todd
Region 7 Custer, Fall River, Pennington, Shannon
Each dot represents approximately 100 people
Each dot ranmdomly placed within its 2010 US Census Tract
Region 1
Region 2
Region 3
Region 4 Region 5
Region 6Region 7
Each dot represents approximately 100 people Each dot randomly placed within its 2010 US Census Tract

South Dakota Health Care Workforce Needs Assessment 2015 Page 13
Athletic Trainers Description: A program that prepares individuals to work in consultation with, and under the supervision of physicians to prevent and treat sports injuries and associated conditions. Includes instruction in the identification, evaluation, and treatment of athletic injuries and illnesses; first aid and emergency care; therapeutic exercise; anatomy and physiology; exercise physiology; kinesiology and biomechanics; nutrition; sports psychology; personal and community health; knowledge of various sports and their biomechanical and physiological demands; and applicable professional standards and regulations. Demand: Between 2012 and 2022, the South Dakota Department of Labor and Regulation projects that South Dakota will need an average of 4 new athletic trainers per year.
Occupational Title 2012
Workers 2022
Workers Numeric Change
Percent Change
Average Annual Openings
Athletic Trainers 95 100 5 5.3% 4
Current Workforce Information: The statewide median age of Athletic Trainers is 32 years and 12.2% of trainers are age 45 or older.
Current Workforce Distribution by Age and Geographic Region:
Region Number Mean/Average
Age Standard Deviation
Median Percent Age 45 and older
Percent Age 60 and older
1 38 34.3 8.6 34 10.5 0.0
2 76 36.0 10.0 34 17.1 1.3
3 36 31.8 7.1 30 8.3 0.0
4 13 36.1 8.9 36 23.1 0.0
5 20 32.6 7.3 30 10.0 0.0
6 4 33.0 14.8 26 25.0 0.0
7 13 32.3 6.8 31 0.0 0.0
Not SD* 30 31.2 7.5 30 6.7 0.0
Total 230 33.9 8.8 32 12.2 0.4
*Licensure/certification data included individuals with addresses not located in South Dakota.
Supply: During the 2012-2013 academic year, there were 32 graduates reported from Athletic Trainer programs in South Dakota. During the 2013-2014 academic year, there were 18 graduates reported from Athletic Trainer programs in South Dakota under the Board of Regents schools. Data was not yet available for non-Board of Regents schools for 2014.
South Dakota Health Care Workforce Needs Assessment 2015 Page 14
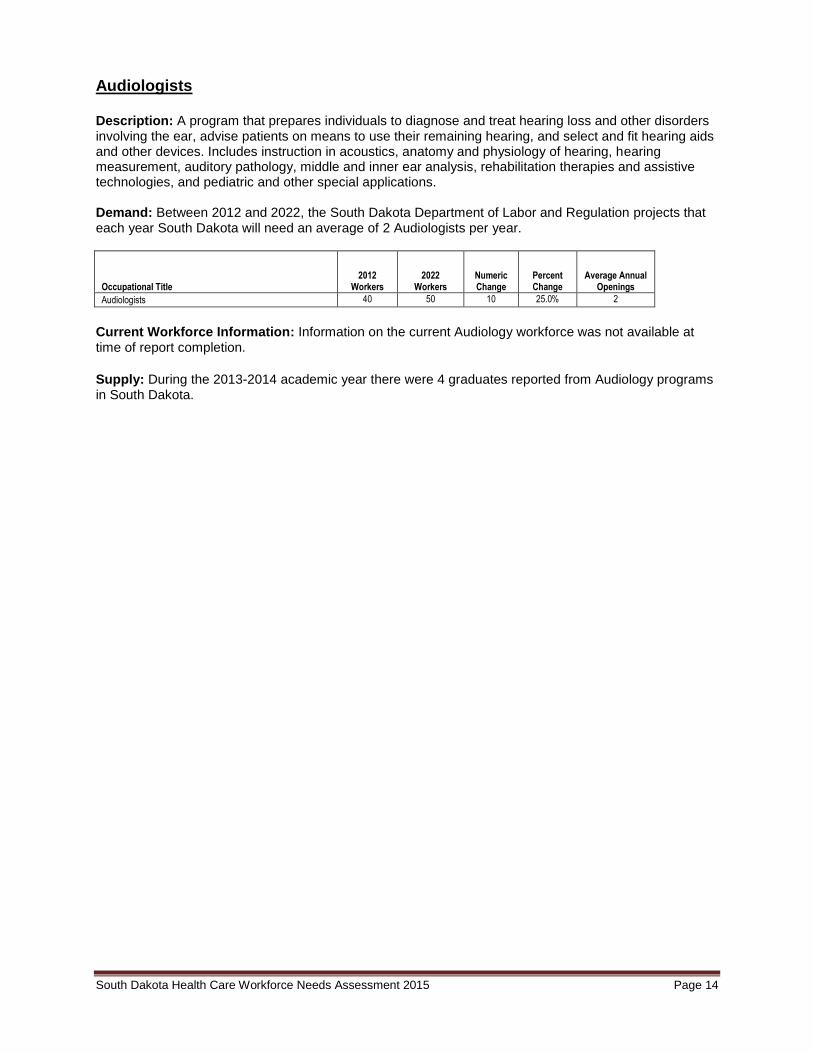
Audiologists Description: A program that prepares individuals to diagnose and treat hearing loss and other disorders involving the ear, advise patients on means to use their remaining hearing, and select and fit hearing aids and other devices. Includes instruction in acoustics, anatomy and physiology of hearing, hearing measurement, auditory pathology, middle and inner ear analysis, rehabilitation therapies and assistive technologies, and pediatric and other special applications. Demand: Between 2012 and 2022, the South Dakota Department of Labor and Regulation projects that each year South Dakota will need an average of 2 Audiologists per year.
Occupational Title 2012
Workers 2022
Workers Numeric Change
Percent Change
Average Annual Openings
Audiologists 40 50 10 25.0% 2
Current Workforce Information: Information on the current Audiology workforce was not available at time of report completion.
Supply: During the 2013-2014 academic year there were 4 graduates reported from Audiology programs in South Dakota.

South Dakota Health Care Workforce Needs Assessment 2015 Page 15
Certified Nurse Practitioners (CNPs) Description: CNPs are advanced practice registered nurses that work in a variety of settings, such as hospitals and clinics. They are educationally prepared to assess, diagnose and manage patient problems, order tests and prescribe medications. Their advanced education, knowledge, and skills prepare them to care for specific populations of patients, including adults, families, children and infants. South Dakota licenses CNPs in the following population focus areas: Acute, Adult-Gero, Family, Neonatal, Pediatric, Psych-Mental Health, and Women’s Health nurse practitioners. Demand: Employment projection data specific for Certified Nurse Practitioners was not included in the South Dakota Department of Labor and Regulation projections.
Current Workforce Information: The statewide median age of Certified Nurse Practitioners (CNPs) is 45 years and 50.2% of CNPs are age 45 or older. The percent of CNPs age 45 and older is 40% or higher in all seven regions of the state.
Current Workforce Distribution by Age and Geographic Region:
Region Number Mean/Average
Age Standard Deviation
Median Percent Age 45 and older
Percent Age 60 and older
1 65 44.6 11.9 43 46.2 13.8
2 227 42.7 10.5 40 40.1 7.5
3 57 45.5 11.9 44 49.1 14.0
4 43 52.3 10.3 55 76.7 32.6
5 30 46.2 10.5 48 56.7 10.0
6 28 47.4 10.9 47 57.1 17.9
7 105 49.9 11.2 53 67.6 20.0
Not SD* 102 44.1 10.5 42 43.1 6.9
Total 657 45.5 11.2 45 50.2 12.8
*Licensure/certification data included individuals with addresses not located in South Dakota.
Supply: During the 2011-2012 academic year there were 38 graduates from CNP programs in South Dakota (includes Family Nurse Practitioners (38), Neonatal Nurse Practitioners (0), and Psych-Mental Health Nurse Practitioners (0)). Data was not available for the 2013 and 2014 school years for CNP programs through BOR Dashboard. For more information on the nursing workforce please refer to the South Dakota Board of Nursing reports located at: http://doh.sd.gov/Boards/Nursing/RandP.aspx
South Dakota Health Care Workforce Needs Assessment 2015 Page 16
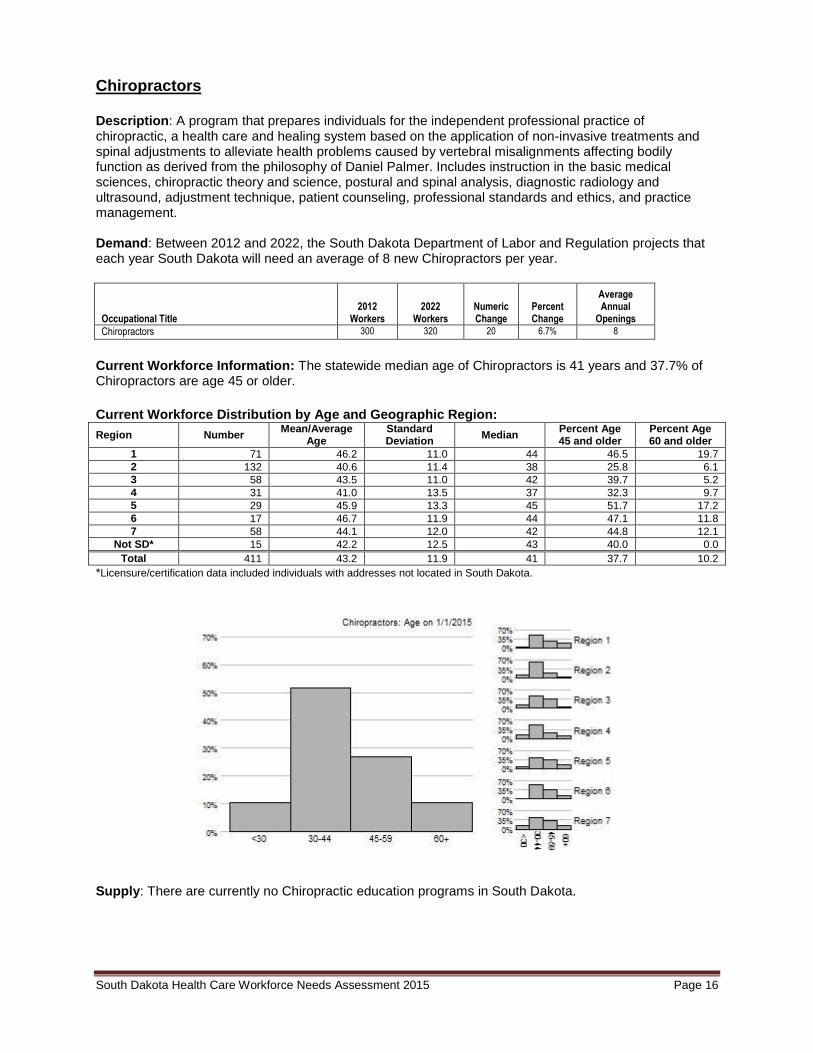
Chiropractors Description: A program that prepares individuals for the independent professional practice of chiropractic, a health care and healing system based on the application of non-invasive treatments and spinal adjustments to alleviate health problems caused by vertebral misalignments affecting bodily function as derived from the philosophy of Daniel Palmer. Includes instruction in the basic medical sciences, chiropractic theory and science, postural and spinal analysis, diagnostic radiology and ultrasound, adjustment technique, patient counseling, professional standards and ethics, and practice management. Demand: Between 2012 and 2022, the South Dakota Department of Labor and Regulation projects that each year South Dakota will need an average of 8 new Chiropractors per year.
Occupational Title 2012
Workers 2022
Workers Numeric Change
Percent Change
Average Annual
Openings
Chiropractors 300 320 20 6.7% 8
Current Workforce Information: The statewide median age of Chiropractors is 41 years and 37.7% of Chiropractors are age 45 or older.
Current Workforce Distribution by Age and Geographic Region:
Region Number Mean/Average
Age Standard Deviation
Median Percent Age 45 and older
Percent Age 60 and older
1 71 46.2 11.0 44 46.5 19.7
2 132 40.6 11.4 38 25.8 6.1
3 58 43.5 11.0 42 39.7 5.2
4 31 41.0 13.5 37 32.3 9.7
5 29 45.9 13.3 45 51.7 17.2
6 17 46.7 11.9 44 47.1 11.8
7 58 44.1 12.0 42 44.8 12.1
Not SD* 15 42.2 12.5 43 40.0 0.0
Total 411 43.2 11.9 41 37.7 10.2
*Licensure/certification data included individuals with addresses not located in South Dakota.
Supply: There are currently no Chiropractic education programs in South Dakota.

South Dakota Health Care Workforce Needs Assessment 2015 Page 17
Advanced Dental Assistants Description: A program that prepares individuals to provide patient care, take dental radiographs (x-ray photographs), prepare patients and equipment for dental procedures, and discharge office administrative functions under the supervision of dentists and dental hygienists. Includes instruction in medical record-keeping, general office duties, reception and patient intake, scheduling, equipment maintenance and sterilization, basic radiography, pre- and post-operative patient care and instruction, chairside assisting, taking tooth and mouth impressions, and supervised practice.
Demand: Between 2012 and 2022, the South Dakota Department of Labor and Regulation projects that each year South Dakota will need an average of 29 new Dental Assistants per year.
Occupational Title 2012
Workers 2022
Workers Numeric Change
Percent Change
Average Annual Openings
Advanced Dental Assistants 865 975 110 12.7% 29
* The Department of Labor statistics does not distinguish between a dental assistant and an advanced dental assistance.
Current Workforce Information: The statewide median age of Advanced Dental Assistants is 34 years. The percent of Advanced Dental Assistants age 45 and older is 29.3%.
Current Workforce Distribution by Age and Geographic Region:
Region Number Mean/Average
Age Standard Deviation
Median Percent Age 45 and older
Percent Age 60 and older
1 75 37.5 11.5 35.0 26.7 1.3
2 263 37.4 12.2 35.0 31.9 3.8
3 139 35.2 11.9 32.0 23.7 3.6
4 49 41.1 11.7 41.0 36.7 6.1
5 52 33.4 10.9 30.0 21.6 3.9
6 39 36.4 14.3 30.0 30.8 5.1
7 125 39.8 11.7 39.0 36.8 5.6
SD Region Unknown
7 32.1 10.7 27.0 14.3 0.0
Not SD* 60 33.6 11.5 30.0 20.0 3.3
Total 809 37.0 12.1 34.0 29.3 4.0
*Licensure/certification data included individuals with addresses not located in South Dakota. Data above includes advanced dental assistants only.
Supply: During the 2012-2013 academic year, there were 40 graduates reported from Advanced Dental Assistant programs in South Dakota.

South Dakota Health Care Workforce Needs Assessment 2015 Page 18
Dental Hygienists Description: A program that prepares individuals to clean teeth and apply preventive materials, provide oral health education and treatment counseling to patients, identify oral pathologies and injuries, and manage dental hygiene practices. Includes instruction in dental anatomy, microbiology, and pathology; dental hygiene theory and techniques; cleaning equipment operation and maintenance; dental materials; radiology; patient education and counseling; office management; supervised clinical training; and professional standards. Demand: Between 2012 and 2022, the South Dakota Department of Labor and Regulation projects that each year South Dakota will need an average of 22 new Dental Hygienists per year.
Occupational Title 2012
Workers 2022
Workers Numeric Change
Percent Change
Average Annual
Openings
Dental Hygienists 490 595 105 21.4% 22
Current Workforce Information: The statewide median age of Dental Hygienists is 37 years and 33.6% of Dental Hygienists are age 45 or older. Current Workforce Distribution by Age and Geographic Region:
Region Number Mean/Average
Age Standard Deviation
Median Percent Age 45 and older
Percent Age 60 and older
1 104 41.6 13.4 39 41.3 10.6
2 207 38.2 10.6 36 27.5 2.4
3 72 37.9 10.9 36 29.2 1.4
4 43 40.8 12.0 38 37.2 7.0
5 41 39.3 12.7 34 41.5 4.9
6 34 41.1 13.3 39 38.2 8.8
7 99 41.6 12.0 40 38.4 11.1
SD, Reg Unk 5 39.2 15.8 35 40.0 20.0
Not SD* 136 38.1 12.5 35 31.1 6.7
Total 741 39.4 12.0 37 33.6 6.2
*Licensure/certification data included individuals with addresses not located in South Dakota.
Supply: During the 2013-2014 academic year, there were 33 baccalaureate degree program graduates reported from the Dental Hygiene programs in South Dakota.

South Dakota Health Care Workforce Needs Assessment 2015 Page 19
Dentists Description: A program that prepares individuals for the independent professional practice of dentistry/dental medicine, encompassing the evaluation, diagnosis, prevention, and treatment of diseases, disorders, and conditions of the oral cavity, maxillofacial area, and adjacent structures and their impact on the human body and health. Includes instruction in the basic biomedical sciences, occlusion, dental health and prevention, oral pathology, cardiology, operative dentistry, oral radiology, principles of the various dental specialties, pain management, oral medicine, clinic and health care management, patient counseling, and professional standards and ethics. Demand: Between 2012 and 2022, the South Dakota Department of Labor and Regulation projects that each year South Dakota will need an average of 15 new Dentists (General) per year.
Occupational Title 2012
Workers 2022
Workers Numeric Change
Percent Change
Average Annual Openings
Dentists, General 505 540 35 6.9% 15
Current Workforce Information: The statewide median age of Dentists is 49 years and 55.4% of Dentists are age 45 or older. The percent of Dentists age 45 and older is greater than 45% in all seven regions of the state.
Current Workforce Distribution by Age and Geographic Region:
Region Number Mean/Average
Age Standard Deviation
Median Percent Age 45 and older
Percent Age 60 and older
1 69 47.9 14.6 45 53.6 24.6
2 144 47.1 13.5 45 50.7 22.2
3 69 49.0 15.2 48 52.2 39.1
4 25 48.6 13.4 46 56.0 36.0
5 32 54.5 13.9 56 75.0 37.5
6 30 46.5 16.7 38 46.7 30.0
7 95 50.8 12.4 54 60.0 31.6
Not SD* 92 48.4 13.9 50 57.6 26.1
Total 556 48.7 14.0 49 55.4 28.8
*Licensure/certification data included individuals with addresses not located in South Dakota.
Supply: There are currently no Dental programs in South Dakota.

South Dakota Health Care Workforce Needs Assessment 2015 Page 20
Dietitians and Nutritionists Description: Dietitians A program that prepares individuals to integrate and apply the principles of the food and nutrition sciences, human behavior, and the biomedical sciences to design and manage effective nutrition programs in a variety of settings. Includes instruction in human nutrition; nutrient metabolism; the role of foods and nutrition in health promotion and disease prevention; planning and directing food service activities; diet and nutrition analysis and planning; supervision of food storage and preparation; client education; and professional standards and regulations. Nutritionists A program that focuses on the relationships between food consumption and human development and health. Includes instruction in the cellular and molecular processes of food processing in the human body, related metabolic processes, the relationship of food and nutrition to disease, and nutritional needs across the life span. Demand: Between 2012 and 2022, the South Dakota Department of Labor and Regulation projects that each year South Dakota will need an average of 4 new Dietitians and Nutritionists per year.
Occupational Title 2012
Workers 2022
Workers Numeric Change
Percent Change
Average Annual Openings
Dietitians and Nutritionists 195 215 20 10.3% 4
Current Workforce Information: The statewide median age of Dietitians and Nutritionists is 43 years and 46.2% of Dietitians and Nutritionists are age 45 or older. Current Workforce Distribution by Age and Geographic Region:
Region Number Mean/Average
Age Standard Deviation
Median Percent Age 45 and older
Percent Age 60 and older
1 34 43.9 15.3 42 47.1 11.8
2 103 43.4 12.0 41 39.8 14.6
3 35 42.3 14.6 41 37.1 17.1
4 17 43.9 12.2 47 52.9 5.9
5 16 44.1 12.5 43 50.0 12.5
6 12 47.6 18.8 50 50.0 41.7
7 42 47.5 12.6 52 64.3 19.0
Not SD* 59 44.3 13.3 43 45.8 10.2
Total 318 44.3 13.3 43 46.2 14.8
*Licensure/certification data included individuals with addresses not located in South Dakota.
Supply: During the 2013-2014 academic year, there were 15 baccalaureate degree program graduates and 3 Master degree program graduates reported from Dietetics and Nutritional programs in South Dakota.

South Dakota Health Care Workforce Needs Assessment 2015 Page 21
Emergency Medical Technicians (EMT) and Paramedics Description: A program that prepares individuals, under the remote supervision of physicians, to recognize, assess, and manage medical emergencies in pre-hospital settings and to supervise Ambulance personnel. Includes instruction in basic, intermediate, and advanced EMT procedures; emergency surgical procedures; medical triage; rescue operations; crisis scene management and personnel supervision; equipment operation and maintenance; patient stabilization, monitoring, and care; drug administration; identification and preliminary diagnosis of diseases and injuries; communication and computer operations; basic anatomy, physiology, pathology, and toxicology; and professional standards and regulations. Demand: Between 2012 and 2022, the South Dakota Department of Labor and Regulation projects that each year South Dakota will need an average of 36 new EMTs and Paramedics per year.
Occupational Title 2012
Workers 2022
Workers Numeric Change
Percent Change
Average Annual Openings
Emergency Medical Technicians and Paramedics 940 1,040 100 10.6% 36
The Workforce and Supply information for Emergency Medical Technicians and Paramedics is separated below. EMT Current Workforce Information: The statewide median age of EMTs is 49 years and 61.5% of EMTs are age 45 or older. The percent of EMTs age 45 and older is greater or equal to 50% in six out of the seven regions of the state.
EMTs Current Workforce Distribution by Age and Geographic Region:
Region Number Mean/Average
Age Standard Deviation
Median Percent Age 45 and older
Percent Age 60 and older
1 24 48.4 12.9 50 79.2 20.8
2 10 41.3 10.4 40 30.0 0.0
3 11 53.9 15.4 57 81.8 45.5
4 56 44.6 12.9 46 53.6 10.7
5 19 51.8 11.4 53 68.4 26.3
6 35 51.0 10.6 52 74.3 20.0
7 54 45.9 12.7 48 55.6 18.5
Not SD* 12 47.4 10.6 44 50.0 16.7
Total 221 47.4 12.5 49 61.5 18.1
*Licensure/certification data included individuals with addresses not located in South Dakota.

South Dakota Health Care Workforce Needs Assessment 2015 Page 22
Paramedics Current Workforce Information: The statewide median age of Paramedics is 37 years and 30.6% of Paramedics are age 45 or older.
Paramedics Current Workforce Distribution by Age and Geographic Region:
Region Number Mean/Average
Age Standard Deviation
Median Percent Age 45 and older
Percent Age 60 and older
1 47 41.2 12.1 42 40.4 8.5
2 128 38.9 10.0 37 32.8 2.3
3 69 39.9 12.3 40 37.7 8.7
4 45 41.1 12.1 41 35.6 11.1
5 50 35.6 10.6 34 16.0 4.0
6 25 42.3 13.6 41 40.0 12
7 108 37.5 9.8 34 25.0 1.9
Not SD* 122 38.7 9.6 38 27.9 2.5
Total 594 38.9 10.8 37 30.6 4.7
*Licensure/certification data included individuals with addresses not located in South Dakota.
Supply: Training for EMTs and Paramedics is provided through hospital and community education programs located throughout the state.

South Dakota Health Care Workforce Needs Assessment 2015 Page 23
Health Information Administrators Description: A program that prepares individuals to plan, design, and manage systems, processes, and facilities used to collect, store, secure, retrieve, analyze, and transmit medical records and other health information used by clinical professionals and health care organizations. Includes instruction in the principles and basic content of the biomedical and clinical sciences, information technology and applications, data and database management, clinical research methodologies, health information resources and systems, office management, legal requirements, and professional standards. Demand: The South Dakota Department of Labor and Regulation data does not include updated projections specific to Health Information Administrators for the 2012 to 2022 timeframe. Current Workforce Information: Information on the current Health Information Administrator workforce was not available at time of report completion.
Supply: During the 2013-2014 academic year there were 12 graduates reported from Health Information Administrator programs in South Dakota.
South Dakota Health Care Workforce Needs Assessment 2015 Page 24
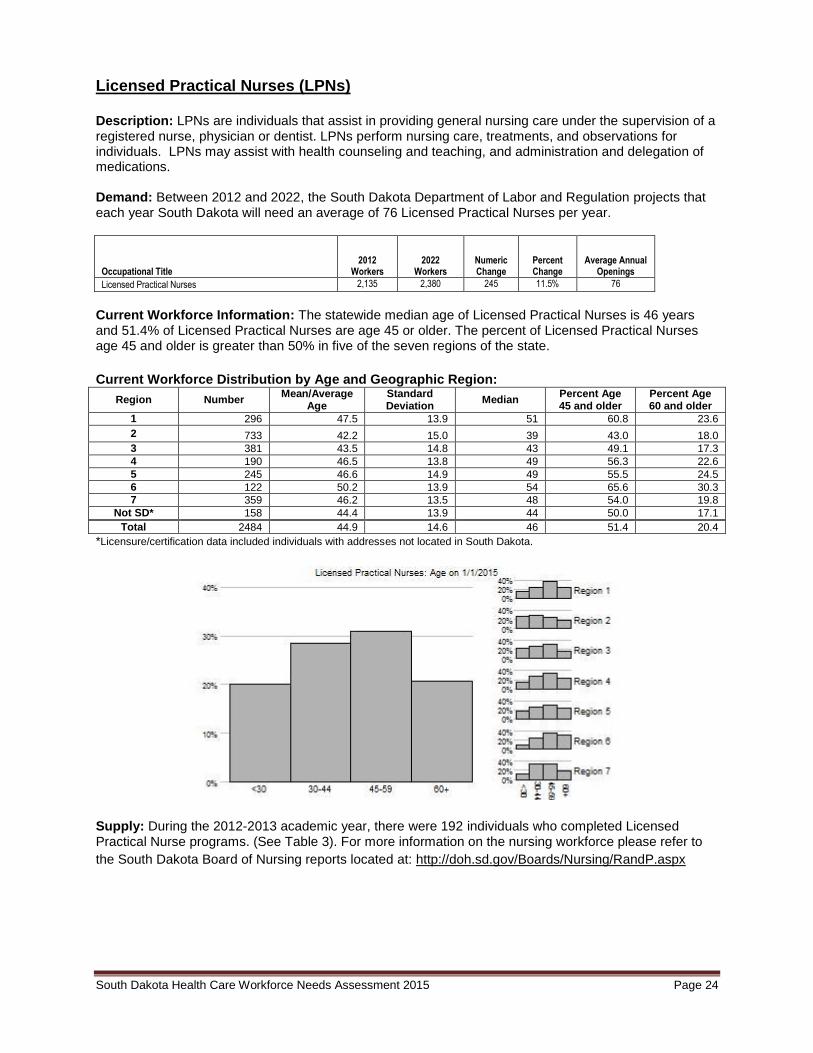
Licensed Practical Nurses (LPNs) Description: LPNs are individuals that assist in providing general nursing care under the supervision of a registered nurse, physician or dentist. LPNs perform nursing care, treatments, and observations for individuals. LPNs may assist with health counseling and teaching, and administration and delegation of medications. Demand: Between 2012 and 2022, the South Dakota Department of Labor and Regulation projects that each year South Dakota will need an average of 76 Licensed Practical Nurses per year.
Occupational Title 2012
Workers 2022
Workers Numeric Change
Percent Change
Average Annual Openings
Licensed Practical Nurses 2,135 2,380 245 11.5% 76
Current Workforce Information: The statewide median age of Licensed Practical Nurses is 46 years and 51.4% of Licensed Practical Nurses are age 45 or older. The percent of Licensed Practical Nurses age 45 and older is greater than 50% in five of the seven regions of the state.
Current Workforce Distribution by Age and Geographic Region:
Region Number Mean/Average
Age Standard Deviation
Median Percent Age 45 and older
Percent Age 60 and older
1 296 47.5 13.9 51 60.8 23.6
2 733 42.2 15.0 39 43.0 18.0
3 381 43.5 14.8 43 49.1 17.3
4 190 46.5 13.8 49 56.3 22.6
5 245 46.6 14.9 49 55.5 24.5
6 122 50.2 13.9 54 65.6 30.3
7 359 46.2 13.5 48 54.0 19.8
Not SD* 158 44.4 13.9 44 50.0 17.1
Total 2484 44.9 14.6 46 51.4 20.4
*Licensure/certification data included individuals with addresses not located in South Dakota.
Supply: During the 2012-2013 academic year, there were 192 individuals who completed Licensed Practical Nurse programs. (See Table 3). For more information on the nursing workforce please refer to
the South Dakota Board of Nursing reports located at: http://doh.sd.gov/Boards/Nursing/RandP.aspx

South Dakota Health Care Workforce Needs Assessment 2015 Page 25
Massage Therapists Description: A program that prepares individuals to provide relief and improved health and well-being to clients through the application of manual techniques for manipulating skin, muscles, and connective tissues. Includes instruction in Western (Swedish) massage, sports massage, myotherapy/trigger point massage, myofascial release, deep tissue massage, cranio-sacral therapy, reflexology, massage safety and emergency management, client counseling, practice management, applicable regulations, and professional standards and ethics. Demand: Between 2012 and 2022, the South Dakota Department of Labor and Regulation projects that each year South Dakota will need an average of 3 new Massage Therapists per year.
Occupational Title 2012
Workers 2022
Workers Numeric Change
Percent Change
Average Annual Openings
Massage Therapists 130 155 25 19.2% 3
Current Workforce Information: The statewide median age of Massage Therapists is 39 years and 39.1% of Massage Therapists are age 45 or older. Current Workforce Distribution by Age and Geographic Region:
Region Number Mean/Average
Age Standard Deviation
Median Percent Age 45 and older
Percent Age 60 and older
1 89 44.6 13.9 42 44.9 16.9
2 210 39.1 12.7 36 31.9 7.6
3 81 41.8 12.9 39 37.0 9.9
4 67 42.6 13.5 41 44.8 13.4
5 76 43.6 15.0 39 42.1 21.1
6 29 44.2 17.4 40 37.9 13.8
7 145 43.9 13.5 41 46.9 20.7
8 3 42.7 18.4 38 33.3 33.3
Not SD* 103 39.4 14.1 34 34.0 13.6
Total 803 41.8 13.8 39 39.1 14.1
*Licensure/certification data included individuals with addresses not located in South Dakota.
Supply: During the 2012-2013 academic year, there were 44 graduates reported from Massage Therapy programs in South Dakota.
South Dakota Health Care Workforce Needs Assessment 2015 Page 26
Medical and Clinical Laboratory Technicians Description: A program that prepares individuals, under the supervision of clinical laboratory scientists/medical technologists, to perform routine medical laboratory procedures and tests and to apply preset strategies to record and analyze data. Includes instruction in general laboratory procedures and skills; laboratory mathematics; medical computer applications; interpersonal and communications skills; and the basic principles of hematology, medical microbiology, immunohematology, immunology, clinical chemistry, and urinalysis. Demand: Between 2012 and 2022, the South Dakota Department of Labor and Regulation projects that each year South Dakota will need an average of 16 new Medical and Clinical Laboratory Technicians per year.
Occupational Title 2012
Workers 2022
Workers Numeric Change
Percent Change
Average Annual Openings
Medical and Clinical Laboratory Technicians 370 435 65 17.6% 16
Current Workforce Information: Information on the age and geographic distribution of the current Clinical/Medical Laboratory Technician workforce is not currently available. Supply: During the 2013-2014 academic year, there were 25 graduates reported from Medical and Clinical Laboratory Technician programs in South Dakota.
Medical and Clinical Laboratory Technologists Description: A program that prepares individuals to conduct and supervise complex medical tests, clinical trials, and research experiments; manage clinical laboratories; and consult with physicians and clinical researchers on diagnoses, disease causation and spread, and research outcomes. Includes instruction in the theory and practice of hematology, clinical chemistry, microbiology, immunology, immunohematology, physiological relationships to test results, laboratory procedures and quality assurance controls, test and research design and implementation, analytic techniques, laboratory management, data development and reporting, medical informatics, and professional standards and regulations. Demand: Between 2012 and 2022, the South Dakota Department of Labor and Regulation projects that each year South Dakota will need an average of 27 new Medical and Clinical Laboratory Technologists per year.
Occupational Title 2012
Workers 2022
Workers Numeric Change
Percent Change
Average Annual Openings
Medical and Clinical Laboratory Technologists 810 865 55 6.8% 27
Current Workforce Information: Information on the age and geographic distribution of the current Medical and Clinical Laboratory Technologists workforce is not currently available. Supply: During the 2013-2014 academic year, there were 24 graduates reported from Medical and Clinical Laboratory Technologist programs in South Dakota under the Board of Regents schools. Data was not yet available for non-Board of Regents schools for 2014 academic year.

South Dakota Health Care Workforce Needs Assessment 2015 Page 27
Medical Assistants Description: A program that prepares individuals, under the supervision of physicians, to provide medical office administrative services and perform clinical duties including patient intake and care, routine diagnostic and recording procedures, pre-examination and examination assistance, and the administration of medications and first aid. Includes instruction in basic anatomy and physiology; medical terminology; medical law and ethics; patient psychology and communications; medical office procedures; and clinical diagnostic, examination, testing, and treatment procedures. Demand: Between 2012 and 2022, the South Dakota Department of Labor and Regulation projects that each year South Dakota will need an average of 39 new Medical Assistants per year.
Occupational Title 2012
Workers 2022
Workers Numeric Change
Percent Change
Average Annual Openings
Medical Assistants 1,095 1,275 180 16.4% 39
Current Workforce Information: The statewide median age of Medical Assistants is 35 years and 28.1% of Medical Assistants are age 45 or older. Current Workforce Distribution by Age and Geographic Region:
Region Number Mean/Average
Age Standard Deviation
Median Percent Age 45 and older
Percent Age 60 and older
1 98 36.4 11.7 34 22.4 4.1
2 224 38.0 11.5 34 27.4 4.9
3 89 38.0 13.0 34 29.2 10.1
4 31 40.8 12.1 35 35.5 6.5
5 56 38.8 12.1 36 28.6 3.6
6 16 41.2 16.0 42 50.0 12.5
7 53 39.8 12.5 38 30.2 5.7
Not SD* 67 36.3 10.8 33 26.9 0.0
Total 634 38.0 12.0 35 28.1 5.2
*Licensure/certification data included individuals with addresses not located in South Dakota.
Supply: During the 2012-2013 academic year, there were 83 program completers reported from Medical Assistant programs in the state.

South Dakota Health Care Workforce Needs Assessment 2015 Page 28
Medical Records and Health Information Technicians Description: A program that prepares individuals, under the supervision of health information administrators and other professionals, to construct medical records and clinical databases, perform manipulations on retrieved data, control the security and quality of records, and supervise data entry and technical maintenance personnel. Includes instruction in clinical and biomedical science data and information requirements, database management, data coding and validation, information security, quality control, health information content and structure, medical business procedures, and legal requirements. Demand: Between 2012 and 2022, the South Dakota Department of Labor and Regulation projects that each year South Dakota will need an average of 40 new Health Information Technicians per year.
Occupational Title 2012
Workers 2022
Workers Numeric Change
Percent Change
Average Annual Openings
Medical Records and Health Information Technicians 1,025 1,155 130 12.7% 40
Current Workforce Information: Information on the age and geographic distribution of the current Health Information Technician workforce is not currently available. Supply: During the 2013-2014 academic year, there were 15 graduates reported from Health Information Technology programs in South Dakota under the Board of Regents schools. Data was not yet available for non-Board of Regents schools for 2014.

South Dakota Health Care Workforce Needs Assessment 2015 Page 29
Nurse Anesthetists (CRNAs) Description: CRNAs are advanced practice registered nurses that work in hospital operating rooms and out-patient surgical settings. Their advanced education in pharmacology, assessment, and pathophysiology prepares them to manage patients before, during and after anesthesia including assessing and administering anesthetic medications, managing pain, and intervening in emergency patient situations. Demand: Between 2012 and 2022, the South Dakota Department of Labor and Regulation projects that each year South Dakota will need an average of 10 new Nurse Anesthetists per year.
Occupational Title 2012
Workers 2022
Workers Numeric Change
Percent Change
Average Annual Openings
Nurse Anesthetists 305 340 35 11.5% 10
Current Workforce Information: The statewide median age of CRNAs is 48 years and 56.6% of CRNAs are age 45 or older. The percent of CRNAs age 45 and older is greater than 50% in five out of the seven regions of the state.
Region Number Mean/Average
Age Standard Deviation
Median Percent Age 45 and older
Percent Age 60 and older
1 46 50.5 12.8 52 63.0 37.0
2 162 45.3 10.0 43 43.8 12.3
3 20 47.1 10.9 44 45.0 15.0
4 24 50.3 11.2 52 70.8 20.8
5 18 48.4 11.7 49 61.1 16.7
6 10 52.2 14.5 54 70.0 50.0
7 61 50.5 11.5 48 60.7 31.1
Not SD* 99 50.8 11.1 53 68.7 27.3
Total 440 48.4 11.3 48 56.6 22.5
*Licensure/certification data included individuals with addresses not located in South Dakota.
Supply: During the 2012-2013 academic year, there were 32 graduates from the CRNA program in South Dakota. For more information on the nursing workforce please refer to the South Dakota Board of Nursing reports located at: http://doh.sd.gov/Boards/Nursing/RandP.aspx

South Dakota Health Care Workforce Needs Assessment 2015 Page 30
Occupational Therapists
Description: A program that prepares individuals to assist patients limited by physical, cognitive, psychosocial, mental, developmental, and learning disabilities, as well as adverse environmental conditions, to maximize their independence and maintain optimum health through a planned mix of acquired skills, performance motivation, environmental adaptations, assistive technologies, and physical agents. Includes instruction in the basic medical sciences, psychology, sociology, patient assessment and evaluation, standardized and non-standardized tests and measurements, assistive and rehabilitative technologies, ergonomics, environmental health, special education, vocational counseling, health education and promotion, and professional standards and ethics. Demand: Between 2012 and 2022, the South Dakota Department of Labor and Regulation projects that each year South Dakota will need an average of 11 Occupational Therapists per year.
Occupational Title 2012
Workers 2022
Workers Numeric Change
Percent Change
Average Annual
Openings
Occupational Therapists 340 395 55 16.2% 11
Current Workforce Information: The statewide median age of Occupational Therapists is 40 years and 33.6% of Occupational Therapists are age 45 or older. Current Workforce Distribution by Age and Geographic Region:
Region Number Mean/Average
Age Standard Deviation
Median Percent Age 45 and older
Percent Age 60 and older
1 66 39.6 9.2 41 28.8 1.5
2 161 40.1 9.2 40 34.8 1.9
3 35 41.1 11.6 41 34.3 8.6
4 25 43.9 12.1 42 36.0 16.0
5 36 42.5 12.1 41 38.9 13.9
6 12 39.2 11.3 37 25.0 8.3
7 60 40.7 11.0 40 38.3 6.7
Not SD* 69 39.7 10.3 40 29.0 4.3
Total 464 40.5 10.2 40 33.6 5.2
*Licensure/certification data included individuals with addresses not located in South Dakota.
Supply: During the 2013-2014 academic year, there were 24 graduates reported from the Occupational Therapy programs in South Dakota.
South Dakota Health Care Workforce Needs Assessment 2015 Page 31
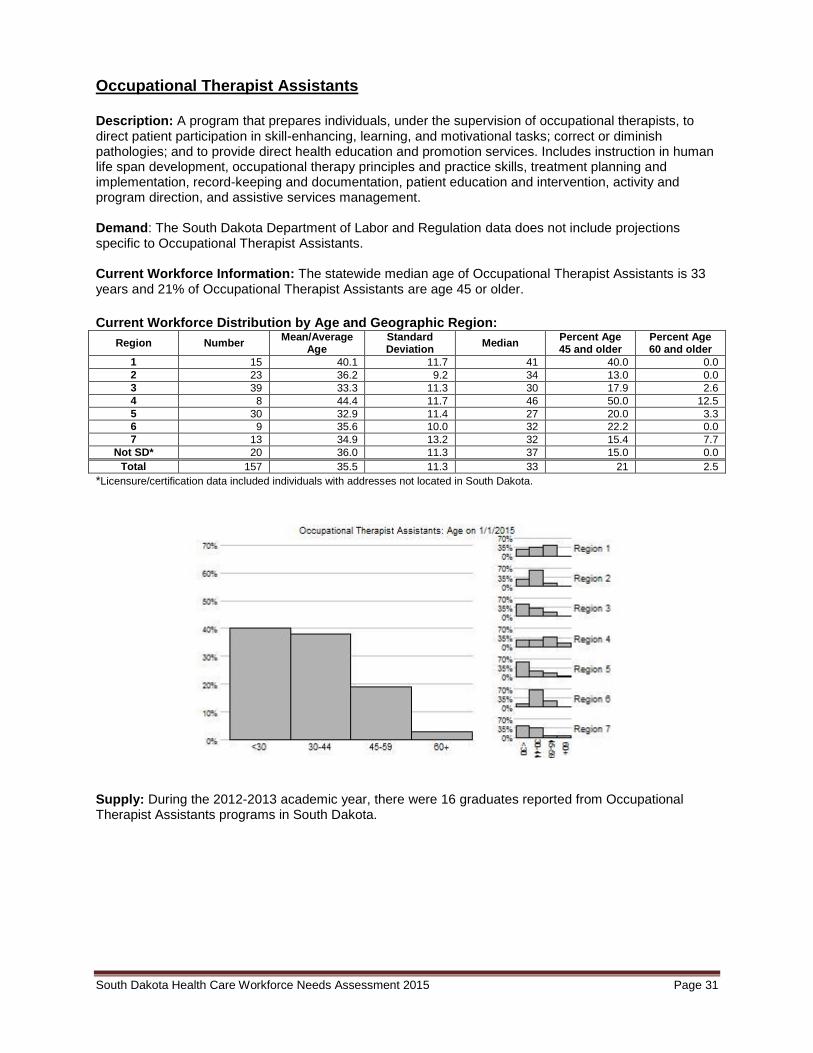
Occupational Therapist Assistants Description: A program that prepares individuals, under the supervision of occupational therapists, to direct patient participation in skill-enhancing, learning, and motivational tasks; correct or diminish pathologies; and to provide direct health education and promotion services. Includes instruction in human life span development, occupational therapy principles and practice skills, treatment planning and implementation, record-keeping and documentation, patient education and intervention, activity and program direction, and assistive services management. Demand: The South Dakota Department of Labor and Regulation data does not include projections specific to Occupational Therapist Assistants. Current Workforce Information: The statewide median age of Occupational Therapist Assistants is 33 years and 21% of Occupational Therapist Assistants are age 45 or older.
Current Workforce Distribution by Age and Geographic Region:
Region Number Mean/Average
Age Standard Deviation
Median Percent Age 45 and older
Percent Age 60 and older
1 15 40.1 11.7 41 40.0 0.0
2 23 36.2 9.2 34 13.0 0.0
3 39 33.3 11.3 30 17.9 2.6
4 8 44.4 11.7 46 50.0 12.5
5 30 32.9 11.4 27 20.0 3.3
6 9 35.6 10.0 32 22.2 0.0
7 13 34.9 13.2 32 15.4 7.7
Not SD* 20 36.0 11.3 37 15.0 0.0
Total 157 35.5 11.3 33 21 2.5
*Licensure/certification data included individuals with addresses not located in South Dakota.
Supply: During the 2012-2013 academic year, there were 16 graduates reported from Occupational Therapist Assistants programs in South Dakota.

South Dakota Health Care Workforce Needs Assessment 2015 Page 32
Optometrists Description: A program that prepares individuals for the independent professional practice of optometry and that focuses on the principles and techniques for examining, diagnosing and treating conditions of the visual system. Includes instruction in prescribing glasses and contact lenses, other optical aids, corrective therapies, patient counseling, physician referral, practice management, and ethics and professional standards. Demand: Between 2012 and 2022, the South Dakota Department of Labor and Regulation projects that each year South Dakota will need an average of 7 new Optometrists per year.
Occupational Title 2012
Workers 2022
Workers Numeric Change
Percent Change
Average Annual Openings
Optometrists 160 180 20 12.5% 7
Current Workforce Information: The statewide median age of Optometrists is 46 years and 55.9% of Optometrists are age 45 or older.
Current Workforce Distribution by Age and Geographic Region:
Region Number Mean/Average
Age Standard Deviation
Median Percent Age 45 and older
Percent Age 60 and older
1 27 46.7 10.6 44 48.1 7.4
2 63 45.5 11.6 46 53.7 14.8
3 23 45.9 11.5 42 47.8 17.4
4 17 48.2 12.8 49 62.5 18.8
5 15 48.8 10.2 50 61.5 15.4
6 7 50.9 12.4 57 71.4 28.6
7 39 46.0 10.0 46 54.5 9.1
Not SD* 32 47.7 11.5 47 64.5 9.7
Total 223 46.7 11.1 46 55.9 13.2
*Licensure/certification data included individuals with addresses not located in South Dakota.
Supply: There are currently no Optometry programs in South Dakota.
South Dakota Health Care Workforce Needs Assessment 2015 Page 33
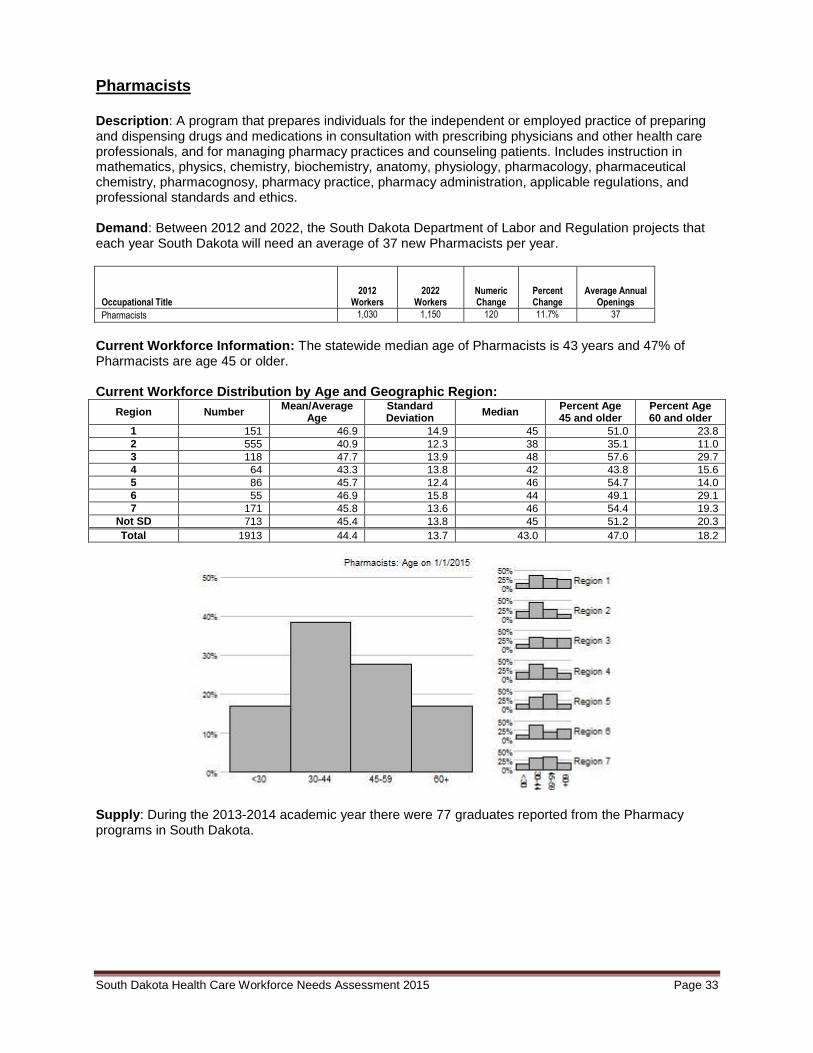
Pharmacists Description: A program that prepares individuals for the independent or employed practice of preparing and dispensing drugs and medications in consultation with prescribing physicians and other health care professionals, and for managing pharmacy practices and counseling patients. Includes instruction in mathematics, physics, chemistry, biochemistry, anatomy, physiology, pharmacology, pharmaceutical chemistry, pharmacognosy, pharmacy practice, pharmacy administration, applicable regulations, and professional standards and ethics. Demand: Between 2012 and 2022, the South Dakota Department of Labor and Regulation projects that each year South Dakota will need an average of 37 new Pharmacists per year.
Occupational Title 2012
Workers 2022
Workers Numeric Change
Percent Change
Average Annual Openings
Pharmacists 1,030 1,150 120 11.7% 37
Current Workforce Information: The statewide median age of Pharmacists is 43 years and 47% of Pharmacists are age 45 or older. Current Workforce Distribution by Age and Geographic Region:
Region Number Mean/Average
Age Standard Deviation
Median Percent Age 45 and older
Percent Age 60 and older
1 151 46.9 14.9 45 51.0 23.8
2 555 40.9 12.3 38 35.1 11.0
3 118 47.7 13.9 48 57.6 29.7
4 64 43.3 13.8 42 43.8 15.6
5 86 45.7 12.4 46 54.7 14.0
6 55 46.9 15.8 44 49.1 29.1
7 171 45.8 13.6 46 54.4 19.3
Not SD 713 45.4 13.8 45 51.2 20.3
Total 1913 44.4 13.7 43.0 47.0 18.2
Supply: During the 2013-2014 academic year there were 77 graduates reported from the Pharmacy programs in South Dakota.

South Dakota Health Care Workforce Needs Assessment 2015 Page 34
Pharmacy Technicians Description: A program that prepares individuals, under the supervision of pharmacists, to prepare medications, provide medications and related assistance to patients, and manage pharmacy clinical and business operations. Includes instruction in medical and pharmaceutical terminology, principles of pharmacology and pharmaceutics, drug identification, pharmacy laboratory procedures, prescription interpretation, patient communication and education, safety procedures, record-keeping, measurement and testing techniques, pharmacy business operations, prescription preparation, logistics and dispensing operations, and applicable standards and regulations. Demand: Between 2012 and 2022, the South Dakota Department of Labor and Regulation projects that each year South Dakota will need an average of 28 new Pharmacy Technicians per year.
Occupational Title 2012
Workers 2022
Workers Numeric Change
Percent Change
Average Annual Openings
Pharmacy Technicians 1,245 1,405 160 12.9% 28
Current Workforce Information: Demographic information on the current workforce is not currently available. Supply: During the 2012-2013 academic year there were 50 graduates reported from Pharmacy Technician programs in South Dakota.

South Dakota Health Care Workforce Needs Assessment 2015 Page 35
Physical Therapist Assistants Description: A program that prepares individuals, under the supervision of a physical therapist, to implement physical therapy treatment care plans, train patients, conduct treatment interventions, use equipment, and observe and record patient progress. Includes instruction in applied anatomy and physiology, applied kinesiology, principles and procedures of physical therapy, basic neurology and orthopedics, physical therapy modalities, documentation skills, psychosocial aspects of health care, wound and injury care, electrotherapy, working with orthotics and prostheses, and personal and professional ethics. Demand: Between 2012 and 2022, the South Dakota Department of Labor and Regulation projects that each year South Dakota will need an average of 11 Physical Therapist Assistants per year.
Occupational Title 2012
Workers 2022
Workers Numeric Change
Percent Change
Average Annual Openings
Physical Therapist Assistants 240 305 65 27.1% 11
Current Workforce Information: The statewide median age of Physical Therapist Assistants is 34 years and 20.2% of Physical Therapist Assistants are age 45 or older. Current Workforce Distribution by Age and Geographic Region:
Region Number Mean/Average
Age Standard Deviation
Median Percent Age 45 and older
Percent Age 60 and older
1 37 35.3 10.8 32 21.6 0.0
2 31 34.4 11.1 30 19.4 3.2
3 73 33.5 9.0 32 13.7 0.0
4 11 38.4 15.2 34 27.3 9.1
5 24 36.2 10.7 34 16.7 4.2
6 14 36.6 11.8 36 21.4 0.0
7 19 40.9 10.3 39 26.3 0.0
Not SD* 53 37.1 11.9 34 26.4 3.8
Total 262 35.7 10.9 34 20.2 1.9
*Licensure/certification data included individuals with addresses not located in South Dakota.
Supply: During the 2012-2013 academic year, there were 23 graduates reported from the Physical
Therapy Assistant program in South Dakota.
South Dakota Health Care Workforce Needs Assessment 2015 Page 36
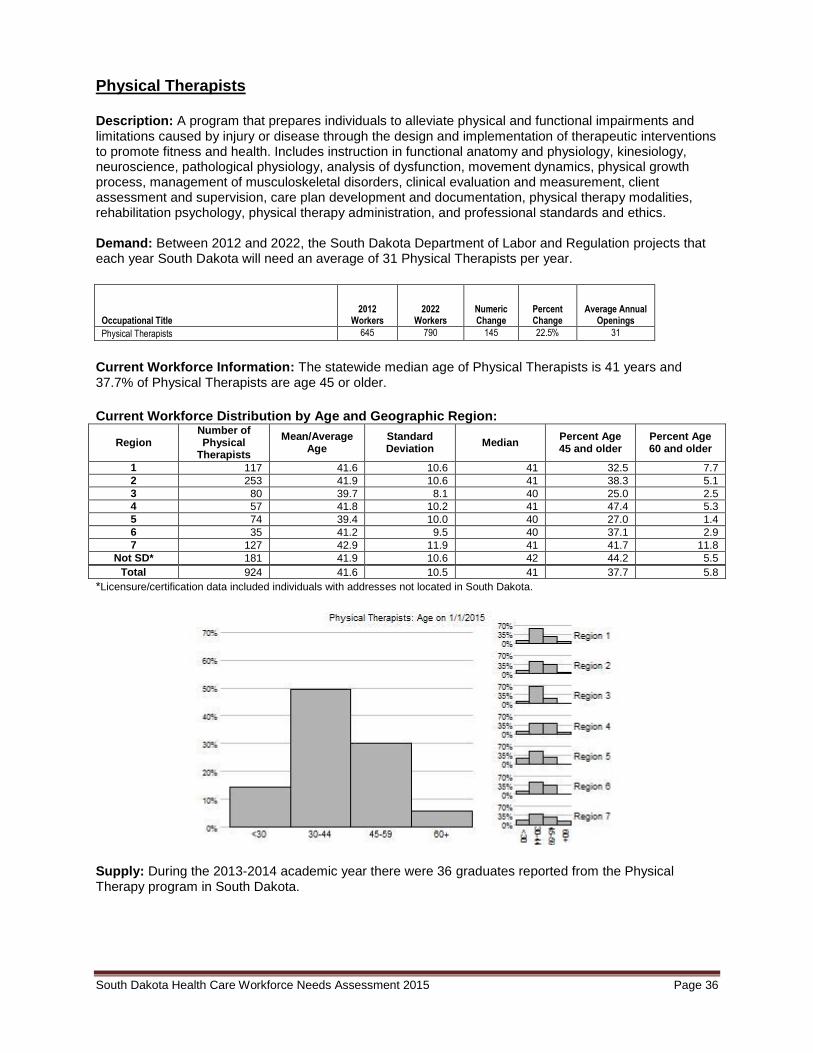
Physical Therapists Description: A program that prepares individuals to alleviate physical and functional impairments and limitations caused by injury or disease through the design and implementation of therapeutic interventions to promote fitness and health. Includes instruction in functional anatomy and physiology, kinesiology, neuroscience, pathological physiology, analysis of dysfunction, movement dynamics, physical growth process, management of musculoskeletal disorders, clinical evaluation and measurement, client assessment and supervision, care plan development and documentation, physical therapy modalities, rehabilitation psychology, physical therapy administration, and professional standards and ethics. Demand: Between 2012 and 2022, the South Dakota Department of Labor and Regulation projects that each year South Dakota will need an average of 31 Physical Therapists per year.
Occupational Title 2012
Workers 2022
Workers Numeric Change
Percent Change
Average Annual Openings
Physical Therapists 645 790 145 22.5% 31
Current Workforce Information: The statewide median age of Physical Therapists is 41 years and 37.7% of Physical Therapists are age 45 or older.
Current Workforce Distribution by Age and Geographic Region:
Region Number of Physical
Therapists
Mean/Average Age
Standard Deviation
Median Percent Age 45 and older
Percent Age 60 and older
1 117 41.6 10.6 41 32.5 7.7
2 253 41.9 10.6 41 38.3 5.1
3 80 39.7 8.1 40 25.0 2.5
4 57 41.8 10.2 41 47.4 5.3
5 74 39.4 10.0 40 27.0 1.4
6 35 41.2 9.5 40 37.1 2.9
7 127 42.9 11.9 41 41.7 11.8
Not SD* 181 41.9 10.6 42 44.2 5.5
Total 924 41.6 10.5 41 37.7 5.8
*Licensure/certification data included individuals with addresses not located in South Dakota.
Supply: During the 2013-2014 academic year there were 36 graduates reported from the Physical Therapy program in South Dakota.
South Dakota Health Care Workforce Needs Assessment 2015 Page 37
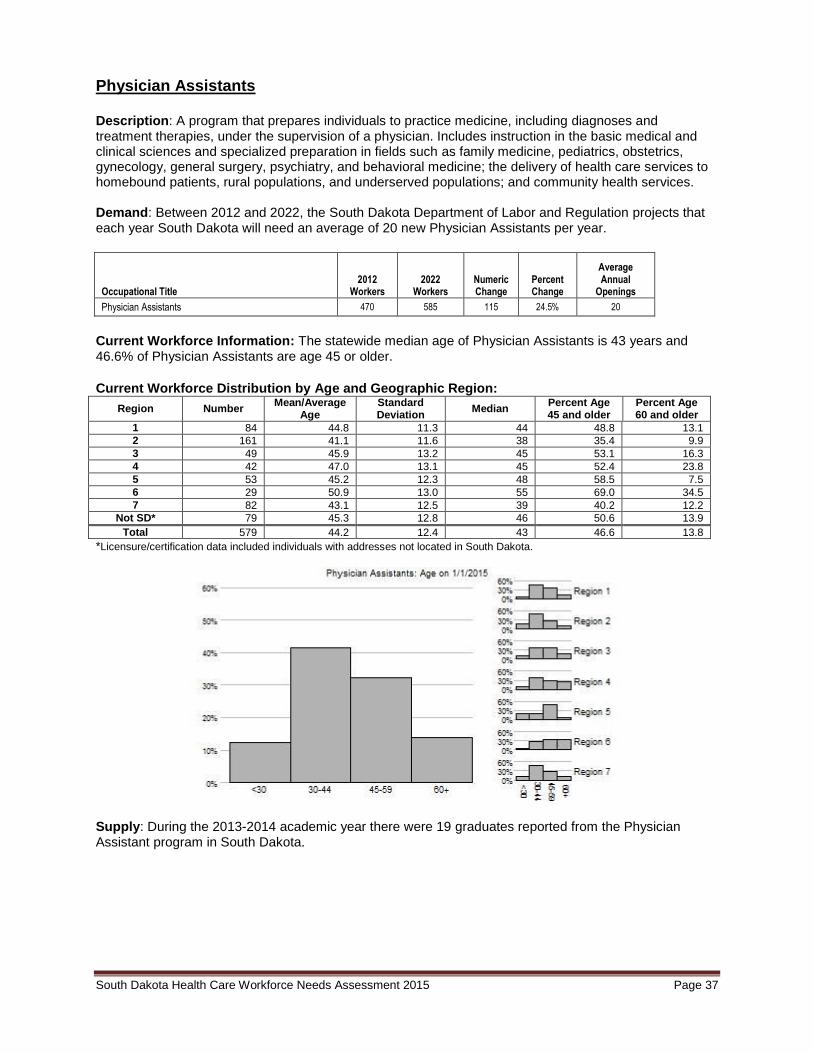
Physician Assistants Description: A program that prepares individuals to practice medicine, including diagnoses and treatment therapies, under the supervision of a physician. Includes instruction in the basic medical and clinical sciences and specialized preparation in fields such as family medicine, pediatrics, obstetrics, gynecology, general surgery, psychiatry, and behavioral medicine; the delivery of health care services to homebound patients, rural populations, and underserved populations; and community health services. Demand: Between 2012 and 2022, the South Dakota Department of Labor and Regulation projects that each year South Dakota will need an average of 20 new Physician Assistants per year.
Occupational Title 2012
Workers 2022
Workers Numeric Change
Percent Change
Average Annual
Openings
Physician Assistants 470 585 115 24.5% 20
Current Workforce Information: The statewide median age of Physician Assistants is 43 years and 46.6% of Physician Assistants are age 45 or older.
Current Workforce Distribution by Age and Geographic Region:
Region Number Mean/Average
Age Standard Deviation
Median Percent Age 45 and older
Percent Age 60 and older
1 84 44.8 11.3 44 48.8 13.1
2 161 41.1 11.6 38 35.4 9.9
3 49 45.9 13.2 45 53.1 16.3
4 42 47.0 13.1 45 52.4 23.8
5 53 45.2 12.3 48 58.5 7.5
6 29 50.9 13.0 55 69.0 34.5
7 82 43.1 12.5 39 40.2 12.2
Not SD* 79 45.3 12.8 46 50.6 13.9
Total 579 44.2 12.4 43 46.6 13.8
*Licensure/certification data included individuals with addresses not located in South Dakota.
Supply: During the 2013-2014 academic year there were 19 graduates reported from the Physician Assistant program in South Dakota.

South Dakota Health Care Workforce Needs Assessment 2015 Page 38
Physicians
Description: A program that prepares individuals for the independent professional practice of medicine, involving the prevention, diagnosis, and treatment of illnesses, injuries, and other disorders of the human body. Includes instruction in the basic medical sciences, clinical medicine, examination and diagnosis, patient communications, medical ethics and law, professional standards, and rotations in specialties such as internal medicine, surgery, pediatrics, obstetrics and gynecology, orthopedics, neurology, ophthalmology, radiology, clinical pathology, anesthesiology, family medicine, and psychiatry.
Demand: Between 2012 and 2022, the South Dakota Department of Labor and Regulation projects that each year South Dakota will need an average of 14 Family and General Practitioners and 9 Surgeons per year. See the table below for projections on other Physician/Medical specialties.
Occupational Title 2012
Workers 2022
Workers Numeric Change
Percent Change
Average Annual Openings
Anesthesiologists 30 35 5 16.7% 1
Family and General Practitioners 500 515 15 3.0% 14
Internists, General 205 210 5 2.4% 5
Obstetricians and Gynecologists 45 45 0 0.0% 1
Pediatricians, General 55 55 0 0.0% 1
Physicians and Surgeons, All Other 545 590 45 8.3% 18
Psychiatrists 20 20 0 0.0% 0
Surgeons 225 250 25 11.1% 9
Current Workforce Information: The statewide median age of Physicians is 52 years and 68.1% of Physicians are age 45 or older. The percent of Physicians age 45 and older is greater than 56% in all seven regions of the state.
Current Workforce Distribution by Age and Geographic Region:
Region Number Mean/Average
Age Standard Deviation
Median Percent Age 45 and older
Percent Age 60 and older
1 275 51.5 12.4 52.0 65.1 28.7
2 1012 49.1 12.2 48.0 56.9 22.3
3 149 51.9 12.0 52.0 70.9 32.4
4 77 55.8 11.8 57.0 79.2 44.2
5 149 50.9 13.1 51.0 63.8 26.8
6 64 51.0 12.9 52.0 67.2 25.0
7 417 53.4 12.3 54.0 75.2 30.5
Not SD* 1616 52.7 11.3 53.0 73.4 29.6
Total 3759 51.7 12.0 52.0 68.1 27.9
*Licensure/certification data included individuals with addresses not located in South Dakota.
Supply: During the 2013-2014 academic year, there were 52 graduates reported from the Physician program in South Dakota.

South Dakota Health Care Workforce Needs Assessment 2015 Page 39
Radiology Description: Radiologic Technologists and Technicians: A program that prepares individuals, under the supervision of physicians, to provide medical imaging services to patients and attending health care professionals. Includes instruction in applied anatomy and physiology, patient positioning, radiographic technique, radiation biology, safety and emergency procedures, equipment operation and maintenance, quality assurance, patient education, and medical imaging/radiologic services management. Medical Radiologic Technology/Science-Radiation Therapists: A program that prepares individuals to administer prescribed courses of radiation treatment, manage patients undergoing radiation therapy, and maintain pertinent records. Includes instruction in applied anatomy and physiology, oncologic pathology, radiation biology, radiation oncology procedures and techniques, radiation dosimetry, tumor localization, treatment planning, patient communication and management, data collection, record-keeping, and applicable standards and regulations. Demand: Between 2012 and 2022, the South Dakota Department of Labor and Regulation projects that each year South Dakota will need an average of 25 new Radiologic Technologists and Technicians per year.
Occupational Title 2012
Workers 2022
Workers Numeric Change
Percent Change
Average Annual
Openings
Radiologic Technologists and Technicians 955 1,075 120 12.6% 25
Current Workforce Information: Demographic information on the current workforce is not currently available. Supply: During the 2012-2013 academic year, there were 55 graduates reported from the Radiologic Technologists and Technicians programs in South Dakota.

South Dakota Health Care Workforce Needs Assessment 2015 Page 40
Registered Nurses (RNs) Description: The preparation and practice of RNs requires substantial specialized knowledge, judgment and skill based upon the principles of the biological, physiological, behavioral and sociological sciences, and for which the registered nurse bears responsibility and accountability. RNs perform assessments and nursing diagnoses of actual or potential health problems for individuals or groups, providing and administering preventative, restorative and supportive care, health teaching and counseling, case management and referral. RNs supervise, delegate, and evaluate the care performed by others. Demand: Between 2012 and 2022, the South Dakota Department of Labor and Regulation projects that each year South Dakota will need an average of 370 Registered Nurses per year.
Occupational Title 2012
Workers 2022
Workers Numeric Change
Percent Change
Average Annual Openings
Registered Nurses 11,380 12,870 1,490 13.1% 370
Current Workforce Information: The statewide median age of Registered Nurses is 43 years and 48% of Registered Nurses are age 45 or older. The percent of Registered Nurses age 45 and older is greater than 50% in four of seven regions of the state. Current Workforce Distribution by Age and Geographic Region:
Region Number of Registered
Nurses
Mean/Average Age
Standard Deviation
Median Percent Age 45
and older Percent Age 60
and older
1 2172 45.0 13.5 45.0 51.3 15.9
2 5351 41.6 13.5 39.0 39.8 12.6
3 1618 44.3 13.8 44.0 48.6 16.4
4 901 46.0 13.5 47.0 54.7 19.4
5 1093 45.5 13.5 47.0 54.3 17.9
6 634 45.8 13.2 46.0 53.0 18.0
7 2308 44.8 13.6 44.0 49.6 16.8
Not SD* 2143 46.1 12.5 47.0 55.3 16.3
Total 16220 44.0 13.5 43.0 48.0 15.5
*Licensure/certification data included individuals with addresses not located in South Dakota.
Supply: During the 2013-2014 academic year, there were 609 nursing graduates reported in South Dakota. Data was not yet available for non-Board of Regents schools for the 2014 academic year. See Table 2 and Table 3 for a complete breakdown. For more information on the nursing workforce please refer to the South Dakota Board of Nursing reports located at http://doh.sd.gov/Boards/Nursing/RandP.aspx.
South Dakota Health Care Workforce Needs Assessment 2015 Page 41
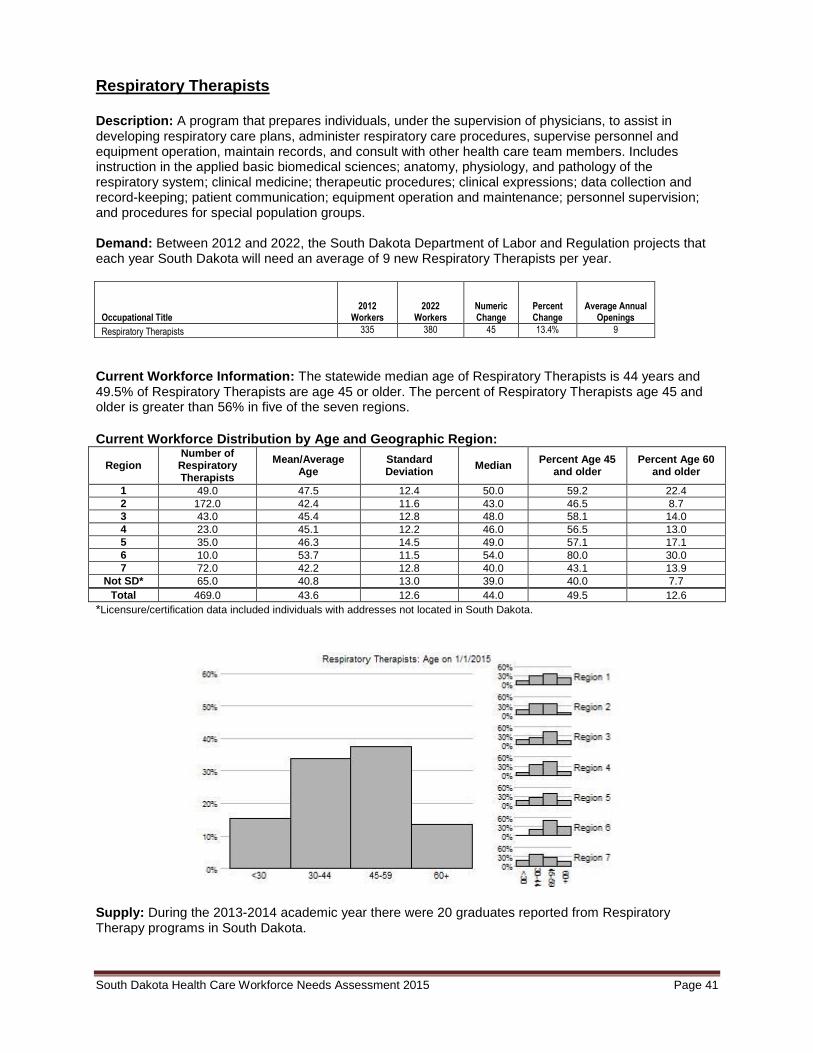
Respiratory Therapists Description: A program that prepares individuals, under the supervision of physicians, to assist in developing respiratory care plans, administer respiratory care procedures, supervise personnel and equipment operation, maintain records, and consult with other health care team members. Includes instruction in the applied basic biomedical sciences; anatomy, physiology, and pathology of the respiratory system; clinical medicine; therapeutic procedures; clinical expressions; data collection and record-keeping; patient communication; equipment operation and maintenance; personnel supervision; and procedures for special population groups. Demand: Between 2012 and 2022, the South Dakota Department of Labor and Regulation projects that each year South Dakota will need an average of 9 new Respiratory Therapists per year.
Occupational Title 2012
Workers 2022
Workers Numeric Change
Percent Change
Average Annual Openings
Respiratory Therapists 335 380 45 13.4% 9
Current Workforce Information: The statewide median age of Respiratory Therapists is 44 years and 49.5% of Respiratory Therapists are age 45 or older. The percent of Respiratory Therapists age 45 and older is greater than 56% in five of the seven regions. Current Workforce Distribution by Age and Geographic Region:
Region Number of Respiratory Therapists
Mean/Average Age
Standard Deviation
Median Percent Age 45
and older Percent Age 60
and older
1 49.0 47.5 12.4 50.0 59.2 22.4
2 172.0 42.4 11.6 43.0 46.5 8.7
3 43.0 45.4 12.8 48.0 58.1 14.0
4 23.0 45.1 12.2 46.0 56.5 13.0
5 35.0 46.3 14.5 49.0 57.1 17.1
6 10.0 53.7 11.5 54.0 80.0 30.0
7 72.0 42.2 12.8 40.0 43.1 13.9
Not SD* 65.0 40.8 13.0 39.0 40.0 7.7
Total 469.0 43.6 12.6 44.0 49.5 12.6
*Licensure/certification data included individuals with addresses not located in South Dakota.
Supply: During the 2013-2014 academic year there were 20 graduates reported from Respiratory Therapy programs in South Dakota.
South Dakota Health Care Workforce Needs Assessment 2015 Page 42
Speech-Language Pathologists Description: A program that prepares individuals to evaluate the speaking, language interpretation, and related physiological and cognitive capabilities of children and/or adults and develop treatment and rehabilitative solutions in consultation with clinicians and educators. Includes instruction in the anatomy and physiology of speech and hearing, biomechanics of swallowing and vocal articulation, communications disorders, psychology of auditory function and cognitive communication, language assessment and diagnostic techniques, and rehabilitative and management therapies. Demand: Between 2012 and 2022, the South Dakota Department of Labor and Regulation projects that each year South Dakota will need an average of 10 Speech-Language Pathologists per year.
Occupational Title 2012
Workers 2022
Workers Numeric Change
Percent Change
Average Annual Openings
Speech-Language Pathologists 405 445 40 9.9% 10
Current Workforce Information: Information on the current speech-language pathologist workforce was not available at time of report completion. Supply: During the 2013-2014 academic year there were 21 graduates reported from speech-language pathology programs in South Dakota.