2015 Results Presentation - Tabreed 2015... · Landmark Projects: Reef Island, Financial Harbour,...
20
National Central Cooling Company PJSC 1 February 2016 2015 Results Presentation
Transcript of 2015 Results Presentation - Tabreed 2015... · Landmark Projects: Reef Island, Financial Harbour,...

National Central Cooling Company PJSC
1 February 2016
2015 Results Presentation

• These materials have been prepared by and are the sole responsibility ofthe National Central Cooling Company PJSC, ‘Tabreed’ (the “Company”).These materials have been prepared solely for your information and foruse at the call/presentation to be made on 1 February 2016. By attendingthe meeting/call where this presentation is made, or by reading thepresentation slides,you agree to be bound by the following limitations
• These materials are confidential and may not be further distributed orpassed on to any other person or published or reproduced, in whole or inpart, by any medium or in any form for any purpose. The distribution ofthese materials in other jurisdictions may be restricted by law, andpersons into whose possession this presentation comes should informthemselves about, and observe, any such restrictions
• These materials are for information purposes only and do not constitute aprospectus, offering memorandum or offering circularor an offer to sell any securities and are not intended to providethe basis for any credit or any third party evaluation of any securities orany offering of them and should not be consideredas a recommendation that any investor should subscribe for or purchaseany securities. The information contained herein has not been verified bythe Company, its advisers or any other personand is subject to change without notice and past performance isnot indicative of future results. The Company is under no obligation toupdate or keep current the information contained herein
• No person shall have any right of action (except in case of fraud) against the Company orany other person in relation to the accuracy or completeness of the informationcontained herein. Whilst the Company has taken all reasonable steps to ensure theaccuracyof all information, the Company cannot accept liability for any inaccuracies or omissions.All the information is provided on an“as is” basis and without warranties, representations or conditionsof any kind, either express or implied, and as such warranties, representation andconditions are hereby excluded to the maximum extent permitted by law
• The merits or suitability of any securities to any investor's particular situation should beindependently determined by such investor. Any such determination should involveinter alia, an assessment of the legal, tax, accounting, regulatory, financial, credit andother related aspects of any securities
• No person is authorized to give any information or to make any representation notcontained in and not consistent with these materials and, if given or made, suchinformation or representation must not be relied upon as having been authorized by oron behalf of the Company
• These materials are not intended for publication or distribution to, or use by any personor entity in any jurisdiction or country where such distribution or use would be contraryto local law or regulation. The securities discussed in this presentation have not beenand will not be registered under the U.S. Securities Act of 1933, as amended (theSecurities Act) and may not be offered or sold except underan exemption from, or transaction not subject to, the registration requirements of theSecurities Act. In particular, these materials are not intended for publication ordistribution, except to certain persons in offshore transactions outside the United Statesin reliance on Regulation S under the Securities Act
• These materials contain information regarding the past performance of the Companyand its subsidiaries. Such performance may not be representative of the entireperformance of the Company and its subsidiaries. Past performance is neither a guide tofuture returns nor to the future performance of the Company and its subsidiaries
• These materials contain, or may be deemed to contain, forward-looking statements. Bytheir nature, forward- looking statements involve risks and uncertainties because theyrelate to events and depend on circumstances that may or may not occur in the future.The future results of the Company may vary from the results expressed in, or implied by,the following forward looking statements, possibly to a material degree. Any investmentin securities is subject to various risks, such risks should be carefully considered byprospective investors before they make any investment decisions. The directors disclaimany obligation toupdate their view of such risks and uncertainties or to publicly announce the result ofany revision to the forward-looking statements made herein, except where it would berequiredto do so under applicable law
Disclaimer

Agenda
A | Introduction and Performance Highlights – Jasim Thabet, CEOB | Financial Results – Steve Ridlington, CFOC | Conclusion – Jasim Thabet, CEO

Robust results delivered in 2015
Commercial andOperationalPerformance
• Providing 974kRT of cooling – 8% annual growth since 2012• 35KRT added in 2015 and ~100 kRT of new contracted capacity under
construction• 1.3 billion KWh of electricity saved in 2015, reducing CO2 emissions by
650,000 tons
Tabreed Analyst Presentation 2015 4
FinancialPerformance
• Net Income growing at 13% since 2012• 2015 Net Income 6% higher, reaching AED 345m• Share of results of equity investments grew 16% in 2015 to AED 99m led
by Qatar Cool and Saudi Tabreed• Long-term project financing deal signed with ENBD, loan drawdown in
2016 to reimburse construction cost
IncreasedShareholderValue
• Capital structure optimized during the year through substitution of Bondswith debt
• Successful MCB repurchase in July 2015, resulting in 758m shares beingbought back driving 19% increase in EPS
• Tabreed’s Board of Directors to recommend 6 fils dividend, up from 5 filsin 2014
Robust performance driven by sizeable presence across GCC and increase in dividends to shareholders

An environmentally friendly Company operating across GCC todeliver shareholder returns
As an integral part of the region's growth, Tabreed will be the leading utility company, delivering and operating district coolinginfrastructure, while creating sustainable value for our shareholders as we maintain the comfort of the communities we serve.
1 2 3
EFFICIENT ANDENVIRONMENT FRIENDLY
OPERATION
We harness the most efficienttechnology and utilize our
extensive experience to deliverreliable and energy efficient
cooling solutions that areenvironmentally friendly
SHAREHOLDER RETURNS
We generate sustainable long-term returns for our stakeholders
BE A REGIONAL LEADER
As the region's preferredprovider of cooling solutions, wefocus on our customers' needsand deliver comfort, value and
service to all the communities weserve.
Tabreed Analyst Presentation 2015 5

Tabreed at a glanceTabreed Analyst Presentation 2015
Greater reliability compared to conventional cooling and positive environmental impact
annual reduction in electricity consumption throughTabreed’s DC services
Enough energy to power
Iconic projects
44,000homes in the UAE every year
=
1.3 billion kWh 650,000 tons eliminated
of CO2 emissions
=The equivalent of removing
130,000cars from our streets every year
6
DubaiMetro
ClevelandClinicAbu Dhabi
The PearlQatar
Jabal Omar ProjectThe Holy City of Mecca
Sheikh Zayed GrandMosque
974kRTdelivered to clients
One of the world’s largest district cooling companies
69plants in the GCC
Equivalent to cooling
towers the size of BurjKhalifa97
Yas Mall

The only listed DC Company in GCC and operating across the region
Tabreed Analyst Presentation 2015
5 Countries | 69 Plants | 974 kRT
BahrainDiplomaticArea
Qatar3 plantsWest Bay – 2Pearl - 1
KSA2 plantsAramcoJabal Omar
Oman2 plants
KOMLulu
UAE61 plantsAbu Dhabi – 37Dubai –17Northern Emirates– 7
• Partnership with ACWA Power and Al Mutlaq• Owns and operates first significant DC plant in KSA – Saudi Aramco (32 kRT) & DC plant in the Holy City of
Mecca (34 kRT)• Operates the DC plant servicing the landmark KAFD development (50 kRT)• Significant growth opportunitiesLandmark Projects: Saudi Aramco, Jabal Omar Development
Saudi Tabreed District Cooling Company (Tabreed 25%)
• A partnership between Tabreed and prominent Omani shareholders• Owns and operates 2 plants serving Knowledge Oasis Muscat, Military Technical College and Lulu (12 kRT)Landmark Projects: Knowledge Oasis Muscat and Lulu Mall
Tabreed Oman (Tabreed 60%)
• Partnership with Esterad, A.A. Bin Hindi and others• Owns and operates 1 DC plant (22 kRT)• Plant runs using sea water to provide cooling to the most prestigious developments in BahrainLandmark Projects: Reef Island, Financial Harbour, World Trade Centre
Bahrain District Cooling Company (Tabreed 90%)
• Joint Venture with United Development Company• Owns and operates the world’s largest 130 kRT DC Plant on The Pearl (102 kRT)• Also owns and operates 2 DC plants and a concession in Qatar’s West Bay (81 kRT)Landmark Projects: The Pearl – Qatar, West Bay
Qatar District Cooling Company (Tabreed 44%)
7
• 52 wholly owned plants, 9 held through associates and joint ventures• Plants in 6 emirates of the UAE - Abu Dhabi, Dubai, Ajman, RAK, Sharjah and Fujairah• 690 kRT delivered to clients including some of UAE’s most prominent landmarksLandmark Projects: Dubai Metro, Sheikh Zayed Grand Mosque, Yas Island, Al Maryah Island, Etihad Towers
National Central Cooling Company and its UAE investments
• Only listed DC company in GCC markets• Uniform utility infrastructure model implemented across GCC• Long term contracts underpinning stability of earnings and returns for shareholders

2015
1,172
1,103
69
2014
1,131
1,035
96
2013
1,100
1,027
73
2012
1,129
1,011
118
2015
974
344
630
2014
956
335
621
2013
839
274
565
2012
767
274
493
Government
2015 Performance
Revenue growthfrom continuedfocus on core
business
• 94% of Group Revenue is from Chilled Water (2014: 91%)• Total Group Revenue up 4% to AED 1,172m (2014: AED 1,131m)• Chilled water revenue up 7% due to new connections and pass through of
utility cost in 2015• Over 35kRT of new connections during the year in Qatar, Saudi and Oman
Value toshareholders
• One of the few listed regional utilities and only DC company operatingacross GCC
• EPS of 11 fils/share – 19% higher than 2014 due to MCB repurchase• 20% increase in dividend payout in 2015 to 6 fils per share, dividend yield
in the top 10 for DFM for the past 3 years• Over 100kRT of contracted projects currently under construction in UAE
(Dubai Parks and others), Qatar and Oman
Strong operatingperformance andfinancial position
• Predictability in earnings driven by capacity charges• Increasing profitability driven by economies of scale and cost control• Net Income and EBITDA growing at 13% and 14% respectively• 2015 Net Income 6% higher despite AED18m of additional finance cost
from MCB repurchase debt• 43% leverage – approaching global utility industry averages
Long-termcontracts withcredit worthy
customers
• Providing 974kRT of cooling across GCC– growing 8% annually since 2012• Long term price certain contracts (~25 years) ensuring stability in earnings• Over 50% of UAE capacity contracted to Government clients• Contracts renewed/extended with key clients such as UAE Armed Forces
and Aldar in the recent past
Tabreed Analyst Presentation 2015
Mar
gins
(%)
(AED
m)
Gro
upRe
venu
e(A
EDm
)G
roup
Conn
ecte
dCa
paci
ty(k
RT)
Stable utility infrastructure business with strong cash flows that continues to deliver earnings growth anddividends
8
Chilled WaterVCB
+13%
2015
345
544
383
2014
325
535
374
2013
272417358
2012
236365356
Net IncomeEBITDAProfit from Ops
29%
Net IncomeMargin
29%
EBITDA Margin
33%
47%
33%
OperatingProfit Margin
46% 44%36%
Gearing
2015 2014

Agenda
A | Introduction and Performance Highlights – Jasim Thabet, CEOB | Financial Results – Steve Ridlington, CEOC | Conclusion – Jasim Thabet, CEO

Stable core business model delivering consistent performance
Tabreed Analyst Presentation 2015
Capacity (fixed) Consumption(variable)
Total
Revenue 66 34 100
Utility Costs - (31) (31)
Plant operation & maintenance (8) - (8)
Depreciation & amortisation (15) - (15)
Gross Profit 43 4 47
Corporate overheads (14) - (14)
Profit from Operations 29 4 33
Add back: depreciation & amortisation 15 - 15
EBITDA 44 4 48
66% 10% 47%
Profit Statement (% of revenue)
Revenue
EBITDA
10
Stable and predictable earnings - ~ 92% of EBITDA arises from capacity charges
• Tabreed bills customers for capacity (fixed) charges and consumption (variable) charges
• Capacity charges reflect the cooling capacity (in RT) reserved for the customer and are
generally fixed, subject to escalation based on country CPI every year
• Consumption charges recover the cost of cooling consumed. Contractually, any change in
variable cost is generally passed through to the customers
• Tabreed’s EBITDA is driven by capacity charges allowing recovery of plant operation cost,
corporate overheads and providing a strong return on capital invested
Billing structure and profitability
34%66%
ConsumptionCapacity
8%92%

Tabreed Analyst Presentation 201511
Unaudited Consolidated Financials (AED m) Dec 2015 Dec 2014 Variance %Revenue 1,172 1,131 41 +4%
Chilled water revenue (94%) 1,103 1,035 68 +7%Value chain businesses (6%) 69 96 (27) -28%
Operating cost (611) (597) (14) +2%Gross Profit 561 534 27 +5%Gross profit margin 48% 47%Administrative and other expenses (178) (160) (18) +12%Profit from Operations 383 374 9 +2%Operating profit margin 33% 33%Net finance costs (138) (130) (7) +6%Share of results of associates and joint ventures 99 85 13 +16%Other gains and losses 4 (1) 5 -450%Income attributable to non-controlling interests (3) (3) (0) +8%Net Profit 345 326 20 +6%Net profit margin 29% 29%EBITDA 545 535 10 +2%EBITDA margin 46% 47%
Financial HighlightsIncome Statement
Key Points
• 4% increase in revenues and 5% increase in gross profit, mainly reflects chilled water performance.
• Results of associates and JVs increased by 16%, driven by Qatar Cool and Saudi Tabreed
• Finance costs up by AED 7m, with additional finance cost incurred on the debt raised to finance the
MCB repurchase partly offset by 2014 re-financing savings
Stable utility infrastructure business model enables consistent performance with EBITDA margins approaching 50%

Unaudited Consolidated Financials (AED m) Dec 2015 Dec 2014 Variance %
Fixed Assets 6,766 6,679 87 +1%
Associates and Joint Ventures 714 651 63 +10%
Accounts Receivable 410 467 (57) -12%
Cash and Short Term Deposits 177 418 (241) -58%
Other Assets 167 120 47 +39%
Total Assets 8,233 8,335 (102) -1%
Equity and Reserves 2,453 2,480 (27) -1%
Mandatory Convertible Bonds – equity portion 1,773 2,450 (678) -28%
Debt 3,274 2,662 612 +23%
Other Liabilities 733 742 (9) -1%
Total Liabilities and Equity 8,233 8,335 (102) -1%
Tabreed Analyst Presentation 2015
Financial HighlightsFinancial Position
12
Key Points
• Growth in fixed assets represents continuing investment in Dubai Parks and Resort plant and otherprojects under construction
• Capital structure optimisation achieved via repurchase of MCBs and replacement with new debt• Reduction in equity is due to payment of 5 fils dividend paid to all shareholders in April• Assets held for sale represents one of our value chain subsidiaries in UAE and plot of land in Oman
Balance sheet continues to show strength and positions Tabreed well for further growth
Tabreed Analyst Presentation 2015
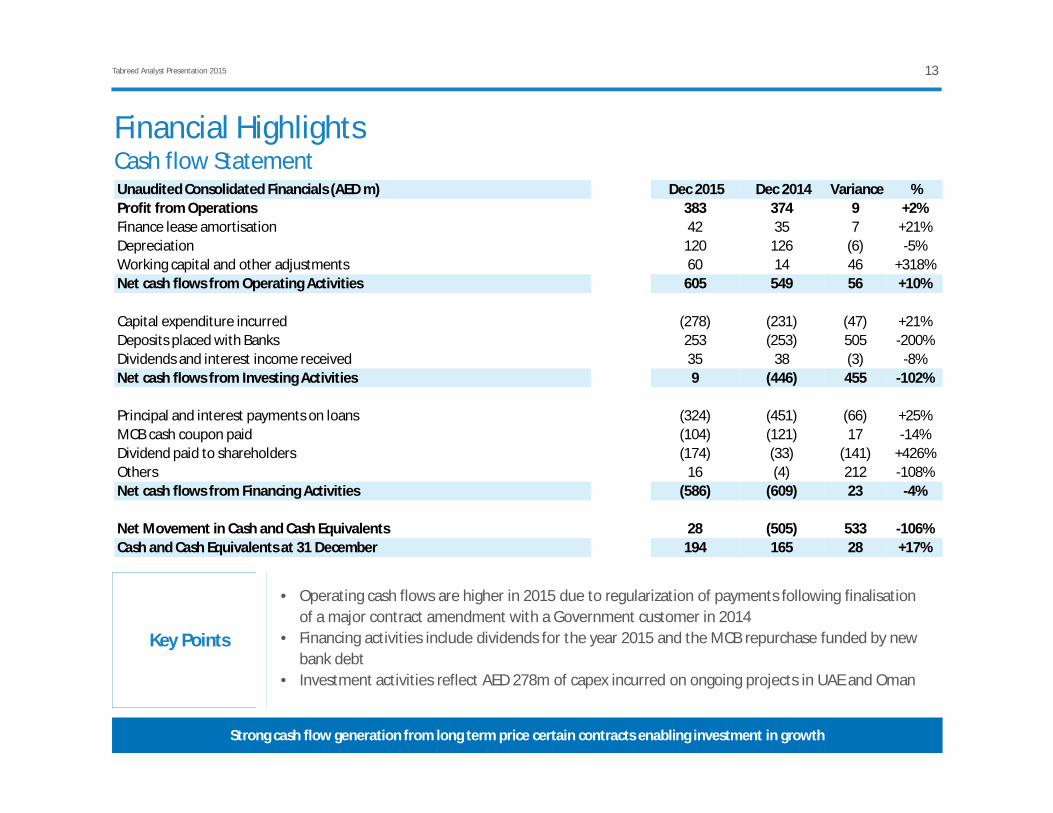
Financial HighlightsCash flow Statement
13
Key Points
• Operating cash flows are higher in 2015 due to regularization of payments following finalisationof a major contract amendment with a Government customer in 2014
• Financing activities include dividends for the year 2015 and the MCB repurchase funded by newbank debt
• Investment activities reflect AED 278m of capex incurred on ongoing projects in UAE and Oman
Strong cash flow generation from long term price certain contracts enabling investment in growth
Unaudited Consolidated Financials (AED m) Dec 2015 Dec 2014 Variance %Profit from Operations 383 374 9 +2%Finance lease amortisation 42 35 7 +21%Depreciation 120 126 (6) -5%Working capital and other adjustments 60 14 46 +318%Net cash flows from Operating Activities 605 549 56 +10%
Capital expenditure incurred (278) (231) (47) +21%Deposits placed with Banks 253 (253) 505 -200%Dividends and interest income received 35 38 (3) -8%Net cash flows from Investing Activities 9 (446) 455 -102%
Principal and interest payments on loans (324) (451) (66) +25%MCB cash coupon paid (104) (121) 17 -14%Dividend paid to shareholders (174) (33) (141) +426%Others 16 (4) 212 -108%Net cash flows from Financing Activities (586) (609) 23 -4%
Net Movement in Cash and Cash Equivalents 28 (505) 533 -106%Cash and Cash Equivalents at 31 December 194 165 28 +17%

Tabreed Analyst Presentation 2015
Chilled Water Performance 2015Gross Capacity (kRT) Chilled Water Revenue (AED m)
Chilled Water Profit From Operations (AED m)
UAE Qatar KSA OtherGCC
Total
Revenue 1,060 - - 43 1,103
Operating Costs (545) - - (32) (577)
Gross Profit 515 - - 11 526
Gross Profit Margin 49% - - 26% -
Profit fromOperations 366 - - 4 370
Share of Results ofAssociates 24 47 28 - 99
14
20152013
CAGR +3%
2014
1,0351,103
1,027
2012
1,011
690689
2013 2014
956
284
974
267
2015
839
612
767203
2012
155
636
CAGR +8%
UAEGCC
370359348347
35%
2013
32%
2012
33% 34%
2014 2015
Margin Profit from Operations
UAE is the foundation for consistent performance with exciting opportunities in GCC to materialize
Chilled Water Geographical Breakdown (AED m)

Borrower Type Amount(AED m)
Undrawn amount(AED m)
Currency Interest Hedging(%)
Maturity
Tabreed Term loan 2,895 - AED EIBOR + margin 55 2021
Tabreed Revolver - 450 AED EIBOR + margin - 2021
Bahrain DCCompany
Term loan 134 - USD LIBOR + margin - 2019
TabreedOman
Term loan 33 5 OR Fixed 100 2024
Total 3,062 455 53
• Tabreed’s current gearing is 44% (debt: debt + equity), approaching global utility peers• 95% of Tabreed’s debt is denominated in AED, with the balance in USD and OR, in line with cash flow generation profile• Virtually all the debt is floating rate with 53% of total debt hedged into fixed rates• Weighted average loan life is 5.2 years, with 64% of the debt portfolio maturing in 2021
Debt position (AED in millions)
Tabreed Analyst Presentation 2015
Debt Portfolio
15
Manageable debt portfolio with major repayments due in 2021
Agenda
A | Introduction and Performance Highlights – Jasim Thabet, CEOB | Financial Results – Steve Ridlington, CEOC | Conclusion – Jasim Thabet, CEO

Key Recent Developments
June 2014NewAgreementsigned withUAF valued atAED 6 billion
July 2014Acquisition ofa 30 yearconcession onAl MaryahIsland inpartnershipwith MIP with43kRTcurrentlyconnected
Sep 2014Concessionsigned withMeraas forDubai Parksdevelopment
Dec 2014Re-financingof AED 2.6 bnof loans withincreasedtenor and upto 25%reduction inmargin
Jan 201530-yearcontractrenewed withAldar andframeworkset out forfutureconnections
April 20155 fils dividendpaid for 3rdconsecutiveyear
July 2015Repurchased28% of MCBsfinanced withnew bankloan
December2015AED 193mLong-termprojectfinancing dealsigned forDubai Parksplant
Tabreed has achieved significant business and investors objectives in the past 18 months
2015 announcements
Tabreed Analyst Presentation 2015 17

In Conclusion
Why Tabreed
• One of the largest district cooling companies in the world• Track record of delivering infrastructure projects on time• Proven operations track record and industry leading O&M team• Long-term, stable, price certain contracts with guaranteed returns• Over 50% of UAE capacity contracted to Government entities
Core BusinessFocus Delivering
Value
• Focus on Chilled Water leading to enhanced value from existing plants while maximizing operationalefficiencies
• Stable utility business model ensure consistent results• Investing in sanctioned projects on “take or pay” billing basis to reduce real estate risk• Project financing new plants to reduce equity capital and increase shareholder returns
Robust FinancialResults
• 2015 Net Profit of AED 345m, up 6% on 2014 and growing at 12% annually since 2012• Strong cash generating ability, sufficient to fund growth capex and dividends• Group EBITDA of AED 545m and operating cash flows of AED 605m allowing for investment in new
projects and increasing dividend payout
Why DistrictCooling
Delivering growth
• GCC economies continue to grow and district cooling is a vital component of economic growth• Over 200 kRT increase in contracted capacity since 2012 and a further ~100 kRT of fully contracted
capacity currently under construction in UAE (Dubai Parks and others), Qatar and Oman• Agreement signed with Qatar Railways to provide cooling to 7 metro stations in Doha starting 2019
• Air conditioning is a critical part of the GCC infrastructure• District Cooling enables a 50% reduction in energy consumption, carbon footprint and state subsidies• District Cooling is 16% cheaper than conventional cooling
Tabreed Analyst Presentation 2015 18

Questions
IR Contacts
Tabreed Analyst Presentation 2015
Faisal Tahir BhattiSenior Analyst
Ahmed Al NowaisSenior Manager
Tel: +971 2 2020336Email: [email protected]
Tel: +971 2 2020333Email: [email protected]
20