2015 Privacy Professionals Salary Survey · Salary by Organization The majority of respondents, 22...
74
2015 Privacy Professionals Salary Survey
Transcript of 2015 Privacy Professionals Salary Survey · Salary by Organization The majority of respondents, 22...
2015 Privacy Professionals Salary Survey
1

2 Research Objectives and Method
1 Executive Summary
4 Median Salary Data
7 EU
3 Sample Profile: Demographics and Experience
6 U.S.
5 Historical Salary Trends
8 Canada
9 Gender Analysis
Contents
2 21. Executive Summary
Privacy Professionals Salary ProfilesDuring the first weeks of 2015, the IAPP fielded its periodic salary survey to the 25,000+ privacy professionals in the IAPP’s database, working with third-party research firm Fondulas Strategic Research to track, over time, salary ranges, roles and median salaries for the world’s privacy professionals.
The survey took a median length of 23 minutes to complete, with participants responding to questions on salaries, bonuses, raises and the operational aspects of their privacy organizations (more to come on that last part). Respondents from all regions were asked to supply salary-related information in U.S. dollars for consistency of comparison across regions. Specific information on each region is detailed in the individual sections that follow the main portion of the results. For some questions, sample sizes for salary information are larger than those who provided personal information, such as gender, so some discrepancies may exist between overall medians and those of segments.
This year, we received 1,305 responses from across the globe, with the largest portion from the U.S., followed by Canada and Europe, and with additional responses from Latin America, Africa, the Middle East, Asia and Australia/New Zealand.
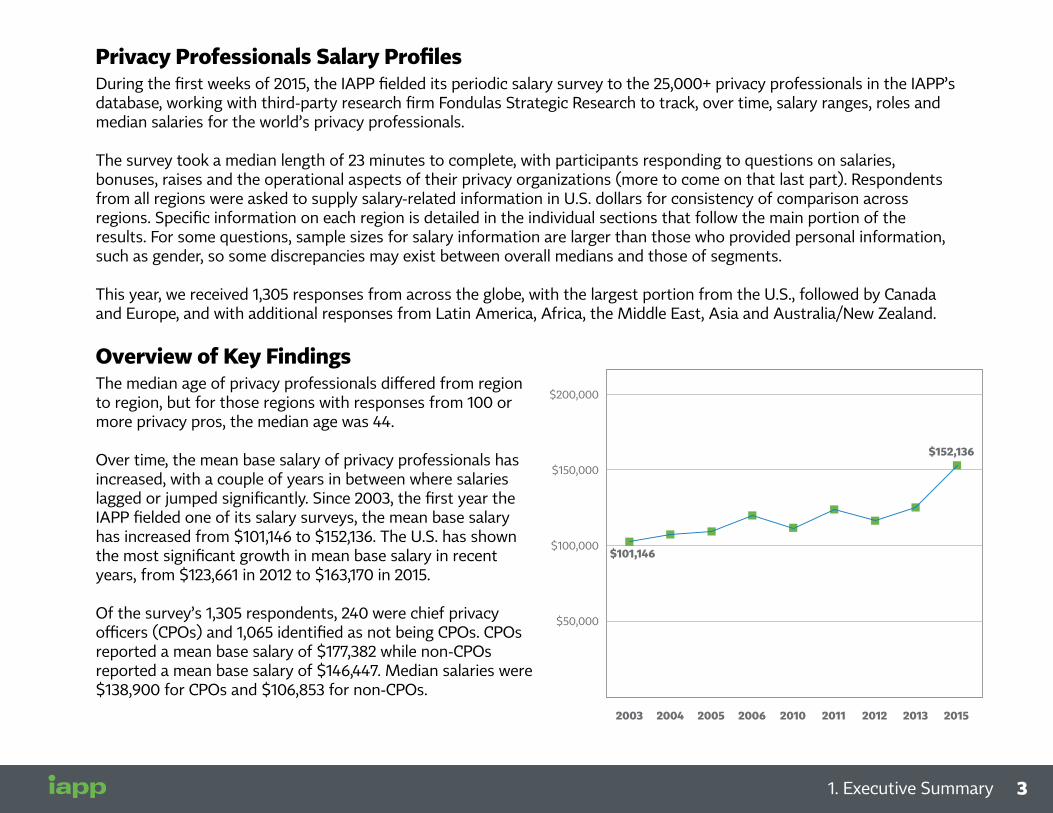
Overview of Key FindingsThe median age of privacy professionals differed from region to region, but for those regions with responses from 100 or more privacy pros, the median age was 44.
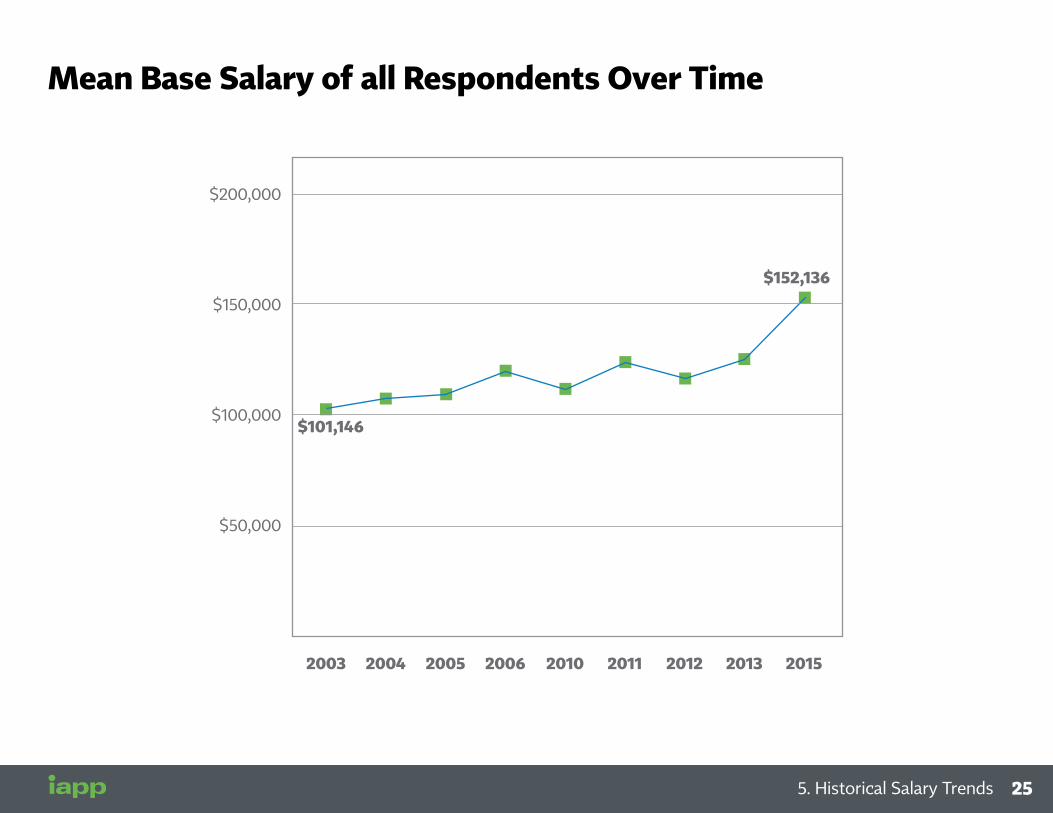
Over time, the mean base salary of privacy professionals has increased, with a couple of years in between where salaries lagged or jumped significantly. Since 2003, the first year the IAPP fielded one of its salary surveys, the mean base salary has increased from $101,146 to $152,136. The U.S. has shown the most significant growth in mean base salary in recent years, from $123,661 in 2012 to $163,170 in 2015.
Of the survey’s 1,305 respondents, 240 were chief privacy officers (CPOs) and 1,065 identified as not being CPOs. CPOs reported a mean base salary of $177,382 while non-CPOs reported a mean base salary of $146,447. Median salaries were $138,900 for CPOs and $106,853 for non-CPOs.
Mean Base Salary of all Respondents Over Time
2003 2004 2005 2006 2010 2011 2012 2013 2015
$200,000
$150,000
$100,000
$50,000
$101,146
$152,136
21331. Executive Summary
Salary by Organization The majority of respondents, 22 percent, reported working for firms of between 5,000 and 24,999 employees. However, organizations of all sizes were well represented in the survey, with the smallest firms of fewer than 100 employees receiving 10 percent of the responses and all other firms represented by between 15 and 19 percent of respondents. Overall, the largest number of responses came from the Software and Services industry, with 19 percent of privacy pros reporting they work in that field. Not surprisingly, the organizations with the largest number of employees at 75,000 or more had the highest median salary at $123,000, while those with the fewest number of employees—under 100—had the lowest median salary at $94,278.
For median salary by industry, the highest earners were in the Media sector at $138,000, followed by Drugs and Biotechnology at $135,835. Government and Education and Academia reported the lowest median salaries at $87,065 and $83,533, respectively. In sectors with more than 25 responses, “Conglomerates” showed the most significant increase in salaries for privacy professionals since 2013. In that sector, the mean base salary increased from $127,228 to $440,661. However, several sectors—Education and Academia, Healthcare, Insurance, Media, Retail, Software and Services, Tech Hardware and Equipment and Telecom—showed decreases in mean base salaries from 2013 to this year.
Experience and PositionLooking at salary by experience, the highest earners reported $653,911 for mean base salary in 2015 and fell into the category of those with between 16 and 20 years of experience. However, it is important to note this sample size was one of the smallest with seven respondents, compared to 541 respondents in the zero to five years of experience range. At that level the mean base salary was reported at $135,739 for 2015.
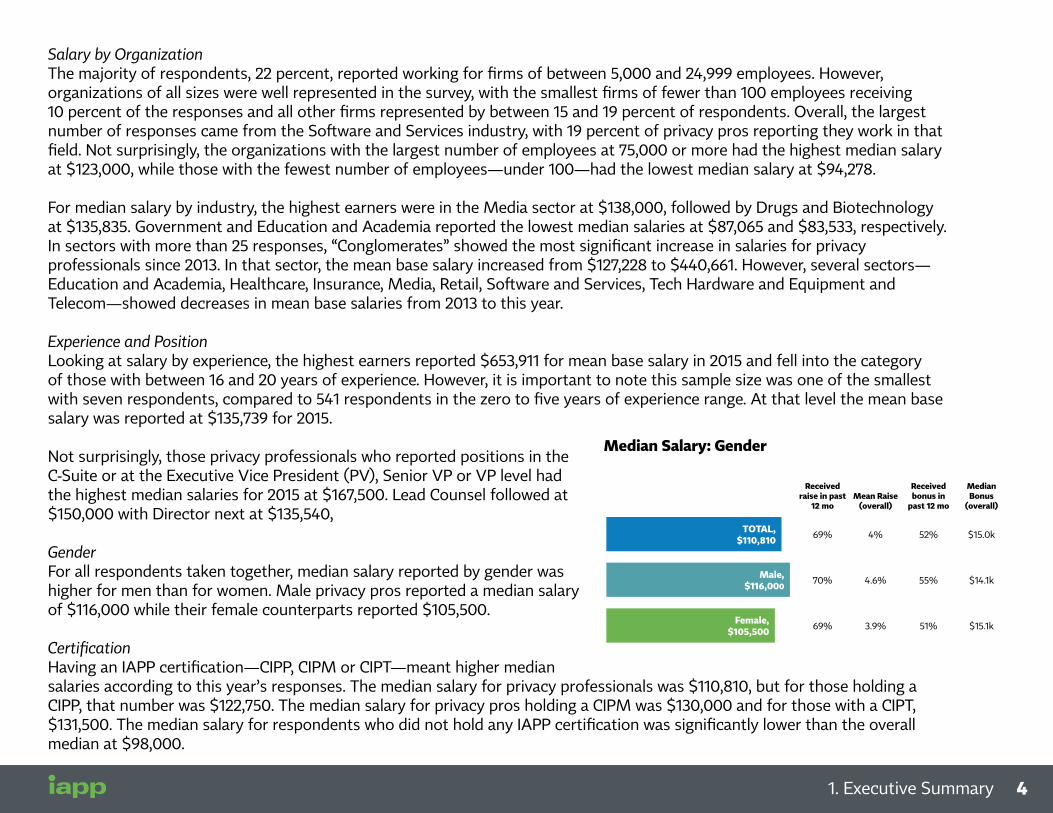
Not surprisingly, those privacy professionals who reported positions in the C-Suite or at the Executive Vice President (PV), Senior VP or VP level had the highest median salaries for 2015 at $167,500. Lead Counsel followed at $150,000 with Director next at $135,540,
GenderFor all respondents taken together, median salary reported by gender was higher for men than for women. Male privacy pros reported a median salary of $116,000 while their female counterparts reported $105,500.
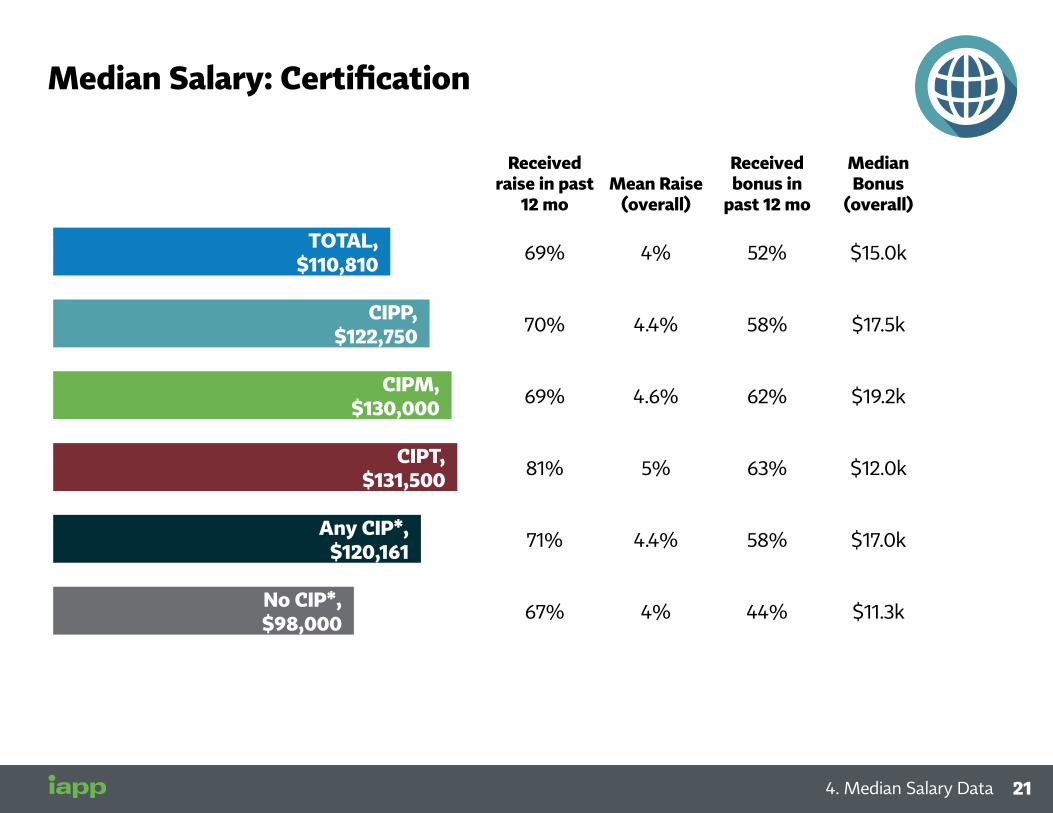
CertificationHaving an IAPP certification—CIPP, CIPM or CIPT—meant higher median salaries according to this year’s responses. The median salary for privacy professionals was $110,810, but for those holding a CIPP, that number was $122,750. The median salary for privacy pros holding a CIPM was $130,000 and for those with a CIPT, $131,500. The median salary for respondents who did not hold any IAPP certification was significantly lower than the overall median at $98,000.
Median Salary: Gender
Received raise in past
12 moMean Raise
(overall)
Received bonus in
past 12 mo
Median Bonus
(overall)
TOTAL, $110,810 69% 4% 52% $15.0k
Male, $116,000
70% 4.6% 55% $14.1k
Female, $105,500 69% 3.9% 51% $15.1k
Note: Sample sizes for salary information are larger than those who provided personal information, such as gender, so some discrepancies may exist between overall medians and those of segments.
124 41. Executive Summary

2 Research Objectives and Method
1 Executive Summary
4 Median Salary Data
7 EU
3 Sample Profile: Demographics and Experience
6 U.S.
5 Historical Salary Trends
8 Canada
9 Gender Analysis
552. Research Objectives and Method

Research ObjectivesThe overarching goal of this research was to track, over time, the typical salary range and median salary for privacy professionals.
This research will also help understand how salaries vary across geography, demographics and firmographics.
6 62. Research Objectives and Method
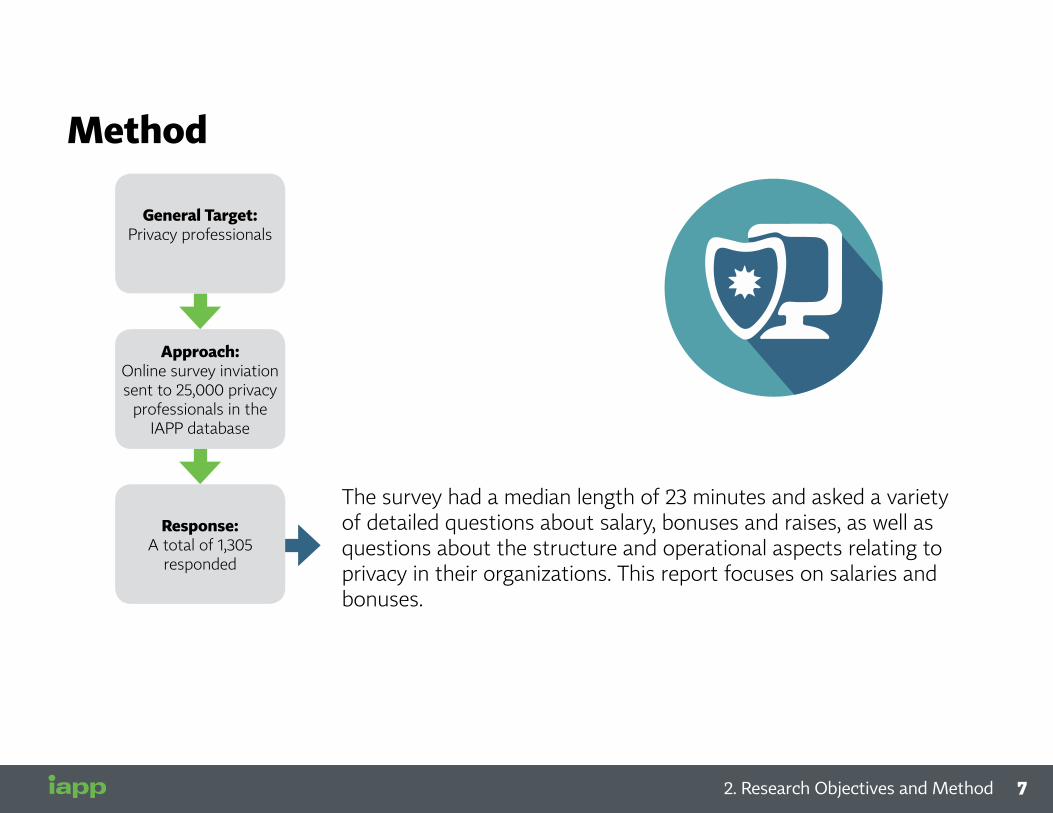
Method
The survey had a median length of 23 minutes and asked a variety of detailed questions about salary, bonuses and raises, as well as questions about the structure and operational aspects relating to privacy in their organizations. This report focuses on salaries and bonuses.
Approach: Online survey inviation sent to 25,000 privacy
professionals in the IAPP database
General Target: Privacy professionals
Response: A total of 1,305
responded
772. Research Objectives and Method
2 Research Objectives and Method
1 Executive Summary
4 Median Salary Data
7 EU
3 Sample Profile: Demographics and Experience
6 U.S.
5 Historical Salary Trends
8 Canada
9 Gender Analysis
8 83. Sample Profile: Demographics and Experience

Sample Profile: Demographics and Experience
RESPONDENTS LOCATED IN…
# INTERVIEWS
MEDIAN AGE MALE FEMALE
United States 880 44 50% 50%
Canada 198 45 35% 65%
Europe (EU) 166 43 68% 32%
Europe (Non-EU) 12 49 57% 43%
Latin America 9 37 80% 20%
Africa 2 30 100% 0%
Middle East 4 40 75% 25%
Asia 17 43 80% 20%
Australia/New Zealand 17 50 55% 45%
993. Sample Profile: Demographics and Experience

Sample Profile: Certifications, Experience in Privacy
TOTAL U.S. CANADA EU
CIPP 55% 60% 47% 47%
CIPM 13% 13% 6% 17%
CIPT 10% 11% 6% 7%
No CIP* certification 38% 34% 48% 44%
IAPP member 88% 90% 87% 82%
Mean Years Experience in Privacy 8.2 7.8 9.1 8.5
10 103. Sample Profile: Demographics and Experience
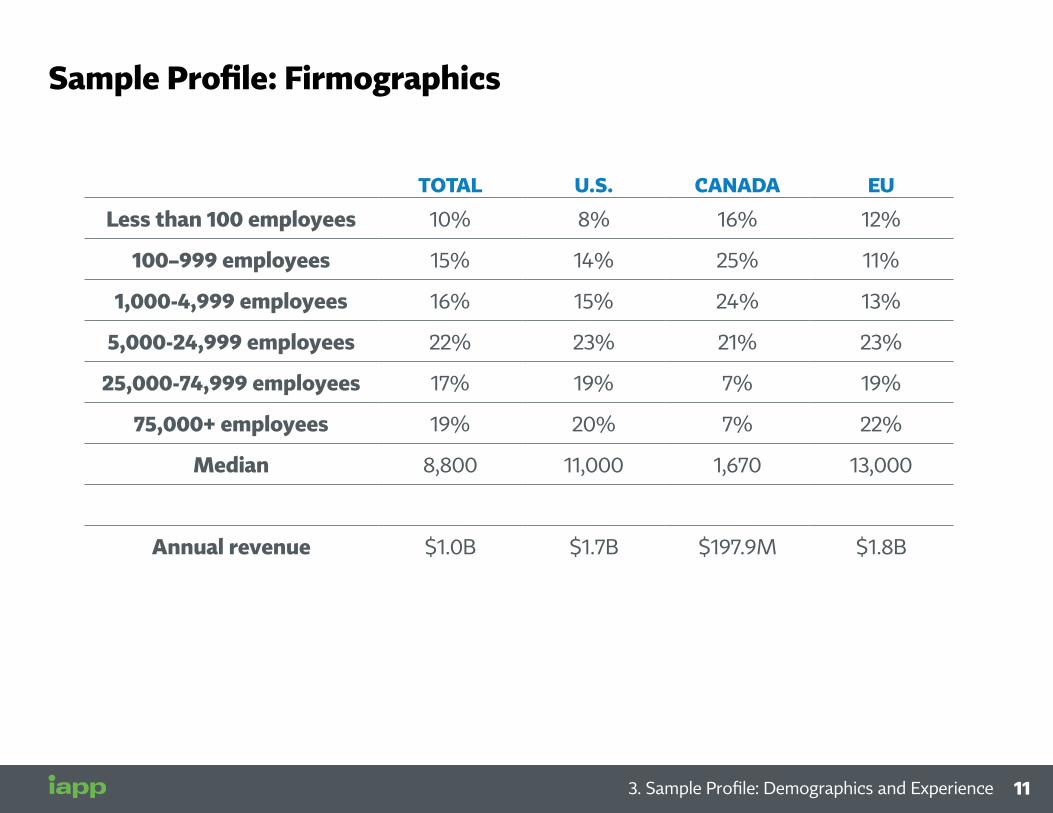
Sample Profile: Firmographics
TOTAL U.S. CANADA EU
Less than 100 employees 10% 8% 16% 12%
100–999 employees 15% 14% 25% 11%
1,000-4,999 employees 16% 15% 24% 13%
5,000-24,999 employees 22% 23% 21% 23%
25,000-74,999 employees 17% 19% 7% 19%
75,000+ employees 19% 20% 7% 22%
Median 8,800 11,000 1,670 13,000
Annual revenue $1.0B $1.7B $197.9M $1.8B
11113. Sample Profile: Demographics and Experience
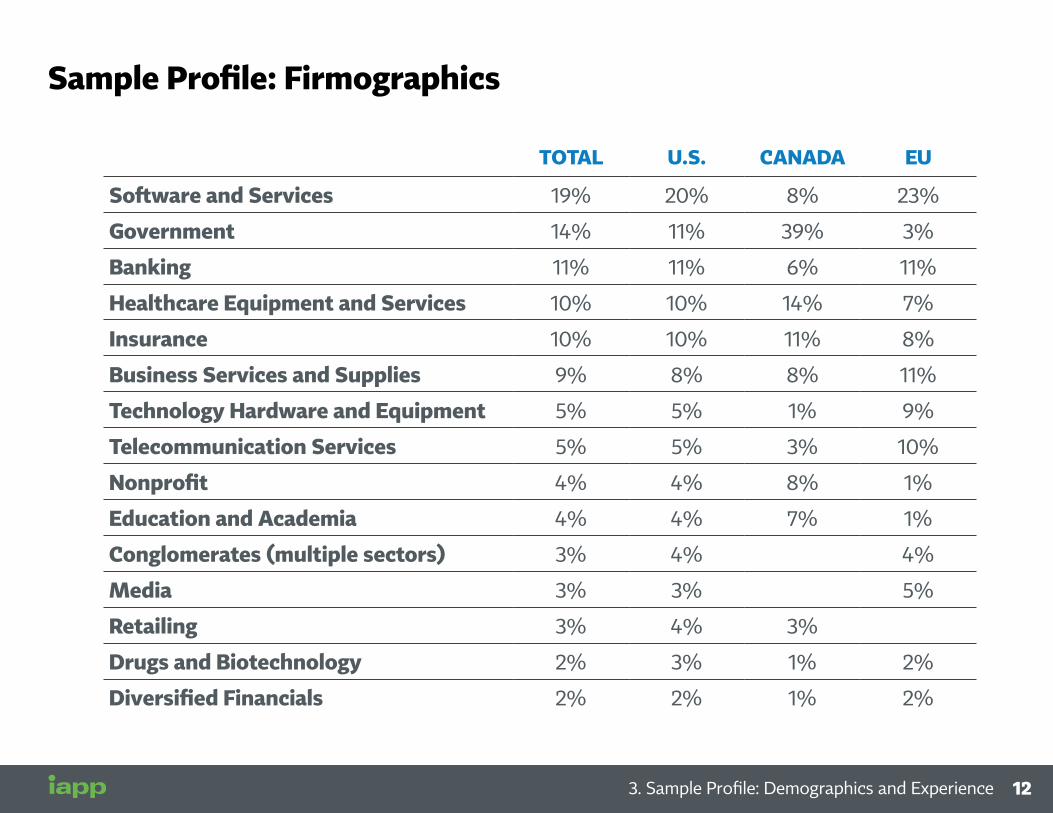
Sample Profile: Firmographics
TOTAL U.S. CANADA EU
Software and Services 19% 20% 8% 23%
Government 14% 11% 39% 3%
Banking 11% 11% 6% 11%
Healthcare Equipment and Services 10% 10% 14% 7%
Insurance 10% 10% 11% 8%
Business Services and Supplies 9% 8% 8% 11%
Technology Hardware and Equipment 5% 5% 1% 9%
Telecommunication Services 5% 5% 3% 10%
Nonprofit 4% 4% 8% 1%
Education and Academia 4% 4% 7% 1%
Conglomerates (multiple sectors) 3% 4% 4%
Media 3% 3% 5%
Retailing 3% 4% 3%
Drugs and Biotechnology 2% 3% 1% 2%
Diversified Financials 2% 2% 1% 2%
12 123. Sample Profile: Demographics and Experience

Sample Profile: Currency Conversions
• The following charts convert global currencies to United States dollars for comparison. The following exchange rates were used:
US$1 = Cdn$ 0.7915 US$1 = € 1.1295
US$1 = Aus$ 0.7713 US$1 = NZ$ 0.7380
13133. Sample Profile: Demographics and Experience

2 Research Objectives and Method
1 Executive Summary
4 Median Salary Data
7 EU
3 Sample Profile: Demographics and Experience
6 U.S.
5 Historical Salary Trends
8 Canada
9 Gender Analysis
14 144. Median Salary Data

Median Salary: Region
Received raise in past
12 moMean Raise
(overall)
Received bonus in
past 12 mo
Median Bonus
(overall)
TOTAL, $110,810 69% 4.0% 52% $15.0k
U.S., $126,992 73% 4.5% 58% $17.0k
Canada, $74,005 64% 2.2% 30% $7.9k
EU, $89,739 58% 3.2% 53% $11.3k
15154. Median Salary Data

Median Salary: Gender
Received raise in past
12 moMean Raise
(overall)
Received bonus in
past 12 mo
Median Bonus
(overall)
TOTAL, $110,810 69% 4% 52% $15.0k
Male, $116,000
70% 4.6% 55% $14.1k
Female, $105,500 69% 3.9% 51% $15.1k
Note: Sample sizes for salary information are larger than those who provided personal information, such as gender, so some discrepancies may exist between overall medians and those of segments.
16 164. Median Salary Data

Median Salary: Industry
Received raise in past
12 moMean Raise
(overall)
Received bonus in
past 12 mo
Median Bonus
(overall)
TOTAL, $110,810 69% 4% 52% $15.0k
Media,$138,000 66% 4.9% 66% $15.8k
Drugs and Biotechnology, $135,835 81% 2.1% 87% $30.1k
Conglomerates $124,946 70% 5.4% 60% $14.0k
Business Services and Supplies, $117,390 61% 4.8% 50% $11.1k
Software and Services, $116,774 64% 4.4% 54% $13.9k
Banking, $116,000 68% 4.1% 73% $16.0k
Diversified Financials, $113,000 70% 3.4% 70% $19.2k
17174. Median Salary Data

Median Salary: Industry, (cont.)
Received raise in past
12 moMean Raise
(overall)
Received bonus in
past 12 mo
Median Bonus
(overall)
TOTAL, $110,810 69% 4% 52% $15.0k
Technology Hardware and Equipment,$111,950 66% 3.3% 62% $11.3k
Telecommunication Services, $107,216 67% 4.5% 66% $11.3k
Retail, $106,426 76% 5% 70% $17.7k
Insurance,$102,000 81% 4.4% 66% $15.0k
Healthcare Equipment and Services, $100,000 71% 4.3% 44% $14.7k
Nonprofit, $94,850 72% 6.6% 25% $6.7k
Government, $87,065 63% 2.3% 20% $1.9k
Education and Academia, $83,533 67% 3.4% 11% $10.0k
18 184. Median Salary Data

Median Salary: Number of Employees
Received raise in past
12 moMean Raise
(overall)
Received bonus in
past 12 mo
Median Bonus
(overall)
TOTAL, $110,810 69% 4% 52% $15.0k
Less than 100,$94,278 53% 5.3% 20% $10.0k
100–999, $94,469 64% 4.1% 38% $13.5k
1,000–4,999, $104,956 71% 4.6% 45% $11.3k
5,000–24,999, $112,950 75% 3.8% 61% $16.4k
25,000–74,999,$120,000 72% 3.5% 65% $18.6k
75,000+, $123,000 72% 3.6% 65% $14.0k
19194. Median Salary Data

Median Salary: CPO/Non-CPO
Received raise in past
12 moMean Raise
(overall)
Received bonus in
past 12 mo
Median Bonus
(overall)
TOTAL, $110,810 69% 4% 52% $15.0k
CPO, $138,900 72% 3.9% 57% $32.5k
Non-CPO, $106,853 69% 4.1% 51% $12.0k
Mean Base Salary of CPOs vs. Non-CPOs
CPOs - $177,382 (240)Non-CPOs - $146,447 (1,065)
20 204. Median Salary Data
Median Salary: Certification
Received raise in past
12 moMean Raise
(overall)
Received bonus in
past 12 mo
Median Bonus
(overall)
TOTAL, $110,810 69% 4% 52% $15.0k
CIPP, $122,750 70% 4.4% 58% $17.5k
CIPM, $130,000 69% 4.6% 62% $19.2k
CIPT, $131,500 81% 5% 63% $12.0k
Any CIP*, $120,161 71% 4.4% 58% $17.0k
No CIP*, $98,000 67% 4% 44% $11.3k
21214. Median Salary Data

Median Salary: Position
Received raise in past
12 moMean Raise
(overall)
Received bonus in
past 12 mo
Median Bonus
(overall)
TOTAL, $110,810 69% 4% 52% $15.0k
C-Suite, EVP, SVP, VP, $167,500 70% 5% 70% $39.8k
Director, $135,540 74% 4.7% 61% $23.8k
Lead Counsel, $150,000 54% 3.6% 54% $20.8k
Manager, $102,000 70% 3.3% 54% $9.6k
Below Manager, $80,074 70% 3.7% 41% $6.0k
22 224. Median Salary Data

Median Salary: Internal/External
Received raise in past
12 moMean Raise
(overall)
Received bonus in
past 12 mo
Median Bonus
(overall)
TOTAL, $110,810 69% 4% 52% $15.0k
Internal, $112,000 71% 3.6% 57% $15.9k
External, $105,000 59% 5.9% 34% $9.6k
Outside Advisor, $120,000 55% 7% 40% $10.0k
Internal: Private-sector in-house, Government in-house, In-house ITExternal: Regulator, Researcher or academic, External privacy advisor, Vendor, Privacy advocateOutside advisor: Work as a privacy consultant, attorney, barrister or auditor on the privacy needs of other companies.
23234. Median Salary Data

2 Research Objectives and Method
1 Executive Summary
4 Median Salary Data
7 EU
3 Sample Profile: Demographics and Experience
6 U.S.
5 Historical Salary Trends
8 Canada
9 Gender Analysis
24 245. Historical Salary Trends
Mean Base Salary of all Respondents Over Time
2003 2004 2005 2006 2010 2011 2012 2013 2015
$200,000
$150,000
$100,000
$50,000
$101,146
$152,136
25255. Historical Salary Trends
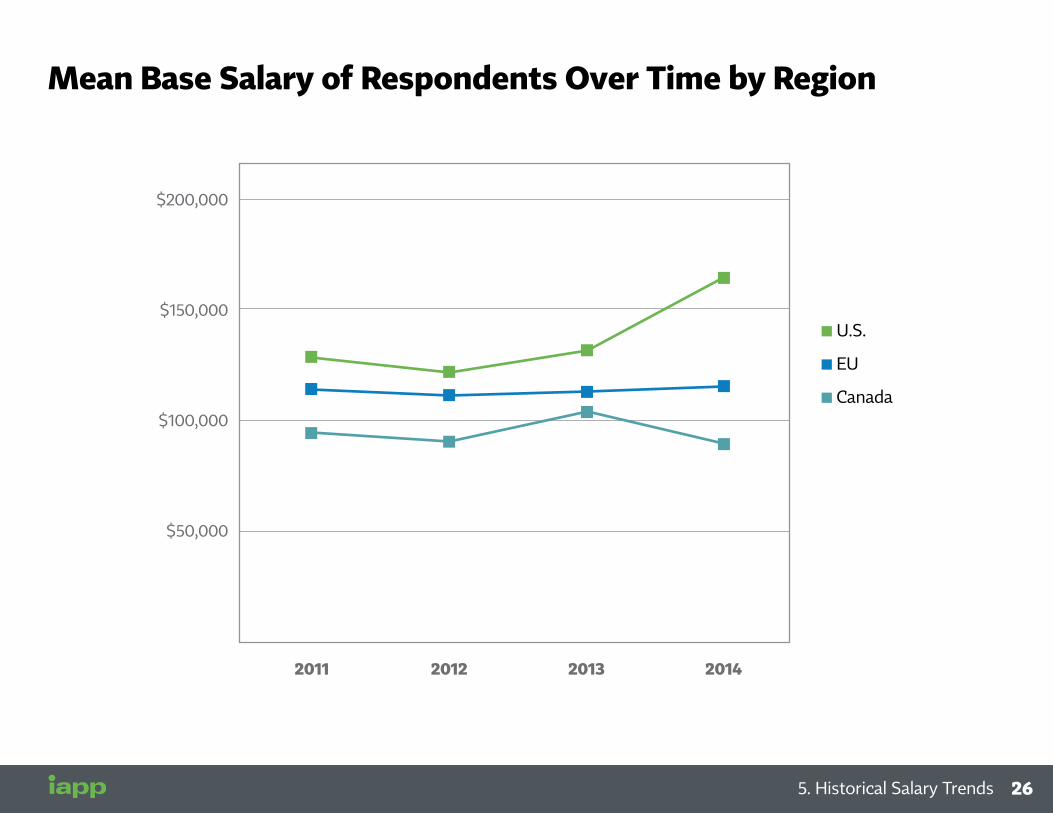
Mean Base Salary of Respondents Over Time by Region
2011 2012 2013 2014
$200,000
$150,000
$100,000
$50,000
U.S.
EU
Canada
26 265. Historical Salary Trends

Mean Base Salary by Sector Over Time (greater than 25 responses)
2013 2015
Business Services and Supplies $138,886 $158,801
Conglomerates $127,228 $440,661
Diversified Financials $131,122 $144,356
Drugs and Biotech $139,810 $150,656
Education and Academia $101,822 $99,083
Government $104,877 $173,986
Healthcare $115,652 $109,169
Insurance $122,478 $115,269
Media $162,901 $151,127
Nonprofit $95,980 $154,439
Retail $121,165 $115,287
Software and Services $141,161 $134,526
Tech Hardware and Equipment $136,598 $130,745
Telecom $128,399 $118,966
27275. Historical Salary Trends

Mean Base Salary by Certification Over Time
2012 2013 2015
CIPP/C $115,586 $116,549 $100,359
CIPP/E $215,000 $122,660 $131,824
CIPP/G $119,534 $125,138 $162,565
CIPP/IT $116,152 $122,130 $143,886
CIPP/US $127,870 $138,369 $149,530
CIPM N/A N/A $145,604
28 285. Historical Salary Trends
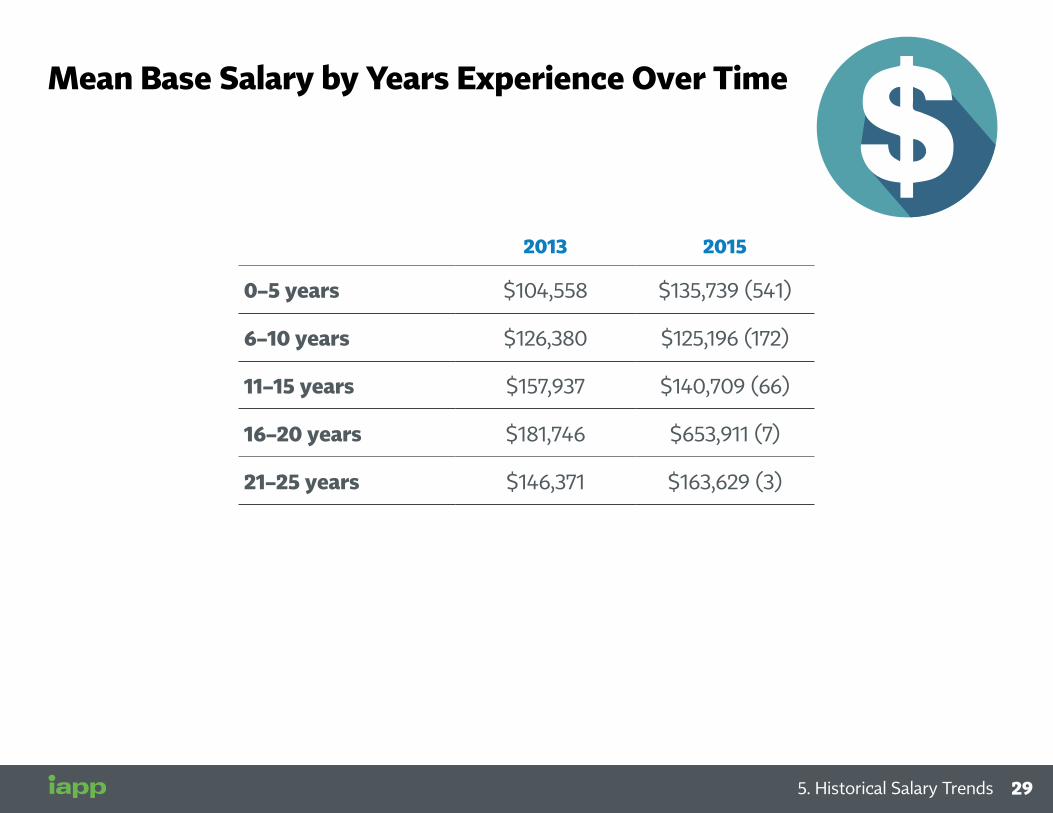
Mean Base Salary by Years Experience Over Time
2013 2015
0–5 years $104,558 $135,739 (541)
6–10 years $126,380 $125,196 (172)
11–15 years $157,937 $140,709 (66)
16–20 years $181,746 $653,911 (7)
21–25 years $146,371 $163,629 (3)
29295. Historical Salary Trends
2 Research Objectives and Method
1 Executive Summary
4 Median Salary Data
7 EU
3 Sample Profile: Demographics and Experience
6 U.S.
5 Historical Salary Trends
8 Canada
9 Gender Analysis
30 306. U.S.

Executive SummaryOf the 1,305 respondents to the 2015 IAPP Privacy Professionals Salary Survey, 880 identified as U.S.-based privacy professionals, the largest regional group of respondents to this year’s survey.
In this section of the report, we focus specifically on the salary and bonus information provided by our U.S. respondents, also providing context from past surveys. In the U.S., the median age of the privacy professional is 44 and the median salary is $126,992.
The survey also shows:• Of our U.S. respondents, 50 percent were male and 50 percent female.
• Asked about their certifications, 60 percent responded they held a CIPP, with 13 percent holding a CIPM and 11 percent a CIPT. Additionally, 34 percent reported holding a non-IAPP certification.
• The majority of respondents, 90 percent, were IAPP members.
• Their mean number of years working in privacy was 7.8 years.
Taking a closer look at the salary numbers, while the overall median for respondents was $126,992, male privacy pros reported earning $5,000 more annually than their female counterparts. The median salary reported by male respondents was $130,000 and for females, $125,000.
Having an IAPP certification resulted in higher salaries; respondents who held a CIPP, CIPM or CIPT reported a median salary of $134,000, more than $7,000 higher than the overall median salary.
The industry privacy pros work in also affects salary. According to this year’s survey, the highest paid industries in the U.S. are Software and Services and Banking, each with a reported median salary of $130,000. Insurance had the lowest reported salaries in the U.S. with a median of $108,500.
Median Salary: Industry
Received raise in past
12 moMean Raise
(overall)
Received bonus in
past 12 mo
Median Bonus
(overall)
TOTAL, $126,992 73% 4.5% 58% $17.0k
Software and Services, $130,000 66% 4.6% 61% $16.0k
Government, $111,000 71% 2.6% 28% $1.8k
Banking, $130,000 76% 4.2% 78% $22.0k
Healthcare Equipment and Services, $120,000 75% 5.5% 54% $16.0k
Insurance, $108,500 87% 5.3% 71% $20.0k
3031316. U.S.

The median salary by size of organization followed the expected pattern overall in the U.S. with some small deviations. The highest median salaries were reported in organizations with 5,000 to 74,999 employees at $130,000, while those with 75,000 or more employees reported a slightly lower median salary of $128,500. The smallest organizations—with fewer than 100 employees—had a median salary of $115,500, while those with 100 to 999 had a median of $125,000 and those with 1,000 to 4,999 were slightly lower with a median salary of $122,750.
For chief privacy officers (CPOs) the median salary was $163,087, compared to $120,000 for privacy professionals who do not hold a CPO title.
To compare this year’s results with past salary surveys, we examined the mean base salaries, as opposed to the median numbers reported above.
This year’s responses averaged to a mean base salary of $163,170, compared to $131,891 in 2013 and $123,661 in 2012. Median Salary: CPO/Non-CPO
Received raise in past
12 moMean Raise
(overall)
Received bonus in
past 12 mo
Median Bonus
(overall)
TOTAL, $126,992 69% 4% 52% $15.0k
CPO, $163,087 72% 3.9% 57% $32.5k
Non-CPO, $120,000 69% 4.1% 51% $12.0k
32
32 326. U.S.
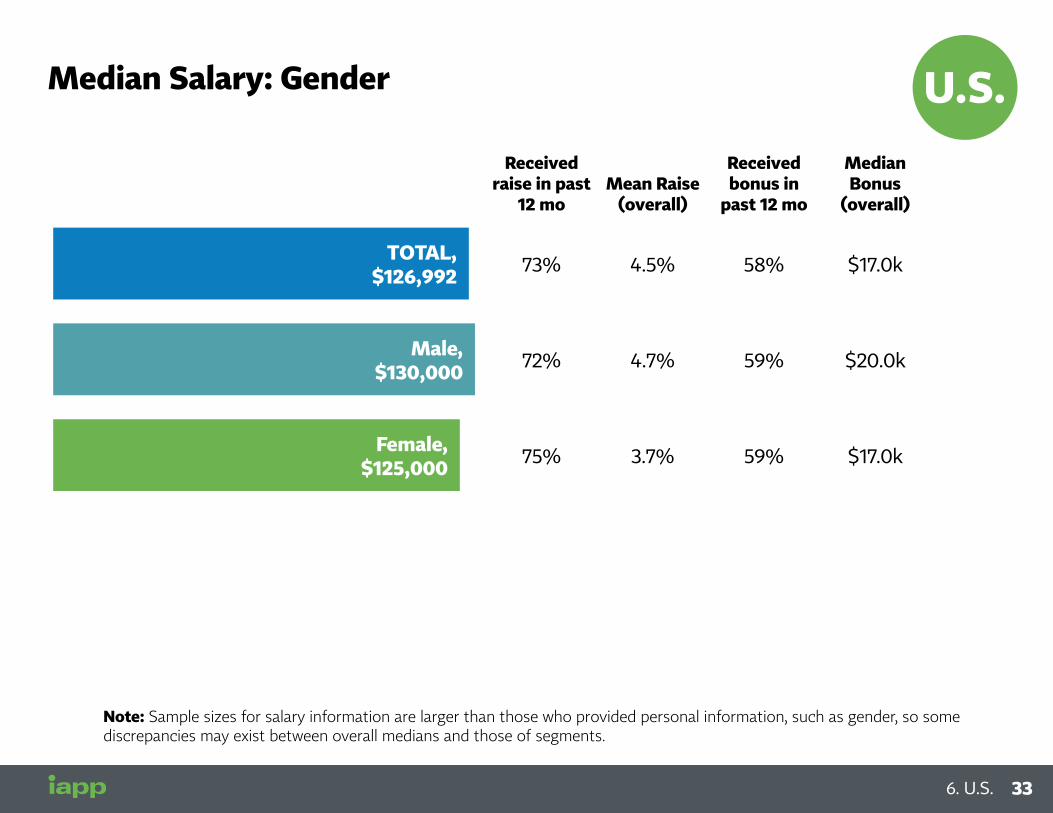
Median Salary: Gender
Received raise in past
12 moMean Raise
(overall)
Received bonus in
past 12 mo
Median Bonus
(overall)
TOTAL, $126,992 73% 4.5% 58% $17.0k
Male, $130,000 72% 4.7% 59% $20.0k
Female, $125,000 75% 3.7% 59% $17.0k
Note: Sample sizes for salary information are larger than those who provided personal information, such as gender, so some discrepancies may exist between overall medians and those of segments.
33336. U.S.
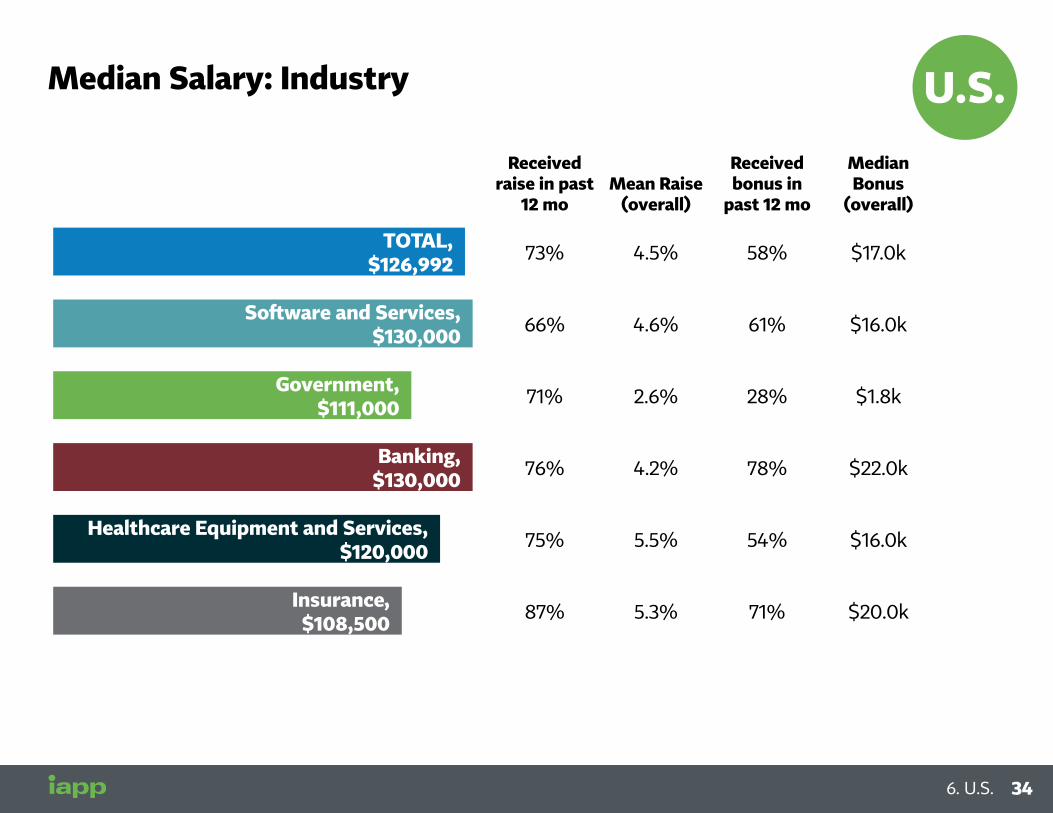
Median Salary: Industry
Received raise in past
12 moMean Raise
(overall)
Received bonus in
past 12 mo
Median Bonus
(overall)
TOTAL, $126,992 73% 4.5% 58% $17.0k
Software and Services, $130,000 66% 4.6% 61% $16.0k
Government, $111,000 71% 2.6% 28% $1.8k
Banking, $130,000 76% 4.2% 78% $22.0k
Healthcare Equipment and Services, $120,000 75% 5.5% 54% $16.0k
Insurance, $108,500 87% 5.3% 71% $20.0k
34 346. U.S.
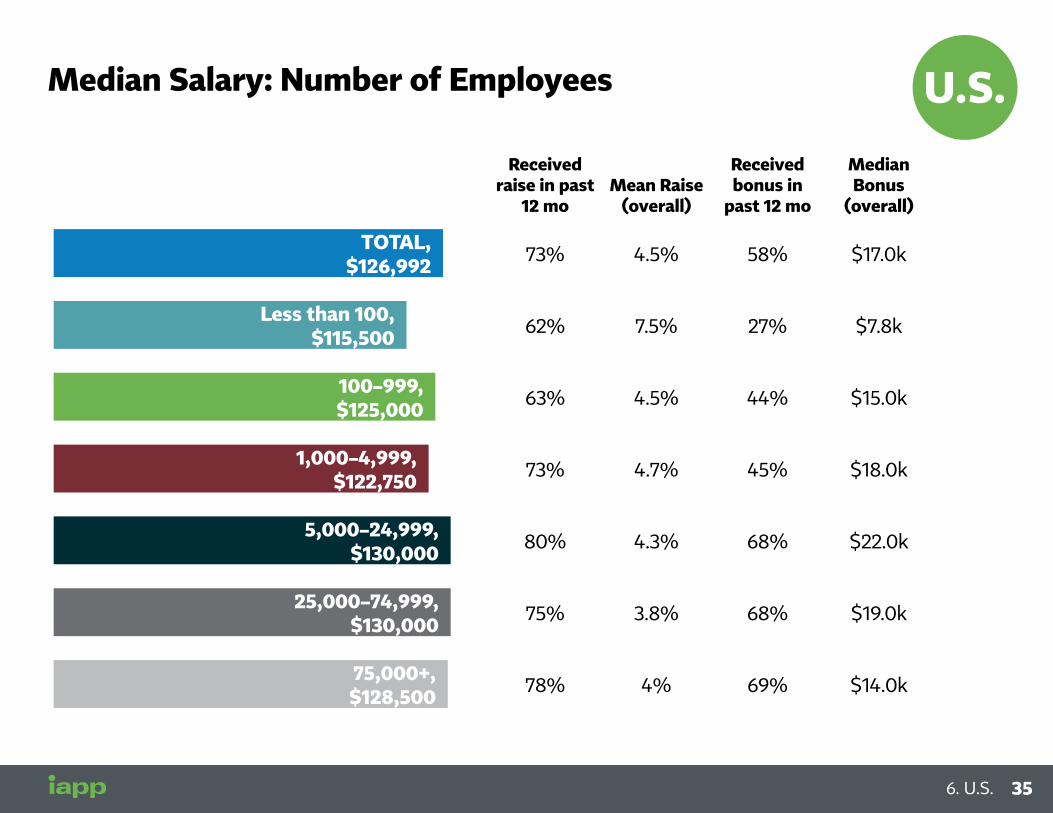
Median Salary: Number of Employees
Received raise in past
12 moMean Raise
(overall)
Received bonus in
past 12 mo
Median Bonus
(overall)
TOTAL, $126,992 73% 4.5% 58% $17.0k
Less than 100,$115,500 62% 7.5% 27% $7.8k
100–999, $125,000 63% 4.5% 44% $15.0k
1,000–4,999, $122,750 73% 4.7% 45% $18.0k
5,000–24,999, $130,000 80% 4.3% 68% $22.0k
25,000–74,999,$130,000 75% 3.8% 68% $19.0k
75,000+, $128,500 78% 4% 69% $14.0k
35356. U.S.

Median Salary: CPO/Non-CPO
Received raise in past
12 moMean Raise
(overall)
Received bonus in
past 12 mo
Median Bonus
(overall)
TOTAL, $126,992 69% 4% 52% $15.0k
CPO, $163,087 72% 3.9% 57% $32.5k
Non-CPO, $120,000 69% 4.1% 51% $12.0k
36 366. U.S.

Median Salary: Certification
Received raise in past
12 moMean Raise
(overall)
Received bonus in
past 12 mo
Median Bonus
(overall)
TOTAL, $126,992 73% 4.5% 58% $17.0k
Any CIP* (CIPP, CIPM, CIPT), $134,000 73% 4.8% 63% $20.0k
No CIP*, $111,950 74% 4.8% 52% $13.0k
37376. U.S.

Median Salary: Position
Received raise in past
12 moMean Raise
(overall)
Received bonus in
past 12 mo
Median Bonus
(overall)
TOTAL, $126,992 75% 4.5% 58% $17.0k
C-Suite, EVP, SVP, VP, $180,000 73% 4.9% 73% $45.0k
Director, $150,000 77% 5.4% 65% $30.0k
Lead Counsel, $165,000 61% 4.4% 50% $20.0k
Manager, $115,000 74% 3.6% 64% $10.0k
Below Manager, $94,675 76% 4.5% 49% $6.7k
38 386. U.S.

Median Salary: Internal/External
Received raise in past
12 moMean Raise
(overall)
Received bonus in
past 12 mo
Median Bonus
(overall)
TOTAL, $126,992 73% 4.5% 58% $17.0k
Internal, $127,500 74% 4% 63% $18.0k
External, $125,500 67% 7.1% 39% $9.6k
Outside Advisor, $130,000 63% 8.3% 41% $9.0k
Internal: Private-sector in-house, Government in-house, In-house ITExternal: Regulator, Researcher or academic, External privacy advisor, Vendor, Privacy advocateOutside advisor: Work as a privacy consultant, attorney, barrister or auditor on the privacy needs of other companies.
39396. U.S.

2 Research Objectives and Method
1 Executive Summary
4 Median Salary Data
7 EU
3 Sample Profile: Demographics and Experience
6 U.S.
5 Historical Salary Trends
8 Canada
9 Gender Analysis
40 407. EU
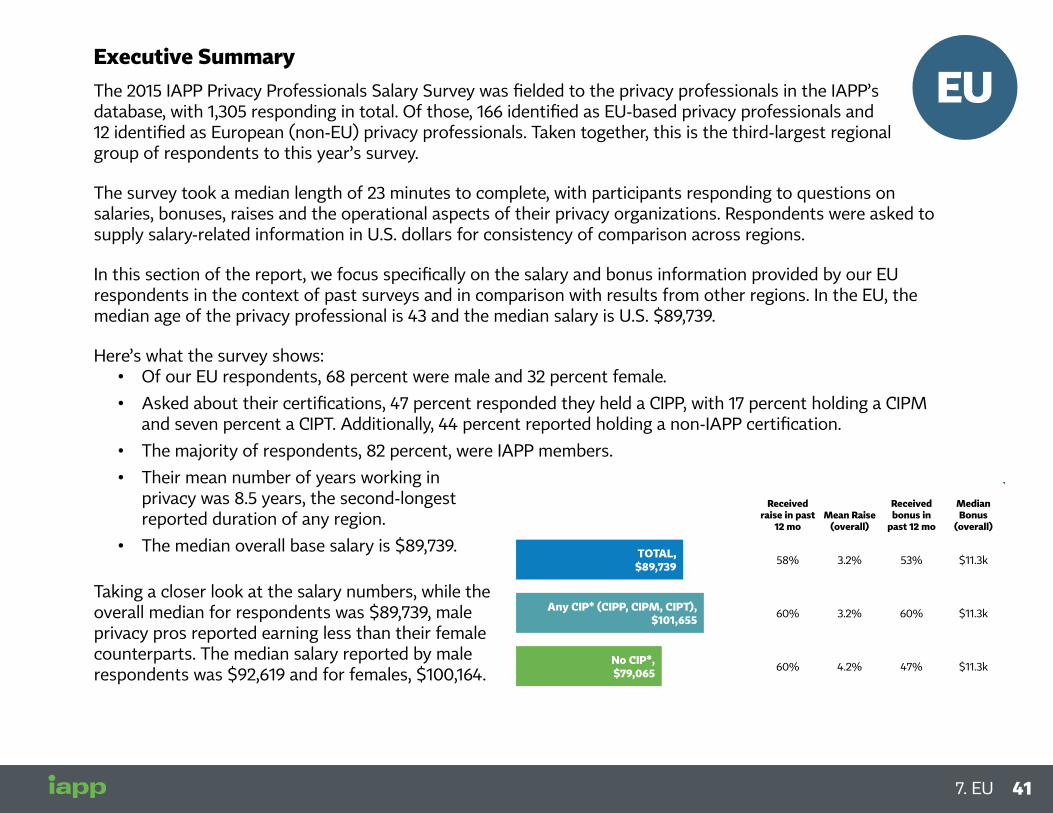
Executive SummaryThe 2015 IAPP Privacy Professionals Salary Survey was fielded to the privacy professionals in the IAPP’s database, with 1,305 responding in total. Of those, 166 identified as EU-based privacy professionals and 12 identified as European (non-EU) privacy professionals. Taken together, this is the third-largest regional group of respondents to this year’s survey.
The survey took a median length of 23 minutes to complete, with participants responding to questions on salaries, bonuses, raises and the operational aspects of their privacy organizations. Respondents were asked to supply salary-related information in U.S. dollars for consistency of comparison across regions.
In this section of the report, we focus specifically on the salary and bonus information provided by our EU respondents in the context of past surveys and in comparison with results from other regions. In the EU, the median age of the privacy professional is 43 and the median salary is U.S. $89,739.
Here’s what the survey shows:• Of our EU respondents, 68 percent were male and 32 percent female.
• Asked about their certifications, 47 percent responded they held a CIPP, with 17 percent holding a CIPM and seven percent a CIPT. Additionally, 44 percent reported holding a non-IAPP certification.
• The majority of respondents, 82 percent, were IAPP members.
• Their mean number of years working in privacy was 8.5 years, the second-longest reported duration of any region.
• The median overall base salary is $89,739.
Taking a closer look at the salary numbers, while the overall median for respondents was $89,739, male privacy pros reported earning less than their female counterparts. The median salary reported by male respondents was $92,619 and for females, $100,164.
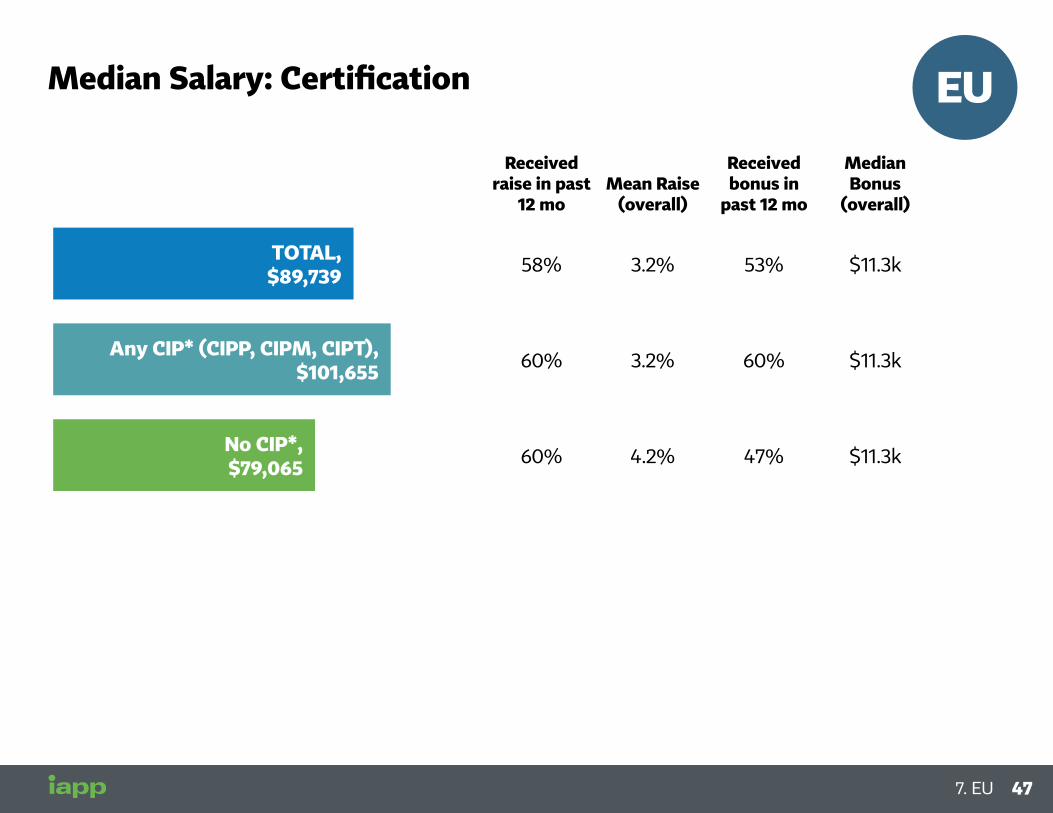
Median Salary: Certification
Received raise in past
12 moMean Raise
(overall)
Received bonus in
past 12 mo
Median Bonus
(overall)
TOTAL, $89,739 58% 3.2% 53% $11.3k
Any CIP* (CIPP, CIPM, CIPT), $101,655 60% 3.2% 60% $11.3k
No CIP*, $79,065 60% 4.2% 47% $11.3k
44
41417. EU

Having an IAPP certification resulted in a significantly higher salary; respondents who held a CIPP, CIPM or CIPT reported a median salary of $101,655, almost $12,000 more than the median base salary.
Not surprisingly, the industry privacy pros work in also has a significant impact on salary. According to this year’s survey, the highest paid industry in the EU is Banking, with the median salary reported at $112,950. The lowest paid sector in the EU is Government, with respondents reporting a median salary of $76,806.
The median salary by size of organization followed the expected pattern at the ends of the spectrum in the EU, with the largest organizations—those with 75,000 or more employees—paying their privacy professionals a median salary of $113,515 and the smallest—with fewer than 100 employees—paying a median salary of $42,356. However, the numbers varied for organizations between the two ends. The second-smallest organizations paid the next highest median salary, at $90,699, while the second-largest responding organizations, with between 25,000 and 74,999 employees, were next with a median salary of 89,118. The median salary for organizations with 1,000 to 4,999 employees was $83,583, and those employing between 4,000 and 24,999 had median salary of $85,842.
For chief privacy officers (CPOs) the median salary was $110,691, compared to $84,713 for privacy professionals who do not hold a CPO title.
To compare this year’s results with past salary surveys, we examined the mean base salaries, as opposed to the median numbers reported above.
This year’s EU responses averaged to a mean base salary of $114,693, the highest number since 2011. In 2013, the mean was $112,481 and in 2012, $111,054.
Mean salary by CIPP/E also showed an increase from 2013, when the mean salary reported by respondents holding a CIPP/E was $122,660 compared with $131,824 in 2015. Respondents with a CIPP/E reported a mean salary that was more than $27,000 higher than the average mean base salary of EU respondents of $114,693 for this year.
Median Salary: Industry
Received raise in past
12 moMean Raise
(overall)
Received bonus in
past 12 mo
Median Bonus
(overall)
TOTAL, $89,739 58% 3.2% 53% $11.3k
Software and Services, $83,583 64% 4.9% 44% $9.0k
Government, $76,806 20% 0.6% 0% $0k
Banking, $112,950 32% 1.3% 67% $13.8k
Healthcare Equipment and Services, $101,655 55% 1.6% 45% $13.8k
Insurance, $101,655 57% 2.2% 50% $18.3k
41
42 427. EU

Median Salary: Gender
Received raise in past
12 moMean Raise
(overall)
Received bonus in
past 12 mo
Median Bonus
(overall)
TOTAL, $89,739 58% 3.2% 53% $11.3k
Male, $92,619 65% 4.2% 58% $11.3k
Female, $100,164 53% 2.7% 50% $15.5k
Note: Sample sizes for salary information are larger than those who provided personal information, such as gender, so some discrepancies may exist between overall medians and those of segments.
43437. EU

Median Salary: Industry
Received raise in past
12 moMean Raise
(overall)
Received bonus in
past 12 mo
Median Bonus
(overall)
TOTAL, $89,739 58% 3.2% 53% $11.3k
Software and Services, $83,583 64% 4.9% 44% $9.0k
Government, $76,806 20% 0.6% 0% $0k
Banking, $112,950 32% 1.3% 67% $13.8k
Healthcare Equipment and Services, $101,655 55% 1.6% 45% $13.8k
Insurance, $101,655 57% 2.2% 50% $18.3k
44 447. EU

Median Salary: Number of Employees
Received raise in past
12 moMean Raise
(overall)
Received bonus in
past 12 mo
Median Bonus
(overall)
TOTAL, $89,739 58% 3.2% 53% $11.3k
Less than 100,$42,356 30% 1.9% 10% $14.1k
100–999, $90,699 72% 6.6% 61% $13.5k
1,000–4,999, $83,583 73% 6.3% 59% $9.4k
5,000–24,999, $85,842 62% 2.9% 62% $6.8k
25,000–74,999,$89,118 61% 2.2% 43% $21.2k
75,000+, $113,515 50% 1.9% 69% $15.2k
45457. EU

Median Salary: CPO/Non-CPO
Received raise in past
12 moMean Raise
(overall)
Received bonus in
past 12 mo
Median Bonus
(overall)
TOTAL, $89,739 58% 3.2% 53% $11.3k
CPO, $110,691 60% 3.4% 50% $11.3k
Non-CPO, $84,713 57% 3.2% 54% $11.3k
46 467. EU
Median Salary: Certification
Received raise in past
12 moMean Raise
(overall)
Received bonus in
past 12 mo
Median Bonus
(overall)
TOTAL, $89,739 58% 3.2% 53% $11.3k
Any CIP* (CIPP, CIPM, CIPT), $101,655 60% 3.2% 60% $11.3k
No CIP*, $79,065 60% 4.2% 47% $11.3k
47477. EU

Median Salary: Position
Received raise in past
12 moMean Raise
(overall)
Received bonus in
past 12 mo
Median Bonus
(overall)
TOTAL, $89,739 58% 3.2% 53% $11.3k
C-Suite, EVP, SVP, VP, $112,950 48% 4.5% 67% $16.4k
Director, $112,950 62% 3.0% 55% $17.5k
Lead Counsel, $101,655 45% 1.6% 68% $16.9k
Manager, $89,569 53% 2.1% 55% $9.6k
Below Manager, $71,336 67% 3.2% 38% $2.3k
48 487. EU

Median Salary: Internal/External
Received raise in past
12 moMean Raise
(overall)
Received bonus in
past 12 mo
Median Bonus
(overall)
TOTAL, $89,739 58% 3.2% 53% $11.3k
Internal, $89,118 65% 2.9% 59% $13.0k
External, $79,065 44% 4.7% 39% $8.3k
Outside Advisor, $90,360 41% 5.3% 41% $11.3k
Internal: Private-sector in-house, Government in-house, In-house ITExternal: Regulator, Researcher or academic, External privacy advisor, Vendor, Privacy advocateOutside advisor: Work as a privacy consultant, attorney, barrister or auditor on the privacy needs of other companies.
49497. EU
2 Research Objectives and Method
1 Executive Summary
4 Median Salary Data
7 EU
3 Sample Profile: Demographics and Experience
6 U.S.
5 Historical Salary Trends
8 Canada
9 Gender Analysis
50 508. Canada

Executive SummaryThe 2015 IAPP Privacy Professionals Salary Survey was fielded to the privacy professionals in the IAPP’s database, with 1,305 responding in total. Of those, 198 identified as Canadian privacy professionals. This was the second-largest regional group of respondents to this year’s survey after the U.S.
The survey took a median length of 23 minutes to complete, with participants responding to questions on salaries, bonuses, raises and the operational aspects of their privacy organizations. Respondents supplied salary-related information in Canadian dollars, which was then converted to U.S. dollars for consistency of comparison across regions.
In this section of the report, we focus specifically on the salary and bonus information provided by our Canadian respondents in the context of past surveys and in comparison with results from other regions.
In Canada, the median age of the privacy professional is 45 and the median salary is U.S. $74,005.
Here’s what the survey shows:
• Of our Canadian respondents, 35 percent were male and 65 percent female.
• Asked about their certifications, 47 percent responded they held a CIPP, with six percent holding a CIPM and six percent a CIPT. Additionally, 48 percent report holding a non-IAPP certification.
• The vast majority, 87 percent of respondents, were IAPP members.
• Their mean number of years working in privacy was 9.1—the longest duration of time working in privacy of any region we surveyed.
Taking a closer look at the salary numbers, while the overall median for respondents was $74,005, male privacy pros were paid more than their female counterparts. The median for male respondents was $79,942 and for females, $69,217.
Sample Profile: Demographics and Experience
RESPonDEntS LoCatED In…
# IntERvIEwS
MEDIan agE MaLE FEMaLE
United States 880 44 50% 50%
Canada 198 45 35% 65%
Europe (EU) 166 43 68% 32%
Europe (Non-EU) 12 49 57% 43%
Latin America 9 37 80% 20%
Africa 2 30 100% 0%
Middle East 4 40 75% 25%
Asia 17 43 80% 20%
Australia/New Zealand 17 50 55% 45%
1
51518. Canada
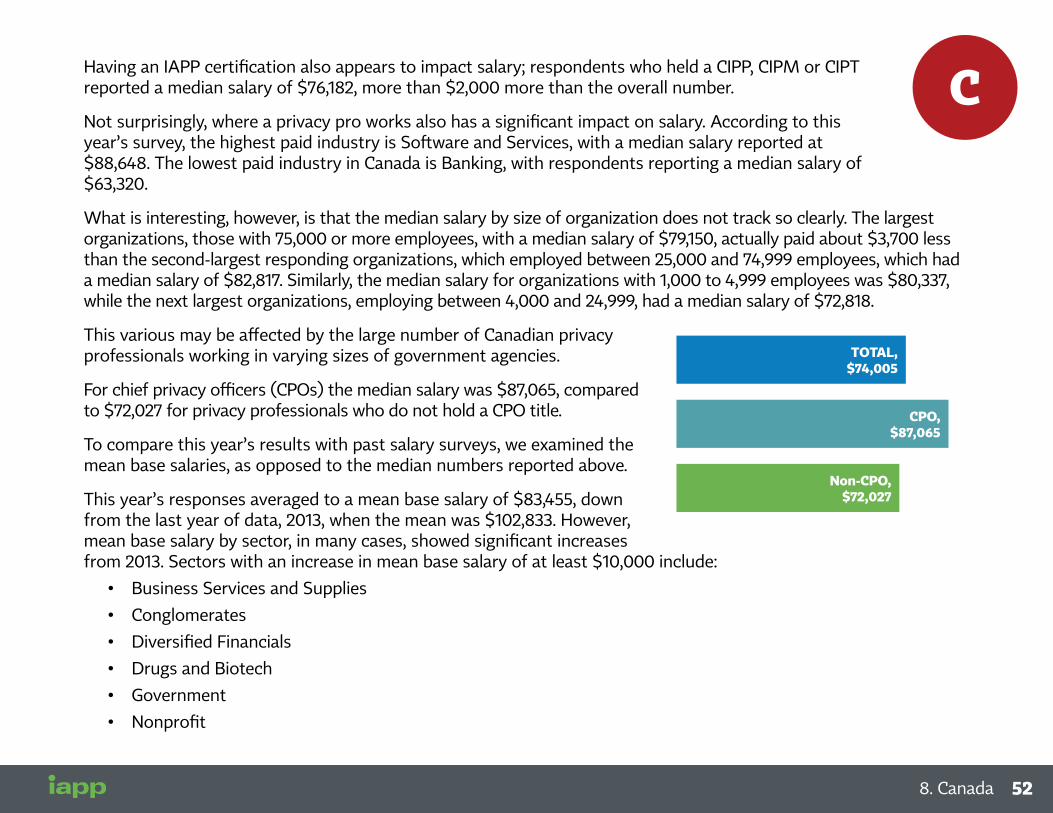
Having an IAPP certification also appears to impact salary; respondents who held a CIPP, CIPM or CIPT reported a median salary of $76,182, more than $2,000 more than the overall number.
Not surprisingly, where a privacy pro works also has a significant impact on salary. According to this year’s survey, the highest paid industry is Software and Services, with a median salary reported at $88,648. The lowest paid industry in Canada is Banking, with respondents reporting a median salary of $63,320.
What is interesting, however, is that the median salary by size of organization does not track so clearly. The largest organizations, those with 75,000 or more employees, with a median salary of $79,150, actually paid about $3,700 less than the second-largest responding organizations, which employed between 25,000 and 74,999 employees, which had a median salary of $82,817. Similarly, the median salary for organizations with 1,000 to 4,999 employees was $80,337, while the next largest organizations, employing between 4,000 and 24,999, had a median salary of $72,818.
This various may be affected by the large number of Canadian privacy professionals working in varying sizes of government agencies.
For chief privacy officers (CPOs) the median salary was $87,065, compared to $72,027 for privacy professionals who do not hold a CPO title.
To compare this year’s results with past salary surveys, we examined the mean base salaries, as opposed to the median numbers reported above.
This year’s responses averaged to a mean base salary of $83,455, down from the last year of data, 2013, when the mean was $102,833. However, mean base salary by sector, in many cases, showed significant increases from 2013. Sectors with an increase in mean base salary of at least $10,000 include:
• Business Services and Supplies
• Conglomerates
• Diversified Financials
• Drugs and Biotech
• Government
• Nonprofit
Median Salary: CPo/non-CPo
Received raise in past
12 moMean Raise
(overall)
Received bonus in
past 12 mo
Median Bonus
(overall)
totaL, $74,005 64% 2.2% 30% $7.9k
CPo, $87,065 76% 2.4% 33% $11.9k
non-CPo, $72,027 60% 2.1% 29% $5.5k
10
52 528. Canada
One explanation for the differences mean salaries may lie in the variety of responses received in 2015, with almost one-third of this year’s responses identifying as working at the “Below Manager” level. Those who identified their level within their organizations include:
• C-Suite, EVP, SVP, VP: 15
• Director: 34
• Lead Counsel: 7
• Manager: 63
• Below Manager: 58
Another possibility is that the CPO’s role has shifted at some organizations, perhaps to the director level rather than vice-president or lead counsel, which tracks with what we’re seeing in the data for heavily regulated industries.
Mean salary by CIPP/C also showed a decrease from 2013, but the average salary for privacy pros with the credential was significantly higher than the overall mean: $100,359 for those with a CIPP/C as opposed to $83,455 for mean salary of all respondents together.
53538. Canada

Median Salary: Gender
Received raise in past
12 moMean Raise
(overall)
Received bonus in
past 12 mo
Median Bonus
(overall)
TOTAL, $74,005 64% 2.2% 30% $7.9k
Male, $79,942 67% 3.2% 31% $9.7k
Female, $69,217 60% 1.8% 27% $7.9k
Note: Sample sizes for salary information are larger than those who provided personal information, such as gender, so some discrepancies may exist between overall medians and those of segments.
54 548. Canada
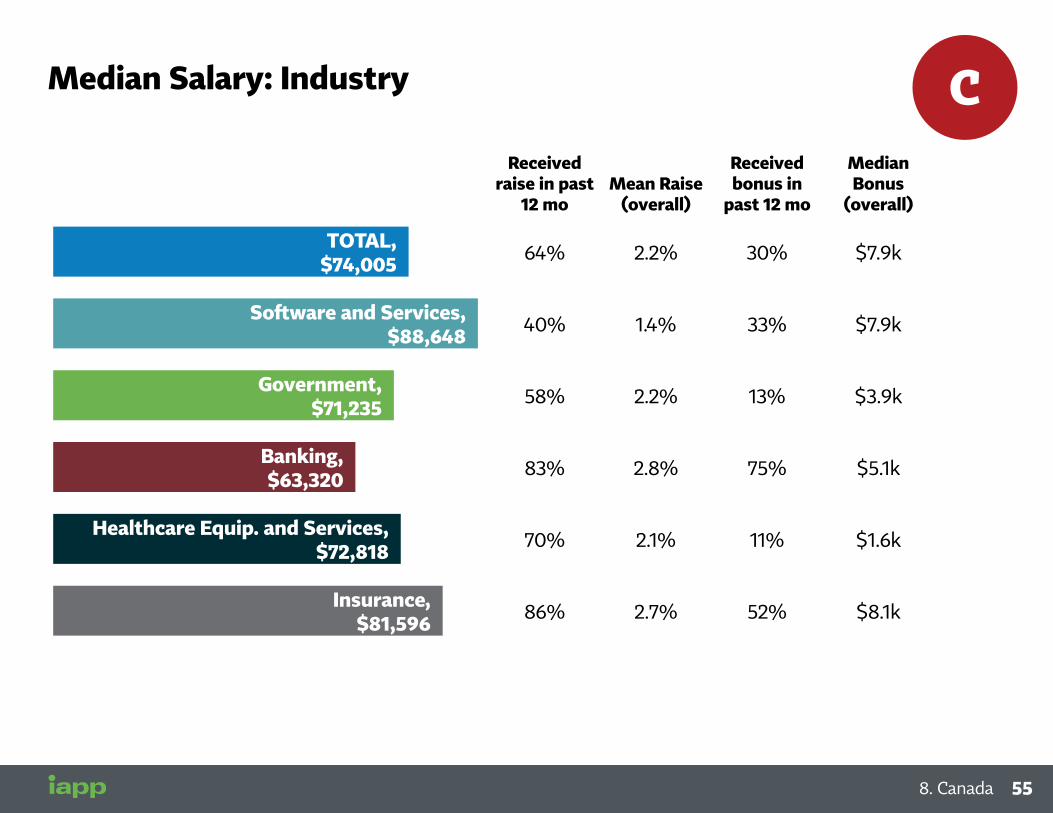
Median Salary: Industry
Received raise in past
12 moMean Raise
(overall)
Received bonus in
past 12 mo
Median Bonus
(overall)
TOTAL, $74,005 64% 2.2% 30% $7.9k
Software and Services, $88,648 40% 1.4% 33% $7.9k
Government, $71,235 58% 2.2% 13% $3.9k
Banking, $63,320 83% 2.8% 75% $5.1k
Healthcare Equip. and Services, $72,818 70% 2.1% 11% $1.6k
Insurance, $81,596 86% 2.7% 52% $8.1k
55558. Canada
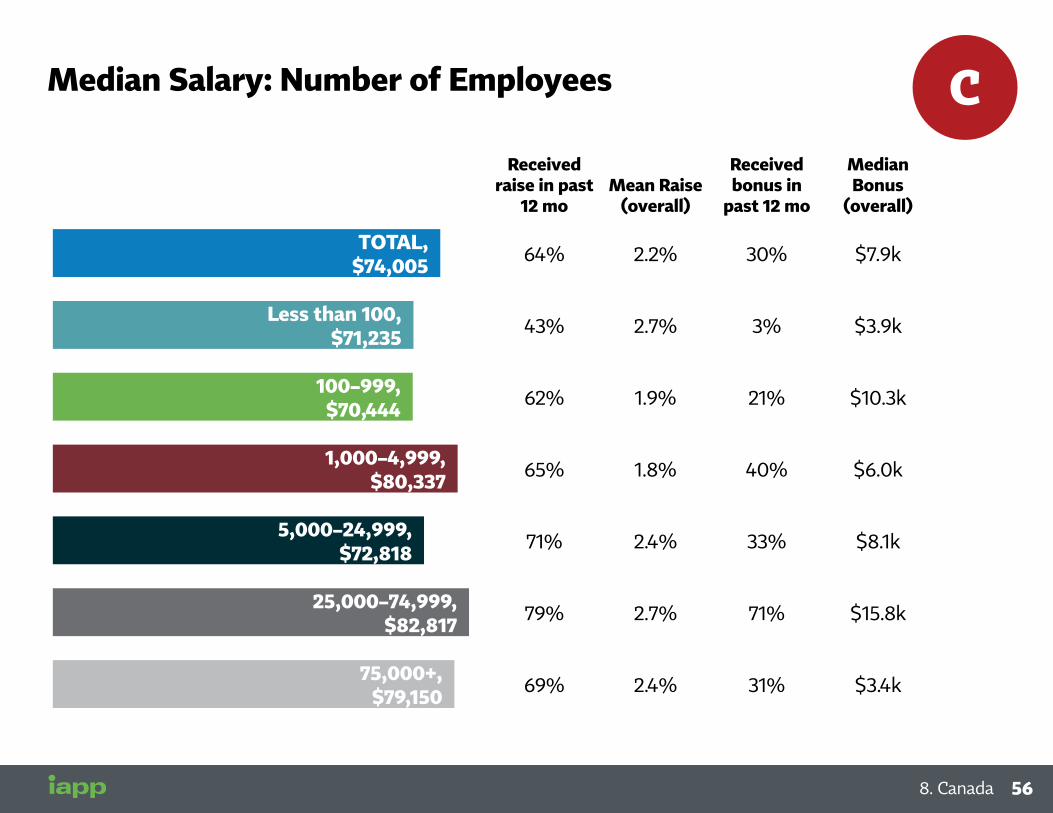
Median Salary: Number of Employees
Received raise in past
12 moMean Raise
(overall)
Received bonus in
past 12 mo
Median Bonus
(overall)
TOTAL, $74,005 64% 2.2% 30% $7.9k
Less than 100,$71,235 43% 2.7% 3% $3.9k
100–999, $70,444 62% 1.9% 21% $10.3k
1,000–4,999, $80,337 65% 1.8% 40% $6.0k
5,000–24,999, $72,818 71% 2.4% 33% $8.1k
25,000–74,999,$82,817 79% 2.7% 71% $15.8k
75,000+, $79,150 69% 2.4% 31% $3.4k
56 568. Canada
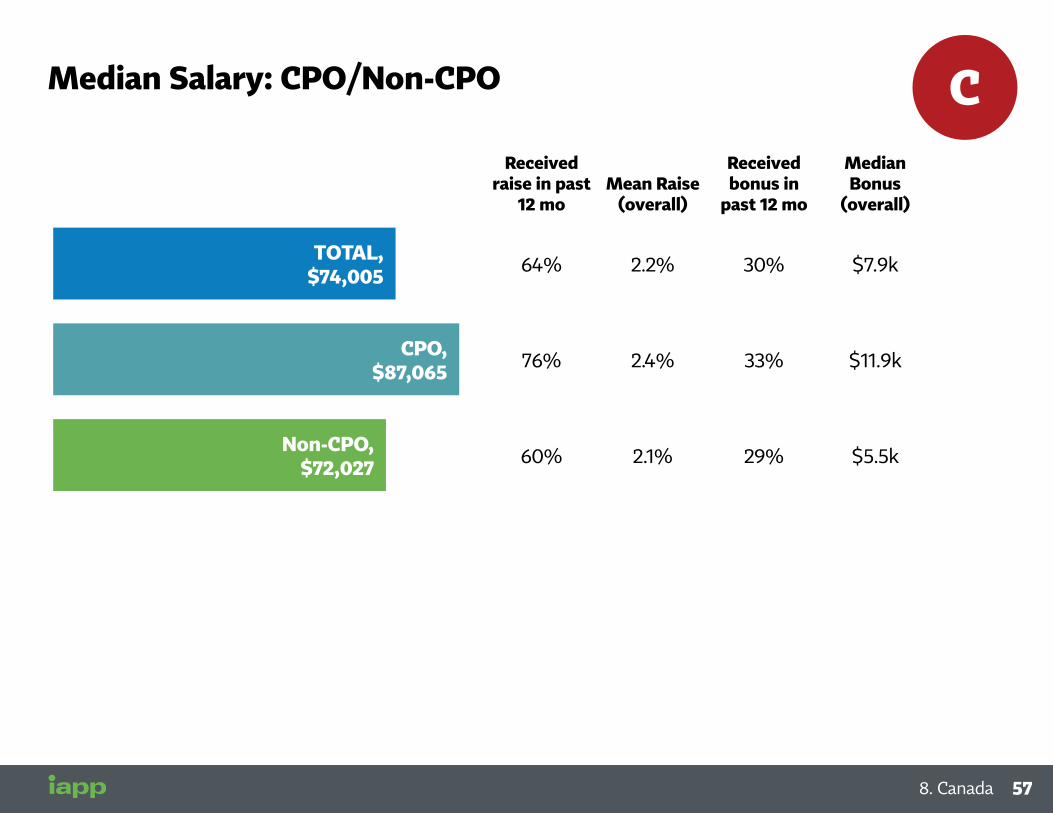
Median Salary: CPO/Non-CPO
Received raise in past
12 moMean Raise
(overall)
Received bonus in
past 12 mo
Median Bonus
(overall)
TOTAL, $74,005 64% 2.2% 30% $7.9k
CPO, $87,065 76% 2.4% 33% $11.9k
Non-CPO, $72,027 60% 2.1% 29% $5.5k
57578. Canada

Median Salary: Certification
Received raise in past
12 moMean Raise
(overall)
Received bonus in
past 12 mo
Median Bonus
(overall)
TOTAL, $74,005 64% 2.2% 30% $7.9k
Any CIP* (CIPP, CIPM, CIPT), $76,182 68% 2.9% 32% $8.7k
No CIP*, $69,573 56% 1.7% 25% $7.9k
58 588. Canada
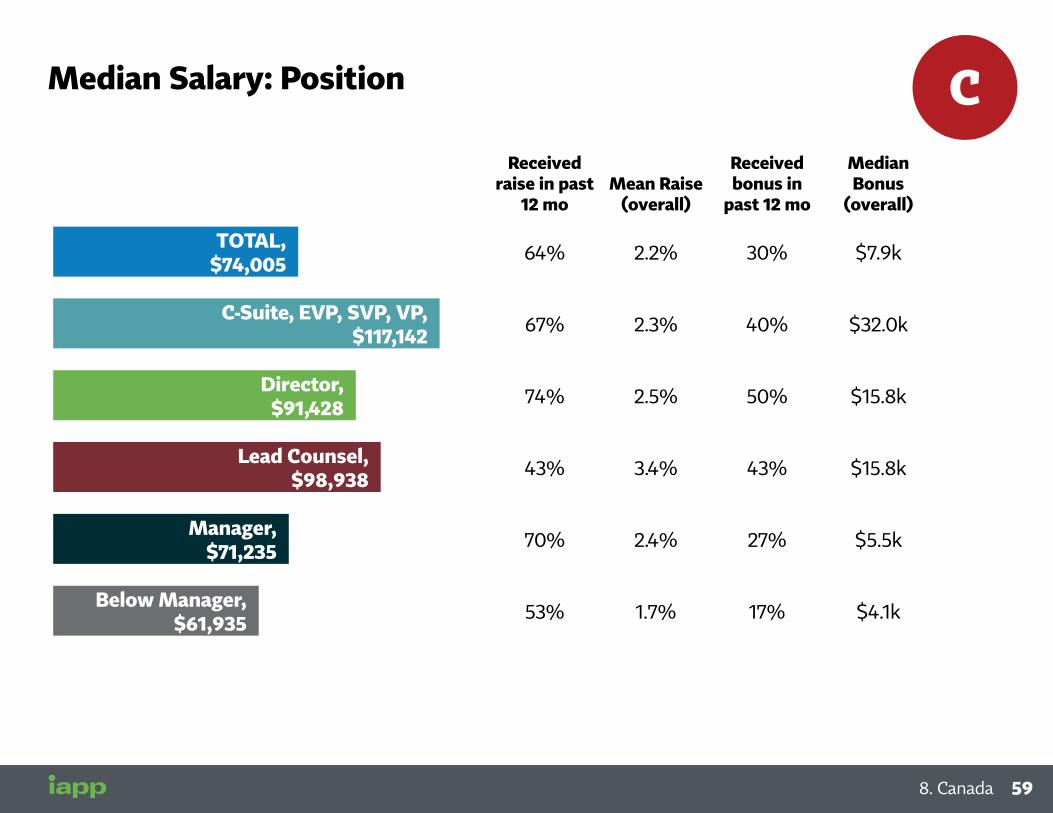
Median Salary: Position
Received raise in past
12 moMean Raise
(overall)
Received bonus in
past 12 mo
Median Bonus
(overall)
TOTAL, $74,005 64% 2.2% 30% $7.9k
C-Suite, EVP, SVP, VP, $117,142 67% 2.3% 40% $32.0k
Director, $91,428 74% 2.5% 50% $15.8k
Lead Counsel, $98,938 43% 3.4% 43% $15.8k
Manager, $71,235 70% 2.4% 27% $5.5k
Below Manager, $61,935 53% 1.7% 17% $4.1k
59598. Canada

Median Salary: Internal/External
Received raise in past
12 moMean Raise
(overall)
Received bonus in
past 12 mo
Median Bonus
(overall)
TOTAL, $74,005 64% 2.2% 30% $7.9k
Internal, $74,401 68% 2.2% 35% $7.9k
External, $69,612 41% 2% 9% $8.3k
Outside Advisor, $98,938 17% 1.3% 17% $12.1k
60 608. Canada

2 Research Objectives and Method
1 Executive Summary
4 Median Salary Data
7 EU
3 Sample Profile: Demographics and Experience
6 U.S.
5 Historical Salary Trends
8 Canada
9 Gender Analysis
61619. Gender Analysis

Privacy: An Equal Playing Field for Women and MenIn the midst of the public debate around the lingering gender gap in places like Fortune 1000 C-suite positions and the technology industry, our survey results show that, in privacy and data governance, women occupy similarly senior positions and earn as much as men.
The results, from a survey of more than 1,000 privacy professionals around the world, demonstrate a 50-50 split in placement between women and men. For privacy professionals, salary figures too are equal, with men in the United States reporting a median salary of $130,000 and women $125,000, and women in the EU reporting a median salary of $100,100 vs. $92,600 for men.
The slight remaining pay gap between men and women in the U.S. is virtually wiped out for professionals who obtain IAPP certification. Among certified professionals, men make a median salary of $135,000 compared to $132,500 for women.
Gender parity is evident not only in placement and pay but also in privacy job titles. Women are almost identical to men in the likelihood of holding a C-level position (slightly more likely), VP-level position (slightly less likely), legal counsel-level position (slightly more likely) or director-level position (even).
Suggesting lingering historical imbalances, the data shows that on average, women have slightly less experience in the profession, with 39 percent reporting less than five years compared to only 35 percent for men; this, despite women professionals being one year older on average. Looking at the 15 percent of respondents who have more than 15 years of experience, a salary gap opens up with men making an average of $181,000 compared to $156,300 for women. In addition, only 25 percent of women privacy professionals hold a Master’s degree compared to 39 percent of their male counterparts.
The survey demonstrates that in a work environment on the cusp of the intersection of new technology and policy, women can fare as well as – or better – than men. Privacy, which combines skills from business, legal, technological and ethics, provides a level playing field for all professionals. All evidence indicates that position and salary are determined first and foremost by experience and merit.
Female and male privacy professionals have similar levels of experience in privacy
• If anything, women have a bit less experience than men, with 39% in privacy for fewer than 5 years (vs. 35% for men)
Years of Privacy Experience: US
Fewer than 5 years
5 to 9 years
10 to 14 years
15 years or more
35%
39%
31%
27%
19%
20%
15%
14%
Male
Female
55
62 629. Gender Analysis
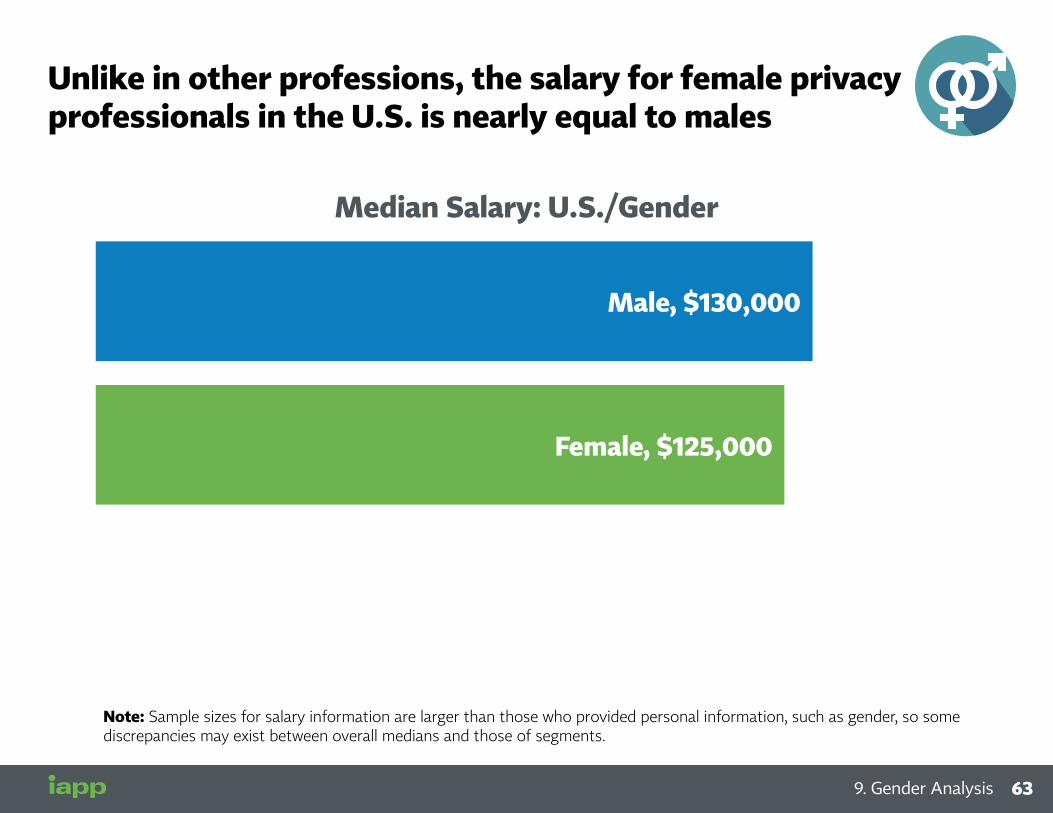
Female, $125,000
Male, $130,000
Median Salary: U.S./Gender
Unlike in other professions, the salary for female privacy professionals in the U.S. is nearly equal to males
Note: Sample sizes for salary information are larger than those who provided personal information, such as gender, so some discrepancies may exist between overall medians and those of segments.
63639. Gender Analysis

Female, $100,100
Male, $92,600
Median Salary: EU/Gender
For privacy professionals in the EU, women actually have a higher median salary than men
US$1 = € 1.1295
64 649. Gender Analysis
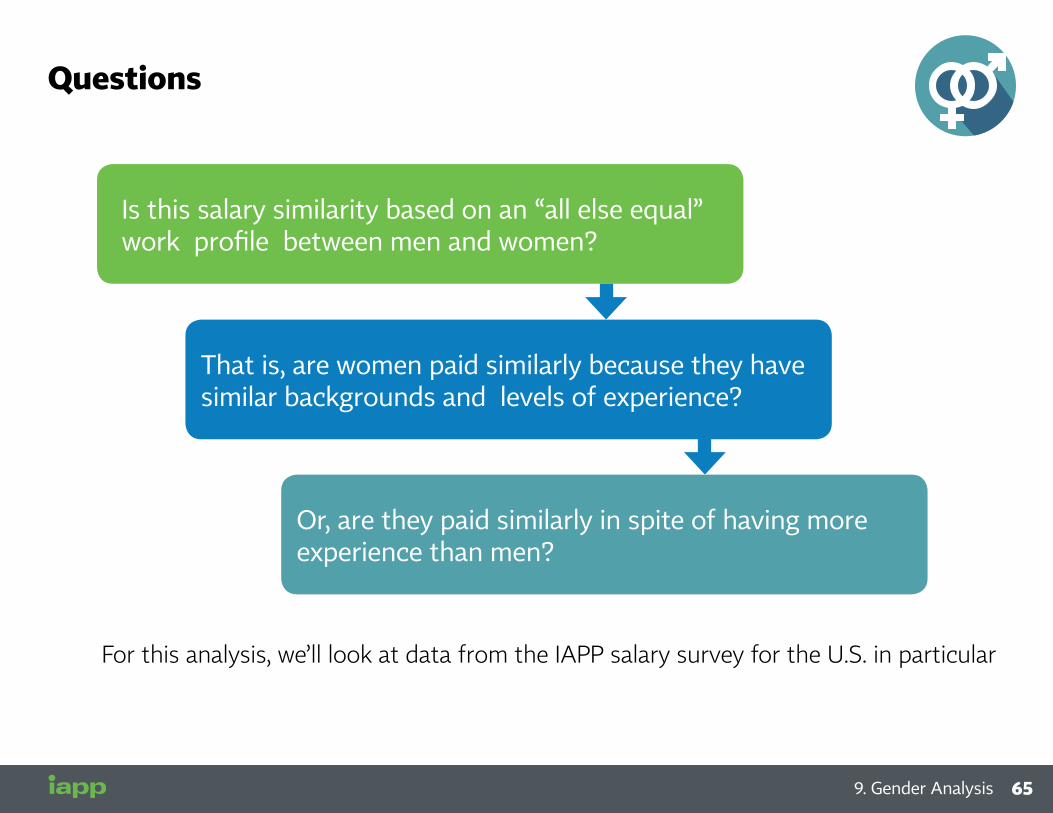
That is, are women paid similarly because they have similar backgrounds and levels of experience?
Is this salary similarity based on an “all else equal” work profile between men and women?
Or, are they paid similarly in spite of having more experience than men?
Questions
For this analysis, we’ll look at data from the IAPP salary survey for the U.S. in particular
65659. Gender Analysis

Female and male privacy professionals have similar levels of experience in privacy
• If anything, women have a bit less experience than men, with 39 percent in privacy for fewer than 5 years (vs. 35 percent for men)
Years of Privacy Experience: U.S.
Fewer than 5 years
5 to 9 years
10 to 14 years
15 years or more
35%
39%
31%
27%
19%
20%
15%
14%
Male
Female
66 669. Gender Analysis
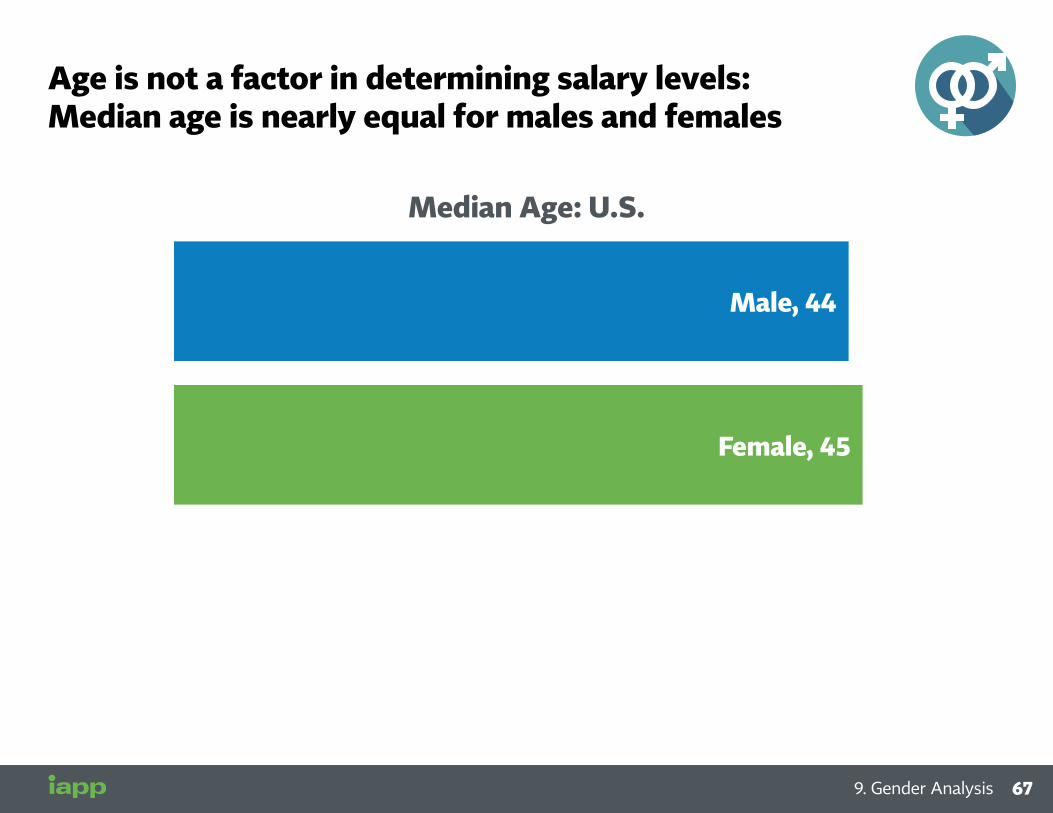
Median Age: U.S.
Age is not a factor in determining salary levels: Median age is nearly equal for males and females
Female, 45
Male, 44
67679. Gender Analysis

Women and men also have similar profiles when it comes to title and position in their firms
• Males are a bit more likely to be in managerial or supervisory positions (vs. higher-level positions), but the difference is relatively small
Position/Title: U.S.
C level
VP level
Director level
Legal counsel
Manager/supervisor
3%
4%
24%
20%
13%
12%
26%
26%
5%
6%
Male
Female
68 689. Gender Analysis

Although men are a bit more likely than women to have a bachelor’s degree…
• They’re much more likely to have a master’s degree—in other words, women have similar salary levels in spite of a lower likelihood to have an advanced degree
Academic Degrees: U.S.
Male
Female
Bachelors
Masters
Law
76%
68%
39%
25%
41%
45%
69699. Gender Analysis
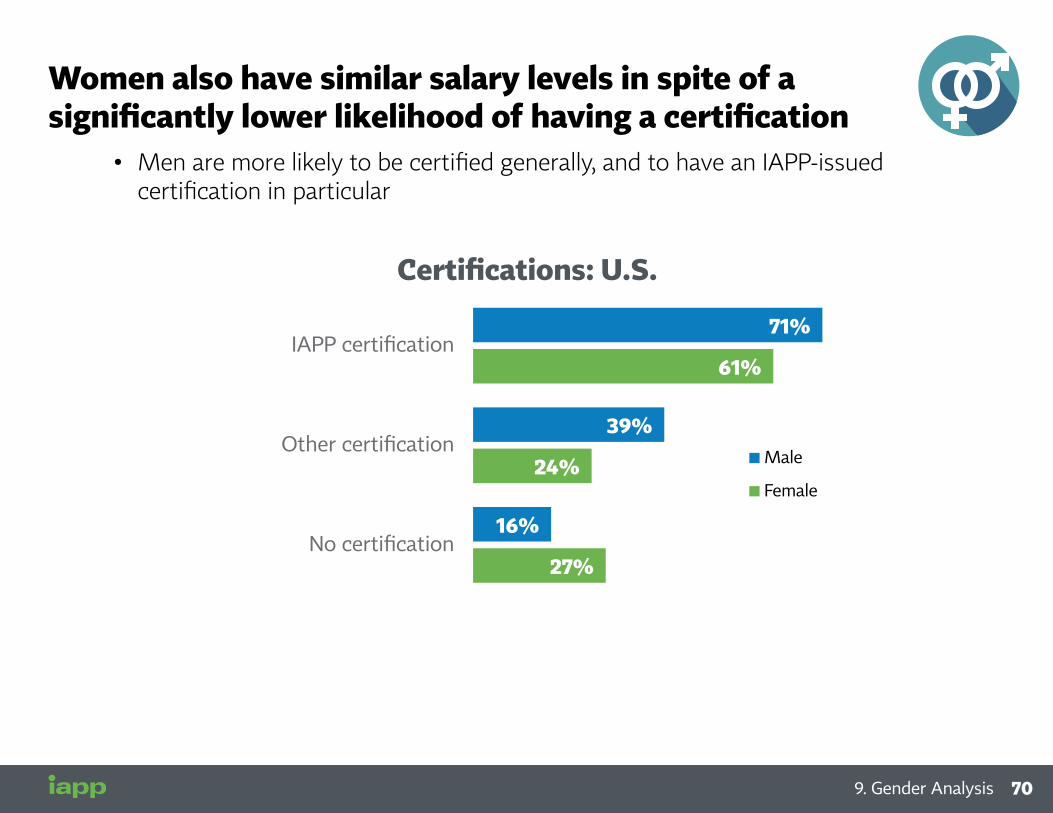
Women also have similar salary levels in spite of a significantly lower likelihood of having a certification
• Men are more likely to be certified generally, and to have an IAPP-issued certification in particular
Certifications: U.S.
Male
Female
IAPP certification
Other certification
No certification
71%
61%
39%
24%
16%
27%
70 709. Gender Analysis
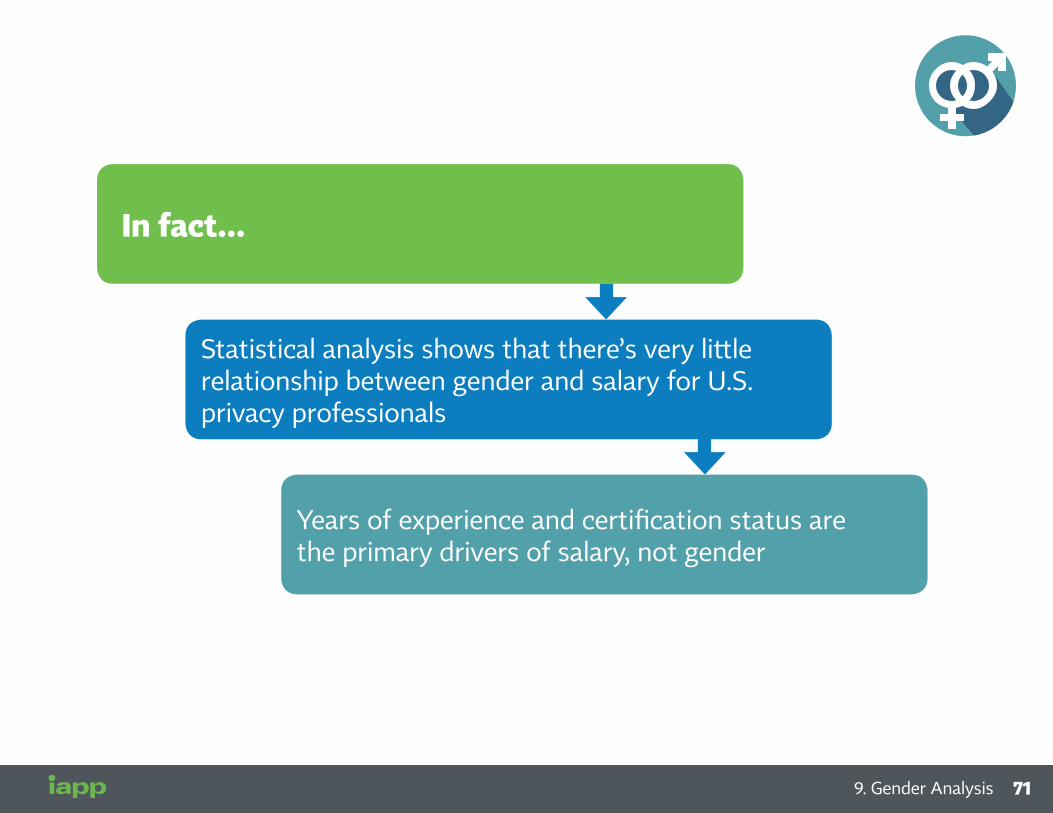
Statistical analysis shows that there’s very little relationship between gender and salary for U.S. privacy professionals
In fact...
Years of experience and certification status are the primary drivers of salary, not gender
71719. Gender Analysis

Salaries make a bigger jump for the relatively few males (15% of total) who have 15 years of privacy experience
• But until that point, women and men have similar median salaries
Median Salary: U.S., By Years of Experience in Privacy
Fewer than 5 years
5 to 9 years
10 to 14 years
15 years or more
$106,000
$100,000
$132,000
$126,000
$144,500
$140,000
$181,000
$156,300
Male
Female
72 729. Gender Analysis
Male
Female
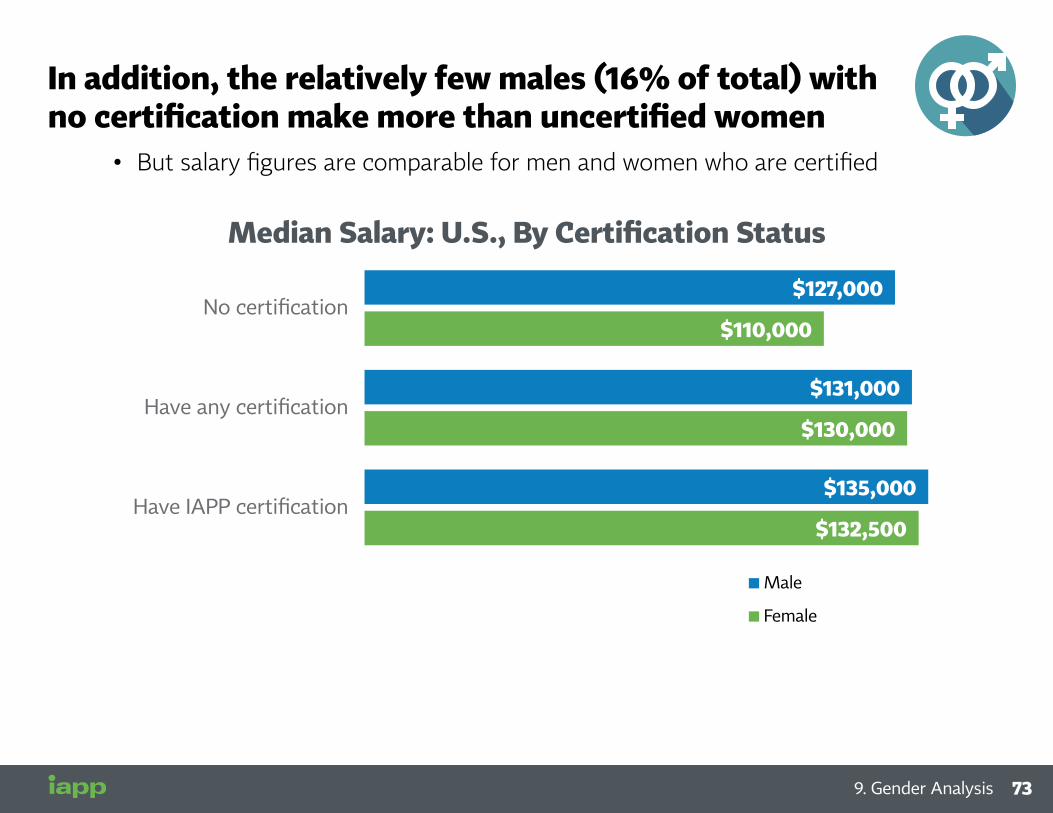
In addition, the relatively few males (16% of total) with no certification make more than uncertified women
• But salary figures are comparable for men and women who are certified
Median Salary: U.S., By Certification Status
Male
Female
No certification
Have any certification
Have IAPP certification
$127,000
$110,000
$131,000
$130,000
$135,000
$132,500
73739. Gender Analysis

Key Take-Aways
• With a few exceptions, the comparable median salary for female and male privacy professionals does appear to be based on an “all things equal” work profile between males and females.
• That is, women’s nearly equal salaries are NOT a function of less-experienced or qualified men getting similar pay vs. more-experienced or qualified women.
• The exceptions are seen in relatively small segments: For those without any certification and for those in privacy for 15 years or more, men do have higher salaries than women.
74 749. Gender Analysis