
2015 Pillar 3 Report - nab.com.au · 2015 Pillar 3 Report Incorporating the requirements of APS 330...
101
2015 Pillar 3 Report Incorporating the requirements of APS 330 as at 30 September 2015
Transcript of 2015 Pillar 3 Report - nab.com.au · 2015 Pillar 3 Report Incorporating the requirements of APS 330...

2015Pillar 3 Report
Incorporating the requirements of APS 330as at 30 September 2015

This page has been left blank intentionally

2
pillar 3 report
2015 Contents 1. Introduction 4 1.1 The NAB Group’s Capital Adequacy Methodologies 4
1.2 AASB 9 ‘Financial Instruments’ 4
1.3 APS 330 Disclosure Governance 4
1.4 Regulatory Reform 5
2. Scope of Application 6 Disclosure 2A: Scope of Application 6
3. Risk Governance and Management 8
4. Capital 10 4.1 Capital Adequacy 10
Table 4.1A: Risk-Weighted Assets 12
Table 4.1B: Capital Ratios 13
4.2 Capital Structure 14
Table 4.2A: Regulatory Capital Structure - Summary 14
5. Credit Risk 15
5.1 General Disclosure 15
Table 5.1A: Credit Risk Exposures Summary 17
Table 5.1B: Total and Average Credit Risk Exposures 19
Table 5.1C: Exposures by Geography 21
Table 5.1D: Exposures by Industry 22
Table 5.1E: Exposures by Maturity 24
Table 5.1F: Provisions by Asset Class 25
Table 5.1G (i): Loss Experience 28
Table 5.1G (ii): Accuracy of Risk Estimates – PD and EaD 29
Table 5.1G (iii): Accuracy of Risk Estimates – LGD 30
Table 5.1H: Provisions by Industry 31
Table 5.1I: Provisions by Geography 32
Table 5.1J: Movement in Provisions 33
5.2 Standardised and Supervisory Slotting Portfolio s 34
Table 5.2A: Standardised Exposures by Risk Weight 34
Table 5.2B: Standardised Exposures by Risk Grade 35
Table 5.2C: Supervisory Slotting by Risk Weight 36
5.3 Internal Rating Based Portfolios 37
Table 5.3A: Non-Retail Exposure by Risk Grade 40
Table 5.3B: Retail Exposure by Risk Grade 42
5.4 Credit Risk Mitigation 44
Table 5.4A: Mitigation by Eligible Collateral 45
Table 5.4B: Mitigation by Guarantees and Credit Derivatives 46
5.5 Counterparty Credit Risk 47
Table 5.5A(i): Net Derivatives Credit Exposure 48
Table 5.5A(ii): Distribution of Current Credit Exposure 48
Table 5.5B: Credit Derivative Transactions 48
6. Securitisation 49 6.1 Third Party Securitisation 50
Table 6.1A: Total Securitisation Exposures 52
Table 6.1B: Type of Exposure 53
Table 6.1C: Recent Third Party Securitisation Activity 53
Table 6.1D: Exposures by Risk Weight 54
Table 6.1E: Exposures Deducted from Capital 57
6.2 Level 2 Group Owned Securitised Assets 58
Table 6.2A: Assets Securitised by the Level 2 Group 59
Table 6.2B: Recent Securitisation Activity 60
Disclosure 6.2C: Securitisation Subject to Early Amortisation
60
Disclosure 6.2D: Forthcoming Securitisation Activity by the Level 2 Group
60
Disclosure 6.2E: Credit Risk Mitigation and Guarantors 60
7. Market Risk 61 Table 7.1A: Standard Method Risk-Weighted Assets 62
Table 7.1B: Total Risk-Weighted Assets 63
Table 7.1C: Internal Model Approach VaR 63
Table 7.1D: Internal Model Approach Stressed VaR 64
Table 7.1E: Back-testing Results 65
8. Operational Risk 66 Table 8A: Total Risk-Weighted Assets 67
9. Balance Sheet and Liquidity Risk 68 9.1 Funding and Liquidity Risk 69
9.2 Interest Rate Risk in the Banking Book 70
Table 9.2A: Interest Rate Risk in the Banking Book 71
Table 9.2B: Total Risk-Weighted Assets 71
9.3 Equities Banking Book Position 72
Table 9.3A: Equities Banking Book Position 73
Table 9.3B: Gains and Losses on Equity Investments 73 Disclosure 9.3C: Equity Investments Subject to Grandfathering Provision
73
9.4 Foreign Exchange Risk in the Banking Book 74
10. Leverage Ratio Disclosures 75 10.1 Leverage Ratio Disclosure Template 75
10.2 Summary Comparison of Accounting Assets vs Leverage Ratio Exposure Measure 75
11. Liquidity Coverage Ratio Disclosures 76 11.1 Liquidity Coverage Ratio Disclosure Template 76
12. Detailed Capital Disclosures 78 12.1 Common Disclosure Template – Regulatory
Capital 78
12.2 Level 2 Regulatory Balance Sheet 81
12.3 Reconciliation between the Capital Disclosure Template and Level 2 Regulatory Balance Sheet
83
12.4 Material Entities Excluded from Level 2 Regulato ry Balance Sheet
84
Table 12.4A: Insurance and Fund Management Entities 84
Table 12.4B: Securitisation Entities 84
13. Remuneration 85
13.1 Remuneration Governance 85
13.2 Remuneration Processes 85
13.3 Remuneration and Risk 86
13.4 Linking Performance and Remuneration 88
13.5 Adjusting Remuneration for Longer-Term Performance
89
13.6 Forms of Variable Remuneration 89
13.7 Quantitative Remuneration Disclosures 90
Table 13.7A: Total Value of Remuneration Awards 90
Table 13.7B: Deferred Remuneration 90
Table 13.7C: Other Remuneration 90
13.8 London Branch Remuneration Disclosures 91
Table 13.8A: Aggregate Remuneration of Material Risk Takers by Operating Segment 91
Table 13.8B: Total Value of Remuneration Awards 91 Table 13.8C: Deferred Remuneration 91
Table 13.8D: Other Remuneration 92
Table 13.8E: Remuneration by Band 92
14. Glossary 93
15. Reference to APS 330 Tables 98

3
pillar 3 report
2015
This page has been left blank intentionally

Introduction
4
pillar 3 report
2015 1. Introduction
National Australia Bank Limited (ABN 12 004 044 937) (NAB) applies the Basel framework as a cornerstone of the NAB Group’s risk management framework and capital strategy, and recognises that it is critical for achieving the NAB Group’s strategic agenda.
In Australia, the Australian Prudential Regulation Authority (APRA) has regulatory responsibility for the implementation of the Basel Accord through the release of prudential standards.
This Pillar 3 Report is designed to provide the NAB Group’s stakeholders with detailed information about the approach the NAB Group takes to manage risk and to determine capital adequacy, having regard to the operating environment. The report also addresses the requirements of APRA’s Prudential Standard APS 330: Public Disclosure (APS 330).
All figures in this report are in Australian dollars (AUD) unless otherwise noted. Disclosures in this Report are based on the APRA Basel III standards that have applied since 1 January 2013, except for market risk Risk-Weighted Assets (RWA) that are calculated on a Basel 2.5 basis for each period presented.
Capital Ratio Summary
The NAB Group’s Common Equity Tier 1 (CET1) Capital ratio of 10.24% at 30 September 2015 is consistent with the NAB Group’s objective of maintaining a strong capital position.
As at
30 Sep 15 31 Mar 15
Capital ratios (Level 2) % %
Common Equity Tier 1 10.24 8.87
Tier 1 12.44 11.13
Total 14.15 12.81
The NAB Group maintains a strong capital, funding and liquidity position, in line with its ongoing commitment to maintain balance sheet strength.
Over six months ended 30 September 2015, the NAB Group has accessed a diverse range of wholesale funding across senior, subordinated and secured debt markets.
The NAB Group remains vigilant in its evaluation of the economic and regulatory environment, and continues to ensure that the NAB Group’s balance sheet remains strong to enable it to respond to changing market and regulatory conditions.
In June 2015, the NAB Group completed a $5.5 billion Capital raise through a 2 for 25 fully underwritten pro rata accelerated renounceable rights issue, adding 141 basis points of CET1 Capital. The additional capital will help address the incremental capital requirement resulting from APRA’s announcement in July 2015 of an increase in mortgage risk weights for internal ratings-based approach accredited Authorised Deposit-taking Institutions (ADI) to an average of 25% in response to a recommendation of the Financial System Inquiry. This change takes effect from 1 July 2016. The capital raising
will also help to facilitate the proposed exit from Clydesdale Bank plc (Clydesdale). On 3 August 2015, the NAB Group completed its full divestment of Great Western Bank (GWB). The total sale was undertaken as three separate tranches, and increased the NAB Group’s CET1 Capital ratio by 1 basis point during the six months to March 2015 and by 36 basis points during the six months to September 2015.
1.1 The NAB Group’s Capital Adequacy Methodologies The NAB Group operates in Australia, Asia, New Zealand, the United Kingdom and North America. The following table sets out the approach to the Basel Accord, which is applied across the NAB Group as at 30 September 2015.
The NAB Group’s Basel Methodologies
IRB: Internal Ratings Based Approach AMA: Advanced Measurement Approach IRRBB: Interest Rate Risk in the Banking Book IMA: Internal Models Approach
Bank of New Zealand (BNZ), NAB’s main operating subsidiary in New Zealand, is regulated by the Reserve Bank of New Zealand (RBNZ). Credit risk exposures consolidated in the NAB Group position are calculated under RBNZ requirements.
Clydesdale, NAB’s main operating subsidiary in the United Kingdom, is regulated by the Prudential Regulation Authority (PRA). Clydesdale has been accredited to apply the standardised approach to operational and credit risk management in accordance with regulatory requirements. Credit risk exposures and operational risk RWA consolidated in this report are calculated under APRA requirements.
1.2 AASB 9 ‘Financial Instruments’ Effective 1 October 2014, the NAB Group early adopted the requirements of AASB 9 'Financial Instruments'. The transitional impacts of this adoption are highlighted in Note 1 to the NAB Group's 2015 Annual Financial Report.
1.3 APS 330 Disclosure Governance The NAB Group’s Disclosure and External communications Policy defines Board and management accountabilities for APS 330 disclosure, including processes and practices to ensure the integrity and timeliness of prudential disclosures and compliance with NAB Group policies.
MethodologyApproach
Credit Risk
Operational Risk
Non-TradedMarket Risk
Traded Market Risk
National Australia
Bank Limited
Advanced IRB
AMA IRRBB Standardised and IMA
Bank of New Zealand
Advanced IRB
AMA IRRBB Standardised and IMA
Clydesdale Bank PLC
Standardised Standardised IRRBB n/a

Introduction
5
pillar 3 report
2015
1.4 Regulatory Reform
The quantitative requirements of APRA’s Prudential Standard APS 210 Liquidity came into force on 1 January 2015 requiring compliance with the Liquidity Coverage Ratio (LCR). Net Stable Funding Ratio (NSFR) rules are expected to be released by APRA during 2015/2016, with implementation expected in 2018. The NAB Group’s liquidity strategy remains focused on the quality of liquid assets and the stability of the funding that underpins the LCR. The NAB Group also remains focused on other areas of regulatory change. Key reforms that may affect its capital and funding include: Basel III
- APRA’s disclosure requirements in relation to leverage ratio, Global Systemically Important Bank (G-SIB) indicators and LCR became effective from 1 July 2015. The September 2015 Leverage ratio and LCR are disclosed on page 75 and 76 of this report. The minimum leverage ratio is yet to be determined by APRA, with Pillar 1 compliance not required until 1 January 2018.
- The Basel Committee on Banking Supervision’s (BCBS) Fundamental Review of the Trading Book (FRTB) and review of the Credit Valuation Adjustment (CVA) framework is currently in consultation.
Federal Government’s Financial System Inquiry (Inquiry)
- Released in December 2014, the Inquiry’s final report included recommendations focused on financial system resilience, including ensuring unquestionably strong bank capital ratios, mortgage risk weights calibration, and the implementation of a loss absorbing capacity framework.
- APRA’s introduction in July 2015 of an increase in mortgage risk weights for internal ratings-based approach accredited ADIs to on average 25% in response to a recommendation of the Inquiry. This change takes effect from 1 July 2016.
- In July 2015, APRA released the findings from a study comparing the capital position of the Australian major banks against their international peers. APRA has indicated a final response will require further consideration.
- The Federal Government’s response released October 2015, was supportive of the resilience recommendations and APRA’s approach to implementation.
Basel IV agenda
- Themes driving the informally named ‘Basel IV’ BCBS proposals include transparency, consistency and credibility of IRB models. Draft proposals include revisions to the standardised approaches for calculating regulatory capital and the introduction of a capital floor framework and revisions to interest rate risk in the banking book (IRRBB) framework.
Other regulatory changes - APRA’s notification regarding the definition of
entities to be included within the Level 2 Authorised Deposit-taking Institution (ADI) Group was previously announced on 5 May 2014. The change will remove over time the capital benefit that NAB gains from the debt on the National Wealth Management Holdings (NWMH) balance sheet, in accordance with the APRA approved transition period to December 2017. As of 30 September 2015, NWMH has $1.0 billion of debt remaining subject to transition, which is equivalent to 25 basis points of CET1 Capital.
- APRA has confirmed a minimum 12 month transition period will be provided for Level 3 Conglomerate Supervision requirements. APRA’s quantitative impact analysis suggests no potential Level 3 Group would be required to raise additional capital as a result of the implementation. Implementation has been deferred by APRA with a date to be advised.
- The PRA confirmed the UK Pillar 2 Framework in July 2015 with the publication of Policy Statement 17/15: "Assessing capital adequacy under Pillar 2 (PS17/15)". The statement confirms revised methodologies for assessing Credit, Concentration, Operational and Conduct risks and also covers capital buffers and confirms that the Capital Planning Buffer will be replaced by the CRD IV buffers (Capital Conservation Buffer, Counter-Cyclical Buffer, and Systemic Risk Buffer) that transition from 1 January 2016. These will provide a “floor” for Pillar 2B requirements, however the PRA will also make its own buffer assessment and if this is higher than the combined CRD IV buffers then an additional PRA buffer would be applied.
- The UK Government has enacted legislation to restrict to 50% the utilisation of tax losses realised by UK banks prior to 1 April 2015. This will prolong the expected period of time required to utilise deferred tax assets recognised on these tax losses. The UK Government has also announced a tax law change that will restrict tax relief for banks' conduct compensation payments to customers. The measure applies to compensation expenditure arising on or after 8 July 2015. Furthermore, the existing Bank Levy will be reduced from 0.21% to 0.10% by 2021. However, from 1 January 2016 a new profit related surcharge of 8% will apply. It was also announced that the mainstream UK rate of corporation tax would fall from 20% to 19% from 1 April 2017 and to 18% from 1 April 2020.

Scope of Application
6
pillar 3 report
2015 2. Scope of Application
APRA measures the NAB Group’s capital adequacy by assessing financial strength at three levels:
− Level 1: comprises NAB and its subsidiary entities approved by APRA as part of the Extended Licensed Entity (ELE)
− Level 2: comprises NAB and the entities it controls, subject to certain exceptions set out below
− Level 3: comprises the conglomerate NAB Group.
This report applies to the Level 2 consolidated group (the Level 2 Group).
NAB Group Consolidation for Regulatory Purposes
The controlled entities in the Level 2 Group include BNZ, Clydesdale and other financial entities (e.g. finance companies and leasing companies).
Wealth management and life insurance activities are excluded from the calculation of RWA and the related controlled entities are deconsolidated from the Level 2 Group for the purposes of calculating capital adequacy. Capital adequacy deductions are applied to the investments in, and profits of, these activities. NWMH has not been treated as part of the Level 2 Group for the purposes of this report.
In addition, certain securitisation special purpose vehicles (SPVs) to which assets have been transferred in accordance with APRA’s requirements as set out in APS 120 have been deconsolidated from the Level 2 Group for the purposes of this disclosure. For regulatory purposes, credit risk is removed from the sold assets and there is no requirement to hold capital against them.
Differences in Consolidation Arising Between the Regulatory and Accounting Approaches
For financial reporting, the NAB Group applies International Financial Reporting Standards (IFRS) and consolidates all entities in which it has the power to govern the financial and operating policies so as to obtain benefit from their activities. This includes life insurance, funds management and securitisation SPVs used to house securitised assets. As noted above, these entities receive a different treatment for Level 2 regulatory consolidation purposes. A list of material controlled entities included in the consolidated NAB Group for financial reporting purposes can be found in the NAB Group’s 2015 Annual Financial Report.
Restrictions on the Transfer of Funds and Regulatory Capital within the NAB Group
Limits are placed on the level of capital and funding transfers and on the level of exposure (debt and equity) that the NAB Group may have to a related entity. These limits are subject to the NAB Group Balance Sheet and Liquidity Risk (GBSLR) Policy which requires that contagion risk be managed under regulatory requirements APRA Prudential Standard APS 222 Associations with Related Entities and the Board’s risk appetite for intra-group exposures.
Each banking subsidiary works with the NAB Group to manage capital to target capital ranges approved by their local Boards. Any capital transfer is subject to maintaining adequate subsidiary and parent company capitalisation.
Disclosure 2A: Scope of Application
There were no capital deficiencies in non-consolidated subsidiaries of the NAB Group as at 30 September 2015 or 31 March 2015.
Clydesdale Bank plc
Clydesdale is a wholly owned subsidiary of the NAB Group and operates as a regionally autonomous retail and business bank in the United Kingdom. It applies the provisions laid down in the individual consolidation method waiver granted by the PRA under Article 9 of the EU Capital Requirements Regulation. This enables some intra-group exposures and investments of Clydesdale in its subsidiaries to be eliminated and the free reserves of such subsidiaries to be aggregated when calculating capital resource requirements of Clydesdale.
On 28 October 2015, the NAB Group provided an update to the announcement at the March 2015 half year results, on the demerger and initial public offering (IPO) of Clydesdale and Yorkshire Bank Group plc (CYBG). The NAB Group is proposing to demerge 75% of CYBG shares to existing NAB shareholders and sell up to 25% by IPO to institutional investors in early February 2016.
In order to achieve the proposed CYBG demerger and IPO the UK PRA requires capital support for CYBG of £1.7 billion in relation to potential future legacy conduct costs. The provisions of £465 million recognised in the September 2015 half year will form part of the £1.7 billion support package and, combined with £120 million for CYBG’s share of future conduct liabilities, will result in a capped indemnity from the NAB Group of £1.115 billion upon separation. Assuming no further pre-demerger provisions are raised, future legacy conduct costs will be shared 90.3%/9.7% between the NAB Group and CYBG respectively.
On completion of the demerger, the capped indemnity amount of £1.115 billion is expected to result in a deduction from the NAB Group’s CET1 Capital. To the extent that claims against the NAB Group under the capped indemnity are ultimately less than £1.115 billion, this is expected to result in a commensurate CET1 Capital benefit for the NAB Group.
National Australia Bank Level 2
National Australia Bank Level 3
Bank of New Zealand
Clydesdale Bank PLC
Wealth Managementand Life Insurance
National Australia Bank Limited
Extended Licence Entity Subsidiaries
National Australia Bank Level 1

Risk Governance and Management
7
pillar 3 report
2015 Bank of New Zealand
BNZ is a wholly owned subsidiary of NAB and operates as a regionally autonomous, full-service bank in New Zealand. The BNZ Board is responsible for corporate governance and derives its authority from the Constitution of BNZ and applicable New Zealand legislation.
BNZ is subject to the Basel Accord capital adequacy requirements applicable in New Zealand, mandated by the RBNZ. The capital ratios for BNZ presented in this report have been derived under the RBNZ’s Capital Adequacy Framework (Internal Models Based Approach). Full Basel disclosures for BNZ are published separately under the Disclosure Statement regime applicable to banks incorporated in New Zealand.
Great Western Bank
On 3 August 2015, the NAB Group completed the full divestment of GWB.
MLC life insurance transaction
As announced on 28 October 2015, the NAB Group has agreed to sell 80% of MLC Limited to Nippon Life Limited. The transaction is subject to certain conditions, including regulatory approvals, extraction of the investments and superannuation business and establishing MLC Limited as a standalone life insurance company. Some of these conditions are subject to approvals from third parties and government agencies. The transaction may not proceed if any contractual conditions cannot be satisfied.
Risk Governance and Management
8
pillar 3 report
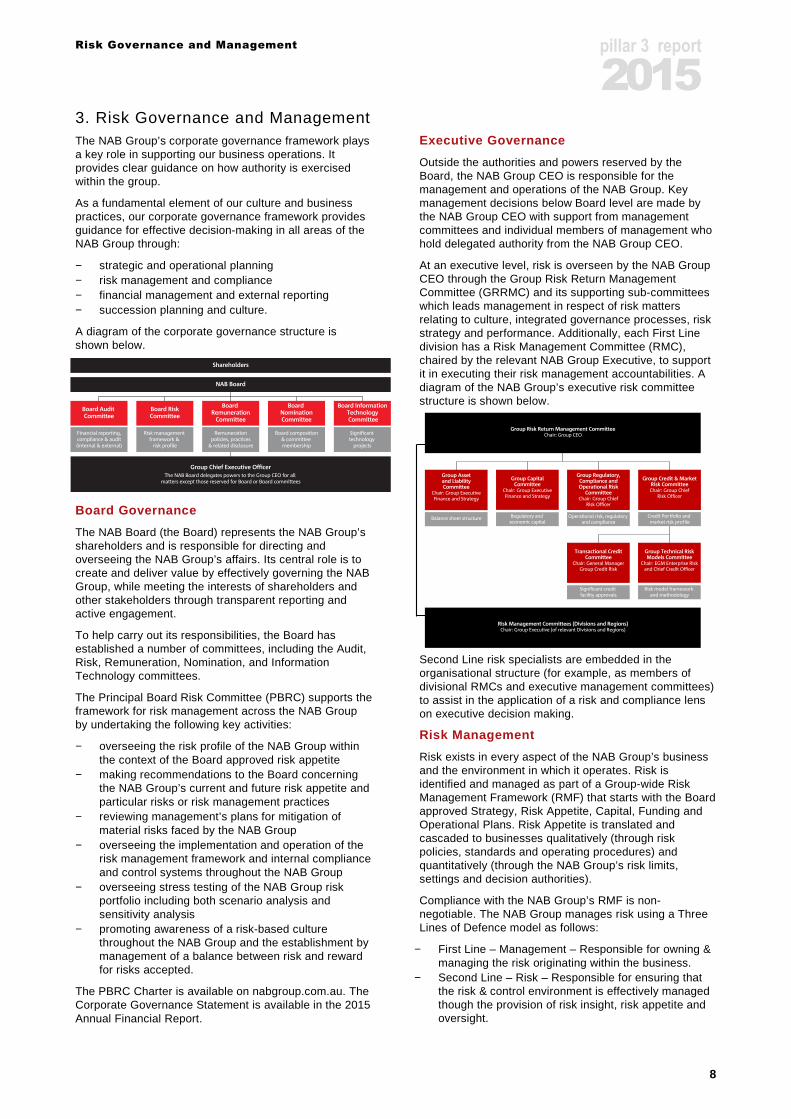
2015 3. Risk Governance and ManagementThe NAB Group’s corporate governance framework plays a key role in supporting our business operations. It provides clear guidance on how authority is exercised within the group.
As a fundamental element of our culture and business practices, our corporate governance framework provides guidance for effective decision-making in all areas of the NAB Group through:
− strategic and operational planning − risk management and compliance − financial management and external reporting − succession planning and culture.
A diagram of the corporate governance structure is shown below.
Board Governance
The NAB Board (the Board) represents the NAB Group’s shareholders and is responsible for directing and overseeing the NAB Group’s affairs. Its central role is to create and deliver value by effectively governing the NAB Group, while meeting the interests of shareholders and other stakeholders through transparent reporting and active engagement.
To help carry out its responsibilities, the Board has established a number of committees, including the Audit, Risk, Remuneration, Nomination, and Information Technology committees.
The Principal Board Risk Committee (PBRC) supports the framework for risk management across the NAB Group by undertaking the following key activities:
− overseeing the risk profile of the NAB Group within the context of the Board approved risk appetite
− making recommendations to the Board concerning the NAB Group’s current and future risk appetite and particular risks or risk management practices
− reviewing management’s plans for mitigation of material risks faced by the NAB Group
− overseeing the implementation and operation of the risk management framework and internal compliance and control systems throughout the NAB Group
− overseeing stress testing of the NAB Group risk portfolio including both scenario analysis and sensitivity analysis
− promoting awareness of a risk-based culture throughout the NAB Group and the establishment by management of a balance between risk and reward for risks accepted.
The PBRC Charter is available on nabgroup.com.au. The Corporate Governance Statement is available in the 2015 Annual Financial Report.
Executive Governance
Outside the authorities and powers reserved by the Board, the NAB Group CEO is responsible for the management and operations of the NAB Group. Key management decisions below Board level are made by the NAB Group CEO with support from management committees and individual members of management who hold delegated authority from the NAB Group CEO.
At an executive level, risk is overseen by the NAB Group CEO through the Group Risk Return Management Committee (GRRMC) and its supporting sub-committees which leads management in respect of risk matters relating to culture, integrated governance processes, risk strategy and performance. Additionally, each First Line division has a Risk Management Committee (RMC), chaired by the relevant NAB Group Executive, to support it in executing their risk management accountabilities. A diagram of the NAB Group’s executive risk committee structure is shown below.
Second Line risk specialists are embedded in the organisational structure (for example, as members of divisional RMCs and executive management committees) to assist in the application of a risk and compliance lens on executive decision making.
Risk Management
Risk exists in every aspect of the NAB Group’s business and the environment in which it operates. Risk is identified and managed as part of a Group-wide Risk Management Framework (RMF) that starts with the Board approved Strategy, Risk Appetite, Capital, Funding and Operational Plans. Risk Appetite is translated and cascaded to businesses qualitatively (through risk policies, standards and operating procedures) and quantitatively (through the NAB Group’s risk limits, settings and decision authorities).
Compliance with the NAB Group’s RMF is non-negotiable. The NAB Group manages risk using a Three Lines of Defence model as follows:
− First Line – Management – Responsible for owning & managing the risk originating within the business.
− Second Line – Risk – Responsible for ensuring that the risk & control environment is effectively managed though the provision of risk insight, risk appetite and oversight.
Board Remuneration
Committee
Remuneration policies, practices
& related disclosure
Board NominationCommittee
Board composition& committee membership
Board Audit Committee
Financial reporting,compliance & audit(internal & external)
Board RiskCommittee
Risk management framework &
risk profile
Board Information Technology Committee
Significant technology
projects
NAB Board
Group Chief Executive Officer
Shareholders
The NAB Board delegates powers to the Group CEO for all matters except those reserved for Board or Board committees
Balance sheet structure
Group Asset and Liability Committee
Chair: Group Executive Finance and Strategy
Credit Portfolio and market risk profile
Group Credit & Market Risk CommitteeChair: Group Chief
Risk Officer
Group Risk Return Management CommitteeChair: Group CEO
Operational risk, regulatory and compliance
Group Regulatory, Compliance and Operational Risk
CommitteeChair: Group Chief
Risk Officer
Regulatory and economic capital
Group Capital Committee
Chair: Group Executive Finance and Strategy
Significant credit facility approvals
Transactional Credit Committee
Chair: General Manager Group Credit Risk
Risk model framework and methodology
Group Technical Risk Models Committee
Chair: EGM Enterprise Risk and Chief Credit Officer
Risk Management Committees (Divisions and Regions)Chair: Group Executive (of relevant Divisions and Regions)

Risk Governance and Management
9
pillar 3 report
2015 − Third Line – Internal Audit – Responsible for providing
independent assurance over the risk & control environment.
Operational accountability for risk management activities across each Line of Defence is articulated in our Risk Management Accountability Model. The key principles to this model are that risk management activities:
− are clearly understood − are focused on enhancing sustainable business
performance − are efficient − assess and confirm the effectiveness of the Risk and
Control Framework − review the current and emerging risk profile.
Further details of risks associated with the NAB Group are set out in in the NAB 2015 Annual Financial Report.

Capital
10
pillar 3 report
2015 4. Capital
4.1 Capital Adequacy
Capital Objectives
The NAB Group assesses capital adequacy to support its overarching capital management objectives:
− a credit rating in the AA range − meeting regulatory capital requirements − meeting internal economic capital requirements − maintaining flexibility to deal with unexpected events − efficiency in the amount and type of capital − effective deployment of capital.
Risk Identification and Measurement
The process of assessing capital adequacy begins with the identification of all the material risks of the NAB Group within the Group Risk Inventory (GRI). The GRI includes consistent definitions and the approach to measurement, including for capital adequacy purposes.
The NAB Group measures all material risks and where appropriate, generates a capital adequacy requirement. In managing the business, the NAB Group considers both regulatory and economic capital requirements.
Regulatory Capital Economic Capital
Purpose Regulatory view of the capital required to be held to protect against risks associated with business activities.
Management’s view of the capital required to be held to support the specific risk characteristics of the business and its portfolio.
Calculation Driven by RWA which is calculated under regulatory requirements.
Internal risk-based models.
Risk types Credit risk, market risk, operational risk and interest rate risk in the banking book.
As per regulatory capital requirements, plus other material risks, including defined-benefit pension risk and business/strategic risk.
Capital Planning
Along with the Risk Appetite Statement, the Capital Management Plan is an integral part of the NAB Group’s strategic planning process which considers how the NAB Group will meet its capital requirements over a three-year plan period. The Capital Management Plan covers the NAB Group’s:
− capital outlook, including capital forecast − risks and potential upsides to the forecast − capital initiatives over the plan period − dividend outlook and sustainability − profits test obligations − other strategic initiatives.
In addition to a base case, the planning process also considers stressed scenarios and sensitivities to ensure the NAB Group maintains capital adequacy in these situations and adjusts plans if these stress tests highlight a need to. Within certain risk categories, the NAB Group performs regular sensitivity and stress tests across material models and businesses to test the veracity of assumptions and to determine the sensitivity of key risk measures (including capital) to management actions and potential changes in the external environment. The NAB
Group then develops plans to mitigate risks in the event of a stressed scenario.
The Board sets capital targets above the internal risk-based assessment of capital. Target ranges are set by reference to factors such as the NAB Group’s Risk Appetite Statement, market, regulatory and rating agencies expectations. The NAB Group’s CET1 Capital ratio operating target is between 8.75% and 9.25% based on current regulatory requirements. The NAB Group will continue to regularly review its operating target levels and aims to retain flexibility in executing capital initiatives. These targets reflect the NAB Group’s desire to support balance sheet strength and are consistent with investor risk appetite and global regulatory direction. The NAB Group continues to operate at a comfortable buffer to the Board target. APRA advises the NAB Group of its Prudential Capital Requirements (PCR) which represent the minimum ratios of regulatory capital to total RWA. The PCRs are not publicly disclosed.
The NAB Group’s capital position is monitored on a monthly basis and reported to management and Board committees.
Embedding Capital Requirements in Business Decisions
Capital requirements are taken into consideration in:
− product and facility pricing decisions − business development, including acquisitions − strategy and strategic planning − performance measurement and management,
including short and long-term incentive determination − setting of risk appetite and risk limits, including large
exposure limits, industry limits and country limits.

Capital
11
pillar 3 report
2015
Governance, Reporting and Oversight
A number of risks exist in the management of the NAB Group’s capital position which, if not appropriately managed, could lead to the NAB Group not holding sufficient capital and reserves to achieve its strategic aspirations, cover the risks to which it is exposed and protect against unexpected losses.
The annual Internal Capital Adequacy Assessment Process (ICAAP) describes the NAB Group’s framework for assessing its capital adequacy. Key features include:
− understanding risks and ensuring they are appropriately mitigated
− capital management − use of capital in the business − risk appetite and planning process − capital adequacy assessment on current and forward
looking basis, including the impact of stress and scenario testing.
The NAB Group’s ICAAP document, Capital Management Plan, Risk Appetite Statement and Strategic Plan cover the governance, reporting and oversight of the NAB Group’s capital adequacy. These documents and plans are reviewed and endorsed by key management committees, including the Group Capital Committee (GCC), the Group Asset and Liability Committee (GALCO) and the GRRMC, and are ultimately approved by the Board.
The ICAAP is also supported by the NAB’s GBSLR Policy which defines the framework for the management, monitoring and governance of the NAB Group’s capital position. The framework is built around the Board’s guiding principles, including preserving the NAB Group’s credit rating, maintaining capital adequacy and an efficient capital mix.
Group Treasury is responsible for managing capital risk. The NAB Group and subsidiary Treasuries each prepare an annual Capital Management Plan (incorporating capital targets) and execute the Board-approved strategies outlined in the Capital Management Plan.
GBSLR is responsible for capital oversight and is independent of Treasury. GBSLR maintains a risk framework for effective oversight, supports stress testing of the NAB Group’s capital position, supports capital planning and forecasting, and monitors capital activities to ensure compliance with the requirements of the NAB Group’s capital framework.

Capital
12
pillar 3 report
2015 Table 4.1A: Risk-Weighted Assets
The following table provides the Basel Accord RWA for the Level 2 Group. As at
30 Sep 15 31 Mar 15
RWA RWA
$m $m
Credit risk (1)
IRB approach
Corporate (including SME) (2) 128,382 122,190
Sovereign 1,679 1,762
Bank 12,291 12,711
Residential mortgage 60,783 60,987
Qualifying revolving retail 3,782 3,773
Retail SME 6,470 6,667
Other retail 3,429 3,590
Total IRB approach 216,816 211,680
Specialised lending (SL) 58,376 53,415
Standardised approach
Australian and foreign governments 55 205
Bank 189 222
Residential mortgage 20,877 19,603
Corporate 20,896 26,671
Other 3,404 3,349
Total standardised approach 45.421 50,050
Other
Securitisation 2,515 2,701
Credit value adjustment 13,940 13,383
Central counterparty default fund contribution guarantee 557 343
Other (3) 6,701 8,655
Total other 23,713 25,082
Total credit risk 344,326 340,227
Market risk 5,793 5,821
Operational risk 40,000 40,000
Interest rate risk in the banking book(4) 9,639 7,190
Total risk-weighted assets 399,758 393,238
(1) RWA which are calculated in accordance with APRA’s requirements under the Basel Accord are required to incorporate a scaling factor of 1.06 to assets that are not subject to specific risk weights.
(2) Corporate (including SME) consists of corporations, partnerships or proprietorships not elsewhere classified and includes non-banking entities held by banks.
(3) ‘Other’ includes non-lending asset exposures and, from September 2013, an RBNZ overlay adjustment required to maintain a minimum risk profile of the NZ Agri portfolio.
(4) Due to an IRRBB model enhancement reflected in the 30 September 2015 result, the equivalent March 2015 result would now be $11,581m.

Capital
13
pillar 3 report
2015 Table 4.1B: Capital Ratios
The table below provides the key capital ratios for each significant ADI or overseas bank subsidiary. As at
30 Sep 15 31 Mar 15
Capital ratios (1) % %
Level 2 Common Equity Tier 1 Capital ratio 10.24 8.87
Level 2 Tier 1 Capital ratio 12.44 11.13
Level 2 Total Capital ratio 14.15 12.81
Level 1 National Australia Bank Common Equity Tier 1 Capital ratio 11.60 10.08
Level 1 National Australia Bank Tier 1 Capital ratio 13.97 12.58
Level 1 National Australia Bank Total Capital ratio 15.78 14.41
Significant subsidiaries
BNZ Common Equity Tier 1 Capital ratio 10.70 10.79
BNZ Tier 1 Capital ratio 11.69 11.85
BNZ Total Capital ratio 12.67 12.90
Clydesdale Common Equity Tier 1 Capital ratio 13.29 12.75
Clydesdale Tier 1 Capital ratio 15.76 14.69
Clydesdale Total Capital ratio 19.13 17.99
(1) Level 1 Group represents the extended licence entity. The Level 2 Group represents the consolidation of the NAB Group and all its subsidiary entities, other than non-consolidated subsidiaries as outlined in Section 2 Scope of Application of this report. Capital ratios for offshore banking subsidiaries reflect local regulatory standards.

Capital
14
pillar 3 report
2015 4.2 Capital Structure The NAB Group’s capital structure comprises various forms of capital. CET1 Capital comprises of paid-up ordinary share capital, retained earnings plus certain other items recognised as capital. The ratio of such capital to risk-weighted assets is called the CET1 Capital Ratio. Additional Tier 1 Capital comprises certain securities with required loss absorbing characteristics. Together, CET1 Capital and Additional Tier 1 Capital make up Tier 1 Capital and the ratio of such capital to RWA is called the Tier 1 Capital ratio.
CET1 Capital contains the highest quality and most loss absorbent components of capital, followed by Additional Tier 1 Capital and then followed by Tier 2 Capital. Tier 2 Capital mainly comprises of subordinated instruments, which contributes to the overall capital framework.
Further details of Additional Tier 1 and Tier 2 securities are disclosed in the Capital Instruments section of the NAB Group’s website at: http://capital.nab.com.au/disclaimer-area/capital-instruments.phps.
Table 4.2A: Regulatory Capital Structure - Summary (1)
The table below provides the structure of Regulatory Capital for the NAB Group. A detailed breakdown is shown in Section 12 of this report. As at
30 Sep 15 31 Mar 15
$m $m
Common Equity Tier 1 Capital before regulatory adjustments 53,562 47,845
Total regulatory adjustments to Common Equity Tier 1 Capital 12,625 12,951
Common Equity Tier 1 Capital (CET1) 40,937 34,894
Additional Tier 1 Capital before regulatory adjustments 8,814 8,858
Total regulatory adjustments to Additional Tier 1 Capital 8 -
Additional Tier 1 Capital (AT1) 8,806 8,858
Tier 1 Capital (T1 = CET1 + AT1) 49,743 43,752
Tier 2 Capital before regulatory adjustments 6,888 6,705
Total regulatory adjustments to Tier 2 Capital 81 102
Tier 2 Capital (T2) 6,807 6,603
Total Capital (TC = T1 + T2) 56,550 50,355
(1) Regulatory Capital has been calculated in accordance with APRA definitions in APRA Prudential Standard APS 111 Capital Adequacy: Measurement of Capital. The regulatory approach to calculating capital differs from the accounting approach as defined under IFRS.

Credit Risk
15
pillar 3 report
2015 5. Credit Risk
5.1 General Disclosure Credit is any transaction that creates an actual or potential obligation for a counterparty to pay the NAB Group.
Credit risk is the potential that a counterparty or customer may fail to meet its obligations to the NAB Group under agreed terms.
The NAB Group’s approach to credit risk management is designed to:
− inform future direction and broader strategic priorities − achieve effective credit risk management through
maintaining exposure to credit risk within acceptable parameters while maximising the NAB Group’s risk-adjusted rate of return and ensuring alignment to risk appetite
− be embedded in every aspect of the NAB Group’s day-to-day business.
Structure and Organisation
The Board delegates credit decision-making authority to the PBRC and then through the organisation via the NAB Group CEO and NAB Group Chief Risk Officer (CRO), who set the Delegated Commitment Authority (DCA). The DCA is cascaded via the NAB Group Chief Credit Officer to the Transactional Credit Committee (TCC) and the NAB Group’s business units.
The GRRMC and its subcommittees oversee the NAB Group’s credit risk appetite, principles, policies, models and systems for the management of credit risk across the NAB Group.
Business unit risk management committees are responsible for implementing these disciplines at a business unit level.
Either the PBRC or its delegates set limits on the amount of risk accepted concerning one counterparty or group of counterparties, and geographic and industry segments. These limits are consistent with the NAB Group’s risk appetite. Such risks are monitored on a regular basis and are subject to annual or more frequent reviews.
Management
Exposure to credit risk is managed by regularly analysing the ability of counterparties and potential counterparties to meet interest and capital repayment obligations, and by changing lending limits and lending conditions where appropriate.
Group Credit Policy applies globally and encompasses the NAB Group’s:
− credit risk appetite and principles − credit underwriting standards − approach to ensure compliance with regulatory
standards.
Senior management and line management within each business unit have primary responsibility to ensure their respective areas follow the NAB Group’s credit policies, processes and standards.
The Credit Risk functions at the NAB Group and business unit levels are charged with implementing a sound risk framework to maintain appropriate asset quality across the NAB Group in line with credit risk appetite, credit risk underwriting standards and policy.
Group Credit Risk plays a key role in managing risk appetite, portfolio measurement, assisting businesses with portfolio management, and measuring compliance with strategic targets and limits. Group Credit Risk also:
− owns and is accountable for the credit risk policies and systems, concentration limits, large counterparty credit approvals and the management of large underperforming loans
− ensures that such policies and systems comply with the various regulatory and prudential requirements
− owns and monitors the performance of Group-wide models and methodology.
A key assurance area across non-retail banking activities is the Asset Quality Assurance function. This function is responsible and accountable for the independent review and reporting of asset quality, lending process standards and credit policy compliance across transaction-managed lending portfolios. The function operates independently from the credit approval process and reports its findings to the respective business units and risk management committees highlighting adverse trends and required remedial action.
Retail lending teams undertake independent reviews and report these results to senior management in the respective business and risk management committees.
Measurement
Later sections of this report detail the credit risk measurement approaches.
Monitoring and Reporting
The NAB Group has a comprehensive process for reporting credit and asset quality.
The NAB Group and business unit CROs receive regular reports covering credit risk parameters, asset concentrations and asset quality for both business and retail credit. These reports incorporate key credit risk measures including economic capital and detailed analysis of concentration risk, TCC approvals and updates on defaulted counterparties. Key reports are provided to the internal committees and the PBRC.
On a monthly basis, the NAB Group and business unit Credit Risk Committees receive a detailed analysis of asset quality measures. Periodically, the business unit and Group Credit Risk functions provide the PBRC and the GRRMC with portfolio and industry reviews, as well as the outcome of portfolio stress testing.

Credit Risk
16
pillar 3 report
2015 Definitions of Default and Impairment
Default occurs when a loan obligation is 90 days or more past due, or when it is considered unlikely that the credit obligation to the NAB Group will be paid in full without recourse to actions, such as realisation of security. There are no material exceptions to the NAB Group’s definition of default.
A facility is classified as impaired when the ultimate ability to collect principal and interest and other amounts (including legal, enforcement and realisation costs) is compromised, and the bank’s security is insufficient to cover these amounts, leading to a loss occurring.
Impaired facilities consist of:
− retail loans (excluding unsecured portfolio-managed facilities) which are contractually 90 days or more past due with security insufficient to cover principal and arrears of interest revenue
− unsecured portfolio-managed facilities which are 180 days past due (if not written off)
− non-retail loans that are contractually 90 days or more past due and/or sufficient doubt exists about the ultimate ability to collect principal and interest
− impaired off-balance sheet credit exposures, where current circumstances indicate that losses may be incurred.
Creation of Specific Provisions, Collective Provisions and the General Reserve for Credit Losses
Specific provisions
Specific provisions are raised for assets classified as default loss expected. A specific provision will be raised when the estimated cash flows accruing to an asset, including the estimated realisable value of securities after meeting security realisation costs, are less than the face value of the asset.
The calculation and raising of specific provisions is subject to tight controls with only appropriate Categorised Asset Approval Authority (CAAA) holders capable of establishing these provisions.
Collective provisions
Collective provisions are raised for assets that are not impaired. This process involves grouping financial assets with similar credit risk characteristics and collectively assessing them for expected loss in accordance with the requirements of IFRS.
For retail assets the calculation relies on the portfolio delinquency profile and historical loss experience while the non-retail calculation relies on the risk characteristics of credit rating models.
In addition, the NAB Group uses its expert judgement to estimate the amount of expected loss. The use of such judgements and reasonable estimates is considered by management to be an essential part of the process and does not impact the reliability of the calculations as all assessments are conducted within the requirements of IFRS.
The NAB Group’s collective provision is disclosed in the NAB 2015 Annual Financial Report.
Effective 1 October 2014, the NAB Group early adopted the requirements of AASB 9 ‘Financial Instruments’. The transitional impacts of this adoption are highlighted in Note 1 to the NAB Group’s 2015 Annual Financial Report.
Default-no-loss assets are defaulted or otherwise non-performing assets, such as 90+ days past due (90+ DPD) retail and default-no-loss non-retail exposures. Provisions for default-no-loss assets are reported as additional regulatory specific provisions within this report.
General reserve for credit losses
APRA Prudential Standard APS 220 Credit Quality requires a reserve to be held to cover credit losses estimated but not certain to arise in the future over the full life of all individual facilities. The general reserve for credit losses (GRCL) represents an appropriation of retained profits to non-distributable reserves.
The GRCL is calculated as a collective provision for doubtful debts, excluding securitisation and provisions on default-no-loss assets. The difference between the GRCL and accounting collective provisions is covered with an additional top up, created through a deduction from retained earnings to reflect losses expected as a result of future events that are not recognised in the NAB Group’s collective provision for accounting purposes.
Write-offs
When an asset is considered uncollectible, it is written off against the related provision. Such assets are written off after all the necessary recovery procedures have been completed and the amount of the loss has been determined. Subsequent recoveries of amounts written off reduce the amount of the expense in the income statement.

Credit Risk
17
pillar 3 report
2015 Table 5.1A: Credit Risk Exposures Summary
This table provides the amount of gross credit risk exposure subject to the Standardised and Advanced IRB approaches. The Level 2 Group has no credit risk exposures subject to the Foundation IRB approach. Gross credit risk exposure refers to the potential exposure as a result of a counterparty default before the application of credit risk mitigation. It is defined as the outstanding amount on drawn commitments plus a credit conversion factor on undrawn commitments on a given facility. For derivatives, the exposure is defined as the mark-to-market value plus a potential value of future movements.
For the IRB approach, Exposure at Default (EaD) is reported gross of specific provisions and partial write-offs and before the application of on-balance sheet netting and credit risk mitigation. For the Standardised approach, EaD is reported net of any specific provision and before the application of on-balance sheet netting and credit risk mitigation. Exposures exclude non-lending assets, securitisation and Credit Value Adjustment (CVA).
Definitions of impairment and past due facilities are based on APS 220. This standard also provides guidance for Provisioning, estimated future credit losses and the General Reserve for Credit Losses.
As at 30 Sep 15
6 months
ended
30 Sep 15
Total
exposure (EaD) (1)
Risk-weighted
Assets
Regulatory expected
loss
Impaired facilities (2)
Specific provisions
(3)
Net write-offs
(4)
Exposure type $m $m $m $m $m $m
IRB approach
Corporate (including SME) 261,339 128,382 1,598 778 244 288
Sovereign 71,477 1,679 2 - - -
Bank 81,055 12,291 20 - - -
Residential mortgage 340,777 60,783 859 367 94 30
Qualifying revolving retail 11,272 3,782 174 - - 71
Retail SME 16,227 6,470 154 96 45 42
Other retail 4,432 3,429 134 3 1 43
Total IRB approach 786,579 216,816 2,941 1,244 384 474
Specialised lending (SL) 66,039 58,376 1,057 226 54 39
Standardised approach
Australian and foreign governments 14,499 55 - - - -
Bank 1,157 189 - - - -
Residential mortgage 53,430 20,877 - 150 51 5
Corporate 80,962 20,896 - 427 179 32
Other 3,999 3,404 - 3 3 43
Total standardised approach 154,047 45,421 - 580 233 80
Total 1,006,665 320,613 3,998 2,050 671 593
(1) Total credit risk exposure is EaD estimates of potential exposure, according to product type, for a period of one year.
(2) Impaired facilities includes $60 million of restructured loans (March 2015: $80 million) which includes $nil of restructured fair value assets (March 2015: $6 million).
Impaired facilities includes $58 million of gross impaired loans at fair value (March 2015: $73 million).
(3) Specific provisions for prudential purposes include all provisions for impairment assessed on an individual basis in accordance with IFRS excluding securitisation. For regulatory reporting collective provisions on defaulted or otherwise non-performing assets, regardless of expected loss, such as those for 90+ days past due retail and in default with no loss non-retail exposures, are treated as regulatory specifics and total $413 million (March 2015: $410 million).
Specific provisions includes $34 million (March 2015: $35 million) of specific provisions on gross impaired loans at fair value.
(4) Net write-offs includes net write-offs of fair value loans and discontinued operations of GWB.

Credit Risk
18
pillar 3 report
2015
As at 31 Mar 15
6 months ended
31 Mar 15
Total
exposure (EaD)
Risk-weighted
Assets
Regulatory expected
loss
Impaired facilities
Specific provisions
Net write-offs
Exposure type $m $m $m $m $m $m
IRB approach
Corporate (including SME) 248,954 122,190 1,740 1,104 440 207
Sovereign 75,753 1,762 2 - - -
Bank 79,920 12,711 22 1 - (1)
Residential mortgage 334,743 60,987 903 407 107 34
Qualifying revolving retail 11,169 3,773 181 - - 64
Retail SME 16,323 6,667 170 105 54 25
Other retail 4,829 3,590 136 4 3 40
Total IRB approach 771,691 211,680 3,154 1,621 604 369
Specialised lending (SL) 62,721 53,415 1,054 320 81 126
Standardised approach
Australian and foreign governments 17,605 205 - 60 - -
Bank 2,490 222 - - - -
Residential mortgage 47,919 19,603 - 116 36 6
Corporate 68,386 26,671 - 437 185 120
Other 3,934 3,349 - 4 1 21
Total standardised approach 140,334 50,050 - 617 222 147
Total 974,746 315,145 4,208 2,558 907 642

Credit Risk
19
pillar 3 report
2015 Credit Exposures by Measurement Approach
Table 5.1B: Total and Average Credit Risk Exposures
This table provides the amount of gross credit risk exposure subject to the Standardised and Advanced IRB approaches. The Level 2 Group has no credit risk exposures subject to the Foundation IRB approach. Gross credit risk exposure refers to the potential exposure as a result of a counterparty default prior to the application of credit risk mitigation. It is defined as the outstanding amount on drawn commitments plus a credit conversion factor on undrawn commitments on a given facility. For derivatives, the exposure is defined as the mark-to-market value plus a potential value of future movements. The average credit risk exposure is the sum of the gross credit risk exposure at the beginning of the reporting period plus the gross credit risk exposure at the end of the reporting period divided by two.
For the IRB approach, EaD is reported gross of specific provisions and partial write-offs and prior to the application of on-balance sheet netting and credit risk mitigation. For the Standardised approach, EaD is reported net of any specific provision and prior to the application of on-balance sheet netting and credit risk mitigation. Exposures exclude non-lending assets, securitisation and CVA.
As at 30 Sep 15 6 months
ended
30 Sep 15
On-balance
sheet exposure
Non-market related
off-balance sheet
Market related
off-balance sheet
Total exposure
Average total
exposure
Exposure type $m $m $m $m $m
IRB approach
Corporate (including SME) (1) 135,731 61,588 64,020 261,339 255,147
Sovereign (1) 54,200 485 16,792 71,477 73,615
Bank (1) 25,377 4,058 51,620 81,055 80,488
Residential mortgage 291,966 48,811 - 340,777 337,760
Qualifying revolving retail 5,702 5,570 - 11,272 11,221
Retail SME 12,443 3,784 - 16,227 16,275
Other retail 3,190 1,242 - 4,432 4,631
Total IRB approach 528,609 125,538 132,432 786,579 779,137
Specialised lending (SL) 54,293 10,321 1,425 66,039 64,380
Standardised approach
Australian and foreign governments 14,283 216 - 14,499 16,052
Bank 616 50 491 1,157 1,824
Residential mortgage 50,491 2,939 - 53,430 50,675
Corporate (1) 19,984 3,166 57,812 80,962 74,674
Other 3,812 187 - 3,999 3,967
Total standardised approach 89,186 6,558 58,303 154,047 147,192
Total 672,088 142,417 192,160 1,006,665 990,709
(1) Total credit risk exposure, net of eligible financial collateral is $850,651 million. For materially impacted asset classes, exposure net of collateral is as follows: $m Corporate (including SME) 214,432 Sovereign 57,919 Bank 42,637 Corporate (Standardised) 25,947
Credit Risk
20
pillar 3 report
2015
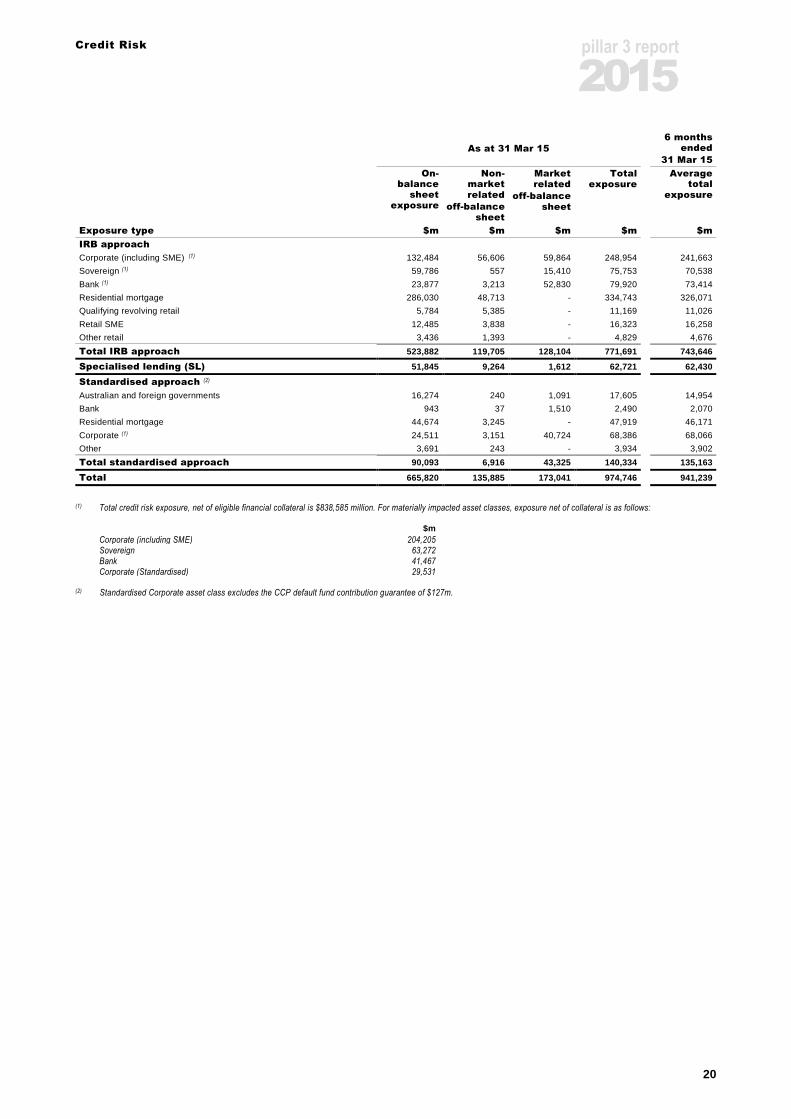
As at 31 Mar 15 6 months
ended
31 Mar 15
On-balance
sheet exposure
Non-market related
off-balance sheet
Market related
off-balance sheet
Total exposure
Average total
exposure
Exposure type $m $m $m $m $m
IRB approach
Corporate (including SME) (1) 132,484 56,606 59,864 248,954 241,663
Sovereign (1) 59,786 557 15,410 75,753 70,538
Bank (1) 23,877 3,213 52,830 79,920 73,414
Residential mortgage 286,030 48,713 - 334,743 326,071
Qualifying revolving retail 5,784 5,385 - 11,169 11,026
Retail SME 12,485 3,838 - 16,323 16,258
Other retail 3,436 1,393 - 4,829 4,676
Total IRB approach 523,882 119,705 128,104 771,691 743,646
Specialised lending (SL) 51,845 9,264 1,612 62,721 62,430
Standardised approach (2)
Australian and foreign governments 16,274 240 1,091 17,605 14,954
Bank 943 37 1,510 2,490 2,070
Residential mortgage 44,674 3,245 - 47,919 46,171
Corporate (1) 24,511 3,151 40,724 68,386 68,066
Other 3,691 243 - 3,934 3,902
Total standardised approach 90,093 6,916 43,325 140,334
135,163
Total 665,820 135,885 173,041 974,746 941,239
(1) Total credit risk exposure, net of eligible financial collateral is $838,585 million. For materially impacted asset classes, exposure net of collateral is as follows: $m
Corporate (including SME) 204,205 Sovereign 63,272 Bank 41,467 Corporate (Standardised) 29,531
(2) Standardised Corporate asset class excludes the CCP default fund contribution guarantee of $127m.

Credit Risk
21
pillar 3 report
2015 Table 5.1C: Exposures by Geography
This table provides the total gross credit risk exposures, by major geographical areas, derived from the booking office where the exposure was transacted. Exposures exclude non-lending assets, securitisation and CVA. As at 30 Sep 15
Australia United Kingdom
New Zealand
Other (1) Total exposure
Exposure type $m $m $m $m $m
IRB approach
Corporate (including SME) 167,150 37,317 32,790 24,082 261,339
Sovereign 50,809 9,727 4,137 6,804 71,477
Bank 31,962 33,698 4,111 11,284 81,055
Residential mortgage 308,579 - 32,198 - 340,777
Qualifying revolving retail 11,272 - - - 11,272
Retail SME 14,442 - 1,785 - 16,227
Other retail 2,326 - 2,106 - 4,432
Total IRB approach 586,540 80,742 77,127 42,170 786,579
Specialised lending (SL) 57,218 1,984 6,045 792 66,039
Standardised approach
Australian and foreign governments - 14,499 - - 14,499
Bank - 1,157 - - 1,157
Residential mortgage 2,635 48,229 3 2,563 53,430
Corporate 4,875 25,164 497 50,426 80,962
Other 1,099 2,816 - 84 3,999
Total standardised approach 8,609 91,865 500 53,073 154,047
Total exposure (EaD) 652,367 174,591 83,672 96,035 1,006,665
(1) ‘Other’ comprises North America and Asia.
As at 31 Mar 15
Australia United Kingdom
New Zealand
Other Total exposure
Exposure type $m $m $m $m $m
IRB approach
Corporate (including SME) 153,932 36,334 33,510 25,178 248,954
Sovereign 50,902 3,125 4,856 16,870 75,753
Bank 30,195 36,079 3,081 10,565 79,920
Residential mortgage 300,722 - 34,021 - 334,743
Qualifying revolving retail 11,169 - - - 11,169
Retail SME 14,376 - 1,947 - 16,323
Other retail 2,281 - 2,548 - 4,829
Total IRB approach 563,577 75,538 79,963 52,613 771,691
Specialised lending (SL) 53,752 2,159 6,176 634 62,721
Standardised approach
Australian and foreign governments - 14,227 - 3,378 17,605
Bank 419 1,930 15 126 2,490
Residential mortgage 2,447 41,881 4 3,587 47,919
Corporate 3,733 24,406 292 39,955 68,386
Other 1,081 2,572 - 281 3,934
Total standardised approach 7,680 85,016 311 47,327 140,334
Total exposure (EaD) 625,009 162,713 86,450 100,574 974,746

Credit Risk
22
pillar 3 report
2015 Table 5.1D: Exposures by Industry
This table provides the distribution of gross credit risk exposures, excluding non-lending assets, securitisation and CVA, by major industry type. Industry classifications follow ANZSIC Level 1 classifications (1). As at 30 Sep 15
Accommodation, cafes, pubs and
restaurants
Agriculture, forestry,
fishing and mining
Business services
and property services
Commercial property
Construction Finance and
insurance
Manufacturing Personal Residential mortgages
Retail and wholesale
trade
Transport and
storage
Other (2) Total
Exposure type $m $m $m $m $m $m $m $m $m $m $m $m $m
IRB approach
Corporate (including SME) 8,125 43,555 14,956 11,676 7,536 82,178 20,387 280 - 27,597 16,478 28,571 261,339
Sovereign - - - - - 32,245 - - - - - 39,232 71,477
Bank - - - - - 79,805 - - - - - 1,250 81,055
Residential mortgage - - - - - - - - 340,777 - - - 340,777
Qualifying revolving retail - - - - - - - 11,272 - - - - 11,272
Retail SME 881 3,944 2,010 481 1,812 878 994 119 - 2,730 781 1,597 16,227
Other retail - - - - - - - 4,432 - - - - 4,432
Total IRB approach 9,006 47,499 16,966 12,157 9,348 195,106 21,381 16,103 340,777 30,327 17,259 70,650 786,579
Specialised lending (SL) 108 861 5 58,630 167 551 - 69 - - 1,647 4,001 66,039
Standardised approach
Australian and foreign governments
- - - - - 11,238 - - - - - 3,261 14,499
Bank - - - - - 1,036 - - - - - 121 1,157
Residential mortgage - - - - - - - - 53,430 - - - 53,430
Corporate 1,053 3,346 2,101 718 475 60,470 2,241 11 1,553 2,464 745 5,785 80,962
Other - - - - - - - 3,984 15 - - - 3,999
Total standardised approach
1,053 3,346 2,101 718 475 72,744 2,241 3,995 54,998 2,464 745 9,167 154,047
Total exposure (EaD) 10,167 51,706 19,072 71,505 9,990 268,401 23,622 20,167 395,775 32,791 19,651 83,818 1,006,665
(1) To provide for a meaningful differentiation and quantitative estimates of risk that are consistent, verifiable, relevant and soundly based, exposures are disclosed based on the counterparty to which the NAB Group is exposed to credit risk, including guarantors and derivative counterparties.
(2) Immaterial categories are grouped collectively under ‘Other’.

Credit Risk
23
pillar 3 report
2015 As at 31 Mar 15
Accommodation cafes, pubs and
restaurants
Agriculture, forestry,
fishing and mining
Business services
and property services
Commercial property
Construction Finance and
insurance
Manufacturing Personal Residential mortgages
Retail and wholesale
trade
Transport and
storage
Other Total
Exposure type $m $m $m $m $m $m $m $m $m $m $m $m $m
IRB approach
Corporate (including SME) 8,044 42,266 13,052 11,769 7,759 71,390 21,406 324 - 26,607 15,991 30,346 248,954
Sovereign - - 63 - - 35,761 - - - - - 39,929 75,753
Bank - - - - - 78,637 - - - - - 1,283 79,920
Residential mortgage - - - - - - - - 334,743 - - - 334,743
Qualifying revolving retail - - - - - - - 11,169 - - - - 11,169
Retail SME 918 3,943 2,016 494 1,817 841 1,021 116 - 2,778 776 1,603 16,323
Other retail - - - - - - - 4,829 - - - - 4,829
Total IRB approach 8,962 46,209 15,131 12,263 9,576 186,629 22,427 16,438 334,743 29,385 16,767 73,161 771,691
Specialised lending (SL) 136 656 4 55,181 265 294 - 86 - - 1,632 4,467 62,721
Standardised approach
Australian and foreign governments
41 1 - 52 - 14,481 24 - - 7 - 2,999 17,605
Bank - - - - - 1,865 - - - - - 625 2,490
Residential mortgage - - - - - - - - 47,919 - - - 47,919
Corporate 1,709 5,217 2,190 1,882 771 33,406 2,279 15 1,551 3,322 874 15,170 68,386
Other 2 11 17 4 7 1 6 3,641 10 11 2 222 3,934
Total standardised approach
1,752 5,229 2,207 1,938 778 49,753 2,309 3,656 49,480 3,340 876 19,016 140,334
Total exposure (EaD) 10,850 52,094 17,342 69,382 10,619 236,676 24,736 20,180 384,223 32,725 19,275 96,644 974,746

Credit Risk
24
pillar 3 report
2015 Table 5.1E: Exposures by Maturity
This table sets out the residual contractual maturity breakdown of gross credit risk exposures, excluding non-lending assets, securitisation and CVA. Overdraft and other similar revolving facilities are allocated to the category that most appropriately captures the maturity characteristics of the product. As at 30 Sep 15
<12 months
1 – 5 years >5 years No specified
maturity (1)
Exposure type $m $m $m $m
IRB approach
Corporate (including SME) 108,860 113,901 32,408 6,170
Sovereign 34,436 16,220 20,747 74
Bank 45,462 14,295 20,862 436
Residential mortgage 39,851 7,817 292,543 566
Qualifying revolving retail 1 - - 11,271
Retail SME 5,326 6,921 3,330 650
Other retail 264 1,118 922 2,128
Total IRB approach 234,200 160,272 370,812 21,295
Specialised lending (SL) 21,332 38,759 5,321 627
Standardised approach
Australian and foreign governments 9,644 1 2,791 2,063
Bank 707 388 49 13
Residential mortgage 2,581 3,040 47,782 27
Corporate 66,385 7,857 6,220 500
Other 1,143 1,556 255 1,045
Total standardised approach 80,460 12,842 57,097 3,648
Total exposure (EaD) 335,992 211,873 433,230 25,570
(1) No specified maturity includes exposures related to credit cards, on demand facilities and guarantees given by the Level 2 Group with no fixed maturity date.
As at 31 Mar 15
<12 months
1 – 5 years >5 years No specified maturity
Exposure type $m $m $m $m
IRB approach
Corporate (including SME) 103,832 108,906 30,205 6,011
Sovereign 36,941 18,162 20,595 55
Bank 49,364 13,187 17,241 128
Residential mortgage 42,034 7,194 284,891 624
Qualifying revolving retail 1 - - 11,168
Retail SME 5,352 6,904 3,383 684
Other retail 200 1,181 792 2,656
Total IRB approach 237,724 155,534 357,107 21,326
Specialised lending (SL) 20,696 36,151 5,074 800
Standardised approach
Australian and foreign governments 11,293 600 3,852 1,860
Bank 1,894 552 31 13
Residential mortgage 2,684 3,532 41,665 38
Corporate 50,618 9,576 7,717 475
Other 1,257 1,503 267 907
Total standardised approach 67,746 15,763 53,532 3,293
Total exposure (EaD) 326,166 207,448 415,713 25,419

Credit Risk
25
pillar 3 report
2015 Credit Provisions and Losses
Table 5.1F: Provisions by Asset Class
The following tables set out information on credit risk provision by Basel Accord asset class, excluding non-lending assets and securitisation exposures. Definitions of impairment and past due facilities are based on APS 220. This standard also provides guidance for Provisioning, estimated future credit losses and the GRCL. As at 30 Sep 15 6 months ended
30 Sep 15
Impaired facilities (1)
Past due facilities
≥90 days
Specific provisions
(2)
Charges for
specific provisions
(3)
Net write-offs
(4)
Exposure type $m $m $m $m $m
IRB approach
Corporate (including SME) 778 221 244 105 288
Sovereign - - - - -
Bank - - - - -
Residential mortgage 367 1,256 94 24 30
Qualifying revolving retail - 58 - 69 71
Retail SME 96 106 45 22 42
Other retail 3 43 1 37 43
Total IRB approach 1,244 1,684 384 257 474
Specialised lending (SL) 226 124 54 8 39
Standardised approach
Australian and foreign governments - - - - -
Bank - - - - -
Residential mortgage 150 216 51 29 5
Corporate 427 76 179 6 32
Other 3 22 3 45 43
Total standardised approach 580 314 233 80 80
Total 2,050 2,122 671 345 593
Additional regulatory specific provision 413
(1) Impaired facilities includes $60 million of restructured loans (March 2015: $80 million) which includes $nil of restructured fair value assets (March 2015: $6 million).
Impaired facilities includes $58 million of gross impaired loans at fair value (March 2015: $73 million).
(2) Specific provisions for prudential purposes include all provisions for impairment assessed on an individual basis in accordance with IFRS excluding securitisation. For regulatory reporting collective provisions on defaulted or otherwise non-performing assets, regardless of expected loss, such as those for 90+ days past due retail and in default with no loss non-retail exposures, are treated as regulatory specifics and total $413 million (March 2015: $410 million).
Specific provisions includes $34 million (March 2015: $35 million) of specific provisions on gross impaired loans at fair value.
(3) Charges for specific provisions includes discontinued operations of GWB.
(4) Net write-offs includes net write-offs of fair value loans and discontinued operations of GWB.
Credit Risk
26
pillar 3 report
2015
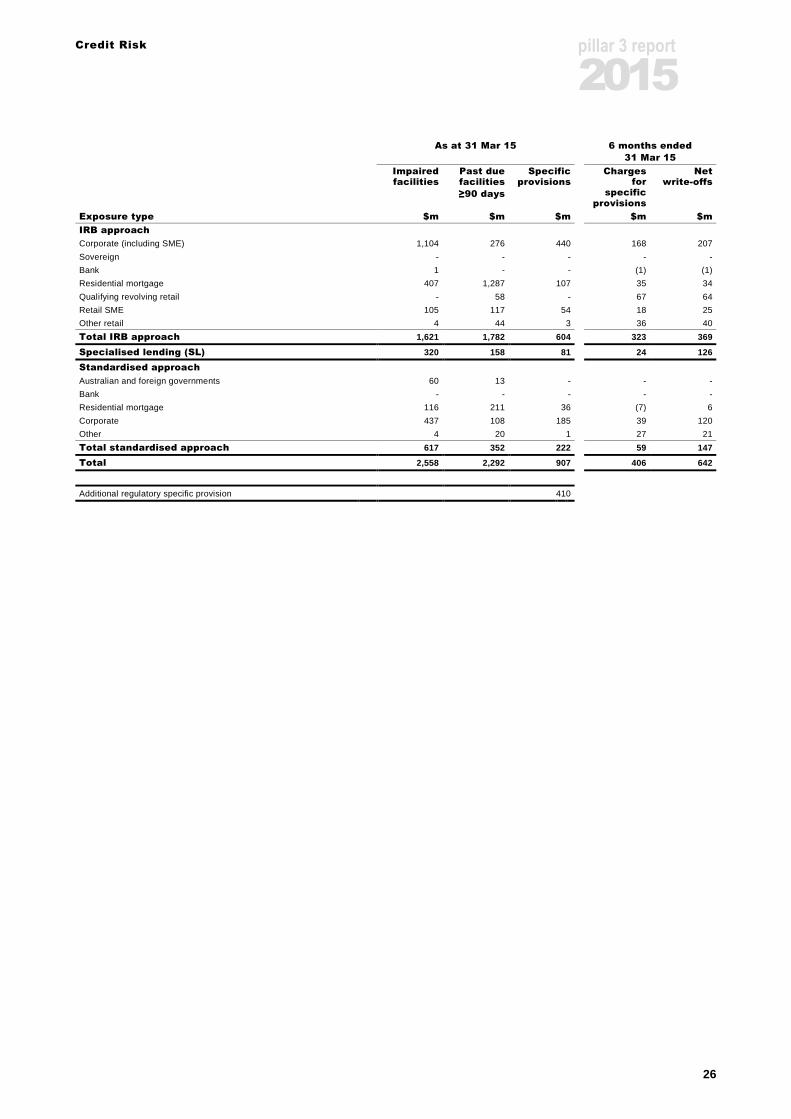
As at 31 Mar 15 6 months ended
31 Mar 15
Impaired facilities
Past due facilities
≥90 days
Specific provisions
Charges for
specific provisions
Net write-offs
Exposure type $m $m $m $m $m
IRB approach
Corporate (including SME) 1,104 276 440 168 207
Sovereign - - - - -
Bank 1 - - (1) (1)
Residential mortgage 407 1,287 107 35 34
Qualifying revolving retail - 58 - 67 64
Retail SME 105 117 54 18 25
Other retail 4 44 3 36 40
Total IRB approach 1,621 1,782 604 323 369
Specialised lending (SL) 320 158 81 24 126
Standardised approach
Australian and foreign governments 60 13 - - -
Bank - - - - -
Residential mortgage 116 211 36 (7) 6
Corporate 437 108 185 39 120
Other 4 20 1 27 21
Total standardised approach 617 352 222 59 147
Total 2,558 2,292 907 406 642
Additional regulatory specific provision 410

Credit Risk
27
pillar 3 report
2015 Factors Impacting Loss Experience in the Preceding Period
90+ Days Past Due Loans
90+DPD facilities declined during the September 2015 half year, mainly driven by the Australian Banking Advanced IRB Corporate (including SME), Residential Mortgage and Specialised Lending portfolios, along with the UK Banking Standardised Corporate portfolio.
Impaired facilities
Impaired facilities decreased during the September 2015 half year, driven by the Advanced IRB Corporate (including SME) and Residential Mortgage portfolios in Australian Banking and NZ Banking, reflecting a general decrease in impairment activity. In addition, the Specialised Lending portfolio improved for Australian Banking and NZ Banking.
Charges for Specific Provisions
The total specific provision charge for the September 2015 half was $345m, $61m lower than the March 2015 half. The six month reduction to September 2015 was primarily due to lower specific provision charges across Australian Banking and NZ Banking within the Advanced IRB Corporate (including SME) portfolios driven by lower impairment activity.
Net Write-Offs
Net write-offs decreased from $642 million for the March 2015 half year to $593 million for the September 2015 half year. The decrease was due to lower write-offs across all major divisions, except NZ Banking (due to the write-off of a large single name), in particular for the Clydesdale Standardised Corporate portfolio.
Credit Risk
28
pillar 3 report
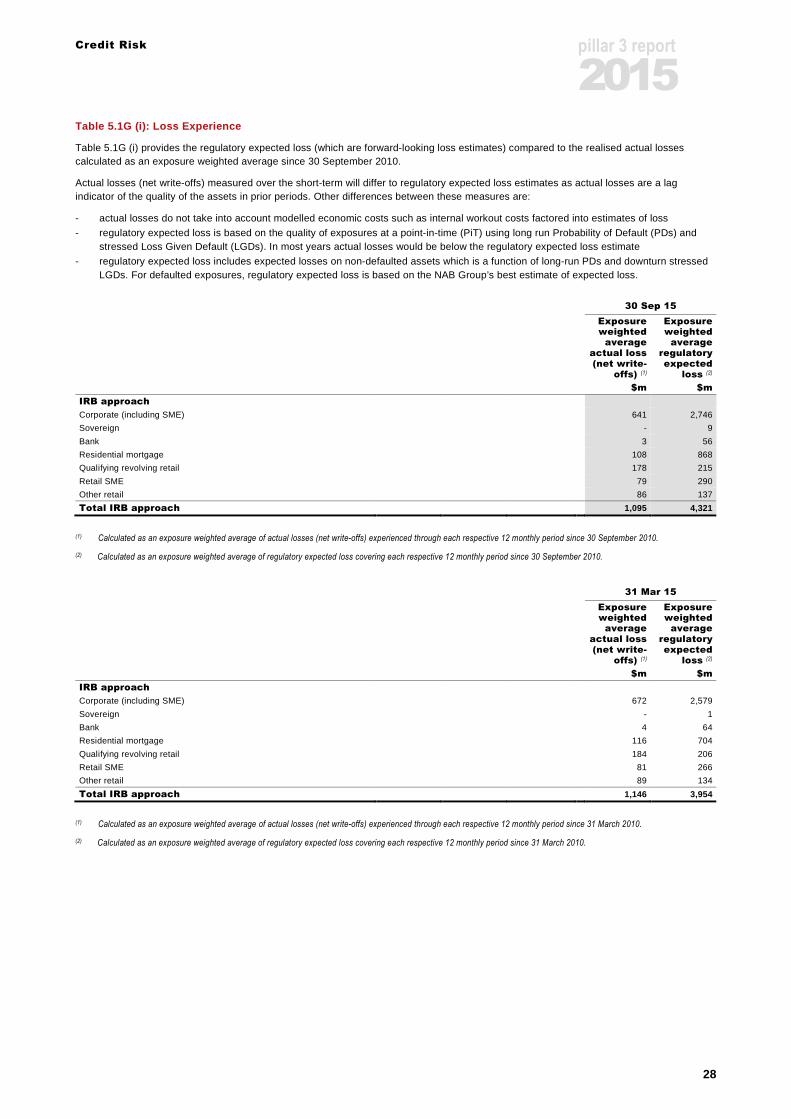
2015 Table 5.1G (i): Loss Experience
Table 5.1G (i) provides the regulatory expected loss (which are forward-looking loss estimates) compared to the realised actual losses calculated as an exposure weighted average since 30 September 2010.
Actual losses (net write-offs) measured over the short-term will differ to regulatory expected loss estimates as actual losses are a lag indicator of the quality of the assets in prior periods. Other differences between these measures are:
- actual losses do not take into account modelled economic costs such as internal workout costs factored into estimates of loss
- regulatory expected loss is based on the quality of exposures at a point-in-time (PiT) using long run Probability of Default (PDs) and stressed Loss Given Default (LGDs). In most years actual losses would be below the regulatory expected loss estimate
- regulatory expected loss includes expected losses on non-defaulted assets which is a function of long-run PDs and downturn stressed LGDs. For defaulted exposures, regulatory expected loss is based on the NAB Group’s best estimate of expected loss.
30 Sep 15
Exposure weighted
average actual loss (net write-
offs) (1)
Exposure weighted
average regulatory expected
loss (2)
$m $m
IRB approach
Corporate (including SME) 641 2,746
Sovereign - 9
Bank 3 56
Residential mortgage 108 868
Qualifying revolving retail 178 215
Retail SME 79 290
Other retail 86 137
Total IRB approach 1,095 4,321
(1) Calculated as an exposure weighted average of actual losses (net write-offs) experienced through each respective 12 monthly period since 30 September 2010.
(2) Calculated as an exposure weighted average of regulatory expected loss covering each respective 12 monthly period since 30 September 2010.
31 Mar 15
Exposure weighted
average actual loss (net write-
offs) (1)
Exposure weighted
average regulatory expected
loss (2)
$m $m
IRB approach
Corporate (including SME) 672 2,579
Sovereign - 1
Bank 4 64
Residential mortgage 116 704
Qualifying revolving retail 184 206
Retail SME 81 266
Other retail 89 134
Total IRB approach 1,146 3,954
(1) Calculated as an exposure weighted average of actual losses (net write-offs) experienced through each respective 12 monthly period since 31 March 2010.
(2) Calculated as an exposure weighted average of regulatory expected loss covering each respective 12 monthly period since 31 March 2010.

Credit Risk
29
pillar 3 report
2015
Accuracy of Risk Estimates
The following tables have been provided to summarise and compare across asset classes, the estimates of credit risk factors used within the calculation of regulatory capital with actual outcomes. Estimates for Specialised Lending have not been included as these exposures are subject to the Supervisory Slotting Criteria approach, which relies upon the application of supervisory risk weights when calculating regulatory Expected Loss (EL). A full explanation of the Internal Ratings Process and the application of credit risk models to calculate PD, EaD and LGD is provided within Section 5.3 of this report.
Table 5.1G (ii): Accuracy of Risk Estimates – PD an d EaD
This table provides a comparison of internal estimates of long-run PD with actual default rates averaged over a period of five years to 30 September 2015. Averages of actual and estimated PD are calculated from customers not in default at the beginning of the financial year and averaged out over the five year observation period. The EaD ratio compares the estimated downturn EaD at the beginning of the financial year against the actual default amount. As at 30 Sep 15
Average
Estimated PD
Average Actual
PD
Ratio of estimated to actual
EAD
% %
IRB approach
Corporate (including SME) 1.79 2.06 1.1
Sovereign (1) 0.41 0.16 1.3
Bank (1) 0.36 0.19 1.1
Residential mortgage (2) 0.92 0.88 1.0
Qualifying revolving retail 1.51 1.40 1.1
Retail SME 1.99 2.31 1.1
Other retail 2.16 2.87 1.0
(1) Average actual PDs for Sovereign and Bank exposures are based on a low number of observed defaults.
(2) Estimated PDs includes BNZ assets subject to RBNZ calibration overlay.
As at 31 Mar 15
Average
Estimated PD (1)
Average Actual
PD (1)
Ratio of estimated to actual
EAD
% %
IRB approach
Corporate (including SME) 1.78 2.05 1.1
Sovereign 0.40 0.11 1.1
Bank 0.37 0.24 1.0
Residential mortgage 0.98 0.87 1.0
Qualifying revolving retail 1.60 1.41 1.1
Retail SME 1.97 2.27 1.1
Other retail 2.27 2.89 1.0
(1) These values provide a comparison of internal estimates of long-run PD with actual default rates averaged over a period of five years to 31 March 2015.

Credit Risk
30
pillar 3 report
2015 Table 5.1G (iii): Accuracy of Risk Estimates – LGD
This table provides comparison of internal estimates of downturn LGD with actual losses which were evidenced during the five years to 30 September 2015. Actual LGD was calculated using net write-offs from defaults during the five year observation period with the most recent defaults excluded to allow sufficient time for the workout of the asset and recognition of any losses. For defaults relating to qualifying revolving retail and other retail, this period is the most recent 12 months and for all other asset classes the period is the most recent two years. Estimates are calculated using the downturn LGD at the beginning of the financial year.
As at 30 Sep 15
Average estimated downturn
LGD
Average actual
LGD
% %
IRB approach
Corporate (including SME) (1) 38.7 30.2
Sovereign (2) 45.0 -
Bank (2) - -
Residential mortgage (3) 20.6 4.1
Qualifying revolving retail 87.1 68.0
Retail SME 36.5 20.1
Other retail 75.6 54.7
(1) Estimated downturn LGD includes BNZ assets subject to RBNZ regulatory floors.
(2) Average actual LGDs for Sovereign and Bank exposures are based on a low number of observed defaults.
(3) Estimated downturn LGD subject to APRA and RBNZ imposed regulatory floors.
As at 31 Mar 15
Average estimated downturn
LGD (1)
Average actual LGD (1)
% %
IRB approach
Corporate (including SME) 38.7 31.8
Sovereign 32.4 -
Bank - -
Residential mortgage 20.6 4.2
Qualifying revolving retail 87.2 69.5
Retail SME 36.9 22.4
Other retail 75.4 56.4
(1) These values provide a comparison of internal estimates of downturn LGD with actual losses which were evidenced during the five years to 31 March 2015.
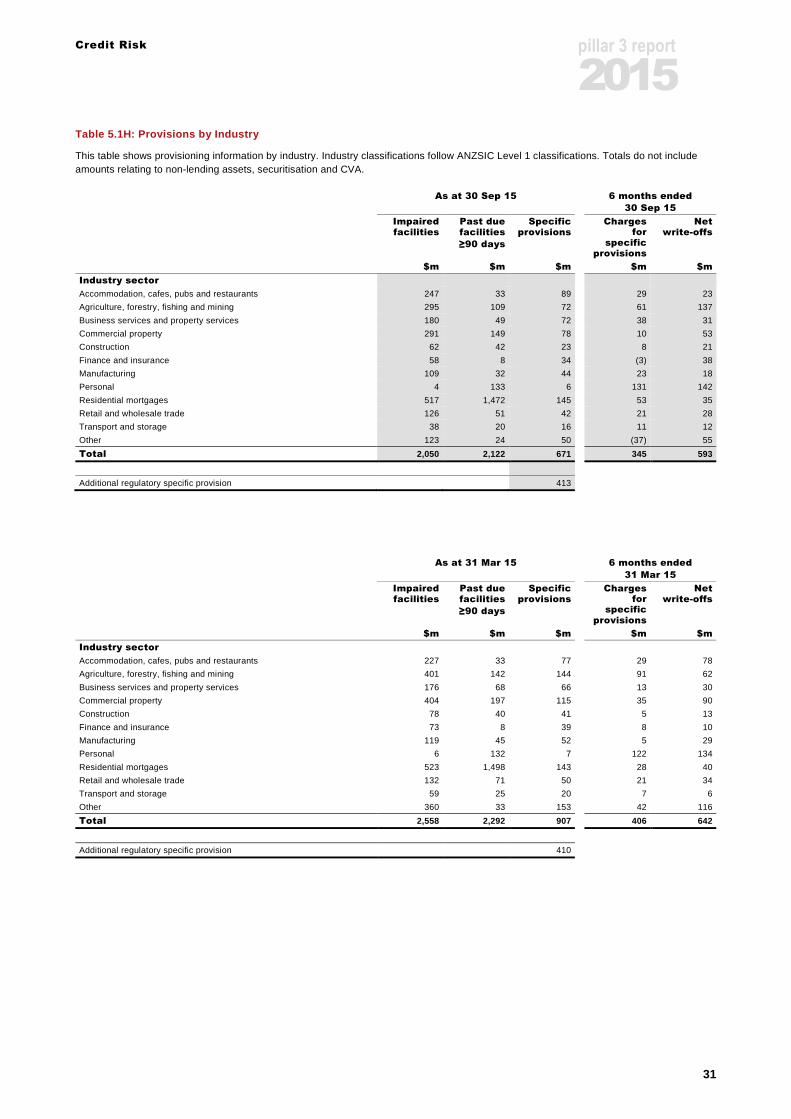
Credit Risk
31
pillar 3 report
2015 Table 5.1H: Provisions by Industry
This table shows provisioning information by industry. Industry classifications follow ANZSIC Level 1 classifications. Totals do not include amounts relating to non-lending assets, securitisation and CVA. As at 30 Sep 15 6 months ended
30 Sep 15
Impaired facilities
Past due facilities
≥90 days
Specific provisions
Charges for
specific provisions
Net write-offs
$m $m $m $m $m
Industry sector
Accommodation, cafes, pubs and restaurants 247 33 89 29 23
Agriculture, forestry, fishing and mining 295 109 72 61 137
Business services and property services 180 49 72 38 31
Commercial property 291 149 78 10 53
Construction 62 42 23 8 21
Finance and insurance 58 8 34 (3) 38
Manufacturing 109 32 44 23 18
Personal 4 133 6 131 142
Residential mortgages 517 1,472 145 53 35
Retail and wholesale trade 126 51 42 21 28
Transport and storage 38 20 16 11 12
Other 123 24 50 (37) 55
Total 2,050 2,122 671 345 593
Additional regulatory specific provision 413
As at 31 Mar 15 6 months ended
31 Mar 15
Impaired facilities
Past due facilities
≥90 days
Specific provisions
Charges for
specific provisions
Net write-offs
$m $m $m $m $m
Industry sector
Accommodation, cafes, pubs and restaurants 227 33 77 29 78
Agriculture, forestry, fishing and mining 401 142 144 91 62
Business services and property services 176 68 66 13 30
Commercial property 404 197 115 35 90
Construction 78 40 41 5 13
Finance and insurance 73 8 39 8 10
Manufacturing 119 45 52 5 29
Personal 6 132 7 122 134
Residential mortgages 523 1,498 143 28 40
Retail and wholesale trade 132 71 50 21 34
Transport and storage 59 25 20 7 6
Other 360 33 153 42 116
Total 2,558 2,292 907 406 642
Additional regulatory specific provision 410

Credit Risk
32
pillar 3 report
2015 Table 5.1I: Provisions by Geography
As at 30 Sep 15
Impaired facilities
Past due facilities
≥90 days
Specific provisions
General reserve for
credit losses
$m $m $m $m
Geographic region
Australia 1,241 1,620 343 2,360
United Kingdom 604 324 241 725
New Zealand 197 178 84 349
Other (1) 8 - 3 60
Total 2,050 2,122 671 3,494
Regulatory specific provisions 413 (413)
Plus reserve created through retained earnings 64
General reserve for credit losses (2) 3,145
(1) ‘Other’ comprises North America and Asia.
(2) The GRCL balance allocated across geographic regions of $3,494 million includes $2,883 million of provisions on loans at amortised cost and $611 million of provisions held on assets at fair value.
As at 31 Mar 15
Impaired facilities
Past due facilities
≥90 days
Specific provisions
General reserve for
credit losses
$m $m $m $m
Geographic region
Australia 1,485 1,731 451 2,291
United Kingdom 703 349 296 704
New Zealand 303 199 148 319
Other 67 13 12 130
Total 2,558 2,292 907 3,444
Regulatory specific provisions 410 (410)
Plus reserve created through retained earnings -
General reserve for credit losses (1) 3,034
(1) The GRCL balance allocated across geographic regions of $3,444 million includes $2,871 million of provisions on loans at amortised cost and $573 million of provisions held on assets at fair value.
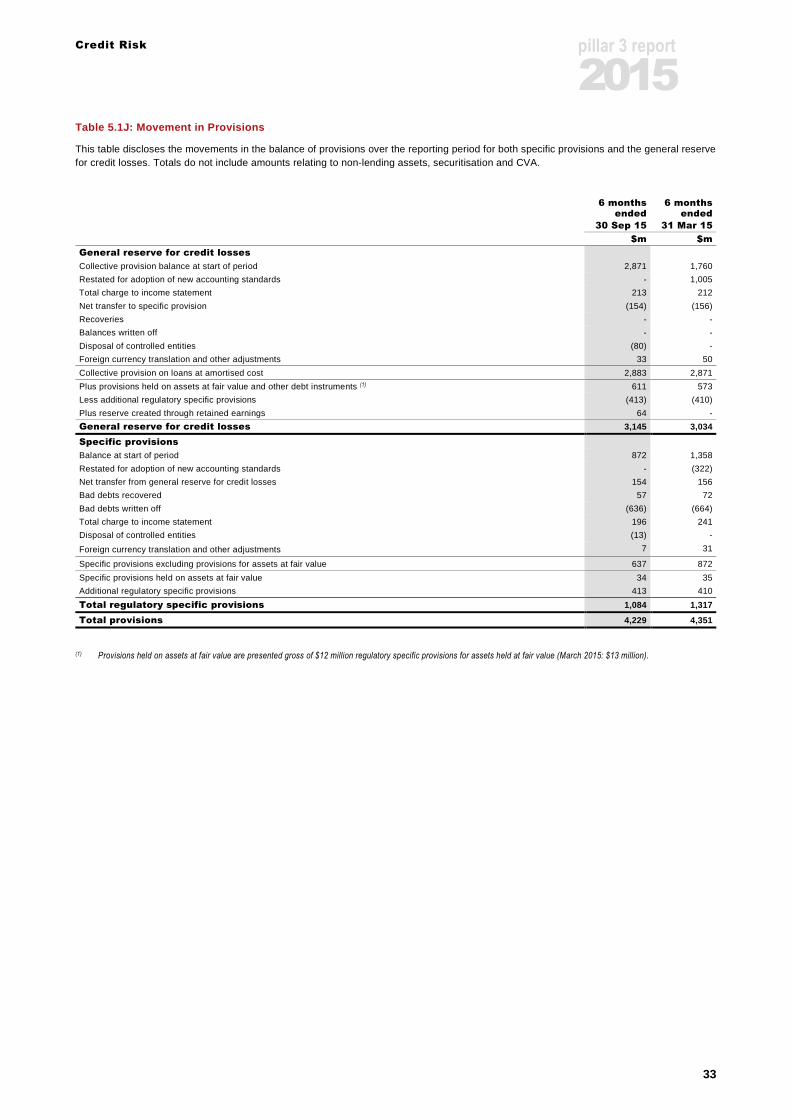
Credit Risk
33
pillar 3 report
2015 Table 5.1J: Movement in Provisions
This table discloses the movements in the balance of provisions over the reporting period for both specific provisions and the general reserve for credit losses. Totals do not include amounts relating to non-lending assets, securitisation and CVA.
6 months
ended
30 Sep 15
6 months ended
31 Mar 15
$m $m
General reserve for credit losses
Collective provision balance at start of period 2,871 1,760
Restated for adoption of new accounting standards - 1,005
Total charge to income statement 213 212
Net transfer to specific provision (154) (156)
Recoveries - -
Balances written off - -
Disposal of controlled entities (80) -
Foreign currency translation and other adjustments 33 50
Collective provision on loans at amortised cost 2,883 2,871
Plus provisions held on assets at fair value and other debt instruments (1) 611 573
Less additional regulatory specific provisions (413) (410)
Plus reserve created through retained earnings 64 -
General reserve for credit losses 3,145 3,034
Specific provisions
Balance at start of period 872 1,358
Restated for adoption of new accounting standards - (322)
Net transfer from general reserve for credit losses 154 156
Bad debts recovered 57 72
Bad debts written off (636) (664)
Total charge to income statement 196 241
Disposal of controlled entities (13) -
Foreign currency translation and other adjustments 7 31
Specific provisions excluding provisions for assets at fair value 637 872
Specific provisions held on assets at fair value 34 35
Additional regulatory specific provisions 413 410
Total regulatory specific provisions 1,084 1,317
Total provisions 4,229 4,351
(1) Provisions held on assets at fair value are presented gross of $12 million regulatory specific provisions for assets held at fair value (March 2015: $13 million). .
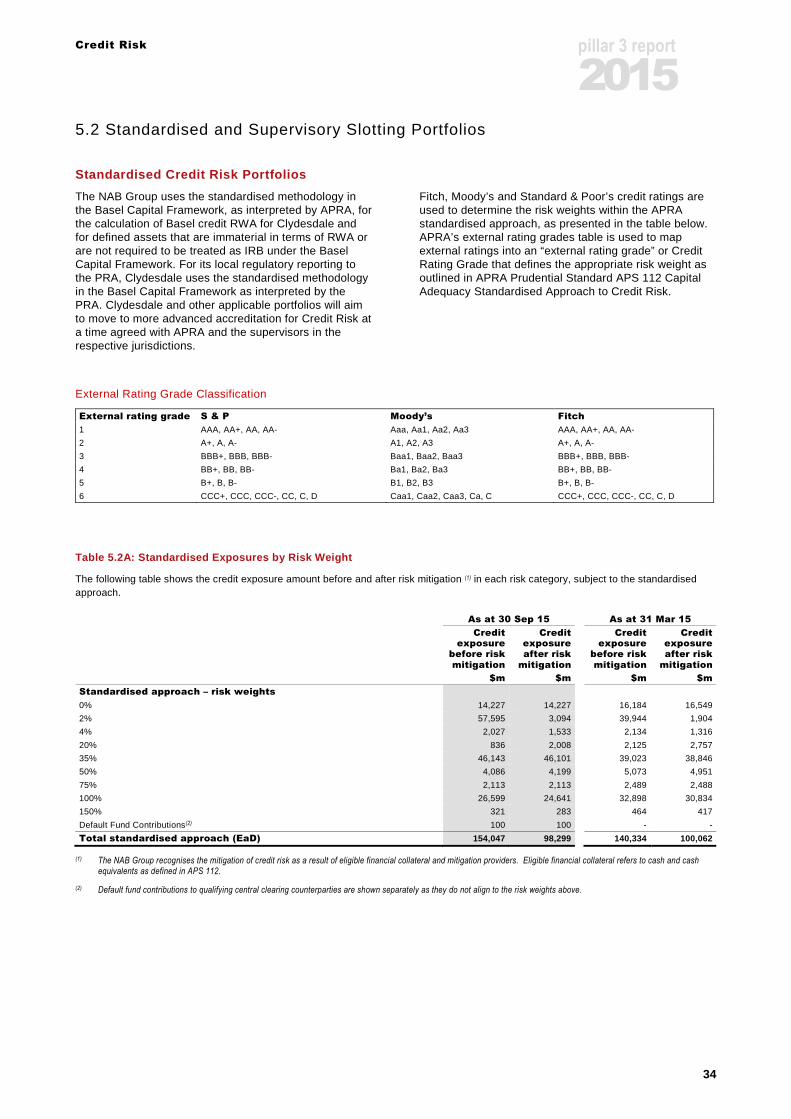
Credit Risk
34
pillar 3 report
2015 5.2 Standardised and Supervisory Slotting Portfolios
Standardised Credit Risk Portfolios
The NAB Group uses the standardised methodology in the Basel Capital Framework, as interpreted by APRA, for the calculation of Basel credit RWA for Clydesdale and for defined assets that are immaterial in terms of RWA or are not required to be treated as IRB under the Basel Capital Framework. For its local regulatory reporting to the PRA, Clydesdale uses the standardised methodology in the Basel Capital Framework as interpreted by the PRA. Clydesdale and other applicable portfolios will aim to move to more advanced accreditation for Credit Risk at a time agreed with APRA and the supervisors in the respective jurisdictions.
Fitch, Moody’s and Standard & Poor’s credit ratings are used to determine the risk weights within the APRA standardised approach, as presented in the table below. APRA’s external rating grades table is used to map external ratings into an “external rating grade” or Credit Rating Grade that defines the appropriate risk weight as outlined in APRA Prudential Standard APS 112 Capital Adequacy Standardised Approach to Credit Risk.
External Rating Grade Classification
External rating grade S & P Moody’s Fitch
1 AAA, AA+, AA, AA- Aaa, Aa1, Aa2, Aa3 AAA, AA+, AA, AA-
2 A+, A, A- A1, A2, A3 A+, A, A-
3 BBB+, BBB, BBB- Baa1, Baa2, Baa3 BBB+, BBB, BBB-
4 BB+, BB, BB- Ba1, Ba2, Ba3 BB+, BB, BB-
5 B+, B, B- B1, B2, B3 B+, B, B-
6 CCC+, CCC, CCC-, CC, C, D Caa1, Caa2, Caa3, Ca, C CCC+, CCC, CCC-, CC, C, D
Table 5.2A: Standardised Exposures by Risk Weight
The following table shows the credit exposure amount before and after risk mitigation (1) in each risk category, subject to the standardised approach. As at 30 Sep 15 As at 31 Mar 15
Credit exposure
before risk mitigation
Credit exposure after risk
mitigation
Credit exposure
before risk mitigation
Credit exposure after risk
mitigation
$m $m $m $m
Standardised approach – risk weights
0% 14,227 14,227 16,184 16,549
2% 57,595 3,094 39,944 1,904
4% 2,027 1,533 2,134 1,316
20% 836 2,008 2,125 2,757
35% 46,143 46,101 39,023 38,846
50% 4,086 4,199 5,073 4,951
75% 2,113 2,113 2,489 2,488
100% 26,599 24,641 32,898 30,834
150% 321 283 464 417
Default Fund Contributions(2) 100 100 - -
Total standardised approach (EaD) 154,047 98,299 140,334 100,062
(1) The NAB Group recognises the mitigation of credit risk as a result of eligible financial collateral and mitigation providers. Eligible financial collateral refers to cash and cash equivalents as defined in APS 112.
(2) Default fund contributions to qualifying central clearing counterparties are shown separately as they do not align to the risk weights above.

Credit Risk
35
pillar 3 report
2015
Table 5.2B: Standardised Exposures by Risk Grade
As at 30 Sep 15 As at 31 Mar 15
Credit exposure
before risk mitigation
Credit exposure after risk
mitigation
Credit exposure
before risk mitigation
Credit exposure after risk
mitigation
Asset class by rating grade $m $m $m $m
Australian and foreign governments
Credit rating grade 1 14,491 14,245 17,226 17,335
Credit rating grade 2 - - 7 7
Unrated 8 8 372 7
Sub-total 14,499 14,253 17,605 17,349
Bank
Credit rating grade 1 486 486 618 425
Credit rating grade 2 412 181 1,652 919
Credit rating grade 3 51 51 30 44
Credit rating grade 4 9 9 8 8
Unrated 199 84 182 64
Sub-total 1,157 811 2,490 1,460
Residential mortgage
Unrated 53,430 53,361 47,919 47,852
Sub-total 53,430 53,361 47,919 47,852
Corporate
Credit rating grade 1 3 3 - -
Credit rating grade 2 747 668 9 9
Credit rating grade 3 26 26 25 25
Unrated 80,186 25,247 68,352 29,497
Sub-total 80,962 25,944 68,386 29,531
Other
Unrated 3,999 3,930 3,934 3,870
Sub-total 3,999 3,930 3,934 3,870
Total standardised approach (EaD) 154,047 98,299 140,334 100,062

Credit Risk
36
pillar 3 report
2015 Portfolios Subject to Supervisory Risk Weights in t he IRB Approaches
Specialised Lending is represented by the following four sub-asset classes:
- Project Finance Exposures - Income-Producing Real Estate Exposures - Object Finance Exposures - Commodities Finance Exposures. The NAB Group maps its internal rating grades for Specialised Lending to the five supervisory slotting categories of strong, good, satisfactory, weak and default. The criteria to map these exposures are found in APRA Prudential Standard APS 113 Capital Adequacy: Internal Ratings-based Approach to Credit Risk (Attachment F).
For Income-Producing Real Estate, the NAB Group maps a combination of internal rating grade and loss given default to the supervisory slotting categories. Each slotting category is associated with a specific risk weight for unexpected loss that broadly corresponds to a range of external credit assessments as detailed below.
Supervisory category
Risk weight External rating equivalent
Strong 70% BBB- or better
Good 90% BB+ or BB
Satisfactory 115% BB- or B+
Weak 250% B to C
Default 0% N/A
Table 5.2C: Supervisory Slotting by Risk Weight
The following table shows the credit exposure, reported after risk mitigation, in each risk bucket for Specialised Lending products subject to supervisory slotting. As at
30 Sep 15 31 Mar 15
Exposure after risk
mitigation
Exposure after risk
mitigation
$m $m
IRB supervisory slotting – unexpected loss risk weights
70% 23,280 27,125
90% 30,597 25,497
115% 9,997 8,060
250% 1,082 747
Default 705 915
Total IRB supervisory slotting (EaD) 65,661 62,344

Credit Risk
37
pillar 3 report
2015 5.3 Internal Ratings Based Portfolios
General Disclosure on the Internal Rating Based Sys tem (IRB)
The NAB Group has been accredited by APRA to use its internal credit models and processes in determining RWA for its retail and non-retail credit portfolios across its Australian, New Zealand(1) and Product & Markets operations.
The NAB Group’s internal ratings system measures credit risk using: PD, LGD, and EaD. Distinct PD, EaD and LGD models exist for the retail and non-retail credit portfolios, based on asset categories and customer segments.
Non-retail customers are assessed individually using a combination of expert judgement and statistical risk rating tools. For retail customers, operational scorecards are the primary method of risk rating. The following table summarises exposures type and rating approach for each asset class.
Internal Risk Rating and External Ratings
The structure of the internal risk rating system and its relationship with external ratings is detailed below.
Description Internal rating Probability of default (%)
Super senior investment grade 1, 2 0<0.03
Senior investment grade 3, 4, 5 0.03<0.11
Investment grade 6, 7, 8, 9, 10, 11 0.11<0.55
Acceptable 12, 13, 14, 15, 16, 17, 18, 19 0.55<5.01
Weak/doubtful 20, 21, 22, 23 5.01<99.99
Default 98, 99 100
Description S&P rating Moody’s rating
Super senior investment grade AAA, AA+, AA, AA- Aaa, Aa1, Aa2, Aa3
Senior investment grade A+, A, A- A1, A2, A3
Investment grade BBB+, BBB, BBB- Baa1, Baa2, Baa3
Acceptable BB+, BB, BB-, B+ Ba1, Ba2, Ba3, B1
Weak/doubtful B, B-, CCC+, CCC, CCC- B2, B3, Caa,Ca
Default D C
Basel Asset Class Type of exposures Rating approach
Non-Retail
Corporate (including SME)
Companies, including investment banks and non-government entities. Statistical risk model, external credit rating and expert judgement
Sovereign Sovereign and Australian dollar claims on the Reserve Bank of Australia. Sovereign includes government guaranteed exposures.
Statistical risk model, external credit rating and expert judgement
Bank ADIs and overseas banks. Statistical risk model, external credit rating and expert judgement
Specialised lending Exposures associated with the financing of individual projects where the repayment is highly dependent on the performance of the underlying pool or collateral, rather than the obligor’s creditworthiness. Includes project finance, income-producing real estate, object finance and commodities finance.
Statistical risk model, expert judgement, supervisory slotting
Retail
Residential mortgage Exposures partly or fully secured by residential properties. Statistical risk model
Qualifying revolving retail
Consumer credit cards excluding BNZ credit cards (which are classified as Other Retail under RBNZ rules).
Statistical risk model
Retail SME Small business and agriculture exposures where the total aggregated business related exposures of the obligor and its related entities are less than $1 million.
Statistical risk model
Other retail Retail exposures other than Residential Mortgage, Qualifying revolving retail and Retail SME. Includes personal loan products, overdrafts, transaction account exposures and BNZ credit cards.
Statistical risk model
(1) RBNZ IRB discretions are used for the New Zealand (BNZ) portfolio.

Credit Risk
38
pillar 3 report
2015 Internal Ratings Process Overview
Probability of Default
PD measures the likelihood that a customer will default within a 12 month period. The NAB Group uses two types of PD estimates:
- PiT, which estimates the likelihood of default in the next 12 months taking account of the current economic conditions. PiT PDs are used for management of the portfolio.
- Through the Cycle (TTC), which estimates the likelihood of default through a full credit cycle. TTC PDs are used for regulatory and economic capital calculation.
The NAB Group has a common masterscale across all counterparties (non-retail and retail) for PD.
Loss Given Default
LGD measures the portion of the exposure owed to the NAB Group that would be lost in the event of the customer defaulting. LGD is calculated by using a set of estimated parameters including Loss Given Realisation (LGR), post-default cure rates and the bank value of collateral.
The NAB Group applies stresses to the model factors to obtain downturn LGD estimates using internal data, external reference data and benchmarks, and by applying expert judgement.
Exposure at Default
EaD is calculated according to the facility type. The NAB Group’s EaD models predict the dollar amount that a customer is likely to have outstanding if they were to default within a 12 month period. This amount includes principal, fees and interest owed at the time of default.
The NAB Group applies stresses to the model factors to obtain downturn EaD estimates using internal data, benchmark studies and expert judgement.
Use of PD, LGD and EaD
PD, LGD and EaD estimates are used for various regulatory and internal Credit Risk calculations, such as Regulatory Expected Loss, RWA, economic capital and provisioning.
Credit Rating System Control
In addition to monthly performance reporting, credit models are reviewed at least annually in accordance with the NAB Group’s Model Risk Policy. Regular independent reviews are also conducted.
The outcomes of the model validation process, including proposed actions, are presented to the authorised Risk Committees for review and endorsement of any actions for implementation.
Non-Retail Credit - Internal Ratings Process
Non-Retail – PD Models
The NAB Group has a number of PD models that differentiate by industry or segment, counterparty size and incorporate regional variances. The rating model used is dependent on:
- industry, based on ANZSIC classification - financial information available - qualitative information - net sales/total assets and exposure.
The quantitative (financial) factors consist of financial ratios and indicators (e.g. profitability, leverage and debt service coverage). The qualitative (non-financial) factors are based on qualitative data using the expert judgement of the lender and credit officer (e.g. management ability and industry outlook).
While factors predictive of default have broad similarities across segments (e.g. debt service capability and management quality), the modelling process establishes those factors that are most predictive for each segment, along with their relative weightings. External benchmarking is used for certain segments that have insufficient internal data, a small population and/or low defaults. This is the case for externally rated banks and sovereigns, where external rating agencies data is used. The resulting rating is updated at least annually.
Long run adjustments are made to the models to account for performance over an economic cycle.
Non-Retail – EaD Models
EaD is calculated according to the facility type.
EaD = Balance + Credit Conversion Factor x Undrawn Limit
Conversion factors are used for estimating off-balance sheet exposures into an equivalent on-balance sheet amount, based on internal data.
Non-Retail – LGD Models
LGD for the non-retail portfolio is calculated by using a set of estimated parameters including bank value of collateral, Loss Given Realisation and the probability of realisation occurring subsequent to default. LGD is segmented by customer type, customer size and nature of facility.
Loss Given Realisation is the loss sustained, as a proportion of EaD, following the realisation of security held. It is based on the bank values assigned to each asset type along with the NAB Group’s experience with unsecured recoveries. As the market value of the collateral is affected by credit cycle changes, the impact of a credit cycle downturn on LGD has been incorporated.
The NAB Group also uses the following factors for non-retail credit LGD models:
- relevant external benchmarks - recovery rates - time value of money - write-offs. Where limited internal default data exists, data is supplemented by external benchmarks, market data and expert judgement.

Credit Risk
39
pillar 3 report
2015 Retail Credit - Internal Ratings Process
Retail Credit – PD Models
Retail PD models are developed using the following:
- application data and scorecards, including external credit bureau data
- customer and account level behavioural data (for example delinquency or limit utilisation) as well as behaviour scorecards that are updated monthly.
Each account is “scored” to assign a PD. This process allows groups of accounts with similar scores to be pooled together and mapped to the PD masterscale.
Appropriate long run adjustments have been made to the models to account for performance over an economic cycle.
Retail Credit – EaD Models
Retail EaD models use a combination of Credit Conversion Factors (CCFs) similar to those used in non-retail, and scaling factors.
CCFs have been developed mainly for revolving credit products, such as credit cards and overdrafts and estimate the amount of unutilised credit a customer may draw in the lead up to default.
Scaling factors have been applied mainly to term lending products, where the customer has less availability of unutilised credit from which to draw in the lead up to default.
Retail Credit – LGD Models
Key account variables, such as months exposure held and balance, are identified and modelled to provide an estimate of the probability that a loan that has defaulted would return to full performance (i.e. cure).
For accounts that do not cure and are written off, internal recovery data is used to assess the ultimate loss (i.e. initial loss less recoveries achieved plus costs of recovery).
Adjustments based on external data and expert judgement are made to the LGD to account for a downturn in the economic cycle, and are applied by varying the cure and recovery rates.
In Australia, the only credit risk mitigation measure applies to the residential mortgage portfolio, where Lenders Mortgage Insurance (LMI) is normally required for borrowing above 80% Loan to Value Ratio at origination. For loans secured by residential property, APRA has mandated the use of a supervisory floor of 20% for RWA purposes.
Note: LMI does not currently influence the retail LGD metrics used.

Credit Risk
40
pillar 3 report
2015 Portfolios Subject to IRB Approach
Table 5.3A: Non-Retail Exposure by Risk Grade
This table provides a breakdown of gross non-retail credit exposures by PD risk grade, categorised into bands that broadly correspond to externally recognised risk grades. Moody’s risk grades have been included as a reference point. Exposures have been categorised into PD grades as assessed by the Level 2 Group’s own internal ratings system and exclude non-lending assets, securitisation, CVA and Specialised Lending. As at 30 Sep 15
PD risk grade mapping
External credit rating equivalent Aa3 and above
A1, A2, A3 Baa1, Baa2, Baa3 .
Ba1, Ba2 Ba3, B1 B2 and below
Default
0<0.03% 0.03<0.1% 0.1<0.5% 0.5<2.0% 2.0<5.0% 5.0<99.9% 100%
IRB approach $m $m $m $m $m $m $m
Total exposure
Corporate - 58,127 100,493 73,356 21,704 5,672 1,987
Sovereign 65,387 5,413 643 24 10 - -
Bank - 69,950 7,896 3,159 19 30 1
Total exposure (EaD) 65,387 133,490 109,032 76,539 21,733 5,702 1,988
Undrawn commitments
Corporate - 13,414 24,588 11,188 2,732 487 97
Sovereign 118 257 85 3 5 - -
Bank - 1,109 243 10 - - -
Total undrawn commitments (1) 118 14,780 24,916 11,201 2,737 487 97
IRB approach
Average EaD ($m) (2)
Corporate - 1.42 0.62 0.24 0.19 0.15 0.20
Sovereign 41.54 2.13 1.35 0.14 0.03 0.07 -
Bank - 2.06 1.59 11.39 0.20 1.15 0.65
Exposure weighted average LGD (%)
Corporate - 33.6 % 36.5 % 29.0 % 32.6 % 34.9 % 42.7 %
Sovereign 4.1 % 26.3 % 47.4 % 45.0 % 44.0 % 45.0 % 45.0 %
Bank - 30.1 % 28.2 % 10.2 % 37.3 % 45.0 % 59.6 %
Exposure weighted average risk weight (%)
Corporate - 19.2 % 44.7 % 57.3 % 85.0 % 136.7 % 203.4 %
Sovereign 0.8 % 13.1 % 62.6 % 84.3 % 118.0 % 188.3 % 596.3 %
Bank - 13.1 % 33.5 % 12.8 % 95.7 % 218.4 % -
(1) Total undrawn commitments are included in the calculation of Total Exposures (EaD) shown above.
(2) Simple average of exposure by number of arrangements.
.

Credit Risk
41
pillar 3 report
2015 As at 31 Mar 15
PD risk grade mapping
External credit rating equivalent Aa3 and
above A1, A2, A3 Baa1, Baa2,
Baa3 Ba1, Ba2 Ba3, B1 B2 and
below Default
0<0.03% 0.03<0.1% 0.1<0.5% 0.5<2.0% 2.0<5.0% 5.0<99.9% 100%
IRB approach $m $m $m $m $m $m $m
Total exposure
Corporate - 51,705 96,999 74,032 19,455 4,238 2,525
Sovereign 70,152 4,811 760 17 13 - -
Bank - 67,092 9,804 2,954 42 27 1
Total exposure (EaD) 70,152 123,608 107,563 77,003 19,510 4,265 2,526
Undrawn commitments
Corporate - 11,497 23,760 10,577 2,641 446 143
Sovereign 170 237 121 7 6 - -
Bank - 952 216 1 - - -
Total undrawn commitments 170 12,686 24,097 10,585 2,647 446 143
IRB approach
Average EaD
($m)
Corporate - 1.28 0.58 0.30 0.18 0.13 0.24
Sovereign 39.03 1.89 1.79 0.08 0.03 - -
Bank - 1.87 2.37 14.30 0.46 0.61 0.65
Exposure weighted average LGD (%)
Corporate - 34.7 % 36.1 % 29.1 % 32.8 % 36.0 % 44.0 %
Sovereign 4.4 % 29.9 % 43.2 % 44.8 % 43.8 % - -
Bank - 32.5 % 22.6 % 11.2 % 59.6 % 15.0 % 59.6 %
Exposure weighted average risk weight (%)
Corporate - 19.7 % 43.5 % 57.6 % 82.9 % 133.8 % 212.2 %
Sovereign 0.8 % 14.7 % 60.5 % 76.6 % 120.5 % - -
Bank - 14.3 % 26.4 % 15.2 % 158.0 % 94.7 % -

Credit Risk
42
pillar 3 report
2015 Table 5.3B: Retail Exposure by Risk Grade
This table provides a breakdown of gross retail credit exposures by PD risk grade, categorised into bands that broadly correspond to externally recognised risk grades, ranging from Super Senior Investment Grade to Defaulted exposures. Exposures exclude non-lending assets, securitisation and CVA.
As at 30 Sep 15
PD risk grade mapping
0<0.1% 0.1<0.5% 0.5<2.0% 2.0<5.0% 5.0<99.9% 100%
IRB approach $m $m $m $m $m $m
Total exposure
Residential mortgage 107,637 118,804 87,514 16,376 8,280 2,166
Qualifying revolving retail 4,291 2,976 1,937 1,087 957 24
Retail SME 1,617 4,289 6,398 2,754 792 377
Other retail 1,065 828 1,068 919 493 59
Total exposure (EaD) 114,610 126,897 96,917 21,136 10,522 2,626
Undrawn commitments
Residential mortgage 27,645 13,643 6,346 981 126 70
Qualifying revolving retail 3,264 1,712 445 112 36 1
Retail SME 934 1,115 896 301 65 63
Other retail 707 261 188 68 18 -
Total undrawn commitments (1) 32,550 16,731 7,875 1,462 245 134
IRB approach
Average EaD ($m) (2)
Residential mortgage 0.08 0.26 0.22 0.29 0.34 0.19
Qualifying revolving retail 0.01 0.01 0.01 0.01 0.01 0.01
Retail SME 0.02 0.03 0.03 0.02 0.01 0.01
Other retail - 0.01 0.01 0.01 0.01 small
Exposure weighted average LGD (%)
Residential mortgage 20.0 % 20.0 % 20.4 % 20.0 % 20.0 % 20.5 %
Qualifying revolving retail 83.4 % 84.5 % 86.6 % 87.2 % 87.3 % 87.9 %
Retail SME 23.7 % 25.3 % 29.0 % 30.6 % 32.3 % 38.6 %
Other retail 83.0 % 80.9 % 79.6 % 79.3 % 78.1 % 78.7 %
Exposure weighted average risk weight (%)
Residential mortgage 3.4 % 10.4 % 26.9 % 54.7 % 94.3 % 209.1 %
Qualifying revolving retail 4.2 % 11.9 % 37.7 % 82.1 % 161.2 % 356.1 %
Retail SME 5.8 % 15.0 % 34.5 % 57.9 % 95.0 % 313.2 %
Other retail 14.3 % 43.1 % 89.5 % 118.0 % 146.2 % 270.4 %
(1) Total undrawn commitments are included in the calculation of Total Exposures (EaD) shown above.
(2) Simple average of exposure by number of arrangements.
.

Credit Risk
43
pillar 3 report
2015
As at 31 Mar 15
PD risk grade mapping
0<0.1% 0.1<0.5% 0.5<2.0% 2.0<5.0% 5.0<99.9% 100%
IRB approach $m $m $m $m $m $m
Total exposure
Residential mortgage 104,458 115,349 87,619 16,326 8,757 2,234
Qualifying revolving retail 4,360 2,766 2,043 1,030 942 28
Retail SME 1,769 4,298 6,298 2,686 862 410
Other retail 1,269 930 1,190 872 509 59
Total exposure (EaD) 111,856 123,343 97,150 20,914 11,070 2,731
Undrawn commitments
Residential mortgage 27,142 13,811 6,535 1,013 126 86
Qualifying revolving retail 3,250 1,551 456 95 32 1
Retail SME 1,034 1,116 875 290 66 62
Other retail 799 293 205 77 19 -
Total undrawn commitments 32,225 16,771 8,071 1,475 243 149
IRB approach
Average EaD ($m)
Residential mortgage 0.08 0.25 0.22 0.28 0.33 0.20
Qualifying revolving retail 0.01 0.01 0.01 0.01 0.01 0.01
Retail SME 0.03 0.03 0.03 0.02 0.02 0.02
Other retail - 0.01 0.01 0.01 0.01 -
Exposure weighted average LGD (%)
Residential mortgage 20.0 % 19.9 % 20.5 % 20.0 % 20.0 % 20.6 %
Qualifying revolving retail 83.5 % 84.6 % 86.7 % 87.1 % 87.3 % 87.9 %
Retail SME 24.2 % 25.9 % 29.3 % 31.2 % 32.8 % 39.2 %
Other retail 83.3 % 81.1 % 79.7 % 79.5 % 77.5 % 78.7 %
Exposure weighted average risk weight (%)
Residential mortgage 3.3 % 10.4 % 27.1 % 55.0 % 95.3 % 198.9 %
Qualifying revolving retail 4.1 % 12.1 % 37.7 % 83.8 % 163.0 % 310.4 %
Retail SME 6.0 % 15.3 % 34.9 % 58.7 % 99.1 % 310.5 %
Other retail 14.5 % 42.7 % 89.2 % 118.1 % 145.8 % 297.9 %

Credit Risk
44
pillar 3 report
2015 5.4 Credit Risk Mitigation
The NAB Group employs a range of techniques to reduce risk in its credit portfolio.
Credit risk mitigation commences with an objective credit evaluation of the counterparty. This includes an assessment of the counterparty’s character, industry, business model and capacity to meet its commitments without distress. Other methods to mitigate credit risks include a prudent approach to facility structure, collateral, lending covenants, terms and conditions.
Collateral Management
Collateral provides a secondary source of repayment for funds being advanced, in the event that a counterparty cannot meet its contractual repayment obligations.
Collateral commonly includes:
- fixed and floating charges over business assets - residential, commercial and rural property - cash deposits - fixed income products - listed shares, bonds or securities - guarantees, letters of credit and pledges. To ensure that collateral held is sufficiently liquid, legally valid, enforceable and regularly valued, credit risk policy provides a framework to:
- establish the amount and quality of collateral required to support an exposure
- determine acceptable valuation type and revaluation requirements for each collateral class
- record market value and ‘bank value’ (a conservative assessment of value in the event the collateral is realised).
Guarantees from financially sound parties are sometimes required to support funds advanced to a counterparty; which can reduce the risk of default on their obligations. Where allowed in credit risk policy, guarantors that are risk rated may enhance the counterparty customer rating.
Credit Hedging
Credit hedging is utilised in the banking book to avoid counterparty concentrations against protection sellers and achieve portfolio diversification.
Credit risk to individual hedge counterparties is mitigated through careful selection of investment grade equivalent counterparties and use of collateral agreements to manage net exposures.
Credit Exposure Netting
Credit Exposure Netting may be adopted to calculate counterparty credit exposures on a net basis. This recognises that the change in value for different products over time is not perfectly correlated; transactions with positive value when netted may offset those with negative value.
Credit Exposure Netting is subject to execution of supporting legal documentation. A credit exposure measurement and reporting system manages the netting pools in accordance with that documentation.
Portfolio Management
Group Credit Risk, together with Business Unit Risk functions, manage the overall risk of the corporate, sovereign and bank credit portfolios. Where credit risks are identified, a variety of techniques are used to mitigate the risk, including credit derivatives and, on occasion, the sale of loan assets (in consultation with the counterparties).
Internal reporting systems are utilised to record all:
- approved derivative, money market, credit line and/or credit trading facility limits
- credit exposure arising from securities sales and purchases, money market lines, commodities, trade, derivative and foreign exchange transactions
- country risk exposures for country economic capital limit purposes.
Limits may be established at a facility, product group or individual product level, based on the level of financial sophistication exhibited by the counterparty. A specialist administration unit operating independently from relationship managers, dealers and credit approvers record and maintain the limits.

Credit Risk
45
pillar 3 report
2015 Table 5.4A: Mitigation by Eligible Collateral
This table discloses the total credit exposures subject to the standardised and supervisory slotting criteria approaches which are covered by eligible financial collateral. Exposures exclude non-lending assets, securitisation and CVA. As at 30 Sep 15
Total exposure
of which is covered by
eligible financial
collateral (1)
$m $m
Specialised lending (SL) 66,039 378
Standardised approach
Australian and foreign governments 14,499 246
Bank 1,157 346
Residential mortgage 53,430 69
Corporate 80,962 55,018
Other 3,999 69
Total standardised approach 154,047 55,748
(1) Eligible financial collateral, when used to reduce levels of exposure, refers to cash and cash equivalents as defined in APS 112. Exposures covered by eligible financial collateral are measured after the application of regulatory haircuts.
As at 31 Mar 15
Total exposure
of which is covered by
eligible financial
collateral
$m $m
Specialised lending (SL) 62,721 377
Standardised approach
Australian and foreign governments 17,605 256
Bank 2,490 1,030
Residential mortgage 47,919 67
Corporate 68,386 38,855
Other 3,934 64
Total standardised approach 140,334 40,272

Credit Risk
46
pillar 3 report
2015
Table 5.4B: Mitigation by Guarantees and Credit Der ivatives
This table discloses the total credit exposures which are covered by the guarantees and credit derivatives relating to each portfolio. Exposures exclude non-lending assets, securitisation and CVA. As at 30 Sep 15
Total exposure
of which is covered by guarantees
of which is covered by
credit derivatives
$m $m $m
IRB approach
Corporate (including SME) 261,339 26,542 406
Sovereign 71,477 145 -
Bank 81,055 99 5
Residential mortgage 340,777 - -
Qualifying revolving retail 11,272 - -
Retail SME 16,227 - -
Other retail 4,432 - -
Total IRB approach 786,579 26,786 411
Specialised lending (SL) 66,039 - -
Standardised approach
Australian and foreign governments 14,499 - -
Bank 1,157 114 -
Residential mortgage 53,430 - -
Corporate 80,962 - -
Other 3,999 - -
Total standardised approach 154,047 114 -
As at 31 Mar 15
Total exposure
of which is covered by guarantees
of which is covered by
credit derivatives
$m $m $m
IRB approach
Corporate (including SME) 248,954 24,585 427
Sovereign 75,753 134 -
Bank 79,920 143 12
Residential mortgage 334,743 - -
Qualifying revolving retail 11,169 - -
Retail SME 16,323 - -
Other retail 4,829 - -
Total IRB approach 771,691 24,862 439
Specialised lending (SL) 62,721 - -
Standardised approach
Australian and foreign governments 17,605 365 -
Bank 2,490 119 -
Residential mortgage 47,919 - -
Corporate 68,386 - -
Other 3,934 - -
Total standardised approach 140,334 484 -

Credit Risk
47
pillar 3 report
2015 5.5 Counterparty Credit Risk
This section describes the NAB Group’s approach to managing credit risk concerning market-related instruments. Counterparty Credit Risk (CCR) is the risk that a counterparty to a transaction may default before the final settlement of the transaction’s cash flows. An economic loss would occur if a transaction with a defaulting counterparty has a positive economic value to the NAB Group.
Credit Limits
Credit limits for derivatives are approved and assigned by an appropriately authorised DCA based on the same principles (i.e. amount, tenor, probability of default, loss given default and product type), and internal credit policies used for approving bank loans.
Credit exposures for each transaction are measured as the current mark-to-market value and the Potential Credit Exposure (PCE) which is an estimate of the future replacement cost.
Credit risk economic capital is then allocated to individual counterparty exposures based on their relative risk contribution to Unexpected Loss (UL).
Limit excesses, whether they are active or passive, are subject to formal approval by a DCA.
Collateral
Counterparty credit exposures may be collateralised by an approved list of eligible collateral via market standard master agreements (ISDA and credit support annex). Eligible collateral may be subject to haircuts depending on asset type. Counterparties may also be subject to posting additional collateral before transacting.
Bank systems are in place to support daily marking-to-market of net exposures and margin requirements, marking-to-market of collateral value and reconciliation of collateral receipt and holdings against collateral due.
Wrong Way Risk
Wrong way risk occurs when exposure to a counterparty is adversely correlated with the credit quality of that counterparty. Credit exposures and potential losses may increase under these circumstances as a result of market conditions. The NAB Group manages these risks through the effective implementation of a number of risk policies, including, but not limited to: single large exposure policy; credit concentration risk policies; aggregation policy; collateralisation policy; and various product restrictions.
Downgrade Impact
As at 30 September 2015, with respect to counterparty derivatives, the NAB Group would need to post an estimated amount of $273 million of collateral in the event of a one notch downgrade to the NAB Group's credit rating, and $359 million in the event of a two notch downgrade.
Group Treasury, on behalf of the NAB Group, plan for and manage the impact on transactions that would be affected by a downgrade clause.
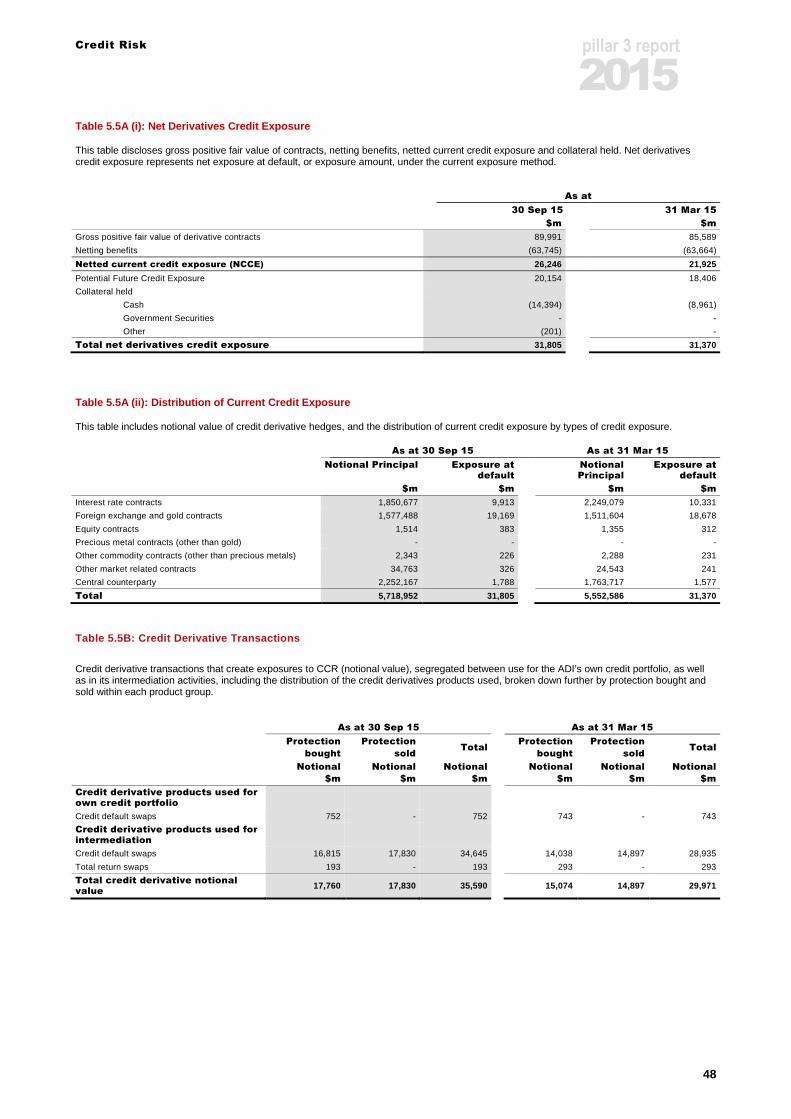
Credit Risk
48
pillar 3 report
2015 Table 5.5A (i): Net Derivatives Credit Exposure This table discloses gross positive fair value of contracts, netting benefits, netted current credit exposure and collateral held. Net derivatives credit exposure represents net exposure at default, or exposure amount, under the current exposure method.
As at
30 Sep 15 31 Mar 15
$m $m
Gross positive fair value of derivative contracts 89,991 85,589
Netting benefits (63,745) (63,664)
Netted current credit exposure (NCCE) 26,246 21,925
Potential Future Credit Exposure 20,154 18,406
Collateral held
Cash (14,394) (8,961)
Government Securities - -
Other (201) -
Total net derivatives credit exposure 31,805 31,370
Table 5.5A (ii): Distribution of Current Credit Exp osure This table includes notional value of credit derivative hedges, and the distribution of current credit exposure by types of credit exposure.
As at 30 Sep 15 As at 31 Mar 15
Notional Principal Exposure at default
Notional Principal
Exposure at default
$m $m $m $m
Interest rate contracts 1,850,677 9,913 2,249,079 10,331
Foreign exchange and gold contracts 1,577,488 19,169 1,511,604 18,678
Equity contracts 1,514 383 1,355 312
Precious metal contracts (other than gold) - - - -
Other commodity contracts (other than precious metals) 2,343 226 2,288 231
Other market related contracts 34,763 326 24,543 241
Central counterparty 2,252,167 1,788 1,763,717 1,577
Total 5,718,952 31,805 5,552,586 31,370
Table 5.5B: Credit Derivative Transactions
Credit derivative transactions that create exposures to CCR (notional value), segregated between use for the ADI’s own credit portfolio, as well as in its intermediation activities, including the distribution of the credit derivatives products used, broken down further by protection bought and sold within each product group.
As at 30 Sep 15 As at 31 Mar 15
Protection
bought
Protection
sold Total
Protection
bought
Protection
sold Total
Notional
$m
Notional
$m
Notional
$m
Notional
$m
Notional
$m
Notional
$m
Credit derivative products used for own credit portfolio
Credit default swaps 752 - 752 743 - 743
Credit derivative products used for intermediation
Credit default swaps 16,815 17,830 34,645 14,038 14,897 28,935
Total return swaps 193 - 193 293 - 293
Total credit derivative notional value
17,760 17,830 35,590 15,074 14,897 29,971

Securitisation
49
pillar 3 report
2015 6. Securitisation
Introduction
Securitisation is a structure where the cash flow from a pool of assets is used to service obligations to at least two different tranches or classes of creditors (typically holders of debt securities), with each class or tranche reflecting a different degree of credit risk (i.e. one class of creditors is entitled to receive payments from the pool before another class of creditors). An exception to this is a warehouse SPV which is a securitisation even if it does not have at least two different tranches of creditors or securities. The Level 2 Group engages in securitisation activities for two primary purposes:
- securitisation activities for business purposes, including arranging and managing securitisations for third parties (clients). These activities are undertaken primarily through securitisation SPVs that provide funding for single or multiple transactions
- securitisation of its own assets for funding, liquidity (including contingent liquidity) purposes, primarily for risk and capital management reasons.
The Level 2 Group has discontinued all securities arbitrage activities (i.e. the funding of purchased assets).
The Level 2 Group’s securitisation exposures are generally categorised according to the requirements of APS 330. Key definitions are provided below.
SPV
- SPV is an entity set up solely for the purpose of securitisation, usually a trust or a company
- the Level 2 Group does not sponsor any SPVs used to securitise third party exposures which are currently issuing securities.
Origination
- originating ADI: the Level 2 Group is an "Originating ADI" if it originally sold the asset to the SPV (directly or indirectly), manages the SPV or provides a non-derivative facility to an Asset Backed Commercial Paper (ABCP) Program
- non-originating ADI facilities: any facility provided by the Level 2 Group in which the Level 2 Group is not an Originating ADI
- originated assets: these refer to assets that were originally written by the Level 2 Group and transferred to the SPV, or in the case of indirect origination, written directly by the SPV at the direction of the Level 2 Group
- traditional securitisations: securitisations in which the pool of assets is assigned to an SPV, usually by a sale
- synthetic securitisations: securitisations in which the risk of the pool of assets is transferred to an SPV through a derivative, usually a credit default swap.
The Level 2 Group's assessment and management of securitisation risk is governed by APS 120.
Affiliated Entities
The Level 2 Group manages and advises MLC Limited which may invest in securitisation exposures that the Level 2 Group has securitised. These investments are made as part of MLC Limited’s investment process and are made on an arm’s length basis. These investments do not form a material percentage of the total funds invested by MLC Limited.

Securitisation
50
pillar 3 report
2015 6.1 Third Party Securitisation
The Level 2 Group may undertake any of the following roles in its third party securitisation activities:
Role Definition
Arranger Structurer of securitisation transactions.
Liquidity Facility provider Provider of liquidity facilities to an SPV for the primary purpose of funding any timing mismatches between receipts of funds on underlying exposures and payments on securities issued by the SPV.
Buyer of protection over assets(1)
Entering into derivative transactions that provide credit protection over assets on the Level 2 Group’s balance sheet.
Dealer Buyer and seller in the primary and secondary markets of securities.
Derivative provider Counterparty to swaps and other derivative transactions, including interest rate and currency derivatives provided to securitisation SPVs and credit derivative transactions.
First loss provider(1) Principally for securitisation of the Level 2 Group’s own assets, the provider of credit enhancement that bears the first losses (if any) incurred by the securitised pool of assets.
Investor Purchaser of securitisation debt securities for either trading or banking book purposes.
Letter of credit provider(1) Provider of credit enhancement to securitisation transactions.
Manager Operator of securitisation SPVs, including managing assets and liabilities and providing accounting and administrative services.
Redraw Facility provider(1) Provider of liquidity to cover redraws of underlying loans for residential mortgage-backed securitisation transactions.
Securitisation funding facility provider(1)
Lender to securitisation SPVs where the term of the funding extends beyond one year and may match the expected redemption date of the underlying security held by the SPV.
Sponsor(1) The entity that establishes the securitisation SPVs including ABCP conduits and often provides other services.
Standby liquidity provider(1) Provider of liquidity facilities to an SPV to cover the inability of the SPV to roll over ABCP.
Warehouse facility provider Provider of lending (warehouse) facilities to an SPV for the financing of exposures in a pool.
(1) Immaterial level of involvement.
Structure and Organisation
The Board approves risk appetite limits and periodically monitors and reviews the third party asset securitisation framework, management and reporting with guidance from the Product & Markets Risk Management Committee (Product & Markets RMC), the GRRMC and the PBRC.
The Third Party Asset Securitisation Policy sets out how securitisation activity is governed and managed within the Level 2 Group.
The Product & Markets Risk function is responsible for ensuring that securitisation activity is conducted within the approved limits and maintaining ongoing reporting and compliance.
Management
The Level 2 Group’s securitisation business is managed as part of the Product & Markets portfolio. Third party securitisation activities follow the Level 2 Group’s credit decision-making and oversight process. The Business Bank Credit Risk function is responsible for independent credit decisions for securitisation transactions.
Expert knowledge specialists within the securitisation business work with customers, trustees and rating agencies to structure each transaction according to the requirements of Level 2 Group policies, APS 120 and the rating agencies. Approvals must be in accordance with the delegated commitment authority schedule.
Initial structuring and assessment includes an analysis of matters such as portfolio composition and quality, the level and type of credit enhancement, due diligence on the quality of the servicer of the assets, and specific structural enhancements such as trigger events.
Measurement
Securitisation exposures and RWAs are measured in accordance with regulatory requirements outlined in APS 120. Key metrics include any external rating (if available),
internal risk grading, the seniority of the exposure and the composition of the pool of securitised assets. The Level 2 Group views securitisation exposures for facilities provided to securitisation transactions as ‘hold to maturity’ exposures.
Depending on the asset class, the Level 2 Group uses either the ratings-based approach (RBA), the internal assessment approach (IAA) or other APS 120 methodologies, as approved by APRA, to calculate RWA for the portfolio.
The IAA methodology is applied to the following asset classes:
- residential mortgages - equipment receivables - auto loan receivables.
The IAA methodology has been developed by specialists within the Level 2 Group’s securitisation function as part of the Third Party Asset Securitisation policy and was approved as set out under the heading ‘Structure and Organisation’ above.

Securitisation
51
pillar 3 report
2015 The IAA methodology incorporates many of the elements
of the external credit assessment institutions (ECAIs) used by the Level 2 Group including stress factors that are at least as conservative as the publicly available ECAI stress factors. The ECAIs used by the Level 2 Group are predominantly Standard & Poor’s for rating securitisations for which the Level 2 Group is an originating ADI and Moody's and Fitch for some term transactions.
In addition to providing the basis for assessing the regulatory capital under APS 120 for the relevant asset classes, the IAA is used in the Level 2 Group’s internal risk management process.
The IAA approval also includes an additional risk weighting approach for unrated securitisation facilities to “non-IAA” asset classes that applies the higher (most conservative) risk weight of: (i) APS 120 or APS 112 standardised risk weights, or (ii) APS 120 IAA risk weights based on the Level 2 Group’s internal assessments. The outcome is that for a majority of the non-IAA asset classes the standardised risk weights apply.
The IAA model for each asset class is based on an asset class specific IAA methodology. The models used are locked-down to ensure a consistency of approach and minimise the risk of manual over-rides occurring. The methodology and model (where applicable) for each asset class are considered on a semi-annual basis to ensure they reflect the NAB Group’s desired risk appetite and allow for changes in market conditions. Certain asset classes have a specific actuarial tool developed that allows for systematic assessment of credit risk across different pools of financial receivables.
IAA model outputs are used in the credit decision making process for a given exposure according to the NAB Group’s DCA matrix. Under the Group’s Risk Management Accountability Model, the business has primary responsibility to manage risks originating in the business. This includes ensuring that the methodologies and models used remain appropriate and are updated as required. Secondary responsibility lies with Credit Risk who must ensure that the business uses the model consistently and that outcomes across different transactions are consistent. Internal auditors ensure that the approval process for the model and methodology are adequate.
Monitoring and Reporting
Finance functions perform regular measurement and reporting of securitisation and resecuritisation exposures, including revenue, capital, asset and facility limits and exceptions. Key elements of these reports are provided to the various risk committees.
Specialist securitisation areas monitor the quality of the pools of assets underlying securitisation or resecuritisation exposures and model the effect on the exposures. Material changes in credit quality of the assets or the exposures are reported to the risk function and, if required, to the relevant risk committees.
Accounting Treatment
The payments on facilities provided to securitisation SPVs are contractually linked to the payments received on a pool of other instruments within the SPV. The facility
provided is often pooled into tranches by the SPV based on a contractual cash waterfall repayment arrangement.
To measure the facility at amortised cost, the tranche which the facility is part of must give rise to cash flows that are ‘solely payments of principal and interest’. The underlying pool of instruments in the SPV must also contain one or more instruments that have contractually cash flows that comprise ‘solely payments of principal and interest’.
If the facility meets the criteria to be measured at amortised cost, interest income is recognised in the income statement using the effective interest method. Fees received which are directly attributable to the origination of the financial instrument are recognised as part of the effective interest method otherwise the fees are recognised on an accruals basis.
Most of these facilities fund NAB-sponsored securitisation SPVs which are consolidated by the Level 2 Group. On consolidation, the facilities are eliminated and the underlying liabilities and assets are brought onto the Level 2 Group’s balance sheet.
Securitisation exposures held in trading book, where the facility provided to the SPV is not held to collect ‘solely payments of principal and interest’, but are traded, are recorded at fair value. Unrealised profit or losses in respect of the fair value adjustments are recognised immediately in to the profit and loss account.
Securitisation exposures held in banking book, where the facility provided to the SPV is to hold to collect ‘solely payment of principal and interest’ and sell the exposure where an opportunity arises, are recorded at fair value and unrealised profit or losses in respect of the fair value adjustments are recognised in other comprehensive income.
Securitisation warehouse facilities provided to third party SPVs are accounted for at amortised cost, net of any provision for impairment, provided they meet the contractually linked guidance above.
Derivatives such as interest rate swaps, basis swaps or cross-currency swaps with third party SPVs are recorded at fair value and unrealised profit or losses in respect of the fair value adjustments are recognised immediately in to the profit and loss account.
In general, there is no difference in accounting treatment between securitisation and resecuritisation exposures.
Securitisation Risks
Risks arising from securitisation activities include credit, liquidity, market and operational risks. Interest rate risk and securities price risk are managed as part of the market and non-traded market risk processes. In some cases risks are assumed by acquiring securities or entering into facilities. In other cases risks are transferred through the securitisation of Level 2 Group assets. The Level 2 Group engages in credit risk mitigation on a case-by-case basis.
The Level 2 Group has certain exposures which are classed as resecuritisation exposures. The Level 2 Group does not specifically target resecuritisation exposures for investment.

Securitisation
52
pillar 3 report
2015 Trading book securitisation exposures are not material at a Level 2 Group level. As such, these exposures are included in
the tables below and are not separately disclosed within this document.
This section provides information about assets that the Level 2 Group manages as securitisations for third parties (clients) and for any retained exposure to assets securitised by the Level 2 Group.
Table 6.1A: Total Securitisation Exposures
This table shows the amount of securitisation exposures by facility and provides an indication of the relative extent to which the Level 2 Group has exposure to each type of asset within the securitisation SPV. This table does not provide information on Level 2 Group assets that have been sold to securitisations. As at 30 Sep 15
Total outstanding exposures
Non-originating
ADI exposures
Originating ADI
Directly originated
assets
Indirectly originated
assets
ABCP facilities provided
Other (manager services)
$m $m $m $m $m
Underlying asset
Residential mortgage 14,040 - - 620 424
Credit cards and other personal loans 18 - - 34 -
Auto and equipment finance 1,341 - - 139 -
CDOs/CLOs (1) - - - - 461
Commercial mortgages 13 - - - 40
Corporate bonds - - - - 612
Other 535 - - - -
Total underlying asset 15,947 - - 793 1,537
(1) As at 30 September 2015, all exposures are traditional securitisations, where the pool of assets is assigned to an SPV, usually by a sale.
As at 31 Mar 15
Total outstanding exposures
Non-originating
ADI exposures
Originating ADI
Directly originated
assets
Indirectly originated
assets
ABCP facilities provided
Other (manager services)
$m $m $m $m $m
Underlying asset
Residential mortgage 14,049 10 - 413 535
Credit cards and other personal loans 20 - - 37 -
Auto and equipment finance 1,244 - - 150 -
CDOs/CLOs (1) - - - - 635
Commercial mortgages 13 - - - 59
Corporate bonds - - - - 641
Other 535 - - - -
Total underlying asset 15,861 10 - 600 1,870
(1) As at 31 March 2015, all exposures are traditional securitisations, where the pool of assets is assigned to an SPV, usually by a sale.

Securitisation
53
pillar 3 report
2015 Table 6.1B: Type of Exposure
The following two tables provide information about assets that the Level 2 Group manages as securitisations (predominantly for third party clients) where the exposures are risk weighted under APS 120. These tables do not provide information on Level 2 Group assets that have been sold to securitisations whether or not the assets are risk weighted under APS 120. The table below breaks down the securitisation exposures by type of facility as defined in the Glossary.
As at 30 Sep 15 As at 31 Mar 15
On-balance
sheet
Off-balance
sheet Total
On-balance
sheet
Off-balance
sheet Total
$m $m $m $m $m $m
Securitisation exposure type
Liquidity facilities 1 1,989 1,990 1 1,704 1,705
Warehouse facilities 6,589 1,281 7,870 6,255 1,206 7,461
Credit enhancements 2 16 18 - 20 20
Derivative transactions 97 - 97 107 - 107
Securities 8,381 - 8,381 9,116 - 9,116
Credit derivatives transactions - - - - - -
Other - - - - - -
Total securitisation exposures 15,070 3,286 18,356 15,479 2,930 18,409
Table 6.1C: Recent Third Party Securitisation Activ ity
This table provides information about new securitisation facilities provided in the period described below.
Notional amount of facilities provided
6 months ended
30 Sep 15
6 months ended
31 Mar 15
$m $m
Securitisation exposure type
Liquidity facilities 331 17
Warehouse facilities 866 1,196
Credit enhancements - -
Derivative transactions 19 -
Securities 973 2,979
Credit derivatives transactions - -
Other - -
Total new facilities provided 2,189 4,192

Securitisation
54
pillar 3 report
2015 Table 6.1D: Exposures by Risk Weight
These tables show the risk weights for securitisation and resecuritisation exposures as calculated under APS 120, split between the RBA, the IAA, and Other.
Securitisation Exposures by Risk Weight
Securitisation exposures are on-balance and off-balance sheet risk positions held by the Level 2 Group arising from a securitisation, excluding exposures which have been classified as resecuritisations. Resecuritisation exposures are disclosed on the following page.
As at 30 Sep 15 As at 31 Mar 15
Exposure RWA Exposure RWA
Risk weight bands $m $m $m $m
RBA
≤10% 7,436 524 8,651 614
> 10% ≤ 25% 138 18 137 18
> 25% ≤ 35% - - 25 9
> 35% ≤ 50% - - - -
> 50% ≤ 75% - - - -
> 75% ≤ 100% - - - -
> 100% ≤ 650% - - - -
> 650% ≤ 850% - - - -
1250% - - - -
Deductions 6 - - -
RBA sub-total 7,580 542 8,813 641
IAA
≤10% 4,773 346 3,004 220
> 10% ≤ 25% 4,128 532 4,530 576
> 25% ≤ 35% 23 8 33 12
> 35% ≤ 50% 54 27 28 14
> 50% ≤ 75% 74 56 82 61
> 75% ≤ 100% 11 11 - -
> 100% ≤ 650% 4 10 2 4
> 650% ≤ 850% - - - -
1250% - - - -
Deductions 5 - 1 -
IAA sub-total 9,072 990 7,680 887
Other
≤10% 63 4 68 5
> 10% ≤ 25% 268 45 258 44
> 25% ≤ 35% 6 2 6 2
> 35% ≤ 50% 75 37 64 32
> 50% ≤ 75% - - - -
> 75% ≤ 100% 626 617 496 496
> 100% ≤ 650% - - 191 243
> 650% ≤ 850% - - - -
1250% - 3 - 3
Deductions - - - -
Other sub-total 1,037 708 1,083 825
Total 17,689 2,240 17,576 2,353

Securitisation
55
pillar 3 report
2015 Resecuritisation Exposures by Risk Weight
Resecuritisation exposures are securitisation exposures in which the risk associated with an underlying pool of exposures is tranched and at least one of the underlying exposures is a securitisation exposure. In addition, an exposure to one or more resecuritisation exposures is a resecuritisation exposure. As at 30 Sep 15 As at 31 Mar 15
Exposure RWA Exposure RWA
Risk weight bands $m $m $m $m
RBA
≤10% - - - -
> 10% ≤ 25% 1 - 1 -
> 25% ≤ 35% 4 2 4 1
> 35% ≤ 50% - - - -
> 50% ≤ 75% - - - -
> 75% ≤ 100% - - - -
> 100% ≤ 650% - - - -
> 650% ≤ 850% - - - 1
1250% - - - -
Deductions 16 - 16 -
RBA sub-total 21 2 21 2
IAA
≤10% - - - -
> 10% ≤ 25% - - - -
> 25% ≤ 35% - - - -
> 35% ≤ 50% - - - -
> 50% ≤ 75% - - - -
> 75% ≤ 100% - - - -
> 100% ≤ 650% - - - -
> 650% ≤ 850% - - - -
1250% - - - -
Deductions - - - -
IAA sub-total - - - -
Other
≤10% 95 6 96 6
> 10% ≤ 25% 5 1 5 1
> 25% ≤ 35% 6 2 8 3
> 35% ≤ 50% 275 110 451 180
> 50% ≤ 75% 91 59 80 52
> 75% ≤ 100% 95 95 104 104
> 100% ≤ 650% - - - -
> 650% ≤ 850% - - - -
1250% - - - -
Deductions - - - -
Other sub-total 567 273 744 346
Total 588 275 765 348

Securitisation
56
pillar 3 report
2015 Total Exposures by Risk Weight
This table is the sum of the tables ‘Securitisation Exposures by Risk Weight’ and ‘Resecuritisation Exposures by Risk Weight’ disclosed on the previous pages. As at 30 Sep 15 As at 31 Mar 15
Exposure RWA Exposure RWA
Risk weight bands $m $m $m $m
RBA
≤10% 7,436 525 8,651 615
> 10% ≤ 25% 139 18 138 18
> 25% ≤ 35% 5 1 29 10
> 35% ≤ 50% - - - -
> 50% ≤ 75% - - - -
> 75% ≤ 100% - - - -
> 100% ≤ 650% - - - -
> 650% ≤ 850% - - - -
1250% - - - -
Deductions 21 - 16 -
RBA sub-total 7,601 544 8,834 643
IAA
≤10% 4,773 346 3,004 220
> 10% ≤ 25% 4,128 532 4,530 576
> 25% ≤ 35% 23 8 33 12
> 35% ≤ 50% 54 27 28 14
> 50% ≤ 75% 74 56 82 61
> 75% ≤ 100% 11 11 - -
> 100% ≤ 650% 4 10 2 4
> 650% ≤ 850% - - - -
1250% - - - -
Deductions 5 - 1 -
IAA sub-total 9,072 990 7,680 887
Other
≤10% 158 10 164 11
> 10% ≤ 25% 274 46 263 45
> 25% ≤ 35% 12 4 14 5
> 35% ≤ 50% 350 148 515 212
> 50% ≤ 75% 91 59 80 52
> 75% ≤ 100% 719 711 600 600
> 100% ≤ 650% - - 191 243
> 650% ≤ 850% - - - -
1250% - 3 - 3
Deductions - - - -
Other sub-total 1,604 981 1,827 1,171
Total 18,277 2,515 18,341 2,701

Securitisation
57
pillar 3 report
2015 Table 6.1E: Exposures Deducted from Capital
The table below shows securitisation exposures that have been deducted from capital, divided into those that relate to securitisations of Level 2 Group assets and other securitisations.
As at 30 Sep 15
Deductions relating to ADI-originated assets securitised
Deductions relating to
other securitisation exposures
Total
Residential mortgage
Credit cards and
other personal
loans
Commercial loans
Other
$m $m $m $m $m $m
Securitisation exposures deducted from capital (1)
Deductions from Common Equity Tier 1 Capital
- - - - 26 26
Total securitisation exposures deducted from capital
- - - - 26 26
(1) These are exposures to the subordinated tranche (i.e. exposure to the first 10% of credit losses of a securitisation and where the exposure is not to the most senior tranche).
As at 31 Mar 15
Deductions relating to ADI-originated assets securitised
Deductions relating to
other securitisation exposures
Total
Residential mortgage
Credit cards and
other personal
loans
Commercial loans
Other
$m $m $m $m $m $m
Securitisation exposures deducted from capital
Deductions from Common Equity Tier 1 Capital
- - - - 17 17
Total securitisation exposures deducted from capital
- - - - 17 17

Securitisation
58
pillar 3 report
2015 6.2 Level 2 Group Owned Securitised Assets
The Level 2 Group securitises its own assets for funding, liquidity risk and capital management purposes.
In doing this, the Level 2 Group acts as the originator, seller and servicer of assets from the Level 2 Group’s balance sheet. This includes responsibility for collecting interest and principal on the securitised assets. The Level 2 Group may or may not retain an exposure to securitisation SPVs to which the Level 2 Group has sold assets. It may also manage or provide facilities for the securitisation (including credit enhancements, liquidity and funding facilities), roles which are outlined in Section 6.1 Third Party Securitisation.
This section includes information about the Level 2 Group's internal securitisation pools of residential mortgage-backed securities (RMBS). These securities have been developed as a source of contingent liquidity to support the Level 2 Group's liquid asset holdings outlined in Section 9.1 Funding and Liquidity Risk.
Structure and Organisation
GALCO and subsidiary ALCOs are responsible for the oversight of management’s performance, and of the compliance and governance frameworks around balance sheet risks, including secured funding (which incorporates owned asset securitisation).
The GBSLR Policy and GBSLR Secured Funding Standard set out the principles and control framework for secured funding. Among other forms of secured funding, it applies to traditional securitisation, synthetic securitisation and a combination of the two.
The risk appetite for secured funding is reviewed annually and is set as part of the Level 2 Group Annual Funding Plan, approved by the Board.
Management
Securitisation exposures, risks and capital must comply with the requirements outlined in APS 120. Compliance with the requirements of APS 120 is achieved through ensuring that the Level 2 Group:
- deals with the SPV and its investors on an arm’s length basis and on market terms and conditions
- clearly discloses the nature and limitations of its involvement in a securitisation
- takes the necessary precautions to ensure that the Level 2 Group does not give the perception that it will support a securitisation that is in excess of its explicit contractual obligations (i.e. implicit support).
Level 2 Group and subsidiary Treasuries have responsibility for the management of secured funding, including:
- secured funding strategy and plan development, incorporating the setting of funding indices and secured funding targets (forming part of the Annual Funding Plan)
- execution of securitisation transactions - ongoing management of securitisation transactions. At the Level 2 Group level, Group Treasury is also responsible for the oversight of secured funding plans and strategies, and for ensuring that activities across the
Level 2 Group are coordinated and Level 2 Group objectives are achieved.
The GBSLR team are responsible for the independent oversight of secured funding execution management conducted by the Level 2 Group and Subsidiary Treasuries, monitoring secured funding activity to ensure it is conducted within the requirements of the Level 2 Group’s secured funding framework and policies.
Measurement
The Level 2 Group's measurement framework for own asset securitisation is consistent with the framework outlined in Section 6.1 Third Party Securitisation. Business unit finance and risk functions perform regular measurement and reporting in relation to owned asset securitisation, including the impact on capital, provisioning, outstanding issuance and run-off. Clydesdale and BNZ are also governed by local regulatory requirements and report owned asset securitisation to the PRA and RBNZ using their respective local regulatory methodologies.
Monitoring and Reporting
Reporting is conducted periodically including:
- pool performance for each securitisation transaction - investor and regulatory reporting - rating agency and financial reporting - funding plan updates to GALCO and subsidiary
ALCOs.
Any key issues arising are also presented to the GRRMC and PBRC each month via the GCRO report.
Accounting Treatment
Through its securitisation program, the Level 2 Group engages in two main activities:
- it packages and sells loans (principally housing mortgage loans) and other finance receivables as securities to investors through a series of securitisation vehicles
- it develops securities as a source of contingent liquidity to support the Level 2 Group's liquid asset holdings.
The Level 2 Group is entitled to any residual income of the securitisation SPVs after all payments to investors and costs of the program have been met.
The Level 2 Group is considered to hold the majority of the residual risks and benefits within the securitisation SPVs and all relevant financial assets continue to be held on the Level 2 Group balance sheet. A liability is recognised for the proceeds of the funding transaction. The transactions are therefore considered financings rather than sales.

Securitisation
59
pillar 3 report
2015 Table 6.2A: Assets Securitised by the Level 2 Group
This table shows the classes of assets that have been securitised by the Level 2 Group. This table and table 6.2B may include assets which are sold to SPVs (1) which issue securities which meet the Reserve Bank of Australia’s repurchase eligibility criteria; (2) which otherwise do not result in significant risk transfer and are considered on-balance sheet for regulatory purposes; or (3) in which significant risk transfer has taken place and which are considered off-balance sheet for regulatory purposes. As at 30 Sep 15
Total outstanding exposures securitised
assets originated
by ADI
Impaired assets
relating to exposures
securitised
Total past due assets
from exposures
securitised
ADI recognised
loss from exposures
securitised Traditional Synthetic
$m $m $m $m $m
Underlying asset (1)
Residential mortgage (2) 87,753 - 192 317 -
Credit cards - - - - -
Auto and equipment finance - - - - -
Commercial loans - - - - -
Other - - - - -
Total underlying asset 87,753 - 192 317 -
(1) The definition of impaired and past due assets is consistent with the definitions provided in the Glossary of this report.
(2) Includes internal securitisation pools of RMBS that have been developed as a source of contingent liquidity to support the Level 2 Group's liquid asset holdings. The amount of these securitised assets is $63,717 million (March 2015: $59,446 million).
As at 31 Mar 15
Total outstanding exposures securitised
assets originated
by ADI
Impaired assets
relating to exposures
securitised
Total past due assets
from exposures
securitised
ADI recognised
loss from exposures
securitised Traditional Synthetic
$m $m $m $m $m
Underlying asset
Residential mortgage 79,087 - 165 289 -
Credit cards - - - - -
Auto and equipment finance 53 - - - -
Commercial loans - - - - -
Other - - - - -
Total underlying asset 79,140 - 165 289 -

Securitisation
60
pillar 3 report
2015 Table 6.2B: Recent Securitisation Activity
This table shows the amount of assets sold by the Level 2 Group to securitisation SPVs and any gain or loss on sale.
6 months ended 30 Sep 15 6 months ended 31 Mar 15
Amount securitised
during period directly
originated
Amount securitised
during period
indirectly originated
Recognised gain or loss
on sale
Amount securitised
during period
directly originated
Amount securitised
during period
indirectly originated
Recognised gain or loss
on sale
$m $m $m $m $m $m
Underlying asset (1)
Residential mortgage 15,281 - - 19,575 - -
Credit cards - - - - - -
Auto and equipment finance - - - - - -
Commercial loans - - - - - -
Other - - - - - -
Total underlying asset 15,281 - - 19,575 - -
(1) The amount securitised during the period is securitisation undertaken for funding purposes, where no significant risk transfer has occurred.
Disclosure 6.2C: Securitisation Subject to Early Am ortisation
Attachment G of APS 120 provides for specific regulatory treatment for securitisations of certain types of assets. As at 30 September 2015 and 31 March 2015, none of these securitisations have been undertaken by the Level 2 Group.
Disclosure 6.2D: Forthcoming Securitisation Activit y by the Level 2 Group
The Level 2 Group has a securitisation strategy, and sets funding indices and securitisation targets as part of its Annual Funding Plan. The aim of the securitisation program is to ensure that the Level 2 Group is capital efficient and has diversity of funding and liquidity sources.
To support this strategy, the Level 2 Group has a business practice in which pools of assets originated by the Level 2 Group are available to be internally securitised (as a source of contingent liquidity) or externally securitised when market opportunities arise. The Level 2 Group continually assesses opportunities for securitisation of these assets.
This table provides information about forthcoming external securitisation deals entered into between 30 September 2015 and the disclosure date of this report.
As at
30 Sep 15
As at
31 Mar 15
$m $m
Underlying asset
Residential mortgage 5,830 2,789
Credit cards - -
Auto and equipment finance - -
Commercial loans - -
Other - -
Total underlying asset 5,830 2,789
Disclosure 6.2E: Credit Risk Mitigation and Guarant ors
APS 330 Table 12n requires disclosure of resecuritisation exposures retained or purchased, broken down according to the application of credit risk mitigation and exposures to guarantors. As at 30 September 2015, the Level 2 Group did not have any resecuritisation exposures to which credit risk mitigation is applied or exposures to guarantors.

Market Risk
61
pillar 3 report
2015 7. Market Risk
Introduction
The Level 2 Group makes a distinction between traded and non-traded market risks for the purpose of managing market risk. This section relates to traded market risk. Non-traded market risk is discussed in Section 9 Balance Sheet and Liquidity Risk.
The Level 2 Group undertakes trading activities to support its clients and to profit in the short term from differences in markets, such as interest rates, foreign exchange rates, commodity prices, equity prices and credit spreads. Traded market risk is the potential for losses or gains to arise from trading activities undertaken by the Level 2 Group as a result of the movement of market prices.
The Level 2 Group’s exposure to market risk arises out of its trading activities which are principally carried out by Product & Markets Fixed Income, Currencies & Commodities (FICC) and BNZ. This exposure is quantified for regulatory capital purposes using both the APRA-approved internal model approach and the standard method, details of which are provided below.
Other business units within the Level 2 Group do not conduct trading books. Clydesdale offers a range of treasury risk management products to their customers to assist with the customers’ management of interest rate risk and foreign exchange risk. Any market risk associated with treasury risk management products offered by Clydesdale is managed by the NAB Group so that, other than immaterial positions, market risk positions are not held on the balance sheet of Clydesdale.
Management and Governance
The Level 2 Group’s risk appetite in relation to market risk is determined by the Board and is expressed in the Group Risk Appetite Statement, and governed by the Traded Market Risk Policy and Standards.
The Market Risk Appetite Statement complements the Group Risk Appetite Statement by providing further depth on the allocation of risk appetite to asset classes, regions and trading desks as well as detailing permitted products and markets.
The overall framework of Traded Market Risk Policy, Standards and the Risk Appetite Statement provide direction for the monitoring, oversight, escalation and governance of traded market risk including delegated authorities, risk measurement, and reporting and control standards. These policies are consistent with the prudential regulatory requirements.
The market risk profile of the NAB Group is overseen by the senior executive management of the NAB Group via the PBRC, GRRMC, Group Credit & Market Risk Committee (GCMRC), and Product & Markets Risk Management Committee (P&M RMC).
The Product & Markets Market Risk Sub-committee (P&M MRSC) manages market risk with the following responsibilities:
- designing and implementing of policies and procedures to ensure market risk is managed within the appetite set by the Board
- reviewing market risks for consistency with approved market risk settings and the NAB Group’s Risk Appetite
- overseeing the effectiveness and appropriateness of the risk management framework
- reviewing and approving models - escalating market risk issues to the higher
committees as necessary.
Group Market Risk is an independent unit, separate from the trading activities units, with responsibility for the daily measurement and monitoring of market risk exposures. Group Market Risk has the following key controls in place for effective internal management as well as compliance with the prudential requirements:
- trading authorities and responsibilities are defined and monitored at all levels
- a comprehensive and controlled framework of risk reporting and limit breach management
- new product approval process and usage authority permitting desk to transact a particular product
- daily end of day and intra-day risk oversight as well as periodic desk review
- backtesting of VaR results under internal models for capital adequacy
- segregation of duties in the origination, processing, and valuation of transactions operated under clear and independent reporting lines
- regular and effective reporting of market risk to executive management and the Board
- periodic review and update of compliance with internal and regulatory policies
- independent and periodic internal audit review of compliance with policies, procedures, process and limits.
Key methodologies for compliance with the prudential requirements for positions held in the trading book are:
- models that are used to determine risk and financial profit and loss for the NAB Group are independently validated with the review outcome documented and reported to P&M MRSC on a regular basis
- all trades are fairly valued daily using independently sourced and validated rates in accordance with Finance Rates and Revaluation Policy
- use of Model Reserve Framework and Fair Value Adjustments to support compliance with prudential validations.

Market Risk
62
pillar 3 report
2015 Measurement
VaR estimates the likelihood that a given portfolio’s losses will exceed a certain amount. The Level 2 Group uses VaR estimates for both regulatory capital calculations in accordance with Prudential Standard APS 116 Capital Adequacy: Market Risk, and for internal risk control purposes.
The Level 2 Group is accredited by APRA to use a historical simulation model to simulate the daily change in market factors. VaR is calculated for all trades on an individual basis using a full revaluation approach. For capital purposes, VaR for products modelled using the Internal Model is calculated in Australian dollars on a globally diversified basis in accordance with the following parameters:
- confidence level - 99 per cent one tail - holding period - 10 days (1 day VaR scaled by
square root of time) - observation period - 550 days (unweighted, updated
daily).
VaR limits are assigned to individual trading desks and regions or product lines in accordance with the Market Risk Appetite Statement.
Group Market Risk monitors positions daily against the relevant limits and escalates any breaches in accordance with Market Risk standards and procedures. Additionally, Group Market Risk performs backtesting analysis to assess the validity of the VaR numbers when compared to the actual and hypothetical trading outcomes and to escalate any anomalies that may arise. Results of the backtesting are overseen by the P&M MRSC.
Stressed VaR is calculated using the same methodology as VaR but with an observation period based on a one-year period of significant market volatility.
Stress testing is carried out daily to test the profit and loss implications of extreme but plausible scenarios, and also to reveal hidden sensitivities in the portfolio that only become transparent when modelling extreme market moves.
‘Stop loss limits’ represent trigger points at which an overnight or accumulated loss incurred by a trading desk would lead to escalation in accordance with agreed procedures.
Sensitivity and other market risk limits are set by Group Market Risk to manage market risk at a more granular level, for example to manage concentration risk. These limits are monitored by Product & Markets FICC and independently by Group Market Risk.
Product & Markets FICC are responsible for managing risk, in order to deliver profits, while ensuring compliance with all limits and policies.
Capital Methodology
As detailed in the following table, the Level 2 Group is accredited by APRA to use the Internal Model Approach (IMA) under APS116 for all trading asset classes except for specific interest rate risk, equities, carbon, and some foreign exchange risk from banking book portfolios. These asset classes are managed with regulatory capital calculated as an add-on to that from IMA. There are two types of market risk measures related to regulatory capital:
- general market risk which is related to changes in the overall market prices
- specific market risk which is related to changes for the specific issuer.
In accordance with APS 110, the RWA equivalent for traded market risk using the IMA is the capital requirement multiplied by 12.5.
Table 7.1A: Standard Method Risk-Weighted Assets
As at
30 Sep 15 31 Mar 15
$m $m
Risk-Weighted Assets
Interest rate risk 899 808
Equity position risk 10 11
Foreign exchange risk - -
Commodity risk - -
Total risk-weighted assets - standard method 909 819
Standard Method
Internal Model Approach
Calculation As per APS 116 Attachment B
Internally developed VaR calculation
General Market Risk
Equities, Carbon, some Banking Book Foreign Exchange Risk
Foreign Exchange, Commodities, Credit, Interest Rate and Inflation Products
Specific Market Risk
All applicable products

Market Risk
63
pillar 3 report
2015 Table 7.1B: Total Risk-Weighted Assets
As at
30 Sep 15 31 Mar 15
$m $m
Market risk
Standard method 909 819
Internal model approach 4,884 5,002
Total market risk RWA 5,793 5,821
Table 7.1C: Internal Model Approach VaR
The following table provides information on the high, mean and low VaR over the reporting period and at period end. 6 months ended 30 Sep 15 As at
30 Sep 15
Mean value
Minimum
value
Maximum
value
$m $m $m $m
VaR at a 99% confidence level (1)
Foreign exchange risk 5 1 11 10
Interest rate risk 5 3 13 6
Volatility risk 2 2 4 3
Commodities risk - - 1 1
Credit risk 2 1 3 2
Inflation risk - - 1 -
Diversification benefit (6) n/a n/a (9)
Total diversified VaR at a 99% confidence level 8 5 14 13
Other market risks (2) - - 1 -
Total VaR for physical and derivative positions (3) 8 5 15 13
(1) The maxima / minima by risk types are likely to occur during different days in the period. As such, the sum of these figures will not equal the total maximum / minimum VaR which is the maximum/ minimum aggregate VaR position during the period.
(2) Other market risks include exposures to various basis risks measured individually at a portfolio level.
(3) VaR is measured individually for foreign exchange risk, interest rate risk, volatility risk, commodities risk, credit risk, and inflation risk. Risk limits are applied in these categories separately, and against the total risk position.
6 months ended 31 Mar 15 As at
31 Mar 15
Mean value
Minimum
value
Maximum
value
$m $m $m $m
VaR at a 99% confidence level
Foreign exchange risk 3 1 7 3
Interest rate risk 7 5 11 5
Volatility risk 2 1 4 3
Commodities risk - - 1 -
Credit risk 3 2 3 3
Inflation risk 1 - 1 -
Diversification benefit (8) n/a n/a (7)
Total diversified VaR at a 99% confidence level 8 6 12 7
Other market risks - - 1 -
Total VaR for physical and derivative positions 8 6 13 7

Market Risk
64
pillar 3 report
2015
Table 7.1D: Internal Model Approach Stressed VaR
The following table provides information on the high, mean and low Stressed VaR over the reporting period and at period end. 6 months ended 30 Sep 15 As at
30 Sep 15
Mean value
Minimum
value
Maximum
value
$m $m $m $m
Stressed VaR at a 99% confidence level (1)
Foreign exchange risk 9 1 22 19
Interest rate risk 16 10 25 18
Volatility risk 5 4 7 5
Commodities risk 1 - 1 -
Credit risk 18 14 22 15
Inflation risk 1 1 1 1
Diversification benefit (25) n/a n/a (27)
Total diversified Stressed VaR at a 99% confidence level 25 16 37 31
Other market risks (2) 1 - 2 -
Total Stressed VaR for physical and derivative positions (3) 26 16 39 31
(1) The maxima / minima by risk types are likely to occur during different days in the period. As such, the sum of these figures will not equal the total maximum / minimum Stressed VaR which is the maximum / minimum aggregate Stressed VaR position during the period.
(2) Other market risks include exposures to various basis risks measured individually at a portfolio level.
(3) VaR is measured individually for foreign exchange risk, interest rate risk, volatility risk, commodities risk, credit risk, and inflation risk. Risk limits are applied in these categories separately, and against the total risk position.
6 months ended 31 Mar 15 As at
31 Mar 15
Mean value
Minimum
value
Maximum
value
$m $m $m $m
Stressed VaR at a 99% confidence level
Foreign exchange risk 6 1 19 6
Interest rate risk 18 10 29 17
Volatility risk 5 3 6 6
Commodities risk - - 1 1
Credit risk 21 17 24 22
Inflation risk 2 1 3 1
Diversification benefit (27) n/a n/a (27)
Total diversified Stressed VaR at a 99% confidence level 25 16 38 26
Other market risks 2 - 5 1
Total Stressed VaR for physical and derivative positions 27 16 43 27
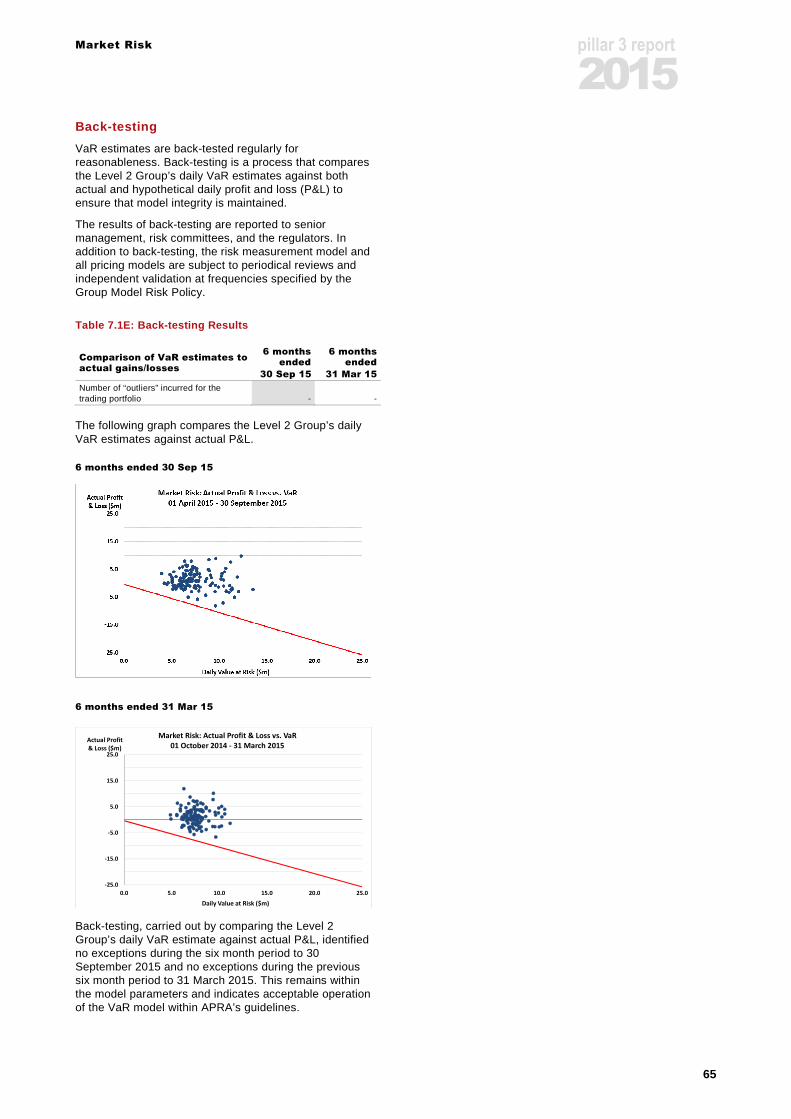
Market Risk
65
pillar 3 report
2015 Back-testing
VaR estimates are back-tested regularly for reasonableness. Back-testing is a process that compares the Level 2 Group’s daily VaR estimates against both actual and hypothetical daily profit and loss (P&L) to ensure that model integrity is maintained.
The results of back-testing are reported to senior management, risk committees, and the regulators. In addition to back-testing, the risk measurement model and all pricing models are subject to periodical reviews and independent validation at frequencies specified by the Group Model Risk Policy.
Table 7.1E: Back-testing Results
Comparison of VaR estimates to actual gains/losses
6 months ended
30 Sep 15.
6 months ended
31 Mar 15
Number of “outliers” incurred for the trading portfolio - -
The following graph compares the Level 2 Group’s daily VaR estimates against actual P&L. 6 months ended 30 Sep 15
6 months ended 31 Mar 15
Back-testing, carried out by comparing the Level 2 Group’s daily VaR estimate against actual P&L, identified no exceptions during the six month period to 30 September 2015 and no exceptions during the previous six month period to 31 March 2015. This remains within the model parameters and indicates acceptable operation of the VaR model within APRA’s guidelines.
-25.0
-15.0
-5.0
5.0
15.0
25.0
0.0 5.0 10.0 15.0 20.0 25.0
Actual Profit
& Loss ($m)
Daily Value at Risk ($m)
Market Risk: Actual Profit & Loss vs. VaR
01 October 2014 - 31 March 2015

Operational Risk
66
pillar 3 report
2015 8. Operational Risk
Introduction
Operational risk is the risk of loss resulting from inadequate or failed internal processes, people and systems or external events. This includes legal risk, but excludes strategic risk and reputational risk.
The primary objective for the management of operational risk is to ensure that where operational risk exists, it is identified, assessed and managed to acceptable levels, and at the same time, allows for the achievement of business and strategic objectives and compliance with our obligations.
Structure and Organisation
The PBRC, on the recommendation of the GRRMC, is responsible for approving and/or endorsing the:
- Group Operational Risk Management Framework (ORMF)
- Group Operational Risk Appetite Statement - Operational Risk Capital Calculation Model.
The NAB Group’s Risk Governance structure provides the Board and PBRC with assurance over the performance of the overall risk management framework. This is primarily achieved through Enterprise Operational Risk and Compliance (EOR&C) which provides the Board, PBRC, GRRMC, Group Regulatory Compliance Operational Risk Committee (GRCORC) and the Risk Leadership Team (RLT) with the information required to manage these responsibilities.
This flow of information ultimately allows the Board to discharge its responsibilities for managing the NAB Group’s operational risk exposures.
Management
EOR&C provides the framework, policies, standards, processes and tools for the business to use in the identification, assessment, management, monitoring, measurement and reporting of operational risks.
Implementation of the ORMF leads to:
- all staff taking responsibility and ownership for managing the operational risk inherent in their day-to-day activities
- promoting and embedding a risk conscious culture and behaviour throughout the NAB Group
- consistency in the identification, assessment, management, monitoring, measurement and reporting of operational risk
- proactive identification and management of operational risks and events to contain: direct and indirect financial loss, disruption to business processes, and non-financial impacts including regulatory, reputation, customer and management remediation
- estimates of operational risk capital that reflect the operational risk profile of the NAB Group
- risk decisions being made on an informed basis, considering risk appetite and the capital implications, thereby enhancing awareness and/or acceptance of operational risks.
The NAB Group creates a risk conscious environment through promoting an operational risk culture:
- of effective integration of operational risk management into day-to-day business decisions
- where risk-awareness and questioning are supported (including the exercise of appropriate judgement in the identification and management of risk)
- of compliance, not only within the strict parameters of the law, delegated authorities and other compliance requirements, but also extending to doing what is right.
The ORMF applies to all entities within the NAB Group, including any outsourced services undertaken on behalf of any business within the NAB Group.
The NAB Group’s Operational Risk Management Framework
The Enterprise Risk Policy, supporting standards and processes define the principles, minimum standards and processes for the management of operational risk throughout the NAB Group and support the ORMF. The scope includes:
- Business Continuity Management - Change Risk - Event Management - Information Security - Model Risk - Operational Risk Profiling - Scenario Analysis - Outsourcing - Physical Security - Travel Security - Executive protection - Anti-Fraud.
Additional standards/processes are developed when there is a critical need to manage a specific risk area.
Measurement
The NAB Group has been accredited to use its internal operational risk models and processes to determine regulatory capital for its Australian and New Zealand Banking operations. The NAB Group uses alternative standardised approach for Clydesdale with an AMA overlay. The NAB Group's AMA calculation of regulatory capital for operational risk uses data captured from:
. Operational Risk AppetiteThe level and types of operational risk the Group iswilling to assume within our Risk Capacity so as to
achieve our strategic objectives.
. Operational Risk MeasurementA measurement of the Operational Risk Profile whichallows the Group to determine the level of capitalrequired to be held by the Group in order to protectagainst insolvency arising from operational risk
events and losses.
. Operational Risk ProfileThe identification, assessment,
management, monitoring and reportingof operational risks, controls, residual
or expected impacts, loss events and severeimpacts and scenarios.
. GovernanceThe organisational structure, roles and accountabilities which support and enable identifying,assessing, managing, measuring and reporting operational risks and operational risk events.
. Operational Risk Policies & StandardsThe policies, standards and tools which enable identification, assessment, management,
measurement and reporting of operational risks and operational risk events.

Operational Risk
67
pillar 3 report
2015 - historical internal loss data which is representative of
the NAB Group's operational loss profile - scenario analysis data received from business and
risk management professionals which considers potential extreme events faced by the NAB Group
- relevant data from losses incurred by other financial institutions and factors reflecting the business environment and internal controls.
The Operational Risk Capital Calculation Model is illustrated below as an end-to-end capital allocation process.
Calculation of Operational Risk Capital
Table 8A: Total Risk-Weighted Assets
As at
30 Sep 15 31 Mar 15
$m $m
Operational risk
Standardised approach 3,680 4,110
Advanced measurement approach 36,320 35,890
Total operational risk RWA 40,000 40,000
Monitoring and Reporting
The success of the operational risk management processes is determined by the ability of management to articulate and consistently demonstrate behaviours that promote a strong risk awareness and culture throughout the NAB Group.
EOR&C provides the following reporting:
- monthly reporting on significant loss events, emerging issues, oversight, monitoring, and review activity. This information is included in the NAB Group CRO report which is provided to the GRRMC and PBRC
- monthly EOR&C insights based on external information. This is provided to Divisional risk teams
- 6 monthly EOR&C reports to the PBRC via GRRMC.
At times, the RLT and risk committees may also request EOR&C to report on topics of operational risk such as Business Continuity Management and physical security. EOR&C may also choose or be requested to undertake a deep dive review or provide analysis on a particular emerging issue or theme. Findings are reported to the requestor and, if material, escalated through the Risk Governance structure.
Risk Mitigation through Insurance
A key strategy to mitigate the financial impacts of operational risk exposures at the NAB Group level is the NAB Group's insurance program. This NAB Group function maintains and monitors the NAB Group's insurance program within a defined risk appetite and ensures that it aligns with the NAB Group's current and projected operational risk exposures. The quantitative modelling and measurement of the NAB Group's operational risk profile forms a significant input into the design of the NAB Group's insurance cover.
The regulatory capital measure for operational risk does not include any adjustment for insurance.
Regulatory and Compliance Management
The NAB Group is committed to complying with all applicable laws, regulations, licences, codes and rules, and to building constructive regulatory relationships.
Accordingly, the NAB Group has in place dedicated frameworks, policies, standards and processes that are designed to ensure the effective management of regulatory and compliance obligations across the NAB Group.
InternalLoss Data
ScenarioAnalysis
Capital Model
Operational Risk
Capital
External Loss Data
Business Environment and Internal
Control FactorsCalculation Methodology• Combines the inputs to emphasise
the strengths of each data source• Internal loss data most relevant for
“body” of distribution and frequency of occurrence of loss events
• External data, Scenario Analysis and Business Environment and Internal Control Factors most relevant for extreme “tail” of loss distribution

Balance Sheet and Liquidity Risk
68
pillar 3 report
2015 9. Balance Sheet and Liquidity Risk
Balance Sheet and Liquidity Risk (BSLR) is primarily concerned with the management of various structural, non-traded market risks within the Level 2 Group’s balance sheet. Non-traded market risk arises from the Level 2 Group’s banking book activity and includes capital risk, non-traded equity risk, interest rate risk, funding risk (secured and unsecured), liquidity risk and foreign exchange risk.
Structure and Organisation
The Board approved risk appetite limits are outlined in the GBSLR Policy, ancillary Standards and Limits Schedule, which provide direction for the management, measurement, monitoring, oversight, reporting and governance of non-traded market risks. The PBRC approves the GBSLR Policy.
The PBRC and GRRMC receive regular reporting on balance sheet management activities, along with monthly reporting of non-traded market risk compliance and activity.
The GALCO and subsidiary ALCOs review risk management strategies, compliance with risk limits and controls and remedial action undertaken for limit breaches. They approve the GBSLR Standards and models relating to balance sheet and non-traded market risks.
With the exception of non-traded equity risk, the Level 2 Group and relevant subsidiary Treasuries are responsible for the management of non-traded market risks. For non-traded equity risk, individual business lines that have been allocated equity risk limits are responsible for managing their risk exposures.
GBSLR and subsidiary BSLR teams provide independent operational oversight over the non-traded market risk framework. GBSLR is the owner of the GBSLR Policy and ancillary Standards and oversees the operation of APRA approved models to meet regulatory requirements.
Further information on the management of GBSLR is included in the following sections of this report:
- section 4.1 Capital Adequacy - section 6.2 Level 2 Group Owned Securitised Assets - section 9.1 Funding and Liquidity Risk - section 9.2 Interest Rate Risk in the Banking Book - section 9.3 Equities Banking Book Position - section 9.4 Foreign Exchange Risk in the Banking
Book.

Balance Sheet and Liquidity Risk
69
pillar 3 report
2015 9.1 Funding and Liquidity Risk
Introduction
Liquidity risk is the risk of the Level 2 Group being unable to meet its financial obligations as they fall due. These obligations include:
- repayment of deposits - repayment of borrowings and loan capital as they
mature - payment of operating expenses and taxes - payment of dividends to shareholders - ability to fund the NAB Group’s strategic plan and
growth initiatives.
Funding risk is the risk which arises due to change in appetite and capacity of the market to provide adequate long-term and short-term funds to meet the Level 2 Group’s strategic plans and objectives at an acceptable cost. This includes the risk of over-reliance on any source of funding, which due to a lack of diversified funding sources jeopardises the Level 2 Group’s ability to raise funds at acceptable costs under adverse business conditions.
The objectives of the Level 2 Group in managing its funding and liquidity risks are:
- to ensure that the current and future payment obligations of the Level 2 Group are met as they become due
- to retain adequate liquidity buffers in the Level 2 Group and subsidiary balance sheets so as to withstand severe market and institutional disruptions
- to meet planned business funding needs over a three-year forward horizon
- to maintain access to global short-term and long-term debt capital markets and global secured funding markets consistent with the target credit ratings of the Level 2 Group and its subsidiaries
- to diversify funding sources in terms of maturity, currency, instrument, investor type, geographic region and by the issuing entity.
Management
Target funding indices are set by the GALCO at both the NAB Group and subsidiary levels, and communicated for approval by the Board in the annual Group Funding Plan. The target indices measure and monitor customer funding and wholesale term funding levels.
The Group Funding Plan outlines the Level 2 Group’s funding strategy and targets for a three-year period. In addition the plan outlines the key funding and liquidity metrics which Treasury manage towards, including a wholesale refinancing and cash flows days’ positive target.
The GBSLR Policy, Liquidity and Funding Standards and Group Limits Schedule detail the Board’s risk appetite
and guiding principles regarding liquidity and funding. In addition, they define the framework to ensure that the Level 2 Group can meet its current and future payment obligations as they become due under diverse operating scenarios and the framework to ensure that Level 2 Group and subsidiary balance sheet management practices do not introduce unacceptable levels of funding risk.
The NAB Group and relevant subsidiary Treasuries are responsible for managing funding and liquidity risk for the Level 2 Group. This includes the development and execution of liquidity and funding strategies consistent with the Group Funding Plan, mandates and limits in place.
The NAB Group and subsidiary BSLR teams are independent of Treasury and are responsible for liquidity and funding risk measurement and monitoring, developing and maintaining systems and models to support monitoring, and reporting of liquidity and funding compliance against limits.
Measurement
Liquidity risk is measured, managed and monitored on a cash flow basis, using scenario analysis, gap analysis and stress testing, and addresses all regulatory requirements. Key scenarios include going concern, offshore market closure and local market disruption.
Although managed on an individual currency basis, operational liquidity is measured and reported in accordance with cumulative cash flow mismatch limits. Mismatch limits are set for defined time buckets and scenarios. Concentration levels of funding sources, investor base and maturity terms are also monitored to avoid excessive concentration.
Monitoring and Reporting
Funding and liquidity risk are measured and monitored on a daily basis, with any non-compliance escalated to the GALCO and Group CRO. Monthly results are reported to Group and subsidiary ALCOs, GRRMC and PBRC. The NAB Group has clearly defined escalation procedures whereby liquidity events, both systemic and name specific, are monitored and appropriate actions outlined against triggers.
Regulatory Change
The Liquidity Coverage Ratio (LCR) is a key focus for the NAB Group, with compliance having been required from 1 January 2015. The LCR measures the liquidity required in a severe stress scenario over a 30-day period. Compliance with the LCR is in line with the Group Funding Plan, including the increase of liquid assets and ensuring sufficient available collateral to access the Reserve Bank of Australia’s (RBA) Committed Liquidity Facility (CLF).

Balance Sheet and Liquidity Risk
70
pillar 3 report
2015 9.2 Interest Rate Risk in the Banking Book
Introduction
Interest Rate Risk in the Banking Book (IRRBB) arises from changes in market interest rates that adversely impact the NAB Group’s financial condition in terms of earnings (net interest income) or economic value of the balance sheet. This includes:
- Repricing Risk, arising from changes to the overall level of interest rates and inherent mismatches in the repricing term of banking book items
- Yield Curve Risk, arising from a change in the relative level of interest rates for different tenors and changes in the slope or shape of the yield curve
- Basis Risk, arising from differences between the actual and expected interest margins on banking book items over the implied cost of funds of those items
- Optionality Risk, arising from the existence of stand-alone or embedded options in banking book items, to the extent that the potential for those losses is not included in the above risk types.
The objective of the NAB Group’s framework is to ensure that IRRBB is managed to optimise and stabilise the NAB Group’s economic value and earnings over an investment horizon.
Management
The Board approves the risk appetite for IRRBB, and sets the overall limits for VaR and Earnings at Risk (EaR).
The key elements of the management framework for IRRBB include:
- the GBSLR Policy and GBSLR IRRBB Standard define the compliance and management framework to ensure that all interest rate risk positions in the banking book are identified, measured, managed and reported, and are aligned to the requirements of Prudential Standard APS 117: Capital Adequacy: Interest Rate Risk in the Banking book
- the NAB Group and subsidiary Treasuries are responsible for managing the interest rate risk profile of the balance sheet in line with the approved risk appetite. This includes development and execution of interest rate risk management strategies
- Funds Transfer Pricing (FTP) is a mechanism in place to transfer interest rate risk out of originating business units and into the Treasury functions for the management of interest rate risk
- the NAB Group and subsidiary BSLR teams are responsible for IRRBB monitoring and oversight and are independent of Treasury. They maintain a risk framework for IRRBB and have responsibility for IRRBB measurement of exposures, compliance monitoring and reporting. The system and model for IRRBB measurement is managed by operations
- periodic reporting to management and governance committees of IRRBB exposures and compliance.
Measurement
The NAB Group has been accredited by APRA to use its internal model for the measurement of IRRBB. Interest rate risk is measured, managed and monitored using both
the economic valuation approach and the earnings approach.
The principal metrics used to measure and monitor IRRBB are as follows:
Measurement Definition
VaR The potential loss in economic value implied by
the static balance sheet that arises from
changes to the current yield curve based upon
historical observations for a given holding
period and confidence level.
EaR The potential loss in earnings implied by the
static balance sheet over a 12-month forecast
period, that arises from changes in the current
yield curve based on historical observations for
a given holding period and confidence level.
Market Value The present value of all known future cash
flows implied by the static balance sheet on
both a spot and historically cumulative basis.
Embedded Value
The economic gain or loss implied by the static
balance sheet which equates to the market
value less the book value, less accrued
interest.
Economic Value Sensitivity (EVS)
The potential impact of a one basis point
parallel decrease in interest rates on the
present value of all known future cash flows
implied by the static balance sheet.
Net Interest Income Sensitivity (NIIS)
The potential impact of a one basis point
parallel decrease in interest rates on the
earnings over a 12-month forecast period
implied by the static balance sheet.
VaR and EaR are measured with a three-month holding period and 99% confidence level for internal reporting purposes.
To complement these static measures, a series of stress tests are also modelled, measuring the impact of large parallel and non-parallel yield curve shocks.
The NAB Group incorporates behavioural modelling where contractual-based modelling is inappropriate for measuring IRRBB, such as for prepayments, non-bearing interest accounts, rate locks and CET1 Capital. Any changes to the assumptions require subsidiary ALCO or GALCO approval.
IRRBB regulatory capital includes a value for repricing and yield curve risk, basis risk, optionality risk and embedded value. The components of IRRBB regulatory capital are calculated using a historical VaR simulation using at least six years of historical data at a 99% confidence level, one-year investment term of capital, and a 12-month holding period.
Monitoring and Reporting
The IRRBB metrics are measured and monitored on a monthly basis as a minimum. Compliance with limits is reported to subsidiary ALCOs, GALCO, GRRMC and PBRC on a monthly basis. IRRBB regulatory capital is also calculated monthly.
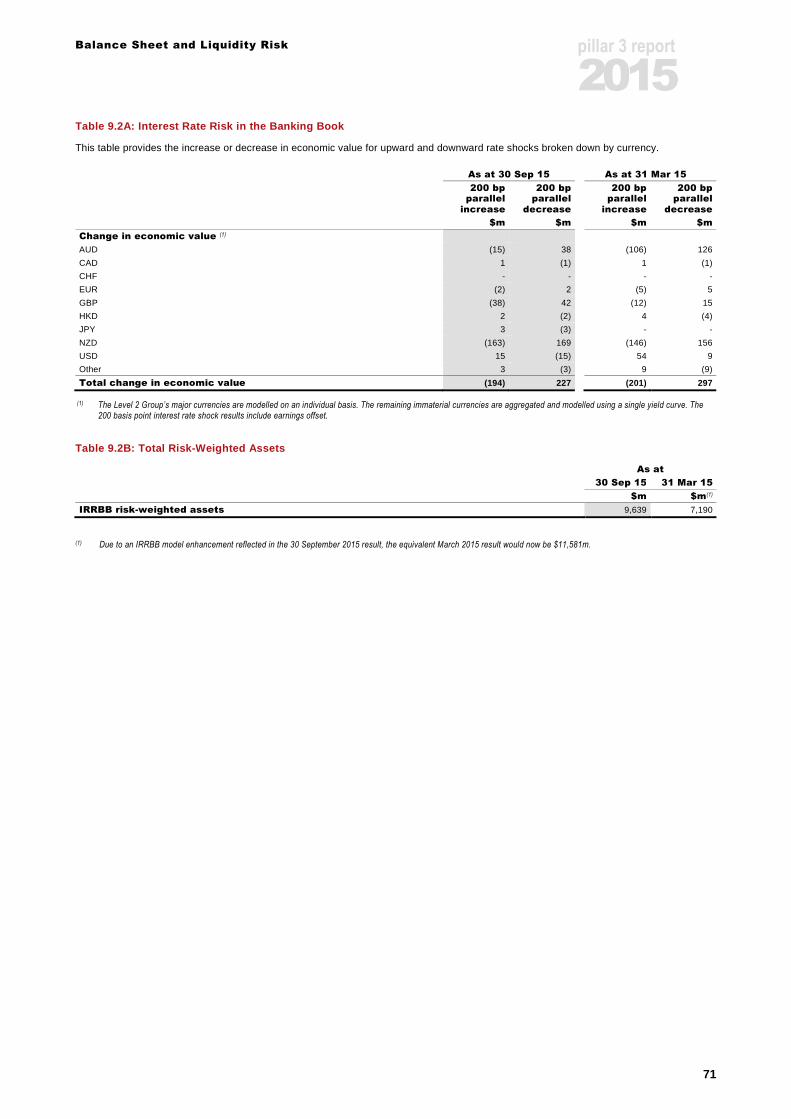
Balance Sheet and Liquidity Risk
71
pillar 3 report
2015 Table 9.2A: Interest Rate Risk in the Banking Book
This table provides the increase or decrease in economic value for upward and downward rate shocks broken down by currency. As at 30 Sep 15 As at 31 Mar 15
200 bp
parallel increase
200 bp parallel
decrease
200 bp parallel
increase
200 bp parallel
decrease
$m $m $m $m
Change in economic value (1)
AUD (15) 38 (106) 126
CAD 1 (1) 1 (1)
CHF - - - -
EUR (2) 2 (5) 5
GBP (38) 42 (12) 15
HKD 2 (2) 4 (4)
JPY 3 (3) - -
NZD (163) 169 (146) 156
USD 15 (15) 54 9
Other 3 (3) 9 (9)
Total change in economic value (194) 227 (201) 297
(1) The Level 2 Group’s major currencies are modelled on an individual basis. The remaining immaterial currencies are aggregated and modelled using a single yield curve. The 200 basis point interest rate shock results include earnings offset.
Table 9.2B: Total Risk-Weighted Assets
As at
30 Sep 15 31 Mar 15
$m $m(1)
IRRBB risk-weighted assets 9,639 7,190
(1) Due to an IRRBB model enhancement reflected in the 30 September 2015 result, the equivalent March 2015 result would now be $11,581m.

Balance Sheet and Liquidity Risk
72
pillar 3 report
2015 9.3 Equities Banking Book Position
Introduction
Non-traded equity risk refers to the direct loss that may be incurred as a result of reduction in the fair value of an equity investment in the NAB Group’s banking book. Fair value represents mark-to-market valuations derived from market prices or independent valuation and methodologies.
The objective of the NAB Group in managing non-traded equity risk is to protect the value of equity investments over the long term and to create value within an approved risk appetite. Key strategies include:
- strategic investments - capital gains - distressed debt management (e.g. Debt for Equity
swaps).
Management
Equity risk appetite limits are reflected in the Group Risk Appetite Statement and the Group Limits Schedule. The Equity Risk Standard defines the compliance and management framework in relation to undertaking, measurement, monitoring and reporting equity investments outside of the trading book. It applies to both direct equity investments and equity underwriting activities.
Business units with a non-traded equity risk limit are responsible for managing equity risk in line with the requirements of the non-traded equity risk framework. Business units and their risk committees are responsible for monitoring of, and compliance with, all material risks, and ensuring that all commercial and risk aspects of the transactions are addressed.
The GBSLR team is responsible for maintaining independent oversight of the non-traded equity risk framework, including independent review of proposed equity transactions for compliance under the equity risk delegated authority, oversight of the periodic valuation and impairment assessments of investments, and monitoring and reporting of equity investment against limits.
Measurement
Investment in equity instruments that are neither held for trading nor contingent consideration recognised by the NAB Group in a business combination to which AASB 3 ‘Business Combination’ applies, are measured at fair value through other comprehensive income, where an irrevocable election has been made by the management.
Amounts presented in other comprehensive income are not subsequently transferred to profit or loss. Dividends on such investments are recognised in profit or loss unless the dividend clearly represents a recovery of part of the cost of the investment.
Monitoring and Reporting
Monthly reports are provided to senior management and risk committees. The overall monitoring and reporting framework is shown below.
Monitoring and Reporting Framework
Bank Approved Framework & Risk Appetite
Motivation
Transact
StrategicInvestment
Capital Gains
Debt For Equity
Swaps
ValuationMethodology
Measure
ObservableMarketPrices
IndependentValuations
Model Derived
Estimates
Risk Framework
Monitor
RegionalFinance
RegionalDelegatedAuthority
RegionalRisk Function
GroupEconomic
Capital
GBSLR
Financial Accounting & Records
Deal Execution, Business Strategy & Risk Management
Operational Risk
Methodologies for ECap Measurement
Measurement & Compliance

Balance Sheet and Liquidity Risk
73
pillar 3 report
2015 Table 9.3A: Equities Banking Book Position
This table provides the value of investments disclosed in the balance sheet, as well as the fair value of those investments. As at 30 Sep 15 As at 31 Mar 15
Carrying
value (1) Fair value
(2)
Carrying value (1)
Fair value (2)
$m $m $m $m
Total listed equities (publicly traded) 38 39 29 28
Total unlisted equities 697 697 567 559
(1) Carrying value as recorded in the Balance Sheet, in accordance with accounting standards.
(2) The best evidence of fair value is quoted prices in an active market. If the market for a financial instrument is not active, fair value is established by using a valuation technique.
Table 9.3B: Gains and Losses on Equity Investments
This table provides the realised (actual) gains/losses arising from sales and liquidations in the six months to 30 September 2015 recognised through the profit and loss account. Unrealised (expected) gains/losses which were previously included in Tier 1 and Tier 2 capital represent gains/losses recognised in the balance sheet but not through the profit and loss account. 6 months ended
30 Sep 15 31 Mar 15
$m $m
Gains (losses) on equity investments
Cumulative realised gains (losses) in reporting period 1 9
Total unrealised gains (losses) 220 64
Total unrealised gains (losses) included in Common Equity Tier 1, Tier 1 and/or Tier 2 Capital
220 64
Disclosure 9.3C: Equity Investments Subject to Gran dfathering Provision
The Level 2 Group does not have any equity investments that are subject to grandfathering provisions.

Balance Sheet and Liquidity Risk
74
pillar 3 report
2015 9.4 Foreign Exchange Risk in the Banking Book
The NAB Group’s banking book has exposure to risk arising from currency movements as a result of participation in the global financial markets and international operations. Foreign Exchange Risk in the Banking Book (FXRBB) arises from both operating business activities and structural foreign exchange exposures from foreign investments and capital management activities. Currency movements can impact profit and loss, cash flows and the balance sheet.
The NAB Group’s objective in relation to foreign exchange risk is to protect the NAB Group’s capital ratio from the impact of currency movements, and to manage non-structural foreign exchange risk within risk appetite. The NAB Group’s main structural foreign exchange exposures are due to its investment in BNZ and Clydesdale.
The Board approves the risk appetite for FXRBB, setting the overall VaR limit. In addition, with guidance from the PBRC, it monitors and reviews the adequacy of the NAB Group’s foreign exchange risk compliance and management framework developed by management.
The key elements of the management framework for FXRBB include:
- the GBSLR Policy and FXRBB Standard define the compliance and management framework to ensure all foreign exchange positions (both structural and non-structural) in the banking book are identified, measured, managed and reported
- the NAB Group and subsidiary Treasuries are responsible for the development and execution of foreign exchange risk management strategies
- GBSLR and subsidiary BSLR teams provide independent oversight. They are responsible for monitoring and oversight to ensure FXRBB is managed in compliance with the Policy and requirements of the Standard
- periodic reporting to management and governance committees of FXRBB exposures and compliance.

Leverage Ratio Disclosures
75
pillar 3 report
2015 10. Leverage Ratio Disclosures
The leverage ratio table below has been prepared in accordance with APRA’s prudential standard APS110: Capital Adequacy (Attachment D). The Leverage Ratio is a non-risk based measure that uses exposures to supplement the risk-weighted assets based capital requirements. In summary, the leverage ratio is intended to:
• restrict the build-up of leverage in the banking sector to avoid destabilising deleveraging processes that can damage the broader financial system and the economy; and
• reinforce the risk-based requirements with a simple, transparent, non-risk based supplementary measure.
As at 30 September 2015 the leverage ratio for the Level 2 Group was 5.54%.
10.1 Leverage Ratio Disclosure Template
As at
30 Sep 15
$m
On-balance sheet exposures
1 On-balance sheet items (excluding derivatives and securities financing transactions (SFTs), but including collateral) 735,002
2 (Asset amounts deducted in determining Tier 1 capital) (12,626)
3 Total on-balance sheet exposures (excluding deriva tives and SFTs) (sum of rows 1 and 2) 722,376
Derivative exposures
4 Replacement cost associated with all derivatives transactions (i.e. net of eligible cash variation margin) 31,805
5 Add-on amounts for potential future credit exposure (PFCE) associated with all derivatives transactions 19,009
6 Gross-up for derivatives collateral provided where deducted from the balance sheet assets pursuant to the Australian Accounting Standards
-
7 (Deductions of receivables assets for cash variation margin provided in derivatives transactions) (2,377)
8 (Exempted central counterparty (CCP) leg of client-cleared trade exposures) -
9 Adjusted effective notional amount of written credit derivatives 17,926
10 (Adjusted effective notional offsets and add-on deductions for written credit derivatives) (16,574)
11 Total derivative exposures (sum of rows 4 to 10) 49,789
SFT exposures
12 Gross SFT assets (with no recognition of netting), after adjusting for sales accounting transactions 67,055
13 (Netted amounts of cash payables and cash receivables of gross SFT assets) (29,224)
14 CCR exposure for SFT assets 1,779
15 Agent transaction exposures -
16 Total SFT exposures (sum of rows 12 to 15) 39,610
Other Off-balance sheet exposures
17 Off-balance sheet exposure at gross notional amount 161,930
18 (Adjustments for conversion to credit equivalent amounts) (75,940)
19 Other off-balance sheet exposures (sum of rows 17 and 18) 85,990
Capital and total exposures
20 Tier 1 Capital 49,743
21 Total exposures (sum of rows 3, 11, 16 and 19) 897,765
Leverage ratio %
22 Leverage ratio 5.54%
10.2 Summary comparison of accounting assets vs leverage ratio exposure measure
As at
30 Sep 15
$m
Items
1 Total consolidated assets as per published financial statements 955,052
2 Adjustment for investments in banking, financial, insurance or commercial entities that are consolidated for accounting purposes but outside the scope of regulatory consolidation
(90,275)
3 Adjustment for assets held on the balance sheet in a fiduciary capacity pursuant to the Australian Accounting Standards but excluded from the leverage ratio exposure measure
-
4 Adjustments for derivative financial instruments (42,155)
5 Adjustment for SFTs (i.e. repos and similar secured lending) 1,779
6 Adjustment for off-balance sheet exposures (i.e. conversion to credit equivalent amounts of off-balance sheet exposures) 85,990
7 Other adjustments (12,626)
8 Leverage ratio exposure 897,765

Liquidity Coverage Ratio
76
pillar 3 report
2015 11. Liquidity Coverage Ratio Disclosures
The Liquidity Coverage Ratio (LCR) is a metric that measures the adequacy of High Quality Liquid Assets (HQLA) available to meet net cash outflows (NCO) over a 30-day period during a severe liquidity stress scenario. The APRA minimum coverage level is 100% for both Level 2 NAB Group and NAB Ltd from 1 January 2015. The Group LCR for the quarter ended 30 September 2015 is presented in the following table using the Basel standard disclosure template and is based on a simple average of daily LCR outcomes excluding weekends (66 data points).
11.1 Liquidity Coverage Ratio Disclosure Template
As at
30 Sep 15
Total unweighted
value (average)
Total weighted
value (average)
A$m(1), (3), (4) A$m(3), (4)
Liquid assets, of which: 150,208
1 High-quality liquid assets (HQLA)(2) n/a 93,465
2 Alternative liquid assets (ALA) n/a 54,277
3 Reserve Bank of New Zealand (RBNZ) securities(2) n/a 2,466
Cash outflows
4 Retail deposits and deposits from small business customers, of which: 186,651 19,764
5 stable deposits 58,995 2,959
6 less stable deposits 127,656 16,805
7 Unsecured wholesale funding, of which: 142,768 89,912
8 operational deposits (all counterparties) and deposits in networks for cooperative banks 20,193 5,048
9 non-operational deposits (all counterparties) 101,294 63,503
10 unsecured debt 21,281 21,361
11 Secured wholesale funding n/a 6,388
12 Additional requirements, of which 148,406 30,727
13 outflows related to derivatives exposures and other collateral requirements 18,162 18,162
14 outflows related to loss of funding on debt products - -
15 credit and liquidity facilities 130,244 12,565
16 Other contractual funding obligations 2,870 1,941
17 Other contingent funding obligations 107,223 6,880
18 Total cash outflows n/a 155,612
Cash inflows
19 Secured lending (e.g. reverse repos) 58,471 5,001
20 Inflows from fully performing exposures 29,453 16,966
21 Other cash inflows 3,067 3,067
22 Total cash inflows 90,991 25,034
23 Total liquid assets
Total adjusted
value
150,208
24 Total net cash outflows 130,578
25 Liquidity Coverage Ratio (%) 115%
(1) Unweighted inflow and outflow values are outstanding balances maturing or callable within 30 days.
(2) Weighted values are calculated after applying caps to the amount of liquid assets included from subsidiaries.
(3) Values relating to Great Western Bank have been included up to the date of divestment 3 August 2015.
(4) This is the first disclosure of LCR. Future disclosures will include quarterly average comparative data.

Liquidity Coverage Ratio
77
pillar 3 report
2015 The NAB Group maintains well diversified and high quality liquid asset portfolios to support regulatory and internal requirements in the various countries in which it operates.
Average liquid assets for the quarter were $150.2 billion of which HQLA comprised $93.4 billion. The HQLA consists primarily of Level 1 assets which include cash, deposits with Central Banks, Australian Semi Government and Commonwealth Government securities and securities issued by foreign sovereigns. Alternative Liquid Assets (ALA) relate to the Committed Liquidity Facility (CLF) provided by the Reserve Bank of Australia (RBA). HQLA held in subsidiaries (Bank of New Zealand and Clydesdale Bank) which is excess to meeting an LCR of 115% is excluded reflecting liquidity portability considerations. This amount excluded was on average $3.5 billion during the quarter to 30 September 2015.
The CLF value used in the LCR calculation is the lesser of the undrawn portion of the facility granted to the NAB Group and the value of the collateral the NAB Group chooses to hold at any given time to support the facility and its liquidity requirements. This collateral is a combination of internal Residential Mortgage Backed Securities (RMBS) and other RBA repo eligible securities including bank bills and third party RMBS. The drawn portion of the CLF relates to accounts held with the RBA for the settlement of payment obligations. The NAB Group has an available CLF of $59 billion during the period 1 January 2015 to 31 December 2015, and has been allocated a CLF in line with requirements for the 2016 calendar year.
LCR NCO represents the net cash flows that could potentially occur from on and off balance sheet activities within a 30 day severe liquidity stress scenario. The cash flows are calculated by applying APRA prescribed run-off factors to maturing debt and deposits and inflow factors to assets. High run-off factors are applied to sophisticated investors and depositors including long term and short term debt holders, financial institution and corporate depositors. Lower run off factors are applied to deposits less likely to be withdrawn in a period of severe stress. These include deposits from natural persons and small medium enterprises and deposits from corporate and financial institutions which are considered to be operational in nature. NAB conducts an annual review of its interpretation of the LCR definitions.
Cash outflows arising from business activities that create contingent funding and collateral requirements such as repo funding and derivatives and the extension of credit and liquidity facilities to customers are also captured within the LCR calculation along with an allowance for debt buyback requests.
The NAB Group manages its LCR position daily within a target range that reflects management risk appetite across the legal entity structure, major currencies and jurisdictions in which business activities are undertaken.

Detailed Capital Disclosures
78
pillar 3 report
2015
12. Detailed Capital Disclosures
12.1 Common Disclosure Template – Regulatory Capital
This table provides the post 1 January 2018 Basel III common disclosure requirements for APS 330 (Attachment A). Regulatory adjustments under Basel III are disclosed in full as implemented by APRA. The capital conservation buffer and any countercyclical buffer requirements referred to in rows 64 to 67 will formally apply from 1 January 2016. Furthermore, an additional CET1 capital buffer of 1% will also become effective from 1 January 2016 as an extension to the capital conservation buffer as the NAB Group is categorised as a Domestic Systemically Important Bank. The information contained within the table below should be read in conjunction with section 12.2 Regulatory Balance Sheet and section 12.3 Reconciliation between the Common Disclosure Template and the Level 2 Regulatory Balance Sheet.
As at
30 Sep 15
$m
Common Equity Tier 1 Capital: instruments and reserves
1 Directly issued qualifying ordinary shares (and equivalent for mutually-owned entities) capital 33,087
2 Retained earnings 20,968
3 Accumulated other comprehensive income (and other reserves) (493)
4 Directly issued capital subject to phase out from CET1 (only applicable to mutually-owned companies) -
5 Ordinary share capital issued by subsidiaries and held by third parties (amount allowed in group CET1) -
6 Common Equity Tier 1 Capital before regulatory adjustments 53,562
Common Equity Tier 1 Capital: regulatory adjustments
7 Prudential valuation adjustments 1
8 Goodwill (net of related tax liability) 4,423
9 Other intangibles other than mortgage-servicing rights (net of related tax liability) 2,716
10 Deferred tax assets that rely on future profitability excluding those arising from temporary differences (net of related tax liability) -
11 Cash-flow hedge reserve 112
12 Shortfall of provisions to expected losses -
13 Securitisation gain on sale (as set out in paragraph 562 of Basel II framework) -
14 Gains and losses due to changes in own credit risk on fair valued liabilities (98)
15 Defined benefit superannuation fund net assets 131
16 Investments in own shares (if not already netted off paid-in capital on reported balance sheet) -
17 Reciprocal cross-holdings in common equity -
18 Investments in the capital of banking, financial and insurance entities that are outside the scope of regulatory consolidation, net of eligible short positions, where the ADI does not own more than 10% of the issued share capital (amount above 10% threshold)
-
19 Significant investments in the ordinary shares of banking, financial and insurance entities that are outside the scope of regulatory consolidation, net of eligible short positions (amount above 10% threshold)
-
20 Mortgage service rights (amount above 10% threshold) -
21 Deferred tax assets arising from temporary differences (amount above 10% threshold, net of related tax liability) -
22 Amount exceeding the 15% threshold -
23 of which: significant investments in the ordinary shares of financial entities -
24 of which: mortgage servicing rights -
25 of which: deferred tax assets arising from temporary differences -
APRA specific regulatory adjustments
26 National specific regulatory adjustments (sum of rows 26a, 26b, 26c, 26d, 26e, 26f, 26g, 26h, 26i and 26j) 5,340
26a of which: treasury shares (7)
26b of which: offset to dividends declared under a dividend reinvestment plan (DRP), to the extent that the dividends are used to purchase new ordinary shares issued by the ADI
-
26c of which: deferred fee income -
26d of which: equity investments in financial institutions not reported in rows 18, 19 and 23 2,362
26e of which: deferred tax assets not reported in rows 10, 21 and 25 2,049
26f of which: capitalised expenses 310
26g of which: investments in commercial (non-financial) entities that are deducted under APRA prudential requirements 26
26h of which: covered bonds in excess of asset cover in pools -
26i of which: undercapitalisation of a non-consolidated subsidiary -
26j of which: other national specific regulatory adjustments not reported in rows 26a to 26i 600
27 Regulatory adjustments applied to Common Equity Tier 1 due to insufficient Additional Tier 1 and Tier 2 to cover deductions -
28 Total regulatory adjustments to Common Equity Tier 1 12,625
29 Common Equity Tier 1 Capital (CET1) 40,937

Detailed Capital Disclosures
79
pillar 3 report
2015
As at
30 Sep 15
$m
Additional Tier 1 Capital: instruments
30 Directly issued qualifying Additional Tier 1 instruments 4,574
31 of which: classified as equity under applicable accounting standards -
32 of which: classified as liabilities under applicable accounting standards 4,574
33 Directly issued capital instruments subject to phase out from Additional Tier 1 4,240
34 Additional Tier 1 instruments (and CET1 instruments not included in row 5) issued by subsidiaries and held by third parties (amount allowed in group AT1)
-
35 of which: instruments issued by subsidiaries subject to phase out -
36 Additional Tier 1 Capital before regulatory adjustments 8,814
Additional Tier 1 Capital: regulatory adjustments
37 Investments in own Additional Tier 1 instruments -
38 Reciprocal cross-holdings in Additional Tier 1 instruments -
39 Investments in the capital of banking, financial and insurance entities that are outside the scope of regulatory consolidation, net of eligible short positions, where the ADI does not own more than 10% of the issued share capital (amount above 10% threshold)
-
40 Significant investments in the capital of banking, financial and insurance entities that are outside the scope of regulatory consolidation (net of eligible short positions)
-
41 National specific regulatory adjustments (sum of rows 41a, 41b and 41c) 8
41a of which: holdings of capital instruments in group members by other group members on behalf of third parties -
41b of which: investments in the capital of financial institutions that are outside the scope of regulatory consolidations not reported in rows 39 and 40
8
41c of which: other national specific regulatory adjustments not reported in rows 41a and 41b -
42 Regulatory adjustments applied to Additional Tier 1 due to insufficient Tier 2 to cover deductions -
43 Total regulatory adjustments to Additional Tier 1 Capital 8
44 Additional Tier 1 Capital (AT1) 8,806
45 Tier 1 Capital (T1 = CET1 + AT1) 49,743
Tier 2 Capital: instruments and provisions
46 Directly issued qualifying Tier 2 instruments 2,302
47 Directly issued capital instruments subject to phase out from Tier 2 3,935
48 Tier 2 instruments (and CET1 and AT1 instruments not included in rows 5 or 34) issued by subsidiaries and held by third parties (amount allowed in group T2)
-
49 of which: instruments issued by subsidiaries subject to phase out -
50 Provisions 651
51 Tier 2 Capital before regulatory adjustments 6,888
Tier 2 Capital: regulatory adjustments
52 Investments in own Tier 2 instruments 75
53 Reciprocal cross-holdings in Tier 2 instruments -
54 Investments in the capital of banking, financial and insurance entities that are outside the scope of regulatory consolidation, net of eligible short positions, where the ADI does not own more than 10% of the issued share capital (amount above 10% threshold)
-
55 Significant investments in the capital banking, financial and insurance entities that are outside the scope of regulatory consolidation (net of eligible short positions)
-
56 National specific regulatory adjustments (sum of rows 56a, 56b and 56c) 6
56a of which: holdings of capital instruments in group members by other group members on behalf of third parties -
56b of which: investments in the capital of financial institutions that are outside the scope of regulatory consolidation not reported in rows 54 and 55
6
56c of which: other national specific regulatory adjustments not reported in rows 56a and 56b -
57 Total regulatory adjustments to Tier 2 Capital 81
58 Tier 2 Capital (T2) 6,807
59 Total Capital (TC = T1 + T2) 56,550
60 Total risk weighted assets based on APRA standards 399,758
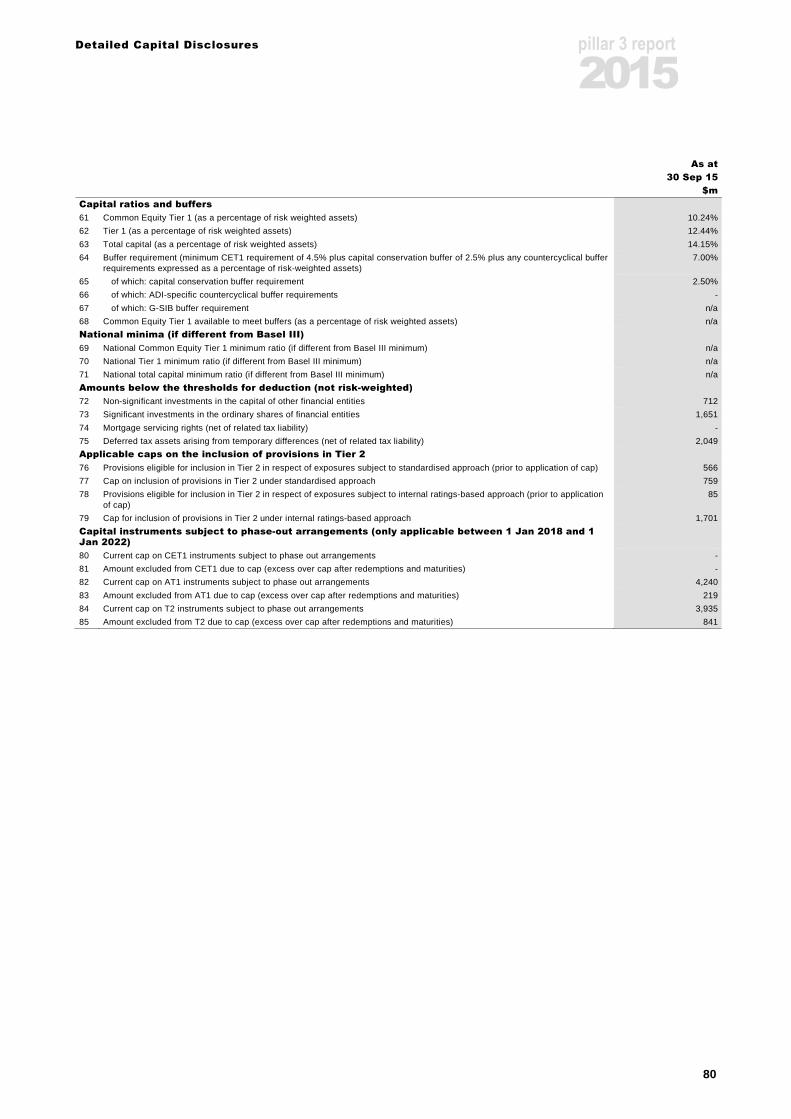
Detailed Capital Disclosures
80
pillar 3 report
2015
As at
30 Sep 15
$m
Capital ratios and buffers
61 Common Equity Tier 1 (as a percentage of risk weighted assets) 10.24%
62 Tier 1 (as a percentage of risk weighted assets) 12.44%
63 Total capital (as a percentage of risk weighted assets) 14.15%
64 Buffer requirement (minimum CET1 requirement of 4.5% plus capital conservation buffer of 2.5% plus any countercyclical buffer requirements expressed as a percentage of risk-weighted assets)
7.00%
65 of which: capital conservation buffer requirement 2.50%
66 of which: ADI-specific countercyclical buffer requirements -
67 of which: G-SIB buffer requirement n/a
68 Common Equity Tier 1 available to meet buffers (as a percentage of risk weighted assets) n/a
National minima (if different from Basel III)
69 National Common Equity Tier 1 minimum ratio (if different from Basel III minimum) n/a
70 National Tier 1 minimum ratio (if different from Basel III minimum) n/a
71 National total capital minimum ratio (if different from Basel III minimum) n/a
Amounts below the thresholds for deduction (not risk-weighted)
72 Non-significant investments in the capital of other financial entities 712
73 Significant investments in the ordinary shares of financial entities 1,651
74 Mortgage servicing rights (net of related tax liability) -
75 Deferred tax assets arising from temporary differences (net of related tax liability) 2,049
Applicable caps on the inclusion of provisions in Tier 2
76 Provisions eligible for inclusion in Tier 2 in respect of exposures subject to standardised approach (prior to application of cap) 566
77 Cap on inclusion of provisions in Tier 2 under standardised approach 759
78 Provisions eligible for inclusion in Tier 2 in respect of exposures subject to internal ratings-based approach (prior to application of cap)
85
79 Cap for inclusion of provisions in Tier 2 under internal ratings-based approach 1,701
Capital instruments subject to phase-out arrangements (only applicable between 1 Jan 2018 and 1 Jan 2022)
80 Current cap on CET1 instruments subject to phase out arrangements -
81 Amount excluded from CET1 due to cap (excess over cap after redemptions and maturities) -
82 Current cap on AT1 instruments subject to phase out arrangements 4,240
83 Amount excluded from AT1 due to cap (excess over cap after redemptions and maturities) 219
84 Current cap on T2 instruments subject to phase out arrangements 3,935
85 Amount excluded from T2 due to cap (excess over cap after redemptions and maturities) 841

Detailed Capital Disclosures
81
pillar 3 report
2015
12.2 Level 2 Regulatory Balance Sheet
The table shows the NAB Group’s Balance Sheet and the Level 2 Regulatory Balance Sheet. Level 2
NAB Group Regulatory
Balance Balance
Sheet Sheet Template
As at As at Reference /
30 Sep 15 Adjustments 30 Sep 15 Reconciliation
$m $m $m Table
Assets
Cash and liquid assets 30,934 (3,094) 27,840
Due from other banks 50,595 (3) 50,592
Trading derivatives 78,384 1,964 80,348
Trading securities 42,937 - 42,937
Investments relating to life insurance business 89,350 (89,350) -
Other financial assets at fair value 29,696 (7) 29,689
Hedging derivatives 11,599 - 11,599
Debt instruments at fair value through other comprehensive income 45,189 - 45,189
Loans and advances 532,784 (45) 532,739
Due from customers on acceptances 19,437 - 19,437
Property, plant and equipment 1,741 (6) 1,735
Goodwill and other intangible assets 7,347 (4,238) 3,109 Table A
Deferred tax assets 2,141 (928) 1,213
Investment in non-consolidated entities - 5,681 5,681 Table A
Due from controlled entities - 1,233 1,233
Other assets 12,918 (1,482) 11,436
Total assets 955,052 (90,275) 864,777
Liabilities
Due to other banks 54,405 (220) 54,185
Trading derivatives 74,442 1 74,443
Other financial liabilities at fair value 30,046 - 30,046
of which:
Change in own credit worthiness 98 - 98 Row 14
Hedging derivatives 4,539 (3) 4,536
Deposits and other borrowings 489,010 10 489,020
Liability on acceptances - - -
Life policy liabilities 76,311 (76,311) -
Current tax liabilities 1,114 (6) 1,108
Provisions 3,575 (310) 3,265
Bonds, notes and subordinated debt 130,518 (2,627) 127,891
Other debt issues 6,292 - 6,292
External unitholders’ liability 14,520 (14,520) -
Deferred tax liabilities - (991) (991)
Due to controlled entities - 431 431
Other liabilities 14,767 2,841 17,608
Total liabilities 899,539 (91,705) 807,834
Net assets 55,513 1,430 56,943

Detailed Capital Disclosures
82
pillar 3 report
2015
Level 2
NAB Group Regulatory
Balance Balance
Sheet Sheet Template
As at As at Reference /
30 Sep 15 Adjustments 30 Sep 15 Reconciliation
$m $m $m Table
Equity
Issues and paid-up ordinary share capital 31,334 1,753 33,087 Row 1
Other contributed equity 3,317 - 3,317
Contributed equity 34,651 1,753 36,404
General reserve for credit losses 64 - 64
Asset revaluation reserve 75 - 75
Foreign currency translation reserve (1,091) (68) (1,159)
Cash flow hedge reserve 110 2 112 Row 11
Equity-based compensation reserve 204 - 204
Debts instruments at fair value through other comprehensive income reserve 56 - 56
Equity instruments at fair value through other comprehensive income reserve 220 (1) 219
Other reserves (426) (67) (493) Row 3
Reserves (362) (67) (429)
Retained profits 21,205 (237) 20,968 Row 2
Total equity (parent entity interest) 55,494 1,449 56,943
Non-controlling interest in controlled entities 19 (19) -
Total equity 55,513 1,430 56,943

Detailed Capital Disclosures
83
pillar 3 report
2015
12.3 Reconciliation between the Common Disclosure Template and Level 2 Regulatory Balance Sheet
As at
30 Sep 15 Template
Table A $m Reference
Goodwill and other intangible assets 3,109
Investment in non-consolidated entities 5,681
Total 8,790
Less
DTL for other intangible assets 1
Goodwill (net of related tax liability) 4,423 Row 8
Other intangibles other than mortgage-servicing rights (net of related tax liability) 2,716 Row 9
Net tangible assets of investment in non-consolidated entities 1,650
Add
Insignificant equity investment in financial institutions 712
Total equity investment in financial institutions 2,362 Row 26d

Detailed Capital Disclosures
84
pillar 3 report
2015
12.4 Material Entities Excluded from Level 2 Regulatory Balance Sheet
Table 12.4A: Insurance and Fund Management Entities
As at 30 Sep 15
Total Assets Total Liabilities
$m $m
National Wealth Management Holdings Limited 8,513 1,506
National Australia Financial Management Limited 5,914 6
MLC Holdings Limited 3,341 - MLC Investments Limited 104 51
MLC Limited 79,911 77,725
Table 12.4B: Securitisation Entities
As at 30 Sep 15
Total Assets Total Liabilities
$m $m
Titan NZ (MRP Bonds) Trust 227 227
Titan NZ Funding Trust 228 228

Remuneration
85
pillar 3 report
2015 13. Remuneration
The NAB Group provides detailed information specific to senior executive remuneration in the Remuneration Report section of NAB’s 2015 Annual Financial Report available online at www.nab.com.au.
This disclosure relates to senior managers and material risk takers of the Level 2 Group, for the financial year ended 30 September 2015 (referred to as 2015 throughout this report).
Individuals within this disclosure have been identified consistent with the definitions provided in paragraph 21 of APS 330 and paragraph 59(a) and (c) of Prudential Standard CPS 510 Governance (CPS 510).
Number of individuals(1)
Definition
Senior Managers
24 Members of the NAB Group Executive Leadership Team (ELT), senior managers who are members of the NAB GRRMC and business line Chief Risk Officers.
Material Risk Takers
27 Executives of the NAB Group who can substantially impact the financial performance and capital position of the Level 2 Group.
(1) There were 24 senior managers and 23 material risk takers identified for the 2014 disclosure.
13.1 Remuneration Governance
The Remuneration Committee (the Committee) has been established by the Board. Its Charter (which is approved by the Board) sets out the membership, responsibilities, authority and activities of the Committee. The full Charter is available online at www.nab.com.au. Information on the governance, operations and activities of the Committee are detailed in the Corporate Governance section of NAB’s 2015 Annual Financial Report available online at www.nab.com.au.
As at the date of this report, the Committee was comprised of four independent non-executive directors (including the Chairman of the Committee). The Committee met 13 times during 2015.
The Committee Chairman receives an annual fee of $55,000 and other members of the Committee receive an annual fee of $25,000 for membership of the Committee. The member fee will increase to $27,500 from 1 January 2016.
Use of External Advisers
Where appropriate, the Committee seeks and considers advice directly from external advisers, who are independent of management.
The Committee retained 3 degrees consulting to review and provide recommendations and advice on remuneration and governance matters.
Scope of the Remuneration Policy
The NAB Group operates a global remuneration policy (the Policy) that applies to NAB and all its controlled entities. The Policy covers all employees, including senior managers and material risk takers. The NAB Group’s overall philosophy is to adopt, where possible, a methodology, which links remuneration directly to the performance and behaviour of an employee, the NAB Group’s results and shareholder outcomes.
13.2 Remuneration Processes Remuneration Policy
The NAB Group’s Policy uses a range of components to focus employees on achieving the NAB Group’s strategy and business objectives. The Policy is designed to:
− attract, recognise, motivate and retain high performers
− drive employee performance − align the interests of employees and shareholders
through ownership of NAB securities − comply with jurisdictional remuneration regulations
and the NAB Group’s diversity, inclusion and pay equity commitments.
Reward consists of both fixed and variable components:
− fixed remuneration provided as cash and benefits (including employer superannuation)
− short-term incentive (STI) reflecting both individual and business performance for the current year that supports the longer-term strategy of the NAB Group
− long-term incentive (LTI) reflecting the longer-term business performance of the NAB Group.
The mix of fixed and variable reward is balanced to ensure that fixed remuneration provides a sufficient level of remuneration so that the variable reward components (STI and LTI) can be fully flexible, including the possibility of paying no variable reward.
The remuneration mix at target is based on market information and practices. In any year, the actual mix may vary from target, given the overlay of business performance and individual performance.
Individual target reward must be approved by the Board for the ELT and any other senior executives of the NAB Group (as determined by the Board).
In addition, the Board will approve and monitor the remuneration framework for senior managers and material risk takers. Individual target reward for other senior managers and material risk takers is approved by the appropriate senior manager in line with the Policy.
More details on STI and LTI arrangements are provided in Section 13.4 Linking Performance and Remuneration and Section 13.5 Adjusting Remuneration for Longer-Term Performance.

Remuneration
86
pillar 3 report
2015 Other features of the Policy
Malus The Board has absolute discretion, subject to compliance with the law, to adjust any STI reward, LTI award and other performance-based components of remuneration downwards, or to zero, to protect the financial soundness of the NAB Group. In addition, the Board may vary vesting of deferred incentives and long-term incentives if the NAB Group’s financial performance or risk management have significantly deteriorated over the vesting period. A qualitative overlay may be applied that reflects the NAB Group’s management of business risks, shareholder expectations and the quality of the financial results.
This discretion can be applied at any time and may impact unvested equity awards and performance-based rewards yet to be awarded, whether in cash or equity. In exercising its discretion, the Board will consider whether the rewards are appropriate given later individual or business performance. Malus may apply to any employees across the NAB Group, by division, by role and/or employee, depending on circumstances.
Clawback
In the UK, from 1 January 2015, variable reward for some UK Material Risk Takers, including retention awards, is subject to clawback for up to 7 years from the award date.
The UK employee will be required to repay, up to the full amount, any performance-based reward, where the Board (in its absolute discretion) determines that one or more of the following circumstances have arisen before the seventh anniversary of the reward:
- the employee has participated in, or was responsible for, conduct which resulted in significant losses to the NAB Group or relevant business
- the employee has failed to meet appropriate standards of fitness and propriety
- the NAB Group has reasonable evidence of employee misbehaviour or material error
- the NAB Group or the relevant business suffered a material failure of risk management, taking into account the employee’s level of responsibility.
Minimum shareholding policy Members of the ELT are required to accumulate and retain NAB equity over a five year period from commencement in an ELT role, to the value of two times fixed remuneration for the Group CEO and Managing Director and one times fixed remuneration for other senior executives.
Details of senior executive shareholdings in NAB are set out in NAB’s 2015 Annual Financial Report available online at www.nab.com.au.
Commencement, retention and guaranteed incentives Commencement awards enable buy-out of unvested equity from previous employment. The amount, timing and performance hurdles relevant to any such awards are based on satisfactory evidence. The awards are primarily provided in the form of shares or performance rights, subject to performance hurdles, restrictions and certain forfeiture conditions, including forfeiture on resignation, unique to each offer. Guaranteed incentives or bonuses
do not support the NAB Group’s performance-based culture and are not provided as part of the Policy.
The NAB Group provides retention awards for key employees in roles where retention is critical over a medium-term timeframe (generally two to three years). These are normally provided in the form of shares or performance rights, subject to a restriction period, achievement of individual performance standards and forfeiture conditions, including forfeiture on resignation.
Remuneration policy review
The Committee reviewed the Policy during 2015 to:
− reflect changes agreed as a result of the NAB Group’s 2014 Enterprise Agreement
− capture enhancements to the NAB Group’s reward framework
− reflect the NAB Group’s commitment to pay equity − introduce a ‘Clawback’ policy for UK Material Risk
Takers in line with UK regulatory requirements.
Risk and Financial Control Employees
Risk and financial control employees (as defined in paragraph 59(b) of CPS 510) are critical to effective management of risk across the NAB Group.
Independence from the business for these employees is assured through:
− setting the reward mix so that variable reward is not significant enough to encourage inappropriate behaviours while remaining competitive with the external market
− the Risk or Finance function determining remuneration decisions, and not the business the employees support
− performance measures and targets set align with the NAB Group and/or are specific to the function
− NAB Group performance and / or function performance being a key component for calculating employee incentive payments.
The Committee reviews remuneration structures for these employees and oversees the overall reward outcomes for employees in these roles at least annually.
13.3 Remuneration and Risk
Risk exists in every aspect of the business and throughout the NAB Group’s operating environment. The NAB Group identifies and manages its risks as part of a Group-wide risk management framework. The risk management framework supports the successful implementation of the NAB Group’s strategies and allows the NAB Group to run a sustainable, resilient business that is responsive to its changing environment. The NAB Group’s remuneration strategy, reward framework, policies and practices are designed to support the risk management framework and ensure employees are taking the right risk, with the right controls for the right return.
The NAB Group regularly assesses risks and controls, and undertakes stress testing and scenario analysis. Assessing the risk profile aims to identify and understand the drivers of change, so that appropriate action can be taken to manage risk positions, within the Board approved risk appetite.
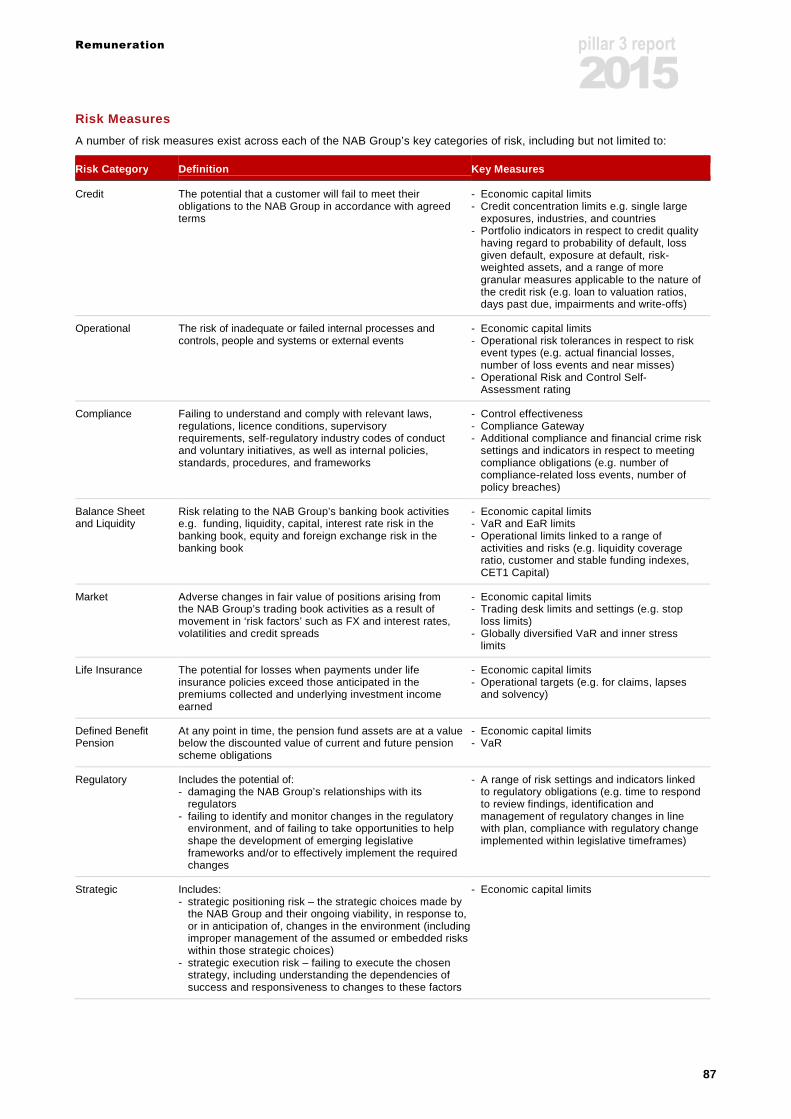
Remuneration
87
pillar 3 report
2015 Risk Measures
A number of risk measures exist across each of the NAB Group’s key categories of risk, including but not limited to:
Risk Category Definition Key Measures
Credit The potential that a customer will fail to meet their obligations to the NAB Group in accordance with agreed terms
- Economic capital limits - Credit concentration limits e.g. single large
exposures, industries, and countries - Portfolio indicators in respect to credit quality
having regard to probability of default, loss given default, exposure at default, risk-weighted assets, and a range of more granular measures applicable to the nature of the credit risk (e.g. loan to valuation ratios, days past due, impairments and write-offs)
Operational The risk of inadequate or failed internal processes and controls, people and systems or external events
- Economic capital limits - Operational risk tolerances in respect to risk
event types (e.g. actual financial losses, number of loss events and near misses)
- Operational Risk and Control Self-Assessment rating
Compliance Failing to understand and comply with relevant laws, regulations, licence conditions, supervisory requirements, self-regulatory industry codes of conduct and voluntary initiatives, as well as internal policies, standards, procedures, and frameworks
- Control effectiveness - Compliance Gateway - Additional compliance and financial crime risk
settings and indicators in respect to meeting compliance obligations (e.g. number of compliance-related loss events, number of policy breaches)
Balance Sheet and Liquidity
Risk relating to the NAB Group’s banking book activities e.g. funding, liquidity, capital, interest rate risk in the banking book, equity and foreign exchange risk in the banking book
- Economic capital limits - VaR and EaR limits - Operational limits linked to a range of
activities and risks (e.g. liquidity coverage ratio, customer and stable funding indexes, CET1 Capital)
Market Adverse changes in fair value of positions arising from the NAB Group’s trading book activities as a result of movement in ‘risk factors’ such as FX and interest rates, volatilities and credit spreads
- Economic capital limits - Trading desk limits and settings (e.g. stop
loss limits) - Globally diversified VaR and inner stress
limits
Life Insurance The potential for losses when payments under life insurance policies exceed those anticipated in the premiums collected and underlying investment income earned
- Economic capital limits - Operational targets (e.g. for claims, lapses
and solvency)
Defined Benefit Pension
At any point in time, the pension fund assets are at a value below the discounted value of current and future pension scheme obligations
- Economic capital limits - VaR
Regulatory Includes the potential of: - damaging the NAB Group’s relationships with its
regulators - failing to identify and monitor changes in the regulatory
environment, and of failing to take opportunities to help shape the development of emerging legislative frameworks and/or to effectively implement the required changes
- A range of risk settings and indicators linked to regulatory obligations (e.g. time to respond to review findings, identification and management of regulatory changes in line with plan, compliance with regulatory change implemented within legislative timeframes)
Strategic Includes: - strategic positioning risk – the strategic choices made by
the NAB Group and their ongoing viability, in response to, or in anticipation of, changes in the environment (including improper management of the assumed or embedded risks within those strategic choices)
- strategic execution risk – failing to execute the chosen strategy, including understanding the dependencies of success and responsiveness to changes to these factors
- Economic capital limits

Remuneration
88
pillar 3 report
2015 Aligning Risk and Remuneration
STI and LTI reward outcomes reflect risk at a number of levels:
Individual scorecards – Employees have specific risk related measures relevant to their role and aligned with the NAB Group’s Risk Appetite Statement and Divisional Risk Setting Statement where appropriate. The employee’s performance against these risk measures is captured, in part, through the employee’s STI reward. Employees who do not meet minimum performance requirements will not be eligible for STI or LTI.
Compliance Gateway – Supports the NAB Group’s risk and compliance culture. Employees have a responsibility to ensure they comply with Group policies, including the Group Securities Trading Policy and the Code of Conduct. In particular, the Group Securities Trading Policy specifically prohibits directors and employees from protecting the value of unvested securities (including unvested deferred variable pay) with derivative instruments. Directors and employees can protect the value of vested securities in limited circumstances. Employees who do not pass the compliance expectations of their role will have their STI reduced in part, or in full, depending on the severity of the breach and may not participate in the LTI Plan and/or may have deferred STI and/or LTI forfeited/lapsed. The may also be subject to other disciplinary action.
STI pool measures – The financial measures used to determine the STI pool capture a number of material risks (see Section 13.4 Linking Performance and Remuneration for further discussion on how the financial measures take account of risk).
Risk adjustment of business outcomes – The Committee may recommend to the Board adjustment of the financial outcomes upon which STI and LTI rewards are determined based on a qualitative overlay that reflects the NAB Group’s management of business risks, shareholder expectations and the quality of the financial results.
There have been no material changes to the nature and type of key measures used to account for risks and how they impact remuneration during 2015.
13.4 Linking Performance and Remuneration Performance is linked to remuneration through both fixed and variable remuneration components.
Fixed remuneration is set based on a combination of market position, individual performance and NAB’s ability to pay.
Short-Term Incentives
STI rewards are determined based on a combination of business and individual performance.
Business performance is measured by a mix of growth in cash earnings, Return on Equity (ROE), and Return on Total Allocated Equity (ROTAE). These measures reasonably capture the effects of a number of material risks and minimise actions that promote short-term results at the expense of longer-term business growth and success. STI pools are calculated for the NAB Group
and UK Banking level using the following key performance measures:
Performance Measures
Group - Group cash earnings (40%) - ROE (30%) - Group ROTAE (30%)
UK Banking - UK Banking cash earnings (40%)
- UK Banking ROTAE (60%) An employee’s individual performance is assessed against what they have delivered and how they have achieved the outcomes. An employee’s scorecard defines performance measures and targets relevant to the employee’s role that support delivery of the NAB Group’s longer-term strategy. A behavioural assessment and compliance requirements also form part of the employee’s overall performance outcome.
Examples of performance measures used across the NAB Group in 2015 were:
Example Performance Measures
Financial - Revenue - Expenses
Shareholder returns - ROE - Cash earnings
Key deliverables - Delivery of specific projects - Process/technology change
Enterprise Key Performance Indicators
- Customer Advocacy (Net Promoter Score) (1)
- Risk Management - Employee engagement - Diversity and Inclusion
(1) Roy Morgan Research 6 month moving AFI advocacy, DBM
(BFSM) 6 month moving AFI advocacy. Net Promoter Score and
NPS is a registered trademark of Bain & Company, Inc., Satmetrix
Systems, Inc., and Fred Reichheld.
A portion of the STI reward is provided as deferred equity or deferred cash. This allows time to confirm that the initial business and individual performance outcomes are realised and if not, for STI reward to be adjusted downwards.
STI plans link to the NAB Group and business performance by delivering smaller STI pools when performance is less than target and larger STI pools when performance is above target.
Executive Long-Term Incentive Plan
The Executive LTI Plan helps to drive management decisions concerning the long-term prosperity of the NAB Group. The Executive LTI Plan has three to five year performance periods (from 2012 the minimum performance period is four years).
The performance measures for the LTI awarded in respect of 2015 are:
− NAB’s TSR performance relative to the TSR performance of the S&P/ASX Top 50 Index as at 1 October 2015
− NAB’s TSR performance relative to the TSR performance of a selection of financial services companies in the S&P/ASX 200

Remuneration
89
pillar 3 report
2015 A list of the companies used for the LTI performance measures can be found online at www.nab.com.au. NAB’s TSR ranking compared to the peer groups will determine the proportion of performance rights that will vest.
Adjustment of Remuneration
Poor performance during a performance period will be reflected in the STI awarded or amount of LTI that vests at the end of the vesting period. If performance is significantly weak, this may result in no STI being awarded and/or no LTI vesting.
The Committee, in consultation with the PBRC, reviews financial and risk outcomes at the end of the performance year and recommends to the Board, the size of the STI pool, taking into account a qualitative overlay that reflects the NAB Group’s management of business risks (see Section 13.3 Remuneration and Risk), shareholder expectations and the quality of the financial results.
13.5 Adjusting Remuneration for Longer-Term Performance Longer-term performance is reflected in the design of NAB Group’s STI and LTI arrangements.
STI plans contain annual performance metrics that are set to achieve the NAB Group’s longer-term strategy. Deferral of a portion of the STI reward allows for the reward to be adjusted after the initial performance assessment to reflect longer-term performance outcomes.
The NAB Group’s LTI plan has a minimum four year performance period to align management decisions with the achievement of sustained positive performance by NAB Group.
Deferral arrangements
STI rewards are subject to deferral for all senior managers and material risk takers depending on the STI plan and jurisdictional requirements:
Role Grouping Deferral Arrangement
ELT
50% of STI is deferred equally over 2 years
Senior Managers and Material Risk Takers (not in categories below)
25% of STI is deferred for 1 year
Senior UK Material Risk Takers earning more than £500,000 variable remuneration
60% of STI is deferred over 3 years LTI is deferred for no less than 4 years
Senior UK Material Risk Takers
50% of STI is deferred for either 2 or 3 years Any LTI is deferred for no less than 4 years
Financial Markets Specialist Incentive Plan • Senior Executives
• Other Senior
Managers and Material Risk Takers
• 50% of STI deferred
equally over 3 years • 50% of STI deferred
equally over 2 years
Note: Other deferral arrangements apply to employees not identified
as senior managers or material risk takers.
Deferred STI amounts are generally provided in either shares or performance rights.
For UK Material Risk Takers, half of any ‘up-front’ cash STI payment is provided as equity subject to a six month retention period and a further six month retention period applies to deferred STI and LTI after performance conditions have been satisfied. The retained amounts are restricted from being sold, transferred or exercised by the employee during the retention period. No further performance conditions apply to retention equity.
Deferred STI and unvested LTI may be further adjusted as described in Section 13.2 Remuneration Processes – Malus and Clawback.
Once an award has vested or the performance restrictions have ceased, no further adjustment or ‘Malus’ applies. Clawback applies to vested awards.
13.6 Forms of Variable Remuneration The NAB Group provides variable remuneration in the following forms:
Form Use
Cash - All or a portion of the STI award that relates to the current performance year
- Portion of the 2013 UK LTI - Occasionally for deferred STI where an
employee is entitled to receive deferred STI but has ceased employment with the NAB Group prior to allocation of any shares or performance rights
- Retention and recognition awards - Commencement awards.
Shares - Deferred STI (except as noted otherwise) - General employee share offers - Retention and recognition awards - Commencement awards.
Performance rights
- Deferred STI for executives receiving an LTI award or for jurisdictional reasons
- LTI awards - Retention and recognition awards - Commencement awards.
Generally, the NAB Group aims to provide deferred STI and LTI awards as equity to align the interests of employees and shareholders. Performance rights are provided where NAB Group does not consider it appropriate to pay dividends during deferral or restriction periods.
The mix of different forms of variable remuneration is dependent on the employee’s role and external market relativities.
All employees are eligible to participate in an STI plan. STI awards will generally be provided in a combination of cash and equity as described above in Deferral Arrangements (see Section 13.5 Adjusting Remuneration for Longer-Term Performance).
LTI awards are provided to senior executives of the NAB Group. Not all senior managers or material risk takers will participate in the LTI program. Senior managers and material risk takers who do not participate in the LTI program will generally receive deferred STI shares.
Retention, recognition and commencement awards are provided to an employee depending on circumstances. The quantum and form will vary depending on the specific circumstances at the time of the award.

Remuneration
90
pillar 3 report
2015 13.7 Quantitative Remuneration Disclosures
Table 13.7A: Total Value of Remuneration Awards (1)
As at 30 Sep 15 As at 30 Sep 14
Senior Managers Material Risk Takers Senior Managers Material Risk Takers
Unrestricted Deferred Unrestricted Deferred Unrestricted Deferred Unrestricted Deferred
$000 $000 $000 $000 $000 $000 $000 $000
Fixed remuneration
Cash-based(2) 18,503 - 14,662 - 19,450 - 9,602 -
Other(3) 807 - 888 - 765 - 619 -
Variable remuneration(4)
Cash-based(5) 9,391 - 11,425 - 5,887 - 5,660 -
Equity(6) - 12,188 - 8,105 - 8,241 - 7,628
(1) Prepared in accordance with APS 330 Attachment G Table 21A. There were no amounts of fixed remuneration paid in shares or share-linked instruments. No other forms of variable remuneration were provided.
(2) Includes cash salary, cash allowances, short-term compensated absences (such as annual leave entitlements accrued but not taken during the year), motor vehicle benefits, parking and other benefits (including any related fringe benefits tax).
(3) Other fixed remuneration includes employer contributions to superannuation (in Australia) and National Insurance Contributions (in the UK) and long service leave entitlements accrued but not taken during the year. The long service leave entitlements are recognised as accruing on an annual basis subject to an actuarial calculation.
(4) 24 (2014: 24) senior managers and 27 (2014: 23) material risk takers received variable remuneration in respect of the relevant year. In 2015, some senior managers and material risk takers did not receive variable remuneration as they ceased employment with the NAB Group during the relevant year.
(5) The cash component of the STI received in respect of the relevant year. (6) Equity includes all shares and share-linked instruments. Amounts are determined based on the grant date fair value amortised on a straight line basis over the expected vesting
period. The amount shown is the portion relating to the relevant year accounting expense accrual and includes amounts relating to the relevant year and prior year awards.
Table 13.7B: Deferred Remuneration
As at 30 Sep 15 As at 30 Sep 14
Senior Managers
Material Risk Takers
Senior Managers
Material Risk Takers
$000 $000 $000 $000
Total outstanding deferred remuneration (1) 48,738 21,963 36,435 19,279
Cash-based - - 659 -
Equity 48,738 21,963 35,776 19,279
Paid out during the year (2) 8,116 12,121 22,358 11,812
Reductions due to explicit adjustments (3) (5,266) (3,044) (47,108) (4,203)
Reductions due to implicit adjustments (269) (325) - -
(1) The value of deferred cash awards is the grant value and for deferred equity awards is the grant fair value. Outstanding deferred remuneration provided as shares and share-linked instruments is fully exposed to ex post explicit and/or implicit adjustments.
(2) Includes the value of vested awards using the closing share price of NAB shares on the vesting date for all senior managers and material risk takers during the relevant year. (3) Includes any reductions to awards as a result of forfeitures and lapses due to failure to meet performance hurdles, resignations, or malus adjustments for all senior managers and
material risk takers during the relevant year. The value was calculated using the closing share price of NAB shares on the forfeiture or lapsing date.
Table 13.7C: Other Remuneration (1)
As at 30 Sep 15 As at 30 Sep 14
Senior Managers Material Risk Takers Senior Managers Material Risk Takers
No. of individuals
Total amount
$000
No. of individuals
Total amount
$000
No. of individuals
Total amount
$000
No. of individuals
Total amount
$000
Commencement awards (2) 1 1,002 2 551 1 6,500 - -
Termination payments (3) 1 174 1 127 1 1,707 - -
(1) No senior managers or material risk takers received a guaranteed bonus during 2015 or 2014. (2) The full value of these awards and payments is shown with no expensing adjustments made. (3) Termination payments are made in accordance with the relevant NAB Enterprise Agreement and/or the employee’s employment agreement. Employees may also retain shares
and performance rights in accordance with the relevant terms and conditions of each grant, which remain subject to the relevant performance hurdles and restriction periods. These arrangements are in line with the NAB Group’s policy and practice in such circumstances.

Remuneration
91
pillar 3 report
2015 13.8 London Branch Remuneration Disclosures
The following quantitative disclosures are applicable to NAB’s London Branch operations only. They have been prepared in accordance with CRR Article 450 for the year ended 30 September 2015. All monetary amounts are in GBP.
Individuals included in this section of the disclosure meet the following definitions:
UK Material Risk Takers Roles
Senior Management Includes senior management of NAB’s London Branch operations and NAB Group senior management who have significant management accountability for NAB’s London Branch operations.
Other Material Risk Takers
Includes employees performing Significant Influence Functions, employees who have responsibility and accountability for activities that could have a material impact on London Branch’s risk profile, and employees in independent risk management, compliance or internal audit function roles.
Table 13.8A: Aggregate Remuneration of Material Risk Takers by Operating Segment
London Branch
Independent Control
Function (1) Total
Number of Material Risk Takers 58 7 65
Total remuneration (£000) 20,663 1,690 22,353
(1) Includes non-executive directors, Risk, Internal Audit and Compliance employees.
Table 13.8B: Total Value of Remuneration Awards
Senior
Management Other Material
Risk Takers Total
Number of Material Risk Takers 10 55 65
Senior
Management Other Material
Risk Takers Total
£000 £000 £000
Fixed remuneration 3,232 13,065 16,297
Variable remuneration (cash) 525 2,062 2,587
Variable remuneration (retained shares) 290 726 1,016
Deferred remuneration (equity) (1) 492 1,961 2,453
Deferred remuneration (cash) (1) - - -
Total variable remuneration 1,307 4,749 6,056
Total remuneration 4,539 17,814 22,353
(1) The Group provides all deferred remuneration in Company equity or cash. The amount shown includes any LTI awards.
Table 13.8C: Deferred Remuneration
Senior Management
£000
Other Material Risk
Takers £000
Total £000
Outstanding - vested 1,068 36 1,104
Outstanding - unvested 679 5,265 5,944
Awarded during the year 335 3,059 3,394
Vested during the year 701 3,923 4,624
Reductions during the year through performance adjustments - (331) (331)

Remuneration
92
pillar 3 report
2015 Table 13.8D: Other Remuneration (1)
Senior Management
Other Material Risk
Takers
Termination payments (£000) 316 21
Number of beneficiaries 1 1
Highest award to a single beneficiary (£000) 316 21
(1) No sign-on bonuses, commencement or retention awards were provided to senior managers or material risk takers during 2015.
Table 13.8E: Remuneration by Band
Remuneration band (£000) (1)
Number of Material Risk
Takers
1,098 – 1,464
1
732 - 1,098
2
Less than 732
62
Total
65
(1) Total remuneration has been calculated including fixed remuneration, allowances, variable remuneration in relation to the performance year, and fees for non- executive directors. Variable remuneration includes the annual short-term incentive and the long-term incentive award in respect of the 2015 financial year. Bands have been converted using a rate of 1 Euro = £0.7321, consistent with the European Commissions's currency converter for September 2015.

Glossary
93
pillar 3 report
2015 14. Glossary
Term Description
ABCP Asset-Backed Commercial Paper being a form of commercial paper that is collateralised by other financial assets. It is a short-term debt instrument created by an issuing party (typically a bank or other financial institution).
ADI Authorised Deposit-taking Institution.
Additional Tier 1 Capital Additional Tier 1 Capital comprises high quality components of capital that satisfy the following essential characteristics: (a) provide a permanent and unrestricted commitment of funds; (b) are freely available to absorb losses; (c) rank behind the claims of depositors and other more senior creditors in the event of winding up of the issuer; and (d) provide for fully discretionary capital distributions
Advanced IRB approach (IRB) The Advanced Internal Ratings Based (IRB) approach refers to the processes employed by the NAB Group to estimate credit risk. This is achieved through the use of internally developed models to assess potential credit losses using the outputs from the PD, LGD and EaD models.
AMA Advanced Measurement Approach (AMA) is the risk estimation process used for the NAB Group’s operational risk. It combines internally developed risk estimation processes with an integrated risk management process, embedded within the business with loss event management.
APRA Australian Prudential Regulation Authority.
APS Prudential Standards issued by APRA applicable to ADIs.
Alternative Liquid Assets (ALA) Alternative liquid assets are made available in jurisdictions where there is insufficient supply of HQLA in the domestic currency to meet the aggregate demand of banks with significant exposures in the domestic currency in the Liquidity Coverage Ratio (LCR) framework. The Committed Liquidity Facility (CLF) provided by the Reserve Bank of Australia to Australian banks is treated as an ALA in the LCR.
Alternative Standardised Approach (ASA)
Alternative Standardised Approach is the risk estimation process used for the NAB Group’s operational risk.
Back-testing Back-testing refers to the process undertaken to monitor performance of the NAB Group’s risk models. Historical data is used to compare the actual outcomes to the expected outcomes.
Theoretical (or hypothetical) back-testing refers to the process whereby the trading positions at the end of the preceding day are revalued using the end-of-day rates for that day and then again at the succeeding day’s closing rates. The difference between the two mark-to-market values of the portfolio which represents the profit and loss that would have occurred had there been no transactions on the day, is compared with the VaR. VaR is also compared with the actual daily traded profit and loss as a cross-check of the reasonableness of the theoretical portfolio movement.
Basel Accord The Basel regulatory framework (which includes Basel II, Basel 2.5 and Basel III) is the global benchmark for assessing banks’ capital adequacy. The guidelines are aimed at promoting a more resilient banking system through the development of capital adequacy standards that are more accurately aligned with the individual risk profile of institutions, by offering greater flexibility for supervisors to recognise and encourage the use of more sophisticated risk management techniques.
BIPRU BIPRU refers to the UK PRA’s requirements and guidance for accreditation under the Basel Accord. It refers to the Prudential Sourcebook for Banks, Building Societies and Investment Firms.
Board Principal Board of Directors of NAB.
Capital adequacy Capital adequacy is the outcome of identifying and quantifying the major risks the NAB Group is exposed to, and the capital that the NAB Group determines as an appropriate level to hold for these risks, as well as its strategic and operational objectives, including its target credit rating.
CDO Collateralised Debt Obligation.
Central Counterparty (CCP) A clearing house which interposes itself, directly or indirectly, between counterparties to contracts traded in one or more financial markets, becoming the buyer to every seller and the seller to every buyer.
CLO Collateralised Loan Obligation.
Committed Liquidity Facility (CLF) The Reserve Bank of Australia will establish a committed liquidity facility (CLF) as part of Australia's implementation of the Basel III liquidity reform, which will provide high-quality liquidity to commercial banks to assist them in meeting the Basel III liquidity requirements.
Common Equity Tier 1 (CET1) Capital Common Equity Tier 1 (CET1) Capital is recognised as the highest quality component of capital. It is subordinated to all other elements of funding, absorbs losses as and when they occur, has full flexibility of dividend payments and has no maturity date. It is predominately comprised of common shares; retained earnings; undistributed current year earnings; as well as other elements as defined under APS111 - Capital Adequacy: Measurement of Capital.
Compliance Gateway All employees must satisfy threshold measures for compliance which reflect a range of internal and external regulatory requirements.
Corporate (including SME) Corporate (including SME) consists of corporations, partnerships or proprietorships not elsewhere classified and includes non-banking entities held by banks.
Credit derivatives Credit derivatives include single-name credit default and certain total rate of return swaps, cash funded credit linked notes and first-to-default and second-to-default credit derivative basket products. ADIs may also recognise many more complex credit derivatives that do not fall into the list above, that have been approved by APRA.
Credit derivative transactions In relation to securitisation exposures, credit derivative transactions are those in which the credit risk of a pool of assets is transferred to the NAB Group, usually through the use of credit default swaps.
Credit enhancements Credit enhancements are arrangements in which the NAB Group holds a securitisation exposure that is able to absorb losses in the pool, providing credit protection to investors or other parties to the securitisation. A first loss credit enhancement is available to absorb losses in the first instance. A second loss credit enhancement is available to absorb losses after first loss credit enhancements have been exhausted.
Credit Value Adjustment (CVA) A capital charge to reflect potential mark-to-market losses due to counterparty migration risk on bilateral OTC derivative contracts.

Glossary
94
pillar 3 report
2015 Term Description
The Credit Risk function All areas reporting directly to the Chief Credit Officer including Credit Insight & Appetite, Credit Frameworks, Credit Oversight, Counterparty Credit and Strategic Business Services.
Default Fund Clearing members’ funded or unfunded contributions towards, or underwriting of, a CCP’s mutualised loss sharing arrangements.
Derivative transactions In relation to securitisation exposures, derivative transactions include interest rate and currency derivatives provided to securitisation SPVs, but do not include credit derivative transactions.
EaD Exposure at Default (EaD) is an estimate of the total committed credit exposure expected to be drawn at the time of default for a customer or facility that the NAB Group would incur in the event of a default. It is used in the calculation of RWA.
Earnings at Risk (EaR) Earnings at Risk (EaR) is a mathematical technique that uses statistical analysis of historical data to estimate the likelihood that a given portfolio’s net interest margin losses will exceed a certain amount over a 12 month period.
Economic capital Economic capital represents the NAB Group’s internal assessment of the amount of capital required to protect against potential unexpected future losses arising from its business activities, in line with its target credit rating.
Economic profit Economic profit represents cash earnings less capital costs whereby capital costs is allocated equity multiplied by the cost of equity.
ELE The Extended Licensed Entity (ELE) comprises the ADI itself and any APRA approved subsidiary entities assessed as effectively part of a single ‘stand-alone’ entity, as defined in Prudential Standard APS 222 Associations with Related Entities.
Eligible financial collateral Eligible financial collateral, under the standardised approach, will be the amount of cash collateral, netting and eligible bonds and equities. Eligible financial collateral, under the IRB approach, for corporate, sovereign and bank portfolios, is limited to the collateral items detailed in paragraphs 4 and 23 of Attachment G of APS 112. Recognition of eligible financial collateral is subject to the minimum conditions detailed in that same Attachment, paragraph 6.
Fair value The price that would be received to sell an asset or paid to transfer a liability in an orderly transaction between market participants at measurement date.
Foundation IRB (FIRB) Foundation Internal Ratings Based (FIRB) approach refers to an alternative approach to advanced IRB defined under the Basel Accord where a Group develops its own PD models and seeks approval from its regulator to use these in the calculation of regulatory capital, and the regulator provides a supervisory estimate for LGD and EaD.
General Reserve for Credit Losses (GRCL)
The general reserve for credit losses (GRCL) is an estimate of the reasonable and prudent expected credit losses over the remaining life of the portfolio and on non-defaulted assets. The reserve is a compliance requirement under APS 220 - Credit Quality. The GRCL is calculated as a collective provision for doubtful debts, excluding securitisation and provision on default no-loss assets. The difference between the GRCL and accounting collective provision is covered with an additional top-up, created through a transfer from retained earnings to a reserve, to reflect losses expected as a result of future events that are not recognised in the Group’s collective provision for accounting purposes.
GRCL calculation methodology The GRCL is calculated as a collective provision for doubtful debts, excluding securitisation and provision on default no-loss assets. The difference between the GRCL and accounting collective provision is covered with an additional top-up, created through a transfer from retained earnings to reflect losses expected as a result of future events that are not recognised in the NAB Group’s collective provision for accounting purposes. All collective provisions on defaulted or otherwise non-performing assets, regardless of expected loss, are reported as additional regulatory specific provisions.
Group cash earnings Group cash earnings is defined as net profit attributable to owners of the NAB, adjusted for the items NAB considers appropriate to better reflect the underlying performance of the Group. In September 2015 cash earnings has been adjusted for the following:
- Distributions
- Treasury shares
- Fair value and hedge ineffectiveness
- Life insurance economic assumption variation
- Amortisation of acquired intangible assets
- Sale and demerger transaction costs.
GRRMC Group Risk Return Management Committee.
Guarantees Guarantors under the standardised approach are recognised according to APS 112 Attachment F paragraph 3. The secured portion of an exposure is weighted according to the risk weight appropriate to the guarantor and the unsecured portion is weighted according to the risk weight applicable to the original counterparty (Refer to Attachment A for the appropriate risk weights). Under the IRB approach, for corporate, sovereign and bank portfolios, the ADI may recognise credit risk mitigation in the form of guarantees and credit derivatives according to the FIRB substitution approach where an ADI uses supervisory estimates of LGD (refer to APS 113 Attachment B paragraph 49), an AIRB substitution approach where the ADI has approval from APRA to use its own estimates of LGD (refer to APS 113 Attachment B paragraph 60) and, for certain exposures, a double default approach (refer to APS 113 Attachment B paragraph 67). An ADI may decide, separately for each eligible exposure, to apply either the relevant substitution approach or the double default approach. For retail portfolios there are two approaches for the recognition of credit risk mitigation in the form of guarantees and credit derivatives under the retail IRB approach, a substitution approach (refer to APS 113 Attachment C paragraph 19) and, for certain exposures, a double default approach (refer to APS 113 Attachment C paragraph 28). An ADI may decide separately for each eligible exposure to apply either the substitution approach or the double default approach.
High Quality Liquid Assets (HQLA) HQLA refers to high quality liquid assets determined in accordance with APS 210 Liquidity (APS210). These assets include notes and coins, central bank reserves and highly rated marketable securities issued or guaranteed by central banks or governments.
IAA Internal Assessment Approach.
ICAAP Internal Capital Adequacy Assessment Process (ICAAP) is the mechanism developed and used by the NAB Group to determine capital requirements as outlined under Basel III. It results in the NAB Group identifying and assessing all risks to which it is exposed and allocating an appropriate level of capital to each.
IFRS International Financial Reporting Standards.

Glossary
95
pillar 3 report
2015 Term Description
IMA Internal Model Approach (IMA) describes the approach used in the assessment of traded market risk. The NAB Group uses, under approval from APRA, the IMA to calculate general market risk for all transactions in the trading book other than those covered by the Standard Method.
Impaired facilities Impaired facilities consist of:
- Retail loans (excluding unsecured portfolio managed facilities) which are contractually past due 90 days with security insufficient to cover principal and arrears of interest revenue
- Non-retail loans which are contractually past due and there is sufficient doubt about the ultimate collectability of principal and interest;
and
- Impaired off-balance sheet credit exposures where current circumstances indicate that losses may be incurred.
Unsecured portfolio managed facilities are also classified as impaired assets when they become 180 days past due (if not written off).
Investment earnings on Retained Earnings (IoRE)
Investment earnings (net of tax) on shareholders’ retained profits and capital from life businesses, net of capital funding costs, IoRE is comprised of three items:
− Investment earnings on surplus assets which are held in the Statutory Funds to meet capital adequacy requirements under the Life Insurance Act 1995 (Cth);
− Interest on deferred acquisition costs (net of reinsurance) included in insurance policy liabilities resulting from the unwind of discounting; and
Less the borrowing costs of any capital funding initiatives.
IoRE discount rate variation The profit impact of a change in value of deferred acquisition costs (net of reinsurance) included in insurance policy liabilities resulting from a movement in the inflation adjusted risk-free discount rate.
IRB approach
The internal ratings based (IRB) approach refers to the processes employed by the NAB Group to estimate credit risk. This is achieved through the use of internally developed models to assess the potential credit losses using the outputs from the probability of default, loss given default and exposure at default models.
IRRBB Interest rate risk in the banking book.
Level 2 Group The Level 2 Group, being NAB and the entities it controls subject to certain exceptions set out in Section 2 Scope of Application of this report.
Level 3 conglomerate Group
Contains APRA-regulated entities with material operations across more than one APRA-regulated industry and/or unregulated entities.
LGD Loss Given Default (LGD) is an estimate of the expected severity of loss for a credit exposure following a default event. Regulatory LGDs reflect a stressed economic condition at the time of default. It is used in the calculation of RWA.
Liquidity Coverage Ratio (LCR) LCR is a new measure announced as part of the Basel III liquidity reforms that came into force on 1 January 2015. The ratio measures the amount of high quality liquid assets held that can be converted to cash easily and immediately in private markets, to total net cash flows required to meet the Group’s liquidity needs for a 30 day calendar liquidity stress scenario.
Liquidity facilities Liquidity facilities are provided by the NAB Group to an SPV for the primary purpose of funding any timing mismatches between receipts of funds on underlying exposures and payments on securities issued by the SPV (asset liquidity facilities), or to cover the inability of the SPV to roll over ABCP (standby liquidity facilities).
Loan to value ratio Loan to Value Ratio (LVR) is the ratio between the loan and value of the security provided.
Malus Malus allows NAB to stop vesting of all or part of deferred remuneration. Malus adjustments to remuneration may be done at NAB’s discretion, or may be controlled by a pre-set formula. Malus arrangements do not reverse vesting after it has already occurred, so they have no force after the end of the deferral period.
Masterscale Masterscale is a consistent series of grades applied to credit exposures that allows the NAB Group to place every credit exposure into a specific grade or range that represents the likelihood of a credit default. This allows comparison of customers and portfolios.
NAB National Australia Bank Limited ABN 12 004 044 937.
NAB Group NAB and its controlled entities.
Net Promoter Score The Net Promoter Score measures how likely a customer would be to recommend NAB to a friend or colleague on a scale of 0 - 10. The overall score is calculated by subtracting the percentage of customers that answer 6 or below (‘detractors’) from the percentage of customers that answer 9 or 10 (‘promoters’).
Net Stable Funding Ratio (NSFR) NSFR is a measure announced as part of the Basel III liquidity reforms that will apply from January 2018. The ratio establishes a minimum acceptable amount of stable funding (the portion of those types and amounts of equity and liability financing expected to be reliable sources of funds over a one-year time horizon under conditions of extended stress) based on the liquidity characteristics of an ADI’s assets and activities over a one-year horizon. Finalised requirements are still to be outlined by the Basel Committee and APRA.
Net write-offs Write-offs on loans at amortised cost and Fair Value loans net of recoveries.
Non-retail credit Non-retail credit broadly refers to credit exposure to business customers. It excludes retail credit defined below.
Non-traded book Non-traded book refers to the investment in securities held by the NAB Group through to maturity.
The Operational Risk function All areas reporting directly to the General Manager, Operational Risk and Compliance.
Past due facilities ≥ 90 days Past due facilities ≥ 90 days consist of well-secured assets that are more than 90 days past due and portfolio-managed facilities that are not well secured and between 90 and 180 days past due.
PBRC Principal Board Risk Committee.
Glossary
96
pillar 3 report
2015 Term Description
Performance rights A performance right is a right to acquire one NAB ordinary share, once the performance right has vested based on achievement of the related performance hurdle or at the Board’s discretion. Each performance right is issued at no charge to the employee. To acquire a share, the holder must exercise the right but there is no exercise price to be paid. Performance rights may be used instead of performance shares due to jurisdictional reasons for awards such as deferred STI and commencement and other retention programs. The terms and conditions, including lapsing, will vary for each particular grant. Performance rights are issued by NAB. No dividend income is provided to the employee until the end of the restriction period and the performance conditions have been met and the performance rights are exercised.
PD Probability of Default (PD) is an estimate of the likelihood of a customer defaulting or not repaying their borrowings and other obligations to the NAB Group in the next 12 months.
Point in Time Point in Time (PiT) within this document refers to risk models that estimate the likelihood of default and resulting loss over a 12-month period having regard to the current economic conditions.
Qualifying revolving retail exposures For the purposes of regulatory reporting, credit cards are referred to as qualifying revolving retail.
RBA Reserve Bank of Australia.
Regulatory capital
Regulatory capital is the total capital held by the NAB Group as a buffer against potential losses arising from the business the NAB Group operates in. Unlike economic capital, it is calculated based on guidance and standards provided by the NAB Group’s regulators, including APRA. It is designed to support stability in the banking system and protect depositors.
Regulatory expected loss Regulatory Expected Loss (EL) is a calculation of the estimated loss that may be experienced by the NAB Group over the next 12 months. Regulatory EL calculations are based on the PD, LGD and EaD values of the portfolio at the time of the estimate which include stressed LGDs for economic conditions. As such, regulatory EL is not an estimate of long-run average expected loss.
Resecuritisation Resecuritisation exposures are securitisation exposures in which the risk associated with an underlying pool of exposures is tranched and at least one of the underlying exposures is a securitisation exposure. In addition, an exposure to one or more resecuritisation exposures is a resecuritisation exposure.
Retail credit For the purposes of managing credit, two broad categories are used: retail credit and non-retail credit. This reflects the different approaches to the sales and ongoing management of credit and is consistent with the approach required under the Basel Accord. Retail credit refers to the credit provided to retail or personal customers. For the purposes of regulatory capital, retail credit is categorised into four groups: residential mortgages, credit cards (or qualifying revolving credit), retail SME and other.
Return on Equity (ROE) ROE is calculated as cash earnings (annualised) divided by average shareholders’ equity, excluding non-controlling interests and other equity instruments and adjusted for treasury shares.
Return on Total Allocated Equity (ROTAE)
ROTAE is a function of cash earnings, combined divisional RWA target regulatory capital ratios and regulatory deductions (including adjustments for Wealth Management).
Risk appetite Risk appetite defines the level of risk the NAB Group is prepared to accept as part of its business. The resulting level of risk is a direct input into the NAB Group’s capital requirements.
Risk Management Framework (RMF) NAB identifies and manages risk using the RMF.
Risk-Weighted Assets (RWA) A quantitative measure of the NAB Group’s risk, required by the APRA risk-based capital adequacy framework, covering credit risk for on- and off-balance sheet exposures, market risk, operational risk and interest rate risk in the banking book.
RMC Risk Management Committee.
Securities Securities include the purchase of securitisation debt securities for either trading or banking book purposes.
Securitisation Structured finance technique which involves pooling, packaging cash-flows and converting financial assets into securities that can be sold to investors.
Senior executives Persons who are (or were) members of the Executive Leadership Team, including executive directors.
Senior managers Consistent with paragraph 17 of APS 330 and paragraph 48(a) of Prudential Standard CPS 510 Governance (CPS 510), senior managers are Responsible Persons under the NAB Group’s Fit and Proper Policy, including members of the NAB Group Executive Committee, senior managers who are members of the NAB Group Risk Return Management Committee and business line Chief Risk Officers. Non-executive directors of the NAB Group and NAB’s appointed auditor are excluded.
London Branch senior managers are defined in Section 3.8.
Shares Shares are NAB ordinary shares, allocated at no charge to the employee, which provide dividend income to the employee from allocation. The shares are held on trust for at least one year, are restricted from trading and may be fully or partially forfeited if individual or business performance warrants. The shares are forfeited if the participant fails to meet the Compliance Gateway, or if they resign or are dismissed prior to vesting. The shares may be retained on cessation of employment in other circumstances. Shares have no exercise price.
SME Small and medium sized enterprises.
SGA Specialised Group Assets.
Specific provisions Specific provisions for prudential purposes include all provisions for impairment assessed on an individual basis in accordance with IFRS excluding securitisation.
Sponsor The entity that establishes the securitisation SPVs including ABCP conduits and often provides other services.
Standardised approach Standardised refers to an alternative approach to the assessment of risk (notably credit and operational) whereby the institution uses external rating agencies to assist in assessing credit risk and/or the application of specific values provided by regulators to determine RWA.
Statutory Fund A Statutory Fund is a fund that is established in the records of a life company; and relates solely to the life insurance business of NAB or a particular part of that business.
Stress testing Stress testing refers to a technique whereby the NAB Group’s capital position is assessed against a number of different scenarios used to determine the movement on expected losses and subsequent impact on capital.

Glossary
97
pillar 3 report
2015 Term Description
S&P/ASX Top 50 Index A Standard & Poor’s (S&P)/ASX capitalisation index comprised of the 50 largest companies by market capitalisation in Australia.
Through the cycle Through the Cycle (TtC) within this document refers to risk models that estimate the likelihood of default and resulting loss over a 12-month period having regard to the impact of an economic downturn.
Tier 1 Capital Tier 1 Capital comprises Common Equity Tier 1 (CET1) Capital and instruments issued by the Group that meet the criteria for inclusion as Addition Tier 1 capital set out in APS111 - Capital Adequacy: Measurement of Capital
Tier 1 Capital ratio Tier 1 Capital as defined by APRA divided by RWA.
Tier 2 Capital Tier 2 Capital includes other components of capital that, to varying degrees, fall short of the quality of Tier 1 Capital but nonetheless contribute to the overall strength of an ADI and its capacity to absorb losses.
Tier 2 Capital ratio Tier 2 Capital as defined by APRA divided by RWA.
Total Shareholder Return (TSR) TSR is a concept used to compare the performance of different companies’ securities over time. It combines share price appreciation and dividends paid to show the total return to the shareholder. The absolute size of the TSR will vary with stock markets, but the relative position reflects the market perception of overall performance relative to a reference group.
Traded book Traded book refers to the NAB Group’s investment portfolio that is traded or exchanged in the market from time to time that reflects market opportunities.
Value at Risk (VaR) Value at Risk (VaR) is a mathematical technique that uses statistical analysis of historical data to estimate the likelihood that a given portfolio’s losses will exceed a certain amount.
Warehouse facilities Warehouse facilities are lending facilities provided by the NAB Group to an SPV for the financing of exposures in a pool. These may be on a temporary basis pending the issue of securities or on an on-going basis.
Write-offs Write-offs represent credit losses in accordance with accounting rules.
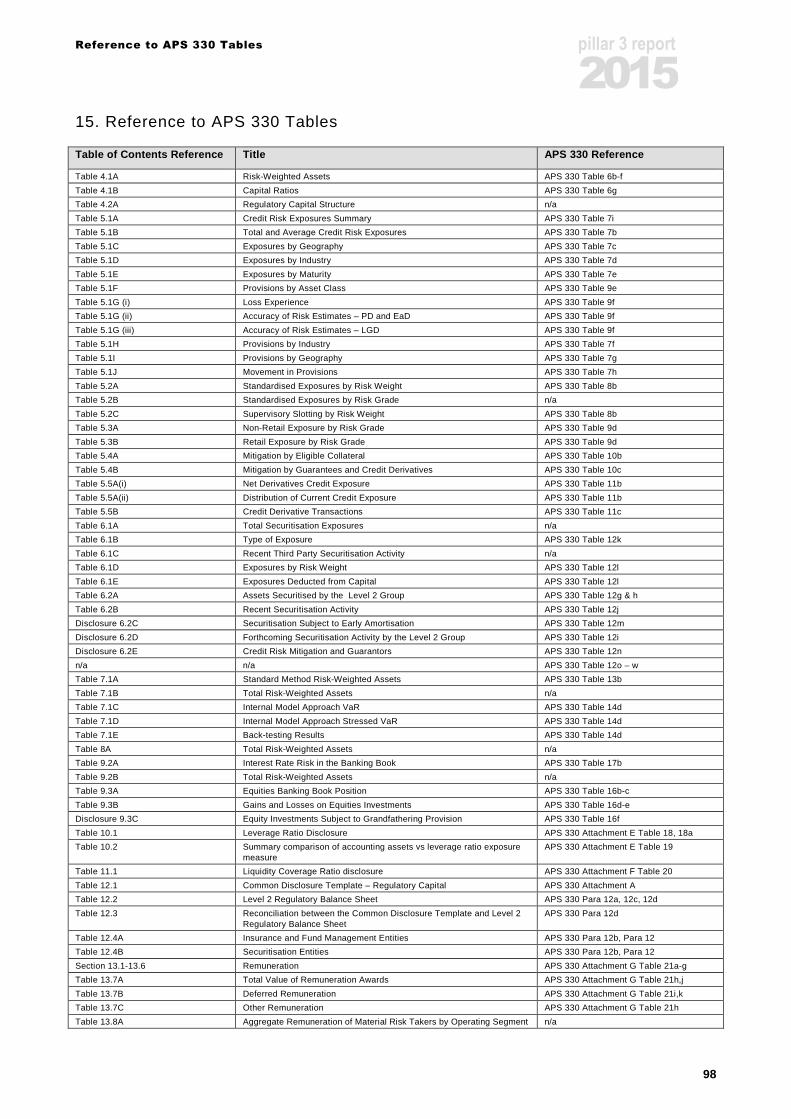
Reference to APS 330 Tables
98
pillar 3 report
2015 15. Reference to APS 330 Tables
Table of Contents Reference Title APS 330 Reference
Table 4.1A Risk-Weighted Assets APS 330 Table 6b-f
Table 4.1B Capital Ratios APS 330 Table 6g
Table 4.2A Regulatory Capital Structure n/a
Table 5.1A Credit Risk Exposures Summary APS 330 Table 7i
Table 5.1B Total and Average Credit Risk Exposures APS 330 Table 7b
Table 5.1C Exposures by Geography APS 330 Table 7c
Table 5.1D Exposures by Industry APS 330 Table 7d
Table 5.1E Exposures by Maturity APS 330 Table 7e
Table 5.1F Provisions by Asset Class APS 330 Table 9e
Table 5.1G (i) Loss Experience APS 330 Table 9f
Table 5.1G (ii) Accuracy of Risk Estimates – PD and EaD APS 330 Table 9f
Table 5.1G (iii) Accuracy of Risk Estimates – LGD APS 330 Table 9f
Table 5.1H Provisions by Industry APS 330 Table 7f
Table 5.1I Provisions by Geography APS 330 Table 7g
Table 5.1J Movement in Provisions APS 330 Table 7h
Table 5.2A Standardised Exposures by Risk Weight APS 330 Table 8b
Table 5.2B Standardised Exposures by Risk Grade n/a
Table 5.2C Supervisory Slotting by Risk Weight APS 330 Table 8b
Table 5.3A Non-Retail Exposure by Risk Grade APS 330 Table 9d
Table 5.3B Retail Exposure by Risk Grade APS 330 Table 9d
Table 5.4A Mitigation by Eligible Collateral APS 330 Table 10b
Table 5.4B Mitigation by Guarantees and Credit Derivatives APS 330 Table 10c
Table 5.5A(i) Net Derivatives Credit Exposure APS 330 Table 11b
Table 5.5A(ii) Distribution of Current Credit Exposure APS 330 Table 11b
Table 5.5B Credit Derivative Transactions APS 330 Table 11c
Table 6.1A Total Securitisation Exposures n/a
Table 6.1B Type of Exposure APS 330 Table 12k
Table 6.1C Recent Third Party Securitisation Activity n/a
Table 6.1D Exposures by Risk Weight APS 330 Table 12l
Table 6.1E Exposures Deducted from Capital APS 330 Table 12l
Table 6.2A Assets Securitised by the Level 2 Group APS 330 Table 12g & h
Table 6.2B Recent Securitisation Activity APS 330 Table 12j
Disclosure 6.2C Securitisation Subject to Early Amortisation APS 330 Table 12m
Disclosure 6.2D Forthcoming Securitisation Activity by the Level 2 Group APS 330 Table 12i
Disclosure 6.2E Credit Risk Mitigation and Guarantors APS 330 Table 12n
n/a n/a APS 330 Table 12o – w
Table 7.1A Standard Method Risk-Weighted Assets APS 330 Table 13b
Table 7.1B Total Risk-Weighted Assets n/a
Table 7.1C Internal Model Approach VaR APS 330 Table 14d
Table 7.1D Internal Model Approach Stressed VaR APS 330 Table 14d
Table 7.1E Back-testing Results APS 330 Table 14d
Table 8A Total Risk-Weighted Assets n/a
Table 9.2A Interest Rate Risk in the Banking Book APS 330 Table 17b
Table 9.2B Total Risk-Weighted Assets n/a
Table 9.3A Equities Banking Book Position APS 330 Table 16b-c
Table 9.3B Gains and Losses on Equities Investments APS 330 Table 16d-e
Disclosure 9.3C Equity Investments Subject to Grandfathering Provision APS 330 Table 16f
Table 10.1 Leverage Ratio Disclosure APS 330 Attachment E Table 18, 18a
Table 10.2 Summary comparison of accounting assets vs leverage ratio exposure measure
APS 330 Attachment E Table 19
Table 11.1 Liquidity Coverage Ratio disclosure APS 330 Attachment F Table 20
Table 12.1 Common Disclosure Template – Regulatory Capital APS 330 Attachment A
Table 12.2 Level 2 Regulatory Balance Sheet APS 330 Para 12a, 12c, 12d
Table 12.3 Reconciliation between the Common Disclosure Template and Level 2 Regulatory Balance Sheet
APS 330 Para 12d
Table 12.4A Insurance and Fund Management Entities APS 330 Para 12b, Para 12
Table 12.4B Securitisation Entities APS 330 Para 12b, Para 12
Section 13.1-13.6 Remuneration APS 330 Attachment G Table 21a-g
Table 13.7A Total Value of Remuneration Awards APS 330 Attachment G Table 21h,j
Table 13.7B Deferred Remuneration APS 330 Attachment G Table 21i,k
Table 13.7C Other Remuneration APS 330 Attachment G Table 21h
Table 13.8A Aggregate Remuneration of Material Risk Takers by Operating Segment n/a

Reference to APS 330 Tables
99
pillar 3 report
2015 Table 13.8B Total Value of Remuneration Awards n/a
Table 13.8C Deferred Remuneration n/a
Table 13.8D Other Remuneration n/a
Table 13.8E Remuneration by Band n/a
www.nab.com.au

©2015 National Australia Bank Limited ABN 12 004 044 937 AFSL and Australian Credit Licence 230686


![2017 First Quarter Pillar 3 Report - nab.com.au · Credit Risk Exposures Section 4 Credit Risk Exposures Total and Average Credit Risk Exposures [APS 330 Attachment C, Table 4a] This](https://static.fdocuments.us/doc/165x107/5bb90f7109d3f2930f8d8a9b/2017-first-quarter-pillar-3-report-nabcomau-credit-risk-exposures-section.jpg)


