2015 full year China media scene
130
-
Upload
zenithoptimediachina -
Category
Business
-
view
4.375 -
download
1
Transcript of 2015 full year China media scene


CHINA ECONOMIC OVERVIEW

CHINA GDP AND GDP PER CAPITA
China’s GDP growth continues to slow to 6.9% - the lowest since 1990
Source: National Bureau of Statistics – Jan 2016
-
1,000
2,000
3,000
4,000
5,000
6,000
7,000
8,000
2006 2007 2008 2009 2010 2011 2012 2013 2014 2015
0%
5%
10%
15%
20%
25%GDP PER CAPITA (USD)
Source: National Bureau of Statistics
RMB 49,228 (USD $7,581)2014 GDP Per Capita - China
+4%YOY
VS
CHINA'S GDP GROWTH YEAR-ON-YEAR
8.1%
7.6%7.4%
7.9%7.7%
7.5%
7.8%7.7%
7.4%7.5%7.4%7.3%
5.8%7.0%6.9%6.8%
5.00%
5.50%
6.00%
6.50%
7.00%
7.50%
8.00%
8.50%
Q12012
Q2 Q3 Q4 Q12013
Q2 Q3 Q4 Q12014
Q2 Q3 Q4 Q12015
Q2 Q3 Q4
2015 GDP Growth: 6.9% YOY
2
CONSUMER CONFIDENCE
Despite the economic slowdown, consumer confidence remains stable with index above 100
FACTORS
• 13th Five year plan was aim to build a comprehensive well-off society.
• Stock market fluctuated dramatically.
• Central band lowered rates and loosened loans restrictions by 5 times in 2015.
• Two children policy was open to all people to increase the domestic demand.
• China’s RMB joined the SDR,,the Fed raised interest rates, and RMB exchange rate fluctuated.
• The division in Real Estate was intensifying and the home-purchase restrictions in many regions was relieved.
CHINA CONSUMER CONFIDENCE
85
90
95
100
105
110
115
Source: National Bureau of Statistics – Jan 2016
3

CHINA ADVERTISING OVERVIEW

CHINA AD EXPENDITURE FORECAST
9.3%
26.9%
17.7%
12.6% 13.4%
10.5%8.7% 8.0% 7.5% 7.0%
0%
5%
10%
15%
20%
25%
30%
0
100,000
200,000
300,000
400,000
500,000
600,000
2009 2010 2011 2012 2013 2014 2015 2016e 2017e 2018e
Total YOY Growth
TOTAL AD INVESTMENT (2015): RMB 456 BILLION
RMB: Million
Advertising investment growth continues to slow down
Source: ZenithOptimedia Adforecast
5

MONITORED SPENDING BY INDUSTRY
0%
39%
-15%
17% 15%
50%
229%
121%
67%50%
88%
10% 13%
96% 93% 82%
-50%
0%
50%
100%
150%
200%
250%
-
50,000
100,000
150,000
200,000
250,000
300,000
350,000
2014 2015 YOYRMB: Million
TOTAL MONITORED AD INVESTMENT BY SECTORS (2014 & 2015)
Food & drink still dominant category; Pharmaceuticals with significant growth taking second position while Toiletries drops into third
Media: Exclude all no-cost items & Hong Kong Media
Source: CTR AdEx Power 2015; iResearch 2015
6

CHINA AD EXPENDITURE BY MEDIA
21%
-2%
5%
-24%
2%
-14%
25%
-30%
-20%
-10%
0%
10%
20%
30%
-
50,000
100,000
150,000
200,000
250,000
300,000
Internet TV Outdoor Newspaper Radio Magazine Cinema
CHINA AD EXPENDITURE BY MEDIA (2015-2016)
2015 2016 yoy
RMB: Million
Source: ZenithOptimedia Adforecast
Internet expected to take up 50% of total ad expenditure with 21% increase in 2016
7

OVERALL MEDIA LANDSCAPE
18% 18%
72%
55%
31%27%
95% 96%
61%
74%
24%
64%
0%
10%
20%
30%
40%
50%
60%
70%
80%
90%
100%
2012 2013 2014 2015
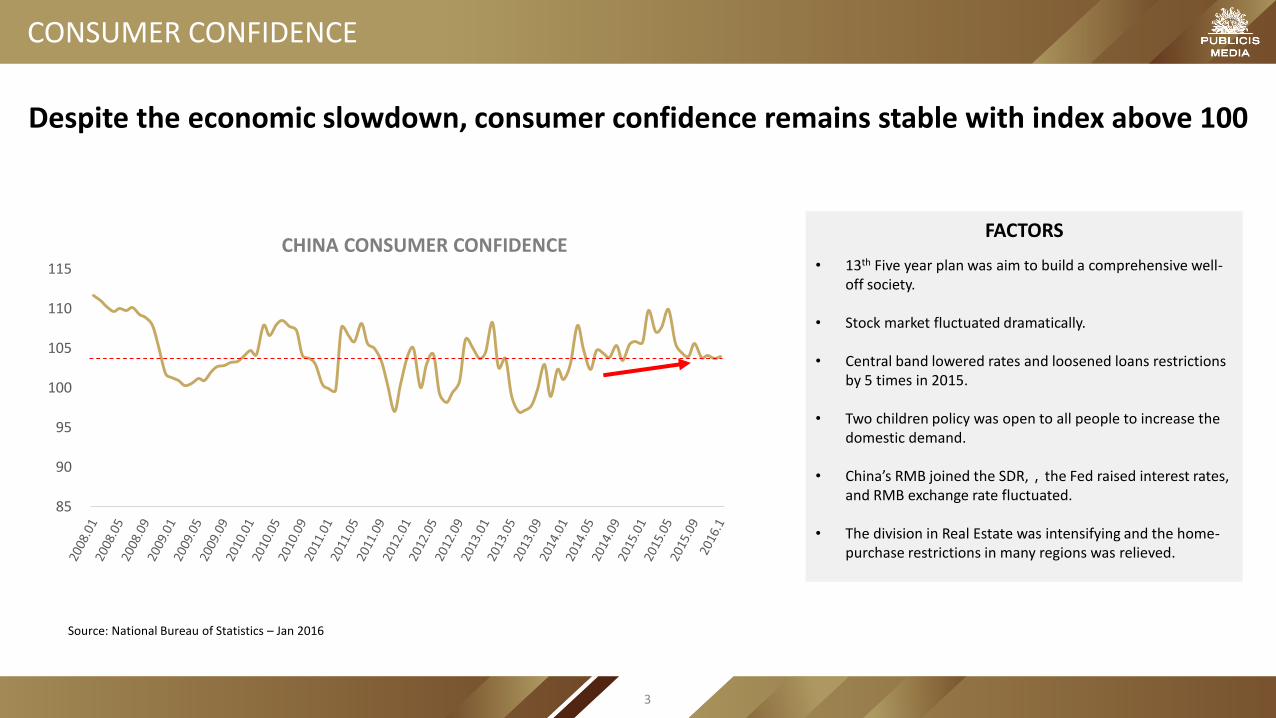
MEDIA PENETRATION 2012-2015
MEDIA COVERAGE BY CHANNELS
TV
Internet Total
Newspaper
Mobile
Magazine
Radio
+13%
+40%
Digital media continues to grow penetration at a steady pace of 13% while mobile internet consumption sees a massive 64% jump in penetration in 2015
Source:CMMS 2012-2015 WinterNote: Internet in Share of time spent including PC and mobile internet.
0%
10%
20%
30%
40%
50%
60%
70%
80%
90%
100%
2012 2013 2014 2015
SHARE OF TIME SPENT 2012-2015
Internet via mobile phone
Internet via others
TV
Magazine
Newspaper
Radio
31%Digital
69%Traditional
34%Digital 39%
Digital
61%Traditional
66%Traditional
45%Digital
55%Traditional
9

0.3 0.2 0.3 0.2 0.2 0.1 0.1 0.2 0.2 0.2 0.2 0.2
0.6 0.5 0.5 0.4 0.4 0.4 0.4 0.3 0.5 0.4 0.3 0.3
0.10.1 0.1 0.1 0.0 0.0 0.0 0.0
0.1 0.1 0.1 0.1
3.13.0 2.9
2.7 2.82.5 2.4 2.4
2.52.3 2.2 2.0
1.81.8 2.0
1.91.2
1.21.3 1.2
1.11.1 1.1
0.9
0.20.3
0.61.0
0.10.3 0.5 1.0 0.4
0.5 0.71.0
0.0
1.0
2.0
3.0
4.0
5.0
6.0
7.0
2012 2013Tier1
2014 2015 2012 2013Tier2
2014 2015 2012 2013Tier3
2014 2015
TIME SPENT ON MEDIA PER DAY, BY CITY TIER 2012-2015
Internet via mobile phones
Internet via others
TV
Magazine
Newspaper
Radio
CROSS TIERS MEDIA CONSUMPTION
Source:CMMS 2012-2015Winter
Tier 1 market continues to consume more media overall but digital consumption increases across all tiers
33%Digital 37%
Digital
41%Digital
29%Digital
32%Digital
42%Digital 32%
Digital 35%Digital
43%Digital
46%Digital
38%Digital 39%
Digital
10

2.4
1.81.9
2.0 2.1 2.2
2.9
1.3
1.3
1.71.8
1.8 1.60.8
1.0
1.2
1.51.5 1.3 1.2
0.4
0.0
1.0
2.0
3.0
4.0
5.0
6.0
7.0
all 15-19 20-24 25-29 30-34 35-39 40+
TIME SPENT ON MEDIA PER DAY, BY AGE GROUP 2015
Mobile Internet via mobile phone
Internet via others
TV
Magazine
Newspaper
Radio
MEDIA CONSUMPTION BY AGE
Young people continue to drive heavy digital consumption, in contrast to 40+ age group
Source:CMMS 2015Winter
54%Digital
58%Digital
57%Digital
53%Digital
50%Digital
25%Digital
44%Digital
11

CHINA DIGITAL LANDSCAPE

TOTAL POPULATION
28.4%71.6% OF NETIZENS
URBAN RURAL
INTERNET PENETRATION6% YOY
50% OF TOTAL POPULATION688,000,000NETIZENS
620,000,000 90% OF NETIZENS
MOBILE WEBMOBILE NETIZENS 11% YOY
Half the population has internet access with higher growth in mobile netizens of 11%
Sources: National Bureau of Statistics of China 2015; CNNIC Jan 2016
DIGITAL LANDSCAPE
1,374,620,000
13
NETIZENS GROWTH RATE
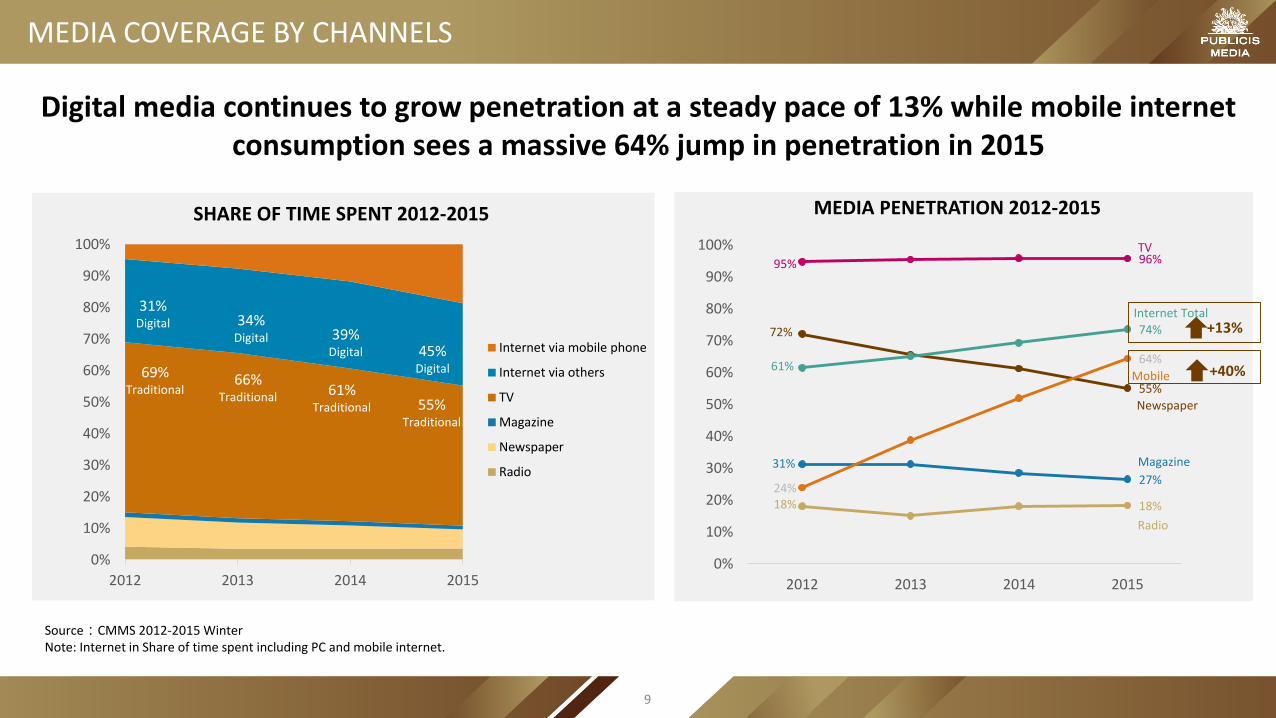
Growth rate of netizens and mobile netizens is slowing down
Source:CNNIC 2011 -2016
513564
618649
688
356
420
501
557
620
12% 10% 10%
5%6%
17% 18% 19%
11%11%
0%
5%
10%
15%
20%
25%
0
100
200
300
400
500
600
700
800
2011 2012 2013 2014 2015
TOTAL NETIZEN & MOBILE NETIZEN GROWTH(2010-2015)
Netizens Mobile Netizens Netizen Growth Mobile Netizen Growth
Unit: Million
14

34% 37%
19% 17%
11% 13%
6% 5%5% 5%5% 5%5% 1%
9% 12%
0%
10%
20%
30%
40%
50%
60%
70%
80%
90%
100%
2014.12 2015.12
SHARE OF TIME SPENT
Video IM Game Social
Search E-comment Finance News
Entertainment Others
MEDIA CONSUMPTION ON PC
User behavior remained relatively unchanged for most categories with exception of BBS
-25%
-20%
-15%
-10%
-5%
0%
5%
10%
0
100,000
200,000
300,000
400,000
500,000
600,000
MONTHLY COVERAGE BY CATEGORY
Dec-14 Dec-15 YOY Growth
-2%
3%
Source:iUserTracker Dec 2014&2015
(‘000)
2%
15

MEDIA CONSUMPTION ON MOBILE
IM is the most used on mobile and still growing. Travel experienced massive growth in 2015
-20%
-10%
0%
10%
20%
30%
40%
50%
60%
70%
80%
90%
0
100,000
200,000
300,000
400,000
500,000
600,000
700,000
MONTHLY COVERAGE BY CATEGORY
Jan-2015 Dec-2015 Growth(Dec/Jan)
26% 29%
20%24%
5%
7%8%
6%5%
6%5%
4%3%
4%3%
3%
23%15%
0%
10%
20%
30%
40%
50%
60%
70%
80%
90%
100%
Jan 2016 Dec 2015
SHARE OF TIME SPEND
IM Online Video Search
Game Browser Social
News&Information E-reading Online Shopping
Others
3%
Source:mUserTracker Jan& Dec 2015,Note: not compare with Jan 2014 due to huge gap after panel change), search combine both APP and site.
(‘000)
4%
2%
16

33.0% 31.4% 34.1% 33.8% 33.5% 33.2% 33.1%
23.3% 27.1% 26.0% 28.2% 28.6% 29.6% 30.0%
26.2% 21.1% 17.8% 15.3% 14.7% 13.4% 12.2%
6.2%7.2% 8.0% 8.2% 8.4% 8.6% 8.7%
11.3% 13.2% 14.1% 14.5% 14.8% 15.2% 16.0%
0%
10%
20%
30%
40%
50%
60%
70%
80%
90%
100%
2012 2013 2014 2015 2016e 2017e 2018e
SHARE OF DIGITAL AD SPENDING IN CHINA BY FORMAT
Search EC ads Display Pre-roll Others
DIGITAL AD SPENDING BY FORMAT
Source: iResearch Report, March 2016
Notes: “Others” include rich media, text link, classifieds, email etc.
Digital ad investment is shifting from display banners to pre-roll and EC ads
17

INTRODUCTION TO VR MARKET AND ITS APPLICATION
450 1,350 3,150
6,300
10,980
16,830
30 75
255
1,035
3,405
8,505
-
5,000
10,000
15,000
20,000
25,000
30,000
2015e 2016e 2017e 2018e 2019e 2020e
2015-2020 Number Of Chinese VR Users
PC VR or VR Gear users(,000) Mobile VR users(,000)
VR experienced huge growth since the end of 2015 with many applications in development
VR EntertainmentVR MovieVR Game
VR TravelVR EducationVR Social
VR TrainingVR TransactionVR Live
Source:iResearch Report, March, 2016.
18

MOBILE

REACH BY DEVICE
Source:CNNIC Jan, 2010 – Jan 2016
Mobile reach now overtakes PC & laptop which have both witnessed a decline since Jan 2015
83%80% 82%
79% 78%
71%71% 70% 70% 70% 71%
68%
68%
35%40%
50% 49% 49%45% 46% 47%
44% 44% 43% 43%39%
69%72% 72% 70% 73%
72%74%
79% 81% 83%86%
89% 90%
35% 34% 32%
16% 16% 18%
0%
10%
20%
30%
40%
50%
60%
70%
80%
90%
100%
Jan-10 Jul-10 Jan-11 Jul-11 Jan-12 Jul-12 Jan-13 Jul-13 Jan-14 Jul-14 Jan-15 Jul-15 Jan-16
INTERNET PENETRATION BY DEVICE
PC Laptop Mobile Tablet TV
20

TIME SPENT ON MOBILE PHONE VS. OTHER DIGITAL
Source:CMMS Winter, 2015
Mobile phones taking up 43% of digital consumption among all people. Teens and college-age users are the heaviest mobile consumers.
1.3 1.3 1.7 1.8 1.8 1.6
0.8
1.0 1.2
1.5 1.5 1.3
1.2
0.4
0.0
0.5
1.0
1.5
2.0
2.5
3.0
3.5
Total Population 15-19 20-24 25-29 30-34 35-39 40+
TIME SPENT ON MOBILE INTERNET VS. DESKTOP INTERNET
Internet via others Internet via mobile phone
43% mobile phone
48% mobile phone
46% mobile phone
45% mobile phone 43%
mobile phone 42% mobile phone
37% mobile phone
Unit: Hour
21

SMARTPHONE OS
27.1%
71.4%
1.2% 0.0% 0.2%
2015 DEC. SMARTPHONE SALES
iPhone Android Windows Blackberry Others
Source:Kantar Worldpanel Dec, 2015
MEDIAN HOUSEHOLD INCOME BY OPERATING SYSTEM
Source:CMMS Winter, 2015
IOS continues to expand its market share in China, driven by higher income mobile users
Unit: Yuan
9,110
11,086 9,804
8,576 8,125
0
2000
4000
6000
8000
10000
12000
Android iPhone WindowsPhone
Blackberry Others
+5.6%
22

MOBILE ADS INVESTMENT
45
97
154
209
266
320
31%
51%
63%
70%
75%80%
12%
22%
31%
37%
43%48%
0%
10%
20%
30%
40%
50%
60%
70%
80%
90%
-
50
100
150
200
250
300
350
2014 2015 2016e 2017e 2018e 2019e
Mobile Internet Ad Spending in China,2014-2019
Mobile internet ad spending(Billion) % of digital ad spending %of total ad spending
Mobile ad spend surpasses PC ads in 2015 and will continue to grow in the coming years
Source:eMarketer, Sep 2015
23
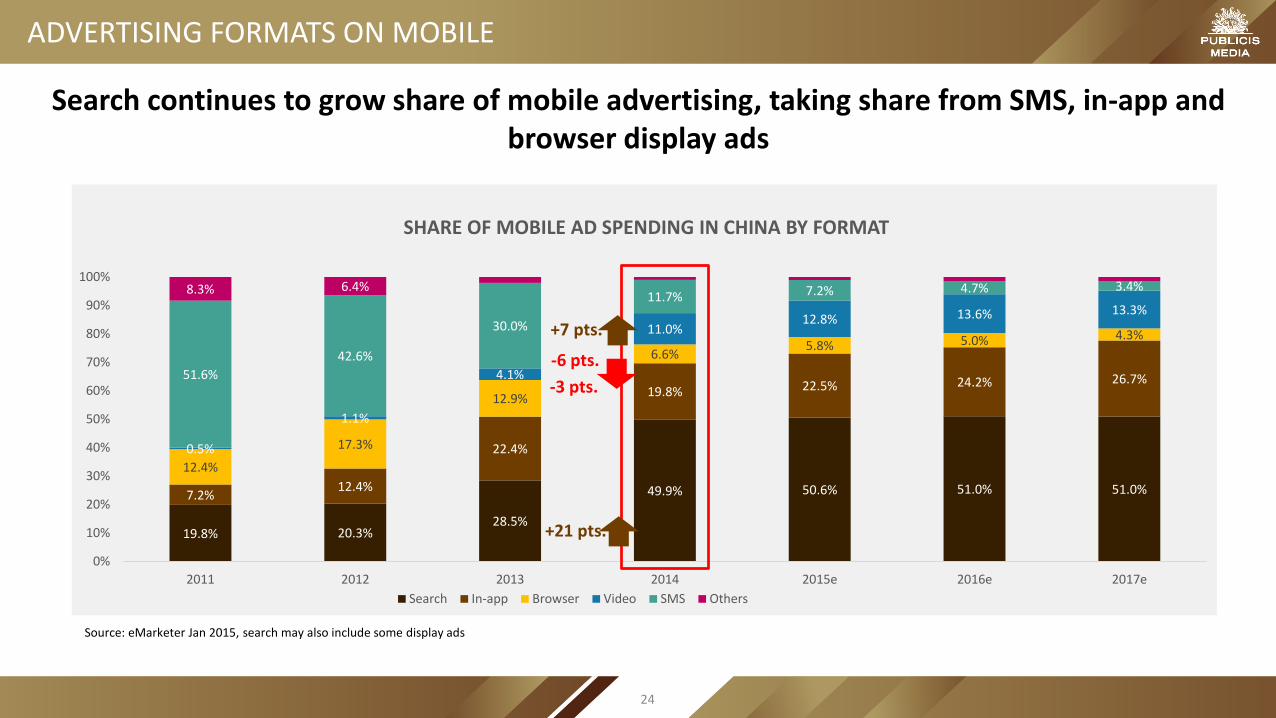
ADVERTISING FORMATS ON MOBILE
19.8% 20.3%28.5%
49.9% 50.6% 51.0% 51.0%7.2%12.4%
22.4%
19.8% 22.5% 24.2% 26.7%
12.4%
17.3%
12.9%
6.6%5.8% 5.0% 4.3%
0.5%
1.1%
4.1%
11.0%12.8% 13.6% 13.3%
51.6%
42.6%
30.0%
11.7% 7.2% 4.7% 3.4%8.3% 6.4%
0%
10%
20%
30%
40%
50%
60%
70%
80%
90%
100%
2011 2012 2013 2014 2015e 2016e 2017e
SHARE OF MOBILE AD SPENDING IN CHINA BY FORMAT
Search In-app Browser Video SMS Others
-3 pts.
+21 pts.
+7 pts.
-6 pts.
Source: eMarketer Jan 2015, search may also include some display ads
Search continues to grow share of mobile advertising, taking share from SMS, in-app and browser display ads
24

FORMATS & CASES

PANORAMIC EXPERIENCE
Uber: Play basketball with Kris Wu
Uber created an H5 page with VR to offer panoramic experience. Users can make defensive move by rotating their mobile while Kris tries to shoot. Winners get red envelops.
10 Corso Como: Panoramic Shopping
Actual instore setting is restored with 360°interaction to offer shopping experience to consumers far away, which speed up online consumption.
Shanghai E-shop
Beijing E-shop
Enhanced visual experience strengthens the sense of reality while interacting with consumers
26

2.Pro X pushes banners with different content under various AQI context1.Impression on weather forecast page to draw the attention of weather conscious females.
CONTEXTUAL MARKETING
Using real time data to understand consumer needs and target appropriately
27

Mobile will surpass all other media both in terms of penetration and time spent. Percentage of mobile investment as well as its role should be fully carefully weighted.1.
Thanks to the development of VR and AR, panoramic experience will enjoy wider implementations. User experience should not be compromised while testing technology innovations.
2.
3.
RECOMMENDATIONS ON MOBILE
Mobile video ads now share higher quality standards and innovation, plus accurate user behavior analysis. Allows for delivery of more targeted and context based content through programmatic buy.
28

TV & OTV

57% 56% 54% 56% 57% 58% 63%
43% 44% 46% 44% 43% 42% 37%
0%
10%
20%
30%
40%
50%
60%
70%
80%
90%
100%
all 15-19 20-24 25-29 30-34 35-39 40+
SHARE OF TIME SPENT ON TV/OTV – OTV VIEWERS
TV OTV
Source: CMMS 2015 Winter
58% watch OTV
97 % watch TV
TV only viewers drop by 5% as multi-screen viewing habits continue to grow
55% watch both
3% watch OTV only
OF THE TV/OTV VIEWING POPULATION:
42% watch TV only
(+4.8%)
(-5%)
(-0.4%)
(+0.4%)
(+5.2%)
TV & OTV COVERAGE
30

SMART TV OVERVIEW
201
50 46
23
77
0
50
100
150
200
250TV market sizeUnit: Million
Source:admaster,2016年1月
Although traditional TV still takes a bigger share, smart TV is catching up fast. TV time spent sees significant increase when consumers buy smart TV
46.9%
23.3%
22.4%
25.7%
13.7%
19.1%
9.1%
12.6%
6.0%
16.5%
1.9% 2.8%
0%
10%
20%
30%
40%
50%
60%
70%
80%
90%
100%
before they buy smart TV after they buy smart TV
TV Time Spent Share
less than 1h 1-2h 2-3h 3-4h over 4h unknown
31

SMART TV ADS FORMAT
Mainstream formats: Content based formats:
“Push content based on programs "is possible on smart TVCase study:during the World Cup, users can interact with smart TV by betting on penalty results to win prizes and collect points.
DIS
PLA
YIN
TER
AC
TIO
NEP
G
Brand zoneFull screen FrontPage/menu/portal VOD pre-roll/post-roll/pause/exit
Navigation bar ad Channel menu ad Volume bar ad
QR code
Link with other smart
devices
Mini siteCorner banner
32

NEW ADVERTISING POLICY
Banned on TV, banned on digitalSAPPRFT installs 24 hour nonstop surveillance on online series, bearing the same censor as with TV. Those already on air but failed to meet the regulations would be put off air or sent back for re-editing, such as Go, Princess go and Addiction.
Restrictions on celebrity kids showsSAPPRFT will strictly control number of reality show that have underaged kids as well as its content and time slot. Using reality shows to market kids of celebrity is especially banned. Such programs would be pulled out of evening timeslot for good, besides, program featuring celebrity kids would become history.
SAPPRFT may restore TVC during drama and 1 drama might be airedon 3 PSTVRecently, SAPPRFT made adjustments on 3 aspects of TV drama: restore TVC duringdrama with total time span of less than 18 minutes; 3 episodes or 2 episodes if eachspans 1 hour; some drama can be aired on 3 PSTV.
33
1
2
3

TV
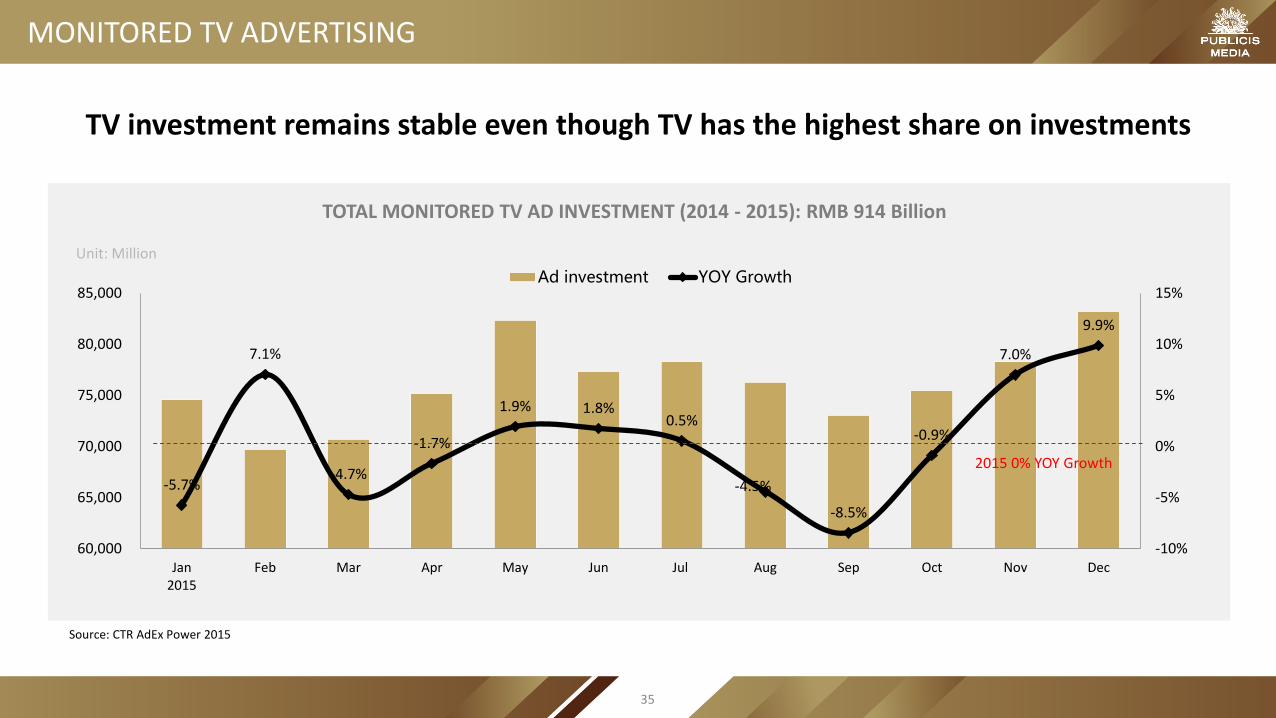
MONITORED TV ADVERTISING
Unit: Million
TOTAL MONITORED TV AD INVESTMENT (2014 - 2015): RMB 914 Billion
-5.7%
7.1%
-4.7%
-1.7%
1.9% 1.8%0.5%
-4.5%
-8.5%
-0.9%
7.0%
9.9%
-10%
-5%
0%
5%
10%
15%
60,000
65,000
70,000
75,000
80,000
85,000
Jan2015
Feb Mar Apr May Jun Jul Aug Sep Oct Nov Dec
Ad investment YOY Growth
TV investment remains stable even though TV has the highest share on investments
2015 0% YOY Growth
Source: CTR AdEx Power 2015
35
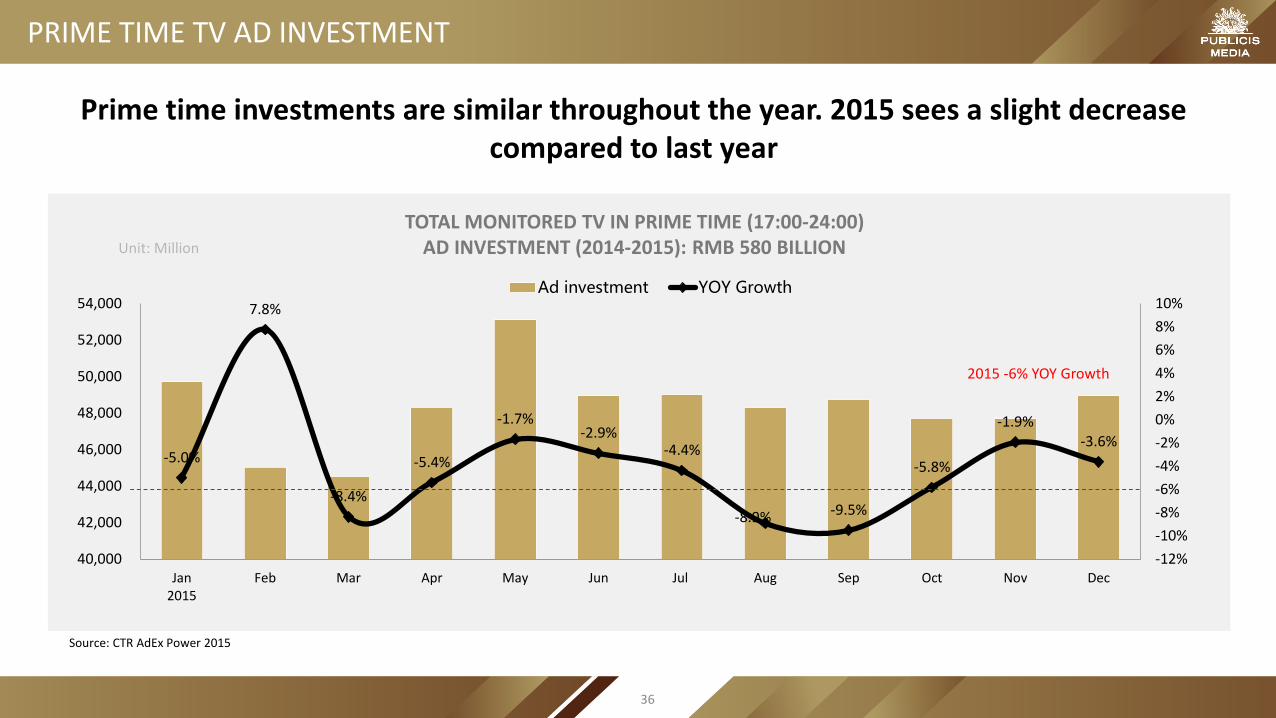
PRIME TIME TV AD INVESTMENT
Unit: Million
TOTAL MONITORED TV IN PRIME TIME (17:00-24:00)AD INVESTMENT (2014-2015): RMB 580 BILLION
-5.0%
7.8%
-8.4%
-5.4%
-1.7%-2.9%
-4.4%
-8.9% -9.5%
-5.8%
-1.9%-3.6%
-12%
-10%
-8%
-6%
-4%
-2%
0%
2%
4%
6%
8%
10%
40,000
42,000
44,000
46,000
48,000
50,000
52,000
54,000
Jan2015
Feb Mar Apr May Jun Jul Aug Sep Oct Nov Dec
Ad investment YOY Growth
Prime time investments are similar throughout the year. 2015 sees a slight decrease compared to last year
2015 -6% YOY Growth
Source: CTR AdEx Power 2015
36

TV AD INVESTMENT BY CATEGORY
Unit: Million
TV MONITORED AD INVESTMENT BY SECTORS (2014-2015)
39%
-4% -4%
-22%-12%
-4% -7%-12%
33%24%
-2%
37%
11%
-12% -15%-6%
8% 10%
-11%
33%
76%
-40%
-20%
0%
20%
40%
60%
80%
100%
0
20,000
40,000
60,000
80,000
100,000
120,000
140,000
160,000
2014 2015 YOY Growth
Pharmaceuticals continue to strengthen investments on TV, while we see a massive drop for Toiletries and Automobile categories
Source: CTR AdEx Power 2014-2015
37
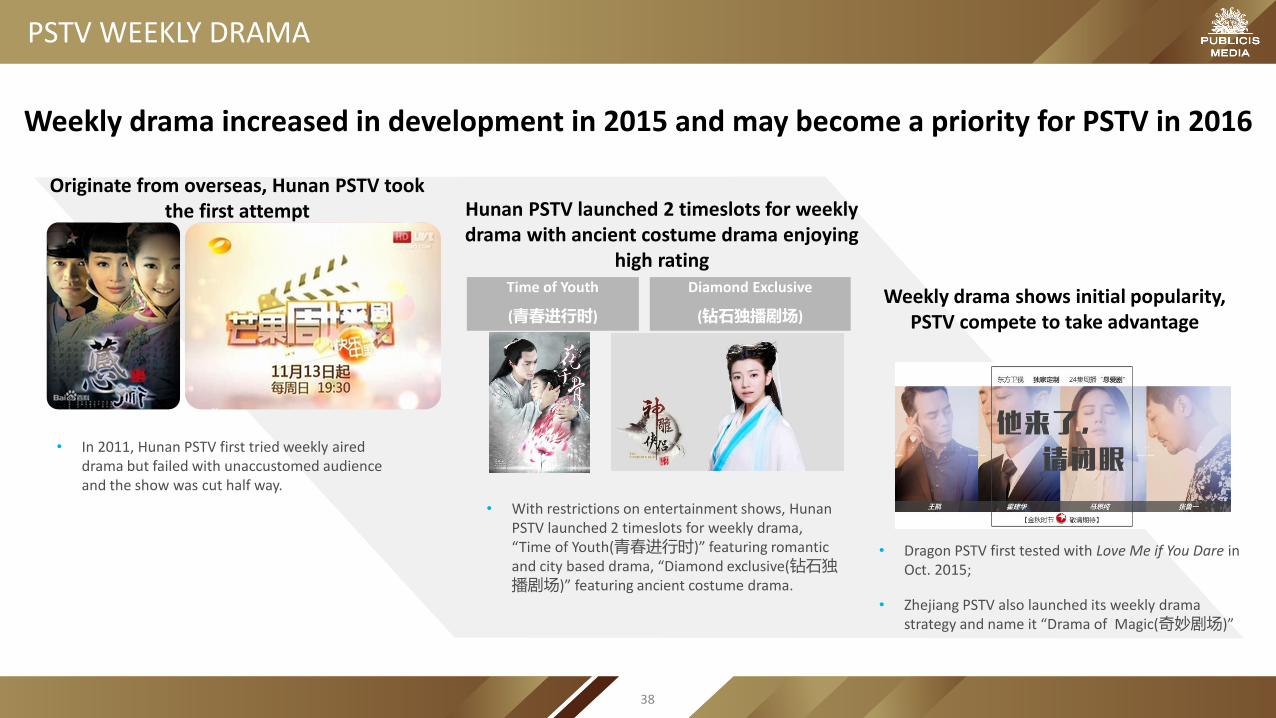
PSTV WEEKLY DRAMA
Originate from overseas, Hunan PSTV took the first attempt
• In 2011, Hunan PSTV first tried weekly aired drama but failed with unaccustomed audience and the show was cut half way.
Hunan PSTV launched 2 timeslots for weekly drama with ancient costume drama enjoying
high rating Time of Youth
(青春进行时)
Diamond Exclusive
(钻石独播剧场)
• With restrictions on entertainment shows, Hunan PSTV launched 2 timeslots for weekly drama, “Time of Youth(青春进行时)” featuring romantic and city based drama, “Diamond exclusive(钻石独播剧场)” featuring ancient costume drama.
Weekly drama shows initial popularity, PSTV compete to take advantage
• Dragon PSTV first tested with Love Me if You Dare in Oct. 2015;
• Zhejiang PSTV also launched its weekly drama strategy and name it “Drama of Magic(奇妙剧场)”
Weekly drama increased in development in 2015 and may become a priority for PSTV in 2016
38

JOINT COUNTER ATTACK OF LTV
Market Hidden Singer Chinese Idol I’m a Singer Voice of China
14 city panel 1.09 1.13 1.72 2.08
Beijing 1.13 0.521 2.028 2.135
Fuzhou 0.137 0.958 2.047 1.555
Guangzhou 1.122 0.609 2.251 1.13
Hangzhou 0.225 0.197 1.155 4.456
Jinan 0.549 0.291 1.173 2.645
Shanghai 3.483 4.423 1.2 1.664
Shenzhen 0.79 0.158 2.452 1.827
Shenyang 0.324 0.383 2.024 3.214
Suzhou 0.941 0.404 1.002 1.585
Wuxi 0.441 0.248 0.906 1.404
Wuhan 0.541 1.282 1.868 2.319
Xi’an 0.217 0.213 2.106 1.798
Changchun 0.29 0.269 1.712 2.055
Chongqing 0.552 0.718 1.549 2.106
Source: Infosys, TA: P4+
Hidden Singer was created by Shanghai Entertainment Channel, Beijing Art Channel, Guangzhou Comprehensive Channel, Shenzhen City Channel together , produced by Dragon PSTV and aired on multiple LTV.
Restricted by budget and production capability, LTV couldn’t compete with CCTV and PSTV. However, several LTV have started to join hands in creating reality shows, breaking the
dominance of CCTV and PSTVRatings
More entertainment shows jointly created by LTV will be on air soon, such as Fashion CN vs. KR and Eat, Drink, Man, Woman.
39

OTV

504MILLION USERS
73% REACHAMONG ALL NETIZENS
8 DAYS PER MONTH
60 MINUTESPER USAGE DAY
PC MOBILE
65% REACH AMONG ALL NETIZENS
15 DAYS PER MONTH
46 MINUTESPER USAGE DAY
ONLINE VIDEO OVERVIEW
Source: Total netizen number and reach rom CNNIC, days and time spent from iUserTracker & mUserTracker Dec 2015;
41

MEDIA SHARE OF TIME SPENT ON PC AND MOBILE
TIME SPENT BY VIDEO PLATFORM
PC
36%
14%8%
8%
8%
7%
4%
3%2%1%
10%
iQiyi
Baofeng
Youku
Sohu
Tencent
PPTV
Fushion
LeTV
CNTV
Tudou
Others
-4%
-9%
-5%
Source: iUserTracker & mUserTracker Dec 2014 & 2015, PC includes desktop apps.Note:iQiyi’s fast expansion is due to exclusive copyright and self produced content.
+14%
33%
23%
23%
7%
6%3%
4%0%iQiyi
Tencent
Youku
LeTV
Sohu
PPTV
Tudou
MangoTV
Funshion
Others
MOBILE
iQiyi is the only platform that grew significantly on both PC & mobile. On mobile, top 3 players take nearly 80% share of total time spent
PC Dec-2015 Mobile Dec-2015
+15%
+8%
-9%
+2%
42

VIDEO VIEWS BY DEVICE
Viewers prefer tablets and phone for online video except for Baofeng, Funshion and Kankan.com
18%28% 30% 30%
40% 42% 45%55%
76%
94%
74%65% 60% 56%
42%48% 40%
43%
22%
4%8% 7% 10% 14% 18%10% 15%
2% 2% 2%
0%
10%
20%
30%
40%
50%
60%
70%
80%
90%
100%
Tencent Mango TV Youku&Tudou Iqiyi& PPS PPTV LeTV Souhu 风行 Baofeng kankan.com
VIDEO VIEW % BY DEVICE
PC Mobile
Source:Claimed Publisher Data, 2016
2% 18% 21% 5% 12% 9% 12% 21%
43

ONLINE VIDEO ADVERTISING REVENUE
Source: iResearch Report, Feb, 2016
0.2 0.5 3.39.8
17.5
26.5
36.3
6.59.3
11.9
13.4
15.5
17.7
18.6
3%5%
22%
42%
53%
60%
66%
0%
10%
20%
30%
40%
50%
60%
70%
0
10
20
30
40
50
60
2012 2013 2014 2015e 2016e 2017e 2018e
2012-2018 ADVERTISING REVENUE FOR ONLINE VIDEO (MOBILE & PC)
Mobile Advertising Non-Mobile Advertising % of all OTV Advertising
RMB: Billion
Mobile video revenue is expected to take over 50% of share in 2016
44
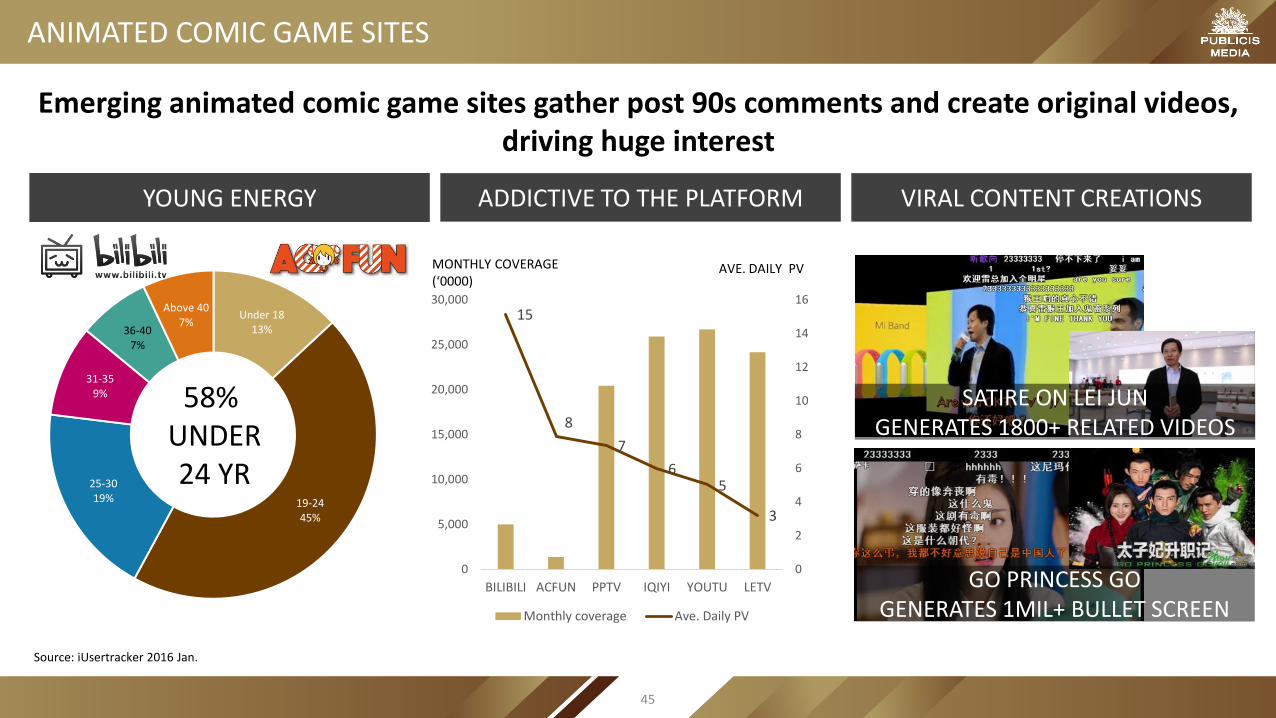
ANIMATED COMIC GAME SITES
YOUNG ENERGY ADDICTIVE TO THE PLATFORM
Under 1813%
19-2445%
25-3019%
31-359%
36-407%
Above 407%
VIRAL CONTENT CREATIONS
58% UNDER24 YR
15
8
7
65
3
0
2
4
6
8
10
12
14
16
0
5,000
10,000
15,000
20,000
25,000
30,000
BILIBILI ACFUN PPTV IQIYI YOUTU LETV
Monthly coverage Ave. Daily PV
MONTHLY COVERAGE(‘0000)
AVE. DAILY PV
Emerging animated comic game sites gather post 90s comments and create original videos, driving huge interest
SATIRE ON LEI JUN GENERATES 1800+ RELATED VIDEOS
GO PRINCESS GOGENERATES 1MIL+ BULLET SCREEN
Source: iUsertracker 2016 Jan.
45

VIDEO SITE VIP SUBSCRIPTION MODELS
iQiyi will invest more than 50% budget and resources to expend its VIP business in 2016.
iQiyi:Start the VIP subscription models
LeTV: content+ experience+ service
0.2 0.20.3
0.60.8
0.9
1.2
46%
91%
63%
171%
272%284%
256%
0%
50%
100%
150%
200%
250%
300%
0.0
0.2
0.4
0.6
0.8
1.0
1.2
1.4
2014Q1 2014Q2 2014Q3 2014Q4 2015Q1 2015Q2 2015Q3
VIDEO SITE VIP MARKET SCALE
Video site VIP market scale (billion) Growth
First start VIP-watch-first model First start VIP-watch-only model
Source:iQiyi《网络视频个人付费行业白皮书》
LeTV started VIP model of “content+experience+service”, and allowed the member can be engaged in more services, such as sports, music and online&offline movies.
“Go, Princess, Go” attract 2.2 million people to pay for the content.
In Jan, 2016, the VIP number has reached 20 million.
With good content and service together with convenience of online payment, VIP subscription model of video site begins booming
46

SELF-PRODUCED PROGRAM
The number of self-produced programs in online video site has doubled in 2015, and the broadcast of each episode has reached over 100 million
Souce: Media , March, 2016
3
4
4
24
21
21
30
8
9
10
30
42
42
50
PPTV
MangoTV
Souhu
Tencent
iQiyi
Letv
Youku&Tudou
The number of self-produced program (2014VS2015)
Y2015 Y2014
iQiyi-《U CAN U BB》broadcast :191,000,000/episode
iQiyi-《The Lost Tomb》broadcast:243,000,000/episode
LeTV-《Go, Princess, Go》broadcast :89,000,000/episode
47

FORMATS & CASES

UPDATED WATCH&BUY
Youku: Occasion targeting iQiyi:Facial recognition
iQiyi use the figure out technology to do the facial recognition, which can help to realize the model that the brand will be wherever the celebrity is.
Based on the content, Youku do the targeting with 6 dimensions: category, product, brand, location, scene tonality and occasion type.
Ctrip is the first tester of this techonology. In the variety show “running man”, when Dengchao shows up, Ctrip ads will pop up, which successfully transform the
celebrities fans into its own consumers.
Products:Capture the products in video and tag them to do the watch&buy.
Occasion:Define the occasion in video by tag to do the watch&buy.
49

E-COMMERCE IN VIDEO SITE
Combining with brand, KOL, content, e-commerce and social forum, Youku connects content and purchase to build a new ecosystem
Oh!8 Brand shop
Related content & video
Fans interaction area
KOL video
Shopping area
Youku mall: purchase directly
GoPro Brand shop
Social media
Brand
E-commence
Content
UPCG KOL
Experience native marketing
KOLBrand
Purchase Fans
Brands cooperate with Youku UPCG KOL to build the business ecosystem
Offer the platform to demonstrate products and
link to e-commerce platform directly.
Offer a fans interaction area to build the fans
economy.
Give the brand an opportunity to expose its products and drive sales
directly.
50

NONGFU SPRING TRUE VIEW
Now Youku and iQiyi allow users to skip pre-roll therefore advertisers only pay for the actual exposure
Exclusive displayed
1-3 minutes long
Skippable after 5
seconds
Charge after 30 seconds
Frequency cappingPC Only
Nongfu Spring 180s true view results:
The first day Whole campaign
30 s 80% 67%
180 s 70% 57%
CTR4.07%
400% higher than average
2.82%282% higher than
average
Win the word of mouth
51

LANEIGE CONTENT COOPERATION
Sponsor the drama in iQiyi and occupy the first place of the homepage
Brand/product implantation Video sites cooperation Owned media support
Watch & buy
Page decorated by brands elements+ The first pre-roll+ small video ad on the bottom right corner
Promotion in iQiyi mall in mobile App
Celebrities is using products in the drama Official wechat launched a related activity.
Official weibo interact with fans.
Official e-commence sell the same products.
Laneige partnered with the hot Korean drama “Descendants of the Sun”
52

Smart TV shows strong potential for the future with growing penetration and possibility of programmatic buying in the near future. 1.
OTV ads blocking has seen steady growth this year, therefore, advertisers need to look beyond exposure on traditional spots such as in-program.2.
OTV is incorporating E-commerce with its sales led and branding enabled content.3.
Bullet screen (弹幕) makes OTV viewing part of social experience. Advertisers can use it to build WOM.4.
RECOMMENDATION ON TV & OTV
53

SOCIAL

624 MILLION USERS
91% REACHAMONG ALL NETIZENS
14 DAYS PER MONTH
17 MINUTESPER USAGE DAY
PC MOBILE
90% REACHAMONG ALL NETIZENS
19 DAYS PER MONTH
37 MINUTESPER USAGE DAY
SOCIAL OVERVIEW
Source: Total netizen number and reach number from CNNIC, days and time spent from iUserTracker & mUserTracker Jun 2015; Note PC also include social shopping here, while mobile doesn’t.
55
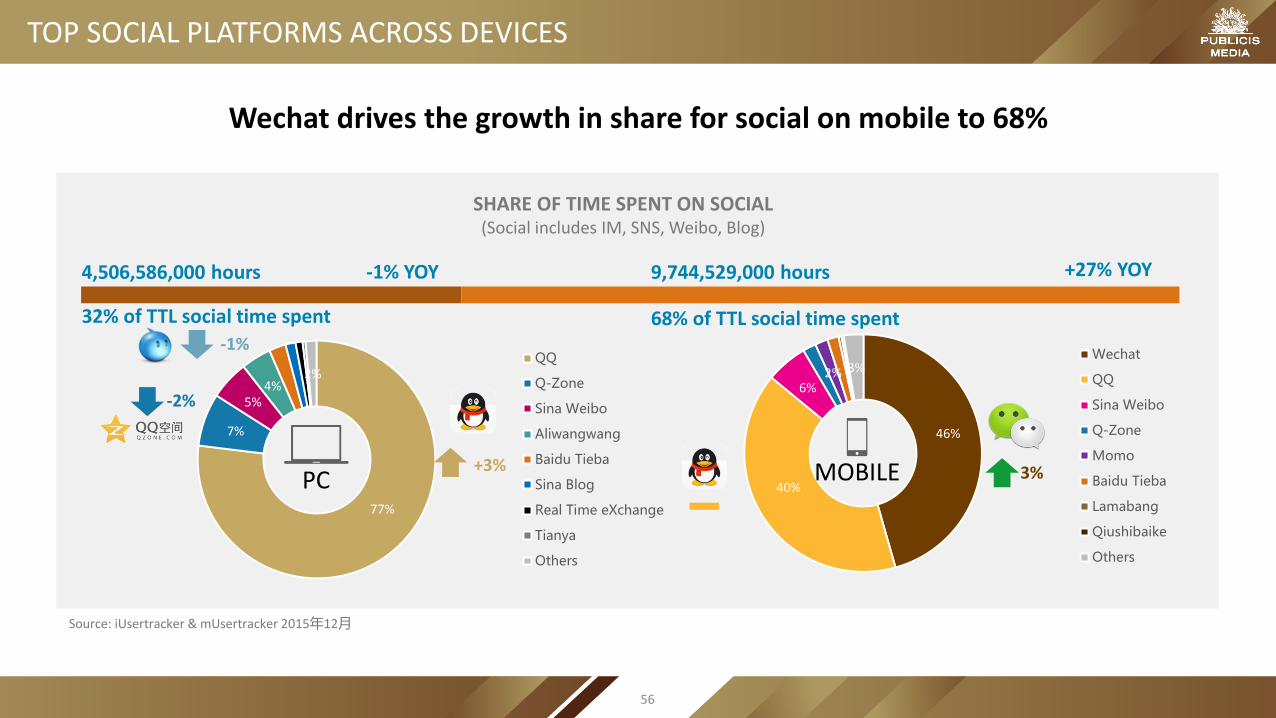
77%
7%
5%4%
2%QQ
Q-Zone
Sina Weibo
Aliwangwang
Baidu Tieba
Sina Blog
Real Time eXchange
Tianya
Others
46%
40%
6%2% 3%
Sina Weibo
Q-Zone
Momo
Baidu Tieba
Lamabang
Qiushibaike
Others
3%
4,506,586,000 hours
32% of TTL social time spent
-1% YOY 9,744,529,000 hours
68% of TTL social time spent
+27% YOY
+3%
-2%
-1%
TOP SOCIAL PLATFORMS ACROSS DEVICES
Source: iUsertracker & mUsertracker 2015年12月
SHARE OF TIME SPENT ON SOCIAL(Social includes IM, SNS, Weibo, Blog)
PC MOBILE
Wechat drives the growth in share for social on mobile to 68%
56

MONTHLY REACH OF TOP PROGRAMS
0%
10%
20%
30%
40%
50%
60%
70%
80%
90%
100%
PC - SOCIAL REACH(%)
QQ zone
Sina Weibo
Baidu Tieba
Aliwangwang
Douban
Tianya
Source: iUsertracker & mUsertracker 2015年1-12月.
0%
10%
20%
30%
40%
50%
60%
70%
80%
90%
100%
MOBILE - SOCIAL APP REACH (%)
Sina Weibo
QQ zone
Momo
QQ mail
ChatON
Aliwangwang
On PC, the reach of QQ Zone declines sharply while others keep stable
57

AGE DISTRIBUTION OF SOCIAL MEDIA
53%
44%
33%
18%
5%
34%
72%
60%
53%
32%
10%
51%
0%
10%
20%
30%
40%
50%
60%
70%
80%
16-25 26-35 36-45 46-55 55+ Total
AGE DISTRIBUTION OF SOCIAL MEDIA
2014 2015
35%
37%64%
75%
92%
50%
Young people still the biggest users of social media, however older users have doubled in 2015
Source: Kandar-Chinese Social Media Report, Jan. 2016
58

FORMATS & CASES

VIDEO AD ON SOCIAL PLATFORMS
Wechat and Weibo both launched video ads to offer more dynamic formats
Brand feed video adsAutomatic view with Wi-Fi, shown in front-page, full screen display enabled
Weibo recommendation video adsGender, age, geographic targeting enabled, shown in second spot of Weibo video, play if slide upwards
Advertiser
Copy
6 seconds short video ( 30-90
seconds long video after clicking)
Interaction
Support to download/book activities
Support to skip to H5 page
Support to skip to public account’s news
60
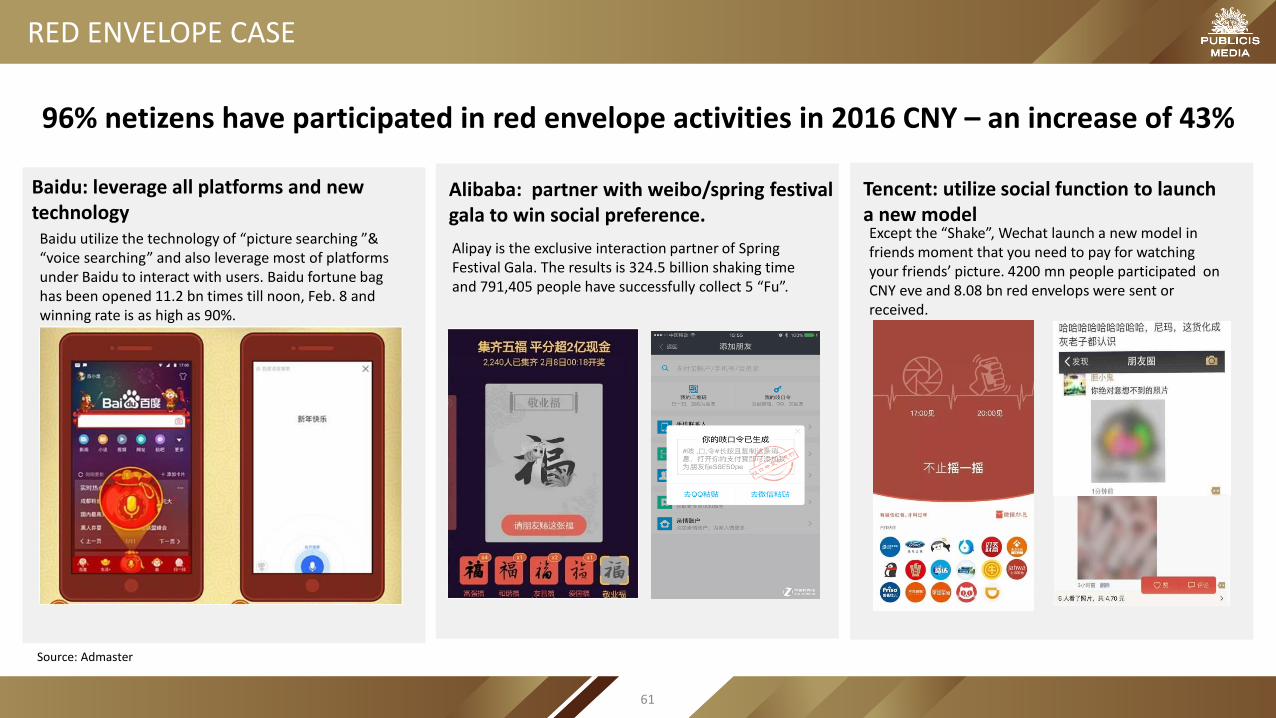
RED ENVELOPE CASE
Alibaba: partner with weibo/spring festival gala to win social preference.
Tencent: utilize social function to launch a new model
Baidu: leverage all platforms and new technology
Baidu utilize the technology of “picture searching ”& “voice searching” and also leverage most of platforms under Baidu to interact with users. Baidu fortune bag has been opened 11.2 bn times till noon, Feb. 8 and winning rate is as high as 90%.
Alipay is the exclusive interaction partner of Spring Festival Gala. The results is 324.5 billion shaking time and 791,405 people have successfully collect 5 “Fu”.
96% netizens have participated in red envelope activities in 2016 CNY – an increase of 43%
Except the “Shake”, Wechat launch a new model in friends moment that you need to pay for watching your friends’ picture. 4200 mn people participated on CNY eve and 8.08 bn red envelops were sent or received.
Source: Admaster
61

NEW SOCIAL MODEL: LIVE BROADCAST
ADVERTISMENTGAME NEWS
There’s large number of game users, and among them male with good consumption ability take the biggest account. Based on iResearch, the live game broadcast will reach to 100 million.
163 news launch the project “2016 Spring Festival Travel Live broadcast” which is a 360 hours record by video, picture and word. 22 million people in total attend this news live broadcast.
Durex launched a 3 hours video in Bilibili to promote its new product. There’re over 1 million audiences watching it and 300,000 of them watch the whole advertisement.
62

Social is becoming more diversified and can be used to reach specific targets with the right content and start conversation.1.
Social + video is attracting more and more attention, allowing advertisers to track consumer response.2.
Content which resonate with consumers tend to drive more interactions with customers.3.
RECOMMENDATIONS ON SOCIAL
63

MAGAZINE AND NEWSPAPER

33%
74%
62%
23%18%
96%
31%
66% 64%
35%
16%
95%
29%
62%
68%
49%
17%
96%
27%
55%
74%
64%
18%
96%
0%
10%
20%
30%
40%
50%
60%
70%
80%
90%
100%
Magazine Reach NewspaperReach
Internet Reach Mobile InternetReach
Radio Reach TV Reach
2013-2015 REACH OF PRINT MEDIA
2012 2013 2014 2015
PRINT MEDIA OVERVIEW
Source: CMMS 2012-2015Winter
14.6 minutes on magazine 35.4 minutes on newspaper
Print readership continues to decline due to the fast rise of digital media
DAILY TIME SPENT ON PRINT
134
186
242
3283.87
7.059.43
13.84
-10
-5
0
5
10
15
0
50
100
150
200
250
300
350
2012 2013 2014 2015
No. of users (mn) Market share (bn)
2012-2015 CHINA MOBILE READING MARKET
65
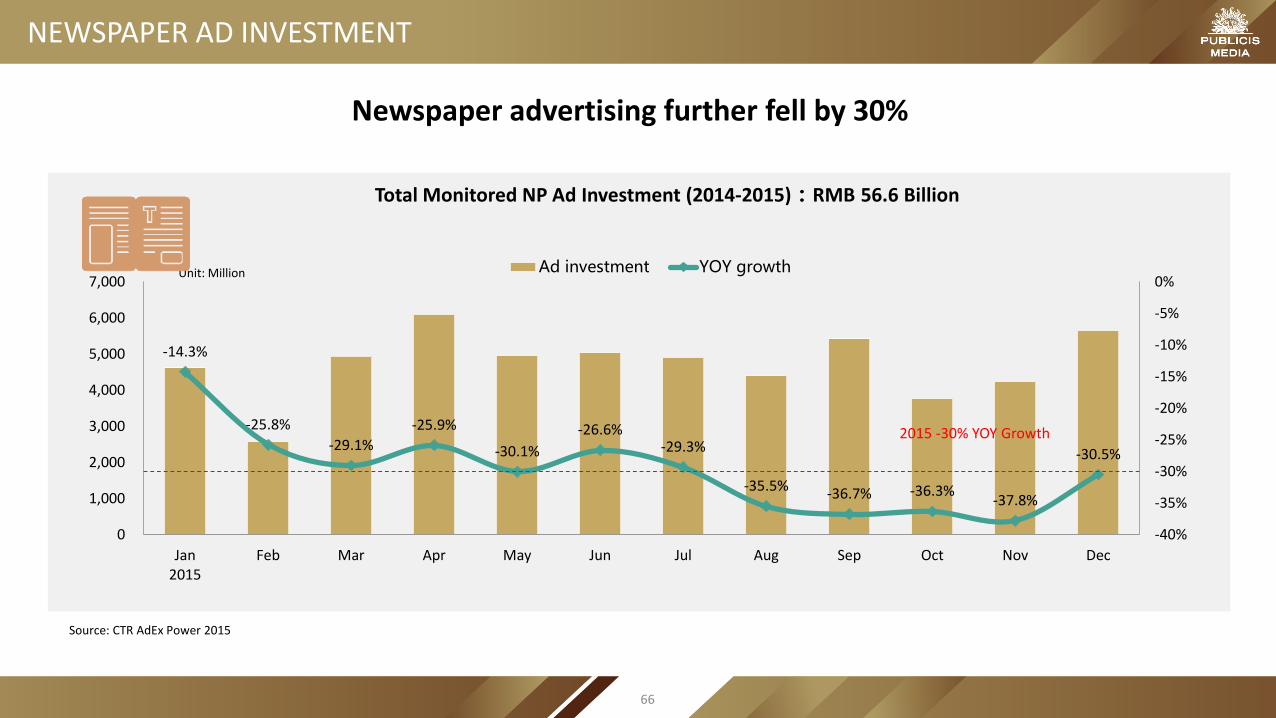
-14.3%
-25.8%
-29.1%
-25.9%
-30.1%
-26.6%-29.3%
-35.5% -36.7% -36.3%-37.8%
-30.5%
-40%
-35%
-30%
-25%
-20%
-15%
-10%
-5%
0%
0
1,000
2,000
3,000
4,000
5,000
6,000
7,000
Jan2015
Feb Mar Apr May Jun Jul Aug Sep Oct Nov Dec
Ad investment YOY growth
Total Monitored NP Ad Investment (2014-2015):RMB 56.6 Billion
Unit: Million
NEWSPAPER AD INVESTMENT
2015 -30% YOY Growth
Newspaper advertising further fell by 30%
Source: CTR AdEx Power 2015
66

NP Monitored Ad Investment By Sectors (2014-2015)
Ad spend in newspapers decreased across most categories
NEWSPAPER AD INVESTMENT BY INDUSTRY
Unit: Million
-35%-44%
-16%-5%
-21%
-46%
-12%
-43%-49%
-41%
-20%
-42%-33%
-20%
-54% -56%
-21%-10% -10%
38%
-73%
-80%
-60%
-40%
-20%
0%
20%
40%
60%
0
5,000
10,000
15,000
20,000
25,0002014 2015 YOY growth
Source: CTR AdEx Power 2014-2015
67

MAGAZINE AD INVESTMENT
Total Monitored MG Ad Investment (2014 - 2015): RMB 14.7 Billion
-10.8%
-3.8%
-14.1%
-18.7%-20.8%
-16.4%
-21.6%-23.7% -23.3%
-21.8%-19.8%
-27.7%
-30%
-25%
-20%
-15%
-10%
-5%
0%
0
200
400
600
800
1,000
1,200
1,400
1,600
Jan2015
Feb Mar Apr May Jun Jul Aug Sep Oct Nov Dec
Ad investment YOY GrowthUnit: Million
2015 -20% YOY Growth
Magazine investment dropped by 20% in 2015
Source: CTR AdEx Power 2015
68

MAGAZINE AD INVESTMENT BY INDUSTRY
MG Monitored Ad Investment By Sectors (2014 & 2015)
-22%
-13%
-21%-25%
-10%
-28% -26%
-18% -20%-17%
-32%
-20%
-29% -30%
-38% -40%
-18%
11%
-7%
1%
-39%
-50%
-40%
-30%
-20%
-10%
0%
10%
20%
0
1,000
2,000
3,000
4,000
5,000
6,0002014 2015 YOY growth
Unit: Million
As seen for newspapers, ad spend on magazines decreased across all key categories
Source: CTR AdEx Power 2014-2015
69

FORMATS & CASES

CASE: SECRET GARDEN
After the popularity of coloring book ”secret garden”, a real estate company created its secret garden in the Nanjing Newspaper.
Advertise in a newspaper by the method of coloring just like the Secret Garden
Gain a social buzz on social media Encourage consumers to finish the work and win the prize.
71

With most leading print publishers now have online versions, print buys should not be restricted to hard copy.1.
Print still can be used for local activation coupled with interactive mechanism.2.
RECOMMENDATIONS ON PRINT
72

RADIO

Source:CMMS 2013-2015 Summer
1 hour 5 minutes on radio
Car Owners Non Car Owners58 minutes on radio 1 hour 11 minutes on radio
DAILY TIME SPENT ON RADIO (YESTERDAY)
15%
47%
11%
18%
52%
12%
18%
54%
11%
0%
10%
20%
30%
40%
50%
60%
Total Population Car Owners Non Car Owners
MONTHLY REACH OF RADIO 2013-2015 BY CAR OWNERSHIP
2013 2014 2015 Total Population
RADIO OVERVIEW
Radio continues to increase reach among car owners, however time spent per person declines with increase in light listeners
74

RADIO AD INVESTMENT
TOTAL MONITORED RD AD INVESTMENT (Jan- Dec 2015): 36.4 bn RMB
-2.4%
17.2%
-3.6%
7.6%6.7%
10.5%
17.3%
13.4%11.6%
12.9%
5.2%
11.9%
-5%
0%
5%
10%
15%
20%
0
500
1,000
1,500
2,000
2,500
3,000
3,500
4,000
4,500
Jan2015
Feb Mar Apr May Jun Jul Aug Sep Oct Nov Dec
Ad investment YOY GrowthUnit: Million
2015 YOY GROWTH9%
Radio investments grew at a steady pace of 9%
Source:CTR AdEx Power 2014-2015
75
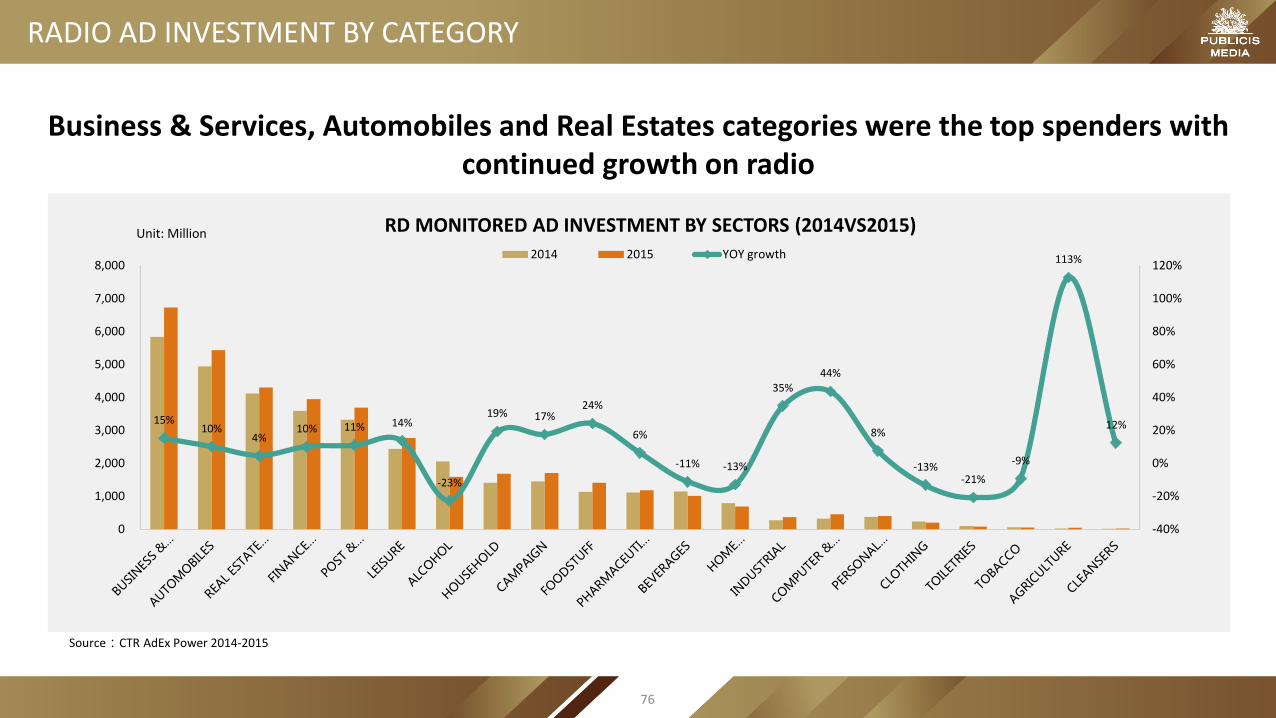
RD MONITORED AD INVESTMENT BY SECTORS (2014VS2015)
15%10%
4%10% 11% 14%
-23%
19% 17%24%
6%
-11% -13%
35%44%
8%
-13%-21%
-9%
113%
12%
-40%
-20%
0%
20%
40%
60%
80%
100%
120%
0
1,000
2,000
3,000
4,000
5,000
6,000
7,000
8,0002014 2015 YOY growth
Unit: Million
RADIO AD INVESTMENT BY CATEGORY
Business & Services, Automobiles and Real Estates categories were the top spenders with continued growth on radio
Source:CTR AdEx Power 2014-2015
76

MOBILE RADIO
65
59
66 6469 67
70 69 70 6971
74
0
10
20
30
40
50
60
70
80
3300
3400
3500
3600
3700
3800
3900
4000
4100
4200
2015 MOBILE RADIO COVERAGE
Coverage Time per person(min)
Unit:0000’
33%
23%
21%
6%
2%
2%
2% 2%
1% 1% 8%
SHARE OF TIME SPENT
Lazyaudio
Ximalaya FM
Qingting FM
Kwting
Kaola FM
Lizhi FM
ifeng FM
Douban FM
FM radio
Baidu Music
Others
Time spent on mobile radio is increasing with top 3 APP already occupying 70% of time
Source: mUsertracker, 2015
Unit:mins
77
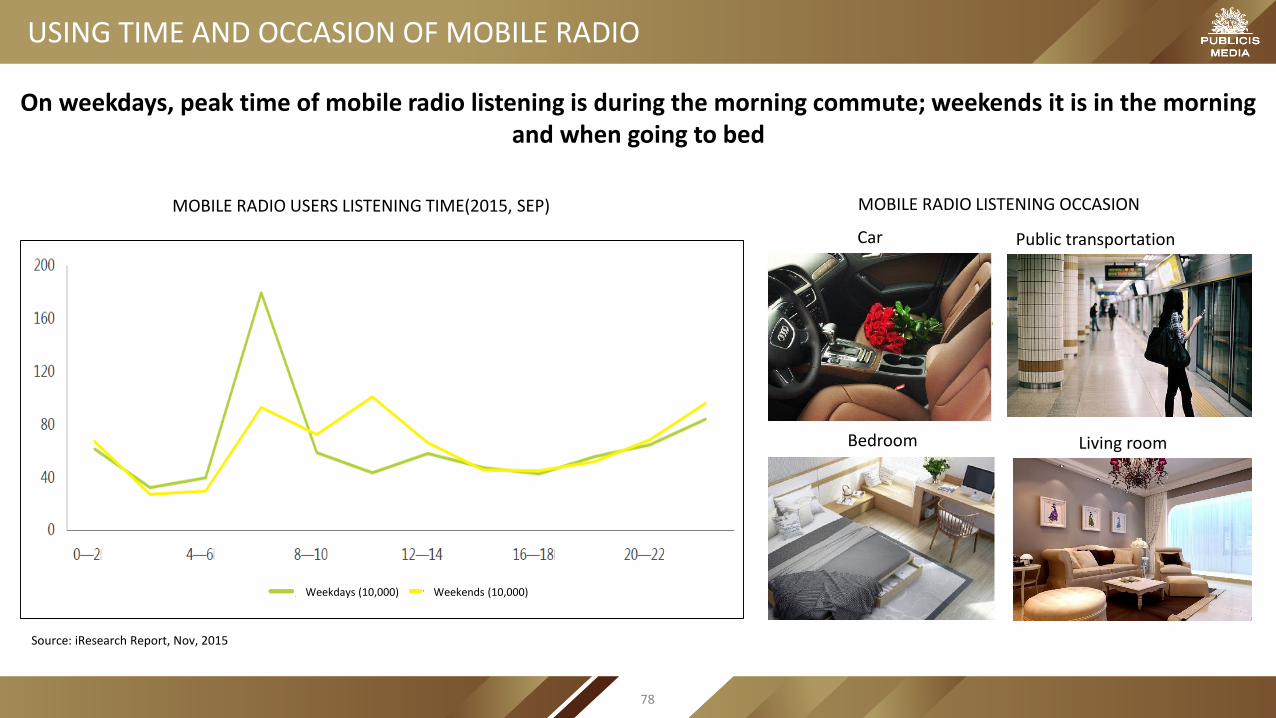
USING TIME AND OCCASION OF MOBILE RADIO
MOBILE RADIO LISTENING OCCASION
Car
Bedroom
Public transportation
Living room
MOBILE RADIO USERS LISTENING TIME(2015, SEP)
On weekdays, peak time of mobile radio listening is during the morning commute; weekends it is in the morning and when going to bed
Source: iResearch Report, Nov, 2015
Weekdays (10,000) Weekends (10,000)
78

As consumer would shift to mobile radio, it provides advertisers with newer formats and context based advertising opportunities. 1.
Car owners are still major radio listeners. Low cost radio programs can be used as part of an integrated plan targeting them.2.
RECOMMENDATIONS ON RADIO
79


OOH

OOH AD INVESTMENT
TOTAL MONITORED OOH AD INVESTMENT (Jan -Dec 2015): RMB 22.24 Billion
4.4%
14.3%
6.0%
2.0%4.7%
2.8%
-3.0%-5.1%
-8.9%
-5.2%
-7.7%
-4.3%
-15%
-10%
-5%
0%
5%
10%
15%
20%
1,650
1,700
1,750
1,800
1,850
1,900
1,950
2,000
Jan2015
Feb Mar Apr May Jun Jul Aug Sep Oct Nov Dec
Ad investment YOY Growth
Unit: Million
2015 YOY Growth:0%
OOH Investment remains stable in 2015
Source:CTR AdEx Power 2015
82

OOH AD INVESTMENT BY INDUSTRY
OOH Monitored Ad Investment By Sectors (Jan-Dec 2014 & 2015)
2.7% 1.2%
14.8%
4.1% 3.6%
-11.7% -10.0%
5.7%
-8.9%-17.8%
-5.7%
-18.9%
8.3%
-13.7%
-25.4%
7.3%
-22.7%
2.4%
19.1%
41.6%
-24.3%
-30%
-20%
-10%
0%
10%
20%
30%
40%
50%
0
1,000
2,000
3,000
4,000
5,000
6,000
Jan-Dec,2014 Jan-Dec,2015 YOYUnit: Million
FMCG category (beverage, food, toiletries) reduce their OOH investment, while business services, real estate and telecommunications have remained stable or increased investment
Source:CTR AdEx Power 2014-2015
83

TOP 10 OOH ADVERTISER IN 2015
Internet brands join in the competition, with 5 out of top 10 are from digital roots: Tmall, Guazi.com, Tuniu.com and JD.com. KFC remains the NO.1 of OOH media investment
Source:CODC 2015年
921
924
963
1,142
1,162
1,168
1,351
1,690
1,894
2,010
0 500 1,000 1,500 2,000 2,500
Suning
XiaoTianCai
MengNiu
Nongfu Spring
JD.com
TuNiu.com
Gold JianNan
Guazi.com
Tmall
KFC
YOY Growth
5%
224%
-
26%
66%
35%
-20%
86%
1796%
-29%
Unit: Million
84
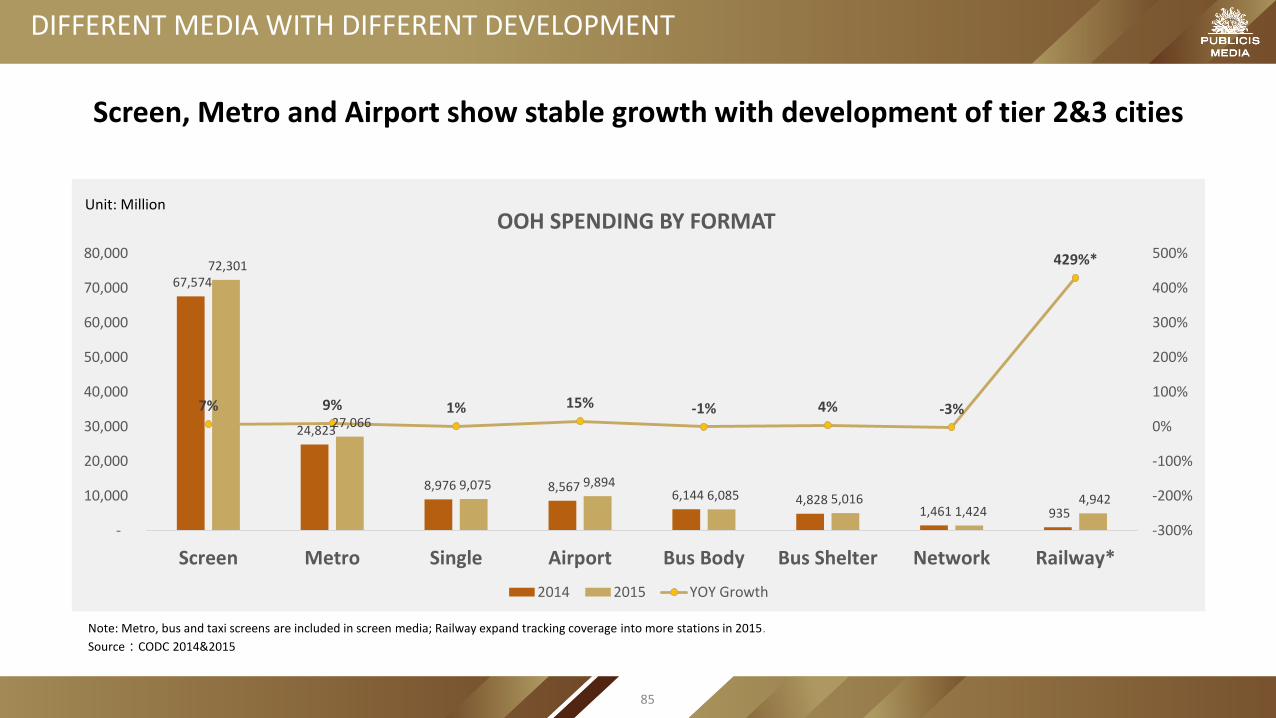
DIFFERENT MEDIA WITH DIFFERENT DEVELOPMENT
Screen, Metro and Airport show stable growth with development of tier 2&3 cities
Source:CODC 2014&2015
Note: Metro, bus and taxi screens are included in screen media; Railway expand tracking coverage into more stations in 2015.
Unit: Million
67,574
24,823
8,976 8,567 6,144 4,828
1,461 935
72,301
27,066
9,075 9,894 6,085 5,016
1,424 4,942
7% 9% 1% 15% -1% 4% -3%
429%*
-300%
-200%
-100%
0%
100%
200%
300%
400%
500%
-
10,000
20,000
30,000
40,000
50,000
60,000
70,000
80,000
Screen Metro Single Airport Bus Body Bus Shelter Network Railway*
OOH SPENDING BY FORMAT
2014 2015 YOY Growth
85

SCREEN AND METROS STILL THE KEY
Source:CODC 2014&2015
Unit: Million
Screen Media Comparison (Unit : RMB Million)
Media Type 2014 2015 Growth%
Building LCD 41,464 46,997 13%
LED Screen 12,680 13,777 9%
Metro TV 3,104 1,739 -44%
Bus LCD 3,690 4,591 24%
Metro LCD 3,104 1,739 -44%
Taxi Screen 2,403 783 -67%
Others 1,129 2,674 137%
Total 67,574 72,301 7%
Screen Media Share 55% 53%
Following the trend in 2014, screen media takes half the share of total OOH Spending, while Bus LCD and Building LCD grows the fastest
Metro20%
Single7%
Airport7%
Bus Body4%
Bus Shelter4%
Network1%
Railway Station4%
Building LCD35%
LED screen10%
Metro TV
Bus LCD 3%Metro LCD 1%
Taxi Screen1%
Others 2%
Screen Media53%
86

OOH TREND ACROSS TIERS
Source: CODC 2015
51%, Screen
24%, Metro
6%, Single
8%, Airport
4%, Bus Body
3%, Bus Shelter
1%, Network
4%, Railway
Screen
Metro
Single
Airport
Bus Body
Bus Shelter
Network
Railway
55%, Screen
19%, Metro
6%, Single
7%, Airport
5%, Bus Body
4%, Bus Shelter
3%, Railway
Screen
Metro
Single
Airport
Bus Body
Bus Shelter
Network
Railway
59%, Screen3%, Metro
13%, Single
5%, Airport
6%, Bus Body
8%, Bus Shelter
3%, Network
4%, Railway
Screen
Metro
Single
Airport
Bus Body
Bus Shelter
Network
Railway
SHARE OF OOH FORMAT INVESTMENT CROSS TIERS
Screen ads develop faster across all cities due to the improvement of infrastructure
12%7%2%
87
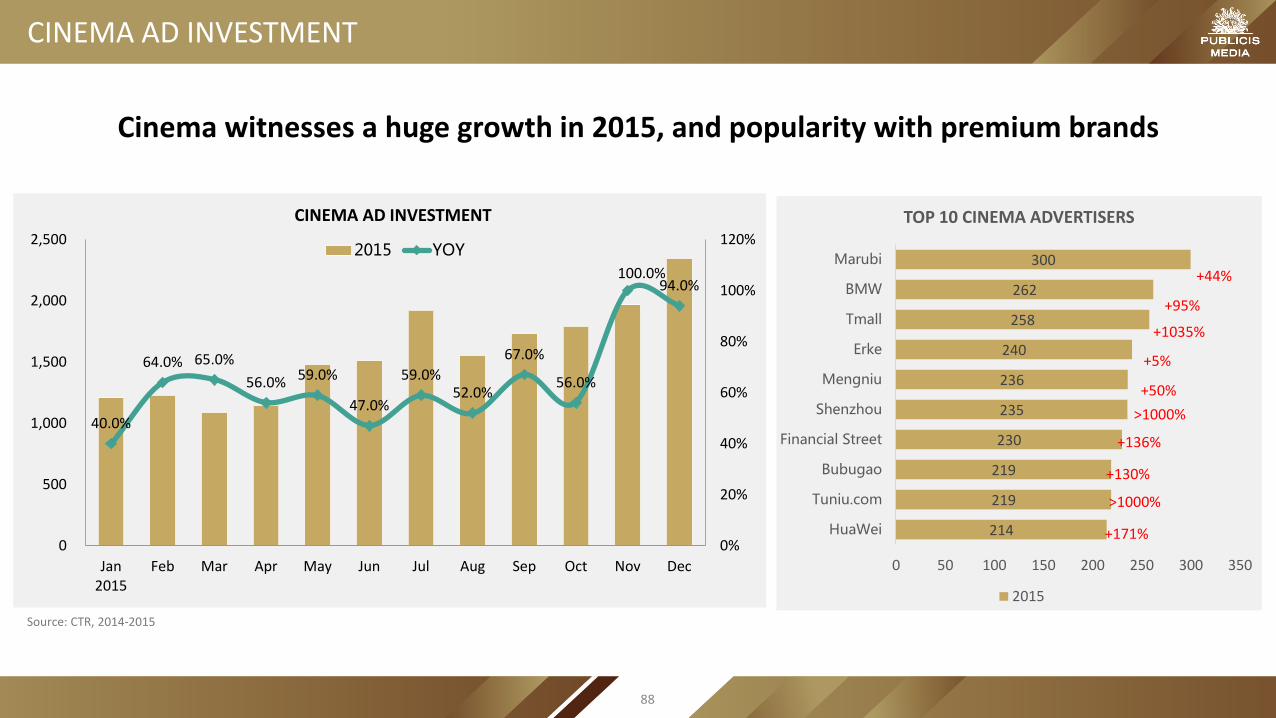
CINEMA AD INVESTMENT
40.0%
64.0% 65.0%
56.0% 59.0%
47.0%
59.0%52.0%
67.0%
56.0%
100.0%94.0%
0%
20%
40%
60%
80%
100%
120%
0
500
1,000
1,500
2,000
2,500
Jan2015
Feb Mar Apr May Jun Jul Aug Sep Oct Nov Dec
CINEMA AD INVESTMENT
2015 YOY
214
219
219
230
235
236
240
258
262
300
0 50 100 150 200 250 300 350
HuaWei
Tuniu.com
Bubugao
Financial Street
Shenzhou
Mengniu
Erke
Tmall
BMW
Marubi
TOP 10 CINEMA ADVERTISERS
2015
+44%
+95%
+1035%
+5%
+50%
+136%
+130%
>1000%
+171%
>1000%
Source: CTR, 2014-2015
Cinema witnesses a huge growth in 2015, and popularity with premium brands
88

FORMATS & CASES
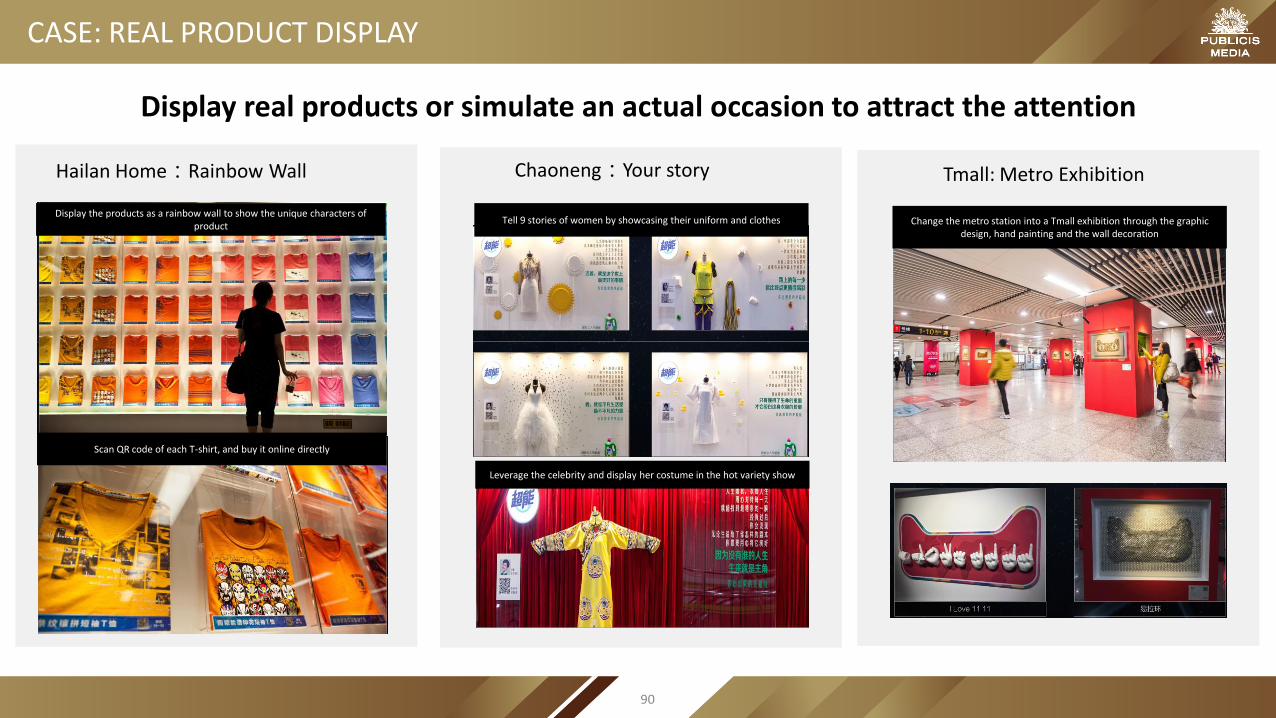
CASE: REAL PRODUCT DISPLAY
Hailan Home:Rainbow Wall Chaoneng:Your story Tmall: Metro Exhibition
Display the products as a rainbow wall to show the unique characters of product
Scan QR code of each T-shirt, and buy it online directly
Tell 9 stories of women by showcasing their uniform and clothes
Leverage the celebrity and display her costume in the hot variety show
Change the metro station into a Tmall exhibition through the graphic design, hand painting and the wall decoration
Display real products or simulate an actual occasion to attract the attention
90

CASE: DIRECTLY DRIVE SALES
Hailan Home: a Tin of T-shirt Georgia Coffee:The Sense of Smell Tangdaren: To be or not to be
Build up an independent space with brand elements and diffuse the coffee smell. It aims to enhance the consumer experience by combing
vision and scent.
Install an interactive devise to allow consumers to play the game by their phones, and the winners can get a free sample from the vending
machine or get a coupon.
Change the traditional light box to a interactive game machine to solve the YES OR NO problems in people’s life.
Consumers who attend the game can win a product.
Set up a t-shirt vending machine in the metro station
Scan QR code to attend the mobile game and win a tin of T-shirt
Set up a vending machine to encourage consumers to actively engage in the product experience and drive sales further.
91
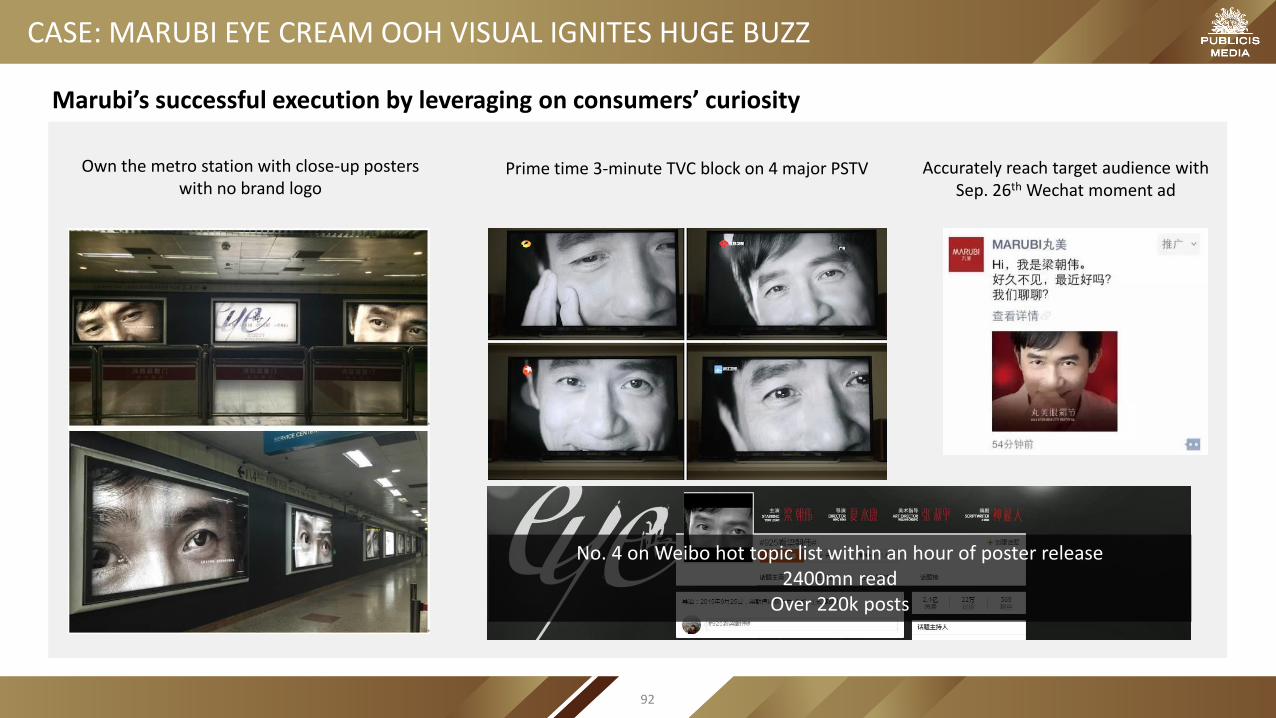
CASE: MARUBI EYE CREAM OOH VISUAL IGNITES HUGE BUZZ
Prime time 3-minute TVC block on 4 major PSTV
Marubi’s successful execution by leveraging on consumers’ curiosity
Own the metro station with close-up posters with no brand logo
Accurately reach target audience with Sep. 26th Wechat moment ad
No. 4 on Weibo hot topic list within an hour of poster release2400mn read
Over 220k posts
92
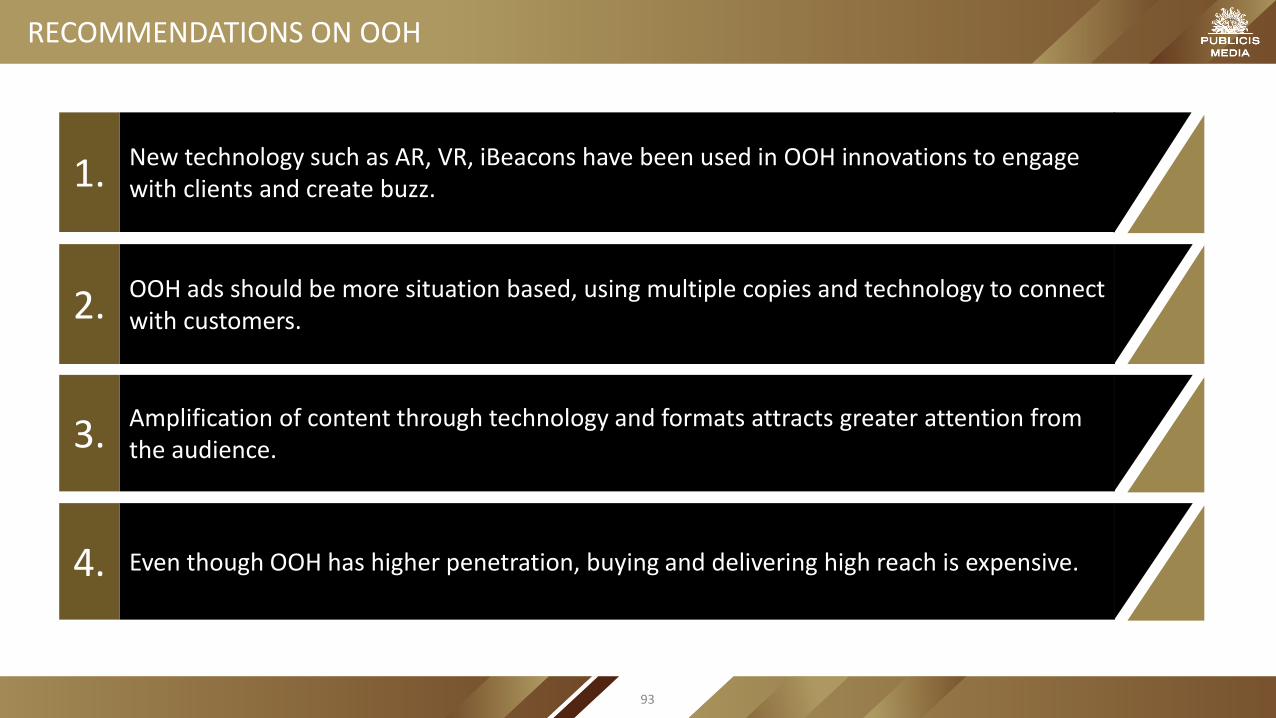
New technology such as AR, VR, iBeacons have been used in OOH innovations to engage with clients and create buzz. 1.
OOH ads should be more situation based, using multiple copies and technology to connect with customers.2.
Even though OOH has higher penetration, buying and delivering high reach is expensive.4.
RECOMMENDATIONS ON OOH
Amplification of content through technology and formats attracts greater attention from the audience. 3.
93

E-COMMERCE
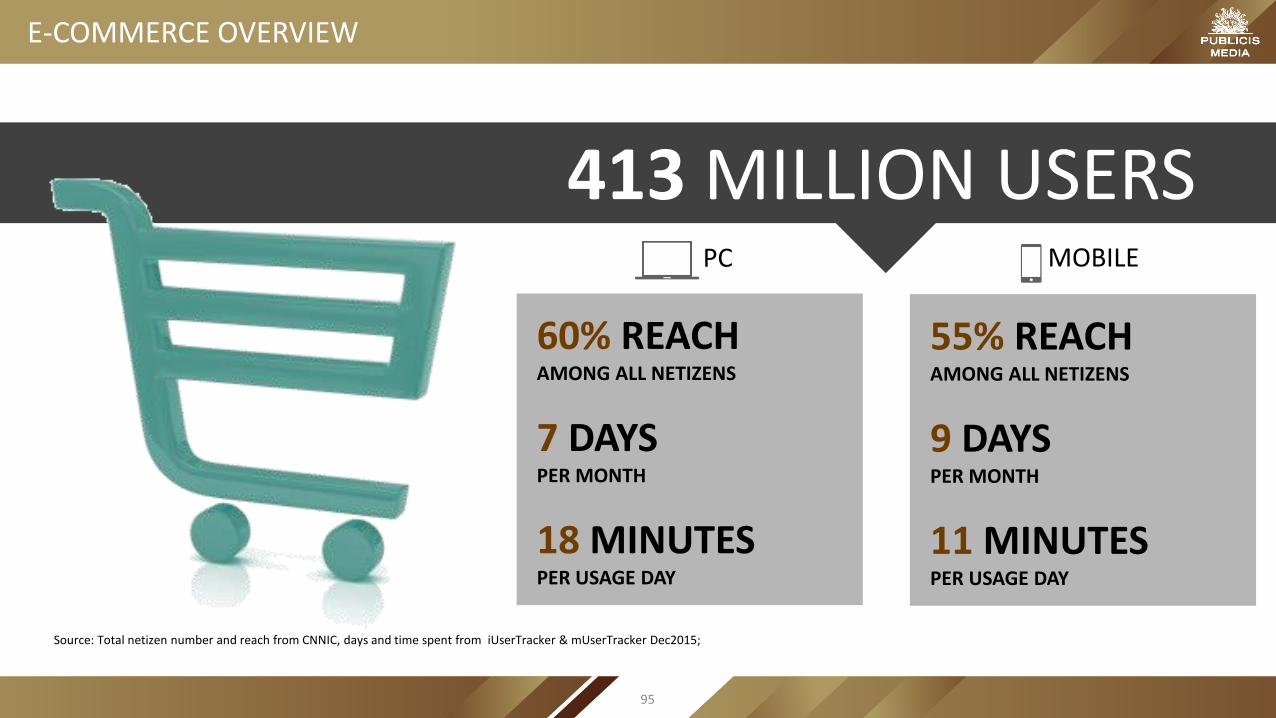
413 MILLION USERS
60% REACH AMONG ALL NETIZENS
7 DAYS PER MONTH
18 MINUTESPER USAGE DAY
PC MOBILE
55% REACH AMONG ALL NETIZENS
9 DAYS PER MONTH
11 MINUTESPER USAGE DAY
E-COMMERCE OVERVIEW
Source: Total netizen number and reach from CNNIC, days and time spent from iUserTracker & mUserTracker Dec2015;
95

61%17%
8%
3%
Taobao
Tmall
JD.com
VIP.com
Suning
Meituan (GB)
Dangdang
Yhd.com
Amazon
Others
-1%
+2%
Source: iUserTracker & mUserTracker Dec,2015
64%7%
6%
4%
3%2%1%
Taobao
Meituan (GB)
Jindong
Tmall
VIP
Mogujie
Meilishuo
Jumei
Juhuasuan (GB)
Nuomi (GB)
Others
PCMOBILE
-1%
TOP EC PLATFORMS ACROSS DEVICES
SHARE OF TIME SPENT ON EC
-1%
+3%
Alibaba drives growth with increased share on mobile
96

B2C VS. C2C
Source: Analysys Report, Q4, 2015
B2C takes up more than half share of all transactions, dominated by TMALL and JD
25.8%36.1%
41.9%47.8% 52.5%
74.2%63.9%
58.1%52.2% 47.5%
0%
10%
20%
30%
40%
50%
60%
70%
80%
90%
100%
2011 2012 2013 2014 2015
ONLINE SHOPPING MARKET - B2C VS. C2C BY TOTAL TRANSACTIONS
B2C C2C
63.5%
20.8%
2.6%2.5%
1.5%
0.9%
0.8%0.8%
MARKET SHARE OF TOP B2C PALYERS BY TOTAL TRANSACTIONS
TMALL
JD.com
VIP.com
Suning.com
Gome.com.cn
Dangdang
yhd.com
Amazon.cn
Jumei.com
Others
97
M-COMMERCE
Source: Alibaba Business Consulting(生意参谋); QuestMobile M-commerce Report, 2016
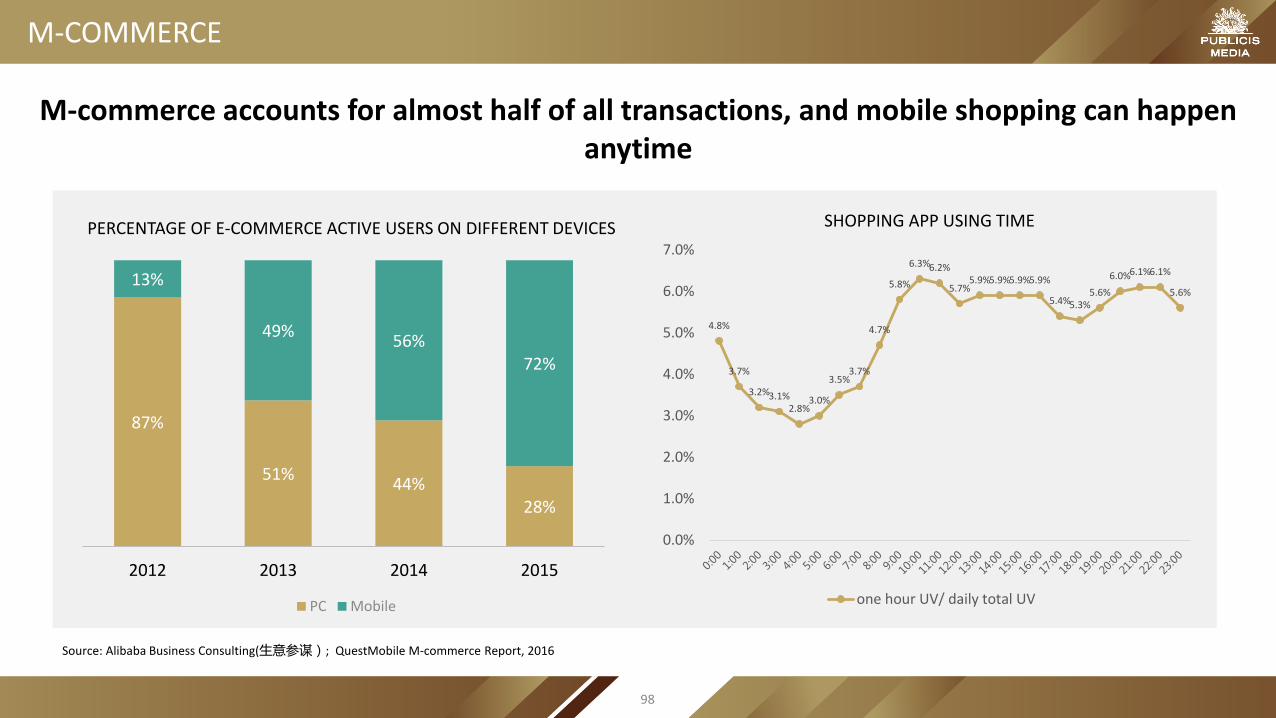
M-commerce accounts for almost half of all transactions, and mobile shopping can happen anytime
4.8%
3.7%
3.2%3.1%2.8%
3.0%
3.5%3.7%
4.7%
5.8%
6.3%6.2%
5.7%5.9%5.9%5.9%5.9%
5.4%5.3%5.6%
6.0%6.1%6.1%
5.6%
0.0%
1.0%
2.0%
3.0%
4.0%
5.0%
6.0%
7.0%
SHOPPING APP USING TIME
one hour UV/ daily total UV
87%
51%44%
28%
13%
49%56%
72%
2012 2013 2014 2015
PC Mobile
PERCENTAGE OF E-COMMERCE ACTIVE USERS ON DIFFERENT DEVICES
98

CROSS-BORDER E-COMMERCE
In 2015, overseas purchase and cross-border e-commerce platform both launched a big promotion on Black Friday, with the aim of taking the market share before 11.11
56%54%
46%39%
28%27% 28%
0%
10%
20%
30%
40%
50%
60%
0
20
40
60
80
100
120
140
160
180
200
2012 2013 2014 2015 2016e 2017e 2018e
CHINA CROSS-BORDER E-COMMERCE TRANSACTION
Transcation YOY growth
Unit: Million RMB
Source: iResearch Report, March, 2016
Based on YangMatou’s data, during its Black Friday Promotion of 2015, it increased millions new users and 60% of them are the first time to do overseas purchase. The cost per customer transaction is more than 500 yuan, and the average cost of each
person is over 1500 yuan.
99
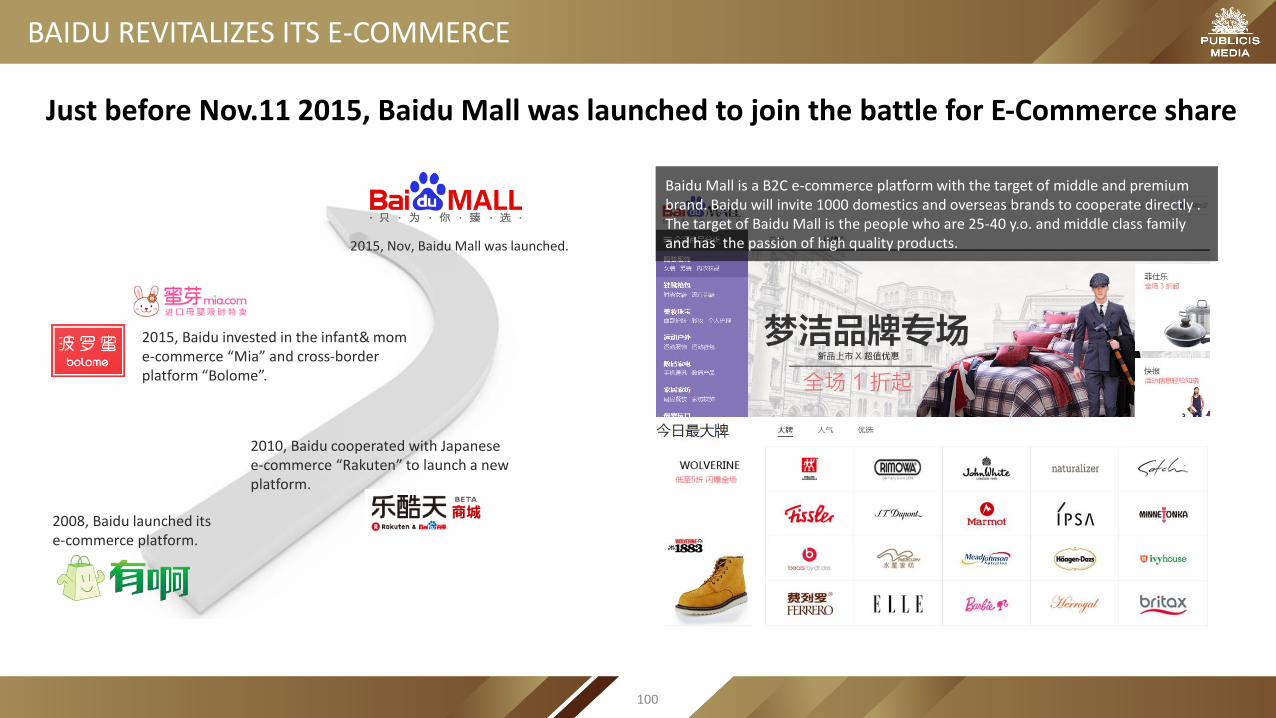
Baidu Mall is a B2C e-commerce platform with the target of middle and premium brand. Baidu will invite 1000 domestics and overseas brands to cooperate directly . The target of Baidu Mall is the people who are 25-40 y.o. and middle class family and has the passion of high quality products.
2008, Baidu launched its e-commerce platform.
2010, Baidu cooperated with Japanese e-commerce “Rakuten” to launch a new platform.
2015, Baidu invested in the infant& mom e-commerce “Mia” and cross-border platform “Bolome”.
2015, Nov, Baidu Mall was launched.
Just before Nov.11 2015, Baidu Mall was launched to join the battle for E-Commerce share
BAIDU REVITALIZES ITS E-COMMERCE
100

FORMATS & CASES

DOUBLE 11 GALA
0.00
0.50
1.00
1.50
2.00
2.50
3.00
Rating
Hunan PSTV Zhejiang PSTV CCTV-1 CCTV-6
On the night of Nov 10th , the rating of Tmall gala is much higher than other programs, and is 2.5 times as much as that of Jingdong gala.
The 11.11 gala held by Tmall and Hunan PSTV went far beyond the previous ones. It combined TV and e-commence creating a new model of TV shopping and cross-screen interaction that allowed consumers to watch, play and buy at the
same time,
Consumers can attend interaction by shaking mobile and guessing and have a chance to win a “1 yuan” product.The total sales of double 11 is 91.2 billion. Mobile transaction accounts for 68% and one of the important reasons is the traffic from TV.
Data Source: Infosys 2015年11月10日数据;Target:P20-45;2000-2400;全国城市组
102
CASE: GO RURAL
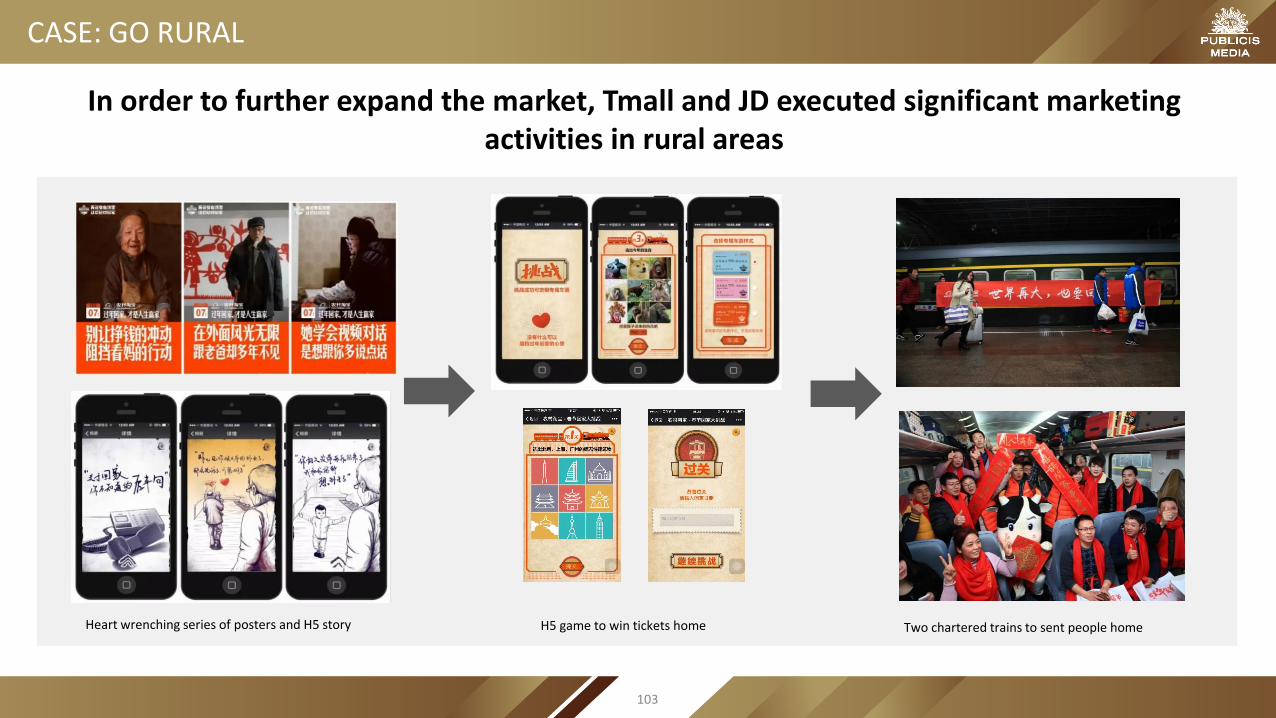
In order to further expand the market, Tmall and JD executed significant marketing activities in rural areas
Heart wrenching series of posters and H5 story H5 game to win tickets home Two chartered trains to sent people home
103

Need to manage duplication and context as re-targeting technology allows targeting the same person behind various screens.1.
TV and OTV can drive traffic to E-commerce, therefore, should be planned together.2.
E-commerce can not only drives conversion, but can also help build band awareness and provide product information.3.
RECOMMENDATIONS ON E-COMMERCE
104

SEARCH
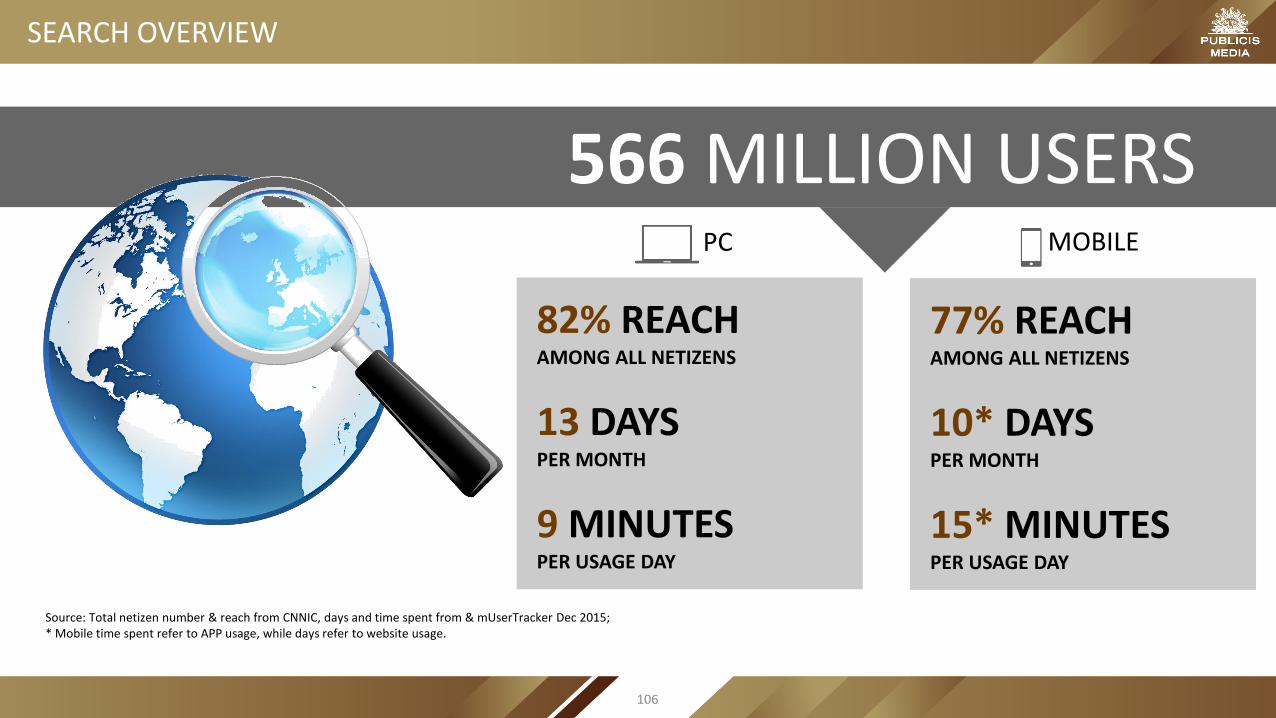
566 MILLION USERS
82% REACH AMONG ALL NETIZENS
13 DAYS PER MONTH
9 MINUTESPER USAGE DAY
PC MOBILE
77% REACH AMONG ALL NETIZENS
10* DAYSPER MONTH
15* MINUTESPER USAGE DAY
Source: Total netizen number & reach from CNNIC, days and time spent from & mUserTracker Dec 2015;* Mobile time spent refer to APP usage, while days refer to website usage.
SEARCH OVERVIEW
106

SEARCH RANKING BY PAGE VIEWS
0%
-4%
-3%
-1%
-32%
Source: iUsertracker & mUsertracker Jan-Dec, but Shenma is not well tracked according to the market share published by CNZZ, Mar 2015Note: PVs are within iResearch panel geography, scale may not be representative of the total online population
-
10,000
20,000
30,000
40,000
50,000
60,000
70,000
80,000
Jan
-15
Feb
-15
Mar
-15
Ap
r-1
5
May
-15
Jun
-15
Jul-
15
Au
g-15
Sep
-15
Oct
-15
No
v-15
Dec
-15
PV OF SEARCH ENGINE ON PC (Mil)
Baidu 360 Sogou Etao
Google Soku Bing
-10,000
-
10,000
20,000
30,000
40,000
50,000
60,000
Jan
-15
Feb
-15
Mar
-15
Ap
r-1
5
May
-15
Jun
-15
Jul-
15
Au
g-15
Sep
-15
Oct
-15
No
v-15
Dec
-15
PV OF SEARCH ENGINE ON MOBILE (Mil)
Baidu Easou Sogou Etao Bing
+27%
Usage of 360 search continues to grow in PV, though still dwarfed by Baidu’s dominant share of search. In mobile, Sogou surpassed Easou to be the No 2 search engine
Change in Reach
Change in Reach
Baidu, 80%
Shenma*, 13%
Sogou, 6%
MARKET SHARE OF MOBILE SEARCH
107

PC & MOBILE DIFFERENCES CROSS TIME
0 1 2 3 4 5 6 7 8 9 1 0 1 1 1 2 1 3 1 4 1 5 1 6 1 7 1 8 1 9 2 0 2 1 2 2 2 3
Monday
Tuesday
Wednesday
ThursdayFriday
Saturday
Sunday
PC MOBILE
Source: Baidu Tanxing Jul 2015
PC dominates working time (day and week days) while mobile spikes up during ‘me’ time (night and weekends)
PC VS. MOBILE SEARCH CROSS THE DAY
PCMOBILE
PC VS. MOBILE SEARCH CROSS THE WEEK
108

Trend
Queries will increasingly become more conversational and precise with specific questions.
Conversational questions will expect conversational answers, inviting new styles of copywriting.
Implications for brands
For brands, it will imply a clear identification of the question and connecting it to precise and to the point results, in order to avoid frustration
It will also require the creation of assets that can be read out loud by AI assistants, making AI compatible assets a crucial part of the content production expertise.
Better
Voice vs. key in10 times faster
Can hear and understand your needs
With better communication
Always improving user experience
Faster
Smarter
50% MILLENNIALS and 100% POST 90’Shave used voice search
VOICE SEARCH WILL TRANSFORM THE WAY BRANDS RESPOND
109

FORMATS & CASES

CASE: L’OREAL PLAY WITH BRAND ZONE
• Search the key word “玻尿酸”or “范冰冰”, an creative animation will pop up;• Adopt the customized floating ads and tailor-made brand zone to demonstrate the news product.
Version 1 Version 2
L'Oréal worked with Baidu mobile platform with a creative animation appearing when certain key words are searched
111

1.
2.
3.
4.
RECOMMENDATIONS ON SEARCH
360 is threatening Baidu’s dominance with the second largest market share on PC. Baidu still secures its absolute leading position when combined with their mobile search offering.
Baidu releases a very robust voice search functionality, efficiency and ease of voice based searching means this is expected to gain popularity very quickly.
Shema gaining popularity on mobile. This is Alibaba’s mobile search engine and particularly important for ecommerce players.
Baidu increasingly offers highly tailored, interactive and rich advertising formats to advertisers.
112

PROGRAMMATIC BUYING

PROGRAMMATIC INVESTMENT USA VS. CHINA
3%
8%
15%
23%
29%
35%
0.00%
5.00%
10.00%
15.00%
20.00%
25.00%
30.00%
35.00%
40.00%
0
5
10
15
20
25
30
35
40
45
50
2013 2014 2015 2016e 2017e 2018e
PROGRAMMATIC DISPLAY INVESTMENT IN CHINA
Programmatic digital display ad spending
% of total China digital display ad spending
10.32
15.43
21.55
26.78
49%
59%
67%72%
0%
10%
20%
30%
40%
50%
60%
70%
80%
0
5
10
15
20
25
30
2014 2015e 2016e 2017e
PROGRAMMATIC DISPLAY INVESTMENT IN USA
Programmatic digital display ad spending
% of total US digital display ad spending
China witnesses a rapid growth in programmatic investment however way behind USA
Source: USA data from eMarketer, Oct 2015O; China data from iResearch Report, Mar 2016.
Unit: Billion (USD) Unit: Billion (RMB)
114
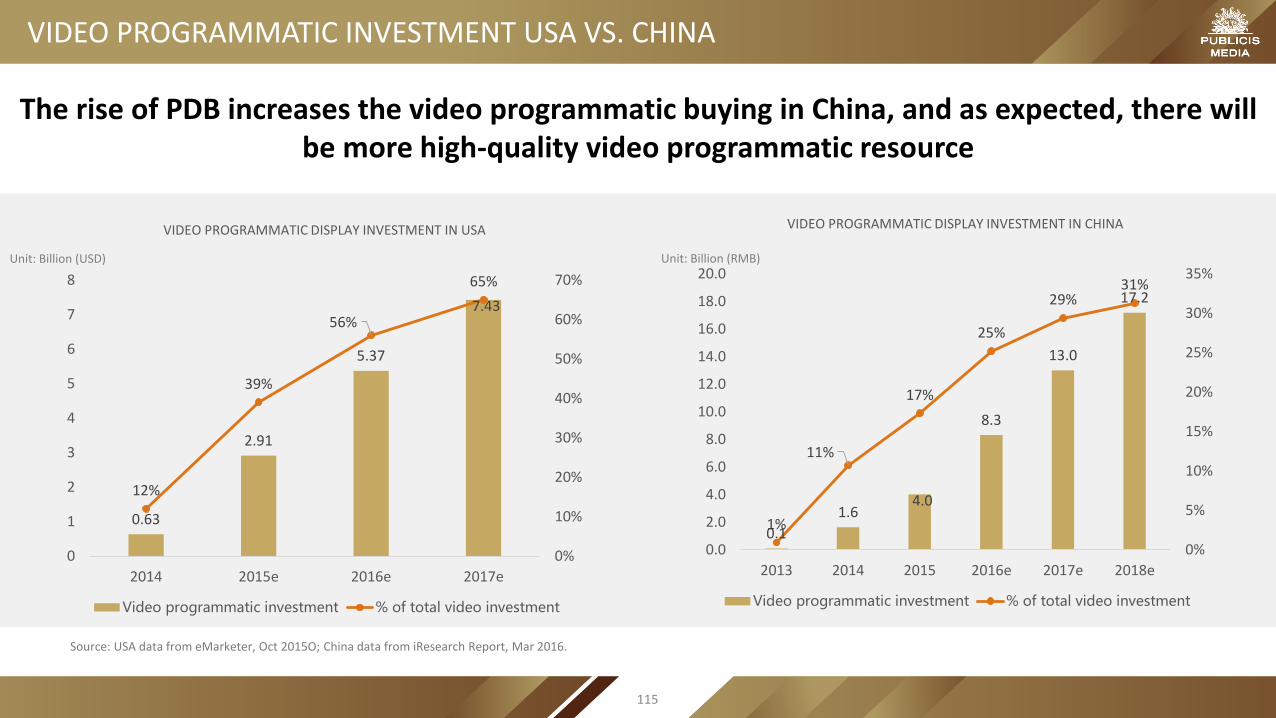
VIDEO PROGRAMMATIC INVESTMENT USA VS. CHINA
0.63
2.91
5.37
7.43
12%
39%
56%
65%
0%
10%
20%
30%
40%
50%
60%
70%
0
1
2
3
4
5
6
7
8
2014 2015e 2016e 2017e
VIDEO PROGRAMMATIC DISPLAY INVESTMENT IN USA
Video programmatic investment % of total video investment
0.1
1.64.0
8.3
13.0
17.2
1%
11%
17%
25%
29%31%
0%
5%
10%
15%
20%
25%
30%
35%
0.0
2.0
4.0
6.0
8.0
10.0
12.0
14.0
16.0
18.0
20.0
2013 2014 2015 2016e 2017e 2018e
VIDEO PROGRAMMATIC DISPLAY INVESTMENT IN CHINA
Video programmatic investment % of total video investment
The rise of PDB increases the video programmatic buying in China, and as expected, there will be more high-quality video programmatic resource
Source: USA data from eMarketer, Oct 2015O; China data from iResearch Report, Mar 2016.
Unit: Billion (USD) Unit: Billion (RMB)
115

CHINA MOBILE PROGRAMMATIC INVESTMENT
China saw a huge growth of mobile programmatic buying, and mobile resource has tripled in the RTB market
5% 8%29%
40%47%
54%
100% 95% 92%
71%60%
53%47%
0%
10%
20%
30%
40%
50%
60%
70%
80%
90%
100%
2012 2013 2014 2015 2016e 2017e 2018e
2012-2018 CHINA PROGRAMMATIC INVESTMENT IN DIFFERENT DEVICES
MOBILE PC
PC Mobile
2014-2015 CHINA PROGRAMMATIC SOURCE
2014 2015
~80bn PV/day
~10bn PV/day
~1bn PV/day
~3bn PV/day
Source: iResearch Report, March, 2016
116

SEMANTIC TARGETING
• The semantic targeting strategy could better reach audience with recent purchase intention and influence their consumption. It is suitable for advertiser’s on-hand promotion.
• The conventional DSP + semantic targeting strategy is suitable for the campaign during holidays and special media environment. It could improve the ads efficiency and help brands stand out from the exploding ads.
Semantic targeting better reach audience with recent purchase intension
Conventional DSP reached more TA with demographic labels
45 41
3458
Converional DSP Semantic Targeting
When do you plan to go to the market?
in a week in 1-2 days
+20%
98%
2%
Conventional DSP
TA Non-TA
75%
25%
Semantic DSP
TA Non-TA
Source: VivaKi 2015 Programmatic Ads Research White Paper
117

CONSUMPTION TARGETING
• The consumption targeting strategy could effectively grab audiences with special consumption characteristics and make up for the conventional DSP targeting’s weakness on premium consumer targeting.
• The consumption targeting strategy is suitable for luxury goods, automobiles, and other premium categories that require participation of high consumption level audiences. It will effectively improve conversion rate of premium brand’s campaign.
Consumption Targeting Largely Improved the Campaign Efficiency
KPI Actual
CPC
in a week
-18%
Source: VivaKi 2015 Programmatic Ads Research White Paper
Leads
X4 times than planned
DMP
DSP
Conduct special group from multiple data sources:• Live in 5-stars hotel• Bought premium brand• ……
Deliver ads to TA:• Luxury consumers• Real estate consumers• ….
118

CONTEXTUAL TARGETING
• The contextual targeting strategy could effectively facilitate the conversion of the audiences who have positive attitude toward the brands.
• For new brand or new product, the campaign should focus on those who have positive brand impression to improve the brand preference and facilitate purchase conversion. For those matured brands, the campaign should on the one hand deliver promotion ads to those positive audiences. On the other hand, it will also deliver branding ads to those negative audiences to improve the brand images.
Trigger Ads on 2nd And 3rd Screens Based on TV Ads
Contextual Targeting Could Deliver Different Ads Based on the Social Buzz
Contextual Targeting Effectively Improved Audience’s Brand Image and Largely Increased the Brand Favorability
24%20%
28%
46%
35%
54%
44% 46% 48% 46%
BrandFavorability
PurchaseIntention
ComprehensiveComposition
Blanced Nutrition Professional
The Target Brand Index (%)
Control Contextual Targeting
Source: VivaKi 2015 Programmatic Ads Research White Paper
119

OTV PROGRAMMATIC BUYING:DSP+REGULAR BUY
• Comparing to regular buy, DSP can make better cross-platform frequency control and effectively utilize inventory to precisely reach TA.
• Supplying DSP ads on the basis of regular buy can take full advantage of UGC/PGC inventory. Combining DSP with regular buy as an integral solution will largely enhance TA accuracy, brand impression, and drive audience’s consumption.
• In terms of exposure environment, there can be 6-8 pre-rolls before the hero videos, which will largely distract audiences’ attention and memory. On the contrast, there are only 1-2 pre-rolls before the UGC/PGC. The exclusiveness will ensure the audience’s attention and long-term memory.
DSP Inventory Resulted in Higher Visual Attention and long-term memory
DSP+ Regular Buy Improved Brand Favorability & Purchase Intention
0.03 0.01
Regular Buy DSP
0.59 0.67
25.7 28.8
Emotion
Visual Attention
Long-term memory
Source: VivaKi 2015 Programmatic Ads Research White Paper
Control Regular Buy DSP only Combo
Brand Favorability
10%
Control Regular Buy DSP only Combo
Purchase Intention
30%
120

OTV PROGRAMMATIC BUYING:RTB+PDB
• PDB can target a large number of active audiences and achieve large coverage through premium inventory. RTB inventory can be more accurate and more flexible to reach TA. PDB + RTB strategy can effectively achieve frequency capping cross media, reduce the campaign cost, and effectively reach the target audiences.
• PDB + RTB strategy should be widely used in the video programmatic buying. Advertisers should allocate budget on PDB and RTB wisely based on campaign spending and goal.
PDB Could Reached Broader Group, while RTB more precisely reached the TA with Demographic Labels
Source: VivaKi 2015 Programmatic Ads Research White Paper
Inventory Pricing InventoryCost
Effeciency
PDB Reserved Fixed ☆☆☆ ☆
RTB Open Bidding ☆ ☆☆☆
34.3%24.4%
PMI over 5000 RMB:
Most likely to buy the brand:
27.5% 21.2%
RTB+ PDB Largely lifted the Brand Performance
(RTB) (PDB)
(PDB)(RTB)
Unaided Brand Awareness:
Purchase Intention:
Brand Recommendation:
7.6%
10.1%
8.9%
121

OTV PDB ADVANTAGES
Media Buying VivaKi Inventory ManagerSelected Inventory
Unselected Inventory
Client Platform
VivaKi DMP
Other Advertisers
Experienced top video
media negotiation
Competitive media price
under PUBLICIS Group
All PDB tech supported
Successfully served many
industry-leading clients
VivaKi DMP empower DSP to know more about the audience.
Returnable media has no extra charge.
Frequency Capping & High-Quality inventory to increase TA
coverage. With the help of VivaKi DMP data, AOD covers
potential target efficiently.
Inventory returnable model
122

0.8B
Daily active users
90%
Social market share
Cross screens
Unique technic
85%
Mobile socialmarket share
6B PV
Daily volume
Purchasing behavior, app behavior, ’like’
behavior、SNS search behavior
Blog, Weibo, album, video, shuoshuo,
wenwen
Birthday,Anniversary, gift,
LBS…
Gender, Age,location, education, profession, school…
OnlineBehavior
Data
ContentData
SituationData
DemographicData
Friends' Feed
Friend interactionFriends’ sharingFriends’ commentFriends’ game……
Relationship chain
Friend recommendation
SocialChannel
Targeting accurate TA by Tencent big data – Users’ real QQ personal information, location, Qzone blog content, QQ group etc..
Social Data System
SOCIAL DATA MAKING MORE POSSIBILITIES
123
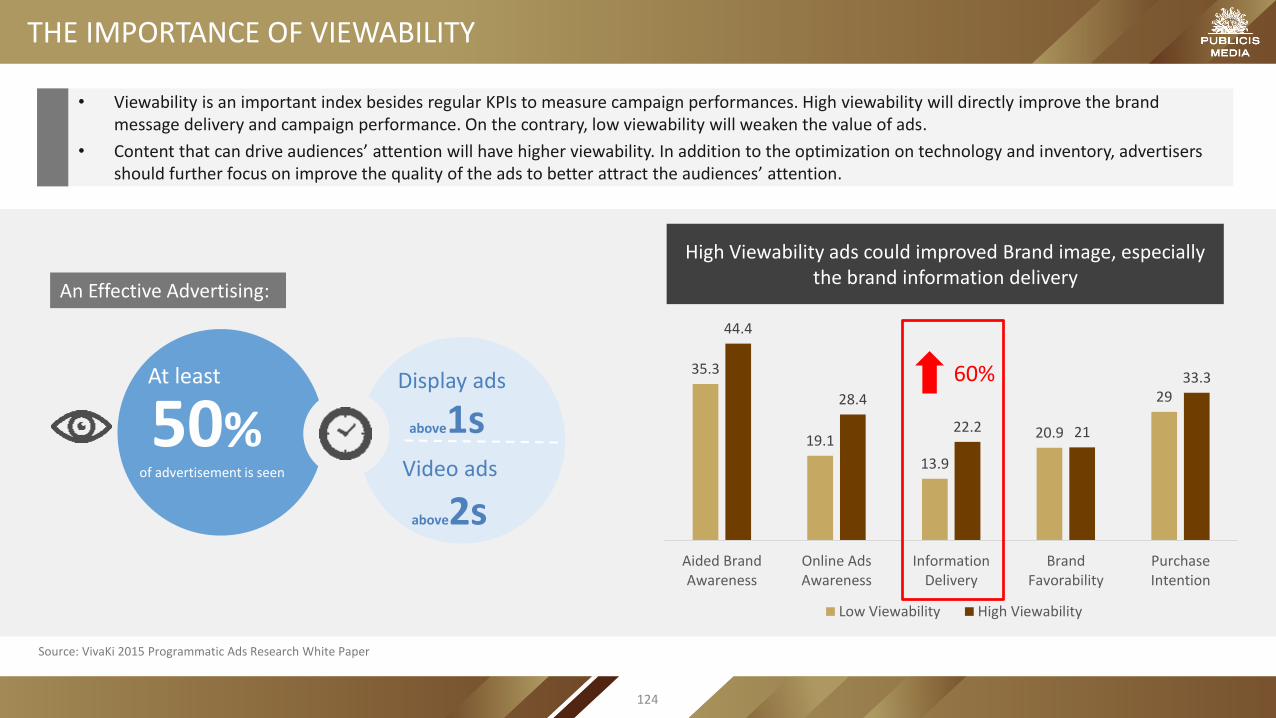
THE IMPORTANCE OF VIEWABILITY
• Viewability is an important index besides regular KPIs to measure campaign performances. High viewability will directly improve the brand message delivery and campaign performance. On the contrary, low viewability will weaken the value of ads.
• Content that can drive audiences’ attention will have higher viewability. In addition to the optimization on technology and inventory, advertisers should further focus on improve the quality of the ads to better attract the audiences’ attention.
50% above1s
above2s
At least
of advertisement is seen
Display ads
Video ads
An Effective Advertising:
High Viewability ads could improved Brand image, especially the brand information delivery
35.3
19.1
13.9
20.9
29
44.4
28.4
22.2 21
33.3
Aided BrandAwareness
Online AdsAwareness
InformationDelivery
BrandFavorability
PurchaseIntention
Low Viewability High Viewability
60%
Source: VivaKi 2015 Programmatic Ads Research White Paper
124

FORMATS & CASES
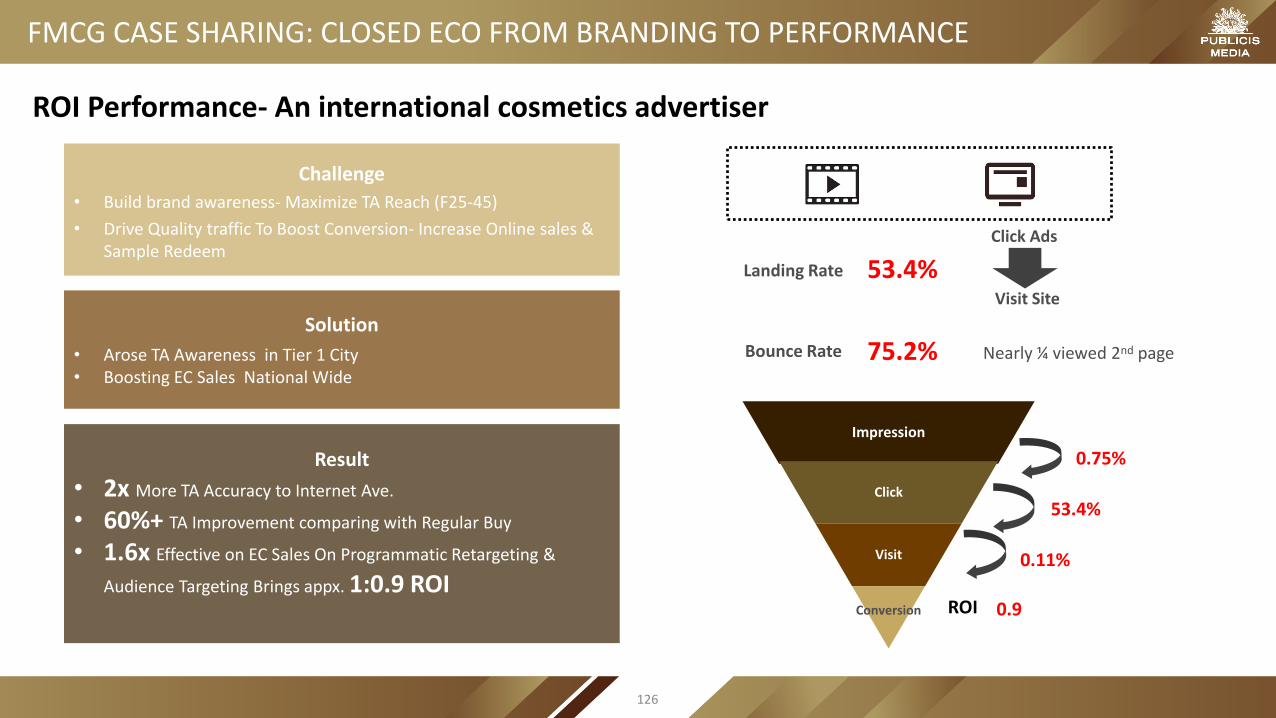
FMCG CASE SHARING: CLOSED ECO FROM BRANDING TO PERFORMANCE
0.75%
53.4%
0.11%
Landing Rate 53.4%
Click Ads
Visit Site
Impression
Click
Visit
Conversion ROI 0.9
Challenge
• Build brand awareness- Maximize TA Reach (F25-45)
• Drive Quality traffic To Boost Conversion- Increase Online sales & Sample Redeem
Solution
• Arose TA Awareness in Tier 1 City• Boosting EC Sales National Wide
Result
• 2x More TA Accuracy to Internet Ave.
• 60%+ TA Improvement comparing with Regular Buy
• 1.6x Effective on EC Sales On Programmatic Retargeting &
Audience Targeting Brings appx. 1:0.9 ROI
Bounce Rate 75.2% Nearly ¼ viewed 2nd page
ROI Performance- An international cosmetics advertiser
126

An health product adviser
Challenge
• 4 different Landing Pages
• Find The Right People + Push The Right Message
Solution• Audience interest labels; based on four product lines, SEM search
Intention, Shop geo-targeting• Machine allocate budget by time/hours performance & Geo
performance • Various creative concepts in 1 product line to stimulate the landing
site engagements
Result
• CTR/clicks over achieved at both PC & Mobile; esp. Mobile CTR is
2x better than est.
• PC Engagement- Landing Rate
Is 1.25x better than Drama Buy
Is 1.5x better than Regular Buy
0.6%
0.3%
0.2%
AOD Direct Buy Drama Buy
CTR
60%
41%48%
AOD Direct Buy Drama Buy
Landing Rate
85%86%
85%
AOD Direct Buy Drama Buy
Bounce Rate
PHARMACEUTICAL CASE SHARING: FIND THE RIGHT PEOPLE + PUSH THE RIGHT MESSAGE
127

Besides performance and efficiency, inventory quality and media environment are also important criteria. Therefore, PDB+RTB is becoming the mainstream for programatic buy.1.
Each targeting method has its own strength. Careful selection or mix is required according to the communication purpose.2.
Social big data can be used to target certain TA, but be careful with privacy issue.3.
RECOMMENDATION ON PROGRAMATIC BUY
128

BERTILLA TEO PUBLICIS MEDIA GREATER CHINA CEO MYKIM CHIKLI PUBLICIS MEDIA GREATER CHINA COO