2015 Energy Balance for the Corn-Ethanol Industry · The ratio of energy in a gallon of ethanol...
21
Office of the Chief Economist Office of Energy Policy and New Uses February 2016 2015 Energy Balance for the Corn-Ethanol Industry
Transcript of 2015 Energy Balance for the Corn-Ethanol Industry · The ratio of energy in a gallon of ethanol...

Office of the Chief Economist Office of Energy Policy and New Uses February 2016
2015 Energy Balance for the Corn-Ethanol Industry
1
2015 Energy Balance for the Corn-Ethanol Industry
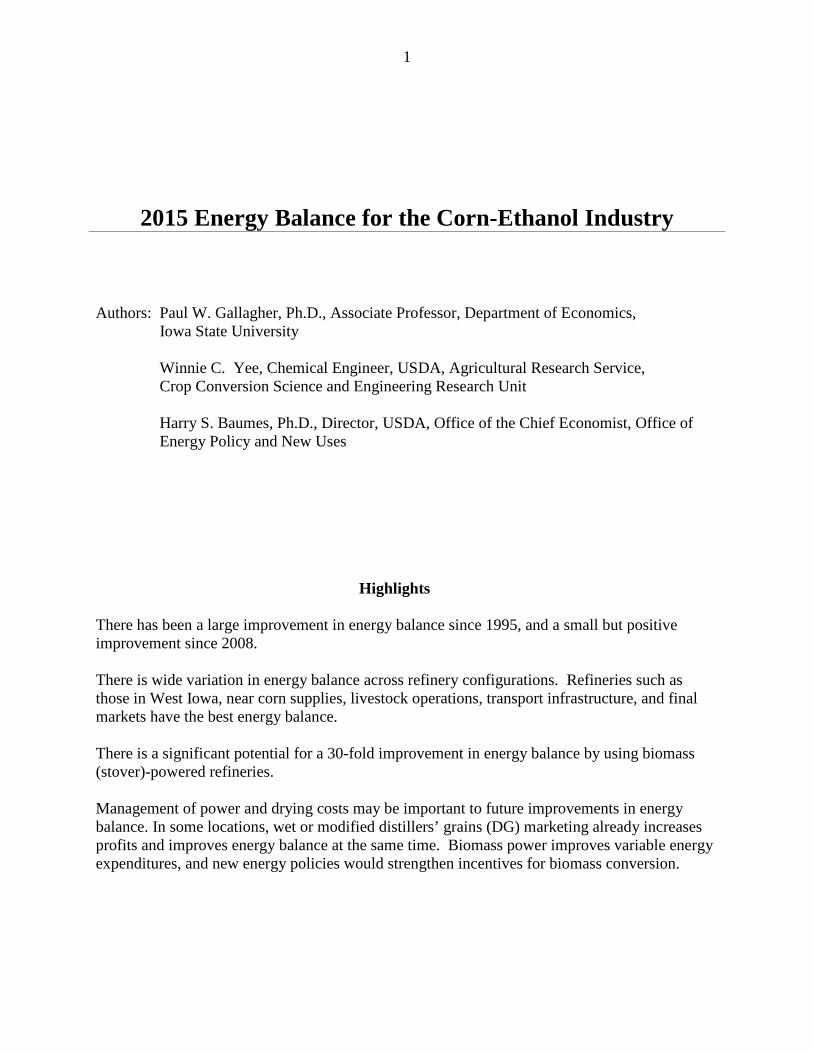
Authors: Paul W. Gallagher, Ph.D., Associate Professor, Department of Economics, Iowa State University Winnie C. Yee, Chemical Engineer, USDA, Agricultural Research Service, Crop Conversion Science and Engineering Research Unit Harry S. Baumes, Ph.D., Director, USDA, Office of the Chief Economist, Office of Energy Policy and New Uses
Highlights
There has been a large improvement in energy balance since 1995, and a small but positive improvement since 2008.
There is wide variation in energy balance across refinery configurations. Refineries such as those in West Iowa, near corn supplies, livestock operations, transport infrastructure, and final markets have the best energy balance.
There is a significant potential for a 30-fold improvement in energy balance by using biomass (stover)-powered refineries. Management of power and drying costs may be important to future improvements in energy balance. In some locations, wet or modified distillers’ grains (DG) marketing already increases profits and improves energy balance at the same time. Biomass power improves variable energy expenditures, and new energy policies would strengthen incentives for biomass conversion.

Introduction1
The ratio of energy in a gallon of ethanol relative to the external fossil energy required to produce the corn and process and ship the ethanol is an important measure of sustainability of the corn ethanol industry (Pimentel). Some revisions of initial energy balance calculations have already verified enhanced industry performance and identified methods that could yield further improvement (Shapouri, et al., 2002: Gallagher and Shapouri). A post-expansion survey of ethanol processors thermal and electrical energy use showed further improvement in energy balance (Shapouri, et al., 2010). Ethanol made the transition from an energy sink, to a moderate net energy gain in the 1990s, and to a substantial net energy gain by 2008. This study investigates whether ethanol energy balance still improves and reviews some potential sources of future improvement.
Estimates of the current energy balance situation are presented in this report. We update effects of current corn production practices, using current fertilizer and chemical application rates from the most recent data collected by the USDA. Updates also include the energy embodied in modern farm machinery. Energy use by the transportation system for corn procurement and ethanol distribution is also revised to reflect current marketing practices. Current thermal and electrical energy use by ethanol processors is also included. Furthermore, we discuss the range of energy balance outcomes in the industry, according to byproduct marketing practices and process energy sources. Lastly, we examine the potential for further energy balance improvements through improved economic management of byproduct marketing and power choices. We find that profitable practices followed by some firms also tend to improve the energy balance above the industry average.
Estimation of Energy Balance
Energy Consumption by Corn Producers Corn producers use most energy products (gasoline, diesel, natural gas, liquid petroleum gas, and electricity) directly in planting, harvesting, and drying their crop. There is also considerable energy embodied in the commercial fertilizers applied to enhance plant growth. Table 1a and table 1b provide a summary of the latest USDA data on energy components and totals.2 The trends for components and total energy are summarized with data at 5-year intervals over the last 25 years. The Agricultural Resource Management Study (ARMS) is the source of data used to estimate total energy inputs used in production of corn (Economic Research Service (ERS) Staff). Energy inputs used in production of corn are derived from the response of corn farmers in nine States for a survey on corn production practices and costs as part of the 2010 ARMS. The target population for the corn survey was farmers who planted corn with the 1 This research was funded by the Office of Energy Policy and New Uses/Office of the Chief Economist of the U.S. Department of Agriculture. Thanks are also due to Jim Duffield, who arranged for unpublished corn production data, to Dan Sleper, who organized data for table 3 and table 4, and to Hosein Shapouri, whose previous energy balance studies laid the foundation for this report. 2 Working Electronic Spreadsheet versions of all tables in this report are useful for verification of calculation details. They can be found at www2.econ.iastate.edu/faculty/gallagher

2
intention of harvesting corn for grain. The USDA National Agricultural Statistics Service (NASS) and the Economic Research Service (ERS) collect production and cost data once every 5-8 years for each major commodity on a rotating basis in the ARMS survey. The State data from the survey are also weighted to represent their importance in U.S. corn acreage (see Appendix Tables A1 and A2).3 Importantly, the largest energy components for corn production are nitrogen and direct energy use for fuel and electricity. Nitrogen use measured on a per bushel basis has declined by about 20 percent since the mid-90s. Similarly, all direct energy components have declined by about 50 percent since the mid-90s. Together, the nitrogen and direct energy reductions result in a 30 percent decline in the energy required to produce a bushel of corn. Overall 65,298 BTU/bu were required for corn production in 1996 whereas 37,666 BTU/bu were required in 2010. For the 2005-2010 period, farm energy declined by about 8 percent on a per bushel basis-- moderate declines in embodied energy in fertilizer, gasoline, and diesel were only partially offset by slight increases in drying and chemicals. Declining energy use on a per bushel basis is the net change due to moderately growing (fertilizer) or declining (diesel) application rates per acre divided by rapidly growing corn yields. Lastly, the energy in corn must be expressed relative to the amount of ethanol produced for energy balance comparisons. Hence, we must account for the fact that only the starch fraction of the corn plant is used for ethanol–other components are used for livestock feed. Also, changes in ethanol yields should be incorporated. Specifically, ethanol yields have increased by about 10 percent in the last 20 years, so proportionately less corn is required – 13,647 BTU/gal in table 1b. Further, only the starch fraction of the corn kernel (66 percent) is used for ethanol production.4 So the net corn energy used for ethanol production is 9,007 BTU/gal in table 1b. The corn energy input for ethanol production declined to 9,007 BTU/gal from 9,812 over the most recent 5-year period, an 8.2 percent decline.
3 All of the appendix tables mentioned in this report can be found at www2.econ.iastate.edu/faculty/gallagher 4 To see this, notice that a bushel of corn weighs 56 pounds and yields 17.5 pounds of distilled grains (the protein, fiber and oil components) of the corn plant. The starch component is 38.5 pounds = 56-17.5. So the starch fraction of the corn plant is 38.5/56 = .688. That is, the starch (ethanol-making) component is about two thirds of the corn. In many cases the two thirds allocation rule is very conservative.

Table 1. Energy-related inputs and energy requirements for corn production, 9-State weighted average
Table 1a. Energy-related inputs for corn production, per acre
Conversion factors Table 1b. Total energy requirements , in btu / bu corn
1991 1996 2001 2005 2010
energy useda :
1991 1996 2001 2005 2010
Seedc lb/ac 19.62 19.61 22.11 18.29 24.58
btu/bu c 394.26
784 859.7 663.39 394 485.1 Fertilizer:
Nitrogen lb/ac 124.5 129.38 133.52 133.39 136.50
btu/lb 24500
25,023 25,358 23,477 20,464 20,397 Potash lb/ac 52.77 59.25 88.52 61.26 54.87
btu/lb 3000
1,299 1,422 1,899 1,151 1,004
Phosphate lb/ac 58.17 48.16 56.81 54.36 49.45
btu/lb 4000
1,909 1,541 1,631 1,362 1,206 Limeb lb/ac 242.18 382.18 350 554.36 490.16
btu/lb 558
1,109 1,706 1,402 1,937 1,668
Energy inputs: Diesel gal/ac 6.85 8.6 6.85 5.81 4.95
btu/gal 152372
8,562 10,483 7,491 5,539 4,600
Gasoline gal/ac 3.4 3.09 1.7 1.92 1.95
btu/gal 144211
4,022 3,565 1,759 1,735 1,715 LP Gas gal/ac 3.42 6.36 3.42 3.2 1.81
btu/gal 85895
2,410 4,370 2,108 1,722 948
Natural gas ft3/ac 246 200 245.97 208.9 34.47
btu/ft3 1046
2,111 1,674 1,846 1,368 220 Electricity kwh/ac 33.59 77.13 33.59 20.41 21.45
btu/kwh 9365
2,581 5,779 2,258 1,197 1,225
Custom work $/ac 6.68 15.07 10.12 8.45 16.00
1,590 3,340 1,581 648 937 Chemicals lb/ac 3.99 3.49 2.66 2 2.20
btu/lb 154150
5,049 4,304 2,943 1,930 2,072
Custom Drying $/ac 1.79 0 0 2.09 1.66
1,030 0 0 642 373 Purchased water $/ac
0.18 0.08 0.11
136 75 75
Input hauling
616 896 688 868 740 Total energy
58,095 65,298 49,881 41,032 37,666
Yield, 3-year av. bu/ac c 121.9 125 139.34 159.7 163.96
to btu / gal ethanol:
btu/buc
58,095 65,298 49,881 41,032 37,666
gal buc
2.5 2.636 2.662 2.76 2.76
aincluding energy loss and transmission loss (LHV)
btu/gal
23,238 24,771 18,738 14,867 13,647 bLime use in 1996 is an average of 1991, 2001, and 2005
starch fraction
0.66 0.66 0.66 0.66 0.66
cSeed calculation shown below
ethanol's share
15,337 16,349 12,367 9,812 9,007
btu's for seed:
2006 conversion shown above
seeds per acre
25,501 25,495 28,739 23,771 31,954
Pounds of seed/acre
19.62 19.61 22.11 18.29 24.58
bu seed / bu corn
0.0029 0.0028 0.0028 0.0020 0.0027
btu / bu corn seed
166.94 182.94 141.32 83.89 100.83
magnification factor
4.7 4.7 4.7 4.7 4.7
btu / bu corn, adj.
784.61 859.8 664.20 394.30 473.92

5
Corn and Ethanol Transportation The corn procurement and ethanol distribution systems have evolved since the ethanol industry expansion began in 2005. Specifically, the proximity of farms to ethanol plants has improved with the five-fold increase in the number of processing facilities in main production areas. Further, new storage facilities were constructed that matched the increased corn production and shifted towards on-farm storage and shipment to a nearby ethanol plant. Similarly, ethanol distribution has shifted towards rail shipment as a national market for ethanol developed. Our strategy for revising estimates of the energy used for the ethanol marketing system includes two dimensions. First, continue to use estimates from the Greenhouse Gases, Regulated Emissions and Energy Use in Transportation (GREET) modeling system for energy use per mile for each mode of transportation. Second, modify the distances traveled to reflect the current industry situation. Corn moves by truck relatively short distances to a nearby ethanol plant. We calculated average distance shipped estimates for each of the nine States in the production survey, and then used the GREET estimate of the energy required to ship corn a mile. The distance shipped estimate begins with an input market area that is defined by the closest plant’s input capacity, and the density of surrounding corn supplies (Gallagher and Johnson, p.117). Then processing capacities and corn availability densities are tabulated for each of the nine States. Then the inferred average distance shipped is calculated by each State. These calculations are summarized in table B1. The average distance to market ranges from about 14 miles for Iowa to 23 miles for Ohio, based on the concentration of ethanol facilities and the density of corn supplies. The GREET truck energy estimate, 1960 BTU/ton to move corn 1 mile in a diesel truck, includes direct energy and an allowance for the energy required to produce fuel. We also assume that back-haul energy equals delivery energy. The main result for corn is that the nine-State weighted average is 701 BTU/gallon for farm-to ethanol plant shipment of corn. Ethanol moves intermediate distances by truck and long distances by rail. We developed our own estimates of typical distances shipped by truck and train. Then our distance estimates are combined with GREET energy requirement estimates for truck and rail transport of ethanol. Next consider freight distances in detail. Specifically, Gallagher and Denicoff report interregional ethanol shipment between Production Areas for Defense Districts (PADDs) and the distance for the main rail route associated with each trade flow. Then a shipment-weighted average distance, 1,086 miles, was calculated (panel 1 of table B2). A typical truck shipment distance of 93 miles was taken from a survey (Shapouri and Gallagher (2005), p.16). Energy use for both truck and train includes an allowance for the energy required for fuel production. The estimate for ethanol transport in a train is 332 BTU/ton per mile. The estimate for ethanol transport in a truck is 1,175 BTU/ton per mile.

6
Last, we calculated a volume-weighted average for truck and train transport. To obtain the weight for local truck shipments, we again used the trade flow baseline discussed by Gallagher and Denicoff. For exporting regions, we assumed that any particular PADD’s production that was not shipped to other PADDs was used within the PADD and shipped by truck. For importing regions, we assumed that all domestic production was shipped by truck. The weighted average shipment energy for ethanol is 993 BTU/gallon–this estimate accounts for typical distance of rail and truck shipments, the energy differential for rail and freight, and the relative market shares of local and national market consumption. See cell E20 of table b2 for the calculation of weighted-average truck and train energy. However, we did not include energy used for small quantities of international ethanol exports. Farm Machinery We need estimates of the energy embodied in farm machinery for corn farming and corn stover collection. The corn farming estimate includes machinery for planting, spraying, harvesting, and storing corn–we arrived at 601,904 BTU/acre each year. For corn stover, the harvest equipment for mowing, raking, bailing, and handling was included–we arrived at 322,685 BTU/acre. Both estimates are taken directly from the GREET model. Next, corn energy use was adjusted by corn yield, 163.96 bu/acre and ethanol yield, 2.76 gal/bu for machinery-related energy use on a per gallon basis. The stover harvest energy estimate was adjusted by the stover yield, 2.72 tons/acre, and the stover quantity needed with 100 percent biomass power for a gallon of ethanol, 0.002126 tons stover/gallon, to arrive at the stover machinery energy needed for a gallon of ethanol production. For stover, we also included an allowance for fertilizer application to replace the fertilizer contained in the stover that was removed. Appendix Table C1 gives the details of these calculations. For corn, the weighted average machinery energy is 1,330 BTU/gallon. The machinery estimate accounts for the energy required to produce, maintain, and transport the farm machinery. The machinery energy estimate is somewhat higher because modern equipment is bigger and more powerful. For stover, 307 BTU/gallon are required for machinery energy. Processing We use a recent survey for estimates of thermal and electrical energy used in processing (Shapouri, et al., 2010). This survey is unique, providing estimates for plants with wet DGs and dry DGs separately. Another recent survey combines plants with wet and dry DGs, and gives an industry average energy estimate of processing energy requirements (Mueller, 2012). Comparing across studies, the latter report’s industry average estimate of heat requirements is between the survey report’s energy estimate for wet DGs and dry DGs, suggesting that the same industry energy requirements are represented in both surveys. A revised survey that separates the processors into the two groups could be useful if there is a resurgence of support for a survey that separates processors by type of DG marketing. We also use an engineering model from USDA/ARS for a comparison estimate of the DG-drying energy requirement.

7
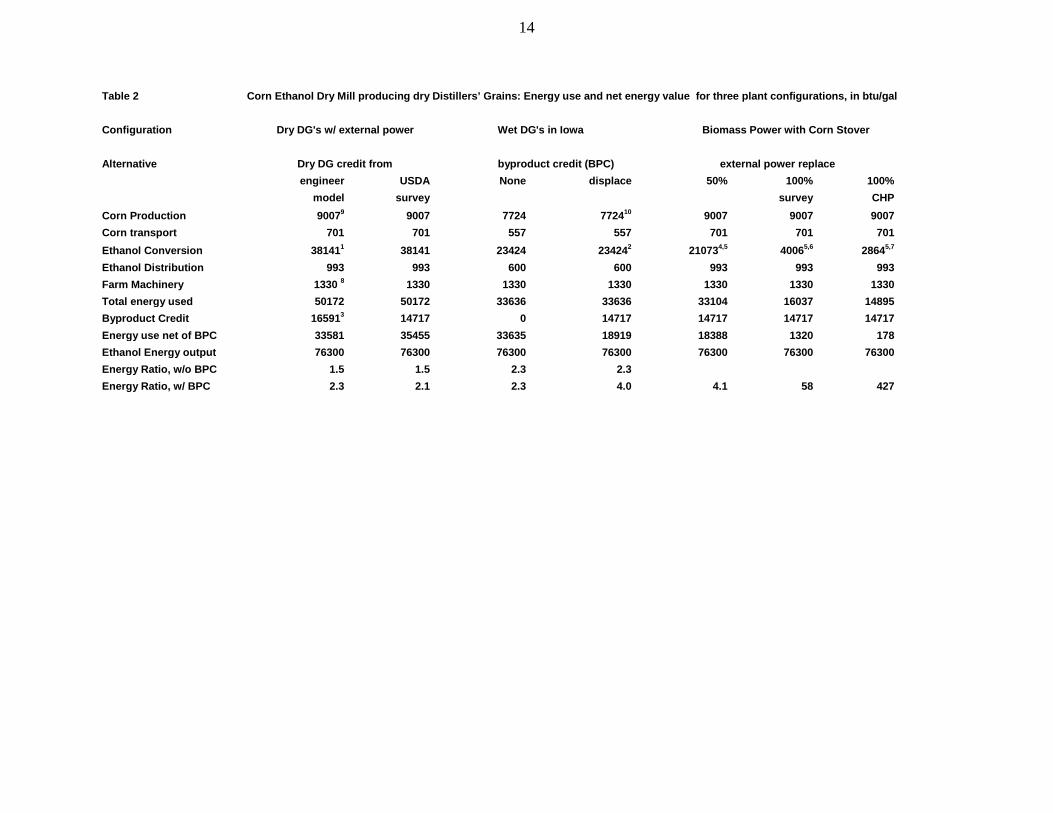
Energy Balance Estimates Table 2 contains the energy balance results. The latest corn energy use data from the USDA survey is included; transportation energy estimates reflect the present spatial structure of corn procurement and ethanol distribution; farm machinery energy requirements come from the GREET model. Three configurations of dry mills are shown in table 2: dry DGs (byproduct drying) with conventional natural gas power, wet DGs (no byproduct drying) with natural gas power, and dry DGs with biomass power. A dry mill with dry DGs is the reference case of table 2. The numerical columns report energy use with natural gas fossil fuel power (Columns 1 and 2) and with biomass power (columns 5, 6, and 7). The byproduct credit is the heat used to prepare dry DG—we compare the survey estimate with dry DGs (column 2) and the engineering model estimate (column 1). The case of wet DG sales is shown in columns 3 and 4. For the conventionally powered dry mill, shown in columns 1 and 2, the ethanol conversion estimate of heat content, 38,141 BTU/gal is the sum of electricity and thermal energy from Shapouri, et al., (2010). Additionally, survey reported numbers are all adjusted to an energy input basis. The corn production estimate is also the same in column 1 and column 2, at 9,007 BTU/gal from the 2010 USDA data given in table 1b. However, an important segment of the ethanol industry operates with a better energy balance than the reference case. The largest ethanol-producing State, Iowa, has a better energy balance than the reference case for several reasons. First, Iowa’s corn production energy is the second lowest of the nine States, according to the most recent ARMS survey. Second, a significant cattle feedlot industry is located in West Iowa, so selling wet DGs eliminates drying energy. Third, there is a population and fuel demand cluster along the I29 and I35 highway corridors, so local ethanol marketing to locations such as Omaha, Sioux Falls, or Mason City pipeline terminals is possible. Fourth, energy for corn shipment to ethanol plans is lowest, due to high corn yields and the spatial concentration of ethanol plants. Energy balance calculations for the low-energy segment of the ethanol industry are shown in column 3 and column 4 of table 2. For the conventionally powered dry mill without byproduct drying , shown in columns 3 and 4, the ethanol conversion estimate of heat content, 23,424/gal is the sum of electricity and thermal energy from Shapouri, et al(2010). Additionally, the corn production estimate is the Iowa value, at 7,724 BTU/gal from the 2010 USDA data given in table A2. Transport costs are also lower, at 557 BTU/gal for corn and 560 for ethanol. Conceptually, the byproduct credit (BPC) is the energy used to dry the byproduct. The survey-based byproduct credit, 14,717 BTU/gal, is the difference between heat and electrical processing energy with drying, 38,141 BTU/gal in column 2, and processing energy without drying, 23,424 BTU/gal in columns 3 or 4. A byproduct credit based on an economic-engineering model was also prepared by staff from the Eastern Regional Research Center of the USDA’s Agricultural Research Service. This analysis is based on a dry-grind ethanol model (Kiatkowski, et al.). Updates are included with the

8
published ethanol model, such as using higher solid content in the fermenters, for a slight improvement in energy use. Simulation results were calculated with SuperPro Designer (SPD) software (Intelligen Staff ). The byproduct credit from the engineering model, 16,591 BTU/gal in column 1, is also calculated as the difference in total processing energy according to whether the byproduct is dried. Comparing, the survey and model based estimates of the byproduct credit are quite similar; the survey-based byproduct is 12 percent less than the model based estimate. The survey and model based estimates of total processing energy are also similar–the model is 4 percent higher than the survey. For energy balance calculations, the various components of energy use are compared to the heat content of ethanol (76,300 BTU/gal).5 Together, the recent energy use estimates show that the ratio of energy in ethanol to the external energy used to produce ethanol is about 1.5, even without allowing for the processing component of the byproduct credit. After fully allowing for heat and electricity used to produce dry byproducts, the energy ratio is between 2.1 and 2.3 in columns 1 and 2. In comparison with our recent study, input energy has declined somewhat because moderate gains in corn production, procurement and ethanol distribution have slightly offset the higher energy embodied in farm machinery. For the survey based byproduct credit, the energy balance ratio increased to 2.1 from 2.0 when the same byproduct credit is used.6 In contrast, the energy balance ratio for the model-based byproduct credit stayed the same at 2.3 in the current and previous reports. Here, the input energy decline was exactly offset by a slightly higher byproduct credit. The engineering credit is somewhat smaller, possibly due to modeling of process improvements such as higher solid content in fermenters. When comparing the byproduct credit estimates, it is important to remember that the survey gives an observation of reality, whereas the model gives a prediction based on a set of assumptions. The difference between the survey estimate and the engineering estimate is smaller now than in the previous survey, partly because survey calculations have been corrected, and partly because the model estimate includes more relevant technologies. As it stands, the model is reasonably well calibrated to the baseline, with an overestimate of 5.7 percent of total input energy. The remaining discrepancy may stem from omitted model technologies. Or operating temperatures in actual plants may be more conducive to natural evaporation of moisture from DGs than the simulation model assumes. Ethanol plants with Iowa locations that have a favorable corn production and byproduct marketing circumstance use less input energy, and likely have a higher energy balance. Alternative approaches to the byproduct credit for WDGs distinguish column 3 from column 4. 5 In some plants, the corn oil is removed from the distilled grain and used for biodiesel processing (a contribution to energy output). In 2013, for example, corn oil accounted for 970 mil. lbs., about 10% of the biodiesel industry’s feedstock. The effect on ethanol industry’s energy balance would likely be in the small-to-moderate range. In particular, corn oil yields 0.26 lb/gal e with the Thin Stillage Flotation process but there is 0.2 Kw.hr /gal e increase in electricity use (Mueller and Kwik, p. 8). Given a heat content of corn oil of 14,400 BTU/lb and electricity of 11,520 BTU/Kw.hr, the net energy gain for corn oil biofuel in an ethanol plant is 1440 BTU/gal e, which is about a 2 percent increase in the ethanol plant’s output energy. 6 The survey credit reported previously is somewhat smaller, 12,936 BTU/gal instead of 14,717 BTU/gal, because modest amounts of electrical energy for drying were excluded from byproduct credit calculation. The energy balance estimate of 2.0 above correctly includes the electrical energy in the byproduct credit.

9
In column 3, the byproduct credit is zero, on the notion that no energy is used to dry the byproduct. But we prefer the byproduct estimate in column 4, which reflects an “opportunity energy” concept--the full byproduct energy is included on the notion that WDGs replace a cattle feed that would require energy for production, such as dry DGs. The energy balance estimate is 4.0 when the byproduct credit is included. Biomass power is another approach to low input energy ethanol production. Biomass power reduces external fossil energy needed to produce ethanol. In the case of corn stover, some of the fossil energy used to produce corn biomass is recovered, usually even after the energy required for stover harvest and fertilizer replacement is recognized. Energy required for stover harvest and fertilizer replacement is taken into account in column 5. In a typical dry mill, biomass power would replace market purchases of natural gas and electricity. At the upper range of survey responses shown in Column 5, external thermal energy reduces by about one-half, to 15,961 BTU/gal on an output basis. We also assume that one-half of the external electrical energy is eliminated, based on Gallagher, et al., (2006). So external electrical energy would be 4,360 BTU/gal with 50 percent biomass power. A 753 BTU/gallon allowance for stover harvest and fertilizer replacement is also included. The energy balance ratio increases to 4.1 with 50 percent biomass power and dry DG (column 5). Complete replacement of external processing energy for thermal energy and electricity is also contemplated (Energy and Environmental Analysis, Inc. Staff, et al.). But complete replacement of ethanol processing energy with biomass power extends beyond the range of our survey responses. Still, the possibilities are interesting. Corn stover, which contains about the same energy (BTUs) as the corn, is presently discarded. But residues represent enough energy to replace all of the process heat and electricity needed for ethanol, and combined heat and power plants are capable of producing the required process heat and electricity. Column 6 and column 7 give estimates for an ethanol plant that use close to 100 percent biomass power. Column 6 is based on an extrapolation of the survey estimate of thermal energy; a 2,501 BTU/gallon residual external energy requirement remains. By assumption, external electrical energy is eliminated. The allowance for stover harvest, fertilizer replacement and transport to the plant is 1,505 BTU/gal. Together, the processing energy requirement is 4,006 BTU/gal. In column 7, an engineering model estimates that 100 percent of heat energy and 66 percent of electrical energy is eliminated, giving a processing energy estimate of 1,359 BTU/gal. A stover harvest and fertilizer replacement of 1,505 BTU/gal is again included. So the total processing energy in column 7 is 2,864 BTU/gal. The energy balance for the hypothetical case of 100 percent biomass power would be very large, ranging from about 58 to 427.
14
Table 2 Corn Ethanol Dry Mill producing dry Distillers’ Grains: Energy use and net energy value for three plant configurations, in btu/gal
Configuration Dry DG's w/ external power Wet DG's in Iowa
Biomass Power with Corn Stover
Alternative Dry DG credit from
byproduct credit (BPC) external power replace
engineer USDA
None displace
50% 100% 100%
model survey
survey CHP Corn Production 90079 9007
7724 772410
9007 9007 9007
Corn transport 701 701
557 557
701 701 701 Ethanol Conversion 381411 38141
23424 234242
210734,5 40065,6 28645,7
Ethanol Distribution 993 993
600 600
993 993 993 Farm Machinery 1330 8 1330
1330 1330
1330 1330 1330
Total energy used 50172 50172
33636 33636
33104 16037 14895 Byproduct Credit 165913 14717
0 14717
14717 14717 14717
Energy use net of BPC 33581 35455
33635 18919
18388 1320 178 Ethanol Energy output 76300 76300
76300 76300
76300 76300 76300
Energy Ratio, w/o BPC 1.5 1.5
2.3 2.3 Energy Ratio, w/ BPC 2.3 2.1
2.3 4.0
4.1 58 427

15
Footnotes for Table 2:(calculations and sources) 1electricity: 8720 btu/gal
power: 29421 btu/gal from coal or n. gas 38141 Source: Shapouri and Gallagher (2010)
assumes
0.757 Kw-hr elec/gal e 3413 btu elec/ Kw-hr 0.30
btu out / btuin 8720 btu in/gal
2electricity: 6939 btu/gal
power: 16485 btu/gal from coal or n. gas 23424 Source: Shapouri and Gallagher (2010)
Assumes
0.6024 Kw-hr elec/gal e 3413 btu elec/Kw-hr 0.30 btu out/btu in 6939 btu in/gal
16485 btu in/gal
1.00 btu out/btu in 16485 btu in/gal
341.8 percent of total energy used for dry dg preparation in an engineer Model of an ethanol plant using the Superpro Designer (SPD) model.
4electricity: 4360 btu/gal power: 15961 btu/gal from stover or SRWC 20321
Sources: Shapouri&Gallagher (2006,2010)
50% external energy Assumes 0.3785 Kw-hr elec/gal e 3413 btu elec/Kw-hr elec Dry 0.3 Btu-out/btu in 4360
15961 btu in/gal
1.00 btuin/btuin
15961 btu in/gal
5stover harvest:
307 btu/gal Corn Stover harvest energy (direct+machinery) from GREET . srover fertilizer replacement:
983 btu/gal fertilizer replacement. See Gallagher and Dikemen (2003)
215 btu/gal stover transport energy-farm to plant. See appendix table b3
Total 1505
6biomass power replaces 100 percent of total energy used for heat and power. See Shapouri and Gallagher ( 2010) for heat and electricity with alternative energy configurations:
heat energy for a plant with dry dg's
29421 btu/gal heat energy for a plant with 100% biomass power
26920 btu/gal
Difference
2501 btu/gal All electrical energy is jointly replaced w/ biomass power
7biomass power replaces 100 percent of nat. gas and 65% of elec with Combined Heat and Power (CHP) plant. net energy consumption in ethanol plant:
1359 btu / gal
8energy in farm Machinery (steel, tire, assembly, repair parts):
3671 btu/bu from GREET model, see Wang ethanol yield:
2.76 ga /bu from Survey
9energy in farm production of corn:
37666 btu/bu from Table 1b- 9-state weighted average ethanol yield:
2.76 gal/bu from Survey
Starch Fraction:
0.66 => 9007 btu/gal
10energy in farm production of corn:
32302 btu/bu from Table 1b- State of Iowa ethanol yield:
2.76 gal/bu from Survey
Starch Fraction:
0.66 => 7724 btu/gal

16
Economics: How Market Conditions and Energy Policies Affect Energy Balance One energy balance number for the entire ethanol industry is usually emphasized. In fact, there are a range of energy balance outcomes for individual firms. Individual firm outcomes are determined in part by local market factors. The policy environment also has an important bearing on the energy balance of all firms. We review two economic decisions faced by ethanol processing firms that impinge on energy balance: the decision to dry DGs and the decision to use conventional power instead of biomass power. Drying Costs and Returns Byproduct drying is a short-run decision that is made on the basis of prevailing market prices. The profit gain from drying , or the drying margin (ΔM), includes the revenues for dry (d) DGs less the revenues for wet (w) DGs less the increment in energy costs associated with drying:
ΔM = Pd Xd – Pw Xw – Ph (hd – hw ) (1), where P is a price, X is a byproduct yield, and h is a heat or energy input. There is a profit advantage to selling dry DGs when ΔM > 0. In contrast, there is a profit advantage to selling wet DGs when ΔM < 0. A break-even point occurs when there is no profit advantage to be gained from drying: ΔM = 0.7 We calculated values for the drying margin (equation 1) for four midwestern locations that sell wet and dry DGs, using some new data. We use Xd=0.0028 tn/gal e, Xw = 0.00841 tn/gal e, and Xm = 0.00561 tn/ gal e for the byproduct yields of dry DGs, wet DGs, and modified DGs, respectively. Byproduct yields are based on corn consumption and byproduct production data for ethanol plants in the United States (NASS staff), and monthly reports of ethanol production are also used (Energy Information Administration (EIA) staff). Details of these calculations are shown in appendix table D1. Also, the physical energy (natural gas and electricity) requirements for byproduct drying are taken from our recent survey ( Shapouri, et al., 2010., p.5). Finally, market price data for byproduct outputs (AMS staff) is provided by the USDA. Prices for Energy inputs are published by the U.S. Department of Energy ((EIA staff , July 2015, EIA staff, April 2015). Details of margin calculations that combine byproduct prices, yields and revenues with energy input requirements, prices, and costs for net profit gains are shown in appendix D2. In Table 3, average drying margins for West IA, MN, NE, and SD are based on weekly data from the 6/20/2014-to-5/8/2015 period. The average drying margins are consistently negative, ranging from -$0.045/gal in West IA to -$0.154 / gal in MN. Also, the negative margin is significantly different from zero with a high level of confidence in a t-test for most of these locations (MN, NE, and SD). The margin also tends to be negative for West IA. The West IA margin is also statistically significant at a moderate confidence level. Generally speaking then,
7 For demonstration, a break-even point equation equalizes profits from selling dry DGs and profits from selling wet DGs . Start with the profit (πd) and margin (Md) identities for dry distillers grain sales: πd= Pe Qe+ Pd Qd–Ph Qhd–Pc Qc , or dividing by Qc gives Md = Pe+Pd Xd –Ph Xh–Pc Xc , where Pi is price, and Qi is quantity. The index, i, refers to e for ethanol, d for dry DGs, w for wet DGs, m for modified DGs, c for corn, and h for heat. Xi is the input requirement or byproduct yield per unit of ethanol: Xd = Qd / Qe, Xw = Qw / Qe, Xm = Qm / Qe, Xh = Qhw / Qe , and Xc= Qc/Qe. Notice that the corn input requirement is the inverse of the ethanol yield. Similarly, the profit and margin equation for wet DGs is:
πd = Pe Qe + Pw Qw – Ph Qhw – Pc Qc and Md = Pe + Pw Xw – Ph Xh – Pc Xc. The implied profit advantage for drying, Md - Mw, is the revenue advantage for drying less the increase in heating costs.

17
average profits would have been improved by 5 cents to 15 cents per gallon of ethanol sold through wet DG sales instead of dry DG sales during the 2014-15 marketing year. It does appear that expanding wet DG sales could improve a firm’s profits and energy balance ratio at the same time. But extending the profit differential calculations for a longer time period might well verify that there is an unexploited profit opportunity with wet DGs. Transport costs could limit wet DG marketing somewhat, but sub-State average prices are used for profit calculations. Then more expertise and equipment for marketing wet or modified DGs could be a way to improve energy balance and profits at the same time. Table 3. Distillers’ Grains Drying Margins for Four Locations–Weekly Averages and Standard Deviations During the
6/20/14 to 5/8/15 period, in $ / gallon of ethanol produced Location West Iowa Minnesota Nebraska South Dakota Mean -0.045 -0.154 -0.119 -0.087 Standard Deviation 0.034 0.066 0.042 0.026 t-value -1.326 -2.338 -2.831 -3.343
Biomass Power
Adoption of biomass power would improve energy and carbon accounts because an external fossil fuel would be replaced by a fuel grown with existing energy inputs for corn. Also, the carbon removed from the atmosphere while the corn plant grows is returned to the air when the corn stover is burned for power–the atmospheric carbon removal and return cycle with biomass power is environmentally superior to the continuous atmospheric carbon return associated with fossil fuels. Still, plant managers and engineers usually favor the convenience of a natural gas-based power system, because there is little equipment, maintenance, or labor once the natural gas pipe is installed. In contrast, a biomass power involves input handling equipment, labor, a schedule, and possibly, short-term storage. There are some ethanol firms with biomass power facilities. But widespread adoption has not occurred. Still, biomass power has some economic advantages. We compare power feedstock costs for an initial estimate, although differential capital costs between power systems would ultimately be included. Table 4 shows the difference between conventional power costs and stover power cost for some alternative market and policy environments. The first numerical row contains the difference between natural gas cost and stover cost. Row 2 shows the difference between coal cost and stover cost. The first numerical column contains the current market, the second column shows the carbon tax situation, and the third column shows the situation if stover was included in the Renewable Fuel Standard. In the current market environment, (column 1 of table 4), biomass feedstock cost is only slightly higher than coal, -$.006/gal of ethanol. Biomass power has a distinct advantage, $.079/gal of ethanol produced, when compared to natural gas costs. The biomass feedstock advantage would strengthen with some plausible energy policy changes. For instance, a carbon tax has been proposed as an alternative to cap and trade carbon emission policies (Sachs). The carbon tax is a reference global warming policy in the economics literature. A carbon tax on coal would be higher than the corresponding tax on natural gas, and

18
would likely exempt users of biomass power (column 2 of Table 4). Then the biomass power advantage for ethanol would consistently improve, to +$0.030 / gal against coal and to +.100/gal against natural gas. Alternatively, corn producers who use biomass power could reasonably expect classification as an advanced biofuel under the current Renewable fuel Standard, a status that would be parallel to bagasse-using sugar-ethanol facilities.8 Consider the case of a Renewable Inventory Number (RIN) certificate valued at $.05/gal, which was the case before the ethanol shortages of the 2013 crop year (Gallagher and Duffield, p. 97). The effective subsidy for biomass power, calculated by allocating the per gallon subsidy over the biomass power to produce that gallon, would make stover a free power source. Then biomass power would have a $.044/gal advantage over coal, and a $.129/gal advantage over natural gas. Table 4. Variable Heat Cost Reductions From Adopting Biomass Power in an Ethanol Plant,
Assuming Recent Market Conditions and Alternative Energy Policies --in $ / gallon of ethanol
Current Carbon RIN Certificate Power Situation Market Tax for Corn Change nat. gas-to-Stover 0.079 0.100 0.129 Coal-to- Stover -0.006 0.030 0.044
Conclusions
A dry grind ethanol plant that produces and sells dried distillers grains and uses conventional fossil fuel power for thermal energy and electricity produces slightly more than twice the energy in the form of ethanol delivered to customers than it uses for corn, processing, and transportation. Specifically, we calculated the energy ratio at 2.1 using the survey based on a byproduct credit for a dry mill that drys the DGs using natural gas power. The ratio is a little higher, at 2.3 BTU of ethanol for 1 BTU of energy in inputs, when a more generous byproduct credit based on an engineering model is used—the model prediction of the byproduct credit baseline defined by the survey is close, but not exactly aligned with reference data. The corn ethanol energy balance is improving. Compared to the previous survey, our calculations showed slight net improvement in overall energy input use of 2,010 BTU/gal as corn production, corn transport, and ethanol transport offset a slight increase the energy embodied farm machinery, and the output energy embodied in the ethanol remained unchanged. But the changes are not large. There is a low-input-energy segment of the industry that does better than the industry average. The energy balance ratio is 4.0 for areas like Iowa and Minnesota that use the lowest corn
8Presently, an advanced biofuel is “a renewable fuel other than ethanol derived from corn starch, that is derived from renewable biomass, and achieves a 50 percent Greenhouse Gas (GHG) emissions reduction requirement” (Renewable Fuels Association). So corn ethanol would not be included even if it achieved the necessary GHG reduction.

19
energy, market wet DGs to local livestock industry, and sell ethanol locally along the I35 or I29 interstate highway corridor. Some dry mills are already using up to 50 percent biomass power. The energy output for these plants is about 4.2 times energy inputs even for firms that are drying DGs. If processors would master the logistics of handling bulky biomass, the energy balance ratio could eventually reach 60 BTUs of ethanol per 1 BTU of inputs used. Overall then, ethanol has made the transition from an energy sink, to a moderate net energy gain in the 1990s, to a substantial net energy gain in the present. And there are still prospects for improvement. The source of some energy balance improvements may continue to change. Past studies have emphasized improvements in corn production and processing plant technology. The present study found improvements in corn production, procurement, and distribution. For the future, management of power and drying costs may be important to future improvements in energy balance. First, our snapshot of a recent distillers’ grain market suggests that more marketing of wet and modified DGs would increase profits and improve energy balance at the same time. Second, a comparison of recent heat input energy markets showed that biomass power instead of natural gas could improve variable energy expenditures. Further, potential policy changes, such as carbon tax or advanced biofuel status for biomass-using corn ethanol plants, would strengthen economic incentives for conversion to biomass power.

20
References
AMS Staff, “Weekly Distillers Grains Summary,” USDA-Market News, NW_GR115, Des Moines, Iowa, Fri, Aug 21, 2015, http://www.ams.usda.gov/mnreports/nw_gr115.txt, accessed 8/28/2015.
EIA staff, “Weekly Ethanol Production,” U.S. Energy Information Agency, U.S. Dept. of Energy, http://www.eia.gov/dnav/pet/pet_pnp_wprode_s1_w.htm , accessed 8/28/15.
EIA staff, “Iowa Natural Gas Prices,” http://www.eia.gov/dnav/ng/ng_pri_sum_dcu_sia_m.htm, accessed 7/15/15.
EIA staff, Electric Power Monthly, U.S. Department of Energy, Washington, D.C., www.eia.gov, June 2015. Energy and Environmental Analysis, Inc. and Eastern Research Group Staff, Biomass Combined Heat and Power: Catalogue of Technologies, U.S. Environmental Protection Agency, September 2007, www.epa.gov/chp.
ERS Staff, “ARMS Farm Financial and Crop Production Practices,” http://ers.usda.gov/data-products/arms-farm-financial-and-crop-production-practices/tailored-reports-crop-production-practices.aspx , Accessed 7/19/2014.
Gallagher, Paul. and Marina Denicoff, “Ethanol Distribution, Trade Flows, and Shipping Costs,” Ch. 5 in U.S. Ethanol: An Examination of Policy, Production, Use, Distribution and Interactions, Office of Energy Policy and New Uses, U.S. Department of Agriculture, September 2015, http://www.usda.gov/oce/reports/energy/EthanolExamination102015.pdf. Gallagher, P. and J. Duffield, “The Potential for Higher Ethanol Blends in Finished Gasoline,” Chapter 7 in U.S. Ethanol: An Examination of Policy, Production, Use, Distribution and Interactions, Office of Energy Policy and New Uses, U.S. Department of Agriculture, September 2015, http://www.usda.gov/oce/reports/energy/EthanolExamination102015.pdf. Gallagher, P. and H. Shapouri , “Improving Sustainability of the Corn-Ethanol Industry,” in Biofuels, W. Soetaert and E. Vandamme, eds, John Wiley, West Sussex (UK), December 2008. Gallagher, P., G. Schamel, H. Shapouri and H. Brubaker, “The International Competitiveness of the U.S. Corn-Ethanol Industry,” Agribusiness: An International Journal 22(2006): 1-26. Gallagher, P., M. Dikeman, J. Fritz, E. Wailes, W. Gauthier, and H. Shapouri, Biomass from Crop Residues: Some Cost and Supply Estimates, Agricultural Economic Report Number 819, U.S. Dept of Agriculture, January 2003.
Gallagher, Paul and Donald L. Johnson, “Some New Ethanol Technology: Cost Competition and Adoption Effects in the Petroleum Market,” The Energy Journal 20(April1999):89-120.

21
Intelligen Staff, “SuperPro Overview,” Intelligen, Inc., Scotch Plains, NJ, http://www.intelligen.com/, accessed 9/15/15. Kwiatkowski, Jason, McAloon, Andrew, Taylor, Frank, Johnston, David; “Modeling the Process and Costs of Fuel Ethanol by the Dry-Grind Process,” Industrial Crops and Products 23(2006), pp. 288-296. Mueller, Steffen, and John Kwik, 2012, Corn Ethanol: Emerging Plant Energy and Environmental Technologies, Energy Resources Center, College of Engineering, University of Illinois at Chicago. NASS staff, “Grain Crushings and Co-Products Production,” March2, 2015. http://www.nass.usda.gov/Surveys/Guide_to_NASS_Surveys/Current_Agricultural_Industrial_Reports/index.asp. Pimentel, David, “Ethanol Fuels: Energy Security, Economics, and the Environment,” Journal of Agricultural and Environmental Ethics 4(1991):1-13. Renewable Fuels Association, “The Renewable Fuels Standard,” http://www.ethanolrfa.org/pages/renewable-fuel-standard , Washington, D.C., accessed 9/23/15. Sachs, J. “Towards a Global Carbon Tax-A Better Way To Fight Climate Change?,” Economy Watch, March 4, 2013. http://www.economywatch.com/economy-business-and-finance-news/carbon-emission-tax-a-better-way-to-fight-climate-change-jeffrey-sachs.04-01.html Shapouri, H., Paul Gallagher, Ward Nefstead, R. Butler, S. Noe, 2008 Energy Balance for the Corn-Ethanol Industry, AER No. 846, Office of Energy Policy and New Uses, U.S. Department of Agriculture, March 2010. Shapouri, Hosein, James A. Duffield, and Michael Wang, “The Energy Balance of Corn Ethanol: An Update,” U.S. Department of Agriculture, Office of the Chief Economist, Office of Energy Policy and New Uses, Report No. 813 (July 2002). Shapouri, H., and P. Gallagher, USDA’s 2002 Ethanol Cost-of-Production Survey, U.S. Department of Agriculture, Office of Energy Policy and New Uses, Agricultural Economic Report No. 841 (July 2005).
Transportation Technology Research and Development Center Staff, GREET Model: The Greenhouse Gases, Regulated Emissions, and Energy Use in Transportation Model, U.S. Dept of Energy, Argonne National Lab, https://GREET.es.anl.gov/index.php?content=download1x , accesses 7/19/2015.
22
Abbreviations Abbreviation Explanation USDA United States Department of Agriculture ARMS Agricultural Resource Management Study ERS Economic Research Service NASS National Agricultural Statistics Service BTU British Thermal Unit bu bushel gal gallon lbs pounds lb pound ac acre LHV low heat value ft3 cubic feet $ dollars ac c acres of corn bu c bushels of corn kwh kilowatt-hour GREET Greenhouse Gases, Regulated Emissions and Energy Use in Transportation PADD Production Area for Defense District DGs Distillers’ Grains ARS Agricultural Research Service BPC Byproduct Credit SPD SuperPro Designer mil. Million tn (short) ton gal e gallons of ethanol WDGs Wet Distillers’ Grains btu in input energy, in British thermal units btu out output energy, in British thermal units EIA Energy Information Administration IA Iowa RIN Renewable Inventory Number GHG Greenhouse Gas

23
In accordance with Federal civil rights law and U.S. Department of Agriculture (USDA) civil rights regulations and policies, the USDA, its Agencies, offices, and employees, and institutions participating in or administering USDA programs are prohibited from discriminating based on race, color, national origin, religion, sex, gender identity (including gender expression), sexual orientation, disability, age, marital status, family/parental status, income derived from a public assistance program, political beliefs, or reprisal or retaliation for prior civil rights activity, in any program or activity conducted or funded by USDA (not all bases apply to all programs). Remedies and complaint filing deadlines vary by program or incident.
Persons with disabilities who require alternative means of communication for program information (e.g., Braille, large print, audiotape, American Sign Language, etc.) should contact the responsible Agency or USDA's TARGET Center at (202) 720-2600 (voice and TTY) or contact USDA through the Federal Relay Service at (800) 877-8339. Additionally, program information may be made available in languages other than English.
To file a program discrimination complaint, complete the USDA Program Discrimination Complaint Form, AD-3027, found online at How to File a Program Discrimination Complaint and at any USDA office or write a letter addressed to USDA and provide in the letter all of the information requested in the form. To request a copy of the complaint form, call (866) 632-9992. Submit your completed form or letter to USDA by: (1) mail: U.S. Department of Agriculture, Office of the Assistant Secretary for Civil Rights, 1400 Independence Avenue, SW, Washington, D.C. 20250-9410; (2) fax: (202) 690-7442; or (3) email: [email protected].
USDA is an equal opportunity provider, employer, and lender.

24