
2015 EDITION factbook · Profile– TOTAL Factbook 2015 1 KEY FIGURES FOR 2015 9.4% Upstream...
126
2015 EDITION factbook
Transcript of 2015 EDITION factbook · Profile– TOTAL Factbook 2015 1 KEY FIGURES FOR 2015 9.4% Upstream...

2015 EDITION
factbook

SUMMARY
Abbreviations
b: barrelcf: cubic feet/d: per day/y: per year€: euro$ and/or dollar: U.S. dollart: metric tonboe: barrel of oil equivalentkboe/d: thousand boe/dkb/d: thousand barrel/dBtu: British thermal unitM: millionB: billionMW: megawattMWp: megawatt peak (direct current)TWh: terawatt hourAMF: French Financial Markets AuthorityAPI: American Petroleum InstituteERMI: European Refining Margin Indicator.
ERMI is an indicator intended to represent themargin after variable costs for a hypotheticalcomplex refinery located around Rotterdam inNorthern Europe. The indicator margin may not berepresentative of the actual margins achieved byTOTAL in any period because of TOTAL’sparticular refinery configurations, product mixeffects or other company-specific operatingconditions.
FEED: Front-End Engineering and DesignFPSO: Floating Production Storage and OffloadingIFRS: International Financial Reporting StandardsLNG: liquefied natural gasLPG: liquefied petroleum gasROE Return on EquityROACE: Return on Average Capital EmployedSAGD: Steam Assisted Gravity DrainageSEC: United States Securities and Exchange
Commission
Conversion table
1 boe = 1 barrel of crude oil = approx. 5,390 cf of gas(1) in 20151 b/d = approx. 50 t/y 1 t = approx. 7.5 b (for a gravity of 37° API) 1 Bm3/y = approx. 0.1 Bcf/d 1 m3 = approx. 35.3 cf 1 t of LNG = approx. 48 kcf of gas 1 Mt/y of LNG = approx. 131 Mcf/d
(1) This ratio is calculated based on the actual averageequivalent energy content of TOTAL's natural gasreserves and is subject to change.
Need more information on a specific subject?Log on to www.total.comYou can display online TOTAL’s factbook, downloadit in PDF or collect all the tables in Excel format.
PROFILE 1
HIGHLIGHTS 2
CORPORATE 5
Financial Highlights...............................................................................................................7Market Environment ............................................................................................................7Operational Highlights by quarter..........................................................................................8Financial Highlights by quarter..............................................................................................8Market Environment and Price Realizations..........................................................................8Consolidated statement of income ....................................................................................10Consolidated balance sheet ..............................................................................................14Consolidated statement of changes in shareholders’ equity ...............................................17Net-debt-to-equity ratio ....................................................................................................18ROACE by business segment ...........................................................................................19Consolidated statement of cash flow .................................................................................20Cash flow from operating activities ....................................................................................21Investments ......................................................................................................................22Share information...............................................................................................................24
UPSTREAM 27
Combined liquids and gas production................................................................................31Changes in oil, bitumen and gas reserves .........................................................................34Results of operations for oil and gas producing activities....................................................47Cost incurred......................................................................................................................49Capitalized costs related to oil and gas producing activities ...............................................50Standardized measure of discounted future net cash flows ...............................................52LNG positions as of December 31, 2015 ...........................................................................59Re-gasification terminals as of December 31, 2015 ...........................................................60Interests in pipelines...........................................................................................................63
Acreage including maps, main producing assets and acreage by region:Europe...............................................................................................................................65Africa .................................................................................................................................73Commonwealth of Independent States .............................................................................81Middle East........................................................................................................................84Asia-Pacific ........................................................................................................................89South America ..................................................................................................................93North America ...................................................................................................................99
REFINING & CHEMICALS 105
Refinery capacity..............................................................................................................109Petrochemicals product – main production capacities at year-end ...................................111Petrochemicals product – sales by geographic area.........................................................111Specialty chemicals product – sales by geographic area..................................................112Specialty chemicals product – sales by activity ...............................................................112
MARKETING & SERVICES 113
Petroleum product sales (excluding trading and bulk sales)..............................................119Service-stations ...............................................................................................................120

1– TOTAL Factbook 2015Profile
KEY FIGURESFOR 2015
9.4%Upstream production growth
8 B$Downstream cash generation
10.5 B$adjusted net income
23 B$organic Capex
1.5 B$Opex savings
4 B$asset sales signed
A GLOBAL ENERGY GROUP
With operations in more than 130 countries,TOTAL is engaged in every sector of the oilindustry, including upstream (hydrocarbonexploration, development and production)and downstream (refining, petrochemicals,specialty chemicals, trading and shipping ofcrude oil and petroleum products andmarketing). TOTAL also operates in therenewable energies and power generationsectors.
STRATEGY
The Group’s goal is to be a global, integratedenergy company. TOTAL is a leadinginternational oil and gas company, and isactive in new energy sources, such as solarpower and biomass. To achieve this goal,TOTAL leverages its integrated businessmodel, which enables it to capture synergiesbetween the different business segments of the Group. TOTAL stands out due to its operational excellence, its technologicalexpertise and its capacity to managecomplex projects. The Group’s strategy is based on four main priorities:
– driving profitable, sustainable growth inExploration & Production’s hydrocarbonactivities;
– developing competitive, top-tier refiningand petrochemical complexes;
– responding to its customer needs bydelivering innovative solutions andservices that go beyond the supply ofpetroleum products; and
– consolidating its leadership in solar energyand continuing to develop biomass in orderto offer the most appropriate energy solutions.
This strategy incorporates the challenges of climate change, using the InternationalEnergy Agency 2°C scenario (450 ppm) as a point of reference. TOTAL’s approach is tocontribute to satisfying the demand forenergy of the world’s growing population,while providing concrete solutions to limit theeffects of climate change. To do so, theGroup focuses its actions around several keypoints, including the development of gas andrenewable energies.
At the core of TOTAL’s strategy is a strongbelief that energy is vital, drives progress andmust be made available to everyone. Energyis a precious resource that must be usedwisely. The Group is helping to produce theenergy that people around the planet needto live and thrive, while ensuring that itsoperations deliver economic, societal andenvironmental benefits. TOTAL is meetingthis challenge with and for its employees, its stakeholders and local communities.
Beyond safety, the values of respect,responsibility and exemplary conductunderpin TOTAL’s Code of Conduct andaccompany priority business principles in the realms of safety / security / health / the environment, integrity (preventingcorruption, fraud and anti-competitivepractices) and human rights. It is throughstrict adherence to these values andprinciples that TOTAL will be able to buildstrong and sustainable growth for the Groupand its stakeholders and fulfill its motto:committed to better energy.
PROFILE

JANUARYNORWAY – E&PStart-up of oil production fromthe Eldfisk II project on the PL 018license in the North Sea, inwhich Total owns a 39.9%interest. The project has aproduction capacity of 70,000barrels of oil equivalent per day.
NIGERIA – E&PCompletion of the flare out of theOfon field on Oil Mining Lease(OML) 102 offshore Nigeria.
UK – E&PStart-up of gas andcondensate production fromthe West Franklin Phase 2project, which is operated byTotal (46.2%) in the CentralGraben area of the UK North Sea.
ABU DHABI – E&PSignature of a new 40-yearonshore concessionagreement with the SupremePetroleum Council of theEmirate of Abu Dhabi (UnitedArab Emirates) and the AbuDhabi National Oil Company(ADNOC), granting Total a 10%participating interest in theADCO concession, effectiveJanuary 1, 2015.
MARCHNIGERIA – E&PCompletion of the divestmentof Total’s stake in onshore OilMining Lease (OML) 29 toAiteo Eastern E&P, for$569 million. Together with thecompleted divestments ofOML 24 and OML 18, Total’sshare of sale proceeds fromthese three onshore Nigerianblocks amounts to over $1 billion.
APRILFRANCE – R&CAnnouncement of the Frenchrefining roadmap plan: aninvestment of €200 million totransform the La Mède refineryand create France’s firstbiorefinery and an investmentof €400 million to upgrade theDonges refinery to capture newmarkets with low-sulfur fuels.
MAYRUSSIA – E&PStart-up of gas and condensateproduction from the onshoreTermokarstovoye field, locatedin the Russian Federation,operated by Terneftegas, a jointventure between Total (49%)and Novatek (51%). The fieldwill produce around 6.6 millioncubic meters of gas and20,000 barrels of condensate perday, with a combined productioncapacity of 65,000 barrels of oilequivalent per day.
ANGOLA – E&PAchievement of the significantmilestone of producing acumulative two billion barrelsfrom the Total-operated deepoffshore Block 17 located 150 km off the coast ofAngola. With the start-up ofCLOV in June 2014, Block 17has become Total’s mostprolific site with production ofover 700,000 barrels per day.
JUNEGERMANY – R&CSale of Total’s 16.7% interest inthe Schwedt refinery innortheastern Germany(Brandenburg) to Rosneft,which already indirectly held an18.8% stake in the facility. Thetransaction is valued at$300 million.
JULYSINGAPORE – M&SStart-up of Total’s largest state-of-the-art lubricants oilblending plant in the world,located in Singapore. With anannual production capacity of310,000 tonnes, this newmajor hub will boost Total’slubricant supply in the Asia-Pacific region, which alreadyrepresents more than 25% ofTotal’s lubricants sales.
ANGOLA – E&PStart-up of production from DaliaPhase 1A, a new developmenton deep offshore operatedBlock 17, located 135 km offthe coast of Angola. Block 17is operated by Total (40%). DaliaPhase 1A will develop additionalreserves of 51 million barrels andwill contribute 30,000 barrels perday to the Block’s production.
UK – E&PSale of 20% of Total’s interestsin the Laggan, Tormore,Edradour and Glenlivet fields,located in the West of Shetlandarea, to SSE E&P UK LimitedLtd for £565 million.
AUGUSTHOLDINGCompletion of the sale of the100% stake in Total Coal SouthAfrica which was signed in 2014,confirming Total’s exit from coalproduction and marketing.
UK – E&PSale of all of Total’s interests in theFUKA and SIRGE gas pipelinesand the St. Fergus Gas Terminalto North Sea Midstream Partnersfor around £585 million.
1
5
6
7
2
3 4
2 TOTAL Factbook 2015 – Highlights
2015 HIGHLIGHTS
1 2 3
4 5 6

SEPTEMBERTURKEY – M&SSale of Total’s service stationnetwork and commercial sales,supply and logistics assetslocated in Turkey to Demirörenfor around $356 million.
CANADA – E&PStart-up of production from theSurmont 2 oil sands project, inwhich the Group holds a 50%interest, located in the Athabascaregion of Alberta, Canada.Gross capacity for Surmont 1and 2 is expected to reach150,000 barrels of oil per day.
HOLDINGSale of 50% in Géosel Manosqueto a 50-50 consortiumcomposed of EDF Invest andArdian. Total’s 53.4% stake inGéosel Manosque was valuedat around $320 million inJanuary 2015 and the Group willremain a minority shareholderwith an interest of 3.4%.
CANADA – E&PSale of 10% interest in the FortHills oil sands mining project tothe operating partner SuncorEnergy for a consideration ofaround $230 million.
OCTOBERAUSTRALIA – E&PFirst shipment of LNG from theGladstone LNG project loadedand sent to North Korea. Theplant at Curtis Island will produce7.2 million tonnes of LNG peryear once at full capacity. Allproduction from the plant will besold under long-term contractsto Asian buyers, notably in SouthKorea and in Malaysia.
NORWAY – E&PSale of a 15% interest in theGina Krog field in Norway toTellus Petroleum. Following thesale, Total retains a 15%interest in Gina Krog.
DECEMBERCONGO – E&PStart-up of Moho Phase 1bproject, located 75 kilometersoff the coast of Pointe-Noire inthe Republic of the Congo. Theproject is operated by Totaland has a production capacityof 40,000 barrels oil equivalentper day.
HOLDINGTotal’s Board of Directorselected Patrick Pouyanné,Chief Executive Officer of Total,Chairman of the Board ofDirectors. Mr. Pouyanné thereforebecomes Chairman and ChiefExecutive Officer of Total,following the Board’s decisionto recombine the two roles.
JANUARY
RUSSIA – E&PTransfer of Total’s 20% interestin the Kharyaga ProductionSharing Agreement togetherwith operatorship toZarubezhneft. Following thecompletion of the transactionTotal retains a 20% interest inKharyaga.
DOMINICAN REPUBLIC – M&SAcquisition of a majority 70%interest in the leadingDominican fuel retailer fromPutney Capital Management.The transaction includes a wellestablished network of 130stations, along with significantcommercial oil products andlubricants sales positions.
FEBRUARYINDONESIA – GASTotal has signed long-termLNG sale and purchaseagreements with state-ownedIndonesian companyPertamina for the supply ofLNG volumes increasing from0.4 to 1 million tonnes per yearover a period of 15 yearsbeginning 2020.
CHINA – GASSignature of a binding Headsof Agreement with ENN LNGTrading for the delivery of0.5 million tonnes per year ofLNG for a period of 10 years.The deliveries will be sourcedfrom Total’s global LNGportfolio and are expected tobegin in 2018 upon completionof ENN’s Zhoushan LNGreceiving terminal.
UK – E&PStart-up of production from theLaggan and Tormore gas andcondensate fields, located inthe West of Shetland area. Thefields, which are operated byTotal with a 60% interest, willproduce 90,000 barrels of oilequivalent per day.
ARGENTINA – E&PStart-up of production at theoffshore Vega Pleyade gas andcondensate field in the Tierradel Fuego region of Argentina.Operated by Total (37.5%), theproject will have a productioncapacity of 10 million cubic metersof gas per day (70,000 barrelsof oil equivalent per day).
MARCHHOLDINGAppointment of Momar Ngueras President, Marketing &Services and member of theExecutive Committee of Total,replacing Philippe Boisseau.
8
10
11
9
12
3– TOTAL Factbook 2015Highlights
7 8 9
10 11 12
2016

This page was intentionally left blank.
4 TOTAL Factbook 2015

5– TOTAL Factbook 2015Corporate
CORPORATE
23 B$Cash Flow (1)
10.5 B$adjusted net income
4.5 $adjusted fully-dilutedearnings per share
2.44 €dividend per share (2)
(1) Cash flow from operations + net asset sales.
(2) Pending approval at the May 24, 2016 Annual Shareholders’ Meeting.

6 TOTAL Factbook 2015 – Corporate
2016 OUTLOOKLowering breakevens and capitalizing on theGroup’s market position
2016 Organic Capex target:
19 B$2016 Opex reduction target:
2.4 B$2016 net asset sales target:
2 B$2016 exploration budget:
1.5 B$

NOTE ON FINANCIAL STATEMENTS
FINANCIAL HIGHLIGHTS
(in million dollars, except percent and per share amounts) 2015 2014 2013 2012 2011
Sales 165,357 236,122 251,725 257,037 257,084Adjusted operating income from business segments (1) 12,672 21,604 27,618 31,946 34,044Adjusted net operating income from business segments (1) 11,362 14,247 15,861 17,153 17,118Net income (Group share) 5,087 4,244 11,228 13,648 17,400Adjusted net income (Group share) (1) 10,518 12,837 14,292 15,772 15,948Fully-diluted weighted-average number of shares 2,304,435,542 2,281,004,151 2,271,543,658 2,266,635,745 2,256,951,403Adjusted fully-diluted earnings per share ($) (1) (2) 4.51 5.63 6.29 6.96 7.07Dividend per share (€) (2) 2.44 (3) 2.44 2.38 2.34 2.28Dividend per ADR ($) (2) 2.67 (3) (4) 2.93 3.24 3.05 2.97Net-debt-to-equity ratio (as of December 31) 28.3% 31.3% 23.3% 21.9% 23.4%Return on Average Capital Employed (ROACE) (5) 9.4% 11.1% 13.0% 15.5% 17.0%Return on Equity (ROE) 11.5% 13.5% 14.9% 17.7% 19.9%Cash flow from operating activities 19,946 25,608 28,513 28,858 27,193Gross investments (6) 28,033 30,509 34,431 29,475 34,161Organic investments (7) 22,976 26,430 28,309 23,789 20,641Divestments (at the sale price) 7,584 6,190 6,399 7,543 11,940
(1) Adjusted results are defined as income at replacement cost, excluding non-recurring items, and excluding the impact of fair value changes.(2) Based on the fully-diluted weighted-average number of common shares outstanding during the period.(3) 2015 dividend subject to approval at the May 24, 2016 Annual Shareholders’ Meeting.(4) 2015 estimated dividend in dollars includes the first quarterly interim ADR dividend of $0.69 paid in October 2015 and the second quarterly interim ADR dividend of $0.66 paid in
January 2016, as well as the third quarterly interim ADR dividend of $0.66 payable in April 2016 and the proposed final ADR dividend of $0.66 payable in July 2016, both converted at arate of $1.09 / €.
(5) Based on adjusted net operating income and average capital employed using replacement cost.(6) Including acquisitions and increases in non-current loans.(7) Organic investments = net investments, excluding acquisitions, divestments and other operations with non-controlling interests.
MARKET ENVIRONMENT
2015 2014 2013 2012 2011
Year-end euro / dollar (€ / $) 1.09 1.21 1.38 1.32 1.29Average euro / dollar (€ / $) 1.11 1.33 1.33 1.28 1.39Year-end Brent price ($ / b) 37.3 57.3 110.3 110.0 107.4Average Brent price ($ / b) 52.4 99.0 108.7 111.7 111.3Average refining margins ($ / t) – ERMI (1) 48.5 18.7 17.9 36.0 17.4
(1) Total’s European Refining Margin Indicator (ERMI); published quarterly by the Group.
7– TOTAL Factbook 2015Corporate
Effective January 1, 2014, Total changed the presentation currency of the Group’s Consolidated Financial statementsfrom the euro to the US dollar. Comparative 2013, 2012 and 2011 information has been restated.

OPERATIONAL HIGHLIGHTS BY QUARTER
(in million dollars) 2015 Quarters
Full Year 1st 2nd 3rd 4th
Adjusted operating income from business segments (1) 12,672 3,311 4,064 3,204 2,093 Upstream 4,925 1,531 1,995 994 405 Refining & Chemicals 5,649 1,335 1,604 1,713 997 Marketing & Services 2,098 445 465 497 691 Adjusted net operating income from business segments (1) 11,362 2,780 3,334 2,963 2,285 Upstream 4,774 1,359 1,560 1,107 748 Refining & Chemicals 4,889 1,100 1,349 1,433 1,007 Marketing & Services 1,699 321 425 423 530
(1) Adjusted results are defined as income at replacement cost, excluding non-recurring items, and excluding the impact of fair value changes.
FINANCIAL HIGHLIGHTS BY QUARTER
(in million dollars, except percent, 2015 Quartersper share amounts and share buybacks)
Full Year 1st 2nd 3rd 4th
Adjusted net income (Group share) (1) 10,518 2,602 3,085 2,756 2,075 Adjusted fully diluted earnings per share ($) (1) 4.51 1.13 1.34 1.17 0.88 Net income (Group share) 5,087 2,663 2,971 1,079 (1,626) Net-debt-to-equity ratio (as of end of period) 28.3% 28.2% 25.9% 26.6% 28.3% Shares outstanding (as of end of period) 2,440,057,883 2,385,555,781 2,396,360,090 2,415,089,789 2,440,057,883 Fully-diluted weighted-average number of shares 2,304,435,542 2,285,344,747 2,292,139,361 2,311,978,156 2,328,765,893 Number of shares bought back during the period 4,711,935 - - 4,711,935 - Share buybacks (B$) 0.2 - - 0.2 -
(in million dollars, except percent, 2012 Quartersper share amounts and share buybacks)
Full Year(2) 1st 2nd 3rd 4th
Adjusted net income (Group share) (1) 15,772 4,037 3,576 4,206 3,943 Adjusted fully diluted earnings per share ($) (1) 6.96 1.78 1.58 1.85 1.74 Net income (Group share) 13,648 4,808 1,945 3,853 3,036 Net-debt-to-equity ratio (as of end of period) 21.9% 22.6% 21.9% 21.2% 21.9% Shares outstanding (as of end of period) 2,365,933,146 2,364,545,977 2,364,546,966 2,365,919,246 2,365,933,146 Fully-diluted weighted-average number of shares 2,266,635,745 2,264,743,824 2,264,091,516 2,268,296,670 2,270,173,079 Number of shares bought back during the period 1,800,000 - - - 1,800,000 Share buybacks (B$) 0.1 - - - 0.1
(1) Adjusted results are defined as income at replacement cost, excluding non-recurring items, and excluding the impact of fair value changes.(2) Quarterly data for 2012 and 2011 have not been restated following the application of revised accounting standard IAS 19 effective January 1, 2013.
Therefore, in the absence of such information, the sum of the quarters for these two years is not equal to the full year restated of IAS 19.
MARKET ENVIRONMENT AND PRICE REALIZATIONS
2015 Quarters 2014 Quarters
Full Year 1st 2nd 3rd 4th Full Year 1st 2nd 3rd 4th
Market environment Average euro-dollar ($ / €) 1.11 1.13 1.11 1.11 1.10 1.33 1.37 1.37 1.33 1.25Brent price ($ / b) 52.4 53.9 61.9 50.5 43.8 99.0 108.2 109.7 101.9 76.6Average refining margins ($ / t) – ERMI (1) 48.5 47.1 54.1 54.8 38.1 18.7 6.6 10.9 29.9 27.6
Price realizations (2) TOTAL average liquids price ($ / b) (3) 47.4 49.5 58.2 44.0 38.1 89.4 102.1 103.0 94.0 61.7TOTAL average gas price ($ / MBtu) 4.75 5.38 4.67 4.47 4.45 6.57 7.06 6.52 6.40 6.29
(1) Total’s European Refining Margin Indicator (ERMI); published quarterly by the Group.(2) Consolidated subsidiaries excluding fixed margin and buy-back contracts. Beginning with the first quarter of 2012, includes hydrocarbon production overlifting / underlifting position
valued at market price.(3) Crude oil and natural gas liquids.
8 TOTAL Factbook 2015 – Corporate

9– TOTAL Factbook 2015Corporate
2014 Quarters
Full Year 1st 2nd 3rd 4th
21,604 6,182 5,583 6,134 3,705 17,156 5,501 4,810 4,671 2,174 2,739 328 368 974 1,069 1,709 353 405 489 462 14,247 3,699 3,824 3,927 2,797 10,504 3,092 3,051 2,765 1,596 2,489 346 401 786 956 1,254 261 372 376 245
2014 Quarters 2013 Quarters
Full Year 1st 2nd 3rd 4th Full Year 1st 2nd 3rd 4th
12,837 3,327 3,151 3,558 2,801 14,292 3,698 3,581 3,628 3,385 5.63 1.46 1.38 1.56 1.22 6.29 1.63 1.57 1.59 1.49 4,244 3,335 3,104 3,463 (5,658) 11,228 1,948 3,364 3,682 2,234 31.3% 23.5% 27.1% 27.8% 31.3% 23.3% 25.9% 27.6% 23.0% 23.3% 2,385,267,525 2,378,259,685 2,382,870,577 2,384,527,055 2,385,267,525 2,377,678,160 2,365,933,626 2,376,735,991 2,377,196,179 2,377,678,160 2,281,004,151 2,276,773,146 2,281,218,870 2,284,596,468 2,286,737,894 2,271,543,658 2,269,007,119 2,274,457,002 2,274,700,388 2,275,542,248 4,386,300 - - 4,386,300 - 4,414,200 - - 4,414,200 - 0.3 - - 0.3 - 0.2 - - 0.2 -
2011 Quarters
Full Year(2) 1st 2nd 3rd 4th
15,948 4,246 4,021 3,957 3,674 7.07 1.89 1.78 1.75 1.62 17,400 5,398 3,923 4,682 3,087 23.4% 19.3% 24.3% 15.2% 23.4% 2,363,767,313 2,351,139,024 2,361,390,509 2,363,752,941 2,363,767,313 2,256,951,403 2,251,135,143 2,255,537,890 2,260,966,547 2,263,503,634 - - - - - - - - - -
2013 Quarters 2012 Quarters 2011 Quarters
Full Year 1st 2nd 3rd 4th Full Year 1st 2nd 3rd 4th Full Year 1st 2nd 3rd 4th
1.33 1.32 1.31 1.32 1.36 1.28 1.31 1.28 1.25 1.30 1.39 1.37 1.44 1.41 1.35108.7 112.6 102.4 110.3 109.2 111.7 118.6 108.3 109.5 110.1 111.3 105.4 117.0 113.4 109.317.9 26.9 24.1 10.6 10.1 36.0 20.9 38.2 51.0 33.9 17.4 24.6 16.3 13.4 15.1
103.3 106.7 96.6 107.2 102.5 107.7 115.2 101.6 107.6 106.4 105.0 99.5 110.6 106.8 104.37.12 7.31 6.62 7.18 7.36 6.74 7.16 7.10 6.00 6.94 6.53 6.19 6.60 6.56 6.79

CONSOLIDATED STATEMENT OF INCOME
For the year ended December 31, 20 15 20 14 20 13 20 12 20 11(in million dollars, except per share amounts)
Sales 165,357 236,122 251,725 257,037 257,084Excise taxes (21,936) (24,104) (23,756) (22,821) (25,254)
Revenues from sales 143,421 212,018 227,969 234,216 231,830
Purchases, net of inventory variation (96,671) (152,975) (160,849) (162,908) (158,533)Other operating expenses (24,345) (28,349) (28,764) (29,273) (27,549)Exploration costs (1,991) (1,964) (2,169) (1,857) (1,418)Depreciation, depletion, and amortization of tangible assets and mineral interests (17,720) (19,656) (11,994) (12,237) (10,448)Other income 3,606 2,577 2,290 1,897 2,975Other expense (1,577) (954) (2,800) (1,178) (1,738)
Financial interest on debt (967) (748) (889) (863) (992)Financial income from marketable securities and cash equivalents 94 108 85 128 380
Cost of net debt (873) (640) (804) (735) (612)
Other financial income 882 821 696 717 848Other financial expense (654) (676) (702) (641) (597)
Equity in income (loss) of affiliates 2,361 2,662 3,415 2,582 2,680
Income taxes (1,653) (8,614) (14,767) (16,747) (19,614)
Consolidated net income 4,786 4,250 11,521 13,836 17,824Group share 5,087 4,244 11,228 13,648 17,400Minority interests (301) 6 293 188 424
Earnings per share ($) 2.17 1.87 4.96 6.05 7.74
Fully-diluted earnings per share ($) 2.16 1.86 4.94 6.02 7.71
Adjusted net income 10,518 12,837 14,292 15,772 15,948Adjusted fully-diluted earnings per share ($) 4.51 5.63 6.29 6.96 7.07
10 TOTAL Factbook 2015 – Corporate

SALES
(in million dollars) 2015 2014 2013 2012 2011
By business segment excluding inter-segment sales Upstream 16,840 23,484 26,367 28,449 30,916Refining & Chemicals 70,623 106,124 114,483 117,067 107,384Marketing & Services 77,887 106,509 110,873 111,281 118,769Corporate 7 5 2 240 15
Total 165,357 236,122 251,725 257,037 257,084
By business segment including inter-segment sales Upstream 34,767 52,667 64,017 68,947 68,918Refining & Chemicals 97,417 151,074 166,758 174,201 169,016Marketing & Services 78,798 108,124 113,032 112,251 119,890Corporate 225 241 179 496 271Inter-segment sales (45,850) (75,984) (92,261) (98,858) (101,011)
Total 165,357 236,122 251,725 257,037 257,084
By geographic area excluding inter-segment sales France 36,536 51,471 57,650 59,077 59,333Rest of Europe 79,463 114,747 128,661 133,439 113,379North America 14,857 23,766 22,332 22,675 22,156Africa 17,612 23,281 23,146 23,025 20,986Rest of world 16,889 22,857 19,936 18,821 41,230
Total 165,357 236,122 251,725 257,037 257,084
DEPRECIATION, DEPLETION & AMORTIZATION OF TANGIBLE ASSETS AND MINERAL INTEREST BY BUSINESS SEGMENT
As of December 31, 20 15 20 14 20 13 20 12 2011(in million dollars)
Upstream (15,857) (15,938) (9,484) (9,555) (7,014)Refining & Chemicals (1,092) (2,901) (1,736) (1,856) (2,695)Marketing & Services (744) (781) (733) (780) (690)Corporate (27) (36) (41) (46) (49)
Total (17,720) (19,656) (11,994) (12,237) (10,448)
EQUITY IN INCOME / (LOSS) OF AFFILIATES BY BUSINESS SEGMENT
As of December 31, 20 15 20 14 20 13 20 12 20 11(in million dollars)
Upstream 1,720 2,509 2,889 2,385 2,372Refining & Chemicals 602 315 500 312 411Marketing & Services 39 (162) 26 (115) (104)Corporate - - - - 1
Total 2,361 2,662 3,415 2,582 2,680
INCOME TAXES
(in million dollars) 2015 2014 2013 2012 2011
Current income taxes (4,552) (10,904) (13,607) (15,970) (17,392)Deferred income taxes 2,899 2,290 (1,160) (777) (2,222)Income taxes (1,653) (8,614) (14,767) (16,747) (19,614)
11– TOTAL Factbook 2015Corporate

ADJUSTMENT ITEMS TO OPERATING INCOME BY BUSINESS SEGMENT
(in million dollars) Upstream Refining & Marketing & Corporate Total Chemicals Services
Year 2015 Inventory valuation effect - (859) (254) - (1,113)Effect of changes in fair value (16) - - - (16)Restructuring charges (43) - (5) - (48)Impairments (6,783) (70) (24) - (6,877)Other (1,024) (176) (57) - (1,257)
Total (7,866) (1,105) (340) - (9,311)
Year 2014 Inventory valuation effect - (2,944) (525) - (3,469)Effect of changes in fair value 31 - - - 31Restructuring charges - - - - -Impairments (6,529) (1,450) - - (7,979)Other (164) (36) (26) - (226)
Total (6,662) (4,430) (551) - (11,643)
Year 2013 Inventory valuation effect - (978) (87) - (1,065)Effect of changes in fair value (74) - - - (74)Restructuring charges - (373) (3) - (376)Impairments (855) (184) (4) - (1,043)Other (113) (54) (44) - (211)
Total (1,042) (1,589) (138) - (2,769)
Year 2012 Inventory valuation effect - (230) (71) - (301)Effect of changes in fair value (12) - - - (12)Restructuring charges - (3) - - (3)Impairments (1,538) (266) (87) - (1,891)Other (752) (24) (223) (115) (1,114)
Total (2,302) (523) (381) (115) (3,321)
Year 2011 Inventory valuation effect - 1,292 399 - 1,691Effect of changes in fair value 62 - - - 62Restructuring charges - - - - -Impairments (104) (983) - - (1,087)Other (104) (23) - (127)
Total (42) 205 376 - 539
12 TOTAL Factbook 2015 – Corporate

ADJUSTMENT ITEMS TO NET INCOME BY BUSINESS SEGMENT
(in million dollars) Upstream Refining & Marketing & Corporate Total Chemicals Services
Year 2015 Inventory valuation effect - (590) (157) - (747)Effect of changes in fair value (9) - - - (9)Restructuring charges (10) (52) (10) - (72)Impairments (5,249) (59) (127) (12) (5,447)Gains (losses) on asset sales 162 1,288 360 - 1,810Other (516) (257) (193) - (966)
Total (5,622) 330 (127) (12) (5,431)
Year 2014 Inventory valuation effect - (2,114) (339) - (2,453)Effect of changes in fair value 25 - - - 25Restructuring charges - (13) (7) - (20)Impairments (5,514) (1,409) (140) - (7,063)Gains (losses) on asset sales 1,314 (105) - - 1,209Other (193) (58) (40) - (291)
Total (4,368) (3,699) (526) - (8,593)
Year 2013 Inventory valuation effect - (656) (72) - (728)Effect of changes in fair value (58) - - - (58)Restructuring charges - (537) (30) - (567)Impairments (581) (183) (9) - (773)Gains (losses) on asset sales (58) (59) - - (117)Other (113) (676) 47 (79) (821)
Total (810) (2,111) (64) (79) (3,064)
Year 2012 Inventory valuation effect - (149) (52) - (201)Effect of changes in fair value (9) - - - (9)Restructuring charges - (31) (68) - (99)Impairments (985) (247) (155) (39) (1,426)Gains (losses) on asset sales 326 - - 438 764Other (491) (57) (140) (465) (1,153)
Total (1,159) (484) (415) (66) (2,124)
Year 2011 Inventory valuation effect - 931 229 - 1,160Effect of changes in fair value 45 - - - 45Restructuring charges - (100) (70) - (170)Impairments (104) (663) (644) - (1,411)Gains (losses) on asset sales 1,213 700 391 103 2,407Other (248) (157) (85) (89) (579)
Total 906 711 (179) 14 1,452
13– TOTAL Factbook 2015Corporate

CONSOLIDATED BALANCE SHEET
As of December 31, 20 15 20 14 20 13 20 12 20 11(in million dollars)
ASSETS
Non-current assets Intangible assets, net 14,549 14,682 18,395 16,965 16,062Property, plant and equipment, net 109,518 106,876 104,480 91,477 83,400Equity affiliates: investments and loans 19,384 19,274 20,417 18,153 16,814Other investments 1,241 1,399 1,666 1,571 4,755Hedging instruments of non-current financial debt 1,219 1,319 1,418 2,145 2,557Deferred income taxes 3,982 4,079 3,838 2,982 2,653
Other non-current assets 4,355 4,192 4,406 3,513 3,179
Total non-current assets 154,248 151,821 154,620 136,806 129,420
Current assets Inventories, net 13,116 15,196 22,097 22,954 23,447Accounts receivable, net 10,629 15,704 23,422 25,339 25,941Other current assets 15,843 15,702 14,892 13,307 13,932Current financial instruments 6,190 1,293 739 2,061 906Cash and cash equivalents 23,269 25,181 20,200 20,409 18,147Assets classified as held for sale 1,189 (1) 4,901 (3) 3,253 (5) 5,010 (7) -
Total current assets 70,236 77,977 84,603 89,080 82,373
Total assets 224,484 229,798 239,223 225,886 211,793
LIABILITIES AND SHAREHOLDERS’ EQUITY
Shareholders’ equity Common shares 7,670 7,518 7,493 7,454 7,447Paid-in surplus and retained earnings 101,528 94,646 98,254 92,485 86,461Currency translation adjustment (12,119) (7,480) (1,203) (1,696) (2,884)Treasury shares (4,585) (4,354) (4,303) (4,274) (4,357)
Total shareholders’ equity – Group share 92,494 90,330 100,241 93,969 86,667
Non-controlling interests 2,915 3,201 3,138 1,689 1,749
Total shareholders’ equity 95,409 93,531 103,379 95,658 88,416
Non-current liabilities Deferred income taxes 12,360 14,810 17,850 16,006 15,340Employee benefits 3,774 4,758 4,235 4,939 4,380Provisions and other non-current liabilities 17,502 17,545 17,517 15,285 14,114Non-current financial debt 44,464 45,481 34,574 29,392 29,186
Total non-current liabilities 78,100 82,594 74,176 65,622 63,020
Current liabilities Accounts payable 20,928 24,150 30,282 28,563 28,577Other creditors and accrued liabilities 16,884 16,641 18,948 19,316 19,045Current borrowings 12,488 10,942 11,193 14,535 12,519Other current financial liabilities 171 180 381 232 216Liabilities directly associated with the assets classified as held for sale 504 (2) 1,760 (4) 864 (6) 1,960 (8) -
Total current liabilities 50,975 53,673 61,668 64,606 60,357
Total liabilities and shareholders’ equity 224,484 229,798 239,223 225,886 211,793
(1) $497 million of Fuka in United Kingdom has been classified as “Assets classified as held for sale”. $458 million of Total Turkyie has been classified as “Assets classified as held for sale”.$234 million of Kharyaga in Russia has been classified as “Assets held for sale”.
(2) $82 million of Fuka in United Kingdom has been classified as “Liabilities directly associated with the assets classified as held for sale”. $258 million of Total Turkyie has been classified as “Liabilitiesdirectly associated with the assets classified as held for sale”. $164 million of Kharyaga in Russia has been classified as “Liabilities directly associated with the assets classified as held for sale”.
(3) $2,401 million of OML 138 in Nigeria has been classified as “Assets classified as held for sale”. $1,664 million of Bostik has been classified as “Assets classified as held for sale”.$469 million of TCSA has been classified as “Assets held for sale”. $367 million of Totalgaz has been classified as “Assets held for sale”.
(4) $831 million of OML 138 in Nigeria has been classified as “Liabilities directly associated with the assets classified as held for sale”. $606 million of Bostik has been classified as“Liabilities directly associated with the assets classified as held for sale”. $58 million of TCSA has been classified as “Liabilities directly associated with the assets classified as held forsale”. $265 million of Totalgaz has been classified as “Liabilities directly associated with the assets classified as held for sale”.
(5) $2,527 million of OML 138 in Nigeria has been classified as “Assets classified as held for sale”. $726 million of Block 15 / 06 in Angola has been classified as “Assets classified as held for sale”.(6) $814 million of OML 138 in Nigeria has been classified as “Liabilities directly associated with the assets classified as held for sale”. $50 million of Block 15 / 06 in Angola has been
classified as “Liabilities directly associated with the assets classified as held for sale”.(7) $2,181 million of OML 138 in Nigeria has been classified as “Assets classified as held for sale”. $1,887 million of Transport et Infrastructures Gaz France (TIGF) including $1,643 million
tangible assets has been classified as “Assets classified as held for sale”. $614 million of Tempa Rossa has been classified as “Assets classified as held for sale”. $329 million ofUpstream Trinidad & Tobago have been classified as “Assets classified as held for sale”.
(8) $662 million of OML 138 in Nigeria has been classified as “Liabilities directly associated with the assets classified as held for sale”. $1,167 million of Transport et Infrastructures GazFrance (TIGF) including $1,046 million non current financial debt has been classified as “Liabilities directly associated with the assets classified as held for sale”. $131 million of UpstreamTrinidad & Tobago have been classified as “Liabilities directly associated with the assets classified as held for sale”.
14 TOTAL Factbook 2015 – Corporate

NET TANGIBLE & INTANGIBLE ASSETS BY BUSINESS SEGMENT
As of December 31, 20 15 20 14 20 13 20 12 20 11(in million dollars)
Upstream Tangibles 95,086 92,262 87,548 75,386 67,930Intangibles 13,132 13,011 16,119 14,742 13,909
Refining & Chemicals Tangibles 8,631 8,798 10,991 10,840 10,515Intangibles 686 714 1,416 1,327 1,178
Marketing & Services Tangibles 5,595 5,580 5,676 5,034 4,735Intangibles 628 863 765 814 878
Corporate Tangibles 206 236 265 217 220Intangibles 103 94 95 82 97
Total 124,067 121,558 122,875 108,442 99,642
PROPERTY, PLANT & EQUIPMENT
As of December 31, 20 15 20 14 20 13 20 12 20 11(in million dollars)
Proved properties 58,687 52,968 51,089 39,668 38,342Unproved properties 2,423 2,153 1,432 302 270Work in progress 33,962 37,124 34,612 34,928 27,398
Total Upstream properties 95,072 92,245 87,133 74,898 66,010
Land 970 1,070 1,264 1,250 1,227Machinery plant and equipment (including transportation equipment) 5,748 6,092 8,312 7,972 9,690Buildings 2,637 2,850 3,180 3,057 2,730Construction in progress 2,577 2,043 1,853 1,920 1,589Other 2,514 2,576 2,738 2,380 2,154
Other 14,446 14,631 17,347 16,579 17,390
Total (1) 109,518 106,876 104,480 91,477 83,400
(1) As of December 31, 2015, accumulated depreciation, depletion and amortization amounted to 131,497 M$.
NON-CURRENT ASSETS BY BUSINESS SEGMENT (1)
As of December 31, 20 15 20 14 20 13 20 12 2011(in million dollars)
Upstream 131,014 126,904 125,218 109,004 98,692Refining & Chemicals 12,985 13,987 17,376 16,332 15,752Marketing & Services 9,163 9,129 9,468 8,473 8,114Corporate (133) 482 1,140 852 4,305
Total 153,029 150,502 153,202 134,661 126,863
(1) Financial instruments held for hedging of non-current financial debt purposes are not included here.
15– TOTAL Factbook 2015Corporate

NON-CURRENT DEBT ANALYSIS
As of December 31, 20 15 % 20 14 % 20 13 % 20 12 % 20 11 %(in million dollars, except percent)
Loan repayment schedule (1)
2011 - - - - - - - -2012 - - - - - - - -2013 - - - - - - 5,812 22%2014 - - - - 5,056 19% 4,697 18%2015 - - 4,647 14% 4,572 17% 4,676 17%2016 4,793 11% 4,528 14% 2,804 10% 1,965 7%2017 4,602 11% 4,547 10% 4,159 12% 4,124 15% 9,479 (2) 36%2018 4,420 10% 4,451 10% 4,361 13% 10,691 (3) 39% - -2019 5,542 13% 4,765 11% 15,461 (4) 47% - - - -2020 4,965 11% 25,606 (5) 58% - - - - - -2021 and beyond 23,716 55% - - - - - - - -
Total 43,245 100% 44,162 100% 33,156 100% 27,247 100% 26,629 100%
(in million dollars, except percent) 20 15 % 20 14 % 20 13 % 20 12 % 20 11 %
Analysis by currency (1)
U.S. Dollar 40,337 93% 41,369 94% 27,908 84% 18,060 66% 11,185 42%Euro 1,681 4% 2,428 5% 4,885 15% 7,445 27% 12,398 47%Norwegian Krone 907 2% - - - - - - - -Other currencies 320 1% 365 1% 363 1% 1,742 7% 3,046 11%
Total 43,245 100% 44,162 100% 33,156 100% 27,247 100% 26,629 100%
(in million dollars, except percent) 20 15 % 20 14 % 20 13 % 20 12 % 20 11 %
Analysis by interest rate (1)
Fixed rate 7,666 18% 6,944 16% 6,771 20% 6,710 25% 6,280 24%Floating rates 35,579 82% 37,218 84% 26,385 80% 20,537 75% 20,349 76%
Total 43,245 100% 44,162 100% 33,156 100% 27,247 100% 26,629 100%
(1) These analyses are presented after the impact of interest rate and currency swaps.(2) 2017 and after.(3) 2018 and after.(4) 2019 and after.(5) 2020 and after.
16 TOTAL Factbook 2015 – Corporate

CONSOLIDATED STATEMENT OF CHANGES IN SHAREHOLDERS’ EQUITY – GROUP SHARE
(in million dollars) Common shares issued Paid-in Cumulative Treasury shares Shareholders’ surplus and translation equity
Number Amount retained adjustments Number Amount earnings
As of January 1, 2012 2,363,767,313 7,447 86,461 (2,884) (109,554,173) (4,357) 86,667
Dividend - - (6,728) - - - (6,728)Net income 2012 - - 13,648 - - - 13,648Other comprehensive income - - (987) 1,187 - - 200Issuance of common shares 2,165,833 7 34 - - - 41Purchase of treasury shares - - - - (1,800,000) (88) (88)Sales of treasury shares (1) - - (171) - 2,962,534 171 -Share-based payments - - 188 - - - 188Share cancellation - - - - - - -Other operations with minority interests - - 20 1 - - 21Other items - - 20 - - - 20
As of December 31, 2012 2,365,933,146 7,454 92,485 (1,696) (108,391,639) (4,274) 93,969
Dividend - - (7,116) - - - (7,116)Net income 2013 - - 11,228 - - - 11,228Other comprehensive income - - 473 492 - - 965Issuance of common shares 11,745,014 39 446 - - - 485Purchase of treasury shares - - - - (4,414,200) (238) (238)Sales of treasury shares (1) - - (209) - 3,591,391 209 -Share-based payments - - 189 - - - 189Share cancellation - - - - - - -Other operations with minority interests - - 749 1 - - 750Other items - - 9 - - - 9
As of December 31, 2013 2,377,678,160 7,493 98,254 (1,203) (109,214,448) (4,303) 100,241
Dividend - - (7,378) - - - (7,378)Net income 2014 - - 4,244 - - - 4,244Other comprehensive income - - (907) (6,275) - - (7,182)Issuance of common shares 7,589,365 25 395 - - - 420Purchase of treasury shares - - - - (4,386,300) (283) (283)Sales of treasury shares (1) - - (232) - 4,239,335 232 -Share-based payments - - 114 - - - 114Share cancellation - - - - - - -Other operations with minority interests - - 148 (2) - - 146Other items - - 8 - - - 8
As of December 31, 2014 2,385,267,525 7,518 94,646 (7,480) (109,361,413) (4,354) 90,330
Dividend - - (6,303) - - - (6,303)Net income 2015 - - 5,087 - - - 5,087Other comprehensive income - - 185 (4,639) - - (4,454)Issuance of common shares 54,790,358 152 2,159 - - - 2,311Purchase of treasury shares - - - - (4,711,935) (237) (237)Sales of treasury shares (1) - - (6) - 105,590 6 -Share-based payments - - 101 - - - 101Share cancellation - - - - - - -Issuance of perpetual subordinated notes - - 5,616 - - - 5,616Payments on perpetual subordinated notes - - (114) - - - (114)Other operations with minority interests - - 23 - - - 23Other items - - 134 - - - 134
As of December 31, 2015 2,440,057,883 7,670 101,528 (12,119) (113,967,758) (4,585) 92,494
(1) Treasury shares related to the restricted stock grants.
17– TOTAL Factbook 2015Corporate

NET-DEBT-TO-EQUITY RATIO
As of December 31, 20 15 20 14 20 13 20 12 2011(in million dollars, except percent)
Net financial debt 26,586 28,754 23,612 20,541 20,311Shareholder’s equity 93,864 91,845 101,471 93,901 86,748
Net-debt-to-equity ratio 28.3% 31.3% 23.3% 21.9% 23.4%
CAPITAL EMPLOYED BASED ON REPLACEMENT COST BY BUSINESS SEGMENT
As of December 31, 20 15 20 14 20 13 20 12 2011(in million dollars)
Upstream 105,580 100,497 95,529 84,260 73,635Refining & Chemicals 10,407 13,451 19,752 20,783 20,017Marketing & Services 8,415 8,825 10,051 9,232 8,882Corporate (3,259) (2,247) (2,881) (3,195) 990
Total 121,143 120,526 122,451 111,080 103,534
CAPITAL EMPLOYED
As of December 31, 20 15 20 14 20 13 20 12 20 11(in million dollars)
Non-current assets 153,029 150,502 153,202 134,661 126,863Assets and liabilities classified as held for sale 826 3,085 2,210 4,047 -Working capital 1,776 5,811 11,181 13,721 15,698Long-term liabilities (33,636) (37,113) (39,602) (36,230) (33,834)
Capital employed 121,995 122,285 126,991 116,199 108,727
18 TOTAL Factbook 2015 – Corporate

ROACE BY BUSINESS SEGMENT
(in million dollars, except percent) 20 15 20 14 20 13 2012
Upstream Adjusted net operating income 4,774 10,504 12,450 14,316Average capital employed (1) 103,039 98,013 89,895 78,948
ROACE 4.6% 10.7% 13.8% 18.1%
Refining & Chemicals Adjusted net operating income 4,889 2,489 1,857 1,768Average capital employed (1) 11,929 16,602 20,268 20,400
ROACE 41.0% 15.0% 9.2% 8.7%
Marketing & Services Adjusted net operating income 1,699 1,254 1,554 1,069Average capital employed (1) 8,620 9,438 9,642 9,057
ROACE 19.7% 13.3% 16.1% 11.8%
Corporate Adjusted net operating income 38 (717) (631) (543)Average capital employed (1) (2,753) (2,564) (3,038) (1,103)Group Adjusted net operating income 11,400 13,530 15,230 16,610Average capital employed (1) 120,835 121,489 116,766 107,302
ROACE 9.4% 11.1% 13.0% 15.5%
(1) At replacement cost (excluding after-tax inventory effect). Average Capital Employed = (Capital Employed beginning of the year + Capital Employed end of the year) / 2.
19– TOTAL Factbook 2015Corporate
13
14
20
15
15
14
41
15
11
14
9
15
11
14
5
15
Refining & ChemicalsMarketing & Services
Upstream
Group
ROACE by business segment (%)

CONSOLIDATED STATEMENT OF CASH FLOW
(in million dollars) 20 15 20 14 20 13 20 12 20 11
Cash flow from operating activities Consolidated net income 4,786 4,250 11,521 13,836 17,824Depreciation, depletion, and amortization 19,334 20,859 13,358 13,466 12,010Non-current liabilities, valuation allowances, and deferred taxes (2,563) (1,980) 1,567 1,889 2,272Impact of coverage of pension benefit plans - - - (465) -(Gains) losses on sales of assets (2,459) (1,979) (80) (1,715) (2,479)Undistributed affiliates’ equity earnings (311) 29 (775) 272 (149)(Increase) decrease in working capital 1,683 4,480 2,525 1,392 (2,421)Other changes, net (524) (51) 397 183 136
Cash flow from operating activities 19,946 25,608 28,513 28,858 27,193
Cash flow used in investing activities Intangible assets and property, plant, and equipment additions (25,132) (26,320) (29,748) (25,574) (24,986)Acquisition of subsidiaries, net of cash acquired (128) (471) (21) (245) (1,189)Investments in equity affiliates and other securities (513) (949) (1,756) (1,152) (6,299)Increase in non-current loans (2,260) (2,769) (2,906) (2,504) (1,687)
Total expenditures (28,033) (30,509) (34,431) (29,475) (34,161)
Proceeds from disposal of intangible assets, and property, plant and equipment 2,623 3,442 1,766 1,822 2,003Proceeds from disposal of subsidiaries, net of cash sold 2,508 136 2,654 452 800Proceeds from disposal of non-current investments 837 1,072 330 3,618 7,922Repayment of non-current loans 1,616 1,540 1,649 1,651 1,215
Total divestments 7,584 6,190 6,399 7,543 11,940
Cash flow used in investing activities (20,449) (24,319) (28,032) (21,932) (22,221)
Cash flow (from) / used financing activities Issuance (repayment) of shares:
– Parent company shareholders 485 420 485 41 670– Treasury shares (237) (289) (238) (88) -
Cash dividend paid: – Parent company’s shareholders (2,845) (7,308) (7,128) (6,660) (7,155)– Minority shareholders (100) (154) (156) (133) (239)
Issuance of perpetual subordinated notes 5,616 - - - -Non controlling interest 89 179 2,153 - (798)Net issuance (repayment) of non-current debt 4,166 15,786 11,102 6,780 5,664(Increase) decrease in current borrowings (597) (2,374) (9,037) (3,540) (5,387)(Increase) decrease in current financial assets and liabilities (5,517) (351) 1,298 (1,217) 1,247
Cash flow used in financing activities 1,060 5,909 (1,521) (4,817) (5,998)
Net increase (decrease) in cash and cash equivalents 557 7,198 (1,040) 2,109 (1,026)
Effect of exchange rates (2,469) (2,217) 831 153 (187)Cash and cash equivalents at the beginning of the period 25,181 20,200 20,409 18,147 19,360
Cash and cash equivalents at the end of the period 23,269 25,181 20,200 20,409 18,147
20 TOTAL Factbook 2015 – Corporate

CASH FLOW FROM OPERATING ACTIVITIES
(in million dollars) 20 15 20 14 20 13 20 12 20 11
By business segment Upstream 11,182 16,666 21,857 24,354 23,724Refining & Chemicals 6,432 6,302 4,260 2,726 2,987Marketing & Services 2,323 2,721 2,557 1,456 753Corporate 9 (81) (161) 322 (271)
Total 19,946 25,608 28,513 28,858 27,193
21– TOTAL Factbook 2015Corporate
Sources Uses
Net asset salesCFFO
Financing
Organic investmentCash dividend
22.6 B$
23.0
2015 Cash flow allocation (in B$)

GROSS INVESTMENTS (1)
(in million dollars) 20 15 20 14 20 13 20 12 20 11
By business segment Upstream 24,270 26,520 29,750 25,200 28,761Refining & Chemicals 1,843 2,022 2,708 2,502 2,659Marketing & Services 1,841 1,818 1,814 1,671 2,553Corporate 79 149 159 102 188
Total 28,033 30,509 34,431 29,475 34,161
By geographic area France 980 1,266 1,772 2,041 2,130Rest of Europe 4,783 5,880 6,289 5,660 5,292North America 3,493 3,658 4,157 4,045 7,301Africa 9,154 9,798 10,705 9,346 7,328Rest of world 9,623 9,907 11,508 8,383 12,110
Total 28,033 30,509 34,431 29,475 34,161
(1) Including acquisitions and increases in non-current loans.
ORGANIC INVESTMENTS (2) BY BUSINESS SEGMENT
(in million dollars) 2015 2014 2013 2012 2011
Upstream 20,508 22,959 24,102 20,106 16,872Refining & Chemicals 827 1,944 2,530 2,094 2,373Marketing & Services 1,569 1,424 1,579 1,507 1,239Corporate 72 104 97 82 156
Total 22,976 26,430 28,309 23,789 20,641
(2) Organic investments = net investments, excluding acquisitions, divestments and other operations with non-controlling interests.
DIVESTMENTS BY BUSINESS SEGMENT
(in million dollars) 20 15 20 14 20 13 20 12 20 11
Upstream 3,215 5,764 5,786 3,595 3,607Refining & Chemicals 3,488 192 365 392 3,492Marketing & Services 856 163 186 196 2,721Corporate 25 71 62 3,360 2,120
Total 7,584 6,190 6,399 7,543 11,940
22 TOTAL Factbook 2015 – Corporate
Marketing & Services 6.8%Refining & Chemicals 3.6%
Upstream 89.3%
Corporate 0.3%
2015 Organic investments by business segment

23– TOTAL Factbook 2015Corporate
2012 2013 2014 2015
70
130
120
150
140
9080
TOTAL CAC 40
100110
Total share price in Paris (2012-2015)(in euros)
Source: Bloomberg.Base 100 in 2012.
(1) Based on the definition of employees shareholding persuant to Article L. 225-102 ofthe French Commercial Code, treasury shares excluded.
Source: Bloomberg.Base 100 in 2012.(1) BP, Chevron, ExxonMobil, Shell.
SHARE PERFORMANCE
2012 2013 2014 2015
70
150
9080
TOTAL US
100
120
110
140
130
Peer average
(1)
Total ADR price in New York (2012-2015)(in dollars)
Individual shareholders 7.8%
Group employees(1) 5.1%
Institutional shareholders 87.1%
Distribution by shareholders by type(excluding treasury shares)
SHAREHOLDING STRUCTURE ESTIMATE AS OF DECEMBER 31, 2015
France 28.2%
Rest of Europe 18.8%UK 11.9%Rest of world 8.6%
North America 32.5%
Distribution by shareholders by geographic area(excluding treasury shares)
(2) The 2015 dividend is subject to approval at the May 24, 2016 Annual Shareholders’ meeting.
2.442.382.342.28 2.44(2)
20152011 2012 2013 2014
Dividend per share (in euros)
DIVIDEND POLICY
5850
4345
60
20152011 2012 2013 2014
Pay-out ratio (%)

SHARE INFORMATION
20 15 20 14 20 13 20 12 20 11
Shares outstanding (as of December 31) 2,440,057,883 2,385,267,525 2,377,678,160 2,365,933,146 2,363,767,313Weighted-average number of fully-diluted shares(1) 2,304,435,542 2,281,004,151 2,271,543,658 2,266,635,745 2,256,951,403Shares on a fully-diluted basis (as of December 31) (1) 2,336,295,758 2,285,476,721 2,275,897,116 2,270,350,218 2,263,790,054Treasury Shares 113,967,758 109,361,413 109,214,448 108,391,639 109,554,173
Price per share (€) High 50.30 54.71 45.67 42.97 44.55Low 36.92 38.25 35.18 33.42 29.40Year-end 41.27 42.52 44.53 39.01 39.50
Price per ADR ($) High 55.86 74.22 62.45 57.06 64.44Low 40.93 48.43 45.93 41.75 40.00Year-end 44.95 51.20 61.27 52.01 51.11
Market capitalization at year-end, computed on shares outstanding Billion € 100.7 101.4 105.9 92.3 93.4Billion $ 109.7 122.1 145.7 123.1 120.8
Trading volume (daily average) Euronext Paris 7,412,179 5,519,597 4,439,725 5,622,504 6,565,732New York Stock Exchange (number of ADRs) 1,853,669 1,277,433 1,371,780 3,291,705 4,245,743
Adjusted fully-diluted earnings per share ($) (2) 4.51 5.63 6.29 6.96 7.07Dividend per share (€) 2.44 (3) 2.44 2.38 2.34 2.28Dividend per ADR ($) 2.67 (3) (4) 2.93 3.24 3.05 2.97Pay-out (5) 60% 58% 50% 43% 45%Price-to-earning ratio (6) 10.1 10.1 9.4 7.2 7.8Yield (7) 5.91% 5.74% 5.34% 6.00% 5.77%
(1) Excluding shares owned by the Group and cancelled in the Consolidated Balance Sheet under IFRS.(2) Adjusted results are defined as income at replacement cost, excluding non-recurring items, and excluding the impact of fair value changes.(3) Pending approval at the May 24, 2016 AGM. This amount includes the first two quarterly interim dividends of 0.61 € per share paid on October 21, 2015, January 14, 2016 and the
third quarterly interim dividend of 0.61 € per share payable on April 12, 2016 and, the final dividend of 0.61 € per share payable on June 23, 2016.(4) 2015 estimated dividend in dollars includes the first quarterly interim ADR dividend of $0.69 paid in October 2015 and the second quarterly interim ADR dividend of $0.66 paid in
January 2016, as well as the third quarterly interim ADR dividend of $0.66 payable in April 2016 and the proposed final ADR dividend of $0.66 payable in July 2016, both converted at arate of $1.09 / €.
(5) Dividend (€) / adjusted fully-diluted earnings per share.(6) Share price at year-end (€) / adjusted fully-diluted earnings per share.(7) Dividend (€) / share price at year-end.
24 TOTAL Factbook 2015 – Corporate

PAYROLL (1)
For the year ended December 31, 20 15 20 14 20 13 20 12 20 11(in million dollars)
Wages and salaries (including social charges) 8,088 9,690 9,424 9,167 9,158
(1) Personnel expenses and number of employees of fully-consolidated subsidiaries.
NUMBER OF EMPLOYEES
As of December 31, 20 15 20 14 20 13 20 12 20 11
Number of employees by region (1) France 31.5% 32.5% 33.6% 36.0% 36.5%Rest of Europe 24.5% 23.9% 23.4% 23.5% 23.4%Rest of world 44.0% 43.6% 43.0% 40.5% 40.1%
Total 96,019 100,307 98,799 97,126 96,104
As of December 31, 2015 2014 2013 2012 2011
Number of employees by business segment (1) Upstream 17.9% 18.3% 18.2% 18.6% 18.4%Refining & Chemicals 50.2% 51.5% 52.1% 53.1% 52.4%Marketing & Services 30.2% 28.6% 28.2% 26.8% 27.8%Corporate 1.7% 1.6% 1.5% 1.5% 1.5%
Total 96,019 100,307 98,799 97,126 96,104
(1) Personnel expenses and number of employees of fully-consolidated subsidiaries.
As of December 31, 2015
Number of employees present by business segment (2) Upstream
Exploration & Production 15,366Gas & Power 915
Refining & Chemicals Refining & Chemicals 46,661Trading & Shipping 563
Marketing & Services Marketing & Services 19,923New Energies 8,475
Corporate 1,568
(2) Employees present: employees present are employees on the payroll of the consolidated scope, less employees who are not present, i.e., persons who are under suspended contract(sabbatical, business development leave, etc.), absent on long-term sick leave (more than six months), assigned to a company outside the Group, etc.
25– TOTAL Factbook 2015Corporate

This page was intentionally left blank.
26 TOTAL Factbook 2015 – Corporate

27– TOTAL Factbook 2015Upstream
UPSTREAM
2.35Mboe/dproduction
4.8 B$adjusted net operating income
>13 yearsproved reserve life
16,281employees
11.2 B$cash flow from operations
20.5 B$organicinvestments (1)
9.4%production growth in 2015
9start-ups in 2015
(1) Organic investments = net investments, excluding acquisitions, divestments and other operations with non-controlling interests.

28 TOTAL Factbook 2015 – Upstream
2016 OUTLOOK
5major start-ups in 2016, 2 already in production
4%targeted production growth in 2016
Exploration budget
1.5 B$
35%reduction in E&P Opex per barrel (ASC 932) vs 2014
The Upstreamsegment comprises…Exploration & Production Presence in more than fifty countries withoil or gas production in approximately thirtycountries.
GasConducts activities downstream fromproduction related to natural gas, LiquefiedNatural Gas (LNG) and Liquefied PetroleumGas (LPG), as well as power generation andtrading, and other activities.

FINANCIAL HIGHLIGHTS (1)
(in million dollars) 2015 2014 2013 2012 2011
Adjusted operating income (1) 4,925 17,156 23,700 28,333 31,525Adjusted net operating income (1) 4,774 10,504 12,450 14,316 14,798Gross investments (2) 24,270 26,520 29,750 25,200 28,761Organic investments (3) 20,508 22,959 24,102 20,106 16,872Divestments 3,215 5,764 5,786 3,595 3,607Cash flow from operations 11,182 16,666 21,857 24,354 23,724
(1) Adjusted results are defined as income at replacement cost, excluding non-recurring items, and excluding the impact of fair value changes.(2) Including acquisitions and increases in non current-loans.(3) Organic investments = net investments, excluding acquisitions, divestments and other operations with non-controlling interests.
PRODUCTION
2015 2014 2013 2012 2011
Liquids (Kb / d) (1) 1,237 1,034 1,167 1,220 1,226Gas (Mcf / d) 6,054 6,063 6,184 5,880 6,098
Combined production (Kboe / d) 2,347 2,146 2,299 2,300 2,346
(1) Including bitumen.
PROVED RESERVES (1)
2015 2014 2013 2012 2011
Liquids (Mb) (2) 5,605 5,303 5,413 5,686 5,784Gas (Bcf) 32,206 33,590 33,026 30,877 30,717
Total (Mboe) 11,580 11,523 11,526 11,368 11,423
(1) Proved reserves are calculated in accordance with the United States Securities and Exchange Commission regulations.(2) Including bitumen.
29– TOTAL Factbook 2015Upstream
Africa 2,134 MboeAmericas 1,977 Mboe
Asia-CIS 3,811 Mboe
Middle East 2,386 MboeEurope 1,272 Mboe
2015 Proved reserves by geographical area: 11,580 Mboe

KEY OPERATING RATIOS ON PROVED RESERVES – GROUP
(three-year average) 2013-2015 2012-2014 2011-2013 2010-2012 2009-2011
Finding costs ($ / boe) (1) 4.2 5.5 7.9 8.1 6.6Reserve replacement costs ($ / boe) (2) 23.2 24.8 21.4 17.9 16.1Reserve replacement rate (%) (3) (4) 109 104 133 134 138Organic reserve replacement rate (%) (4) (5) 121 107 89 79 80
(in years) 2015 2014 2013 2012 2011
Reserve life (6) 13.5 14.7 13.7 13.5 13.3
(1) (Exploration costs + unproved property acquisition) / (revisions + extensions and discoveries).(2) Total costs incurred / (revisions + extensions, discoveries + acquisitions). Revision of historical costs incurred since 2011 triggering a revision in reserve replacement costs.(3) (Revisions + extensions, discoveries + acquisitions – sales of reserves) / production for the period.(4) Including the mechanical effect of changes in oil prices at year-end.(5) (Revisions + extensions, discoveries) / production for the period; excluding acquisitions and sales of reserves.(6) Reserves at year-end / production of the year.
KEY OPERATING RATIOS ON PROVED RESERVES – CONSOLIDATED SUBSIDIARIES
(in dollars per barrel of oil equivalent) 2013-2015 2012-2014 2011-2013 2010-2012 2009-2011
Finding costs (1) 6.5 10.3 10.3 8.0 6.3Reserve replacement costs (2) 36.5 47.4 34.3 21.6 18.4
(in dollars per barrel of oil equivalent) 2015 2014 2013 2012 2011
Operating costs 7.4 9.9 8.9 7.9 7.0Exploration costs 2.4 3.4 3.7 3.0 2.2DD&A (3) 13.2 15.0 13.5 11.9 9.7
Technical costs (4) 23.0 28.3 26.1 22.8 18.9
(1) (Exploration costs + unproved property acquisition) / (revisions + extensions, discoveries).(2) Total costs incurred / (revisions + extensions, discoveries + acquisitions). Revision of historical costs incurred since 2011 triggering a revision in reserve replacement costs.(3) Excluding non-recurring items.(4) (Production costs + exploration expenses + DD&A) / production of the year.
30 TOTAL Factbook 2015 – Upstream
Africa 678 kboe/dAmericas 255 kboe/d
Asia-CIS 548 kboe/d
Middle East 492 kboe/dEurope 374 kboe/d
Total production for 2015: 2,347 kboe/d

COMBINED LIQUIDS AND GAS PRODUCTION (1)
(in thousands of barrels of oil equivalent per day) 2015 2014 2013 2012 2011
Africa 678 657 670 713 659
Algeria 25 20 21 23 33Angola 248 200 186 179 135Cameroon - - - - 3Gabon 59 58 59 57 58Libya 14 27 50 62 20Nigeria 245 257 261 279 287The Congo, Republic of 87 95 93 113 123
North America 103 90 73 69 67
Canada (2) 14 12 13 12 11United States 89 78 60 57 56
South America 152 157 166 182 188
Argentina 72 75 78 83 86Bolivia 28 30 28 27 25Colombia - - - 6 11Trinidad & Tobago - - 12 16 12Venezuela 52 52 48 50 54
Asia – Pacific 258 238 235 221 231
Australia 4 4 4 5 4Brunei 15 15 13 12 13China 11 12 8 1 -Indonesia 147 130 131 132 158Myanmar 19 17 16 16 15Thailand 62 60 63 55 41
Commonwealth of Independent States 290 249 227 195 119
Azerbaijan - 14 20 16 14Russia 290 235 207 179 105
Europe 374 364 392 427 512
France - 2 9 13 18Netherlands 28 31 35 33 38Norway 239 242 243 275 287United Kingdom 107 89 105 106 169
Middle East 492 391 536 493 570
U.A.E. 287 127 260 246 240Iraq 18 12 7 6 -Oman 36 36 37 37 36Qatar 134 132 137 139 155Syria - - - - 53Yemen 17 84 95 65 86
Total production 2,347 2,146 2,299 2,300 2,346
Including share of equity affiliates 559 571 687 611 571Algeria - - - - 10Angola - 2 3 - -Colombia - - - - 4Venezuela 37 38 37 40 45U.A.E. 116 118 253 237 231Oman 34 34 35 34 34Qatar 77 77 78 74 78Yemen 15 75 84 55 74Russia 280 227 197 171 95
(1) Including fuel gas (435 Mcf / d in 2015, 426 Mcf / d in 2014, 415 Mcf / d in 2013, 394 Mcf / d in 2012).(2) The Group’s production in Canada consists of bitumen only. All of the Group’s bitumen production is in Canada.
31– TOTAL Factbook 2015Upstream

LIQUIDS PRODUCTION
(in thousands of barrels per day) 2015 2014 2013 2012 2011
Africa 542 522 531 574 517
Algeria 7 5 5 6 16Angola 238 191 175 172 128Cameroon - - - - 2Gabon 55 55 55 54 55Libya 14 27 50 62 20Nigeria 147 156 158 173 179The Congo, Republic of 81 88 88 107 117
North America 48 39 28 25 27
Canada (1) 14 12 13 12 11United States 34 27 15 13 16
South America 47 50 54 59 71
Argentina 8 9 13 12 14Bolivia 3 4 4 3 3Colombia - - - 1 5Trinidad & Tobago - - 2 4 4Venezuela 36 37 35 39 45
Asia – Pacific 34 30 30 27 27
Brunei 3 2 2 2 2Indonesia 22 18 17 16 18Thailand 9 10 11 9 7
Commonwealth of Independent States 54 36 32 27 22
Azerbaijan - 3 5 4 4Russia 54 33 27 23 18
Europe 161 165 168 197 245
France - - 1 2 5Netherlands 1 1 1 1 1Norway 125 135 136 159 172United Kingdom 35 29 30 35 67
Middle East 351 192 324 311 317
U.A.E. 274 115 247 233 226Iraq 18 12 7 6 -Oman 25 24 24 24 24Qatar 32 32 36 38 44Syria - - - - 11Yemen 2 9 10 10 12
Total production 1,237 1,034 1,167 1,220 1,226
Including share of equity affiliates 219 200 325 308 316Algeria - - - - 10Colombia - - - - 4Venezuela 36 37 35 38 44U.A.E. 107 109 240 225 219Oman 24 23 23 23 22Qatar 7 7 8 7 8Russia 45 24 19 15 9
(1) The Group’s production in Canada consists of bitumen only. All of the Group’s bitumen production is in Canada.
32 TOTAL Factbook 2015 – Upstream

GAS PRODUCTION (1)
(in millions of cubic feet per day) 2015 2014 2013 2012 2011
Africa 677 693 699 705 715
Algeria 96 79 82 90 94Angola 49 54 62 44 39Cameroon - - - - 1Gabon 15 14 16 19 17Nigeria 487 511 511 521 534The Congo, Republic of 30 35 28 31 30
North America 308 285 256 246 227
United States 308 285 256 246 227
South America 588 599 627 682 648
Argentina 354 367 366 394 397Bolivia 133 139 129 124 118Colombia - - - 23 27Trinidad & Tobago - - 52 70 47Venezuela 101 93 80 71 59
Asia – Pacific 1,290 1,178 1,170 1,089 1,160
Australia 28 23 25 29 25Brunei 62 66 59 54 56China 59 63 46 7 -Indonesia 676 594 605 605 757Myanmar 153 135 129 127 119Thailand 312 297 306 267 203
Commonwealth of Independent States 1,252 1,135 1,046 909 525
Azerbaijan - 59 82 64 57Russia 1,252 1,076 964 845 468
Europe 1,161 1,089 1,231 1,259 1,453
France - 9 45 58 69Netherlands 158 171 195 184 214Norway 614 576 575 622 619United Kingdom 389 333 416 395 551
Middle East 778 1,084 1,155 990 1,370
U.A.E. 66 61 71 70 72Iraq 1 1 1 - -Oman 58 61 66 61 62Qatar 573 555 558 560 616Syria - - - - 218Yemen 80 406 459 299 402
Total production 6,054 6,063 6,184 5,880 6,098
Including share of equity affiliates 1,828 1,988 1,955 1,635 1,383Algeria - - - - 3Angola - 10 16 - -Venezuela 7 6 7 7 7U.A.E. 50 51 61 61 62Oman 58 61 66 60 62Qatar 383 381 385 364 382Yemen 80 404 458 299 402Russia 1,250 1,075 962 844 465
(1) Including fuel gas (435 Mcf / d in 2015, 426 Mcf / d in 2014, 415 Mcf / d in 2013, 394 Mcf / d in 2012).
33– TOTAL Factbook 2015Upstream

CHANGES IN OIL, BITUMEN AND GAS RESERVES
The following tables present, for oil, bitumen and gas reserves, an estimate of the Group’s oil, bitumen and gas quantities by geographicareas as of December 31, 2015, 2014, 2013, 2012 and 2011.
Quantities shown concern proved developed and undeveloped reserves together with changes in quantities for 2015, 2014, 2013, 2012 and 2011.
The definitions used for proved, proved developed and proved undeveloped oil and gas reserves are in accordance with the revisedRule 4-10 of SEC Regulation S-X.
All references in the following tables to reserves or production are to the Group’s entire share of such reserves or production.
TOTAL’s worldwide proved reserves include the proved reserves of its consolidated subsidiaries as well as its proportionate share of theproved reserves of equity affiliates.
(in millions of barrels of oil equivalent) Consolidated subsidiaries
Proved developed Europe Africa Americas Middle East Asia-CIS Russia Totaland undeveloped reserves (excl. Russia)
Balance as of December 31, 2010 1,706 3,371 1,540 574 1,069 30 8,290
Revisions of previous estimates 117 (61) (36) (68) (16) (3) (67)Extensions, discoveries and other 57 6 - - 588 - 651Acquisitions of reserves in place 44 - 309 - 2 - 355Sales of reserves in place - (65) - - - - (65)Production for the year (187) (237) (75) (56) (90) (3) (648)
Balance as of December 31, 2011 1,737 3,014 1,738 450 1,553 24 8,516
Revisions of previous estimates 64 65 7 (23) 9 6 128Extensions, discoveries and other 67 173 110 29 40 3 422Acquisitions of reserves in place 32 - - - - - 32Sales of reserves in place (38) (71) (8) - - - (117)Production for the year (156) (261) (77) (34) (87) (3) (618)
Balance as of December 31, 2012 1,706 2,920 1,770 422 1,515 30 8,363
Revisions of previous estimates 18 (97) 44 11 48 - 24Extensions, discoveries and other 12 20 135 2 226 1 396Acquisitions of reserves in place - - - - 132 - 132Sales of reserves in place (51) - (51) - - - (102)Production for the year (143) (243) (74) (31) (94) (3) (588)
Balance as of December 31, 2013 1,542 2,600 1,824 404 1,827 28 8,225
Revisions of previous estimates 31 48 (11) 7 21 4 100Extensions, discoveries and other 21 111 151 3 29 - 315Acquisitions of reserves in place 1 - - - - - 1Sales of reserves in place (26) (21) - - (206) - (253)Production for the year (133) (240) (76) (32) (91) (3) (575)
Balance as of December 31, 2014 1,436 2,498 1,888 382 1,580 29 7,813
Revisions of previous estimates (10) (121) 144 110 73 - 196Extensions, discoveries and other 11 9 6 864 7 - 897Acquisitions of reserves in place - - - - - - -Sales of reserves in place (28) (76) (160) - - - (264)Production for the year (137) (247) (79) (91) (94) (4) (652)
Balance as of December 31, 2015 1,272 2,063 1,799 1,265 1,566 25 7,990
Minority interest in proved developed and undeveloped reserves as of
December 31, 2011 - 98 - - - - 98December 31, 2012 - 99 - - - - 99December 31, 2013 - 159 - - - - 159December 31, 2014 - 146 - - - - 146
December 31, 2015 - 128 - - - - 128
34 TOTAL Factbook 2015 – Upstream

(in millions of barrels of oil equivalent) Equity affiliates
Proved developed Europe Africa Americas Middle East Asia-CIS Russia Totaland undeveloped reserves (excl. Russia)
Balance as of December 31, 2010 - 107 486 1,812 - - 2,405
Revisions of previous estimates - (1) (8) (20) - - (29)Extensions, discoveries and other - - - - - - -Acquisitions of reserves in place - - - - - 779 779Sales of reserves in place - (24) (4) (11) - - (39)Production for the year - (4) (18) (152) - (35) (209)
Balance as of December 31, 2011 - 78 456 1,629 - 744 2,907
Revisions of previous estimates - 2 (39) 5 - 78 46Extensions, discoveries and other - - - - - 158 158Acquisitions of reserves in place - - - - - 118 118Sales of reserves in place - - - - - - -Production for the year - - (15) (146) - (63) (224)
Balance as of December 31, 2012 - 80 402 1,488 - 1,035 3,005
Revisions of previous estimates - (3) (141) (3) - 33 (114)Extensions, discoveries and other - - - 14 - 622 636Acquisitions of reserves in place - - - - - 117 117Sales of reserves in place - - - - - (92) (92)Production for the year - (1) (13) (164) - (73) (251)
Balance as of December 31, 2013 - 76 248 1,335 - 1,642 3,301
Revisions of previous estimates - (2) 2 (8) - 6 (2)Extensions, discoveries and other - - - 2 - 516 518Acquisitions of reserves in place - - - - - 107 107Sales of reserves in place - - - - - (6) (6)Production for the year - (1) (14) (110) - (83) (208)
Balance as of December 31, 2014 - 73 236 1,219 - 2,182 3,710
Revisions of previous estimates - (2) (44) (10) - 96 40Extensions, discoveries and other - - - - - - -Acquisitions of reserves in place - - - - - 56 56Sales of reserves in place - - - - - (12) (12)Production for the year - - (14) (88) - (102) (204)
Balance as of December 31, 2015 - 71 178 1,121 - 2,220 3,590
35– TOTAL Factbook 2015Upstream

CHANGES IN OIL, BITUMEN AND GAS RESERVES
(in millions of barrels of oil equivalent) Consolidated subsidiaries and equity affiliates
Europe Africa Americas Middle East Asia-CIS Russia Total (excl. Russia)
As of December 31, 2011
Proved developed and undeveloped reserves 1,737 3,092 2,194 2,079 1,553 768 11,423
Consolidated subsidiaries 1,737 3,014 1,738 450 1,553 24 8,516Equity affiliates - 78 456 1,629 - 744 2,907
Proved developed reserves 894 1,660 647 1,869 302 674 6,046
Consolidated subsidiaries 894 1,639 524 371 302 19 3,749Equity affiliates - 21 123 1,498 - 655 2,297
Proved undeveloped reserves 843 1,432 1,547 210 1,251 94 5,377
Consolidated subsidiaries 843 1,375 1,214 79 1,251 5 4,767Equity affiliates - 57 333 131 - 89 610
As of December 31, 2012
Proved developed and undeveloped reserves 1,706 3,000 2,172 1,910 1,515 1,065 11,368
Consolidated subsidiaries 1,706 2,920 1,770 422 1,515 30 8,363Equity affiliates - 80 402 1,488 - 1,035 3,005
Proved developed reserves 827 1,584 616 1,718 290 754 5,789
Consolidated subsidiaries 827 1,563 475 349 290 23 3,527Equity affiliates - 21 141 1,369 - 731 2,262
Proved undeveloped reserves 879 1,416 1,556 192 1,225 311 5,579
Consolidated subsidiaries 879 1,357 1,295 73 1,225 7 4,836Equity affiliates - 59 261 119 - 304 743
36 TOTAL Factbook 2015 – Upstream

(in millions of barrels of oil equivalent) Consolidated subsidiaries and equity affiliates
Europe Africa Americas Middle East Asia-CIS Russia Total (excl. Russia)
As of December 31, 2013
Proved developed and undeveloped reserves 1,542 2,676 2,072 1,739 1,827 1,670 11,526
Consolidated subsidiaries 1,542 2,600 1,824 404 1,827 28 8,225Equity affiliates - 76 248 1,335 - 1,642 3,301
Proved developed reserves 766 1,469 540 1,577 539 783 5,674
Consolidated subsidiaries 766 1,452 452 330 539 21 3,560Equity affiliates - 17 88 1,247 - 762 2,114
Proved undeveloped reserves 776 1,207 1,532 162 1,288 887 5,852
Consolidated subsidiaries 776 1,148 1,372 74 1,288 7 4,665Equity affiliates - 59 160 88 - 880 1,187
As of December 31, 2014
Proved developed and undeveloped reserves 1,436 2,571 2,124 1,601 1,580 2,211 11,523
Consolidated subsidiaries 1,436 2,498 1,888 382 1,580 29 7,813Equity affiliates - 73 236 1,219 - 2,182 3,710
Proved developed reserves 737 1,472 535 1,442 453 1,067 5,706
Consolidated subsidiaries 737 1,455 450 316 453 18 3,429Equity affiliates - 17 85 1,126 - 1,049 2,277
Proved undeveloped reserves 699 1,099 1,589 159 1,127 1,144 5,817
Consolidated subsidiaries 699 1,043 1,438 66 1,127 11 4,384Equity affiliates - 56 151 93 - 1,133 1,433
As of December 31, 2015
Proved developed and undeveloped reserves 1,272 2,134 1,977 2,386 1,566 2,245 11,580
Consolidated subsidiaries 1,272 2,063 1,799 1,265 1,566 25 7,990Equity affiliates - 71 178 1,121 - 2,220 3,590
Proved developed reserves 756 1,215 626 2,020 499 1,070 6,186
Consolidated subsidiaries 756 1,203 549 1,028 499 16 4,051Equity affiliates - 12 77 992 - 1,054 2,135
Proved undeveloped reserves 516 919 1,351 366 1,067 1,175 5,394
Consolidated subsidiaries 516 860 1,250 237 1,067 9 3,939Equity affiliates - 59 101 129 - 1,166 1,455
37– TOTAL Factbook 2015Upstream

CHANGES IN OIL RESERVES
Oil reserves include crude oil, condensates and natural gas liquids reserves.
(in millions of barrels) Consolidated subsidiaries
Proved developed Europe Africa Americas Middle East Asia-CIS Russia Totaland undeveloped reserves (excl. Russia)
Balance as of December 31, 2010 792 2,350 79 239 528 26 4,014
Revisions of previous estimates 49 (19) 9 (33) (21) (3) (18)Extensions, discoveries and other 17 6 - - 58 - 81Acquisitions of reserves in place 42 - - - - - 42Sales of reserves in place - (57) - - - - (57)Production for the year (88) (185) (15) (25) (12) (3) (328)
Balance as of December 31, 2011 812 2,095 73 181 553 20 3,734
Revisions of previous estimates 20 61 10 2 3 7 103Extensions, discoveries and other 27 148 8 28 3 3 217Acquisitions of reserves in place 7 - - - - - 7Sales of reserves in place (32) (45) (2) - - - (79)Production for the year (72) (210) (12) (21) (11) (3) (329)
Balance as of December 31, 2012 762 2,049 77 190 548 27 3,653
Revisions of previous estimates 19 50 7 7 75 - 158Extensions, discoveries and other 6 19 20 2 20 1 68Acquisitions of reserves in place - - - - 34 - 34Sales of reserves in place (49) - (6) - - - (55)Production for the year (60) (194) (12) (20) (13) (3) (302)
Balance as of December 31, 2013 678 1,924 86 179 664 25 3,556
Revisions of previous estimates 8 33 3 5 10 4 63Extensions, discoveries and other 3 101 14 3 2 - 123Acquisitions of reserves in place - - - - - - -Sales of reserves in place (11) (20) - - (32) - (63)Production for the year (60) (191) (15) (19) (12) (3) (300)
Balance as of December 31, 2014 618 1,847 88 168 632 26 3,379
Revisions of previous estimates (18) (120) 27 76 20 - (15)Extensions, discoveries and other 4 8 2 856 - - 870Acquisitions of reserves in place - - - - - - -Sales of reserves in place (4) (57) - - - - (61)Production for the year (60) (198) (16) (78) (12) (3) (367)
Balance as of December 31, 2015 540 1,480 101 1,022 640 23 3,806
Minority interest in proved developed and undeveloped reserves as of
December 31, 2011 - 88 - - - - 88December 31, 2012 - 87 - - - - 87December 31, 2013 - 140 - - - - 140December 31, 2014 - 128 - - - - 128
December 31, 2015 - 115 - - - - 115
38 TOTAL Factbook 2015 – Upstream

(in millions of barrels) Equity affiliates
Proved developed Europe Africa Americas Middle East Asia-CIS Russia Totaland undeveloped reserves (excl. Russia)
Balance as of December 31, 2010 - 34 470 680 - - 1,184
Revisions of previous estimates - 2 (6) (12) - - (16)Extensions, discoveries and other - - - - - - -Acquisitions of reserves in place - - - - - 51 51Sales of reserves in place - (22) (4) (12) - - (38)Production for the year - (4) (17) (91) - (3) (115)
Balance as of December 31, 2011 - 10 443 565 - 48 1,066
Revisions of previous estimates - 5 (40) 5 - 9 (21)Extensions, discoveries and other - - - - - 51 51Acquisitions of reserves in place - - - - - 11 11Sales of reserves in place - - - - - - -Production for the year - - (15) (93) - (5) (113)
Balance as of December 31, 2012 - 15 388 477 - 114 994
Revisions of previous estimates - (3) (138) (6) - (4) (151)Extensions, discoveries and other - - - - - 32 32Acquisitions of reserves in place - - - - - 13 13Sales of reserves in place - - - - - - -Production for the year - - (13) (99) - (7) (119)
Balance as of December 31, 2013 - 12 237 372 - 148 769
Revisions of previous estimates - (5) 2 (3) - (3) (9)Extensions, discoveries and other - - - 3 - 81 84Acquisitions of reserves in place - - - - - 9 9Sales of reserves in place - - - - - (1) (1)Production for the year - - (13) (51) - (9) (73)
Balance as of December 31, 2014 - 7 226 321 - 225 779
Revisions of previous estimates - 6 (42) (11) - 34 (13)Extensions, discoveries and other - - - - - - -Acquisitions of reserves in place - - - - - 6 6Sales of reserves in place - - - - - (2) (2)Production for the year - - (14) (50) - (17) (81)
Balance as of December 31, 2015 - 13 170 260 - 246 689
39– TOTAL Factbook 2015Upstream

CHANGES IN OIL RESERVES
(in millions of barrels of oil equivalent) Consolidated subsidiaries and equity affiliates
Europe Africa Americas Middle East Asia-CIS Russia Total (excl. Russia)
As of December 31, 2011
Proved developed and undeveloped reserves 812 2,105 516 746 553 68 4,800
Consolidated subsidiaries 812 2,095 73 181 553 20 3,734Equity affiliates - 10 443 565 - 48 1,066
Proved developed reserves 351 1,206 165 565 33 58 2,378
Consolidated subsidiaries 351 1,202 48 116 33 17 1,767Equity affiliates - 4 117 449 - 41 611
Proved undeveloped reserves 461 899 351 181 520 10 2,422
Consolidated subsidiaries 461 893 25 65 520 3 1,967Equity affiliates - 6 326 116 - 7 455
As of December 31, 2012
Proved developed and undeveloped reserves 762 2,064 465 667 548 141 4,647
Consolidated subsidiaries 762 2,049 77 190 548 27 3,653Equity affiliates - 15 388 477 - 114 994
Proved developed reserves 289 1,145 179 506 34 76 2,229
Consolidated subsidiaries 289 1,139 44 133 34 21 1,660Equity affiliates - 6 135 373 - 55 569
Proved undeveloped reserves 473 919 286 161 514 65 2,418
Consolidated subsidiaries 473 910 33 57 514 6 1,993Equity affiliates - 9 253 104 - 59 425
40 TOTAL Factbook 2015 – Upstream

(in millions of barrels of oil equivalent) Consolidated subsidiaries and equity affiliates
Europe Africa Americas Middle East Asia-CIS Russia Total (excl. Russia)
As of December 31, 2013
Proved developed and undeveloped reserves 678 1,936 323 551 664 173 4,325
Consolidated subsidiaries 678 1,924 86 179 664 25 3,556Equity affiliates - 12 237 372 - 148 769
Proved developed reserves 274 1,068 128 419 216 88 2,193
Consolidated subsidiaries 274 1,064 45 119 216 19 1,737Equity affiliates - 4 83 300 - 69 456
Proved undeveloped reserves 404 868 195 132 448 85 2,132
Consolidated subsidiaries 404 860 41 60 448 6 1,819Equity affiliates - 8 154 72 - 79 313
As of December 31, 2014
Proved developed and undeveloped reserves 618 1,854 314 489 632 251 4,158
Consolidated subsidiaries 618 1,847 88 168 632 26 3,379Equity affiliates - 7 226 321 - 225 779
Proved developed reserves 263 1,069 136 377 200 136 2,181
Consolidated subsidiaries 263 1,065 54 117 200 16 1,715Equity affiliates - 4 82 260 - 120 466
Proved undeveloped reserves 355 785 178 112 432 115 1,977
Consolidated subsidiaries 355 782 34 51 432 10 1,664Equity affiliates - 3 144 61 - 105 313
As of December 31, 2015
Proved developed and undeveloped reserves 540 1,493 271 1,282 640 269 4,495
Consolidated subsidiaries 540 1,480 101 1,022 640 23 3,806Equity affiliates - 13 170 260 - 246 689
Proved developed reserves 262 865 145 1,032 200 151 2,655
Consolidated subsidiaries 262 862 71 817 200 15 2,227Equity affiliates - 3 74 215 - 136 428
Proved undeveloped reserves 278 628 126 250 440 118 1,840
Consolidated subsidiaries 278 618 30 205 440 8 1,579Equity affiliates - 10 96 45 - 110 261
41– TOTAL Factbook 2015Upstream

CHANGES IN BITUMEN RESERVES
(in millions of barrels) Consolidated subsidiaries
Proved developed Europe Africa Americas Middle East Asia-CIS Russia Totaland undeveloped reserves (excl. Russia)
Balance as of December 31, 2010 - - 789 - - - 789
Revisions of previous estimates - - (109) - - - (109)Extensions, discoveries and other - - - - - - -Acquisitions of reserves in place - - 308 - - - 308Sales of reserves in place - - - - - - -Production for the year - - (4) - - - (4)
Balance as of December 31, 2011 - - 984 - - - 984
Revisions of previous estimates - - 43 - - - 43Extensions, discoveries and other - - 15 - - - 15Acquisitions of reserves in place - - - - - - -Sales of reserves in place - - - - - - -Production for the year - - (4) - - - (4)
Balance as of December 31, 2012 - - 1,038 - - - 1,038
Revisions of previous estimates - - 2 - - - 2Extensions, discoveries and other - - 53 - - - 53Acquisitions of reserves in place - - - - - - -Sales of reserves in place - - - - - - -Production for the year - - (5) - - - (5)
Balance as of December 31, 2013 - - 1,088 - - - 1,088
Revisions of previous estimates - - (25) - - - (25)Extensions, discoveries and other - - 87 - - - 87Acquisitions of reserves in place - - - - - - -Sales of reserves in place - - - - - - -Production for the year - - (5) - - - (5)
Balance as of December 31, 2014 - - 1,145 - - - 1,145
Revisions of previous estimates - - 130 - - - 130Extensions, discoveries and other - - - - - - -Acquisitions of reserves in place - - - - - - -Sales of reserves in place - - (160) - - - (160)Production for the year - - (5) - - - (5)
Balance as of December 31, 2015 - - 1,110 - - - 1,110
Proved developed reserves as of
December 31, 2011 - - 21 - - - 21December 31, 2012 - - 18 - - - 18December 31, 2013 - - 15 - - - 15December 31, 2014 - - 17 - - - 17
December 31, 2015 - - 100 - - - 100
Proved undeveloped reserves as of
December 31, 2011 - - 963 - - - 963December 31, 2012 - - 1,020 - - - 1,020December 31, 2013 - - 1,073 - - - 1,073December 31, 2014 - - 1,128 - - - 1,128
December 31, 2015 - - 1,010 - - - 1,010
There are no bitumen reserves for equity affiliates.
There are no minority interests for bitumen reserves.
42 TOTAL Factbook 2015 – Upstream

CHANGES IN GAS RESERVES
(in billion cubic feet) Consolidated subsidiaries
Proved developed and undeveloped reserves Europe Africa Americas Middle East Asia-CIS Russia Total (excl. Russia)
Balance as of December 31, 2010 4,962 5,314 3,806 1,867 3,176 18 19,143
Revisions of previous estimates 358 (216) 367 (180) - 1 330Extensions, discoveries and other 211 - - - 2,824 - 3,035Acquisitions of reserves in place 11 - 7 - 13 - 31Sales of reserves in place - (46) - - - - (46)Production for the year (528) (259) (317) (169) (444) (1) (1,718)
Balance as of December 31, 2011 5,014 4,793 3,863 1,518 5,569 18 20,775
Revisions of previous estimates 268 31 (278) (132) 15 - (96)Extensions, discoveries and other 216 127 478 6 195 - 1,022Acquisitions of reserves in place 138 - - - - - 138Sales of reserves in place (30) (173) (35) - - - (238)Production for the year (462) (257) (337) (75) (432) (1) (1,564)
Balance as of December 31, 2012 5,144 4,521 3,691 1,317 5,347 17 20,037
Revisions of previous estimates (6) (887) 199 29 (186) - (851)Extensions, discoveries and other 27 12 336 - 1,074 - 1,449Acquisitions of reserves in place 1 - - - 506 - 507Sales of reserves in place (13) - (243) - - - (256)Production for the year (450) (248) (320) (68) (457) (1) (1,544)
Balance as of December 31, 2013 4,703 3,398 3,663 1,278 6,284 16 19,342
Revisions of previous estimates 129 86 54 7 69 - 345Extensions, discoveries and other 99 56 296 1 154 - 606Acquisitions of reserves in place 6 - - - - - 6Sales of reserves in place (97) (6) - - (941) - (1,044)Production for the year (398) (250) (320) (68) (451) (1) (1,488)
Balance as of December 31, 2014 4,442 3,284 3,693 1,218 5,115 15 17,767
Revisions of previous estimates 46 (33) (92) 174 304 1 400Extensions, discoveries and other 40 7 24 42 38 - 151Acquisitions of reserves in place - - - - - - -Sales of reserves in place (135) (93) - - - - (228)Production for the year (424) (247) (324) (75) (471) (1) (1,542)
Balance as of December 31, 2015 3,969 2,918 3,301 1,359 4,986 15 16,548
Minority interest in proved developed and undeveloped reserves as of
December 31, 2011 - 62 - - - - 62December 31, 2012 - 57 - - - - 57December 31, 2013 - 87 - - - - 87December 31, 2014 - 91 - - - - 91
December 31, 2015 - 64 - - - - 64
43– TOTAL Factbook 2015Upstream

CHANGES IN GAS RESERVES
(in billion cubic feet) Equity affiliates
Proved developed Europe Africa Americas Middle East Asia-CIS Russia Totaland undeveloped reserves (excl. Russia)
Balance as of December 31, 2010 - 390 91 6,164 - - 6,645
Revisions of previous estimates - (16) (10) (31) - - (57)Extensions, discoveries and other - - - - - - -Acquisitions of reserves in place - - - - - 3,865 3,865Sales of reserves in place - (10) - - - - (10)Production for the year - (1) (2) (331) - (167) (501)
Balance as of December 31, 2011 - 363 79 5,802 - 3,698 9,942
Revisions of previous estimates - (21) 5 (4) - 366 346Extensions, discoveries and other - - - - - 578 578Acquisitions of reserves in place - - - - - 568 568Sales of reserves in place - - - - - - -Production for the year - (1) (2) (287) - (304) (594)
Balance as of December 31, 2012 - 341 82 5,511 - 4,906 10,840
Revisions of previous estimates - 8 (18) 16 - 191 197Extensions, discoveries and other - - - 77 - 3,209 3,286Acquisitions of reserves in place - - - - - 553 553Sales of reserves in place - - - - - (485) (485)Production for the year - (6) (2) (354) - (345) (707)
Balance as of December 31, 2013 - 343 62 5.250 - 8,029 13,684
Revisions of previous estimates - 17 2 (25) - 50 44Extensions, discoveries and other - - - - - 2,328 2,328Acquisitions of reserves in place - - - - - 521 521Sales of reserves in place - - - - - (28) (28)Production for the year - (4) (2) (328) - (392) (726)
Balance as of December 31, 2014 - 356 62 4,897 - 10,508 15,823
Revisions of previous estimates - (45) (11) 6 - 337 287Extensions, discoveries and other - - - - - - -Acquisitions of reserves in place - - - - - 267 267Sales of reserves in place - - - - - (52) (52)Production for the year - - (3) (208) - (456) (667)
Balance as of December 31, 2015 - 311 48 4,695 - 10,604 15,658
44 TOTAL Factbook 2015 – Upstream

(in billion cubic feet) Consolidated subsidiaries and equity affiliates
Europe Africa Americas Middle East Asia-CIS Russia Total (excl. Russia)
As of December 31, 2011
Proved developed and undeveloped reserves 5,014 5,156 3,942 7,320 5,569 3,716 30,717
Consolidated subsidiaries 5,014 4,793 3,863 1,518 5,569 18 20,775Equity affiliates - 363 79 5,802 - 3,698 9,942
Proved developed reserves 2,943 2,308 2,600 7,170 1,582 3,272 19,875
Consolidated subsidiaries 2,943 2,216 2,567 1,450 1,582 12 10,770Equity affiliates - 92 33 5,720 - 3,260 9,105
Proved undeveloped reserves 2,071 2,848 1,342 150 3,987 444 10,842
Consolidated subsidiaries 2,071 2,577 1,296 68 3,987 6 10,005Equity affiliates - 271 46 82 - 438 837
As of December 31, 2012
Proved developed and undeveloped reserves 5,144 4,862 3,773 6,828 5,347 4,923 30,877
Consolidated subsidiaries 5,144 4,521 3,691 1,317 5,347 17 20,037Equity affiliates - 341 82 5,511 - 4,906 10,840
Proved developed reserves 2,927 2.192 2,356 6,656 1,513 3,602 19,246
Consolidated subsidiaries 2,927 2,110 2,316 1,240 1,513 13 10,119Equity affiliates - 82 40 5,416 - 3,589 9,127
Proved undeveloped reserves 2,217 2,670 1,417 172 3,834 1,321 11,631
Consolidated subsidiaries 2,217 2,411 1,375 77 3,834 4 9,918Equity affiliates - 259 42 95 - 1,317 1,713
45– TOTAL Factbook 2015Upstream

CHANGES IN GAS RESERVES
(in billion cubic feet) Consolidated subsidiaries and equity affiliates
Europe Africa Americas Middle East Asia-CIS Russia Total (excl. Russia)
As of December 31, 2013
Proved developed and undeveloped reserves 4,703 3,741 3,725 6,528 6,284 8,045 33,026
Consolidated subsidiaries 4,703 3,398 3,663 1,278 6,284 16 19,342Equity affiliates - 343 62 5,250 - 8,029 13,684
Proved developed reserves 2,687 2,009 2,240 6,366 1,821 3,693 18,816
Consolidated subsidiaries 2,687 1,937 2,210 1,210 1,821 13 9,878Equity affiliates - 72 30 5,156 - 3,680 8,938
Proved undeveloped reserves 2,016 1,732 1,485 162 4,463 4,352 14,210
Consolidated subsidiaries 2,016 1,461 1,453 68 4,463 3 9,464Equity affiliates - 271 32 94 - 4,349 4,746
As of December 31, 2014
Proved developed and undeveloped reserves 4,442 3,640 3,755 6,115 5,115 10,523 33,590
Consolidated subsidiaries 4,442 3,284 3,693 1,218 5,115 15 17,767Equity affiliates - 356 62 4,897 - 10,508 15,823
Proved developed reserves 2,578 2,019 2,167 5,866 1,444 4,959 19,033
Consolidated subsidiaries 2,578 1,952 2,145 1,144 1,444 9 9,272Equity affiliates - 67 22 4,722 - 4,950 9,761
Proved undeveloped reserves 1,864 1,621 1,588 249 3,671 5,564 14,557
Consolidated subsidiaries 1,864 1,332 1,548 74 3,671 6 8,495Equity affiliates - 289 40 175 - 5,558 6,062
As of December 31, 2015
Proved developed and undeveloped reserves 3,969 3,229 3,349 6,054 4,986 10,619 32,206
Consolidated subsidiaries 3,969 2,918 3,301 1,359 4,986 15 16,548Equity affiliates - 311 48 4,695 - 10,604 15,658
Proved developed reserves 2,682 1,726 2,153 5,442 1,717 4,890 18,610
Consolidated subsidiaries 2,682 1,680 2,133 1,207 1,717 6 9,425Equity affiliates - 46 20 4,235 - 4,884 9,185
Proved undeveloped reserves 1,287 1,503 1,196 612 3,269 5,729 13,596
Consolidated subsidiaries 1,287 1,238 1,168 152 3,269 9 7,123Equity affiliates - 265 28 460 - 5,720 6,473
46 TOTAL Factbook 2015 – Upstream

RESULTS OF OPERATIONS FOR OIL AND GAS PRODUCING ACTIVITIES
The following tables do not include revenues and expenses related to oil and gas transportation activities and LNG liquefaction andtransportation.
(in million dollars) Consolidated subsidiaries
Europe Africa Americas Middle East Asia-CIS Russia Total (excl. Russia)
2011
Revenues Non-Group sales 4,337 4,438 1,080 1,613 4,456 - 15,924Revenues Group sales 9,823 15,819 1,063 1,026 681 310 28,722
Total Revenues 14,160 20,257 2,143 2,639 5,137 310 44,646
Production costs (1,720) (1,641) (347) (398) (388) (35) (4,529)Exploration expenses (477) (449) (67) (15) (407) (3) (1,418)Depreciation, depletion and amortization and valuation allowances (1,858) (2,568) (490) (387) (1,039) (62) (6,404)Other expenses (1) (428) (1,644) (382) (384) (103) (29) (2,970)
Pre-tax income from producing activities 9,677 13,955 857 1,455 3,200 181 29,325
Income tax (7,042) (9,027) (407) (647) (1,720) (92) (18,935)
Results of oil and gas producing activities 2,635 4,928 450 808 1,480 89 10,390
2012
Revenues Non-Group sales 2,552 5,638 1,244 929 4,508 - 14,871Revenues Group sales 8,809 17,268 820 1,298 750 265 29,210
Total Revenues 11,361 22,906 2,064 2,227 5,258 265 44,081
Production costs (1,693) (1,853) (381) (437) (469) (39) (4,872)Exploration expenses (620) (469) (436) (23) (306) (3) (1,857)Depreciation, depletion and amortization and valuation allowances (2,551) (3,308) (2,002) (588) (1,130) (75) (9,654)Other expenses (1) (419) (1,742) (496) (204) (133) (31) (3,025)
Pre-tax income from producing activities 6,078 15,534 (1,251) 975 3,220 117 24,673
Income tax (4,469) (9,485) 291 (496) (1,572) (53) (15,784)
Results of oil and gas producing activities 1,609 6,049 (960) 479 1,648 64 8,889
2013
Revenues Non-Group sales 2,170 4,575 1,331 1,079 4,626 - 13,781Revenues Group sales 7,749 16,072 808 901 742 268 26,540
Total Revenues 9,919 20,647 2,139 1,980 5,368 268 40,321
Production costs (1,762) (1,974) (415) (498) (546) (39) (5,234)Exploration expenses (483) (583) (539) (165) (395) (4) (2,169)Depreciation, depletion and amortization and valuation allowances (1,817) (3,433) (1,214) (725) (1,607) (85) (8,881)Other expenses (1) (493) (1,578) (434) (106) (149) (33) (2,793)
Pre-tax income from producing activities 5,364 13,079 (463) 486 2,671 107 21,244
Income tax (3,621) (8,281) 56 (419) (1,362) (46) (13,673)
Results of oil and gas producing activities 1,743 4,798 (407) 67 1,309 61 7,571
(1) Included production taxes and accretion expense as provided for by IAS 37 ($470 million in 2011, $502 million in 2012, $566 million in 2013).
47– TOTAL Factbook 2015Upstream

RESULTS OF OPERATIONS FOR OIL AND GAS PRODUCING ACTIVITIES
(in million dollars) Consolidated subsidiaries
Europe Africa Americas Middle East Asia-CIS Russia Total (excl. Russia)
2014
Revenues Non-Group sales 2,073 3,561 1,195 804 4,423 - 12,056Revenues Group sales 5,966 13,386 971 972 742 236 22,273
Total Revenues 8,039 16,947 2,166 1,776 5,165 236 34,329
Production costs (1,729) (2,221) (466) (503) (738) (44) (5,701)Exploration expenses (617) (631) (183) (144) (381) (9) (1,965)Depreciation, depletion and amortization and valuation allowances (1,988) (4,750) (5,717) (545) (2,058) (97) (15,155)Other expenses (1) (419) (1,375) (402) (114) (167) (29) (2,506)
Pre-tax income from producing activities 3,286 7,970 (4,602) 470 1,821 57 9,002
Income tax (1,683) (6,066) 882 (334) (1,159) (32) (8,392)
Results of oil and gas producing activities 1,603 1,904 (3,720) 136 662 25 610
2015
Revenues Non-Group sales 1,343 1,191 970 2,138 3,015 - 8,657Revenues Group sales 3,821 7,959 271 1,715 351 129 14,246
Total Revenues 5,164 9,150 1,241 3,853 3,366 129 22,903
Production costs (1,485) (1,847) (497) (591) (492) (34) (4,946)Exploration expenses (572) (694) (114) (147) (461) (3) (1,991)Depreciation, depletion and amortization and valuation allowances (2,335) (6,941) (1,548) (558) (3,563) (203) (15,148)Other expenses (1) (350) (841) (280) (2,637) (121) (16) (4,245)
Pre-tax income from producing activities 422 (1,173) (1,198) (80) (1,271) (127) (3,427)
Income tax 443 (242) 210 (101) (158) (4) 148
Results of oil and gas producing activities 865 (1,415) (988) (181) (1,429) (131) (3,279)
(1) Included production taxes and accretion expense as provided for by IAS 37 ($526 million in 2014 and $497 million in 2015).
(in million dollars) Equity affiliates
Group’s share of results Europe Africa Americas Middle East Asia-CIS Russia Totalof oil and gas producing activities (excl. Russia)
2011 - 17 152 1,424 - 61 1,6542012 - - 299 1,438 - 44 1,7812013 - - 105 1,867 - 223 2,1952014 - (21) (69) 1,838 - 410 2,158
2015
Revenues Non-Group sales - - 380 812 - 670 1,862Revenues Group sales - - 10 2,404 - - 2,414
Total Revenues - - 390 3,216 - 670 4,276
Production costs - - (54) (295) - (127) (476)Exploration expenses - - - - - (1) (1)Depreciation, depletion and amortization and valuation allowances - - (98) (400) - (58) (556)Other expenses - - (170) (1,638) - (134) (1,942)
Pre-tax income from producing activities - - 68 883 - 350 1,301
Income tax - - (36) (184) - (65) (285)
Results of oil and gas producing activities - - 32 699 - 285 1,016
48 TOTAL Factbook 2015 – Upstream

COST INCURRED
The following tables set forth the costs incurred in the Group’s oil and gas property acquisition, exploration and development activities,including both capitalized and expensed amounts. They do not include costs incurred related to oil and gas transportation and LNGliquefaction and transportation activities.
(in million dollars) Consolidated subsidiaries
Europe Africa Americas Middle East Asia-CIS Russia Total (excl. Russia) (2)
2011
Proved property acquisition 415 13 574 3 350 - 1,355Unproved property acquisition 1 553 2,355 4 20 - 2,933Exploration costs 703 535 354 24 578 3 2,197Development costs (1) 3,274 5,422 1,828 457 3,643 131 14,755
Total cost incurred 4,393 6,523 5,111 488 4,591 134 21,240
2012
Proved property acquisition 259 35 - - 16 - 310Unproved property acquisition 52 1,749 494 226 33 - 2,554Exploration costs 768 742 734 45 434 3 2,726Development costs (1) 4,090 5,563 2,351 394 3,337 107 15,842
Total cost incurred 5,169 8,089 3,579 665 3,820 110 21,432
2013
Proved property acquisition - 175 - 3 487 - 665Unproved property acquisition 17 512 2,105 85 85 - 2,804Exploration costs 679 889 585 231 538 4 2,926Development costs (1) 5,239 8,545 3,191 464 4,395 147 21,981
Total cost incurred 5,935 10,121 5,881 783 5,505 151 28,376
2014
Proved property acquisition 57 17 - (1) 32 - 105Unproved property acquisition 17 69 544 7 66 - 703Exploration costs 466 1,057 375 228 485 9 2,620Development costs (1) 4,495 8,126 3,468 478 3,680 116 20,363
Total cost incurred 5,035 9,269 4,387 712 4,263 125 23,791
2015
Proved property acquisition 37 59 - 1,039 30 - 1,165Unproved property acquisition - 29 199 1,202 4 4 1,438Exploration costs 563 321 515 229 316 3 1,947Development costs (1) 3,987 7,686 3,143 496 3,129 97 18,538
Total cost incurred 4,587 8,095 3,857 2,966 3,479 104 23,088
(in million dollars) Equity affiliates
Group’s share of costs of property acquisition Europe Africa Americas Middle East Asia-CIS Russia Totalexploration and development (excl.Russia)
2011 - 3 150 438 - 6,606 7,1972012 - - 214 488 - 537 1,2392013 - - 170 458 - 734 1,3622014 - - 195 500 - 970 1,665
2015
Proved property acquisition - - - - - 218 218Unproved property acquisition - - - - - 14 14Exploration costs - - - 8 - - 8Development costs (1) - - 83 398 - 405 886
Total cost incurred - - 83 406 - 637 1,126
(1) Including asset retirement costs capitalized during the year and any gains or losses recognized upon settlement of asset retirement obligation during the year.(2) Revision of historical costs out of ASC932 perimeter.
49– TOTAL Factbook 2015Upstream

CAPITALIZED COST RELATED TO OIL AND GAS PRODUCING ACTIVITIES
Capitalized costs represent the amount of capitalized proved and unproved property costs, including support equipment and facilities, alongwith the related accumulated depreciation, depletion and amortization. The following tables do not include capitalized costs related to oil andgas transportation and LNG liquefaction and transportation activities.
(in million dollars) Consolidated subsidiaries
Europe Africa Americas Middle East Asia-CIS Russia Total (excl. Russia) (1)
As of December 31, 2011
Proved properties 44,391 47,916 11,402 8,060 20,359 696 132,824Unproved properties 596 2,539 5,407 79 1,179 - 9,800
Total capitalized costs 44,987 50,455 16,809 8,139 21,538 696 142,624
Accumulated depreciation, depletion and amortization (31,115) (24,121) (2,968) (5,530) (6,316) (239) (70,289)
Net capitalized costs 13,872 26,334 13,841 2,609 15,222 457 72,335
As of December 31, 2012
Proved properties 46,781 53,517 13,336 8,455 23,336 803 146,228Unproved properties 717 4,200 5,706 327 808 - 11,758
Total capitalized costs 47,498 57,717 19,042 8,782 24,144 803 157,986
Accumulated depreciation, depletion and amortization (31,217) (26,868) (4,247) (6,133) (7,433) (314) (76,212)
Net capitalized costs 16,281 30,849 14,795 2,649 16,711 489 81,774
As of December 31, 2013
Proved properties 50,313 61,728 15,002 8,941 28,047 950 164,981Unproved properties 888 5,049 7,881 481 1,123 - 15,422
Total capitalized costs 51,201 66,777 22,883 9,422 29,170 950 180,403
Accumulated depreciation, depletion and amortization (32,208) (30,278) (5,259) (6,842) (9,040) (399) (84,026)
Net capitalized costs 18,993 36,499 17,624 2,580 20,130 551 96,377
As of December 31, 2014
Proved properties 46,444 69,277 17,774 8,115 30,622 1,066 173,298Unproved properties 628 5,045 8,309 566 1,730 - 16,278
Total capitalized costs 47,072 74,322 26,083 8,681 32,352 1,066 189,576
Accumulated depreciation, depletion and amortization (28,748) (34,438) (10,657) (6,304) (11,005) (496) (91,648)
Net capitalized costs 18,324 39,884 15,426 2,377 21,347 570 97,928
As of December 31, 2015
Proved properties 44,104 77,032 19,630 9,626 33,832 1,163 185,387Unproved properties 524 4,573 8,915 1,847 1,491 4 17,354
Total capitalized costs 44,628 81,605 28,545 11,473 35,323 1,167 202,741
Accumulated depreciation, depletion and amortization (28,064) (41,737) (11,488) (6,805) (13,924) (699) (102,717)
Net capitalized costs 16,564 39,868 17,057 4,668 21,399 468 100,024
(1) Revision of historical costs out of ASC932 perimeter.
50 TOTAL Factbook 2015 – Upstream

(in million dollars) Equity affiliates
Group's share of net capitalized costs Europe Africa Americas Middle East Asia-CIS Russia Total (excl. Russia)
As of December 31, 2011 - - 821 1,500 - 6,349 8,670As of December 31, 2012 - - 1,150 1,447 - 6,247 8,844As of December 31, 2013 - - 1,007 1,418 - 7,096 9,521As of December 31, 2014 - - 1,101 1,152 - 4,607 6,860
As of December 31, 2015
Proved properties - - 1,500 4,323 - 4,573 10,396Unproved properties - - - - - 202 202Total capitalized costs - - 1,500 4,323 - 4,775 10,598Accumulated depreciation, depletion and amortization - - (403) (3,192) - (655) (4,250)
Net capitalized costs - - 1,097 1,131 - 4,120 6,348
51– TOTAL Factbook 2015Upstream

(in million dollars) Consolidated subsidiaries
Europe Africa Americas Middle East Asia-CIS Russia Total (excl. Russia)
As of December 31, 2011
Future cash inflows 120,398 234,532 75,078 20,035 93,292 1,810 545,145Future production costs (26,326) (44,478) (31,828) (5,552) (16,942) (779) (125,905)Future development costs (30,312) (31,917) (16,182) (4,358) (15,130) (344) (98,243)Future income taxes (39,341) (99,561) (6,110) (3,915) (17,905) (261) (167,093)
Future net cash flows, after income taxes 24,419 58,576 20,958 6,210 43,315 426 153,904
Discount at 10% (13,209) (24,928) (17,233) (3,064) (28,857) (173) (87,464)
Standardized measure of discounted future net cash flows 11,210 33,648 3,725 3,146 14,458 253 66,440
As of December 31, 2012
Future cash inflows 120,136 228,622 74,932 21,231 88,907 2,578 536,406Future production costs (26,210) (50,380) (33,282) (6,719) (17,980) (1,633) (136,204)Future development costs (31,563) (37,242) (16,689) (4,906) (13,504) (613) (104,517)Future income taxes (35,305) (87,660) (5,743) (3,521) (16,054) (237) (148,520)
Future net cash flows, after income taxes 27,058 53,340 19,218 6,085 41,369 95 147,165
Discount at 10% (13,596) (22,851) (14,960) (2,870) (25,743) 7 (80,013)
Standardized measure of discounted future net cash flows 13,462 30,489 4,258 3,215 15,626 102 67,152
As of December 31, 2013
Future cash inflows 106,968 205,741 78,813 19,413 93,404 2,332 506,671Future production costs (24,973) (50,531) (36,172) (6,950) (18,548) (1,456) (138,630)Future development costs (30,534) (34,364) (18,844) (4,282) (16,570) (526) (105,120)Future income taxes (27,307) (73,232) (5,190) (3,030) (14,946) (219) (123,924)
Future net cash flows, after income taxes 24,154 47,614 18,607 5,151 43,340 131 138,997
Discount at 10% (10,813) (19,397) (15,304) (2,490) (27,670) (49) (75,723)
Standardized measure of discounted future net cash flows 13,341 28,217 3,303 2,661 15,670 82 63,274
52 TOTAL Factbook 2015 – Upstream
The standardized measure of discounted future net cash flows relatingto proved oil and gas reserve quantities was developed as follows:
1. Estimates of proved reserves and the corresponding productionprofiles are based on current technical and economic conditions;
2. The estimated future cash flows are determined based on pricesused in estimating the Group’s proved oil and gas reserves;
3. The future cash flows incorporate estimated production costs(including production taxes), future development costs andasset retirement costs. All cost estimates are based on year-endtechnical and economic conditions;
4. Future income taxes are computed by applying the year-endstatutory tax rate to future net cash flows after considerationof permanent differences and future income tax credits; and
5. Future net cash flows are discounted at a standard discountrate of 10 percent.
These principles applied are those required by ASC 932 and donot reflect the expectations of real revenues from these reserves,nor their present value; hence, they do not constitute criteria forinvestment decisions.
An estimate of the fair value of reserves should also take intoaccount, among other things, the recovery of reserves not presentlyclassified as proved, anticipated future changes in prices and costsand a discount factor more representative of the time value ofmoney and the risks inherent in reserve estimates.
STANDARDIZED MEASURE OF DISCOUNTED FUTURE NET CASH FLOWS (EXCLUDING TRANSPORTATION)

(in million dollars) Consolidated subsidiaries
Europe Africa Americas Middle East Asia-CIS Russia Total (excl. Russia)
As of December 31, 2014
Future cash inflows 87,950 184,975 87,965 17,214 86,184 2,294 466,582Future production costs (23,722) (49,796) (38,776) (6,240) (16,700) (1,255) (136,489)Future development costs (28,529) (35,683) (16,728) (3,534) (12,177) (780) (97,431)Future income taxes (15,363) (59,063) (5,891) (2,881) (13,475) (172) (96,845)
Future net cash flows, after income taxes 20,336 40,433 26,570 4,559 43,832 87 135,817
Discount at 10% (7,928) (16,026) (19,489) (2,173) (29,422) (5) (75,043)
Standardized measure of discounted future net cash flows 12,408 24,407 7,081 2,386 14,410 82 60,774
As of December 31, 2015
Future cash inflows 46,490 76,719 40,866 55,819 49,825 1,045 270,764Future production costs (14,787) (28,159) (24,103) (45,806) (13,831) (512) (127,198)Future development costs (17,956) (25,035) (11,104) (4,907) (8,751) (495) (68,248)Future income taxes (6,720) (12,479) (1,105) (1,409) (3,843) (28) (25,584)
Future net cash flows, after income taxes 7,027 11,046 4,554 3,697 23,400 10 49,734
Discount at 10% (887) (3,550) (4,014) (2,095) (15,195) 18 (25,723)
Standardized measure of discounted future net cash flows 6,140 7,496 540 1,602 8,205 28 24,011
Minority interests in future net cash flows as of
December 31, 2011 - 782 - - - - 782December 31, 2012 - 646 - - - - 646December 31, 2013 - 808 - - - - 808December 31, 2014 - 1,103 - - - - 1,103
December 31, 2015 - 448 - - - - 448
(in million dollars) Equity affiliates
Group’s share of equity affiliates’ Europe Africa Americas Middle East Asia-CIS Russia Totalfuture net cash flows as of (excl. Russia)
December 31, 2011 - 70 2,595 12,148 - 924 15,737December 31, 2012 - 676 1,930 12,491 - 794 15,891December 31, 2013 - 215 1,304 12,834 - 1,066 15,419December 31, 2014 - 361 1,728 11,591 - 5,413 19,093
December 31, 2015
Future cash inflows - 52 7,736 36,231 - 21,779 65,798Future production costs - - (2,884) (16,814) - (7,973) (27,671)Future development costs - (28) (547) (2,638) - (1,146) (4,359)Future income taxes - (29) (918) (2,818) - (3,540) (7,305)
Future net cash flows, after income taxes - (5) 3,387 13,961 - 9,120 26,463
Discount at 10% - (98) (1,759) (7,009) - (8,116) (16,982)
Standardized measure of discounted future net cash flows - (103) 1,628 6,952 - 1,004 9,481
53– TOTAL Factbook 2015Upstream

CHANGES IN THE STANDARDIZED MEASURE OF DISCOUNTEDFUTURE NET CASH FLOWS
Consolidated subsidiaries(in million dollars) 2015 2014 2013 2012 2011
Beginning of year 60,774 63,274 67,152 66,440 47,955
Sales and transfers, net of production costs (14,209) (26,647) (32,860) (36,685) (37,617)Net change in sales and transfer prices and in production costs and other expenses (88,615) (16,703) (8,007) 3,532 64,638Extensions, discoveries and improved recovery 933 1,912 1,106 1,749 2,354Changes in estimated future development costs 4,412 (5,407) (10,803) (8,381) (6,724)Previously estimated development costs incurred during the year 19,694 21,484 18,218 15,220 13,338Revisions of previous quantity estimates (4,800) (1,505) 1,511 3,504 1,805Accretion of discount 6,077 6,327 6,715 6,644 4,795Net change in income taxes 42,252 20,116 20,178 18,034 (23,717)Purchases of reserves in place - 26 1,459 385 1,240Sales of reserves in place (2,507) (2,103) (1,395) (3,290) (1,627)
End of year 24,011 60,774 63,274 67,152 66,440
Equity affiliates(in million dollars) 2015 2014 2013 2012 2011
Beginning of year 19,093 15,419 15,891 15,737 12,289
Sales and transfers, net of production costs (1,860) (3,639) (3,723) (3,074) (2,772)Net change in sales and transfer prices and in production costs and other expenses (14,821) (1,546) (1,056) (1,702) 5,901Extensions, discoveries and improved recovery - 4,444 4,980 (32) -Changes in estimated future development costs 1,572 190 540 (638) (536)Previously estimated development costs incurred during the year 1,272 1,330 1,101 1,042 890Revisions of previous quantity estimates 315 19 (5,020) 1,268 (1,050)Accretion of discount 1,909 1,542 1,589 1,574 1,229Net change in income taxes 1,881 834 1,107 1,693 (1,879)Purchases of reserves in place 186 543 520 23 2,539Sales of reserves in place (66) (43) (510) - (874)
End of year 9,481 19,093 15,419 15,891 15,737
54 TOTAL Factbook 2015 – Upstream

OIL AND GAS ACREAGE
As of December 31, 2015 2014 2013(in thousands of acres)
Undeveloped Developed Undeveloped Developed Undeveloped Developed acreage(1) acreage acreage(1) acreage acreage(1) acreage
Europe Gross 9,585 703 10,601 692 10,804 722 Net 4,518 149 5,197 143 5,305 163
Africa Gross 93,306 1,313 122,385 1,306 134,157 1,266 Net 53,154 346 79,562 350 86,493 341
Americas Gross 23,881 984 25,081 962 19,790 960 Net 9,186 304 11,375 299 9,391 286
Middle East Gross 28,032 2,189 34,375 1,215 33,242 1,482 Net 3,241 227 9,908 129 4,534 192
Asia-CIS (incl. Russia) Gross 56,255 1,254 53,495 2,075 55,980 1,064 Net 29,078 356 28,264 468 29,880 309
Gross 211,059 6,443 245,937 6,250 253,973 5,494Total
Net (2) 99,177 1,382 134,306 1,389 135,603 1,291
As of December 31, 2012 2011(in thousands of acres)
Undeveloped Developed Undeveloped Developed acreage(1) acreage acreage(1) acreage
Europe Gross 10,015 724 6,478 781 Net 6,882 176 3,497 185
Africa Gross 135,610 1,256 110,346 1,229 Net 88,457 337 65,391 333
Americas Gross 16,604 1,705 15,454 1,028 Net 6,800 330 5,349 329
Middle East Gross 32,369 1,896 31,671 1,461 Net 3,082 256 2,707 217
Asia-CIS (incl. Russia) Gross 37,208 955 40,552 930 Net 18,184 270 19,591 255
Gross 231,806 6,536 204,501 5,429Total
Net (2) 123,405 1,369 96,535 1,319
(1) Undeveloped acreage includes leases and concessions.(2) Net acreage equals the sum of the Group’s equity stakes in gross acreage.
55– TOTAL Factbook 2015Upstream

NUMBER OF PRODUCTIVE WELLS
As of December 31, 2015 2014 2013(number of wells)
Gross Net Gross Net Gross Net productive productive productive productive productive productive wells wells(1) wells wells(1) wells wells(1)
Europe Oil 386 105 370 101 403 106 Gas 283 88 279 82 286 87
Africa Oil 2,532 624 2,297 619 2,269 615 Gas 177 49 158 49 156 48
Americas Oil 1,092 349 961 295 868 266 Gas 3,903 795 3,817 782 3,311 634
Middle East Oil 7,625 510 5,540 355 6,283 441 Gas 80 16 107 20 295 36
Asia-CIS (incl. Russia) Oil 347 99 277 88 229 81 Gas 2,885 895 2,473 799 2,306 741
Oil 11,982 1,687 9,445 1,458 10,052 1,509Total
Gas 7,328 1,843 6,834 1,732 6,354 1,546
As of December 31, 2012 2011(number of wells)
Gross Net Gross Net productive productive productive productive wells wells(1) wells wells(1)
Europe Oil 410 111 576 151 Gas 330 117 358 125
Africa Oil 2,216 593 2,275 576 Gas 156 48 157 44
Americas Oil 898 258 877 247 Gas 2,892 546 2,707 526
Middle East Oil 6,488 462 7,829 721 Gas 371 49 372 49
Asia-CIS (incl. Russia) Oil 206 75 209 75 Gas 1,912 578 1,589 498
Oil 10,218 1,499 11,766 1,770Total
Gas 5,661 1,338 5,183 1,242
(1) Net wells equal the sum of the Group’s equity stakes in gross wells.
56 TOTAL Factbook 2015 – Upstream

NUMBER OF NET PRODUCTIVE AND DRY WELLS DRILLED
As of December 31, 2015 2014 2013(number of wells)
Net Net dry Net total Net Net dry Net total Net Net dry Net total productive wells wells productive wells wells productive wells wells wells drilled(1)(3) drilled(1)(3) wells drilled(1)(3) drilled(1)(3) wells drilled(1)(3) drilled(1)(3)
drilled(1)(2) drilled(1)(2) drilled(1)(2)
Exploratory Europe 1.0 3.6 4.6 1.4 0.2 1.6 1.5 0.2 1.7Africa 0.2 2.1 2.3 2.0 3.3 5.3 1.5 5.1 6.6Americas 1.4 0.6 2.0 2.1 0.3 2.4 2.9 1.4 4.3Middle East 0.3 0.5 0.8 0.3 0.3 0.6 0.6 0.7 1.3Asia-CIS (incl. Russia) 2.0 1.9 3.9 1.2 1.4 2.6 1.6 4.3 5.9
Subtotal 4.9 8.7 13.6 7.0 5.5 12.5 8.1 11.7 19.8
Development Europe 14.0 0.4 14.4 8.8 - 8.8 6.9 0.3 7.2Africa 21.4 - 21.4 24.6 1.0 25.6 19.7 0.4 20.1Americas 60.6 0.1 60.7 128.1 0.2 128.3 98.0 - 98.0Middle East 36.6 0.6 37.2 36.1 0.2 36.3 42.7 0.3 43.0Asia-CIS (incl. Russia) 111.5 - 111.5 135.0 1.3 136.3 198.0 - 198.0
Subtotal 244.1 1.1 245.2 332.6 2.7 335.3 365.3 1.0 366.3
Total 249.0 9.8 258.8 339.6 8.2 347.8 373.4 12.7 386.1
As of December 31, 2012 2011(number of wells)
Net Net dry Net total Net Net dry Net total productive wells wells productive wells wells wells drilled(1)(3) drilled(1)(3) wells drilled(1)(3) drilled(1)(3)
drilled(1)(2) drilled(1)(2)
ExploratoryEurope 0.9 3.3 4.2 1.5 1.7 3.2Africa 4.9 2.8 7.7 2.9 1.5 4.4Americas 3.9 0.6 4.5 1.2 1.3 2.5Middle East - - - 1.2 0.8 2.0Asia-CIS (incl. Russia) 2.4 1.4 3.8 2.1 3.7 5.8
Subtotal 12.1 8.1 20.2 8.9 9.0 17.9
DevelopmentEurope 6.0 0.7 6.7 7.5 - 7.5Africa 22.7 - 22.7 24.7 - 24.7Americas 70.6 - 70.6 113.1 - 113.1Middle East 43.3 - 43.3 32.6 2.6 35.2Asia-CIS (incl. Russia) 127.8 - 127.8 118.4 - 118.4
Subtotal 270.4 0.7 271.1 296.3 2.6 298.9
Total 282.5 8.8 291.3 305.2 11.6 316.8
(1) Net wells equal the sum of the Company’s fractional interest in gross wells.(2) Includes certain exploratory wells that were abandoned but which would have been capable of producing oil in sufficient quantities to justify completion.(3) For information: service wells and stratigraphic wells drilled within oil sands operations in Canada are not reported in this table (34.8 wells in 2015, 90.0 wells in 2014, 86.2 wells
in 2013,131.7 in 2012 and 82.2 in 2011).
57– TOTAL Factbook 2015Upstream

WELLS IN THE PROCESS OF BEING DRILLED (INCLUDING WELLS TEMPORARILY SUSPENDED)
As of December 31, 2015 2014 2013(number of wells)
Gross Net(1) Gross Net(1) Gross Net(1)
Exploratory Europe 5 1.6 6 2.1 2 1.5Africa 25 7.3 32 9.6 31 9.8Americas 14 4.6 12 4.0 15 6.7Middle East 8 2.5 13 4.2 10 3.6Asia-CIS (incl. Russia) 11 3.4 12 3.4 15 5.7
Subtotal 63 19.4 75 23.3 73 27.3
Other wells (2) Europe 38 13.6 36 13.9 35 13.4Africa 56 14.9 47 12.6 27 7.7Americas 63 22.4 370 159.3 348 120.7Middle East 158 20.5 128 14.0 129 15.8Asia-CIS (incl. Russia) 755 209.1 1,000 238.9 821 246.1
Subtotal 1,070 280.5 1,581 438.7 1,360 403.7
Total 1,133 299.9 1,656 462.0 1,433 431.0
As of December 31, 2012 2011(number of wells)
Gross Net(1) Gross Net(1)
Exploratory Europe 1 1.0 2 2.0Africa 4 1.3 2 0.8Americas 7 3.4 3 1.0Middle East 2 1.1 - -Asia-CIS (incl. Russia) 2 1.3 1 0.6
Subtotal 16 8.1 8 4.4
Other wells (2) Europe 23 6.2 21 4.5Africa 25 6.4 31 11.3Americas 29 8.2 22 5.7Middle East 93 6.1 26 3.5Asia-CIS (incl. Russia) 171 49.2 11 5.1
Subtotal 341 76.1 111 30.1
Total 357 84.2 119 34.5
(1) Net wells equal the sum of the Group’s equity stakes in gross wells. From 2013, includes wells for which surface facilities permitting production have not yet been constructed. Such wells are also reported in the table “Number of net productive and dry wells drilled”, for the year in which they were drilled.
(2) Other wells are development wells, service wells, stratigraphic wells and extension wells.
58 TOTAL Factbook 2015 – Upstream

LNG POSITIONS AS OF DECEMBER 31, 2015
(1) TOTAL has an indirect stake via Oman LNG’s stake in Qalhat LNG.(2) The State of Papua New Guinea retains the right to enter the license (when the final investment decision is made) at a maximum level of 22.5%. In this case, TOTAL’s stake would be
reduced to 31.1%.(3) Direct stake in the project.
LIQUEFIED NATURAL GAS (LNG) SALES(1)
(kt/y) 2015 2014 2013 2012 2011
Nigeria (NLNG) 3,068 3,105 2,731 3,198 3,162Indonesia (Bontang)(2) 2,990 2,901 3,022 2,975 3,888Qatar (Qatargas II) 1,237 1,277 1,308 1,168 1,310Qatar (Qatargas I) 932 937 952 921 969Norway (Snøhvit) 731 658 567 631 521Yemen LNG 529 2,590 2,983 1,900 2,686Oman(3) 336 344 378 358 369Abu Dhabi (Adgas) 289 290 272 268 287Gladstone LNG 103 - - - -Angola LNG - 44 43 - -
Total 10,216 12,146 12,257 11,418 13,192
(1) Group share, excluding trading.(2) From 2007, TOTAL’s actual net supply to LNG plant applied to Bontang sales.(3) Includes both Oman LNG & Qalhat LNG.
59– TOTAL Factbook 2015Upstream
4.2 MT/YTOTAL: 18.4%
Snøhvit LNG
6.7 MT/YTOTAL: 39.62%
Yemen LNG
7.2 MT/YTOTAL: 5.54%
Oman LNG
3.7 MT/YTOTAL: 2.04%(1)
Qalhat LNG22.2 MT/Y
TOTAL’S 2014NET SUPPLY TO
LNG PLANT: 41.9%
Bontang
9.9 MT/YTOTAL: 10%
Qatargas 1
5.6 MT/YTOTAL: 5%
Adgas
TRAIN 5 - 7.8 MT/YTOTAL: 16.7%
Qatargas 2
5.2 MT/YTOTAL: 13.6%
Angola LNG7.2 MT/Y
TOTAL: 27.5%
Gladstone LNG
8.9 MT/YTOTAL: 30%
Ichthys LNG
16.5 MT/YTOTAL: 20%(3)
Yamal LNG
LNG PURCHASE
Sabine Pass / Cameron LNG
8.5 MT/YTOTAL: 15%
Nigeria LNG T7
21.9 MT/YTOTAL: 15%
Nigeria LNG T1-T6
Papua LNG
TOTAL: 40.1%(2)
Existing LNG Plant(100% capacity, TOTAL’s interest)
LNG project (FEED or under study)(100% capacity, TOTAL’s interest)
LNG project under construction at year-end 2015(100% capacity, TOTAL’s interest)
LNG supply

RE-GASIFICATION TERMINALS AS OF DECEMBER 31, 2015
60 TOTAL Factbook 2015 – Upstream
CAPACITY SUBSCRIBEDBY TOTAL: 8.9 BCM/Y
Sabine Pass
6.7 BCM/YCAPACITY SUBSCRIBED
BY TOTAL: 1.7 BCM/Y
Altamira
6.9 BCM/YTOTAL’S EQUITYINTEREST: 26%
Hazira
8.25 BCM/YTOTAL’S EQUITY
INTEREST: 27.54%
Fosmax LNG
21 BCM/YTOTAL’S EQUITYINTEREST: 8.35%
South Hook LNG
13 BCM/YTOTAL’S EQUITYINTEREST: 9.99%
Dunkerque LNG
Existing terminal(Re-gas capacity or reserved re-gas capacityat year-end 2015, Group share)Project under construction
GLNG.

GAS & POWER ACTIVITIES IN EUROPE AS OF DECEMBER 31, 2015
61– TOTAL Factbook 2015Upstream
(1) Asset sale was closed in the first quarter of 2016.
South Hook LNG8.35%
Dunkerque LNG
9.99%
TOTALGas & Power Ltd
100%
TOTAL Gas & PowerNederland B.V.
100%
Géométhane(1)
28.05%
100%
TOTAL Energie Gas GmbH
Fosmax LNG27.54%
TOTAL Gas & PowerBelgium
100%
35% TOTAL
Cepsa GasComercializadora (JV)
Total Énergie Gaz
100%Paris
Existing activities (TOTAL’s equity interest)
Project under construction (TOTAL’s equity interest)
Ichthys.

GAS & POWER ACTIVITIES IN NORTH AND SOUTH AMERICA AS OF DECEMBER 31, 2015
62 TOTAL Factbook 2015 – Upstream
TBG(Bolivia-Brazil)
TGN(1)
TGM
Altamira Regasification(subscribed capacity)
TOTAL Gas & PowerNorth America
Sabine Pass Regasification(subscribed capacity)
CANADA
VENEZUELA
BOLIVIA
ARGENTINA
CHILE
UNITED STATES
MEXICO
BRAZIL
Gas del Litoral
9.7%
32.7%
15.4%
25%
TOTAL 1.7 BCM/Y
100%
TOTAL 8.9 BCM/Y
LNG PURCHASE
Sabine Pass / Cameron LNG
Existing activities
Project under construction
Gas production
Gas pipeline under construction
Pipeline with TOTAL interest
Other gas pipeline
(1) Asset sale was closed in the first quarter of 2016.

INTERESTS IN PIPELINES
The table below sets forth interests of the Group’s entities (1) in oil and gas pipelines.
As of December 31, 2015Pipeline(s) Origin Destination % interest Operator Liquids Gas
Europe
Norway Frostpipe (inhibited) Lille-Frigg, Froy Oseberg 36.25 x Heimdal to Brae Condensate Line Heimdal Brae 16.76 x Kvitebjorn pipeline Kvitebjorn Mongstad 5.00 x Norpipe Oil Ekofisk Treatment center Teeside (UK) 34.93 x Oseberg Transport System Oseberg, Brage and Veslefrikk Sture 12.98 x Sleipner East Condensate Pipe Sleipner East Karsto 10.00 x Troll Oil Pipeline I and II Troll B and C Vestprosess (Mongstad Refinery) 3.71 x Vestprosess Kollsnes (Area E) Vestprocess (Mongstad Refinery) 5.00 x Polarled Asta Hansteen / Linnorm Nyhamna 5.11 x
The Netherlands Nogat pipeline F3-FB Den Helder 5.00 xWGT K13-Den Helder K13A Den Helder 4.66 xWGT K13-Extension Markham K13 (via K4 / K5) 23.00 x
United Kingdom Alwyn Liquid Export Line Alwyn North Cormorant 100.00 x x Bruce Liquid Export Line Bruce Forties (Unity) 43.25 x Central Graben Liquid Export Line (LEP) Elgin-Franklin ETAP 15.89 x Frigg System: UK line Alwyn North, Bruce and others St.Fergus (Scotland) 100.00 x xNinian Pipeline System Ninian Sullom Voe 16.00 x Shearwater Elgin Area Line (SEAL) Elgin-Franklin, Shearwater Bacton 25.73 xSEAL to Interconnector Link (SILK) Bacton Interconnector 54.66 x x
Africa
GabonMandji Pipes Mandji fields Cap Lopez Terminal 100.00 (a) x x Rabi Pipes Rabi fields Cap Lopez Terminal 100.00 (a) x x
Americas
ArgentinaTGN Network (Northern Argentina) 15.38 xTGM TGN Uruguyana (Brazil) 32.68 x
Brazil TBG Bolivia-Brazil border Porto Alegre via São Paulo 9.67 xTSB Argentina-Brazil border (TGM) Uruguyana (Brazil) 25.00 x Porto Alegre Canoas
Asia-Pacific
Australia Gladstone LNG Fairview, Roma, Scotia, Arcadia GLNG (Curtis Island) 27.50 x
Myanmar Yadana Yadana Ban-I Tong (Thai border) 31.24 x x
Rest of world
BTC Baku (Azerbaijan) Ceyhan (Turkey, Mediterranean) 5.00 x Dolphin North Field (Qatar) Taweelah-Fujairah-Al Ain (United Arab Emirates) 24.50 x
(a) Interest of Total Gabon. The Group has a financial interest of 58.3% in Total Gabon.
63– TOTAL Factbook 2015Upstream
(1) Excluding equity affiliates, except for the Yadana and Dolphin pipelines.

PIPELINE GAS SALES (1)
(Mcf / d) 2015 2014 2013 2012 2011
France - 9 37 53 61United Kingdom 370 313 395 379 526Norway 469 465 463 491 481The Netherlands 149 155 186 176 204Africa 13 63 56 112 64Azerbaijan - 147 81 64 56Brunei 62 65 58 54 56Qatar 173 155 154 178 217Syria - - - - 215China 59 63 45 7 -Indonesia (2) 119 94 92 123 115Myanmar 150 131 126 125 118Thailand 301 286 296 257 197United States 306 286 252 239 222Argentina 341 351 347 375 376Colombia - - - 14 18Bolivia 130 136 127 124 118Venezuela 93 87 73 64 52Australia 25 21 23 29 21Trinidad & Tobago - - 51 67 47
Total 2,760 2,827 2,862 2,931 3,164
(1) Consolidated entities.(2) Domestic sales.
POWER GENERATION FACILITIES
Status Interest Capacity(1) Technology
Abu Dhabi Taweelah A1 In operation 20.00% 1,600 MW Gas
Nigeria Afam VI In operation 10.00% 630 MW Gas
Thailand Bang Bo In operation 28.00% 350 MW Gas
(1) Capacity stated at 100%.
64 TOTAL Factbook 2015 – Upstream

PRODUCTION
20 15 20 14 20 13 20 12 20 11
Liquids production (Kb/d) 161 165 168 197 245Gas production (Mcf/d) 1,161 1,089 1,231 1,259 1,453
Total (Kboe/d) 374 364 392 427 512
MAIN START-UPS
Start-up Projects Type Capacity Share Op. Country (kboe/d)
2015 Eldfisk II Liq / gas 70 39.9% Norway West Franklin Ph.2 Gas / Cond. 40 46.2% x UK
2016 Laggan-Tormore Deep off. 90 60% x UK2017+ Tempa Rossa Heavy oil 55 50% x Italy Martin Linge Liq / gas 80 51% x Norway
65– TOTAL Factbook 2015Upstream
EUROPE ACREAGE
In 2015, TOTAL’s production in Europe was
374 kboe/d
Representing
16%of the Group’soverall production

TOTAL’S PRODUCING ASSETS AS OF DECEMBER 31, 2015(1)
Year of entry Operated Non-operated into the country (Group share in %) (Group share in %)
Europe
Norway 1965 Atla (40.00%)Skirne (40.00%)
Åsgard (7.68%)Ekofisk (39.90%)Ekofisk South (39.90%)Eldfisk (39.90%)Embla (39.90%)Gimle (4.90%)Gungne (10.00%)Heimdal (16.76%)Huldra (24.33%)Islay (5.51%) (2)
Kristin (6.00%)Kvitebjørn (5.00%)Mikkel (7.65%)Oseberg (14.70%)Oseberg East (14.70%)Oseberg South (14.70%)Sleipner East (10.00%) Sleipner West (9.41%)Snøhvit (18.40%)Stjerne (14.70%)Tor (48.20%)Troll I (3.69%)Troll II (3.69%)Tune (10.00%)Tyrihans (23.15%)Visund (7.70%)Visund South (7.70%)Visund North (7.70%)
(1) The Group’s interest in the local entity is approximately 100%.(2) The field of Islay extends partially in Norway. Total E&P UK holds a 94.49% stake and Total E&P Norge 5.51%.
66 TOTAL Factbook 2015 – Upstream

67– TOTAL Factbook 2015Upstream
Year of entry Operated Non-operated into the country (Group share in %) (Group share in %)
The Netherlands 1964 F6a (gas) (55.66%) F6a (oil) (65.68%) F15a Jurassic (38.20%) F15a / F15d Triassic (32.47%) F15d (32.47%) J3a (30.00%) K1a (40.10%) K1b / K2a (60.00%) K2c (60.00%) K3b (56.16%) K3d (56.16%) K4a (50.00%) K4b / K5a (36.31%) K5b (50.00%) K6 / L7 (56.16%) L1a (60.00%) L1d (60.00%) L1e (55.66%) L1f (55.66%) L4a (55.66%) L4d (55.66%) E16a (16.92%) E17a / E17b (14.10%) J3b / J6 (25.00%) K9ab-A (22.46%) Q16a (6.49%)
United Kingdom 1962 Alwyn North (100.00%) Dunbar (100.00%) Ellon (100.00%) Forvie North (100.00%) Grant (100.00%) Jura (100.00%) Nuggets (100.00%) Elgin-Franklin (46.17%) West Franklin (46.17%) Glenelg (58.73%) Islay (94.49%) (1)
Bruce (43.25%) Markham unitized field (7.35%) Keith (25.00%)
(1) The field of Islay extends partially in Norway. Total E&P UK holds a 94.49% stake and Total E&P Norge 5.51%.

NORWAY
TOTAL has equity stakes in 97 productionlicenses on the Norwegian maritimecontinental shelf, 31 of which it operates.
The Group’s production in 2015 was239 kboe / d compared to 242 kboe / d in2014 and 243 kboe / d in 2013.
– In the Greater Ekofisk area (map page 69),the Group holds a 39.9% stake in theEkofisk and Eldfisk fields. Production atEkofisk South started in 2013 and atEldfisk II in January 2015 (capacity of 70kboe / d each).
– In the Sleipner area, development of theGina Krog field located in the north ofSleipner and approved in 2013 isunderway. The Group’s stake, currently30% (after the sale of 8% in 2014), isexpected to be reduced to 15% after thefinalization of the sale of 15% announcedin October 2015.
– In the Greater Hild area (map page 69),the Martin Linge field (51%, operator,estimated capacity 80 kboe / d) iscurrently being developed.
– In the Haltenbanken region, the first sub-marine compression train in the worldwas commissioned on the Åsgardproject (7.7%) in September 2015.
– In the Barents Sea, the Group holds an18.4% stake in the gas liquefaction plantof Snøhvit (capacity of 4.2 Mt / y). Thisplant is supplied with gas from theSnøhvit, Albatross and Askeladd fields.
68 TOTAL Factbook 2015 – Upstream
EUROPE ACREAGE NorwayUnited KingdomNetherlandsFrance
DenmarkItalyRest of Europe
SWEDEN
NORWAY
FINLAND
BARENTS SEA
NORWEGIAN SEA
Snøhvit
TOTAL Partner
TOTAL Operator
500 km0 km
Field or Discovery:
3
Eldfisk.

UNITED KINGDOM
The Group’s production was 107 kboe / d in2015 compared to 89 kboe / d in 2014 and105 kboe / d in 2013. Approximately 90% ofthis production comes from operated fieldsin two main areas: the Alwyn area in thenorthern North Sea, and the Elgin / Franklinarea in the Central Graben.
– In the Alwyn area (100%), productionfrom the Alwyn and Dunbar fieldsrepresents 20% and 25% of production,respectively. The rest of the productioncomes from satellites:
1) linked to Alwyn by subsea tieback: theForvie gas and condensates field joinedby the Jura and Islay fields and theNuggets gas field network, whichstarted to produce in cyclic mode at theend of 2015;
2) linked to Dunbar: the Ellon (oil and gas)and the Grant (gas and condensates)fields.
The natural decline of the Alwyn field’sproduction was partially compensated by thestart-up of new reservoir compartments. Asystem for improving recovery, the concentricgas lift, was installed in three Alwyn wells in2014.
On the Dunbar field (100%), a newdevelopment phase (Dunbar phase IV) isunderway, which includes three well work-overs and the drilling of six new wells. Drillingon the first well, D14, started in April 2015.
РIn Central Graben, TOTAL holds stakes inthe Elgin, Franklin and West Franklin fieldsΠ(46.2%, operator). A redevelopmentproject involving the drilling of five newinfill wells on Elgin and Franklin started inJuly 2013. The first well is currently beingdrilled. In addition, the West FranklinPhase II development project continuedwith the start-up of production of twonew wells in 2015.
69– TOTAL Factbook 2015Upstream
EUROPE ACREAGE NorwayUnited KingdomNetherlandsFrance
DenmarkItalyRest of Europe
NORWAY
SHETLAND
UNITEDKINGDOM
NORTH SEA
Laggan
Alwyn Area
Elgin-Franklin Area
Islay
Greater Ekofisk Area
Greater Hild Area
Jura
Sleipner
Troll
Oseberg
TOTAL Partner
TOTAL Operator
250 km0 km
Field or Discovery:
5
1
46
2

– A third area, West of Shetland (mappage 69), is currently under development.This includes the fields of Laggan, Tormore,Edradour and Glenlivet (operator with 60%,following the sale of 20% of its interestscarried out in 2015) and the P967 license,including the discovery of gas at Tobermory(30%, operator). Production of the Lagganand Tormore fields started in February 2016.Production of the Edradour and Glenlivetfields is expected to start in 2017 and 2018,respectively, with an expected total capacityof 90 kboe / d.
In 2014, TOTAL acquired a 40% stake intwo onshore shale gas exploration andproduction licenses (PEDL 139 and 140)located in the Gainsborough Trough basinof the East Midlands, and signed anagreement enabling the Group to acquire a50% stake in the PEDL 209 license locatedin the same area. A 3D seismic survey wasperformed on the PEDL 139 and 140licenses.
In August 2015, an agreement was signedfor the sale of interests held by Total E&PUK in transport pipelines (FUKA andSIRGE) and the St. Fergus terminal. The transfer was closed in March 2016.
70 TOTAL Factbook 2015 – Upstream
EUROPE ACREAGE
Laggan-Tormore.
West Franklin.
NorwayUnited KingdomNetherlandsFrance
DenmarkItalyRest of Europe

NETHERLANDS
TOTAL currently holds interests in 24offshore production licenses, including 20that it operates, and 2 offshore explorationlicenses, E17c (16.92%) and K1c (30%). In 2015, the Group’s production was 28 kboe / d compared to 31 kboe / d in 2014and 35 kboe / d in 2013.
FRANCE
The Group’s production ended with thesale in October 2014 of the Lacqconcessions to Geopetrol. Production in2014 was 2 kboe / d compared to 9 kboe / din 2013. The Montélimar exclusive researchlicense granted to TOTAL in 2010 forevaluating the shale gas potential of thisarea was repealed by the government in2011. In January 2016, following theappeal filed in 2011, the administrativecourt canceled the revocation of thelicense deciding the Group had fulfilled itsobligations.
71– TOTAL Factbook 2015Upstream
EUROPE ACREAGE
THE NETHERLANDS
NORTH SEA
AMSTERDAM
Q16a
K5bK5aK4
K1c
J6L4
L7
E17b
E17a
F15a
J3K6
TOTAL Operator
TOTAL Partner
100 km0 km
NorwayUnited KingdomNetherlandsFrance
DenmarkItalyRest of Europe

DENMARK
TOTAL (80%, operator) acquired two shalegas exploration licenses in 2010 in order to assess their potential. On the 1 / 10(Nordjylland) license, a vertical explorationwell without hydraulic fracturing drilled in2015 revealed the presence of gas, but thequantities were not sufficient to considereconomically viable production. The Groupis moving forward with restoration workson the drilling site, which will berehabilitated in compliance withenvironmental obligations as required byDanish law. The 2 / 10 (Nordsjaelland)license was relinquished in July 2015 dueto lower than expected estimated potentialfor the Group.
ITALY
TOTAL holds a stake in two explorationlicenses and in the Tempa Rossa field(50%, operator), discovered in 1989 andlocated on the Gorgoglione concession(Basilicate region). Development of theTempa Rossa project is underway.
REST OF EUROPE
TOTAL also holds interests in explorationlicenses in Bulgaria and Cyprus.
72 TOTAL Factbook 2015 – Upstream
Gorgoglione
Teana
AlianoFosso Valdienna
Serra San Bernardo
MEDITERRANEAN SEA
ITALY
ADRIATIC SEA
NAPOLI
BARI
TARANTO
Tempa Moliano
400 km0 km
TOTAL Partner
TOTAL Operator
EUROPE ACREAGE NorwayUnited KingdomNetherlandsFrance
DenmarkItalyRest of Europe

PRODUCTION
20 15 20 14 20 13 20 12 20 11
Liquids production (Kb/d) 542 522 531 574 517Gas production (Mcf/d) 677 693 699 705 715
Total (Kboe/d) 678 657 670 713 659
MAIN START-UPS
Start-up Projects Type Capacity Share Op. Country (kboe/d)
2015 Ofon 2 Liq / gas 70 40% x Nigeria Dalia 1A Deep off. 30 40% x Angola Lianzi Deep off. 40 36.75% Congo (1)
Moho Ph. 1b Deep off. 40 53.5% x Congo2016 Angola LNG LNG 175 13.6% Angola2017+ Moho North Deep off. 100 53.5% x Congo Kaombo Deep off. 230 30% x Angola Egina Deep off. 200 24% x Nigeria
(1) Offshore unitization area between Republic of Congo and Angola.
73– TOTAL Factbook 2015Upstream
AFRICA ACREAGE
In 2015, TOTAL’s production in Africa was
678 kboe/d
Representing
29%of the Group’soverall production

TOTAL’S PRODUCING ASSETS AS OF DECEMBER 31, 2015(1)
Year of entry Operated Non-operated into the country (Group share in %) (Group share in %)
Africa
Algeria 1952 Tin Fouye Tabankort (35.00%)
Angola 1953 Girassol, Jasmim, Rosa, Dalia, Pazflor, CLOV (Block 17) (40.00%) Cabinda Block 0 (10.00%) Kuito, BBLT, Tombua-Landana (Block 14) (20.00%) (2)
Lianzi (Block 14K) (10.00%) (2)
Angola LNG (13.60%)
Gabon 1928 Anguille (100.00%) Anguille Nord Est (100.00%) Anguille Sud-Est (100.00%) Atora (40.00%) Avocette (57.50%) Baliste (50.00%) Barbier (100.00%) Baudroie Marine (50.00%) Baudroie Nord Marine (50.00%) Coucal (57.50%) Girelle (100.00%) Gonelle (100.00%) Grand Anguille Marine (100.00%) Grondin (100.00%) Hylia Marine (75.00%) Lopez Nord (100.00%) Mandaros (100.00%) M’Boukou (57.50%) M’Boumba (100.00%) Mérou Sardine Sud (50.00%) Port Gentil Océan (100.00%) Tchengue (100.00%) Torpille (100.00%) Torpille Nord Est (100.00%) Rabi Kounga (47.50%)
Libya 1959 Zones 15, 16 & 32 (75.00%) (3)
Nigeria 1962 OML 58 (40.00%) OML 99 Amenam-Kpono (30.40%) OML 100 (40.00%) OML 102 (40.00%) OML 130 (24.00%) OML 102 – Ekanga (40.00%) Shell Petroleum Development Company (SPDC 10.00%) OML 118 – Bonga (12.50%) OML 138 (20.00%)
The Congo, Republic of 1968 Kombi-Likalala-Libondo (65.00%) Moho Bilondo (including Moho phase 1b) (53.50%) Nkossa (53.50%) Nsoko (53.50%) Sendji (55.25%) Tchendo (65.00%), Tchibeli-Litanzi-Loussima (65.00%), Tchibouela (65.00%), Yanga (55.25%) Lianzi (26.75%), Loango (42.50%), Zatchi (29.75%)
(1) The Group’s interest in the local entity is approximately 100% in all cases except for Total Gabon (58.28%) and Total E&P Congo (85.00%).(2) Stake in the company Angola Block 14 BV (TOTAL 50.01%).(3) TOTAL’s stake in the foreign consortium.
74 TOTAL Factbook 2015 – Upstream

NIGERIA
The Group’s production, primarily offshore,was 245 kboe / d in 2015, compared to 257kboe / d in 2014 and 261 kboe / d in 2013.This decrease is explained mainly by thesale of interests in certain licenses of theShell Petroleum Development Company(SPDC) joint venture as well as by anupsurge of oil bunkering activities since2013. This has negatively affected onshoreproduction and has had an impact on theintegrity of the SPDC joint venture facilitiesas well as on the local environment.
TOTAL operates 5 of the 31 oil miningleases (OML) in which it has interests andalso holds interests in 4 oil prospectinglicenses (OPL).
Regarding the principal variations inTOTAL’s permits since 2013:
– TOTAL was granted approval by theauthorities in 2013 to increase its stakein OPL 285 from 26.67% to 60% and itdrilled the Ekpeyi-1 exploration well in2015;
– In 2013, TOTAL was granted approvalby the authorities for the renewal ofOMLs 99, 100 and 102 for a period of20 years;
– On OML 138 (20%), the production ofthe offshore field Usan reached 130kboe / d in 2013. In 2014, two explorationwells, Ukot South-2B and Ukot South-3,and an exploration well in 2015, UkotSouth-4, led to three oil discoveries. Thesale process, launched inNovember 2012, could not be closed.This asset is no longer accounted under“assets classified as held for sale”.TOTAL has ceased to be the operator ofOML 138 since February 2014;
– TOTAL sold its 10% interest in OMLs 18and 29 (in 2015) and OML 24 (in 2014),operated via the SPDC joint venture. Inaddition, the sale process is underwayfor OML 25.
TOTAL continues to develop its operatedassets, in particular:
– OML 58 (40%, operator, onshore): in thescope of its joint venture with theNigerian National Petroleum Corporation(NNPC), TOTAL has finalized theincrease of the gas production capacityfrom 370 Mcf / d to 550 Mcf / d;
– OML 102 (40%, operator): inDecember 2014, TOTAL stopped routineflaring on the Ofon field (Ofon phase 2
project). The gas associated with theproduction of oil is now compressed andevacuated to shore and monetized viathe Nigeria LNG plant;
– OML 130 (24%, operator): thedevelopment of the Egina field (200kboe / d capacity) launched in 2013 isunderway. The drilling campaign for 44wells started at the end of 2014;
– OML 99 (40%, operator): additionalstudies are underway for thedevelopment of the Ikike field.
TOTAL is also developing LNG activitieswith a 15% stake in the Nigeria LNG Ltdcompany, which owns a liquefaction plantwith a 22 Mt / year total capacity.Assessments are underway for theinstallation of an additional capacity ofapproximately 8.5 Mt / year. In an effort to
focus its activities, TOTAL is currently re-evaluating its participation in the BrassLNG project, in which it holds a 20.48%interest.
The Group’s non-operated production inNigeria comes mostly from the SPDC jointventure in which TOTAL holds a 10%stake. TOTAL also holds an interest in deepoffshore OML 118 (12.5%). On this leasein 2015, the Bonga field has contributed19 kboe / d to the Group’s production. Aunitization agreement for the Bonga SouthWest / Aparo discovery (10%) wassubmitted to the authorities in 2015.
75– TOTAL Factbook 2015Upstream
OML 118(Bonga)
OPL 285
OML 136
OPL 297
OPL 257
OML 135
OML 130(Akpo,Egina)
OML 138 (Usan)OML 139
OPL 223
OML 102(Ofon)
OML 99 OML 117
OML 112
OML 79(EA)
OML 58(Obagi/Obite)
GUINEA GOLF
NIGERIA
OML 100
TOTAL Partner
TOTAL Operator
100 km0 km
NigeriaAngolaRepublic of the Congo
GabonAlgeriaLibyaUganda
MoroccoRest of Africa
AFRICA ACREAGE
Egina.
1
3
4
2

ANGOLA
In Angola, where TOTAL is the leading oiloperator in the country (1), the Group’sproduction was 248 kboe / d in 2015compared to 200 kboe / d in 2014 and 186kboe / d in 2013. This production comesfrom Blocks 17, 14 and 0.
– Deep offshore Block 17 (40%, operator)is TOTAL’s main asset in Angola. It iscomposed of four major producinghubs: Girassol, Dalia, Pazflor and CLOV.The latest greenfield project, CLOV,started production in June 2014 and,since September 2014, its productionplateau of 160 kboe / d has beenmaintained. In June 2015, DaliaPhase 1A, a new development in theDalia field, started production.
– On the ultra-deep offshore Block 32 (30%, operator), the Kaombo projectwas launched in April 2014 to developthe discoveries in the southeast part ofthe block via two FPSOs (FloatingProduction Storage and Offloadingfacilities) with a capacity of 115 kb / deach. The drilling campaign of 59 wellsbegan in October 2015 and productionstart-up is planned for 2017. Theexploration and delineation of the centerand north parts of the block (outsideKaombo) is ongoing.
– On Block 14 (20%) (2), production comesfrom the Tombua-Landana and Kuitofields as well as the BBLT project,comprising the Benguela, Belize, Lobitoand Tomboco fields.
– Block 14K (36.75%) is the offshoreunitization zone between Angola (Block14) and the Republic of the Congo(Haute Mer license). The Lianzi field,which was connected to the existingBBLT platform (Block 14), startedproduction at the end of October 2015.The project is expected to reach aproduction plateau of 40 kb / d. TOTAL’sinterest in the unitized Block region isheld 10% through Angola Block 14 BVand 26.75% through Total E&P Congo.
– On Block 0 (10%), the development ofMafumeira Sul was approved by thepartners and authorities in 2012. Thisproject constitutes the seconddevelopment phase of the Mafumeirafield and is expected to start productionby the end of 2016.
76 TOTAL Factbook 2015 – Upstream
Diaba
Rabi Kounga
Igongo
Atora
Anguille
GABON
CONGO
ANGOLA
CONGO (DR)Moho-BilondoLianzi
Persee
Block 17-06
Block 32CLOV
Block 39
Block 40
Block 25
ATLANTIC OCEAN
GULF OF GUINEA
LUANDA
CABINDA
LIBREVILLE
Nkossa
Pazflor
Dalia
Girassol-Jasmin
Rosa
Pegase
Cassiopee
Andromede
TOTAL Operator
TOTAL Partner
200 km0 km
ZIC
AFRICA ACREAGE NigeriaAngolaRepublic of the Congo
GabonAlgeriaLibyaUganda
MoroccoRest of Africa
12
(1) Company data.(2) Stake held by the company Angola Block 14 BV (TOTAL 50.01%).

– In April 2014, TOTAL sold its entire stakein Block 15 / 06 (15%). In the Bas-Congobasin, TOTAL is the operator ofexploration Block 17 / 06 (30%). TheGroup relinquished Block 33 (58.67%,operator) in November 2014.
In the Kwanza basin, deep offshore, TOTALis also operator of Blocks 25 (35%), and 40(40%) and holds an interest in Block 39(7.5% following the finalization of the sale ofhalf of its stake in March 2015). TOTAL isalso developing its LNG activities throughthe Angola LNG project (13.6%), whichincludes a gas liquefaction plant near Soyosupplied by gas associated with productionfrom Blocks 0, 14, 15, 17 and 18. LNGproduction started in June 2013, butvarious technical incidents required theextended shutdown of the plant. LNGproduction is expected to resume in 2016.
REPUBLIC OF THE CONGO
The Group’s production was 87 kboe / d in2015 compared to 95 kboe / d in 2014 and93 kboe / d in 2013. In December 2013,Qatar Petroleum International Upstream(QPI) purchased a 15% stake in the capitalof Total E&P Congo, via a share capitalincrease of the subsidiary.
– On the offshore field Moho Bilondo(53.5%, operator), phase 1b project(estimated capacity: 40 kboe / d) startedproduction in December 2015.Production of the Moho Nord project(estimated capacity: 100 kboe / d) isexpected to start by the first half of 2017.
– Block 14K (36.75%) corresponds to theoffshore unitization area between theRepublic of the Congo (Haute Merlicense) and Angola (Block 14 located inAngola). The production of the Lianzifield started at the end of October 2015.TOTAL’s interests in the unitization areaare 26.75% held by Total E&P Congoand 10% by Angola Block 14 BV.
– Since 2013, as part of the renewal oflicenses, the stakes held by the Grouphave been 42.5% on the Loango licenseand 29.75% on the Zatchi license.
– Total E&P Congo is operator of Djéno(63%), the sole oil terminal in the country.
GABON
The Group’s production in 2015 was 59 kboe / d compared to 58 kboe / d in 2014and 59 kboe / d in 2013. The Group’sexploration and production activities in
Gabon were primarily carried out by TotalGabon (1).
– On the Anguille field (100%, operator),production of phase 3 of theredevelopment project (productioncapacity estimated at 20 kboe / d) fromthe AGM Nord platform started in 2013and 18 wells are operational today.
– On the Torpille field (100%, operator), thedata acquired during the 3D seismicsurvey performed in 2014 is now beingprocessed.
– On the deep-offshore Diaba license(42.5%, operator), an exploration well(Diaman-1B), drilled in 2013, showed anaccumulation of gas and condensates.Additional seismic data acquired at theend of 2014 on the western part of thelicense is being processed and isexpected to generate a full inventory ofthe license’s prospectivity.
– On the Nziembou (20%) license, theIgongo-1X well (which revealed amultilayer accumulation of oil and gas)was commissioned by connecting to thefacilities of the Echira field in June 2015.
77– TOTAL Factbook 2015Upstream
Kaombo. Moho.
AFRICA ACREAGE
(1) Total Gabon is a company under Gabonese law listed on Euronext Paris. TOTAL holds 58.28%, the Republic of Gabon holds 25% and the public float is 16.72%.
NigeriaAngolaRepublic of the Congo
GabonAlgeriaLibyaUganda
MoroccoRest of Africa

ALGERIA
TOTAL’s production was 25 kboe / d during2015, compared to 20 kboe / d in 2014 and21 kboe / d in 2013. All of the Group’sproduction in Algeria comes from the TinFouyé Tabankort (TFT) field (35%) .TOTAL also has a 37.75% stake in theTimimoun gas development project.
The development of the Timimoun fieldcontinued in 2015 with engineeringactivities, the start of plant constructionand the drilling preparation.
LIBYA
In Libya, where the security contextremains unstable, the Group’s productionwas 14 kb / d in 2015 compared to 27 kb / din 2014 and 50 kb / d in 2013. Thisproduction comes from blocks located onoffshore areas 15, 16 and 32 (Al Jurf, 75%(1)),which have not been affected by thesecurity issues. Since the fourth quarter of2014, production as well as explorationactivities have been stopped onMabruk – onshore areas 70 and 87 (75% (1)) – and on El Sharara – onshoreareas 129, 130 (30% (1)), and 130 and 131(24% (1)).
78 TOTAL Factbook 2015 – Upstream
MEDITERRANEAN SEA
TUNISIA
LIBYA
TRIPOLI
Contract Area 70 & 87
Contract Area 129 & 130
NC 191
Contract Area 130 & 131
Contract Area 15, 16 & 32
ALGERIA
Tin Fouye Tabankort
Timimoun Centre
Hassi Mahdjib
Explo: TOTAL Operator / Prod: TOTAL Partner
300 km0 km
TOTAL Operator
TOTAL Partner
AFRICA ACREAGE
1
2
(1) TOTAL’s stake in the foreign consortium.
NigeriaAngolaRepublic of the Congo
GabonAlgeriaLibyaUganda
MoroccoRest of Africa

UGANDA
In Uganda, a growth area for the Groupand where TOTAL has been present in theupstream since 2012, the Group has a33.33% stake in the EA-1, EA-1A and EA-2 licenses and 28.33% in the EA-3license located in the region of Lake Albert.TOTAL is the operator of licenses EA-1 andEA-1A and partner on the other licenses.
– On the EA-1 license, a drilling campaign,production tests and 3D seismicacquisition survey were carried outbetween 2012 and mid-2014. As of theend of 2014, five development plans hadbeen submitted to the authorities. In2015, discussions for the obtaining ofproduction licenses were continued, anddevelopment optimization studies wereconducted in order to start the projectphase.
– The EA-1A license expired in 2013 at theend of a drilling campaign that resultedin one discovery (Lyec). With theexception of the area relating to thisdiscovery, the license was relinquishedto the authorities.
– On the EA-2 license, the drillingcampaign and production tests startedin 2012 were completed in 2014. Twodevelopment plans were submitted tothe authorities in 2013. In 2015,discussions continued for the obtainingof production licenses.
– The development plan for Kingfisherfield, located on the EA-3 productionlicense, was approved by the authoritiesin 2013 and the work to develop the fieldcontinues.
– In 2015, discussions were continuedwith the authorities of Uganda in order toassess the best option for the layout forthe crude oil export pipeline to the IndianOcean.
MOROCCO
The 3D seismic processing andinterpretation studies acquired in 2013 inthe south of the Block continued in thescope of the recognition authorization ofAnzarane offshore, which covers an oceanregion of 100,000 km² and was allocated inDecember 2011 to TOTAL by the ONHYM(National Office of Hydrocarbons andMines). The results of geological studieshaving not been encouraging, therecognition authorization, which had beenextended until December 2015, was nottransformed into an exploration license.
REST OF AFRICA
TOTAL also holds interests in explorationlicenses in South Africa, Côte d’Ivoire,Egypt, Kenya, Madagascar, Mauritania,Mozambique and the Democratic Republicof the Congo, and is negotiating with theauthorities with the view to resumeexploration activities in the Republic ofSouth Sudan.
79– TOTAL Factbook 2015Upstream
UGANDA
DEMOCRATICREPUBLIC OF THECONGO
KAMPALA
EA 3-KJEA 2
EA 2 BuliisaEA 1 (Dev)
Block III
TOTAL Partner
TOTAL Operator
400 km0 km
AFRICA ACREAGE NigeriaAngolaRepublic of the Congo
GabonAlgeriaLibyaUganda
MoroccoRest of Africa

80 TOTAL Factbook 2015 – Upstream
This page was intentionally left blank.

PRODUCTION
20 15 20 14 20 13 20 12 20 11
Liquids production (Kb/d) 54 36 32 27 22Gas production (Mcf/d) 1,252 1,135 1,046 909 525
Total (Kboe/d) 290 249 227 195 119
MAIN START-UPS
Start-up Projects Type Capacity Share Op. Country (kboe/d)
2015 Termokarstovoye Gas / Cond. 65 49%(1) Russia2016 Kashagan Liquids 370 16.81% Kazakhstan2017+ Yamal LNG LNG 450 20%(1) Russia
(1) Direct stake only.
TOTAL’S PRODUCING ASSETS AS OF DECEMBER 31, 2015(1)
Year of entry Operated Non-operated into the country (Group share in %) (Group share in %)
Commonwealth of Independent States
Kazakhstan 1992 Kashagan (16.81%)
Russia 1991 Kharyaga (40.00%) Termokastovoye (49.00%) (2)
Several fields through the participation in Novatek (18.90%)
(1) The Group’s interest in the local entity is approximately 100%.(2) TOTAL’s interest in the joint venture with Novatek.
81– TOTAL Factbook 2015Upstream
COMMONWEALTH OF INDEPENDENT STATES
In 2015, TOTAL’s production in CIS was
290 kboe/d
Representing
12%of the Group’soverall production

RUSSIA
In Russia, where, as of December 31,2015, the Group holds 19% of its provedreserves, the Group’s production was 290 kboe / d in 2015 compared to 235kboe / d in 2014 and 207 kboe / d in 2013.This production comes from the Kharyagaand Termokarstovoye fields and TOTAL’sstake in OAO Novatek (18.9% as ofDecember 31, 2015). In 2015, Russiabecame the leading contributor to theGroup’s production.
In 2014, international economic sanctionsassociated with the situation in Ukrainewere adopted by the United States, theEuropean Union and other countries.TOTAL complies with sanctions applicableto its activities.
On the Kharyaga (40%, operator)project, the works relating to thedevelopment plan of phases 3 and 4 areongoing though they slowed in 2015 aftera dispute with the main contractor, whichwas settled at the end of 2015. In addition,
in January 2016, TOTAL signed anagreement for the sale of 20% interest andthe transfer of operatorship of the field.This sale is expected to take effect in thesecond quarter of 2016, subject to theapproval of the authorities.
In addition to its shareholding in Novatek,TOTAL currently participates via a directstake in two projects with Novatek:
– Termokarstovoye (an onshore gas andcondensates field, located in theYamalo-Nenets region): the developmentand production license ofTermokarstovoye field is held by ZAOTerneftegas, a joint venture betweenNovatek (51%) and TOTAL (49%). Thisfield, which started production in May2015, reached its capacity of 65 kboe / din September 2015; and
– Yamal LNG: in December 2013 thecompany OAO Yamal LNG (1) launchedthe project, aimed at developing theonshore field of South Tambey (gasand condensates) located on the Yamalpeninsula and at building a three-train
gas liquefaction plant with total LNGcapacity of 16.5 Mt / y. The financing planfor the Yamal LNG project is beingreviewed, and the project’s partners areengaged in efforts to develop a financingplan in compliance with the applicableregulations. In 2015, the projectadvanced satisfactorily according toschedule.
The exploration project on the Bazhenovfield (shale oil) in the Kanthy Mansiyskregion has been suspended since 2014. In2015, TOTAL transferred all of its rights inthe awarded licenses to a subsidiary of thepartner of the project.
82 TOTAL Factbook 2015 – Upstream
RUSSIA
KARA SEA
Termokarstovoye
South Tambey
Kharyaga
TOTAL Partner
TOTAL Operator
500 km0 km
COMMONWEALTH OF INDEPENDENTSTATES ACREAGE
RussiaKazakhstanRest of CIS
1
3
2
(1) The OAO Yamal LNG company is owned by Novatek (60%), Total E&P Yamal (20%), and CNODC (20%), a subsidiary of China National Petroleum Corporation. Novatek’s investment inthe company OAO Yamal LNG is to be reduced to 50.1% following an agreement signed in September 2015 for the entry of the Silk Road Fund (9.9%). This agreement is expected tobe approved by the authorities in 2016.

KAZAKHSTAN
TOTAL holds a stake in the NorthCaspian license (16.81%), which coversthe Kashagan field .
The production of the first phase of theKashagan project (300 kb / d), started inSeptember 2013, was halted inOctober 2013 due to leaks detected in thegas export pipeline. The two gas and oilexport pipelines are being replaced by theoperator. The works progress according toplan and production is expected to resumein December 2016.
TOTAL is the operator of the NurmunaïNorth and South onshore explorationlicenses (51.1%, after the sale of 23.9%of interests in February 2015) located in thesouthwest of the country. The drilling oftwo exploration wells (the first on theNurmunaï North license and the second onthe Nurmunaï South license) wasperformed between February andOctober 2015. The results are beinganalyzed.
REST OF CIS
TOTAL also holds interests in explorationlicenses in Azerbaijan and Tajikistan.
83– TOTAL Factbook 2015Upstream
CASPIAN SEA
KAZAKHSTAN
TURKMENISTAN
UZBEKISTAN
Nurmunaï North
Nurmunaï SouthKashagan
North CaspianSea Permit
GURJEV
ERBAIJANBAKU
TOTAL Partner
TOTAL Operator
200 km0 km
Yamal.
COMMONWEALTH OF INDEPENDENTSTATES ACREAGE
RussiaKazakhstanRest of CIS
1
2

MIDDLE EAST ACREAGE
In 2015, TOTAL’s production in Middle East was
492 kboe/d
Representing
21%of the Group’soverall production
UpstreamTOTAL Factbook 2015 –84
PRODUCTION
20 15 20 14 20 13 20 12 20 11
Liquids production (Kb/d) 351 192 324 311 317Gas production (Mcf/d) 778 1,084 1,155 990 1,370
Total (Kboe/d) 492 391 536 493 570
TOTAL’S PRODUCING ASSETS AS OF DECEMBER 31, 2015(1)
Year of entry Operated Non-operated into the country (Group share in %) (Group share in %)
Middle East
U.A.E. 1939 Abu Dhabi-Abu Al Bu Khoosh (75.00%) ADCO (10.00%) Abu Dhabi offshore (13.33%) (2)
GASCO (15.00%) ADGAS (5.00%)
Iraq 1920 Halfaya (22.5%) (3)
Oman 1937 Various fields onshore (Block 6) (4.00%) (4)
Mukhaizna field (Block 53) (2.00%) (5)
Qatar 1936 Al Khalij (40.00%) North Field-Bloc NF Dolphin (24.50%) North Field-Qatargas 1 Downstream (10.00%) North Field-Qatargas 1 Upstream (20.00%) North Field-Qatargas 2 Train 5 (16.70%)
Yemen 1987 Kharir / Atuf (Block 10) (28.57%)Various fields onshore (Block 5) (15.00%)
(1) The Group’s interest in the local entity is approximately 100% in all cases except certain entities in Abu Dhabi and Oman (see notes (2) through (5) below).(2) Via Abu Dhabi Marine Areas Limited (equity affiliate), TOTAL holds a 13.33% stake in the Abu Dhabi Marine Areas (ADMA) concession operated by ADMA-OPCO.(3) TOTAL’s interest in the joint venture.(4) TOTAL’s indirect interest (4.00%) in the concession, via its 10% interest in Private Oil Holdings Oman Ltd. TOTAL also has a direct interest (5.54%) in the Oman LNG facility
(trains 1 and 2), and an indirect participation (2.04%) through OLNG in Qalhat LNG (train 3).(5) TOTAL’s direct interest in Block 53.

UNITED ARAB EMIRATES
The Group’s production was 287 kboe / d in2015 compared to 127 kboe / d in 2014 and260 kboe / d in 2013. Since January 1, 2015the Group has held a 10% stake in theAbu Dhabi Company for OnshorePetroleum Operations Ltd. Concession(ADCO) for a period of 40 years, whichfollows a previous onshore concession.This concession covers the 15 mainonshore fields of Abu Dhabi and representsmore than half of the Emirate’s production.
TOTAL holds a 75% stake (operator) in theAbu Al Bukhoosh field and a 13.3% stake
in Abu Dhabi Marine Operating Company(ADMA-OPCO), which operates two fieldsoffshore Abu Dhabi. TOTAL also holds a15% stake in Abu Dhabi Gas Industries(GASCO), which produces NGL andcondensates from the associated gasproduced by ADCO. In addition, TOTALholds 5% of the Abu Dhabi GasLiquefaction Company (ADGAS), whichprocesses the associated gas produced byADMA-OPCO in order to produce LNG,NGL and condensates, and 5% of NationalGas Shipping Company (NGSCO), whichowns eight LNG tankers and exports theLNG produced by ADGAS.
The Group holds a 24.5% stake in DolphinEnergy Ltd. in partnership with Mubadala,a company owned by the government ofAbu Dhabi, in order to market gasproduced in Qatar primarily to the UnitedArab Emirates.
The Group also owns 33.33% of RuwaisFertilizer Industries (FERTIL), whichproduces urea. The FERTIL 2 projectcommenced operations in 2013, enablingFERTIL to increase its production capacityto 2 Mt / y.
85– TOTAL Factbook 2015Upstream
MIDDLE EAST ACREAGE United Arab EmiratesQatar
OmanYemen
IraqSyria
ADCO.

QATAR
The Group’s production was 134 kboe / d in2015 compared to 132 kboe / d in 2014and 137 kboe / d in 2013.The Group operates the Al Khalij field (40%operator) and participates in theproduction, processing and exporting ofgas from the North Field due toinvestments in the LNG Qatargas 1 andQatargas 2 plants and in Dolphin Energy.– Qatargas 2 (16.7%): the production
capacity of train 5 of Qatargas 2 stoodat 8 Mt / y. TOTAL offtakes part of theLNG produced under the 2006 contracts
that provide for the purchase of 5.2 Mt / yof LNG by the Group. In addition, theGroup holds a stake in the Qatargas 1liquefaction plant (10%) as well as astake in the corresponding UpstreamBlock NFB (20%).
– Dolphin Energy (24.5%): the productioncontract for the Dolphin gas project,signed in 2001 with Qatar Petroleum,provides for the sale of 2 Bcf / d of gasfrom the North Field for a 25-year period.The gas is processed in the Dolphinplant in Ras Laffan and exported to theUnited Arab Emirates through a 360 kmgas pipeline.
OMAN
The Group’s production in 2015 was 36 kboe / d, stable compared to 2014 and2013. TOTAL participates in the productionof oil principally in Block 6 (4%) (1), but alsoin Block 53 (2%). The Group also producesLNG through its investments in the OmanLNG (5.54%) / Qalhat LNG (2.04%) (2)
liquefaction complex, with an overallcapacity of 10.5 Mt / y. The ultra-deepoffshore Block 41 license, obtained in2013, was relinquished in February 2015following disappointing results.
86 TOTAL Factbook 2015 – Upstream
MIDDLE EAST ACREAGE United Arab EmiratesQatar
OmanYemen
IraqSyria
QATAR
OMAN
U.A.E.
SAUDI ARABIA
PERSIAN GULFQatargas II 5
Qatargas II 4
Abu Al Bu Khoosh
Dolphin North Field
Al Khalij
Adco (Block 1 - Central Auh)
Block 6
Adma Central (Zakum)
Adma (Umm Lulu)
Qatargas I upstream
ABU DHABI
DUBAIAdma Central(Ummshaif-Nasr)
Adco(Block 2 - Southeast Auh)
TOTAL Partner
TOTAL Operator
100 km0 km
1
(1) TOTAL holds an indirect 4% stake in Petroleum Development Oman LLC, operator of Block 6, via its 10% stake in Private Oil Holdings Oman Ltd.(2) TOTAL has an indirect stake via Oman LNG’s stake in Qalhat LNG.

YEMEN
The Group’s production was 17 kboe / d in2015 compared to 84 kboe / d in 2014 and95 kboe / d in 2013.
Due to the further deterioration in thesecurity situation in the vicinity of itsBalhaf site, the company Yemen LNG ,in which the Group holds a 39.62%stake, decided to stop its commercialLNG production and export activities.The plant is in a preservation mode. As
a consequence of this situation, YemenLNG declared force majeure to itsvarious stakeholders in early April 2015.
The PSA of Block 10 (Masila Basin, EastShabwa permit, 28.57%, operator)expired in late December 2015, thelicense was returned to the Yemeniauthorities. TOTAL is a partner inBlock 5 (Marib basin, Jannah license,15%) and holds various stakes in fouronshore exploration licenses.
87– TOTAL Factbook 2015Upstream
OMAN
SAUDI ARABIA
U.A.E.
YEMEN
GULF OF ADEN
ARABIAN SEA
Mukhaizna(Block 53)
Block 6
Block 71 (Al Qarn)
E
DC
BJannah ABlock 72 (Al Ain)
Block 70Block 3 BALHAF
(Yemen LNG) TOTAL Partner
TOTAL Operator
200 km0 km
MIDDLE EAST ACREAGE
1
United Arab EmiratesQatar
OmanYemen
IraqSyria

IRAQ
The Group’s production in 2015 was 18 kboe / d compared to 12 kboe / d in 2014and 7 kboe / d in 2013.
On the Halfaya field in Missan province,following the completion of a negotiation inOctober 2014, TOTAL’s stake increasedfrom 18.75% to 22.5% in the consortiumthat was awarded the development andproduction contract. Production of phase 1of the project started in 2012 and phase 2started in 2014, enabling production toreach 200 kb / d in the second half of 2014.In 2015, amid low barrel prices, thecommencement of EPCC contracts(engineering, procurement, constructionand commissioning) of phase 3 of theproject (to increase production to 400 kb / d)was postponed.
In Iraqi Kurdistan, TOTAL holds stakes inseveral exploration blocks.
SYRIA
TOTAL has a 100% stake in the Deir Ez Zorlicense, which is operated by the jointventure company DEZPC in which TOTALand the state-owned company SPC eachhave a 50% share. Additionally, TOTAL isholder of the Tabiyeh contract which cameinto effect in 2009. The Group has had noproduction in the country sinceDecember 2011, when TOTAL suspendedits hydrocarbon production activities inSyria in compliance with the EU’sregulations regarding this country.
88 TOTAL Factbook 2015 – Upstream
Halfaya
Taza
Safen
Harir
IRAN
IRAQBAGHDAD
Baranan
TOTAL Partner
100 km0 km
TOTAL Operator
MIDDLE EAST ACREAGE United Arab EmiratesQatar
OmanYemen
IraqSyria

PRODUCTION
2015 2014 2013 2012 2011
Liquids production (Kb/d) 34 30 30 27 27Gas production (Mcf/d) 1,290 1,178 1,170 1,089 1,160
Total (Kboe/d) 258 238 235 221 231
MAIN START-UPS
Start-up Projects Type Capacity Share Op. Country (kboe/d)
2015 Gladstone LNG LNG 150 27.5% Australia2017+ Ichthys LNG LNG 344 30% Australia
TOTAL’S PRODUCING ASSETS AS OF DECEMBER 31, 2015(1)
Year of entry Operated Non-operated into the country (Group share in %) (Group share in %)
Asia-Pacific
Australia 2005 Various fields in UJV GLNG (27.50%) (2)
Brunei 1986 Maharaja Lela Jamalulalam (37.50%)
China 2006 South Sulige (49.00%)
Indonesia 1968 Bekapai (50.00%) Handil (50.00%) Peciko (50.00%) Sisi-Nubi (47.90%) South Mahakam (50.00%) Tambora (50.00%) Tunu (50.00%) Badak (1.05%) Nilam-gas and condensates (9.29%) Nilam-oil (10.58%) Ruby-gas and condensates (15.00%)
Myanmar 1992 Yadana (31.24%)
Thailand 1990 Bongkot (33.33%)
(1) The Group’s interest in the local entity is approximately 100%.(2) TOTAL’s interest in the unincorporated joint venture.
89– TOTAL Factbook 2015Upstream
ASIA-PACIFIC ACREAGE
In 2015, TOTAL’s production in Asia-Pacific was
258 kboe/d
Representing
11%of the Group’soverall production

INDONESIA
The Group’s production was 147 kboe / din 2015 compared to 130 kboe / d in 2014and 131 kboe / d in 2013.
TOTAL’s operations in Indonesia areprimarily concentrated on the Mahakamlicense (50%, operator), which inparticular includes the Peciko and Tunugas fields. TOTAL also has a stake in theSisi-Nubi gas field (47.9%, operator). TheMahakam license expires inDecember 2017. The Indonesiangovernment has decided to allocate100% of the participating interest toPertamina (operator) from January 1,2018 onwards, while giving Pertamina thepossibility to farm-out a maximum interestof 30% to TOTAL and its current partner,INPEX. The Group delivers most of itsnatural gas production to the BontangLNG plant. These volumes of gasrepresented approximately 80% of theBotang plant’s supply in 2015. To this gas
production was added the operatedproduction of oil and condensates fromthe Handil and Bekapai fields.
– On the Mahakam license, the worksaimed at maintaining production on theTunu, Peciko, South Mahakam, Sisi-Nubi and Bekapai fields are ongoing.
– On the Sebuku (15%) license,production start-up of the Ruby gas fieldtook place in 2013, with a productioncapacity of approximately 100 Mcf / d.Production is routed via pipeline forprocessing and separation at theSenipah terminal (operated by TOTAL).
– TOTAL also holds stakes in twoexploration blocks: Mentawai (80%,operator) and Telen (100%).
– In addition, the Group holds stakes inblocks with no activity: Sadang (30%),Sageri (50%), Arafura Sea (24.5%),Amborip VI (24.5%), South Mandar(49.3%), South West Bird’s Head (90%,
operator) and South East Mahakam(50%, operator).
– Early in 2015, the Group sold its stakein the two coal bed methane (CBM)blocks located in the East Kalimantanprovince, Kutai II (18.4%) and KutaiTimur (50%).
THAILAND
The Group’s production was 62 kboe / d in2015 compared to 60 kboe / d in 2014 and63 kboe / d in 2013. This comes from theoffshore gas and condensates field ofBongkot (33.33%). PTT (Thai state-ownedcompany) purchases all of the natural gasand condensates production. Newinvestments are underway for maintainingthe plateau and responding to gasdemand.
90 TOTAL Factbook 2015 – Upstream
INDONESIA
JAVA SEA
MOLUCCASEA
CELEBES SEAKALIMANTAN
Mahakam North Area 1
Telen (Area III)Telen (Area IV)
SebukuSouth Mandar
South Sageri
South East Mahakam
Mahakam North Area 3Tengah
Telen (Area V)
Telen (Area VI)
Telen (Area I)Telen (Area II)
Mahakam North Area 2
MahakamSouth Area
TOTAL Partner
TOTAL Operator
500 km0 km
ASIA-PACIFIC ACREAGE IndonesiaThailandMyanmar
BruneiChinaAustralia
Papua New GuineaRest of Asia

MYANMAR
The Group’s production was 19 kboe / d in2015 compared to 17 kboe / d in 2014 and16 kboe / d in 2013.
The Yadana field (31.2%, operator),located on the offshore Blocks M5 and M6,primarily produces gas for delivery to PTT(Thai state-owned company) for use in Thaipower plants. The Yadana field alsosupplies the domestic market via twopipelines built and operated by MOGE, a Myanmar state-owned company. The LCP-Badamyar project, which includesthe installation of the Badamyar fieldcompression and development platformconnected to the Yadana facilities, waslaunched in September 2014.
In 2014, the Group was awarded the deepoffshore Block YWB (100%, operator)during the offshore round launched by thelocal authorities. The PSC was signed inFebruary 2015.
In October 2015, the Group sold its stakein the offshore Block M11 (47.06%) andentered in exploration license A6 (40%) inthe deep offshore area west of Myanmar. Afirst well was drilled in December 2015 onwhich a natural gas discovery has beenmade and is currently under evaluation.
BRUNEI
TOTAL operates the offshore Maharaja LelaJamalulalam gas and condensates fieldlocated on Block B (37.5%). The Group’sproduction was 15 kboe / d in 2015 as in2014 and compared to 13 kboe / d in 2013.The gas is delivered to the Brunei LNGliquefaction plant.
A study regarding the additionaldevelopment of the southern part of the
gas field (Maharaja Lela South) wascompleted in 2013. The project waslaunched in early 2014 with the signature ofthe majority of the contracts and the 20-yearextension on the existing license.Onshore, a first debottlenecking phase forthe production processing plant wascompleted in 2015, increasing productionby 20%. Offshore, the installation of a thirdplatform was completed at the end of 2015and the drilling campaign started inFebruary 2016. The first wells are expectedto be put into production in 2016.
Studies are currently being conducted toreassess the potential of the deep offshoreexploration Block CA1 (where TOTAL isoperator), which includes the Jagus East
discovery. Following the decision of twopartners to sell their interest in the block,TOTAL decided to exercise its preemptiveright, bringing its stake from 54% to86.9%. A well was drilled inNovember 2015, and has confirmed theconnection of the Jagus East field with theGumusut-Kakap reservoirs in Malaysia.Discussions of the terms of the unitizationare underway between the two countriesand an agreement should be reached in2016.
CHINA
TOTAL has been active since 2006 on theSouth Sulige Block, located in the OrdosBasin in the Inner Mongolia province. TheGroup’s production was 11 kboe / d in 2015compared to 12 kboe / d in 2014 and 8kboe / d in 2013. Following appraisal workby TOTAL, China National PetroleumCorporation (CNPC) and TOTAL agreed toa development plan under which CNPC isthe operator and TOTAL holds a 49%stake. This development plan wasapproved by the authorities in 2014. Thedrilling of development wells is ongoing.
In 2013, TOTAL signed a joint studyagreement with Sinopec for potential shalegas on the Xuancheng license (4,000 km²)near Nanjing. A 2D seismic survey wasperformed in 2014 and the drilling of anexploration well was done in 2015.
91– TOTAL Factbook 2015Upstream
BANGKOK
INDIAN OCEAN
MYANMAR
LAOSTHAILAND
CAMBODIA
VIETNAM
MALAYSIA
M6
A6
YWB
M5
SOUTH CHINA SEA
BRUNEI
MALAYSIA
Block B
Block CA1
BANDAR SERIBEGAWAN
TOTAL Partner
TOTAL Operator
300 km0 km
75 km0 km
TOTAL Operator
1
CHINA
YINCHUAN
South Sulige
TOTAL Partner
100 km0 km
ASIA-PACIFIC ACREAGE IndonesiaThailandMyanmar
BruneiChinaAustralia
Papua New GuineaRest of Asia

AUSTRALIA
In Australia, where TOTAL has had miningrights since 2005, the Group’s productionwas 4 kboe / d in 2015, 2014 and 2013.
– The Ichthys project (30%) involves thedevelopment of a gas and condensatesfield located in the Browse Basin. Thisdevelopment will include a floatingplatform designed for the production,processing and exportation of gas (CPF,Central Processing Facility), an FPSO(with condensate processing capacity of100 kb / d) to stabilize and export thecondensate, an 889 km gas pipeline andan onshore liquefaction plant (with 8.9Mt / y LNG and 1.6 Mt / y LPG capacities)at Darwin. The LNG has already beensold mainly to Asian buyers under long-term contracts. Production is expectedto start in 2017.
– Gladstone LNG (GLNG) (27.5%) is anintegrated gas production, transportationand liquefaction project of 7.2 Mt / ybased on the development of coal seamgas from the Fairview, Roma, Scotia andArcadia fields. The development of a firstupstream phase was completed with thestart of production of Fairview 3 and 4and Roma 2. Train 1 (3.6 Mt / y capacity)started production in September 2015and the first LNG cargo left GLNG forSouth Korea in October 2015. Thedevelopment of the liquefaction plantcontinues with the construction of train2, which is expected to start productionin 2016.
– The WA-492 and WA-493 licenses,located in the Carnarvon basin, wereawarded to TOTAL (100%, operator) in2013. A 2D seismic regional campaignbegan in January 2015.
– In 2012, TOTAL signed an agreement toenter into three shale gas explorationlicenses located in the South Georginabasin in the center of the country. In2013, a 2D seismic survey was acquiredon three licenses and a drilling campaignbegan in 2014 with two wells. Technicalstudies are ongoing.
PAPUA NEW GUINEA
In Papua New Guinea, where TOTAL hasbeen active since 2012, the Groupacquired in March 2014 a stake in BlockPRL-15 (40.1%). TOTAL became the
operator in August 2015. The State ofPapua New Guinea retains the right toenter on the license (when the finalinvestment decision is made) at amaximum level of 22.5%. In this case,TOTAL’s stake would be reduced to 31.1%.
Block PRL-15 includes the two discoveriesElk and Antelope, growth areas for theGroup. A delineation program of thesediscoveries is underway. The results of thefirst wells drilled have confirmed the level ofresources in the Elk and Antelope fields.TOTAL has also started developmentstudies in the Elk and Antelope fields,including on the construction of an onshoregas liquefaction plant. In July 2015, thelocation of the various production sites wasannounced to the authorities.
REST OF ASIA
TOTAL also holds interests explorationlicenses in Malaysia and the Philippines.
92 TOTAL Factbook 2015 – Upstream
AUSTRALIA
MILES
Roma
Arcadia
Fairview
Scotia
EAN
DARWIN
AUSTRALIA
Bonaparte
TIMOR SEA
Browse
Ichthys
WYNDHAM
TOTAL Partner
TOTAL Operator
250 km0 km
DARWIN
SYDNEY
GLADSTONE
1
2
ASIA-PACIFIC ACREAGE
1 2
PRL-15PAPUA NEW GUINEA
IndonesiaThailandMyanmar
BruneiChinaAustralia
Papua New GuineaRest of Asia
100 km0 km
TOTAL Partner
TOTAL Operator
100 km0 km
GLNG Upstream Licences

PRODUCTION
20 15 20 14 20 13 20 12 20 11
Liquids production (Kb/d) 47 50 54 59 71Gas production (Mcf/d) 588 599 627 682 648
Total (Kboe/d) 152 157 166 182 188
MAIN START-UPS
Start-up Projects Type Capacity Share Op. Country (kboe/d)
2016 Vega Pleyade Gas 70 37.5% x Argentina Incahuasi Gas 50 60% x Bolivia
2017+ Libra EWT Deep off. 50 20% Brazil
TOTAL’S PRODUCING ASSETS AS OF DECEMBER 31, 2015(1)
Year of entry Operated Non-operated into the country (Group share in %) (Group share in %)
South America
Argentina 1978 Aguada Pichana (27.27%) Aguada San Roque (24.71%) Aries (37.50%) Cañadon Alfa Complex (37.50%) Carina (37.50%) Hidra (37.50%) Kaus (37.50%)
Rincón de Aranda (45.00%) Sierra Chata (2.51%)
Bolivia 1995 San Alberto (15.00%) San Antonio (15.00%) Itaú (41.00%)
Venezuela 1980 PetroCedeño (30.32%) Yucal Placer (69.50%)
(1) The Group’s interest in the local entity is approximately 100%.
93– TOTAL Factbook 2015Upstream
SOUTH AMERICA ACREAGE
In 2015, TOTAL’s production in South America was
152 kboe/d
Representing
7%of the Group’soverall production

ARGENTINA
In Argentina, TOTAL operatedapproximately 30% (1) of the country’s gasproduction in 2015. The Group’sproduction was 72 kboe / d in 2015compared to 75 kboe / d in 2014 and 78kboe / d in 2013. From 2012, theArgentinean government concluded gasprice agreements with various producersunder which the government guaranteesthe price of gas for quantities above a fixedproduction level in exchange forcompliance with defined production targetsand applicable penalties (i.e., “deliver orpay”). In 2013, TOTAL signed anagreement of this type for a period of fiveyears with retroactive effect fromDecember 1, 2012.
– In Tierra del Fuego, the Group operatesthe Carina and Aries offshore fields(37.5%). A drilling campaign for twoadditional wells off the existing platformwas completed in 2015. The VegaPleyade field (37.5%, operator), wheredevelopment work was launched in2013 (with a production capacity of 350Mcf / d), started production inFebruary 2016.
– In the Neuquén basin, two pilot projectswere launched following positive initialresults of the drilling campaign on itsmining licenses in order to assess its gasand shale oil potential: one on theAguada Pichana Block (27.3%,operator) where production started mid-2015, and the other on the Rincón laCeniza Block (42.5%, operator).
94 TOTAL Factbook 2015 – Upstream
ARGENTINA
CHILE
USHUAIA
Vega-Pleyade
Hidra
Tauro Sirius
Canadon Alfa
Octans Pegaso
Ranquil Norte
La Escalonada
Aguada PichanaCerro Partido
San Roque
Argo
Cerro Las Minas
Pampa Las Yeguas II
Aguado de Castro
Carina
NEUQUEN
Leo
TOTAL Partner
TOTAL Operator
600 km0 km
2
1
SOUTH AMERICA ACREAGE ArgentinaVenezuelaBolivia
BrazilRest of South America
(1) Source: Department of Federal Planning, Public Investment and Services, Energy Secretariat.

95– TOTAL Factbook 2015Upstream
SOUTH AMERICA ACREAGE ArgentinaVenezuelaBolivia
BrazilRest of South America
Vega Pleyade.

96 TOTAL Factbook 2015 – Upstream
SOUTH AMERICA ACREAGE ArgentinaVenezuelaBolivia
BrazilRest of South America
VENEZUELA
In Venezuela, where TOTAL has beenactive since 1980, the Group’s productionwas 52 kboe / d in 2015 as in 2014 andcompared to 48 kboe / d in 2013. TOTALhas stakes in PetroCedeño (30.3%) andYucal Placer (69.5%) as well as the offshoreexploration Block 4 of Plataforma Deltana(49%).
Development of the extra heavy oil field ofPetroCedeño continues in the southernarea as in the main area (47 productionwells were drilled in 2015 compared to 86in 2014 and 43 in 2013), as well as thedebottlenecking project for the waterseparation and treatment facilities.
In the Yucal Placer field, following thesignature of an amendment to the gas salecontract, a new development phase was
launched in 2012. In April 2014, theproduction field has increased following thecommissioning of new clusters and thedebottlenecking of the existing gasprocessing train (production capacity of150 Mcf / d in 2015).
VENEZUELA
CARIBBEAN SEA
MARGARITAISLANDS
TRINIDADAND TOBAGO
PORT OF SPAIN
PUERTO LA CRUZ
Cocuina (Block 4)
Petrocedeño
Yucal Placer South
Yucal Placer North
TOTAL Partner
200 km0 km

97– TOTAL Factbook 2015Upstream
BOLIVIA
The Group’s production, mainly gas, was28 kboe / d in 2015 compared to 30 kboe / din 2014 and 28 kboe / d in 2013.
TOTAL is active on seven licenses: threeproduction licenses at San Alberto (15%),San Antonio (15%) and Block XX TarijaOeste (41%); two licenses in developmentphase , Aquio and Ipati (60%, operator);and two exploration phase licenses, RioHondo (50%) and Azero (50%, operator ofthe exploration phase).
– Following the discovery of the Incahuasigas field, located in the Ipati Block,TOTAL was granted approval by theauthorities to launch the firstdevelopment phase of the project,including the connection of three wellsalready drilled in a 6.5 Mm³ / d capacityprocessing plant. The project isexpected to start production mid-2016.In mid-2014, TOTAL reduced its stake inAquio and Ipati from 80% to 60%.
– In 2013, TOTAL acquired a 50% stake inthe Azero exploration license located inthe Andean foothills, which extends overan area of 7,800 km². The explorationperiod began in June 2014.
BOLIVIA
LA PAZ
SANTA CRUZ
Ipati Sur
Aquio
Azero
San Antonio(Sabalo)
Rio Hondo
Bloc XX Tarija Oeste(Itau)
San Alberto
TOTAL Partner
TOTAL Operator
200 km0 km
1
SOUTH AMERICA ACREAGE
Incahuasi.
ArgentinaVenezuelaBolivia
BrazilRest of South America

98 TOTAL Factbook 2015 – Upstream
SOUTH AMERICA ACREAGE ArgentinaVenezuelaBolivia
BrazilRest of South America
BRAZIL
In Brazil, a growth area for the Group,TOTAL acquired in 2013 a 20% stake inthe Libra field , located in the Santosbasin. The field is located in the ultra-deepoffshore (2,000 m) approximately 170 kmoff the coast of Rio de Janeiro and coversan area of 1,550 km². In 2014, a 50 kb / dcapacity boat was reserved for longduration production testing. In 2015, thedrilling of two wells was completed andone of two others started in the northwestand center of the field. The Group alsoholds stakes in 18 exploration licenses,following the 2015 acquisition of a 50%stake in Blocks P-M 1269, 1271, 1351 and1353 in the Pelotas basin.
REST OF SOUTH AMERICA
TOTAL also holds interests in explorationlicenses in Aruba, Columbia, FrenchGuiana and Uruguay.
RIO DE JANEIRO
BM-S-54
BM-C-14(Xerelete)
BC-2(Xerelete)
ES-M-671ES-M-669
ES-M-743
Libra
BELEM
Fortaleza
ATLANTIC OCEAN
BAR-M-346
FZA-M-125FZA-M-127
FZA-M-88FZA-M-86
FZA-M-57
CE-M-661
BRAZIL
TOTAL Partner
TOTAL Operator
200 km0 km
TOTAL Partner
TOTAL Operator
200 km0 km
1
2
1
2
3

PRODUCTION
2015 2014 2013 2012 2011
Liquids production (Kb/d) 48 39 28 25 27Gas production (Mcf/d) 308 285 256 246 227
Total (Kboe/d) 103 90 73 69 67
MAIN START-UPS
Start-up Projects Type Capacity Share Op. Country (kboe/d)
2015 Surmont Ph. 2 Heavy oil 118 50% Canada2017+ Fort Hills Heavy oil 180 29.2% Canada
TOTAL’S PRODUCING ASSETS AS OF DECEMBER 31, 2015(1)
Year of entry Operated Non-operated into the country (Group share in %) (Group share in %)
North America
Canada 1999 Surmont (50.00%)
United States 1957 Several assets in the Barnett Shale area (25.00%) (2)
Several assets in the Utica Shale area (25.00%) (2)
Chinook (33.33%), Tahiti (17.00%)
(1) Group’s interest in the local entity is approximately 100%.(2) TOTAL’s interest in the joint venture with Chesapeake.
99– TOTAL Factbook 2015Upstream
NORTH AMERICA ACREAGE
In 2015, TOTAL’s production in North America was
103 kboe/d
Representing
4%of the Group’soverall production

UNITED STATES
The Group’s production was 89 kboe / d in2015 compared to 78 kboe / d in 2014 and60 kboe / d in 2013.
– In the Gulf of Mexico, TOTAL holdsinterests in the deep offshore fields Tahiti(17%) and Chinook (33.33%).In 2015, the TOTAL (40%) – Cobalt(60%, operator) alliance, formed in 2009for exploration in the Gulf of Mexico,carried out further drilling to evaluate thesize of the North Platte discovery.
– TOTAL is also present in shale gasproduction in the United States throughits 25% stake in two joint venturesoperated by Chesapeake in the Barnett(Texas) and Utica (Ohio) basins. Drillingactivity in these basins was greatlyreduced in 2015 due to the decrease inthe price of gas and related liquids. InBarnett, four wells were drilled in 2015compared to 40 in 2014 and
approximately 60 in 2013. In Utica, thenumber of drilling rigs employed hasbeen reduced from nine to one in 2015and TOTAL participated in eight wellswith Chesapeake. In 2014,approximately 170 wells were drilled bythe joint venture and over 200 weredrilled in 2013.
The R&D stage oil shale projects (in situand ex situ production technology) in whichthe Group holds a stake (through theAmerican Shale Oil LLC, 55.7%, and the50 / 50 joint venture with the company RedLeaf Resources) including the developmentof the Red Leaf pilot, have been deferred.
100 TOTAL Factbook 2015 – Upstream
TEXAS
GULF OF MEXICO
Tahiti
Chinook
TOTAL Operator
200 km0 km
TOTAL Partner
TEXAS
Barnett Shales(JV Chesapeake)
FORT WORTH
DALLAS
AUSTIN
TOTAL Partner
Field or Discovery:
400 km0 km
OHIO
Utica Shales(JV Chesapeake)
WESTVIRGINIA
CLEVELANDTOLEDO
COLUMBUS
TOTAL Partner
Field or Discovery:
400 km0 km
1 2
1
2
NORTH AMERICA ACREAGE United StatesCanada

CANADA
The Group’s production was 14 kboe / d in2015 compared to 12 kboe / d in 2014 and13 kboe / d in 2013. This production comesentirely from TOTAL’s 50% stake in theSurmont project developed by SAGD1.Phase 2 of the project was commissionedin September 2015 and at the end of theramp-up in 2017, the project is expected tohave a total capacity of approximately150 kb / d (75 kb / d in Group share).Construction of the second oil sand projectin which TOTAL has a stake, the Fort Hillsmining project, has progressed on time andwithin budget. At a more than 50%completion rate as at the end of 2015,production from Fort Hills is expected tostart toward the end of 2017. As a result ofa full comparative analysis of its globalassets portfolio of in the context of thelower oil prices, the Group decided in 2015to reduce its exposure to Canadian oilsands. In November 2015,TOTAL sold10% of its 39.2% stake in the Fort Hillsproject to the operator, reducing its interestto 29.2%.
On the Joslyn (38.25%, operator) andNorthern Lights (50% operator) oil sandslicenses, the projects were suspended andworks have been strictly limited to legal andcontractual obligations, and maintainingsafety.
101– TOTAL Factbook 2015Upstream
CANADA
FORT MCMURRAY ALB
ER
TA
SA
SK
ATC
HE
WA
N
Northern Lights
Fort Hills
Joslyn
Emerillon
Surmont
McLelland
TOTAL Partner
TOTAL Operator
50 km0 km
1
NORTH AMERICA ACREAGE United StatesCanada
(1) Steam Assisted Gravity Drainage, production by injection of recycled water vapor.
Surmont.

This page was intentionally left blank.
102 TOTAL Factbook 2015 – Upstream

103– TOTAL Factbook 2015Refining & Chemicals
REFINING & CHEMICALS
4.9 B$adjusted net operating income
47,224employees
41%ROACE (businesssegment)
One of the leadingtraders of oil andrefined productsworldwide
2.2 MB/Drefiningcapacity atyear-end 2015
0.8 B$organicinvestments(2)
Among the world’s
10largest integratedproducers(1)
6.4 B$cash flow from operations
(1) Based on publicly available information, production capacities at year-end 2014.
(2) Organic investments = net investments, excluding acquisitions, divestments and other operations with non-controlling interests.

104 TOTAL Factbook 2015 – Refining & Chemicals
2016 OUTLOOK
The Refining & Chemicalssegment comprises…Refining, petrochemicals and specialty chemicalsoperationsTOTAL’s petrochemical operations areintegrated with its refining operations. The specialty chemicals businesses includeelastomer processing (Hutchinson) andelectroplating chemistry (Atotech).
Oil trading and shipping activities
Delivering 4 major projects in Lindsey, La Mède, Antwerp and Satorp
Focusingon major integrated platforms –Antwerp, Daesan, Normandy, Port Arthur, Qatar, Satorp
Expandingin growing regions and markets: – Evaluating a side-cracker in the United States and a crackerdebottlenecking in Qatar– Promoting Bio Fuels and Bio plastics
Enhancingoperational efficiency to reach ≥94%availability rate
Buildingsmart digital plants and integratingnew technologies in organizations

FINANCIAL HIGHLIGHTS
(in million dollars) 2015 2014 2013 2012 2011
Adjusted operating income (1) 5,649 2,739 1,766 1,873 848Adjusted net operating income (1) 4,889 2,489 1,857 1,768 1,173Contribution of Specialty Chemicals 496 629 583 491 590Gross investments (2) 1,843 2,022 2,708 2,502 2,659Organic investments (3) 827 1,944 2,530 2,094 2,373Divestments 3,488 192 365 392 3,492Cash flow from operations 6,432 6,302 4,260 2,726 2,987
(1) Adjusted results are defined as income at replacement cost, excluding non-recurring items, and excluding the impact of fair value changes.(2) Including acquisitions and increases in non-current loans.(3) Organic investments = net investments, excluding acquisitions, divestments and other operations with non-controlling interests.
OPERATIONAL HIGHLIGHTS (1)
(in kb / d) 2015 2014 2013 2012 2011
Distillation capacity Group share at year-end(2) 2,247 2,187 2,042 2,048 2,096Refinery throughput 1,938 1,775 1,719 1,786 1,863
(1) Including share of CEPSA until July 31, 2011 and share of TotalErg. Results for refineries in Africa, French Antilles and Italy are reported in the Marketing & Services segment.(2) Capacity data based on refinery process unit stream-day capacities under normal operating conditions, less the impact of shutdown for regular repair and maintenance activities
averaged over an extended period of time.
105– TOTAL Factbook 2015Refining & Chemicals

MAIN REFINING & CHEMICALS PLANTS AS OF DECEMBER 31, 2015
106 TOTAL Factbook 2015 – Refining & Chemicals
Lindsey
Grandpuits
VlissingenLeuna
Donges
La Porte,Texas
La Mède Lavéra
El Prat
Bayport,Texas
Carville,Louisiana
Feyzin
Carling
Feluy
Port Arthur,Texas
Normandy,France
Antwerp,Belgium
PetrochemicalsPlant
Refinery +Petrochemicals Complex
Refinery
Major integrated platforms

107– TOTAL Factbook 2015Refining & Chemicals
2.2 MB/DOF REFINING CAPACITYAT YEAR-END 2015
Dalian
Foshan
Ras Laffan
Ningbo
Qapco
Qatofin
RLOC Daesan,South Korea
Jubail,Saudi Arabia
Qatar
And worldwide specialty chemicals positions
Bostik sale completed on February 2, 2015.

108 TOTAL Factbook 2015 – Refining & Chemicals
TOTAL’s target to reduce European capacity by 20% is expected to be met byend 2016, one year ahead of schedule
Implementing the French refining roadmap presented in 2015
• In La Mède, TOTAL is investing to build the first French bio-refineryto meet the growing demand for biofuel in Europe, while endingcrude processing at the end of 2016.
• In Donges, TOTAL is adapting its refinery by building anintermediate feedstock desulfurization unit and an associatedhydrogen production plant. The production of lower sulfur contentproducts will enable Total to target more profitable markets.
Rejuvenating the Carling site
• Steam cracker shut down in October 2015.
• New hydrocarbon resin and polypropylene compoundproduction units are being built and are expected to becommissioned in 2016.
Enhancing competitiveness in the United Kingdom
• In the Lindsey refinery, the 5 Mt / y distillation capacity reduction plannedfor end 2016 and conversion capacity increase will improve thesite’s profitability. Its competitiveness will also benefit from logisticalimprovements and the simplification of the refinery organization.
Reinforcing major platforms
Modernizing Refining & Petrochemicals platform in Belgium
• The upgrade of the Antwerp integrated platform launched in 2013 is a key cash generation contributor in the mid-term.
• This project consists of two parts:
– the construction of new conversion units in response to theshift in demand towards lighter oil products with a very lowsulfur content (completion in 2016), and
– the construction of a new unit to convert part of thecombustible gases recovered from the refining process into rawmaterials for petrochemical units (start up in 2017).
Building on Saudi Arabia operational success
• Jubail refinery, fully operational since mid-2014, has reached its plateau of 400 kb / d capacity in 2015. A 10% capacitycreeping project is ongoing to maximize value out of the plant.
Focus
REFINING & CHEMICALS
ONGOING PROJECTS PAVING THE WAY TO FUTURE CASH GENERATION

REFINERY CAPACITY (GROUP SHARE)
As of December 31, 2015 (kb/d) Major upgrading plant capacity at 100% (1)
Total Group Group Cat Cat Hydro- Resid. Dist. Alky Isom Vis Coker Distillation Interest Capacity Crack Reform Cracking Hydro- Hydro-
Capacity Treat Treat
France Normandy, Gonfreville 247 100% 247 - 34 62 - 205 - - 21 -Provence, La Mède 153 100% 153 35 29 - - 121 - - 14 -Donges 219 100% 219 51 23 - - 126 7 - 26 -Feyzin 109 100% 109 29 11 - - 72 5 - 15 -Grandpuits 101 100% 101 31 14 - - 77 4 - 13 -
Total France 829 829 146 111 62 - 601 16 - 89 -
Rest of Europe United Kingdom, Immingham / Lindsey 207 100% 207 50 31 - - 140 7 - 20 -Netherlands, Vlissingen 148 55% 81 - 26 72 - 64 - - - -Belgium, Antwerp 338 100% 338 95 56 - 83 253 9 - 26 -Germany, Leuna 227 100% 227 59 25 - - 238 10 - 25 -Italy, Trecate (TotalErg) (2) 131 13% 17 35 - - - - - - - -
Total rest of Europe 1,051 870 239 138 72 83 695 26 - 71 -
United States Texas, Port Arthur (Refinery) 174 100% 174 75 38 - - 241 6 8 - 58Texas, Port Arthur (Condensate Splitter) (3) 60 40% 24 - - - - - - - - -
Total United States 234 198 75 38 - - 241 6 8 - 58
Africa Cameroon, Limbe 42 20% 8 - 8 - - 27 - - - -Côte d’Ivoire, Abidjan 76 25% 19 - 14 17 - 33 - - - -Gabon, Port Gentil 24 44% 11 - 2 - - 6 - - 8 -Senegal, Dakar 24 20% 5 - 3 - - 5 - - - -South Africa, Sasolburg 105 18% 19 25 18 12 15 44 5 - - -
Total Africa 271 62 25 45 29 15 115 5 - 8 -
Asia & Middle East China, Dalian 219 22% 49 55 15 29 41 119 - - - -Korea, Daesan (4) 158 50% 79 - - - - - - - - -Qatar, Ras Laffan 155 10% 15 - - - - 132 - - - -Saudi Arabia Jubail 386 38% 145 31 61 111 - 272 12 - - 99
Total Asia 917 288 86 76 140 41 523 12 - - 99
Worldwide crude distillation 3,302 2,247 571 408 303 139 2,175 65 8 168 157
(1) Cat Crack: Catalytic Cracking; Cat Reform: Catalytic Reforming; Resid Hydrotreat: Residual Hydrotreating; Dist Hydrotreat: Distillate Hydrotreating; Alky: Alkylation; Isom: C5 / C6Isomerization; Vis: Visbreaker.
(2) In October 2010, TOTAL Italy merged with Erg to create the new company TotalErg – TOTAL holds 49% of TotalErg.(3) Condensates Splitter held by the joint venture BFLP (40% TOTAL, 60% BASF and TOTAL operator) and included in the refining capacities from 31th December 2015.(4) Condensates Splitter held by the joint venture HTC (50% TOTAL, 50% Hanwha and HTC operator) and included in the refining capacities from 31th December 2015.
DISTILLATION CAPACITY (GROUP SHARE)(1)
Capacity, throughput and production data include equity share of refineries in which the Group holds a direct or indirect interest:
As of December 31, (kb / d) 20 15 20 14 20 13 20 12 20 11
France 829 829 829 829 829Rest of Europe 870 907 907 913 958United States and French West Indies (2) 198 178 178 178 178Asia & Middle East (3) 288 209 64 64 64Africa 62 64 64 64 67 (4)
Total 2,247 2,187 2,042 2,048 2,096
(1) Capacity at the end of the year. Includes share of CEPSA until July 31, 2011, and share of TotalErg. Results for refineries in Africa, French Antilles and Italy are reported in theMarketing & Services segment.
(2) Including from December 31, 2015, TOTAL share in BTP Condensate Splitter (40%) in United States.(3) Including TOTAL share (50%) in HTC Condensate Splitter in Korea from December 31, 2015.(4) TOTAL share in NATREF adjusted from 36.36% to 18.22%.
109– TOTAL Factbook 2015Refining & Chemicals

REFINERY THROUGHPUT (GROUP SHARE)(1)
Capacity, throughput and production data include equity share of refineries in which the Group holds a direct or indirect interest:
(kb / d) 2015 2014 2013 2012 2011
France 674 639 647 657 732Rest of Europe 849 794 797 866 885United States and French West Indies 204 188 178 182 148Asia & Middle East 157 105 48 33 32Africa 54 49 50 48 66
Total 1,938 1,775 1,719 1,786 1,863
(1) Includes share of CEPSA until July 31, 2011, and share of TotalErg. Results for refineries in Africa, French Antilles and Italy are reported in the Marketing & Services segment.
UTILIZATION RATE (BASED ON CRUDE AND OTHER FEEDSTOCKS)(1)(2)
(%) 2015 2014 2013 2012 2011
France 81 77 78 82 91Rest of Europe (3) 94 88 87 88 78Americas 115 106 100 99 81Asia & Middle East 75 50 75 67 67Africa 84 77 78 75 80
Average 89 81 84 86 83
(1) Including equity share of refineries in which the Group has a stake.(2) (Crude + crackers’ feedstock) / distillation capacity at the beginning of the year (2014: SATORP refinery’s capacity considered as from January 1).(3) Including CEPSA until end-July 2011 and TotalErg. For CEPSA in 2011: calculation of the utilization rate based on production and capacity prorated on the first seven months of the year.
UTILIZATION RATE (BASED ON CRUDE ONLY)(1)(2)
(%) 2015 2014 2013 2012 2011
Average 86 77 80 82 78
(1) Including equity share of refineries in which the Group has a stake.(2) Crude / distillation capacity at the beginning of the year (2014: SATORP refinery’s capacity considered as from January 1).
PRODUCTION LEVELS (GROUP SHARE)(1)
The table below sets forth by product category TOTAL’s net share of refined quantities produced at the Group’s refineries(1).
(kb / d) 2015 2014 2013 2012 2011
LPG 55 51 52 51 50Motor gasoline 346 344 340 351 350Avgas, jet fuel and kerosene 172 148 146 153 158Diesel fuel and heating oils 812 787 739 734 804Fuel oils 129 134 133 160 179Lubricants 17 20 18 11 15Bitumen 31 29 33 30 34Other products 284 229 219 246 236
Total 1,846 1,742 1,680 1,736 1,826
(1) For refineries not 100% owned by TOTAL the production shown is TOTAL’s equity share of the site’s overall production.
110 TOTAL Factbook 2015 – Refining & Chemicals

MAIN PETROCHEMICALS PRODUCT GROUPS AND THEIR MAJOR APPLICATIONS
Main product groups Major applications
Base PetrochemicalsOlefins
Ethylene Production of polyethylene, vinyl chloride monomer, styrene, functional polymers and copolymers, ethylene oxide, glycols and vinyl acetate monomer.
Propylene Production of polypropylene, acrylic acid, oxo-alcohols, propylene oxide, glycols, cumene and acrylonitrile.Butadiene Production of rubber, polybutadiene, elastomers, latex and ABS.
AromaticsBenzene Production of styrene, cyclohexane, chlorobenzenes, cumene, aniline, alkylbenzenes and maleic anhydride.Styrene Production of polystyrene, expanded polystyrene, ABS, emulsions, resins, latex and rubbers.Toluene Production of chemical intermediates and solvents.Xylenes Production of phthalic anhydride, terephthalic acid (PTA) and solvents.
PolymersPolyethylene Flexible and rigid packaging, cables, pipes and tubes, molded bottles, fuel tanks artificial grass and caps
and closures.Polypropylene Flexible and rigid packaging, containers, automotive parts, household and sanitary goods, fibers, medical,
pipes and caps and closures.Polystyrene Food packaging, refrigeration appliances, insulation boards and television sets.
MAIN PRODUCTION CAPACITIES AT YEAR-END(1)
2015 2014 2013 2012 2011
(in thousands Europe North Asia and World World World World Worldof tons) America Middle East(2)
Olefins (3) 4,384 1,525 1,525 7,433 7,791 7,654 8,039 7,097Aromatics (4) 2,903 1,512 2,368 6,783 6,773 5,635 5,795 5,730Polyethylene 1,120 445 773 2,338 2,338 2,289 2,239 2,094Polypropylene 1,350 1,200 400 2,950 2,950 2,895 2,875 2,835Polystyrene 637 700 408 1,745 1,805 1,530 1,595 1,555Others (5) - - 63 63 63 63 358 358
Total 10,394 5,382 5,536 21,312 21,720 20,065 20,900 19,668
(1) Excluding inter-segment sales.(2) Including interests in Qatar, 50% of Hanwha Total Petrochemicals Co. Ltd and 37.5% of SATORP in Saudi Arabia.(3) Ethylene + Propylene + Butadiene.(4) Including monomer styrene.(5) Mainly Monoethylene Glycol (MEG) and Cyclohexane.
SALES BY GEOGRAPHIC AREA – PETROCHEMICALS PRODUCTS(1)
(%) 2015 2014 2013 2012 2011
France 13% 15% 18% 21% 24%Rest of Europe 41% 39% 40% 45% 44%North America 34% 33% 28% 22% 20%Rest of world 12% 13% 14% 12% 12%
Total 100% 100% 100% 100% 100%
(1) Excluding inter-segment sales and sales by equity affiliates and including fertilizers sales.
111– TOTAL Factbook 2015Refining & Chemicals

MAIN SPECIALTY CHEMICALS PRODUCT GROUPS AND THEIR MAJOR APPLICATIONS
Main product groups Major applications
Elastomer processing Elastomer parts for the automotive, transportation and aerospace industries: transmission systems, antivibration systems, fluid transfer parts, body sealings, precision sealing (Hutchinson).
Adhesives Adhesives and sealants for construction, packaging, transportation, hygiene and assembly markets (Bostik)(1).
Electroplating General metal finishing, electronics materials and semiconductors, green technologies chemistry and systems (Atotech).
(1) Bostik sale to Arkema completed on February 2, 2015.
SALES BY ACTIVITY – SPECIALTY CHEMICALS PRODUCTS
(in million dollars) 2015 2014 2013 2012 2011
Hutchinson 4,256 4,599 4,351 4,066 4,161Bostik (1) 155 2,043 1,999 1,990 1,989Atotech 1,093 1,261 1,175 1,240 1,243
(1) Bostik sale to Arkema completed on February 2, 2015.
SALES BY GEOGRAPHIC AREA – SPECIALTY CHEMICALS PRODUCTS(1)(2)
(%) 2015 2014 2013 2012 2011
France 14% 14% 15% 16% 15%Rest of Europe 35% 35% 34% 33% 33%North America 26% 24% 24% 24% 28%Rest of world 25% 27% 27% 27% 24%
Total 100% 100% 100% 100% 100%
(1) Excluding inter-segment sales.(2) The Cray Valley coating resins and Sartomer photocure resins businesses were divested in July 2011. The structural and hydrocarbon resins business lines were kept and have been
incorporated into the Petrochemicals division as of January 1, 2012.
SALES BY ACTIVITY– SPECIALTY CHEMICALS PRODUCTS(1)
(%) 2015 2014 2013 2012 2011
Elastomer processing 77% 58% 58% 56% 44%Resins (2) - - - - 22%Adhesives (3) 3% 26% 27% 27% 21%Electroplating 20% 16% 16% 17% 13%
Total 100% 100% 100% 100% 100%
(1) Excluding inter-segment sales.(2) The Cray Valley coating resins and Sartomer photocure resins businesses were divested in July 2011. The structural and hydrocarbon resins business lines were kept and have been
incorporated into the Petrochemicals division as of January 1, 2012.(3) Bostik sale to Arkema completed on February 2, 2015.
112 TOTAL Factbook 2015 – Refining & Chemicals

113– TOTAL Factbook 2015Marketing & Services
MARKETING & SERVICES
16,023service-stations
1.7 B$adjusted net operating income
1,818kb/dof refined products sales (5)
28,398employees
(1) Data published by the companies based on quantities sold in 2014.
(2) Organic investments = net investments, excluding acquisitions, divestments and other operations with non-controlling interests.
(3) PFC Energy and Company data 2014.
(4) Including via national distributors.
(5) Excluding trading and refinery bulk sales, including share of TotalErg.
N°1marketer in Africa (3)
2.3 B$cash flow from operations
Among the largestmarketers in Western Europe (1)
Products & servicesmarketed in more than
150 (4)
countries
1.6 B$organicinvestments (2)

114 TOTAL Factbook 2015 – Marketing & Services
2016 OUTLOOK
Growingwhile maintaining high profitability
Expanding retail network:+6% growth in 2014-2015
Developing high return lubricants worldwide: +3% growth in 2014-2015
Consolidatingpositions in Europe and growing in Africa and the Middle East
Becomingthe partner of choice
Innovatingin products and services
Investing500 M$ in New Energies
The Marketing & Services segment comprises…Marketing & ServicesThe Marketing & Services (M&S) businesssegment is dedicated to the developmentof TOTAL’s oil products distributionactivities and related services throughoutthe world. M&S conveys TOTAL’s brandimage to its customers, both private andprofessional, through a large retail networkand the distribution of a wide range ofproducts from its refineries and other facilities.TOTAL is among the key players in thespecialty products market, in particular forlubricants, LPG, jet fuel, special fluids,bitumen and marine fuels. TOTAL alsooffers numerous services for consumersand professionals in the mobility, residentialand industrial sectors.
New EnergiesTOTAL focuses on two main developmentaxes: solar energy, a high-growth market in which the Group is positioned among the leaders through SunPower (1) and thetransformation of biomass throughbiotechnology which aims to develop new biosourced product solutions fortransportation and chemicals.
In addition, TOTAL actively followsdevelopments in other renewable energies.
(1) Listed on Nasdaq.
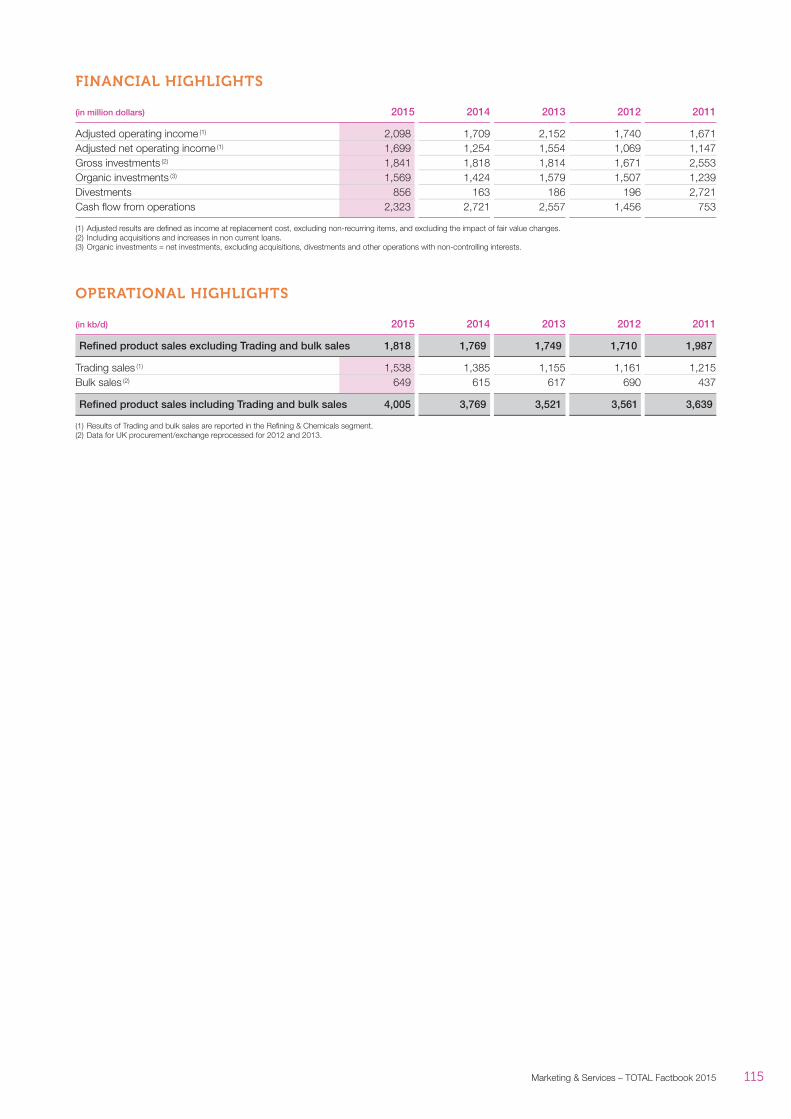
FINANCIAL HIGHLIGHTS
(in million dollars) 20 15 20 14 20 13 20 12 20 11
Adjusted operating income (1) 2,098 1,709 2,152 1,740 1,671Adjusted net operating income (1) 1,699 1,254 1,554 1,069 1,147Gross investments (2) 1,841 1,818 1,814 1,671 2,553Organic investments (3) 1,569 1,424 1,579 1,507 1,239Divestments 856 163 186 196 2,721Cash flow from operations 2,323 2,721 2,557 1,456 753
(1) Adjusted results are defined as income at replacement cost, excluding non-recurring items, and excluding the impact of fair value changes.(2) Including acquisitions and increases in non current loans.(3) Organic investments = net investments, excluding acquisitions, divestments and other operations with non-controlling interests.
OPERATIONAL HIGHLIGHTS
(in kb/d) 20 15 20 14 20 13 20 12 20 11
Refined product sales excluding Trading and bulk sales 1,818 1,769 1,749 1,710 1,987
Trading sales (1) 1,538 1,385 1,155 1,161 1,215Bulk sales (2) 649 615 617 690 437
Refined product sales including Trading and bulk sales 4,005 3,769 3,521 3,561 3,639
(1) Results of Trading and bulk sales are reported in the Refining & Chemicals segment.(2) Data for UK procurement / exchange reprocessed for 2012 and 2013.
115– TOTAL Factbook 2015Marketing & Services

116 TOTAL Factbook 2015 – Marketing & Services
EUROPE 9,154(incl. AS24
AFRICA 4,058
AMERICAS 464
Retail network
Participation in refineries
Retail network (excluding AS24), wholesale and specialty products
Direct presence in specialty products(1)
Main blending plants
(1) Lubricants - LPG - jet fuel - special fluids - bitumen -heavy fuels - marine fuels - additives and special fuels.
MARKETING & SERVICES POSITIONS AS OF DECEMBER 31, 2015

117– TOTAL Factbook 2015Marketing & Services
4)
MIDDLE EAST 816
ASIA - PACIFIC 1,531
WORLD 16,023(including AS24)

Expanding our retail network
M&S has a large footprint in retail with presence in 65 countries (7 in Europe, 43 in Africa and the Middle East, 6 in the Americasand 9 in Asia) and achieved network growth of 6% in 2015. In Africa,TOTAL is the number one retail player with an average retail marketshare of 18% in 2015. Its network is also one of the largest inWestern Europe with presence in key markets (France, Germany,Benelux, Italy).
M&S continues to develop its retail activities through:
• Organic growth. In Europe, M&S has increased its averagemarket share by 3% in France since Total Access, a low-price / high quality fuel concept, was launched, and gained 1%market share in Germany in the last two years.
• Bolt-on acquisitions. M&S has secured significant assets indynamic regions: the acquisition of the Chevron retail network inPakistan was finalized in 2015, adding around 500 stations to anexisting retail network of nearly 300 sites. In the Caribbean, M&Sacquired a 70% stake in the leading fuel retailer in the DominicanRepublic in 2016, strengthening its footprint in the region.
• A modern and attractive new concept of service stations.A new image, alongside a range of services selected for drivers’convenience, such as food, shops, and car washing facilities,enable the service station to provide a pleasant experience tocustomers. Available in 42 countries, Total’s mobile applicationallows customers to stay connected with Total.
• High quality innovative and alternative fuels. The new TotalExcellium, which enhances vehicles’ performance by protectingengines from grime and deposits, was launched in 2015.Preparing for evolving trends in consumption, Total is alreadytesting gas, electricity and hydrogen as transport fuels in aselection of countries.
Lubricants: a global and profitable business
Lubricant sales grew by 3% in 2015. TOTAL aims to continueoutpacing market growth.
• Lubricant demand is expected to be driven by the Asia-Pacificregion. Total’s new blending plant in Singapore, inaugurated in2015, is well set to capture this growing demand. With acapacity of 310 kt per year, the plant is Total’s largest.
• TOTAL continues to create new partnerships to leverage itslubricants brand. In 2015, Total Lubricants signed a new after-marketpartnership with Tata Motors to supply high performance lubricantsacross Tata Motors sales & service points in the global market.
• Through its efforts in R&D, TOTAL is able to provide qualitylubricants to its customers, including fuel economy engine oilsand biodegradable oils.
Expanding specialties worldwide
With the ambition to become the partner of choice and proximityfor its clients, Total invests in its production tools and develops newoffers and services:
• TOTAL has selectively strengthened its position in LPG throughacquisitions in Tunisia, South Africa and Vietnam, where Total hasbecome the second largest LPG player in the market.
• TOTAL has started up a special fluid production plant nearHouston, USA, in early 2016.
• Through the introduction of an online portal for professionals tobuy their bitumen at fixed prices in France, Total is helping itsclients control their expenses in case of sudden changes in price.
118 TOTAL Factbook 2015 – Marketing & Services
Focus
MARKETING & SERVICESExpanding highly profitablebusiness in growth-driven regions

PETROLEUM PRODUCT SALES (EXCLUDING TRADING AND BULK SALES)
By geographic area(kb / d) 2015 2014 2013 2012 2011
Europe France 541 547 575 566 574United Kingdom 27 26 27 26 115Benelux 214 214 211 226 231Germany 192 195 205 207 214Italy (1) 81 76 77 89 95Spain (2) 1 1 1 1 163Portugal (2) - - - - 9Rest of Europe 36 41 43 45 54
Total Europe 1,092 1,100 1,139 1,160 1,455
Africa Northern Africa 118 108 56 56 56Western Africa 85 82 78 76 70Eastern Africa 89 72 69 56 53Southern Africa 87 73 69 66 69Central Africa 31 30 33 32 32Other (3) 13 15 21 21 24
Total Africa 423 380 326 307 304
Americas United States 28 29 37 3 3Caribbean Islands 35 42 41 42 45Latin America 7 7 8 8 8
Total Americas 70 78 86 53 56
Middle East Jordan, Lebanon, Turkey and others 85 77 54 55 51
Total Middle East 85 77 54 55 51
Asia-Pacific East Asia 124 107 118 108 93Pacific 9 12 10 10 10Indian Ocean islands 15 15 17 17 18
Total Asia-Pacific 148 134 144 135 121
Total Worldwide 1,818 1,769 1,749 1,710 1,987
(1) From October 1, 2010, TOTAL Italy merged with Erg to create TotalErg – TOTAL holds 49% of TotalErg.(2) On July 31, 2011, TOTAL sold its 48.83% share in CEPSA.(3) Represents supply to African non consolidated group companies and third parties.
By main products(1)
(kb / d) 2015 2014 2013 2012 2011
LPG (2) 70 86 88 91 103Motor gasoline 332 312 277 275 327Avgas and jet fuel 243 228 246 215 238Diesel fuel and heating oils 1,018 995 980 956 1,050Fuel oils 42 39 45 65 121Lubricants and base oil 39 37 37 38 40Solvents 14 15 15 15 24Bitumen 45 40 45 43 57Other products 15 17 16 12 27
Total 1,818 1,769 1,749 1,710 1,987
(1) Including TOTAL’s share in CEPSA until July 31, 2011 and in TotalErg since October 1, 2010.(2) Sale of Totalgaz since May 29, 2015.
119– TOTAL Factbook 2015Marketing & Services

SERVICE-STATIONS(1)
As of December 31, 2015 2014 2013 2012 2011
Europe France 3,667 3,727 3,813 3,911 4,046Benelux 928 922 923 931 929Germany 1,178 1,157 1,122 1,108 1,091Italy (1) 2,608 2,749 3,017 3,161 3,355Poland 10 2 - - -AS24 Stations 763 740 731 700 615
Total Europe 9,154 9,297 9,606 9,811 10,036
Africa Northern Africa 673 653 585 490 470Western Africa 1,509 1,502 1,379 1,336 1,293Eastern Africa 882 866 845 841 836Southern Africa 592 587 578 588 528Central Africa 402 383 339 346 337
Total Africa 4,058 3,991 3,726 3,601 3,464
Americas Caribbean Islands 464 452 438 415 410
Total Americas 464 452 438 415 410
Middle East Jordan, Lebanon, Turkey 816 796 770 637 613
Total Middle East 816 796 770 637 613
Asia-Pacific East Asia 1,276 734 716 669 618Pacific 96 91 90 88 86Indian Ocean islands 159 208 205 204 207
Total Asia-Pacific 1,531 1,033 1,011 961 911
Total excluding AS24 15,257 14,829 14,820 14,725 14,819
Total Worldwide 16,023 15,569 15,551 15,425 15,434
(1) Including TotalErg service-stations. From October 1, 2010, TOTAL Italy merged with Erg to create TotalErg.
120 TOTAL Factbook 2015 – Marketing & Services

Total is investing for the long term in New Energies (Solar andBiofuels) because it believes in their future profitability. Therefore,the Group allocates around $500 million of capital expenditures peryear to high-tech, high-quality platforms for growth.
Solar: Worldwide Projects with our affiliate SunPower
More than 60 gigawatts have been deployed worldwide by thesolar photovoltaic industry in 2015. The global solar market isgrowing fast at more than 10% per year and the cost ofphotovoltaic solar continues to come down. In this environment,Total’s solar affiliate SunPower takes advantage of Total’sinternational footprint to develop new projects, providinggovernments, utilities, businesses and residential customers aroundthe globe with complete high-efficiency competitive solar solutions.
The U.S.: A Strong Presence
June 2015: SunPower completed construction of the 579 MWacSolar Star Project 1, the world’s largest photovoltaic solar powerplant, in Rosamond, California. SunPower designed and built thefacility, and now provides operations and maintenance services.Solar Star supplies enough electricity to power nearly 255,000Californian homes. SunPower also completed the construction ofQuinto 2, a 110 MWac solar farm and began building Henrietta 3(102 MWac), both in California.
South Africa: Solar power plant under construction
April 2015: Total and SunPower began building Prieska 4, a 75 MWacsolar power plant located in South Africa’s Northern Cape province.The plant is expected to be operational by mid-2016 and will powerapproximately 75,000 homes. This project was selected by SouthAfrica’s Department of Energy, as part of the third round of tendersfor renewable energy generation facilities.
121– TOTAL Factbook 2015Marketing & Services
Focus
NEW ENERGIES: TAKINGADVANTAGE OF FASTGROWING RENEWABLEENERGY MARKET
1 2
3 4

This page was intentionally left blank.
122 TOTAL Factbook 2015 – Marketing & Services

This brochure is printed on 100% recyclable and biodegradable coated paper, manufactured from ECF (Elemental Chlorine Free) bleached pulp in a European factory certified ISO 9001 (for its quality management), ISO 14001 (for its environmental management), CoC FEFC (for the use of paper from sustainably managed forests) and is EMAS-accredited (for its environmental performance).
Photo credits : © Clémentine Béjat / Objectif Images, © BHE Renewables, Eric Boideneau, © CAPA Pictures, © ConocoPhillips/ Steinar Haugen, Marco Dufour, © INPEX, Pavel Kotlyar, Michel Labelle, François Lacour, Pascal Laurent, Peter Livermore, Axel Mboko, Ramesh Menon, Guillaume Perrin,© Olivier Robinet, © Santos GLNG, Patrick Sordoillet, Dan Sorensen, © Sunpower, Ken Taylor, © Total, © Total Austral, Total E&P Bolivia, © Total E&PCanada, © Total E&P Congo, Total Upstream Nigeria, © Yamal LNG, Alexander Zamlianichenko Jnr.
Design and Production: Agence Marc Praquin
LONDON
TOTAL S.A.10 Upper Bank StreetCanary WharfLondon E14 5BFUnited KingdomPhone: +44 (0)207 7197 [email protected]
NORTH AMERICA
TOTAL American Services, Inc.1201 Louisiana Street, Suite 1800Houston, TX 77002 United StatesPhone: +1 (713) 483 [email protected]
TOTAL S.A.
Phone: +33 (0)1 47 44 45 46Share capital: 6,135,008,980 euros542 051 180 RCS Nanterre
YOU CAN ALSO DOWNLOAD THE FOLLOWING DOCUMENTS FROM WWW.TOTAL.COM
TOTAL INVESTOR RELATIONS CONTACTS
CONTACT

TOTAL S.A.Registered Office:2, place Jean Millier - La Défense 692400 Courbevoie - FranceShare capital: 6,135,008,980 euros542 051 180 RCS Nanterrewww.total.com
see you on
total.com


![2015 Honda Digital FactBook - Honda News & Pressnews.honda.com/newsandviews/local_news_content/[5147g]_Honda_… · 2015 Honda Digital FactBook ... America U.S.A. American Honda Motor](https://static.fdocuments.us/doc/165x107/5abcc7787f8b9a297f8e7fc4/2015-honda-digital-factbook-honda-news-5147ghonda2015-honda-digital-factbook.jpg)