2015 Economic and Fiscal Update · Fiscal Update 2015-16 Update The 2015 budget delivered on April...
8
Economic and Fiscal Update 2015
Transcript of 2015 Economic and Fiscal Update · Fiscal Update 2015-16 Update The 2015 budget delivered on April...

Economic and Fiscal Update2015

Current Global Economic EnvironmentThe global economy has yet to achieve robust and synchronized growth a full six years after emerging from the deepest post-war recession on record. Many of the world’s larger economies—both advanced and emerging market economies—have been unable to achieve consistently stronger momentum despite low interest rates and low inflation. As a result, global economic growth has fallen short of expectations in each of the past four years and this trend continued in 2015. At the beginning of 2015, the International Monetary Fund (IMF) was forecasting world GDP growth of 3.5%. As of October, this had been revised down to 3.1% with downward revisions to most of the world’s largest economies.
The dynamics of global growth are now changing. For several years, emerging economies, particularly China, were fuelling global growth. China’s recent efforts to redistribute growth from exports to domestic consumption are slowing its economic growth. This slower growth in China, combined with the recent declines in oil and mineral prices, is negatively impacting many commodity producing nations, particularly Brazil and Russia. On the other hand, the decline in oil prices is boosting consumption, especially in major oil importing countries. These factors are causing a realignment of economic growth. With modest, but improving growth occurring in the U.S. and Europe and strong growth continuing in India, these countries are now playing a larger role in global growth.
Looking forward to 2016, the IMF is forecasting acceleration in world GDP growth to 3.6%. Advanced economies are expected to record modest growth next year. In the emerging market economies, growth prospects generally appear set to improve as recessionary impacts recede in hard hit countries such as Russia and Brazil. However, growth in China is expected to continue to slow despite recent stimulus measures by the government and central bank.
Newfoundland and LabradorEconomic activity in Newfoundland and Labrador continued at high levels throughout 2015. Consumer and government spending as well as capital investment remained at levels similar to 2014. However, the export sector was negatively impacted by lower oil production and price. For the year as a whole, real final domestic demand is expected to be down slightly compared to 2014, while real gross domestic product (GDP) is forecast to decline by 2.6% due to lower exports.
Capital investment in the province remained at very high levels in 2015. Investment is expected to total $11.7 billion this year, down slightly from the record level of investment recorded in 2014. Higher spending on the Muskrat Falls development will be offset by lower spending on Vale’s nickel processing facility in Long Harbour and the Hebron oil project. Solid commercial and residential expenditures are also contributing to the high level of investment spending. Total residential spending (including renovations) is expected to be $1.5 billion this year, a decline from 2014 but still high in a historical context.
Employment, as measured by Statistics Canada’s Labour Force Survey (LFS), declined by 0.9% in the first 10 months of 2015 compared to the same period of 2014. However, other indicators of labour market activity depicted a more positive picture. Average weekly earnings rose by 3.1% in the first eight months of 2015 and at $1,015 were the second highest among provinces after Alberta. The increase in wages led to a 4.0% gain in total compensation of employees for the first six months of 2015.
2 2015 Economic and Fiscal Update

Economic Indicators Forecast (Calendar Year)Budget vs Fall 2015 and Latest 2016 Forecast (per cent change unless otherwise indicated)
Economic Indicators 2015 Budget 2015 Fall Change Budget vs Fall 2016 Fall
Real GDP -0.3 -2.6 -2.3 0.9
Household Income 0.2 1.3 1.1 1.4
Retail Sales -0.3 0.1 0.4 1.3
Consumer Price Index 1.0 0.3 -0.7 2.1
Housing Starts -9.6 -21.9 -12.3 -8.1
Capital Investment 1.8 -1.0 -2.8 -5.3
Employment -1.5 -0.6 0.9 -1.0
Unemployment Rate (%) 12.4 12.4 0.0 12.4
Population -0.2 -0.2 0.0 -0.3
OutlookWhile the long-term outook remains positive, in the short-term, the winding down of development of several major projects, in particular Hebron and Muskrat Falls, will lower investment over the next few years. Furthermore, low commodity prices have dampened short-term resource development and are expected to continue to do so. Taken together, these factors are expected to negatively impact capital investment expenditures in the province. Over the next several years, investment is forecast to decline from $11.7 billion in 2015 to $7.2 billion in 2018.
In 2016, higher oil and mining output will provide a boost to exports and this will translate into growth of 0.9% in real GDP. However, as Hebron and Muskrat Falls move closer to completion, a decline in capital investment is expected. This will result in lower employment. As well, low oil prices are dampening development activity in Western Canada and this will likely impact employment of some Newfoundland and Labrador residents who commute to Western Canada. These factors are forecast to dampen income and consumption growth. Consequently, final domestic demand (real terms) is expected to fall by 2.6%.
In 2017 and 2018, economic growth is expected to be constrained by declines in capital investment. Most main economic indicators are forecast to decline in these years.
While growth is expected to be challenged in the near term, it is important to note that it is happening at a point when incomes are the highest they have been in the province’s history. Following a sustained period of robust capital investment stemming from major project development, a period of retrenchment is expected.
2015 Economic and Fiscal Update 3
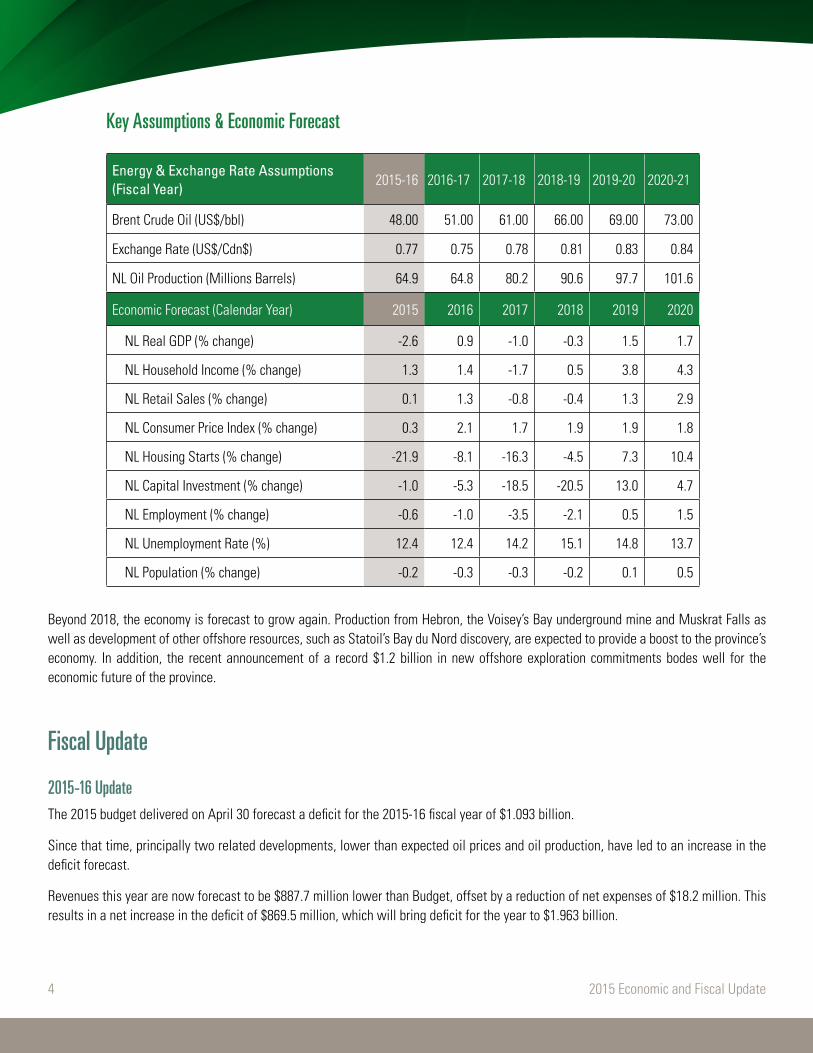
Key Assumptions & Economic Forecast
Energy & Exchange Rate Assumptions (Fiscal Year)
2015-16 2016-17 2017-18 2018-19 2019-20 2020-21
Brent Crude Oil (US$/bbl) 48.00 51.00 61.00 66.00 69.00 73.00
Exchange Rate (US$/Cdn$) 0.77 0.75 0.78 0.81 0.83 0.84
NL Oil Production (Millions Barrels) 64.9 64.8 80.2 90.6 97.7 101.6
Economic Forecast (Calendar Year) 2015 2016 2017 2018 2019 2020
NL Real GDP (% change) -2.6 0.9 -1.0 -0.3 1.5 1.7
NL Household Income (% change) 1.3 1.4 -1.7 0.5 3.8 4.3
NL Retail Sales (% change) 0.1 1.3 -0.8 -0.4 1.3 2.9
NL Consumer Price Index (% change) 0.3 2.1 1.7 1.9 1.9 1.8
NL Housing Starts (% change) -21.9 -8.1 -16.3 -4.5 7.3 10.4
NL Capital Investment (% change) -1.0 -5.3 -18.5 -20.5 13.0 4.7
NL Employment (% change) -0.6 -1.0 -3.5 -2.1 0.5 1.5
NL Unemployment Rate (%) 12.4 12.4 14.2 15.1 14.8 13.7
NL Population (% change) -0.2 -0.3 -0.3 -0.2 0.1 0.5
Beyond 2018, the economy is forecast to grow again. Production from Hebron, the Voisey’s Bay underground mine and Muskrat Falls as well as development of other offshore resources, such as Statoil’s Bay du Nord discovery, are expected to provide a boost to the province’s economy. In addition, the recent announcement of a record $1.2 billion in new offshore exploration commitments bodes well for the economic future of the province.
Fiscal Update
2015-16 Update The 2015 budget delivered on April 30 forecast a deficit for the 2015-16 fiscal year of $1.093 billion.
Since that time, principally two related developments, lower than expected oil prices and oil production, have led to an increase in the deficit forecast.
Revenues this year are now forecast to be $887.7 million lower than Budget, offset by a reduction of net expenses of $18.2 million. This results in a net increase in the deficit of $869.5 million, which will bring deficit for the year to $1.963 billion.
4 2015 Economic and Fiscal Update

RevenueThe largest impact on revenues since budget is lower offshore revenues, which remain vulnerable to unanticipated swings in the international market price of Brent crude. The other key variables are the volume of oil production, which also has been lower than expected, along with a modestly better US-Canadian dollar exchange rate. Government looks to a variety of sources to forecast these variables, sources independent of government like the major banks and other private sector forecasters. Generally, these forecasts were more optimistic about future oil prices at budget than actually unfolded during the year, and have since lowered their price forecasts looking forward.
The oil price assumption at budget of an average price of $62US a barrel for the fiscal year initially tracked the market price, as oil traded mostly in the $60-66US range until the end of the first quarter in June. The price drifted lower in July to the mid $50s, and in August to the low $40s. Since September it has traded mostly in a range between the mid $40s to the low $50s, until recently when oversupply in international markets has seen the Brent price fall to the $30s, its lowest price since the 2008-09 financial crisis.
The price forecast has been revised downward to reflect market developments over the year, with the price for the 4th quarter from January to March 2016 now expected to average $37US. Compared to expectations at budget that Brent crude would average $62US for the fiscal year, the average for the year is now expected to be $48US.
The impact of lower oil prices on revenues has been compounded by lower than expected oil production. At budget production was forecast to be 80.3 million barrels, but subsequent revisions have reduced the forecast by almost 20%, or 15.4 million barrels, to 64.9 million barrels.
The US-Canadian dollar exchange rate is now expected to average 76.6 cents for the year versus 80.0 cents at budget, which is positive for offshore revenues.
When the impacts of lower oil prices, lower production and a better exchange rate are combined, oil royalties for the fiscal year compared to budget are now revised downward from $1.2 billion to $551.8 million, a decrease of $659.8 million. This is the lowest oil royalties have been since 2006-07. From 2007-08 to 2014-15 oil royalties ranged between $1.5 billion and $2.8 billion, averaging $2.1 billion annually during this period.
2015 Economic and Fiscal Update 5
2015-16 Budget
2015-16Update Variance
Revenue 6,567.3 5,725.7 (841.6)
Net Income of Government Business Enterprises
409.1 363.0 (46.1)
Total Revenue 6,976.4 6,088.7 (887.7)
Gross Expenses:
Program Expenses 7,182.0 7,229.8 47.8
Debt Servicing Expenses 887.8 821.8 (66.0)
Total Expenses 8,069.8 8,051.6 (18.2)
Deficit (1,093.4) (1,962.9) (869.5)
Update 2015-16 ($ millions)

Revenues, other than offshore royalties, have also declined by a net $227.9 million, led by a decrease in corporate income tax of $103.2 million, reduced sales tax revenue of $58.6 million, and falling metal prices lowering mining tax revenues by $55.1 million, together with reductions in other revenues of $11.0 million.
Total revenues forecast for 2015-16 have fallen since budget from $6.976 billion to $6.089 billion, or by just over 12.7 per cent, and are now expected this year to be at their lowest level since 2006-07.
ExpensesCompared to revenues, total expenses are expected to show a modest improvement over budget of $18.2 million. A $45.5 million increase in pension and post retirement liabilities accounts for most of the $47.8 million increase in program expenses. This increase in program expenses is offset by a reduction in debt servicing costs of $66.0 million, primarily due to revised actuarial calculations relating to the pensions and other post-employment liabilities. The net effect of these changes is a reduction in forecast expenses of $18.2 million.
Fiscal Outlook
Fiscal Outlook ($ millions)
With independent forecasters generally lowering their expectations for the price of Brent crude, not only this year, but looking forward over the next five years, oil revenues will be lower than had been anticipated for this fiscal planning horizon. For the five year period 2016-17 to 2020-21, total revenues are forecasted to be about $6.6 billion less than previous estimates.
Over the same period, total expenses are forecast to be about $2.1 billion higher, attributable for the most part to increases in debt servicing costs, which grow to reflect the higher deficits.
Based on the current forecast, the combined impact of lower revenues and higher expenses will add over $10 billion to the deficit approximately during the 2016-17 to 2020-21 forecast.
These estimates are based on updated assumptions since budget. These forecasts do not account for any new actions that may be taken by government going forward in response to this current fiscal situation.
Government will soon be undertaking pre-budget consultations to get the views of the people of the province before the 2016 budget and before determining the fiscal plan for the medium or longer term.
6 2015 Economic and Fiscal Update
2015-16Update
2016-17Forecast
2017-18Forecast
2018-19Forecast
2019-20Forecast
2020-21Forecast
Total Gross Revenue 6,088.7 6,220.6 6,680.7 6,918.8 7,087.9 7,139.0
Gross Expenses:
Program Expenses 7,229.8 7,645.9 7,486.6 7,584.2 7,668.2 7,718.2
Debt Expenses 821.8 1,011.5 1,149.5 1,267.3 1,338.7 1,387.2
Total Gross Expenses 8,051.6 8,657.4 8,636.1 8,851.5 9,006.9 9,105.4
Deficit (1,962.9) (2,436.8) (1,955.4) (1,932.7) (1,919.0) (1,966.4)
Net Debt 12,436.2 15,056.0 17,199.3 19,215.4 21,078.5 22,947.6
Required Borrowing 2,400.0 3,700.0 3,000.0 2,500.0 1,800.0 2,000.0

Newfoundland and Labrador Economy2015
0.3%
Inflation
Unemployment Rate 12.4%
AVERAGE WEEKLY EARNINGS
$1,024Second highest among provinces Employed
237,100
Oil & Gas
28%of Provincial Economy
(2013)
GDP $30.34B
50
60
70
80
90
100
2010 2011 2012 2013 2014 2015
NL OIL PRODUCTION (millions of barrels)

Department of FinanceEconomics and Statistics BranchDepartment of Finance5 Mews PlaceP.O. Box 8700St. John’s, NLA1B 4J6