©2015, College for Financial Planning, all rights reserved. Session 11 Fundamental & Technical...
24
©2015, College for Financial Planning, all rights reserved. Session 11 Fundamental & Technical Analysis, Ratios, Anomalies CERTIFIED FINANCIAL PLANNER CERTIFICATION PROFESSIONAL EDUCATION PROGRAM Investment Planning
-
Upload
buck-elliott -
Category
Documents
-
view
214 -
download
0
Transcript of ©2015, College for Financial Planning, all rights reserved. Session 11 Fundamental & Technical...

©2015, College for Financial Planning, all rights reserved.
Session 11Fundamental & Technical Analysis, Ratios, Anomalies
CERTIFIED FINANCIAL PLANNER CERTIFICATION PROFESSIONAL EDUCATION PROGRAMInvestment Planning

Session Details
Module 5
Chapter(s)
2
LOs 5-3 Explain terminology and concepts associated with fundamental and technical analysis.
5-4 Relate fundamental and technical analysis concepts to modern portfolio theory principles.
5-6 Relate the impact of financial leverage to the financial performance of a company and to the valuation of a company’s stock.
11-2
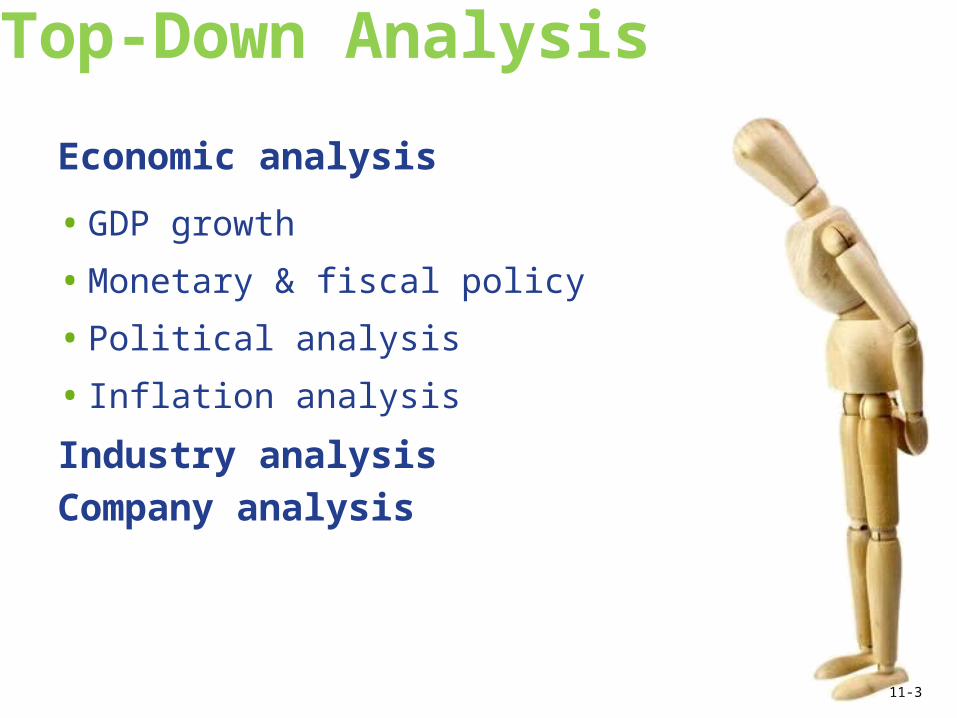
Top-Down Analysis
Economic analysis
• GDP growth
• Monetary & fiscal policy
• Political analysis
• Inflation analysis
Industry analysisCompany analysis
11-3

Industry Analysis
The growth and maturation of an industry
Output
Time to t1 t2 t3
Rapid
Growth
Dec
linin
g Gro
wth
Maturity
11-4

Bottom-Up AnalysisRatio analysis• Liquidity (current
and quick ratios)• Activity (inventory
turnover)• Profitability
(EBITDA)• Return on capital• LeverageCash flow analysis
Business analysis
11-5

Liquidity Ratios
Current ratio
Quick ratio (acid test)
sliabilitie Current
assets Current
sliabilitie Current
Inventory assets Current
11-6
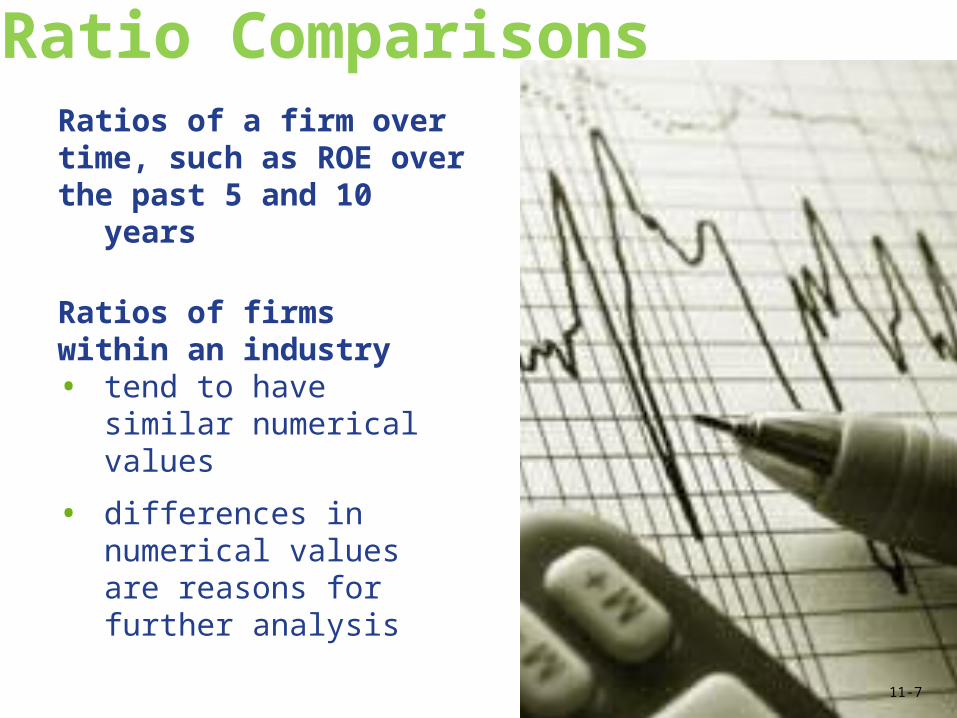
Ratio ComparisonsRatios of a firm overtime, such as ROE
over the past 5 and 10
years
Ratios of firms within an industry• tend to have similar
numerical values
• differences in numerical values are reasons for further analysis
11-7

Problems for Interpretation
• Different definitions for the same ratio
• Historical data may be outmoded
• Accounting changes alter financial statements
• Non-recurring items
11-8
Financial Leverage & the Return on Equity
• The use of debt financing (financial leverage)o may increase the return on equityo also increases financial risk
• Increased risk may offset the increased return on equity
11-9

Impact of Equity vs. Debt
Two companies, each raises $100M, one all equity, the other $50M equity and $50M debt.
What is the impact of $10M in earnings on ROE?
Company A: 10/100 = 10% ROE
Company B: 10/50 = 20% ROE
Example ignores interest charges and cost of borrowing
Company A Company B
Equity - Common Stock
$100M $50M
Debt - Corporate Bond
$0 $50M
Total Capitalization $100M $100M 11-10

Technical Analysis• Focus on the stock,
not on the company
• Interprets supply and demand for the stock
• Uses graphs of stock’s price movements and volume
11-11
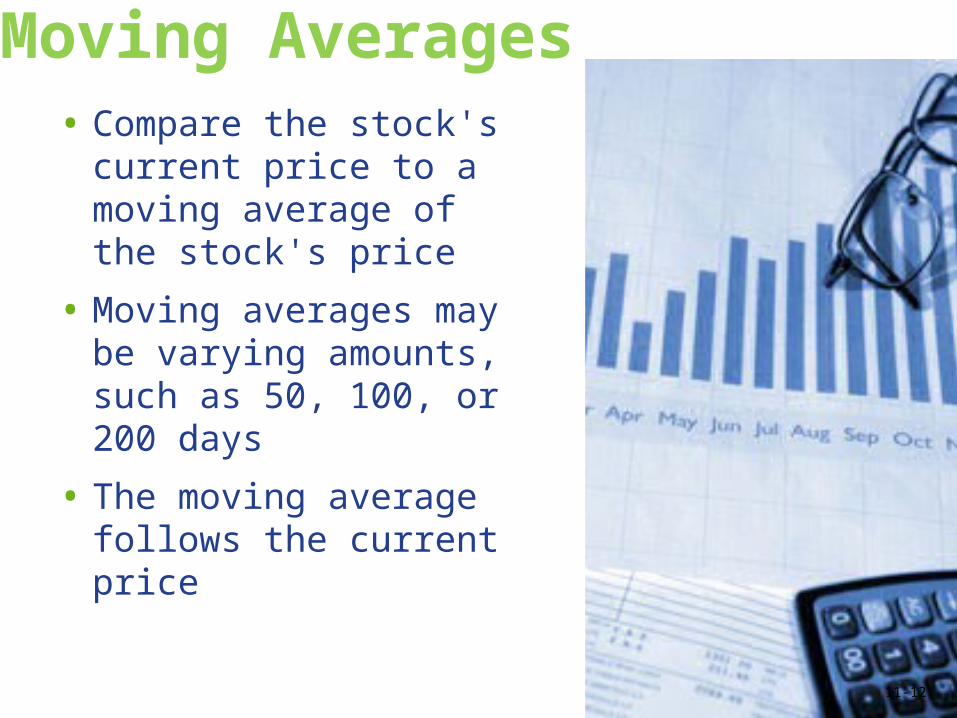
Moving Averages• Compare the stock's
current price to a moving average of the stock's price
• Moving averages may be varying amounts, such as 50, 100, or 200 days
• The moving average follows the current price
11-12
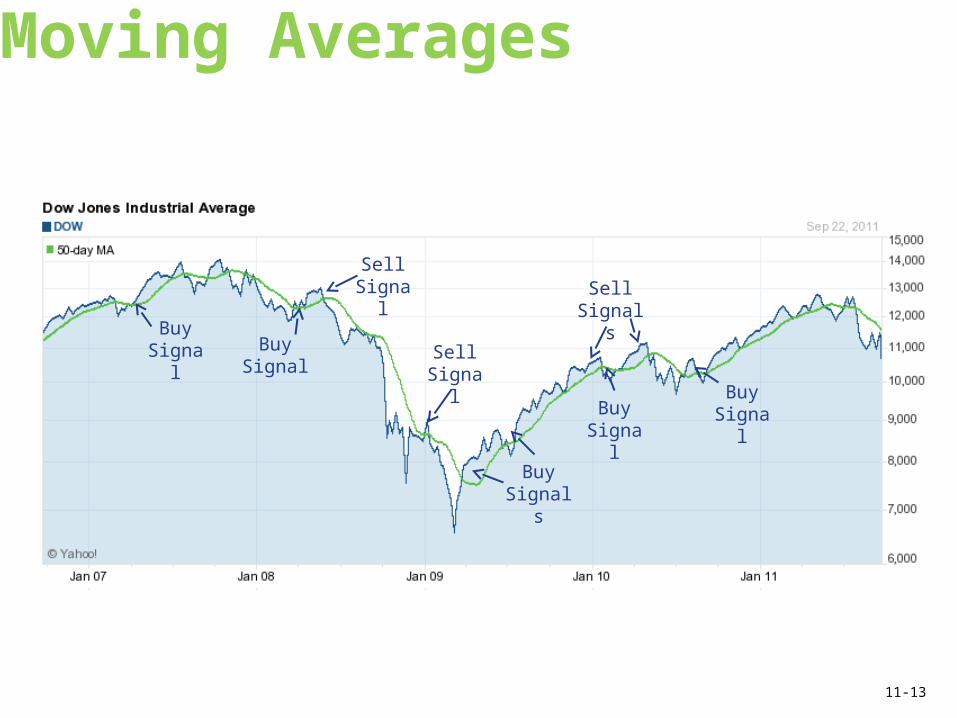
Moving Averages
Buy Signal
Sell Signals
Buy Signal
Buy Signals
Sell Signal
Buy Signal
Buy Signal Sell
Signal
11-13
Technical Trading Indicators
• Advance/decline line• Moving averages• Support and resistance levels• Mutual fund cash positions • Short sales by specialists• Short interest• Odd lot purchases• Investment advisory opinions • Put/call ratio• Barron’s Confidence Index
11-14
The Dow Theory• Emphasizes
movements in the industrial and transportation averages
• Movement in one average, confirmed by movement in the other average, indicates a trend
11-15

Dividend Growth Rate
Where: g = dividend growth rate ROE = return on equity RR = earnings retention rate
RRROEg
11-16

Constant Growth DDM
gr
DV
1
11-17

Growth Rate ExampleZarathustra Industries has assets of $300 million, and liabilities of $100 million. Zarathustra earned $25 million last year, and paid out $5 million in dividends. What is Zarathustra’s dividend growth rate?
$300M (assets) - $100M (liabilities) = $200M of equity$25M/$200M = .125 = 12.5% ROE
$25M (earnings) – $5M (dividends) = $20M in retained dividends
$20M/$25M = .80 Retention Rate (RR)
g = ROE x RR12.5 x .80 = 10%
11-18
Question 1
Your client has a mutual fund that had a 15% return last year, with a beta of .90. The risk-adjusted return of the fund isa. 13.50%.b. 15.00%.c. 16.67%.d. 17.25%.
11-19

Question 2
Fundamental analysis includes which of the following?I. computation of the current ratioII. comparison of a company’s PEG ratio to its
industry’s PEG ratioIII. computation of the company’s debt-to-equity
ratioIV. comparison of a company’s daily trading
volume to its historical volumea. I and II onlyb. I and III onlyc. I, II, and III onlyd. I, III, and IV onlye. I, II, III, and IV
11-20

Question 3
In designing and implementing an investment plan for a client, a planner who believes in the strong form of the efficient market hypothesis will use which one of the following combinations of analytical techniques?a. moving average analysis, industry analysis,
and weighted average returnsb. efficient frontier, correlation coefficients, and
weighted average returnsc. efficient frontier, industry analysis, and
company analysisd. technical analysis, fundamental analysis, and
correlation coefficients
11-21

Question 4
If a company payout ratio over the past five years has gradually declined from 50% to 25%, which one of the following statements summarizes the impact on the dividend growth model?a. The payout ratio has no impact on the
dividend growth model.b. The required return (“r”) in the dividend
growth equation will rise.c. The “g” in the dividend growth model may be
difficult to determine.d. The current dollar dividend amount will be
affected, but neither “r” nor “g” will be affected.
11-22

Question 5
Kaleidoscope Inc. has assets of $600 million and liabilities of $350 million. Earnings for the current year were $50 million, and the dividend payout ratio is 25%. What is the dividend growth for Kaleidoscope Inc.?a. 10%b. 15%c. 20%d. 25%
11-23

©2015, College for Financial Planning, all rights reserved.
Session 11End of Slides
CERTIFIED FINANCIAL PLANNER CERTIFICATION PROFESSIONAL EDUCATION PROGRAMInvestment Planning