2015 cahf yearbook-22.10.2015.compressed
256
HOUSING FINANCE IN AFRICA A review of some of Africa’s housing finance markets October 2015 Published by the Centre for Affordable Housing Finance in Africa 2015 YEARBOOK
-
Upload
maxine-ohenewaa-asiedu -
Category
Real Estate
-
view
43 -
download
0
Transcript of 2015 cahf yearbook-22.10.2015.compressed

HOUSING FINANCE IN AFRICA
A review of some of Africa’s housing finance markets
October 2015
Published by the Centre for Affordable Housing Finance in Africa
2015YEARBOOK

Copyright © Centre for Affordable Housing Finance in Africa, 2015All rights reserved.
The Centre for Affordable Housing Finance in AfricaPO Box 72624Parkview 2122South AfricaTel +27 11 447 9581Contact: Kecia RustMobile +27 83 785 4964Email [email protected] www.housingfinanceafrica.org
The Centre for Affordable Housing Finance in Africa (CAHF) is a not-for-profit company with a vision for an enabled affordable housing financesystem in countries throughout Africa, where governments, business, and advocates work together to provide a wide range of housing optionsaccessible to all. CAHF’s mission is to make Africa’s housing finance markets work, with special attention on access to housing finance for the poor.We pursue this mission through the dissemination of research and market intelligence, supporting cross-sector collaborations and a market-basedapproach. The overall goal of our work is to see an increase of investment in affordable housing and housing finance throughout Africa: moreplayers and better products, with a specific focus on the poor.
Our work covers four main areas: (1) understanding the housing asset, (2) monitoring housing sector performance, (3) exploring innovation inhousing finance, and (4) supporting housing finance market development.
Since its formation, the CAHF has come to be known as the most comprehensive and up to date source of information on housing finance inAfrica. Its research and other material is regularly used by investors, lenders, pension funds, and other financiers; legal practitioners, researchers andacademics; policy makers and other housing finance practitioners to scope and pursue the opportunities for extending access to housing financeacross Africa. As a thought leader in the sector, CAHF is a respected advocate for financial inclusion in housing finance in Africa. Our work isavailable on our website: www.housingfinanceafrica.org.
CAHF’s core funders are FSD Africa, the National Housing Finance Corporation (of South Africa), and the FinMark Trust.
Acknowledgements
This report was edited by Sireena Ramparsad. It represents the combined effort of people from all over the African continent, either as authors,reviewers, or respondents to our questionnaire. Sincere thanks are due to everyone for their contributions and insights.
Individual country and regional profiles were written and/or updated by, Josie McVitty (Algeria, Djibouti, and Libya), Shakrah Sadou (Burkino Faso,Cote d’Ivoire, Niger, Senegal, Liberia and UEMOA), Duncan Kayiira (Burundi, Uganda, South Sudan and the EAC region), Joachim Boko (Benin, Mali,and Togo), Carlson Ifughe (Cameroon and CEMAC region), Palesa Sematlane (Lesotho), Sabelo Mabuza (Swaziland), Dolapo Adejuyigbe andOlamide Udoma (Nigeria), Allan Kundu (Kenya), Zeinab Sayed (Egypt and the Northern Africa region), Azanga Katikia Henry and Joëlle Fotine(DRC), Janine Ampulire (Rwanda), Daniel Phiri (Zambia), Juana Hatfield (Mozambique, Ethiopia, The Gambia, Mauritania, Central African Republicand Eritrea), Sylvia Croese (Angola), Othata Batsetswe (Botswana), Laura Courbois - Imani Development (Malawi), Innocent Chirisa (Zimbabwe),Laverne Buya-Kamara (Sierra Leone), Ziad Sayah (Tunisia), Mounia Tagma (Morocco), Emmanual Kwaku Asamoah (Ghana), Vinson Hailulu (Namibia),Anna-Maria Shija (Tanzania), Manilall Seetohul (Mauritius, Comoros, Seychelles and Madagascar), Samuel Suttner (Chad and Cape Verde), MargaridaMoreira (Guinea-Bissau), Sireena Ramparsad and Kecia Rust (South Africa) and Sireena Ramparsad (Somalia and the SADC region). Allan Kunducollected the data for the tables in each country profile. Further thanks are extended to people who assisted in providing information or commentson the profiles: Adelaide Steedley; Kudakwashe Mativenga; Samuel Suttner; Kgomotso Tolamo; Aqualine Suliali; Oswald Urassa; Allan Cain; MohamedDubo of Datagrid Somalia; Stephen Wanjala; UN-Habitat Ethiopia; Manuela Graetz and the Housing Development and Government BuildingsBureau of the Ministry of Urban Development, Housing and Construction in Ethiopia. Kecia Rust wrote the introductory essay and SireenaRamparsad oversaw the project.
We are grateful for your insights and enthusiasm for this project, and very happy to have you all as part of our growing team of experts. TheYearbook would not have been possible without your input. The report has also drawn extensively on CAHF’s ongoing research, often undertakenby CAHF consultants, as well as on local reporting in the press. Of course, any errors of omission or interpretation remain with the Centre forAffordable Housing Finance in Africa. We welcome your comments.
Layout and production:
June Viljoen Print Consultancy cc

If cities are built the way they are financed (Renaud, 1984), then Africa’s cities areset to change.
Innovation in housing finance –in terms of products, players, and approaches, not tomention target markets – is a key feature across the continent, creating newopportunities for investment and delivery. As both local and international investorschase growth opportunities in a sluggish global economy, they are employingdiversification strategies to manage the risks of their traditional targets – and in this,residential property is increasingly becoming an option. And while establishedplayers are getting better at what they do, new players are adding to the mix andcompeting for opportunities.
Investors are faced with a paradox, however. By their very nature, they are drawnto the high income markets. It is in these markets that they can price adequatelyfor risk and realize the returns they seek. However, the real story – the scaleopportunity just waiting to be cracked – is in the lower income market segments.The arguments for investment in residential – high urbanization rates, a growingmiddle class, a shortage of supply – these are all arguments for moving down marketinto the uncharted waters of affordable housing. Can investors and developers doit? In 2015, this is a very real focus.
Five stories characterise Africa’s housing finance markets in 2015:
1. Innovation in financing 2. Growing awareness of the opportunity in residential3. The identification of niche markets and an appreciation of the affordability
challenge4. Policy & regulatory evolution to match investor interest5. Growing experience and investor sophistication
Of course, the challenges are not insignificant. But increasingly, investors anddevelopers are noting that the potential benefits outweigh the risks. And, asgovernments come to appreciate the potential that this interest offers, their effortsto streamline development processes and enable their local housing markets togrow are creating new opportunities that are beginning to change the face ofAfrican cities.

This is the sixth edition of the Housing Finance in Africa yearbook. Since last year, we have added five country profiles and one regional profile bringing thetotal to 48 country profiles and five regional profiles. We have again sought out new data sources, and rethought our approach to the affordability graphs.We have been monitoring the news so that this yearbook reflects the current situation of housing finance markets on the African continent in 2015.
The Yearbook is intended to provide housing finance practitioners, investors, developers, researchers and government officials with a current update ofpractice and developments in housing finance in Africa, reflecting the dynamic change and growth evident in the market. It is hoped that it will also highlightthe opportunities available for new initiatives, and help practitioners find one another as they strive to participate in the sector. While the general aim ofthe Yearbook is to offer a broad overview of housing finance and housing development in Africa, special emphasis is placed on the key challenge of housingaffordability, and the critical need for housing products and finance that are explicitly targeted at the income profiles of the majority.
This has been a desktop study. Using the CAHF’s research as baseline material, further information on more recent developments was accessed from mediareports, journal articles and practitioner websites. In some cases, material was shared with in-country practitioners. Of course, the yearbook is notcomprehensive, neither in the scope of countries covered nor the data provided. It is intended as an introduction, with the hope that the detail providedwill whet the appetite for more. CAHF invites readers to provide comment and share their experiences on what they are doing in housing finance in Africa.
Kecia RustCentre for Affordable Housing Finance in AfricaOctober 2015
About this publication

Overview 1Explaining the indicators 21Country profiles 25
Algeria 25Angola 29Benin 33Botswana 37Burkina Faso 41Burundi 45Cameroon 49Cabo Verde (Cape Verde) 53Central African Republic 57Chad 61Comoros 65Cote d' Ivoire 69Democratic Republic of Congo 73Djibouti 77Egypt 81Eritrea 85Ethiopia 89Gambia, The 93Ghana 97Guinea-Bissau 101Kenya 103Lesotho 107Liberia 111Libya 115Madagascar 119Malawi 123Mali 127Mauritania 131Mauritius 135Morocco 139Mozambique 143Namibia 147Niger 151Nigeria 155Rwanda 159Senegal 163Seychelles 167Sierra Leone 171Somalia 175South Africa 179South Sudan 183Swaziland 187Tanzania 191Togo 195Tunisia 199Uganda 203Zambia 207Zimbabwe 211
Regions 215CEMAC 215EAC 219North Africa Region 223SADC 225UEMOA 229
Contents

AbbreviationsAADL Lease to own programme, AlgeriaAAHDE Addis Ababa Housing Development EnterpriseACF African Capitalisation Fund, MalawiACI Agence de Cession Immobilière (Land Development Agency), Mali ACSI Amhara Credit & Savings Institution, EthiopiaADC Arrêté de Consession Definitive, Cote d’IvoireAFD Agence Française de Développement (French Development Agency)AfDB African Development BankAFRICOM Africa Command, DjiboutiAFT Agenda for Transformation, LiberiaAGETIP Agence de Gestion des Travaux d’Intérêt Public, BeninAGETU Agency for the Equipment of Urban Land
(Agence d’Equipement des Terrains Urbains), TogoAGOA African Growth and Opportunity ActAH Amiscus Horizon company, The GambiaAIB African Investment BankAMU Arab Maghreb UnionAMT Akiba Mashinani TrustANAT National Land Development Agency, MauritaniaANDF National Agency for Domain and Land
(Agence nationale du domaine et du foncierANIP The National Private Investment AgencyAPBEF Association professionnelle des banques et
établissements financiers du Mali APIM Association des promoteurs immobiliers du MaliAPIMA Angolan Association of Real Estate ProfessionalsARRU Agency for Urban Rehabilitation, TunisiaASODEV Action pour la Solidarité et le Développement, DRCASSOAL Solidarity Actions of Support to Organisations
Supporting Freedom, CameroonATM Automated teller machineBaDEx Bonds and derivatives exchangeBAI Banco Africano de Investimento BAIC Banque africaine pour l’investissement et le commerce BANCOBU Commercial Bank of BurundiBASE Banking Association of South AfricaBBCI Burundi Bank for Commerce and InvestmentBBD Benin Development BankBBS Botswana Building SocietyBCA Banco Comercial do AtlânticoBCB Bank Credit Bujumbura, BurundiBCC Central Bank of ComorosBCDC Banque Commerciale du CongoBCEAO Banque Centrale Des Etats de l’Afrique de l’OuestBCIMR Banque pour le Commerce et l'Industrie – Mer Rouge, DijoubitiBCM Central Bank of MauritaniaBCR Bank Commerciale du RwandaBCEAO Banque Centrale des États de l' Afrique de l'Ouest
(Central Bank of West African States)BCV Banco de Cabo VerdeBEA Banque El Ammane pour le Developpement de l’Habitat BEAC Banque des Etats d’Afrique Centrale
(Bank of Central African States), CameroonBESA Banco Espirito Santo AngolaBFA Banco de Fomento, AngolaBFI Banks and Financial Institutions BGF Bank Financing and Management, BurundiBHB Benin Housing BankBHBF Housing Bank of Burkina Faso (Banque de l’Habitat du Burkina Faso)BCM Central Bank of MauritaniaBCR Bank Commerciale du RwandaBCEAO Banque Centrale des États de l' Afrique de l'Ouest
(Central Bank of West African States)BCV Banco de Cabo Verde
BEA Banque El Ammane pour le Developpement de l’Habitat BEAC Banque des Etats d’Afrique Centrale
(Bank of Central African States), CameroonBESA Banco Espirito Santo AngolaBFA Banco de Fomento, AngolaBFI Banks and Financial Institutions BGF Bank Financing and Management, BurundiBHB Benin Housing BankBHBF Housing Bank of Burkina Faso (Banque de l’Habitat du Burkina Faso)BHC Botswana Housing CorporationBHM Banque de l'Habitat du Mali (Mali Housing Bank)BHR Banque de l’Habitat du Rwanda (Rwanda Housing Bank) BHS Banque de l'Habitat du SenegalBIAC Banque Internationale pour l’Afrique au CongoBIC Banco Internacional de Crédito BICIA-B Banque Internationale pour le Commerce,
l’Industire et l’Agriculture du Burkina, Burkina FasoBIM Banque Internationale du MaliBIMR Banque Indosuez Mer RougeBIAT Arab Bank of TunisiaBIP Bank for Innovation and Partnership, BIPBK Banque de Kigali (Bank of Kigali), RwandaBNDE National Bank for Economic Development, BurundiBNG Building New Ground, South African housing programmeBOA Bank of Africa BOAD Banque Ouest Africaine de Développement
(West African Development Bank)BoG Bank of GhanaBoM Bank of MauritiusBoN Bank of NamibiaBOT Build, operate and transfer modelBoT Bank of TanzaniaBoZ Bank of ZambiaBPC Banco de Poupança e CréditoBpd Barrels-per-dayBRB Bank of the Republic of BurundiBRD Banque Rwandaise de Développement (Rwanda Development Bank)BSIC Sahelo-Saharan Bank for Commerce and Investment, BeninBTCGA Banco Totta Caixa Geral AngolaBTD Togolese Development BankBTCI Banque Togolaise pour le Commerce et l’IndustrieBUCECO Burundi Cement Company BVMT Tunisian stock exchangeCABS Central African Building Society, ZimbabweCAGR Compound Annual Growth RateCAMCCUL Cameroon Cooperative Credit Union LeagueCAPEC Savings and Cooperative Union, MauritaniaCAPMAS Central Agency for Public Mobilization and StatisticsCAR Central African RepublicCBB Construction and Business Bank, EthiopiaCBE Central Bank of EgyptCBE Commercial Bank of EritreaCBE Commercial Bank of EthiopiaCBG Central Bank of The GambiaCBK Central Bank of KenyaCBL Central Bank of LesothoCBL Central Bank of LiberiaCBL Central Bank of LibyaCBR Central Bank RateCCI Centre for Community Initiatives, TanzaniaCCL Centre for Housing Construction
(Centre de la Construction et du Logement), TogoCCODE Centre for Community Organisation and Development, Malawi

Africa Housing Finance Yearbook 2015
CDMH Compte de Mobilisation pour l’Habitat, Cote d’IvoireCDN Crédit du Niger (a commercial bank in Niger)CDS City Development StrategyCEGECI Centre for the Management of Cities
(Le Centre de Gestion des Cités)CEMAC Communauté Économique et Monétaire de l'Afrique Centrale
(Economic and Monetary Community of Central Africa, EMCCA) CENFRI Centre for Financial Regulation and InclusionCEN-SAD Community of Sahelo-Saharan statesCFA Communauté Financière Africaine (currency in West Africa)CGAP Consultative Group to Assist the PoorCHF Common Humanitarian FundCIF Climate Investment Fund, MadagascarCIS Collective Investment Schemes CMA Common Monetary AreaCMCA Crédit Mutuel de CentrafriqueCMH Companhia Mocambicana de HidrocarbonetosCMP Common Market Protocol CMU Couverture Maladie Universelle (universal health coverage)CMS Credit Mutuel du SenegalCNEC Caisse Nationale d'Epargne et de Crédit de DjiboutiCNEL Savings and Loans Bank, TunisiaCNEP Caisse National d’ Épargne de Prévoyance (National Savings
and Providence Fund – one of the state-owned banks), AlgeriaCNSS National Social Security Fund, TogoCNT Confederation Nigerienne du TravailCOBAC Central African Banking CommissionCoK City of Kigali CofO Certificate of Occupancy, NigeriaCOMESA Common Market for Eastern and Southern AfricaCPA Comprehensive Peace Agreement, South Sudan CPEC Caisse Populaire d'Epargne et de Crédit, DijiboutiCPF Conservation de la Propriété FoncièreCPLP Comunidade dos Países de Língua Portuguesa
(Community of Portuguese Speaking Countries)CPIA Country Performance and Institutional Assessment, World Bank CPS Contribution Pension SchemeCRB Credit Reference Bureau, Malawi, South Sudan and ZambiaCREPMF Conseil Regional de l’epargne publique et des marches financiers
(Regional Council of Savings Public and Financial Markets)CRJE China Railway Jianchang Engineering CRI Collateral replacement indemnityCRRH Caisse Regionale de Refinancement Hypothecaire
(Regional Mortgage Refinance Fund), WAEMU CRRH-UEMOA Caisse Regional de Refinancement Hypothecaire – UEMOA CRT Togolese Pension FundCRM Retirement Fund of MaliCTA Construction technical assistanceDFI Development Finance InstitutionDID Développement International DesjardinsDNHU National Directorate for Housing and UrbanisationDRC Democratic Republic of CongoDTI Debt to Income ratio DUAT Direito de Uso de Aproveitamento da Terra
(right to use and benefit from and), MozambiqueEAC East African Community EAMU East African Community Monetary UnionEBH Elgin, Brown & Hamer, NamibiaECAM Enquête Camerounaise auprès des Ménages, or Household survey,
CameroonECF Enhanced Credit FacilityECOSAT Encadrement des Constructions sociales et aménagement des terrrains,
(Framework for social engineering and land management), BurundiECOWAS Economic Community of West African StatesEEDC Egypt Economic Development ConferenceEFSA Egyptian Financial Supervisory AuthorityEHFC Egyptian Housing Finance Company
EIU Economic Intelligence UnitEMRC Egyptian Mortgage Refinance CompanyEMSL Ecobank microfinance Institution, Sierra LeoneENDE National Strategy for DevelopmentEPS Expanded PolystyreneEU European UnionFAEU Fonds d'Amenagement et d'Equipement Urbain
(Urban Development and Equipment Fund), BurundiFDI Foreign direct investmentFECECAM Fédération des Caisses d’Epargne et de Crédit Agricole MutuelFEDEP Federal Urban PoorFFH Fundo de Fomento de Habitação
(Housing Promotion Fund), MozambiqueFGCMPI Real Estate Development Guarantee Fund, AlgeriaFGHM Fonds de Garantie Hypothecaire du Mali,
(Mali Mortgage Guarantee Fund)FHA Federal Housing Authority, NigeriaFHRL FMBN Home Renovation Loan FHSE Foundation for Rural Housing, UgandaFIP Finance and InvestmentFLISP Finance Linked Individual Subsidy Programme, South AfricaFMBN Federal Mortgage Bank of NigeriaFMO Nederlandse Financierings-Maatschappij voor Ontwikkelingslanden
(Netherlands Development Finance Company)FNB First National BankFNFI National Inclusive Finance Fund
(Fonds National de la Finance Inclusive), TogoFNM National Microfinance Fund, CongoFOGARIM Guarantee Fund for mortgages for low or
seasonal income groups, MoroccoForex Foreign exchangeFPHU Fund for the Promotion of Urban Housing, BurundiFSC Financial Sector Charter, in South Africa and NamibiaFSDH Special Fund for Housing Development
(Fonds Special de Developpement de l’Habitat), TogoFSDP Financial Sector Development Program, RwandaFSH Fonds de Soutien à l’Habitat (Fund for housing support)FSRA Financial Services Regulatory AuthorityFTA Free Trade AreaFUCEC Faîtière des Unités Coopératives d’Epargne et de Crédit, TogoGARI Fonds Africain de Garantie des Investissements
Privés en Afrique de l’OuestGBS Gambia Bureau of StatisticsGDP Gross domestic productGHL Ghana Home LoansGIPF Government Institutions Pension FundGIZ Deutsche Gessellschaft für Internationale Zusammenarbeit
(German Society for International Cooperation)Global Findex Global Financial Inclusion DatabaseGLS Government Loan SchemeGNI Gross national incomeGNC General National Congress, LibyaGOAC Guernsey Overseas Aid CommissionGRET Groupe de Recherches et d’Échanges Technologiques, MauritaniaGREDA Ghana Real Estate Developers Association GRI Global Real Estate InstituteGSF Guarantee and Subsidy Fund, EgyptGSMA Groupe Speciale Mobile AssociationGTP Growth and Transformation Plan, EthiopiaHCBE Housing and Commerce Bank of EritreaHCF Housing Finance Company, SeychellesHDA Housing Development Agency, South AfricaHDI Human Development IndexHFB Housing Finance Bank, UgandaHFC Housing Finance Company HFC Home Finance Company of the Gambia LimitedHFCU Housing Finance Company of Uganda

HfH Habitat for HumanityHFHU Habitat for Humanity, UgandaHFP Housing Finance ProjectHIB Housing and Infrastructure Board, LibyaHMF Housing microfinanceHOFINET Housing Finance Information NetworkHSB Housing and Savings Bank, EthiopiaIAS International Accounting StandardsICF Investment Climate FacilityIDBZ Infrastructure Development Bank of ZimbabweIFAD International Fund for Agricultural DevelopmentIFC International Finance CorporationIFRS International Financial Reporting StandardsIDB Islamic Development BankIDP Internally Displaced PersonIHDP Integrated Housing Development Programme, EthiopiaIHS International Housing SolutionsIMF International Monetary FundINEP Instituto Nacional de Estudos e Pesquisa National Institute
for Studies and ResearchINPS National Institute of Social Welfare, MaliINSS National Social Security Institution, BurundiIOR-ARC Indian Ocean Rim Association for Regional CooperationIRS Integrated Resort Scheme, MauritiusISKAN National Land Development, Housing Development and
Real Estate Promotion and Management Corporation, MauritaniaKBA Kenya Bankers Association KCB Kenya Commercial BankKBRR Kenya Banks’ Reference RateKfW Kreditanstalt für Wiederaufbau
(German Reconstruction Loan Corporation)KNBS Kenya National Bureau of Statistics KoS Kingdom of Swaziland KYC Know Your Customer, South SudanLBDI Liberian Bank for Development and InvestmentLDC Least developed countryLFS Labour Force Survey, LiberiaLHLDC Lesotho Housing and Land Development CorporationLIC Low income countryLIS Lands Information systemLISGIS Institute of Statistics and Geo-Information Services, LiberiaLNG Liquefied Natural GasLOUAF Loi d’Orientation sur l’Urbanisme et l’Aménagement Foncier, NigerLPA Commercial housing, AlgeriaLPL Public rental housing, AlgeriaLPP Logement Public Promotionnel, the assisted housing programme, AlgeriaLSC Land, Services and Citizenship, GhanaLTV Loan-to-value (ratio)LUSE Lusaka Stock Exchange MCA Millennium Challenge Account, LesothoMCB Mauritius Commercial BankMCIB Public Credit Bureau, Mauritius MDG Millennium Development GoalMDI Microfinance Deposit-taking InstitutionMENA Middle East and North Africa Region MFC Mortgage Finance CompanyMFF Mortgage Finance FundMFI Microfinance InstitutionMFSDS Financial Sector Development Strategy 2013 – 2022, MozambiqueMHC Malawi Housing CorporationMHC Mauritius Housing CompanyMHDP Mass Housing Development ProgrammeMHU Ministry of Housing and Urban Development, AlgeriaMHU Ministry of Housing and Utilities, Libya
MLF Mortgage Liquid FacilityMLSP Mass Land Servicing ProgrammeMINDAF Ministry of State Property and Land Tenure, CameroonMOPH Ministério das Obras Públicas e HabitaçãoMOU Memorandum of Understanding MPD Movement for Democracy MSMEDF Micro Small and Medium Enterprises Development Fund, NigeriaMTSP Money Transfer Service ProviderNACHU National Cooperative Housing Union, KenyaNAMFISA Namibia Financial Institution Supervisory AuthorityNAPSA National Pension Scheme Authority, ZambiaNASSIT National Social Security and Insurance Trust, Sierra LeoneNASSCORP National Social Security and Welfare Corporation NBFIRA Non-Banking Financial Institution Authority, BotswanaNBBL Norwegian Federation of Co-operative Housing AssociationsNBE National Bank of EthiopiaNBS New Building Society, MalawiNDP National Development PlanNDP4 4th National Development Plan, Namibia NEF National Empowerment Foundation, MauritiusNEMA National Environmental Management Authority, KenyaNGO Non-governmental organisationNHA National Housing Agency, ZambiaNHA National Housing Authority, LiberiaNHAG Namibian Housing Action GroupNHBT National Housing Bond Trust, ZambiaNHC National Housing Corporation, Kenya and TanzaniaNHDC National Housing Development Company, MauritiusNHE National Housing Enterprise, NamibiaNHF National Housing Fund, NigeriaNHFC National Housing Finance CorporationNHP National Housing Programme, EgyptNLC National Land Commission Kenya NIESV Nigerian Institute of Estate Surveyors and Valuers NMB National Microfinance Bank, TanzaniaNMRC Nigerian Mortgage Refinance CorporationNOCAL National Oil Company of Liberia NOCIBE Nouvelle Cimenterie du Bénin – NOCIBENPL Non-performing loanNREC National Real Estate CompanyNSDP National Strategic Development Plan, Lesotho NSSA National Social Security Authority, ZimbabweNSSF National Social and Security Fund, UgandaNUCA New Urban Communities Authority, EgyptODA Official development assistanceOHADA Organisation for the Harmonisation of Business Law in AfricaOHLM Office des habitats à loyers moderesOIBM Opportunity International Bank of MalawiOMH Office Malien de l'Habitat (Mali Housing Agency)OPIC Overseas Private Investment CorporationOTC Office de Topographie et de CadastreOTR Office Togolais des RecettesPAGE Programme to Accelerate Growth and Employment, The GambiaPAMF Première Agence de MicroFinance, MadagascarPAICV African Party for the Independence of Cabo VerdePDES Economic Social Development plan, NigerPDU Urban Development Programme, MauritaniaPGE Programme Général de l’EtatPMB Primary Mortgage BanksPMC Property Management CorporationPMI Primary Mortgage InstitutionPNEI National Pact for Industrial Emergence, MoroccoPND National Development Plan, Chad

Africa Housing Finance Yearbook 2015
PNRLR National Programme for the Resorbing of Rudimentary Lodging PPC Pretoria Portland Cement PPHPZ Peoples’ Process on Housing and Poverty in ZambiaPPP Purchasing power parityPPP Public-private partnershipPRS Permanent Residence Scheme, MauritiusPSE Plan Sénégal EmergentPSI Policy support instrumentPTI Payment-to-income ratioPUIUR Programme d'Urgence d'Infrastructures Urbaines, Cote d’IvoireRCPB Réseau des Caisses Populaires du BurkinaRDP Reconstruction and Development Programme, South Africa REALL Real Equity for All (formerly Homeless International)REC Regional Economic Community RECCU Renaissance Cooperative Credit Unions, CameroonREDAN Real Estate Development Association of NigeriaREIT Real Estate Investment TrustREPI Real Estate Price Index, MoroccoRHA Rwanda Housing AuthorityRHB Rwanda Housing BankRHLF Rural Housing Loan Fund, South AfricaRISDP Regional Indicative Strategic Development Plan (SADC)RNHC National Network of Inhabitants of CameroonRNP National Postal ServiceROA Return on AssetsRSNDP Revised Sixth National Development RSSB Rwanda Social Security BoardSACCO Savings and Credit Co-operativeSACU South African Customs UnionSADC Southern African Development CommunitySALHOC Sierra Leone Housing Corporation SAPES Scheme to Attract Professionals for Emerging Sectors, MauritiusSARB South African Reserve BankSBM State Bank of MauritiusSBS Swaziland Building SocietySEC Securities and Exchange Commission, GhanaSDFN Shack Dwellers Federation of NamibiaSDI Shack / Slum Dwellers InternationalSETU Societe d’Equipement des Terrains Urbains
(Society of Urban Land Equipment), TogoSFDN Shack Dwellers Federation of NamibiaSGBB Societe Generale de Banque au BurkinaSHC State Housing Company, GhanaSHDC Seychelles Housing Development CorporationSHHA Self Help Housing Agency, BotswanaSIAB Société Inter-Africaine de Banque, TogoSIC Société Immobilière du Cameroun (Cameroon Real Estate Corporation)SID Société Immobilière de DjiboutiSIFMA-SA Societe Fonciere et Immobiliere du MaliSiHA Single Housing Agency, BotswanaSIP Société Immobilière Publique (National Real Estate Company), BurundiSIPIM Societe ivoirienne de promotion immobilièreSIPO Strategic Indicative Plan for the Organ
(on Defence, Politics and Security) (SADC)SITO Société Immobilière TogolaiseSLIEPA Sierra Leone Investment and Export Promotion Agency SMB State Bank of MauritiusSMCP Savings and Micro-Credit Programme, EritreaSME Small and medium-sized enterpriseSNEC National Water Supply Company of CameroonSNC Societe Nigerienne de Cimenterie, NigerSNEN Syndicat National des Enseignants du NigerSNHB Swaziland National Housing BoardSNL Swazi Nation Land
SNPSF National Post and Financial Services Institution SOCOGIB Société de Construction et de Gestion Immobilière du BurkinaSOCOGIM Société de Construction et de Gestion Immobilière, BeninSOCOGIM Real Estate Construction and Management Company MauritaniaSOFIA Société Financière Africaine de CréditSONA State Insurance company, Democratic Republic of Congo SONIDEP Société Nigérienne Des Products PétroliersSONUCI Société Nationale d’Urbanisme et de Construction ImmobilièreSOPROFIM Land and Real Estate Promotion CorporationSPI Societé de Promotion Immobiliere, MaliSPLM South People’s Liberation Movement, South SudanSRA Swaziland Revenue Authority SREP Scaling Up Renewable Energy in Low Income
Countries Programme, MadagascarSRH Société de Refinancement Hypothécaire
(Mortgage Refinancing Company), AlgeriaSSA Sub-Saharan AfricaSSFR Social Security Fund of RwandaSSHFC Social Security and Housing Finance Corporation, GambiaSTZC Zhen Gwei Technique CongoTIPEEG Targeted Intervention Programme for Employment
and Economic Growth, Namibia TMB Trust Merchant Bank, DRCTMRC Tanzania Mortgage Refinancing CompanyPROM Togolese Sponsorship Corporation (Societe Togolaise de Promotion)UAE United Arab EmiratesUEAC Union Economique de l’Afrique Central
(Central African Economic Union)UEMOA West African Economic Monetary UnionUN United NationsUNCDF United Nations Capital Development FundUNCHS United Nations Centre for Human SettlementsUNDP United Nations Development ProgrammeUNSMIL United Nations Support Mission in LibyaUSA United States of AmericaUSAID United States Agency for International DevelopmentUSD United States DollarUTB Union Togolaise de BanqueVAT Value added taxWAEMU West African Economic Monetary UnionWAMZ West African Monetary ZoneWHPI Women’s Housing Plan Initiative, NigeriaZAMFI Zimbabwe Association of Microfinance InstitutionsZAMCO Zimbabwe Asset Management CorporationZHPPF Zimbabwe Homeless and Poor People’s FederationZIMASSET Zimbabwe Agenda for Sustainable Socio-Economic transformationZINAHCO Zimbabwe National Association of Housing CooperativesZNBS Zambia National Building SocietyZSIC Zambia State Insurance Corporation


Overview
Africa Housing Finance Yearbook 2015
If cities are built the way they are financed1 (Renaud, 1984), then Africa’s cities are set to change. Innovation in housing finance –in terms of products, players, andapproaches, not to mention target markets – is a key feature across the continent, creating new opportunities for investment and delivery. As both local andinternational investors chase growth opportunities in a sluggish global economy, they are employing diversification strategies to manage the risks of their traditionaltargets – and in this, residential property is increasingly becoming an option. And while established players are getting better at what they do, new players are addingto the mix and competing for opportunities.
Investors are faced with a paradox, however. By their very nature, they are drawn to the high income markets. It is in these markets that they can price adequatelyfor risk and realise the returns they seek. However, the real story – the scale opportunity just waiting to be cracked – is in the lower income market segments.The arguments for investment in residential – high urbanisation rates, a growing middle class, a shortage of supply – these are all arguments for moving down marketinto the uncharted waters of affordable housing. Can investors and developers do it? In 2015, this is a very real focus.
Of course, the challenges are not insignificant, and cannot be easily wished away. But increasingly, investors and developers are noting that the potential benefitsoutweigh the risks. And, as governments come to appreciate the potential that this interest offers, their efforts to streamline development processes and enabletheir local housing markets to grow are creating new opportunities that are beginning to change the face of African cities.
There are five stories that characterise Africa’s housing finance markets in 2015:
1. Innovation in financing 2. Growing awareness of the opportunity in residential3. The identification of niche markets and an appreciation of the affordability challenge4. Policy & regulatory evolution to match investor interest5. Growing experience and investor sophistication
1. Innovation in financing
A key challenge facing investors has been the inability to find investment targets in the residential real estate space that are sufficiently substantial to warrant theirattention. International and local institutional investors generally seek large investment targets where they can place their money and realise a steady return thatisn’t drained by the administrative and organisational weight of multiple projects. With the exception of South Africa, African housing markets lack the capacity toreceive big money. Developers haven’t the capacity to build housing at scale and municipalities haven’t the capacity to receive large scale housing developments.Some investors are noting a change, however: investment in large scale infrastructure – roads, energy, even telecommunications – clears the way and reduces someof the transaction costs associated with housing developments. As the African head of Real Estate Finance for Standard Bank, Gerhard Zeelie, says2 “economicgrowth and ongoing investments in infrastructure are opening up previously inaccessible markets.”
Given this, investors have been looking for innovative ways to make the connection between their capital and potential investment opportunities. The introductionof Real Estate Investment Trusts (REITs) is perhaps the most significant of these – these create a vehicle that investors understand and can trust, aggregating diversesources of funding from international and institutional investors through to households, and targeting them into a portfolio that extends beyond the limitations ofindividual projects.
REITs are new in Africa – having developed through the promulgation of legislation and issuing of regulations only in the past three years, in South Africa, Nigeria,Tanzania, Kenya, Ghana, Morocco, and Zimbabwe. Initially used for the retail and commercial real estate sectors, residential REITs are now also emerging. The firstresidential-only REIT in South Africa, Indluplace, listed on the Johannesburg Stock Exchange in June 2015. Promoted by Arrowhead Properties, which has beenbringing residential properties into its REIT portfolios since 2013, Indluplace focuses on affordable rental.
In some jurisdictions, the REIT legislation allows for a housing development focus. This was a Kenyan innovation, which allows for the Development REIT (D-REIT).Investors take some of the project risk, so the regulations limit D-REITs to professional investors. A D-REIT can be converted into an Income REIT (I-REIT) whichrealises returns through rental cash flows, when the bulk of the assets have completed the construction phase and rentals begin to flow3. In Tanzania, the CapitalMarkets and Securities Authority (CMSA) approved Watumishi Housing Company REIT in early 2015. WHC-REIT aims to mobilise funding for the developmentof low-middle income housing, both for sale and for rent, and the development of commercial properties. WHC-REIT was created explicitly to target public sectorworkers’ housing demand, and the Public Service Pension Fund, Government Employees Provident Fund, PPF Pension Fund, LAPF Pension Fund, National SecurityAuthority, National Health Insurance Fund, and National Housing Corporation are the unit holders. Over time, WHC-REIT intends to float units on the Dar esSalaam Stock Exchange to allow members of the public to also invest4.
Listed groups create a credibility on which investors can rely. As listed groups – REITs and others – explore the affordable property sector, investors can begin todevelop an understanding of this market opportunity through their arms-length relationships with developments that their investment in the REITs facilitate.
Another innovation whose practice has been evolving as its been tried in different countries, is the mortgage liquidity facility. Originally introduced in Africa withthe establishment of the Egyptian Mortgage Refinancing Company in 2007, this was soon followed by the establishment of the Tanzania Mortgage RefinanceCompany in 2010, the Caisse Regional de Refinancement Hypothecaire-UEMOA in 2012, and the Nigerian Mortgage Refinance Company in 2014. While thereare variations from one to the next, the model essentially allows for the liquidity facility to purchase mortgages from mortgage lenders, giving them the liquidity tofund further mortgages. In order to engage with multiple lenders, the facility requires standardisation of mortgages, which over time makes them more accessibleto investors. Access to funding from the liquidity facility both reduces the cost of capital and increases the loan tenor, which in turn makes the mortgages muchmore affordable to borrowers, and lower income borrowers can then also participate. An increase in effective demand on this basis encourages developers tobuild to this market, and over time, the virtuous cycle sees more housing at more affordable prices for a widening market of borrowers5.
Mortgage markets across Africa are tiny by international comparisons, but this is part of their attraction – there is space to grow. Lower interest rates, achievablein part through liquidity facilities, seem to correlate with larger mortgage markets. But it is still early days and our data collection is imprecise. The data illustrated
1

30
25
20
15
10
5
0
Mortgage to GDP vs prevailing mortgage interest rate and term
Com
oros
(201
5)
Sout
h Af
rica
(201
4)
Cape
Ver
de (2
013)
Nam
ibia
(201
1)
Mau
ritiu
s (2
011)
Tuni
sia
(Bad
ev e
t al)
Bots
wan
a (2
013)
Mor
occo
(Bad
ev e
t al)
Rwan
da (2
013)
Keny
a (2
013)
Seyc
helle
s (2
013)
Zim
babw
e (2
012)
Zam
bia
(201
2)
Buru
ndi (
2013
)
Djib
outi
(201
5)
Liby
a (2
015)
Ugan
da (2
012)
Nige
ria (2
011)
Cam
eroo
n (W
B 20
05)
Mal
awi (
2004
)
Togo
(Bad
ev e
t al)
Tanz
ania
(201
4)
Libe
ria (2
008)
Ghan
a (2
010)
Moz
ambi
que
(200
8)
Cent
ral A
frica
n Re
publ
ic (W
B 20
05)
Sene
gal (
2010
)
Mor
tgag
e to
GDP
(per
cent
)
Of course, mortgages are only feasible when they’re affordable. Mortgage rates above fifteen percent, and offered at tenors below ten years, are unhelpful. Beyondthe factors that liquidity facilities address, macro-economic factors – the pricing of Treasury Bill rates, inflation, the availability of long term capital, the strength ofcapital markets, and so on – are behind a lender’s ability to make the mortgage work. In Malawi, a borrower might as well buy their house with their credit card.It is unsurprising therefore, that mortgages comprise only 0.5 percent of GDP. Interestingly, a number of countries are offering mortgages at rates below 15 percentand for tenors over 15 years, and some now at even less than 10 percent and over 20 years.
28
22.54 22.15
18.21
12.99
9.25
6.59
3.85 3.64 3.53 3.31 2.831.29 1.16 1 1 0.9 0.58 0.5 0.5 0.49 0.46 0.34 0.25 0.14 0.07 0.07
35
30
25
20
15
10
5
0
Prevailing mortgage interest rates, and term
Mor
tgag
e in
tere
st ra
te (%
) and
term
(yea
rs)
Mal
awi
Ugan
da
Sier
ra L
eone
Nige
ria
Gam
bia
Moz
ambi
que
Com
oros
Tanz
ania
Zam
bia
Sout
h Su
dan
DRC
Rwan
da
Keny
a
Buru
ndi
Cote
d' I
voire
Cent
ral A
frica
n Re
publ
ic
Ango
la
Cam
eroo
n
Beni
n
Burk
ina
Faso
Seyc
helle
s
Zim
babw
e
Eritr
ea
Mad
agas
car
Ethi
opia
Guin
ea-B
issa
u
Sene
gal
Mal
i
Nam
ibia
Leso
tho
Sout
h Af
rica
Djib
outi
Liby
a
Togo
Chad
Mau
ritiu
s
Nige
r
Som
alia
Tuni
sia
Libe
ria
Ghan
a
Alge
ria
Mor
occo
Egyp
t
n Mortgage interest rate %l Mortgage term
n Average mortgages % of GDP▲ Mortgage interest rate in 2015 (%)
n Mortgage term (years)... Linear (Mortgage interest rate in 2015%)
35
30
25
20
15
10
5
0
Mortgage interest rate (percent) and term
(years)
in the following graph comes from multiple sources – central banks, the Housing Finance Information Network (Hofinet), the World Bank, and from CAHF’s ownresearch. Aside from North African and certain markets such as South Africa and Namibia, most countries barely achieve 5 percent mortgage debt to GDP.Growing these markets will not only encourage investors to treat them more seriously, they will also encourage developers to be more targeted in their delivery,and this will support the economic development that the rest of the world knows goes with housing.
Source: Hofinet, World Bank, CAHF research, other sources.
Source: CAHF Research, September 2015.
2

Africa Housing Finance Yearbook 2015
Of course, exposure is still very limited. If booming Kenya is celebrated for its mortgage market of just over 22 013 mortgages as at the end of 2014, then weknow mortgage markets are tiny and we can suspect that there is a substantial opportunity for growth.
As mortgage markets develop further, they create exit opportunities for developers and construction financiers, supporting further investment in residentialdevelopment, greater housing supply, and the growth of cities with more formal housing. New financing approaches are changing the shape and look of African cities.
2. Growing awareness of the opportunity in residential
The investment potential in Africa is, of course, not new. Since the early “Africa rising” narrative, analysts have been citing the potential to be found in a young,growing middle class becoming economic participants in countries where the rate of urbanisation outpaces the rate of population growth. This, together with thecommodities boom, spurred investment in infrastructure, which then facilitated investment in real estate – largely commercial and retail. In 2014, foreign directinvestment into real estate was second behind coal, oil and natural gas, comprising 14 percent market share and US$12 billion6. South African retailers pushednorth into Zambia, Botswana, Mozambique, Tanzania, Kenya, Nigeria, Ghana, seeking new markets. New shopping malls were opened, and the “African real estatemarket” became a focus of more detailed analysis and investor interest. With the commodities downturn, the fall in the oil price, and the depreciation of manylocal currencies against the strengthening dollar, however, investors are being forced to diversify their strategies. Their local experience has shown them the housingbacklogs that beset virtually all African cities, and while they now have a better understanding of the target market, residential becomes a new opportunity.
Arrowhead, a REIT operating in South Africa, has a diverse portfolio, including office, retail, industrial and residential real estate. In an environment where mortgagelending is increasingly constrained, Arrowhead has positioned itself as an exit for residential property developers. It is these global forces on capital and oninvestment opportunities that are shifting a focus towards residential as a parallel investment strategy. PwC’s Global Real Estate Leader, Kees Hage, says7 that “realestate investors have a wide range of issues to consider when making investment decisions. What is clear is that they may have to approach those decisions in acompletely different way in the future. Capital allocations may need to be made to a wider range of asset types than ever before, ranging from retirement andstudent housing to data centres and self storage.”
Promoting the residential construction industry is also a diversification strategy for the public sector. In Nigeria, the emphasis on the residential real estate sectorcomes at the same time as the oil price has fallen by 40 percent. Can Nigeria shift its economic drivers away from commodities and use housing as its engine forgrowth? This must be at least in part what is behind the central government’s enabling interventions into real estate. In the past four years, Nigeria’s real estatesector has grown to become one of the main, non-oil sector contributors to the country’s rebased GDP, contributing 11 percent by 2014. It is estimated that theN6.5 trillion market will grow at an average of ten percent over the next few years. The 2015 Real Estate Review8 explicitly states that “the major growth driversin the sector have been credited to: an increased inflow of foreign investment; increased institutional investment from local companies including PFAs and MutualFunds; the growing population of High Net Worth individuals; and the targeted intervention of the Federal Government in the housing finance sector.”
3. The identification of niche markets and an appreciation of the affordability challenge
And yet, the enthusiasm with residential will be misplaced if it is only focused on the top end. The bulk of the backlog is not in the high end property market, butrather in what is being called the affordable market – home to new entrants to the middle class. Affordability is higher in urban areas, of course, where residentsare more likely to have an income stream that can support a long term mortgage obligation – but even so, less than ten percent of households across the continentare likely to afford a mortgage for even the cheapest, newly built house, built by a private developer.
CAHF has been collecting data on house prices across Africa for the past six years. We ask two simple questions: what is the price of the cheapest, newly builthouse, built by a private developer, and what is the size of that house. The answers we receive tell us nothing about scale – we have no idea if enough of thesehouses are being built annually to satisfy demand, though we suspect that in most cases they’re not. And because most countries do not collect this data in anyformal way, the information we receive cannot be taken as representative – the responses we receive are based on the opinions and experience of the respondents.However, it gives us an indication of the range of house prices, the possible relationship this may have to size, and what this means for housing affordability.
$200 000
$180 000
$160 000
$140 000
$120 000
$100 000
$80 000
$60 000
$40 000
$20 000
$0
250
200
150
100
50
0
Price of the cheapest, newly built house by a formal developer
Mor
tgag
e in
tere
st ra
te (%
) and
term
(yea
rs)
Size of that house (m2)
Ango
la
Seyc
helle
s
Guin
ea-B
issa
u
Mad
agas
car
Com
oros
Som
alia
Eritr
ea
Bots
wan
a
Zam
bia
Gam
bia
Liby
a
Cam
eroo
n
DRC
Ethi
opia
Rwan
da
Sout
h Su
dan
Alge
ria
Mau
ritiu
s
Djib
outi
Sier
ra L
eone
Sout
h Af
rica
Tuni
sia
Buru
ndi
Ghan
a
Sene
gal
Tanz
ania
Cent
ral A
frica
n Re
publ
ic
Nam
ibia
Zim
babw
e
Keny
a
Nige
ria
Beni
n
Leso
tho
Mor
occo
Mal
awi
Ugan
da
Swaz
iland
Nige
r
Burk
ina
Faso
Egyp
t
Togo
Mal
i
Moz
ambi
que
n Price of the cheapest, newly built house by a formal developer in 2015 (US$)n Price of the cheapest newly built house, by a formal developer in 2014 (US$)n Price of the cheapest newly built house, by a formal developer in 2013 (US$)n Price of the cheapest newly built house, by a formal developer in 2012 (US$)n Price of the cheapest newly built house, by a formal developer in 2011 (US$) ▲ What is the size of this house (in m2) in 2015?
Source: Annual CAHF survey of local housing practitioners
3

If we compare this data with average annual household income in urban and rural areas, we can see some countries with very serious gaps, which, in most cases,are not easily overcome with end-user finance.
Given these affordability challenges, and the very real need and obvious demand for housing, investors and developers are targeting specific niche markets that pulltogether resources in innovative ways. An important niche is the rental market. This was the focus of two recent symposia hosted by development financier ShelterAfrique this year, one of which was in Ghana. Across these two events, proponents highlighted the opportunity for regular cash flow and increasing rentals as ahedge against the long term expectation for property appreciation. The rental sector offers strong synergies with pension fund liabilities, and provides opportunitiesfor diversification. Demand is obvious: Africa’s cities are welcoming streams of new migrants, and the middle class is young and both upwardly and geographicallymobile in their pursuit of employment. This, plus the simple absence of housing for ownership, makes rental an obvious target. And critically, a growing track recordis showing impressive results.
Within the rental sector, student housing has been a critically overlooked housing niche. A key challenge in making this market segment work, has been the needfor property managers that are specialist in this market segment. As the demand for diversification shifts practitioners in the direction of residential, however, thestudent niche offers a focus that is attracting some investors.
In many countries, housing investors are targeting employers, whether public or private, as critical role players that can facilitate their workers’ access to the resourcesthey need to pay for their housing. In South Africa, Pretoria Portland Cement has embarked on a “Home Owners Support Programme”, assisting its lower gradeemployees to improve their housing circumstances9.
Certainly, a key determinant of market demand is income – both in terms of quantum and source. The graphs that follow provide an indication of the nuance ofthis demand. This sort of market segmentation can enable a more careful targeting, and changes the affordability challenge. While the majority of households cannotafford the mortgage that would buy them the cheapest, newly built house by a private developer, they may afford to buy a plot of land, servicing it collectively withmembers of their community, and then financing the incremental construction of their housing in stages, using housing microfinance.
As we better understand the size and scope of housing affordability – even at the very general level offered by these graphs – we can better understand whatsorts of investment can be targeted where, and what sort of market will support these kinds of decisions.
$40 000
$35 000
$30 000
$25 000
$20 000
$15 000
$10 000
$5 000
$0
Average annual household income and housing affordability
Mau
ritiu
sSe
yche
lles
Bots
wan
aSw
azila
ndTu
nisi
aNa
mib
iaGa
bon
Sout
h Af
rica
Ango
laAl
geria
Mor
occo
Djib
outi
Cabo
Ver
deNi
geria
Cote
d'Iv
oire
Zim
babw
eEq
uato
rial G
uine
aEg
ypt
Liby
aSe
nega
lLe
soth
oSu
dan
Sao
Tom
e an
d Pr
inci
peM
aurit
ania
Zam
bia
Cam
eroo
nCo
mor
osGh
ana
Keny
aSi
erra
Leo
neTo
goGa
mbi
aBe
nin
Ugan
daGu
inea
-Bis
sau
Burk
ina
Faso
Moz
ambi
que
Mal
iDR
CSo
uth
Suda
nLi
beria
Rwan
daTa
nzan
iaBu
rund
iGu
inea
Mal
awi
Nige
rCh
adEt
hiop
iaSo
mal
iaCe
ntra
l Afri
can
Repu
blic
Mad
agas
car
Eritr
ea
n Average, annual HH Income (urban, 2014)n Average, annual HH Income (rural, 2014)▲ Average Annual HH Income required to afford the cheapest newly built house built by a private developer, at current mortgage rates (2015)
$65 925 $200 000 $78 567 $65 057
Source: Annual CAHF survey of local housing practitioners and C-GIDD data
4
Africa Housing Finance Yearbook 2015
The affordability graphs use C-GIDD (Canback Global Income Distribution) 2014 data10 and apply various assumptions relating to house price and mortgageaffordability. Plotting the number of households by annual household income, in rural and urban areas, the graphs offer an indication of housing affordability,and suggest where investors and developers might target which efforts.
Splitting the population into urban and rural households (represented in thousands across the bottom, horizontal axis) assists us in understanding key marketdifferences: housing supply/delivery systems, the scale of delivery and density, land tenure, access to finance/financing instruments, housing typologies, buildingmaterials are very different for rural and urban households. Africa is still largely a rural continent, with 59 percent of households living in rural areas. However,urbanisation rates are high – 5.4 percent in Uganda, for example. This shifting of populations from rural to urban is an important factor in understanding housingdemand.
The income brackets are constant – the same for each graph, and are broken down into custom ranges of annual household income, from less than US$800 perannum (less than about US$2/day) to more than US$50 000 per annum (more than about US$137/day). Of course, this is a general indication of affordability:household sizes vary, they can contain more than one income earner, and expenditure patterns will be very different from one household to the next, not to mentionthe household’s debt burden. Still, the indication is helpful in showing where the bulk of the population will lie. Generalised across the continent, 37.6 percent ofthe population (urban and rural combined) earn less than US$1 600 per annum (or about US$4 per day). The bulk of these are in rural areas, however, where housingfinance is likely to be less of an issue. Countries with populations earning above US$8 000 per annum (or about US$20 per day) may well be able to support a growingmortgage (or at least micro-mortgage) market, although this also depends on very affordably priced housing stock. In these markets, as well as those with highurbanisation rates, rental accommodation would also be an important market niche to consider. Countries with populations where the bulk earn below US$8 000per annum would need to incorporate strategies that allow for incremental housing construction and self-build. In these cases, investment in housing microfinanceand other aspects of the incremental housing delivery chain would likely find demand.
Using the C-GIDD data, we calculate the average annual urban household income for the country – a very rough figure illustrated with the blue dotted line – asa comparator for mortgage affordability. We then calculate the average household income needed to afford the cheapest, newly built house by a formal developer(the green dotted line), drawing on data sourced from our annual survey and responses from the authors of the country profiles. Of course, the prevailingmortgage loan interest rate, term, and down payment required differ per country and are assumptions made are based on information provided from authors ofthe country profiles and CAHF research. Use this data with caution – they are simply meant to provide an indication of the extent to which the so-called cheapesthouse is affordable to the general population.
Think about these graphs in terms of the relative population of each country, and the urbanisation rates that they are experiencing, which impacts directly on demandfor housing. The cost of the unit is what is true, according to our country researchers, this year – there may be cheaper houses available or possible, but this iswhat is being built by a private developer this year. We also don’t have a sense of scale – how many of these houses are being built? So when a graph suggeststhat 57.1 percent of urban Algerian households can afford the cheapest newly built house (delivered this year at US$32 500), we don’t know if there are enoughhouses being built to serve this population. In very many countries, the opportunity lies in finding something that will serve just below this affordability threshold –in Algeria, for example, what are the possibilities of delivering housing for less than US$32 500? There seems to be a market that could afford such an offering.This is certainly true in Angola, where only 2.2 percent of urban households can afford a US$200 000 house.
The question of affordability is difficult, however. These are generalised annual household income figures, averaged for a nation, and hiding what goes on in individualhouseholds. This is critical information that developers and investors will need to explore further if they are to truly understand the opportunities available. In acountry like South Africa, for example, credit indebtedness is a critical factor : only 42.8 percent of credit active consumers were current on their accounts at theend of the second quarter of 2015. This has a severe impact on affordability for housing. In the graphs that follow, therefore, the “% of urban households that canafford this house” is a rough figure – indicative of the region in which investors and developers can explore opportunities. More detailed, local work is necessaryto understand these opportunities better.
> $50 000
$25 000 – $50 000
$14 000 – $25 000
$8 000 – $14 000
$5 000 – $8 000
$3 600 – $5 000
$2 400 – $3 600
$1 600 – $2 400
$800 – $1 600
<$800
AFRICA
Rural | UrbanAnnual household income US$
No. of households (thousands) 40000 30000 20000 10000 0 10000 20000
0.1% 0.6%
0.4% 1.2%
0.9% 2.4%
2.4% 4.7%
4.2% 5.9%
4.8% 4.5%
7.7% 5.3%
8.6% 4.6%
15.9% 5.5%
14.1% 2.4%
59% 41%
5

> $50 000
$25 000 – $50 000
$14 000 – $25 000
$8 000 – $14 000
$5 000 – $8 000
$3 600 – $5 000
$2 400 – $3 600
$1 600 – $2 400
$800 – $1 600
<$800
- - - Average income needed for the cheapest newly built house by a formal developer, 2015
- - - Average annual urban household income, 2014
ALGERIA
$11 851
$8 806
Rural | UrbanAnnual household income US$
No. of households (thousands) 1000 500 0 500 1000 1500 2000
> $50 000
$25 000 – $50 000
$14 000 – $25 000
$8 000 – $14 000
$5 000 – $8 000
$3 600 – $5 000
$2 400 – $3 600
$1 600 – $2 400
$800 – $1 600
<$800
- - - Average income needed for the cheapest newly built house by a formal developer, 2015
- - - Average annual urban household income, 2014
BENIN
$10 351
$3 514
Rural | UrbanAnnual household income US$
No. of households (thousands) 500 400 300 200 100 0 100 200 300
> $50 000
$25 000 – $50 000
$14 000 – $25 000
$8 000 – $14 000
$5 000 – $8 000
$3 600 – $5 000
$2 400 – $3 600
$1 600 – $2 400
$800 – $1 600
<$800
- - - Average income needed for the cheapest newly built house by a formal developer, 2015
- - - Average annual urban household income, 2014
ANGOLA
$108 638
$12 408
Rural | UrbanAnnual household income US$
No. of households (thousands) 800 400 200 0 200 400 600
> $50 000
$25 000 – $50 000
$14 000 – $25 000
$8 000 – $14 000
$5 000 – $8 000
$3 600 – $5 000
$2 400 – $3 600
$1 600 – $2 400
$800 – $1 600
<$800
- - - Average income needed for the cheapest newly built house by a formal developer, 2015
- - - Average annual urban household income, 2014
BOTSWANA
$26 564
$16 194
Rural | UrbanAnnual household income US$
No. of households (thousands) 60 40 20 0 20 40 60 80
Population:24 400 000
Urbanisation rate:4.88
Cost of Unit (US$):200 000
% of urban households that can afford this house:
2.2%
Population:10 599 510
Urbanisation rate:3.63
Cost of Unit (US$):15 188
% of urban households that can afford this house:
6.8%
Population:20 38 587
Urbanisation rate:1.3
Cost of Unit (US$):69 640
% of urban households that can afford this house:
19.0%
Population:39 928 947
Urbanisation rate:2.71
Cost of Unit (US$):32 500
% of urban households that can afford this house:
57.1%
6

Africa Housing Finance Yearbook 2015
> $50 000
$25 000 – $50 000
$14 000 – $25 000
$8 000 – $14 000
$5 000 – $8 000
$3 600 – $5 000
$2 400 – $3 600
$1 600 – $2 400
$800 – $1 600
<$800
- - - Average income needed for the cheapest newly built house by a formal developer, 2015- - - Average annual urban household income, 2014
BURKINA FASO
$2 761
$2 991
Rural | UrbanAnnual household income US$
No. of households (thousands) 1000 800 600 400 200 0 200 400
> $50 000
$25 000 – $50 000
$14 000 – $25 000
$8 000 – $14 000
$5 000 – $8 000
$3 600 – $5 000
$2 400 – $3 600
$1 600 – $2 400
$800 – $1 600
<$800
- - - Average income needed for the cheapest newly built house by a formal developer, 2015
- - - Average annual urban household income, 2014
BURUNDI
$18 325
$2 210
Rural | UrbanAnnual household income US$
No. of households (thousands) 800 700 600 500 400 300 200 100 0 100 200
> $50 000
$25 000 – $50 000
$14 000 – $25 000
$8 000 – $14 000
$5 000 – $8 000
$3 600 – $5 000
$2 400 – $3 600
$1 600 – $2 400
$800 – $1 600
<$800
- - - Average income needed for the cheapest newly built house by a formal developer, 2013- - - Average annual urban household income, 2014
CAMEROON
$24 084
$4 853
Rural | UrbanAnnual household income US$
No. of households (thousands) 800 600 400 200 0 200 400 600 800
> $50 000
$25 000 – $50 000
$14 000 – $25 000
$8 000 – $14 000
$5 000 – $8 000
$3 600 – $5 000
$2 400 – $3 600
$1 600 – $2 400
$800 – $1 600
<$800
- - - Average income needed for the cheapest newly built house by a formal developer, 2015- - - Average annual urban household income, 2014
CABO VERDE
$9 239
$12 052
Rural | UrbanAnnual household income US$
No. of households (thousands) 10 5 0 5 10 15 20
Population:17 419 615
Urbanisation rate:5.75
Cost of Unit (US$):8 429
% of urban households that can afford this house:
41.7%
Population:10 482 752
Urbanisation rate:5.59
Cost of Unit (US$):25 000
% of urban households that can afford this house:
0.4%
Population:22 818 632
Urbanisation rate:3.57
Cost of Unit (US$):42 163
% of urban households that can afford this house:
3.7%
Population:503 637
Urbanisation rate:2.05
Cost of Unit (US$):28 000
% of urban households that can afford this house:
36.5%
7

8
> $50 000
$25 000 – $50 000
$14 000 – $25 000
$8 000 – $14 000
$5 000 – $8 000
$3 600 – $5 000
$2 400 – $3 600
$1 600 – $2 400
$800 – $1 600
<$800
- - - Average income needed for the cheapest newly built house by a formal developer, 2015- - - Average annual urban household income, 2014
CENTRAL AFRICAN REPUBLIC
$23 853
$1 490
Rural | UrbanAnnual household income US$
No. of households (thousands) 400 300 200 100 0 100 200 300
> $50 000
$25 000 – $50 000
$14 000 – $25 000
$8 000 – $14 000
$5 000 – $8 000
$3 600 – $5 000
$2 400 – $3 600
$1 600 – $2 400
$800 – $1 600
<$800
- - - Average income needed for the cheapest newly built house by a formal developer, 2015
- - - Average annual urban household income, 2014
CHAD
$15 582
$1 853
Rural | UrbanAnnual household income US$
No. of households (thousands) 1400 1200 1000 800 600 400 200 0 200 400
> $50 000
$25 000 – $50 000
$14 000 – $25 000
$8 000 – $14 000
$5 000 – $8 000
$3 600 – $5 000
$2 400 – $3 600
$1 600 – $2 400
$800 – $1 600
<$800
- - - Average Income needed to purchase cheapest 3 bedroom semi-detached house, 2015
- - - Average annual urban household income, 2014
COMOROS
$78 567
$4 584
Rural | UrbanAnnual household income US$
No. of households (thousands) 30 25 20 15 10 5 0 5 10 15
> $50 000
$25 000 – $50 000
$14 000 – $25 000
$8 000 – $14 000
$5 000 – $8 000
$3 600 – $5 000
$2 400 – $3 600
$1 600 – $2 400
$800 – $1 600
<$800
- - - Average income needed for the cheapest newly built house by a formal developer, 2015
- - - Average annual urban household income, 2014
CÔTE D'IVOIRE
$8 863
$6 718
Rural | UrbanAnnual household income US$
No. of households (thousands) 300 200 100 0 100 200 300 400
Population:4 709 203
Urbanisation rate:2.64
Cost of Unit (US$):20 229
% of urban households that can afford this house:
0.9%
Population:13 211 146
Urbanisation rate:3.48
Cost of Unit (US$):25 000
% of urban households that can afford this house:
0.4%
Population:752 438
Urbanisation rate:2.67
Cost of Unit (US$):131 000
% of urban households that can afford this house:
1.4%
Population:20 804 774
Urbanisation rate:3.72
Cost of Unit (US$):16 858
% of urban households that can afford this house:
59.1%

Africa Housing Finance Yearbook 2015
9
> $50 000
$25 000 – $50 000
$14 000 – $25 000
$8 000 – $14 000
$5 000 – $8 000
$3 600 – $5 000
$2 400 – $3 600
$1 600 – $2 400
$800 – $1 600
<$800
- - - Average income needed for the cheapest newly built house by a formal developer, 2015
- - - Average annual urban household income, 2014
DEMOCRATIC REPUBLIC OF CONGO
$35 621
$2 551
Rural | UrbanAnnual household income US$
No. of households (thousands) 5000 4000 3000 2000 1000 0 1000 2000
> $50 000
$25 000 – $50 000
$14 000 – $25 000
$8 000 – $14 000
$5 000 – $8 000
$3 600 – $5 000
$2 400 – $3 600
$1 600 – $2 400
$800 – $1 600
<$800
- - - Average income needed for the cheapest newly built house by a formal developer, 2013
- - - Average annual urban household income, 2014
DJIBOUTI
$12 621
$9 351
Rural | UrbanAnnual household income US$
No. of households (thousands) 10 5 0 5 10 15 20 25 30 35
> $50 000
$25 000 – $50 000
$14 000 – $25 000
$8 000 – $14 000
$5 000 – $8 000
$3 600 – $5 000
$2 400 – $3 600
$1 600 – $2 400
$800 – $1 600
<$800
- - - Average income needed for the cheapest newly built house by a formal developer, 2015
- - - Average annual urban household income, 2014
EGYPT, ARAB REP.
$8 126
$4 178
Rural | UrbanAnnual household income US$
No. of households (thousands) 5000 4000 3000 2000 1000 0 1000 2000 3000 4000
> $50 000
$25 000 – $50 000
$14 000 – $25 000
$8 000 – $14 000
$5 000 – $8 000
$3 600 – $5 000
$2 400 – $3 600
$1 600 – $2 400
$800 – $1 600
<$800
- - - Average income needed for the cheapest newly built house by a formal developer, 2015
- - - Average annual urban household income, 2014
ERITREA
$34 770
$1 074
Rural | UrbanAnnual household income US$
No. of households (thousands) 1000 800 600 400 200 0 200
Population:69 360 118
Urbanisation rate:3.93
Cost of Unit (US$):25 000
% of urban households that can afford this house:
0.3%
Population:886 313
Urbanisation rate:1.62
Cost of Unit (US$):30 000
% of urban households that can afford this house:
39.3%
Population:83 386 739
Urbanisation rate:1.71
Cost of Unit (US$):9 102
% of urban households that can afford this house:
86.3%
Population:6 536 176
Urbanisation rate:5.10
Cost of Unit (US$):90 901
% of urban households that can afford this house:
0.0%

> $50 000
$25 000 – $50 000
$14 000 – $25 000
$8 000 – $14 000
$5 000 – $8 000
$3 600 – $5 000
$2 400 – $3 600
$1 600 – $2 400
$800 – $1 600
<$800
- - - Average income needed for the cheapest newly built house by a formal developer, 2015
- - - Average annual urban household income, 2014
ETHIOPIA
$17 152
$1 743
Rural | UrbanAnnual household income US$
No. of households (thousands) 8000 6000 4000 2000 0 2000 4000
> $50 000
$25 000 – $50 000
$14 000 – $25 000
$8 000 – $14 000
$5 000 – $8 000
$3 600 – $5 000
$2 400 – $3 600
$1 600 – $2 400
$800 – $1 600
<$800
GAMBIA, THE
$29 943
$3 582
Rural | UrbanAnnual household income US$
No. of households (thousands) 40 30 20 10 0 10 20 30 40 50
- - - Average income needed for the cheapest newly built house by a formal developer, 2015
- - - Average annual urban household income, 2014
> $50 000
$25 000 – $50 000
$14 000 – $25 000
$8 000 – $14 000
$5 000 – $8 000
$3 600 – $5 000
$2 400 – $3 600
$1 600 – $2 400
$800 – $1 600
<$800
- - - Average income needed for the cheapest newly built house by a formal developer, 2015
- - - Average annual urban household income, 2014
GHANA
$21 982
$4 489
Rural | UrbanAnnual household income US$
No. of households (thousands) 1000 800 600 400 200 0 200 400 600 800
> $50 000
$25 000 – $50 000
$14 000 – $25 000
$8 000 – $14 000
$5 000 – $8 000
$3 600 – $5 000
$2 400 – $3 600
$1 600 – $2 400
$800 – $1 600
<$800
- - - Average income needed for the cheapest newly built house by a formal developer, 2015
- - - Average annual urban household income, 2014
GUINEA BISSAU
$89 892
$3 343
Rural | UrbanAnnual household income US$
No. of households (thousands) 50 40 30 20 10 0 10 20 30 40
Population:96 506 031
Urbanisation rate:4.85
Cost of Unit (US$):34 515
% of urban households that can afford this house:
0.1%
Population:1 908 954
Urbanisation rate:4.27
Cost of Unit (US$):50 000
% of urban households that can afford this house:
0.8%
Population:26 442 178
Urbanisation rate:3.29
Cost of Unit (US$):24 359
% of urban households that can afford this house:
3.4%
Population:1 745 798
Urbanisation rate:4.08
Cost of Unit (US$):153 429
% of urban households that can afford this house:
0.0%
10

Africa Housing Finance Yearbook 2015
> $50 000
$25 000 – $50 000
$14 000 – $25 000
$8 000 – $14 000
$5 000 – $8 000
$3 600 – $5 000
$2 400 – $3 600
$1 600 – $2 400
$800 – $1 600
<$800
- - - Average income needed for the cheapest newly built house by a formal developer, 2015
- - - Average annual urban household income, 2014
KENYA
$8 821
$4 140
Rural | UrbanAnnual household income US$
No. of households (thousands) 3000 2500 2000 1500 1000 500 0 500 1000
> $50 000
$25 000 – $50 000
$14 000 – $25 000
$8 000 – $14 000
$5 000 – $8 000
$3 600 – $5 000
$2 400 – $3 600
$1 600 – $2 400
$800 – $1 600
<$800
- - - Average income needed for the cheapest newly built house by a formal developer, 2015
- - - Average annual urban household income, 2014
LESOTHO
$6 578
$6 286
Rural | UrbanAnnual household income US$
No. of households (thousands) 80 70 60 50 40 30 20 10 0 10 20 30
> $50 000
$25 000 – $50 000
$14 000 – $25 000
$8 000 – $14 000
$5 000 – $8 000
$3 600 – $5 000
$2 400 – $3 600
$1 600 – $2 400
$800 – $1 600
<$800
- - - Average income needed for the cheapest newly built house by a formal developer, 2015
- - - Average annual urban household income, 2014
LIBERIA
$6 259
$2 413
Rural | UrbanAnnual household income US$
No. of households (thousands) 250 200 150 100 50 0 50 100 150 200
> $50 000
$25 000 – $50 000
$14 000 – $25 000
$8 000 – $14 000
$5 000 – $8 000
$3 600 – $5 000
$2 400 – $3 600
$1 600 – $2 400
$800 – $1 600
<$800
- - - Average income needed for the cheapest newly built house by a formal developer, 2013
- - - Average annual urban household income, 2014
LIBYA
$18 013
$7 989
Rural | UrbanAnnual household income US$
No. of households (thousands) 100 50 0 50 100 150 200 250 300
Population:45 545 980
Urbanisation rate:4.32
Cost of Unit (US$):17 000
% of urban households that can afford this house:
10.2%
Population:2 097 511
Urbanisation rate:3.06
Cost of Unit (US$):14 615
% of urban households that can afford this house:
39.0%
Population:4 396 873
Urbanisation rate:3.15
Cost of Unit (US$):15 000
% of urban households that can afford this house:
5.9%
Population:6 253 452
Urbanisation rate:1.08
Cost of Unit (US$):50 000
% of urban households that can afford this house:
9.3%
11

12
> $50 000
$25 000 – $50 000
$14 000 – $25 000
$8 000 – $14 000
$5 000 – $8 000
$3 600 – $5 000
$2 400 – $3 600
$1 600 – $2 400
$800 – $1 600
<$800
- - - Average income needed for the cheapest newly built house by a formal developer, 2015
- - - Average annual urban household income, 2014
MADAGASCAR
$65 057
$1 291
Rural | UrbanAnnual household income US$
No. of households (thousands) 3000 2500 2000 1 500 1000 500 0 500 1000
> $50 000
$25 000 – $50 000
$14 000 – $25 000
$8 000 – $14 000
$5 000 – $8 000
$3 600 – $5 000
$2 400 – $3 600
$1 600 – $2 400
$800 – $1 600
<$800
- - - Average income needed for the cheapest newly built house by a formal developer, 2015
- - - Average annual urban household income, 2014
MALAWI
$14 666
$2 103
Rural | UrbanAnnual household income US$
No. of households (thousands) 2500 2000 1500 1000 500 0 500
> $50 000
$25 000 – $50 000
$14 000 – $25 000
$8 000 – $14 000
$5 000 – $8 000
$3 600 – $5 000
$2 400 – $3 600
$1 600 – $2 400
$800 – $1 600
<$800
- - - Average income needed for the cheapest newly built house by a formal developer, 2015
- - - Average annual urban household income, 2014
MALI
$2 669
$2 259
Rural | UrbanAnnual household income US$
No. of households (thousands) 800 600 400 200 0 200 400
> $50 000
$25 000 – $50 000
$14 000 – $25 000
$8 000 – $14 000
$5 000 – $8 000
$3 600 – $5 000
$2 400 – $3 600
$1 600 – $2 400
$800 – $1 600
<$800
- - - Average annual urban household income, 2014
MAURITANIA
$5 167
Rural | UrbanAnnual household income US$
No. of households (thousands) 100 80 60 40 20 0 20 40 60 80 100
Population:23 571 962
Urbanisation rate:4.65
Cost of Unit (US$):138 000
% of urban households that can afford this house:
0.0%
Population:17 964 697
Urbanisation rate:3.77
Cost of Unit (US$):14 100
% of urban households that can afford this house:
1.1%
Population:15 768 227
Urbanisation rate:5.02
Cost of Unit (US$):5 802
% of urban households that can afford this house:
39.4%
Population:3 984 457
Urbanisation rate:3.45
Cost of Unit (US$):–
% of urban households that can afford this house:
–
Africa Housing Finance Yearbook 2015
13
> $50 000
$25 000 – $50 000
$14 000 – $25 000
$8 000 – $14 000
$5 000 – $8 000
$3 600 – $5 000
$2 400 – $3 600
$1 600 – $2 400
$800 – $1 600
<$800
- - - Average income needed for the cheapest newly built house (excluding land), 2015
- - - Average annual urban household income, 2014
MAURITIUS
$23 327
$9 231
Rural | UrbanAnnual household income US$
No. of households (thousands) 80 60 40 20 0 20 40 60
> $50 000
$25 000 – $50 000
$14 000 – $25 000
$8 000 – $14 000
$5 000 – $8 000
$3 600 – $5 000
$2 400 – $3 600
$1 600 – $2 400
$800 – $1 600
<$800
- - - Average income needed for the cheapest newly built house by a formal developer, 2015
- - - Average annual urban household income, 2014
MOROCCO
$3 446
$11 199
Rural | UrbanAnnual household income US$
No. of households (thousands) 800 600 400 200 0 200 400 600 800 1000 1200
> $50 000
$25 000 – $50 000
$14 000 – $25 000
$8 000 – $14 000
$5 000 – $8 000
$3 600 – $5 000
$2 400 – $3 600
$1 600 – $2 400
$800 – $1 600
<$800
- - - Average income needed for the cheapest newly built house by a formal developer, 2015
- - - Average annual urban household income, 2014
MOZAMBIQUE
$16 169
$2 693
Rural | UrbanAnnual household income US$
No. of households (thousands) 2000 1500 1000 500 0 500 1000
> $50 000
$25 000 – $50 000
$14 000 – $25 000
$8 000 – $14 000
$5 000 – $8 000
$3 600 – $5 000
$2 400 – $3 600
$1 600 – $2 400
$800 – $1 600
<$800
- - - Average income needed for the cheapest newly built house by a formal developer, 2015
- - - Average annual urban household income, 2014
NAMIBIA
$15 244
$8 427
Rural | UrbanAnnual household income US$
No. of households (thousands) 60 40 20 0 20 40 60
Population:1 260 934
Urbanisation rate:-0.23
Cost of Unit (US$):31 000
% of urban households that can afford this house:
94.4%
Population:33 492 909
Urbanisation rate:2.30
Cost of Unit (US$):14 478
% of urban households that can afford this house:
88.4%
Population:26 472 977
Urbanisation rate:3.28
Cost of Unit (US$):30 000
% of urban households that can afford this house:
1.7%
Population:2 347 988
Urbanisation rate:4.13
Cost of Unit (US$):18 563
% of urban households that can afford this house:
55%

14
> $50 000
$25 000 – $50 000
$14 000 – $25 000
$8 000 – $14 000
$5 000 – $8 000
$3 600 – $5 000
$2 400 – $3 600
$1 600 – $2 400
$800 – $1 600
<$800
- - - Average income needed for the cheapest newly built house by a formal developer, 2013
- - - Average annual urban household income, 2014
NIGER
$5 278
$2 091
Rural | UrbanAnnual household income US$
No. of households (thousands) 1400 1200 1000 800 600 400 200 0 200 400
> $50 000
$25 000 – $50 000
$14 000 – $25 000
$8 000 – $14 000
$5 000 – $8 000
$3 600 – $5 000
$2 400 – $3 600
$1 600 – $2 400
$800 – $1 600
<$800
- - - Average income needed for the cheapest newly built house by a formal developer, 2013
- - - Average annual urban household income, 2014
NIGERIA
$10 953
$8 936
Rural | UrbanAnnual household income US$
No. of households (thousands) 5000 4000 3000 2000 1000 0 1000 2000 3000 4000 5000
> $50 000
$25 000 – $50 000
$14 000 – $25 000
$8 000 – $14 000
$5 000 – $8 000
$3 600 – $5 000
$2 400 – $3 600
$1 600 – $2 400
$800 – $1 600
<$800
- - - Average income needed for the cheapest newly built house by a formal developer, 2015
- - - Average annual urban household income, 2014
RWANDA
$18 484
$2 377
Rural | UrbanAnnual household income US$
No. of households (thousands) 1200 1000 800 600 400 200 0 200 400
> $50 000
$25 000 – $50 000
$14 000 – $25 000
$8 000 – $14 000
$5 000 – $8 000
$3 600 – $5 000
$2 400 – $3 600
$1 600 – $2 400
$800 – $1 600
<$800
- - - Average income needed for the cheapest newly built house by a formal developer, 2012- - - Average annual urban household income, 2014
SENEGAL
$8 256
$7 959
Rural | UrbanAnnual household income US$
No. of households (thousands) 250 200 150 100 50 0 50 100 150 200 250
Population:18 534 802
Urbanisation rate:5.23
Cost of Unit (US$):10 958
% of urban households that can afford this house:
4.1%
Population:178 516 904
Urbanisation rate:4.61
Cost of Unit (US$):16 400
% of urban households that can afford this house:
35.2%
Population:12 100 049
Urbanisation rate:6.26
Cost of Unit (US$):34 247
% of urban households that can afford this house:
2.0%
Population:14 548 171
Urbanisation rate:3.62
Cost of Unit (US$):21 915
% of urban households that can afford this house:
31.4%

Africa Housing Finance Yearbook 2015
15
> $50 000
$25 000 – $50 000
$14 000 – $25 000
$8 000 – $14 000
$5 000 – $8 000
$3 600 – $5 000
$2 400 – $3 600
$1 600 – $2 400
$800 – $1 600
<$800
- - - Average income needed for the cheapest newly built house by a formal developer - - - Average annual urban household income, 2014
SEYCHELLES
$65 925
$18 199
Rural | UrbanAnnual household income US$
No. of households (thousands) 5 4 3 2 1 0 1 2 3 4 5
> $50 000
$25 000 – $50 000
$14 000 – $25 000
$8 000 – $14 000
$5 000 – $8 000
$3 600 – $5 000
$2 400 – $3 600
$1 600 – $2 400
$800 – $1 600
<$800
- - - Average income needed for the cheapest newly built house by a formal developer, 2015
- - - Average annual urban household income, 2014
SIERRA LEONE
$33 607
$4 088
Rural | UrbanAnnual household income US$
No. of households (thousands) 300 250 200 150 100 50 0 50 100 150
> $50 000
$25 000 – $50 000
$14 000 – $25 000
$8 000 – $14 000
$5 000 – $8 000
$3 600 – $5 000
$2 400 – $3 600
$1 600 – $2 400
$800 – $1 600
<$800
- - - Average income needed for the cheapest newly built house by a formal developer, 2015
- - - Average annual urban household income, 2014
SOMALIA
$37 220
$1 522
Rural | UrbanAnnual household income US$
No. of households (thousands) 800 600 400 200 0 200 400
> $50 000
$25 000 – $50 000
$14 000 – $25 000
$8 000 – $14 000
$5 000 – $8 000
$3 600 – $5 000
$2 400 – $3 600
$1 600 – $2 400
$800 – $1 600
<$800
- - - Average income needed for the cheapest newly built house by a formal developer, 2015
- - - Average annual urban household income, 2014
SOUTH AFRICA
$14 578
$12 148
Rural | UrbanAnnual household income US$
No. of households (thousands) 1000 500 0 500 1000 1500 2000
Population:91 526
Urbanisation rate:2.41
Cost of Unit (US$):160 000
% of urban households that can afford this house:
7.4%
Population:6 205 382
Urbanisation rate:2.74
Cost of Unit (US$):50 000
% of urban households that can afford this house:
0.7%
Population:10 805 651
Urbanisation rate:4.11
Cost of Unit (US$):100 000
% of urban households that can afford this house:
0.0%
Population:54 001 953
Urbanisation rate:2.37
Cost of Unit (US$):26 763
% of urban households that can afford this house:
48.3%

16
> $50 000
$25 000 – $50 000
$14 000 – $25 000
$8 000 – $14 000
$5 000 – $8 000
$3 600 – $5 000
$2 400 – $3 600
$1 600 – $2 400
$800 – $1 600
<$800
- - - Average income needed for the cheapest newly built house by a formal developer, 2015
- - - Average annual urban household income, 2014
SOUTH SUDAN
$22 668
$2 464
Rural | UrbanAnnual household income US$
No. of households (thousands) 500 400 300 200 100 0 100 200
> $50 000
$25 000 – $50 000
$14 000 – $25 000
$8 000 – $14 000
$5 000 – $8 000
$3 600 – $5 000
$2 400 – $3 600
$1 600 – $2 400
$800 – $1 600
<$800
- - - Average income needed for the cheapest newly built house by a formal developer, 2015
- - - Average annual urban household income, 2014
SWAZILAND
$16115
$4 381
Rural | UrbanAnnual household income US$
No. of households (thousands) 40 35 30 25 20 15 10 5 0 5 10 15
> $50 000
$25 000 – $50 000
$14 000 – $25 000
$8 000 – $14 000
$5 000 – $8 000
$3 600 – $5 000
$2 400 – $3 600
$1 600 – $2 400
$800 – $1 600
<$800
- - - Average income needed for the cheapest newly built house by a formal developer, 2015
- - - Average annual urban household income, 2014
TANZANIA
$14 820
$2 259
Rural | UrbanAnnual household income US$
No. of households (thousands) 3500 3000 2500 2000 1500 1000 500 0 500 1000 1500 2000
> $50 000
$25 000 – $50 000
$14 000 – $25 000
$8 000 – $14 000
$5 000 – $8 000
$3 600 – $5 000
$2 400 – $3 600
$1 600 – $2 400
$800 – $1 600
<$800
- - - Average income needed for the cheapest newly built house by a formal developer, 2015
- - - Average annual urban household income, 2014
TOGO
$4 467
$3 671
Rural | UrbanAnnual household income US$
No. of households (thousands) 250 200 150 100 50 0 50 100 150
Population:11 738 718
Urbanisation rate:4.93
Cost of Unit (US$):33 000
% of urban households that can afford this house:
1.2%
Population:1 267 704
Urbanisation rate:1.34
Cost of Unit (US$):12 718
% of urban households that can afford this house:
93.2%
Population:50 757 459
Urbanisation rate:5.32
Cost of Unit (US$):20 992
% of urban households that can afford this house:
0.7%
Population:6 993 244
Urbanisation rate:3.8
Cost of Unit (US$):11 945
% of urban households that can afford this house:
30.2%

Africa Housing Finance Yearbook 2015
17
> $50 000
$25 000 – $50 000
$14 000 – $25 000
$8 000 – $14 000
$5 000 – $8 000
$3 600 – $5 000
$2 400 – $3 600
$1 600 – $2 400
$800 – $1 600
<$800
- - - Average income needed for the cheapest newly built house by a formal developer, 2015
- - - Average annual urban household income, 2014
TUNISIA
$15 704
$8 342
Rural | UrbanAnnual household income US$
No. of households (thousands) 300 200 100 0 100 200 300 400 500 600
> $50 000
$25 000 – $50 000
$14 000 – $25 000
$8 000 – $14 000
$5 000 – $8 000
$3 600 – $5 000
$2 400 – $3 600
$1 600 – $2 400
$800 – $1 600
<$800
- - - Average income needed for the cheapest newly built house by a formal developer, 2015
- - - Average annual urban household income, 2014
UGANDA
$11 149
$3 417
Rural | UrbanAnnual household income US$
No. of households (thousands) 3000 2500 2000 1500 1000 500 0 500
> $50 000
$25 000 – $50 000
$14 000 – $25 000
$8 000 – $14 000
$5 000 – $8 000
$3 600 – $5 000
$2 400 – $3 600
$1 600 – $2 400
$800 – $1 600
<$800
- - - Average income needed for the cheapest newly built house by a formal developer, 2015
- - - Average annual urban household income, 2014
ZAMBIA
$36 960
$5 102
Rural | UrbanAnnual household income US$
No. of households (thousands) 700 600 500 400 300 200 100 0 100 200 300
> $50 000
$25 000 – $50 000
$14 000 – $25 000
$8 000 – $14 000
$5 000 – $8 000
$3 600 – $5 000
$2 400 – $3 600
$1 600 – $2 400
$800 – $1 600
<$800
- - - Average income needed for the cheapest newly built house by a formal developer, 2015
- - - Average annual urban household income, 2014
ZIMBABWE
$8 675
$8 308
Rural | UrbanAnnual household income US$
No. of households (thousands) 600 500 400 300 200 100 0 100 200 300
Population:10 996 600
Urbanisation rate:1.29
Cost of Unit (US$):25 500
% of urban households that can afford this house:
70.6%
Population:38 844 624
Urbanisation rate:5.42
Cost of Unit (US$):13 600
% of urban households that can afford this house:
7.4%
Population:15 021 002
Urbanisation rate:4.37
Cost of Unit (US$):65 000
% of urban households that can afford this house:
3.1%
Population:14 600 000
Urbanisation rate:2.66
Cost of Unit (US$):18 000
% of urban households that can afford this house:
29.6%

18
800
700
600
500
400
300
200
100
0
Housing affordability and urban population figures bring into sharp focus the relevance of the recent trend of megacities. Across the continent, greenfield city projectsare being developed: mixed residential, commercial and retail developments, such as Kenya’s Garden City, which opened in September 2015. Others include TatuCity in Nairobi, Kenya; Eko Atlantic in Lagos, Nigeria; La Cite de Fleuve in Kinshasa, DRC; Hope City in Accra, Ghana; Kigamboni New City in Dar es Salaam, Tanzania;and Diamniadio Valley digital city, planned in Senegal11. These projects are hugely ambitious involving massive investments by the private sector and substantialregulatory support and administrative engagement by the public sector. But when the entry level unit in La Cite de Fleuve is US$190 000, or when Garden Cityyields a total of 400 units, their relevance for meeting the breadth of the demand comes into question. Will developers (and governments) manage to shift theirefforts from these high value initiatives targeted at high net-worth individuals and the diaspora, to engaging with the realities of affordability that truly shape thebacklogs on which their diversification and investment strategies are justified? This is the challenge of the future.
A further perspective. The housing affordability story is significantly influenced by the price of building materials, and this is an issue that CAHF is exploring withits partners in the coming year. Key among these is the price of cement. If it takes 35-40 bags of cement for the construction of a 40m2 brick and mortar house,the per bag cost is a critical factor. In 2015, the most expensive country with respect to cement, at US$30,30 for a 50kg bag, was the DRC, followed closely bySouth Sudan, where the same bag cost US$29,00. Compare this with Nigeria (US$11,00), Kenya (US$7,60), and Senegal (US$5,06), and the cheapest source ofcement, Tunisia (US$3,53), and the capacity of a household to build their home with cement becomes somewhat more clear.
Assuming 25% of annual household income is spent on cement, how many bags could a household buy?
Tuni
sia
Mau
ritiu
s
Sout
h Af
rica
Seyc
helle
s
Alge
ria
Nam
ibia
Ango
la
Sene
gal
Mor
occo
Egyp
t
Leso
tho
Cote
d' I
voire
Nige
ria
Liby
a
Djib
outi
Zim
babw
e
Zam
bia
Togo
Beni
n
Ghan
a
Com
oros
Keny
a
Gam
bia
Moz
ambi
que
Sier
ra L
eone
Guin
ea-B
issa
u
Mal
i
Ethi
opia
Tanz
ania
Ugan
da
Burk
ina
Faso
Libe
ria
Mal
awi
Nige
r
Mad
agas
car
Rwan
da
Som
alia
Buru
ndi
Cent
ral A
frica
n Re
publ
ic
Sout
h Su
dan
DRC
Eritr
ea
n Bags of cement that 25% of avg annual hh income would buy in urban areasn Bags of cement that 25% of avg annual hh income would buy in rural areas
$30
$25
$20
$15
$10
$5
$0
Cost of a standard 50kg bag of cement
DRC
Sout
h Su
dan
Buru
ndi
Eritr
ea
Cent
ral A
frica
n Re
publ
ic
Som
alia
Rwan
da
Zim
babw
e
Djib
outi
Nige
ria
Ugan
da
Mal
awi
Nige
r
Burk
ina
Faso
Liby
a
Sier
ra L
eone
Cote
d' I
voire
Guin
ea-B
issa
u
Libe
ria
Cam
eroo
n
Com
oros
Nam
ibia
Ghan
a
Mal
i
Keny
a
Seyc
helle
s
Zam
bia
Mor
occo
Tanz
ania
Ango
la
Mad
agas
car
Gam
bia
Swaz
iland
Mau
ritiu
s
Egyp
t
Leso
tho
Togo
Beni
n
Alge
ria
Moz
ambi
que
Ethi
opia
Sout
h Af
rica
Sene
gal
Tuni
sia
Bots
wan
a
n September, 2015n November, 2014n August, 2013n September, 2012
A 40m2 house would require about35 – 40 bags of cement for themortar.
9111115

Africa Housing Finance Yearbook 2015
19
Given these challenges, opportunities for innovative building materials that reduce the burden of cement, have become niches that investors are exploring. At thesame time, cement manufacturers themselves are also exploring new niches in this space – Lafarge Malawi, for example, has launched a new cement binder speciallyformulated for use in soil stabilised bricks. The process uses much less cement, which means that low income households who might otherwise have foregone theuse of cement entirely, can now afford to use it to improve the durability of their homes. Lafarge argues that the houses built with this technology can be 20-40percent cheaper than houses constructed with conventional material. Meanwhile, Lafarge Malawi has found itself a market that was previously excluded from buyingits product12.
4. Policy & regulatory evolution to match investor interest
Even in 2015, the key challenge that investors and developers highlight from their experiences across the continent, and including South Africa, is regulatory andpolicy uncertainty and instability. This factor is critically important because of the long term nature of housing investments. Unpredictable regulatory changes,complex legal frameworks and volatile local currencies all limit investment timeframes and challenge exit strategies, encouraging investors to look elsewhere whilegovernments get their house in order, so to speak. Government policy can have a significant impact on investor interest and market participation, simply by beingreliable.
Access to land is a key factor, and regulatory challenges in this regard also undermine the capacity to deliver at scale. At the I H S affordable housing summit, aNigerian developer, Resilient Africa, reported that of the ZAR28 billion (US$ 2.139 billion) worth of ‘large lot size property’ sold across the continent in 2014,ZAR26 billion (US$1.986 billion) was in South Africa. The ability to acquire large tracts of land for property development is constrained in very many jurisdictionsby the capacity of local governments to package and present that land as required by legislation – and to administer and manage it over time, thereafter.
Ironically, Kenyan REIT legislation requires that the property development option (the D-REIT) is restricted to 15 percent of the REIT value to help manage therisks – many of which are regulatory in nature. If REITs are to have a significant impact on the financing of housing development, governments must focus on therisks inherent in the development process, which undermine investment, or at best, make it more expensive.
And they are. A key indicator offered by the World Bank as part of its “doing business indicators” is the number of days and cost involved to register property (acommercial property, in this instance, but indicative nonetheless). Comparing data from 2012 and 2015, it is clear that there have been improvements: Rwanda,Burundi, Morocco, Lesotho, Cote d’Ivoire, Guinea-Bissau, Sierra Leone, and Senegal have all shown noticeable improvements in the time it takes to register aproperty, with Guinea-Bissau being the star performer. In Namibia, however, the time increased by a few days. In terms of cost, Rwanda, Malawi, Angola, Mozambique,Niger, Togo, DRC, Cote d’Ivoire, Comoros, Sierra Leone, Senegal and Nigeria have all improved, with the most significant savings in Senegal. The cost of registeringproperty in Zambia and Namibia increased in the period.
As governments better come to understand the capacity that investors have to offer and the significant impact that their interest can have on the progress of theirlocal housing markets, the incentive to address time delays and stumbling blocks becomes clear. World Bank support tied to the development of mortgage liquidityfacilities in Egypt (previously) and currently in Tanzania, Nigeria and the WAEMU region, is having a significant impact, and in those countries, Central Banks areincreasingly assertive in championing effective housing markets. This is also the case in South Africa, where the challenge of housing for the working class was anissue highlighted very recently by the national Finance Minister.
300
250
200
150
100
50
0
Number of days, and cost, to register a commercial property: 2015 vs. 2012
n Days 2015n Days 2012▲ Cost (% of property value) 2015l Cost (% of property value) 2012
Num
ber o
f day
s to
regi
ster
a c
omm
erci
al p
rope
rty
Mortgage interest rate (percent) and term
(years)
Rwan
daEg
ypt,
Arab
Rep
.Gh
ana
Mal
awi
Ethi
opia
Ugan
daAn
gola
Buru
ndi
Cabo
Ver
deKe
nya
Tanz
ania
Mau
ritan
iaBo
tsw
ana
Mor
occo
Tuni
sia
Sout
h Af
rica
Moz
ambi
que
Seyc
helle
sAl
geria
Swaz
iland
Gam
bia
Zim
babw
eLe
soth
oNi
ger
Eritr
eaTo
goCo
ngo,
Dem
. Rep
.Cô
te d
'Ivoi
reM
adag
asca
rCo
mor
osGu
inea
-Bis
sau
Mau
ritiu
sSi
erra
Leo
neCe
ntra
l Afri
can
Repu
blic
Beni
nM
ali
Burk
ina
Faso
Djib
outi
Libe
riaZa
mbi
aNa
mib
iaSe
nega
lCh
adSo
uth
Suda
nNi
geria
–La
gos
Cam
eroo
n
Source: Doing Business Indicators, 2012 and 2015
35
30
25
20
15
10
5
0

20
5. Growing experience and investor sophistication.
Its worth noting that investors who have lasted this long aren’t frightened – and the potential returns are enough to keep them focused on the long haul. In June 2014,private equity investor I H S announced the first close of their second fund, following the strong, risk-adjusted returns achieved in its first fund, worth ZAR1,8 billion, whichprovided financing for over 28 000 units across South Africa. Announcing their second fund, I H S said that the strong returns achieved with the first fund provided clearproof that the affordable housing market, targeted at middle and low income earners, was a sound investment, and a strong base for ongoing inflows into the sector13.
A separate example is that of Housing Finance Kenya, a leading mortgage provider in Kenya. Over the course of its operations, from its founding in 1965 by theCommonwealth Development Corporation (CDC) and the Government of Kenya, to its listing on the Nairobi stock exchange in 1992, to issuing Rights Issues of Sharesand a Corporate Bond, to launching the HF Group, an integrated property, banking and investment solutions company, in 2015, HF Kenya has increasingly engaged with thecapital market14. Its first bond issue in 2010 was hugely oversubscribed, demonstrating investor confidence in the focus and operations of this company which targeted theresidential real estate market in Kenya.
These experiences are not lost on investors, and the success of companies like the HF Group bode well for other players also operating in the market and seeking marketparticipation in their activities.
At the other end of the income spectrum, over the course of the past ten years, Habitat for Humanity Egypt has realized a home improvement lending model that is botheffective and sustainable – although the loans are subsidized with charitable assistance from Habitat for Humanity, they have achieved 98 percent repayments15. Lessonsgenerated by this model demonstrate how sound lending practice can even reach the lowest income earners, and offer insights into how the subsidy / finance mix might beeffectively achieved. This will be useful for both governments, NGOs and impact investors who are keen to work together to achieve a broader reach with respect to eachof their target markets.
In many ways, 2015 has been a hard year. Lower commodity prices, and notably, a 40 percent fall in the oil price since June 2014, have impacted on the growth forecasts formany countries. The value of local currencies has also fallen – in Ghana, by as much as 50 percent. And political instability in many regions has made any sort of investmentmuch more difficult. These factors haven’t changed the reality of an affordable housing shortage, however, and may well be stimulating investors and developers to thinkdifferently about what and to whom they deliver. The space for conversation is certainly opening up. Governments are much more open about partnering, whether formallythrough public-private partnerships, or simply through regular engagement with the private sector, to achieve goals they now realize to be mutual. In some cases, realcapacity constraints hamper their efforts, but generally there are efforts to resolve these issues too. For its part, the private sector is beginning to understand the imperativeof affordability, and the opportunities that open up when this is engaged with substantively. African cities are set to change dramatically – more houses for more people –as practitioners in both the public and private sectors pay increasing attention to the reality of and opportunity for investment in affordable housing.
1 Renaud, B (1984) Housing and financial institutions in developing countries. World Bank Staff Working Paper 658.2 As reported in Africa Property News (2015-08-25) Real estate in Africa continues to drive growth potential.3 Dick, W (2013) What’s in a REIT? Africainvestor, 1 November 2013.4 CMSA approves first real estate investment trust in East Africa. www.tanzaniadiaspora.org 23 February 2015.5 Langhan, S (2015) The role of mortgage liquidity facilities in housing finance: lessons learned from Egypt, Tanzania, Nigeria and Malaysia. Case study prepared for CAHF.6 fdiIntelligence (2015) The Africa Investment Report 2015.7 As reported in Africa Property News (2015-03-04) Global megatrends driving Real Estate growth opportunities in Africa.8 Detail Commercial Solicitors (2015) Nigeria Real Estate Guide, Volume 1, 2015 Edition.9 Gordon, R (2015) Case study: the PPC Home Owners Support Programme – Programme managed by the South African Housing Club. Case study prepared for CAHF.10 C-GIDD is a global database for GDP and income distribution data. The dataset covers 212 countries, 694 subdivisions (states, provinces, etc.) and 997 major cities from 2000 till 2025. See www.cgidd.com 11 Africa Property News (2015-04-14) Africa on a roll with a clutch of new Cities.12 See www.lafarge.com/en/durabric-earth-cement-solution-cities-challenges-malawi 13 International Housing Solutions (June 2014) News Release: Major investments flow into Affordable Housing Fund.14 Shah, S and R Ruparel (2015) The Transformation of the Housing Finance Company of Kenya. Case study prepared for CAHF.15 LaTowsky, R (2015) Sustainable NGO Microfinance of Poor and low income Housing in Egypt. A case study of Habitat for Humanity, Egypt, prepared for CAHF.

Africa Housing Finance Yearbook 2015
21
Each of the country profiles has a set of indicators on the right hand side of the page. The figures have been drawn from various sources, most notablythe African Economic Outlook database, the World Bank database, and the United Nations Development Programme. The Global Financial Inclusion (GlobalFindex) Database includes data that measures how people in 148 countries save, borrow, make payments and manage risk. The prices of cement, the formalhouse, and plot size within each country was drawn from an informal survey of practitioners that CAHF conducts annually, and adapted by the authorsfor the purpose of this report.
n Main Urban Centres: These include the capital city of the country and any other largely populated city. The United Nations World Urbanisation Prospects1 estimatesthat Africa’s urban population will increase from 455 million in 2014 to about 1.33 billion in 2050, – about three times the current population. This means that we canexpect about 20 million new urban households by 2050. This will put pressure on existing housing stock and provision of essential services which is already inadequate.
n Exchange Rate: The rate for all currencies to the US dollar currency was obtained through the forex website www.coinmill.com. The exchange rate used per countryvaries according to the period when the profile was written - generally between the months of July and September 2015. Exchange rates can fluctuate widely, however– it is therefore merely indicative of the current situation.
n Inflation Rate: Inflation as measured by the consumer price index reflects the annual percentage change in the cost to the average consumer of acquiring a basket ofgoods and services that may be fixed or changed at specified intervals, such as yearly. The Laspeyres formula is generally used.
n Population: Population counts all residents regardless of legal status or citizenship – except for refugees not permanently settled in the country of asylum, who aregenerally considered part of the population of their country of origin. The values are midyear estimates drawn from the World Bank’s World Development Indicators..
n Population growth rate: This is the rate of growth of population, measured in the middle of the year, from one year to another. The data is drawn from the WorldBank’s World Development Indicators.
n Urban population: Refers to people living in urban areas as defined by national statistical offices. It is calculated using World Bank population estimates and urbanratios from the United Nations World Urbanisation Prospects.
n Urbanisation growth rate: Refers to the rate of increase in the country’s urban population as defined by national statistical offices, expressed as a percentage.Uganda and Burkina Faso have the highest urbanisation rates in Africa, at just under six percent.
n GDP per capita: This is the gross domestic product (GDP) divided by the midyear population. GDP is the sum of all value added, or simply the gross value of output,by all resident producers in the economy without making deductions for depreciation of assets or for depletion and degradation of natural resources. Data is expressedin current U.S. dollars. It provides a rough indication of the residents’ standard of living, but misses the important factor of inequality, and so must be read together withthe Gini Coefficient and the percent of the population below the poverty line. This data is drawn from the World Bank’s World Development Indicators.
n GDP growth rate: Is the annual percentage growth rate of GDP at market prices based on constant local currency. Aggregates are based on constant 2005 U.S.dollars. GDP growth rate measures the growth in the economy. This data is also drawn from the World Bank’s World Development Indicators.
n GNI Per Capita, Atlas method: GNI per capita (formerly GNP per capita) is the gross national income, converted to U.S. dollars using the World Bank Atlas method,divided by the midyear population. GNI is the gross national income of a country: the sum of value added by all resident producers plus any product taxes (lesssubsidies) not included in the valuation of output plus net receipts of primary income (compensation of employees and property income) from abroad. To smoothfluctuations in prices and exchange rates, a special Atlas method of conversion is used by the World Bank. This applies a conversion factor that averages the exchangerate for a given year and the two preceding years, adjusted for differences in rates of inflation between the country, and from 2001, countries in the Euro area, Japan,the United Kingdom, and the United States. Some argue that it is a better measure of the standard of living than GDP per capita. It is measured in US dollars. Thedata is drawn from the World Bank’s World Development Indicators.
n Population below national poverty line: Nation-specific estimates of the percentage of the population falling below the national poverty line are generally basedon surveys of sub-groups, with the results weighted by the number of people in each group. Definitions of poverty vary considerably among nations,therefore, somecountries have established national poverty lines that better reflect the reality of poverty in their own local economies. This data is drawn from African Economic Outlookand is a rough measure of living standards. A benchmark that is used within this yearbook is percentage of the population earning less than US$ 2 per day ppp.
n Unemployment rate: The share of the labour force that is without work but available for and seeking employment. The number typically does not include discouragedjob seekers. This data was drawn from the World Bank database.
n GINI Coefficient: This measures levels of inequality in a country, based on the extent to which the distribution of income or consumption expenditure among thepopulation deviates from a perfectly equal distribution. A Gini index of 0 represents perfect equality, while an index of 100 implies perfect inequality. The data relatesto various years, depending on when the calculation was done for a particular country, and is drawn from the World Bank’s World Development Indicators.
n Human Development Index (Global Ranking): The Human Development Index is a composite statistic, a multi-dimensional concept. It is a summary measure ofaverage achievement in key dimensions of human development including life expectancy, education, and per capita income indicators. The HDI is the geometric meanof normalised indices for each of the three dimensions used to rank countries. The index score is drawn from the UN Development Programme. The global rankingis out of 187 countries.
n Lending Interest Rate: This is the prevailing interest rate in the country, charged as a percentage of the loan amount that usually meets the short- and medium-termfinancing needs of the private sector. While the rate offered will differ from one lender to the next, and be adjusted to the creditworthiness of borrowers and objectivesof the loan, the number offered is indicative of the state of lending in the country. The data is drawn from the World Bank’s World Development Indicators.
n Mortgage Interest Rate: The rate of interest charged on a mortgage loan to purchase a property. Coupled with mortgage term and the loan to value ratio, thisdetermines loan affordability and the percentage of the population that can afford to participate in the housing market unassisted. The mortgage interest rate is usuallylinked to prime, and is influenced by the central bank rate in the country. It also incorporates the cost of capital to a particular lender, and so varies from one lenderto the next. This data was collected by the country-profile authors for CAHF.
n Mortgage Term: Given the size of the loan, mortgage terms are generally long, and can be anywhere up to 30 years. However, a lender’s capacity to offer a long termloan is determined by their source of capital. If they rely on deposits, their ability to offer a long term loan is constrained. This is the classic challenge in most Africancountries: overcoming the capital mismatch where lenders use short term savings to fund long term loans. The liquidity facilities introduced in Egypt, Tanzania, Nigeriaand the WAEMU region address this particular challenge. Generally, mortgage terms across the continent vary from five to 20 years.
n Credit % of GDP: This indicator is written in full as domestic credit to the private sector as a percentage of GDP. It measures the financial resources provided to theprivate sector – such as through loans, purchases of non-equity securities, and trade credits and other accounts receivable – that establish a claim for repayment. It offersan indication of the extent or sophistication of the country’s credit market. For some countries these claims include credit to public enterprises. It has been expressedas a percentage of GDP. This data is drawn from the World Bank’s World Development Indicators.
Explaining the indicators
1 esa.un.org/unpd/wup/

22
n Average Mortgages % of GDP: This indicator measures the value of mortgages outstanding in a country as a percentage of GDP. It’s often regarded as a roughmeasure of the size of the mortgage market in a country relative to the size of the economy. This data is not yet collected on a consistent basis across Africa – this issomething that CAHF wishes to address. Current data provided in this report is drawn from various sources – Central Banks, World Bank research, and the HousingFinance Information Network (Hofinet).
n Price To Rent Ratio: This ratio provides a comparison between owning and renting properties in certain cities. It is calculated by dividing the average house priceby the average yearly rent price. In some cities, the ratio could vary drastically between properties within the city centre and outside the city centre. Of course, thisdata is skewed towards the high income, formal market, but is nonetheless indicative of what is formally available. The data is drawn from Numbeo, 2014.
n Gross Rental Yield: This is the amount of annual rent collected, expressed as a percentage of the total cost of the rental property. It is used to compare propertiesin different locations against each other. Rental yields also signify the rate of return from investing in the rental property. The yield may differ significantly betweenproperties within city centre and away from the city centre. Again, the data is skewed towards the high income, formal market. The data is drawn from Numbeo, 2014.
n Outstanding home loan (% age 15+): The Global Findex database is the world’s most comprehensive database on financial inclusion. The data is collected inpartnership with the Gallup World Poll, and is based on interviews with about 150 000 adults in over 140 countries. Among the questions, respondents were asked ifthey had an outstanding loan from a bank or another type of financial institution to purchase a home, an apartment, or land. This figure would include both mortgageand non-mortgage loans for housing, and represents the situation in 2014.
n Cost of standard 50kg bag of cement: This is a rough indicator of the relative cost of construction across countries. CAHF collects this data annually, from buildingmaterial supplier websites, phone calls made to suppliers, or in-country researchers.
n Price of the cheapest, newly built house by a formal developer: This is a rough indicator of the minimum price of the cheapest, newly built housing unit, by aformal developer. The indicator does not tell us how many of these houses are built annually, and only provides an indication of the cheapest house under constructionin that particular year. It is indicative of the target of the construction industry. CAHF collects this data through an email survey of researchers and practitioners acrossAfrica, and from the authors of the country profiles.
n Average rental price for a formal unit: This is a rough indicator to understand the range of average rentals per country – another indicator of housing affordability.CAHF collects this data through an email survey of researchers and practitioners across Africa, and from the authors of the country profiles.
n Minimum stand or plot size for residential property (m2): This indicator (which is country specific) is the minimum size of a stand/plot that the house will bebuilt on. CAHF collects this data through an email survey of researchers and practitioners across Africa, and from the authors of the country profiles.
n Ease of Doing Business: Ease of Doing Business ranks economies from 1 to 189, with first place being the best. A high numerical rank means that the regulatoryenvironment is not conducive to business operations. The index averages the country's percentile rankings on 10 topics covered in the World Bank's Doing BusinessSurvey, conducted annually. The ranking on each topic is the simple average of the percentile rankings on its component indicators. Property-related indicators are forcommercial, not residential property, but are nonetheless a useful indicator.
n Number of Procedures to Register Property: Part of the Ease of Doing Business survey, this represents the number of procedures required for a business tosecure rights to a commercial property.
n Time (days) to Register Property: Part of the Ease of Doing Business survey, this represents the number of calendar days needed for businesses to secure rightsto a commercial property.
n Cost (% of property value) to Register Property: Part of Ease of Doing Business survey, this represents the average cost incurred by a business to secure rightsto a commercial property, expressed as a percentage of the property value.
Investor interest in housing in Africa has grown substantially in recent years. Driven, in part, by new market opportunities created by economic growth, investorsare looking for specific initiatives on which to place their bets. Data across much of Africa is scarce, however, especially so for the housing and housing finance sectors.As investors struggle to assess market risk and opportunity with precision, they either shift their sights to more easily dimensioned investments outside the housingsector, or price for the inability to fully determine risk, ultimately narrowing the affordability of the housing output. Better data would stimulate increased investmentand enhance housing affordability. The recent development of the World Bank’s Open Data platform has made a tremendous difference, but still, very little dataexplores the nature, status and performance of residential property markets. Another new data source is Hofinet, the Housing Finance Information Network. Thisis a global initiative, which the Centre for Affordable Housing Finance in Africa is proud to support, and it includes data for a number of African countries.
CAHF is also working hard to improve the data situation. At the time of going to print, we are in the process of commissioning a study looking at the relative costsof building materials for a basic, entry level house across the main and secondary cities in about fifteen countries. We are also about to embark on a programmeto develop “Doing HOUSING Business Indicators”. Please continue to visit our website for details on our progress, or contact us directly.
As this has been a desktop study, the reporting is limited by the data and sources available. While every effort has been made to overcome these shortcomings,there will always be more information and nuance to add to the picture. In some cases, where the current status is not conclusive, both perspectives have beenoffered. In other cases, data tables necessarily have a blank spot where the data is not available. Future editions of this yearbook will strive to overcome these dataand information shortcomings. As always, comments are welcome.
Websites
http://data.worldbank.org www.doingbusiness.orgwww.africaneconomicoutlook.org http://hdr.undp.org/en/statistics http://www.numbeo.com/property-investment/http://datatopics.worldbank.org/financialinclusion/ www.hofinet.orgwww.cgidd.com

Africa Housing Finance Yearbook 2015
23
Indicator’s Name Source Short Comment
Main Urban Centres Collected by CAHF
n Exchange Rate: 1 US$ =n Inflation n Population below national poverty line n Unemployment rate (%)
African Economic Outlook Highly reliable data, periodically updated and sourced from primarysources, national statistical offices, World Bank and other reliable sources
n Population n Population growth raten Urban population (% of total) n Urbanisation raten GDP per capita (current US$) n GDP growth raten GNI per capita, Atlas method (current US$) n Lending Interest Raten Credit % of GDP
World Bank’s WorldDevelopment Indicators
World Development Indicators is a highly recommended economic datasource. Data in this databank is sourced of national statistical offices andWorld Bank’s own surveys. Highly reliable and periodically updated
n Gini co-efficient ~ World Bank’s Povcal tool
PovcalNet is an interactive computational tool that allows you to replicatethe calculations made by the World Bank's researchers in estimating theextent of absolute poverty in the world. PovcalNet also allows you tocalculate the poverty measures under different assumptions. Data iscollected by World Bank at different years for each country
n HDI (Global Ranking and Index) UN Development Programme
The HDI was created to emphasize that people and their capabilitiesshould be the ultimate criteria for assessing the development of a country,not economic growth alone. Annual surveys and report s are publishedby the UNDP’s Human Development Report Office (HDRO).
n Average Mortgages % of GDP° The Housing Finance InformationNetwork (HOFINET)
HOFINET is a quality-assured web portal that consolidates internationalhousing finance knowledge. Data is sourced from Central Banks of thecountries reported.
n Price To Rent Ratio City Centre**n Gross Rental Yield City Centre**
Numbeo online propertydatabase
Numbeo is the world’s largest database of user contributed data aboutcities and countries worldwide. This data fills in very important data gapsin property market. However, sources should be used carefully and inlimited circumstances, unless substantiated by other sources.
n Outstanding home loan (% age 15+)
Asli Demirguc-Kunt, Leora Klapper,Dorothe Singer, and Peter VanOudheusden, “The Global FindexDatabase 2014: MeasuringFinancial Inclusion around theWorld”. Policy Research WorkingPaper 7255.
The data is drawn from a survey of 150 000 people in 143 economies.The survey was carried out in 2014 by Gallup World Poll.
n Cost of a standard 50kg bag of cement n Price of the cheapest, newly built house by a
formal developer or contractorn Size of this house n Average rental price n Minimum stand or plot size for residential
property
2015 (and past years) CAHF2015 (and past years) CAHF2015 (and past years) CAHF2015 (and past years) CAHF2015 (and past years) CAHF
CAHF collects these datasets annually by email questionnaires, throughconsultants working on profiles and sometimes from online sources.Although very important, the samples used are usually very small andtherefore, this data should be used only as indicative values.
n Ease of Doing Business Rank n Number of Procedures to Register Property n Time (days) to Register Property n Cost (% of property value) to Register
Property
World Bank's Doing BusinessSurvey
Quantitative data is gathered and analysed in order to compare businessregulations environments across economies and over time. Survey isdone annually using adequate sample sizes in each country. Highly reliable.
n Number of households per income bracket –data used to inform the affordability graphs
C-GIDD, 2014www.cgidd.com
C-GIDD is a comprehensive database for GDP and income distributiondata from 2000 – 2025. Data collected from the C-GIDD database wasused per country to show an indicative split of rural and urban householdsper income category. The income categories used were customised byCAHF.
Data sources

24
25
Africa Housing Finance Yearbook 2015
Algeria
Since Bouteflika came into power in 1999, Algeria has attempted to reform themortgage system by improving access to capital markets and deepening themarket toward lower income groups. Yet, despite regulatory reforms, past trendsof excess liquidity while oil revenues were high and heavy public spending havepreviously acted as a disincentive for banks to carry out product innovation. Thehigh liquidity of banks in Algeria also lessens the need to attract further deposits,and cultivate long-term savings, or resolve asset-liability mismatches.
A four-year ban on consumer lending was ended in 2014, so banks have now beenable to offer new loan products on consumer goods. However, domestic creditto the private sector remains low overall (18.5 percent of GDP in 2014). Housingfinance is a particularly underdeveloped sector, despite the liquidity of the bankingsector. In 2015, mortgage lending was still only equivalent to about one percentof GDP, making up six percent of the US$31.4 million total lending of banks whichis dominated, at 90 percent, by business loans. In general, commercial real estatefinance in Algeria represents a larger share of total bank lending than retail housingfinance.
State-owned banks make up nearly all mortgage loans, more than 60 percent ofwhich are attributable to the CNEP (Caisse National d’Épargne de Prévoyance –National Savings and Providence Fund). Housing finance products range induration from 20 to a maximum of 40 years at a mortgage lending rate of 6.5 to8 percent. The maximum loan-to-value ratio for non-government programmes iscapped at 70 percent of the total unit cost. Government offer upfront down-
Overview
The People’s Democratic Republic of Algeria is a North African Maghreb state,with a population of 39.5 million inhabitants in 2015. At 2 381 000km2, it is thelargest country in Africa. Algeria has had modest, yet steady growth over the pastfew years, accelerating to four percent in 2014 from 2.8 percent in 2013, withGDP per capita of US$5 503. Inflation stabilised in the past years dropping froma 15 year high of around nine percent in 2013 to 3.3 percent in 2014. This is dueto the government carrying out fiscal consolidation and measures to control andimprove distribution channels for consumer goods.
The economy remains heavily dependent on the petroleum industry, whichaccounts for around 60 percent of budget revenues and 98 percent of exportearnings. Government revenue reduced substantially with the external shock ofrecord low oil prices, which resulted in a continued high fiscal deficit, at around20 percent of GDP, despite a slow-down in public expenditure in 2014. This deficitwas covered mainly by government reserves, which were estimated at US$ 185 billionby end of September 2014.
President Bouteflika announced a third five-year investment programme ofUS$262 billion for the period 2015 – 2019. However, government subsequentlydecided to revise this policy in order to restrict public spending in 2015, due to thedramatic fall in oil prices in 2014. The aim is to cope with lower oil prices and fiveconsecutive years of fiscal deficits. This has included a freeze on hiring governmentworkers (except in education and healthcare), postponing major non-priorityinvestment projects (railways, tram networks) and the use of local banks to fundprojects within the five-year development plan that are outside the equipmentbudget. This may put additional pressure on the need to diversify the Algerianeconomy and continue the government's large-scale social housing programmes,with 1.6 million units planned for 2015 to 2019.
Access to finance
The banking system in Algeria is dominated by six state-owned banks, whichcontrol almost 90 percent of banking assets, 80 percent of all loans and continueto play a key role in financing of government-prioritised projects. There are alsonine non-bank financial institutions and 23 insurance companies. Efforts to carryout financial sector reforms have been slow or are often put on hold, particularlyliberalisation of state-owned banks and companies.
KEY FIGURES
Main Urban Centres Algiers (capital), Oran.
Exchange Rate: 1 US$***Inflation 2013 | 2014 (est.) | 2015 (prov.) | 2016 (prov.) *
98.96 Algerian Dinar (DA)3.3 | 3.0 | 4.0 | 4.0
Population^ | Population growth rate (2013)^Urban population (% of total)^ | Urbanisation rate (% in 2013)^
39 928 947 | 1.8270.13 | 2.71
GDP / capita (current US$)^ | GDP growth rate (annual %)^GNI / capita, Atlas method (current US$) ^Population below national poverty line*Unemployment rate (%)*Gini co-efficient (year of survey)^^HDI (Global Ranking)" | HDI (Country Index Score)”
5 361.10 | 4.105 34023 (2006 est.)/9.836.06 (2010)93 | 0.717
Lending Interest Rate^Mortgage Interest Rate (%) | Mortgage Term (years)#Credit % of GDP^Average Mortgages % of GDP° Price To Rent Ratio City Centre** | Outside City Centre**Gross Rental Yield City Centre** | Outside of City Centre**Outstanding home loan (% age 15+)##
8.008.00 | 3018.51...32.55 | 24.73.07% | 4.05%3.86
What is the cost of standard 50kg bag of cement (in US$)? #What is the price of the cheapest, newly built house by a formaldeveloper or contractor (in US$)? #What is the size of this house (in m2)? #What is the average rental price for a formal unit (in US$/month)#What is the minimum plot size for residential property (in m²)#
5.00
32 5007520080
Ease of doing business rank !Number of procedures to register property !Time (days) to register property !Cost (% of property value) to register property !
15410557.10
*** Conmill.com The Currency Converter^ World Bank's World Development Indicators (2014)~ World Bank PovcalNet: an online poverty analysis tool, various years^^ The World Bank's PovCalnet" UNDP's International Human Development Indicators (2014)° Various: Badev et al. "Housing Finance Across Countries: New Data and Analysis" – Unpublished
paper/Hofinet/World Bank## Global Financial Inclusion Database (FINDEX)# CAHF Annual Survey Data (September 2015)! World Bank's Doing Business Survey Data (2015)** Numbeo Online User-Contributed Database/ CIA World Factbook
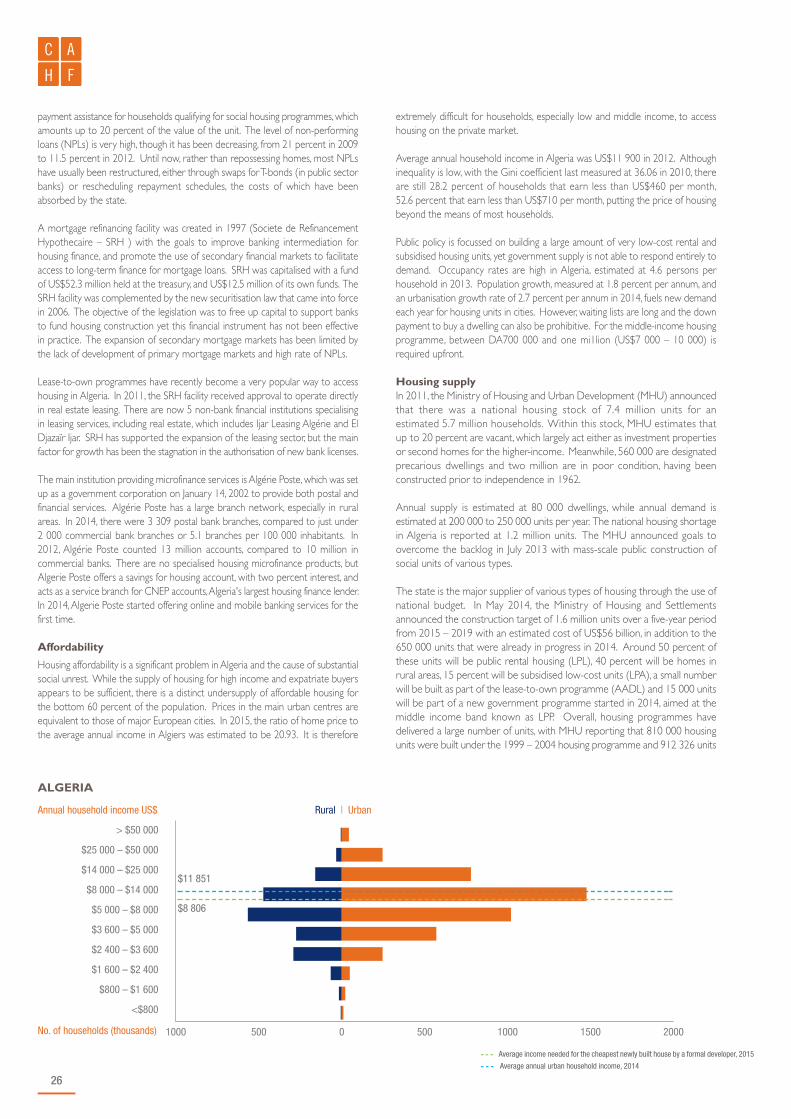
26
payment assistance for households qualifying for social housing programmes, whichamounts up to 20 percent of the value of the unit. The level of non-performingloans (NPLs) is very high, though it has been decreasing, from 21 percent in 2009to 11.5 percent in 2012. Until now, rather than repossessing homes, most NPLshave usually been restructured, either through swaps for T-bonds (in public sectorbanks) or rescheduling repayment schedules, the costs of which have beenabsorbed by the state.
A mortgage refinancing facility was created in 1997 (Societe de RefinancementHypothecaire – SRH ) with the goals to improve banking intermediation forhousing finance, and promote the use of secondary financial markets to facilitateaccess to long-term finance for mortgage loans. SRH was capitalised with a fundof US$52.3 million held at the treasury, and US$12.5 million of its own funds. TheSRH facility was complemented by the new securitisation law that came into forcein 2006. The objective of the legislation was to free up capital to support banksto fund housing construction yet this financial instrument has not been effectivein practice. The expansion of secondary mortgage markets has been limited bythe lack of development of primary mortgage markets and high rate of NPLs.
Lease-to-own programmes have recently become a very popular way to accesshousing in Algeria. In 2011, the SRH facility received approval to operate directlyin real estate leasing. There are now 5 non-bank financial institutions specialisingin leasing services, including real estate, which includes Ijar Leasing Algérie and ElDjazaïr Ijar. SRH has supported the expansion of the leasing sector, but the mainfactor for growth has been the stagnation in the authorisation of new bank licenses.
The main institution providing microfinance services is Algérie Poste, which was setup as a government corporation on January 14, 2002 to provide both postal andfinancial services. Algérie Poste has a large branch network, especially in ruralareas. In 2014, there were 3 309 postal bank branches, compared to just under2 000 commercial bank branches or 5.1 branches per 100 000 inhabitants. In2012, Algérie Poste counted 13 million accounts, compared to 10 million incommercial banks. There are no specialised housing microfinance products, butAlgerie Poste offers a savings for housing account, with two percent interest, andacts as a service branch for CNEP accounts, Algeria's largest housing finance lender.In 2014, Algerie Poste started offering online and mobile banking services for thefirst time.
Affordability
Housing affordability is a significant problem in Algeria and the cause of substantialsocial unrest. While the supply of housing for high income and expatriate buyersappears to be sufficient, there is a distinct undersupply of affordable housing forthe bottom 60 percent of the population. Prices in the main urban centres areequivalent to those of major European cities. In 2015, the ratio of home price tothe average annual income in Algiers was estimated to be 20.93. It is therefore
extremely difficult for households, especially low and middle income, to accesshousing on the private market.
Average annual household income in Algeria was US$11 900 in 2012. Althoughinequality is low, with the Gini coefficient last measured at 36.06 in 2010, thereare still 28.2 percent of households that earn less than US$460 per month,52.6 percent that earn less than US$710 per month, putting the price of housingbeyond the means of most households.
Public policy is focussed on building a large amount of very low-cost rental andsubsidised housing units, yet government supply is not able to respond entirely todemand. Occupancy rates are high in Algeria, estimated at 4.6 persons perhousehold in 2013. Population growth, measured at 1.8 percent per annum, andan urbanisation growth rate of 2.7 percent per annum in 2014, fuels new demandeach year for housing units in cities. However, waiting lists are long and the downpayment to buy a dwelling can also be prohibitive. For the middle-income housingprogramme, between DA700 000 and one mi1lion (US$7 000 – 10 000) isrequired upfront.
Housing supplyIn 2011, the Ministry of Housing and Urban Development (MHU) announcedthat there was a national housing stock of 7.4 million units for anestimated 5.7 million households. Within this stock, MHU estimates thatup to 20 percent are vacant, which largely act either as investment propertiesor second homes for the higher-income. Meanwhile, 560 000 are designatedprecarious dwellings and two million are in poor condition, having beenconstructed prior to independence in 1962.
Annual supply is estimated at 80 000 dwellings, while annual demand isestimated at 200 000 to 250 000 units per year. The national housing shortagein Algeria is reported at 1.2 million units. The MHU announced goals toovercome the backlog in July 2013 with mass-scale public construction ofsocial units of various types.
The state is the major supplier of various types of housing through the use ofnational budget. In May 2014, the Ministry of Housing and Settlementsannounced the construction target of 1.6 million units over a five-year periodfrom 2015 – 2019 with an estimated cost of US$56 billion, in addition to the650 000 units that were already in progress in 2014. Around 50 percent ofthese units will be public rental housing (LPL), 40 percent will be homes inrural areas, 15 percent will be subsidised low-cost units (LPA), a small numberwill be built as part of the lease-to-own programme (AADL) and 15 000 unitswill be part of a new government programme started in 2014, aimed at themiddle income band known as LPP. Overall, housing programmes havedelivered a large number of units, with MHU reporting that 810 000 housingunits were built under the 1999 – 2004 housing programme and 912 326 units
> $50 000
$25 000 – $50 000
$14 000 – $25 000
$8 000 – $14 000
$5 000 – $8 000
$3 600 – $5 000
$2 400 – $3 600
$1 600 – $2 400
$800 – $1 600
<$800
- - - Average income needed for the cheapest newly built house by a formal developer, 2015
- - - Average annual urban household income, 2014
ALGERIA
$11 851
$8 806
Rural | UrbanAnnual household income US$
No. of households (thousands) 1000 500 0 500 1000 1500 2000

Africa Housing Finance Yearbook 2015
27
under the 2005 – 2009 programme. A massive DA 3 500 to 4 500 billion(US$46 billion – 60 billion) was committed, yet only half of the 2.2 millionunits planned in the 2010 – 2014 period were produced. Land disputes oversome project sites and mismanagement of funds contributed to this shortfall.
These programmes have required an enormous effort that is both widelypublicised and visible. Thousands of housing units have been built by the state-owned firm Cosider. Of the estimated 1 800 building developers constructingthe rest of the public housing, 1 500 are local Algerian firms, usually workingon smaller projects of 100, 200 or 500 units. Three hundred of the developersthat are carrying out the rest of the public housing projects are foreign, manyfrom Turkey and China, with an estimated 35 000 – 60 000 Chineseconstruction workers in Algeria at any one time.
Despite the extent of housing construction, there is still a backlog. In theWilaya Province of Algiers, for example, 24 300 temporary structures werebuilt between 1998 and 2008 and substandard housing as a percentage oftotal housing stock rose from 5.9 percent to 9.1 percent, over the sameperiod. In 2014, 72 000 residents were surveyed as still living in precarioushousing in Algiers. There have been additional initiatives to clean upshantytowns with the slum eradication project Résorption de l’HabitatPrécaire, a programme that included slum-upgrading, redevelopment orresettlement. Started in 1999 with a World Bank loan of US$150 million, thisprogramme initially identified 65 target sites, accounting for 30 390 inadequateunits, housing 172 000 residents. In July 2014, this programme gained a furthercommitment of US$90 million from the new government for theimprovement of inadequate units. Within a year, 20 000 families living intemporary sites in Algiers have been given public rental housing units in thefirst phase of this programme.
Property markets
Constraints to the availability of land have severely restricted the emergence of aformal real estate market. The state is the primary owner of land in Algeria andonly very limited supply is made accessible to private individuals or developers.Furthermore, the land registration system is cumbersome and unclear. Algeriahas continued to maintain a low ranking of 157th in the 2015 Doing Businessreport for registering property, with 10 procedures, taking an average of 55 days(increasing from 48 days in 2012), and costing 7.1 percent of the property value.Many apartments or plots are left vacant due to disputes over tenure.
The government has attempted to increase the supply of land with a tax rebateif the land is sold for housing. However, this measure has primarily benefitted highincome groups, who are the ones that are able to afford land in the first place, andthe higher the purchase price, the larger the tax rebate. With 90 percent of thepopulation living within only 10 percent of the national territory, and growingdemand caused by high population growth and urban migration, difficulties toaccess land are likely to continue without any significant reforms in land policy.
The majority of households are forced to rely on public housing programmes, orotherwise self-build on informally-squatted government land or buy units on theblack market. Due to the enormous price gaps between the private propertymarket and affordable housing constructed by the state, many of the social housingunits are quickly released into the thriving black market, where title transfer is notformally registered. The mark-up of the property value can be up to 40 percentand real estate brokers engaged in the business demand high commissions tofacilitate the transactions.
To facilitate property development, Algeria introduced a Real Estate DevelopmentGuarantee Fund (FGCMPI) in 1997 and made a Certificate of Guarantee onadvance payments for off-plan sales compulsory. Its purpose is to reimbursepayments made by purchasers in the event of the developer defaulting on theirobligations.
Policy and regulation
From 1999 to 2012, one third of those in the Algiers region applied for some sortof government housing assistance. The government has five types of housingprogrammes, with different target groups and tenure outcomes. In 2013 and 2014,the thresholds for several programmes were revised and a new LPP programmewas introduced for middle class households, resulting in the following set of housingoptions:
Target Group
Income Level (DA)
Income Level(USD) Programme
1 – 6 SMIG 18 000 – 108 000 180 – 1 090The Rural Housing Programme for rural areas, where a household receives a subsidy of US$8 800 for renovationor new home construction, which is disbursed as progress is made.
<1.5 SMIG <24 000 <240
Public Rental Housing for households earning less than 1.5 times the minimum wage, in which construction isentirely financed by the budget on free government land and rent is extremely low, ranging from US$12 – 23 permonth. To make more transparent the allocation, the government has created a scoring system for applicants that takeinto account a range of conditions.
1.5 – 6 SMIG 24 000 – 108 000 $40 – 1 090
AADL (Agence de l'Amélioration et du Développement du Logement): AADL was introduced in 2001 andoperates a lease-to-own Programme for households with little down-payment capacity. Units range in size from 70m2
to 85m2. Small upfront payments are required for entry, and then the lease is guaranteed 100 percent by the stateon a zero interest basis.
1.5 – 6 SMIG 24 000 – 108 000 240 – 1 090
LPA (Logement Promotionnel Aidé): The Assisted Housing Programme, started in 2010, LPA aims to facilitatehome ownership for households earning up to six times the minimum wage. There is an upfront grant of eitherUS$5 000 or US$8 700 to assist with down-payments and subsidised loan finance with interest rates between oneto three percent. Land is provided by the government at discounted rates to developers for these projects to reduceoverall cost, but demand is very high. Units cost between US$32 500 and US$36 800.
6 – 12 SMIG 108 000 – 216 000 1 090 – 2 180
LPP (Logement Public Promotionnel): The Commercial Housing Programme. A newer housing programmeaimed at assisting the middle class to purchase housing, started in 2012. There are three classes, units of 80m2 forUS$60 400, units of 100m2 for units of US$92 800, and units of 120m2 for US$113 000. Households are eligible toaccess housing finance at three percent interest and require a 10 percent payment to be eligible. Much of these unitsare financed by the national public developer, ENPI (Entreprise Nationale de Promotion Immobilière).
Civil Servants N/A N/AGovernment Employees are also offered low-cost finance, at one percent for a house up to US$86 600 for higherdignitaries, and US$50 000 for others.

28
Demand for all these programmes is high and supply is insufficient. Allocationprocedures have been brought under scrutiny for mismanagement and argumentsover allocations which are the cause of many protests. In the first half of 2015,there were 974 registered protests related to housing, compared to 710 in all of2014. This rise is due to the large number of resettlements that have been takingplace. Efforts to better regulate the application and waitlisting procedures havemade some progress, yet have not gone far enough to alleviate this social unrest.
A scoring system has been introduced to the public rental housing programme,which gives preference to families based on their income, current living situation,familial situation, and improves transparency. Distinct issues to resolve are theverification of the eligibility of applicants as waitlists are managed locally, there canbe duplication of applicants across regions and people may already own propertyor move to precarious housing in shantytowns simply to qualify for governmentassistance. In addition, there is a challenge to eradicate fraudulent documents ofidentification or false certificates of accommodation.
Opportunities
The outlook for growth in the Algerian housing finance sector remains largelypositive, given the liquidity of the financial system, the development of stronger legalframeworks for mortgages and growing number of banks offering varied housingfinance options, including housing microfinance. Yet, progress is slow due to delaysin reforms of the financial sector and the large drop in oil prices which threatensto destablise fiscal stability and public programmes that require large expenditures.There has also been a sharp decline of European investment and a revival ofinterest from Gulf investors and the country has introduced a 49/51 rule, whichlimits the participation of a foreign investors in local companies to 49 percent.
Housing production still faces challenges on the supply side, caused by a lack ofland available for private development. There has not been much progress inrecent times, apart from a World Bank project from 2002 until 2007 that includeda nation-wide systematic registration system for physical and legal properties, andthe expansion of the cadastre. New legislation has also helped to standardise anddigitise the registration procedures and designed a special ad-hoc procedure toexpedite the process in urban areas. A 2011 law that was enacted to grant leasesfor state land to foreign investors for 99 years instead of 20 years, has beenpromising to stimulate private investment in real estate.
Earlier this year, the government stated its intention to shift the housing deliveryemphasis from the provision of public housing towards the facilitation of privately-developed affordable housing, financed through long-term mortgage loans. Thegovernment commitment made in 2014 of another major public investment in afive-year housing construction programme demonstrates that government stillfeels responsible for low income housing. There have been very few concreteattempts to facilitate private sector activity, so many Algerians simply wait and relyon these public delivery systems.
The government has stated its intention to shift the housing delivery emphasisfrom the provision of public housing towards the facilitation of privately-developedaffordable housing, financed through long-term mortgage loans. Yet, the recentannouncement of yet another public push on housing construction demonstratesthat there have been very few concrete attempts to facilitate private sector activity,so many Algerians must simply wait and rely on the public delivery systems.
Sources
Algerian Government (2014). National Report on Housing for Habitat III.African Economic Outlook (2014). Algeria Profile 2014. Bellal, T. (2009). Housing Supply in Algeria: Affordability Matters Rather ThanAvailability. Algiers: University of Setif.Belkalem, M., Laghouati, S., Ghorbal, Y., & Larbi, A. (2006). The 2006 GlobalSecuritisation Guide: Algeria, Morocco and Tunisia. EuroMonitor (2014). World Consumer Income and Expenditure Patterns: 14th
Edition.Hassler, O. (2011). Housing and Real Estate Finance in Middle East and NorthAfrican Countries. World Bank.International Monetary Fund. (2014). Algeria: Financial System StabilityAssessment.Jones Lang Lasalle. (2011). Affordable Housing in MENA. September 2011.KPMG. (2012). Guide des banques et des établissements financiers.Oxford Business Group (2014). The Report: Algeria 2014. The World Bank. (2014). Doing Business: Algeria. United Nations Human Rights Council. (2012). Report of the SpecialRapporteur on Adequate Housing.UN-HABITAT. (2012). State of Arab Cities 2012: Challenges of UrbanTransition. Kuwait.
Websites
www.cgap.orgwww.cnl.gov.dzwww.globalpropertyguide.comwww.lkeria.comwww.mfw4a.orgwww.mhuv.gov.dzwww.ons.dzwww.srh-dz.orgwww.worldbank.orgwww.imf.org

Africa Housing Finance Yearbook 2015
29
Angola
The National Bank of Angola (BNA) has made a concerted effort to increase theuse of banking services in recent years. In the past, commercial banks wererestricted to the few who could meet the deposit requirement of about US$200to open an account. In 2011, the National Bank of Angola launched the Bankitaprogramme in partnership with most of the commercial banks that operate inAngola in an effort to improve access to banking services amongst low incomehouseholds. This matched savings programme offers people the possibility to opena bank account with only Kz100 (about US$1)7. However, data on the holders ofBankita bank accounts indicate that their use is limited to urban, male and formallyemployed individuals8.
The post-war construction boom has resulted in a growing interest in themortgage market and most large banks now offer loans for housing. BAI, forexample, offers terms of up to 20 years and financing up to 85 percent of thevalue of the property. Interest rates for mortgages generally vary between eightand 14 percent. Other banks finance house acquisitions as unsecured consumerloans. These products typically have much higher interest rates, reaching up to24 percent, and shorter repayment periods of around 36 months9. In practice thelack of instruments to gauge the creditworthiness of prospective borrowers dueto the lack of a credit information and a national identification system means thatcollateral is required for nearly all loans. The absence of a functioning propertyregistration system remains an obstacle and rejection rates of loan applicationsare high.
Overview
Angola is an oil-rich nation located in southern Africa, on the Atlantic coast ofAfrica, and bordered by Namibia, Zambia and the Democratic Republic of Congo.President Jose Eduardo dos Santos’ ruling party, the People’s Movement for theLiberation of Angola (MPLA), holds a strong majority, having taken 72 percent atthe August 2012 polls. The country has come a long way since its civil war endedin 2002. In 12 years, Angola has managed to transform its war-torn economy intothe fifth biggest in Africa. This growth has been mainly fuelled by a doubling of oilproduction, turning Angola into Sub-Saharan Africa’s second largest oil producerafter Nigeria. Rising oil revenues have allowed for large-scale state investments,mainly in the construction and rehabilitation of public infrastructures, leading to amassive construction boom and double digit GDP growth rates which reached23.4 percent in 2007 up from 3.3 in 2003.
Poverty rates have been reduced in post-war years, but about 40 percent still livesbelow the poverty line1. While non-oil economic sectors, notably in services suchas banking and telecoms, have been thriving in the past years, the benefits of thisgrowth have been limited to a growing but still small urban middle class. Due tohigh birth rates and the continued underdevelopment of Angola’s countryside, itsurban population has been growing rapidly in the past years, with nearly a third ofits 24.4 million population now living in the capital of Luanda2. Average incomesare higher in urban areas compared to rural ones, but rapid urbanisation and highcosts of living in the city mean that at least two thirds of Luanda’s residentsdepends on the informal sector3. In recent years the Angolan government hascome to play an active role in housing development through the construction ofmass scale housing projects. Nevertheless, informal self-built housing remains thepredominant method of housing development.
Access to finance
As of 2014, there were 24 banks in Angola, four of which are state owned; halfof which have entered the market in the past six years4. The Angolan bankingsector the third largest in Sub-Saharan Africa after Nigeria and South Africa.However, levels of financial inclusion in Angola remain low5. Only 39.2 percentof Angolans have a bank account at a formal financial institution. This percentageis somewhat higher in urban areas, where 56.5 percent have an account,compared to 33.8 percent in rural areas6.
KEY FIGURES
Main Urban CentresLuanda (capital), Lubango,Benguela, Huambo
Exchange Rate: 1 US$***Inflation 2013 | 2014 (est.) | 2015 (prov.) | 2016 (prov.) *
125.50 Angolan Kwanza (Kz)8.8 | 7.4 | 8.0 | 8.7
Population^ | Population growth rate (2013)^Urban population (% of total)^ | Urbanisation rate (% in 2013)^
24 400 000~~ | 3.0562.00~~ | 4.88
GDP / capita (current US$)^ | GDP growth rate (annual %)^GNI / capita, Atlas method (current US$) ^Population below national poverty line*Unemployment rate (%)*Gini co-efficient (year of survey)^^HDI (Global Ranking)" | HDI (Country Index Score)”
5 935.72 | 3.905 30036.626.042.66 (2008)149 | 0.526
Lending Interest Rate^Mortgage Interest Rate (%) | Mortgage Term (years)#Credit % of GDP^Average Mortgages % of GDP° Price To Rent Ratio City Centre** | Outside City Centre**Gross Rental Yield City Centre** | Outside of City Centre**Outstanding home loan (% age 15+)##
16.3815.00 | 2024.98...10.29 | 7.349.72% | 13.62%2.16
What is the cost of standard 50kg bag of cement (in US$)? #What is the price of the cheapest, newly built house by a formaldeveloper or contractor (in US$)? #What is the size of this house (in m2)? #What is the average rental price for a formal unit (in US$/month)#What is the minimum plot size for residential property (in m²)#
7.00
200 00095 ...500
Ease of doing business rank !Number of procedures to register property !Time (days) to register property !Cost (% of property value) to register property !
18171903.00
*** Conmill.com The Currency Converter^ World Bank's World Development Indicators (2014)~ World Bank PovcalNet: an online poverty analysis tool, various years^^ The World Bank's PovCalnet" UNDP's International Human Development Indicators (2014)° Various: Badev et al. "Housing Finance Across Countries: New Data and Analysis" – Unpublished
paper/Hofinet/World Bank## Global Financial Inclusion Database (FINDEX)# CAHF Annual Survey Data (September 2015)! World Bank's Doing Business Survey Data (2015)** Numbeo Online User-Contributed Database~~ Government of Angola National Census 2014

30
As a result, only 7.6 percent of housing credit held by households came from banksin 2009, with the rest obtained from family and friends, savings and employers. In2010, lending for housing picked up from Kz84 billion (US$900 million) in July toKz189 billion (US$2 billion) in August of the same year. By mid-July 2013, accordingto the Governor of the National Bank, individual housing loans were still undereight percent of all loans. However 16 percent of overall investments from bankswent into housing, the majority of which was for construction by commercialcompanies10. Most of these companies are large, established and often foreign-owned firms, as smaller domestic start-ups experience similar kind of difficulties asprivate individuals when it comes to accessing finance.
Nevertheless, Angolan banks investment in the real estate sector in 2014 from datareleased in July 2015 by the National Bank indicates an increase by approximatelyUS$6 billion over the year11. In order to overcome some of the obstacles relatedto access to housing finance, the Angolan government has taken an active role inthe area of housing development through the construction of new urban centres,or centralidades, across the country. These have generally been financed throughoil-backed credit lines from China. Housing in these projects is subsidised througha rent-to-buy scheme launched in 2013 by SONIP, the real estate arm of theAngolan national oil company. This scheme offers a three percent interest rate ontwenty-year mortgages for apartments in the new centralidades. In August 2014,the SONIP housing portfolio was transferred to the Angolan private housingmanagement company Imogestin SA.
The government has also created a Housing Development Fund (FFH) (Decree54/09 of 2009) and adopted new legislation on housing finance with the aim ofencouraging commercial financial institutions to provide credit for the constructionor purchase of a house. This is done by providing subsidies to banks to reduceinterest rates and by providing financial guarantees to reduce risk. Agreements tothis effect have been signed with several banks, but so far the portfolio of the FFHis limited to the provision of subsidised loans for public servants. These loans arerestricted to the 5 500 units in the centralidades of Kilamba and Cacuaco/Sequelein Luanda, which are managed by the FFH. Loans are extended for 30 years witha three percent interest rate.
The penetration rate of microfinance institutions (MFIs) remains low, with littlemore than 30 000 active clients. Three MFIs are currently registered with theBNA, but new MFIs have started to enter the market12. Of these, only KixiCreditoand Novo Banco Angola report to MIX Market, an online source of microfinanceperformance data and analysis, which recorded a combined US$20.6 million worthof loans disbursed in 201113. Most microfinanciers in Angola are financial banks;in 2007 BAI moved into microfinance by acquiring Novo Banco Angola. TheAfrican Development Bank expected that the adoption of new regulations onmicro-finance institutions in 2011 should accelerate the development of the sectorgoing forward14.
KixiCredito is the largest non-bank microfinancier, launched by local non-governmental organisation (NGO) Development Workshop Angola. In 2014,KixiCredito had a gross loan portfolio of US$32 million, with loans to 20 000borrowers. In addition to microfinance for small business, it also offers a housingmicrofinance product known as KixiCasa. This was developed on the realisationthat more than 30 percent of business loans were being diverted for housingpurposes. The product enables groups of between three and five people to access36-month loans from US$1 000 to US$10 000. In 2012, Homeless International(now Reall) gave Development Workshop access to its CLIFF line of financing fora new social housing project in Huambo province. End-user finance forincremental housing is being provided by KixiCasa. KixiCrédito is also finalising arelationship with IFC to finance the institution’s scale-up and its new housingproduct.
The social security system in Angola covers less than 10 percent of theeconomically active. There are some special pension funds set up for war veteransand oil sector workers, and there is scope for harnessing these resources forhousing. Plans to set up a stock market have been underway since before theend of the war. Government bonds started to be sold to investors in December2014 and equity trading is expected to start by the end of 201515.
Affordability
The Angolan population is a young; almost half are under the age of 15. Theaverage Angolan household consists of five members. A government householdsurvey conducted in 2008-2009 calculates average income per person at aboutUS$90 a month, but almost double in urban areas than in rural areas: US$110against US$6016. The minimum wage in Angola is about US$150 and the averagemonthly salary is estimated to be approximately US$ 500, but skilled private sectoremployees generally earn over 20 times more than those in the lowest incomebracket17. For (expatriate) oil company employees, this income is even higherwith employers generally picking up the bill for accommodation.
The demand for high-end, quality housing in secure developments, with thereliable provision of utilities, and the substantial budgets of oil companies meansthat rental and sale prices have become among the most expensive in the world.Prices dropped somewhat after the economic downturn in 2008, caused by a fallin oil prices. Nevertheless, the focus of formal commercial developers remainson the higher income category. In this market, a two-bedroom apartment ofabout 180 m2 in downtown Luanda reaches an average of US$8 525 a m2 ornearly US$1.5 million a unit, while a three bedroom house of about 190 m2 in aresidential compound in the suburb of Luanda Sul costs about US$1 million perunit or US$5 269 a m2. The cheapest commercial properties are found inCamama, an hours drive from central Luanda, where there are limited asphaltedroads and poor electricity supplies. There, a two-bedroom apartment costsapproximately US$200 000, compared to US$840 000 in Maianga, an inner-citydistrict18.
> $50 000
$25 000 – $50 000
$14 000 – $25 000
$8 000 – $14 000
$5 000 – $8 000
$3 600 – $5 000
$2 400 – $3 600
$1 600 – $2 400
$800 – $1 600
<$800
- - - Average income needed for the cheapest newly built house by a formal developer, 2015
- - - Average annual urban household income, 2014
ANGOLA
$108 638
$12 408
Rural | UrbanAnnual household income US$
No. of households (thousands) 800 400 200 0 200 400 600

Africa Housing Finance Yearbook 2015
31
The are government schemes aimed at making housing more affordable. In thebeginning of 2013 the Angolan government substantially reduced the selling priceof apartments in several of its large-scale housing projects in Luanda. Apartmentsin these projects were initially priced between US$125 000 and US$200 000 aunit. The introduction of subsidised rent-to-buy schemes through SONIP and theHousing Development Fund (FFH) reduced apartment prices to US$80 000 fora three bedroom apartment, with monthly payments of US$390. This broughtownership within the reach of early career professionals and mid-level civil servantsearning over US$1 500 a month. While the FFH kept non-payments low throughautomatic debit orders, Imogestin has not charged any payments since it took overfrom SONIP. Residents are expected to start paying their monthly instalmentsfrom October 2015 onwards19.
It has been reported that in the future, the rent-to-buy option for housing unitsin government housing projects currently under construction in other parts of thecountry will be limited to public servants, while other prospective buyers will needto apply at commercial banks for loans that will benefit from state subsidies tokeep interest rates low20.
It is evident that the rapid rise of house prices and rental prices are slowing, partlydue to the government subsidised units. Despite budget cuts in other areas of thesocial sector due to the most recent fall in oil prices in 2014, investment in housingremains considerable at 4.7 percent of the state’s budget, up from 1.07 percent in2012. However, government housing schemes do not address the costs of livingin government housing projects, which are mostly located on the city periphery.A lack of public transport means that many residents rely on costly privatetransport. Moreover, government housing projects have been largely unsuccessfulin terms of reaching low income households.
Housing supply
The civil war in Angola left a legacy of a highly urbanised population, living in areaswith little developed infrastructure – some 30 percent of the population have noaccess to electricity and less than 42 percent have access to clean water. Thelimited infrastructure restricts development by drastically increasing the cost ofdeveloping. This has led to a severe shortage of habitable housing in urban areas.
In the first post-war years, a number of government housing projects weredeveloped for low income households, such as war veterans or people. However,rapid urbanisation means that these projects contributed little to overcome thehousing deficit, estimated at just below two million units. In the run-up to thecountry’s first post-war elections in 2008, the government announced a plan tobuild 1 million houses by 2012. Accompanied by the slogan ‘My Dream, My Home’(Meu Sonho, Minha Casa), this plan was formally adopted in 2009 as the NationalUrbanism and Housing Programme. The public and private sector were eachmeant to deliver around 12 percent of the total of one million housing units.Housing co-operatives were to deliver around eight percent, while more than68 percent were to be delivered through the provision of serviced and legalisedplots of land for self-help building.
The implementation of the housing programme is still on-going and the timeframehas been extended to 2017. The most successful element of the programme hasbeen the delivery of state-built housing. This includes the construction of newurban centres such as the ‘new city’ of Kilamba. Financed with a Chinese credit lineof US$3.5 billion, which Angola is repaying in oil, and built by the Chinese state-owned company China International Trust and Investment Corporation, Kilambais one of the largest new-build developments on the continent. Covering 5 000hectares, the first phase of this residential development includes 750 eight-storyapartment buildings with over 20 000 apartment units, as well as schools and retailunits, which currently house over 70 000 people. The second phase of Kilambaconsists of 5 000 apartments called ‘KK 5000’.
Beyond Kilamba, several other new ‘satellite cities’ have been built by Chinesecompanies on the outskirts of the capital of Luanda, totalling about 70 000 housingunits. The government is building an additional 40 000 units to re-house residentsof the inner-city bairros (areas) of Sambizanga, Cazenga and Rangel, which havebeen targeted for urban renewal. Outside of Luanda, several other Chinese-builtnew cities amounting to 30 000 units are under construction. Progress is uncertain
with the 40 000 houses are under construction in the provinces of Bié, Huambo,Moxico, Kwanza Sul and Uíge by Kora Angola, a partnership between SONIP andthe Israeli company LR21.
State-led housing delivery and the subsidised mortgages (regulated by PresidentialDecree 259/11 of 2011) mainly serve better paid civil servants. The ‘one millionhouses’ programme has mainly fallen short in supporting the self-help housingsector, with regards to security of tenure, serviced stands and financing. It has alsofailed to create an enabling environment for private actors and housingcooperatives. The domestic construction and the local construction materialsectors remain underdeveloped. As a result, foreign firms and imported buildingmaterials predominate. Though there has been some progress regarding localcement production, as a ban on imports and new cement factories reduced pricesfrom over US$20 in 2007 to about US$7 in 2015.
Property markets
Angola's formal property market is still in its infancy, with most properties beingbought new or off plan and little turnover of real estate. New laws for rentals andthe transfer of housing have been adopted in recently in order to make investmentin rental housing more attractive, replacing colonial. This is also expected to offermore protection for tenants. This includes a new urban rental, adopted in August2015, which requires that rental payments be in the country’s currency instead ofUS dollars and that downpayments should be limited to a maximum of 6 months22.Before, it was common for landlords to demand downpayments of two years.
Angola has also made significant progress in reforming the administrative processesfor registering and transferring property. The Guiché Único (Presidential Decree52/11 of 2011) was created in 2011, a one stop shop for property registration,while new laws on notaries and realtors (Law 8/11 of 2011 and Law 14/12 of2012) have liberalised the property market, allowing for the private exercise of thisprofession alongside state officials. A new law on urban property tax (Law 18/11of 2011) reduced the cost of transferring property from 10 percent to twopercent, eliminating them altogether for low cost housing. Stamp duties have beenreduced from 0.3 percent to 0.5 percent, tax on housing credit from 0.3 percentto 0.1 percent, and land registry fees have been reduced by half. As a result, thecost of transferring property was reduced from 11.5 percent of the propertyvalue in 2005 to three percent in 201523. However, it still takes 190 days toregister property24.
Obtaining the official permits and licences necessary to operate in Angola remainscostly and time-consuming. For instance, construction permits now take onaverage 203 days to obtain (down from 348 days in 2013). It takes 1 296 days (anincrease from 1 011 days in 2013) to resolve a contract dispute, and the averagecost of doing so is equal to 44.4 percent of the value of the claim25. At 187th of189 countries in 2015, this makes Angola rank among the worst in the world forease of contract enforcement. A general legal framework for faster, non-judicialarbitration of disputes, the Voluntary Arbitration Law of 2003, has yet to be fullyimplemented26. Moreover, legislation that would allow banks to repossessproperty in case of non-payment is yet to be adopted. According to the AngolanAssociation of Real Estate Professionals (APIMA), it takes three years for banks toconfiscate mortgaged real-estate.
Policy and regulation
In post-war years, the Angolan government has adopted an extensive legal andinstitutional framework to regulate the land, housing and financial sector. Thisincludes the adoption of a new land law (Law 9/04 of 2004), which establishes thedifferent types of land rights that can be granted by the state and stipulates thatinformally occupied land needs to be regularised within three years. A newterritorial planning law (Law 3/04 of 2004) calls for the creation of national,provincial and municipal development plans to allow for more orderly planning. Anofficial housing policy (Resolution 60/06 of 2006) with a view to guaranteeing theuniversal right to housing. A framework law for housing (Law 3/07 of 2007)defines the different instruments that are to be used to guarantee this right, suchas the creation of a system of credit for housing. This law represents the statutorybasis for the Housing Development Fund (FFH).

32
The Angolan government also created a Ministry of Urbanism and Housing, aNational Housing Institute (INH) (Decree 12/04 of 2004), a Ministry ofConstruction, which in addition to local governments, are expected to contributeto fulfilling the government’s policy objectives.
However, in practice state institutions are weak and the enforcement of policyand legislation is wanting, especially in the area of land tenure (Law 9/04 of 2004).Many different actors are involved in granting property rights and there is nounified land registry. Moreover, by-laws regulating and simplifying the legalisationof land in the large informal settlements around Angola’s major cities have not yetbeen published. The first comprehensive study of Luanda’s urban land marketscarried out in 2011 by Development Workshop Angola, with the support of theWorld Bank, demonstrated that there was a thriving land market but that itoperated mainly in the informal sector, with less than 10 percent of land parcelsoutside the urban core having legal titles27.
Opportunities
Although subsidised state-led housing construction remains a government priority,budget constraints resulting from the global economic downturn will limit theextent to which the government will be able to continue to invest its ownresources in housing development. The National Private Investment Agency(ANIP) has long called for public private partnerships in the area of housingdevelopment, offering various incentives. In January 2015, the Minister of Urbanismand Housing invited various stakeholders from the private sector for a meetingabout the current obstacles in the property market. This led to a decision tocreate a task force to improve the participation of the private sector in theimplementation of the National Urbanism and Housing Programme (Resolution20/09 of 2009)28. This is likely to create further opportunities for residentialfinanciers and developers.
Despite government investments in urban infrastructure, there are still significantneeds in this area. There is increasing recognition by the government thatinsufficient progress has been made when it comes to making legalised andserviced land available for self-help building. This represents opportunities foractors and companies that can provide technical assistance in terms of landregularisation as well as opportunities for infrastructure development. This washighlighted in April 2015, during the 2nd Africa Urban Infrastructure InvestmentForum that was held in Luanda.
While the buying power of the country’s urban middle class represents on-goingopportunities for both financing and development, so far the lower incomesegment of the population has been virtually untouched. Housing microfinancetherefore represents big opportunities, having the advantage of a supportivelegislative regime that formally recognises incremental housing, an establishedtradition of microfinance lending, established practices by players such asKixiCrédito, and recognised significant demand for it.
1 National Institute of Statistics (INE). Inquérito Integrado sobre o Bem Estar da População (IBEP). Relatório Analítico. Vol. I. Luanda, 2011.2 National Institute of Statistics (INE). 3 National Institute of Statistics (INE), Inquérito Integrado sobre o Bem Estar da População (IBEP) 2008-09. Luanda, August 2010.4 KPMG (2014). Angola banking survey (October 2014). Available at http://www.kpmg.com/PT/en/IssuesAndInsights/Documents/bank-ao-2014-en.pdf 5 FinScope Angola Community Survey, Literature Review on Current Financial Inclusion Initiatives, (forthcoming 2014)6 World Bank Financial Inclusion data for Angola, see http://datatopics.worldbank.org/financialinclusion/country/angola 7 BNA website, see http://www.consumidorbancario.bna.ao/Conteudos_PC/Artigos/detalhe_artigo.aspx?idc=10140&idsc=12331&idl=1 8 BNA (2012). Relatório de Estabilidade Financeira. Available at http://www.bna.ao/uploads/%7Bae258f2c-376f-46a1-bc24-ad713577d9a4%7D.pdf 9 FinMark Trust. Access to housing finance in Africa: exploring the issues. No. 11, Angola (May 2010).10 FinMark Trust. Access to housing finance in Africa: exploring the issues. No. 11, Angola (May 2010).11 Economia e Mercado, Bancos injectam, mas não na diversificação, 30 July 2015.12 These include Mão Solidária Microfinança and Microcapital, which reportedly received licenses in April 2014.13 http://www.mixmarket.org/mfi/country/Angola14 African Development Bank (2012). Angola private sector country profile (September 2012). Available at http://www.afdb.org/fileadmin/uploads/afdb/Documents/Evaluation-Reports/Angola%20%20-
%20Private%20Sector%20Country%20Profile.pdf15 Bloomberg, Angola to start trading stocks this year as banks plan listings (7 May 2015), see http://www.bloomberg.com/news/articles/2015-05-07/angola-to-start-trading-stocks-this-year-as-banks-plan-
listings16 National Institute of Statistics (INE), Inquérito Integrado sobre o Bem Estar da População (IBEP) 2008-09. Luanda, August 2010.17 Centro de Estudos e Investigação Científica (CEIC) (2015). Relatório Económico Annual 2014. Luanda: Universidade Católica de Angola.18 ProPrime (2014), Estudo de Mercado Imobiliário Angola 2014/Angola Property Market 2014. Luanda, Benguela, Lobito. Luanda: ProPrime.19 http://www.portalangop.co.ao/angola/pt_pt/noticias/economia/2015/8/37/Angola-Imogestin-vai-cobrar-prestacao-2015-partir-Outubro-proximo,9f730e91-d3bc-46a2-b65f-76a696167923.html 20 http://www.portalangop.co.ao/angola/pt_pt/noticias/economia/2015/8/37/Angola-Imogestin-vai-cobrar-prestacao-2015-partir-Outubro-proximo,9f730e91-d3bc-46a2-b65f-76a696167923.html21 http://www.kora.co.ao/ 22 http://expansao.co.ao/Artigo/Geral/5972523 World Bank Doing Business Report (2015) Economy Profile Angola. Available at http://www.doingbusiness.org/~/media/GIAWB/Doing%20Business/Documents/Profiles/Country/AGO.pdf24 World Bank Doing Business Report (2015) Economy Profile Angola. Available at http://www.doingbusiness.org/~/media/GIAWB/Doing%20Business/Documents/Profiles/Country/AGO.pdf25 World Bank Doing Business Report (2015) Economy Profile Angola. Available at http://www.doingbusiness.org/~/media/GIAWB/Doing%20Business/Documents/Profiles/Country/AGO.pdf26 http://opais.co.ao/arbitragem-debatida-em-luanda/27 Development Workshop. “The Case of Angola: Strengthening Citizenship through Upgrading of Informal Settlements Cross Country Initiative.” Final Synthesis Report TF 0901110 presented to the World
Bank, Luanda 30 June 2011.28 O País, 23 January 2015.

Africa Housing Finance Yearbook 2015
33
Benin
of GDP in 2014, as in 2013 compared to 24 percent in 20122. Lending ratesremain moderate, but are among the highest in the region, averaging 8.5 percentin 2013. Despite the creation in 2010 of the Regional Mortgage Refinancing Fund(Caisse Régionale de Refinancement Hypothécaire – CRRH), lack of long-termfinancing remains the main reason for the low provision of long-term credit. In2013, other stakeholders in the financial system included two pension funds(serving about 50 000 citizens) and the insurance sector, with an insurancepremium equivalent of 1.7 percent of the country’s GDP3.
Housing finance has been growing, driven mainly by banks with donors showingsome interest. Most housing loans are provided in two forms to individuals withregular employment who use their salaries as collateral: medium-term constructionmaterial loans, and group lending. The medium-term construction material loansare granted to individuals at an interest rate of 10.5 percent to 11 percent, and arepayment term from three to five years. The group lending products are usuallygranted to private organisations or to parastatals to distribute to their employees,where the organisation is responsible for repayment of the loans. Products suchas ‘consumption loans’ (with a two-year maximum term) or ‘equipment loans’ (witha five-year maximum term), are often used as housing finance, and often for homeimprovements.
In 2013, there was a total of CFA Francs 20 billion (US$35.2 million) housing loanprovided by Benin banks4. This reached CFA Francs 6 billion (US$10.3 million) for
Overview
Benin is a small country in the West African Economic and Monetary Union(WAEMU). For years, agriculture has been the main driver of the economythrough cotton exports, which account for over 40 percent of export revenues.This has changed over the last decade, with services taking the lead. Thecountry has recovered from a slowdown in agricultural production following2009 and 2010 floods. GDP has increased steadily, from 5.4 percent in 2012,reaching 5.6 percent in 2013 and 5.5 percent in 2014. Over the past three years,GDP growth has been driven by an increase in agricultural production and inactivities at the Port of Cotonou, resulting from modernisation works undertakenunder the Millennium Challenge Account Programme and private investor Bolloré.The World Bank’s 2015 Doing Business Report ranked Benin among the top 10reformers in the world, with a significant improvement of its overall ranking fromthe 167th out of 189 economies on the ‘ease of doing business’ global index to the151st in 2014, a 16 rank jump from the 2013 rank.
After reaching 6.7 percent in 2012, inflation slowed to around 1.1 percent in 2013,and deflation of 0.5 percent in 2014 caused by the normalisation of the petrolmarket in neighbouring Nigeria, after a hike in 2012. Benin’s public finance is understress due to changes in trade policy in Nigeria, which significantly reduced re-exportation taxes on rice and several imported products transiting in Benin.According to the 2013 general census, Benin’s population has reached 10.5 million.The urban population reached 43 percent of the total population in 2013 andgrows at a steady 3.6 percent a year.
Access to finance
The country’s financial sector is concentrated in commercial banks; other sectorsare still in their infancy. At the end of 2013, there were 14 commercial banks withabout 190 branches and 254 ATM machines, with a total of 892 914 bankaccounts for about 10 million inhabitants1. In 2014, a new bank joined the Beninbanking landscape, the Banque africaine pour l’investissement et le commerce(BAIC). In 2014, loans disbursed were estimated at CFA Francs 1 084 billion(US$1.85 billion), a six percent increase from 2013. 46 percent (CFA Francs 497 billionor US$848 million) of loans were medium- to long-term loans, but the latterremain marginal at CFA francs 37 billion (US$63.1 million) or three percent.Access to credit as measured by credit to the economy remained at 25 percent
KEY FIGURES
Main Urban Centres Porto-Novo (capital), Cotonou
Exchange Rate: 1 US$***Inflation 2013 | 2014 (est.) | 2015 (prov.) | 2016 (prov.) *
593.20 West African CFA1.0 | -0.5 | 1.7 | 1.7
Population^ | Population growth rate (2013)^Urban population (% of total)^ | Urbanisation rate (% in 2013)^
10 599 510 | 2.6443.51 | 3.63
GDP / capita (current US$)^ | GDP growth rate (annual %)^GNI / capita, Atlas method (current US$) ^Population below national poverty line*Unemployment rate (%)*Gini co-efficient (year of survey)^^HDI (Global Ranking)" | HDI (Country Index Score)”
825.23 | 5.3781036.21.043.53 (2011)165 | 0.476
Lending Interest Rate^Mortgage Interest Rate (%) | Mortgage Term (years)#Credit % of GDP^Average Mortgages % of GDP° Price To Rent Ratio City Centre** | Outside City Centre**Gross Rental Yield City Centre** | Outside of City Centre**Outstanding home loan (% age 15+)##
...13.00 | 725.07.........5.50
What is the cost of standard 50kg bag of cement (in US$)? #What is the price of the cheapest, newly built house by a formaldeveloper or contractor (in US$)? #What is the size of this house (in m2)? #What is the average rental price for a formal unit (in US$/month)#What is the minimum plot size for residential property (in m²)#
6.13
15 188 44...250
Ease of doing business rank !Number of procedures to register property !Time (days) to register property !Cost (% of property value) to register property !
151412011.70
*** Conmill.com The Currency Converter^ World Bank's World Development Indicators (2014)~ World Bank PovcalNet: an online poverty analysis tool, various years^^ The World Bank's PovCalnet" UNDP's International Human Development Indicators (2014)° Various: Badev et al. "Housing Finance Across Countries: New Data and Analysis" – Unpublished
paper/Hofinet/World Bank## Global Financial Inclusion Database (FINDEX)# CAHF Annual Survey Data (September 2015)! World Bank's Doing Business Survey Data (2015)** Numbeo Online User-Contributed Database

34
the first two months of 2014, compared to CFA Francs 4.1 billion (US$7.04 million)for 2012. The increase is explained by the sale of the first units of the governmentpromoted affordable housing programme. This continues to increase, as thegovernment continues to sell out more and more housing units. In 2015, a totalof about 200 units were sold out.
In July 2010, the WAEMU created a regional mortgage refinance fund called CaisseRégionale de Refinancement Hypothécaire (CRRH), hosted at the West AfricanDevelopment Bank (BOAD). With an initial capital of CFA Francs 3.4 billion(US$5.9 million) and a partnership with 31 banks in the region, the CRRH aimsto provide long-term resources that will allow lenders to develop long-termmortgage products at relatively moderate rates. Between the time of its creationand January 2014 CRRH mobilised about CFA Francs 77 billion5 (US$131 million)in long-term resources for 23 partners banks in the eight WAEMU countries.
As a result, some banks have designed specific housing finance products, such asthe housing savings plan of Ecobank Benin, which provides access to relativelylower interest rate housing loans for savers. In 2012, Bank of Africa Benin launchedthe ‘housing loan’, a new product specifically targeted to those looking for long-term housing finance. The term of this loan can go up to 20 years, with an interestrate as low as 6.5 percent. The housing loan was launched in partnership with theBenin Housing Bank and is secured by a mortgage on the house for which the loanis requested.
The first of its kind in the country, Benin Housing Bank (BHB) was founded in2004 by a public private partnership between the government and privatestakeholders, including the Bank of Africa, to provide solutions to the demand forhousing finance in the country. The BHB is capitalised at CFA Francs 5 billion(US$8.5 million) with the Bank of Africa Group as main shareholder at 77 percent.It is expected to provide 50 percent of its loans to affordable housing projects,although this is not always achieved. Some specificities of this include that themaximum borrower’s net monthly income should be CFA Francs 250 000(US$427) and that the maximum value of the housing units or the improvementsshould be CFA Francs 150 000 a m2, within an upper limit of CFA Francs 12 million(US$20 478) for a whole house. BHB is reportedly the most important originatorof housing loans in Benin. At December 2014, the total outstanding loan by theBHB was CFA Francs 22.9 billion6 (US$39.12 million).
While Benin is known to be one of the most stable democracies and economiesin West Africa, lending rates offered by its banks are among the highest in theWAEMU. In 2013 the average interest rate was around 8.5 percent, down from2012. This confirms the downward tendency noticed in recent years, (as low as6.5 percent for long-term loans) as the macroeconomic and political environmentremain stable and competition increases in the banking sector.
The savings culture of the Beninese has driven the growth of microfinance, makingit a significant player in the country’s financial system. As of March 2014, there are85 registered microfinance institutions with 742 service points, serving 2.25 millionclients. The Fédération des Caisses d’Epargne et de Crédit Agricole Mutuel(FECECAM) is the biggest network, gathering more than 80 percent of clients. Thepenetration rate of microfinance reached 85 percent in 2014. CFA Francs 92 billion(US$157 million) represented the total outstanding debt of all of the 85microfinance institutions (MFIs) for a total deposit of CFA Francs 77 billion(US$149.5 million)7. A significant change in the microcredit sector since 2013 isthe joining of LITTO Finance as the second private corporate MFI with FINADEV,a branch of the ORABANK group.
Some of the MFIs offer housing finance products. For example, PADME offersloans of up to CFA Francs 10 million (US$17 065) over 60 months, at 1.5 percentto two percent interest a month. A critical challenge facing these MFIs is the limitedamount of resources available to manage larger size housing loans in the longerterm.
Affordability
Affordability is a serious issue since incomes are relatively low compared tohousing unit prices. The cheapest properties cost about CFA Francs 8.9 million(US$15 188), or 18 times the per capita gross national income estimated atUS$810 in 2014.
Affordability of housing is exacerbated by rapid escalations in land prices, especiallyin newly urbanised areas. However, speculation also drives prices, with moreintermediaries positioning themselves between property owners and buyers.Increasing land prices have driven lower and middle income people to movefurther from the inner city to where they can afford land. Adding to the rising landprice is the increased price of construction materials. For example, the price of aton of cement produced locally has increased by more than 30 percent between2008 and 2012. However, the completion of a new cement plant (NouvelleCimenterie du Bénin – NOCIBE) in 2013, drove the price of a 50kg bag of cementdown from its CFA Francs 4 550 (US$7.76) level. Today a ton of cement costsaround CFA Francs 80 000 (and US$6.13 for a 50kg bag, a decrease of 14 percent.A standard sheet of corrugated iron is US$4.97.
A minimum plot size for residential property in urban areas is 250m2. Owning aproperty requires a minimum of CFA Francs 8.9 million8 (US$15 188) for a one-bedroom housing unit in the government’s ‘10 000 affordable housing units’programme. The programme delivered some 2 100 housing units in 2012 and afew more in 2013 and 2014, behind schedule. These added to 240 high-endvillas built between 2008 and 2011, costing about CFA Francs 350 million(US$597 270) per unit. Properties in business or industrial estates cost as muchas CFA Francs 144 261 per m2.
People therefore develop creative ideas to save and self-build their housing. Someestablish informal savings groups (known as in-kind tontines) to access buildingmaterials, mostly cement. A beneficiary in the group is chosen randomly, eachmember benefits only once, and the tontine runs until all have benefited. However,as building material increase in price, the feasibility of this kind of scheme is understrain.
Housing supply
There are four major contributors to the housing stock in the country –households, government agencies, public private partnerships and privatedevelopers. Despite various efforts, formal housing supply still lags behind thedemand.
With the emergence of a market economy in the country, there has been anupsurge of housing projects through public private partnerships. A number ofthese have been in the affordable housing space, for example, the Arconvilleproject in partnership with Shelter Afrique for the construction of 10 000affordable housing units, the ‘1 042 affordable housing units’ programme launchedin 2001 in Abomey-Calavi in partnership with the Betsaleel Building Group and thesupport of Shelter Afrique, and the ‘600 housing units’ programme launched in2001 in partnership with Benin Kasher, a private company. In 2008, thegovernment launched a big programme for the construction of 10 000 affordablehousing units all over the country. The programme received support from thebanking sector, with the Benin Housing Bank and Atlantique Bank for respectivelyCFA Francs 10 billion (US$17.1 million) and CFA Francs 2 billion (US$3.41 million).From its launching to date, it is not clear how many housing units have beencompleted. But one can estimate that at most there are about 2 500 housingunits built on all of the chosen sites. The number of sales also remained unclearso far.
As part of the 10 000 affordable housing units programme, GCITT a privatedeveloper has been contracted by the government to provide 600 housing unitsusing local material and the Hydraform® technology in the Bethel Real estate inAbomey-Calavi. The development will be made of two-bedroom, three-bedroomand duplex housing units costing between CFA Francs 10 9 million (US$18 546)and CFA Francs 38.1 million (US$65 171)9. About a hundred of these units havebeen built and sold at September 2015. Acquisition of these require a downpayment of 40 percent of the unit, the remaining expected to be paid off over12 months.
In 2011, a project involving the delivery of 40 affordable housing units as part ofan agreement between the Venezuela and Benin governments was completed,slightly increasing the available housing units.
In 2013, two new housing providers were established – the Executing Agency ofPublic Interest Works in Benin (Agence de Gestion des Travaux d’Intérêt Public, or

Africa Housing Finance Yearbook 2015
35
AGETIP-Benin) and the international NGO Voûte Nubienne based in France.While AGETIP Benin with its ‘Villas de l’Atlantique’ project focuses supply on urbanareas in Cotonou and Abomey Calavi, the NGO Voûte Nubienne targets ruralareas, mainly in the northern part of the country, doing a lot of local capacitybuilding. AGETIP plans to develop three different types of villa in Fidjrossè, aresidential neighbourhood in Cotonou and in Abomey-Calavi, for a total of 120housing units costing between CFA Francs 76 million and 126 million (or US$130 000to US$215 000). AGETIP is completing this project in partnership with local bankssuch as Ecobank Benin, the Banque de l’Habitat du Benin and the Sahelo-SaharanBank for Commerce and Investment (BSIC). In 2014, AGETIP launched the saleof new empty plots in the cities of Cotonou and Abomey-Calavi, costing betweenCFA Francs 2 000 (US$3.41) and CFA Francs 20 000 (US$34.12) a m2.10
Property markets
Land titling is still a major challenge. According to the World Bank’s 2015 DoingBusiness Report, Benin ranked 64th out of 189 countries on the ‘dealing withconstruction permit’ indicator. This is a nine point improvement from 73th in2013. It currently still takes an average of 111 days and 11 procedures, andcosts 165.3 percent of the per capita income to obtain a construction permit. Onregistering a property, no real progress has been made. It currently takes anaverage of 120 days and four procedures, and costs 11.7 percent of the propertyvalue, placing Benin at 165th rank out of 189 countries. This discourages a lot ofpeople from getting a construction permit. Fortunately, with the enactment ofthe new Land Code, followed by the signing of a number of decrees in 2015,including the one creating the National Agency for Domains and Land (AgenceNationale du Domaine et du Foncier), which is to be a ‘one-stop window’ forproperty titling things are expected to improve in the near future. This shouldstreamline property titling procedures, reducing costs and burdens on titlingrequestors.
Property markets are dominated by the trade of empty plots. Trade of builthousing units is very limited, with only a few high-end units (built in preparationfor the Community of Sahelo-Saharan states [CEN-SAD] summit in 2008) on themarket. Two important private actors are positioning themselves in the propertymarket landscape, with their specialty being the brokering of empty plots and a fewhouses: Global Services Immo and Benin-Immo which advertise both plots to sellor rent on their regularly updated websites. While Benin-Immo operates mostlyin Cotonou and its surroundings, Global Service Immo covers the whole countrywith its activities. Global Service Immo is gaining recognition for selling onlysecured properties.
The sale of the first units made available through the government’s ‘10 000affordable housing units’ programme started in 2012. While the sale of the housingunits has increased some new owners complained about the lack of amenities(water and electricity) promised. Those who acquired properties on the Houedosite also complained about accessibility to their properties and security concerns.
Transparency on the sale remains a serious issue as the Agence Fonciere del’Habitat has not published any statistics on sales. However it is well known thatthe acquisition rate is much lower than expected. The main problem is affordability,even for civil servants who find it very difficult to afford the down-payment. Thegovernment is exploring the option of leasing to ease access to these properties.
Despite important progress made in securing property rights on land by theMillennium Challenge Account Benin programme of 2007 to 2011, trade of emptyplots continues to be limited by the absence of a comprehensive cadastre andlimits (the length and cost of the process) in establishing land titles on plots on themarket. The new Land Code will create a cadastre, but in the meantime, urbanland registries in a few of the big cities are the only mechanisms available.
Policy and regulation
Benin’s first housing policy was adopted in 2005. This complements other urbandevelopment policies like the National Land Use Planning Policy statement and theUrban Policy statement. It aims to improve land tenure security and make publicintervention more effective, to encourage individual housing investment effortsthrough relevant regulatory and operational provisions, to develop public privatepartnerships for the production of housing, and to define the rules and accessconditions to housing. The housing policy framework prescribes that landsubdivisions in any municipality should be subject to the existence of a masterplan, a schematic structure and a land use plan. However, it is doubtful whethermunicipalities comply with this, as the framework does not make their role clear.The implementation strategy for the housing policy framework includes theimprovement and strengthening of the regulatory and institutional framework forhousing, the promotion of local building materials, and the establishment of amechanism for housing finance, specifically the creation of a housing bank. Oneevident output thus far is the creation of the Benin Housing Bank.
A National Land Use Planning Policy was adopted in 2002 with the objectives ofpromoting land use planning and the rational management of resources, as well asstrengthening basic infrastructure at the local level. The success of this is yet to beseen, however, as it is not well known to prospective stakeholders like localgovernments.
In 2012, alerted by citizens in several municipalities and communes, ofmismanagement of public and private land, the Minister of Decentralisation issueda hold on any new land subdivision and commissioned investigations of cases ofnon-transparent land subdivisions. Several workshops were held at national levelto deepen reflections on a new land policy for Benin. An important advance inthe regulatory environment was the vote early in 2013 by Parliament of the newBenin Land Code. This reorganises land property rights and puts an end to thelegal dualism inherited from the colonial era, creating a unified land tenure system.In November 2014, as part of the Doing Business reforms, the government tooka total of 1411 important decrees to ease to implementation of the new Land
> $50 000
$25 000 – $50 000
$14 000 – $25 000
$8 000 – $14 000
$5 000 – $8 000
$3 600 – $5 000
$2 400 – $3 600
$1 600 – $2 400
$800 – $1 600
<$800
- - - Average income needed for the cheapest newly built house by a formal developer, 2015
- - - Average annual urban household income, 2014
BENIN
$10 351
$3 514
Rural | UrbanAnnual household income US$
No. of households (thousands) 500 400 300 200 100 0 100 200 300
36
Code, but also created two major agencies in the institutional architecture of landadministration: the National Agency for Domain and Land (Agence nationale dudomaine et du foncier – ANDF), and the Land Compensation Fund (Fonds dedédommagement foncier) under the Ministry of Finance. Likewise, Communes(local governments) were empowered on land administration with the enactmentof decentralised organisation for land administration, among which the Commune’sLand Administration Commissions. This will help Communes to fully exercise theirprerogatives in land administration as devolved by decentralisation laws. Amongareas covered by the above-mentioned decrees are the shared property rights onbuild high rise buildings, modalities for the division and reunion of property rights,arrangements for exercising the right of first refusal and leasing of preempted orexpropriated buildings. Those are important for the protection of property rightsin the Republic of Benin.
Opportunities
People in Benin take pride in owning their house. The demand for housing istherefore very high. There is also a strong commitment by the government toinvest in the housing sector, as illustrated by the launch of the ’10 000 affordablehousing units’ programme in 2008. Likewise, the legal and institutional frameworkto secure property rights is being strengthened, especially since the voting in 2013of a new land code, but also the creation of several entities to that end. All thisshould soon be complemented by the enactment of a new land policy note by thegovernment. The policy aims to help secure access to land and land ownership,facilitate the access of public authorities to land, improve management by the stateand decentralised communities of their respective jurisdictions, and regulate landtransactions and land transfers. Roads and other infrastructure is also improvingfast while access to basic service is also being enhanced. However, the landscapeof private developers is still to be filled, as most of the delays encountered withthe government programme are due to the lack of professional private developersinterested in the affordable housing segment of the market.
The signing of a new Millennium Challenge Account programme for Benin forUS$403 million in early September 2015 for five years, holds promises for theimprovement of energy infrastructure, which has been so far a big constraint todevelop business in the country.
Sources
AfDB, OECD, UNDP and UNECA (2015). African Economic Outlook 2015.Country Note Benin.Bank of Africa Group (2015). Annual Report 2014. Casablanca. February 2015.BCEAO (2015). Statistical Yearbook 2014. Dakar : BCEAO. June 2015.BCEAO (2014). Note d’analyse sur les conditions de financement bancaire del’habitat dans les pays de l’UEMOA. Dakar : BCEAO. Octobre 2014.Boko, J. (unpublished 2011). Access to Housing Finance in Africa: Exploring theIssues. (No 15. Benin Republic). Study commissioned by FinMark Trust withsupport from the African Union for Housing Finance.World Bank (2014). Doing Business 2015: Going Beyond Efficiency.Washington, DC: World Bank Group. DOI: 10.1596/978-1-4648-0351-2.License: Creative Commons Attribution CC BY 3.0 IGO.
Websites
www.africaneconomicoutlook.org www.banque-habitat-benin.com http://www.bank-of-africa.net/www.doingbusiness.org www.unhabitat.org www.worldbank.org www.gcitt.com www.bceao.int www.benin-immo.org/ www.globalserviceimmo.com/
1 BCEAO (Central Bank 2014). Commission Bancaire de l’UMOA, Rapport d’activités 2013, p. 28.2 BCEAO (Central Bank 2015). Statistical Yearbook 2014, p.30.3 African Economic Outlook 2014. Benin country profile.4 BCEAO (Central Bank 2014). Note d’analyse sur les conditions de financement bancaire de l’habitat de l’habitat dans les pays de l’UEMOA, p.155 www.crrhuemo.org6 Bank of Africa Group (2014). Annual Report, p.777 BCEAO (Central Bank 2015). Indicateurs des SFD de l’UMOA – 2015, available at the website http://www.bceao.int/IMG/pdf/indicateurs_au_31_mars_2015.pdf8 Banque de l’Habitat du Bénin9 http://www.gcitt.com/ 10 http://www.agetip-benin.com/IMG/pdf/Villas_de_l_Atlantique-2.pdf 11 http://gouv.bj/content/communique-du-conseil-des-ministres-des-mardi-25-et-jeudi-27-novembre-2014

Africa Housing Finance Yearbook 2015
37
Botswana
Programme that will see it drawing down from its vast foreign reserves, whichcurrently stands at US$8.740 billion. The funds will be used to developinfrastructure mainly; fast tracking of land servicing, with 37 000 plots to be cateredfor in the coming year ; construction of 4 480 new housing units by the BotswanaHousing Corporation; construction of an additional 1 664 teachers quarters and534 nurses’ quarters. The package also includes construction of 144 classroomsand 92 school laboratories. New roads will be constructed, with bypasses for theA1 highway as well as bypasses for Francistown, Molepolole and Lobatse.
Access to finance
Access to finance in Botswana is relatively high by African standards, but consideredlow globally. This is especially so considering the country’s relatively high levels ofGDP per capita (based on purchasing price parity of US$7 757.03 in 2014).Commercial banks in Botswana are small by international standards. However,they are competitive and rapidly growing. Currently, there are seven commercialbanks, namely, Barclay Bank, Standard Chartered Bank, Stanbic Bank, First NationalBank, Bank Gaborone, Bank of Baroda and Capital Bank. In addition there arethree statutory banks namely National Development Bank, Botswana Savings Bankand Botswana Building Society. According to the third FinScope survey undertakenin Botswana in 2014, 67 percent of the population is financially served, using eitherformal and/or informal products, 50 percent of the population is formally bankedand 24 percent is financially excluded. The year-on-year increase in commercialbank credit eased from 15.1 percent in December 2013 to 13.5 percent in
Overview
Botswana is a land-locked country in Southern Africa, with a population of just overtwo million people, and is known for its mining and natural resource base. Hometo the headquarters of the Southern African Development Community (SADC),Botswana has been one of the fastest growing economies in the region. Followinga dip in the demand for its resources, which reflected in poor GDP figures in 2008and 2009 (-3.7 percent), the economy grew by 6.1 percent in 2011, and then bya more modest 3.7 percent in 2012. The lower growth rate was due to declinesin the mining sector, which registered a negative growth of 8.1 percent in 2012, aswell as the water and electricity sector. Domestic economic performance grewin real terms by 4.4 percent in 2014 compared to 9.3 percent in 2013 due torevision of national accounts date from 2012 onward and the inclusion of newmines in the GDP calculations. Botswana government has reduced the 2015forecast economic growth from 4.9 percent to 2.6 percent. Despite the lowprojections in growth, it is noteworthy that Botswana has never performed lowerthan the regional growth and therefore the revised estimates towards the nextfinancial year will most likely show an upward trajectory by 200 points minimum.
A positive aspect of the 2014 growth is that, it was mainly driven by non-miningsectors such as Transport and Communications and Trade, Hotels & Restaurants.These sectors recorded growth rates of 7.4 percent, and 7.1 percent, respectivelyin 2014. The water and electricity sector on the other hand continued tounderperform, due to the drought situation and persistent technical problems atMorupule B Power plant. The sector contracted by 18.5 percent in 2014, resultingin insufficient supply of water and electricity, and the adoption of power and watersupply rationing in the country. It is clear that the challenges of power and waterprovision will remain in the medium to long term; hence government is makingconcerted effort to address such. In the World Bank’s 2015 Doing BusinessReport, Botswana was ranked 74th out of 189 countries, the third highest in SADCafter Mauritius (28) and South Africa (43). Starting a business, getting electricityand trading across borders are the weak elements of the business environment.The Ibrahim Index of African governance ranked Botswana third (with a score of76.2 percent compared to a ranking second (with a 77.6 percent score) in theprevious year.
Botswana’s urbanisation rate (1.30 percent) is becoming increasingly visible asGaborone grows in size. The government will embark on an Economic Stimulus
KEY FIGURES
Main Urban CentresGaborone (capital), Francistown
Exchange Rate: 1 US$***Inflation 2013 | 2014 (est.) | 2015 (prov.) | 2016 (prov.) *
10.21 Botswanan Pula (P)5.8 | 4.4 | 3.3 | 3.0!!
Population^ | Population growth rate (2013)^Urban population (% of total)^ | Urbanisation rate (% in 2013)^
2 038 587 | 0.8657.19 | 1.30
GDP / capita (current US$)^ | GDP growth rate (annual %)^GNI / capita, Atlas method (current US$) ^Population below national poverty line*Unemployment rate (%)*Gini co-efficient (year of survey)^^HDI (Global Ranking)" | HDI (Country Index Score)”
7 757.03 | 2.6!*7 88019.317.760.46 (2009)109 | 0.683
Lending Interest Rate^Mortgage Interest Rate (%) | Mortgage Term (years)#Credit % of GDP^Average Mortgages % of GDP° Price To Rent Ratio City Centre** | Outside City Centre**Gross Rental Yield City Centre** | Outside of City Centre**Outstanding home loan (% age 15+)##
9.006.5!!!55.4!!!6.59% (2013)12.69 | 18.197.88% | 5.5%9.63
What is the cost of standard 50kg bag of cement (in US$)? #What is the price of the cheapest, newly built house by a formaldeveloper or contractor (in US$)? #What is the size of this house (in m2)? #What is the average rental price for a formal unit (in US$/month)#What is the minimum plot size for residential property (in m²)#
5.4
70 51984...354
Ease of doing business rank !Number of procedures to register property !Time (days) to register property !Cost (% of property value) to register property !
744155.10
*** Conmill.com The Currency Converter^ World Bank's World Development Indicators (2014)~ World Bank PovcalNet: an online poverty analysis tool, various years^^ The World Bank's PovCalnet" UNDP's International Human Development Indicators (2014)° Various: Badev et al. "Housing Finance Across Countries: New Data and Analysis" – Unpublished
paper/Hofinet/World Bank## Global Financial Inclusion Database (FINDEX)# CAHF Annual Survey Data (September 2015)! World Bank's Doing Business Survey Data (2015)** Numbeo Online User-Contributed Database!* Government of Botswana!! www.bob.bw or http://www.cso.gov.bw/!!! Bank of Botswana Annual Report

38
December 2014, due to a significant slowdown in growth of lending to thehousehold sector, from 24.2 percent to 10.7 percent. In contrast, the annualincrease in business credit rose from 4.6 percent in 2013 to 17.2 percent in 2014.As at December 2014, the share of household credit in total private commercialbank credit was 56.4 percent compared to 57.7 percent in December 2013.
The lower growth in household credit was due to a significant slowing in the yearlyincrease in mortgages from 40.1 percent to 18.4 percent and in personal loansfrom 19.6 percent to 7.4 percent, in an environment of slow growth in incomes.At the same time, from the supply side, there was weak growth in loanable funds,which further suppressed credit growth through tighter lending conditions. Theslowdown in the growth of mortgage lending appeared to be consistent withother indications that the market for residential property was weakening, especiallyfor high value properties.
Total banking sector assets reached P68 billion in December 2014, which is anincrease of 12.6 percent from P60.4 billion in December 2013. This expansion inassets was driven by growth of 13.6 percent in loans and advances from P38.8 billionin December 2013 to P44.1 billion at the end of 2014, while BoBC’s (Bank ofBotswana Certificate) held by banks fell by 22.7 percent in the same period.Deposits by local banks held in foreign banks rose by 14 percent, while “otherassets” increased by 3.6 percent. On the liabilities side, public deposits atcommercial banks increased by 6.1 percent in the same period. A notable featureof commercial banks’ balance sheets is that funding is supported by wholesalebusiness deposits (71.5 percent of total deposits), which sustains the net debtorposition of households (accounting for 55.4 percent of total credit). The ratio ofcommercial bank assets to nominal GDP remained broadly stable at around50 percent in both 2013 and 2014.
Assets and liabilities of the Botswana Building Society rose by 12.4 percent fromP3 billion (US$293.8 million) in December 2013 to P3.4 billion (US$333 million)in December 2014; this compares with the 9.9 percent increase in 2013. Loansand advances increased by 14.2 percent, while the Society’s cash and depositsgrew by 4.5 percent. Total assets had expanded by 15.6 percent to P1.9 billion(US$ 186 million); this is considerably lower than the growth of 33.2 percent in2013. This reflected slower growth in lending of 16.1 percent against 20.4 percentthe previous year, together with a contraction in cash and deposits and otherassets. The balance sheet of the Botswana Savings Bank grew by 9.7 percent in2014 (14.6 percent in 2013) as lending increased by 20 percent (16.5 percent in2013). Mobilisation of savings was also sustained, with deposits growing by10.8 percent in 2014, albeit slower than 15.4 percent in 2013. For the BotswanaDevelopment Corporation, assets increased by 5.4 percent to P2.1 billion(US$205.6 million) in the year to December 2014 on the back of growth of7.2 percent in investments in related companies, which offset the decline in bankdeposits and loans, advances and leasing.
The financial institutions and government of Botswana have worked hard to ensurehousing affordability in the development of relevant loan products. Governmentassists all Botswana citizens to purchase or develop properties by guaranteeing25 percent of each loan delivered through the BBS. While financing a completedhouse is beyond the reach of most citizens, Standard Chartered Bank is nowoffering 100 percent financing for mortgages in urban centres, small constructionor housing micro loans offered by financiers can theoretically reach more people,who can then build incrementally. In this segment, the Ministry of Lands andHousing has introduced the Integrated Poverty Alleviation and Housingprogramme, which trains households to acquire productive skills in theconstruction industry so that they might address their own housing needs whilealso earning an income. An evaluation of the programme carried out at the endof 2011 found that while training in various construction skills had been successful,this has not translated into housing delivery.
Other housing loan providers include the National Development Bank, a stateentity, which has introduced a self-build loan, lending as little as P50 000(US$4 897) for building a new home, payable over a maximum of 25 years.
Botswana’s microfinance industry has increased the reach of finance servicesgenerally. This form of lending has also been associated with consumer spending,as well as with having money available for education and emergencies. Housingmicrofinance remains unchartered territory in Botswana, although some lendersare moving into this space, notably Select Africa. The challenge is convincing theauthorities of the appropriateness of this type of lending for housing purposes.The Non-Bank Financial Institution Authority (NBFIRA) was recently reluctant togrant a microfinance institution accreditation to offer housing finance, given thehigh costs of microfinance.
Government policy offers low-moderate income households (those earningbetween P4 400 – US$431 and P36 400 – US$3 565) access to a houseimprovement loan through the Self Help Housing Agency (SHHA). A loan amountof up to P45 000 (US$4 407) is available, payable over 20 years at P187.50 amonth, interest free. Repayment on this loan has not been good however thereare roll out challenges due to insufficient funding. Government is currentlyexperiencing a backlog in financing projects across the country. The SHHA schemewas also been extended to officers at entry point of middle management. In April2014, the government issued Public Service Directive No. 8 of 2014 which amongother benefits extended the SHHA scheme to public officers on salary scale upto D4 (US$1 500 p/m). In April 2015 this year as part of its effort to improvehomeownership, government, further, introduced a housing allowance for theemployees in the civil service though at a paltry US$19.6 (BWP 200).
Botswana has one of the more active credit information sharing sectors in theSADC region. In 2013 the government of Botswana through World Bank supportand FinMark undertook a study on the Credit Information Sharing and work is atadvanced stage to appoint to set up a secretariat for that.
> $50 000
$25 000 – $50 000
$14 000 – $25 000
$8 000 – $14 000
$5 000 – $8 000
$3 600 – $5 000
$2 400 – $3 600
$1 600 – $2 400
$800 – $1 600
<$800
- - - Average income needed for the cheapest newly built house by a formal developer, 2015
- - - Average annual urban household income, 2014
BOTSWANA
$26 564
$16 194
Rural | UrbanAnnual household income US$
No. of households (thousands) 60 40 20 0 20 40 60 80
Africa Housing Finance Yearbook 2015
39
Botswana’s pensions industry is large with about 97 standalone registered pensionfunds and total assets accounting for about 60 percent of the country’s GDP.Pension funds’ assets grew by 11.9 percent from P58.7 billion (US$5.4 billion) inDecember 2013 to P59.4 billion (US$5.8 billion) in December 2014. Pension-backed loans are legally permissible; the industry is rather conservative and doesnot provide members with housing loans or allow third party loans secured bypensions. Some argue that the regulatory framework is not clear enough in dealingwith pensions and that this has undermined the growth of this product.
Affordability
According to the 2014 FinScope Botswana survey, 20 percent of adults inBotswana do not earn an income, while another third earn less than P500 (US$74)a month. In most urban households (49 percent) there is only one income earner;in 28 percent of households there are two income earners, and in 15 percentthere are three or more income earners. Some eight percent of urban householdsand 13 percent of rural households have no income earners. Access to mortgagesis constrained by household income.
The Botswana Housing Corporation (BHC) is a leading housing developer. BHC’slowest cost housing product is a 84m2 house on a 354m2 plot. This costs aboutP720 000 (US$70 519). BHC suggests that the minimum mortgage instalment forone of its houses is P6 400 (US$627), which means that a household would haveto earn at least P12 000 (about US$1 175) a month. Government has putminimum salary take home at US$127.33 for singles and US$146.91 for marriedcouples and any person falling below that threshold is imprisoned. This was putin place to avoid over indebtedness by household. The biggest development in thepast two years ever since the Central Bank put a moratorium on bank charges hasbeen that, banks now prefer to finance purchase of ready built structures asopposed to construction. That has led to a slowdown in mortgage uptake.
Housing supply
The supply of ready-built housing units in Botswana is low in all markets, and mostpeople self-build for occupation. The BHC, the primary housing developer inBotswana, was established by an act of Parliament in 1971 to provide for thehousing, office and other building needs of the Botswana government, localauthorities and the general public. In April 2012, the BHC’s mandate wasexpanded so that it might operate as government’s single housing authority. Assuch, the BHC is now also responsible for the construction of housing units withinthe Self Help Housing Agency’s (SHHA’s) turnkey projects, as well as districthousing.
The BHC has a large estate of flats and town houses, and a balanced mix of high,medium and low income houses spread throughout the country, withconcentrations in Gaborone and Francistown. Although historically focused ondeveloping housing for rental, it has recently begun to offer houses for sale as well(although according to their website, this scheme is currently suspended).
Property markets
The outlook for the property market is generally positive. Property prices haverisen steadily over the past few years, spurred on in part by the booming tourismindustry, and showing resilience even in the face of recession. Secondary propertymarkets are limited by the shortage of stock that can be mortgaged in primarymarkets. A useful indicator is the fact that only 18 percent of the buildings in thecountry are of durable material. This shortage is also reflected in the lack ofadequate affordable rental housing stock, and the consistent reports of steep risesin rentals in urban areas.
In an effort to increase tenure security and support enhanced access to mortgagefinance, the Ministry of Lands and Housing has undertaken a land registrationsystem for properties not formally registered. According to the World Bank ittakes about 15 days to register a property in Botswana in 2015 (versus 60 daysfor Sub-Saharan Africa), and the process costs about 5.1 percent of the propertyvalue. Botswana is ranked 51st out of 189 countries globally in terms of thisindicator, illustrating the relative efficiency of the country’s registration process.
Policy and regulation
The Botswana government has prioritised savings and credit for long-terminvestments such as housing. One area of reform identified is the landadministration system. The lengthy process for conversion from tribal to commonlaw land as required for mortgage lending has been cited as a problem.Regulations about land use management such as building permits and relatedprocedures are also considered unduly onerous and bureaucratic, and need to bereformed.
While Botswana has a number of housing programmes under way (the SHHA, thePresidential Housing Appeal, the Housing Scheme for Poverty Eradication, theBotswana Housing Corporation, etc.) there is no underlying housing policy. In2012/2013, a bill to revise the Town and Country Planning Act was introduced todecentralise town planning functions to the Districts. The bill was expected toreduce delays in the processing of planning applications. In 2013, the DevelopmentControl Code was also revised to assist in the management of land and activitiesthereon.
Opportunities
Botswana is a relatively stable, well-managed economy that has shown significantgrowth over the last few years. Finance for self-build housing still offers significantprospects for growth, due to this being the preferred method of building, evenamong the middle and higher income categories. Housing microfinance thereforehas enormous potential. Mortgage lending has been increasing, and while thereis limited demand given the country’s generally small urban areas, it also haspotential for growth. The state has recognised the need to reform in many keyareas such as land administration. If followed through, this can enhance access to,and affordability of, mortgages among the population. Developers willing toembark into real estate should be willing to bear the cost of servicing the landwhich happens to be the biggest constraint to land development. The issue ofsewage is also a major concern, however the economic stimulus packages seeksto attend to all these constraints and therefore property development seems tobe on its hay days of growth. The financial market is good with low interest ratesand the demand for student accommodation and low cost housing is very high inurban areas due to the high levels of urbanization. The opening of new mines andindustries across the country is also putting pressure on the supply.
Sources
Ministry of Finance & Development Planning, Budget Strategy Paper. 2016/17August 2015.Bank of Botswana, 2014. Annual Report (Main Report), 2015 and Part C StatisticsFinMark Trust. Finscope 2014, 2015.Botswana Housing Corporation. BHC Fourth Quarter Report. 2014, 2015.www.gov.bw.www.cso.gov.bw.Bank of Botswana,. Monetary Policy Statement 2015, March 3 2015.Bank of Botswana. Statement of Financial Position, June 2015, 2015.World Economic Outlook. Uneven growth, Short and Long term, April 2015,International Monetary Fund. 2015.Doing business 2015. Economy Profile 2015. Botswana, World Bank. 2014.

40

Africa Housing Finance Yearbook 2015
41
Burkina Faso
for low and middle income earning households. BHBF is funded by thegovernment and its agencies, which contribute 30 percent, international institutionswhich contribute 25.33 percent and other private institutions which contribute44.67 percent. In 2013, BHBF introduced a new product called CAP Lafia, whichallows borrowers to purchase land and/or to build a home, provided that theborrower has a housing savings account or housing savings plan. The product isaimed at public, private and informal sector workers. To qualify, the borrower mustbe a client of BHBF. Borrowers are required to provide a 10 percent deposit, andthe maximum loan term is seven years for land and 15 years for an ‘affordablehouse’. The CAP Lafia provides housing construction and land acquisition loansat a subsidised interest rate of five percent. The bank also provides added servicessuch as an architect to view the plans before a loan is approved.
Some other commercial banks such as Bank of Africa, Banque Internationale pourle Commerce, l’Industire et l’Agriculture du Burkina (BICIA-B) and SocieteGenerale de Banque au Burkina (SGBB) have recently introduced mortgagefinance in their portfolios, although access remains limited. The World BankGroup/IFC Mortgage Market Development Project, approved in 2010 forUS$600 000 equity in the Banque de l’Habitat du Burkina Faso and implementedin 2013, included advisory and training programmes for the sector.
At the end of December 2010, the microfinance sector comprised 81 institutionswith 489 branches. At the time, just over half of the 1.1 million clients were men,another quarter were women, and groups or legal entities made up the remainder.
Overview
Burkina Faso is a landlocked country in West Africa, and part of the West AfricanEconomic and Monetary Union (WAEMU). It has a population of about 17.42 millionpeople and is one of the least urbanised countries in the world. Burkina Faso’scities are growing rapidly though – at an estimated 5.8 – and the capital ofOuagadougou is projected to more than double in population size between 2005and 2020. With a GDP per capita of US$720, Burkina Faso is classified as a lowincome country. GDP real growth rate in 2014 reached 4.05 percent, due mainlyto investment in infrastructure and 2014 good harvest and low oil prices. In spiteof political crisis, lower gold prices and the ebola epidemic, 2015 GDP isestimated at 5.5 percent and 7.0 percent in 2016.
The political tension in the country since the adoption of the law creating a senatein 2013 and the government’s intention to revise the country’s constitution toallow the president to serve a fifth term has resulted in ousting President BlaiseCompare in on 30 September 2014. The president has been in power for the pasttwenty seven years.
In spite of the economic growth in 2013 and 2014 and the inflation rate of0.9 percent, poverty remains high and the poverty headcount ratio was 44.6 percentin 2014. The economy remains vulnerable to changes in gold and oil pricesand especially to the political situation of the country.
Access to finance
Burkina Faso is part of the Central Bank of West African States (BCEAO), whichincludes seven other countries (Benin, Côte d'Ivoire, Guinea-Bissau, Mali, Niger,Senegal and Togo). As of 2014, the financial sector of Burkina Faso was dominatedby 12 commercials banks, five credit institutions, 10 insurance companies, onepostal financial services outlet, two social security institutions, 50 exchange offices,122 offices of funds transfer, 13 national funds of financing and 81 microfinanceinstitutions with 489 branches. Access to finance in the country is low, only about14 percent of the country’s population over the age of 15 have a bank account,nine percent have savings and five percent have loans, as stated in global Findex2015.
The Housing Bank of Burkina Faso (Banque de l’Habitat du Burkina Faso, or BHBF),which started operating in 2006, was created to facilitate access to housing finance
KEY FIGURES
Main Urban Centres Ouagadougou
Exchange Rate: 1 US$***Inflation 2013 | 2014 (est.) | 2015 (prov.) | 2016 (prov.) *
593.20 West African CFA0.5 | 0.9 | 1.5 | 1.7
Population^ | Population growth rate (2013)^Urban population (% of total)^ | Urbanisation rate (% in 2013)^
17 419 615 | 2.8229.02 | 5.75
GDP / capita (current US$)^ | GDP growth rate (annual %)^GNI / capita, Atlas method (current US$) ^Population below national poverty line*Unemployment rate (%)*Gini co-efficient (year of survey)^^HDI (Global Ranking)" | HDI (Country Index Score)”
720.05 | 4.0571046.73.339.78 (2009)181 | 0.388
Lending Interest Rate^Mortgage Interest Rate (%) | Mortgage Term (years)#Credit % of GDP^Average Mortgages % of GDP° Price To Rent Ratio City Centre** | Outside City Centre**Gross Rental Yield City Centre** | Outside of City Centre**Outstanding home loan (% age 15+)##
...5 | 1528.03.........3.41
What is the cost of standard 50kg bag of cement (in US$)? #What is the price of the cheapest, newly built house by a formaldeveloper or contractor (in US$)? #What is the size of this house (in m2)? #What is the average rental price for a formal unit (in US$/month)#What is the minimum plot size for residential property (in m²)#
10.12
8 429 – 10 115...500 – 2 528200
Ease of doing business rank !Number of procedures to register property !Time (days) to register property !Cost (% of property value) to register property !
16746712.30
*** Conmill.com The Currency Converter^ World Bank's World Development Indicators (2014)~ World Bank PovcalNet: an online poverty analysis tool, various years^^ The World Bank's PovCalnet" UNDP's International Human Development Indicators (2014)° Various: Badev et al. "Housing Finance Across Countries: New Data and Analysis" – Unpublished
paper/Hofinet/World Bank## Global Financial Inclusion Database (FINDEX)# CAHF Annual Survey Data (September 2015)! World Bank's Doing Business Survey Data (2015)** Numbeo Online User-Contributed Database

42
There are 21 MFIs listed on the MIX Market (an online repository of microfinanceperformance data and analysis) with US$176.7 million worth of loans dispersedto 194 549 active borrowers, US$252.7 million deposits and 1.4 million depositorsin 2015. The average loan was about CFA Francs 3.78 million (US$6 372). Réseaudes Caisses Populaires du Burkina (RCPB) dominated the market in 2015 with agross loan portfolio of US$128.44 million, gross deposits of US$218.4 million,64.28 active borrowers and 1 091 853 depositors.
With the technical support of Développement International Desjardins (DID), aworld leader in the microfinance sector, the RCPB developed a mortgage loanproduct in 2008. The minimum loan size is CFA Francs 5 million (US$10 000) witha mortgage on property. Borrowers are required to make a 15 percent depositand the interest rate is fixed at 14 percent over 10 years for wage earners, andover five years for non-wage earners. By March 2010 the RCPB had granted 205loans for an amount of about CFA Francs 770 million (US$1.3 million). Theaverage loan was about CFA Francs 3.78 million (US$6 372). The product whichhas grown rapidly was fully integrated into RCPB’s overall portfolio by August2013 and is now offered in all RCPB branches. The housing loan portfolio as ofAugust 2013 was CFA Francs 65 billion to CFA Francs 70 billion (US$132 millionto US$142 million), representing seven percent to 10 percent of RCPB’s overallportfolio..
In July 2010, the WAEMU created a regional mortgage refinance fund calledCaisse Régionale de Refinancement Hypothécaire (CRRH), which is hosted atthe West African Development Bank. With an initial capital of CFA Francs 3.4 billion(US$6.9 million) and a partnership with 31 banks in the region, the CRRH aimsto provide long-term resources that will allow lenders to develop long-termmortgage products at relatively moderate rates. The West African DevelopmentBank is expected to increase its contribution to CRRH to CFA Francs 55 billion(US$110.8 million) in the future. In July 2012, the CRRH launched its first bondon the regional WAEMU financial market to mobilise CFA Francs 10 billion(US$20 million) for mortgage resources from its 30-plus shareholders. In January2013, the second wave of bonds was issued and yielded CFA Francs 19.15 billion(US$38.3 million). The third bonds were issued in December 2013. In fifteenmonths CRRH has mobilised CFA Francs 52 billion (US$104 million). The CRRHis quite successful in the regional stock exchange as illustrated by the number ofmembers’ banks (shareholders), now 46.
Affordability
Burkina Faso is a poor country with 46.7 percent of households living under thethreshold of poverty and earning CFA Francs 108 454 (US$182.83) or less a year.For the 14.5 percent of households representing the well-off population, who earnan income of more than CFA Francs 1.8 million (US$3 034. 39) a year, access toproperty in the main cities is relatively straightforward, with most housing deliveryand finance products designed for their needs. However, lower income householdsstruggle. Government subsidised housing, delivered at the minimum housing
standard defined by ministerial decree as including residential space of atleast nine m2 and some sanitary provision, costs about CFA Francs 5 million(US$8 428.86), but even this is out of reach for most low income households.
In an effort to improve affordability the government has initiated a series ofprojects among which are the Cite de l’amitie de Burkina Faso-Qatar, a project of1 282 housing of two to three bedrooms for the population of lower incomegroup and completely financed by Qatar. Cite de l’amitie de de Burkina consist of1 000 housing units of two to four bedrooms and twenty apartment buildings.The project is estimated at US$22.5 million. The project is financed by thegovernment of India through the EXIM Bank India. The minimum price is estimatedat CFA Francs 5 million and CFA Francs 6 million (US$8 428.86 – US$10 114.63).The Indian project is scheduled for completion in 2016; the construction isprogrammed to start in 2015. To qualify for the programme your monthly salaryshould be less than or equal to five times the minimum wage or CFA Francs 165 000(US$278). This condition was revised last September to up to eight times theminimum wage. Out of 1 282 units of the Cite de l’amitie Burkina-Qatar, 1019have been allocated.
Housing supply
Informal settlements have been growing in Burkina Faso’s main cities, illustrating anundersupply in housing, especially for lower income households. The governmentestimates that housing demand is growing by 8 000 units a year in Ouagadougouand 6 000 units a year in the country’s second largest city, Bobo Dioulasso. Ananalysis from 2009/2010 shows that only 17 percent of the population live incement or concrete structures. The majority (65.6 percent) live in earth brickdwellings, and a further 12.4 percent live in baked brick dwellings.
The government has been a key promoter of housing delivery for many decades.The public institution called Centre for the Management of Cities (Le Centre deGestion des Cités – CEGECI) was originally established in 1987 with a mandateto implement the government’s housing objectives. In 2000, this mandate wasextended to include the actual delivery of housing. The Construction and RealEstate Management Company (Société de Construction et de GestionImmobilière du Burkina, – SOCOGIB) was also established by government, but wasprivatised in 2001. SOCOGIB still carries on with its mission to develop land,construct housing, sell and let accommodation and manage properties, andprovides technical advice on home improvements. Housing constructed bySOCOGIB comes with a 10-year warranty on the floor, walls and roof.
More recently, since 2008, the government has developed a multi-year, socialhousing programme. The delivery target is 10 000 subsidised houses and theprogramme involves experimentation with local building materials in an effort toimprove affordability while maintaining quality. The programme is funded entirelyby the state, with 75 percent of the total delivery cost funded by the HousingBank and the remaining 25 percent funded by CEGECI. To be eligible, a household
> $50 000
$25 000 – $50 000
$14 000 – $25 000
$8 000 – $14 000
$5 000 – $8 000
$3 600 – $5 000
$2 400 – $3 600
$1 600 – $2 400
$800 – $1 600
<$800
- - - Average income needed for the cheapest newly built house by a formal developer, 2015- - - Average annual urban household income, 2014
BURKINA FASO
$2 761
$2 991
Rural | UrbanAnnual household income US$
No. of households (thousands) 1000 800 600 400 200 0 200 400

Africa Housing Finance Yearbook 2015
43
must not own a plot or a house, must have an account at the Housing Bank, andmust have worked for less than 15 years. Eligible households enter a raffle andnames are drawn for the houses that are available. In July 2013, a draw was heldfor 1 500 houses delivered as part of the programme. As from 2014 theprogramme has gained large publicity in Cote d’Ivoire where there is a sizeablecommunity of Burkinabe nationals (as the Burkinabe diaspora are eligible).
In August 2012, the second phase of UN-Habitat’s Participatory Slum UpgradingProgramme in Burkina Faso was completed. The phase involved the profiling andmapping of three informal settlements (known in Burkina Faso as ‘spontaneouszones’), and the identification of development priorities. Projects to address thesedevelopment priorities – now in evaluation stage – will form the basis for the thirdphase of the programme, which began in January 2013. A memorandum ofunderstanding was signed in November 2013 between UN Habitat, Minister Barryand Mayor Ilbudo to activate the third phase of the programme. The third phaseof the project was launched on the 27th of July 2015.
Cities Alliance, a global partnership for urban poverty reduction (together withvarious other partners), has set up an urban development programme over thenext three years worth US$3 million. The programme aims to manage growth andimprove access to services in Burkina Faso, in line with the National Housing andUrban Development Policy. The project is the first of its kind in Francophonecountries and was formally launched in November 2013.
Although there is a transitional government since October 2014, the newgovernment continues the efforts of the ousted government in promotingaffordable housing and sourcing for foreign investors through dynamic diplomacy.
Property markets
According to the World Bank’s 2015 Doing Business Report, Burkina Faso ranksrelatively high. In the Dealing with Construction Permits index, the country ranked75th out of 189 countries, relatively good score in the WAEMU member states. Ittakes 112 days, compared to the Sub-Saharan average of 157.7 days, 11procedures compared to 13.5 in the region. It takes 67 days and four procedures,and costs 12.3 percent (above the Sub-Saharan average of 9.1 percent) of theproperty value to register a property in Burkina Faso.
Policy and regulation
Burkina Faso’s policy framework dates from the early 1990s, with the adoption ofa new constitution in 1991 and a decentralisation policy in 1995. The nationalpolicy framework commonly called (RAF) “reorganisation agraire et fonciere” wascreated by “la loi du 23 mai 1996” and enacted by national decree on 6 February1997. Some 49 urban and 350 rural administrative entities were created in thisprocess. In 2009, a national policy on housing and urban development was enactedwith a 10-year plan of action ending in 2018. The policy puts an urbanisationstrategy in the centre of its economic growth plans, and explicitly addresses thepotential for real estate development to contribute towards growth. Part Threeof the strategy aims to ensure access to comfortable housing for every citizen.The policy aims to raise awareness of the responsibilities of the private sector aswell as to assist households in building their own housing.
Opportunities
The establishing of the Department of Housing and Urbanisation, andconsequently of the Housing Bank of Burkina Faso in 1995, demonstrates thecommitment of government to promote the housing sector and to championhousing for low income earners. Demand for affordable housing is clear andpractitioners can use this as an opportunity to develop innovative products thatserve the needs of the Burkina population.
Despite its status as a heavily indebted country, Burkina Faso has enjoyed stronggrowth in the past few years, largely as a result of political stability, good macro-economic management and a diversifying economy. The political stability enjoyedso far has been threatened by political tensions that have erupted over the senateissue and eventually the coup d’etat of last year. However the country’s housingopportunities are promising as the transitional government is promoting a dynamiccommercial diplomacy. A US$50.7 million competitiveness and enterprisedevelopment project by the World Bank is focused on creating the conditions to
improve business competitiveness and promote investment. This project will nodoubt also have an important impact on Burkina Faso’s residential real estatesector, creating opportunities for greater engagement by both local andinternational players. Regional interventions to support the growth of the housingsector will contribute towards Burkina Faso’s capacity to address its housing needsand mobilise its housing market.
Sources
African Economic Outlook (2015). Regional Development and Spatial Inclusion.Banque de France (2014). Rapport Annuel de la zone franc- Tableau de synthèsedes données économiques des pays de la zone franc- Burkina Faso. BCEAO (2013). Annuaire des banques et établissements financiers de l’UEMOA.BCEAO (2013). Annuaire des banques et établissements financiers de l’UEMOA.BCEAO (2014). Rapport Annuel de la BCEAO.Cities Alliance, The Burkina Faso Urban Country Programme, summary pamphlet.Government Information Service, Enjeux politiques des lotissement au BurkinaFaso : dans la dynamique d’une bonne gouvernance foncière publié le mardi 8 octobre 2013.Politique nationale de l’habitat et du développement urbain (2008). Burkina FasoMinistère de l’Habitat et de l’Urbanisme. The AFDB Statistics Pocketbook (2015).World Bank (2015). Doing Business Survey: Burkina Faso.
Websites
http://burkina24.comhttp://crrhuemoa.orghttp://mixmarket.orghttp://news.aouaga.comNews.abidjan.netwww.africaneconomicoutlook.orgwww.banque-france.frwww.bceao.intwww.burkinaurbanresourcecentre.net www.cia.orgwww.citiesalliance.orgwww.housingfinanceafrica.orgwww.mfw4a.orgwww.mhu.gov.bfwww.sfc.orgwww.tradingeconomics.comwww.unhabitat.orgwww.usaid.orgwww.worldbank.org

44

Africa Housing Finance Yearbook 2015
45
Burundi
is still low but improving. At the end of 2014, 25.9 percent of Burundi’s adultpopulation had a savings account with a formal financial institution, compared to23.8 percent in 2013 and 19 percent in 2011. Gender equality in financialinclusion is also improving. In 2011, women accounted for only 28.5 percent ofthe adult population with an account with a formal financial institution, comparedto 32.4 percent in 2013, and 34.3 at the end of 2014.
Access to financial services, as evidenced by the growing number of institutionsin the financial sector is improving. Presently, Burundi’s financial sector comprisesten banks, two financial establishments2, 27 MFIs and the RNP (National PostalService), compared to nine banks, 22 MFI and the RNP in 2011. In the sameperiod, the number of access points for financial services (branches of financialinstitutions), increased from 492 to 698. MFIs represent the highest percentage(41 percent) of access points for financial services, compared to 38 percent forbanks and 20 percent for the RNP3. The number of ATMs has increased from27 in 2011 to 75 in 2013.
MFIs account for 65 percent of all users of financial services and products. This isattributed to the flexible requirements for opening up an account with an MFI,compared to a banks and other financial institutions. The banks and financialinstitutions require higher minimum deposit amounts than the MFIs. It is possibleto open a current account at an MFI with a deposit of BIF 5 000 (US$3.3), whilethe minimum deposit at a bank is BIF 50 000 (US$33). Similarly, accountmaintenance fees are estimated at BIF 3 000 (US$2) per month in the banks,compared to BIF 200 to 800 (US$ 0.13 to 0.52) per month in the MFIs.
Overview
During the last five years, the government of Burundi has made significantprogress in transforming its society, both socially and economically. Amidst afragile environment, the government has rebuilt public institutions andstrengthened their governance to effectively implement public policies. Themacroeconomic environment is stable due to implementation of prudent reformsthat have imposed fiscal discipline, restructured public expenditure andstrengthened mobilization of tax revenue. In the last five years, GDP has grownat an average rate of 4.4 percent. GDP is forecast to grow at 4.8 percent in2015, up from 4.7 percent in 2014, boosted by improvements in the businessclimate. The World Bank Doing Business Report (2015), ranked Burundi 152 outof 189 countries, compared to a position of 171 in 2011, following implementationof a number of reforms that have facilitated ease of starting a business, tradingacross borders, registering property and promoting tax compliance.
However, Burundi’s macroeconomic growth has not been matched by asignificant reduction in poverty, largely because of the country’s extremely highpopulation growth rate. Burundi has one of the highest poverty rates in theworld (80.3 percent). Burundi’s GDP per capita was estimated at US$293 in 2013,compared to US$286, before the 1993 crisis1. Burundi’s GDP per capita (2013)is just over one eighth of the average GDP per capita of Sub-Saharan Africa. The2014 Human Development Index Report ranked Burundi as a low humandevelopment country (180 out of 187 countries), with an index of 0.389.
The structure of the economy remains rural and agrarian, with over 90 percentof the population engaged mainly in agriculture. The urbanisation rate wasestimated at 12 percent in 2014, compared to an average of 37 percent in Sub-Saharan Africa. Agriculture particularly agribusiness, is central to the urban growthstrategy of the country, and the overall goal is to support higher agriculturalproductivity to respond to the growing local demand, and encourage trading ofagricultural surpluses to promote non-agricultural activities (for example, tourism)in urban areas.
Access to finance
According to the National Financial Inclusion Strategy (2015 – 2020), whosepreparation was informed by updated (2014) statistics from the National Surveyon the Status of Financial Inclusion (2012), the level of financial inclusion in Burundi
KEY FIGURES
Main Urban Centres Bujumbura
Exchange Rate: 1 US$***Inflation 2013 | 2014 (est.) | 2015 (prov.) | 2016 (prov.) *
1 573.34 Burundian Franc (BIF)9.0 | 6.7 | 4.9 | 5.7
Population^ | Population growth rate (2013)^Urban population (% of total)^ | Urbanisation rate (% in 2013)^
10 482 752 | 3.1011.76 | 5.59
GDP / capita (current US$)^ | GDP growth rate (annual %)^GNI / capita, Atlas method (current US$) ^Population below national poverty line*Unemployment rate (%)*Gini co-efficient (year of survey)^^HDI (Global Ranking)" | HDI (Country Index Score)”
295.12 | 4.6627066.97.733.27 (2006)180 | 0.389
Lending Interest Rate^Mortgage Interest Rate (%) | Mortgage Term (years)#Credit % of GDP^Average Mortgages % of GDP° Price To Rent Ratio City Centre** | Outside City Centre**Gross Rental Yield City Centre** | Outside of City Centre**Outstanding home loan (% age 15+)##
15.6716.00 | 517.191.16% (2013)......1.44
What is the cost of standard 50kg bag of cement (in US$)? #What is the price of the cheapest, newly built house by a formaldeveloper or contractor (in US$)? #What is the size of this house (in m2)? #What is the average rental price for a formal unit (in US$/month)#What is the minimum plot size for residential property (in m²)#
25.00
25 000120250464
Ease of doing business rank !Number of procedures to register property !Time (days) to register property !Cost (% of property value) to register property !
1525233.20
*** Conmill.com The Currency Converter^ World Bank's World Development Indicators (2014)~ World Bank PovcalNet: an online poverty analysis tool, various years^^ The World Bank's PovCalnet" UNDP's International Human Development Indicators (2014)° Various: Badev et al. "Housing Finance Across Countries: New Data and Analysis" – Unpublished
paper/Hofinet/World Bank## Global Financial Inclusion Database (FINDEX)# CAHF Annual Survey Data (September 2015)! World Bank's Doing Business Survey Data (2015)** Numbeo Online User-Contributed Database
46
BFIs, offer loans at interest rates of 16 percent to 19 percent per annum, calculatedon declining balance. At the MFIs, there is a great variance in interest rates. Theyrange between 6 percent and 48 percent per annum4. Outstanding loans, at theend of 2014, were estimated at BIF 565.8 billion (US$ 367 million), compared toBIF 479.5 billion (US$ 311 million) in 2013 and BIF 329.6 billion (US$ 214 million)in 2011. MFIs offer the same loan products as the banks, though they have, overthe years, developed more specific products to meet the needs of their clientele.Loan products, offered by both MFIs and BFIs include; (i) overdraft and line ofcredit, (ii) personal and consumer loans, (iii) housing and real estate loans, (iv)agricultural loans, and (v) commercial and business loans.
Housing and real estate loans constitute 17.5 percent of the total portfolio of BFIs,compared to 44 percent of the MFIs. Three banks (the Burundi Bank ofCommerce and Investment, Eco Bank Burundi and KCB Bank) and the twoFinancial Institutions (the Fund for the Promotion of Urban Housing and theNational Bank for Economic Development), offer housing and real estateloans. Housing and real estate loans range between BIF 500 000 (US$324)and BIF 50 000 000 (US$32 362), for a tenor of between 4 and 20 years, at highinterest rates of between 16 and 19 percent. Medium-term mortgages (maturingin two to seven years) account for 63 percent of the total stock of loans grantedby the institutions. Long-term mortgages (15 to 20 years) constitute the balance.
In the last six years, the housing finance market has grown at average rate of18.5 percent per annum, increasing from BIF 30.5 billion in 2009 to BIF 80 billionin 2014. In 2014, only 1 600 mortgages were issued. This shows that the housingfinance sector is characterised by unmet demand, particularly among lower-middleand low income earners, who constitute over 90 percent of the population.
The largest housing finance provider is the Fund for the Promotion of UrbanHousing (FPHU), and accounts for nearly three-quarters of the market, cateringto only middle and high income earners. FPHU was established in 1989, with ashare capital of 100 million BIF, to finance housing at affordable conditions. FHPUwould provide affordable finance to (i) the SIP (Société Immobilière Publique), apublic building society (or a financial institution) charged with implementing andmanaging all government housing operations, including the improvement ordevelopment of urban and peri-urban housing and (ii) the ECOSAT, charged withland development and the construction of houses for civil servants and the privatesector with low incomes. This way, prospective homeowners would access anaffordable house on the market from ECOSAT, and affordable finance to mortgageit from SIP.
FHPU would mobilise and collect savings, through home saving accounts,supplementary pension funds and deposits, to fund the operations of the SIP andECOSAT. However, the civil war (1993 to 2005), which forced seven Central andEast African countries to place a trade embargo and other economic sanctions onBurundi, as way of initiating peace talks, to end the war5, had a severe impact onthe operations of FHPU, particularly, in financing its partner institutions. Theembargo and economic sanctions, raised the cost of houses delivered by ECOSAT(following an increase of over 10 percent on the cost of building materials, mostof which were imported). Worse still, several Burundians who had benefited fromSIP’s mortgages, to buy houses from ECOSAT, could not comfortably pay themback (their salaries were devalued (by about two-thirds), after the local currencydepreciated, and their mortgages were destroyed in the war). Since then, FHPU,and its partner institutions, have been operating in a precarious economic situation,unable to mobilise long and affordable funds, to effectively implement theirmandates. By and large, the lack of long-term funding schemes within the financialsector has constrained growth and development of the Burundi’s housing financesector.
Notwithstanding the above, the development of the housing finance sector inBurundi has also been constrained by the land tenure system. The formal landtenure system is weak. Most land is undocumented and existing land recordsoutdated. Nonetheless, ongoing reforms in land management and securingproperty rights are expected to support the growth of the sector. The legal andinstitutional changes espoused in the 2010 Constitution and the adjusted LandCode of 2011, instituted two major reforms: i) decentralisation of cadastre to thecommune (administrative division) level and ii) improvement in management ofpublic land6. In the World Bank’s 2015 Doing Business report, Burundi ranked
48th with respect to registering property, out of 185 countries, an improvement onthe previous years’ rankings of 51 in 2014 and 124 in 2013.
Affordability
Affordability of housing is low, largely because of the low purchasing power of thepopulation. Only 5.3 percent of Burundians earn between US$2 and US$20 a day.The informal private sector is the principal provider of employment, with a shareof more than 75 percent. In this sector, monthly wages range from BIF 4 000(US$3.3) to BIF 37 500 (US$30.6). This is too low for banks to lend against.
Civil servants have a guaranteed monthly salary, and are eligible for housing financebut their salaries are too low for banks. Efforts have been made to revise civilservants’ salaries, and in 2010 the government raised salaries of individuals inselected ministries. But the increments are insufficient, because they have not keptup with inflation. For example, an increment in the salary of a civil service from30 000 BIF in 1993 to 100 000 BIF in 2010, translated into a 233 percent increasein nominal wage, but a 58 percent decline in purchasing power, adjusting forinflation7.
Monthly salaries for teachers, the military and the police range betweenBIF 30 000 (US$24.7) and BIF 175 000 (US$142.1) below the minimum BIF 1 millionrequired by banks to offer mortgage finance. Judges earn between BIF 115 000(US$93.5) and BIF 270 000 (US$219.20), also below the minimum. The onlygovernment officials whose salaries are eligible for housing finance are ministersand members of parliament who earn between BIF 1.5 million (US$1 236) andBIF 3 million (US$2 472).
Housing construction costs in the middle income suburbs of Bujumbura areestimated at BIF 184 000 (US$150) a m2. Therefore a house of 120m2 will costBIF 22 080 000 (US$17 940). Such a house can only be afforded by ministers andmembers of parliament.
Housing supply
Most households live in their own homes, particularly in rural areas. Findings ofthe 2008 Household Survey showed that 96.2 percent of households own homesand 3.8 percent rent, most of these in urban areas. However, the quality of housingis poor. According to the 2008 Survey, 70 percent of homes are built with adobebrick or wood walls, 30 percent of the houses are covered with tiles or sheets andnearly 70 percent with straw or other plant leaves.
In Burundi, however, it is hard to find a medium to large scale real estate developer,capable of constructing more than 1 000 units annually. In Bujumbura City, nohousing estates over 300 units are in development. The planned modestly sizedhousing project, including 200 units for civil servants, was put on hold, largelybecause of the recent tense political environment, following commissioning of theparliamentary and presidential elections.
In addition to the absence of well established medium to large private real estatedevelopers, the high cost of construction is expected to further contribute to thelack of affordable housing on the market. Burundi imports almost all constructionmaterials. Imports include cement, bricks, pipes and iron sheet. Nonetheless, localproduction of cement has been scaled up to respond to the high demand. BurundiCement Company (BUCECO) is almost reaching its installed capacity of 100 000tones per year, to meet high local demand. The company doubled its productionin its first two years of operations8, to 70 500 tons of cement in 2012 comparedto 34 500 tons in 2011. On average, a 50-kg bag of BUCECO cement costsUS$25, about US$5 less than the imported product.
Presently, the supply side of the housing market is not able to keep up withdemand, leading to an annual shortage of 20 000 units9. Population projectionssuggest that the number of households in the main cities of Bujumbura, Gitega,Ngozi and Rumonge are expected to grow significantly in the period 2008-202510.This will translate into an annual demand of 10 000 new houses.
Recently, foreign business consulting and project financing companies, such as BizPlanners from Singapore, expressed interest in delivering affordable housing forlower middle and middle income earners. In 2014, Biz Planners signed amemorandum of understanding with the government to develop medium sized

Africa Housing Finance Yearbook 2015
47
housing projects of between 1 000 and 5 000 units. However, to date, this projecthas not been embarked upon. Between 2013 and 2014, a private developer(Agglobu Ltd) constructed 27 houses in Kinindo Town Council west ofBujumbura City. The three bedroom houses were sold at between US$205 000and US$225 000 each.
Two government programmes on urban development, the villagisation andlotissement projects, are helping address land scarcity, and it is envisaged that theywill, in the medium to the long term, gradually help tame the high demand forhousing and land in urban areas. Both initiatives, which are implemented by theSIP and ECOSAT, use peri-urban land to promote new residential areas.
The villagisation project targets the poorest households, giving them both land anda house with a water connection and solar panels. The houses don’t have windowsand a bathroom, making them generally cheaper to deliver. Once a householdacquires one, they are supposed to incrementally build the windows and thebathroom. Each house stands on a parcel of 40m2, and they measure about 70m2.Hence, there are about 20 houses per km2. This increases spatial expansion andreduces densities.
The lotissement project targets middle-income households. The project useseither public or private land, demarcates it in plots of 400m2, services it (road andwater connections), before allocating the plots to the middle income households.When land is public, middle-income households, pay for the costs of demarcatingand servicing the land.
When the land is private, the project negotiates with owner to service theirland in return for a portion of the land. After servicing the land, the ownerretains 40 percent, while the project retains the balance. The land is demarcatedinto plots of 400m2, before they allocated to middle-income households. Middle-income households are charged a fee for servicing the land. Fees are in the rangeof BIF 5 000 and 7 500 a m2, for a parcel of 400m2.
Property markets
Property markets are still underdeveloped, with some activities contracted to realestate agencies in neighbouring countries. There is no evidence of independentlocal firms offering valuation services. The country lacks professionals in theconstruction sector. As a result, several houses, including hotels, are of low qualityand lack innovation in design.
Government’s policy of encouraging local and foreign investors to invest in thehousing sector should lead to the development of the property market. Presently,registering property requires five procedures, takes 64 days and costs 3.2 percentof the property value. The number of days to transfer property has decreased byfrom 94 days in 2012 to 24 in 2015 due to the creation of a one-stop shop forproperty registration.
Nonetheless, the high cost of owning a property (a house costs about US$20 000),has increased the demand for rentals (by about 30 percent between 2014 and2015) in Bujumbura, particularly among modest income earners that migrated tourban areas to seek employment. The high demand contributed to an increase inrental fees, from US$300 in 2014 to US$430 in 2015, and yet disposable incomeof the modest income households stagnated at about US$350 during the last twoyears.
The demand for rentals targeting the rich, and expatriates, has on the other handbeen low, following a significant drop in the number expatriates who were livingin the country, after the country showed signs of increasing stability, about a decadeago. Today, owners of apartments that were occupied by expatriates have reducedthe rental fees from about US$2 000 per month to about US$500. Despite thelow monthly rental fees, these houses are still not appealing to modest incomeearners, as they prefer to live in less organised and humble suburbs.
Policy and regulation
In 2015, the long awaited comprehensive study that would inform the formulationof the National Urban Planning and Housing Policy was finalised and launched.The study, titled, “Strategies for Urbanisation and Economic Competitiveness inBurundi”, notes that the country lacks an overarching policy vision for tacklingurbanisation. The report further notes that the poor coordination among relevantinstitutions may hinder sustainable urban development. The report recommendsthe formulation of an urban policy to assist in aligning regulatory and policyframeworks and creating a clear framework for implementation of urban priorities.Other recommendations include (i) enhance spatial management, urban planningand land and property rights management and (ii) strengthen institutional deliverycapacity and enforcement.
Opportunities
The main investment opportunities in Burundi’s housing and housing finance sectorare (i) increasing access to long-term and affordable finance for construction andmortgage financing and (ii) building medium sized housing estates of about 1 000units, annually. The pension and insurance sectors, which can mobilise long-termfunds for housing, should be reformed. There is a need for more competition inbanking. There is a need to attract more organised real estate developers, bothlocal and foreign, to address the housing shortage.
> $50 000
$25 000 – $50 000
$14 000 – $25 000
$8 000 – $14 000
$5 000 – $8 000
$3 600 – $5 000
$2 400 – $3 600
$1 600 – $2 400
$800 – $1 600
<$800
- - - Average income needed for the cheapest newly built house by a formal developer, 2015
- - - Average annual urban household income, 2014
BURUNDI
$18 325
$2 210
Rural | UrbanAnnual household income US$
No. of households (thousands) 800 700 600 500 400 300 200 100 0 100 200

48
Sources
Africa Development Bank (2015). African Economic Outlook: Burundi.Bank of the Republic of Burundi (2012). Burundi National Financial InclusionSurvey. August 2012.Bank of the Republic of Burundi (2014). National Financial Inclusion Strategy(2015-2020).Bank of the Republic of Burundi (2014). Statistics.International Bank for Reconstruction and Development/The World Bank(2014). Strategies for Urbanisation and Economic Competitiveness in Burundi.International Monetary Fund (2015). Letter of Intent, Memorandum ofEconomic and Financial Policies, and Technical Memorandum of Understanding.Nkurunziza, J.D., Ndikumana, L. and Nyamoya, P. (2012). The Financial Sector inBurundi. NBER Working Paper 18289. August 2012.www.nber.org/papers/w18289. Oxford Poverty and Human Development Initiative.World Bank (2015). Doing Business Report: Burundi.
Websites
worldpopulationreview.comhttp://news.bbc.co.uk/2/hi/africa/261258.stmhttp://www.ophi.org.uk/wp-content/uploads/Burundi.pdf?a76f2d https://books.google.co.ke/books?id=OnGQQVuIBjgC&pg=PA55&lpg=PA55&dq=Burundi+Civil+War http://www.globalcement.com/news/item/1521-burundi-cement-doubles-profit-to-us$22m-in-2012 http://www.r vo.nl/subsidies-regelingen/projecten/introducing-modular-construction-high-quality-affordable-housing-burundi
1 Africa Economic Outlook(2015). Burundi 20152 The financial establishments are (i) the Fund for the Promotion of Urban Housing (FPHU) and (ii) the National Bank for Economic Development (BNDE).3 National Financial Inclusion Strategy (2015-2020).4 National Survey on the Status of Financial Inclusion (2012).5 Source: http://news.bbc.co.uk/2/hi/africa/261258.stm 6 International Bank for Reconstruction and Development/The World Bank (2014). Strategies for Urbanisation and Economic Competitiveness in Burundi.7 Nkurunziza, J.D., Ndikumana, L. and Nyamoya, P. (2012). The Financial Sector in Burundi. NBER Working Paper 18289. August 2012.8 http://www.globalcement.com/news/item/1521-burundi-cement-doubles-profit-to-us$22m-in-2012 9 http://www.rvo.nl/subsidies-regelingen/projecten/introducing-modular-construction-high-quality-affordable-housing-burundi10 International Bank for Reconstruction and Development/The World Bank (2014).

Africa Housing Finance Yearbook 2015
49
Cameroon
private sector investment in specific manufacturing sectors. Growth in this sectorand the increasing investments in infrastructure will help enable the expansion ofthe residential real estate market.
The tertiary sector accounted for 52.5 percent of GDP in 2014, up from 49percent in 2013. It is the most dynamic sector of the economy, and has grown atsix percent on average since 2007 due to good performance in business andmobile telecommunications, the recovery of the construction and transportsectors, and retail trading, hotel and catering industries and the financial servicesindustry. This sector is projected to grow continuously and contribute even moreto GDP.
Access to finance
Though Cameroon’s financial system is the largest in the region, it is still in itsinfancy. There are 14 commercial banks, 11 non-banking financial establishments,652 microfinance institutions, an increasing number of foreign exchange bureausand the Douala Stock Exchange. Government accounts for only 10 percent of thesocial capital of banks, while the private sector accounts for 90 percent. Thebanking sector is highly concentrated and dominated by foreign commercial banks.The five largest banks hold about 50 percent of the total assets in the financialsystem.
Only five percent of Cameroonians have access to a bank account. According tothe World Bank’s 2015 Doing Business Report, Cameroon ranked 169th in terms
Overview
Cameroon is a low to middle income Sub-Saharan African country with apopulation of 23.75 million and an annual population growth rate of 2.6 percent.By virtue of its population, position, resource endowments and level ofdevelopment compared to other countries in the region, it is the most significantmarket in the Economic and Monetary Community of Central Africa(Communauté Économique et Monétaire de l'Afrique Centrale, or CEMAC).
Cameroon has a stable macroeconomic environment. The country achieved aranking of 158th in the World Bank’s 2015 Doing Business Report for ease of doingbusiness. The economy has constantly been growing since 2010. Growth in 2014was 5.1 percent, up from 4.7 percent in 2013. The 5.1 percent growth cameslightly lower than the projected six percent based mainly on the strength ofinternal demand, notably domestic consumption. Economic growth, increasinglocal and foreign direct investments and a growing population have created agrowing middle class with a strong demand for products and services, includinghousing.
Cameroon’s primary sector now accounts for 19.9 percent of GDP. The countryhas natural resources such as petrol, gas, diamonds, aluminium, uranium, bauxite,timber, hydropower and iron ore. It produces agricultural products includingrubber, cotton, banana, cocoa, pineapple, coffee, grains, livestock and palm oil. Overthe last five years, growth has been driven strongly by the oil and agriculturesectors, which accounted for 50 percent and 25 percent of exports respectively.However, falling oil prices has reduced the value of oil exports and the contributionof oil revenues to GDP, which is now 10 percent. The mining industry isexperiencing a boom. New exploration and mining licences continue to be issued,with new opportunities for construction and the provision of subsidised, affordablehousing.
The secondary sector accounted for 27.6 percent of GDP, which is a contractioncompared to previous years. Industrial production growth rate was at 4.9 percentleading to a larger supply of energy and agricultural products. An increase in thevalue add of this sector will require huge investments in building infrastructureand in enhancing the business environment. This is currently being addressed bythe government with ongoing projects to increase electricity supply through theconstruction of new hydroelectricity power plants and incentives to encourage
KEY FIGURES
Main Urban Centres Yaoundé
Exchange Rate: 1 US$***Inflation 2013 | 2014 (est.) | 2015 (prov.) | 2016 (prov.) *
593.20 West African CFA2.1 | 2.2 | 2.4 | 2.2
Population^ | Population growth rate (2013)^Urban population (% of total)^ | Urbanisation rate (% in 2013)^
22 818 632 | 2.5153.82 | 3.57
GDP / capita (current US$)^ | GDP growth rate (annual %)^GNI / capita, Atlas method (current US$) ^Population below national poverty line*Unemployment rate (%)*Gini co-efficient (year of survey)^^HDI (Global Ranking)" | HDI (Country Index Score)”
1 426.40 | 5.891 35039.93.840.72 (2007)152 | 0.504
Lending Interest Rate^Mortgage Interest Rate (%) | Mortgage Term (years)#Credit % of GDP^Average Mortgages % of GDP° Price To Rent Ratio City Centre** | Outside City Centre**Gross Rental Yield City Centre** | Outside of City Centre**Outstanding home loan (% age 15+)##
...14 | 3015.330.5% (WB 2005)......2.69
What is the cost of standard 50kg bag of cement (in US$)? #What is the price of the cheapest, newly built house by a formaldeveloper or contractor (in US$)? #What is the size of this house (in m2)? #What is the average rental price for a formal unit (in US$/month)#What is the minimum plot size for residential property (in m²)#
8.50
42 163151256150
Ease of doing business rank !Number of procedures to register property !Time (days) to register property !Cost (% of property value) to register property !
15858619.00
*** Conmill.com The Currency Converter^ World Bank's World Development Indicators (2014)~ World Bank PovcalNet: an online poverty analysis tool, various years^^ The World Bank's PovCalnet" UNDP's International Human Development Indicators (2014)° Various: Badev et al. "Housing Finance Across Countries: New Data and Analysis" – Unpublished
paper/Hofinet/World Bank## Global Financial Inclusion Database (FINDEX)# CAHF Annual Survey Data (September 2015)! World Bank's Doing Business Survey Data (2015)** Numbeo Online User-Contributed Database

50
of ease of getting credit, down from 109th in 2014, partly due to a private bureauand public registry coverage of adults of zero percent and 8.9 percent respectively.Mobile banking has been identified as one way of increasing financial accessibilityand the government is being encouraged to invest in it.
The Bank of Central African States (Banque des Etats d’Afrique Centrale, or BEAC)regulates the banking and MFI sectors through the Central African BankingCommission (COBAC). Both COBAC and the Ministry of Finance and Budgetmust licence banks, and there are special regulations for small-scale creditco-operatives. The system is bank-centred, and the commercial banks in thecountry mainly fulfil traditional banking functions, with a tendency to prefer dealingwith large, established companies and medium to high net worth individuals. Thelong-term credit market remains underdeveloped. The distribution of banks isheavily skewed towards the main urban centres, with a significant part of the semi-urban and rural parts of the country denied access to formal banking facilities.
Access to housing finance is extremely low and available mainly to governmentemployees through the government agency Crédit Foncier du Cameroun. Onlyabout 5 percent of Cameroonians have access to mortgage finance from theformal private banking system. The government has injected more funds intoCrédit Foncier. Government has also instituted other reforms like providingfinancial guarantees and broadening assets that can be used as collateral to makeit easier for middle income and high income Cameroonians to access housingfinance. Several property developers and other private equity funds with moneyare looking for local partnerships to provide end-user financing for housing. Afew partnerships are already in place, like Ecobank and Credit Foncier, which ishelping to provide end-user financing to individuals to buy or build houses. Titledeeds are attached to only a very small percentage of land. This is becauseimplementing the legal provisions on land ownership has been impeded byjurisdictional disputes. In 2012, the country made amendments to theOrganisation for the Harmonisation of Business Law in Africa (OHADA) UniformAct on Secured Transactions that broadened the range of assets that can be usedas collateral. This has made it easier for people to access finance.
Despite excess liquidity, the granting of credit is far below the level required.Foreign banks have good solvency ratios. As a result, banks hold large amounts ofexcess reserves as a percentage of deposits with large unutilised liquidity. TheWorld Bank’s 2015 Doing Business Report has shown some improvement on thelegal rights of borrowers/lenders, and in accessing credit.
Microfinance is mainly managed by associations, or savings and credit co-operatives(80 percent). According to the National Institute of Statistics, in 2014, themicrofinance sector has 438 establishments recognised by the Ministry of Finance,with a portfolio of about 1.5 million Cameroonians, total savings of US$800 million,and over 1 000 branches across the country. Of these, 187 are independent, while178 belong to the largest network of MFIs, the Cameroon Cooperative CreditUnion League (CAMCCUL). It has 55 962 active borrowers and a gross loanportfolio of US$156.9 million. CAMCCUL split in May 2013, however, and a newnetwork of MFIs called Renaissance Cooperative Credit Unions (RECCU-CAMLtd) was registered. In 2000, MFIs granted only 4.3 percent of the total loansmade by financial institutions. This has increased considerably although accuratestatistics are not available.
The microfinance sector has become increasingly important, but its developmenthas been hampered by a loose regulatory and supervisory framework for MFIs.In 2013, some 34 microfinance institutions (MFIs) were suspended by the Ministerof Finance for operating without valid licences.
Liquidity is a problem for the micro lending sector, and many MFIs are only ableto satisfy up to 25 percent of their customers at any time, depending on theircredit requirements. To address the liquidity issue and to make more fundsavailable to finance activities including providing housing finance, the governmenthas established a wholesale fund, financed by the African Development Bank(AfDB). The fund is worth CFA Francs 21 billion (US$40 million) and has helpedto usher financial reforms into the sector.
The conditions to carry out microfinance activities are defined at the sub-regionallevel by CEMAC. The most popular kind of credit institution in Cameroon is called
njangi by the English speaking population, and tontines by the French speakingpopulation. This rotating savings model is usually made up of people of the samesocial class, same community or same cultural affiliation who have similar incomesor who engage in similar activities. Two types are commonly used for housingpurposes, rotating funds, and savings and loans funds.
Rotating funds involve groups of individuals who come together on a regular basiswith agreed fixed sums of money. At each meeting, the money is given to one ofthe group members in a lump sum. The member who receives the money isagreed in advance by consensus among the group, and the number of membersdetermine the loan period. The money received is interest free. A slightly differentrotating savings model, made up of individuals with different income brackets, ismore flexible. The money collected is auctioned and those who have not yetreceived a loan may bid for it. The person with the highest bid gets the loan.
Savings and loans funds allow members to contribute more than the agreedregular sum of money into a savings fund that is then loaned to other membersin need. Interest of 10 to 15 percent is charged. The saver may withdraw themoney but only after sufficient notification has been given to the association. Thismoney often earns interest for the saver. These are important sources of housingfinance for most of the population that does not have access to formal bankfinance and government guaranteed and subsidised loans.
Affordability
The official unemployment rate is 30 percent, with 48 percent of the populationbelow the national poverty line. The national Gini-index stood at 0.38 in 2010,down from 0.390 in 2007, 0.416 in 1996 and 0.404 in 2001, suggesting relativelyhigh, though improving levels of inequality. Most people are employed in theinformal sector. Some 70 percent of the labour force is involved in mostlysubsistence agriculture and some form of small to medium scale trading. Averageincome per household per month in the public sector is CFA Francs 200 000(US$400), which is slightly lower than the average income per household in theprivate sector which is CFA Francs 250 000 (US$500). Average rental pricesrange from CFA Francs 100 000 (US$200) to CFA Francs 60 000 (US$120) inthe urban and semi-urban areas respectively.
Building costs are fairly high. It is difficult to build houses with uniform standardsat a cost accessible to most of the population. This has resulted in a discrepancybetween production costs and purchasing power of most potential buyers.Government has helped to reduce housing production costs to make housingmore affordable. It has established agencies like Maetur to encourage the use oflocal materials and to reduce the price of land and inputs such as cement andsand, and has stepped up funding for government agencies in this sector. Thegovernment has decided to roll out projects to construct affordable housing acrossthe country. Individuals will provide 20 percent as their equity investment upfrontand take a loan for the remaining 80 percent, which government guarantees.
Housing supply
With an annual population growth rate of 2.6 percent, and an annual urbanisationgrowth rate of 6.5 percent, Cameroon is 54 percent urbanised. The challenge isto provide housing to this growing and urbanising population, almost half of whichlive in informal dwellings and settlements. The opportunity is to establishpartnerships across the housing value chain to meet the increasing demand forboth high-end and affordable housing. In Cameroon, an estimated 53 percent ofhouseholds own their own homes, 30 percent are tenants and 11 percent areaccommodated free of charge.
Cameroon’s housing backlog is significant. The government is looking for ways toovercome the deficit of over 100 000 units a year. Government estimated that upto one million homes need to be built in the next five to ten years to adequatelyhouse the growing population. Of these, 300 000 are needed in the main citiesof Douala and Yaounde. Demand for housing in the lower and upper ends of themarket increases by up to 10 percent annually. Government has used the publicprivate partnership approach in its project to build new social housing unitscountrywide.

Africa Housing Finance Yearbook 2015
51
Cameroon’s housing market is not well developed. The main players include thestate-owned Cameroon Real Estate Corporation (Société Immobilière duCameroun, or SIC), founded in October 1952 as a centrally funded company incharge of social housing and developing the real estate market for government. Itworks in partnership with local and foreign private construction companies tohandle large-scale projects and train the local workforce of engineers andtechnicians. SIC aimed to build 100 000 homes by 2022. 30 000 have alreadybeen built. Crédit Foncier du Cameroun, a building and loan association, is the topmortgage bank and provides funds for social housing to individuals and developers.The National Investment Corporation of Cameroon (Société Nationaled'Investissement du Cameroun) invests government funds in profitable projects indifferent sectors.
A government agency, Maetur, acquires and develops land, which are sold to willingbuyers at affordable prices. Mipromalo, the local material promotion authority,develops local materials for use by construction companies. The number of privatedevelopers is increasing, e.g. Options for Homes in Cameroon, a local subsidiaryof a Canadian Housing company, is involved in a mixed-use development in thecoastal city of Limbe aimed at middle income earners. Phases I and II, a total of102 units of its current development is completed and sold out. Most privatedevelopers build and sell houses to the upper middle income and high-end marketthrough the BOT (Build, Operate and Transfer) model. Private developers alsopartner with municipalities to build affordable housing.
There are institutional problems. Although the country has developed catalytic realestate institutions, these are suffering from dwindling public finance and newstrategies are urgently needed for the effective functioning of these institutions. Tothis end, government together with its partners (local councils, energy utilitycompany ENEO Cameroon, the National Water Supply Company of Cameroon,SIC and Crédit Foncier), launched a project in Douala and Yaounde in 2009 toprovide 10 000 houses for low income earners. The partnership has completedPhase I with the provision of about 6 000 new low cost houses. Phase II is nearcompletion with the provision of 4 000 houses.
The first phase of a city council of Douala project which started in 2012 aim tobuild more than 1000 social, affordable and private houses along with community,commercial, retail and leisure facilities in the Mbanga-Japoma area of the DoualaIII council, at a cost of CFA Francs 122.23 billion (US$264 million). On completion,it will consist of 50 buildings, comprising 300 apartments with one parlour and fourbedrooms, and 700 apartments with one sitting room and three bedrooms. Thecity council of Douala is also in charge of a project to deliver 2 500 social andaffordable houses in Bonamatoumbe. Planning for Phase I is complete andconstruction has already started.
Government policy has placed exclusive emphasis on home ownership. Howevera significant proportion of the population will seek rental housing sometime in
their lives. There is a shortage of 400 000 to 600 000 rental housing units.Government must recognise the benefits of regulating and supporting rentalmarkets to complement ownership.
The three new cement companies established have helped to increase the supplyof cement, which currently stands at two million tonnes a year, short of therequired four million tonnes a year.
Property markets
The formal real estate market is concentrated in the urban and peri-urban areas,and churn is concentrated in the middle-to-higher value market. Because supplylags behind demand, there is a constant increase in house price for ownership andrental. On average, it takes at least one month to find accommodation in Douala,Yaounde and other main cities. This time is projected to decrease in the next fewyears with the increasing number of new housing units that enter the market forownership and rental. On average, It costs up tot CFA Francs 100 000 (US$169)a month to rent a standard three-bedroom house in Douala and Yaounde. Thisamount is about 40 percent cheaper in the smaller cities like Limbe, Buea,Bafoussam and Bamenda. It costs up to CFA Francs 10 million (US$16 858) tobuild a standard three-bedroom house, excluding the cost of land in the maincities like Douala and Yaounde. This cost is about the same and can even be moreexpensive in the smaller cities due to input costs. The cost of standard inputsincreases the further away from Douala as most of the standard inputs areimported or manufactured around the main cities. On average, the size of astandard three-bedroom house is 300 m2. The cost of a serviced 500 m2 pieceof land in the urban areas is 5 million (US$8 429).
Policy and regulation
Land tenure is characterised by the coexistence of a traditional or customary landtenure system, which has been in a state of transition for some time now, and amodern land tenure system. Three different land tenure systems were introducedby each colonial power. A land reform programme was introduced in 1974 tounify the legal land systems used. Since then, Ordinance No. 74/1 and 74/2 of 6July 1974 established rules governing land tenure and state lands respectively, andlaws and decrees to amend and implement them. Law No. 85/09 of 4 July 1985relates to expropriation for public purposes and conditions of compensation, andconstitutes the regulatory framework for cadastral survey and land management.Decree No. 2005/178 of 27 May 2005 organises the Ministry of State Propertyand Land Tenure (MINDAF), while Decree 2005/481 of 16 December 2005amends and supplements some provisions of Decree No. 76/165 of 27 April 1976,which lays down conditions for obtaining land certificates. These constitute theinstitutional framework for the implementation of land legislation. The delay inimplementation of this framework is the main reason for the chaotic nature of landreform and the fact that title deeds are attached to only a small percentage of land.
> $50 000
$25 000 – $50 000
$14 000 – $25 000
$8 000 – $14 000
$5 000 – $8 000
$3 600 – $5 000
$2 400 – $3 600
$1 600 – $2 400
$800 – $1 600
<$800
- - - Average income needed for the cheapest newly built house by a formal developer, 2013- - - Average annual urban household income, 2014
CAMEROON
$24 084
$4 853
Rural | UrbanAnnual household income US$
No. of households (thousands) 800 600 400 200 0 200 400 600 800

52
Geodetic infrastructure is characterised by the absence of a reliable and singlegeodetic database. Land stakeholders suffer the consequences of the absence ofa single referencing system. The physical description of real property as the objectof a right is not reliable, which undermines the reliability of the entire land register.To seek a lasting solution to this, the government continues to implement therecommendations and proposals of a 2009 study by the AfDB. There is an urgentneed to continue to support ongoing efforts and initiatives to modernise thesector.
The government passed legislation and put in place regulation that provides for theestablishment and operation of a credit registry database. This has improved thecredit information system. Government also passed legislation that requires forinspection and notification before construction permits are issued. Governmenthas decentralised the process of obtaining building permits and introduced stricttime limits for processing applications and issuing certificates of conformity.
Opportunities
Cameroon’s housing sector is ripe for investment and there is a huge need forhousing in all segments of the market. The government continues to implementand reforms as recommended by the AfDB. Better regulation will make it easierfor people to get title deeds for their land, enhancing security of tenure andadditional investment. Financial market reforms are also being implemented. Thesereforms have helped to alleviate the problems related to lack of serviceable land,delays in issuing construction permits and property registration, undevelopedcapital markets and an unresponsive banking sector. For example, it now takes 136days to get construction permits, down from 139. Government should continuewith reforms in the MFI sector, including building standards, product innovationand financial stability to help realise the potential of the sector and enable it to playa more significant role in housing finance and housing development.
With economic growth, a huge housing backlog, a growing middle class and upperclass, huge capital inflows from Cameroonians in the diaspora and otherinternational investors, increased local investment and better legislation andreforms, the housing market is destined for sustainable growth. Despite thedemand for up-market housing and the current focus of developers on the high-end housing market as a result of affordability and easier access to finance, thefocus should shift to the middle class and lower income groups, as this presentsthe biggest opportunity for development and financing in future.
Sources
African Development Bank (2009). Cameroon: Diagnostic Study forModernisation of the Land and Survey Sectors.African Investment Corporation (2008). Investors Roadshow Cameroon:Presenting Investment Opportunities and Projects.Djoumessi, E. (2009). Financial Development and Economic Growth: AComparative Study Between Cameroon and South Africa.Ngehnevu, C.B. and Nembo, F.Z. (2010). The Impact of Microfinance Institutionsin the Development of SMEs in Cameroon. Unpublished.Nguebou, J. (2010). Stratégie Nationale de Financement du Logement Socialeau Cameroun. Unpublished.Soededje et al (2009). A Study on Cameroon. Unpublished.World Bank (2015). Doing Business 2015. Cameroon Country Profile.Fotabong, A.L. (2012). The Microfinance Market of Cameroon: Analysing Trendsand Current Developments.USAID Country Profile. Cameroon: Property Rights and Resource Governance.
Websites
www.afdb.orgwww.africaneconomicoutlook.orgwww.africaninvestorp.comwww.allafrica.comwww.businessincameroon.comwww.cameroonjournal.comwww.cia.govhttp://data.worldbank.org www.economywatch.comhttp://fas.imf.orgwww.habitatcameroun.netwww.imf.orgwww.investiraucameroun.comwww.mfw4a.org/news/news-detailswww.microworld.orghttp://mixmarket.org/mfi/country/cameroonwww.oecd.orgwww.reuters.comwww.sicameroun.netwww.sni.cmwww.thepostwebedition.comwww.undp.orgwww.wikipedia.comwww.worldhabitatawards.comwww.wto.orgwww.optionsforhomescameroon.comwww.doingbusiness.org
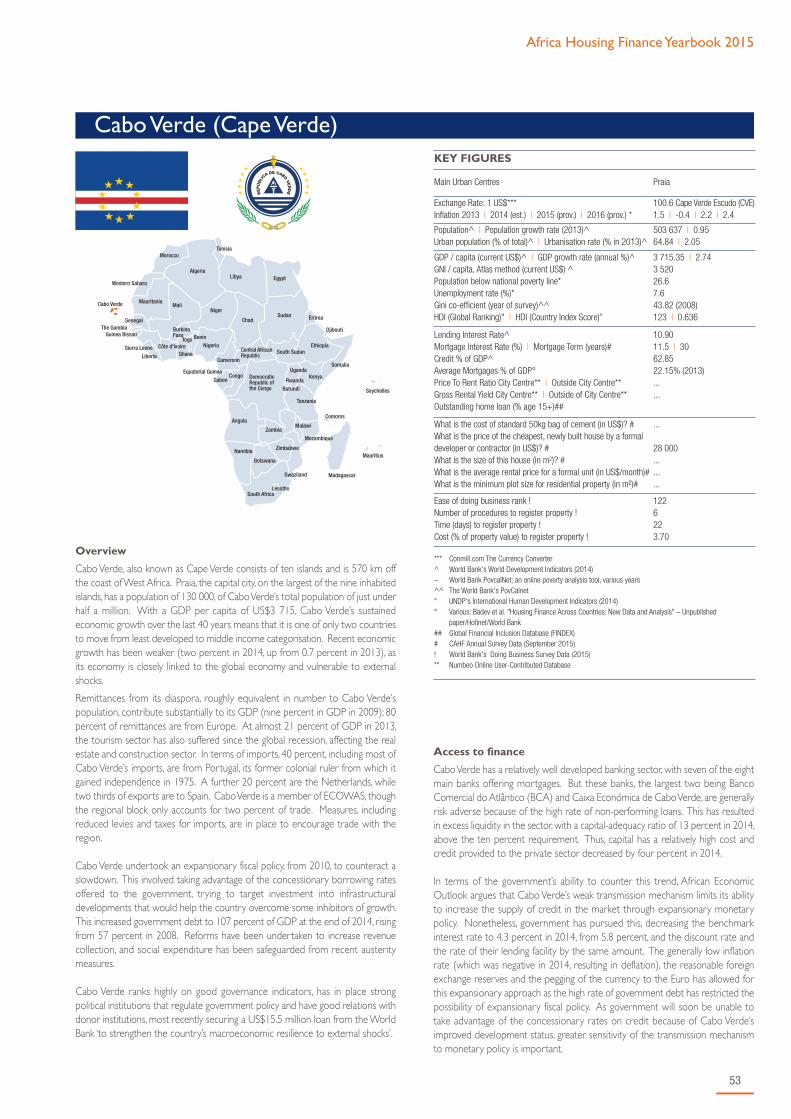
Africa Housing Finance Yearbook 2015
53
Cabo Verde (Cape Verde)KEY FIGURES
Main Urban Centres Praia
Exchange Rate: 1 US$***Inflation 2013 | 2014 (est.) | 2015 (prov.) | 2016 (prov.) *
100.6 Cape Verde Escudo (CVE)1.5 | -0.4 | 2.2 | 2.4
Population^ | Population growth rate (2013)^Urban population (% of total)^ | Urbanisation rate (% in 2013)^
503 637 | 0.9564.84 | 2.05
GDP / capita (current US$)^ | GDP growth rate (annual %)^GNI / capita, Atlas method (current US$) ^Population below national poverty line*Unemployment rate (%)*Gini co-efficient (year of survey)^^HDI (Global Ranking)" | HDI (Country Index Score)”
3 715.35 | 2.743 52026.67.643.82 (2008)123 | 0.636
Lending Interest Rate^Mortgage Interest Rate (%) | Mortgage Term (years)#Credit % of GDP^Average Mortgages % of GDP° Price To Rent Ratio City Centre** | Outside City Centre**Gross Rental Yield City Centre** | Outside of City Centre**Outstanding home loan (% age 15+)##
10.9011.5 | 3062.8522.15% (2013)......
What is the cost of standard 50kg bag of cement (in US$)? #What is the price of the cheapest, newly built house by a formaldeveloper or contractor (in US$)? #What is the size of this house (in m2)? #What is the average rental price for a formal unit (in US$/month)#What is the minimum plot size for residential property (in m²)#
...
28 000.........
Ease of doing business rank !Number of procedures to register property !Time (days) to register property !Cost (% of property value) to register property !
1226223.70
*** Conmill.com The Currency Converter^ World Bank's World Development Indicators (2014)~ World Bank PovcalNet: an online poverty analysis tool, various years^^ The World Bank's PovCalnet" UNDP's International Human Development Indicators (2014)° Various: Badev et al. "Housing Finance Across Countries: New Data and Analysis" – Unpublished
paper/Hofinet/World Bank## Global Financial Inclusion Database (FINDEX)# CAHF Annual Survey Data (September 2015)! World Bank's Doing Business Survey Data (2015)** Numbeo Online User-Contributed Database
Access to finance
Cabo Verde has a relatively well developed banking sector, with seven of the eightmain banks offering mortgages. But these banks, the largest two being BancoComercial do Atlântico (BCA) and Caixa Económica de Cabo Verde, are generallyrisk adverse because of the high rate of non-performing loans. This has resultedin excess liquidity in the sector, with a capital-adequacy ratio of 13 percent in 2014,above the ten percent requirement. Thus, capital has a relatively high cost andcredit provided to the private sector decreased by four percent in 2014.
In terms of the government’s ability to counter this trend, African EconomicOutlook argues that Cabo Verde’s weak transmission mechanism limits its abilityto increase the supply of credit in the market through expansionary monetarypolicy. Nonetheless, government has pursued this, decreasing the benchmarkinterest rate to 4.3 percent in 2014, from 5.8 percent, and the discount rate andthe rate of their lending facility by the same amount. The generally low inflationrate (which was negative in 2014, resulting in deflation), the reasonable foreignexchange reserves and the pegging of the currency to the Euro has allowed forthis expansionary approach as the high rate of government debt has restricted thepossibility of expansionary fiscal policy. As government will soon be unable totake advantage of the concessionary rates on credit because of Cabo Verde’simproved development status, greater sensitivity of the transmission mechanismto monetary policy is important.
Overview
Cabo Verde, also known as Cape Verde consists of ten islands and is 570 km offthe coast of West Africa. Praia, the capital city, on the largest of the nine inhabitedislands, has a population of 130 000, of Cabo Verde’s total population of just underhalf a million. With a GDP per capita of US$3 715, Cabo Verde’s sustainedeconomic growth over the last 40 years means that it is one of only two countriesto move from least developed to middle income categorisation. Recent economicgrowth has been weaker (two percent in 2014, up from 0.7 percent in 2013), asits economy is closely linked to the global economy and vulnerable to externalshocks.
Remittances from its diaspora, roughly equivalent in number to Cabo Verde’spopulation, contribute substantially to its GDP (nine percent in GDP in 2009); 80percent of remittances are from Europe. At almost 21 percent of GDP in 2013,the tourism sector has also suffered since the global recession, affecting the realestate and construction sector. In terms of imports, 40 percent, including most ofCabo Verde’s imports, are from Portugal, its former colonial ruler from which itgained independence in 1975. A further 20 percent are the Netherlands, whiletwo thirds of exports are to Spain. Cabo Verde is a member of ECOWAS, thoughthe regional block only accounts for two percent of trade. Measures, includingreduced levies and taxes for imports, are in place to encourage trade with theregion.
Cabo Verde undertook an expansionary fiscal policy, from 2010, to counteract aslowdown. This involved taking advantage of the concessionary borrowing ratesoffered to the government, trying to target investment into infrastructuraldevelopments that would help the country overcome some inhibitors of growth.This increased government debt to 107 percent of GDP at the end of 2014, risingfrom 57 percent in 2008. Reforms have been undertaken to increase revenuecollection, and social expenditure has been safeguarded from recent austeritymeasures.
Cabo Verde ranks highly on good governance indicators, has in place strongpolitical institutions that regulate government policy and have good relations withdonor institutions, most recently securing a US$15.5 million loan from the WorldBank ‘to strengthen the country’s macroeconomic resilience to external shocks’.

54
> $50 000
$25 000 – $50 000
$14 000 – $25 000
$8 000 – $14 000
$5 000 – $8 000
$3 600 – $5 000
$2 400 – $3 600
$1 600 – $2 400
$800 – $1 600
<$800
- - - Average income needed for the cheapest newly built house by a formal developer, 2015- - - Average annual urban household income, 2014
CABO VERDE
$9 239
$12 052
Rural | UrbanAnnual household income US$
No. of households (thousands) 10 5 0 5 10 15 20
Stress tests in 2011 revealed the high concentration of loans in the constructionsector. These loans have the highest rate of non-performance in Cabo Verde. Thepredominant use of credit in the construction sector is for the developments fortourist industry. The NPL rate rose to as high as 20 percent in 2013, two-thirdsof which are accounted for by corporates. The remaining NPL stock, thoughspecific rates are not publicly available, are loans by households, the majority forwhich is accounted for by non-performing mortgages. Banks have begun to writeoff NPLs, slowly, in order to avoid shocks to their balance sheets.
Though there are no specific mortgage banks in Cabo Verde, nor any institutionsdedicated to mortgage refinancing, the mortgage market has increasedsubstantially in line with Cabo Verde’s economic growth. Credit to individuals forhousing, according to HOFINET, increased from US$54 million in 2000 to justunder US$348 million in 2010. As of December 2013, this figure stood at overUS$433 million, worth over 22 percent of GDP. Mortgage lending depends onremittances, as 40 percent of deposits held by banks are from the Cabo Verdeandiaspora and many Cabo Verdeans depend on remittances to repay mortgages.
In terms of mortgages available, Banco Interatlântico offers mortgages, to purchaseor construct a house, at 90 percent of property value;100 percent under specialcircumstances. BCA offers a range of mortgages between CVE 50 000 (US$500)and CVE 30 million (US$300 000), financing between 90 and 100 percent of thevalue, for terms up to 30 years at an interest rate of 11.5 percent, though higherfor lower income households. They generally only lend if repayments are amaximum of 30 percent of household income. Government provides subsidisedinterest rates on mortgages, with one scheme targeting young home buyers underthe age of 30 (on average, if it is a couple). Additionally, the interest portion ofmortgage repayments can be deducted from taxes due.
There are 50 000 accounts in the microfinance sector, making the size of housingmicrofinance (HMF) small. According to MFW4A, 75 percent of unemployedCabo Verdeans were unaware that they could access credit through microfinance.Though not only a microfinance bank, recently launched Novo Banco focuses onproviding microcredit and serving low income households.
Affordability
Listings for one bedrooms are for around EUR 25 000 (US$28 000) but go lower.Though the Global Property Guide states that, on average, the price per m2 isUS$1 300, there are units available for considerably less. Some of these units areas small as 25 m2, at EUR 800 (US$903) per m2. Of housing advertised by estateagents on Santiago, a two bedroom unit costs CVE 6 million (US$60 000) topurchase, while another two bedroom unit was from CVE 20 000 (US$200) amonth to rent. Prices go up to, and past, CVE 24 million (US$250 000) at the highincome end of the market.
This is quite high considering Cabo Verdean GDP per a capita of US$3 715. Toaddress this, government has launched Casa Para Todos, (examined below), and
tries to accommodate low income households with rent set to a ratio. Though,only one third of units are being built under Casa Para Todos will be affordable tolow income households, despite these households making up 75 percent of thedemand. The cost of housing was one of the main inflationary pressures in CaboVerde in 2012 and 2013, on average just over three percent higher than CPIinflation (5.5 percent in 2012, 5 percent in 2013). In the first half of 2014, thisdifference disappeared, with an average inflation for housing of just 0.2 percent.
The biggest affordability issue for housing is that Cabo Verde has to import mostof the required materials. There is no cement manufacturing plant on the country,with most imports coming from Portugal. Cempor, which is part of InterCement,is the largest company operating in the market, saw sales of cement drop by sevenpercent in 2013, selling 176 metric tons in the year. In 2011, the country importeda total EUR 21.5 million worth of cement, its second largest import. The sales ofcement, and other construction materials, are VAT exempt.
Housing Supply
In 2010, according to the IMF, the country had a housing shortage of 82 000 units,the result of which are the informal settlements around the major cities. TheUnited Nations Commissioner for Human Rights issued a press release for areport that will be published in 2016 on housing in Cabo Verde. The press releasestated that, at the beginning of 2008, there was a quantitative deficit of 40 775 unitsand a qualitative deficit of approximately 66 100 units. These numbers arerelatively high, considering that statistics show that Cabo Verde has just over 102 000households, with 64.84 percent living in cities, according to C-Gidd data. Thecountry has, on average, a household size of 4.9.
The Cabo Verdean government has undertaken initiatives to increase the supplyof housing since 2004, even deeming 2009 as the ‘Year of Housing’. To mark thisyear, Casa Para Todos was launched. The programme aimed to reduce the housingdeficit by 8 000 units by 2013. African Economic Outlook states that theprogramme now aims to build 8 000 new units and rehabilitate 16 000 more. Forthis, a EUR 200 million loan from the Portuguese government was granted. InAugust 2015, an ar ticle in the press stated that a delayed disbursement ofEUR17 million by Portugal suspended progress. The suspension, it was claimed,was because Cabo Verdean government was not paying ten percent of the costs,as per the agreement. There is confusion over the number of houses completed,and reports state that only 800 are occupied, as a study of the programme has notbeen publicly released. Beyond Case Para Todos, there is Operation Esperanca,launched in 2003, implemented in Cabo Verde Solidarity Foundation, which hasrehabilitated 3 000 homes.
Property Markets
There are a number of established estate agents offering rentals and propertiesat a wide-variety of price points. They are relatively formal and operate on CaboVerde’s larger islands. Many realtors cater to the international market, particularly

Africa Housing Finance Yearbook 2015
55
potential expats or Europeans looking for a holiday home. This suggests the strongperformance at the upper end of the market.
Property is subject to a three percent property tax, 2.5 percent registration feeand a three percent legal fee, all payable by the buyer. Real estate agents generallycharge five percent of the property value, which is paid by the seller. This isaccording to the Global Property Guide. The World Bank Doing BusinessIndicators 2015 state that the cost of registering a property is 3.7 percent of itsvalue, perhaps lower because of reforms in 2012. Registering property takes 22days and involves six procedures.
Confidence in the construction sector worsened in 2014, according to the BCV,and has constantly remained lower than other sectors. At the same time, importsof building materials were up in the first half of 2014, increasing on average 16percent month-on-month after two consecutive years of decline. Cement importshave also improved, from March to July 2014, but not to the same levels of importsof building materials.
Policy and Regulation
The microfinance sector is regulated by the BCV, under specialised microfinancelegislation introduced in 2010. This legislation should be updated this year, allowingMFIs to take deposits, increasing transparency of the sector and encouragingforeign investment into the sector.
The rental market is regulated, allowing for a maximum increase of 8.3 percent ayear. The tenant has the right to reject a suggested rental increase, and terminatethe rental agreement with one months notice if this happens. In addition, if thecontract does not explicitly stipulate future possible rental increases, the landlordmay not raise rentals for a period of five years. Landlords are not allowed todemand more than a month’s rental upfront, and can only evict a tenant withpermission from a court. The rental legislation is Decree-Law 47.344, of 25November 1966, as amended by Decree-Law 12-C/97, of 30 June 1997.
Other important policies and regulations that should be noted include therequirement of a tax clearance to purchase property, as the municipality will onlytransfer the deed once property taxes are paid. All transfers involve siteinspections by municipalities. In 2013, Cabo Verde introduced tax incentives forlarge investments, and in 2014, it commenced with the digitisation of its deedsregistry. The National Urban Policy is currently under elaboration, a nationalhousing policy is currently being drawn up and there are plans to establish aNational Habitat Committee, all by the Ministry of Environment, Housing andTerritorial Planning, with the assistance of UN Habitat.
Opportunities
Cabo Verde has a relatively well developed housing and housing finance market.However, as the global economy continues to slow down, and the country growthplateaus, there will be increasing demand for more affordable housing. A significantportion of the housing stock will be in need of refurbishment in the coming years,while the housing backlog continues to be substantial, considering the size of thepopulation. If efforts to increase trade with West Africa are effective, it’ll open upCabo Verde to new markets, hopefully decreasing the costs of construction in thecountry. Overall, a stable exchange rate, an expansionary monetary policy, flexibletaxation on investments and a relatively sophisticated mortgage market providesmany opportunities for housing development.
Sources:
AfDB. (2010). African Fixed Income and Derivatives Guidebook. AfricanDevelopment Bank Group.AfDB. (2014). Cape Verde country strategy paper 2014 – 2018. AfricanDevelopment Bank Group.African Economic Outlook. (2015). Cape Verde. Retrieved fromhttp://www.africaneconomicoutlook.org/en/country-notes/west-africa/Cape-verde/Asias, T. (N/A). Cape Verde. Retrieved fromhttp://fic.wharton.upenn.edu/fic/africa/Cape%20Verde%20Final.pdfBrito, J. (2013). Growth diagnostic of Cape Verdean economy. Retrieved fromhttps://mpra.ub.uni-muenchen.de/59480/1/MPRA_paper_59480.pdf
CGAP. (2010). Sub-Saharan Africa 2009: Microfinance analysis andbenchmarking report. A report from Microfinance Information Exchange (MIX)and Consultative Group to Assist the Poor (CGAP).Chatham House. (2015). Institutional stability and economic success in Africa:Lessons from Cape Verde. IMF. (2010). Cape Verde: poverty reduction strategy paper-progress report.International Monetary Fund. IMF. (2014). 2014 Article IV consultation—staff report; press release; andstatement by the executive director for Cape Verde. International MonetaryFund.Lopes, J., Balsa, C., and Nunes, A. (2011). The long run relationship between theconstruction sector and the national economy in Cape Verde. InternationalJournal of Strategic Property Management, Issue: 1 / 2011, pp 48 59.PWC. (2013). Staying informed: AfriTax: Quarter ended 31 March 2013 Issue 16Rfi. (2015). A polémica "Casa para Todos". Retrieved fromhttp://www.portugues.rfi.fr/Cape-verde/20150808-polemica-casa-para-todosUN-Habitat. (2015). Towards sustainable urban development in Cape Verde: Anintegrated vision. United Nations Human Settlements Programme (Un-Habitat).UN. (2011). United Nations resource mobilization and partnership strategyCape Verde, 2012-2016. United Nations.UNHCR. (2015). Cape Verde must prioritise housing for the poorest, UNrights expert urges. Retrieved from http://www.ohchr.org/EN/NewsEvents/Pages/DisplayNews.aspx?NewsID=15512&LangID=EWorld Bank. (2013). Implementation completion and results report (IDA46700, IDA 48400, and IDA 50520) on programmatic credits in the amount ofDST 9.5 million, SDR 6.4 million, and SDR 7.9 million (us$ 15 million, us$ 10million and us$ 12 million equivalent) to the Republic of Cape Verde for thepoverty reduction support credits 5, 6 and 7 (PRSC-5, PRSC-6, PRSC-7). WorldBank.World Bank. (2013). The Republic of Cape Verde: Report No. 84449-cv: JointIDA-IMF staff advisory note on the growth and poverty reduction strategy iii(2012 – 2016). World Bank.World Bank. (2014). Cape Verde – Eighth poverty reduction support credit(PRSC 8). Retrieved from http://www.worldbank.org/en/news/loans-credits/2014/04/22/Cape-verde-eighth-poverty-reduction-support-credit-prsc-8World Bank. (2014). Cape Verde: World Bank Group discuss country’s newpartnership strategy (2015-2017). Retrieved from http://www.worldbank.org/en/news/press-release/2014/12/18/Cape-verde-world-bank-group-country-partnership-strategy.World Bank. (2014). Fifteen millions dollars to strengthen macroeconomicresilience and to improve competitiveness in Cape Verde. Retrieved fromhttp://www.worldbank.org/en/news/press-release/2014/05/01/fifteen-millions-dollars-to-strengthen-macroeconomic-resilience-and-to-improve-competitiveness-in-Cape-verde.World Bank. (2015). Cape Verde: Ninth poverty reduction support credit.Retrieved from http://www.worldbank.org/en/news/loans-credits/2015/06/16/Cape-verde-ninth-poverty-reduction-support-credit.
Websites:
africaneconomicoutlook.orgbcv.cvcapeverdeportal.comglobalpropertyguide.comhofinet.orgmfw4a.orgnoscasacv.comworldbank.org/en/programs/globalfindex

56
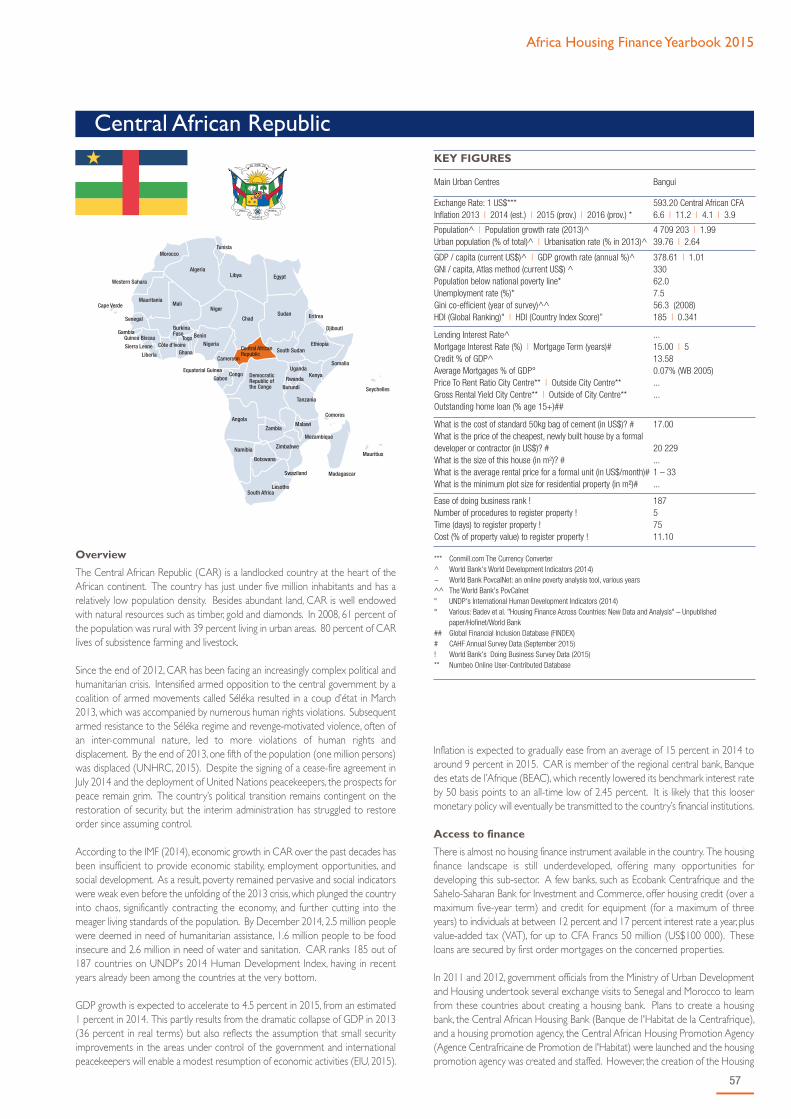
Africa Housing Finance Yearbook 2015
57
Central African Republic
Inflation is expected to gradually ease from an average of 15 percent in 2014 toaround 9 percent in 2015. CAR is member of the regional central bank, Banquedes etats de l’Afrique (BEAC), which recently lowered its benchmark interest rateby 50 basis points to an all-time low of 2.45 percent. It is likely that this loosermonetary policy will eventually be transmitted to the country’s financial institutions.
Access to finance
There is almost no housing finance instrument available in the country. The housingfinance landscape is still underdeveloped, offering many opportunities fordeveloping this sub-sector. A few banks, such as Ecobank Centrafrique and theSahelo-Saharan Bank for Investment and Commerce, offer housing credit (over amaximum five-year term) and credit for equipment (for a maximum of threeyears) to individuals at between 12 percent and 17 percent interest rate a year, plusvalue-added tax (VAT), for up to CFA Francs 50 million (US$100 000). Theseloans are secured by first order mortgages on the concerned properties.
In 2011 and 2012, government officials from the Ministry of Urban Developmentand Housing undertook several exchange visits to Senegal and Morocco to learnfrom these countries about creating a housing bank. Plans to create a housingbank, the Central African Housing Bank (Banque de l'Habitat de la Centrafrique),and a housing promotion agency, the Central African Housing Promotion Agency(Agence Centrafricaine de Promotion de l'Habitat) were launched and the housingpromotion agency was created and staffed. However, the creation of the Housing
Overview
The Central African Republic (CAR) is a landlocked country at the heart of theAfrican continent. The country has just under five million inhabitants and has arelatively low population density. Besides abundant land, CAR is well endowedwith natural resources such as timber, gold and diamonds. In 2008, 61 percent ofthe population was rural with 39 percent living in urban areas. 80 percent of CARlives of subsistence farming and livestock.
Since the end of 2012, CAR has been facing an increasingly complex political andhumanitarian crisis. Intensified armed opposition to the central government by acoalition of armed movements called Séléka resulted in a coup d’état in March2013, which was accompanied by numerous human rights violations. Subsequentarmed resistance to the Séléka regime and revenge-motivated violence, often ofan inter-communal nature, led to more violations of human rights anddisplacement. By the end of 2013, one fifth of the population (one million persons)was displaced (UNHRC, 2015). Despite the signing of a cease-fire agreement inJuly 2014 and the deployment of United Nations peacekeepers, the prospects forpeace remain grim. The country’s political transition remains contingent on therestoration of security, but the interim administration has struggled to restoreorder since assuming control.
According to the IMF (2014), economic growth in CAR over the past decades hasbeen insufficient to provide economic stability, employment opportunities, andsocial development. As a result, poverty remained pervasive and social indicatorswere weak even before the unfolding of the 2013 crisis, which plunged the countryinto chaos, significantly contracting the economy, and further cutting into themeager living standards of the population. By December 2014, 2.5 million peoplewere deemed in need of humanitarian assistance, 1.6 million people to be foodinsecure and 2.6 million in need of water and sanitation. CAR ranks 185 out of187 countries on UNDP’s 2014 Human Development Index, having in recentyears already been among the countries at the very bottom.
GDP growth is expected to accelerate to 4.5 percent in 2015, from an estimated1 percent in 2014. This partly results from the dramatic collapse of GDP in 2013(36 percent in real terms) but also reflects the assumption that small securityimprovements in the areas under control of the government and internationalpeacekeepers will enable a modest resumption of economic activities (EIU, 2015).
KEY FIGURES
Main Urban Centres Bangui
Exchange Rate: 1 US$***Inflation 2013 | 2014 (est.) | 2015 (prov.) | 2016 (prov.) *
593.20 Central African CFA6.6 | 11.2 | 4.1 | 3.9
Population^ | Population growth rate (2013)^Urban population (% of total)^ | Urbanisation rate (% in 2013)^
4 709 203 | 1.9939.76 | 2.64
GDP / capita (current US$)^ | GDP growth rate (annual %)^GNI / capita, Atlas method (current US$) ^Population below national poverty line*Unemployment rate (%)*Gini co-efficient (year of survey)^^HDI (Global Ranking)" | HDI (Country Index Score)”
378.61 | 1.0133062.07.556.3 (2008)185 | 0.341
Lending Interest Rate^Mortgage Interest Rate (%) | Mortgage Term (years)#Credit % of GDP^Average Mortgages % of GDP° Price To Rent Ratio City Centre** | Outside City Centre**Gross Rental Yield City Centre** | Outside of City Centre**Outstanding home loan (% age 15+)##
...15.00 | 513.580.07% (WB 2005)......
What is the cost of standard 50kg bag of cement (in US$)? #What is the price of the cheapest, newly built house by a formaldeveloper or contractor (in US$)? #What is the size of this house (in m2)? #What is the average rental price for a formal unit (in US$/month)#What is the minimum plot size for residential property (in m²)#
17.00
20 229...1 – 33...
Ease of doing business rank !Number of procedures to register property !Time (days) to register property !Cost (% of property value) to register property !
18757511.10
*** Conmill.com The Currency Converter^ World Bank's World Development Indicators (2014)~ World Bank PovcalNet: an online poverty analysis tool, various years^^ The World Bank's PovCalnet" UNDP's International Human Development Indicators (2014)° Various: Badev et al. "Housing Finance Across Countries: New Data and Analysis" – Unpublished
paper/Hofinet/World Bank## Global Financial Inclusion Database (FINDEX)# CAHF Annual Survey Data (September 2015)! World Bank's Doing Business Survey Data (2015)** Numbeo Online User-Contributed Database

58
Bank never passed the stage of signing into law. All of these plans are nowcompromised with the outbreak of violence that followed the March 2013 coupd’état.
As part of the Central African Economic and Monetary Community (CEMAC),CAR shares a common currency with other member states and delegatesmonetary policy to the BEAC. In 1993, CEMAC established a Banking Commission(COBAC) to administer, regulate, and supervise banks that are part of the BEACregion which, along with membership to the CFA franc zone, has helped increasesectorial stability in the CAR.
The CAR had made progress in providing access to finance until the last politicalcrisis again disrupted efforts. The CAR's financial sector, the smallest in the CEMACaccounts only for 17.6 percent of the GDP, is largely underdeveloped and playsonly a limited role in supporting economic growth. In addition to the BEACNational Office, the system currently comprises four commercial banks, holdingapproximately 93 percent of the total financial system's asset, eleven microfinanceinstitutions (MFIs), two post office banks, two insurance companies, and a socialsecurity fund (AEO, 2015). Other financial institutions are largely absent from thecountry's financial system, and their development remains hampered by weakmarket infrastructure as well as the lack of the necessary legal, judicial, prudential,and regulatory frameworks. While the sector has seen some moderate expansionin recent years, financial intermediation levels are still amongst the lowest in theworld, and credit to the economy represents only 11 percent of GDP in 2011, andthe main sectors benefitting from bank loans are trade and commerce (20percent), transport and communications (16 percent), forestry (12 percent) andother services (28 percent). The quality of bank loan portfolios is generally poor;non-performing loans (NPLs) reach around 30 percent of total bank loans, whileNPL provisioning stands at about 52 percent.
Access to financial services remains a major challenge. Due to economic andsecurity concerns, financial institutions, and particularly banks and microfinanceinstitutions (MFIs), have largely consolidated their business in the capital, Bangui.Bank branches and ATMs are mostly concentrated in three towns, with 71 percentof total branches located in Bangui. Coverage of banking services as measured bythe number of branches per 100 000 adults was only 0.89 percent in 2012. Inother words, there were fewer than 30 bank branches in the country in 2013.Ecobank Centrafrique is the most extended banking company, with branches ineach of the main urban centres. Ecobank has 12 branches all over the country,although eight of these are located in Bangui. The post office is in charge of thepostal savings bank, primarily serving as a channel for salary payments to civilservants, a minimal percentage of which hold a savings account. According to thelatest Getting Credit indicator of the World Bank’s Doing Business Report, CARwas ranked 187th out of 189 countries. About one percent of the populationholds a bank account and only 0.5 percent has outstanding loans, while only onepercent has access to MFIs. Low levels of mobile penetration also dampen thepotential expansion of access to financial services through mobile technology.
A pension fund called the National Social Security Fund (Caisse Nationale deSécurité Sociale) exists, but has the same structural problems as other publicagencies in the country. Besides this there are only three insurance companies forthe whole country, with a presence almost only in Bangui.
Political and social instability has weakened the social fabric, reduced saving andinvestment among the population, and lessened the number of donors involvedin the microfinance sector. Between 2007 and 2011 the UNCDF, UNDP, theCentral African Government and various players of the microfinance sectorlaunched a four-year US$4 million programme named Programme d'Appui àl'Emergence d'un Secteur Financier Inclusif en République Centrafricaine(PAE/SFI)to support the emergence of an inclusive financial sector in the CAR inorder to give the poor and low income population access to sustainable financialproducts and services provided by microfinance institutions operating in asustainable legal and institutional framework. At the beginning of 2010 there wereonly five licensed microfinance institutions comprising 31 branches and 32 000clients. Crédit Mutuel de Centrafrique (CMCA) is the most important MFInetwork in the CAR, with a gross loan portfolio of US$3.6 million shared by 2 772borrowers, and deposits amounting to US$9.3 million in 2011. The SociétéFinancière Africaine de Crédit (SOFIA), another microfinance institution, began
operations in March 2009, and by end March 2014 had 265 borrowers with totalloans of US$248 642 and deposits of US$2.8 million.
Affordability
Affordability is a key issue in the CAR housing sector. The high cost of buildingmaterials, the low incomes of Central Africans, and the general political andeconomic volatility make owning a house a mere dream for the average citizen. Asimple one-bedroom housing unit with a modern toilet costs on averageCFA Francs 12 million (US$20 229). Compared to the average monthly incomeof only CFA Francs 19 500 (US$33), the cost of a one-bedroom house represent615 times the monthly revenue. It is obvious that only a tiny proportion of theCentral African population can access formal housing.
Currently, a large number of Internally Displaced Persons (IDPs) are in rental units(estimates are around 70 percent). Unsurprisingly, the main challenge for thisgroup of IDPs has been the inability to pay rent, having lost their livelihoods. InCarnot and Sibut the monthly rent varied between CFA 500 to 3 500 (US$1 –US$6) while in Bangui this could be anything between CFA 5 000 to 20 000(US$8 – US$33), depending on the size of the house (UNHRC, 2015).
In 2013, a standard 50kg bag of cement cost as much as CFA 10 000 (US$17).Other building materials such as a standard iron bar and a sheet of corrugated ironcost between CFA 2 000 (US$3) and CFA 8 500 (US$14), and CFA 5 000 (US$8)and CFA20 000 (US$33), respectively. A major development in the housing sectorin 2012 was the completion of the only cement manufacturing plant in the country,realised with Indian investment. It was expected that the price of a standard 50kgbag of cement bag could drop to CFA Francs 7 500 (US$12). However, the CAR’senergy problems will have to be solved first, and given the recent political crisis, itis not clear when this plant will start operation.
Housing supply
Since the emergence of the crisis, a large portion of CAR’s housing stock has beenpillaged, burnt or destroyed. The UNHRC (2014) estimates that at least 170houses in Bangui’s 8th district and 900 in the 5th district have been partially orcompletely destroyed since December 2013. In Begoua, just north of Bangui, anestimated 800 houses have been partially or completely destroyed. It is estimatedthat 100 houses were partially or completely destroyed in Sibut town. Accordingto a survey amongst IDPs, 70 percent noted that a loss of their homes andbelongings has been the primary obstacle for their return. This decline in thehousing stock has massive ramifications for the housing sector as a whole andmassively impacts on all income earners.
These current conditions are compounded by sub-standard housing practices inthe past. Prior to the most recent conflict, Central Africans have built their housesby themselves. Indeed, with this mode of construction, Bangui was declared toconsist of 94 percent slum sprawl on the north side of the city. To discourageself-construction, the government instituted a CFA Francs 50 000 (US$84) fine foranyone constructing a house without authorisation from the Ministry of UrbanDevelopment and Housing. However, in its housing strategy of 2008 thegovernment shifted its perspective slightly, to offer technical assistance tohouseholds planning to build housing units through self-construction. To this endthe fine was suppressed for those seeking government assistance for self-construction. The government also planned to provide prototype cheap housingunits that are able to resist the recurring floods during the June to October rainyseason, especially in Bangui (UNHRC, 2015). A component of the World Bank-financed Emergency Urban Infrastructure Rehabilitation and Maintenance Projectplanned to fund a few pilot units through the Flood Response Programme sub-component of the project in 2013. However, the current political crisis pushed theWorld Bank, like many other international organisations, to pull out of the country,and the project was halted in March 2013 before this sub-component reallystarted.
In the past, Habitat for Humanity International invested significant resourcesthrough technical assistance and by promoting local building materials andaffordable building techniques. Unfortunately the organisation left the country in2005, after having built more than 500 housing units. In recent years the US-basedInternational Rescue Committee has launched a new housing programme torebuild or rehabilitate over 2 500 housing units in the northern region where
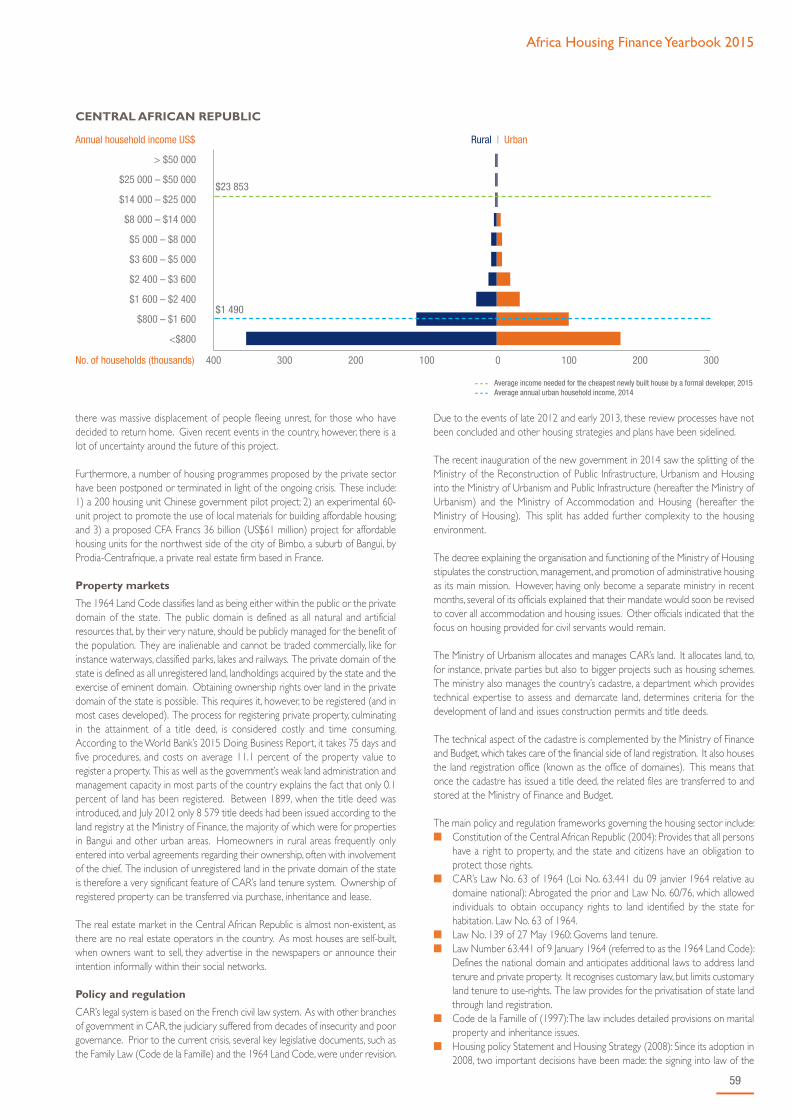
Africa Housing Finance Yearbook 2015
59
there was massive displacement of people fleeing unrest, for those who havedecided to return home. Given recent events in the country, however, there is alot of uncertainty around the future of this project.
Furthermore, a number of housing programmes proposed by the private sectorhave been postponed or terminated in light of the ongoing crisis. These include:1) a 200 housing unit Chinese government pilot project; 2) an experimental 60-unit project to promote the use of local materials for building affordable housing;and 3) a proposed CFA Francs 36 billion (US$61 million) project for affordablehousing units for the northwest side of the city of Bimbo, a suburb of Bangui, byProdia-Centrafrique, a private real estate firm based in France.
Property markets
The 1964 Land Code classifies land as being either within the public or the privatedomain of the state. The public domain is defined as all natural and artificialresources that, by their very nature, should be publicly managed for the benefit ofthe population. They are inalienable and cannot be traded commercially, like forinstance waterways, classified parks, lakes and railways. The private domain of thestate is defined as all unregistered land, landholdings acquired by the state and theexercise of eminent domain. Obtaining ownership rights over land in the privatedomain of the state is possible. This requires it, however, to be registered (and inmost cases developed). The process for registering private property, culminatingin the attainment of a title deed, is considered costly and time consuming.According to the World Bank’s 2015 Doing Business Report, it takes 75 days andfive procedures, and costs on average 11.1 percent of the property value toregister a property. This as well as the government’s weak land administration andmanagement capacity in most parts of the country explains the fact that only 0.1percent of land has been registered. Between 1899, when the title deed wasintroduced, and July 2012 only 8 579 title deeds had been issued according to theland registry at the Ministry of Finance, the majority of which were for propertiesin Bangui and other urban areas. Homeowners in rural areas frequently onlyentered into verbal agreements regarding their ownership, often with involvementof the chief. The inclusion of unregistered land in the private domain of the stateis therefore a very significant feature of CAR’s land tenure system. Ownership ofregistered property can be transferred via purchase, inheritance and lease.
The real estate market in the Central African Republic is almost non-existent, asthere are no real estate operators in the country. As most houses are self-built,when owners want to sell, they advertise in the newspapers or announce theirintention informally within their social networks.
Policy and regulation
CAR’s legal system is based on the French civil law system. As with other branchesof government in CAR, the judiciary suffered from decades of insecurity and poorgovernance. Prior to the current crisis, several key legislative documents, such asthe Family Law (Code de la Famille) and the 1964 Land Code, were under revision.
Due to the events of late 2012 and early 2013, these review processes have notbeen concluded and other housing strategies and plans have been sidelined.
The recent inauguration of the new government in 2014 saw the splitting of theMinistry of the Reconstruction of Public Infrastructure, Urbanism and Housinginto the Ministry of Urbanism and Public Infrastructure (hereafter the Ministry ofUrbanism) and the Ministry of Accommodation and Housing (hereafter theMinistry of Housing). This split has added further complexity to the housingenvironment.
The decree explaining the organisation and functioning of the Ministry of Housingstipulates the construction, management, and promotion of administrative housingas its main mission. However, having only become a separate ministry in recentmonths, several of its officials explained that their mandate would soon be revisedto cover all accommodation and housing issues. Other officials indicated that thefocus on housing provided for civil servants would remain.
The Ministry of Urbanism allocates and manages CAR’s land. It allocates land, to,for instance, private parties but also to bigger projects such as housing schemes.The ministry also manages the country’s cadastre, a department which providestechnical expertise to assess and demarcate land, determines criteria for thedevelopment of land and issues construction permits and title deeds.
The technical aspect of the cadastre is complemented by the Ministry of Financeand Budget, which takes care of the financial side of land registration. It also housesthe land registration office (known as the office of domaines). This means thatonce the cadastre has issued a title deed, the related files are transferred to andstored at the Ministry of Finance and Budget.
The main policy and regulation frameworks governing the housing sector include: n Constitution of the Central African Republic (2004): Provides that all persons
have a right to property, and the state and citizens have an obligation toprotect those rights.
n CAR’s Law No. 63 of 1964 (Loi No. 63.441 du 09 janvier 1964 relative audomaine national): Abrogated the prior and Law No. 60/76, which allowedindividuals to obtain occupancy rights to land identified by the state forhabitation. Law No. 63 of 1964.
n Law No. 139 of 27 May 1960: Governs land tenure.n Law Number 63.441 of 9 January 1964 (referred to as the 1964 Land Code):
Defines the national domain and anticipates additional laws to address landtenure and private property. It recognises customary law, but limits customaryland tenure to use-rights. The law provides for the privatisation of state landthrough land registration.
n Code de la Famille of (1997): The law includes detailed provisions on maritalproperty and inheritance issues.
n Housing policy Statement and Housing Strategy (2008): Since its adoption in2008, two important decisions have been made: the signing into law of the
> $50 000
$25 000 – $50 000
$14 000 – $25 000
$8 000 – $14 000
$5 000 – $8 000
$3 600 – $5 000
$2 400 – $3 600
$1 600 – $2 400
$800 – $1 600
<$800
- - - Average income needed for the cheapest newly built house by a formal developer, 2015- - - Average annual urban household income, 2014
CENTRAL AFRICAN REPUBLIC
$23 853
$1 490
Rural | UrbanAnnual household income US$
No. of households (thousands) 400 300 200 100 0 100 200 300

60
creation of the Central African Housing Bank and the creation of the CentralAfrican Housing Promotion Agency. The law creating the Central AfricanHousing Bank was voted for in July 2010. These two organisations, along withthe Urban Development Fund (Fonds d'Amenagement et d'EquipementUrbain, or FAEU), are the government's main instruments for implementingits housing policy. The Housing Promotion Agency and the FAEU alreadyexist physically but lack the resources (less than CFA Francs 50 million orUS$100 000 a year) to undertake any serious initiative toward the housingsector besides providing a few plots of serviced land each year. Similarly,although the Housing Bank was formally signed into law, it still does not exist(and is unlikely to come into existence any time soon), also due to limitedgovernment resources.
n Poverty Reduction and Growth Strategy (2011-2015): Over this period thegovernment aims to undertake the following housing interventions: createdecent housing for the population, provide the population with marked-outbuilding plots and implement city planning systems. On this last objective,the country has received strong support from the African Development Bank,which will support Bangui’s city development strategy (CDS). The CDS wasnot, however, yet drafted before the crisis engendered by the March 2013coup d’état, and as a result, the current political situation is very likely to delaythe achievement of these goals
Opportunities
Due to prevalence of expensive building materials there is a huge requirement forcost-effective housing at a faster speed and larger scale. Developers with cheaperand unconventional construction materials have significant advantages overcompetitors. At the same time, with the completion of the new cement plant,which is expected to lower the price of cement, the effective demand for housingshould increase over the coming decade, while affordability will grow too.
Housing finance markets are destined for growth at virtually all income levels, butparticularly within the lower to middle income ranges. The conjunction of all theseevents comes with many opportunities to invest in the housing sector, both forbusinesses and households in the near future.
Until the country stabilises, it is unlikely that the housing sector will improve andexpand. However, when investors are able to safely return to the country, therewill be a significant need for the development and reconstruction of housing (ofall types) as well as its supporting infrastructure. As most of the housing unitsavailable in the country, especially outside of Bangui, are traditional housing units,investments to renew such housing are expected to create many jobopportunities.
Sources
African Economic Outlook (2014). Central African Republic, 2014EIU (2015). Country Report: Central African Republic. 16 August 2015.Government of Central African Republic (2000). National Report Istanbul+5.Bangui, 2000.Government of Central African Republic (2008). Ministry of Public BuildingsReconstruction, Urban Development and Housing. Lettre de PolitiqueNationale de Développement du Secteur de l'Habitat en RépubliqueCentrafricaine. Bangui, 2008.Government of Central African Republic (2008). Ministry of Public BuildingsReconstruction, Urban Development and Housing. Résumé du rapport destratégie nationale de l'habitat. Bangui, 2008.Government of Central African Republic (2009). Ministry of Finance andBudget. Stratégie Nationale pour la Finance Inclusive en RCA. Bangui, 2009. Government of Central African Republic (2011). Poverty Reduction StrategyPaper 2 2011-2015: Reducing Extreme Poverty. Bangui, 2011.IMF (2014). Request for disbursement under the Rapid Credit Facility andcancellation of the Extended credit Facility Arrangement- Staff Report; PressRelease; and Statement by the Executive Directot for the Central AfricanRepublic. 1 May 2015.UNHRC & Norwegian Refugee Council (2014). Displacement and Housing,Land and Property Rights in the Central African Republic. December 2014.USAID (2010). Property Rights and Resource Governance: Central AfricanRepublic. USAID Country Profile.World Bank (2014). Doing Business 2014: Central African Republic CountryProfile.
Websites
http://data.worldbank.orghttp://fas.imf.org/www.lejustesalaire.com (international salary comparator site)http://mixmarket.org/mfi/country/Central%20African%20Republic)http://www.mfw4a.org/central-african-republic.htmlhttps://www.cia.gov/library/publications/the-world-factbook/geos/ct.htmlhttp://reliefweb.int/report/central-african-republic/unicef-and-eu-improve-access-safe-water-800000-people-banguihttp://www.uncdf.orghttp://www.undp.org

Africa Housing Finance Yearbook 2015
61
ChadKEY FIGURES
Main Urban Centres N'Djamena
Exchange Rate: 1 US$***Inflation 2013 | 2014 (est.) | 2015 (prov.) | 2016 (prov.) *
593.20 Central African CFA0.2 | 2.9 | 3.3 | 3.5
Population^ | Population growth rate (2013)^Urban population (% of total)^ | Urbanisation rate (% in 2013)^
13 211 146 | 2.9622.34 | 3.48
GDP / capita (current US$)^ | GDP growth rate (annual %)^GNI / capita, Atlas method (current US$) ^Population below national poverty line*Unemployment rate (%)*Gini co-efficient (year of survey)^^HDI (Global Ranking)" | HDI (Country Index Score)”
1 053.82 | 7.301 01046.77.843.3 (2011)184 | 0.372
Lending Interest Rate^Mortgage Interest Rate (%) | Mortgage Term (years)#Credit % of GDP^Average Mortgages % of GDP° Price To Rent Ratio City Centre** | Outside City Centre**Gross Rental Yield City Centre** | Outside of City Centre**Outstanding home loan (% age 15+)##
...9.00 | 107.8.........4.51
What is the cost of standard 50kg bag of cement (in US$)? #What is the price of the cheapest, newly built house by a formaldeveloper or contractor (in US$)? #What is the size of this house (in m2)? #What is the average rental price for a formal unit (in US$/month)#What is the minimum plot size for residential property (in m²)#
...
...
...
...
...
Ease of doing business rank !Number of procedures to register property !Time (days) to register property !Cost (% of property value) to register property !
18564415.20
*** Conmill.com The Currency Converter^ World Bank's World Development Indicators (2014)~ World Bank PovcalNet: an online poverty analysis tool, various years^^ The World Bank's PovCalnet" UNDP's International Human Development Indicators (2014)° Various: Badev et al. "Housing Finance Across Countries: New Data and Analysis" – Unpublished
paper/Hofinet/World Bank## Global Financial Inclusion Database (FINDEX)# CAHF Annual Survey Data (September 2015)! World Bank's Doing Business Survey Data (2015)** Numbeo Online User-Contributed Database
devastating presence along its shared border with Nigeria, Niger and Cameroon.Chad has deployed troops into Cameroonian and Nigerian territory to combatBoko Haram (the area in which Boko Haram operates forms part of Chad’s mostsignificant trade corridor). Overall, Chad has recently made an effort to improveits governance and has acknowledged the reforms that the country requires, whileattempting to protect its economic interests by combating Boko Haram and tryingto increase its regional importance by involving itself in the conflicts in CAR andMali.
Access to finance
Chad is a member of Central African Economic and Monetary Community(CEMAC), which has a regional central bank – the Bank of Central African States(BEAC). All banks in Chad are subject to oversight by the Central Africa BankingCommission (COBAC), which is part of BEAC. As of October 2014, eight bankswere authorised by BEAC to operate within Chad. All eight banks have, to varyingdegrees, some form of foreign ownership. Five of the banks – BSIC, Ecobank,Orabank, Société Générale and United Bank for Africa – are subsidiaries ofmultinational banks. The eight banks vary in size, and with a share capital ofbetween CFAF 6 billion (US$20 million) and CFAF 12 billion (US$40 million).According to Making Finance Work for Africa (MFW4A), despite the foreignlinkages, these banks are not well integrated into global financial markets, inhibitingthe development of the financial sector while providing protection from globalfinancial market fluctuations.
Overview
Chad, a predominantly rural, land-locked country, is recovering from four decadesof continual conflict. Its 1 284 million km2 are bordered by Libya to the north;Sudan to the east; Central African Republic (CAR) to the south; and Cameroon,Niger and Nigeria to the west. Chad holds substantial oil reserves, which havebeen exploited since 2000 through a US$4.2 billion World Bank-financed pipeline.Government’s finances have increased drastically due to the oil revenue. However,the increase in public spending has been predominantly on its military, in violationof the requirement by the World Bank that the oil revenue should be directedtowards poverty reduction efforts. This led to the IMF and World Bank severingits relationship with the government in 2010. Chad’s relations with theseinstitutions have recently been restored, and the country was provided, in May2015, with debt relief to the value of US$1.1 billion.
Throughout 2015, new oil fields are coming into production; the output ofestablished, ageing fields’ production have gradually decreased. Chad’s dependencyon oil makes the economy vulnerable to fluctuation in oil prices, which areexpected to remain at the current low levels for the foreseeable future. Thisresulted in an economic growth rate that has varied between zero and 40 percentsince 2004. Last year, largely because of increased oil output, economic growth wasat 7.2 percent, resulting in a GDP per capita of US$1 053. Despite theconsiderable economic growth, inflation has remained low, consistently below fourpercent.
Even with the newfound oil wealth, the majority of Chadians support themselvesthrough agriculture. The agricultural sector – predominantly based in thesouthwest, with the main produce being cotton and livestock – is vulnerable tovariations in rainfall. The continued shrinking of Lake Chad and lower than typicalrainfall – a trend that is expected to continue because of climate change – hassteadily decreased the availability of water over the last past decade, resulting infood shortages in 2011.
Investors, donors and the government would be encouraged by the reducedthreat of internal conflict, largely the result of the stabilisation of relations withSudan. The region, though, continues to threaten Chad’s stability, with numerousconflicts in bordering countries. Libya and CAR have been engulfed by civil wars,Mali has struggled with a recent insurgency, and Boko Harem has established a

62
> $50 000
$25 000 – $50 000
$14 000 – $25 000
$8 000 – $14 000
$5 000 – $8 000
$3 600 – $5 000
$2 400 – $3 600
$1 600 – $2 400
$800 – $1 600
<$800
- - - Average income needed for the cheapest newly built house by a formal developer, 2015
- - - Average annual urban household income, 2014
CHAD
$15 582
$1 853
Rural | UrbanAnnual household income US$
No. of households (thousands) 1400 1200 1000 800 600 400 200 0 200 400
Chad, like all countries in CEMAC, utilises the CFA franc, a currency which ispegged to the Euro. BEAC has an interest rate of 2.95 percent, down from fourpercent in 2013. This rate has averaged 3.78 percent from 2009 until 2015, witha high of 4.25 percent in July of 2009 and a low of 2.95 percent in July of 2014.The IMF, in 2014, claims that lending rates by banks can be as high as 13 percentin some CEMAC countries. Most of BEAC’s lending is to CEMAC governments,creating a situation where the Chadian government does not need to issuetreasury bonds. The bond market is also not an option for private developerswho wish to raise capital for developments.
Financial inclusion is low in Chad, even among the wealthy. Only 12 percent of thepopulation has formal bank accounts, just 30 percent of the richest 20 percent.According to Findex 2014, only two percent of the adult population borrowedfrom a formal institution in 2014, as the majority of Chadians who have borrowedmoney do so from a relative or friend. This is a the trend across the region, as thelow rate of financial inclusion across CEMAC represents the shallowness of thebanking sector – the IMF report states that banks hold excess reserves (200 percentof reserve requirements) and lack the sophistication to adequately assess risk.
Even with the low rate of financial inclusion, there were consistently, between 2000and 2012, well over 100 microfinance institutions in operation in Chad – thesecond highest number in CEMAC. Currently, according to MFW4A, there areover 200 microfinance institutions in operation, though most are primarily involvedin agriculture. The IMF predicts that the microfinance sector will continue to grow,increasing financial inclusiveness in the country. Microfinance institutions, like banks,are subject to regulatory oversight by COBAC.
According to Findex 2011, 7.3 percent of adults had an outstanding loan topurchase a house. Data from Findex 2014 shows that 4.5 percent of adults havean outstanding mortgage (note that these numbers are not directly comparable).At 5.4 percent, a greater percentage of adults in rural areas had a mortgage thanthose in urban areas. Some of the banks do provide mortgages. Orabank offera mortgage for a loan repayment term between five and 10 years, at an averagerate of nine percent to those who are formally employed, or to private companiesor multinationals. BSIC also offers property loans. Though it is unclear whetherthe other formal banks offer mortgages, data suggests that rates offered onmortgages may be between 14 and 15 percent. The availability and accessibilityof housing finance is limited in Chad, due to both the affordability and supply ofhousing.
Affordability
With over 90 percent of its urban inhabitants living in informal settlements,according to UN Habitat, Chad suffers from a severe shortage in the provision ofaffordable housing. Chad aimed, under its 2013 – 2015 National DevelopmentPlan, to increase access to decent housing to 32 percent, from 28 percent in 2011.The World Bank claims that the inadequate and informal nature of housing is
because of the extremely high cost of building materials, stating that this is thereason that the rental market is predominantly informal. In contrast, typical of lowincome countries with dominant oil sectors, N’Djamena is ranked as the tenthmost expensive city to live in for expatriates by Mercer’s Cost of Living Survey, inits worldwide assessment of 211 cities in 2015, down from second position in2014.
According to Numbeo, the rental cost of a formal one-bedroom apartment inurban Chad is US$580 a month. In contrast, the average annual generalexpenditure per capita, in 2011, was CFAF 231 190 (US$394), ranging fromCFAF 66 321 (US$113) for the poorest households to CFAF 617 292 (US$1 060)for the wealthiest. Taking into consideration Chad’s GDP per capita (US$1 053,which includes the significant contribution to the economy by the oil sector) andits poverty rate (46.7 percent), the rental figures collected in Numbeo highlightshow unaffordable formal housing is.
While there have been initiatives to decrease the cost of imports, such as roadpaving funded by the World Bank, the remoteness of N’Djamena and the lack ofinitiatives to provide affordable housing – marked by the fact that none of theloans provided by international donors have been for housing – means that thehigh cost of formal housing is likely to remain. For the resale market, the WorldBank’s Doing Business 2015 report states that the standard price of property wasCFAF 24 793 141 (US$43 000). There is little data available on the cost ofconstructing a house but what there is suggests that it continues to be high. Anexample of this is demonstrated by Chad having the most expensive cost per aclassroom in Africa: the average construction costs for a classroom, according tothe World Bank, was US$57,229 in 2009, compared to a continental average ofUS$6,740. At this cost, US$741 per m2, a 40 m2 house would cost US$30 000 tobuild, though it is likely cheaper to build a classroom than a house. In terms ofdevelopments, 405 houses were constructed by Lutheran World Federation(LWF) for refugees at a cost of US$45 500 a house in 2013; in 2014, LWF reportthat it was able to build more houses at a cost of US$25 000. The lack of supplyof adequate and affordable housing means that data on the cost of constructionis scarce.
Housing Supply
Supply of housing in Chad is predominantly provided informally. Its remote, land-locked location drastically increases the price of imported building materials, whilelocal manufacturing in the local economy is limited. Chadians tend to constructincrementally, accessing financing through family and informal sources, both in urbanand rural areas, predominantly with traditional building materials.
There is little information available on the supply of housing in Chad.Improvements in housing have been slow: 77.5 percent of urban housing wasinadequate in 2003, decreasing to 73.1 percent in 2011. The oil boom hasincreased demand for formal housing at the top of the market but has done little

Africa Housing Finance Yearbook 2015
63
to increase the supply in the affordable market. Most new formal constructionhappens at the high-end of the market, with the government constructing 60deluxe houses for an African Union summit in 2015. The Chadian governmentannounced the construction of 14 000 social housing units at the beginning of2014, to be constructed by Morocco, but it is not clear what progress has beenmade with this initiative. And the government foresees the construction of125 000 new housing units by 2025.
77.66 percent of households (just over 2 million) are rural, with only 9.17 percent(just under a quarter of a million) living in major urban areas. According to UNHabitat, Chad’s average household size has consistently been around eight for thepast two decades, though it is gradually decreasing, and is expected to be 7.5 in2025. Urban households bring down this average, with an average size just abovefive.
Property Markets
Chad has a small and limited property market. Most housing is informal, and salestake place on the informal market. The formal market serves the elite, with littleturnover. This may be changing, as the World Bank, in 2011, stated that a ‘boomingurban economy is driving improvements … in housing quality,’ with notableincreases in the rate of asset ownership and adequate flooring.
The World Bank’s Doing Business Index 2015 reveals some of factors that inhibitthe development of Chad’s property markets: registering property involves 7procedures, taking 44 days and at a cost of 15.2 percent – down from 15.4 percentfrom 2014 – of the price of the property. This means that Chad is ranked as the166th country in the world in terms of ease of registering a property. Though ittakes less time to register a property than in an average Sub-Saharan Africancountry, the process costs six percentage points more than the regional average.
Chad does have property taxes. According to Monkam, property taxes are onlyimplemented in N’Djamena, and even then it is unevenly and poorly enforced.The tax rate on properties is 12 percent in N'djamena and 11 percent in othermunicipalities, though rates increase to 21 percent if the land is undeveloped. Thetax is calculated according to the annual or rental value of a property. Propertytax collection is hampered by non-compliance and corruption, impeding localgovernments’ ability to provide services yet reducing the tax burden on propertyowners. Beyond property tax, developers would be subject to a corporate taxrate of up to 40 percent, while the highest personal tax rate is 60 percent.
Policy and Regulation
Chad has a National Housing Strategy (SNL), which is implemented through theMinistry of Urban Development and Housing and was adopted in 1998/1999. Themost recent policy document for housing is the 2013 – 2015 NationalDevelopment Plan (PND), which states that, as ‘an emerging regional power by2025, supported by diversified and sustainable sources of growth that create addedvalue and employment and assure every Chadian adequate access to basic socialservices [and] decent housing’. As part of the PND, Chad has allocated CFAF12.05 billion (US$20 million) to housing and provided the Ministry of UrbanDevelopment and Housing with a budget CFAF 6.29 billion (US$5 million), forthe period 2013 – 2015.
The government has undertaken the following initiatives: it intends to clarify thelaws governing property and land ownership, modernise the land-registry services,and launch property surveys in N’Djamena. Additionally, according to the WorldBank, ‘in N’Djamena and a few other cities and towns, 4 082 lots have beenestablished by subdividing land.’ A Land and Real Estate Promotion Corporation(SOPROFIM) was recently established, and the Corporation intends to set up theHousing Mortgage Bank. However, it seems that the Bank will largely beconcerned with the upper-end of the market.
Chad’s land legislation has not been updated since 1967, even though thegovernment recognises its inadequacy. As with many African countries, the stateholds all private and public land. This means that all land that is considered vacantor unoccupied is the property of the state. Land that is occupied falls under anumber of different legal regimes. Islamic law, present in northern and centralChad, provides for ownership. Formal law allows for freehold rights, providing forthe occupation and transfer of land. Leaseholds are recognised under formal law,
though the extent to which it is formally present is uncertain. Communities aremandated to provide occupancy rights.
Chad updated its investment legislation in 2007, adopting the National InvestmentCharter Act, in accordance with the regulations of BEAC. The government has alsopassed a law establishing the National Investment and Export Promotion Agency.It is unclear how this has impacted investors, though in 2009 the AfricanDevelopment Bank criticised the business environment of the country. TheNational Investment Charter Act included provisions that called for the enactmentof a land law consistent with the legislation on contracts and strengthening ofcommercial courts.
Opportunities
With a relatively stable economy, the government is seemingly intent on improvingits standing with international lenders, and the possibility of new oil production andmineral exploitation, Chad’s fortune can improve. Its membership to BEACprovides a stable monetary framework, while political instability is less of a threatto the government than it has been in the past. Chad offers an interesting marketto work in, and one desperately in need of affordable housing developments. Thehigh cost of formal construction provides developers with the opportunity to gainsubstantial market share by innovating in the affordable segment of the market.
Sources
IFC. (2009). Enterprise surveys: Chad: Country Profile 2009, World BankGroup. Retrieved fromhttp://www.enterprisesurveys.org/~/media/GIAWB/EnterpriseSurveys/Documents/Profiles/English/Chad-2009.pdf.IMF. (2014). Central African Economic and Monetary Community (CEMAC):IMF country report No. 14/305, International Monetary Fund PublicationServices: Washington.IMF. (2015). Chad – IMF executive board completes first review under the ECFarrangement, approves augmentation and US$27.7 million disbursement,International Monetrat Fund press release. Retrieved fromhttps://www.imf.org/external/np/sec/pr/2015/pr15181.htm.IMF. (2015). Poverty reduction strategy paper—Joint staff advisory note on the2013 monitoring report of the National Development Plan 2013-15. Retrievedfrom Irish, J. (2014). Chad to double oil output by 2016, develop minerals -minister,Reuters. Retrieved from http://www.reuters.com/article/2014/10/07/chad-economy-idUSL6N0S21K620141007.Monkam, N. (2010). Mobilising tax revenue to finance development: The casefor property taxation in Francophone Africa, Working paper 195, University ofPretoria. Retrieved fromhttp://www.up.ac.za/media/shared/61/WP/wp195.zp39411.pdf.N’Kodia, C. (2014). Chad, African Economic Outlook. Retrieved fromhttp://www.africaneconomicoutlook.org/en/countries/central-africa/chad/.Polgreen, L. (2008). World Bank ends effort to help Chad ease poverty, NewYork Times. Retrieved fromhttp://www.nytimes.com/2008/09/11/world/africa/11chad.html?_r=0.Steffen, S. (2015). Chad: The role of economic interests in Chad's fight againstBoko Haram, Deutsche Welle. Retrieved from http://www.dw.de/the-role-of-economic-interests-in-chads-fight-against-boko-haram/a-18234847.UNHABITAT. (2014). The state of African cities 2014: Re-imagining sustainableurban transitions, United Nations Human Settlements Programme: Nairobi. USAID. (2010). USAID country profile: Property rights and resourcegovernance: Chad, USAID. Retrieved fromhttp://usaidlandtenure.net/sites/default/files/country-profiles/full-reports/USAID_Land_Tenure_Chad_Profile.pdf.World Bank. (2011). Republic of Chad public expenditure review update: Usingpublic resources for economic growth and poverty reduction, PovertyReduction and Economic Management 3: Africa Region. Retrieved fromhttps://openknowledge.worldbank.org/bitstream/handle/10986/2821/576540ESW00P110IC0disclosed02070120.pdf?sequence=1.World Bank. (2013). Republic of Chad poverty notes: Dynamics of povertyand inequality following the rise of the oil sector, Poverty Reduction andEconomic Management 4: Africa Region. Retrieved fromhttps://openknowledge.worldbank.org/bitstream/handle/10986/19322/809350ESW0P1270Gray0cover00PUBLICTD.pdf?sequence=1.

64
World Bank. (2015). The Republic of Chad joint staff advisory note on the2013 monitoring report of the National Development Plan 2013-2015: ReportNo. 95505-TD, World Bank. Retrieved from http://www-wds.worldbank.org/external/default/WDSContentServer/WDSP/IB/2015/04/15/000442464_20150415110358/Rendered/PDF/955050PRSP0IDA0Disclosed04013020150.pdf.
Websites
www.africareport.comwww.allafrica.comwww.beac.intwww.cia.gov/library/publications/resources/the-world-factbookwww.data.imf.orgwww.doingbusiness.orgwww.mfw4a.orgwww.mixmarket.org www.tradingeconomics.comhttp://mirror.unhabitat.org/content.asp?cid=664&catid=186&typeid=13
Africa Housing Finance Yearbook 2015
65
ComorosKEY FIGURES
Main Urban Centres Moroni
Exchange Rate: 1 US$***Inflation 2013 | 2014 (est.) | 2015 (prov.) | 2016 (prov.) *
452.72 Comorian Franc (KMF)1.6 | 1.6 | 2.5 | 2.6
Population^ | Population growth rate (2013)^Urban population (% of total)^ | Urbanisation rate (% in 2013)^
752 438 | 2.3628.19 | 2.67
GDP / capita (current US$)^ | GDP growth rate (annual %)^GNI / capita, Atlas method (current US$) ^Population below national poverty line*Unemployment rate (%)*Gini co-efficient (year of survey)^^HDI (Global Ranking)" | HDI (Country Index Score)”
860.83 | 3.0084044.87.064.3 (2004)159 | 0.488
Lending Interest Rate^Mortgage Interest Rate (%) | Mortgage Term (years)#Credit % of GDP^Average Mortgages % of GDP° Price To Rent Ratio City Centre** | Outside City Centre**Gross Rental Yield City Centre** | Outside of City Centre**Outstanding home loan (% age 15+)##
10.5018.00 | 3024.1628.00%.........
What is the cost of standard 50kg bag of cement (in US$)? #What is the price of the cheapest, newly built house by a formaldeveloper or contractor (in US$)? #What is the size of this house (in m2)? #What is the average rental price for a formal unit (in US$/month)#What is the minimum plot size for residential property (in m²)#
8.25
131 000120......
Ease of doing business rank !Number of procedures to register property !Time (days) to register property !Cost (% of property value) to register property !
15943010.40
*** Conmill.com The Currency Converter^ World Bank's World Development Indicators (2014)~ World Bank PovcalNet: an online poverty analysis tool, various years^^ The World Bank's PovCalnet" UNDP's International Human Development Indicators (2014)° Various: Badev et al. "Housing Finance Across Countries: New Data and Analysis" – Unpublished
paper/Hofinet/World Bank## Global Financial Inclusion Database (FINDEX)# CAHF Annual Survey Data (September 2015)! World Bank's Doing Business Survey Data (2015)** Numbeo Online User-Contributed Database
competitors Réunion, Mauritius, and Seychelles. Its weak tourist industry is mainlybecause of its insecure political climate, with many political upheavals over the pastthree decades. Tourists in the Comoros are mainly wealthy Americans andEuropeans, while much of the investment in hotels has come from South Africa.The per capita income is US$880. The country lacks the infrastructure necessaryfor sustained development.
In its 2013 Annual Report, the Comoros Central Bank indicated that economicgrowth for the year was at 3.5 percent and that the inflation rate had come downto 1.6 percent from 6 percent in 2012. However budget deficit had worsened to8.5 percent of GDP in 2013, compared to 5.6 percent in 2012. The currentaccount deficit is projected to narrow to 7.4 percent of GDP in 2014 from 11.3percent in 2013, reflecting a contraction in imports of investment goods and lowerfuel import prices, as well as higher remittances. While public debt improved to26.2 percent in 2013, compared to 51.3 percent in 2012, this was due to a debtwrite-off from the IMF and other international institutions.
The World Bank’s 2015 Doing Business Report ranks Comoros as 173rd out of 189countries surveyed in terms of starting a business.
Access to Finance
Comoros has a relatively small and underdeveloped financial sector. Financialintermediation and credit to the private sector, while still low, have been expandingin recent years following the entry of two foreign commercial banks. However, thefurther development of credit markets remains constrained by poorly defined
Overview
The Comoros Islands are an archipelago of four islands and several islets locatedin the western Indian Ocean about ten to 12 degrees south of the Equator andless than 200 miles off the East African coast. They lie approximately halfwaybetween the island of Madagascar and northern Mozambique at the northernend of the Mozambique Channel. The archipelago is the result of volcanic actionalong a fissure in the seabed running west-northwest to east-southeast. The totalarea of the four islands is 2 034 km2. The population of Comoros was estimatedat 734 917 in 2013.
The Comoros Archipelago is divided between the Union of the Comoros, asovereign nation formed by the three islands of Grande Comore, Anjouan andMohéli; and an Overseas Department of the French Republic (départementd'outre-mer), which was established in 2011 on the fourth island, Mayotte. Thisisland is claimed by the Union of the Comoros (which considers it to form partof its territory according to Article 1 of its Constitution), but it has chosen toremain French in numerous referenda that France has held. Since independencein 1975, the Comoros experienced more than 20 coups or attempted coups.Controversial elections in 2007 led to military intervention by the African Unionin March 2008. Political stability has since improved following a referendum onconstitutional amendments in May 2009 and the formation of a consensus nationalunity cabinet in May 2010.
According to the African Economic Outlook 2015, despite average growth ofaround three percent since 2011, the economy has not managed to achievestructural transformation, mainly because of the country’s weak institutionalcapacities. The country is therefore struggling to lay the foundations for sustainableeconomic growth that will create jobs. Unemployment among youth andgraduates in particular was estimated at over 50 percent in 2014. Youthemployment is seen as vital to reduce poverty. Comoros is undergoing an energycrisis which is impacting the regional economy resulting in moderate growth. Thishas resulted in increased production costs for large businesses that choose tooperate with power generators. Agriculture constitutes 40 percent of thecountry’s gross domestic product (GDP) with 80 percent of the populationemployed in the subsistence agriculture and fishing sector. Although the Comoroshas many natural resources for tourism, such as its beaches and marineenvironment, it does not have as strong a tourist industry as its regional
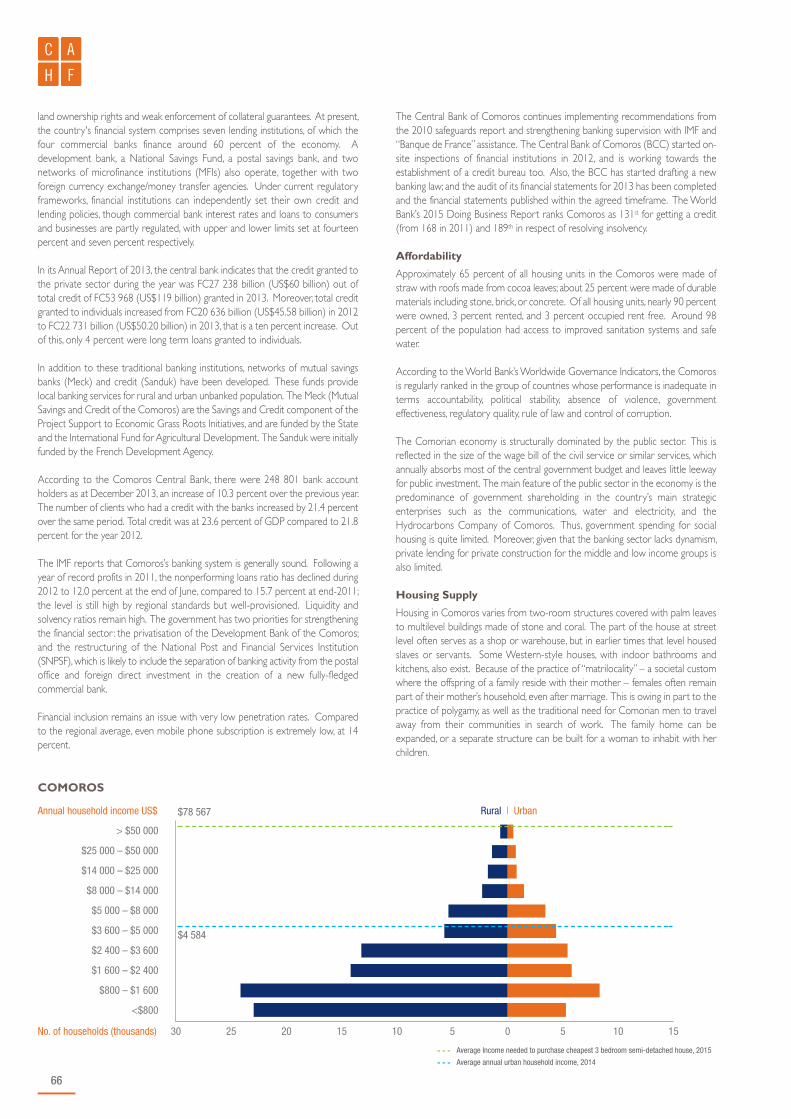
66
> $50 000
$25 000 – $50 000
$14 000 – $25 000
$8 000 – $14 000
$5 000 – $8 000
$3 600 – $5 000
$2 400 – $3 600
$1 600 – $2 400
$800 – $1 600
<$800
- - - Average Income needed to purchase cheapest 3 bedroom semi-detached house, 2015
- - - Average annual urban household income, 2014
COMOROS
$78 567
$4 584
Rural | UrbanAnnual household income US$
No. of households (thousands) 30 25 20 15 10 5 0 5 10 15
land ownership rights and weak enforcement of collateral guarantees. At present,the country's financial system comprises seven lending institutions, of which thefour commercial banks finance around 60 percent of the economy. Adevelopment bank, a National Savings Fund, a postal savings bank, and twonetworks of microfinance institutions (MFIs) also operate, together with twoforeign currency exchange/money transfer agencies. Under current regulatoryframeworks, financial institutions can independently set their own credit andlending policies, though commercial bank interest rates and loans to consumersand businesses are partly regulated, with upper and lower limits set at fourteenpercent and seven percent respectively.
In its Annual Report of 2013, the central bank indicates that the credit granted tothe private sector during the year was FC27 238 billion (US$60 billion) out oftotal credit of FC53 968 (US$119 billion) granted in 2013. Moreover, total creditgranted to individuals increased from FC20 636 billion (US$45.58 billion) in 2012to FC22 731 billion (US$50.20 billion) in 2013, that is a ten percent increase. Outof this, only 4 percent were long term loans granted to individuals.
In addition to these traditional banking institutions, networks of mutual savingsbanks (Meck) and credit (Sanduk) have been developed. These funds providelocal banking services for rural and urban unbanked population. The Meck (MutualSavings and Credit of the Comoros) are the Savings and Credit component of theProject Support to Economic Grass Roots Initiatives, and are funded by the Stateand the International Fund for Agricultural Development. The Sanduk were initiallyfunded by the French Development Agency.
According to the Comoros Central Bank, there were 248 801 bank accountholders as at December 2013, an increase of 10.3 percent over the previous year.The number of clients who had a credit with the banks increased by 21.4 percentover the same period. Total credit was at 23.6 percent of GDP compared to 21.8percent for the year 2012.
The IMF reports that Comoros’s banking system is generally sound. Following ayear of record profits in 2011, the nonperforming loans ratio has declined during2012 to 12.0 percent at the end of June, compared to 15.7 percent at end-2011;the level is still high by regional standards but well-provisioned. Liquidity andsolvency ratios remain high. The government has two priorities for strengtheningthe financial sector: the privatisation of the Development Bank of the Comoros;and the restructuring of the National Post and Financial Services Institution(SNPSF), which is likely to include the separation of banking activity from the postaloffice and foreign direct investment in the creation of a new fully-fledgedcommercial bank.
Financial inclusion remains an issue with very low penetration rates. Comparedto the regional average, even mobile phone subscription is extremely low, at 14percent.
The Central Bank of Comoros continues implementing recommendations fromthe 2010 safeguards report and strengthening banking supervision with IMF and“Banque de France” assistance. The Central Bank of Comoros (BCC) started on-site inspections of financial institutions in 2012, and is working towards theestablishment of a credit bureau too. Also, the BCC has started drafting a newbanking law; and the audit of its financial statements for 2013 has been completedand the financial statements published within the agreed timeframe. The WorldBank’s 2015 Doing Business Report ranks Comoros as 131st for getting a credit(from 168 in 2011) and 189th in respect of resolving insolvency.
Affordability
Approximately 65 percent of all housing units in the Comoros were made ofstraw with roofs made from cocoa leaves; about 25 percent were made of durablematerials including stone, brick, or concrete. Of all housing units, nearly 90 percentwere owned, 3 percent rented, and 3 percent occupied rent free. Around 98percent of the population had access to improved sanitation systems and safewater.
According to the World Bank’s Worldwide Governance Indicators, the Comorosis regularly ranked in the group of countries whose performance is inadequate interms accountability, political stability, absence of violence, governmenteffectiveness, regulatory quality, rule of law and control of corruption.
The Comorian economy is structurally dominated by the public sector. This isreflected in the size of the wage bill of the civil service or similar services, whichannually absorbs most of the central government budget and leaves little leewayfor public investment. The main feature of the public sector in the economy is thepredominance of government shareholding in the country’s main strategicenterprises such as the communications, water and electricity, and theHydrocarbons Company of Comoros. Thus, government spending for socialhousing is quite limited. Moreover, given that the banking sector lacks dynamism,private lending for private construction for the middle and low income groups isalso limited.
Housing Supply
Housing in Comoros varies from two-room structures covered with palm leavesto multilevel buildings made of stone and coral. The part of the house at streetlevel often serves as a shop or warehouse, but in earlier times that level housedslaves or servants. Some Western-style houses, with indoor bathrooms andkitchens, also exist. Because of the practice of “matrilocality” – a societal customwhere the offspring of a family reside with their mother – females often remainpart of their mother’s household, even after marriage. This is owing in part to thepractice of polygamy, as well as the traditional need for Comorian men to travelaway from their communities in search of work. The family home can beexpanded, or a separate structure can be built for a woman to inhabit with herchildren.

Africa Housing Finance Yearbook 2015
67
As indicated earlier, some 65 percent of the houses are quite rudimentary butprivately owned. There is a big scope for eventual further credit facilities fromprivate banks/financial institutions to improve on those houses. In the absence ofaffordable dwellings supplied by the market, a consortium from Iran has proposedto construct 5 000 housing units throughout the three islands over a period of fouryears.
Property markets
While poverty remains pervasive in Comoros and the housing standard iselementary, on the other hand, the market for Comoros up market properties hasbeen growing in recent years.
The growth in residential and commercial property ownership is the result ofseveral trends including international aid, increased tourism and the nation’srelationship with France. Investors and business owners who want property inComoros need to keep these trends in mind before taking the plunge. Thepurchase price of a three bedroom semi-detached house in Comoros can rangefrom US$131 000 to US$700 000. Rental of a three bedroom apartment, ifavailable, is between US$1 000 and US$1 500 per month. The Comoros'sEconomic Citizenship Act, passed in 2008 allows the country to grant nationalityto foreigners who make a substantial amount of investment in the country. Thisadds to the speculative strategies on the part of the few property developerswho operate on the market. Although most of the housing units in Comoros arerudimentary, they are privately owned.
The World Bank’s 2015 Doing Business Report ranks Comoros at the 105th
position for registering property.
Policy and regulation
The Ministry of Territorial Management, Urbanisation, Housing & Energy has theresponsibility of overall administration of housing and related issues. However,given the shortage of affordable houses and the high demand, the market is quiteineffective.
Despite the fact that the credit market is at a basic stage, the Central bank ofComoros has put in place prudential norms. In its report of 2013, the CentralBank reports that compliance to Bank Prudential Ratios were also well respectedby the financial institutions.
In recent years, authorities have undertaken several measures to enhance financialintermediation and strengthen the country's banking and financial sectors. Suchefforts include the facilitation of entry for foreign banks, reforms to the investmentcode in 2007 and the establishment of a National Agency for InvestmentPromotion. The country's authorities have recently concluded agreements withthe Central Bank of Tanzania, the Central African Banking Commission (COBAC)and the French Prudential supervisory authority to strengthen regulatory andsupervisory frameworks, expand the scope of prudential regulations, and increasethe effectiveness of control procedures.
Opportunities
The IMF indicates that the political context of the Comoros has continued toimprove and programme ownership has further strengthened since 2012. SinceMay 2011, the government has shown unwavering commitment to IMF-supportedpolicies; and programme ownership is strong not only in government, but alsoamong trade unions, the private sector, and wider civil society. There is a broadnational consensus on the need to stay the course for achieving the completionpoint and continuing satisfactory implementation of the IMF-supportedprogramme over the medium term.
Moreover, efforts have been made to improve business relationships with majorinternational corporations and to forge relations with companies such as Ernest& Young for business development, auditing and studies. Through bankers such asHSBC, Al Ahli Bank of Kuwait, Gulf Bank, Al Mawared bank and other partners, thecountry is securing financing for its major projects.
There is huge potential for development of infrastructure and other services.Accordingly, as the economy progresses, there might be enormous scope forhousing and housing financing with a particular emphasis on social housing.
Sources
Making Finance Work for Africa.Afdb, Comoros Country Strategic paper. 2011-2015.Banque Centrale des Comoros, Rapport Annuel (2013).African Economic Outlook (2015).World Bank (2015). Ease of Doing Business.
Websites
http://www.mfw4a.org/comoros/financial-sector-profile.htmlhttp http://www.comoros-infos.net/construction-de-5000-logements-sociaux-aux-comoros/://www.afdb.org/http://www.banque-comoros.kmhttp://www.africaneconomicoutlook.org/en/country-notes/east-africa/comoros/http://www.doingbusiness.org/data/exploreeconomies/comoros

68

Africa Housing Finance Yearbook 2015
69
Côte d’Ivoire
to purchase a house. The MFI also has a product called ‘Coopec Diaspora’ targetedat Ivorians in the diaspora. Clients pay a 10 percent deposit and then makearrangements to pay either directly in instalments, or over 15 years via a co-operating bank. UNACOOPEC-CI has entered into a partnership arrangementwith The Central Real Estate Company, which builds the houses that the CoopecDiaspora clients then buy on specification. UNACOOPEC CI is facing a seriouscharge of mismanagement which can jeopardize the savings of its clients this wasreported in the media by late 2014 and there is no information about the project(Cite Diaspora) and the last data of the MFI reported by Mix Market concerned2012.
Broadly, four institutions are involved in the financing of housing. These are theCaisse Autonome d’Amortissement, which later became the national investmentbank, BNI; the Support Fund for Housing (Fonds de Soutien à l’Habitat, FSH); theUrban Land Account (Compte des Terrains Urbains) and the Housing MobilisationAccount (Compte de Mobilisation pour l’Habitat, CDMH). The Compte deMobilisation de l'Habitat was created to give financial assistance and tax incentivesto stimulate the delivery of affordable housing for low income buyers.
Access to housing finance remains challenging in Cote d’Ivoire. Commercial banksinclude the Housing Bank created in 1994 with a mission to finance social housingand real estate activities. In spite of the huge liquidity at their disposal, they cannottake the risk of financing mass produced houses for any category of the populationbecause the banks’ resources are short term.
Overview
The Republic of Côte d'Ivoire is in West Africa and bordered by Liberia, Guinea,Mali, Burkina Faso, Ghana and the Atlantic Ocean. The country has a populationof 20.8 million, and is the world’s largest cocoa producer. The country’s GDPgrowth hit an all-time low in 2011, mainly due to the 2011 post-election violencewhen former President Laurent Gbagbo was forced out of office after he refusedto concede the presidency following his 2010 election defeat. Legislative electionswere held in December 2011 and were won by Alassane Dramane Ouattara, whoafter four years in office was re-elected in the 2015 elections. The economyrecovered in 2012, with an 8.6 percent GDP growth rate, driven by public andprivate investment and growth in consumption. GDP growth rate of 8.7 percentin 2013, and 8.3 percent in 2014 confirmed the recovery. Growth is expected toremain robust in 2015 with eight percent and 8.5 percent in 2016 due to structuralreforms and improvement in the business climate.
Côte d'Ivoire is the largest economy in the West African Economic and MonetaryUnion (WAEMU/UEMOA) and accounted for 35 percent of the region’s totalGDP in 2015. As it implements its 2012-2015 National Development Plan (NDP),the country is busy developing its plans for the next phase, post-2015, with thehelp of various stakeholders and the African Development Bank Group.
Access to finance
According to the Central Bank, Côte d'Ivoire has 25 banks, 31 insurancecompanies, 80 microfinance structures (MFIs) and two financial institutions. Thefinancial service industry has witnessed double digit growth since emerging fromthe political crisis, with aggregate assets of CFA600.6 billion (US$11 126 095 752)in November 2014. According to the West African Central bank, (BCEAO), banks’assets have grown from 25.8 percent of GDP in 2003 to 26.8 percent in 2013meanwhile bank lending remains low at 18 percent of GDP in November 2014.This is due mainly to the lower market penetration.
In 2015, there were 32 MFIs listed on Mix Market, with US$191.8 million worthof loans disbursed to 114 662 borrowers, and US$276.5 million in deposits from680 149 depositors. UNACOOPEC-CI, the savings and credit co-operative networkof Côte d’Ivoire, remains the largest MFI with 448 740 depositors, US$179.4 milliondeposits, 53 293 borrowers and US$65.7 million in loans dispersed in 2012. Theyoffer a product called ‘Prêt Habitat’ which enables borrowers to buy land, build or
KEY FIGURES
Main Urban Centres Yamoussoukro
Exchange Rate: 1 US$***Inflation 2013 | 2014 (est.) | 2015 (prov.) | 2016 (prov.) *
593.20 West African CFA2.6 | 0.6 | 2.5 | 2.1
Population^ | Population growth rate (2013)^Urban population (% of total)^ | Urbanisation rate (% in 2013)^
20 804 774 | 2.3853.48 | 3.72
GDP / capita (current US$)^ | GDP growth rate (annual %)^GNI / capita, Atlas method (current US$) ^Population below national poverty line*Unemployment rate (%)*Gini co-efficient (year of survey)^^HDI (Global Ranking)" | HDI (Country Index Score)”
1 646.43 | 9.001 55042.74.043.19 (2008)171 | 0.452
Lending Interest Rate^Mortgage Interest Rate (%) | Mortgage Term (years)#Credit % of GDP^Average Mortgages % of GDP° Price To Rent Ratio City Centre** | Outside City Centre**Gross Rental Yield City Centre** | Outside of City Centre**Outstanding home loan (% age 15+)##
...5.5 | 1520.33.........2.95
What is the cost of standard 50kg bag of cement (in US$)? #What is the price of the cheapest, newly built house by a formaldeveloper or contractor (in US$)? #What is the size of this house (in m2)? #What is the average rental price for a formal unit (in US$/month)#What is the minimum plot size for residential property (in m²)#
9.27
8 429 – 16 858...2 020 – 2 528400 – 500
Ease of doing business rank !Number of procedures to register property !Time (days) to register property !Cost (% of property value) to register property !
1476309.60
*** Conmill.com The Currency Converter^ World Bank's World Development Indicators (2014)~ World Bank PovcalNet: an online poverty analysis tool, various years^^ The World Bank's PovCalnet" UNDP's International Human Development Indicators (2014)° Various: Badev et al. "Housing Finance Across Countries: New Data and Analysis" – Unpublished
paper/Hofinet/World Bank## Global Financial Inclusion Database (FINDEX)# CAHF Annual Survey Data (September 2015)! World Bank's Doing Business Survey Data (2015)** Numbeo Online User-Contributed Database

70
In order to facilitate access to housing finance, and especially to translate presidentAlhasane Ouattara’s programme of constructing 60 000 houses, the governmenthas come up with a series of initiatives. Among these are the negotiation offavourable conditions with commercial banks to decrease interest rates on housingloans to 5.5 percent as opposed to 9.5 – 12 percent formerly; extending thereimbursement up to 25 years; effective application of the Social Fund for Housing,(Fonds de soutien de l’habitat, FSH) and the creation of a mutualist guarantee fundfor prospective homeowners (Fond de cautionnement mutuel pour tous lesdemandeurs de lodgements sociaux).
Access to financing is not only a challenge in Cote d’Ivoire, but for all UEMOAstates. In order to address this, a regional mortgage institution, the CaisseRegional de Refinancement Hypothecaire-UEMOA (CRRH-UEMOA), wascreated in July 2010, with headquarters in Lomé, Togo. The mission of the newinstitution is to promote easy access to long-term financing for its member banksto enable them to finance housing loans. The initial capital of the CRRH-UEMOAis CFA3 426 million (US$ 5.8 million), 60 percent of which belongs to financialinstitutions of the region, 15 percent to Shelter Afrique and 25 percent to theBanque Ouest Africaine de Developpement,BOAD. It is expected that CRRHactivities will reinforce the capacity of commercial banks, unleash constructionactivities and foster housing development. As expected, the institution is generatinginvestments, and employment opportunities as currently illustrated by the numberof members’ banks (46 shareholders), and has been successful in the regional stockexchange and the projects financed.
Providing decent, affordable housing has become a key legislative component ofthe government of Côte d’Ivoire, especially the need to strengthen the financingoptions for homebuyers and real estate developers. The government hasprioritised housing development through supporting housing projects. Thegovernment also provides a mortgage insurance product for mortgage loansprovided through banks.
The World Bank’s 2015 Doing Business Report ranks Côte d’Ivoire in 180th placeout of 189 countries; in terms of dealings with construction it takes 23 proceduresand 347 days, making it one of the highest in the region. Cote d’Ivoire hasimproved its score in registration of property from being ranked at 138 in 2014to 124 in 2015; the improvement is attributed to digitising its land registry systemand lowering the property registration tax. The cost of registration is 9.6 percentof property value, and is still above the average in the Sub-Saharan region (9.1 percent)and remains very high by world standard.
Affordability
The current National Development Plan (2012 – 2015) is focused on povertyalleviation. The goal is to decrease the incidence of poverty from 48.9 percent ofthe population in 2008 to 33.6 percent in 2013, and to 16 percent in 2015. In spiteof economic growth, poverty is rampant in the country as a result of the civil war,
especially in Abidjan where shanty houses, commonly called Bidonville, haveerupted to house the influx of immigrants from rural zones to the capital in questof opportunities. Even before the war there was a deficit of housing in Abidjan,and today the situation is worse. Affordable housing is a challenge to an averageIvoirian who earns less than CFA60 000 (US$101) a month, the minimum salarysince 2013. The minimum salary concerns only those people working for thegovernment and the formal private sector and they barely represent 18 percentof the labour force. The majority of the population works in the agricultural sectorand the informal sector; and live in shanty houses in areas such as Koumasi, wherethere is little to no urban infrastructure. Rent in slums is speculative and rangebetween CFA25 000 to CFA40 000 (US$42 to 67) for a room. Rent in thepopular residential zone (Cocody), where the majority of expatriates live,ranges from CFA1 200 000 to CFA1 500 000 (US$2 023 to 2 529) for a villa toCFA3 500 000 (US$5 900) for a very luxurious villa.
To alleviate poverty the government has increased the minimum salary fromCFA36 600 (US$ 61) to CFA60 000 (US$101) a month in November 2013.
To boost affordability, the government has a programme for building modulatedhomes costing CFA5 000 000 (US$8 429), LEM: Logements a equipementmodere, i.e. only the structure is built and the home owner provides the rest.
Other initiatives to boost affordability include the promotion of mortgage activitiesand a diversified housing development programme initiated by the government forall categories of the population that is the low, middle and high income Ivoirians.
Housing supply
The majority of houses in Cote d’Ivoire are self-built, but the government, throughits economic development policies, contributed significantly into housingdevelopment between 1970 and 1980, especially in the former capital city, Abidjan.SOGEPHIA and SICOGI are the two public companies in charge of housingdevelopment and property management. Between the two companies 24 254housing units were constructed in Youpoghon, 10 770 in Cocody and 6 938 inPort Bouet during those years. The houses are individual villas, duplexes and oneto two story buildings with apartments and studios; they have been built withadequate construction material and in well planned urban communities withamenities. SOGEPHIA and SICOGI produced housing in relatively mass scale, butother actors in the market include the informal enterprises that produce themajority of the stock of houses in the country. As from 1995 the governmentstopped subsidizing housing and this has contributed to an acute deficit in housing,even before the civil war. Due to the gap between supply and demand a lot ofshanty houses, have emerged in the cities, especially in Abidjan, and even inCocody – which is one of the prime areas in Côte d’Ivoire. .
The Côte d’Ivoire housing deficit is estimated to be over 600 000 units this year,with the need being most prevalent in cities. The government estimates the
> $50 000
$25 000 – $50 000
$14 000 – $25 000
$8 000 – $14 000
$5 000 – $8 000
$3 600 – $5 000
$2 400 – $3 600
$1 600 – $2 400
$800 – $1 600
<$800
- - - Average income needed for the cheapest newly built house by a formal developer, 2015
- - - Average annual urban household income, 2014
CÔTE D'IVOIRE
$8 863
$6 718
Rural | UrbanAnnual household income US$
No. of households (thousands) 300 200 100 0 100 200 300 400
Africa Housing Finance Yearbook 2015
71
annual housing deficit in the country to be over 100 000, and in Abidjan aloneto be 22 000. Housing supply in the capital is less than 3 000 a year and mostpeople are renters (75 percent of the population of Abidjan were renters in2014). Rental for a studio i.e. a minimum unit, range from CFA 100 000 to 150 000(US$169 – 253) in a middle income zone. The housing deficit is a source of rentspeculation and other consumers’ complaints. To protect the population, theministry in charge of housing (Le Ministère de la Construction, du lodgement, del’assinissementet de l’urbanisme) has introduced a code for urban properties, (Lecode du foncier urbain) which regulates rent and minimises rental guarantees andother rental miscellaneous funds.
Construction of decent affordable homes is one of the priorities of the currentgovernment and was among the electoral promises of President AlhassaneOuattara in 2010. However, out of the 50 000 affordable homes promised, onlya few have been supplied. In order to accelerate the process, the government ismobilising all stakeholders – 71 construction sites have been opened andconstruction is in an advanced stage; an additional 31 real estate developers wereofficially engaged in 2013 – with 46 overall in 2014, and each of them has a deliveryobligation of 3 000 homes per annum between 2014 and the end of 2015. Thisobligation is yet to be fulfilled. The government recognised the constraints inrespecting the schedule, among which are the difficulties in acquiring landthroughout the country, and especially in the capital, the difficulties in mobilisingfunds to compensate traditional owners and elaborating the feasibility studies.Other reasons are the underestimation of the cost of the cheapest housing unitat CFA5 million (US$ 8 429) and the slow pace of execution of contracts by localdevelopers. To accelerate delivery the government has had to change its approach byintroducing the construction of modulated homes for the CFA5 000 000 US$ 8 429.Other measures include the transferring of approved contracts from developerswho failed to respect the delay to developers who meet the obligation.
The government recognises the gap between supply and demand for homes andas such initiates multiple programmes including slum upgrading programmes forcities – a programme that was launched at the end of last year, the ‘PUIUR’(Programme d'Urgence d'Infrastructures Urbaines) financed by the World Bankand other incentive measures (financial and legal) to facilitate housing developmentoperations. The impact is illustrated by the number of construction sites in thecapital, and in other smaller cities, (72) the different types of housing unitsproposed (i.e. LEM, apartments, individual houses of different categories) and thenumbers of stakeholders involved, both local and foreign. Among the foreigndevelopers is Alliance Group, a Moroccan company, which will construct 14 000housing units in Abidjan, with 10 000 low income and 4 000 middle and highincome houses. African Business Development Incorporation, an Americancompany, to construct 3 000 units, ADOHA group, a Moroccan company willconstruct more than 9 000 apartments and among the local companies is LaSociete ivoirienne de construction et de gestion immobiliere (Sicogi) a publiccompany which will build 15 000 houses.
The government’s efforts in ameliorating the business environment and sourcingforeign investment to develop urban infrastructure and housing is paying off asillustrated by the number of stakeholders involved and the improvement of therank of Cote d’Ivoire in the World Banks Doing Business 2015.
Property markets
Residential property market data is difficult to come by but the various surveyscarried out by the ministry in charge of housing indicates a range of CFA 100 000to 150 000 (US$169 to 253) for a “studio” in Abidjan as the average rent for themiddle income population. There is a huge gap between rental depending on thegeographical situation of the property. According to a 2015 report by real estateconsultancy Frank Knight, rent ranges for a good villa at Coccody and zone 4, aprime location between CFA1.2 million and CFA1.5 million (US$2 023 to 2 529)and can be higher as CFA3.5 million (US$5 900) a month. Knight Frank goes onto report that demand for retail space is very high with prime rental rates ofUS$32 per m2 per month in Abidjan. According to local market information rentis very speculative in the low income areas, and the average prices range betweenCFA25 000 to CFA40 000 (US$42 to 67) for a room in a multi room building inpopular zones.
As for property prices, only government data is available and ranges betweenCFA5 million for the cheapest, CFA5 – 10 million (US$8 429) for economic,CFA10 – 15 million (US$16 858 – 25 287) for average middle class, CFA20 – 25 million(US$33 715 – 42 144) for middle class and over CFA25 million (US$42 144) forthe upper class. Although there is a land registry in place, it covers only a smallproportion of all property. This is mainly due to the conveyancing process,although a major reform was introduced by the ministry in charge and the costof registration has been reduced to 9.6 percent, which is still very high byinternational standard. It remains a lengthy process of 30 days which isunaffordable to the majority of the people.
The different government economic development programmes, the presidentialprogramme for affordable homes, improvement in the doing business environmentand the returning of the headquarters of African Development Bank to Abidjanwith a staff of over 500, are all already boosting the property market and growthis expected to continue.
Policy and regulation
Before 1998, and according to customary law, women in Côte d’Ivoire were notallowed to own land nor inherit it. Law No. 98-75, the rural land law, permitswomen to own land; however, this tends to be less so in rural areas where menare still the main beneficiaries of land. Although government agencies areresponsible for land registration a new law (N° 2013-481) was passed in July 2013called Arrêté de Consession Definitive (Adc), as the sole document for urban landregistration. According to the minister in charge of housing the new law is tofacilitate the process of land acquisition and protect the right to property.
The most recent municipal land regulation and building code was drawn up in1996. The minimum house size that can be built in Abidjan is 100m2 and themaximum height is four storeys; however, in some municipalities this can be more.
Côte d'Ivoire has improved the strength of its legal rights through amendmentsmade in 2012 to the OHADA Uniform Act on Secured Transactions; theseamendments broaden the range of assets that can be used as collateral (includingfuture assets), extend the security interest to the proceeds of the original asset andintroduce the possibility of out-of-court enforcement. Key laws relating to housinginclude:
n Law 62-253/31-7-62: Invest full authority in the ministry of housing for thedevelopment of the country’s urban planning.
n Law 2003-208 / 7-7-203: Modified law 62-253/31-7-62 and transfer theauthority from the central government to local authorities.
n Law 98-750 /23-12-98: Transfer customary land rights to private propertyrights regulated by the state
n law (N°2013-481) was passed in July 2013: Arrêté de Consession Definitive(Adc). The sole document for urban land registration. Facilitate the processof land acquisition and protect the right to property.
Opportunities
Côte d’Ivoire has come through a difficult period due to the post electoral conflictwhich has threatened national unity and undermined urban infrastructure includinghousing. The country’s progress since the election in 2011, however, has beenimpressive: with a stabilising governance framework, opportunities for investorsare promising. The economic recovery that began in 2012 was confirmed by the8 percent growth rate of the GDP in 2015 and expected to remain robust in2016 and 2017. Many projects are in the pipeline and others are beingimplemented, among which is an infrastructure project which aims to increaseaccess to, and improve the quality of, urban infrastructure facilities and services inAbidjan, Bouake and other selected cities. This project was launched by the WorldBank in 2010, with a total cost of US$50 million. The Emergency InfrastructureRenewal Project was approved in June 2012 and is still ongoing; this aims toimprove access to basic infrastructure in targeted urban and rural areas: i.e. Abidjan,Yamusokoro, Korgho, Bouake, Abengourou and Soubre. The total cost of thisproject is US$200 million with US$100 million already committed.
Cote d’Ivoire’s peaceful election of 2015, the ambitious National Development Plan,the reform in property registration, various government development programmesand the efforts of the government in improving business environments are

72
indicators of opportunities for the housing finance and housing developmentsectors.
The different economic and social reforms of Cote d’Ivoire have a positive effectin the business climate the results of which can be measured by the position ofthe country in the World Bank’s 2014 and 2015 Doing Business Report.
Sources
Annuaire des Banques et Etablissementt Financiers de l’UEMOA. BCEAO 2013. Annuaire des Banques et Etablissementt Financiers de l’UEMOA. BCEAO 2014.Annuaire des Banques et Etablissementt Financiers. BCEAO 2014.Bulletin Trimestriel de Statistiques 2014. BCEAO.Bulletin Trimestriel de Statistiques Deuxième Trimestre. BCEAO. Cote d’Ivoire : Profile d’Abidjan ONU-Habitat 2012.IMF (2012). Côte d’Ivoire – First Review under the Three-Year ArrangementUnder the Extended Credit Facility, Request for Modification of PerformanceCriteria, and Financing Assurances review. Press release. May 2012.Property Rights and Resource Governance. USAID Country Profile Cote d’IvoireReal Estate Markets in a Continent of Growth and opportunity, African Report2015, Knight Frank. World Bank, Doing Business Report 2015.
Websites
data.worldbank.org/http://globalhousingindicators.orgmixmarket.org/news.abidjan.netwww.afdb.orgwww.africaneconomicoutlook.orgwww.ambaciusa.orgwww.bceao.intwww.bhci.ciwww.cotedivoire-economie.comwww.doingbusiness.orgwww.internationalhealthpartnership.netwww.jeuneafrique.comwww.knigtfrank.comwww.linfodrome.comwww.mfw4a.org/www.ministere-construction.ciwww.news.abidjan.netwww.oxfordbusinessgroup.comwww.shelterafrique.org/www.tresor.economie.gouv.frwww.unacoopec.com/

Africa Housing Finance Yearbook 2015
73
Democratic Republic of Congo
The microfinance sector is rapidly growing but, remains undeveloped with aUS$222 million balance sheet in 2013. With over a million accounts opened;60 percent are savings and loan cooperatives. Between end-2009 and June 2013deposits and loans more than doubled to US$144 million in deposits and toUS$113 million in loans, a similar trend to that of banks.
Rawbank said that they received US$10.6 million from Shelter Afrique in March2015 to launch a real estate credit offer for DRC's emerging middle class.
Very few Congolese had an outstanding loan to purchase a home: 0.5 percent ofthe top 60 percent of income earners and 0.3 percent of the bottom 40 percentof income earners. Loans for home construction were slightly more prevalent,however, with 2.9 percent of the top 60 percent of income earners and 0.5 percentof the bottom 40 percent of income earners having home construction loanscurrently outstanding.
The economy has a score of zero on the Depth of Credit Information Index anda score of six on the Strength of Legal Rights Index. Higher scores indicate morecredit information and stronger legal rights for borrowers and lenders. Globally,DRC stands at 131 in the ranking of 189 economies on the ease of getting credit.
Overview
The Democratic Republic of Congo, with 2 344 858 km2, and more than 70 millioninhabitants, is a fragile economy that is re-emerging from years of conflict andinstability. Strong economic and social challenges remain, with over 63 percent ofthe population living in poverty, unemployment rates exceeding 45 percent andweak public institutions.
The economy is in positive trend. Mining sector activities are the driving force forgrowth, with public sector investment, agriculture, and manufacturing broadeningthe economic base. Inflation has declined significantly. Highly dollarised economy,where almost all prices are indexed to the dollar.
Access to finance
The Congolese financial sector is made up of 18 licensed banks; a state insurancecompany (SONAs) and the National Social Security Institute (INSS); 5 specializedinstitutions; 143 MFIs and cooperatives; 59 transfer institutions; 3 electronic moneyinstitutions, and 16 forex exchange bureaus; all operating under the control of thecentral Bank (BCC). There is neither a stock market nor a debt capital market.
Total bank assets, estimated at US$3.6 billion in 2013 (95 percent of financialsystem). Banks’ funding is dominated by deposit collection. Credit has beenincreasing fast but remains scarce, expensive, short-term, and highly concentrated.Between 2006 and 2013, domestic credit tripled but rose only to around 11 percentof GDP. In 2011, only 2 percent of adults had obtained a bank loan and only4 percent of adults held an account at a formal financial institution. In 2012, short-term credit represented 68 percent of all credit, and medium-term creditrepresented about 21 percent, an increase in the share from 16 percent.
Banks’ profitability and earnings are weak and deteriorating, reflecting highoperational and foreign exchange costs. Fees are a main source of banks’ revenue.Operating in U.S. dollars is highly costly, especially for some banks, given foreigncurrency settlements are done via correspondents.
The sole public non-life insurance company, SONAS, and the INSS are both inprecarious financial situations.
KEY FIGURES
Main Urban Centres Kinshasa
Exchange Rate: 1 US$***Inflation 2013 | 2014 (est.) | 2015 (prov.) | 2016 (prov.) *
913.38 Franc Congolaise (CDF)0.8 | 1.2 | 1.8 | 4.7
Population^ | Population growth rate (2013)^Urban population (% of total)^ | Urbanisation rate (% in 2013)^
69 360 118 | 2.7041.98 | 3.93
GDP / capita (current US$)^ | GDP growth rate (annual %)^GNI / capita, Atlas method (current US$) ^Population below national poverty line*Unemployment rate (%)*Gini co-efficient (year of survey)^^HDI (Global Ranking)" | HDI (Country Index Score)”
475.23 | 9.0541071.340#~44.43 (2005)186 | 0.304^#
Lending Interest Rate^Mortgage Interest Rate (%) | Mortgage Term (years)#Credit % of GDP^Average Mortgages % of GDP° Price To Rent Ratio City Centre** | Outside City Centre**Gross Rental Yield City Centre** | Outside of City Centre**Outstanding home loan (% age 15+)##
18.6916.00 | 36.2315%"'16.17** | …6.18+ | …2.74
What is the cost of standard 50kg bag of cement (in US$)? #What is the price of the cheapest, newly built house by a formaldeveloper or contractor (in US$)? #What is the size of this house (in m2)? #What is the average rental price for a formal unit (in US$/month)#What is the minimum plot size for residential property (in m²)#
23.40
25 00075 – 90500200 – 250
Ease of doing business rank !Number of procedures to register property !Time (days) to register property !Cost (% of property value) to register property !
1843!!!21!!!6.00!!!
*** Conmill.com The Currency Converter^ World Bank's World Development Indicators (2014)~ World Bank PovcalNet: an online poverty analysis tool, various years^^ The World Bank's PovCalnet" UNDP's International Human Development Indicators (2014)° Various: Badev et al. "Housing Finance Across Countries: New Data and Analysis" – Unpublished
paper/Hofinet/World Bank## Global Financial Inclusion Database (FINDEX)# CAHF Annual Survey Data (September 2015)! World Bank's Doing Business Survey Data (2015)** Numbeo Online User-Contributed Database^# UNDP 2014!!! DRC Department of Land Affairs+ global property guide#~ radiiookapi.net 2015

74
Affordability
Since 2012, the DRC held the last place (186th) in the UN Human DevelopmentIndex. Poverty is pervasive, and despite the significance of agriculture to the DRC’seconomy, three-quarters of the population do not have enough to eat. AfricanEconomic Outlook reports that the country will not achieve its MillenniumDevelopment Goals by the 2015 deadline. Access to the labour market isconstrained for a number of reasons, and has been made worse by the politicaland social instability of the past years. 40 percent of the Congolese population isunemployed. Two-thirds of the population live below the international poverty lineof US$2 a day.
In the DRC, about 70 percent of household expenditure goes towards food whilein most Sub-Saharan African countries food consumption accounts forapproximately 50 percent, according to the UN-Habitat HDI. On the quality andsafety category, DRC has been ranked at the bottom for lack of even basic nationalnutritional guidelines.
Most banks in the DRC do not provide financing for low income earners, cateringprimarily for the middle and high income earning population. Even so, long-termcapital is scarce, and most housing is financed through an instalment salearrangement facilitated by the developer. Typical is a 50 percent upfront payment,with the remaining debt paid in instalments over 24 months from the date ofdelivery at a mortgage interest rate of 16 percent. A deposit of between US$10 –$1 000 is required to open an account with some banks. Commercial banks’general lending rates are high (at an estimated 16 percent for the year 2015) whilemicrofinance institutions’ lending rates are significantly higher (at an estimated54 percent a year for the same period). This means that the great majority of thepopulation cannot afford to access finance.
The construction and public works sector grew by 13 percent in 2012, contributing6.3 percent to GDP growth in that year. This was achieved despite a 17.7 percentdecrease in cement production; cement production has however increased in2014. The supply of cement in the DRC has never been sufficient and much isimported. To support the construction sector, government has lifted taxes oncement imports. This resulted in the decline in the price of imported cementwhile the price of cement produced locally was still high. Despite taxes beinglifted, cement prices are still high.
Housing supply
The majority of housing in the DRC is developed by households themselves.Population growth and socio-economic development over the last 30 years led torapid development of cities and resulted in strong demand relative to supply.According to UN-Habitat (2012), "the DRC is characterised by a large housingdeficit, which is estimated at 3 million homes. The planned districts represent22.9 percent, while self-built districts represent 77.1 percent."
Formal, affordable housing supply is extremely limited as there are very fewdevelopers, and when it is supplied it is limited to the minority elites. As is the caseacross the continent, the majority use locally sourced materials to build houses forthemselves.
There are some private sector developments underway, spurred on primarily bythe growth in mining areas. In 2009, a Chinese company, China Machinery andEquipment Import and Export Corporation, announced a plan to build 2.5 millionsocial houses. The project was expected to start in 2015, but there’s a delay. Theproject will be undertaken in four phases and is expected to be affordable to allincome levels.
It was reported that an Italian company, Schnell House, was planning an affordablehousing project in the province of North Kivu, using a building technology that cutthe cost of construction by 30 – 40 percent. This project is still in the planningphase as it is awaiting financing.
In 2011, the DRC government launched the project “Kin-Oasis” which allowedthe building of 1 000 social houses in Kinshasa by the Chinese company ZhenGwei Technique Congo (STZC). This project is currently underway.
In 2012, a catholic NGO “Action pour la Solidarité et le Développement(ASODEV)” announced a plan to build 3 080 social houses in Kinshasa, this is alsocurrently underway. The project “UnToit pour Tous” started effectively in 2012 andis expected to be completed in 2016. House prices will vary between US$28 000and US$80 000 payable in 15 years and consisting of 3 000 units.
An ambitious, 400-hectare development in Kinshasa, La Cite du Fleuve, involves thereclamation of land in the Congo River, creating a new island. In making new land,the development gets around the challenge of contested title deeds, a commonproblem in the DRC. Marketed as a lifestyle development with public space, andsocial and economic amenities, the development is being undertaken byHarkwood Properties, a specialist fund manager. Harkwood’s majority shareholder,Mukwa Investment, is an African specialised investment fund based in Lusaka,Zambia run by a group of international managers. From August 2013, the projectwhich is now completed has already offered 18 150m2 apartments for sale, at aprice of US$195 000 each.
The "Maison au prix d’une voiture" project is being launched in January 2016which is a partnership between Baeef Architecture and MOLADI SA. This projectaims to build social housing and low cost housing throughout the extent of theDRC. The project consists of 4 bedroom units with a garage on a land size of300m2. The house sizes average 117m2 and costs US$45 000.
> $50 000
$25 000 – $50 000
$14 000 – $25 000
$8 000 – $14 000
$5 000 – $8 000
$3 600 – $5 000
$2 400 – $3 600
$1 600 – $2 400
$800 – $1 600
<$800
- - - Average income needed for the cheapest newly built house by a formal developer, 2015
- - - Average annual urban household income, 2014
DEMOCRATIC REPUBLIC OF CONGO
$35 621
$2 551
Rural | UrbanAnnual household income US$
No. of households (thousands) 5000 4000 3000 2000 1000 0 1000 2000
Africa Housing Finance Yearbook 2015
75
Property markets
Property prices are high and generally aimed at the high end of the market.According to Knight Frank, in 2014 the industrial property market surpassed theretail property market in prime yields compared to 2012 figures. The industrialproperty yields made up 14 percent at US$8 per m2 a month, followed by retail,which made up 12 percent at US$40 per m2 a month and office space at 11 percentwith a prime rate of US$35 per m2 a month. The residential market yields wereat nine percent, down from 10 percent in 2012, with rentals of US$8 000 a monthfor a four-bedroom executive house in a prime area.
Dealing with construction permits requires 8 procedures, takes 119 days and costs11.6 percent of the property value. Globally, DRC stands at 111 in the ranking of189 economies on the ease of dealing with construction permits.
Beyond the limited, high-end market, a clash between statutory and customaryland laws undermines property developments and achieving legal title. Landadministration systems are lacking. As a result, where land titling does exist, theprice is high (US$800 to US$1 000 per hectare). In Kinshasa, land values are evenhigher – an estimated US$100 000 per hectare in well-serviced residential areas.
Policy and regulation
Historically, the DRC’s banking system has struggled with financial andorganisational imbalances – however there are solutions in place that the centralbank is working towards. Since President Joseph Kabila came to power, the centralbank has been restructured as an independent body, setting interest rates andimplementing the country’s monetary policy to ensure that the price level isstabilised and performing all central banking tasks. A special ministry created in2000 is dedicated to microfinance, which was seen as being important for post-conflict reconstruction. Progress has been made to strengthen the legalframework for the financial sector such as monetary improvement, financial sectorimprovement and central bank restructuring. In 2002, the government passednew laws on the central bank’s independence and to improve its role as regulatoryand supervisory authority.
To facilitate mass banking and the establishment of a sound financial systeminclusion, the Central Bank also defined a specific legal framework for microfinance.This Act 11/020 of 15 September 2011 lay down rules relating to the activity ofmicrofinance.
The government's housing policy is based on four main areas: (1) Thereorganisation of the housing sector (institutional reform and capacity building); (2)Improved habitat (land development policy and supervision of real estate); (3)Resource mobilisation for housing (funding); and (4) The reversal of urban povertyareas (emergency action).
The legal basis governing urban planning and its code is still the Royal Decree of20 June 1957, supplemented by Order # 013CAB / MIN.URB HAB / 2005 of 6May 2005 amending Order # CAB / CE / URB-HAB / 012/88 of 22 October1988 regulating the issuance of the authorisation to build.
Opportunities
The DRC has many rich sources of natural minerals, and mining attracts manyinternational companies. Mining remains one of the biggest areas of economicactivity. In 2009 the biggest deal in Africa was made between the DRC and China,in which China agreed to invest US$9 billion in extensive construction and otherrehabilitation projects over a period of approximately10 years in return for miningand timber concessions. In addition to Kinshasa, important cities offeringopportunities include the mining centre of Lubumbashi, Matadi (on the banks ofthe Congo River), and the eastern city of Goma. New roads and transportinitiatives in Kinshasa are making access easier. The affordable housing sector is stillrelatively undeveloped and offers significant potential for growth.
The DRC has several opportunities in the real estate industry including a largepopulation which is a potential market and the availability of several sites aroundthe country that can accommodate the construction of houses. The governmenthas also put in place customs and tax benefits to real estate projects approvedunder the Investment Code (including import duty-gear, equipment, hardware andbuilding materials, exemption from land tax and income tax).
Sources
Demirguc-Kunt, A. and Klapper, L. (2012). Measuring Financial Inclusion: TheGlobalFindex. World Bank Policy Research WP 6025.Knight Frank (2013). Africa Report 2013.UNDP (2011). Human Development Report 2011. World Bank (2012). Doing Business Indicators 2013.Central Bank of Congo, Annual Report (2012).Microfinance activity report DRC, 2012.Financial services consumers protection survey in the DRC, Central Bank 2013.Central Bank of Congo, Monetary policy report DRC, first semester 2014.
Websites
www.africaneconomicoutlook.orghttp://allafrica.comwww.coinmill.comwww.oecd.orgwwp.greenwichmeantime.comwww.howwemadeitinafrica.comwww.mixmarket.orgwww.mfw4a.orgwww.procredit-holding.comwww.state.govwww.investindrc.cdwww.urbanisme-habitat-rdc.comwww.thinkm-pesa.comwww.unchr.orghttp://realestate.ipe.com

76

Africa Housing Finance Yearbook 2015
77
Djibouti
Rouge (BCIMR) and Banque Indosuez Mer Rouge (BIMR). These two institutionsstill account for around 85 percent of the country's total assets.
In recent years, the Central Bank of Djibouti has taken a number of actions aimedat expanding access to finance. The most significant of these has been the openingof the banking sector to new participants, raising the number of banks from twoto 11 by the end of 2013 and 17 non-bank financial institutions. Other policymeasures include introducing a new requirement in 2009 where all salaries ofgovernment employees earning over DJF 40 000 per month (US$225) must betransferred into a bank account. More recently, there have been efforts tostimulate the microfinance sector, develop a central credit register, facilitate mobilebanking transactions as well as assistance from the IMF to develop bankingsupervision and regulations, including anti-money laundering rules, better disclosureand capital adequacy requirements.
Systemic risks are considered low, with banks generally being very liquid. The levelof non-performing loans has been high, reaching a peak of 13 percent in 2013,against 11.4 percent in 2012 and 9.4 percent in 2011. However, most householdsface serious constraints accessing finance due to onerous requirements in termsof collateral, high interest rates, and difficulties to save the down-payment.
Housing finance is still not well developed. Long-term housing loans (up to 15years) are now being offered, but are still rare, as are medium-term loans. Interestrates range from 7 – 15 percent for housing loans. Loan applications can take
Overview
Djibouti is a small city-state with less than one million inhabitants, located on thehorn of Africa, between Somalia, Eritrea and landlocked Ethiopia. The country isalmost 80 percent urbanised, with most of the urban population living in Djibouti-ville, which has a population of 520 000. The country gained independence fromFrance in 1977 and has recently welcomed a series of new opportunities, drivenby Ethiopia's strong growth and its strategic geographic position for trade andmilitary activity in the region. This growth is contributing to a development offinancial services in the country, including housing finance, and increasing demandfor quality and affordable housing.
Djibouti's economy is dominated by tertiary sectors related to trading, financial andbusiness services, which accounted for over 75 percent of GDP in 2014. In 2013and 2014, driven by an increase in port activity and foreign direct investment,Djibouti’s economy grew by 5.9 percent, with inflation dropping to 3.6 percent in2014, and projected to fall even further, to 3.0 percent in 2015. The country actsas the major port and rail entrance to Ethiopia, which has largely been a positiverelationship for both countries, despite minor tensions occasionally over costs andtaxation. Meanwhile, Djibouti has also become the focal point for military activitiesin East Africa and the Arabian peninsula, hosting the United States' only permanentmilitary base in Sub-Saharan Africa, the Africa Command (AFRICOM) at CampLemonnier.
Despite consistent growth, there has been little spillover to political reform orsocial development for poor Djiboutians. Politics is still heavily personalised andpatronage-based. Civil servants constitute a small urban elite, who are relativelywell-educated and well-paid. The rest of the population live in extreme poverty,estimated at 23 percent of the population. There are also high levels of informalityand unemployment, last estimated at 60 percent in 2012. Over two-thirds ofDjiboutians are plagued by food insecurity, and poor living conditions, as the pricefor electricity, imported food and other goods, remains relatively high.
Access to finance
The volume of credit to GDP has increased to 31 percent in 2014, yet Djiboutiremains a country with one of the lowest levels of financial intermediation andbanking penetration on the continent. Until 2006, there were only two activefinancial institutions in the market, Banque pour le Commerce et l'Industrie – Mer
KEY FIGURES
Main Urban Centres Djibouti-ville
Exchange Rate: 1 US$***Inflation 2013 | 2014 (est.) | 2015 (prov.) | 2016 (prov.) *
177.18 Djiboutian Franc (DJF)2.4 | 3.6 | 3.0 | 3.2
Population^ | Population growth rate (2013)^Urban population (% of total)^ | Urbanisation rate (% in 2013)^
886 313 | 1.5277.26 | 1.62
GDP / capita (current US$)^ | GDP growth rate (annual %)^GNI / capita, Atlas method (current US$) ^Population below national poverty line*Unemployment rate (%)*Gini co-efficient (year of survey)^^HDI (Global Ranking)" | HDI (Country Index Score)”
1 784.38 | 5.501 030 (2005)18.8% (2012 est.)/48.045.13 (2012)170 | 0.467
Lending Interest Rate^Mortgage Interest Rate (%) | Mortgage Term (years)#Credit % of GDP^Average Mortgages % of GDP° Price To Rent Ratio City Centre** | Outside City Centre**Gross Rental Yield City Centre** | Outside of City Centre**Outstanding home loan (% age 15+)##
12.699.50 | 1531.08<1%.........
What is the cost of standard 50kg bag of cement (in US$)? #What is the price of the cheapest, newly built house by a formaldeveloper or contractor (in US$)? #What is the size of this house (in m2)? #What is the average rental price for a formal unit (in US$/month)#What is the minimum plot size for residential property (in m²)#
12.00
30 00060...60
Ease of doing business rank !Number of procedures to register property !Time (days) to register property !Cost (% of property value) to register property !
15563912.80
*** Conmill.com The Currency Converter^ World Bank's World Development Indicators (2014)~ World Bank PovcalNet: an online poverty analysis tool, various years^^ The World Bank's PovCalnet" UNDP's International Human Development Indicators (2014)° Various: Badev et al. "Housing Finance Across Countries: New Data and Analysis" – Unpublished
paper/Hofinet/World Bank## Global Financial Inclusion Database (FINDEX)# CAHF Annual Survey Data (September 2015)! World Bank's Doing Business Survey Data (2015)** Numbeo Online User-Contributed Database/ CIA World Factbook

78
months to process, due to the lack of complete information, automated processingand systemized scoring techniques. This results in loan decisions that are manual,often presided over by a board, and which can be discriminatory. In January 2014,Djibouti announced its intention to set up a housing bank to facilitate homeownership, yet no further public announcements on this bank have been made.
Obtaining credit in Djibouti in general is difficult. Djibouti is ranked 180th globallyin this section of the 2015 Doing Business report. Strength of legal rights anddepth of credit information were ranked lower than in 2014, at a score of one andzero, respectively, out of 10. In 2015, a public registry covered only 0.3 percent ofadults and there were still no private bureaus. Currently the Central Bank ofDjibouti is evaluating strategies to improve credit reporting in the country, in orderto allow banks to improve their credit assessments of potential customers andthe underwriting of housing finance loans.
The emergence of microfinance and of Islamic Banking, which are both regulatedand supervised by the Central Bank, has been another avenue to increase theaccess to finance. Key institutions Saba Bank and Salaam Bank have been offeringsharia-compliant housing finance products (e.g. mudarabah, musharaka and ijara orleasing options) and welcoming strong growth since their entrance in 2006.Microfinance has received a lot of attention, with the Prime Minister chairingmeetings of microfinance providers in Djibouti and making significant investmentsthrough the National Solidarity Fund (NSF) in the development of microfinance.There are two saving and loans cooperative institutions currently operating inDjibouti, CNEC (Caisse Nationale d'Epargne et de Crédit de Djibouti) and CPEC(Caisse Populaire d'Epargne et de Crédit) with loans available from DJF 30 000 –100 000 (US$170 – US$560) at around 2 percent interest per month and amaximum tenure of 18 months.
Affordability
Housing affordability is a major challenge, in a country where the cost ofconstruction is high as many materials need to be imported, income is low, andthere is very little access to credit. Prices to rent a three bedroom villa in the citycentre can range from US$840 – US$1 270 per month, which is reasonable ininternational terms but far beyond the capacity of the vast majority of Djiboutians.Housing is generally only affordable to the small elite that have permanentemployment as civil servants or small number of entrepreneurs who benefit fromthe foreign trade.
Poverty is widespread and has remained high. In 2012, those living below thenational poverty line was estimated at almost 60 percent. Meanwhile, thosepeople in extreme poverty was reported at over 40 percent of the population.Poverty, mixed with the high unemployment rate, as high as 70 percent amongyouth, results in very low purchasing power for most Djiboutans to afford housing,even while inflation has reduced in 2015.
Beyond accessibility to land and services, construction costs for housing are highbecause of the reliance on imported materials. This is estimated at six times theaverage annual income of households for permanent dwellings and 2.5 times forthose homes built with lightweight materials, such a plywood and corrugated iron.
Housing supply
Demand for new housing is estimated at 2 500 – 3 500 units per year. Eventhough the rate of urban growth is expected to have slowed in the past year, from1.64 percent in 2013, demand for housing is still high due to the high rate ofeconomic growth at almost 6 percent and existing deficit. Only around a third ofhousing needs are met by the existing stock, with 34 percent of housing in Djibouticlassified as permanent and supply is very limited.
The vast majority of new housing supply is in poor condition and have informaltitle. It is estimated that the informal housing stock increased by 2 400 units peryear over the decade to 2014. Quality of housing and poverty are very closelyinterrelated. In a pocket of Balbala, one of the older neighbourhoods of Djibouti-ville where extreme poverty is concentrated, over 85 percent of housing is madeof corrugated steel, wooden planks, or metal panels retrieved from various sources.
Most construction is unregulated. On average, approximately 200 building permitsare processed per year, which is less than 10 percent of the total estimatedconstruction. The process to obtain permits is cumbersome and expensive. In2015, a construction permit would take 117 days, 18 procedures and cost 7.4 percentof the property's value.
From 2003, the government has been spending between two and three percentof the national budget on housing, or around US$15 million annually, via theNational Housing Fund. In 2015, the budget was increased to 3.6 billion DjiboutianFrancs or about US$20.3 million for low income housing activities, including publicland acquisition, construction of several subsidised housing estates and new urbandevelopment projects, including the subdivision and servicing of 100 hectares ofland. Supply of subsidised housing is predominantly in the form of landsubdivisions in site and service projects, as well as public rental or lease-to-ownunits for middle and low income households provided by the Real Estate Companyof Djibouti (SID). Households must not have previously owned land and areselected based on income, household size and a lottery basis.
Over the past decade, the public real estate developer, Société Immobilière deDjibouti (SID), has built nearly 2 000 social and affordable units with the assistanceof the National Housing Fund, most notably in the district of Hodane. However,there has been frustration over delays in delivery and the quality of the units builtby SID. Households must pay rent for 10 to 15 years and provide a 10 percentdown-payment on a house valued at about US$30 000 to SID before gettingownership. SID has not been too successful in recovering costs from consumers,yet there is continued government interest in turn-key housing development projects.
> $50 000
$25 000 – $50 000
$14 000 – $25 000
$8 000 – $14 000
$5 000 – $8 000
$3 600 – $5 000
$2 400 – $3 600
$1 600 – $2 400
$800 – $1 600
<$800
- - - Average income needed for the cheapest newly built house by a formal developer, 2013
- - - Average annual urban household income, 2014
DJIBOUTI
$12 621
$9 351
Rural | UrbanAnnual household income US$
No. of households (thousands) 10 5 0 5 10 15 20 25 30 35
Africa Housing Finance Yearbook 2015
79
There are plans for the further construction of 4 000 units, with DJF 5.4 billion(US$30.5 million) being provided by the Saudi Fund for Development.
New supply is built rapidly and in an uncontrolled manner, particularly on the peri-urban areas of Djibouti-ville, with very low access to basic urban services. Thesezones, built without planning, have scant access to safe drinking water, sanitation,transportation, and often uncertain land tenure status. In the past, the governmenthas also undertaken sites and services projects, such as the housing pilot inBarwaqo for guided incremental building. Government figures estimate than morethan 6 000 plots have been serviced since 2000.
Recent investment by the government in real estate has seen the emergence ofhousing estates and new urban development projects (Cité du Stade, Cité duProgrès, Quartier 7 Sud, Poudrière, Einguela, Gabode 3 etc.) targeted at the middleclass. In these areas poverty levels are less than 25 percent and extreme povertyis below 10 percent, much lower than the national averages.
Property markets
For years the property market has been essentially stagnant. The Central Bankreported in 2012, that the average house price had decreased by 28 percent since2008, yet an increase in demand and economic activity in the past years hasresulted in a turn-around, with a rapid increase in prices again. New opportunitiesin Djibouti brought about by the extension of the port, military base and anelectricity connection project with Ethiopia, has attracted a growing interest in theproperty market from foreigners, beyond the government's own investment. Theconstruction sector accounted for 12.9 percent of GDP in 2013, making it animportant part of Djibouti's economy.
Proximity to the Arabian Gulf has also has been a factor in investor interest.Various investors from Gulf countries have explored large-scale developmentprojects in partnership with the government, some of which included socialhousing. However, many of these projects have not ended up going ahead or havefaced delays, due to difficulties in structuring transactions and finalising deals.
Even with these initiatives, there remains an extreme shortage of constructionmaterials, skilled labor, and equipment in the local area, which is limiting progress.Bureaucracy has continued to remain difficult in 2015, with registering of propertyrequiring 6 procedures, 39 days, at a cost of 12.8 percent of the property’s value.Possession of formal land title is also a constraint. Only an estimated 30 percentof urban households in Djibouti-ville have land title and around 25 percent havePermits of Provisional Occupation, which is a permit that allows temporaryresidence on informally-squatted state land.
Policy and regulation
In 2011, the Ministry of Housing was created with the guideline "a decent housefor each Djiboutian”. In 2015, several projects were planned to support this goal,including the subdivision and servicing of 100 hectares of land, the construction of2 500 social housing units for low and middle income families and 500 units forgovernment staff. These projects are located in several peripheral and new sub-division areas of the capital, including PK 12, the Barwaqo II and Balbalaneighbourhoods.
Housing continued to gain a lot of political attention in the past years, as it isconsidered an effective means to reduce poverty and improve living conditions ofthe population. The government is working in collaboration with the World Bankto carry out comprehensive diagnostics of the housing sector in order to preparea national housing strategy. This initiative has been driven by the Ministry ofHousing, Spatial Planning and the Environment and involved a series of workshopsheld in September 2014 on land management, housing delivery channels, housingfinance, as well as spatial development and access to services to provide input intothe formulation of the strategy. In addition, the Saudi Fund for Development areproviding funds to support construction of 1 000 units of social housing, as partof the government’s larger program. Some of governments policies include;
n Decent housing for all Djiboutians: This policy highlights the importance ofhousing in national development and puts responsibility on government toensure that policies and laws are formulated that support the goal of accessto adequate housing for all Djiboutians.
n Slum improvement strategies: The government works with InternationalFinancing Institutions (the World Bank, African Development Bank and FrenchDevelopment Agency) in the delivery of services and the in-situ improvementof existing slum neighbourhoods in Djibouti-ville.
n Public Rental and Lease-to-Own Housing: This programme is executed bythe national real estate company (SID) and targeted at middle-incomehouseholds. Houses are sold at approximately $30,000, which require adown-payment of 10 percent and repayments over 15 years. The objectiveis to increase the supply of housing, where units are built in 2 – 4 storey walk-ups in new subdivisions of Djibouti-ville.
n Site and Service Program: In August 2015, the government announced thelaunch of a programme for Assisted Self-Construction of units aimed at thepoorest households. Here, the government will provide serviced plots of100 – 120m2 and provide technical assistance and construction support tohouseholds to construct units. Monthly payments for any services ormaterials would not exceed DJF 5 000 – 7 000 (US$28 – 40) and a maximumterm of 20 years.
Other policy priorities include better management of urban development andimproving basic services in the city. A number of actions have been taken, includingthe reorganisation of the Ministry of Housing, Urban Planning and TerritorialDevelopment, and the preparation of a master plan for urban planning andimprovement of Djibouti City.
Opportunities
Nestled between Yemen, Somalia and key shipping routes in the Red Sea and Gulfof Aden, Djibouti has a strong geo-political position and has a lot more potentialto capitalise on its location.
The rehabilitation of the 752 km Djibouti-Ethiopian Railway linking the two capitalswas completed in June 2014. An expansion of the Doraleh Port, is expected toquadruple revenues and significantly benefit Djibouti’s economy. In 2015, thecapacity increased from 160 000 containers in 2004 to 830 000 containers.Djibouti also hosts the largest American permanent military base in Africa, CampLemonnier. In May 2014, the US signed a new 20-year lease to serve 4 000American service members and civilians, and announced a US$1 billionprogramme for expansion and upgrades. The lease fees are rumoured to havedoubled from US$30 million to US$63 million per year, with an additionalUS$7 million per year committed to development aid.
In 2014, FDI was a record US$286 million, which accounted for almost 20 percentof gross domestic product (GDP), boosted by a vast ongoing investmentprogramme, especially for infrastructure. The US$6 billion programme includesbuilding new ports, railways and roads, an aqueduct, a desalination plant andhousing, and is funded by Chinese investors and the international aid community.
The programme is a big turning point for Djibouti, whose leaders want to makethe country a regional hub for trade, handling and financial services. Majorinvestment is planned to strengthen the country’s comparative advantage in goodstrading. The government has been trying in recent years to reduce the structuralobstacles to adequate electricity and water supply that handicap growth of theprivate sector, and raised funding in 2013 for several projects which aim to improvesupplies.
The tourism sector is also seen as very promising in terms of real estate anddevelopment of the housing sector. Djibouti currently welcomes only 50 000tourists a year and most are business travellers visiting because of the presence offoreign military bases. According to reports, this number could be increasedtenfold if investments in developing adequate tourism infrastructure and servicesare made.
80
Sources
African Development Bank. (2011). Country Strategy Paper: 2011-2015.African Economic Outlook. (2014).DjibTalk. (2012). Un toit pour tous.International Monetary Fund. (2012). Djibouti: Poverty Reduction StrategyPaper – Annual Progress Report.Styan, David. (2013). Djibouti: Changing Influence in the Horn's Strategic Hub.Chatham House : Briefing Paper. World Bank (2013). Finding New Paths of Growth for Djibouti.World Bank Group. (2014). Doing Business.
Websites
www.africaneconomicoutlook.comwww.comesaria.orgwww.banque-centrale.djwww.djiboutiinvest.comwww.presidence.djwww.mfw4a.org
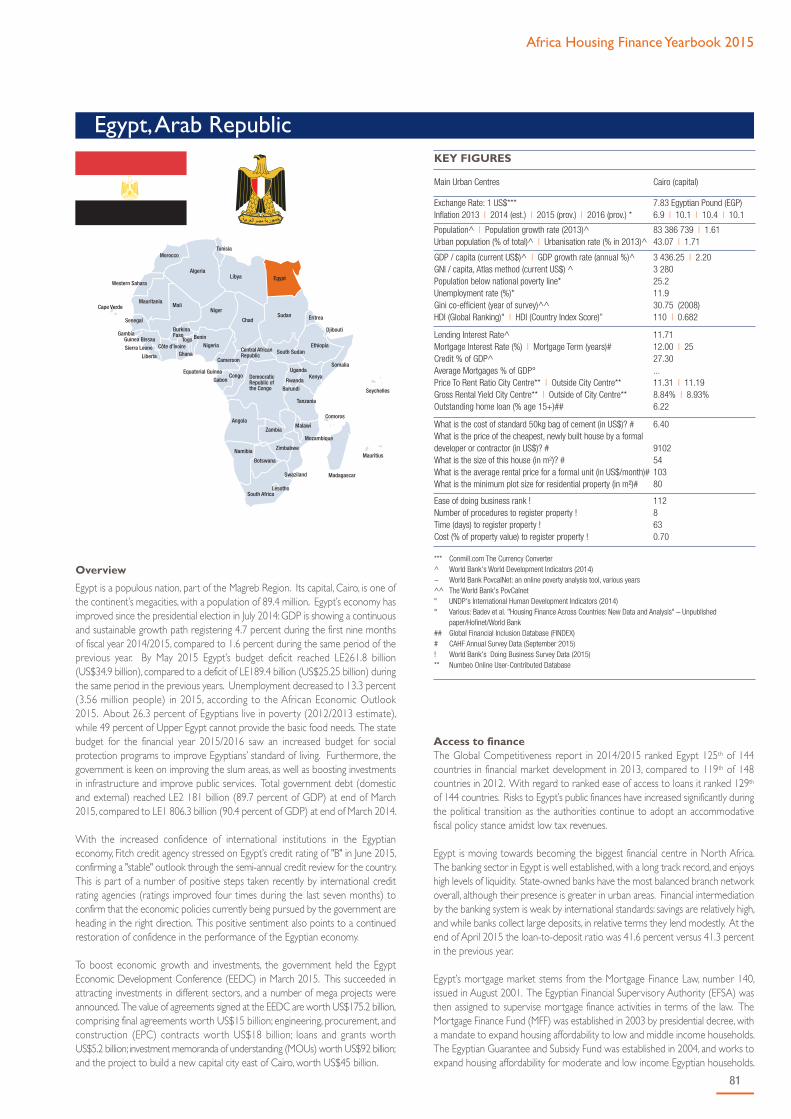
Africa Housing Finance Yearbook 2015
81
Egypt, Arab Republic
Access to financeThe Global Competitiveness report in 2014/2015 ranked Egypt 125th of 144countries in financial market development in 2013, compared to 119th of 148countries in 2012. With regard to ranked ease of access to loans it ranked 129th
of 144 countries. Risks to Egypt’s public finances have increased significantly duringthe political transition as the authorities continue to adopt an accommodativefiscal policy stance amidst low tax revenues.
Egypt is moving towards becoming the biggest financial centre in North Africa.The banking sector in Egypt is well established, with a long track record, and enjoyshigh levels of liquidity. State-owned banks have the most balanced branch networkoverall, although their presence is greater in urban areas. Financial intermediationby the banking system is weak by international standards: savings are relatively high,and while banks collect large deposits, in relative terms they lend modestly. At theend of April 2015 the loan-to-deposit ratio was 41.6 percent versus 41.3 percentin the previous year.
Egypt’s mortgage market stems from the Mortgage Finance Law, number 140,issued in August 2001. The Egyptian Financial Supervisory Authority (EFSA) wasthen assigned to supervise mortgage finance activities in terms of the law. TheMortgage Finance Fund (MFF) was established in 2003 by presidential decree, witha mandate to expand housing affordability to low and middle income households.The Egyptian Guarantee and Subsidy Fund was established in 2004, and works toexpand housing affordability for moderate and low income Egyptian households.
Overview
Egypt is a populous nation, part of the Magreb Region. Its capital, Cairo, is one ofthe continent’s megacities, with a population of 89.4 million. Egypt’s economy hasimproved since the presidential election in July 2014: GDP is showing a continuousand sustainable growth path registering 4.7 percent during the first nine monthsof fiscal year 2014/2015, compared to 1.6 percent during the same period of theprevious year. By May 2015 Egypt’s budget deficit reached LE261.8 billion(US$34.9 billion), compared to a deficit of LE189.4 billion (US$25.25 billion) duringthe same period in the previous years. Unemployment decreased to 13.3 percent(3.56 million people) in 2015, according to the African Economic Outlook2015. About 26.3 percent of Egyptians live in poverty (2012/2013 estimate),while 49 percent of Upper Egypt cannot provide the basic food needs. The statebudget for the financial year 2015/2016 saw an increased budget for socialprotection programs to improve Egyptians’ standard of living. Furthermore, thegovernment is keen on improving the slum areas, as well as boosting investmentsin infrastructure and improve public services. Total government debt (domesticand external) reached LE2 181 billion (89.7 percent of GDP) at end of March2015, compared to LE1 806.3 billion (90.4 percent of GDP) at end of March 2014.
With the increased confidence of international institutions in the Egyptianeconomy, Fitch credit agency stressed on Egypt’s credit rating of "B" in June 2015,confirming a "stable" outlook through the semi-annual credit review for the country.This is part of a number of positive steps taken recently by international creditrating agencies (ratings improved four times during the last seven months) toconfirm that the economic policies currently being pursued by the government areheading in the right direction. This positive sentiment also points to a continuedrestoration of confidence in the performance of the Egyptian economy.
To boost economic growth and investments, the government held the EgyptEconomic Development Conference (EEDC) in March 2015. This succeeded inattracting investments in different sectors, and a number of mega projects wereannounced. The value of agreements signed at the EEDC are worth US$175.2 billion,comprising final agreements worth US$15 billion; engineering, procurement, andconstruction (EPC) contracts worth US$18 billion; loans and grants worthUS$5.2 billion; investment memoranda of understanding (MOUs) worth US$92 billion;and the project to build a new capital city east of Cairo, worth US$45 billion.
KEY FIGURES
Main Urban Centres Cairo (capital)
Exchange Rate: 1 US$***Inflation 2013 | 2014 (est.) | 2015 (prov.) | 2016 (prov.) *
7.83 Egyptian Pound (EGP)6.9 | 10.1 | 10.4 | 10.1
Population^ | Population growth rate (2013)^Urban population (% of total)^ | Urbanisation rate (% in 2013)^
83 386 739 | 1.6143.07 | 1.71
GDP / capita (current US$)^ | GDP growth rate (annual %)^GNI / capita, Atlas method (current US$) ^Population below national poverty line*Unemployment rate (%)*Gini co-efficient (year of survey)^^HDI (Global Ranking)" | HDI (Country Index Score)”
3 436.25 | 2.203 28025.211.930.75 (2008)110 | 0.682
Lending Interest Rate^Mortgage Interest Rate (%) | Mortgage Term (years)#Credit % of GDP^Average Mortgages % of GDP° Price To Rent Ratio City Centre** | Outside City Centre**Gross Rental Yield City Centre** | Outside of City Centre**Outstanding home loan (% age 15+)##
11.7112.00 | 2527.30...11.31 | 11.198.84% | 8.93%6.22
What is the cost of standard 50kg bag of cement (in US$)? #What is the price of the cheapest, newly built house by a formaldeveloper or contractor (in US$)? #What is the size of this house (in m2)? #What is the average rental price for a formal unit (in US$/month)#What is the minimum plot size for residential property (in m²)#
6.40
91025410380
Ease of doing business rank !Number of procedures to register property !Time (days) to register property !Cost (% of property value) to register property !
1128630.70
*** Conmill.com The Currency Converter^ World Bank's World Development Indicators (2014)~ World Bank PovcalNet: an online poverty analysis tool, various years^^ The World Bank's PovCalnet" UNDP's International Human Development Indicators (2014)° Various: Badev et al. "Housing Finance Across Countries: New Data and Analysis" – Unpublished
paper/Hofinet/World Bank## Global Financial Inclusion Database (FINDEX)# CAHF Annual Survey Data (September 2015)! World Bank's Doing Business Survey Data (2015)** Numbeo Online User-Contributed Database

82
In terms of the funding, low income earners can access a subsidy of up to 15 percentof the value of a residence when taking advantage of this finance.
Mortgage finance witnessed a remarkable growth of 82 percent during the firstseven months of 2015, where the volume of mortgage loans granted amountedto LE 586 million (US$78 million) compared to LE321 million (US$42.8 million)during the same period of 2014. The total amount of mortgage loans granted bythe companies until July 2015 was LE 2.6 billion (US$346 million). The EgyptianMortgage Refinance Company (EMRC) held operations amounting LE73 million(US$9.7 million), compared with LE28 million by the end of July 2014.
Financial leasing activity witnessed a significant rise in the seven months of 2015until the end of July 2015. The value of contracts rose by 227 percent comparedto the same period of 2014, which amounted to about LE11.3 (US$1.5 billion)billion compared with LE3.5 billion by the end of July of the previous year. Thenumber of contracts has also increased from 1 120 to 1 548 during the sameperiod with a 38 percent increase. The value of leasing for the whole of 2014contracts was LE7 billion (US$933 million). In addition, the number of leasingcompanies registered in the authority reached 219 companies compared to 214during the corresponding period of the previous year.
Microfinance is still underdeveloped relative to the large potential market. In June2015, the first Board of Directors of the Egyptian Union of Microfinance wasformed. The Union will start its efforts to raise awareness of the importance ofmicrofinance and to develop the skills of those working in that field. According tothe EFSA, more than 400 institutions offer microcredit, with the vast majority beingNGOs. Yet market studies suggest a supply gap of 90 percent. Some 16microlenders reported to the MixMarket, an online source of microfinanceperformance data and analysis, in 2013, with 901 610 active borrowers andUS$215.6 million worth of loans dispersed
Affordability
The World Bank classifies Egypt as a low-middle income nation, with a per capitaGDP of less than LE12 000 (US$ 1600). The Central Agency for PublicMobilisation and Statistics (CAPMAS) maintains that the average Egyptian incomeis around LE3 000 (US$400). By the World Bank’s calculations, the gross nationalincome per capita was LE1 960 (US$261) per month in 2013. Housingaffordability is limited despite government policy efforts. Just over one-fifth ofEgyptians have incomes lower than US$2 per person per day. Northern Egypt isthe most impoverished.
According to C-GIDD and current mortgage rates, the average annual incomeneeded for the cheapest newly built house by a formal developer is US$4 178,while the average household income is US$5 864. On average, however, pricesin Egypt are actually much higher than this. House prices in Egypt relative toincome are more expensive than in Western Europe, double most Gulf countries,and four times more expensive than the USA.
Real estate prices inched upward as the economy picked up steam. Coupled withcorruption and real estate tax, fixed-price plots intended to spur affordabledevelopment and alleviate crowding in the capital were often bought and simplyflipped at a profit a few years later, undeveloped.
Housing supply
Egypt’s population has tripled in the last half century to 89.4 million; the vastmajority of its citizens continue to live on just five percent of the country’s land inthe Nile Valley. While the private sector has produced a glut of luxury apartmentsand upscale developments, there are few options for ordinary working people.Seeking to address Cairo’s chronic shortage of affordable housing, the governmenthas recently announced several mega-developments. In particular, these projectsare targeted at medium-income Egyptians who earn too much to qualify for state-subsidised developments but can’t afford to pay market-rate real estate prices.The vice president of the housing ministry’s New Urban Communities Authorityidentifies that there is a massive gap in the middle-income segment. The privatesector has been moving more upmarket and demanding increasingly high prices.
It is estimated that Egypt requires approximately 300 000 new housing units peryear to house newly formed households, plus an additional 254 000 units togradually deal with the backlog of housing over the past five years. However, totalformal housing production in the country has not exceeded 200 000 units per year.At the same time, a large proportion of existing houses is not available becausethey are left vacant or unfinished by the owners (an estimated three million unitsin urban areas alone).
During 2014 and 2015, the government launched various projects that aim toincrease the number of houses available for the low and middle income category.In March 2015, during the investment conference (EEDC) that was held in Sharmel-Sheikh, the Egyptian government announced plans to build a new capital to theeast of Cairo. The project will cost US$45 billion (£30bn) and take five to sevenyears to complete. The aim is to ease congestion and overpopulation in Cairo overthe next 40 years. This new city would include almost 2 000 schools and collegesand more than 600 health care facilities and will create more than a million jobs.It is planned to be built over 700 km2 and house about five million residents.
In May 2015, the Egyptian Prime Minister Ibrahim Mehleb oversaw the signing ofa protocol that grants the Egyptian government more than 50 000 housing unitsfor social housing, within the United Arab Emirates (UAE) developmental projectsin Egypt. This project is to be built in 36 areas in 17 governorates. As a part ofUAE project, 30 000 new residential units were announced in nine cities, including“New Cairo”, “6th of October City”, and “Badr City”. As part of the Social Housing
Programme, government is building 200 000 residential units annually. Demand forthis housing is outstripping supply: even for the more expensive units in New Cairo,24 200 households submitted applications for 7 000 units.
> $50 000
$25 000 – $50 000
$14 000 – $25 000
$8 000 – $14 000
$5 000 – $8 000
$3 600 – $5 000
$2 400 – $3 600
$1 600 – $2 400
$800 – $1 600
<$800
- - - Average income needed for the cheapest newly built house by a formal developer, 2015
- - - Average annual urban household income, 2014
EGYPT, ARAB REP.
$8 126
$4 178
Rural | UrbanAnnual household income US$
No. of households (thousands) 5000 4000 3000 2000 1000 0 1000 2000 3000 4000

Africa Housing Finance Yearbook 2015
83
The Dar Misr initiative, first announced in November 2014, is targeted at higherincome earners, and clearly not meeting the attracting a segment of the populationthat is above average income. 6th of October City saw just 6 000 applicants for12 000 available units. Dar Misr aims to build 150 000 middle-income homes onthe outskirts of satellite communities like 6th of October and 10th of Ramadancities, targeting the employed who have savings. The housing ministry announcedthe prices; LE255 000 (US$34 000) for a 100 m2, two-bedroom unit in Badr Cityand LE550 000 (US$73 333) for a 130 m2 three-bedroom, two-bathroom flat inNew Cairo. Applicants pay LE200 (US$34 000) to enter the lottery for the units.These prices are far out of the range of someone attempting to support a familyon his salary if his salary is between LE3 000 (US$400) and LE10 000 (US$1 333)per month.
In July 2015, the Ministry of Finance announced that the government plans toincrease investment towards developing low income housing to LE13.7 billion(US$1.8 billion) a growth of 19 percent from last year’s allocations. In addition, thegovernment expenditure on housing increased to LE8 464 billion (US$1 128 billion)in 2013/2014 and is expected to reach LE10 162 (US$1 354 billion) million by thefiscal year 2014/2015.
There have been setbacks. The much-touted Arabtec project that promised tobegin building a million middle-income homes before the end of 2014 had beensuspended as of early March. According to the original deal, the military was todonate 160 000 000 m2 of land for the project, mostly on the outskirts of Cairo,while mortgages and construction were to be financed with loans from Egyptianand foreign banks. However, the government in Egypt announced that it will buildonly 100 000 units with Arabtec in the first phase. The project is still available andthey welcome any other investors who are interested in building houses for middleincome class. Some news on the internet reported that the government changedthose terms mid-stream, however, saying Arabtec must obtain all the funding fromabroad. It also changed its mind about giving away the land, saying that it wouldsell it to the developer via NUCA and the housing authority. Reporters quotedhousing ministry sources in mid-March saying that the parties had arrived atagreements on some of the disputed terms, but at press time, no formal new dealhad been announced.
According to the competitiveness report from the world economic forum, Egyptis ranked 100th of 144 countries in infrastructure pillars in 2013. For overallinfrastructure, quality of roads and quality of electricity supply, it ranked 125th,118thand 121st respectively of 144 countries in 2013.
Property markets
Egypt’s property tax law was amended in 2014. President Abdel Fattah Al-Sisiissued Presidential Decree 117/2014, amending the 196/2008 Property Tax Lawto modify the tax-exempt tranche so that it included those owning a singleresidential unit of up to LE2 million. Hotels, clubs, hospitals, medical centres andclinics affiliated to the armed forces are exempted from paying taxes. Residentialproperties with annual rental values less than LE24 000 are exempted along withcommercial units with annual rental values less than LE1 200.
There is an inconsistent approach to property valuations and a lack of valuationinformation, making the effective use of financing difficult, as lenders have little ideaof the true value of a property that they will recover in the case of default. Over90 percent of urban housing is in the informal sector is without formal title. Thishas hindered the use of houses as collateral for other investments, and limitsinfrastructure development.
In July 2015, the first Board of the Egyptian Real Estate Financing Federation wasformed. It will play an important role in raising the awareness in the field of realestate financing. The Federation will cooperate with numbers of governmentalentities to facilitate and simplify the real estate registration system. In addition,EFSA will cooperate with the Federation through the Financial Services Institutionto prepare training programs and offer professional certificates for those operatingin the field. The First Egyptian Real Estate Appraisal Standards was issued duringJune 2015, according to decision no. 39 of 2015 issued by EFSA’s board ofdirectors, regarding the First Egyptian Real Estate Appraisal Standards which waspublished in the Egyptian Gazette issue no. 130. These standards will be appliedby all real estate appraisers.
These developments notwithstanding, the persistent inefficiencies in propertyregistration and the unfettered competition from developer finance furtherhamper the development of the mortgage market and therefore the down-marketaffordability of houses. According to World Bank’s 2015 Doing Business Report,Egypt is ranked 84th of 189 countries in registering a property. Registeringproperty requires eight procedures, takes 63 days and costs 0.7 percent ofthe property value. While the registration fee ranges from US$75 to US$300(LE2 000), the Global Property Guide suggests that the actual, full costs of atransaction can be as much as 10.85 percent to 12.3 percent of the propertyvalue, of which about a third is paid by the buyer and two thirds by the seller. Itis against the law for a property to be formally traded within five years of purchase.To get around this, property buyers often use a ‘signature validity court verdict’method, which allows resales whenever necessary and without approvals.
Other factors that hinder the advancement of the housing sector are high vacancyrates, rent control and informality. Almost 3.7 million urban housing units are eithervacant or closed, and an estimated 42 percent of the housing stock in GreaterCairo is frozen under rent control. The high vacancy rate is associated with past rentcontrol in older areas and poor location of new housing. The lack of marketmobility has led to stagnating neighbourhoods that should have undergone changeas part of urban and employment transformation (such as the downtown area ofCairo). The relatively low housing production levels, high vacancies, and low incomesrelative to housing costs have resulted in a rapid growth in informal housingproduction, estimated at half of all housing production, and sometimes more.
Policy and regulation
The new investment law; Law 17/2015 ratified by President Abdel Fattah el-Sisi onthe eve of the economic conference, continued the process of deregulation,removing the last remaining restrictions on foreign ownership of land and propertyin Egypt. The new law also allows the government to directly assign, for free, state-owned land to the private sector as part of public-private partnership schemes.Indeed, the minister of housing recently announced that, based on its landownership, the government will hold a 24 percent equity share in the new capitalproject. Poor policies and low income and finance affordability resulted in chronichousing shortages and growth of informal housing.
Egypt’s housing policy framework has been assertive in addressing the challengesof supply and affordability, but its efforts have been criticised as insignificant. Recentpolitical and social instability has further undermined these efforts and highlightedthe need for a new approach. A shift from supply-side housing subsidies tomechanisms stimulating private sector involvement in the mortgage marketpromised to promote the rapid growth of Egypt’s housing sector, stimulatingbroader economic growth in turn.
EFSA’s board of directors published decision no. 64 of 2015 regarding theconditions and requirements that must be met for granting a licence to practicemortgage finance and refinance activity. Among the conditions to be met in themortgage finance company that its issued capital shall not be less than fifty millionpounds. Upon its establishment, the company shall pay the quarter of this amount.The company is committed to complete it within one year from the date of beinglisted at the commercial register. In addition, the capital of Mortgage RefinanceCompany shall not be less than two hundred and fifty million pounds. Upon itsestablishment, the company shall pay no less than half of the amount cash. Thecompany is committed to complete it in three years at the most.
Opportunities
All sectors of the Cairo real estate market have witnessed a positive performanceand improved sentiment during the first three months of 2015 due to strongerconfidence and investment appetite created by increased economic and politicalstability. The recent announcement of the mega real estate project Cairo Capitalwill serve as an extension for New Cairo and will draw the centre of gravityfurther to the East of the existing city. It is expected that this will increaseconfidence in the Egyptian market.The positive economic outlook arising from the Economic Summit is expected toresult in additional investment in the residential sector, strengthening the marketfurther in 2015. According to international real estate firm, JLL, residential saleprices have continued to increase across Cairo in the first quarter of the year withoffice rents increasing in New Cairo and retail rents edging further upwards over

84
the past quarter. The hotel sector has also recorded improved performance withtourist numbers and hotel occupancy rates improving.
The provision of home financing is critical in making home ownership a realistictarget for Egypt’s citizens. The introduction of the mortgage law in the early partof the last decade has facilitated the growth of the market in Egypt. The recentamendment allowing foreign companies to offer home financing as well as theCentral Bank initiative to provide long term financing to institutions offeringmortgage products for low cost housing will contribute to the continued growthof the sector.
Sources
Everhart, S., Heybey, B. and Carleton, P. (2006). Egypt: Overview of the HousingSector. Housing Finance International, 9-15.Hayawan, M., and Hamid, M.A. (2010). The Role of the Mortgage Finance Fund.(Rizk, H., Interviewer.Ismail, A. (2010). Positive Dynamics of Egyptian Real Estate Market. EuromoneyConferences .Jones Lang LaSalle’s quarterly report, April 2014.Mountain View (2010). The Positive Dynamics of the Egyptian Real Estate Market.Euromoney Conferences. Rakhit, A. (2010). Defining the "New Normal" Global Real Estate Market Review.Euromoney Conferences .USAID (2009). The Legal and Regulatory Environment for Microfinance in Egypt.Waly, G. (2009). Microfinance in Egypt: An Overview. World Bank (2013). Doing Business 2013: Egypt Country Profile.
Websites
www.africaneconomicoutlook.orgwww.ashoka.org www.campas.gov.egwww.efsa.gov.eg
www.emrc-online.comwww.globalpropertyguide.comwww.hofinet.org www.lafarge.com.egwww.mfw4a.orgwww.mixmarket.orgwww.propertywire.comwww.worldbank.orghttp://www.newcities.gov.egwww.cbe.gog.egwww.mof.gov.eghttp://reports.weforum.org/http://www.doingbusiness.org/reportshttp://www.numbeo.com/property-investment/region_rankingshttp://www.propertywire.com/http://www.dailynewsegypt.com/

Africa Housing Finance Yearbook 2015
85
Eriteria
opportunities in sectors other than mining. Inflation has soared over the past twodecades but is expected to ease to 10.1 percent in 2015 from 17 percent in 2012,in line with trends in international commodity prices. However, food shortagescaused by a poor cereal harvest in 2013 will put upward pressure on domesticfood prices in 2014. In the short to medium term, inflation is expected to averagearound 12 percent.
Despite these challenges and setbacks, and the fact that the country is ranked182nd out of 187 countries in the 2014 United Nations Human DevelopmentIndex, Eritrea has attempted to make progress towards its own development goals.According to the UNDP, the government has endeavoured to protect the mostvulnerable segments of the population and to implement its long-termdevelopment policies. It maintains an extensive social safety net, investing in threepriority areas: food security and agricultural production, infrastructuredevelopment; and human resources development. These priorities are part of thecountry’s five year National Development Plan (which was being finalised at theend of 2014), which aims to create the necessary conditions for the emergenceof a modern, technologically advanced and internationally competitive economy.
Access to finance
The Eritrean financial system remains significantly underdeveloped with a limitedsupply of financial services, which fall far short of demand. According to the WorldBank’s 2015 Doing Business Report, in the ‘ease of getting credit’ category, Eritrea
Overview
Eritrea is one of the least developed countries in the world. The unresolved “no-peace-no-war” border stalemate that has existed between Ethiopia and Eritreasince 1998 remains a major impediment to the Eritrea’s development and growthefforts, given that a number of possible national socio-economic initiatives andresources remain tied to the border issues.
In 2012, Eritrea had an average annual per capita income of US$507 with apopulation of about 6.5 million, of which an estimated two-thirds live in rural areas.The World Bank’s 2015 Doing Business Report ranks Eritrea as the most difficultcounty in which to do business (last out of 189 countries). No census has beencarried out in Eritrea to date and official statistics on the prevalence of poverty inthe country are limited. Based on anecdotal evidence, poverty is still widespread(up to 69 percent) and 80 percent of the population depend on subsistenceagriculture for their livelihoods. Consequently, a large portion of the populationis vulnerable and food insecurity is high, with an estimated 50 percent of childrensuffering from under-nourishment.
In 2011, the UN Security Council imposed a second set of sanctions against thecountry, expanded from those imposed in 2009 (consisting of an arms embargo,as well as asset freezes and travel bans on some Eritrean political and militaryleaders). The most recent sanctions require international companies operating inEritrea’s mining sector to ensure that funds are not used to destabilise the region.They also call on member states to ensure that no illicit means are used to collectthe two percent "diaspora tax" that Eritrea levies on its citizens working abroad(which is thought to be the most significant source of revenue for the ruling party).
The diversion of resources to the military and negligible foreign investment(beyond the mining sector) means that Eritrea's economic performance willremain below potential. Never theless, real GDP growth picked up from1.3 percent in 2013 to 1.7 percent in 2014 on the back of strong governmentconsumption and high (public and private) investment in mining. Analysts agreethat a moderate growth trend is set to continue with growth expected to reach3.8 percent in 2016. Furthermore, growth is unlikely to be affected by UNsanctions, which are not stringent enough to affect output or investment in themining sector. However, it is also unlikely to result in substantial improvements inthe living standards of the average Eritrean, given the lack of economic
KEY FIGURES
Main Urban Centres Asmara (capital)
Exchange Rate: 1 US$***Inflation 2013 | 2014 (est.) | 2015 (prov.) | 2016 (prov.) *
15.01 Eritrean Nakfa (ERN)12.3 | 11.6 | 10.1 | 12.3>
Population^ | Population growth rate (2013)^Urban population (% of total)^ | Urbanisation rate (% in 2013)^
6 536 176 | 3.1622.19 | 5.10
GDP / capita (current US$)^ | GDP growth rate (annual %)^GNI / capita, Atlas method (current US$) ^Population below national poverty line*Unemployment rate (%)*Gini co-efficient (year of survey)^^HDI (Global Ranking)" | HDI (Country Index Score)”
590.23 | 1.7053069.07.9
182 | 0.381
Lending Interest Rate^Mortgage Interest Rate (%) | Mortgage Term (years)#Credit % of GDP^Average Mortgages % of GDP° Price To Rent Ratio City Centre** | Outside City Centre**Gross Rental Yield City Centre** | Outside of City Centre**Outstanding home loan (% age 15+)##
7 – 1212.00 | 25...............
What is the cost of standard 50kg bag of cement (in US$)? #What is the price of the cheapest, newly built house by a formaldeveloper or contractor (in US$)? #What is the size of this house (in m2)? #What is the average rental price for a formal unit (in US$/month)#What is the minimum plot size for residential property (in m²)#
23.80
90 901125...500
Ease of doing business rank !Number of procedures to register property !Time (days) to register property !Cost (% of property value) to register property !
18911789.10
*** Conmill.com The Currency Converter^ World Bank's World Development Indicators (2014)~ World Bank PovcalNet: an online poverty analysis tool, various years^^ The World Bank's PovCalnet" UNDP's International Human Development Indicators (2014)° Various: Badev et al. "Housing Finance Across Countries: New Data and Analysis" – Unpublished
paper/Hofinet/World Bank## Global Financial Inclusion Database (FINDEX)# CAHF Annual Survey Data (September 2015)! World Bank's Doing Business Survey Data (2015)** Numbeo Online User-Contributed Database> Economic Intelligence Unit 2015

86
was ranked 185th out of 189 countries. The country does not appear to have anyprivate credit bureaus or public credit registries. As a result of the shallow financialsystem, the average level of credit extended to the private sector is quite low andthe government pursues administered interest rates, which discourages privatesavings and increases the cost of borrowing. The cost of borrowing still remainsprohibitively high, with real interest rates around 7 to 12 percent. If not subsidised,the interest rates could be as high as 30 percent depending on the use of themoney being borrowed. The low level of financial sector development in Eritreahas continued to limit investment opportunities.
Eritrea's banking sector remains controlled by the state, with lending directedtowards other state-owned or state-controlled entities. There are currently sixfinancial institutions comprising the financial sector : the central bank (Bank ofEritrea); the Commercial Bank of Eritrea (CBE), a state owned bank with nearlytwenty branches in the country; the Housing and Commerce Bank of Eritrea(HCBE), a private bank, specialising in commercial and residential mortgage loans;the Development and Investment Bank, a state-owned bank specialising in long-term industrial and agricultural loans; an insurance company; and Himbol, agovernment owned and operated exchange and remittance service, which ithopes will help narrow the gap between the exchange rate being offered by thebanks and the black market.
Although the government enacted the comprehensive Bank and FinancialInstitutions Act, permitting the licensing of private financial institutions, includingforeign banks, no other local or foreign private financial institution has beenallowed to work in Eritrea (except the foreign exchange bureau). Money andcapital markets are non-existent, so open-market operations are not possible inmonetary policy management. Currently, commercial banks are required to setaside 20 percent of their deposits as reserves.
HCBE offers savings and current accounts in the local currency (Nakfa), US Dollarsand Euros, as well as US Dollar denominated Certificates of Deposit. Accordingto the Bank’s website, its main product offerings include: medium and long-termloans for the construction of houses and businesses, as well as various types ofmedium- and long-term loans for the construction of buildings, stores, communitycenters, and so on. The bank’s other product offerings include loans for purposesof purchase of existing buildings and homes repairs, maintenance, modificationsand extensions; as well as commercial, consumer and personal loans. The bank alsohas a large scale housing construction programme that it financed, to deliver stockfor sale to the public.
Data on mortgage lending is not available and does not appear to be collected bythe Central Bank – it is therefore not possible to determine the size of themortgage market. It is likely small, however. The country’s collateral markets areunderdeveloped making it difficult for citizens to obtain mortgage loans. Forexample, undeveloped land, no matter the tenure form, cannot be used ascollateral and this denies landholders the opportunity to borrow for houseconstruction.
According to a 2005 Housing/Urban Development Policy Report compiled bythe Eritrean government and United Nations, the major providers of non-conventional finance, primarily for income generating projects, are the Savings andMicro-Credit Programme (SMCP) and Acord. SMCP was founded in 1996 withfinancial support from the World Bank and has established a countrywide networkof village banks through which low income borrowers obtain micro-loans forbusiness. Acord started its operations in 1994 and focuses on supporting ruralgrassroots organisations. Employee-based savings and credit associations, housingcooperatives, and informal credit and savings groups (Ukubs) exist but at the timethese were not significant channels of housing finance (and it is difficult to ascertainif things have changed since then). Furthermore, the government’s saving andmicro credit programme also provides credit in all six administrative regions tohelp women establish small and medium enterprises and thus improve theirincomes and their families’ economic conditions. By far the largest proportion ofhousing is self-built, with funding coming primarily from personal savings.
Affordability
Although the level of urbanisation is low by global standards (around 25 percentof the national population live in towns), access to housing and urban infrastructure
services is severely constrained. While some households are able to make use ofbank loans, a significant percentage of houses are either self-financed, or built withremittances from Eritreans living abroad. The most acute concern for governmentis to house low income households since the majority of Eritreans fall below thepoverty line.
The banks, usually HCBE, require a 25 percent deposit, and then an installment toincome ratio of no more than a third of the borrower’s income over a maximumtenor of 25 years. According to local news sources, a 16m2 room in Asmara andin villages in the vicinity goes for 1 000 Nafka (around US$17) per month and themedian average salary of a government employee in the country is 800 Nafka(US$13) per month. It becomes quickly apparent that only higher incomehouseholds can afford the available housing stock in Eritrea.
In 2013, the government launched a major housing project in Asmara. Accordingto the official website, apartments and houses will range from 30 – 120m2 and125 – 200m2 respectively. Apartment prices range from EUR 18 007 (US$0 248)for a 30 m2 unit to EUR66 471 (US$75 112) for a 120m2 unit. House prices varyfrom EUR71 323 (US$80 595) for a 125 m2 home all the way up to EUR113 006(US$127 697) for a 200m2 unit. As stipulated on HCBE’s website, only nationalswho have fulfilled their national obligations and who make a 25 percent depositpayment for the house or business shops they select are qualified for the purchase.The costs of these types of units are prohibitively expensive for the vast majorityof Eritreans.
Housing supply
According to a 2005 Housing and Urban Development study, the majority ofhouseholds own their homes (69 percent), ranging from 82 percent in villages to63 percent in the primary cities. However, it is not clear if these households haveformal title or are able to use their land rights to mobilise finance. The remaining31 percent is composed of renters, including private renters (20 percent), sharers(6 percent) and government renting (4 percent). The formal and informal rentalhousing sector appears to offer viable housing solutions for many families in Eritrea.
In Asmara, over a half of households in the city were tenants. In the rest of thecountry, this proportion is lower, ranging from around 17 percent in small townsand 22 percent in the medium-sized towns. According to a 2014 law, annual rentmust be paid with the sole exception of rural housing. Regarding “house sharers”they tend to mostly be immediate or extended family members who are eitherunable to pay for their rents or cannot find a house to rent. The large ratio ofsharers reflects the serious housing problem in the country. The majority of urbanresidents in Eritrea live in over-crowded housing with limited access to affordablewater and safe sanitation.
In 2005 it was estimated that over the next ten years, 5 000 new dwelling units ayear would be required in Asmara alone. At that time, the government wasproducing less than 1 500 dwellings per annum. It is not clear what the currentdelivery rate is, or at whom it is targeted. In 2013, the government undertook toprovide much needed housing units in Asmara. According to local sources, theAsmara Housing Project is a pilot project that is being developed in the Sembel,Halibet and Space 2001 districts of the city. The project consists of 1 680 homesand shops, and is the largest modern housing infrastructure project in the Hornof Africa. According to local news sources, in 2014 Eritrea has been quietly buildinga number of multimillion dollar infrastructure projects. From luxury resorts tocolleges to modern homes and dams, Eritrea is witnessing an unprecedenteddevelopment boom. This includes a US$115 million Dahlak Master Plan andseveral high-end resorts in Ras Harab and Halibay. It also appears as though thegovernment is constructing residential properties that will be sold to Eritreans inthe diaspora who can afford to pay in foreign currency.
In an interview with state media in February 2014, President Isaias Afwerki said,"The pilot housing project in Asmara is a precursor of a comprehensive urban andrural national housing scheme for the years to come". Therefore it is suggestedthat urban areas such as Mendefera, Teseney, Assab, Dekemhare and Keren shouldexpect to see housing development projects of their own.
The private sector has also been involved in delivering housing units in the country.The US$300 million Massawa project appears to be a mix of luxurious resorts,

Africa Housing Finance Yearbook 2015
87
hotels and residential buildings. Currently, construction of the project has beenpostponed, presumably, due to the Asmara pilot project taking a priority. Althoughlittle information has been provided on this massive project, observation of thetenders provided by the government seem to indicate the models were designedby Piccini, an Italian based engineering and machinery producing company. AnotherItalian company, Gruppo Italiano Costruzioni, is reportedly constructing 1 680housing units in the capital city, Asmara, as well as several housing projects and aresort in Massawa.
Property markets
Under the 1994 Land Proclamation Act, land ownership is vested in the state, withindividuals, both Eritreans and foreign investors alike, granted users' rights undera lease arrangement, renewable, for 10 – 60 years. Women have equal rights tomen under the Land Proclamation Act. Two legal instruments drafted in the1990s gave every Eritrean the right to land for housing in urban areas andancestral villages, subject to meeting certain allocation criteria. There are twodistinct forms of land tenure for housing: “Tessa” and lease land. “Tessa” land refersto allotted village land. Lease land is allocated in urban areas and houses built onit may be sold, donated, inherited, transferred or mortgaged. The propertymarket in Eritrea remains challenging. According to the World Bank’s 2015 DoingBusiness Report, registering property in Eritrea requires 11 procedures, takes 78days and costs 9.1 percent of the property value.
According to local news sources, earlier this year, the government of Eritrea wasreported to have demolished 105 houses in the village of Tselot in the CentralAdministration Zone. According to the government, the demolished buildingswere built by individuals on half pieces of land allotted to residents in the villageswho had sold portions of their land in order to be able to construct their ownhouses. The government is believed to have been issuing warnings against theselling, purchasing or exchanging of government allotted land and that anyone whoexercises this would be penalized. The government has previously carried outsimilar demolitions in the capital, Asmara.
Policy and regulation
On the national and local levels, a number of institutions and programmes carryout a range of functions related to land, urban planning and housing. The mainnational institutions include the Department of Urban Development of theMinistry of Public Works, the Ministry of Lands, Water and the Environment(MLWE), the Housing Commission, and the various municipalities.
The main mission of the MLWE is ‘to ensure the implementation of sustainableland management and guarantee optimum use and fair distribution of land’. It ismandated to study land capability and land use planning, allocation of land parcels,and monitoring whether allocated land is utilized according to designated purpose.Currently the Land Law (that was promulgated in 1994) is not being implemented,and the pronounced objectives of the macro policy and land policy, such as tenure
security through implementing usufruct rights, agricultural and industrialdevelopment are still not fully realised (Weldegiogis, 2015). There is currently noland use planning in the country- rather, it is carried out on a demand basis. In1997, a Registration Law was promulgated to introduce an efficient, simple andmodern system for the registration of land and other immovable property. Thestatus of the implementation of this legislation is unclear.
Opportunities
Eritrea clearly has a great need for affordable housing delivery. The governmentis strongly encouraging companies and individuals to invest in building residentialhousing and other supporting social and economic infrastructure. In the housingsector, the main drivers of the development initiatives are embedded in thecountry’s commitment to “development through self-reliance” policy. This refersto the country empowering its people to trust their own capabilities and spirit topromote sustainable development; and as an alternative to an overdependence onforeign aid and external development models.
To create even greater opportunities in the formal housing sector, Eritrea needsto continue with ongoing reforms to modernise its finance markets. These reformsshould resolve the problems of an inadequately responsive banking sector,undeveloped capital markets and the relatively high interest rates that havediscouraged lending. Furthermore, the distribution and availability of banks in thevillages and secondary towns should be improved before undertaking anymeaningful housing development plan.
There are enormous opportunities for both the public and private sectors tostrengthen the development of housing finance, as well as increase its supply.Possible initiatives include expanding tailored housing loan products to low incomegroups; providing technical assistance to banks to enable them originate andmanage loans for low income housing; and introducing innovative and competitivehousing solutions and products for the poor. Furthermore, substantial remittancesfrom the diaspora provide a useful source of housing finance (when it is notsubjected to tax) that could be harnessed for both mortgage and microfinancelending.
Beyond mortgage finance, there are real opportunities for growth in the housingmicrofinance sector. High levels of self-build coupled with the microfinanceindustry with good links to the formal banking sector, and experimentation withhousing, mean that housing microfinance has enormous potential to contributetowards housing some of the population.
> $50 000
$25 000 – $50 000
$14 000 – $25 000
$8 000 – $14 000
$5 000 – $8 000
$3 600 – $5 000
$2 400 – $3 600
$1 600 – $2 400
$800 – $1 600
<$800
- - - Average income needed for the cheapest newly built house by a formal developer, 2015
- - - Average annual urban household income, 2014
ERITREA
$34 770
$1 074
Rural | UrbanAnnual household income US$
No. of households (thousands) 1000 800 600 400 200 0 200

88
Sources
African Development Bank Group (2014). Eritrea: Interim Country StrategyPaper (I-CSP) 2014-2016.African Economic Outlook (2015). Eritrea, 2015. AfDB, OECD, UNDP, ECAEIU (2015). Country Report: Eritrea, August 2015.Ministry of Public Works/Department of Urban Development, Eritrea; UN-HABITAT and UNDP (2005). Eritrea: Housing / Urban Development PolicyReport, July 2005.Ministry of Public Works and UNHABITAT (2005). Eritrean Housing and UrbanDevelopment Study: Household Survey, 2005.United Nations (2005). Eritrea: Housing/ Urban Development Policy Report.Ministry of Public Works/Department of Urban Development, Eritrea; UN-HABITAT & UNDP, July 2005.US Department of State (2013). Investment Climate Statement: Eritrea, 2013.World Bank (2013). Doing Business Report 2014: Eritrea.Weldegiogis, H. (2015). Land tenure in Eritrea. FIG Working Week, May 2015.
Websites
www.africaneconomicoutlook.org www.allafrica.com www.asmera.nl/sembel-residentional.htm www.doingbusiness.org www.er.undp.org http://www.erena.org http://erhcb.com/service.htmwww.eritrean-embassy.sewww.madote.comwww.tesfanews.net www.worldbank.org

Africa Housing Finance Yearbook 2015
89
Ethiopia
Access to finance
Ethiopia is amongst the major under-banked economies in the world. The bankingindustry is highly profitable, concentrated and moderately competitive. Traditionallyit has been dominated by the state but performs relatively poorly. There is nostock market and treasury bills are the only active primary securities.
Ethiopia has 19 banks – 16 of which are privately owned. Ethiopia’s banking sectorhas managed to thrive despite the ban on foreign ownership and the extendedreach of the state. The total capital of the banking system is ETB 25.6 billion(US$ 1.28 billion), of which private banks account for 53.9 percent. The largestbank is the government-owned Commercial Bank of Ethiopia (CBE), whichaccounts for 34.2 percent of the total capital of the banking system. CBE hasgrown since the introduction of the Integrated Housing DevelopmentProgramme’s current project in Addis Ababa, in which it plays an important rolein the provision of mortgage finance. Over the past three years CBE opened 298new branches to a total of 700 in June 2013. In general, access to financial serviceshas been improving and the total number of bank branches reached 2 208 in 2014– 34 percent of which are located in Addis Ababa. This increase has brought downthe ratio of bank branches to population from 49 675 to 39 834 (AEO, 2015).
Ethiopia’s banking sector is stable and sound. According to the IMF, the system-wide capital adequacy ratio stood at a comfortable 17.5 percent, (well over the 8percent requirement). Returns on assets and equity showed solid performance,
Overview
The International Monetary Fund (IMF) ranks Ethiopia as among the five fastestgrowing economies in the world. The Ethiopian government’s investment inagriculture and public services has resulted in a decade of high economic growthresulting in a decrease in the national poverty rate from 56 percent in 2000 tounder 30 percent in 2014 – this is the second fastest rate of poverty reductionon the continent. The Ministry of Urban Development, Housing and Constructionreceived the 2015 UN Public Service Award for the Integrated HousingDevelopment Programme. With a population of approximately 96 million people,Ethiopia is also the second most populous country in Africa and is growing rapidlyat 2.52 percent per year.
Despite having one of the lowest proportions of urban population in the worldat only 19 percent, Ethiopia is now one of the most rapidly urbanizing countriesin the world. According to recent UN estimates, the urban population of Ethiopiais expected to triple between 2010 and 2040, growing at an average rate of 3.5percent per year. The combination of high population and urban growth rates,coupled with a high prevalence of urban poverty has placed enormous strain onEthiopian cities and the economy’s ability to create sufficient employmentopportunities.
The Growth and Transformation Plan (GTP2) (the successor economicdevelopment programme to the government’s ambitious 2010 to 2015 GTP) willrun from 2015 to 2020. This will continue to target infrastructural developmentincluding power projects, transport, urban housing, as well as poverty reduction.Full details have not yet been published but the government is reportedly planningto spend some ETB11 billion (US$53 million) on urban infrastructure. Economicgrowth is officially forecast to reach 11.4 percent in 2014/2015 (EIU, 2015).
Curbing inflation has been the government’s key economic policy focus for the lastfew years. As a result the rate of headline inflation has dropped to 7.1 percent inDecember 2014, from a peak of 39.2 percent in November 2011. The averageinterest rate on deposits remained unchanged at 5.09 percent between 1995 and2014. On a number of occasions inflation outstripped interest paid on deposits,thereby limiting the ability of monetary policy to manage demand and savings.
KEY FIGURES
Main Urban Centres Addis Ababa (capital)
Exchange Rate: 1 US$***Inflation 2013 | 2014 (est.) | 2015 (prov.) | 2016 (prov.) *
20.73 Ethiopian Birr (Birr)13.5 | 8.1 | 9.0 | 9.0
Population^ | Population growth rate (2013)^Urban population (% of total)^ | Urbanisation rate (% in 2013)^
96 506 031 | 2.5219.03 | 4.85
GDP / capita (current US$)^ | GDP growth rate (annual %)^GNI / capita, Atlas method (current US$) ^Population below national poverty line*Unemployment rate (%)*Gini co-efficient (year of survey)^^HDI (Global Ranking)" | HDI (Country Index Score)”
567.82 | 9.9455029.65.433.59 (2010)173 | 0.435
Lending Interest Rate^Mortgage Interest Rate (%) | Mortgage Term (years)#Credit % of GDP^Average Mortgages % of GDP° Price To Rent Ratio City Centre** | Outside City Centre**Gross Rental Yield City Centre** | Outside of City Centre**Outstanding home loan (% age 15+)##
5.0911.70 | 17......6.18 | 10.1116.19% | 9.89%2.04
What is the cost of standard 50kg bag of cement (in US$)? #What is the price of the cheapest, newly built house by a formaldeveloper or contractor (in US$)? #What is the size of this house (in m2)? #What is the average rental price for a formal unit (in US$/month)#What is the minimum plot size for residential property (in m²)#
5.41
34 51560288...
Ease of doing business rank !Number of procedures to register property !Time (days) to register property !Cost (% of property value) to register property !
13210412.10
*** Conmill.com The Currency Converter^ World Bank's World Development Indicators (2014)~ World Bank PovcalNet: an online poverty analysis tool, various years^^ The World Bank's PovCalnet" UNDP's International Human Development Indicators (2014)° Various: Badev et al. "Housing Finance Across Countries: New Data and Analysis" – Unpublished
paper/Hofinet/World Bank## Global Financial Inclusion Database (FINDEX)# CAHF Annual Survey Data (September 2015)! World Bank's Doing Business Survey Data (2015)** Numbeo Online User-Contributed Database
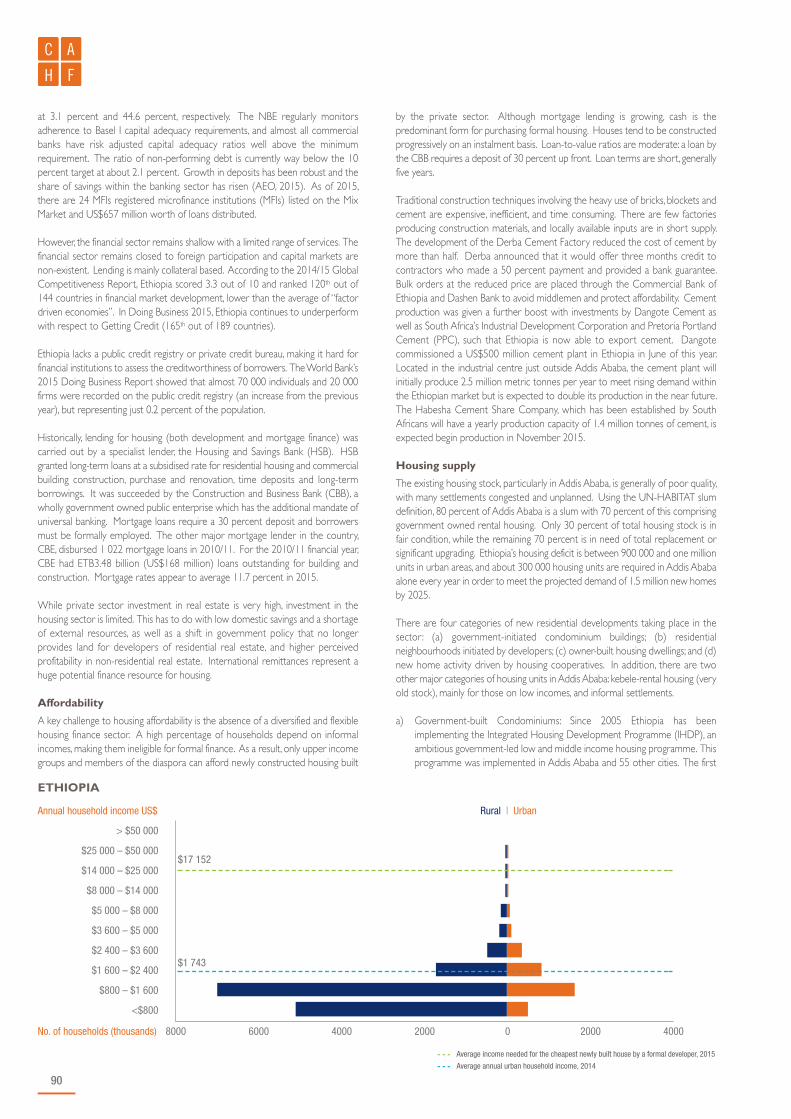
90
at 3.1 percent and 44.6 percent, respectively. The NBE regularly monitorsadherence to Basel I capital adequacy requirements, and almost all commercialbanks have risk adjusted capital adequacy ratios well above the minimumrequirement. The ratio of non-performing debt is currently way below the 10percent target at about 2.1 percent. Growth in deposits has been robust and theshare of savings within the banking sector has risen (AEO, 2015). As of 2015,there are 24 MFIs registered microfinance institutions (MFIs) listed on the MixMarket and US$657 million worth of loans distributed.
However, the financial sector remains shallow with a limited range of services. Thefinancial sector remains closed to foreign participation and capital markets arenon-existent. Lending is mainly collateral based. According to the 2014/15 GlobalCompetitiveness Report, Ethiopia scored 3.3 out of 10 and ranked 120th out of144 countries in financial market development, lower than the average of “factordriven economies”. In Doing Business 2015, Ethiopia continues to underperformwith respect to Getting Credit (165th out of 189 countries).
Ethiopia lacks a public credit registry or private credit bureau, making it hard forfinancial institutions to assess the creditworthiness of borrowers. The World Bank’s2015 Doing Business Report showed that almost 70 000 individuals and 20 000firms were recorded on the public credit registry (an increase from the previousyear), but representing just 0.2 percent of the population.
Historically, lending for housing (both development and mortgage finance) wascarried out by a specialist lender, the Housing and Savings Bank (HSB). HSBgranted long-term loans at a subsidised rate for residential housing and commercialbuilding construction, purchase and renovation, time deposits and long-termborrowings. It was succeeded by the Construction and Business Bank (CBB), awholly government owned public enterprise which has the additional mandate ofuniversal banking. Mortgage loans require a 30 percent deposit and borrowersmust be formally employed. The other major mortgage lender in the country,CBE, disbursed 1 022 mortgage loans in 2010/11. For the 2010/11 financial year,CBE had ETB3.48 billion (US$168 million) loans outstanding for building andconstruction. Mortgage rates appear to average 11.7 percent in 2015.
While private sector investment in real estate is very high, investment in thehousing sector is limited. This has to do with low domestic savings and a shortageof external resources, as well as a shift in government policy that no longerprovides land for developers of residential real estate, and higher perceivedprofitability in non-residential real estate. International remittances represent ahuge potential finance resource for housing.
Affordability
A key challenge to housing affordability is the absence of a diversified and flexiblehousing finance sector. A high percentage of households depend on informalincomes, making them ineligible for formal finance. As a result, only upper incomegroups and members of the diaspora can afford newly constructed housing built
by the private sector. Although mortgage lending is growing, cash is thepredominant form for purchasing formal housing. Houses tend to be constructedprogressively on an instalment basis. Loan-to-value ratios are moderate: a loan bythe CBB requires a deposit of 30 percent up front. Loan terms are short, generallyfive years.
Traditional construction techniques involving the heavy use of bricks, blockets andcement are expensive, inefficient, and time consuming. There are few factoriesproducing construction materials, and locally available inputs are in short supply.The development of the Derba Cement Factory reduced the cost of cement bymore than half. Derba announced that it would offer three months credit tocontractors who made a 50 percent payment and provided a bank guarantee.Bulk orders at the reduced price are placed through the Commercial Bank ofEthiopia and Dashen Bank to avoid middlemen and protect affordability. Cementproduction was given a further boost with investments by Dangote Cement aswell as South Africa’s Industrial Development Corporation and Pretoria PortlandCement (PPC), such that Ethiopia is now able to export cement. Dangotecommissioned a US$500 million cement plant in Ethiopia in June of this year.Located in the industrial centre just outside Addis Ababa, the cement plant willinitially produce 2.5 million metric tonnes per year to meet rising demand withinthe Ethiopian market but is expected to double its production in the near future.The Habesha Cement Share Company, which has been established by SouthAfricans will have a yearly production capacity of 1.4 million tonnes of cement, isexpected begin production in November 2015.
Housing supply
The existing housing stock, particularly in Addis Ababa, is generally of poor quality,with many settlements congested and unplanned. Using the UN-HABITAT slumdefinition, 80 percent of Addis Ababa is a slum with 70 percent of this comprisinggovernment owned rental housing. Only 30 percent of total housing stock is infair condition, while the remaining 70 percent is in need of total replacement orsignificant upgrading. Ethiopia’s housing deficit is between 900 000 and one millionunits in urban areas, and about 300 000 housing units are required in Addis Ababaalone every year in order to meet the projected demand of 1.5 million new homesby 2025.
There are four categories of new residential developments taking place in thesector : (a) government-initiated condominium buildings; (b) residentialneighbourhoods initiated by developers; (c) owner-built housing dwellings; and (d)new home activity driven by housing cooperatives. In addition, there are twoother major categories of housing units in Addis Ababa: kebele-rental housing (veryold stock), mainly for those on low incomes, and informal settlements.
a) Government-built Condominiums: Since 2005 Ethiopia has beenimplementing the Integrated Housing Development Programme (IHDP), anambitious government-led low and middle income housing programme. Thisprogramme was implemented in Addis Ababa and 55 other cities. The first
> $50 000
$25 000 – $50 000
$14 000 – $25 000
$8 000 – $14 000
$5 000 – $8 000
$3 600 – $5 000
$2 400 – $3 600
$1 600 – $2 400
$800 – $1 600
<$800
- - - Average income needed for the cheapest newly built house by a formal developer, 2015
- - - Average annual urban household income, 2014
ETHIOPIA
$17 152
$1 743
Rural | UrbanAnnual household income US$
No. of households (thousands) 8000 6000 4000 2000 0 2000 4000

Africa Housing Finance Yearbook 2015
91
phase of the IHDP has been successful in many respects and has built 171 000housing units. There were, however, a number of unanticipated challengesfacing the program. The most pressing is the affordability of the units for lowincome households, with the cost increases in the price of condominiumhouses deeming them no longer an option for many low income households.The inability to pay the monthly mortgage and service payments forces manyhouseholds to move out of their unit and rent it out rather than risk losing itthrough bank foreclosure.
In order to address these challenges, a new and enhanced second phase ofthe IHDP was launched in 2011. This phase involved a new housing projectin Addis Ababa divided into four different groups based on paymentarrangements: 10/90 (involving a 10 percent deposit and a 90 percent CBEmortgage loan), 20/80 (80 percent LTV), 40/60 (60 percent LTV), and forhousing associations, a full up-front payment is required. The 10/90 schemeis designed for people in the lower income bracket, in the ETB1 200 (US$58)and less monthly income. This group is expected to save ETB187 (US$9)every month. The 20/80 scheme is designed to incorporate those registeredpreviously, in 2005, and the new ones who earn more than the lower incomebracket. The money expected to be saved by this group varies according tothe type of house. Starting from a studio apartment, which entails ETB151(US$7) monthly saving, the range goes up to ETB 685 (US$33).
The 40/60 scheme has special conditions for buyers from the diaspora, so thatthey can pay in hard currency. The saving varies from ETB 1 033(US$50) forone bedroom to ETB2 453 (US$118) for three bedrooms. Demand hasincreased since CBE agreed to provide mortgage financing to prospectivehouseholds. If city residents are able to save 40 percent of the total cost ofthe planned house they will be eligible for the programme that has theremaining 60 percent covered by the state owned bank through a mortgageloan to be paid within 17 years. Site selection and other preconditions havebeen completed and construction of 10 000 houses has started. Thecheapest price is ETB128 590 (US$6 203) for a house with one bedroom(55m2 total area) while the two bedroom homes cost ETB200 475 (US$9 670)and lays on 75m2. The biggest house will cost ETB320 000 (US$15 437) withthree bedrooms (100m2 area). Though affordable, these houses are expectedto be of higher quality and more spacious than those in the low costcondominium housing projects. In 2014 alone, some 22 000 condos werehanded over to beneficiaries and the government expects to transfer 76 000houses to individuals in 2015.
The later (the housing cooperatives having 12 to 24 members) is mainlytargeted for the higher income groups both for local residents and thediaspora. Members of the housing cooperatives are expected to cover 100percent of the housing costs – 50 percent at the time of registration and theremaining 50 percent when securing the land and construction permit.Housing cooperatives are established under four categories, the first is on thebasis of neighbourhoods, the second is based in work places and the third isthe diaspora who live abroad. The housing modalities are G+4 apartmentswith one to three bed rooms with estimated price of ETB210 000,ETB280 000 and ETB385 000 respectively for local residents. For thediaspora the typology of the housing units are G+4 apartments and townhouses with two, three and four bedrooms with estimated prices of 533 000,720 000 and 979 000 Eth. Birr respectively. The diaspora are expected toestablish their coops in each Ethiopian embassy and councils with the help ofthe ministry of Foreign Affairs and the construction of the houses is expectedto be implemented by either the government housing enterprises or by theirown private contractors.
More recently, the Ethiopian Ministry of Urban Development, Housing andConstruction recently announced plans to construct 2.45 million houses inhousing schemes between 2015 and 2020. Out of the residential houses,750 000 will be built in urban areas and 1.7 million in rural areas. Thisconstruction project is in line with the GTP2 currently underway and will beerected in the housing schemes of 10/90, 20/80 and 40/60. Out of the 150 000ha of allocated land, 40 percent will be set aside for the construction ofhouses, 30 percent for its infrastructure and the remaining 30 percent forgreen areas.
b) Residential neighbourhoods initiated by Real Estate Developers: There are
approximately 50 private real estate companies operating in Ethiopia that arealmost exclusively focused on high income groups:
n Arab Contractors is considering developing an affordable housing project(comprising of 7. 9 and 12 floors) in Addis Ababa (April 2015).
n China’s Tsehay Real Estate Plc has begun work on a US$150 millionupmarket complex of flats, offices, retail outlets and a hotel next to thecity light rail (July, 2015).
n In June 2013, Chinese Geo-Engineering Corporation startedconstruction of a real estate complex which will include 21 high-risebuildings of between 12 and 15 storeys to be completed by 2015.
c) Owner-built housing construction: Self-built housing was by far the mostcommon type of housing delivery approach before the introduction of theIntegrated Housing Development Programme. Though relatively limited now,this building approach is still active in older residential neighbourhoods. Costsfor owner-built construction are generally higher and this segment of themarket tends to include the full range of housing units from modest homesconstructed over extended periods to large and luxurious homes often builtby razing or replacing older properties.
d) Home construction by Housing Cooperatives: Cooperative housingdevelopments, organised by groups that share a common employer ormembership, have been a long-standing feature of the residential real estatemarket. The city administration has registered more than 500 housingcooperatives. The minimum membership in a housing cooperative is 14 whilethe maximum is 24. Many cooperatives members are middle-income, basedon employer associations such as Ethiopian Airlines or other state-ownedcompanies. In recent news, Ethiopian Airlines has invited nine companies tobid to take over an employee housing project from a Chinese contractor.The project entails the construction of 2 502 housing units in two phases ona 313 300 m2 plot in the Bole District.
Property markets
In the World Bank’s 2015 Doing Business Report, registering a property requires10 procedures, takes 41 days and costs 2.1 percent of the property value; for this,Ethiopia ranks 104th globally. This is still cheaper and quicker compared to the restof the region. However, key obstacles remain, including land policies, the scarcityand cost of construction material, the lack of basic supporting infrastructure andthe lack of long-term financing.
All land is owned by the state. Land administration is divided betweenmunicipalities (for urban land) and regional governments (for rural land). In urbanareas there is a system of leasehold tenure, which has replaced the permit system;in rural and peri-urban areas a permit system (based on use rights) applies. Interms of the leasehold system in urban areas ,individuals lease land from thegovernment for up to 99 years. The lease may be transferred between privateindividuals but only on the basis of the lease being used as surety or collateral; thelease cannot be traded to a third party. The government has the right to take theland back, on payment of compensation for improvements made. Compensationis not paid for the value of the land itself. In the conversion from the permit tothe lease system, government converts the permits to leases when a land transfertransaction is being carried out. Foreigners are barred from owning property inEthiopia.
In urban areas, formal land delivery is through planning and public auction by citygovernment. New parcels of land are leased with a fixed lease period andconditions according to a land use plan. Alongside this land delivery system a cashland market operates in which people exchange leases or permits through saleagreements. Buyers pay property transfer taxes and commissions to middlemen.Within the city boundary, new parcels of land come onto the market through aninformal system without planning or documentation. The exchange is usuallyamong personal connections, and a simple sale agreement confirms the transaction.About 90 percent of these parcels are subdivisions of land with ‘permission tooccupy’ rather than titles.
The recent growth in the property market has led to a surge in building activity.Manufacturing related to the construction industry constitutes one of the largestand fastest growing industries.

92
Policy and regulation
Until recently, there were few national coordination policies regarding housing andurban development. There are now a number of players in the sector that arefocused in addressing the housing shortfall as well as the associated land andtenure issues. In 2005, the national Ministry of Works and Urban Development(MWUD) was established in order to guide the overall development of thecountry’s urban areas and conducting studies on its urbanisation patterns. It hassince been renamed the Ministry of Urban Development, Housing andConstruction. Cities and regional governments are responsible for preparingphysical urban development plans, and the Housing Development Bureau workstowards the implementation of the second phase of the IHDP in Addis Ababa,including the Micro and Small Enterprises Development Programs.
A number of policies govern the housing sector, including the following:
n Urban Development Policy (2005): Formulated by the Council of Ministersof the Federal Democratic Republic of Ethiopia to link together the small-scaleefforts made by regional governments and cities since 2000.
n The Federal Rural Land Administration and Land Use Proclamation No.456/2005: Enacted for the purpose of ensuring tenure security, strengtheningproperty rights of farmers, sustainably conserving and developing naturalresources, establishing land data base, and establishing an efficient landadministration in the country.
n Expropriation of Landholdings for Public Purposes and Payment ofCompensation and Council of Ministers Regulation No. 135/2007: The FederalConstitution vests in the government the power to expropriate privateproperty in the public interest, provided it pays compensation prior toacquisition and in an amount commensurate with the value of the seizedproperty.
n Ethiopian Building Proclamation 624/2009 formal sector: A legal documentoutlining the building regulations and requirements, for use by local authoritiesto ensure building standards are maintained in their jurisdiction. Parts ofEthiopia are located in an earthquake zone and a code exists to ensurebuildings resist maximum predicted earthquake loads. The codes are onlyused and enforced in buildings developed in the formal sector.
n Proclamation (number unknown): Allowed the importation of cement as thelack of locally available cement caused major construction delays forcondominium projects
n A number of proclamations exist between 2002 – 2005 deal with the leaseholding of land, condominiums and land expropriation provisions.
n Regulation No. 15/2004: Outlines the establishment of the Addis Ababa CityGovernment Housing Development Project office and outlines its duties andresponsibilities.
n Regulation No. 12/2004: Outlines the condominium regulations for AddisAbaba city, regulating further details to Proclamation No. 370/2003.
In June 2013, it was reported that a bill to regulate the rental sector was underconsideration. Of the estimated 600 000 families living in rental accommodation,373 000 rent from government. The new bill would regulate housing standardsand rental relationships. Two other pieces of legislation are also underconsideration: a real estate law and a law that penalises those who unlawfullyregister or take a house.
Opportunities
Like many other African countries, Ethiopia has a great need for affordable housingdelivery. Housing finance markets are destined for growth at virtually all incomelevels, but particularly within the lower to middle income ranges. Real estatedevelopments have tended to focus on the high end of the market but there isconsiderable unmet demand for less expensive homes for professionals andmiddle-income households, to the extent that supply can be expanded for homesin the range of ETB400 000 (US$19 295) to ETB1 000 000 (US$48 239).
A sector that warrants further development and exploration is Ethiopia’smicrofinance industry, one of the largest in Africa. Given relative tenure security,this creates enormous potential for the development of housing microfinanceproducts which are appropriate for low income earners. Formal encouragementof self-build construction is required, especially through regulatory reform aroundbuilding standards and greater product innovation by banks.
Due to expensive and inefficient building materials, there is a huge requirement forcost-effective housing at a faster speed and larger scale. Developers with cheaperand unconventional construction materials have significant advantages overcompetitors. Promising prospects include the use of pre-fabricated boards, steel-based construction of high rise buildings, and locally available environmentallyfriendly building materials.
Sources
Access Capital Research (2010). Sector Report-Real Estate, May 2010.African Economic Outlook (2015). Ethiopia 2015. AfDB, OECF, UNDP.African Union for Housing Finance (2015). Financing Housing in Africa. Issue41:March 2015.Ayenew, M. (2009). Access to Housing Finance in Africa: Exploring the Issues(No. 9) Ethiopia. Report. Commissioned by the FinMark Trust with supportfrom Habitat for Humanity. BMI (2014). Industry Brief – Ethiopian Bank Profitability Could Drop On LowerDeposits, Lending, 17 January 2012.Construction and Business Bank (2008). Annual Report 2007/2008.Deribie, E (2014). Impacts of the Grand Housing Programs of the Governmentof Ethiopia on Private Banks, January 2014. Scholarly Journal of BusinessAdministration, Vol. 4(1) pp 26-33.Eshete, Z.S., Tesome, K.W., Abebe, T.K. (2013). Competition in Ethiopian BankingIndustry, December 2013. African Journal of Economics, Vol. 1 (5), pp. 176-190.EIU (2015). Country Risk Service: Ethiopia, June 2015.Federal Democratic Republic of Ethiopia (2010). Ministry of Works and UrbanDevelopment. Housing Development Programme: 2006-2010 PlanImplementation Report. Federal Democratic Republic of Ethiopia (2011). Federal Negarit Gazeta of the18th Year, Number 4, Addis Ababa, 28 November 2011.Habitat for Humanity Ethiopia (2011). Key Housing Issues in Ethiopia:Challenges of the Housing Situation in Ethiopia & HfH Ethiopia’s approach inproviding housing for low income families, 5 April 2011. Presented at the FirstHousing Forum Europe and Central Asia.IMF (2014). 2014 Article IV Consultation- Staff report; Press release; andStatement by the Executive Director for the Federal Democratic Republic ofEthiopia, 5 September 2014.Marcopolis (2014). Developing the real estate market in Addis Ababa- GIFTReal Estate, 29 January 2014. http://www.marcopolis.net/developing-the-real-estate-market-in-addis-ababa-gift-real-estate-2801.htmMinistry of Urban Development, Housing and Construction (2015). HousingDevelopment: The Ethiopian Experience. Study on Africa’s Market DynamicsRegional Workshop. Addis Ababa (17-19 February 2015).National Bank of Ethiopia (2010). Monthly Macroeconomic Indicators forMarch. UN-Habitat (2011). Condominium Housing in Ethiopia: The Integrated HousingDevelopment Programme.Urban Expansion (2013). The Ethiopia Urban Expansion Initiative: InterimReport 2. NYU Stern and the Urbanisation Project.Urban LandMark (2011). Urban Land Markets in East Africa, March 2011.USAID (2011). Ethiopia: Property Rights and Resource Governance.Worku, G. (2010). Electronic Banking in Ethiopia, Journal of Internet Bankingand Commerce.World Bank (2013). Doing Business 2014: Ethiopia.
Websites
www.acsi.org.et addisfortune.netwww.afkinsider.com www.allafrica.comwww.allbusiness.com www.cbb.com.etwww.citiesalliance.org www.combanketh.com www.csa.gov.et www.doingbusiness.orgwww.economist.com www.engineeringnews.co.zawww.ethiomedia.com www.ethiopiahope.comwww.forbes.com www.mixmarket.orgwww.nbe.gov.et www.numbeo.comhttp://www.imf.org www.worldbank.org

Africa Housing Finance Yearbook 2015
93
Gambia, The
disbursement of US$10.8 million under the rapid credit facility in order to coverurgent national needs. According to the Central Bank of The Gambia (CBG),domestic public debt rose by 39 percent year-on-year between December 2013and 2014.
CBG uses its reserves as its main policy instrument, but also uses interest rates tosignal changes in policy. The CBG increased its rediscount rate (its main policyrate) by 200 basis points in August 2014 and followed this with an additional 100basis points hike, to 23 percent nine months later. This tightening monetary policyreflects the Central Bank’s concern over inflation. In an attempt to improve theeffectiveness of monetary policy, the CBG is planning to replace the currentrediscount rate with a repurchase (repo) rate.
Access to finance
The Gambian financial market is underdeveloped and has limited financialproducts. Doing Business 2015 ranks the Gambia 160th out of 189 economies forgetting credit. The sector comprises of 12 banks (one of which is an Islamic bank)with the remaining 11 conventional banks being mostly foreign owned. There hasbeen an influx of foreign banks over the years, which has increased the penetrationof financial services in the country. That being said, only four large banks control68.1 percent of the industry’s total assets, indicating high concentration in thebanking sector. Furthermore, the banks are mainly located in the greater Banjularea. The banking penetration rate is approximately 25 percent for the urban
Overview
With an area of only 11 000 km2 and a total population of approximately 1.9 millionpeople, the Gambia is one of the smallest countries on the continent and alsoone of the most densely populated in Africa (with 173.6 persons per km2).Although the country’s market size is much smaller compared to some of its WestAfrican neighbours, the Gambia has the comparative advantage of being one ofthe most politically stable countries in the region. According to the World Bank’s2015 Doing Business report, Gambia improved six places in its overall ranking fordoing business since 2014 – it now sits at 138 out of 189 countries.
Due to a relatively high urbanisation rate of a 4.3 percent, approximately59 percent of Gambians live in cities. Spatial inequality remains a critical issue inthe Gambia as there is a large rural-urban gap in income and wealth. It is estimatedthat on average, 48 percent of people lived below the national poverty line. Whileremittances from the large diaspora have helped alleviate poverty, highunemployment and underemployment, particularly among women and the youth,is one of the major causes of poverty in the Gambia. Youth unemployment isestimated at over 40 percent – three times higher than among adults. A lack ofemployment opportunities is spurring a number of people (many of them highlyskilled) to leave the country. In 2011, authorities launched the Programme toAccelerate Growth and Employment (PAGE), a poverty reduction strategy thatemphasised agriculture and investment in infrastructure to help boost incomesparticularly for the rural poor.
In 2011, a drought caused a contraction of the Gambia’s GDP. GDP recoveredmoderately in 2012 and in 2013, and a further 1.6 percent in 2014, according toestimates from the Gambia Bureau of Statistics (GBS). The principal factors behindthe poor growth are the decline in tourism earnings and reduced agriculturaloutputs due to delayed rains in 2014. Furthermore, the negative publicity aboutEbola in the region continues to deter many tourists in the short term, eventhough the Gambia was free from the epidemic.
Although the government maintains a broad commitment to macroeconomicstability, policy slippages over the past few years have exacerbated the Gambia’seconomic difficulties. A failure to meet fiscal targets and limit domestic borrowinghas resulted in the abandonment of the three-year extended credit facility agreedwith the IMF in 2012. In April 2015, the IMF approved the immediate
KEY FIGURES
Main Urban Centres Banjul (capital), Serekunda
Exchange Rate: 1 US$***Inflation 2013 | 2014 (est.) | 2015 (prov.) | 2016 (prov.) *
40.13 Gambian Dalasi (GMD)5.2 | 6.1 | 5.3 | 5.3
Population^ | Population growth rate (2013)^Urban population (% of total)^ | Urbanisation rate (% in 2013)^
1 908 954 | 3.1859.02 | 4.27
GDP / capita (current US$)^ | GDP growth rate (annual %)^GNI / capita, Atlas method (current US$) ^Population below national poverty line*Unemployment rate (%)*Gini co-efficient (year of survey)^^HDI (Global Ranking)" | HDI (Country Index Score)”
422.78 | -0.2045048.47.747.28 (2003)172 | 0.441
Lending Interest Rate^Mortgage Interest Rate (%) | Mortgage Term (years)#Credit % of GDP^Average Mortgages % of GDP° Price To Rent Ratio City Centre** | Outside City Centre**Gross Rental Yield City Centre** | Outside of City Centre**Outstanding home loan (% age 15+)##
28.5020.00 | 1513.45............
What is the cost of standard 50kg bag of cement (in US$)? #What is the price of the cheapest, newly built house by a formaldeveloper or contractor (in US$)? #What is the size of this house (in m2)? #What is the average rental price for a formal unit (in US$/month)#What is the minimum plot size for residential property (in m²)#
6.90
50 00022061 – 257...
Ease of doing business rank !Number of procedures to register property !Time (days) to register property !Cost (% of property value) to register property !
1385667.60
*** Conmill.com The Currency Converter^ World Bank's World Development Indicators (2014)~ World Bank PovcalNet: an online poverty analysis tool, various years^^ The World Bank's PovCalnet" UNDP's International Human Development Indicators (2014)° Various: Badev et al. "Housing Finance Across Countries: New Data and Analysis" – Unpublished
paper/Hofinet/World Bank## Global Financial Inclusion Database (FINDEX)# CAHF Annual Survey Data (September 2015)! World Bank's Doing Business Survey Data (2015)** Numbeo Online User-Contributed Database
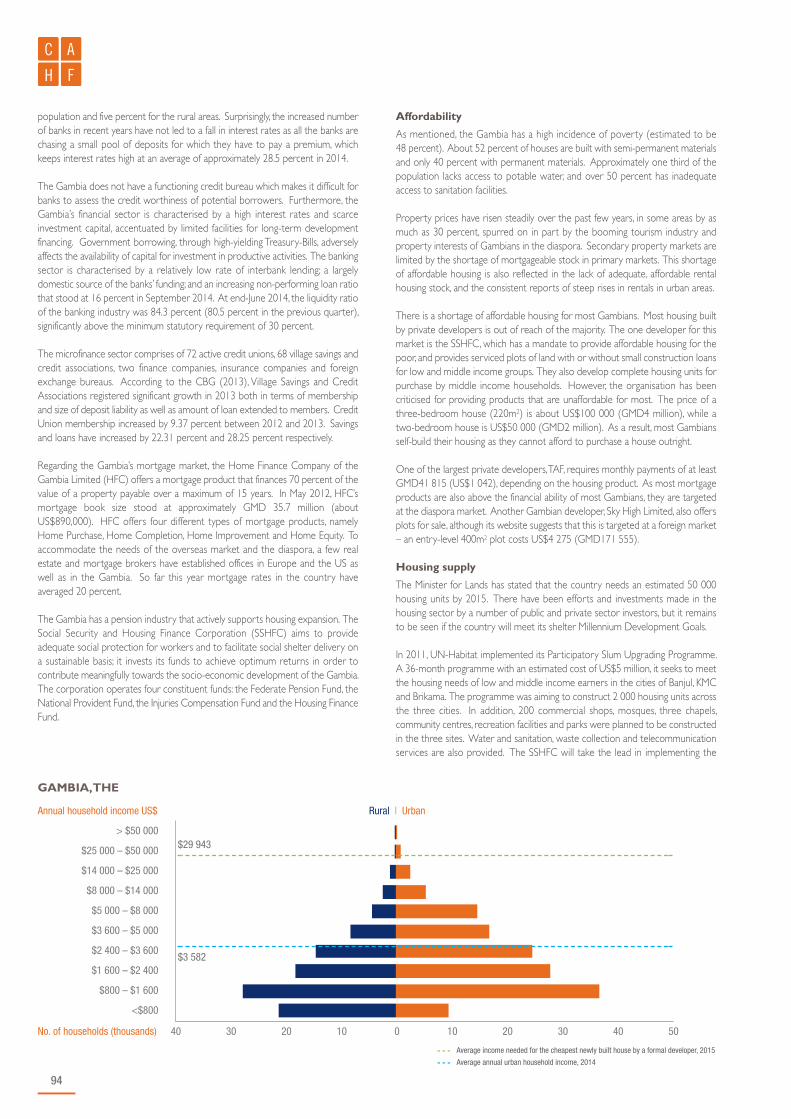
94
population and five percent for the rural areas. Surprisingly, the increased numberof banks in recent years have not led to a fall in interest rates as all the banks arechasing a small pool of deposits for which they have to pay a premium, whichkeeps interest rates high at an average of approximately 28.5 percent in 2014.
The Gambia does not have a functioning credit bureau which makes it difficult forbanks to assess the credit worthiness of potential borrowers. Furthermore, theGambia’s financial sector is characterised by a high interest rates and scarceinvestment capital, accentuated by limited facilities for long-term developmentfinancing. Government borrowing, through high-yielding Treasury-Bills, adverselyaffects the availability of capital for investment in productive activities. The bankingsector is characterised by a relatively low rate of interbank lending; a largelydomestic source of the banks’ funding; and an increasing non-performing loan ratiothat stood at 16 percent in September 2014. At end-June 2014, the liquidity ratioof the banking industry was 84.3 percent (80.5 percent in the previous quarter),significantly above the minimum statutory requirement of 30 percent.
The microfinance sector comprises of 72 active credit unions, 68 village savings andcredit associations, two finance companies, insurance companies and foreignexchange bureaus. According to the CBG (2013), Village Savings and CreditAssociations registered significant growth in 2013 both in terms of membershipand size of deposit liability as well as amount of loan extended to members. CreditUnion membership increased by 9.37 percent between 2012 and 2013. Savingsand loans have increased by 22.31 percent and 28.25 percent respectively.
Regarding the Gambia’s mortgage market, the Home Finance Company of theGambia Limited (HFC) offers a mortgage product that finances 70 percent of thevalue of a property payable over a maximum of 15 years. In May 2012, HFC’smortgage book size stood at approximately GMD 35.7 million (aboutUS$890,000). HFC offers four different types of mortgage products, namelyHome Purchase, Home Completion, Home Improvement and Home Equity. Toaccommodate the needs of the overseas market and the diaspora, a few realestate and mortgage brokers have established offices in Europe and the US aswell as in the Gambia. So far this year mortgage rates in the country haveaveraged 20 percent.
The Gambia has a pension industry that actively supports housing expansion. TheSocial Security and Housing Finance Corporation (SSHFC) aims to provideadequate social protection for workers and to facilitate social shelter delivery ona sustainable basis; it invests its funds to achieve optimum returns in order tocontribute meaningfully towards the socio-economic development of the Gambia.The corporation operates four constituent funds: the Federate Pension Fund, theNational Provident Fund, the Injuries Compensation Fund and the Housing FinanceFund.
Affordability
As mentioned, the Gambia has a high incidence of poverty (estimated to be48 percent). About 52 percent of houses are built with semi-permanent materialsand only 40 percent with permanent materials. Approximately one third of thepopulation lacks access to potable water, and over 50 percent has inadequateaccess to sanitation facilities.
Property prices have risen steadily over the past few years, in some areas by asmuch as 30 percent, spurred on in part by the booming tourism industry andproperty interests of Gambians in the diaspora. Secondary property markets arelimited by the shortage of mortgageable stock in primary markets. This shortageof affordable housing is also reflected in the lack of adequate, affordable rentalhousing stock, and the consistent reports of steep rises in rentals in urban areas.
There is a shortage of affordable housing for most Gambians. Most housing builtby private developers is out of reach of the majority. The one developer for thismarket is the SSHFC, which has a mandate to provide affordable housing for thepoor, and provides serviced plots of land with or without small construction loansfor low and middle income groups. They also develop complete housing units forpurchase by middle income households. However, the organisation has beencriticised for providing products that are unaffordable for most. The price of athree-bedroom house (220m2) is about US$100 000 (GMD4 million), while atwo-bedroom house is US$50 000 (GMD2 million). As a result, most Gambiansself-build their housing as they cannot afford to purchase a house outright.
One of the largest private developers, TAF, requires monthly payments of at leastGMD41 815 (US$1 042), depending on the housing product. As most mortgageproducts are also above the financial ability of most Gambians, they are targetedat the diaspora market. Another Gambian developer, Sky High Limited, also offersplots for sale, although its website suggests that this is targeted at a foreign market– an entry-level 400m2 plot costs US$4 275 (GMD171 555).
Housing supply
The Minister for Lands has stated that the country needs an estimated 50 000housing units by 2015. There have been efforts and investments made in thehousing sector by a number of public and private sector investors, but it remainsto be seen if the country will meet its shelter Millennium Development Goals.
In 2011, UN-Habitat implemented its Participatory Slum Upgrading Programme.A 36-month programme with an estimated cost of US$5 million, it seeks to meetthe housing needs of low and middle income earners in the cities of Banjul, KMCand Brikama. The programme was aiming to construct 2 000 housing units acrossthe three cities. In addition, 200 commercial shops, mosques, three chapels,community centres, recreation facilities and parks were planned to be constructedin the three sites. Water and sanitation, waste collection and telecommunicationservices are also provided. The SSHFC will take the lead in implementing the
> $50 000
$25 000 – $50 000
$14 000 – $25 000
$8 000 – $14 000
$5 000 – $8 000
$3 600 – $5 000
$2 400 – $3 600
$1 600 – $2 400
$800 – $1 600
<$800
GAMBIA, THE
$29 943
$3 582
Rural | UrbanAnnual household income US$
No. of households (thousands) 40 30 20 10 0 10 20 30 40 50
- - - Average income needed for the cheapest newly built house by a formal developer, 2015
- - - Average annual urban household income, 2014
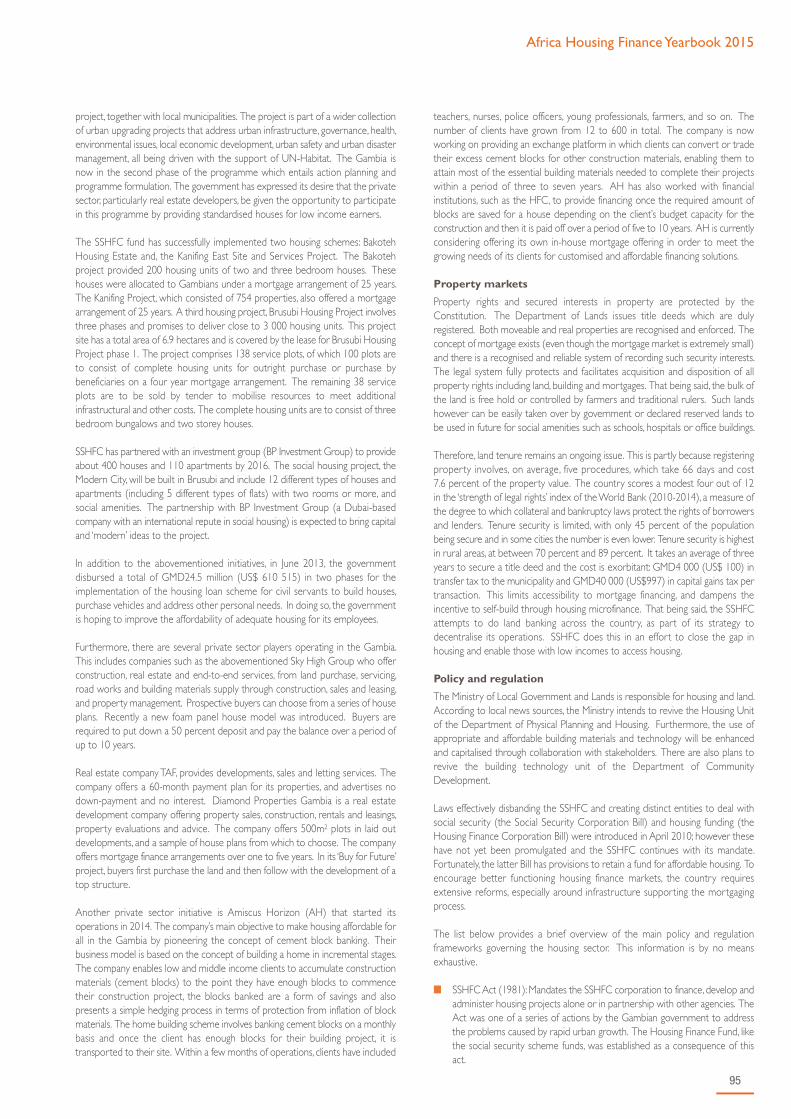
Africa Housing Finance Yearbook 2015
95
project, together with local municipalities. The project is part of a wider collectionof urban upgrading projects that address urban infrastructure, governance, health,environmental issues, local economic development, urban safety and urban disastermanagement, all being driven with the support of UN-Habitat. The Gambia isnow in the second phase of the programme which entails action planning andprogramme formulation. The government has expressed its desire that the privatesector, particularly real estate developers, be given the opportunity to participatein this programme by providing standardised houses for low income earners.
The SSHFC fund has successfully implemented two housing schemes: BakotehHousing Estate and, the Kanifing East Site and Services Project. The Bakotehproject provided 200 housing units of two and three bedroom houses. Thesehouses were allocated to Gambians under a mortgage arrangement of 25 years.The Kanifing Project, which consisted of 754 properties, also offered a mortgagearrangement of 25 years. A third housing project, Brusubi Housing Project involvesthree phases and promises to deliver close to 3 000 housing units. This projectsite has a total area of 6.9 hectares and is covered by the lease for Brusubi HousingProject phase 1. The project comprises 138 service plots, of which 100 plots areto consist of complete housing units for outright purchase or purchase bybeneficiaries on a four year mortgage arrangement. The remaining 38 serviceplots are to be sold by tender to mobilise resources to meet additionalinfrastructural and other costs. The complete housing units are to consist of threebedroom bungalows and two storey houses.
SSHFC has partnered with an investment group (BP Investment Group) to provideabout 400 houses and 110 apartments by 2016. The social housing project, theModern City, will be built in Brusubi and include 12 different types of houses andapartments (including 5 different types of flats) with two rooms or more, andsocial amenities. The partnership with BP Investment Group (a Dubai-basedcompany with an international repute in social housing) is expected to bring capitaland ‘modern’ ideas to the project.
In addition to the abovementioned initiatives, in June 2013, the governmentdisbursed a total of GMD24.5 million (US$ 610 515) in two phases for theimplementation of the housing loan scheme for civil servants to build houses,purchase vehicles and address other personal needs. In doing so, the governmentis hoping to improve the affordability of adequate housing for its employees.
Furthermore, there are several private sector players operating in the Gambia.This includes companies such as the abovementioned Sky High Group who offerconstruction, real estate and end-to-end services, from land purchase, servicing,road works and building materials supply through construction, sales and leasing,and property management. Prospective buyers can choose from a series of houseplans. Recently a new foam panel house model was introduced. Buyers arerequired to put down a 50 percent deposit and pay the balance over a period ofup to 10 years.
Real estate company TAF, provides developments, sales and letting services. Thecompany offers a 60-month payment plan for its properties, and advertises nodown-payment and no interest. Diamond Properties Gambia is a real estatedevelopment company offering property sales, construction, rentals and leasings,property evaluations and advice. The company offers 500m2 plots in laid outdevelopments, and a sample of house plans from which to choose. The companyoffers mortgage finance arrangements over one to five years. In its ‘Buy for Future’project, buyers first purchase the land and then follow with the development of atop structure.
Another private sector initiative is Amiscus Horizon (AH) that started itsoperations in 2014. The company’s main objective to make housing affordable forall in the Gambia by pioneering the concept of cement block banking. Theirbusiness model is based on the concept of building a home in incremental stages.The company enables low and middle income clients to accumulate constructionmaterials (cement blocks) to the point they have enough blocks to commencetheir construction project, the blocks banked are a form of savings and alsopresents a simple hedging process in terms of protection from inflation of blockmaterials. The home building scheme involves banking cement blocks on a monthlybasis and once the client has enough blocks for their building project, it istransported to their site. Within a few months of operations, clients have included
teachers, nurses, police officers, young professionals, farmers, and so on. Thenumber of clients have grown from 12 to 600 in total. The company is nowworking on providing an exchange platform in which clients can convert or tradetheir excess cement blocks for other construction materials, enabling them toattain most of the essential building materials needed to complete their projectswithin a period of three to seven years. AH has also worked with financialinstitutions, such as the HFC, to provide financing once the required amount ofblocks are saved for a house depending on the client’s budget capacity for theconstruction and then it is paid off over a period of five to 10 years. AH is currentlyconsidering offering its own in-house mortgage offering in order to meet thegrowing needs of its clients for customised and affordable financing solutions.
Property markets
Property rights and secured interests in property are protected by theConstitution. The Department of Lands issues title deeds which are dulyregistered. Both moveable and real properties are recognised and enforced. Theconcept of mortgage exists (even though the mortgage market is extremely small)and there is a recognised and reliable system of recording such security interests.The legal system fully protects and facilitates acquisition and disposition of allproperty rights including land, building and mortgages. That being said, the bulk ofthe land is free hold or controlled by farmers and traditional rulers. Such landshowever can be easily taken over by government or declared reserved lands tobe used in future for social amenities such as schools, hospitals or office buildings.
Therefore, land tenure remains an ongoing issue. This is partly because registeringproperty involves, on average, five procedures, which take 66 days and cost7.6 percent of the property value. The country scores a modest four out of 12in the ‘strength of legal rights’ index of the World Bank (2010-2014), a measure ofthe degree to which collateral and bankruptcy laws protect the rights of borrowersand lenders. Tenure security is limited, with only 45 percent of the populationbeing secure and in some cities the number is even lower. Tenure security is highestin rural areas, at between 70 percent and 89 percent. It takes an average of threeyears to secure a title deed and the cost is exorbitant: GMD4 000 (US$ 100) intransfer tax to the municipality and GMD40 000 (US$997) in capital gains tax pertransaction. This limits accessibility to mortgage financing, and dampens theincentive to self-build through housing microfinance. That being said, the SSHFCattempts to do land banking across the country, as part of its strategy todecentralise its operations. SSHFC does this in an effort to close the gap inhousing and enable those with low incomes to access housing.
Policy and regulation
The Ministry of Local Government and Lands is responsible for housing and land.According to local news sources, the Ministry intends to revive the Housing Unitof the Department of Physical Planning and Housing. Furthermore, the use ofappropriate and affordable building materials and technology will be enhancedand capitalised through collaboration with stakeholders. There are also plans torevive the building technology unit of the Department of CommunityDevelopment.
Laws effectively disbanding the SSHFC and creating distinct entities to deal withsocial security (the Social Security Corporation Bill) and housing funding (theHousing Finance Corporation Bill) were introduced in April 2010; however thesehave not yet been promulgated and the SSHFC continues with its mandate.Fortunately, the latter Bill has provisions to retain a fund for affordable housing. Toencourage better functioning housing finance markets, the country requiresextensive reforms, especially around infrastructure supporting the mortgagingprocess.
The list below provides a brief overview of the main policy and regulationframeworks governing the housing sector. This information is by no meansexhaustive.
n SSHFC Act (1981): Mandates the SSHFC corporation to finance, develop andadminister housing projects alone or in partnership with other agencies. TheAct was one of a series of actions by the Gambian government to addressthe problems caused by rapid urban growth. The Housing Finance Fund, likethe social security scheme funds, was established as a consequence of thisact.

96
n State Lands Act (1991): Provides a legal basis to improve and rationalise theland tenure system by the replacement of the customary tenure with a long-term (99 year) leasehold system in designated (specified) areas of the country.
n The Physical Planning and Development Control Act (1991): Provides aunified legal basis for preparation and approval of physical development plans,control of developments (including buildings) and for creating a betterenvironment and proper use of land in The Gambia.
n Land Acquisition and Compensation Act (1991): A legal instrument by whichthe government can acquire land and compensate persons (including freeholdland) anywhere in the country for public and planning purposes.
n The Survey Act (1991): Provides a legal basis for the establishment ofstandards and specifications for survey work, to ensure protection of surveymarks, to enable private surveyors to undertake official survey, and forcadastral surveys for registration of title to land.
n Rent Tribunal (August 2014): Designed to introduce a new legal regime forthe regulation of rent matters. It aims to produce two main benefits, namely:it will enable the house owners to let out their properties to tenants basedon an officially-approved rental fee; and potential tenants are also able toaccess and to occupy affordable housing. Under the new law, each renttribunal would have a registrar keeping an up-to-date register of all rentedproperty within its jurisdiction, as well as the personal details oflandlords/landladies. A landlord/landlady is required to register rentedproperties using a prescribed form. Failure to do so is an offence.
Opportunities
The Gambian market offers potential in the areas of high income and tourismhousing development. Substantial remittances from the diaspora provide a usefulsource of housing finance that can be harnessed by both mortgage andmicrofinance lenders.
Like many African countries, the affordable housing market is inadequately served.More recent interventions by UN-Habitat may shift the investment focus of theprivate sector and open up opportunities for interventions that better target lowerincome earners. The high levels of informality and an established microfinanceindustry point at potential for housing microfinance, which could be supported bythe well-developed pensions industry.
There is a push for the use of alternate approaches, technologies and materials (forexample, the use of burnt bricks made from lacerite clay sand that is widespreadin the country) which could reduce the need for cement and other importedmaterials and speed up the improvement of housing. Therefore, there areconsiderable opportunities for investors who provide innovative housing solutions.
Sources
African Economic Outlook (2015). Gambia, AfDB, OECD, UNDP.African Union for Housing Finance (2014). Financing Housing in Africa, March2014. Issue 33.African Union for Housing Finance (2012). Financing Housing in Africa, May 2012.Issue 14.Central Bank of the Gambia (2013). Annual Report 2013.EIU (2015). Country Report: Gambia, August 2015.IMF (2015). Request for the disbursement under the Rapid Credit Facility,Cancellation of the Extended Credit Facility, and Proposal for a Staff-MonitoredProgramme – Staff Report; Press Release; and Statement by the Executive Directorfor the Gambia. The Point (Banjul) (2014). Gambia We Welcome the New Rent Tribunal Bill, 28August 2014. Editorial.UN Habitat (2014). The State of African Cities 2014: Reimagining SustainableUrban Transitions.UN Habitat (2011). The Gambia: National Urban Profile. Prepared by Guiebo, J. andSommer, K.U.S. Department of State (2015). 2015 Investment Climate Statement: Gambia(May 2015).World Bank (2014). Doing Business Report: Gambia, 2015.
Websites
www.allafrica.comwww.africaneconomicoutlook.orgwww.auhf.co.zawww.cbg.gmhttp://data.worldbank.org/indicator/IC.LGL.CRED.XQwww.doingbusiness.orghttp://gambiabusinessupdates.blogspot.comwww.gambianow.comwww.gambiapropertyshop.comwww.hfc.org.gmwww.mfw4a.orgwww.mixmarket.orghttp://www.numbeo.comhttp:// observer.gmwww.sshfc.gmhttp://standard.gmwww.tafgambia.comwww.tafgambianproperty.comhttp://thepoint.gmwww.unhabitat.orgwww.worldbank.org

Africa Housing Finance Yearbook 2015
97
Ghana
develop properties that are left unsold. The financial sector has 26 commercialbanks, 443 microfinance institutions and three credit bureaus (XDS Data, HudsonPrice and Dun and Bradstreet). Out of the 26 commercial banks, only seven arelisted on the Ghana Stock Exchange. According to the World Bank’s 2015 DoingBusiness Report, in the ‘ease of getting credit’ category, Ghana is ranked 36th outof 189 countries. In 2012, the World Bank launched the Global Financial InclusionDatabase (Global Findex) to explore levels of financial inclusion around the world.According to Global Findex, the use of credit is fairly common – 39.2 percent ofadults over 25 years of age report that they had a loan. Currently in 2015, veryfew Ghanaians have an outstanding loan to purchase a home: 1.9 percent of thetop 60 percent of income earners and 3.1 percent of the bottom 40 percent ofincome earners.
Only five of Ghana’s 26 banks officially offer mortgage loans as a product (namelyHFC Bank, Fidelity Bank, CalBank, Stanbic Bank and UT Bank which grantsmortgage on a limited basis to customers of its subsidiary UT Properties), inaddition, to Ghana Home Loans (GHL) which is the country’s only residentialmortgage lender. Less than three percent of loans granted by banks in Ghana gointo housing finance. Most banks neglect the home loans market and focus insteadon short-term lending and investment such as risk-free government bonds andtrade finance that offers higher returns while consuming less capital. The totalhome loans book in Ghana is in excess of US$200 million and the number of
Overview
The past two decades have seen Ghana experiencing strong and inclusive growth.The country has out-performed regional peers in reducing poverty and improvingsocial indicators. This led to high volumes of direct foreign investments (DFI) withinthe period.
However, due to the government’s excessive borrowing short-term vulnerabilitieshave risen significantly amid high fiscal and current account deficits to the extentthat the current debt burden of the nation has risen to approximatelyGHC98.6 billion (US$25.2 billion). The country’s international reserve position hasweakened alongside mounting public debt. High interest rates and a depreciatingcurrency have begun to weaken private sector activity. Economic growth hasslowed with the current GDP rate of 38.65 percent at the end of June 2015 from48.59 percent as at January 2015 and inflation rate of 17.9 percent as of July 2015.
There is a general economic activity slowdown which has been exacerbated by thecurrent perennial energy crisis combined with high costs of fuel products toprovide power which has virtually collapsed most home-grown Ghanaianbusinesses such as hair dressers, carpenters, welders, some microfinance businessesand most SMEs which heavily depend on constant supply of electricity to dobusiness.
In March 2015, Moody’s downgraded the country’s sovereign rating for the secondtime from B2 to B3 due mainly to the country’s deteriorating debt burden andlarge fiscal imbalances and a sharp weakening of the Cedi. However, with therecent positive review by the IMF, a partial bond guarantees by the World Bankand the resumption of donor support the country’s currency, the Cedi gainedsome ground against other major currencies within the past two months.
Access to Finance
Over the past years, Ghana’s financial system has undergone intensive regulatoryreform and restructuring that resulted in an increase in credit offered bycommercial banks until recently when there was an acute credit crunch in theeconomy. This recent phenomenon has resulted in the financial institutionscurtailing the amount of credit they offer which includes the amount of creditoffered for the purchase of residential properties. Some of the banks are currentlyforeclosing on real estate developers who were given construction finance to
KEY FIGURES
Main Urban Centres Accra (capital), Kumasi
Exchange Rate: 1 US$***Inflation 2013 | 2014 (est.) | 2015 (prov.) | 2016 (prov.) *
3.91 Ghanaian Cedi (GHS)11.7 | 17.0 | 8.3 | 8.7
Population^ | Population growth rate (2013)^Urban population (% of total)^ | Urbanisation rate (% in 2013)^
26 442 178 | 2.0553.39 | 3.29
GDP / capita (current US$)^ | GDP growth rate (annual %)^GNI / capita, Atlas method (current US$) ^Population below national poverty line*Unemployment rate (%)*Gini co-efficient (year of survey)^^HDI (Global Ranking)" | HDI (Country Index Score)”
1 461.61 | 4.181 62024.25.3_42.76 (2005)138 | 0.573
Lending Interest Rate^Mortgage Interest Rate (%) | Mortgage Term (years)#Credit % of GDP^Average Mortgages % of GDP° Price To Rent Ratio City Centre** | Outside City Centre**Gross Rental Yield City Centre** | Outside of City Centre**Outstanding home loan (% age 15+)##
12.5 – 35^*28.00 | 20...0.25% (2010)7.99 | 6.3612.52% | 15.73%12.03
What is the cost of standard 50kg bag of cement (in US$)? #What is the price of the cheapest, newly built house by a formaldeveloper or contractor (in US$)? #What is the size of this house (in m2)? #What is the average rental price for a formal unit (in US$/month)#What is the minimum plot size for residential property (in m²)#
8.00
24 35840500111
Ease of doing business rank !Number of procedures to register property !Time (days) to register property !Cost (% of property value) to register property !
705461.10
*** Conmill.com The Currency Converter^ World Bank's World Development Indicators (2014)~ World Bank PovcalNet: an online poverty analysis tool, various years^^ The World Bank's PovCalnet" UNDP's International Human Development Indicators (2014)° Various: Badev et al. "Housing Finance Across Countries: New Data and Analysis" – Unpublished
paper/Hofinet/World Bank## Global Financial Inclusion Database (FINDEX)# CAHF Annual Survey Data (September 2015)! World Bank's Doing Business Survey Data (2015)** Numbeo Online User-Contributed Database_ GSS: Ghana Statistical Services, 2015^* HFC, Fidelity Bank & Ghana Home Loans, August 2015

98
borrowers just under 6 000. Ghana’s housing finance system (as a share of GDP)is 0.5 percent compared with the African average of 15.7 percent of GDP, makingit one of the lowest in the world.
Though some of the major banks have more than the required capital, they stilldo not finance mortgage loans due to the long tenor of between 10 to 20years to recoup their investment. HFC bank, which is a major provider ofmortgage loans in Ghana, has managed to increase its capital (total equity) fromGH¢32 million in 2009 to GH¢95.4 million in December 2014. Assuming thatHFC Bank will use all its equity to grant mortgage loans for the purchasing of anaverage house with the price of GH¢140 000 (US$35 897), it could give mortgageloans to purchase only about 681 houses. HFC is the only bank that has used thestock exchange to raise funds for mortgage lending by issuing and listing sixcorporate bonds since 1996.
Each of the five banks and GHL offers various mortgage loan products, which canall be categorised into four main loan categories. The first is the Home PurchaseMortgage, which is used for purchasing new houses. The borrower is expectedto make a minimum 20 percent down payment of the cost of the property, whilethe bank provides a loan of 80 percent to cover the purchase price of the property.The loan term is for 20 years, and the interest rates are always variable for the Cedimortgage loans which range between 27 percent and 32 percent among thevarious banks (there are also US dollar denominated mortgage loans which carryfixed interest rates between 12.5 percent and 14 percent among the variousbanks). The second product is the Home Improvement Mortgage, which is forrenovation of already acquired property. These types of mortgage usually carry aterm of five years. Another product is the Home Completion Mortgage, which isused to complete a house under construction. The last product is the HomeEquity Mortgage, is used for realising equity locked up in a property. The HomePurchase Mortgage dominates the market.
Pricing for mortgage loans is in either the local currency (the Cedi) or US Dollars.US dollar loans are mostly given to Ghanaians in diaspora and resident Ghanaianswho earn their incomes in US dollars. Everyone else is given a Cedi loan. Thereare also variations in the interest rates charged for both categories. While interestrate on Cedi loans varies by 30 percent, that of dollar loans is fixed between 12.5to 14 percent (dependent on the lender). This is done to insulate the mortgagebankers from exchange rate risk when they have to pay back on their borrowingsin US dollars from foreign sources.
In Ghana, mortgage loan providers are faced with many challenges such asinsufficient property supplies due to lack of adequate construction financing fromthe banking sector to the real estate developers, the financial institutions haveunderwriting techniques but the lack of well-developed and resourced creditreporting systems. The financial institutions are expected to report all of theircredit data to all three bureaus; the institutions do not frequently report such datato the bureaus for them to update their records. It therefore becomes verydifficult to do a sophisticated underwriting to properly qualify applicants due to lackof updated records of applicants’ credit transactions with other financial institutions.There are also acute delays in title registration of documents from the Land TitleRegistry and there is no reliable database for vital personal information such asdate of birth and residential address. Further, there is no proper address system(the street naming and property numbering address system just started in the lastquarter of 2014) making it very difficult to establish the credit worthiness ofpotential borrowers. There are also difficulties with collateral enforcement. Evenwhere people have standard property that can be used for collateral, landregistration systems in Ghana lack regulation such that most people have nodocuments to prove ownership of their property.
In April 2010 USAID launched and funded a housing microfinance pilotprogramme with Opportunity International, USA, International Land Systems andSinapi Aba Trust. This programme provided US$1 million funding to OpportunityInternational, USA for disbursement to Sinapi Aba and International Land Systemsto promote housing microfinance within the Ashanti and Brong Ahafo regions fortwo years. International Land Systems provided site plans for the recipients andSinapi Aba provided housing microfinance loans. After the success of thisprogramme Sinapi Aba has sourced its own funding to continue the program.
In late 2012, the MasterCard Foundation and Habitat for Humanity International,Ghana, jointly launched a five-year pilot project in Ghana to promote the growthof the housing microfinance and incremental housing construction. TheUS$2.2 million initiative engaged with three microfinance companies in Ghana(Sinapi Aba Savings and Loan, Unicredit and Opportunity International Savings andLoan) to provide technical support in the development of housing microloanproducts. This programme ended in June 2015, with the exception of Sinapi Abathe other two companies did not capitalise on the technical support and citedlack of funding to continue the programme so the 20 000 housing microloans tolow income earners in mostly the rural areas was never achieved.
Global Access Savings and Loan offers housing microfinance loans to low incomeearners in both urban and rural Ashanti region. Mortgage lenders, such as GhanaHome Loans, have reported that despite the difficult operating terrain, the demandfor home loans is very strong and most borrowers are firmly committed tomeeting their loan obligations. Growth in the housing sector has put pressure onmortgage lenders who have struggled to raise funding to meet the demand.Furthermore, the mortgage loans market environment has recently seen signs ofsignificant improvement. These include the introduction of credit bureaus that givelenders access to the credit history of borrowers within seconds; most banks andother financial institutions feel very reluctant to update the bureaus with creditactivities on their customers and this makes it difficult to determine the true creditworthiness of borrowers.
In 2012, Ghana Union Assurance launched the first collateral policy to providecover to finance houses on construction. The Collateral Replacement Indemnity(CRI) targets borrowers in the lower to middle income mortgage market (withincomes below GH¢4 400, or US$1 128) who do not have the deposit requiredby mortgage lenders, but who have the capacity to pay if the debt is spread overa period of time. Working with the support of Home Finance Guarantors AfricaReinsurance Limited, the CRI enables borrowers to access a 100 percent loan.
Finally, the development of a secondary property market in Ghana will be requiredto fuel the growth of the home loans market and enable home loans to achievescale. In addition, there is an appetite for the development of a Real EstateInvestment Trust (REIT) market.
Ghana Home Loans (GHL) in July 2013 hosted a mortgage backed securityconference in Accra to solicit investor confidence with a view to launching amortgage backed security in the first quarter of 2014 to raise US$20 million witha tenor of 5 years at the rate of 7 percent with a semi-annual principal and interestpayments. This initiative was delayed by regulatory issues but have since beenresolved and GHL has made a shelve registration of US$100 million and will issuethe first tranche of US$20 million of this initiative by the first quarter of 2016.
Affordability
Most formal housing units are beyond the affordability level of majority of thepopulation. Analysts have indicated that only three percent of households canafford monthly mortgage payments. ASN Properties currently has the cheapesthouse (2 bedrooms) on the market on a 40 m2 plot and costs GHC95 000(US$24 297). This is a basic house with no kitchen cabinets, floor tiles orwardrobes. For a house of this size, the monthly mortgage payment will beabout GHC955 (US$245), after making a 20 percent deposit of GHC 17 400(US$4 600) in order to obtain the mortgage and require that the prospectivemortgagor be earning about GHC2 387 (US$612) a month to qualify. The rangeof salaries is from a minimum of GHC600 ($153) to GHC10 000 (U$2 564) amonth. This puts majority of formally employed households out of the reach ofthe housing market.
The minimum required mortgage down payments across all mortgage providersis 20 percent of the purchase price of the property to be purchased. This couldbe quite high for most households who do not have the required amount ofsavings because of low incomes and the very high cost of living. Most real estatedevelopers like Devtraco, Regimanuel Gray, Comet Properties have houses alreadybuilt with no buyers.
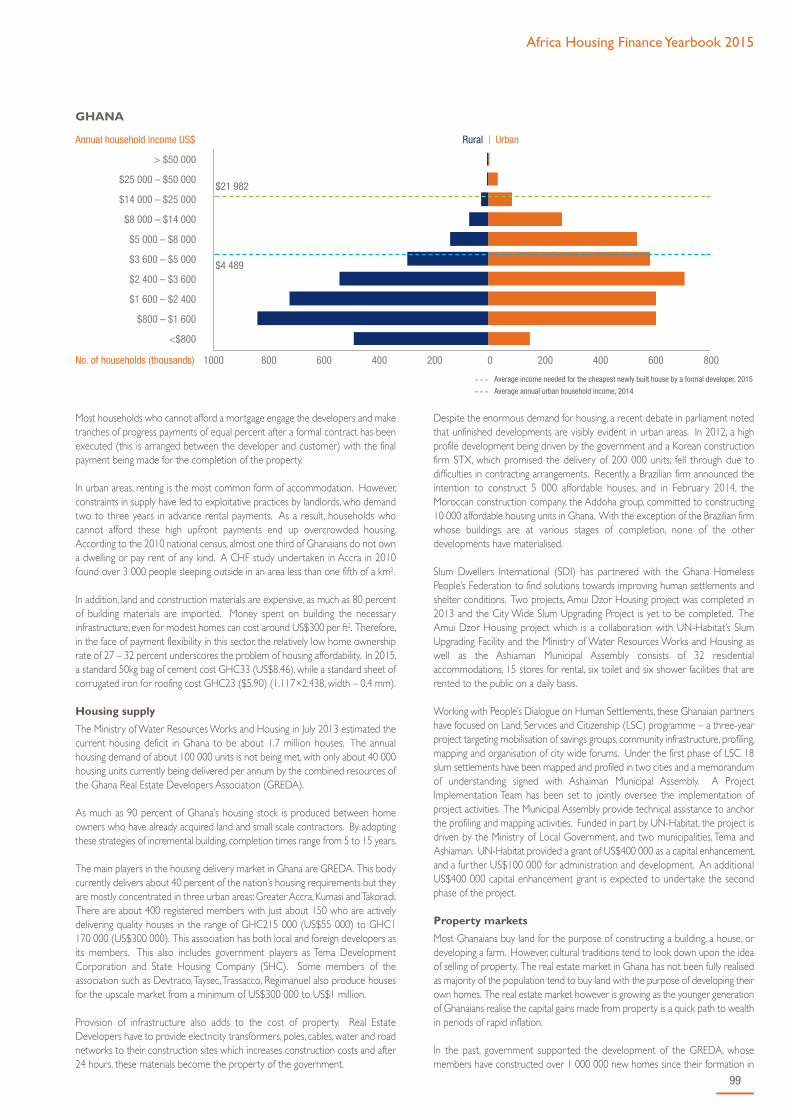
Africa Housing Finance Yearbook 2015
99
Most households who cannot afford a mortgage engage the developers and maketranches of progress payments of equal percent after a formal contract has beenexecuted (this is arranged between the developer and customer) with the finalpayment being made for the completion of the property.
In urban areas, renting is the most common form of accommodation. However,constraints in supply have led to exploitative practices by landlords, who demandtwo to three years in advance rental payments. As a result, households whocannot afford these high upfront payments end up overcrowded housing.According to the 2010 national census, almost one third of Ghanaians do not owna dwelling or pay rent of any kind. A CHF study undertaken in Accra in 2010found over 3 000 people sleeping outside in an area less than one fifth of a km2.
In addition, land and construction materials are expensive, as much as 80 percentof building materials are imported. Money spent on building the necessaryinfrastructure, even for modest homes can cost around US$300 per ft2. Therefore,in the face of payment flexibility in this sector, the relatively low home ownershiprate of 27 – 32 percent underscores the problem of housing affordability. In 2015,a standard 50kg bag of cement cost GHC33 (US$8.46), while a standard sheet ofcorrugated iron for roofing cost GHC23 ($5.90) (1.117×2.438, width – 0.4 mm).
Housing supply
The Ministry of Water Resources Works and Housing in July 2013 estimated thecurrent housing deficit in Ghana to be about 1.7 million houses. The annualhousing demand of about 100 000 units is not being met, with only about 40 000housing units currently being delivered per annum by the combined resources ofthe Ghana Real Estate Developers Association (GREDA).
As much as 90 percent of Ghana’s housing stock is produced between homeowners who have already acquired land and small scale contractors. By adoptingthese strategies of incremental building, completion times range from 5 to 15 years.
The main players in the housing delivery market in Ghana are GREDA. This bodycurrently delivers about 40 percent of the nation’s housing requirements but theyare mostly concentrated in three urban areas: Greater Accra, Kumasi and Takoradi.There are about 400 registered members with just about 150 who are activelydelivering quality houses in the range of GHC215 000 (US$55 000) to GHC1170 000 (US$300 000). This association has both local and foreign developers asits members. This also includes government players as Tema DevelopmentCorporation and State Housing Company (SHC). Some members of theassociation such as Devtraco, Taysec, Trassacco, Regimanuel also produce housesfor the upscale market from a minimum of US$300 000 to US$1 million.
Provision of infrastructure also adds to the cost of property. Real EstateDevelopers have to provide electricity transformers, poles, cables, water and roadnetworks to their construction sites which increases construction costs and after24 hours, these materials become the property of the government.
Despite the enormous demand for housing, a recent debate in parliament notedthat unfinished developments are visibly evident in urban areas. In 2012, a highprofile development being driven by the government and a Korean constructionfirm STX, which promised the delivery of 200 000 units, fell through due todifficulties in contracting arrangements. Recently, a Brazilian firm announced theintention to construct 5 000 affordable houses, and in February 2014, theMoroccan construction company, the Addoha group, committed to constructing10 000 affordable housing units in Ghana. With the exception of the Brazilian firmwhose buildings are at various stages of completion, none of the otherdevelopments have materialised.
Slum Dwellers International (SDI) has partnered with the Ghana HomelessPeople’s Federation to find solutions towards improving human settlements andshelter conditions. Two projects, Amui Dzor Housing project was completed in2013 and the City Wide Slum Upgrading Project is yet to be completed. TheAmui Dzor Housing project which is a collaboration with UN-Habitat’s SlumUpgrading Facility and the Ministry of Water Resources Works and Housing aswell as the Ashiaman Municipal Assembly consists of 32 residentialaccommodations, 15 stores for rental, six toilet and six shower facilities that arerented to the public on a daily basis.
Working with People’s Dialogue on Human Settlements, these Ghanaian partnershave focused on Land, Services and Citizenship (LSC) programme – a three-yearproject targeting mobilisation of savings groups, community infrastructure, profiling,mapping and organisation of city wide forums. Under the first phase of LSC 18slum settlements have been mapped and profiled in two cities and a memorandumof understanding signed with Ashaiman Municipal Assembly. A ProjectImplementation Team has been set to jointly oversee the implementation ofproject activities. The Municipal Assembly provide technical assistance to anchorthe profiling and mapping activities. Funded in part by UN-Habitat, the project isdriven by the Ministry of Local Government, and two municipalities, Tema andAshiaman. UN-Habitat provided a grant of US$400 000 as a capital enhancement,and a further US$100 000 for administration and development. An additionalUS$400 000 capital enhancement grant is expected to undertake the secondphase of the project.
Property markets
Most Ghanaians buy land for the purpose of constructing a building, a house, ordeveloping a farm. However, cultural traditions tend to look down upon the ideaof selling of property. The real estate market in Ghana has not been fully realisedas majority of the population tend to buy land with the purpose of developing theirown homes. The real estate market however is growing as the younger generationof Ghanaians realise the capital gains made from property is a quick path to wealthin periods of rapid inflation.
In the past, government supported the development of the GREDA, whosemembers have constructed over 1 000 000 new homes since their formation in
> $50 000
$25 000 – $50 000
$14 000 – $25 000
$8 000 – $14 000
$5 000 – $8 000
$3 600 – $5 000
$2 400 – $3 600
$1 600 – $2 400
$800 – $1 600
<$800
- - - Average income needed for the cheapest newly built house by a formal developer, 2015
- - - Average annual urban household income, 2014
GHANA
$21 982
$4 489
Rural | UrbanAnnual household income US$
No. of households (thousands) 1000 800 600 400 200 0 200 400 600 800

100
1988. However, GREDA is a land and housing developer organisation and is notin the business of offering real estate services for existing housing stock. There aremany people operating as estate agents, many of whom have no formal orprofessional training.
According to the World Bank’s 2015 Doing Business Report, registering propertyin Ghana requires five procedures, takes 46 days and costs 1.1 percent of theproperty value. Ghana was ranked 96th of 189 countries for this indicator in 2015.The capacity to register a property remains limited to major centres – Accra,Kumasi, Takoradi and a few smaller towns – and the process through the LandsCommission remains quite manual and is fraught with administrative limitations.Furthermore, the land tenure system contributes to the property ownership crisis.Lands are owned by traditional rulers and families. Members of GREDA face a lotof challenges in their efforts to deliver houses to the population. Some of theseconstraints are land acquisition where in Ghana almost all land is vested in thetraditional authorities developers sometimes have to acquire their land fromseveral sections of the same traditional authority.
The growth of the oil and gas industry has brought some up market developersinto the market that are developing highly priced condominiums and other highrise developments in the city centers, most of who sell off-plan with their pricesranging from between US$300 000 to more than US$1 million. Property rentalsin the middle to upper sector range between US$2 500 and US$8 000 a month.The real growth of the property market is in the low to middle income bracketwhere the price of properties range from between GHC97 500 (US$25 000) toGHC585 000 (US$150 000) and most developers sell off-plan.
Both HFC Bank and GHL have established subsidiaries to capitalise upon andfacilitate the growing residential property market. HFC Realty is wholly owned byHFC Bank Ghana, and began operations in 2006 with a mission to hold, developand manage real estate in the country. It operates as a developer, propertymanager, valuer and real estate broker in the industry. GHL established the onlineGhana Home Loans Online Realty, an online database of properties available in theGhanaian market.
Policy and regulation
The Borrowers and Lenders Act of 2008 and the Central Securities DepositoryAct of 2007 are two pieces of legislation that were enacted to speed up theforeclosure process (from 18 months to 90 days) and to allow for the immediateonline registration of collateral at the Bank of Ghana.
Housing in the country has never been a significant component of nationaleconomic planning, but has been seen rather as part of its welfare sector. In 2014a national housing policy was drafted by the Ministry of Water Resources, Worksand Housing. The policy focuses on six thematic areas: a national housing vision,goals and objectives; land for housing, housing finance, housing design andconstruction; institutional reforms; and a housing governance. This housing policytakes the same form as previous ones enacted for example, provision of taxholidays and financial guarantees for real estate developers or zero tax onequipment and machinery imported for housing construction. However this newhousing policy document failed to address the lack of incentives such as mortgagetax relief or first-time home purchase subsidies.
In 2012, the Ghana Housing Finance Association started work with stakeholdersto draft a Condominium Property Bill to govern the development of units forownership, constructed in buildings rather than free standing on plots. Thiscondominium property bill sets out the requirements for management of commonareas and the title definitions for ownership. This document has been finalisedand presented to the Ministry of Water Resources Works and Housing for onwardpresentation to Cabinet for deliberations before it is presented to parliament forpassage. As at the end of August 2015, this bill is yet to be presented to cabinet.
Opportunities
The opportunities in the Ghanaian housing sector look very prosperous. With thediscovery of oil and gas, the sector has opened up the housing industry to manyGhanaian and foreign investors. The Chinese, the Moroccans, the Brazilians andothers are taking advantage of the prospects and are constructing large sectionsof houses for sale. The Chinese are constructing two 13 storey high risecondominiums in the heart of Accra. The first one consists of 60 units with 12three bedrooms, 15 two bedrooms and 33 one bedrooms. The second consistsof 30 units of 15 one bedrooms and 15 two bedrooms each.
There is however the need for the banking sector to provide long-termconstruction finance to aid the local real estate developers to produce more unitsfor the low to middle income earners where there is the bulk of the housingdemand. With greater awareness, access and acceptance of mortgage productsin the country and finalisation of reforms to the land administration system, themortgage industry can thrive and allow room for additional mortgage bankers.With the exception of Global Access Savings and Loan and Sinapi Aba Savingsand Loan, no other institution is providing housing microfinance to the rural lowincome earners and this is an area that more players are needed to help individualsin the rural areas to improve on their housing needs.
Sources
HFC Bank 2014 Annual Report.Ghana Statistical Services.Bank of Ghana (Monetary Policy Committee Meeting, June 2015).Ghana Sovereign Rating Website.HFC Bank ( Annual Report 2014).Ghana Home Loans.Asamoah et al.

Africa Housing Finance Yearbook 2015
101
Guinea-BissauKEY FIGURES
Main Urban Centres Bissau
Exchange Rate: 1 US$***Inflation 2013 | 2014 (est.) | 2015 (prov.) | 2016 (prov.) *
586.59 Central African CFA0.8 | 0.6 | 2.6 | 2.4
Population^ | Population growth rate (2013)^Urban population (% of total)^ | Urbanisation rate (% in 2013)^
1 745 798 | 2.4148.55 | 4.08
GDP / capita (current US$)^ | GDP growth rate (annual %)^GNI / capita, Atlas method (current US$) ^Population below national poverty line*Unemployment rate (%)*Gini co-efficient (year of survey)^^HDI (Global Ranking)" | HDI (Country Index Score)”
585.62 | 2.54570.0069.37.535.52 (2010)177 | 0.396
Lending Interest Rate^Mortgage Interest Rate (%) | Mortgage Term (years)#Credit % of GDP^Average Mortgages % of GDP° Price To Rent Ratio City Centre** | Outside City Centre**Gross Rental Yield City Centre** | Outside of City Centre**Outstanding home loan (% age 15+)##
9 – 11%9 – 11 | 1012.09............
What is the cost of standard 50kg bag of cement (in US$)? #What is the price of the cheapest, newly built house by a formaldeveloper or contractor (in US$)? #What is the size of this house (in m2)? #What is the average rental price for a formal unit (in US$/month)#What is the minimum plot size for residential property (in m²)#
9.00
153 42970170 – 852500
Ease of doing business rank !Number of procedures to register property !Time (days) to register property !Cost (% of property value) to register property !
17985110.60
*** Conmill.com The Currency Converter^ World Bank's World Development Indicators (2014)~ World Bank PovcalNet: an online poverty analysis tool, various years^^ The World Bank's PovCalnet" UNDP's International Human Development Indicators (2014)° Various: Badev et al. "Housing Finance Across Countries: New Data and Analysis" – Unpublished
paper/Hofinet/World Bank## Global Financial Inclusion Database (FINDEX)# CAHF Annual Survey Data (September 2015)! World Bank's Doing Business Survey Data (2015)** Numbeo Online User-Contributed Database
of loan, with loan values varying from CFA francs 3 to 5 million (US$5 177 toUS$8 629). This depends on the nature of their employment contract, whichallows the yearly renewal of the loan at the beginning of each year (someorganisations will provide a four or five year contract, depending on the length oftime needed to develop their projects). The interest rate is nine to 11 percent,according to the Branch Chief of Ecobank Headquarters in Bissau. According toinformation gathered at Orabank, there are plans to the practice of mortgagefinance for large segments population of Guinea-Bissau. But the plans are stillsubject to research. Due to the country’s political instability, it is still very difficultfor the banks to provide loans for a long payment period, which makes the accessto housing finance extremely limited.
Affordability
The majority of the population lives in the suburbs, in low quality housing, manywithout electricity or running water. Initiatives to improve conditions wereunderway, but due to new political upheaval, these have been interrupted with noclear date for their resumption. In the past, and according to information obtainedat the Ministry of Public Works, some of the houses constructed by the state havebeen allocated by assessing applications or by using a lottery system. There wasa commission with the responsibility of evaluating the allocation of houses,assessing specific household needs. Though these households were predominantlywar veterans or civil servants. In all these years, the government was only able toprovide three buildings.
Overview
The Republic of Guinea-Bissau is a country on the west coast of Africa, borderedby Senegal to the north, Guinea to the south. Its area is 36 125km2 and the officiallanguage is Portuguese; the population is 1 745 798. Guinea-Bissau is in the groupof the least developed countries in the world, with an HDI score of 0.396 – rankingit at 177 out of 187 countries in 2014. The GDP per capita is US$ 582, which isless than the ECOWAS (Economic Community of West African States) average.The country faces a growing dependence on foreign aid, with the public investmentprogramme sustained almost entirely from grants and loans.
The total population growth rate, according to the 2009 Census, is 2.41 percent.GDP growth rate in 2014 was 2.52 percent, while the estimated annual inflationrate is 0.6 percent. Total public expenditure will be 16.2 percent of GDP in 2015;interim public investment 3.8 percent. The poverty rate is 69.3 percent. Accordingto the World Bank’s 2015 Doing Business Report, Guinea-Bissau ranked 179th outof a total of 189 countries.
One of the country members of CPLP (Comunidade dos Países de LínguaPortuguesa/Community of Portuguese Speaking Countries), Guinea-Bissaucontinues to struggle with political crises, the latest the president’s dissolution ofthe democratically elected government in August of this year. The present politicalcrisis has affected social, financial and housing development, interfering with theimplementation of new rules and incentives for investors.
Access to finance
Guinea-Bissau does not have a financial sector that caters to the construction ofnew housing units. Due to this, access to mortgage finance is restricted to mediumto high income households, and those who have a warranty or an employmentcontract of 10 years, the typical loan tenor. Whoever does not meet theserequirements will have to save the amount needed or to apply for a loan abroad,for example in Portugal, if they have a business or a warranty seen as capable ofcovering the costs of the loan. Many Guinean citizens have used this strategysuccessfully.
Four commercial banks operate in the country (Ecobank, Orabank, BDU, BAO)and all loans granted will have to respect the maximum 33 percent taken from anyemployee’s salary. Some people do manage to build their homes using this type
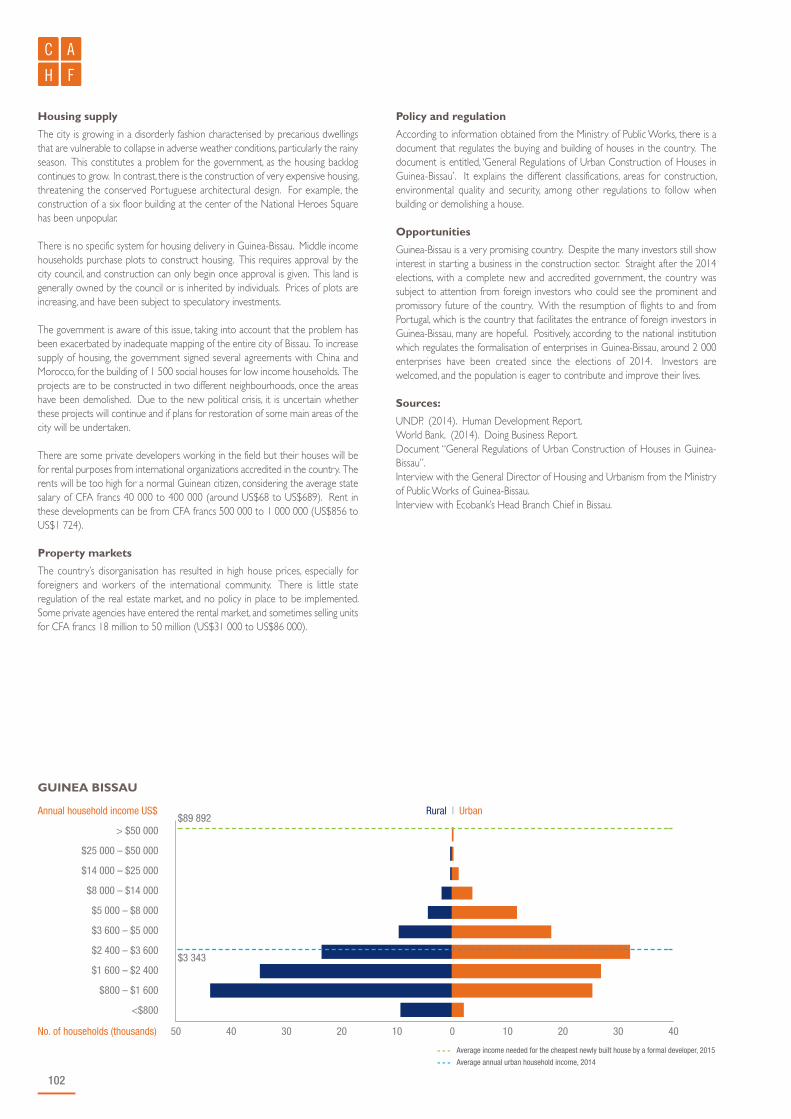
102
> $50 000
$25 000 – $50 000
$14 000 – $25 000
$8 000 – $14 000
$5 000 – $8 000
$3 600 – $5 000
$2 400 – $3 600
$1 600 – $2 400
$800 – $1 600
<$800
- - - Average income needed for the cheapest newly built house by a formal developer, 2015
- - - Average annual urban household income, 2014
GUINEA BISSAU
$89 892
$3 343
Rural | UrbanAnnual household income US$
No. of households (thousands) 50 40 30 20 10 0 10 20 30 40
Housing supply
The city is growing in a disorderly fashion characterised by precarious dwellingsthat are vulnerable to collapse in adverse weather conditions, particularly the rainyseason. This constitutes a problem for the government, as the housing backlogcontinues to grow. In contrast, there is the construction of very expensive housing,threatening the conserved Portuguese architectural design. For example, theconstruction of a six floor building at the center of the National Heroes Squarehas been unpopular.
There is no specific system for housing delivery in Guinea-Bissau. Middle incomehouseholds purchase plots to construct housing. This requires approval by thecity council, and construction can only begin once approval is given. This land isgenerally owned by the council or is inherited by individuals. Prices of plots areincreasing, and have been subject to speculatory investments.
The government is aware of this issue, taking into account that the problem hasbeen exacerbated by inadequate mapping of the entire city of Bissau. To increasesupply of housing, the government signed several agreements with China andMorocco, for the building of 1 500 social houses for low income households. Theprojects are to be constructed in two different neighbourhoods, once the areashave been demolished. Due to the new political crisis, it is uncertain whetherthese projects will continue and if plans for restoration of some main areas of thecity will be undertaken.
There are some private developers working in the field but their houses will befor rental purposes from international organizations accredited in the country. Therents will be too high for a normal Guinean citizen, considering the average statesalary of CFA francs 40 000 to 400 000 (around US$68 to US$689). Rent inthese developments can be from CFA francs 500 000 to 1 000 000 (US$856 toUS$1 724).
Property markets
The country’s disorganisation has resulted in high house prices, especially forforeigners and workers of the international community. There is little stateregulation of the real estate market, and no policy in place to be implemented.Some private agencies have entered the rental market, and sometimes selling unitsfor CFA francs 18 million to 50 million (US$31 000 to US$86 000).
Policy and regulation
According to information obtained from the Ministry of Public Works, there is adocument that regulates the buying and building of houses in the country. Thedocument is entitled, ‘General Regulations of Urban Construction of Houses inGuinea-Bissau’. It explains the different classifications, areas for construction,environmental quality and security, among other regulations to follow whenbuilding or demolishing a house.
Opportunities
Guinea-Bissau is a very promising country. Despite the many investors still showinterest in starting a business in the construction sector. Straight after the 2014elections, with a complete new and accredited government, the country wassubject to attention from foreign investors who could see the prominent andpromissory future of the country. With the resumption of flights to and fromPortugal, which is the country that facilitates the entrance of foreign investors inGuinea-Bissau, many are hopeful. Positively, according to the national institutionwhich regulates the formalisation of enterprises in Guinea-Bissau, around 2 000enterprises have been created since the elections of 2014. Investors arewelcomed, and the population is eager to contribute and improve their lives.
Sources:
UNDP. (2014). Human Development Report.World Bank. (2014). Doing Business Report.Document “General Regulations of Urban Construction of Houses in Guinea-Bissau”.Interview with the General Director of Housing and Urbanism from the Ministryof Public Works of Guinea-Bissau.Interview with Ecobank’s Head Branch Chief in Bissau.

Africa Housing Finance Yearbook 2015
103
Kenya
Kenya has a dynamic mortgage industry, which is growing rapidly and becomingincreasingly competitive. For two years in a row, Housing Finance Kenya hasremained the leading mortgagee, followed by KCB. Together, these institutions haveprovided 52.8 percent of outstanding mortgage loans by value and 53.3 percent ofexisting mortgage accounts in 2014. Other major mortgage lenders include:Standard Chartered, CFC Stanbic, Equity, Co-operative, Barclays, CommercialBank of Africa, Development Bank and I & M bank. These ten banks contributed85.5 percent of the value of outstanding mortgage loans by the end of 2014. Asof 31 December 2014, the total mortgage book stood at Kshs164 billion (aboutUS$1.8 billion) thus showing a growth of 18.8 percent on the previous year. Therewere 22 013 mortgage loans in the market by December 2014, an increase from19 879 in the previous year.
Nevertheless, mortgage lending is still accessible to only a minority of thepopulation. The average loan size has risen from Ksh6.9 million (US$79 945) in2013 to Ksh7.5 million (US$82 924) in 2014. By December 2013, theaverage mortgage interest rate offered by banks was 15.8 percent, a dropfrom 16.4 percent in the previous year. Interest rates charged by the banksranged from 8 to 21.3 percent. Some of the lowest interest rates are providedby KCB (12.9 percent) and Standard Bank (10.9 percent). Higher rates wereoffered by Equity Bank (18 percent), Consolidated Bank (18 percent) and HousingFinance Kenya (16 percent). These bank rates fluctuate, depending on theborrower and central bank rate. This rise and fall in interest rates appear to bethe major reason for non-performing (NPLs) swelling to Ksh10.8 billion
Overview
Kenya has consolidated its place as the largest economy in the East and CentralAfrican region while Nairobi, its capital city, is regarded as the business hub andmain port of entry into this region. After rebasing its GDP in September 2014,Kenya has been classified as a middle-income country. Rebasing increased the sizeof the economy by 25.3 percent making Kenya Africa’s ninth largest economy, upfrom 12th, surpassing Ghana, Tunisia and Ethiopia. In fact, over the last 10 years,with the exception of 2008 and 2009, Kenya has sustained an economic growthabove 4.5 percent in each of the years. Subsequent to the economic deteriorationof 2008, Kenya’s economy started on a recovery trajectory which climaxed in2010 when the economy expanded by 8.4 percent – its highest performance in37 years. Kenya registered GDP growth rates of 6.1 percent in 2011, 4.6 percentin 2012, 5.7 percent in 2013 and 5.3 percent in 2014. According to a recentEconomic Update published by the World Bank, Kenya has just joined the club offastest growing economies in the world and has emerged as one of Africa’s keygrowth centers with sound economic policies in place to ensure future improvement.
It is widely expected that economic gains made in 2014 will be sustained andpossibly improve in 2015 into 2016 and 2017. The World Bank projects thatKenya’s GDP will grow by six percent in 2015, 6.6 percent in 2016, and by sevenpercent in 2017. However, the strength of the Kenyan Shilling, the size of thepublic debt, vulnerability to external shocks caused by the recent entry into thesovereign bond market, security situation, current account deficit and unstable oilprices remain key challenges in 2015. In fact, the Shilling has deterioratedsignificantly since the beginning of 2015 resulting into a liquidity mop-up by theCentral Bank which is likely to constrain credit.
Access to finance
Kenya’s financial sector is highly developed and is regulated by the Central Bankof Kenya (CBK). By the close of 2014, the CBK’s Banking Supervisory Reportpointed out that Kenya had 44 banking institutions (43 commercial banks and onemortgage finance company), eight representative offices of foreign banks, 13microfinance banks (MFBs), two credit reference bureaus (CRBs), 13 moneyremittance providers (MRPs) and 87 foreign exchange (forex) bureaus. Out of the44 banking institutions, 30 were locally-owned banks while 14 were foreign-owned.The number of financial institutions providing mortgage finance was 37 from 36institutions in the previous year.
KEY FIGURES
Main Urban Centres Nairobi (capital), Mombasa
Exchange Rate: 1 US$***Inflation 2013 | 2014 (est.) | 2015 (prov.) | 2016 (prov.) *
101.75 Kenyan Shilling (KSh)7.9 | 7.0 | 5.5 | 5.3
Population^ | Population growth rate (2013)^Urban population (% of total)^ | Urbanisation rate (% in 2013)^
45 545 980 | 2.6525.20 | 4.32
GDP / capita (current US$)^ | GDP growth rate (annual %)^GNI / capita, Atlas method (current US$) ^Population below national poverty line*Unemployment rate (%)*Gini co-efficient (year of survey)^^HDI (Global Ranking)" | HDI (Country Index Score)”
1,337.91 | 5.331,28045.99.247.68 (2005)147 | 0.535
Lending Interest Rate^Mortgage Interest Rate (%) | Mortgage Term (years)#Credit % of GDP^Average Mortgages % of GDP° Price To Rent Ratio City Centre** | Outside City Centre**Gross Rental Yield City Centre** | Outside of City Centre**Outstanding home loan (% age 15+)##
16.5116.00 | 2534.423.53% (2013)12.3 | 18.348.13% | 5.45%12.13
What is the cost of standard 50kg bag of cement (in US$)? #What is the price of the cheapest, newly built house by a formaldeveloper or contractor (in US$)? #What is the size of this house (in m2)? #What is the average rental price for a formal unit (in US$/month)#What is the minimum plot size for residential property (in m²)#
7.60
17 00030222238
Ease of doing business rank !Number of procedures to register property !Time (days) to register property !Cost (% of property value) to register property !
1369724.30
*** Conmill.com The Currency Converter^ World Bank's World Development Indicators (2014)~ World Bank PovcalNet: an online poverty analysis tool, various years^^ The World Bank's PovCalnet" UNDP's International Human Development Indicators (2014)° Various: Badev et al. "Housing Finance Across Countries: New Data and Analysis" – Unpublished
paper/Hofinet/World Bank## Global Financial Inclusion Database (FINDEX)# CAHF Annual Survey Data (September 2015)! World Bank's Doing Business Survey Data (2015)** Numbeo Online User-Contributed Database
104
(US$119.4 million) in 2014 from Ksh8.5 billion (US$97.9 million) in December2013 because nearly 92.5 percent of mortgage loans are on variable interest ratesbasis.
Based on a ranking of mortgage market constraints, a 2013 survey on the demandside of the market revealed that high cost of houses, high interest rates onmortgages, high incidental cost of mortgages, low levels of income and difficultieswith property registration and titling are the major inhibiting factors to the growthof the Kenyan mortgage market. To this end, policies such as the adoption of theKenya Banks’ Reference Rate (KBRR) in July 2014, is expected to increasetransparency and promote pricing competition. In addition, the automation anddigitisation of the land registries are likely to be helpful.
Similarly, to address affordability challenges, supporting growth of the microfinancemovement has been another focal point of monetary policies. Kenya has a strongmicrofinance sector, with 13 deposit taking microfinance institutions from nine in2013. The coming-into-force of the Microfinance (Amendment) Act, 2013, hasallowed the former deposit taking microfinance institutions (now ‘microfinancebanks’) to operate current accounts, issue third party cheques and engage inforeign exchange trading. Regulations for non-deposit taking microfinanceInstitutions are yet to be put in place. The Ministry of Finance is in the process ofdiscussing the best way forward for regulating the non-deposit taking microfinancebusinesses. Mix Market, an online self-reported source of microfinance data,reports on 51 MFIs in Kenya representing 10.6 percent of the accounts, 1.5 millionactive borrowers with a gross loan portfolio of US$ 3.3 billion. Most microfinancebanks and non-deposit taking MFIs provide HMF in one form or another. Forinstance, Rafiki Microfinance Bank provides a Rafiki home savings account throughwhich one can access Rafiki housing microfinance, landlords HMF and homeownership starter HMF. On the other hand, Kenya Women Microfinance Bankprovides a ‘Water Tank’ loan and a roofing loan called ‘Mabati’ loan.
Similar to the microfinance institutions, the cooperative movement has also beenanother important avenue to creating affordable housing finance and providingdecent shelter. Housing cooperatives are mainly engaged in communitymobilisation to build support and participation of individuals, groups, andcooperatives to work towards affordable housing. The primary housingcooperatives have formed a national union – NACHU. As of now, NACHU hasover 600 member housing cooperatives and has become a leading organisationin the provision of housing micro-finance, capacity building and technical services.NACHU has supported various community housing and real estate project. Onesuch project is the 80 units, two-roomed house and toilet Ngasemo HousingScheme located on the outskirts of Nairobi with an asking price of Ksh4.5 million(US$44 500).
Altogether, access to finance has been improving. Key statistics, such as domesticcredit from the banking sector indicate a significant positive change. According toCBK, credit to the private sector grew by 22.2 percent in 2014 following growthof 20.1 percent in 2013. Private households (at 26.2 percent) and real estate (at18.8 percent) were the main activities to which credit to the private sector wasallocated. These statistics are provided by financial institutions in the annualdepository surveys conducted by the CBK. When access to finance and financialinclusiveness in Kenya is estimated from the demand side, statistics still suggesta significant improvement. Global Financial Inclusion Survey (Findex) conductedby the World Bank is one of such demand side surveys. According to Findex,74.6 percent of Kenyans above 14 years say that they have accounts, includingmobile money accounts. Furthermore, between 2011 and 2014, the number ofKenyans that attest to having bank accounts has increased by 30.4 percent from42.3 percent to 55.2 percent while those that report to having borrowed from afinancial institution rose by 53.2 percent from 9.7 percent in 2011 to 14.9 percentin 2014. The Findex survey of 2014 confirms that 12.1 percent of Kenyans above14 years have used their loans for housing purposes. Despite an improvement inthe access to finance, these statistics, together with the doing business statisticshows that Kenyan is ranked at position 116 out of 189 countries in terms of easeof getting credit, which means that much still needs to be done.
Affordability
As with most African countries, affordability is a major constraint to the growth ofthe housing and mortgage markets in Kenya and a key challenge to access decent
housing. Given an average loan size of Ksh7.5 million (US$82 924), averagemortgage interest rate of 15.8 percent, 90 percent loan-to-value and assuming a25-years loan, repayment of such loan will be Ksh100 740.4 (US$1 113.8).Unfortunately, statistics show that a high numbers of people will not afford suchrepayment due to poverty. In fact, going by an income and expenditure surveyconducted by the World Bank in 2005, 99.9 percent of Kenyans will not afford thisaverage mortgage loan. Specifically, the Kenya National Bureau of Statistics (KNBS)defines ‘middle income’ households as those whose monthly incomes fall betweenKsh23 671 (US$321.1) and Ksh119 999 (US$1 628) based on the rates ofOctober 2005. Seen this way, none of the middle income earners will be able toafford the average mortgage loan unless the distribution of income has changedsignificantly since 2005.
These statistics shows that affordability is a major challenge in Kenya’s housing andmortgage markets. This is indeed manifested in the large informal housing andproliferation of slum dwelling. This, together with a high urbanisation rate (urbanpopulation grew at 4.3 percent in 2014) indicates that rental housing, incrementalconstruction and use of alternative building materials and technologies are likelyto remain a feature of housing in Kenya. A highly speculative property market andthe high demand for housing has driven Kenya’s residential property price inflationup steadily over the last 13 years, resulting to over 80 percent rental housing(homeownership was established at 17.7 percent in 2009 by the KNBS).
In an attempt to overcome the affordability problem, lenders, developers,borrowers, cooperatives and NGOs have come up with different strategies. Forinstance, providing credit products that match cash flows of the poor such as thehome improvement loan (Rafiki MFI and Bank of Africa) and incremental financing(‘Ujenzi Kwa Hatua’ meaning an incremental building loan by Humanity for Habitat).Another creative way to obtain affordable housing involves the use of joint landpurchases by groups of low income households which makes land affordable andreduces the risk to the lenders. A good case to illustrate this is where 2 000 slumdwellers in Nairobi purchased 23 acres of land in Mukuru slum. Through the helpof Akiba Mashinani Trust (AMT), a Kenyan NGO working closely with slumdwellers across the country, they organised themselves into 49 groups of 40and started saving in 2007. The land was purchased in 2011 for Ksh81 million(US$953 000). Eventually, all 2 000 slum dwellers will have homes there and anadditional 1 000 middle income homes will be built to subsidise the cost.
Housing supply
According to the 2009 Population and Housing Census, Kenya had 8 738 097dwellings. Out of which, 3 385 308 were urban dwellings. At the same time, theUnited Nations placed the proportion of slum dwelling in Kenyan urban centresat 54.7 percent in 2009 and 56 percent in 2014. If this is accurate, then the stockof decent housing in 2009 was only 1 533 545 units, and 1 851 763 units thatconstitute dwelling units in slum areas form the backlog by then. Consideringthat urban population between 2009 and 2014 had grown at an average rate of4.4 percent per annum, at an average urban household size of 3.4 persons, Kenyawould need about 132 000 units per annum to meet urban population growths.If production remains at 50 000 units a year, as put by the ministry in charge ofhousing in 2011, a recurrent gap of about 82 000 units is added to the existingdeficit annually.
Statistics on investment into housing indicates that there is a growing interestin this sector. According to the annual economic survey of KNBS, aboutKsh127.7 billion (US$1 585 million) was invested into housing production in 2010.Accordingly, the amount injected into housing production has grown by 15.2 percent,17.2 percent, 14.6 percent and 17.3 percent in 2011, 2012, 2013 and 2014,respectively. Similarly, the number of outstanding mortgage loans has also been onthe rise from 13 220 loans in 2009 to 22 013 loans in 2014. Relative to the sizeof the economy, outstanding mortgages to GDP had risen from 2.3 percent in2009 to 2.4 percent in 2010, followed by 3.1 percent in 2011, then 3.5 percent in2012 and 2013, before hitting 3.6 percent in 2014. This indicates that the supplyand demand of housing in Kenya are increasing despite being insufficient to meetthe existing deficit.
Property Markets
According to Knight Frank, which reports on the high end residential market, theprime residential market has recorded a reduction in activity in the second half of

Africa Housing Finance Yearbook 2015
105
2014. This is possibly due to reduced international investor confidence due to theinsecurity concerns experienced towards the end of 2014, and the mismatchbetween demand and supply. As a result of reduced demand in the high endmarket, most developers in the Nairobi prime apartment market appear to beshifting focus from three- and four-bedroom apartments and mansions to smallerunits, such as: studios, one- and two-bedroom apartments, due to oversupply inthe former and the affordability challenges (for instance, in the Karibu homesproject among others). On the whole, the Kenya Bankers Association (KBA)Housing Price Index shows that house prices have risen significantly in 2014compared to similar periods the previous year. Prices for apartments andbungalows recorded the highest increases at 12.2 percent and 10.25 percentbetween 2013 Q3 and 2014 Q3 while maisonettes, which represents a niche inthe high end market, documented a mere 5.7 percent growth. According to thehedonic model estimated by KBA, house prices in this period were driven mostlyby size, neighbourhood and access to land. In their view, demand for bungalowswas on the rise because bungalows, though old, are situated on spacious and onprime land, therefore these sites are fit for redevelopment. Indeed, the scarcity ofland continues to push up property prices. Going by the Land Index (LI) basedon advertised land prices, prepared and published by HassConsult and Stanlib, thisis inevitable. As presented by this land index, land in the inner city suburbs haveincreased fivefold since 2007, while land prices in the satellite towns aroundNairobi have increased six folds.
Policy and Regulation
The adoption of a National Land Policy in 2009, as well as the new Constitutionin 2010, was a positive step towards resolving the protracted question of reliability,accuracy and legitimacy of the land administration system in the country. TheNational Land Commission (NLC) was created in 2012 with a range of functionsincluding advising the national government on a comprehensive programme forthe registration of land titles, management of public land, implementing settlementprogrammes, developing an effective land information system, and managing a landcompensation fund. Even before the NLC stabilises and the new land laws takeroot, stakeholders are asking for a national policy on slum upgrading andprevention, land readjustment, a legal framework for forced evictions and squattersettlement or amendments of the existing law. On the other hand, large scaledevelopers are of the view that the New Land Act (2012) and the Sectional TitleAct (1987), as currently set up, are cumbersome, difficult, slow and ineffective forregistration of more than 20 units. For one to obtain sectional title for a projectwith, for example, 10 000 units; to hasten the registration process and to cater forlarge scale multi-use and controlled communities projects; the amendments to theSectional Act of 2014, Sectional Titles Gated Communities Act of 2014 and theShared Communities Act of 2015 have been proposed. These are furtherdiscussed below.
n The Land Registration Act (2012): To revise, consolidate and rationalise theregistration of titles to land, to give effect to the principles and objects of
devolved government in land registration, and for connected purposes.n The Land Act (2012): Provides guidance for the sustainable administration
and management of land and land based resources. Classifies land as public,private and community land.
n The Land Control Act (2012): To control transactions of agricultural land. Italso sets up the Land Control Areas and Land Control Boards.
n The Sectional Properties Act (1987): Deal with the registration of units inhigh-rise buildings and/or flats.
n The Distress for Rent Act: Rent disputes and distained goods.n Amendments to the Sectional Act (2014) – proposed: Designed to simplify
the registration process and enable developers to create all necessaryindividual titles of the units during the early stages of development.
n Sectional Titles Gated Communities Act (2014) – proposed: To control anyuncontrolled developments in the neighbourhood.
n The Shared Communities Act (2015) – proposed: Create individual SectionalTitle Units for undeveloped land and enable the transfer of villas on individualparcels of land from the onset.
n The National Land Commission Act (2012): To establish the National LandCommission.
Opportunities
Globally, urban populations are growing at a rate much faster than can be absorbedand managed, placing a high demand on services and infrastructure. Kenya is noexception. Kenya requires the construction of at least 132 000 units per annumto cater for new urban dwellers and has a backlog of 1.85 million units of backlog.Going by changes in house prices, the demand for housing has shifted toapartments and smaller units often attributed to the middle and lower incomegroups. The middle and upper class sectors are the most populous populationsegments despite affordability challenges. Providing more affordable homes andhousing finance in Kenya is not impossible and there are a growing number ofgroups who are making strides in this direction. They are taking risks and testingnew models. For instance, on end-user finance, products that match cash flows ofthe middle and low income earners such as home improvement loans, incrementalconstruction financing, group loans and joint-income loans are likely to be appealingto many customers.
On the supply side, developers will be able to make a significant impact byconstructing small units (studio, two-bedroomed and one-bedroomed houses),making joint purchase of land to reduce overall cost of completed units, sourcingconcessionary loans at lower interest rates and by using alternative buildingmaterials. For these reasons, exciting opportunities exist in the mortgage andhousing markets of Kenya.
> $50 000
$25 000 – $50 000
$14 000 – $25 000
$8 000 – $14 000
$5 000 – $8 000
$3 600 – $5 000
$2 400 – $3 600
$1 600 – $2 400
$800 – $1 600
<$800
- - - Average income needed for the cheapest newly built house by a formal developer, 2015
- - - Average annual urban household income, 2014
KENYA
$8 821
$4 140
Rural | UrbanAnnual household income US$
No. of households (thousands) 3000 2500 2000 1500 1000 500 0 500 1000

106
Sources
Arvanitis, Y. (2013). African Housing Dynamics: Lessons from the Kenyan Market. Central Bank of Kenya, (2014). Bank Supervision Annual Report 2014. In CBK(Ed.). Nairobi.Central Bank of Kenya, (2015). Monthly Economic Review. In CBK (Ed.). Nairobi.Gaye, D. (2014). Kenya Economic Update Anchoring High Growth: CanManufacturing Contribute More? World Bank (11 ed.).Kenya National Bureau of Statistics. (2013). Kenya National Housing Survey:KNBS.Noppen, A. V. (2014). The ABCs of affordable housing in Kenya. AcumenOrganisation Report. Retrieved on, 1 Suraya Property Group Ltd. (2015). Review of the Proposed Amendments to theSectional Properties Act 1987 and Proposed Shared Communities Act 2014.Paper presented at the KPDA CEO Morning Learning Sessions, Nairobi. Knight Frank (2015). Kenya Market Update Quarter 2, 2015.
Websites
www.africaneconomicoutlook.orgwww.centralbank.go.ke www.mixmarket.orgwww.worldbank.orgwww.doingbusiness.orgiresearch.worldbank.orgwww.kba.co.kewww.shelterafrique.org

Africa Housing Finance Yearbook 2015
107
Lesotho
was enterprise loans, M 616 629 (US$45 676) represented mortgages while asmall amount, M 16 855 (US$1 249) was for other loans including those to non-profit making organizations. This means that in 2014, mortgages represented 12 percentof the total banking industry loan portfolio while 36 percent loans were toenterprises and 52 percent were personal loans. All the three commercial banksrequire a deposit of 10 percent minimum for a home loan, but this deposit mayincrease for a home loan value in excess of M1 million (US$74 074). Repaymentperiod is for a maximum of 240 months or twenty years. Interest rates are linkedto prime lending rates, which was 9.25 percent as at December 2014.
In October 2011, the Lesotho government passed the Credit Reporting Bill, whichwill ultimately set up a credit bureau to be used by credit providers and theCentral Bank of Lesotho. This bill makes provision for the licensing of private creditbureau operators and technical bureau services, which will assist financialinstitutions in lending out money by establishing a credit information point onborrowers.
One credit bureau, namely Compuscan, was licensed by the Central Bank ofLesotho and was expected to start operations in June 2014. After some delays,Compuscan commenced operations in August 2014. Two importantdevelopments also kicked off that played a key role in enabling the credit bureauto become operational. The SADC Credit Information Sharing Project, initiatedand supported by FinMark Trust, also commenced in July 2014. Through thisproject a local Coordinator was engaged to work with the Lesotho credit
Overview
Lesotho is a small, undeveloped country, bordered completely by the Republic ofSouth Africa, with a population of 2 million people. In 2014, Lesotho’smacroeconomic prospects were challenging; GDP growth in 2014 was estimatedat 1.98 percent. The growth resulted from strong growth realised in mining,construction, financial intermediation, wholesale and retail trade, health and socialwelfare.
Lesotho’s economic development agenda is still being guided by the 2012/13 –2016/17 National Strategic Development Plan (NSDP). The plan has identifiedfour sectors as the growth drivers during this plan period: commercial agriculture,tourism, mining and manufacturing. Yet, low human capital, poor land managementallocation systems and poor quality policy and regulatory structures impact oneconomic growth. This provides a rather compromised environment for housingand related matters in Lesotho, requiring reforms.
Access to finance
The banking sector in Lesotho is small, dominated by three commercial banks andone Post Bank, all regulated by the Central Bank of Lesotho. These banks have atotal of 45 branches, of which 32 are outside Maseru. Standard Lesotho Bank hasthe largest branch network with 17 branches (spread across all 10 districts),followed by Lesotho Post Bank with 13 branches. Nedbank and First NationalBank (FNB), have 10 and six branches respectively. The target clientele of StandardLesotho Bank, Nedbank and FNB is the formal sector, mainly medium and largecorporate enterprises and salaried employees in urban and peri-urban areas.Commercial banks have concentrated their operations in urban areas and have noimmediate plans to extend their network to rural areas, providing neither mobilebanking services nor specialist financial products. Although credit has normallybeen granted only to high net worth clients, or to those who have long businessrelationships with the banks, Nedbank and Standard Lesotho Bank have recentlyshown a keen interest in financing micro, small and medium enterprises byestablishing a dedicated department to handle small and medium enterprisefinancing.
As of December 2014, figures from the Central Bank of Lesotho indicate that thebanking industry loan portfolio totalled M5 075 620 (US$375 971). Of thisportfolio, M2 626 910 (US$194 586) was for personal loans, M1 815 135 (US$134 454)
KEY FIGURES
Main Urban Centres Maseru
Exchange Rate: 1 US$***Inflation 2013 | 2014 (est.) | 2015 (prov.) | 2016 (prov.) *
13.5 Lesotho Loti (LSL)5.3 | 6.6 | 6.0 | 5.5
Population^ | Population growth rate (2013)^Urban population (% of total)^ | Urbanisation rate (% in 2013)^
2 097 511 | 1.1026.79 | 3.06
GDP / capita (current US$)^ | GDP growth rate (annual %)^GNI / capita, Atlas method (current US$) ^Population below national poverty line*Unemployment rate (%)*Gini co-efficient (year of survey)^^HDI (Global Ranking)" | HDI (Country Index Score)”
995.48 | 1.981 35057.126.554.17 (2010)162 | 0.486
Lending Interest Rate^Mortgage Interest Rate (%) | Mortgage Term (years)#Credit % of GDP^Average Mortgages % of GDP° Price To Rent Ratio City Centre** | Outside City Centre**Gross Rental Yield City Centre** | Outside of City Centre**Outstanding home loan (% age 15+)##
10.3410.25 | 2022.60............
What is the cost of standard 50kg bag of cement (in US$)? #What is the price of the cheapest, newly built house by a formaldeveloper or contractor (in US$)? #What is the size of this house (in m2)? #What is the average rental price for a formal unit (in US$/month)#What is the minimum plot size for residential property (in m²)#
6.15
14 61545...400
Ease of doing business rank !Number of procedures to register property !Time (days) to register property !Cost (% of property value) to register property !
1284438.40
*** Conmill.com The Currency Converter^ World Bank's World Development Indicators (2014)~ World Bank PovcalNet: an online poverty analysis tool, various years^^ The World Bank's PovCalnet" UNDP's International Human Development Indicators (2014)° Various: Badev et al. "Housing Finance Across Countries: New Data and Analysis" – Unpublished
paper/Hofinet/World Bank## Global Financial Inclusion Database (FINDEX)# CAHF Annual Survey Data (September 2015)! World Bank's Doing Business Survey Data (2015)** Numbeo Online User-Contributed Database

108
providers to establish as association. This saw the partnership among the Ministryof Finance as the policy maker and project custodian on the ground, the CentralBank of Lesotho, the credit bureau and the credit providers working together tooperationalise a credit information sharing environment in the country. It is hopedthat this initiative will improve credit provision in the country.
To date, the total number of accounts recorded on the Bureau as at the last dayof July was 98 765, while the total number of natural persons recorded on theBureau was 78 218. The data is mainly from the banks and the retailers.
The 2015 Doing Business Report has ranked Lesotho 151 out of 189 countries,losing four positions compared to the 147 position the previous year. In 2012, theWorld Bank launched the Global Financial Inclusion Database (Global Findex) toexplore levels of financial inclusion around the world. According to Global Findex,14.5 percent of rural and 36.2 percent of urban Basotho over 15 years of agehave an account with a formal financial institution. The use of credit is common;57.4 percent of adults over 25 years of age report that they had a loan in the yearto 2011. However, the vast majority of these loans were from family or friends.Only 3.5 percent of adults had a loan from a financial institution and only6.1 percent had a loan from a private lender. Very few Basotho have anoutstanding loan to purchase a home: 0.8 percent of the top 60 percent of incomeearners and 1.2 percent of the bottom 40 percent of income earners. Loans forhome construction are slightly more common but still very scarce: 2.1 percent ofthe top 60 percent of income earners had one, and 0.8 percent of the bottom40 percent of income earners.
Affordability
Nearly 70 percent of Basotho households earn less than M1 000 (US$74) amonth and cannot easily afford to purchase formally developed houses. Whilebanks may provide incremental financing for homeowners, generally to finance thecost of adding a room, such loans are not relevant for the house purchase marketwhere prices are, on average, more than M300 000 (US$22 222). Only 9.8 percentof households in Lesotho purchased their houses from the public developer –and half of these were financed with savings or with work-related loan guaranteeschemes. The remainder of the population build their houses independently, onan incremental basis using a combination of savings and credit to match theiraffordability. The banking sector offer home loans of no less than M 100 000(US$7 407). Of the three commercial banks in the country, the Standard LesothoBank offers home loans from M100 000 (US$7 407) upwards, First National Bankoffers from a minimum of M 150 000 (US$11 111) upwards. Nedbank Lesothodoes not have a clearly spelled out minimum amount for home loans.
Housing supply
A significant proportion of housing is owner-constructed and owner-financed.Some 23 percent of households live in homes they built themselves, and 19.7percent inherited their houses. The majority of people still depend on family
networks and/or inheritance to acquire housing. The higher end market segmentcomprises housing units with prices ranging upwards from M500 000 (US$36 049)a unit, while the middle segment comprises houses ranging between M100 000(US$7 407) and M500 000(US$37 037). In urban areas, and to some extent inrural areas, owners typically collect materials over time and eventually build theirhouses after all the building materials have been assembled. In this way, it normallytakes a household a minimum of three years to gather the required buildingmaterials before they can begin the actual construction of the house. Householdswith unreliable or irregular incomes tend to apply this incremental housing strategy.In rare cases, homebuilders are able to access limited credit.
Although the formal real estate market is growing slowly, private sector developersare discouraged from playing a role in housing provision because of difficultiesexperienced in obtaining land. More recently, a strong demand for propertyexpressed by the expatriate and high income community has resulted in theemergence of a few high density, enclosed real estate developments. One playerin this evolution is the locally owned Matekane Group of Companies. Havingestablished Matekane Property to manage the real estate needs of its varioussubsidiaries, the company then diversified into residential real estate. It developedMpilo Estate, which involved the construction of 20 luxury three bedroom units,while Hilton Estate, with 15 units to be built to order, is in the planning phase.There is no further development on the Hilton Estate. Prices for the houses rangefrom M1.8 million to M2.5 million. Take up rate for the luxury houses at MpiloEstate improved tremendously in 2014/15. As at August 2015 a total of 15 houseshad been taken, leaving only five to be bought.
The Lesotho Housing and Land Development Corporation (LHLDC) is a state-owned developer, which was established following the National Housing Policy of1987. It is a product of the merger of the Lesotho Housing Corporation and theLower Income Housing Company. The LHLDC has three broad mandates: todevelop serviced sites, to provide rental accommodation and to provide homeownership. As of 2011, the LHLDC had delivered 9 519 serviced sites in variousurban centres, although primarily in the capital Maseru. Over 811 serviced siteswere availed to the market in 2013 – 650 were outside Maseru in Mohale`s Hoekdistrict in the South, while the remaining 161 were in Maseru. This brought thetotal to 10 330 sites. Although the corporation has improved on its deliveryrecord in recent years, it is challenged with adequately addressing the needs of lowincome groups. For this category, the primary approach involves the constructionof malaene (rows of single or double interconnecting rooms popularly constructedfor renting).
As indicated above, LHLDC commenced a project in Mohale’s Hoek, where 650serviced sites were up for sale. The costs of plots ranged from M12 000 (US$889)to M45 000 (US$3 333). The size of the plots range from 400 to 600m2. Thesewere targeted to low and middle income earners. There are three paymentoptions. Firstly there is a M150 (US$11) registration fee, applicable for all options,
> $50 000
$25 000 – $50 000
$14 000 – $25 000
$8 000 – $14 000
$5 000 – $8 000
$3 600 – $5 000
$2 400 – $3 600
$1 600 – $2 400
$800 – $1 600
<$800
- - - Average income needed for the cheapest newly built house by a formal developer, 2015
- - - Average annual urban household income, 2014
LESOTHO
$6 578
$6 286
Rural | UrbanAnnual household income US$
No. of households (thousands) 80 70 60 50 40 30 20 10 0 10 20 30

Africa Housing Finance Yearbook 2015
109
then a once off payment can be made. The second option is that after paying theregistration fee, a client is given 30 days within which to pay a 30 percent deposittowards the cost of the plot, and the balance is payable over six months. Underthe third option, all the terms under option two apply, but should the client beunable to pay the balance within the six month period, then she/he is automaticallyput on a twelve months contract, to pay the balance, which attracts 18 percentinterest. LHLDC reports that take up of these plots at the districts is quite slowcompared to Maseru. By the end of March 2014, not all of the sites had beentaken.
In Maseru district, the corporation continued with a residential housing projectthat started in 2009, MASOWE 111. This project entails the design andconstruction of residential houses on a turn-key arrangement. People who buy thehouses are financed by the local bank of their own choice. Under this scheme 26houses are complete and sold. The cost of these houses in a category of low tomiddle income earners ranged from M190 000 (US$14 074) to M240 000(US$17 777). In the second category of middle to high income earners, housescost between M577 000 (US$42 740) and M1.1 million (US$81 481). Of these,11 houses were completed and sold in 2013. In 2014, the Corporation sold 160high income serviced plots in the capital city Maseru. The fully served plots includefull water reticulation, sewer lines, electricity and access roads to all the plots. Theseservices are the ones that render this project a high income one since the servicesare not partial but full. For the middle income category, 51 plots we sold, again inthe Maseru urban area. Another housing project, targeting low income earners iscurrently underway. Under this project, 20 batches of houses are beingconstructed. The construction of these low income houses is at foundation stage.
Another player in the housing services space is Habitat for Humanity Lesotho,which provides shelter for vulnerable groups by building simple, decent andaffordable houses, in addition to raising awareness about legal issues aroundhousing, property ownership and inheritance rights. The goal of the project is toprovide disadvantaged children with safer living environments and access toresources to improve their lives. The aim was to construct two to three roomedhouses with ventilated pit latrines.
As of July 2013, and through its first project, Habitat had constructed a total of 143subsidised houses for low income households in Khubelu, a peri-urban area inMaseru district. This project commenced in 2002. Repayments on this projectwere to be completed within a ten year period. There were a lot of challengesduring implementation of this project, such that by June 2012, only 10 percent ofthe beneficiaries had paid up their loans. But through the restructuring of theloans, a year later, in July 2013, 20 percent of the beneficiaries had fully paid.Consequently 29 families were presented with loan clearance certificates and landtitle deeds. Habitat Lesotho continues to explore options to see how other homeowners can also pay up the remaining balances. Other developments by theorganisation included ventilated pit latrines constructed for 98 families. 41 familiesbenefitted through minor repairs being done to their homes, while maintenanceand hygiene training was offered to 20 families. Lastly, some training on inheritancerights and security of tenure was offered for eight families. During 2014 up to June2015, two-roomed houses were constructed and given to 44 families. Theconstruction also included an improved pit latrine for these families. A further130 families were each given a pit latrine, under the sanitation programme. Duringthe same period, Habitat reached out to 171 individuals through its maintenanceand hygiene training, while a total of 538 individuals benefitted from theirinheritance training programme.
Property markets
The land tenure system in Lesotho is dual, with customary and statutory systemsoperating side by side. The basic tenet of land ownership is that land is owned bythe people, but is held in trust by the King. Over the years, land administration andmanagement in Lesotho has been characterised by a lot of deficiencies andweaknesses. These resulted in unplanned settlements, illegal encroachment ofsettlements on agricultural land, encroachment of settlements and grazing onwetlands, and poorly managed rangelands. A variety of land reform programmeshave been introduced that aimed to improve management and introduce morerobust land administration processes. Following the MCA supported land reformproject that established the Land Administration Authority, there is noticeableimprovement in the land registration. Land titling in urban areas have now been
effectively institutionalised. The above challenges however still require continuedland reforms to enable more productive use of available land. Land allocationprovisions and practices continue to frustrate foreign investment efforts as well.Statutory limits on land allocation stand at 1 000 m2 for residential purposes and10 000 m2 for industrial use. If potential investors require land size above thislimits, such have to be personally approved by the Minister of Local Government.Approval processes are long, which can take anything from a few days to a numberof years.
The IMF estimates that real estate accounts for nine percent of GDP, with anannual growth of just above one percent. Still, REMAX Casa Blanca Realty, whichrecently opened offices in Maseru, reports an active property market withexponential growth recorded in some areas over the past few years. ForeignNGOs, expatriates and diplomatic missions have fuelled the economy in theseareas, increasing the demand for property and putting pressure on prices. As aresult, the buy-to-let market has experienced considerable growth, with mid tohigh level income earners seeking investment returns. For the majority, however,the property market is not a steady source of wealth. Aside from supply problems,especially around affordability, transactions in the property market arecumbersome and undermine market performance. Registering a property inLesotho in 2015 required four procedures, takes 43 days and costs 8.4 percent ofthe property value.
Policy and regulation
Although Lesotho does not have a housing policy, much progress has been madein this process during 2013. In the late 1980s, the government received supportfrom the World Bank and the Canadian Housing Foundation towards the draftingof a National Housing Policy, but this was never adopted. Certain aspects of thishousing policy were still pursued, notably the formation of the LHLDC. In 2005,it was noted that Lesotho had a draft National Shelter Policy. According to UN-Habitat, the draft policy included a market driven shelter delivery approach, andadvocated for transparent, efficient and consistent delivery systems. The draftpolicy also set out the development of an effective regulatory framework towardsequitable access to the shelter delivery market. Further, the draft policy sought torecognise, support and integrate all sectors of the economy, including the informalsector, into shelter delivery, and to localise housing solutions. The development ofthe Housing policy has stalled. It is envisaged that this may just form part of thecountry`s development programmes with support from its cooperating partners.
A National Strategic Development Plan for Lesotho, also recognises theimportance of housing in a section on ‘shelter and property development’. ThePlan asserts that government will strengthen land administration and physicalplanning, facilitate the provision of basic infrastructure to improve quality of shelter,improve the quality and safety standards of housing and ensure their enforcement,encourage the local production of construction outputs, promote densificationand regularise property markets (residential and commercial) to improve safetyand achieve the desired physical layout, develop housing finance and land marketsas well as property development capacity, and identify appropriate housingsolutions which especially target low income households and industrial workers.
Land administration reform was part of the private sector developmentcomponent of the Millennium Challenge Account (MCA) ‘compact’ between theUS and the Lesotho government. This component aimed to achieve improvementin the land laws and policies, in people’s awareness of land rights, especiallywomen’s, and in the efficiency of issuing of land leases to people in urban areas,starting with Maseru. It also aimed to support the establishment of a LandAdministration Authority to enhance land administration and land administrationservices.
Significant legislative and institutional reforms have taken place to date. Theseinclude the Land Administration Act and the Land Act, both of 2010, the LandRegulations and Land Court regulations of 2011 and the Draft Sectional Titles Billof 2011. In the main these reforms are feasible and significant, particularly regardingincreased efficiencies in the processing of title deeds. The main challenge thatremains to be tackled is access to land, one obstacle that continues to negativelyaffect poor people in Lesotho. The country is in the process of finalising the secondcompact with the American government through the Millennium Challengefinancing. This issue of access to land still features significantly as an inhibiting factor

110
in attaining inclusive growth. It is hoped that its inclusion in Compact 2 will bringabout more effective reforms that will enable the most vulnerable people to haveaccess to land for other economic activity but also for shelter.
Opportunities
The demand for property, particularly for the middle to higher income groups,presents an opportunity for investment in the Lesotho property market. Housingsolutions for the bottom end of the property market are also critically needed,especially given rapid urbanisation. The ongoing legislative and policy reforms andthe fact that the current developments have so far concentrated in Maseru aloneleaves other districts open for investments in the housing sector. There are alsoopportunities for microfinance institutions to provide innovative housing financeoptions targeted at lower income earners, and to grow this sector from its currentalmost non-existent position. The Ministry of Trade completed implementation ofa World Bank assisted project – namely the Private Sector Competitiveness andEconomic Diversification Project. Through this initiative, a number of reforms weremade which impacted positively on the business environment. Outcomes of theproject were that days required to register a company reduced from 28 to seven,days required to obtain an industrial license reduced from 35 to five days and,turn-around time for a trade license was reduced to 15 days from 30 – 50 days.
The preceding sections have indicated progress that has been made in addressingland allocation and management weaknesses. Much more reforms are still neededand have to be speedily implemented to redress the persisting weaknesses in themanagement of this critical economic asset.
Sources
Andrews, A.M., Jefferis, K., Murgatroyd, P. and Webb, D. (2013). Lesotho FinancialSector Development Strategy (unpublished draft July 2013). Central Bank of Lesotho (2011). Annual Report 2011. Central Bank of Lesotho Annual Report 2013. Government of Lesotho. (2011). National Strategic Development Plan. TheGrowth and Development Strategic Framework. International Monetary Fund (2012). Kingdom of Lesotho: Poverty ReductionStrategy Paper – National Strategic Development Plan 2012/13 – 2016/17. IMFCountry Report No. 12/102.Mountain View Newsletter, Issue 14 July 2013. Kingdom of Lesotho. (2005). Poverty Reduction Strategy. Leduka, R.C. (2012). Lesotho Urban Land Market Scoping Study. Reportprepared for Urban LandMark. February 2012.Olivier, M. (2011). Social Protection in Lesotho: Innovative Developments andReform Challenges. Presentation to the International Symposium on SocialProtection in Southern Africa, May 2011.Private Sector Competitiveness and Economic Diversification Project,Implementation Completion and Results Report for the Kingdom of Lesotho,Finance and Private Sector Development Unit, Country Management Unit forSouthern Africa Region. December 17, 2013. UN Habitat (2005). Law, Land Tenure, Housing Rights and Gender in Lesotho. Partof the Law, Land Tenure and Gender Review Series: Southern Africa.World Bank (2013). Doing Business 2014: Lesotho .Lesotho Housing and Land Development Corporation , Information Office. The Mountain View, FY 2015 Newsletter (Habitat for Humanity Lesotho).
Websites
www.afdb.org www.africaneconomicoutlook.orgwww.doingbusiness.orgwww.finscope.co.za www.globalpropertyguide.com/Africa/Lesotho/www.hfhl.org.ls/Housingneed.html www.housingfinance.orgwww.informativenews.co.lswww.lesothoreview.comwww.unhabitat.orgwww.urbanlandmark.org.za

Africa Housing Finance Yearbook 2015
111
Liberia
Prior to the civil war, the National Housing and Savings Bank was the onlymortgage bank in Liberia. However, even then, the approach was limited to lendingto individuals to build their own homes. There was no linkage between the bankand the National Housing Authority (NHA), the government owned housingdevelopment institution, to promote housing development in Liberia. The NationalHousing and Savings Bank collapsed in the 1990s during the civil war.
Access to housing finance is limited and when available is confined to Liberia’scapital city, Monrovia. The government, however, is encouraging homeownership,as well as the development of a mortgage sector to make houses affordable to lowand middle income earners. In 2013, the first formal mortgage programme forpost-conflict Liberia was launched by the Liberian Bank for Development andInvestment (LBDI), financed with US$ 10 million from CBL Mortgage Creditstimulus initiative. The programme involved LBDI taking ownership of a 30-yearold estate that had been built for low income earners and managed by NationalHousing Authority. LBDI then sold the units to the tenants. There were 89beneficiaries. A mortgage credit stimulus initiative also allowed LBDI to offer about100 mortgages finance over 10 years.
Other initiatives include the financing of NHA by the National Social Security andWelfare Corporation (NASSCORP) and National Oil Company of Liberia(NOCAL) to boost housing development in Liberia. NASSCORP and NOCALare partners of NHA and their funding has contributed so far to the construction
Overview
The Republic of Liberia is on the West coast of Africa and bordered by SierraLeone to the west, Guinea to the north, Ivory Coast to the east and the AtlanticOcean to the south. The country has a population of 4.3 million, 49 percent ofwhich lives in cities, making the country highly urbanised. Liberia is a member ofEconomic Community of West Africa, (ECOWAS) and rich in natural resourcesamong which are iron ore, rubber, timber, gold, diamond, coffee and cocoa. Liberiais one of the poorest countries in the world with an HDI score of 0.412, placingit at a ranking of 175th out of 187 countries in 2014. The country has suffered froma decade and a half of intermittent civil wars, which contributed towards ahistorical decline in GDP of 90 percent between 1989 and 1995. With the endof the war in 2003, and the inauguration of the Ellen Johnson Sirleaf administrationin 2006, the economy began to recover and GDP growth began to improve,reaching 9.4 percent in 2007. Since then, the country has maintained politicalstability and Liberia celebrated the tenth anniversary of the end of the civil war in2013. Economic growth has continued at 15 percent in 2013, led by publicservices reforms, iron ore exports, construction, and a rise in direct foreigninvestments. GDP grew 9.33 percent and inflation rate of 7.4 percent in 2015.Economic growth has been affected by the delay in direct foreign investments andpublic investment especially in the construction sector and the decline incommodities prices particularly rubber and iron ore. Ebola crisis has claimed morethan 4 000 lives in Liberia starting in 2014. By 2015 the government efforts tocontain the health crisis commenced to yield results. Liberia ranks 174th out of 189countries in the World Bank’s Doing Business report of 2015 climbing up 3 placesfrom 2014.
Access to finance
Liberia’s financial sector in 2014 includes the Central Bank of Liberia (CBL), ninecommercial banks with 85 branches, 20 registered insurance companies, 23registered microfinance institutions, 599 savings and loans associations and fourrural community finance institutions. According to the CBL report, bankingindustry balance sheets showed positive growth at the end of November 2014,with total commercial bank assets increasing at a rate of 7.4 percent over thefigures recorded for the same period a year ago. Overall the growth rate reflectscontinuous confidence in the banking system.
KEY FIGURES
Main Urban Centres Monrovia (capital)
Exchange Rate: 1 US$***Inflation 2013 | 2014 (est.) | 2015 (prov.) | 2016 (prov.) *
84.50 Liberian Dollar (LRD)7.6 | 9.9 | 7.4 | 7.0
Population^ | Population growth rate (2013)^Urban population (% of total)^ | Urbanisation rate (% in 2013)^
4 396 873 | 2.3749.31 | 3.15
GDP / capita (current US$)^ | GDP growth rate (annual %)^GNI / capita, Atlas method (current US$) ^Population below national poverty line*Unemployment rate (%)*Gini co-efficient (year of survey)^^HDI (Global Ranking)" | HDI (Country Index Score)”
461.00 | 9.3340063.83.738.06 (2007)175 | 0.412
Lending Interest Rate^Mortgage Interest Rate (%) | Mortgage Term (years)#Credit % of GDP^Average Mortgages % of GDP° Price To Rent Ratio City Centre** | Outside City Centre**Gross Rental Yield City Centre** | Outside of City Centre**Outstanding home loan (% age 15+)##
...8.00 | 10...0.34% (2008).........
What is the cost of standard 50kg bag of cement (in US$)? #What is the price of the cheapest, newly built house by a formaldeveloper or contractor (in US$)? #What is the size of this house (in m2)? #What is the average rental price for a formal unit (in US$/month)#What is the minimum plot size for residential property (in m²)#
8.75
15 000...12325
Ease of doing business rank !Number of procedures to register property !Time (days) to register property !Cost (% of property value) to register property !
174104412.90
*** Conmill.com The Currency Converter^ World Bank's World Development Indicators (2014)~ World Bank PovcalNet: an online poverty analysis tool, various years^^ The World Bank's PovCalnet" UNDP's International Human Development Indicators (2014)° Various: Badev et al. "Housing Finance Across Countries: New Data and Analysis" – Unpublished
paper/Hofinet/World Bank## Global Financial Inclusion Database (FINDEX)# CAHF Annual Survey Data (September 2015)! World Bank's Doing Business Survey Data (2015)** Numbeo Online User-Contributed Database
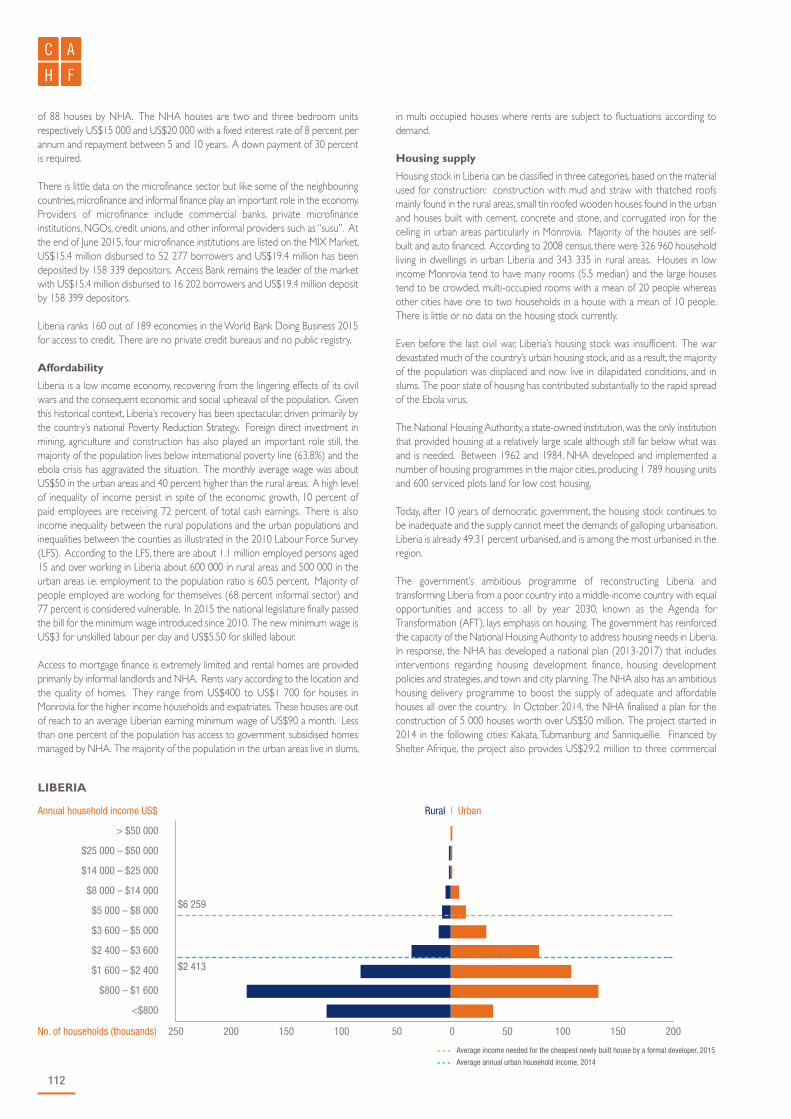
112
of 88 houses by NHA. The NHA houses are two and three bedroom unitsrespectively US$15 000 and US$20 000 with a fixed interest rate of 8 percent perannum and repayment between 5 and 10 years. A down payment of 30 percentis required.
There is little data on the microfinance sector but like some of the neighbouringcountries, microfinance and informal finance play an important role in the economy.Providers of microfinance include commercial banks, private microfinanceinstitutions, NGOs, credit unions, and other informal providers such as “susu”. Atthe end of June 2015, four microfinance institutions are listed on the MIX Market,US$15.4 million disbursed to 52 277 borrowers and US$19.4 million has beendeposited by 158 339 depositors. Access Bank remains the leader of the marketwith US$15.4 million disbursed to 16 202 borrowers and US$19.4 million depositby 158 399 depositors.
Liberia ranks 160 out of 189 economies in the World Bank Doing Business 2015for access to credit. There are no private credit bureaus and no public registry.
Affordability
Liberia is a low income economy, recovering from the lingering effects of its civilwars and the consequent economic and social upheaval of the population. Giventhis historical context, Liberia’s recovery has been spectacular, driven primarily bythe country’s national Poverty Reduction Strategy. Foreign direct investment inmining, agriculture and construction has also played an important role still, themajority of the population lives below international poverty line (63.8%) and theebola crisis has aggravated the situation. The monthly average wage was aboutUS$50 in the urban areas and 40 percent higher than the rural areas. A high levelof inequality of income persist in spite of the economic growth, 10 percent ofpaid employees are receiving 72 percent of total cash earnings. There is alsoincome inequality between the rural populations and the urban populations andinequalities between the counties as illustrated in the 2010 Labour Force Survey(LFS). According to the LFS, there are about 1.1 million employed persons aged15 and over working in Liberia about 600 000 in rural areas and 500 000 in theurban areas i.e. employment to the population ratio is 60.5 percent. Majority ofpeople employed are working for themselves (68 percent informal sector) and77 percent is considered vulnerable. In 2015 the national legislature finally passedthe bill for the minimum wage introduced since 2010. The new minimum wage isUS$3 for unskilled labour per day and US$5.50 for skilled labour.
Access to mortgage finance is extremely limited and rental homes are providedprimarily by informal landlords and NHA. Rents vary according to the location andthe quality of homes. They range from US$400 to US$1 700 for houses inMonrovia for the higher income households and expatriates. These houses are outof reach to an average Liberian earning minimum wage of US$90 a month. Lessthan one percent of the population has access to government subsidised homesmanaged by NHA. The majority of the population in the urban areas live in slums,
in multi occupied houses where rents are subject to fluctuations according todemand.
Housing supply
Housing stock in Liberia can be classified in three categories, based on the materialused for construction: construction with mud and straw with thatched roofsmainly found in the rural areas, small tin roofed wooden houses found in the urbanand houses built with cement, concrete and stone, and corrugated iron for theceiling in urban areas particularly in Monrovia. Majority of the houses are self-built and auto financed. According to 2008 census, there were 326 960 householdliving in dwellings in urban Liberia and 343 335 in rural areas. Houses in lowincome Monrovia tend to have many rooms (5.5 median) and the large housestend to be crowded, multi-occupied rooms with a mean of 20 people whereasother cities have one to two households in a house with a mean of 10 people.There is little or no data on the housing stock currently.
Even before the last civil war, Liberia’s housing stock was insufficient. The wardevastated much of the country’s urban housing stock, and as a result, the majorityof the population was displaced and now live in dilapidated conditions, and inslums. The poor state of housing has contributed substantially to the rapid spreadof the Ebola virus.
The National Housing Authority, a state-owned institution, was the only institutionthat provided housing at a relatively large scale although still far below what wasand is needed. Between 1962 and 1984, NHA developed and implemented anumber of housing programmes in the major cities, producing 1 789 housing unitsand 600 serviced plots land for low cost housing.
Today, after 10 years of democratic government, the housing stock continues tobe inadequate and the supply cannot meet the demands of galloping urbanisation.Liberia is already 49.31 percent urbanised, and is among the most urbanised in theregion.
The government’s ambitious programme of reconstructing Liberia andtransforming Liberia from a poor country into a middle-income country with equalopportunities and access to all by year 2030, known as the Agenda forTransformation (AFT), lays emphasis on housing. The government has reinforcedthe capacity of the National Housing Authority to address housing needs in Liberia.In response, the NHA has developed a national plan (2013-2017) that includesinterventions regarding housing development finance, housing developmentpolicies and strategies, and town and city planning. The NHA also has an ambitioushousing delivery programme to boost the supply of adequate and affordablehouses all over the country. In October 2014, the NHA finalised a plan for theconstruction of 5 000 houses worth over US$50 million. The project started in2014 in the following cities: Kakata, Tubmanburg and Sanniquellie. Financed byShelter Afrique, the project also provides US$29.2 million to three commercial
> $50 000
$25 000 – $50 000
$14 000 – $25 000
$8 000 – $14 000
$5 000 – $8 000
$3 600 – $5 000
$2 400 – $3 600
$1 600 – $2 400
$800 – $1 600
<$800
- - - Average income needed for the cheapest newly built house by a formal developer, 2015
- - - Average annual urban household income, 2014
LIBERIA
$6 259
$2 413
Rural | UrbanAnnual household income US$
No. of households (thousands) 250 200 150 100 50 0 50 100 150 200

Africa Housing Finance Yearbook 2015
113
banks to give long term loans to eligible Liberians. The project is ongoing. Otherprojects include the Ellen Johnson Housing Estate, an estate of 125 housing units,in Marshall and Margibi County programmed to be delivered this year and financedby the government of Liberia.
The government is also encouraging the private sector to participate in financingaffordable homes for their employees. Some of the following companies that haveinitiated partnership with the government to provide affordable homes for theiremployees are Arcelor Mital, Putu Iron Ore Mining and Golden Veroleum.
Other private companies are emerging in the housing market as a result of thecurrent reconstruction drive and economic growth of the country, as well as theefforts of the government in promoting investment opportunities. Among theprivate companies are Global Building Solutions, Real Estate Developers Inc. andBroad Cove Partners. Broad Cove Partners development is called Ecohomes, thefirst project is an estate on 300 acres parcel of land located on the RIA highwaybetween Monrovia and Robert International Airport featuring renewable energyefficient and construction material produced locally to stimulate employment.
The project is a variety of single family homes and a small number of duplexattached houses total 500 planned houses with modern social and commercialamenities. Broad Cove is the lead investor. Prices are from US$39 900 cash fora one bedroom house and US$64 000 for 3 bedrooms with possibility ofmortgage and a monthly payment of US$363 for 10 years for the one bedroomhouse. The SINLIB real estate programme is a partnership between SINLIB RealEstate Developers Inc. and NHA. The project is called Monrovia House andlocated near Redlight Market and the new Fendell Campus of the University ofLiberia. The target market is middle class Liberian. There are 50 houses delivered,one to three bedrooms with modern amenities. The project offers mortgage andthe minimum down payment is 30 percent of the house value. These developersare involved in a number of housing developments, including SINLIB Real Estateprogramme and 500 houses, recreational and commercial amenities programmedby Ecohomes. The homes are delivered with home owner’s certificate.
The Director of Liberia National Housing Authority asserted that Liberia willconstruct 512 000 housing units by 2030, the target year for the country toachieve middle income status. This means Liberia needs at least 30 000 newhouses every year for the next seventeen years.
Property markets
Liberia is a post conflict country and going through reconstruction and as suchadequate houses are in great demand therefore rental prices are increasing andhouses for sale are practically non-existent except for the new housingprogrammes. The need to reconstruct the post-conflict Liberia offersopportunities for real estate investments and property markets. The exorbitantrents demanded by landlords in most cases for inadequate houses are the resultof insufficiency supply of housing and the need to fill the gap. Also there is a needto develop modern and adequate houses and other urban infrastructures to meetthe demand of business, nongovernmental organisations and the diasporas whoare returning home or interested in investing in Liberia. As in most post conflictcountries, data regarding the property market is scarce and when available, doesnot reflect market reality.
According to the World Bank’s 2015 Doing Business Report, Liberia ranks 174out of 189 economies in terms of ease of registering property. Ten proceduresare required to register property almost doubled the six procedures required, onaverage, across Sub-Saharan Africa, and the process takes 44 days. Cost ofregistering property is 12.9 percent of the cost of value of property.
Policy and regulation
The legal and regulatory framework governing urban development and specificallyhousing in general is very meagre and followed by hardly any developers. Thezoning law though enacted since 1947 (to regulate zoning in Liberia) has not beenimplemented and the Building Code of 1958 has not been used. The presidenthas given instructions to the Ministry of Public works, the ministry in charge toenforce the law.
Also to attain the vision defined in “Liberia Rising 2030” and the TransformationAgenda (AFT), the government of Liberia has recognised the need to amelioratethe country’s housing policy. To meet this end the government instructed theNational Housing Authority to develop a national Housing Development Policyand Strategy. In response, the NHA has produced a draft for new national policyto guide in production of 512 000 housing units between now and 2030. A twoday national stakeholder’s colloquium was organised in April 2014 to have a largerepresentation from across Liberia to deliberate on the new policy. It has notbeen possible to find information on the outcome.
Opportunities
Liberia has suffered from two civil wars and economic instability for decades. Thecountry’s progress since the election of Ellen Johnson Sirleaf in 2006, however, hasbeen impressive. Liberia’s economic growth rate, at 9.33 percent in 2014, is oneof the highest in the world. Although commodities prices have fallen in 2014 –2015 the trend for global demand will remain unchanged overtime. There is nodoubt that the global demand for natural resources, the different governmenteconomic development programmes, the NHA programme for affordable homes,improvement in doing business environment and fiscal incentives to encourageinvestments and develop the private sector, are all indicators of the opportunities.The country is rich in natural resources and has also been intensifying itsexploration for offshore oil. Its geographic and historical context, given its slavehistory, also makes it a very attractive hub for the tourist industry. Infrastructuredevelopment projects, including road construction, port rehabilitation, the repairand expansion of the Mount Coffee Hydropower plant (with a maximum capacityof 80MW), and the construction of new heavy fuel power plants to improveproduction of electricity and boost growth in the manufacturing, and services, areall underway.
The challenges arising from the recent Ebola outbreak notwithstanding, Liberia’sambitious programme to attain a middle income status by year 2030 creates thecontext for very real housing investment opportunities. The different governmentdevelopment programmes and the efforts of the government in improvingbusiness environments, the results of which can be measured by the position ofthe country as well as the rate of urbanisation (49.31 percent), are indicators ofopportunities for the housing finance and housing development sectors.
Sources
Akpa, E.K. The size Distribution of Income in Liberia (Ministry of Finance, Monrovia,Liberia).Central Bank of Liberia Policy Statement 2015-09-20.Central Bank of Liberia Annual Report 2014.Central Bank of Liberia, 2014 Financial and Economic Bulletin, Volume 16 N° 2,April – June 2014.Kwanue, C Y, 2014 National Housing Policy in Sight, March, 26 2014.Liberia Housing Profile UN Habitat 2014.Liberia Institute of Statistics and Geo-Information Services (LISGIS), 2011 Reporton the Liberia. Labour Force Survey 2010: February 2011.Liberia Low Income Housing Development Plan: Presented by Robert S. Bestman,Assistant Minister for Urban Affairs.National Housing Authority, 2012 programme for the Construction of 5000Affordable Housing Units and Creation of Homeownership and Mortgage forLow to Middle Income Earners. Morovia, Liberia.World Bank Data. World Bank, Doing Business Report 2015.

114
Websites
www.afdb.orgwww.africaneconomicoutlook.orgwww.doingbusiness.orgwww.ecohomes-liberian.comwww.emansion.gov.lrwww.findex.comwww.ifc.orgwww.ilo.orgwww.Legislature.govwww.liberianobserver.comwww.micatliberia.comwww.mixmarket.orgwww.monroviahouse.comwww.opic.gov/.../broad-covewww.shelterafrique.orgwww.unhabitat.orgwww.worldbank.org

Africa Housing Finance Yearbook 2015
115
Libya
non-performing loans (NPLs), limited credit information systems and poor bankingsupervision have restricted the competitiveness of financial services and theavailability of housing finance. Official figures of NPLs are largely unreliable,reported at ranging from 17.2 to 35.4 percent over the past decade, yet it isestimated that they have reached a level where most of Libya's public institutionswould be considered technically insolvent without the continuous transfer ofcentral government funds. As a result, Libya remains essentially a cash economy,where transactions largely operate outside of the formal banking sector.
For years, the banking sector in Libya has been very isolated. Early in 1970, whenGaddafi came to power, all the banks were nationalised, and international sanctionsthrough the 1990s limited foreign investment in Libya. The CBL oversees theLibyan financial sector, which is dominated by five state-owned banks (whichcontrol around 85 percent of banking assets), 15 commercial banks, fourspecialized credit institutions, five insurance companies and a recently establishedstock market.
A process of privatisation and banking reform commenced in 2007, with someforeign banks authorised to acquire shares in public banks, the legalisation of jointventures between foreigners and local investors in 2010 and a rise of interest inseeking new banking licenses. However, poor security in the past year has limitedany progress in these financial sector reforms.
Overview
A deteriorating political and security situation has stagnated post-revolutionprogress in Libya. After the fall of Gaddafi's authoritarian regime in October 2011,the country has struggled to put in place a stable government resulting in ongoingunrest and civil war. In 2015, competing parliaments, declining oil revenues andinstability have all contributed to the worsening situation.
The General National Congress that acted as legislative body since 2012 rejectedthe election results for the House of Representatives in June 2014, promptingthem to reconvene in Tripoli and create a dual governance structure in the country.Consequently, the public budget was never approved in 2014, and the CentralBank of Libya (CBL) only allocated funds for public sector wages and fuel subsidies,without any budget for ministries or government programmes. As a result, allgovernment programmes have been stalled.
Agreement between various militia and government helped to raise oil exportsin the second half of 2014, from a low of 320 000 barrels per day in July 2014.However, as oil accounts for about 80 percent of GDP and 99 percent ofgovernment revenue, public budget has reduced substantially, causing a deficit thatis being funded by Libya's foreign reserves.
With a population of 6.2 million people, GDP has reduced over the past few yearsto US$12 000 in 2013, with -9.4 percent growth in 2014. Yet, Libya is stillconsidered as an upper-middle income country even though there is limitedeconomic and political freedom. Economic freedom in Libya, a ranking of freedomin trade, business, investment and property rights measured by the Wall StreetJournal and Heritage Foundation, was estimated at 38.59 in 2013, below the levelof ‘repressed’, and the 2015 World Bank Doing Business report ranked Libya as188th out of 189 countries for ease of doing business.
Key challenges that Libya faces include restoring the rule of law, putting in place afunctional government, reducing dependency on the petroleum industry, anddeveloping strategies for long-term development.
Access to finance
According to the 2014-15 Global Competitiveness Report, Libya ranked 144th outof 144 countries in terms of financial market development. High levels of liquidity,
KEY FIGURES
Main Urban Centres Tripoli (capital), Benghazi
Exchange Rate: 1 US$***Inflation 2013 | 2014 (est.) | 2015 (prov.) | 2016 (prov.) *
1.38 Libyan Dinar (LYD)2.6 | 2.6 | 2.7 | 2.9
Population^ | Population growth rate (2013)^Urban population (% of total)^ | Urbanisation rate (% in 2013)^
6 253 452 | 0.8378.36 | 1.08
GDP / capita (current US$)^ | GDP growth rate (annual %)^GNI / capita, Atlas method (current US$) ^Population below national poverty line*Unemployment rate (%)*Gini co-efficient (year of survey)^^HDI (Global Ranking)" | HDI (Country Index Score)”
6 575.43 | -24.037 92030 (2014 est.)/19.8...55 | 0.784
Lending Interest Rate^Mortgage Interest Rate (%) | Mortgage Term (years)#Credit % of GDP^Average Mortgages % of GDP° Price To Rent Ratio City Centre** | Outside City Centre**Gross Rental Yield City Centre** | Outside of City Centre**Outstanding home loan (% age 15+)##
6.009.50 | 2526.96<1%*^!7.07 | 7.0814.15% | 14.13%...
What is the cost of standard 50kg bag of cement (in US$)? #What is the price of the cheapest, newly built house by a formaldeveloper or contractor (in US$)? #What is the size of this house (in m2)? #What is the average rental price for a formal unit (in US$/month)#What is the minimum plot size for residential property (in m²)#
10.00
50 000100450...
Ease of doing business rank !Number of procedures to register property !Time (days) to register property !Cost (% of property value) to register property !
...
...
...
...
*** Conmill.com The Currency Converter^ World Bank's World Development Indicators (2014)~ World Bank PovcalNet: an online poverty analysis tool, various years^^ The World Bank's PovCalnet" UNDP's International Human Development Indicators (2014)° Various: Badev et al. "Housing Finance Across Countries: New Data and Analysis" – Unpublished
paper/Hofinet/World Bank## Global Financial Inclusion Database (FINDEX)# CAHF Annual Survey Data (September 2015)! World Bank's Doing Business Survey Data (2015)** Numbeo Online User-Contributed Database/ CIA World Factbook
World Bank (2013) MENA Housing Finance Mission to Libya, Back to the Office Report*^! Hofinet: http://www.hofinet.org/countries/hfs.aspx?regionId=5&id=5

116
Bank lending for housing finance is restricted due to high collateral requirements,the lack of a Libyan land registry or credit bureau and inadequate central bankregulation. Libya has a very low loan-to-deposit ratio of approximately 23.4 percent(as of March 2013) compared to an average of 80 percent for the region. As aresult, banks are highly liquid. The Savings and Real Estate Investment Bank grantssubsidised housing loans to Libyan citizens at zero interest rate and tenors of upto 30 years. There is a lack of independent oversight, which opens the door tocorruption and many Libyans view these loans as grants, so there are very highdefault rates. The bank’s poor targeting of home loans and lack of enforcementof repayments distort the housing finance market and restrict the development ofa functioning mortgage system.
The domestic credit to GDP ratio was last measured at 13.9 percent in 2013, farbelow the MENA average (almost 60 percent). The ratio of housing finance toGDP ratio has remained small, at below 1 percent. Unless allocated a loan throughthe government program, for which households who do not yet own a home arequalified, it is particularly difficult for low income or small borrowers to accessfinance for housing.
According to the IMF, the banking sector is currently well capitalised, but it maybecome vulnerable to asset quality deterioration and the introduction of newlegislation. In 2013, the government passed a law that will enforce a strict IslamicBanking regime and ban interest in financial transactions starting in January 2015,being the third Middle Eastern country, behind Iran and Sudan, to ban non-Shariacompliant banking. This will essentially preclude conventional banks from lendingand pose serious risks to the financial sector. Lack of government control of thecountry has left enforcement of this policy in limbo and many commercial bankshave ceased lending, effectively paralysing the banking sector.
Affordability
More than 80 percent of the Libyan working population is employed by the publicsector, while a mere four percent of Libyans are employed by the private sector.Although per capita income in Libya was estimated at US$12 200 in 2013, one ofthe highest in Africa, the wealth in the country is not distributed equally among thepopulation. Median income per capita is around US$600 per month, meanwhilerent in a one bedroom apartment in central Tripoli can exceed US$2 000 permonth, and on average, cost US$858 per month, or US$526 per month on theoutskirts, well beyond the affordability limits of the average household. The houseprice to income ratio is in the order of 6.45 to buy in Tripoli, which makesaffordability difficult for low income groups.
Housing is very difficult to access on the private market, due to the small amountof private land available for purchase and development, and the small secondarymarket in formal housing resale. As a result, the majority of households opt to siton waiting lists for years until they are able to access a subsidised house from theLibyan government, often living in poorly serviced informal neighbourhood orovercrowded units housing multiple families.
In 2007, a minimum wage was established at US$200 per month for an individualworker, yet the enforcement of this minimum is not clear. Overall unemploymentwas estimated at 33 percent by the World Bank in 2012 and even higher for youth,up to 50 percent, with the majority of unemployed holding university degrees.During the civil unrest following the revolution, unemployment is expected tohave risen into 2015 and the earning capacity of residents has fallen due todisruptions in business. At the same time, prices have increased, which hasnegatively affected the purchasing power of the lowest-income and least resilienthouseholds.
Public spending on state subsidies remains very high. Public sector workers arereported to receive a monthly housing allowance that ranges from 12 to 25percent of their salary, yet most of the benefits are captured by higher incomegroups, so that subsidies rarely reach the neediest. Even with substantial resources,the government is unable to respond to all the demand, leaving a large section ofthe population unserved. UN-Habitat estimated in 2001 that 35 percent of theurban population in Libya were living in slums, figures that have been confirmed byvarious relief agencies working in the country.
Housing supply
Housing supply in Libya has historically been the main responsibility of thegovernment with the government providing free education, healthcare, publichousing – offered to households with zero interest soft loans – and transportunder Gaddafi's regime. From 1989 to 1996, around 75 percent of housing wasconstructed by the public sector. From 1997 onwards, the government hascontinued to play an instrumental role in housing supply. Housing construction andreal estate transactions have been significantly halted by the unrest. In 2014, thehousing shortage was estimated at 350 000, yet there has been a lot of destructionin cities and displacement of people, which will exacerbate housing shortageestimates once peace is restored.
The Housing and Infrastructure Board (HIB) of the Ministry of Housing andUtilities (MHU) is responsible for the implementation of public works contracts.HIB works on infrastructure and public building projects, along with managing thestate’s residential projects on a turn-key basis, contracting with both national andmultinational firms.
Since its creation in 2007, HIB has been tasked with building 200 000 units. Officialfigures from the MHU in 2012 indicated that 134 341 housing units were underconstruction, 94 500 were in their bidding phase and 11 121 had been completed.Yet, the entire programme was put on hold in 2011 with an estimated US$11 billionworth of uncompleted housing projects under construction. Due to the poorsecurity situation, many of these projects have remained unfinished and in limboas HIB has struggled to relaunch their programme and the EU-imposed sanctions,that had put restrictive measures in place since 2011, were only lifted in January2014. In December 2013, AECOM announced a partnership with HIB worthover US$205 million for 25 months, yet the programme has not been
> $50 000
$25 000 – $50 000
$14 000 – $25 000
$8 000 – $14 000
$5 000 – $8 000
$3 600 – $5 000
$2 400 – $3 600
$1 600 – $2 400
$800 – $1 600
<$800
- - - Average income needed for the cheapest newly built house by a formal developer, 2013
- - - Average annual urban household income, 2014
LIBYA
$18 013
$7 989
Rural | UrbanAnnual household income US$
No. of households (thousands) 100 50 0 50 100 150 200 250 300

Africa Housing Finance Yearbook 2015
117
implemented due to the unstable security situation. Another international firm,Egypt’s Al Abd halted work on housing projects worth US$102 million in 2015over ongoing security tensions.
Since 2011, many foreign and local investors involved in housing construction inLibya have been forced to abandon or face interruptions in their work. Efforts torecommence have been disrupted by continued insecurity, arguments overpayment delays, and increased costs in the intervening period. This had resultedin very limited new supply and an increasing housing backlog caused by destructionof units and internal displacement of people.
Property market
The property market in Libya has been heavily influenced by decades of Gaddafi’ssystem, which developed a system of patronage that has had a serious impact onland availability and exacerbated conflicts related to property ownership followingthe revolution. There is no procedure for dealing with construction permits,registering property and resolving insolvency, giving Libya a ranking of 189th, or last,in these sections of the 2015 Doing Business report.
Large plots of land previously owned by Italian farmers, about 38 000 hectares,were confiscated and redistributed among Libyans after the Coup d'Etat in 1969.These plots have been further fragmented over time due to the traditionalinheritance system guaranteeing each son a part of their father's land. In 1971, thestate confirmed all confiscated land as state land and was involved in furtherconfiscations of uncultivated land and reallocation to citizens in accordance withwhat is considered acceptable to fulfill their needs. As a result, it is very difficult todetermine ownership.
In the years before the revolution, Libya attempted to open up its real estatesector and enabled foreign investment in real estate, known as Decree 21 in 2006.This decree allowed the HIB to contract private and foreign developers forproperty development. Although foreigners can now buy real estate, a lack ofclarity on property rights prevented much uptake, and efforts to open theproperty and real estate markets have been significantly set back due to theincreased insecurity following the 2011 revolution, which have scared awaypotential investors.
Following the revolution, property markets have been in disarray as many formerowners of confiscated land returned to lobby for reform of the property laws andcompensation for land that had been confiscated. Draft bills on propertyownership were brought before parliament, however nothing has been passeddue to the political fragmentation and controversy of such reforms. The situationis further complicated by the fact that many properties have been resold andpapers were destroyed in the early 1980s. It is estimated that up to three-quartersof home-owners in Tripoli could have been formerly confiscated homes.
Until the ambiguity of property rights are resolved, the banks will not allowproperty as collateral when ownership of a property is under dispute. Theproperty market is further constrained due to difficulties in the ease of doingbusiness and because corruption remains so high in Libya. TransparencyInternational’s 2014 Corruption Perceptions Index rated Libya at 166th in theworld, out of 175 countries. Nevertheless, there is some optimism, with a groupof Gulf and Libyan investors buying the largest cement factory in the country inApril this year, betting on a construction boom and cement shortage once peaceis restored and reconstruction begins.
Policy and regulations
Throughout the dictatorship of Gaddafi, policies on land and housing have beenused to establish control over the population and built a large-scale system ofpatronage. In 1978, Gaddafi declared that property ownership was in the publicinterest in his manifesto, known as the Green Book. Private property wasconsidered acceptable as long as it was not “exploitative”, and Law 4 restricted theright of ownership to one house, beyond which property was confiscated. In1986, land ownership was abolished altogether. This was promoted by thegovernment as a means of redistribution, but has resulted in forcible confiscationof private property and reallocation by intransparent means. There are now effortsto revoke these laws, yet few reforms have taken place in the legal vacuumfollowing the end of the regime.
As part of Libya’s “opening up” policy, aimed at reintegrating the country into theinternational economy, Gaddafi’s son, Saif al-Islam, established a propertycompensation committee in 2007 to consider claims on previously expropriatedproperty. Yet, many former property owners fled Libya, in the early 1970s, and thesubsequent exchange of property, along with Gaddafi’s orders to destroy the landregistry in 1982, makes it very difficult to verify ownership claims. In the aftermathof the revolution, some of these former land owners have returned to reclaimtheir land, with some even hiring militias for the purpose.
Due to the previous regime’s ideology, Libya’s policies have been characterised bylarge-scale subsidies. The subsidy system has not been transparent, which makesit difficult to determine either the effectiveness or cost of the state-provision ofhousing. Public expenditure on housing has, in general, increased in the last decade.In 2007, it was reported to have reached as much as 30 percent of overall publicinvestment, with no figures for more recent years. Overwhelmingly, subsidies seemto have been misallocated and used for political reasons. Following the revolution,the government started to raise salaries and distribute a monthly allowance ofUS$400 per household (a total of US$480 million), in an attempt to calm theprotests in the country. The salaries of public workers and allowances to the lowincome are still being paid on a monthly basis, yet the targeting and expendituresare unclear.
In addition with regard to Public Housing Construction; Gaddafi’s governmentcarried out the mass construction of housing to ensure an adequate house for allLibyans. These units were sold to eligible households (those that had not owneda home before), who were able to purchase the units with a zero interest long-term loan from government banks. The high rate of default and concessionarynature of these loans, has restricted the growth of housing finance sector.
The post-revolutionary policy direction on housing is still in a state of uncertainty.It is likely that the government’s strategy will focus on clarifying tenure securityand property rights and increasing the participation of the private sector. Subsidiesfor housing are also likely to continue, where the state engages private companiesto build public housing on a turnkey basis, which are then sold on to householdswith concessionary housing finance provided through the public banks. This maybe used to stimulate the reconstruction and development that is required and tocontinue to attract foreign investors.
Opportunities
In 2013 and 2014, the government plan was stated as to (i) strengthen the businessenvironment to be more competitive and attractive to investors; and to promoteprivate sector development leading to sustainable job creation; (ii) diversify theeconomy to promote industry and trade, tourism, agriculture, and the oil and gassector; (iii) build the country’s human resources, provide adequate training, as wellas improve management of human resources in the public and private sector; (iv)strengthen public sector performance and accountability at the central and locallevels; and (v) strengthen coordination within government on the reformprogramme and promote citizen participation.
However, as insecurity, rival governments, and a widening current account deficitcontinue, the short-term outlook for Libya is not positive. Foreign reserves areexpected to decrease further through 2016 as oil revenues remain low. A peaceagreement to reinstate a functioning unity government has been facilitated by theUN, starting in the Moroccan city of Skhirat in July. Talks are continuing and thereis optimism that agreement can be reached with the Tripoli-based GeneralNational Congress (GNC) and to finalise the details of several outstandingannexes. Meanwhile, the mandate for the UN Support Mission in Libya (UNSMIL)has been extended until March 2016 and the humanitarian situation continues todeteriorate, affecting an estimated two million people, including approximately435 000 internally displaced persons (IDPs).
Addressing the chronic housing shortage and providing shelter to IDPs can beexpected to become a primary priority of the government and population as theterms of the peace agreement are settled and security begins to return. Once thetreasury resumes normal functions, the Libyan government can also be expectedto mobilise substantial resources toward reform and clarification of property rights,as well as development of the real estate sector, which will provide a goodopportunity for future investors.
118
Sources:
African Economic Outlook. (2014).Fitzgerald, M. and T. Megerisi (April 2015). Libya – Whose Land is it? PropertyRights and Transition. Legatum Institute. Transitions Forum. Internal Displacement Monitoring Centre (30 March 2015). Overview; Libya –State Collapse Triggers Mass Displacement. Accessible at: http://www.internal-displacement.org/middle-east-and-north-africa/libya/2015/libya-state-collapse-triggers-mass-displacement.International Monetary Fund. (2013). Libya – Selected Issues, May 2013 IMFCountry Report No. 13/151.Libya Business News (6 December 2013). AECOM wins $209 million housingcontract: http://www.libya-businessnews.com/2013/12/06/aecom-wins-209m-housing-contract/.Mireles, I., Ogilvie, S. and R. Shedid. (2013). Libya Profile. Wharton.fic.wharton.upenn.edu/fic/africa/Libya%20Final.pdf.Sheibani, G. and Havard, T. (2005). The government role in housing in Libya duringthe period 1970 – 2000.World Bank. Doing Business. (2014).World Bank. MENA Quarterly Economy Brief. July 2014.World Bank. Libya – Financial Sector Review. April 2013.
Websites:
http://countrystudies.ushttp://english.ahram.org.egwww.globalpropertyguide.comwww.libyaherald.comwww.theglobaleconomy.comwww.tradingeconomics.comwww.tripolipost.comwww.hib.ly
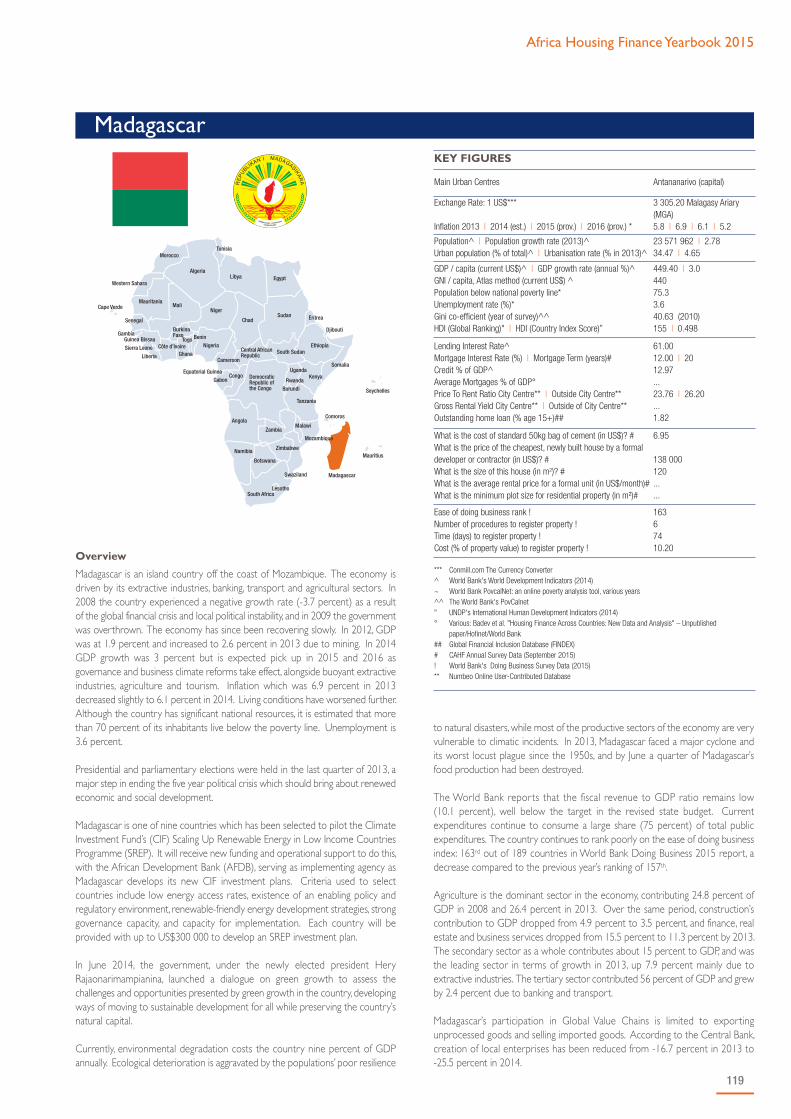
Africa Housing Finance Yearbook 2015
119
Madagascar
to natural disasters, while most of the productive sectors of the economy are veryvulnerable to climatic incidents. In 2013, Madagascar faced a major cyclone andits worst locust plague since the 1950s, and by June a quarter of Madagascar’sfood production had been destroyed.
The World Bank reports that the fiscal revenue to GDP ratio remains low(10.1 percent), well below the target in the revised state budget. Currentexpenditures continue to consume a large share (75 percent) of total publicexpenditures. The country continues to rank poorly on the ease of doing businessindex: 163rd out of 189 countries in World Bank Doing Business 2015 report, adecrease compared to the previous year’s ranking of 157th.
Agriculture is the dominant sector in the economy, contributing 24.8 percent ofGDP in 2008 and 26.4 percent in 2013. Over the same period, construction’scontribution to GDP dropped from 4.9 percent to 3.5 percent, and finance, realestate and business services dropped from 15.5 percent to 11.3 percent by 2013.The secondary sector as a whole contributes about 15 percent to GDP, and wasthe leading sector in terms of growth in 2013, up 7.9 percent mainly due toextractive industries. The tertiary sector contributed 56 percent of GDP and grewby 2.4 percent due to banking and transport.
Madagascar’s participation in Global Value Chains is limited to exportingunprocessed goods and selling imported goods. According to the Central Bank,creation of local enterprises has been reduced from -16.7 percent in 2013 to-25.5 percent in 2014.
Overview
Madagascar is an island country off the coast of Mozambique. The economy isdriven by its extractive industries, banking, transport and agricultural sectors. In2008 the country experienced a negative growth rate (-3.7 percent) as a resultof the global financial crisis and local political instability, and in 2009 the governmentwas overthrown. The economy has since been recovering slowly. In 2012, GDPwas at 1.9 percent and increased to 2.6 percent in 2013 due to mining. In 2014GDP growth was 3 percent but is expected pick up in 2015 and 2016 asgovernance and business climate reforms take effect, alongside buoyant extractiveindustries, agriculture and tourism. Inflation which was 6.9 percent in 2013decreased slightly to 6.1 percent in 2014. Living conditions have worsened further.Although the country has significant national resources, it is estimated that morethan 70 percent of its inhabitants live below the poverty line. Unemployment is3.6 percent.
Presidential and parliamentary elections were held in the last quarter of 2013, amajor step in ending the five year political crisis which should bring about renewedeconomic and social development.
Madagascar is one of nine countries which has been selected to pilot the ClimateInvestment Fund’s (CIF) Scaling Up Renewable Energy in Low Income CountriesProgramme (SREP). It will receive new funding and operational support to do this,with the African Development Bank (AFDB), serving as implementing agency asMadagascar develops its new CIF investment plans. Criteria used to selectcountries include low energy access rates, existence of an enabling policy andregulatory environment, renewable-friendly energy development strategies, stronggovernance capacity, and capacity for implementation. Each country will beprovided with up to US$300 000 to develop an SREP investment plan.
In June 2014, the government, under the newly elected president HeryRajaonarimampianina, launched a dialogue on green growth to assess thechallenges and opportunities presented by green growth in the country, developingways of moving to sustainable development for all while preserving the country’snatural capital.
Currently, environmental degradation costs the country nine percent of GDPannually. Ecological deterioration is aggravated by the populations’ poor resilience
KEY FIGURES
Main Urban Centres Antananarivo (capital)
Exchange Rate: 1 US$***
Inflation 2013 | 2014 (est.) | 2015 (prov.) | 2016 (prov.) *
3 305.20 Malagasy Ariary(MGA)5.8 | 6.9 | 6.1 | 5.2
Population^ | Population growth rate (2013)^Urban population (% of total)^ | Urbanisation rate (% in 2013)^
23 571 962 | 2.7834.47 | 4.65
GDP / capita (current US$)^ | GDP growth rate (annual %)^GNI / capita, Atlas method (current US$) ^Population below national poverty line*Unemployment rate (%)*Gini co-efficient (year of survey)^^HDI (Global Ranking)" | HDI (Country Index Score)”
449.40 | 3.044075.33.640.63 (2010)155 | 0.498
Lending Interest Rate^Mortgage Interest Rate (%) | Mortgage Term (years)#Credit % of GDP^Average Mortgages % of GDP° Price To Rent Ratio City Centre** | Outside City Centre**Gross Rental Yield City Centre** | Outside of City Centre**Outstanding home loan (% age 15+)##
61.0012.00 | 2012.97...23.76 | 26.20...1.82
What is the cost of standard 50kg bag of cement (in US$)? #What is the price of the cheapest, newly built house by a formaldeveloper or contractor (in US$)? #What is the size of this house (in m2)? #What is the average rental price for a formal unit (in US$/month)#What is the minimum plot size for residential property (in m²)#
6.95
138 000120......
Ease of doing business rank !Number of procedures to register property !Time (days) to register property !Cost (% of property value) to register property !
16367410.20
*** Conmill.com The Currency Converter^ World Bank's World Development Indicators (2014)~ World Bank PovcalNet: an online poverty analysis tool, various years^^ The World Bank's PovCalnet" UNDP's International Human Development Indicators (2014)° Various: Badev et al. "Housing Finance Across Countries: New Data and Analysis" – Unpublished
paper/Hofinet/World Bank## Global Financial Inclusion Database (FINDEX)# CAHF Annual Survey Data (September 2015)! World Bank's Doing Business Survey Data (2015)** Numbeo Online User-Contributed Database

120
Access to finance
Madagascar's financial sector is managed tightly by the Central Bank, and thecountry has a comprehensive national finance strategy for 2013-2017. The CentralBank lending rate has been held at a steady 9.5 percent since August 2009, allowinga sense of stability in an otherwise uncertain economy. According to the CentralBank of Madagascar, there are 11 banks, seven non-bank financial institutions(pension funds and insurance companies) and 31 microfinance institutions(MFIs). The financial sector is dominated by commercial banks, which hold about84 percent of the total system’s assets, while non-bank financial institutions andmicrolenders account for the remaining 16 percent of assets. Only five percentof the population use banks.
Increase in household expenditure has been financed by borrowings. As a result,private borrowing increased from 10.1 percent of GDP in 2013, to 17.1 percentin 2014, showing an increase of seven percent.
The increase in short term credit (from 11.4 percent in 2013 to 23.7 percent in2014) is meaningful, as compared to medium term credit (from 8.6 percent in2013 to 9.2 percent in 2014).
Public sector credit has been minimal and has decreased both for the short term(72.9% in 2013 to 20.0% in 2014) and the long term (from 73% in 2013 to 49%in 2014) credit. Most credit given has short to medium term maturity, with amaximum maturity of seven years. The average lending interest rate by banks was13.5 percent in 2014, while the deposit interest rate was 10.75 percent in thesame year. As a result of the high interest rates, only a select clientele can affordto obtain credit from the banks.
The microfinance sector is small at five percent of bank transactions, but has beengrowing rapidly. From a value of about AR22.7 billion (US$6.867 million) in 2002,it had grown to about AR244.4 billion (US$73.94 million) in 2011. The sector hasapproximately 31 players, including state, foreign investor and donor-supportedinitiatives. The Central Bank regulates the sector. Some 16 MFIs reported to theMix Market (an online source of microfinance performance data and analysis), andin 2014 had a gross loan portfolio of US$148.9 million, disbursed to 192 191active borrowers. Almost 800 000 depositors saved US$114.3 million in deposits.The largest of these is CECAM, with 54 602 active borrowers in 2014 and a grossloan book of almost US$35 million. In 2012, Orange Madagascar collaboratedwith MFS Africa to launch an online money transfer service so that its customerscould receive international remittances directly to their Orange Money accounts.The intention was to lower the costs of sending money, both for the receiversand the senders.
Overall, access to financial services is extremely low. According to the InternationalMonetary Fund’s Financial Access Survey, only 15.1 in every 1 000 households hada loan with a commercial bank in 2013, and 67.2 in every 1 000 households had
a savings account with a commercial bank. Outstanding loans from commercialbanks in 2013 amounted to 10.72 percent of GDP, and deposits amounted to18.47 percent of GDP. In 2013, Madagascar only had 1.86 ATMs per 100 000adults, and 1.74 bank branches per 100 000 adults. There were only 0.38commercial bank branches per 1 000 km2 in 2013.
Between 2010 and 2012, the International Fund for Agricultural Development(IFAD) implemented a project to improve access to professional domestic andinternational remittance services mainly for the rural population in the Malagasyhighlands who have limited or no access to the formal banking sector. The AfricanDevelopment Bank provided a Credit line and Technical Assistance grant for thedevelopment of a credit product for rural micro, small and medium enterpriseswithin Première Agence de MicroFinance in Madagascar (PAMF-Madagascar)between 2011 and 2014. The United Nations Capital Development Fundimplemented a programme to strengthen coordination and supervision of theinclusive finance sector, develop financial infrastructure at the meso level, andimprove the provision of financial services to the rural poor between 2010 and2014. A project by IFAD is underway (from 2007 until 2015) to increase theincomes of poor rural people in five of the country’s poorest and most denselypopulated regions. It aims to create efficient business development services thatrespond to the needs of small and micro rural enterprises. It should also assist instructuring traditional clusters into modern value chains by line of business, toenable long-term sustainability and market expansion with linkages to regionalgrowth poles. IFAD also initiated a programme in 2009 which runs until 2018, itaims to support farmers and their organisations to better integrate them into theeconomy – by facilitating farmers’ access to services by matching demand andsupply, and increase production levels by establishing financial mechanismsresponding to demand for services, through the Agricultural Development Fundand the Regional Agricultural Development Fund.
In 2012, the World Bank launched the Global Financial Inclusion Database (GlobalFindex) to explore levels of financial inclusion around the world. According toGlobal Findex, 4.3 percent of rural and 9.7 percent of urban Madagascans over 15years of age have an account with a formal financial institution. Very fewMadagascans have an outstanding loan to purchase a home: 1.2 percent of thetop 60 percent of income earners and 0.4 percent of the bottom 40 percent ofincome earners. Loans for home construction are slightly more common but stillscarce: three percent of the top 60 percent of income earners had one, and1.4 percent of the bottom 40 percent of income earners. Poverty is widespreadin Madagascar. About 49.1 percent of the population earns less than US$1 a day,thus basic needs such as food, education and housing for this group of people islargely unsatisfied.
Enforcement of prudential standards is weak, as insufficient funds have beenavailable for supervision since the Central Bank ran into financial difficulties in 2004.Overall, there is a poor business climate. The country has dropped six places in
> $50 000
$25 000 – $50 000
$14 000 – $25 000
$8 000 – $14 000
$5 000 – $8 000
$3 600 – $5 000
$2 400 – $3 600
$1 600 – $2 400
$800 – $1 600
<$800
- - - Average income needed for the cheapest newly built house by a formal developer, 2015
- - - Average annual urban household income, 2014
MADAGASCAR
$65 057
$1 291
Rural | UrbanAnnual household income US$
No. of households (thousands) 3000 2500 2000 1 500 1000 500 0 500 1000

Africa Housing Finance Yearbook 2015
121
terms of rankings of ease of doing business, and is now 163rd of 189 countries,according to the World Bank’s 2015 Doing Business Report. It has, moreover,regressed in all the other fields except for ease of trading across borders (+1).Major obstacles to attracting investment are political instability, difficult access tocredit, corruption, lawlessness, lack of infrastructure, costly and unreliable energysupply and the absence of an independent legal system.
Affordability
GDP per capita in Madagascar decreased in 2012 by 0.9 percent, in 2013 by0.2 percent, but is estimated at having increased in 2014 by 0.9 percent and ispredicted to increase by 2.6 percent in 2015. In 2012 it was estimated at US$449(AR102 million), down 4.2 percent from 2011. In 2010, the average annual wagewas estimated at US$700 (AR1.59 million), but much lower in the agriculturalsector, at about US$340 (AR771 800).
Household affordability is further affected by droughts, flooding and cyclones, thethree most common disasters that affect more than half of all households. It isnot unusual for a household to suffer a loss equivalent to a full month’s income.72 percent of households say that recovering from such a shock can take over ayear.
Housing supply
According to the Periodic Household Survey of 2010, about 86.5 percent of thecountry’s households live in self-built, traditional housing. These houses are usuallytemporary structures made with compacted mud and poorly attached thatchedroofs which provide very little protection from diseases and the environment, andlittle security from crime. Access to basic services is very low. Only 27.7 percentof the population has access to water, and only 7.1 percent to improved sanitation.Approximately 88.2 percent of the urban population lives in slums, and over57 percent of urban residents have no refuse removal services at all. The rate ofurbanisation is high, estimated to be 29 percent.
Habitat for Humanity indicates that 75 percent of the country’s population live inrural areas. The average size house in rural areas is about 26m2. The currenthousing backlog in Madagascar is estimated at about two million units. Annualpopulation growth creates a demand for an additional 100 000 units; this demandis expected to grow by three percent.
Madagascar’s property development sector, to the extent that one exists, is gearedtowards very high income earners, expatriates and tourists. No formal housing isdeveloped for lower or even middle income earners.
Habitat for Humanity Madagascar has been working in the country since the year2000, and has serviced about 4 460 families. The organisation builds new houses,develops water and sanitation services, and promotes urban renewal. HabitatMadagascar has been active in building houses in the east, central highland, west,south highland and northwest regions of Madagascar. Houses range between15m2 and 40m2 for one bedroom, a living room, a kitchen and a bathroom. Housefoundations are made of stone or fired clay bricks and then covered with concretefloors, while the walls are made of clay brick and mortar. Clay tiles or thatch areused for the roofs, and windows and doors are made of eucalyptus wood. Thesematerials are locally produced and come from renewable sources.
A joint government, UNDP and UN-Habitat initiative took place in March 2013,the country’s first National Urban Forum. Under the theme ‘building together thefuture of our cities’, the Forum adopted a declaration that made the urban sectora national priority. A key aspect of the commitments involved strengthening theprivate sector in the development and management of urban infrastructure.
While the overall business climate has deteriorated in Madagascar in the past fouryears, the most significant decline has been in terms of obtaining constructionpermits. In 2014, the 16 procedures involved in acquiring a construction permittake 160 days and cost 1 105 percent of income per capita. For this reason,Madagascar ranked 163rd for this indicator out of 189 countries in the World Bank’s2015 Doing Business Report, down from 157th in 2014.
Property markets
Originally Madagascar prohibited foreign land ownership, offering rather long-termleases of about 99 years. Under customary law, land in Madagascar is perceivedas the land of the ancestors (tanindrazana). Although land may becomeindividualised, many believe that land must be titled or recorded in some fashionbefore an individual can claim perpetual ownership rights to the plot. In 2004,legislation that allowed foreigners to own land was passed. In order to acquireland, however, foreigners must invest up to US$500 000 in the real estate, bankingor tourism sectors.
Most urban land is held under customary tenure, and residents do not have titlerecognised under formal law. In 2006, the Madagascar Action Plan was drafted,setting out development goals within the time frame of 2007 to 2012. One ofthese goals was to increase the number of households with land title from10 percent to 75 percent. Progress on these goals is yet to be reported.
Madagascar ranked low on the World Bank’s ‘registering property’ index, at 153rd
globally in 2015 (down from 152nd the previous year), and behind the Sub-SaharanAfrica average. In 2015, it took six procedures and over 74 days to registerproperty. The process cost was 10.2 percent of the total property value.
Opportunities
Madagascar’s most immediate challenge is to create a stable governanceenvironment in which the society and economy can again begin to flourish. As aresult of the successful political elections held in 2013, growth in 2014 wasexpected to be 3 percent, mainly related to agriculture and related industries,extractive industries, tourism and construction.
Many international partners, who did not recognise the transitional governmentthat came to power in 2009 through unconstitutional means, have normalisedtheir relations with Madagascar in light of the last elections. The Government ofMadagascar identifies the “fight against poverty through inclusive growth” as itsmain objective and possesses a strategy centered on three pillars: improvinggovernance, promoting economic recovery, and expanding access to basic socialservices. This strategy has been outlined in the Programme Général de l’Etat(PGE) and translated into a 2015-2019 National.
With the growing presence of microfinance in the country, there are opportunitiesfor MFIs to diversify their product range to cater for the housing needs of lowincome earners. Energy efficient products should also be in high demand. Thereis a need for stakeholders in the housing sector to participate in the affordablehousing process – from the supply of affordable and innovative building materialsto the delivery of formal housing that is affordable to lower income earners.
Sources
African Development Bank (2014). Madagascar 2014.(www.africaneconomicoutlook.org)Andrianasolo, E. (2008). Case Study on Microfinance Institutions in Madagascar :Policies for a Viable Sector. Tunis.Culture Grams. (2009). Republic of Madagascar. Demirguc-Kunt, A. and Klapper, K. (2012). Measuring Financial Inclusion: TheGlobal Findex, World Bank Policy Research WP 6025.Financial Access Survey (2011). Madagascar Key Indicators.Financial Standards Foundation. (2009). Country Brief: Madagascar. Freeman, L., Rasolofohery, S. and Randriantovomanana, E. (2010). Patterns,Features and Impacts of Rural-urban Migration in Antananarivo, Madagascar. International Monetary Fund. (2006). IMF Country Report: Madagascar. Jacoby, H. and Minten, B. (2005). Is Land Titling in Sub-Saharan Africa CostEffective? Evidence from Madagascar. Spriggs, K. and Taylor, B. (2009). Financial Sector Profile: Madagascar. World Bank (2015). Doing Business Report: Madagascar.Afribiz (2013).

122
Websites
www.afdb.org www.africaneconomicoutlook.org www.banque-centrale.mghttp://data.worldbank.orgwww.digitaljournal.comfas.imf.orgwww.habitat-madagascar.orgwww.mfw4a.orgwww.mixmarket.orghttp://www.afribiz.info/content/2013/housing-supply-in-madagascar

Africa Housing Finance Yearbook 2015
123
Malawi
demand for housing finance. High interest rates in 2014 played a significant rolein higher credit risk levels that year. Furthermore, the 2013-2014 Financial StabilityReport indicates that the level of non-performing loans increased slightly from15.2 percent in September 2014 to 15.7 percent in March 2014. Before 1989, onlythe New Building Society (now named NBS Bank) could offer mortgage finance.The mortgage market has since broadened and new players include the NationalBank and Standard Bank, among others. However, NBS still holds a 70 percentmarket share. Strict eligibility criteria, including a minimum 10 percent cash deposit,a minimum of six months history with a bank and three months of payslips, restrictaccess to mortgage finance. NBS’s maximum term is 15 years with a maximumloan-to-value rate of 80 percent to 90 percent. Although still higher than previousyears, in August 2015, the base lending rate/mortgage lending rate saw a significantdecrease from 38 percent to 32 percent in hopes of increasing the affordability ofloans4. NBS has pegged its base rate to the base lending rate when owneroccupied, and an additional 2.5 percent if mortgage finance is used for commercialor rental property. The National Bank of Malawi offer mortgages at the base ratefor an individual borrower, and an additional four percent for institutions.
Malawi’s lending spreads, which increased from 21.3 percent to 31.1 percentbetween 2012 and 20145, depict a drastic difference from the Sub-Saharan Africanaverage of seven percent. It has been argued that higher bank overhead costsand relatively low productivity have contributed to this. Additionally, the currentfunding base, through own retail funds, has meant that extension of loans forgreater than 10 to 15 years is unusual. Fundraising through the capital markets has
Overview
A small country in Southern Africa, Malawi has an estimated population of 17.96million, 46.73 percent between 0-14 years of age. Urban areas, the two largestbeing Blantyre and Lilongwe, make up 16.3 percent of the population, butincreasing with a 3.8 percent urbanisation rate over the past five years.
Malawi is considered one of the poorest countries in the world with 61.64 percentof the population living on less than US$1.25 a day. Household income is low,gross national income (GNI) per capita is estimated at US$7801. But conditionsare improving: between 1980 and 2013, Malawi’s Human Development Index(HDI) increased from 0.272 to 0.414, though the country is ranked 174 out of 187on the Index.
In 2014, growth in agriculture, manufacturing, construction, wholesale and retailtrade led the economy to grow by about 5.7 percent. The agricultural sectorexperienced an increase of 6.1 percent, and now accounts for 31 percent of GDP.The sector also experienced a significant increase in maize (staple food) andtobacco (main foreign exchange earner) production. However, real GDP growthfor 2015 is expected to drop to 5.5 percent as the adverse weather and floodsexperienced in January 2015 significantly disrupted agricultural activities andtransport services. This is further compounded by high inflation, high interest rates,and a depreciating currency. Malawi’s inflation was recorded at 21.3 percent in July20152, compared to 19.5 percent in May 2015.
Access to finance
There are 13 commercial banks registered with the Reserve Bank of Malawi. Theseinstitutions make up nearly 80 percent of the financial sector assets in Malawi.Low penetration of formal banking and financial services characterises the country.According to Findex 2015, only 16.1 percent of adults own an account from afinancial institution. Furthermore, only six percent borrowed from a financialinstitution in the past year and only six percent have an outstanding mortgage ata financial institution3 Access to credit through formal channels is limited by lackof collateral, the high cost of borrowing and a low level of financial literacy.
According to the Reserve Bank of Malawi, five percent of all loans extended by thebanking sector in 2010 were for real estate and fell to 1.1 percent in 2013, andconstruction made up four percent of all loans in 2013. This depicts a decline in
KEY FIGURES
Main Urban Centres Lilongwe (capital), Blantyre
Exchange Rate: 1 US$***Inflation 2013 | 2014 (est.) | 2015 (prov.) | 2016 (prov.) *
464.94 Malawian Kwacha (MWK)27.7 | 24.1 | 14.9 | 10.1
Population^ | Population growth rate (2013)^Urban population (% of total)^ | Urbanisation rate (% in 2013)^
17 964 697 | 3.32/16.30 | 3.77/
GDP / capita (current US$)^ | GDP growth rate (annual %)^GNI / capita, Atlas method (current US$) ^Population below national poverty line*Unemployment rate (%)*Gini co-efficient (year of survey)^^HDI (Global Ranking)" | HDI (Country Index Score)”
253.02 | 5.7025050.77.646.18 (2010)174 | 0.414
Lending Interest Rate^Mortgage Interest Rate (%) | Mortgage Term (years)#Credit % of GDP^Average Mortgages % of GDP° Price To Rent Ratio City Centre** | Outside City Centre**Gross Rental Yield City Centre** | Outside of City Centre**Outstanding home loan (% age 15+)##
32#*32.00 | 1516.200.5% (2004)......6.03
What is the cost of standard 50kg bag of cement (in US$)? #What is the price of the cheapest, newly built house by a formaldeveloper or contractor (in US$)? #What is the size of this house (in m2)? #What is the average rental price for a formal unit (in US$/month)#What is the minimum plot size for residential property (in m²)#
11.00
14 1005028 – 22570
Ease of doing business rank !Number of procedures to register property !Time (days) to register property !Cost (% of property value) to register property !
1646691.90
*** Conmill.com The Currency Converter^ World Bank's World Development Indicators (2014)~ World Bank PovcalNet: an online poverty analysis tool, various years^^ The World Bank's PovCalnet" UNDP's International Human Development Indicators (2014)° Various: Badev et al. "Housing Finance Across Countries: New Data and Analysis" – Unpublished
paper/Hofinet/World Bank## Global Financial Inclusion Database (FINDEX)# CAHF Annual Survey Data (September 2015)! World Bank's Doing Business Survey Data (2015)** Numbeo Online User-Contributed Database/ 2015 CIA World Factbook#* National Bank Malawi~! press properties limited| Malawi Housing Corporation

124
been limited, with NBS Bank, the biggest mortgage lender, raising money throughthe capital markets and partially listed on the Malawi Stock Exchange.
The microfinance sector’s growth has been fast paced. As of September 2014, 41MFIs were registered with the Reserve Bank of Malawi, with increased overallassets of US$ 31.2 million (MK 17.4 billion) in 2014 from US$25 million(MK13.9 billion) in 2013. Epik Finance was one of the new microcredit agenciesto enter the sector in 2014, specialising in housing finance and offering short termloans (18 months) to low and middle income earners, focusing on incrementalbuilding loans up to US$900 (MK500 000) per cycle.
The sector recorded an overall improvement in the repayment rate during the6 months leading up to September 2014. The average repayment rate for thesector increased to 63 percent in September 2014 from 50.3 percent, due to asuccessful harvesting and marketing season. However, micro lenders are oftenconstrained by irregular income streams for most microenterprises in the informalmarkets.
There are few notable organisations involved in housing microfinance. TheMchenga Fund, in conjunction with the Centre for Community Organisation andDevelopment (CCODE), offers a housing microfinance product targeting the poor.Another innovative programme within the sector involves the partnershipbetween Habitat for Humanity Malawi and two lenders of housing microfinance.Habitat provides construction technical assistance (CTA) and other supportservices to borrowers as part of the partnership. One is OpportunityInternational Bank of Malawi (OIBM), a non-profit organisation that provides smallloans, savings, insurance, and training to people. The other lender, Select FinancialServices, is a for-profit group with social investment principles focused on offeringretail financial services to the non-banked and under-banked markets in southernand eastern Africa. OIBM’s clients are served directly at their homes by the HabitatCTA officers, and the loans are primarily used for incremental building.
Malawi’s modest pensions sector is mainly invested in equities, Treasury bills andproperty development. Pensions are not generally invested in housing financelending. Two other factors limiting access to housing finance are limited tenuresecurity and the lack of a national identification system. The current vitalregistration system in Malawi is voluntary, resulting in inadequate vital statistics.Attempts to change this include the National Registration Bill, which wasformulated in 2005, while the National Civil Registration and Vital Statistics systemis under development at the National Registration Bureau. Most banks haveexcess liquidity, their funds consisting primarily of a combination of equity plusretail funds from savers. Some have external lines of credit, but only for specialschemes such as SME lending or access to foreign exchange. The main source offunds for the few mortgages remains retail funds, and most surplus funds areinvested in Treasury bills, as there are no bonds.
The legal framework for credit information sharing was established following theenactment of the Credit Reference Bureau (CRB) Act in 2010, together withoverarching financial sector legislation and the Financial Services Act of the sameyear. As a result, two credit reference bureaus were established and licensed:Credit Date CRB and CRB Africa. However, one of the credit bureaus has beenengaged in a long-standing lawsuit with the Bankers Association of Malawi as aresult of banks “failing to use services provided by credit reference bureaus asmandated by law.”6
Additionally, property plays an important role in access to finance. According to theWorld Bank’s Doing Business Report 2015, Malawi ranks 164th of 189 countries(compared to 171th place in 2014 and 157 in 2013) and in 2014 ranked 85th interms of ease of registering property (an improvement from 97th in 2013). In 2013,government passed the Personal Properties Security Bill that enables borrowers touse, and lending institutions to accept moveable assets as collateral or security as oneway of easing access to finance. The effect of the new law on improving access tofinance for SMEs and individuals is yet to be established, as supporting systems likeproperty registers are yet to be established. Furthermore, land in Malawi is managedby a group of key players including the Ministry of Lands, Housing, and UrbanDevelopment, the Malawi Housing Corporation, city councils, traditional leaders, andprivate entities. Most households live in unplanned settlements using customarypractices due to the scarcity of serviced land for low income housing7.
Affordability
The 2014 FinScope study reported that 41 percent of Malawians earn less thanMK10 000 (US$18) a month. Nationally, only 10 percent of adults earn a wageor salary, while 23 percent earn their income through their own business and43 percent through farming. This constrains access to mortgages, as well as theiraffordability; less than one percent of Malawians qualify for a mortgage. As a result,the opportunity for housing microfinance is significant. Microlender Select Africahas said that they would disburse as much as MK57.7 billion (US$100 million) ifthe context was optimal because of the enormous demand for housing loans.
In 2010, NBS Bank was willing to provide a mortgage as small as MK500 000(US$900). This is inadequate given that the least expensive, entry-level house,costs around MK7.5 million (about US$13 500). Given that only 30 percent ofincome is allowed towards servicing of loans or mortgage payments, the totalmonthly income that a borrower would have to earn to pay for this house wouldbe MK680 747 (US$1 222). Standard Bank, one of the major suppliers ofmortgages, requires that borrowers earn a monthly net salary of MK200 000(US$360). This means that access to the very cheapest house is available only tothe highest income earners, who make up less than one percent of the population.By 2014, NBS was providing a facility of 80 percent of the collateral value althoughthis was only targeted at salaried or self-employed individuals.
Housing supply
Individual builders dominate housing construction, with 90 percent of housesself-built. According to the latest Integrated Household Panel Survey (2013),41 percent of households reside in traditional housing (i.e. constructed of unfiredmud brick and grass thatching for roofs), 26 percent reside in semi-permanenthousing (i.e. constructed of a mix of tradition and permanent building materials),and the remaining 33 percent reside in permanent structures (i.e. constructed ofiron sheets, tiles, burnt bricks and cement). There was a slight increase inpermanent constructed dwellings in 2013, from 28 percent in 2010 to 32 percent;and at a rate of 51 percent in urban areas and 28 percent in rural areas. Theaverage household size increased slightly from 4.7 persons in 2010 to 4.9 personsin 2013. In 2013, 78 percent of households resided in owner-occupied dwellings,while 12 percent rented the properties they live in. Rental is much more commonin urban areas, as it is the case for 46 percent of households but only five percentin rural areas. Malawi’s high urbanisation rate has led to increased demand fordecent housing in the urban areas; approximately 21 000 new units are neededevery year for the next 10 years to meet housing demand – this far exceedssupply8. Currently the construction sector contributes nearly three percent ofGDP. It continued to recover from contracting by 2.4 percent in 2011 to7.1 percent growth in 2013. According to the Reserve Bank of Malawi, theconstruction sector accounts for an average of four percent of loans extended bythe financial sector. Several key players are involved in the construction of newhousing, including public housing providers such as the Malawi HousingCorporation as well as private housing providers that cater to middle and highincome earners. These actors include Press Properties Limited, KanengoNorthgate, NICO Assets, Knight Frank, Lilaga Communities, among others. lowincome earners receive housing and assistance from NGOs such as CCODE andHabitat for Humanity. Additionally, several government entities, notably theMinistry of Defence and the Malawi Police Service, provide housing foremployees9. Malawi Housing Corporation (MHC) is the principal public housingdeliverer. The MHC was established in 1964 to develop housing estates for highand low income earners. High income groups, largely public servants, wereprovided for through the construction of conventional houses ready foroccupation, while low income groups were provided for through the developmentof ‘traditional housing areas’. Since inception, only about 7 000 units have beenbuilt countrywide. A plan to build 4 200 houses and develop 5 800 plots between2007 and 2011 did not reach fruition, with only 481 houses completed. However,in the spring of 2015, MHC’s CEO announced that the institution was planning toconstruct 25 000 houses in the country’s three major cities in an effort to meetthe national housing demand currently pegged at 21 000 houses per year10.
Historically, rentals for most of MHC’s residential properties have not kept pacewith increases in costs. Recent adjustments, including a 10 percent increase inOctober 2011, a 25 percent notch in November 2012, a 10 percent increase inAugust 2014, and an undisclosed rental hike effective July 1st 2015 aimed to coverthe costs of renovation and mitigate the effects of devaluation. These have helped

Africa Housing Finance Yearbook 2015
125
improve performance for the Corporation but faced stiff resistance from tenantswho argue that MHC does not fully meet its maintenance obligations.Furthermore, in 2014, the Ministry of Lands, Housing, and Urban Developmentindicated that they would be reviewing the Malawi Housing Corporation Act inorder to allow them to build houses for profit, which it is currently prohibitedfrom doing. The Corporation made loses in the past two years on its rentalaccounts, as it posted a US$95 556 loss in 2014 and US$84 444 in 201311.
CCODE and the Malawi Homeless People’s Federation (with 80 000 members)have been working with UK-based Real Estate for All (Reall) since 2013 insupporting poor urban communities to plan and implement their own solutionsto the challenges of inadequate land, housing and infrastructure provision. As of2014, the collaboration had successfully negotiated for more than 2 000 plots ofland, and constructed 780 low cost houses in Lilongwe, Mzuzu and Blantyre. TheCities Alliance, a global partnership for urban poverty reduction, initiated a slumupgrading programme in January 2011 in partnership with UN-Habitat, the WorldBank and government organisations. The aim of the project is to formulate citydevelopment strategies and a slum upgrading programme covering Blantyre,Lilongwe, Mzuzu and Zomba.
In a developer role, Habitat for Humanity Malawi has been operational since 1986,providing housing solutions to the low income segment of the population byfacilitating the construction of new houses, repairs and rehabilitations, includinghomes for orphans and vulnerable children. Habitat Malawi reports that over3 000 low-cost houses and latrines having been built to date. In 2005, HabitatMalawi launched the ‘building in stages’ programme, an incremental buildingprogramme which allows low income families to improve their living conditionsover time, based on the availability of their resources. By December 2012, 250homes were completed in Lilongwe, helping to secure simple, decent housing forover 700 people previously living in the city’s Mgona, Mtsiriza and Ntadile slums.
In 2014, the government announced the launch of the Decent and AffordableHousing Subsidy Programme, also known as the Cement and Malata project. Asof March 2015, the government had already disbursed MK 91 million (US$163 400)across the country for planning and orientation of key District Council membersand field officer trainings. Furthermore, the programme is allocated MK7 billion(US$12.6 million) annually12. Also in 2014, Lafarge Cement Company launched asocial enterprise housing scheme aimed at providing low income families with‘economical but decent houses’. The scheme, called Maziko Houses, provides pre-designed houses (1-3 bedrooms) which can be built for 20-40 percent cheaperand significantly quicker than conventional houses. Lafarge is offering two financingapproaches, one for self-financed construction and one through a loan facilitatedby the company in partnership with an MFI13.
Property markets
According to property consultants Knight Frank, the residential market in Malawiis still suffering from the effects of the chaotic economic situation following the
devaluation and floatation of the national currency: demand has fallen in both therental and sales markets. However, in Lilongwe and Blantyre the market continuesto benefit from the existence of a large expatriate community (nearly 25 000 inBlantyre), which has traditionally influenced the linking of rents to the US dollar.Renting a house or apartment shows to be the cheapest option with onebedrooms ranging from US$ 125-200, and 3 bedrooms (suited for families) goingfor $550-800 depending on location and proximity to the city centre. Recently,there has been considerable activity in upgrading older buildings in good locationsto meet expatriate demand for high quality residential properties.
Nevertheless, there is a real constraint in the supply of housing, which has causedrapid property price rises. The supply constraint also acutely manifests itself inthe resale market, with limited mortgageable housing stock.
Policy and regulation
In 2013, government presented a new Land Bill, aimed at addressing landadministration and management issues. To this day, the Bill has not been enactedpending clarifications of issues relating to the role of chiefs and women, and thelevel of consultations. Government is still developing the National Urban PolicyMalawi framework (funded by Cities Alliance with technical support from UN-Habitat) aimed at shifting national development from its rural focus to urbangrowth in the light of the rapid urbanisation. The National Housing Policy, originallydrafted in 2007 and still under review, advocates for broad access to housing forall, decentralisation, improving urban land markets, upgrading informal settlementsand improving the quality of rural settlements. Although expected, resolutionswith respect to both policies have not come to fruition yet.
An estimated 90 percent of land is customary land. There are no defined laws thatdeal with property rights of customary land, making transferring customaryproperty rights difficult. Thus, the formal mortgageable tenure system covers onlyeight percent of the land, and almost all of this land is in urban areas. This hasresulted in tighter eligibility criteria, which limits access, as the property cannot beused as collateral for the mortgage. The formal land registration system is generallyinefficient: it takes up to 118 days to register land and 69 days to register aproperty.
Government policy does not engage sufficiently with the issue of housing financemarkets: although the first Malawi Growth and Development Strategy of 2006states that the availability of housing finance is a key barrier to increasing homeownership and improving the quality of shelter, it does so only in passing. The roleof housing is also recognised by the government in the second Malawi Growth andDevelopment Strategy II (Sub-Theme 5 of Theme 4) and mentioned on thecurrent government, the Democratic Progressive Party (DPP)’s 2014 – 2019manifesto. It urges the need to implement policies aimed at removing barriers andto create more opportunities for low income earners to have increased access tohousing. The Cement and Malata subsidy is one critical policy included, and actedupon, in line with this agenda14. Through this initiative, the president hopes that
> $50 000
$25 000 – $50 000
$14 000 – $25 000
$8 000 – $14 000
$5 000 – $8 000
$3 600 – $5 000
$2 400 – $3 600
$1 600 – $2 400
$800 – $1 600
<$800
- - - Average income needed for the cheapest newly built house by a formal developer, 2015
- - - Average annual urban household income, 2014
MALAWI
$14 666
$2 103
Rural | UrbanAnnual household income US$
No. of households (thousands) 2500 2000 1500 1000 500 0 500

126
“in the next 10 – 15 years, there will be no more grass thatched houses and thatan estimated 16 000 houses will be built each year.”15
Opportunities
Population growth and the rapid rate of urbanisation provide both challenges andopportunities in the form of increased demand for housing. The United NationsCentre for Human Settlements (UNCHS) predicts that in less than 40 years,Malawi will transform into an urban society, and has called upon authorities totake the necessary steps to ensure that social services move with populationgrowth.
Government is committed to implementing economic and structural reforms tocreate an enabling environment, however, many of the reforms and new policieshave yet to be enacted. Given the predominant self-build housing provisionmethod used and the existence of a budding microfinance industry, lending forhousing microfinance has good potential for growth. Growth of the middle classhas boosted the mortgage market. Nevertheless, this potential can be met onlywith substantial reform of the land administration system, and sustained, prudentmacroeconomic reform and management. Greater competition in the bankingindustry has spurred on the mortgage markets, and access to mortgages will begreatly enhanced if this trend is sustained.
A World Bank Financial Sector Technical Assistance Project was initiated in 2011(expected completion in 2016) to increase access to finance for the currentlyunbanked population in Malawi. By increasing financial inclusion, the project isexpected to contribute towards a more enabling environment for the housingfinance sector.
Sources
African Economic Outlook, Malawi 2014.CIA World Fact Book .Demirguc-Kunt, A. and Klapper, K. (2012). Measuring Financial Inclusion: The GlobalFindex, World Bank Policy Research WP 6025.Heymans, M. (unpublished, 2011) Credit Bureau Activity in SADC countries.Report commissioned by the FinMark Trust.UNDP Human Development Report 2014 – Malawi.Integrated Household Panel 2010-2013 National Statistics Office.Kadale Consultants (2009). Access to Housing Finance in Africa: Exploring theIssues. (No. 8) Malawi. Paper commissioned by the FinMark Trust with supportfrom Habitat for Humanity.Knight Frank (2013). Africa Report 2013.Manda, M.A.Z. (2007). “Mchenga” – Urban Poor Housing Fund in Malawi.Environment and Urbanisation, Vol 19 No. 2, pp 337-359.Melzer, I. (2011). An Access Frontier for Housing Finance in Malawi. Presentationcommissioned by FinMark Trust and prepared for the AUHF Conference and AGM,September 2011.Ministry of Economic Planning and Development (2013). Annual EconomicReport 2013, Chapter 17.NBS Bank (2011). Annual Report.Reserve Bank of Malawi (2010). Bank Supervision Department Annual Report.Reserve Bank of Malawi (2013). Bank Supervision Department Annual Report.Reserve Bank of Malawi (2012). Financial Stability Report. June 2012.Reserve Bank of Malawi (2012). Financial Stability Report. December 2014.Reserve Bank of Malawi (2012). Financial Stability Report. June 2014.World Bank (2015). Doing Business 2015 Report: Malawi.
Websites
www.africaneconomicoutlook.orgwww.allafrica.comhttps://www.cia.gov/library/publications/the-world-factbook/geos/mi.htmlwww.citiesalliance.org/node/3866http://data.worldbank.org/country/malawi#cp_wdiwww.doingbusiness.org/reports/~/media/GIAWB/Doing%20Business/Documents/Profiles/Country/MWI.pdfhttp://www.doingbusiness.org/~/media/GIAWB/Doing%20Business/Documents/Annual-Reports/English/DB15-Chapters/DB15-Report-Overview.pdfwww.faceofmalawi.com/2013/06/the-bank-base-lending-rates-are-just-a-punishment/comment-page-1/www.habitat.org/ame/stories_multimedia/national_and_area_office_updates/area_49.aspx www.habitat.org/l_and_area_office_updates/area_49.aspxhttp://habitatbuilds.com/wp-content/uploads/2015/01/HFH-Malawi-Tithe.pdfhttp://hdr.undp.org/sites/all/themes/hdr_theme/country-notes/MWI.pdfwww.homeless-international.org/our-work/overseas-partners/malawi-ccodehttp://www.lafarge.mw/Maziko_Houses_Brochure.pdfhttp://malawivoice.com/2015/04/07/decent-affordable-housing-subsidy-scheme-a-worthy-and-bold-decision-by-the-dpp-government/http://malawivoice.com/2014/12/19/mutharika-launches-decent-affordable-housing-programme/www.mfw4a.orghttp://mhcmw.org/ppp.htmlhttp://www.natbank.co.mw/index.php/2013-01-10-09-18-18/interest-rates-2www.nbsmw.com www.nsomalawi.mwhttp://www.nsomalawi.mw/images/stories/data_on_line/economics/ihs/IHPS%202013/IHPS%20Report.pdfwww.nyasatimes.comhttp://www.nyasatimes.com/2015/08/06/national-bank-predicts-gloomy-future-for-malawi-economy/http://www.nyasatimes.com/2015/04/29/malawi-housing-corp-plans-to-build-25-000-houses-by-2018/http://www.nyasatimes.com/2015/05/31/mhc-rentals-hike-july-1-malawi-landlords-to-follow-suit/www.rbm.mw/documents/basu/RBM%20Bank%20Supervision%202011%20Report.pdfwww.rbm.mw/documents/ecom_reviews/Financial%20and%20Economic%20Review%20Volume%2044%20Issue%20Number%201%202012.pdf https://www.rbm.mw/documents/fs/FINANCIAL%20STABILITY%20REPORT%20DECEMBER%20%202014.pdfhttps://www.rbm.mw/documents/FINANCIAL%20SECTOR%20SUPERVISION%20ANNUAL%20REPORT%202013.pdfhttps://www.rbm.mw/documents/fs/FINANCIAL%20STABILITY%20REPORT%20JUNE%202014%20%20.pdfwww.standardbank.co.mwwww.standardbank.co.mw/portal/site/malawi/menuitem.ecfbbf0fa330335e198a721005dd6ba0/?vgnextoid=ad41ede7404f0310VgnVCM10000050ddb60aRCRDhttp://timesmediamw.com/credit-data-sues-banks-for-failure-to-use-services/www.unmalawi.org/agencies/unhabitat.htmlhttp://www.urbanafrica.net/www.urbanlandmark.org.za/conference/2013_presentations/chikoti.pdfwww.worldbank.orghttp://www.worldbank.org/content/dam/Worldbank/Research/GlobalFindex/PDF/LDB_Financial_Inclusion_2015.pdf
1 World Bank World Development Indicators2 Nyasa Times3 World Bank ‘Little Data Book on Financial Inclusion’4 National Bank of Malawi5 World Bank World Development Indicators6 BNL Times7 Malawi National Urban Profile – UN Habitat8 Habitat for Humanity Malawi
9 Malawi National Urban Profile – UN Habitat10 Nyasa Times11 Nyasa Times12 BNL Times13 Lafarge Maziko Houses Brochure14 Malawi Voice15 Malawi Voice

Africa Housing Finance Yearbook 2015
127
Mali
Access to finance
In 2014, the financial sector consisted of 14 banks1, including an agricultural bankand a housing bank (the Banque de l'Habitat du Mali, or BHM), three financialinstitutions (the Fonds de Garantie pour le Secteur Privé received approval fromthe government to operate as a financial intermediary), two pension funds – asocial security fund for private sector employees (the National Institute of SocialWelfare, or INPS) and a pension fund for public sector employees (the RetirementFund of Mali, or CRM) – and six insurance companies. The banking financial sectoris dominated by commercial banks. Other financial institutions include the MaliBranch of Alios Finance (a Cote d'Ivoire-based private financial group) and theMali Mortgage Guarantee Fund (Fonds de Garantie Hypothecaire du Mali, orFGHM). Together the BHM and the FGHM dominate mortgage lending. Severalcommercial banks offer housing (up to CFA Francs 30 million or US$51 195 forequipment loans for housing enhancement, acquisition or construction of housingfor individuals at 12 percent interest rate over five years) but are also very activein supporting housing projects through partnerships with developers or the manyhousing cooperatives in Mali.
Despite the number of financial institutions, access to finance as measured bycredit-to-GDP ratio was estimated at only 24.6 percent in 2014, according to theCentral Bank (Banque Centrale des Etats de l’Afrique de l’Ouest – BCEAO)statistics. In 2013 there were 434 bank branches, 343 ATM machines and 1 234 533bank accounts for the whole population, most of which were concentrated in
Overview
The Republic of Mali is one of the largest countries in West Africa covering1 248 574km2. In 2014, Mali’s population was estimated at 15.8 million, growingat an annual rate of three percent. This is projected to double by 2030, while theurban population is expected to triple from the current level of 39.1 percent.
Mali is one of the poorest countries in the world. According to the UNDP’sHuman Development Index, it ranked 176th of 187 countries in 2014. However,life expectancy at birth is estimated at 65 years, one of the highest in Africa. Grossnational income (Atlas method) was US$720 per capita in 2014, again among thelowest in the world. In 2014, 43.6 percent of Malians were living below thenational poverty line.
The average economic growth rate, at 4.5 percent in 2009 and 5.8 percent in2010, was high, driven by commerce, transportation and telecommunication.However, turmoil resulting from the 22 March 2012 coup d'état seriouslyundermined growth, which had already slowed to 2.7 percent in 2011. In 2012,Mali was in recession, with a negative GDP growth rate of -1.5 percent, against aninitial GDP growth forecast of 5.4 percent. With the July 2013 presidential election,the political situation stabilised. Government and rebel groups in the northern partnegotiated and signed in June 2015 peace and power devolution agreements, theAlgiers Agreements 2. However, challenges remain on the way to full peace allover the country, as sporadic outbreak of violence was recently noted in thenorthern part of the country. GDP increased by about five percent in 2013, andreached 5.8 percent in 2014, driven by gold exports and the primary sector(thanks to good harvests), while inflation was under control at around 0.3 percent.Economic growth is expected to reach 5.4 percent in 2015. Suspension of foreignaid following the 2012 coup was lifted after the elections and Mali was able tosecure more than one billion Euros in commitment from European Union nationsto support development.
During his presidential campaigns, President Ibrahim Boubacar Keita committed toproviding affordable housing. This was restated by Prime Minister Moussa Marawhen he took office, promising that the government will provide 50 000 housingunits by 2018, through the Presidential Housing Programme.
KEY FIGURES
Main Urban Centres Bamako
Exchange Rate: 1 US$***Inflation 2013 | 2014 (est.) | 2015 (prov.) | 2016 (prov.) *
593.20 West African CFA-0.6 | 0.9 | 2.1 | 2.7
Population^ | Population growth rate (2013)^Urban population (% of total)^ | Urbanisation rate (% in 2013)^
15 768 227 | 3.0039.14 | 5.02
GDP / capita (current US$)^ | GDP growth rate (annual %)^GNI / capita, Atlas method (current US$) ^Population below national poverty line*Unemployment rate (%)*Gini co-efficient (year of survey)^^HDI (Global Ranking)" | HDI (Country Index Score)”
765.75 | 7.2272043.68.133.02 (2010)176 | 0.407
Lending Interest Rate^Mortgage Interest Rate (%) | Mortgage Term (years)#Credit % of GDP^Average Mortgages % of GDP° Price To Rent Ratio City Centre** | Outside City Centre**Gross Rental Yield City Centre** | Outside of City Centre**Outstanding home loan (% age 15+)##
...11.00 | 1524.43.........1.72
What is the cost of standard 50kg bag of cement (in US$)? #What is the price of the cheapest, newly built house by a formaldeveloper or contractor (in US$)? #What is the size of this house (in m2)? #What is the average rental price for a formal unit (in US$/month)#What is the minimum plot size for residential property (in m²)#
7.68
5 802 32...200
Ease of doing business rank !Number of procedures to register property !Time (days) to register property !Cost (% of property value) to register property !
14652912.10
*** Conmill.com The Currency Converter^ World Bank's World Development Indicators (2014)~ World Bank PovcalNet: an online poverty analysis tool, various years^^ The World Bank's PovCalnet" UNDP's International Human Development Indicators (2014)° Various: Badev et al. "Housing Finance Across Countries: New Data and Analysis" – Unpublished
paper/Hofinet/World Bank## Global Financial Inclusion Database (FINDEX)# CAHF Annual Survey Data (September 2015)! World Bank's Doing Business Survey Data (2015)** Numbeo Online User-Contributed Database

128
urban areas2. Of the 883.3 billion loans issued in 2013, only 6.1 billion or 0.7 percentwere specifically tagged housing loans3.
General lending rates decreased significantly over the past years, and are betweeneight and nine percent on average for long-term loans (mortgages), above theWest African Economic and Monetary Union (WAEMU) average of 7.7 percentin 20134. Interest rates on deposits have remained almost constant at around3.5 percent. Interest rates applied by the BHM range from four to 11 percent on15-year mortgages (depending on income and whether the applicant is eligible forinterest rate subsidies.) Applicants are mostly civil servants or private sectoremployees with regular and long term contract who can use their salary ascollateral. To be eligible for subsidised interest rates, an individual must be amember of a housing co-operative (cooperatives d'habitat) and have a monthlyincome of less than CFA Francs 100 000 (US$170). The duration of mortgagesmay also be extended to 20 years for members of housing co-operatives.
The microfinance sector has soared in Mali since the end of the 1990s. Accordingto the Central Bank of West African States (BCEAO), 126 microfinance institutionswere listed in Mali at the end of March 2015, with a total of 906 service points.With a total outstanding credit of more than CFA Francs 67.6 billion (aboutUS$115 million), the penetration of microfinance services was estimated at morethan 50 percent of the population. The total outstanding credit reachedCFA Francs 77 billion (or about US$131 million). At end March 2015, the totalnumber of microfinance clients was about 2 million5.
Only one microfinance network, Nyesigiso, offers housing microfinance in Mali.Nyesigiso, in partnership with FGHM, provides mortgage loans for the acquisitionof housing units on serviced sites (the maximum amount of these mortgages isCFA Francs 20 million, (US$34 130) over up to 15 years) and construction loansfor financing the construction of new housing units, for up to CFA Francs 3 million(US$5 119), payable over a maximum of 36 months6.
The FGHM was created in 2000 to cover losses incurred by financial institutionsin the case of default by mortgagees, and to sustain home ownership forhouseholds. This was a unique housing finance product in the WAEMU regionuntil recently (Cote-d’Ivoire launched the same type of financial institution in 2014),as it allows the institution to meet the dual demand of covering the risks of defaultand enhancing the quality of the portfolio.
The landscape of housing finance in Mali was enhanced in 2010 by the creationand full operation of the WAEMU Regional Mortgage Refinance Bank (CaisseRégionale de Refinancement Hypothécaire, or CRRH) of which BHM, FGHMand a number of commercial Malian banks are shareholders. Since its creation in2010, the CRRH mobilised about CFA Francs 77 billion (US$131 million)7 on theWAEMU bond market.
Affordability
While land and housing is not expensive by international standards, very lowincomes mean that formal housing is still unaffordable to a large proportion of thepopulation. Prices for serviced empty plots range from CFA Francs 500 000(US$853) to CFA Francs 2 million (US$3 414) and above, depending on thelocation. Prices in the capital city of Bamako are higher. However, in the provisionof serviced plots, the focus is on plots costing between CFA Francs 1.5 millionand CFA Francs 2 million (between US$2 560 and US$3 414) in cities, all over thecountry. A standard galvanised iron sheet, often used in self-build initiatives, costsbetween CFA Francs 3 000 (US$5.1) for a 4kg sheet and CFA Francs 6 000(US$10.2) for a 7kg sheet. The minimum acceptable size plot is around 200m2. Itcosts between CFA Francs 90 000 (U$154) and CFA Francs 105 000 (US$179)per m2 to build a house, with iron roofing and slab roofing, respectively. This meansthat the minimum price for a standard housing unit (32m2 over a 200m2 plot) isbetween CFA Francs 3.4 million (US$5 802) and CFA Francs 5.3 million (US$9 045).
In 2012, with the completion of the Dio cement plant (in the Kati Cercle, orregional district) and the Diamou cement plant (in the Bafoulabé Cercle), therewas a drop in the price of cement, from CFA Francs 112 000 (about US$191) perton to between CFA Francs 4 500 and CFA Francs 4 800 (between US$7.68 andUS$8.19) for a 50kg bag, depending on where it is bought.
The average annual income as estimated by the per capita gross national incomeis at US$720. The price of the cheapest housing unit, as mentioned earlier, istherefore around 8 times the annual per capita income. This justifies thegovernment’s emphasis on affordable housing and subsidy programmes to supportpeople to acquire housing.
Housing supply
The demand for housing in the agglomeration of Bamako is very high, at about240 000 units, or more than half of the total national demand.
In line with its National Housing Strategy, the government has established agenerous subsidy programme to support the acquisition of affordable housing byeligible households. Households earning between CFA Francs 57 000 (US$97.3)and CFA Francs 150 000 (US$256) monthly are eligible to apply for a two-bedroom housing unit, and those earning between CFA Francs 150 001 (US$256)and CFA Francs 250 000 (US$427) a month can apply for a three-bedroomhousing unit. These include a direct subsidy of up to 45 percent (including theland), of the cost of a housing unit, the remaining being born by the applicantthrough a mortgage or direct contribution.
A 2011 Shelter Afrique study on the real estate sector in Mali, estimated thatalmost 75 percent of the housing supply in the country constituted self-constructed units. Self-construction involve two approaches: simple self-construction and assisted self-construction, the latter involving direct technicalassistance from the Malian Housing Office, available only to housing cooperatives.
> $50 000
$25 000 – $50 000
$14 000 – $25 000
$8 000 – $14 000
$5 000 – $8 000
$3 600 – $5 000
$2 400 – $3 600
$1 600 – $2 400
$800 – $1 600
<$800
- - - Average income needed for the cheapest newly built house by a formal developer, 2015
- - - Average annual urban household income, 2014
MALI
$2 669
$2 259
Rural | UrbanAnnual household income US$
No. of households (thousands) 800 600 400 200 0 200 400
Africa Housing Finance Yearbook 2015
129
Number of foreign investors including the Islamic Development Bank (IDB) havealso shown interest in funding housing programmes. In 2012 the governmentsigned two financing agreements with the IDB, amounting to CFA Francs 7.4 billion(US$12.6 million) and representing half of the resources needed to support theconstruction of 1 000 housing units in Bamako. At the end of July 2015, all ofthem were completed and attributed to beneficiaries.
In 2013 the Office Malien de l’Habitat (Malian Housing Agency) focused itsattention on two major projects: the completion of 1 552 social housing units inBamako (on the Tabacoro site) and the construction and completion of 1 700social housing units in other regions. The 1 552 social housing units werecompleted in June 2015 and attributed to beneficiaries in July 2015. There weremore than 13 000 applications received by the Malian Housing Office. The MaliHousing Bank (BHM) was one of the main financial partners of the beneficiariesfor the acquisition of these housing units.
Several national private real estate developers such as Mali Univers, SocieteFonciere et Immobiliere du Mali (SIFMA-SA), Wahode and SEMA are also activein supplying and selling housing units in partnership with BHM. In December 2013,SIFMA-SA launched a new 600 unit social housing project at Rokiaville in Kati-Socoro for about CFA Francs 10 billion (US$17.1 million) in partnership withShelter Afrique and Ecobank Mali, the latter providing about 40 percent of thefinancing. SIFMA-SA also announced that the social housing project will befollowed by two other major projects in Sicoro-Sananfara and Sirakoro-Méguetanawhere it already holds property title on the lands. In the medium term, SIFMA-SA aims to produce and deliver 15 000 housing units within three years, countingon the partnership with Ecobank and other financial institutions.
Over the past two years, and in line with the vision of the Head of the State tobuild 50 000 housing units by 2018 (the end of his term), several initiatives ofhousing supply have been launched. In March 2015 the government signed aframework agreement with 19 national and international real estate operatorsthrough the Malian Association of Real Estate Developers (the Association despromoteurs immobiliers du Mali– APIM) and with the Association professionnelledes banques et établissements financiers du Mali (APBEF), for the construction of20 000 housing units costing in total CFA Francs 370 billion (US$631 million) tobe delivered within 2 years. It is foreseen that 75 percent of these housing unitswill benefit the lower to middle income population. The units built through thispartnership will be mainly located in the municipalities of Bamako and Kati andwould comprise 2-bedroom, 3-bedroom and 4-bedroom housing units. Theconstruction of these housing units was launched in August 2015.
Another large partnership of this kind was previously signed with the Chinesecompany CMEC for the construction of 24 000 housing units for a total of CFAFrancs 460 billion (US$785 million). With the implementation of these twoagreements, the government of Mali would be very close to fulfilling itscommitment. Recently and as part of the agreement with Malian real estatedevelopers, the government of Mali, Ecobank Mali, and SIFMA – a private realestate operator signed a partnership for the construction of 500 large housingunits (3-bedroom and 4-bedroom units) in N’Tabacoro, in the rural community ofKalabancoro-Kati for a total amount of CFA Francs 10 billion (about US$17 million).Likewise, Palmer Energy and Construction Corporation through its Malian branchof IISAT Mali was awarded a contract with the Mali government for theconstruction of 4 000 units with a first phase of a thousand units starting inOctober 2015.
Property markets
In Mali, most land is owned by the government (mainly central); however manyindividuals claim ownership without proper land titles. To secure the propertymarket, the government is progressively putting in place a national cadastre,focusing first on urban areas and regional capitals. A registry of more than 100 000land titles has thus been put in place covering Bamako and the Kati Circle. In theKati Circle the number of land titles multiplied by five between 2005 and 2012,from 14 314 to 66 988. As of April 2014, the number of land title in the KatiCircle amounted to 87 945, a really strong upward trend from the situation in2005. In the District of Bamako, 36 895 or 36 percent of total households nowhave a land title.
Property markets function in Mali, with BHM and a few private real estatedevelopers as main actors. In 2014, a total of 164 housing units were advertisedfor sale on the BHM website of which 94 are in Sebenikoro, 49 in Sotuba and 21in Faladié. Prices now range between CFA Francs 28.4 million (about US$48 464),and CFA Francs 49.6 million (about US$84 642) for a three-bedroom unit. Two-bedroom units sell for about CFA Francs 23.9 million (US$40 785), while duplexessell for about CFA Francs 57.1 million (US$97 440). For each type of unit, a down-payment of 30 percent of the purchase price is required by the BHM, which thenfinances the remaining 70 percent with a mortgage. As of July 2015, 2 052 housingunits were delivered through government programmes in partnership with theBHM. These figures are far lower than the demand for housing, especially in theCity of Bamako where the demand is highest.
Difficulties remain that hinder the efficient functioning of Mali’s property markets,despite significant efforts by the government. According to the World Bank’s 2015Doing Business Report, access to construction permits involves 10 procedures,takes 119 days and costs 372.2 percent of the per capita income. This places Maliin 97th place out of 189 countries, 16 places up from its 2014 Report ranking. Thiswas due to the reduction of the time needed to obtain a geotechnical study. Onthe ‘registering property’ indicator, Mali ranked 133rd out of 189 countries in 2015,down 6 places compared to 2014. Indeed, it takes five procedures and 29 days,and costs 12.1 percent of the property value to register a property.
To face the demand for housing, especially in urban areas, a rental market isdeveloping around big agglomerations such as Bamako (where 37 percent ofhouseholds are renters) and other secondary cities where the housing demand ishigh. It is estimated that 348 percent of urban dwellers rent their housing units.Aggressive housing policy implementation has slowed down the development ofinformal settlements, which was as high as 65 percent in 2002.
Policy and regulation
Mali adopted its National Housing Strategy in 1995, and this continues to be themain framework under which all housing interventions are pursued. The goal ofthis strategy is to improve living conditions throughout the country by promotingaccess to decent housing for people with low and intermediate incomes. In linewith this, the government created a number of institutions to facilitate access tohousing, such as the Mali Housing Agency created in 1996. The agency is the mainfacilitator of relationships between different actors in the sector, and is active insupplying serviced land for housing, promoting the use of local building materials,participating in financial operations (which includes having a shareholding in theBHM and the FGHM) and subsidising the interest rate on loans for eligiblemortgage applicants, mostly members of housing co-operatives.
Members of housing co-operatives benefit from a subsidised interest rate rangingfrom seven to 11 percent depending on the monthly income of the eligibleapplicant. Besides this, individual housing co-operative members with monthlyincomes lower than CFA Francs 75 000 (US$128) and CFA Francs 100 000(US$171) benefit from an extra subsidy comprising a three point and two pointreduction, respectively, on their mortgage interest rates for the first five years ofthe mortgage. The Malian government’s housing subsidy programme isimplemented through the Mali Housing Agency.
The BHM was created as a specialised institution dedicated to offering housingfinance services. The government has also taken a number of other measures tofacilitate housing supply. The regulatory framework for the housing sector in Maliis one of the most comprehensive in the WAEMU, including a law oncondominiums, a law governing property development and a law on housingfinance. These measures have increased the number of local real estate developersoperating in the housing market and the number of housing co-operatives.
Opportunities
The government has estimated a housing demand of 440 0009 units by 2015. Thedemand is from employees in the public and semi-public sectors, from the privatesector, from NGOs and international organisations, and from housing co-operatives. The Malian diaspora represents more than half of this demand,according to the Ministry of Housing, Land Issues and Urban Planning, which alsoestimated that an overwhelming majority (95 percent) of the Bamako populationhad expressed interest in acquiring a housing unit. Affordable housing is a steady

130
segment of this demand, with more than 93 percent of housing co-operativesinterested in both affordable housing units and serviced housing land. Some71 percent and 66 percent of employees of the public sector and internationalorganisations, respectively, also expressed interest in acquiring a housing unit. Theseare indicators of the untapped potential of the housing sector. Several investors,especially the Islamic Development Bank, the Canadian government, and manyprivate operators have shown interest in the sector.
Lastly it is important to note that with the signing of a peace and power sharingagreement between the government and rebel groups, the political and economicsituation in Mali has returned to almost normal, with several donors returning tothe country and resuming their activities. The international humanitariancommunity designed a US$ 481 million strategic response plan at the end of 2014to support recovery efforts of the government of Mali. These provide positivesignals to investors and encourages them to invest.
Sources
AfDB, OECD, UNDP and UNECA (2015). African Economic Outlook 2015.Country Note Mali.Agence Française de Développement (2011). Comment bénéficier du dividendedémographique? La démographie au centre des trajectoires de développementdans les pays de l'UEMOA. Analyse Pays Mali. AFD: Paris, Janvier 2011. BCEAO (2015). Statistics Yearbook 2014. BCEAO: Dakar, June 2015. BCEAO (2015). Statistiques des SFD au 31 mars 2015. BCEAO: Dakar, 2015. BCEAO (2014). Bulletin of Financial and Monetary Statistics. BCEAO: Dakar, June2014. BCEAO (2014). Note d’analyse sur les conditions de financement bancaire del’habitat dans les pays de l’UEMOA : BCEAO : Dakar, Octobre 2014.Gouvernement du Mali (1995). Ministère de l'Urbanisme et de l'Habitat. StratégieNationale du Logement. Bamako: 1995. Gouvernement du Mali (2009). Ministère du Logement, des Affaires Foncières etde l'Urbanisme. Note sur le marché du logement au Mali. Bamako, Aout 2009. Shelter Afrique (2011). Etude sur le Secteur de l'Immobilier au Mali: Nairobi, 2011.BCEAO (2014). Commission Bancaire de l’UMOA. Rapport Annuel 2013.Abidjan, Juillet 2014. World Bank (2013). Policy Research Working Paper 6687. A systematic Analysisof Land Markets and Land Institutions in West African Cities. Rules and Practices,the Case of Bamako, Mali. Washington, November 2013.World Bank (2014). Doing Business 2015: Going Beyond Efficiency. Washington,DC: World Bank Group. DOI: 10.1596/978-1-4648-0351-2. License: CreativeCommons Attribution CC BY 3.0 IGOWorld Bank (2014). World Development Indicators 2014.
Websites
www.africaneconomicoutlook.org www.bceao.int www.bhm-sa.com/ www.conferenceouagapf.org www.mlafu.gov.ml/ www.nyesigiso-mali.org/ www.omhmali.org/ www.shelterafrique.org www.ortm.info/logements-sociaux-la-surmultipliee/
1 BCEAO (Central Bank). Etablissements de Crédit, paysage bancaire (at Mars 31st, 2015), available at the website http://www.bceao.int/Mali-2334.html 2 BCEAO (Central Bank 2014). Commission Bancaire de l’UMOA, Rapport d’activités 2013, p. 28.3 BCEAO (Central Bank 2015). Note d’analyse sur les conditions de financement bancaire de l’habitat de l’habitat dans les pays de l’UEMOA, p.15.4 BCEAO (Central Bank 2014). Note d’analyse sur les conditions de financement bancaire de l’habitat de l’habitat dans les pays de l’UEMOA, p.15.5 BCEAO (Central Bank 2015). Indicateurs des SFD de l’UMOA – 2015, available at the website http://www.bceao.int/IMG/pdf/indicateurs_au_31_mars_2015.pdf6 http://www.nyesigiso-mali.org/tab_produit.php 7 www.crrhuemo.org 8 According to the director of OMH Mali during a presentation at a Shelter Afrique symposium on affordable rental housing in Mali, in May 2015.9 Gouvernement du Mali, Ministère du Logement, des Affaires Foncières et de l’Urbanisme (2009). Note sur le marché du logement au Mali (2009), p.12.
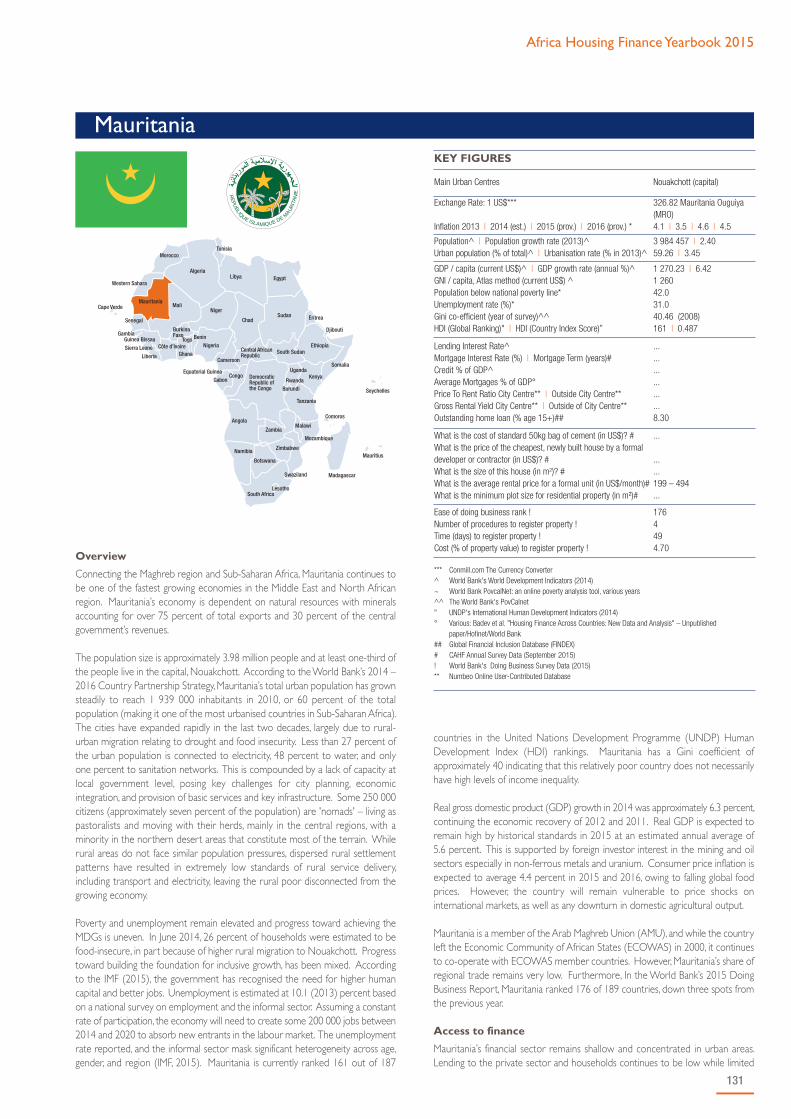
Africa Housing Finance Yearbook 2015
131
Mauritania
countries in the United Nations Development Programme (UNDP) HumanDevelopment Index (HDI) rankings. Mauritania has a Gini coefficient ofapproximately 40 indicating that this relatively poor country does not necessarilyhave high levels of income inequality.
Real gross domestic product (GDP) growth in 2014 was approximately 6.3 percent,continuing the economic recovery of 2012 and 2011. Real GDP is expected toremain high by historical standards in 2015 at an estimated annual average of5.6 percent. This is supported by foreign investor interest in the mining and oilsectors especially in non-ferrous metals and uranium. Consumer price inflation isexpected to average 4.4 percent in 2015 and 2016, owing to falling global foodprices. However, the country will remain vulnerable to price shocks oninternational markets, as well as any downturn in domestic agricultural output.
Mauritania is a member of the Arab Maghreb Union (AMU), and while the countryleft the Economic Community of African States (ECOWAS) in 2000, it continuesto co-operate with ECOWAS member countries. However, Mauritania’s share ofregional trade remains very low. Furthermore, In the World Bank’s 2015 DoingBusiness Report, Mauritania ranked 176 of 189 countries, down three spots fromthe previous year.
Access to finance
Mauritania’s financial sector remains shallow and concentrated in urban areas.Lending to the private sector and households continues to be low while limited
Overview
Connecting the Maghreb region and Sub-Saharan Africa, Mauritania continues tobe one of the fastest growing economies in the Middle East and North Africanregion. Mauritania’s economy is dependent on natural resources with mineralsaccounting for over 75 percent of total exports and 30 percent of the centralgovernment’s revenues.
The population size is approximately 3.98 million people and at least one-third ofthe people live in the capital, Nouakchott. According to the World Bank’s 2014 –2016 Country Partnership Strategy, Mauritania’s total urban population has grownsteadily to reach 1 939 000 inhabitants in 2010, or 60 percent of the totalpopulation (making it one of the most urbanised countries in Sub-Saharan Africa).The cities have expanded rapidly in the last two decades, largely due to rural-urban migration relating to drought and food insecurity. Less than 27 percent ofthe urban population is connected to electricity, 48 percent to water, and onlyone percent to sanitation networks. This is compounded by a lack of capacity atlocal government level, posing key challenges for city planning, economicintegration, and provision of basic services and key infrastructure. Some 250 000citizens (approximately seven percent of the population) are 'nomads' – living aspastoralists and moving with their herds, mainly in the central regions, with aminority in the northern desert areas that constitute most of the terrain. Whilerural areas do not face similar population pressures, dispersed rural settlementpatterns have resulted in extremely low standards of rural service delivery,including transport and electricity, leaving the rural poor disconnected from thegrowing economy.
Poverty and unemployment remain elevated and progress toward achieving theMDGs is uneven. In June 2014, 26 percent of households were estimated to befood-insecure, in part because of higher rural migration to Nouakchott. Progresstoward building the foundation for inclusive growth, has been mixed. Accordingto the IMF (2015), the government has recognised the need for higher humancapital and better jobs. Unemployment is estimated at 10.1 (2013) percent basedon a national survey on employment and the informal sector. Assuming a constantrate of participation, the economy will need to create some 200 000 jobs between2014 and 2020 to absorb new entrants in the labour market. The unemploymentrate reported, and the informal sector mask significant heterogeneity across age,gender, and region (IMF, 2015). Mauritania is currently ranked 161 out of 187
RE
PUB
LIQUE ISLAMIQUE DE M
AUR
ITA
NIE
KEY FIGURES
Main Urban Centres Nouakchott (capital)
Exchange Rate: 1 US$***
Inflation 2013 | 2014 (est.) | 2015 (prov.) | 2016 (prov.) *
326.82 Mauritania Ouguiya (MRO)4.1 | 3.5 | 4.6 | 4.5
Population^ | Population growth rate (2013)^Urban population (% of total)^ | Urbanisation rate (% in 2013)^
3 984 457 | 2.4059.26 | 3.45
GDP / capita (current US$)^ | GDP growth rate (annual %)^GNI / capita, Atlas method (current US$) ^Population below national poverty line*Unemployment rate (%)*Gini co-efficient (year of survey)^^HDI (Global Ranking)" | HDI (Country Index Score)”
1 270.23 | 6.421 26042.031.040.46 (2008)161 | 0.487
Lending Interest Rate^Mortgage Interest Rate (%) | Mortgage Term (years)#Credit % of GDP^Average Mortgages % of GDP° Price To Rent Ratio City Centre** | Outside City Centre**Gross Rental Yield City Centre** | Outside of City Centre**Outstanding home loan (% age 15+)##
...
...
...
...
...
...8.30
What is the cost of standard 50kg bag of cement (in US$)? #What is the price of the cheapest, newly built house by a formaldeveloper or contractor (in US$)? #What is the size of this house (in m2)? #What is the average rental price for a formal unit (in US$/month)#What is the minimum plot size for residential property (in m²)#
...
...
...199 – 494...
Ease of doing business rank !Number of procedures to register property !Time (days) to register property !Cost (% of property value) to register property !
1764494.70
*** Conmill.com The Currency Converter^ World Bank's World Development Indicators (2014)~ World Bank PovcalNet: an online poverty analysis tool, various years^^ The World Bank's PovCalnet" UNDP's International Human Development Indicators (2014)° Various: Badev et al. "Housing Finance Across Countries: New Data and Analysis" – Unpublished
paper/Hofinet/World Bank## Global Financial Inclusion Database (FINDEX)# CAHF Annual Survey Data (September 2015)! World Bank's Doing Business Survey Data (2015)** Numbeo Online User-Contributed Database

132
access to credit and high costs of financing continue to restrain entrepreneurialactivity. According to the World Bank’s 2015 Doing Business Report, in the ‘easeof getting credit’ category, Mauritania was ranked 171 out of 189 countries. In2012 there were 0.1 commercial bank branches per 1 000km2 and only 4.58commercial bank branches per 100 000 adults. Local news sources estimate thatonly 150 000 people have a bank account in Mauritania and only 20 percent ofthe working force are banked.
As at 31 December 2012, the financial sector comprised of: the Central Bank ofMauritania (BCM); 17 licensed banks (four of which are dedicated to Islamicfinance) and two financial establishments that only started operating in 2011;30 licensed microfinance institutions (MFI), and PROCAPEC, an institution thatbrings together 51 Savings and Cooperative Unions under one institution; postalfinancial services; 11 insurance companies; two social security schemes, and theNational Social Security Fund; and 31 licensed foreign exchange offices. There isa nascent money market (treasury bills market and interbank market), but nostocks and bonds market. Banks dominate the sector with nearly 93 percent oftotal assets. According to the IMF (2015), the banking sector is well capitalised andliquid, but remains fragile to shocks. High credit concentration, foreign-exchangerisk exposures, and low profitability due to a constrained business model andhigher competition exacerbate banking vulnerabilities. Although the bankingsystem appears well-capitalised overall, some banks are not meeting the minimumcapital requirement and are under-provisioned. Asset quality remains weak: NPLsrepresented 20 percent of loans in the second quarter of 2014. On December31, 2014 the CBM removed the licenses of Maurisbank, an undercapitalised bank,and of FCI, a financial institution with negative capital and little credit activity.
The short-term consumer finance segment barely existed previously and is stillsmall at 10 percent of GDP. Credit growth has slowed from 13.3 percent to12.1 percent year on year in October 2014, which in turn gave a boost of liquidityin the banking sector. The central bank may increase reserve requirements ifexcess liquidity becomes a destabilizing force within the sector.
Although Mauritania has a relatively small economy, the country has accumulateda substantial pool of private savings, and there is also capital available in a numberof public institutions. The government hopes to channel some of these funds intothe financing of commercial and productive activity.
The BCM has recently introduced reforms to the legal and regulatory frameworkof the financial system. Opening branches outside the main urban centres ofNouakchott and Nouadhibou has been encouraged to increase the rate of use ofbanking services, which is less than four percent. Transition to the new InternationalAccounting Standards/International Financial Reporting Standards (IAS/IFRS) andthe Basel II prudential standards is under preparation. Audit and internal oversightin banks have been strengthened, and the foreign-exchange market modernised.The mortgage market is extremely small. Since the former Banque El Ammanepour le Developpement de l’Habitat (now BEA) was transformed into a universal
commercial bank, there are no specialist housing lending banks. Mauritania doesnot have the usual array of instruments to facilitate the financing of housing. TheWorld Bank has suggested that missing instruments include a housing loans fund;a housing loans refinancing fund; long-term housing loans with periodically re-negotiable rates that minimise interest rate risks due to a mismatch between assetsand liabilities; housing savings plans that provide stable resources; and microcreditfor housing. CAPECs have undertaken limited operations in financing housing.
Guarantee uncertainties contribute to the high cost and relative unavailability ofcredit. Although mortgages are accepted as collateral by commercial banks, theyare considered unreliable, given how few land titles there are, and uncertaintiesabout land surveys and registry operations and records. The World Bank’s 2015Doing Business Report indicates that there are no private bureaus and only4.6 percent of adults are registered on a public credit registry. Access to a landtitle is preceded by the acquisition of an occupancy permit known as a concession.These precarious titles cannot be mortgaged but some banks are satisfied whenthey are used with promises of obtaining land titles. However, the binding natureof such promises is low, and recovery is ineffective with recalcitrant debtors. Thebanking supervisory authority does not recognise these instruments as collateral.The effectiveness of mortgages has been hampered by banks’ lack of diligence toregister mortgages, given high registration fees. In response, in 2006, the authoritiesreduced the registration fees.
Affordability
Government has placed enormous attention on housing development and theeradication of slums which partly explains why home ownership is relatively highnotwithstanding the high incidence of poverty (almost 42 percent of thepopulation live below the poverty line) and extremely small mortgage market inthe country. According to the latest available information (2008), it has beenobserved that the vast majority of households owned their homes (74 percent);tenants are in second place (almost 12 percent); and households in the processof becoming homeowners (known as gazra), constitute the remaining 7.5 percent.The main types of housing occupied by households can be classified into twogroups: substandard dwellings (tents, shacks/huts, baraques and m’bar) representing32.5 percent of all housing types; and dwellings that could be called “houses”comprising the remaining 67.5 percent.
It is therefore difficult to determine if a “gap” market actually exists (and what thebreadth and depth of it would be). Also, it is unclear if a mortgage market is evennecessary at this stage.
Regarding higher income formal housing, various online property web pagessuggest that prices for a three bedroom detached home in the capital city varyfrom US$190 000 up to US$750 000. Given the relatively high poverty levelsand the fact that GNI per capita is only US$1 260, it is unlikely that mostMauritanians would be able to afford these properties.
> $50 000
$25 000 – $50 000
$14 000 – $25 000
$8 000 – $14 000
$5 000 – $8 000
$3 600 – $5 000
$2 400 – $3 600
$1 600 – $2 400
$800 – $1 600
<$800
- - - Average annual urban household income, 2014
MAURITANIA
$5 167
Rural | UrbanAnnual household income US$
No. of households (thousands) 100 80 60 40 20 0 20 40 60 80 100

Africa Housing Finance Yearbook 2015
133
Housing supply
In the 1970s and 1980s, severe droughts and desertification in the Sahel region allbut destroyed the nomadic way of life and spurred significant eco-migration tothe major urban centres of Nouakchott and Nouadhibou. The cities had toaccommodate large influxes of nomadic people settling on the periphery. Self-construction has therefore been the main method of building houses in Mauritania.
As the newly arrived populations lacked the means to construct formal housing,they created two types of spontaneous settlements: the kebbe and the gazra.Distinguishable by the tents and barracks of its residents, the kebbe – a Hassaniya(Arabic dialect) term for a slum – quickly became an expression of social andeconomic marginalisation in the city. Known as the first and largest slum in the city,the kebbe of El Mina (kebbe El Mina) was created on a large area designated forindustrial use and quickly expanded. The gazra, used to identify the illegaloccupation of public or privately owned land, projects a distinct and uniqueexpression of informality as ‘invented’ by its inhabitants. Located in the heart ofthe same-named district, the gazra of Arafat (gazret al Arafat), covers 400 acres andhouses over a third of the entire population of the district. The primarydistinguishing feature between the kebbe and gazra relates to housing type – thekebbe is entirely informal and a real expression of impoverished life; while thegazra is a combination of formal dwellings together with tents and barracks – thedifferent status of the inhabitants raises questions regarding the thin line betweeninformal habitat and ‘poverty’.
Although the objective of revised government efforts was to eliminate theproblem of informal settlements, the kebbe and the gazra continued to expand inresponse to a steadily growing population. The Urban Development Programme(PDU), launched in 2002 with funding from the World Bank and the Mauritaniangovernment, had three main objectives: 1) the eradication of slums and informalneighbourhoods in Nouakchott and Nouadibou; 2) the provision of urbaninfrastructure and 3) capacity building of government institutions and civilorganisations.
The determination of the government authorities to clear squatter settlementsand offer people more decent housing led to the development andimplementation of neighbourhood-based integrated restructuring programmes.The first of these was a pilot, between 2003 and 2007 in El Mina. The pilotguaranteed land tenure to over 16 000 households and implemented a majorconstruction programme costing almost MRO 4 billion (US$12.2 million).Subsequently, government opted for a more affordable, participatory approach torehabilitate the other squatter settlements of Nouakchott and Nouadhibou. Thisentailed engaging with representatives in awareness raising, information sharing,and a broad enumeration of households; and has been successful in both theArafat and Hay Saken squatter settlements. A low-cost housing micro-creditsystem was instituted under the Urban Development Programme (PDU) whichhelped to produce 5 000 housing units in Nouakchott and Nouadhibou.
The Twizé programme was conceived to alleviate settlers’ hardships, to managechaotic urban growth, and to improve access to affordable housing and livingconditions for lower income residents and poor eco-migrants. Established by theGroupe de Recherches et d’Échanges Technologiques (GRET) in 1998, theprogramme was expanded in 2003 with financial support from the World Bankand the government. GRET collaborated with the Mauritanian Commissariat auxDroits de l’Homme, à la Lutte Contre la Pauvreté et à l’Insertion (Commission ofHuman Rights and Integration in the Fight Against Poverty), the municipality ofNouakchott, and NGOs.
The initial pilot project was a success, and demonstrated that marginalisedsettlements could be transformed into viable neighbourhoods. In the first phase,the 130 families who participated in the pilot doubled the size of their homes andincreased the value of the land and top structures by a factor of four. Loanrepayment rates were close to 100 percent. However, rising construction andinfrastructure costs increased the subsidies needed to cover the widening gapbetween the affordability of the target group and the cost of land and housing. Theconstruction cost of the basic module quadrupled between 1998 and 2005 fromMRO110 000 (US$306) to MRO400 000 (US$1 224). Despite the doubling ofpar ticipants’ contributions, rising costs meant that subsidies increased from27 percent to 67 percent of the total cost, eroding the programme’s financial
viability. Following the termination of the World Bank funding (US$15 million overfive years), the project ended. At the conclusion of the programme in 2008,6 000 houses had been constructed. The programme provided skills training forworkers in a variety of fields, including construction, craftsmanship and textiles andliteracy training, and improved communication among labourers, creditors andbeneficiaries. It facilitated the mobilisation and involvement of residents in theplanning process.
Since its establishment in 1974, the Real Estate Construction and ManagementCompany (SOCOGIM) has promoted affordable housing delivery, including thecompletion and marketing of a 1 050 housing-unit programme carried out incollaboration with local banks; the construction of 2 100 housing units for socialhousing between 2006 and 2008 in Nouakchott and Nouadhibou and 1 000housing units in Nouakchott. Essentially through private real estate developers,who have agreements with the government; the completion and partial marketingof 1 485 serviced lots in Nouakchott, and a programme to develop 884 lotsearmarked for social housing and under construction in Nouakchott (El Mina);and the award of land concessions to private international developers to expandthe housing market. The National Land Development, Housing Development andReal Estate Promotion and Management Corporation (ISKAN) was established in2010 to help develop land, improve and develop housing, and promote andmanage real estate development. It became operational in 2013 and absorbedSOCOGIM and the National Land Development Agency (ANAT). This led to theapproval of a strategic development plan for administrative buildings and a housingstrategy; and the adoption of measures to remove bottlenecks in the constructionand public works sector and promote the use of local materials.
The World Bank/IMF’s Poverty Reduction Strategy Paper III (2011 – 2015) actionplan includes the goal to improve living conditions by making decent low-costhousing available and providing proper amenities and infrastructure. This includesbuilding 4 000 houses and the improvement of 6 000 plots.
Currently the top end of the residential development market is entirely local andcomprises the ad hoc construction of buildings for owner-occupation or leasingmainly to the expat market in Tevragh Zeina. Many diplomatic staff is housed inaccommodation that has been built within embassy compounds.
Property markets
Information regarding property rights appears to be mixed and at timescontradictory. While property rights are protected under the Mauritanian CivilCode modelled on the French code, it is difficult to determine who may or maynot own land in the country.
According to the World Bank’s 2015 Doing Business Report, Mauritania is ranked66th out of 189 countries for registering a property; which requires fourprocedures, takes 49 days and costs 4.7 percent of the property value. Lack ofcadastral information and cumbersome legal procedures have hampered thetransfer of property titles to occupants. It can be difficult to gain redress forgrievances through the courts. However, the current Investment Code ensuresthat if the government expropriates private property, it will provide appropriateand prompt compensation, exempt from duties and taxes (US Department ofState, 2012).
Seizure of property, for mortgage or unsecured debt, is a very long and expensiveprocedure. Seized property is generally held by banks, with a negative impact interms of taxes and liquidity ratio. Once seized, a property could be sold by publicauction, but in the absence of a secondary market and a cultural reluctance toacquire the property of others under such circumstances, banks are often forcedto stand as buyers of seized property and keep it as part of their assets. Activityin the real estate market in Nouakchott related almost entirely to the speculativepurchase of land by individuals, most of whom are locals.
There remain many land tenure issues in southern Mauritania, particularly along theSenegal River. Investors should be fully aware of the history of the lands they arepurchasing or renting, and should verify that the local partner has the properauthority to sell/rent land in this area.

134
Policy and regulation
The rapid urbanisation that followed the droughts of the 1970s outstripped theability of government to manage urban growth and regularise peri-urban. Thereis no national housing strategy or policy in Mauritania but there are someinstitutional mechanisms aimed at liberalising and promoting the sector whichtogether create a sort of policy framework. While all regional capitals weredirected to adopt Simplified Master Plans (Schémas Directeurs Simplifiés) in 2008,none have been approved by the national authorities and only Nouakchott has anenforceable set of planning regulations. Property-based local revenues are minimaland further hamper the ability of local governments to provide basic infrastructure,particularly to the informal settlements on the urban fringe where most of theurban growth is concentrated. The main policy and regulation frameworksgoverning the housing sector include:
n Law No. 99-031 of 20 July 1990, as amended by Law No 2005-08 of 30January 2005 and its implementing texts: Established real estate developmentin the country
n World Bank/IMF’s Poverty Reduction Strategy Paper III (2011-2015) actionplan: Part of this programme aims to improve living conditions by makingdecent low-cost housing available and providing proper amenities andinfrastructure. The approach has focused mainly on: 1) adopting andimplementing a national housing strategy; 2) significantly increasing the supplyof housing; 3) encouraging real estate development, with a view to quicklyproviding a diverse supply of dwellings at a cost that is accessible tohouseholds; 4) continuing and expanding the “Twize” low-cost housingprogramme to the major urban areas; and 5) implementing a system forfinancing housing taking into account the needs of households, as well as thoseof real estate developers.
Opportunities
Recently Mauritania has had healthy rates of economic growth. The developmentof the country’s natural resources should have an ongoing and positive impact onGDP and create further opportunities in the industrial and commercial sectors.This has, and will, continue to support a boom in the higher end property market.
Furthermore, there appears to be some opportunities for both the public andprivate sectors to strengthen the development of housing finance, and increase itssupply. Efforts could be targeted toward establishing refinancing and guaranteemechanisms, and new products such as housing savings plans, long term mortgages,renegotiable mortgages etc. These would complement those recommended bythe World Bank for the government to explore the feasibility of establishing: 1) aloans recovery company and/or a mortgaged real property management company;2) a mortgage refinancing fund; and 3) a mortgage guarantee fund.
Sources
African Economic Outlook (2014). Mauritania, 2014. AfDB, OECD, UNDP, ECADessie, E (2013). Land, informality and notions of secure tenure- perceptions fromNouakchott, Mauritania, September 2013.EIU (2015). Country Report: Mauritania, August 2015.IMF (2015). 2014 Article IV Consultation- Staff report; Press Release; and theStatement by the Executive Director for the Islamic Republic of Mauritania, 14January 2015.IMF (2014). Financial Access Survey: Mauritania, 2012.IMF (2013). Sixth Review under the three-year extended credit facilityarrangement and request for waiver of non-observance of performance criterion,31 May 2013. Institute for International Urban Development, 2012. Knight Frank(2015). Africa Report, 2015.UN (2005). Cost of Living Survey Report. August 2005.UN HABITAT (2008). Urban Development and Housing Conditions.US Department of State (2012). Investment Climate Statement: Mauritania, 2012.World Bank (2013). Doing Business Report 2014: Mauritania.World Bank (2013). Islamic republic of Mauritania: Financial Sector DevelopmentStrategy and Action Plan 2013-2017.World Bank (2013). Country Partnership Strategy (FY 2014-2016) for the IslamicRepublic of Mauritania, 5 September 2013.World Bank (2011). The Islamic Republic of Mauritania Poverty Reduction StrategyPaper and Joint Staff Advisory Note, 6 June 2011.
Websites
www.africaneconomicoutlook.orgwww.afribiz.infowww.doingbusiness.orghttp://www.financialfreedomindex.com/freehold-property.htmlhttp://i2ud.org/2012/10/twize-program-mauritania/www.mfw4a.orgwww.shelterafrique.orgwww.unhabitat.org

Africa Housing Finance Yearbook 2015
135
Mauritius
Access to finance
Penetration of financial services is generally good, with 80 percent of Mauritianshaving bank accounts. Over two years, Mauritius’ ranking in terms of ease of gettingcredit improved by 16 points, bringing it to 36th place out of 189 countries in theWorld Bank’s Doing Business indicators. According to the International MonetaryFund, there are about 105 commercial bank branches and 210 ATMs per1 000km2.
At the end of June 2014, the banking sector comprised 23 banks licensed to carryout banking business in Mauritius, of which 10 were local banks, eight weresubsidiaries of foreign-owned banks, four were branches of international banksand one was a foreign-owned bank. Out of the 23 banks, two banks were involvedin private banking business but only one of them was in operation at the end ofJune 2014.
All of the banks have licenses to carry out banking business locally andinternationally. The Mauritius Commercial Bank (MCB) and the State Bank ofMauritius (SBM) are among the largest banks in the East African region. Thebanking system is highly concentrated, with four of the major banks accountingfor 85 percent of the whole banking system’s assets and 70 percent of thecountry’s financial sector.
Overview
Mauritius is a small island country of only 2 000 km2 in the Indian Ocean, with apopulation of about 1.26 million people, or 359 000 households. The Mauritianeconomy is well run, with sound political and economic management practices. In2014, for the sixth year in a row, the World Bank ranked Mauritius as the easiestplace to do business in Sub-Saharan Africa (and 28th globally out of 189 countries).
Despite the country’s exposure to external shocks in the world economy (Europeaccounts for nearly two-thirds of the country’s exports and a similar proportionof the tourist arrivals), the economy grew from 3.2 percent in 2013 to 3.5 percentin 2014. This is due to ongoing efforts to diversify the economy, a modestimprovement in European growth and increased exposure to faster growingemerging economies.
While the government appears to be moving away from economic policies basedon redistribution and state intervention, towards an emphasis on private sector ledeconomic growth, the government will remain deeply involved in efforts todiversify the country’s “four pillar economy” (based on sugar, textiles, tourism andfinancial services). In order to increase competitiveness and resilience to shocks,the country will invest in education and infrastructure to boost productivity andshift towards a more service-oriented economy (particularly focusing on financialservices, information and communications technology and business outsourcing).Another element of the economic strategy is the further development of thefishing sector and continued restructuring of the sugar sector. The luxury realestate sector, supported by a beneficial tax regime and government-backedprogrammes, will also become an increasingly important part of the economy asauthorities seek to establish the island as a business centre linking Africa with theMiddle East and Asia.
The Bank of Mauritius (BoM, the central bank), cut the repo policy rate from4.9 percent to 4.65 percent in June 2013 as domestic growth prospects wereuncertain and external conditions remained relatively weak. During 2014, theMonetary Policy Committee kept the Key Repo Rate unchanged at 4.65 per centagainst the backdrop of weak global growth and contained domestic inflationarypressures.
KEY FIGURES
Main Urban Centres Port Louis (capital)
Exchange Rate: 1 US$***Inflation 2013 | 2014 (est.) | 2015 (prov.) | 2016 (prov.) *
35.50 Mauritian Rupee (MUR)3.5 | 3.2 | 3.1 | 3.5
Population^ | Population growth rate (2013)^Urban population (% of total)^ | Urbanisation rate (% in 2013)^
1 260 934 | 0.1839.81 | -0.23
GDP / capita (current US$)^ | GDP growth rate (annual %)^GNI / capita, Atlas method (current US$) ^Population below national poverty line*Unemployment rate (%)*Gini co-efficient (year of survey)^^HDI (Global Ranking)" | HDI (Country Index Score)”
10 005.62 | 3.609 710...7.935.9 (2012)63 | 0.771
Lending Interest Rate^Mortgage Interest Rate (%) | Mortgage Term (years)#Credit % of GDP^Average Mortgages % of GDP° Price To Rent Ratio City Centre** | Outside City Centre**Gross Rental Yield City Centre** | Outside of City Centre**Outstanding home loan (% age 15+)##
8.508.50 | 30100.2412.99% (2011)14.68 | 17.896.81% | 5.59%15.22
What is the cost of standard 50kg bag of cement (in US$)? #What is the price of the cheapest, newly built house by a formaldeveloper or contractor (in US$)? #What is the size of this house (in m2)? #What is the average rental price for a formal unit (in US$/month)#What is the minimum plot size for residential property (in m²)#
6.40
31 000120......
Ease of doing business rank !Number of procedures to register property !Time (days) to register property !Cost (% of property value) to register property !
2841410.60
*** Conmill.com The Currency Converter^ World Bank's World Development Indicators (2014)~ World Bank PovcalNet: an online poverty analysis tool, various years^^ The World Bank's PovCalnet" UNDP's International Human Development Indicators (2014)° Various: Badev et al. "Housing Finance Across Countries: New Data and Analysis" – Unpublished
paper/Hofinet/World Bank## Global Financial Inclusion Database (FINDEX)# CAHF Annual Survey Data (September 2015)! World Bank's Doing Business Survey Data (2015)** Numbeo Online User-Contributed Database

136
The country’s commercial banks are well capitalised, well regulated, liquid andprofitable. The capital adequacy ratio (16.8 percent in June 2014) comfortablyexceeds the regulatory minimum of 10 percent and the overall quality of assetsis good. On the back of the slowdown in economic growth and declines in theconstruction sector, the ratio of NPLs increased from 3.4 percent in September2013 to 4.0 percent in 2014. Nevertheless analysts agree that local banking groupsare well placed to absorb these losses.
Two new banks to be engaged in private banking business were licensed in April2014 and one of them started operations on 23 June 2014. The licensing of thesetwo private banks is in line with the Bank of Mauritius objective of fostering newlines of banking activities in Mauritius. The Bank of Mauritius issued a number ofnew guidelines and reviewed existing ones with a view of enhancing the financialsoundness of financial institutions falling under its purview.
A set of macro-prudential measures were introduced in October 2013 that aimat addressing potential systemic risks and emerging vulnerabilities in the financialsystem. These measures include, inter alia, a LTV for residential and commercialproperty loans; a debt-to-income ratio (DTI) for residential property loans;additional portfolio provision; and sectoral credit limits for the construction,tourism and personal sectors.
Besides traditional banking facilities, banks offer card-based payment services, suchas credit and debit cards, internet banking, and phone banking facilities. Specialisedservices such as fund administration, custodial services, trusteeship, structuredlending, structured trade finance, international portfolio management, investmentbanking, private client activities, treasury and specialised finance are also offered bybanks. The international banks offer a wide range of global banking and financialservices to corporate, institutional and private clients.
Deposits, which represent banks’ main funding source (78 percent of the totalbanking sector) grew by 2.1 percent during the year under review. Over the pastdecade the savings rate has fallen from just short of 30 percent of GDP to around13 percent. Bank credit to the private sector (excluding the GBL sector) continuedto expand in 2013-14 at the rate of 3.6 per cent, though at a much lower pacethan the growth rate of 8.0 per cent in 2012-13. There was a negligible increasein share of credit to the private construction sector (from 25.3 to 25.4 per cent)during the same period.
Some 15 banks offer mortgage finance, and the use of mortgage finance isgenerally high by African standards, although it has declined recently. According tothe Mauritius Housing Census, just over 12 percent of houses were mortgaged in2011, versus 16 percent in 2000. Mauritius has a relatively large pension industry,and 51.4 percent of the labour force are contributors. The national pension fundis also involved in the housing sector and, for example, lends money to theMauritius Housing Company (MHC).
A key mortgage lender targeting low income earners is the MHC, which emanatesfrom the former Mauritius Housing Corporation, a parastatal body set up in 1963.The MHC was incorporated as a public company in 1989 to address the housingfinance requirements of the population, with special attention to the low incomehouseholds. In 2012, the MHC held a five to 10 percent market share. The MHCoffers a diverse range of products. A major contribution of the MHC has beenthe introduction of a special savings scheme in the year 1982. This schemeencouraged Mauritians to save with the MHC so as to be later eligible for ahousing loan.
There are constraints to the growth of the Mauritian mortgage market.Affordability constraints as well as informal incomes undermine access tomortgages, and lenders feel that the cost and time of foreclosing on a propertycreates risk. The Borrowers’ Protection Act of 2007 aims to ensure responsibleborrowing and lending, and provides for a Commissioner to examine and have asay in cases of foreclosure. Furthermore, while there are no private credit bureaus,over half of the population (56.3 percent) is included in the public credit registry.
By end-June 2014, the public credit bureau (MCIB’s) participation base comprised44 institutions, including the 17 banks, 9 leasing companies, 9 insurance companies,the Mauritius Housing Company Ltd, the Development Bank of Mauritius Ltd, theNational Housing Development Co Ltd, The Employees Welfare Fund, theMauritius Civil Service Mutual Aid Association Ltd and three utility bodies, namely,the Central Electricity Board, the Central Water Authority and the Waste WaterManagement Authority.
Affordability
According to Bhotish (2012), home ownership has been steadily increasing sincethe 1980s; and in 2011 household ownership in Mauritius stood at approximately89 percent (compared to 8 percent that rent or sub-rent, and another threepercent who were living for free in the housing provided by their relatives oremployers).
Although Mauritius is a relatively rich country, a segment of the population isunable to afford their housing. In 2014, Mauritius had an unemployment rate of7.9 percent, or over 40 000 people. According to the Central Statistics Office,about 1.5 percent of people earn below US$2 a day. According to UN-Habitat,there are some incidences of squatting as a result of unemployment and thedecline of solidarity networks that previously supported vulnerable households.
Mauritius has a relatively comprehensive social security system that includes arange of government subsidies for housing. The government uses state ownedcompanies such as the MHC to improve affordability for housing. Anothergovernment driven scheme to increase affordability is offered through the NationalHousing Development Company (NHDC). This parastatal body was set up inMarch 1991 to serve low income Mauritians. It offers both fully developed units
> $50 000
$25 000 – $50 000
$14 000 – $25 000
$8 000 – $14 000
$5 000 – $8 000
$3 600 – $5 000
$2 400 – $3 600
$1 600 – $2 400
$800 – $1 600
<$800
- - - Average income needed for the cheapest newly built house (excluding land), 2015
- - - Average annual urban household income, 2014
MAURITIUS
$23 327
$9 231
Rural | UrbanAnnual household income US$
No. of households (thousands) 80 60 40 20 0 20 40 60

Africa Housing Finance Yearbook 2015
137
and site-and-service options at subsidised rates. The NHDC site-and-servicescheme provides applicants a portion of state land through a lease. There is anincome criterion, requiring a monthly income of between Rs10 000 (US$282)and Rs25 000 (US$706) to qualify for the land. This means that while the productscover the majority of the population, a small minority of the working population,the lowest paid, still cannot afford to meet their housing needs. Due to theincidences of squatting, the government’s National Empowerment Foundation(NEF) is now looking after this category of the population.
The cheapest newly built house by a formal developer costs around US$31 000excluding the land, and is 120m2 with three bedrooms, a living and dining room,kitchen, toilet/washroom and small veranda. A minimum plot size is 250m2 inurban areas. A bag of 50 Kgs of cement costs US$6.40 (incl. VAT).
Sheet iron costs are as follows: Profilage Type – Galvanised and pre-coated roofsheeting: US$ 2.15 per running foot (incl. VAT), thickness of 0.56 mm and width of800 mm; US$ 2.60 per running foot (incl. VAT), thickness of 0.63 mm and width800 mm, Type 3: US$ 3.07 per running foot (Incl VAT), thickness of 0.75 mm andwidth of 800 mm, lastly ordinary S sheet Galvanised corrugated roof sheetingUS$ 1.06 per running foot (incl. VAT), thickness of0.50 mm and width of 800 mm.
Housing supply
The 2011 Housing and Population Census reports that there are 356 900 housingunits in Mauritius and Rodrigues. According to the Housing and Population Censusof 2011, 99.4 percent of households have access to electricity and 94.2 percenthave access to water inside their home. Most housing stock in Mauritius is ofgood quality. According to the World Bank, 91 percent of the dwellings are durablewith only 4.8 percent of the population living in iron/tin walled houses. The Censusalso found that 90.5 percent of residential dwellings were used as a principleresidence, 1.7 percent as secondary dwellings and 7.8 percent were vacant. Semi-detached houses and blocks of flats went up to 16.6 percent of total stock, from11.5 percent in 2000.
Successive Government Budget proposals have ensured that all citizens have ahouse providing decent living conditions. The strategy focuses on HousingEmpowerment Schemes, Social Housing and Home ownership for low incomefamilies are worth mentioning.
1. The Housing Empowerment Scheme targets middle-income families earningup to Rs50 000 (US$1 429) a month. Under the scheme, banks will requireonly five percent as minimum down-payment on the purchase of a propertyinstead of the usual or more 10 percent currently applicable, i.e. they willadvance loans up to 95 percent of the cost of a residential unit. The loans willalso carry a moratorium period of two years on capital repayment. To makethis possible, government is guaranteeing 20 percent of the loan amount. Inaddition, to reduce the cost of acquiring a housing unit, government willreimburse VAT up to an amount of Rs300 000 (US$9 597) on theconstruction of any house or purchase of an apartment costing less thanRs2.5 million (US$79 975). For its part, the Mauritius Housing Company willprovide, free of charge, at least 12 types of architectural plans for each houseof an area of 1 000 and 1 200ft2. In addition, the interest rate is 2.5 percentabove the repo rate, presently at 4.65 percent.
To this effect, in March this year, the Mauritius Housing Company and theMauritius Bankers’ Association signed a Memorandum of Understandingoutlining agreed conditions between the government and the commercialbanks. Twelve banks are involved in this project namely: State Bank ofMauritius, Mauritius Commercial Bank, Mauritius Post and Cooperative Bank,ABC Banking Corporation, Barclays Bank, Bank of Baroda, Bank One, StateBank of India, Bramer Bank, Hong Kong and Shanghai Banking Corporation,Habib Bank and Banque des Mascareignes.
2. The 2014 Budget also announced the launching of a major Social HouseConstruction Programme in 2014, where 1 765 families will benefit fromeither a housing unit or a serviced lot. Thus:
n 576 social housing units will be constructed and 80 serviced lots will becompleted for delivery throughout the island.
n 588 social housing units and 151 serviced lots are also in the pipeline.n Provision for an additional 450 social housing units to vulnerable families in
2014 through the National Empowerment Foundation.n Provision of Rs250 million (US$7.97 million) to improve living conditions in
NHDC and ex-CHA Housing Estates through the rehabilitation programme,and Rs80 million (US$ 2.5 million) for the casting of roof slab scheme.
As part of the social housing policy, the Ministry of Housing and Lands willendeavour to ensure housing estates will be of moderate size, which willfacilitate integration in local communities and reduce offsite infrastructurecost. Local authorities will be responsible for maintaining roads and otherpublic areas in line with their responsibilities for other parts of their councilareas.
3. In line with the new approach of the National Home Ownership Programme,the Social Housing Fund has been revamped into a National Habitat Fundwith wider objects. Hence, the Minister of Housing and Lands broughtlegislative amendments to give to those families who have a housing unit onleased land belonging to the State, the option to buy the land at a nominalprice not exceeding Rs2 000 (US$56.49) per plot. It is a measure that willempower some 17 000 families with very modest means to have fullownership of their land.
These programmes complement the extensive investment that the public andprivate sectors have made in housing development. As from 2011, the NEF hasconstructed more than 300 core housing units of 32m2 each. It is projected tobuild 700 additional such units within the next two years. Furthermore, by 2012,the NHDC had built more than 12 000 units, and a further 10 000 units were inthe pipeline. An innovative subsidy scheme offered by government through theNHDC promotes self-build approaches. Households with a monthly income ofbetween Rs10 000 (US$282) and Rs25 000 (US$706) and who have neitherreceived a grant previously nor already own a property are entitled to apply forland that is periodically made available. The land is made available on a leasearrangement and the beneficiary is required to pay the fee. The construction ofa housing unit on the land must begin within six months following the signing ofthe lease agreement, and be completed within 18 months. Beneficiaries can applyto the MHC to finance the construction and can access architectural services fromthe MHC for Rs2 (US$0.06) per ft2.
Throughout the NHDC, the government also grants up to Rs75 000 (US$2 118)for casting a roof slab of up to 210m2 to first time homeowners earning up toRs10 000 (US$282) a month. The government also grants up to Rs65 000(US$1 836) to households earning not more than Rs10 000 (US$282) a monthto buy building materials. The grant applies to a maximum area of 100m2. For ahouse of 50m2, the grant is Rs40 000 (US$1 129) on a pro-rata basis. Althoughthe NHDC programmes target low income earners, the requirement of aminimum financial contribution means that some households are still unable toparticipate.
Furthermore, there is also an incentive for developers to develop residential units.Requirements are that the land for development must be non-agricultural andhave access to main infrastructure lines and amenities. In addition, developersshould provide all basic infrastructure and 25 percent of the development mustbe for low income households, for which the sale price is determined by thegovernment. A Social Housing Development Fund was also established, capitalisedwith Rs1.5 billion (about US$47.8 million) to encourage the creation of not-for-profit Housing Development Trusts. A Marshal plan against poverty was alsoannounced in the Budget 2015. Under this project, as part of their socialresponsibility will have to take under their wings pockets of poverty situated in theregion where the companies are located. Thus the private sector will also assistin poverty alleviation.
Property markets
The global economic problems have to some extent affected the higher endproperty market in Mauritius, but this seems to be recovering, and governmentexpects the real estate sector to be a primary growth driver as from 2013. Themarket segment is closely tied to the economic fortunes of Europe and the USbecause of the deliberate efforts by government to encourage greater foreign
138
ownership. The Permanent Residence Scheme, the Integrated Resort Schemeand the Scheme to Attract Professionals for Emerging Sectors all encourageforeign investment and settlement. Recently, new tax laws in France have createdmore demand for property in Mauritius amongst French buyers. After this, SouthAfrican property buyers are also significant.
According to the World Bank’s 2015 Doing Business Report, it takes 14 days andfour procedures on average to register property (which ranks Mauritius as beston the continent and 65th globally). The registration process costs on average10.6 percent of the value of the property.
Policy and regulation
The planning and management of housing and land in Mauritius is the responsibilityof the Ministry of Housing and Lands, and as mentioned in previous sections, thisdepartment has set up a fairly comprehensive array of support and initiatives toaddress housing needs. Subsidy programmes target both new build constructionand self-help housing, and government has made an explicit effort to deal withthose with no affordability at all. Spatial data for land use management andplanning is facilitated by the Land Administration Valuation and InformationManagement System.
Prior to 2006, social housing responsibility was solely the responsibility ofgovernment. But as demand kept growing and the government could only buildaround 900 units a year (with a waiting list of 25 000 housing units), the privatesector was called to participate through various Public Private Partnership (PPP)projects. An interesting aspect of the Finance Act of 2009 requires companies, aspart of their corporate social responsibility, to pay two percent of their book profitafter tax into a Corporate Social Responsibility Fund. This Fund can be used onapproved projects, amongst which social or subsidised housing is a high priority.
Opportunities
Mauritius has been emerging as an international financial centre since the early1990s, and as mentioned previously, it is the easiest place to do business in Africa.It is becoming a favoured country for structuring cross-border investments intoAsia and Africa, and particularly into India and China. This reputation as an offshorefinancial haven should see it continue to become an important player ininternational financial flows. The country also has preferential access to marketsin the Africa region (such as the African Union, SADC, the Common Market forEastern and Southern Africa (COMESA) and the Indian Ocean Rim Associationfor Regional Co-operation (IOR-ARC), pointing to its strategic location.
According to the African Executive (2014) in order for Mauritius to become ahigh income country, it needs to start attracting foreign skilled labour. If labourflows are similar to those experienced by Dubai, Hong Kong and Singapore at asimilar stage, over the next decade Mauritius should be ready and willing toaccommodate some 5 000 to 20 000 foreigners annually, with a total of 100 000to 200 000 for the period. In the short run such an influx could be accommodatedin the various real estate projects. However, going forward, this offers a greateropportunity in middle to higher end housing finance, as foreign investment andwealth increase in Mauritius.
Sources
Bhotish, A (2012). Mauritius: Social Housing. Social Movement and Low IncomeHousing in Mauritius, 17 June 2012. Tsinghua University School of Architecture.Business Monitor International (2014). Commercial Banks Facing Near-TermChallenges, 19 August 2014.EIU (2014). Country Risk Service: Mauritius, May 2014.Government Information Service (2015). Government Launches HousingEmpowerment Scheme for Middle Income Families, 18 March 2014.Government Information Service (2015). Budget 2014 Highlights: HomeOwnership within the reach of more Mauritians, 15 November 2013.Housing and Population Census (2011). Statistics Mauritius.www.statsmauritius.gov.mu.Mauritius Banking Association (2013). The Banking Industry, 31 October 2013.The African Executive (2014). How Mauritius Can Become a High IncomeCountry, 9-16 April 2014.UN Habitat (2012). Mauritius National Urban Profile. World Bank (2014). Doing Business 2014: Mauritius.Bank of Mauritius. Financial Stability Report 2015. Annual Report for the yearended 30 June 2014.
Websites
www.africanexecutive.comwww.bom.muwww.gov.muhttp://gis.gov.muwww.mba.muwww.mhc.muwww.nhdcmauritius.comwww.pwc.com/muwww.worldbank.org
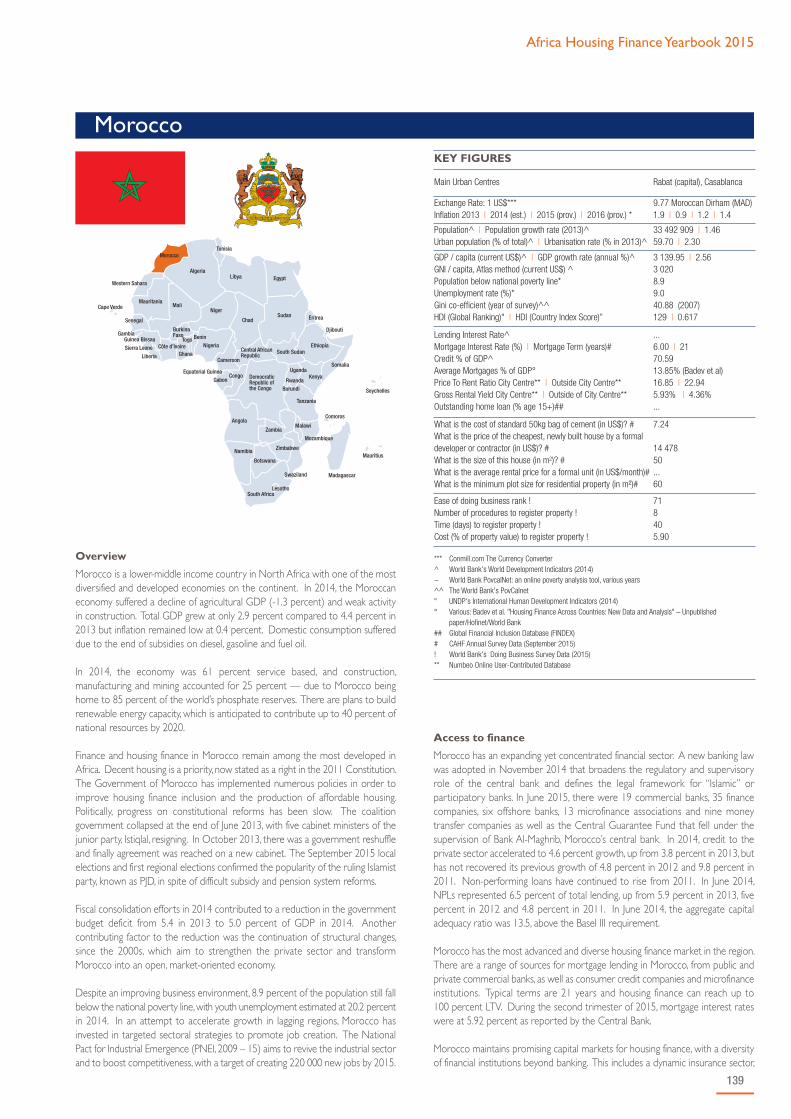
Africa Housing Finance Yearbook 2015
139
Morocco
Access to finance
Morocco has an expanding yet concentrated financial sector. A new banking lawwas adopted in November 2014 that broadens the regulatory and supervisoryrole of the central bank and defines the legal framework for “Islamic” orparticipatory banks. In June 2015, there were 19 commercial banks, 35 financecompanies, six offshore banks, 13 microfinance associations and nine moneytransfer companies as well as the Central Guarantee Fund that fell under thesupervision of Bank Al-Maghrib, Morocco’s central bank. In 2014, credit to theprivate sector accelerated to 4.6 percent growth, up from 3.8 percent in 2013, buthas not recovered its previous growth of 4.8 percent in 2012 and 9.8 percent in2011. Non-performing loans have continued to rise from 2011. In June 2014,NPLs represented 6.5 percent of total lending, up from 5.9 percent in 2013, fivepercent in 2012 and 4.8 percent in 2011. In June 2014, the aggregate capitaladequacy ratio was 13.5, above the Basel III requirement.
Morocco has the most advanced and diverse housing finance market in the region.There are a range of sources for mortgage lending in Morocco, from public andprivate commercial banks, as well as consumer credit companies and microfinanceinstitutions. Typical terms are 21 years and housing finance can reach up to100 percent LTV. During the second trimester of 2015, mortgage interest rateswere at 5.92 percent as reported by the Central Bank.
Morocco maintains promising capital markets for housing finance, with a diversityof financial institutions beyond banking. This includes a dynamic insurance sector,
Overview
Morocco is a lower-middle income country in North Africa with one of the mostdiversified and developed economies on the continent. In 2014, the Moroccaneconomy suffered a decline of agricultural GDP (-1.3 percent) and weak activityin construction. Total GDP grew at only 2.9 percent compared to 4.4 percent in2013 but inflation remained low at 0.4 percent. Domestic consumption suffereddue to the end of subsidies on diesel, gasoline and fuel oil.
In 2014, the economy was 61 percent service based, and construction,manufacturing and mining accounted for 25 percent — due to Morocco beinghome to 85 percent of the world’s phosphate reserves. There are plans to buildrenewable energy capacity, which is anticipated to contribute up to 40 percent ofnational resources by 2020.
Finance and housing finance in Morocco remain among the most developed inAfrica. Decent housing is a priority, now stated as a right in the 2011 Constitution.The Government of Morocco has implemented numerous policies in order toimprove housing finance inclusion and the production of affordable housing.Politically, progress on constitutional reforms has been slow. The coalitiongovernment collapsed at the end of June 2013, with five cabinet ministers of thejunior party, Istiqlal, resigning. In October 2013, there was a government reshuffleand finally agreement was reached on a new cabinet. The September 2015 localelections and first regional elections confirmed the popularity of the ruling Islamistparty, known as PJD, in spite of difficult subsidy and pension system reforms.
Fiscal consolidation efforts in 2014 contributed to a reduction in the governmentbudget deficit from 5.4 in 2013 to 5.0 percent of GDP in 2014. Anothercontributing factor to the reduction was the continuation of structural changes,since the 2000s, which aim to strengthen the private sector and transformMorocco into an open, market-oriented economy.
Despite an improving business environment, 8.9 percent of the population still fallbelow the national poverty line, with youth unemployment estimated at 20.2 percentin 2014. In an attempt to accelerate growth in lagging regions, Morocco hasinvested in targeted sectoral strategies to promote job creation. The NationalPact for Industrial Emergence (PNEI, 2009 – 15) aims to revive the industrial sectorand to boost competitiveness, with a target of creating 220 000 new jobs by 2015.
KEY FIGURES
Main Urban Centres Rabat (capital), Casablanca
Exchange Rate: 1 US$***Inflation 2013 | 2014 (est.) | 2015 (prov.) | 2016 (prov.) *
9.77 Moroccan Dirham (MAD)1.9 | 0.9 | 1.2 | 1.4
Population^ | Population growth rate (2013)^Urban population (% of total)^ | Urbanisation rate (% in 2013)^
33 492 909 | 1.4659.70 | 2.30
GDP / capita (current US$)^ | GDP growth rate (annual %)^GNI / capita, Atlas method (current US$) ^Population below national poverty line*Unemployment rate (%)*Gini co-efficient (year of survey)^^HDI (Global Ranking)" | HDI (Country Index Score)”
3 139.95 | 2.563 0208.99.040.88 (2007)129 | 0.617
Lending Interest Rate^Mortgage Interest Rate (%) | Mortgage Term (years)#Credit % of GDP^Average Mortgages % of GDP° Price To Rent Ratio City Centre** | Outside City Centre**Gross Rental Yield City Centre** | Outside of City Centre**Outstanding home loan (% age 15+)##
...6.00 | 2170.5913.85% (Badev et al)16.85 | 22.945.93% | 4.36%...
What is the cost of standard 50kg bag of cement (in US$)? #What is the price of the cheapest, newly built house by a formaldeveloper or contractor (in US$)? #What is the size of this house (in m2)? #What is the average rental price for a formal unit (in US$/month)#What is the minimum plot size for residential property (in m²)#
7.24
14 47850...60
Ease of doing business rank !Number of procedures to register property !Time (days) to register property !Cost (% of property value) to register property !
718405.90
*** Conmill.com The Currency Converter^ World Bank's World Development Indicators (2014)~ World Bank PovcalNet: an online poverty analysis tool, various years^^ The World Bank's PovCalnet" UNDP's International Human Development Indicators (2014)° Various: Badev et al. "Housing Finance Across Countries: New Data and Analysis" – Unpublished
paper/Hofinet/World Bank## Global Financial Inclusion Database (FINDEX)# CAHF Annual Survey Data (September 2015)! World Bank's Doing Business Survey Data (2015)** Numbeo Online User-Contributed Database

140
growing pension funds and the Casablanca Stock Exchange. Morocco was thefirst country in the region to pass securitisation legislation in 2002. Though, this toolis still underused with a total issuance of MAD 4 billion (US$413 million) in onlya few transactions. An amendment to this law was completed over the past yearsin an attempt to prompt further operations, though activity is still nascent.
In 2014, Morocco continued to develop the law for covered bonds that is intendedto diversify funding sources and overcome maturity mismatches for the rapidlyexpanding mortgage market. In this law, only banks will be authorised for issuance,where the total amount of covered bonds must not exceed 20 percent of the totalassets of the bank and the net present value of the cover portfolio must be, at anytime, more than 105 percent of the net present value of the covered bonds.Selected loans for the cover por tfolio must have a remaining capital under80 percent of the value of the asset.
Growth in the microfinance sector has been rapid in Morocco since theMicrofinance Act was passed in 1999. The two largest microfinance institutions, AlAmana and Attawfiq, control 72 percent of the market and focus on women, whorepresent almost 80 percent of micro-borrowers in Morocco.
MFIs together with the Moroccan government have set high goals for growth,3.2 million clients and MAD25 billion (US$2.58 billion) in loans by 2020, whichcompares to 859 224 borrowers with US$554.1 million outstanding in March2015. Loans are given not only for the development of income-generatingenterprises but also for housing purchase or construction as well as forconnections to basic utilities. However, loans are capped at MAD50 000(US$5 171), which limits their application for new construction. In March 2015,Al Amana had 328 811 active loans, and a total portfolio of US$214 million. In2014, the materials supplier Lafarge announced a new partnership with Al Amanaand Attawfiq, another prominent microfinance provider, to further expandspecialised home improvement loans for a maximum loan of US$4 877 and a fouryear duration. The Moroccan Postal Service also plays a key role as a provider ofdepository, payments and other retail banking services for small savers via Al BaridBank. With more than 1 800 branches, the postal service serves about 13 percentof the population, though it represents only two percent of total financial sectorassets.
In 2013, the sector launched a price transparency initiative to make more clearchanges over time and in 2014, a white paper was published with plans to reach3.2 million customers by 2020. Partnerships between banks and the governmentmake lending more accessible to middle and low income families, through theFogarim mortgage guarantee fund.
Fogarim is a guarantee fund for households with small and irregular income.Launched in 2004, Fogarim guarantees around 1 200 new beneficiaries eachmonth and had a total of 16 500 beneficiaries in 2014, for a total loan portfolioof MAD2.67 billion (US$276 million). Key features of Fogarim are to guarantee70 percent of a loan that is made to a household with informal income forpurchase of a unit below MAD250 000 (US$25 853). Risk premiums wereintroduced in 2009, with an annual premium of 0.325 percent for LTV ratios lessthan 50 percent, and 0.65 percent for a LTV ratio of up to 100 percent. In 2014,the average housing loan offered on the programme was at a fixed interest rateof 6.35 percent with a LTV ratio of 70 percent, average duration 21 years andmonthly repayments of MAD1 263 (US$131). Fogarim maintains a maximummonthly payment level, which increased in 2013 to 1 750 dirham (US$181).
Morocco also has a guarantee programme, known as FOGALOGE, which targetsmoderate income civil servants, middle class independent workers and non-resident Moroccans buying or building houses. In 2014, 5 550 people benefitedfrom this guarantee, up from 4 449 in 2013. The total loan value of FOGALOGEloans was US$143 million (MAD1.39 billion).
Affordability
Affordability remains an important challenge for housing in Morocco, a countrywhere disparities remain high (income Gini coefficient of 40.88 in 2007). In 2007,the World Bank estimated that 8.9 percent of the total Moroccan population livedbelow the poverty line.
Between 2014 and July 2015, Morocco increased the minimum wage by 10 percent,to US$266 a month, the highest rate in Africa. Average monthly incomes ofhouseholds in Morocco were recorded at U$996 in 2012 by Euromonitor’s WorldConsumer Income and Expenditure Patterns Report.
The 2013 Finance Law had set the nominal price for middle income housing atMAD6 000 per m2 (US$620), for units ranging from 80m2 to 120m2. That priceincluded all taxes. The 2014 Finance Law increased this maximum price toMAD6000 per m2 excluding taxes, which gives a maximum price of US$74 457for a 120m2 apartment. This type of housing is aimed at people earning up toUS$2 068 a month.
The Moroccan government defines two types of affordable housing units, bothcommonly called “social” housing and differentiated by their maximum price:the first one was created by the 2008 Finance Act with a capped price ofMAD140 000 (about US$14 478). It is between 45 m2 and 60 m2 and targetedat individuals who earn less than twice the minimum wage (now MAD2 570 amonth, up from MAD2 455 as of July 1st 2015) or US$531 a month.
The second type of social housing started with the 2010 Finance Act. The coveredsurface area of these apartments is defined by law from 50 m2 to 100 m2 butdevelopers usually build them closer to 50 m2 as the sale price and tax exemptionsare not linked to the surface area but only to the maxim sale price of MAD250 000.Its price is capped at MAD250 000 (about US$25 853) but there is no maximumincome requirement to purchase those “social” housing units. Important taxincentives have made this type of housing very popular among real estatedevelopers.
During the first half of 2015, 74 632 social housing units were produced (total forboth types of social housing). There are tax incentives for the production and saleof such housing but also for their lease (since 2013). The 2015 Finance Lawimproved the incentives for rental of social housing. The maximum monthly rentfor the US$14 478 units was increased from about US$72 to US$104. For theUS$25 853 units it was increased from about US$124 to US$207.
Housing Supply
Annual production of housing in Morocco is around 100 000 units, with over twomillion social housing units having been built since 2000. In 2014, the housingdeficit is estimated to have reduced to 650 000 units. While almost five millionMoroccans live in sub-standard housing, there are 820 000 units (20 percent of theurban stock), which are either vacant (75 percent) or used as secondary orvacation homes (25 percent). Vacant housing is often preferred to leasing byhomeowners who do not want to lose their housing in a country where the lawis more in favour of tenants.
New supply of affordable housing tends to be apartment-buildings of typicallythree to five levels, in large-scale projects located on government provisioned landin peripheral locations, often via Al Omrane, a state-owned company that developsland. A single project can reach up to 10 000 units. In addition to the cost of land,the average middle class self-built house will cost MAD2 800 – 3 000 per m2(about US$ 300) for a villa, and MAD2 000 – 2 500 per m2 (US$206-259) for atraditional Moroccan home, and take eight months to construct.
There is widespread use of public private partnerships between government andprivate sector, to facilitate housing production. Morocco has also been assertivein providing tax breaks and guarantee funds to attract the private sector intoaffordable housing development. To qualify for the tax breaks and subsidised land,developers must commit to at least 150 social houses over five years; this amounthas reduced recently from 500 in order to encourage small-scale developers intothe market place. Since 2011, agreements have been signed with developers forthe production of almost one million social units. Another supply incentive hasbeen delivered through the Cities Without Slums programme that was launchedin 2004, and has continued past the proposed end-date in 2012. The programmehas been improving housing for over 300 000 households, financed notably by atax on cement. An example is provided below.
One company benefiting from these government measures is Addoha, one ofMorocco’s largest real estate developers and the first to be listed on the

Africa Housing Finance Yearbook 2015
141
Casablanca Stock Exchange. Addoha accounts for almost half of the low-costhousing being constructed in Morocco, and has a land-bank of around 6 000ha.Addoha has achieved strong financial returns thanks to the 10-year exemptionsfrom capital gains tax, yet also suffered through the property market slow-downover the past 30 months. In 2014, Addoha reported sales of MAD7.04 billion(US$728 million), which was a decrease of 22 percent from the previous year.
In spite of the economic slowdown, private developers are still very powerful andmonopolistic, having a disproportionate weight on policy. The challenge for AlOmrane is to support emerging contractors and small developers to keep themarket competitive and diversify the housing stock. Other challenges in housingsupply are meeting annual demand, balancing cheaper land sites in remotelocations and high infrastructure costs, and keeping units affordable when the costof building materials and other inputs have increased substantially. Revisions in theFinance Law of 2010 and 2013 give better quality control assurance, which forcesdevelopers to respect a set of minimum building standards within affordablehousing projects. Property developers also receive rewards based on the qualityand safety of housing projects.
Property market
The Moroccan property market has continued to slow down in 2014, with a realestate price index (REPI) increasing by only one percent in a year by the end ofthe third quarter of 2014. REPI, which was developed in 2010 by the CentralBank of Morocco and the Land Registry Office gives detailed information on allformal property transactions and has improved the transparency and monitoringof real estate sector dynamics. In 2014, the tax administration launched a newproperty index called “référential des prix de l’immobilier” based on previoushousing sales. The new index was at first published for Casablanca only andextended to a few other cities in 2015.
In January 2015, a price index that property taxes are based on was introduced.This will provide a more accurate estimate of property prices and their evolutionover time. The number of real estate transactions increased by 10.1 percentbetween the first trimester of 2013 and the first trimester of 2014 (+10 percentfor the number of residential real estate transactions). Prices however onlyincreased by 0.1 percent over the same period. While the prices of land andcommercial real estate have increased (respectively by 0.8 percent and 4.4 percent),those of residential real estate fell by 0.1 percent.
Real estate loans outstanding were at MAD238.3 billion (about US$24.6 billion)in January 2015, a 3.3 percent increase from the previous year. Housing loansincreased by 6.2 percent over the same period while loans to real estatedevelopers decreased by 3.8 percent.
Construction sector value added decreased by 0.3 percent during the thirdquarter of 2014 compared to the previous year. Sales of cement have been
decreasing for three years, by 1.6 percent between 2011 and 2012, 6.4 percentthe following year and 5.4 percent between 2013 and 2014.
In terms of outlook, the expectation is for the sector to recover in the mediumterm as the deficit for low-cost housing remains high and the rate of urbanisationand population growth, around one and a half percent per annum, creates 120 000units of new demand each year. Major obstacles still remain, including land accessand management, titling, and affordability.
Policy and regulation
Housing finance policy in Morocco is focused on stimulating the private financialsector to provide housing finance and lend downmarket, using regulation, financialincentives, and effective information management systems to identify and addressmarket inefficiencies. In order to stimulate the production of housing, theGovernment of Morocco uses a package of incentives designed to facilitate bothdemand and supply of low-cost housing. They include tax breaks (as defined in the2008, 2010 and 2013 Finance Acts), changes in zoning and urban planning and theprovision of government-owned land through public private partnerships.
Until 2016, the aim is to reduce the housing shortage by 400 000 units, yet thegovernment is struggling to reach its targets and will need to investigate ways tobe more effective in stimulating housing. In 2014, about 133 000 housing unitswere completed.
The policies which were recently undertaken, but with little to no effect on housingproduction, include:
a) 2015 Finance law:n Rental housing targeted at the low and lower middle classes benefited from
tax exemptions with the condition to respect a ceiling rental price.n For the MAD250 000 type of social housing, the maximum rent was increased
from MAD1 200 to MAD2 000 a month.n For the MAD140 000 type of social housing, the maximum rent was increased
from MAD700 to MAD1 000 a month.n Those incentives, that previously had little impact on the rental market, did not
change the situation any further when improved.
b) 2014 Finance law: The sale price per square meter of housing for the middleclass was limited to MAD6000 all taxes included in the 2013 Finance law. The2014 Finance law increased this maximum price to MAD6000 excludingtaxes.
Opportunities
As European markets recovered in 2014, and fiscal and regulatory reformscontinue to open up the economy and improve the business environment,Morocco can expect foreign investment to increase and the economy to improve.
> $50 000
$25 000 – $50 000
$14 000 – $25 000
$8 000 – $14 000
$5 000 – $8 000
$3 600 – $5 000
$2 400 – $3 600
$1 600 – $2 400
$800 – $1 600
<$800
- - - Average income needed for the cheapest newly built house by a formal developer, 2015
- - - Average annual urban household income, 2014
MOROCCO
$3 446
$11 199
Rural | UrbanAnnual household income US$
No. of households (thousands) 800 600 400 200 0 200 400 600 800 1000 1200

142
The real estate and construction sectors are currently experiencing a slowerperiod, though the impact of the 2013 Finance Law that support smallercontractors and allows them to benefit from tax benefits related to social housingproduction, as well as steady demand and the backlog, is expected to lead toresilience in these sectors. Demand is still high, particularly among the low andmiddle-income population. Although slow to develop, covered bonds will beanother significant innovation for Morocco, opening up the market for longer andmore affordable housing finance.
Sources
African Economic Outlook.(2014). Morocco Country Profile.Al Aissami, N. and H. Talby. (2013). Morocco covered bonds project in EuropeanBank for Reconstruction and Development, Laws in Transition 2013.Bank Al-Maghrib.(2014). Annual Report.Erbas, N. Nothaft, F. (2005). Mortgage Markets in Middle East and North AfricanCountries: Market development, poverty reduction, and growth.EuroMonitor (2014). World Consumer Income and Expenditure Patterns: 14th
Edition.Hassler, O. (2011).Housing and Real Estate Finance in Middle East and NorthAfrica Countries.World Bank.Martin, J &Mathema, A (2008). Housing Finance for the Poor in Morocco:Programs, Policies and Institutions. USAID.Ministère de l’Economie et des Finances (May 2015). Tableau de bord desindicateurs macro-économiques.Oxford Business Group. (2012). The Report: Morocco 2012.World Bank (2015). Doing Business.
Websites
http://www.bkam.ma/ http://www.ccg.ma/ http://www.mfw4a.org/ http://www.mhu.gov.ma/ www.aujourdhui.mawww.finances.gov.mawww.globalpropertyguide.comwww.imf.orgwww.immobilier-maroc.com www.selektimmo.com
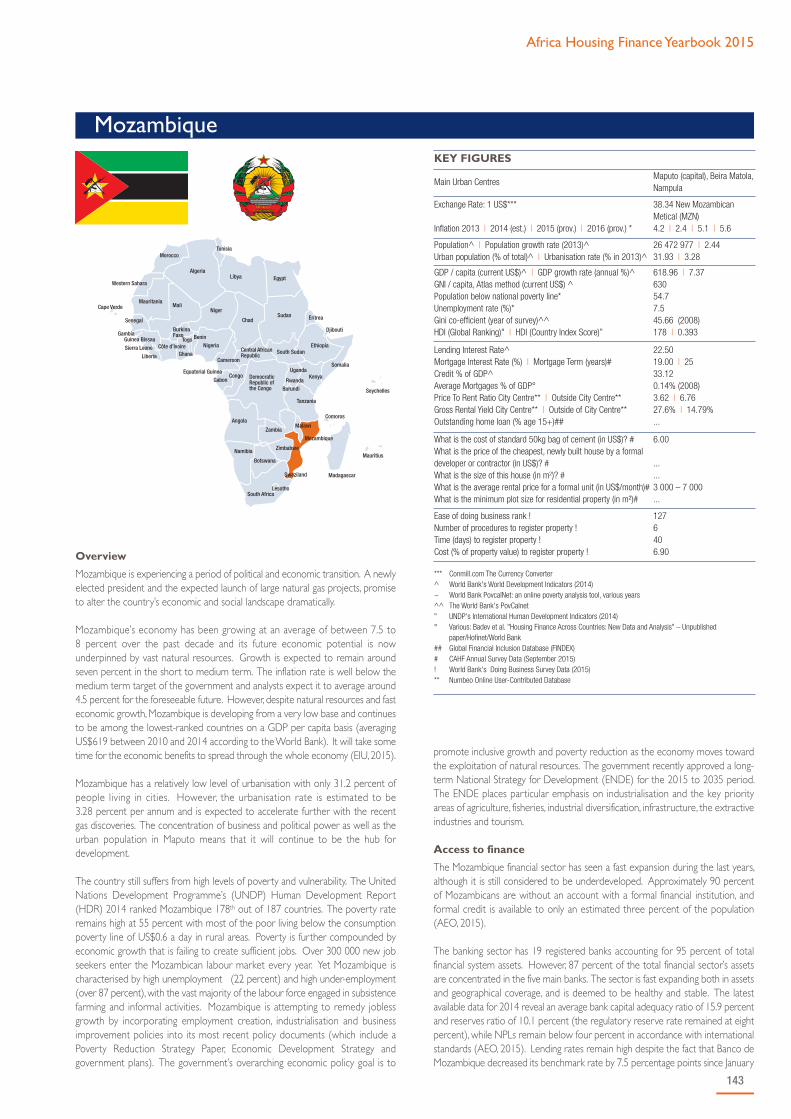
Africa Housing Finance Yearbook 2015
143
Mozambique
promote inclusive growth and poverty reduction as the economy moves towardthe exploitation of natural resources. The government recently approved a long-term National Strategy for Development (ENDE) for the 2015 to 2035 period.The ENDE places particular emphasis on industrialisation and the key priorityareas of agriculture, fisheries, industrial diversification, infrastructure, the extractiveindustries and tourism.
Access to finance
The Mozambique financial sector has seen a fast expansion during the last years,although it is still considered to be underdeveloped. Approximately 90 percentof Mozambicans are without an account with a formal financial institution, andformal credit is available to only an estimated three percent of the population(AEO, 2015).
The banking sector has 19 registered banks accounting for 95 percent of totalfinancial system assets. However, 87 percent of the total financial sector’s assetsare concentrated in the five main banks. The sector is fast expanding both in assetsand geographical coverage, and is deemed to be healthy and stable. The latestavailable data for 2014 reveal an average bank capital adequacy ratio of 15.9 percentand reserves ratio of 10.1 percent (the regulatory reserve rate remained at eightpercent), while NPLs remain below four percent in accordance with internationalstandards (AEO, 2015). Lending rates remain high despite the fact that Banco deMozambique decreased its benchmark rate by 7.5 percentage points since January
Overview
Mozambique is experiencing a period of political and economic transition. A newlyelected president and the expected launch of large natural gas projects, promiseto alter the country’s economic and social landscape dramatically.
Mozambique’s economy has been growing at an average of between 7.5 to8 percent over the past decade and its future economic potential is nowunderpinned by vast natural resources. Growth is expected to remain aroundseven percent in the short to medium term. The inflation rate is well below themedium term target of the government and analysts expect it to average around4.5 percent for the foreseeable future. However, despite natural resources and fasteconomic growth, Mozambique is developing from a very low base and continuesto be among the lowest-ranked countries on a GDP per capita basis (averagingUS$619 between 2010 and 2014 according to the World Bank). It will take sometime for the economic benefits to spread through the whole economy (EIU, 2015).
Mozambique has a relatively low level of urbanisation with only 31.2 percent ofpeople living in cities. However, the urbanisation rate is estimated to be3.28 percent per annum and is expected to accelerate further with the recentgas discoveries. The concentration of business and political power as well as theurban population in Maputo means that it will continue to be the hub fordevelopment.
The country still suffers from high levels of poverty and vulnerability. The UnitedNations Development Programme’s (UNDP) Human Development Report(HDR) 2014 ranked Mozambique 178th out of 187 countries. The poverty rateremains high at 55 percent with most of the poor living below the consumptionpoverty line of US$0.6 a day in rural areas. Poverty is further compounded byeconomic growth that is failing to create sufficient jobs. Over 300 000 new jobseekers enter the Mozambican labour market every year. Yet Mozambique ischaracterised by high unemployment (22 percent) and high under-employment(over 87 percent), with the vast majority of the labour force engaged in subsistencefarming and informal activities. Mozambique is attempting to remedy joblessgrowth by incorporating employment creation, industrialisation and businessimprovement policies into its most recent policy documents (which include aPoverty Reduction Strategy Paper, Economic Development Strategy andgovernment plans). The government’s overarching economic policy goal is to
KEY FIGURES
Main Urban CentresMaputo (capital), Beira Matola,Nampula
Exchange Rate: 1 US$***
Inflation 2013 | 2014 (est.) | 2015 (prov.) | 2016 (prov.) *
38.34 New Mozambican Metical (MZN)4.2 | 2.4 | 5.1 | 5.6
Population^ | Population growth rate (2013)^Urban population (% of total)^ | Urbanisation rate (% in 2013)^
26 472 977 | 2.4431.93 | 3.28
GDP / capita (current US$)^ | GDP growth rate (annual %)^GNI / capita, Atlas method (current US$) ^Population below national poverty line*Unemployment rate (%)*Gini co-efficient (year of survey)^^HDI (Global Ranking)" | HDI (Country Index Score)”
618.96 | 7.3763054.77.545.66 (2008)178 | 0.393
Lending Interest Rate^Mortgage Interest Rate (%) | Mortgage Term (years)#Credit % of GDP^Average Mortgages % of GDP° Price To Rent Ratio City Centre** | Outside City Centre**Gross Rental Yield City Centre** | Outside of City Centre**Outstanding home loan (% age 15+)##
22.5019.00 | 2533.120.14% (2008)3.62 | 6.7627.6% | 14.79%...
What is the cost of standard 50kg bag of cement (in US$)? #What is the price of the cheapest, newly built house by a formaldeveloper or contractor (in US$)? #What is the size of this house (in m2)? #What is the average rental price for a formal unit (in US$/month)#What is the minimum plot size for residential property (in m²)#
6.00
...
...3 000 – 7 000...
Ease of doing business rank !Number of procedures to register property !Time (days) to register property !Cost (% of property value) to register property !
1276406.90
*** Conmill.com The Currency Converter^ World Bank's World Development Indicators (2014)~ World Bank PovcalNet: an online poverty analysis tool, various years^^ The World Bank's PovCalnet" UNDP's International Human Development Indicators (2014)° Various: Badev et al. "Housing Finance Across Countries: New Data and Analysis" – Unpublished
paper/Hofinet/World Bank## Global Financial Inclusion Database (FINDEX)# CAHF Annual Survey Data (September 2015)! World Bank's Doing Business Survey Data (2015)** Numbeo Online User-Contributed Database

144
2012, prime lending rates have only fallen to 14.8 percent in 2015 from 19 percentin 2011 (EIU, 2015).
Most of Mozambique’s commercial banks offer a mortgage product, but themortgage loan to GDP ratio is very low measuring 0.6 percent. Analysis by UN-Habitat (2013) on the extent of housing lending suggests that banks’ mortgageportfolios represent 8.3 percent of total loans to individuals and 2.24 percent oftotal outstanding loans. The conditions for mortgage loans are generally restrictivereflecting the banking industry’s great cautiousness. Loan-to-cost maximums aregenerally set at a minimum of 70 percent. Commercial banks request anotherproperty or fixed assets as collateral for a transition loan at least until theconstruction is 80 percent finished, and thus can then be mortgaged. Mortgagesin Mozambique have a maturity of 12 to 25 years. Approximately only 15 percentof residential properties with mortgages have legal titles. For housing loans, theaverage annual effective interest rate is calculated based on the banks’ prime rateof 15 percent plus a mark-up of up to five percent depending on the client’scredentials (typically 19 percent). The minimum loan amount is aroundMZN300 000 (US$10 000).
To make housing loans more accessible, some banks offer property leasing or rent-to-buy schemes in which the property is made available on a rental basis to atenant who has an option to buy the property at the end of the lease. The Fundfor Housing Promotion (FFH) has agreements with several banks to makemortgage loans accessible for potential beneficiaries of its projects. Banks alsooffer construction and renovation loans – these have shorter terms, sometimesthree to five years, made available as unsecured loans and therefore at a higherinterest rate of about 22.5 percent. In some cases, the lender requires a guaranteeor other form of collateral. Developer finance is considered to be too limitedand expensive, with rates up to 23 percent.
Although the microfinance sector is vibrant, only five microfinanciers offer housingmicrofinance as a product. There have been significant changes in this industryover the past few years and the depth of financial intermediation remains low.Currently only Socremo, at a very small scale, offers housing loans for homeimprovement and rehabilitation purposes.
Affordability
The country’s new found mineral wealth is the main reason that house priceshave soared. However, there are several additional reasons for high housing costssuch as: high construction costs (more than 30 percent higher than in South Africa),high material cost, low labour productivity and high financing costs. Most materialsare imported with only the most basic materials (such as cement and wood)sourced locally. Furthermore, the lack of basic infrastructure adds to the totalcosts of the development. Plots are often far from main roads and not linked tothe public water and electricity network. Plots that are already more developedare transferred at extremely high prices (even though the law clearly outlines that
land is government owned and may not be acquired, however the right to use theland (DUAT) may be passed on).
Furthermore, although the minimum wage was revised to MZN3 010 (US$79) inApril 2014, the majority of population earns less than US$60 a month. Banksoffering mortgages have a minimum loan amount of MZN300 000 (aboutUS$7 824), which is out of reach for the majority. At the current rate of19 percent, it would be affordable only to a household with a monthly income ofabout MZN45 000 (US$1 174). An analysis by UN-Habitat suggests that a netincome of MZN46 500 (about US$1 213) is typical for a middle high incomefamily. At that income, the maximum mortgage that could be achieved (assumingan 80 percent loan-to-value ratio over 20 years at 19 percent interest) is aboutMZN 1.1 million (US$28 690). The family would need to save a further third ofthe purchase price to cover the deposit requirements, registration costs and taxes,and valuation and origination fees.
With regard to the lack of affordable housing and the lack of access to finance,most families rely on their own savings, local materials and self-build for housingconstruction. UN-Habitat suggests Mozambican families have invested at leastUS$3 billion in informal housing in Maputo alone. Housing affordability is achallenge also in the rental market, where high demand and the lack of adequatesupply has resulted in highly inflated prices across all sectors, with owners settingsky-high monthly rental i.e. US$1 500 – US$10 000 per property in CentralMaputo.
Demand for housing far outstrips supply, so it might be a while before housingand rental prices stabilise. That being said, the housing market in the country issimply too difficult for low income earners to access.
Housing supply
Estimates by the FFH point to a housing deficit of two million units and over13.5 million people – the equivalent of 2.5 million families or 60 percent of theMozambican population live in substandard housing; and approximately 70 percentof households in Maputo live in informal housing. In Maputo alone, the demandhas been estimated at 23 000 units over the next five years in the areas of Beixa,Museu, Polana, Sommerschield I, Sommerschield II and Marginal neighbourhoods.Only 4 500 new housing units are expected to enter the market in central Maputoover the same period. Furthermore the housing deficit is also felt in otheremerging economic centres in the country such as Tete, Namoula and Pemba.Over the next five years, housing demand in Nacala is expected to grow to 4 475units and 6 500 units in Pemba.
There is very limited current investment in the low-cost housing sector, as superiorreturns can be achieved on high-end projects. Low-cost housing developers arealso put off by the need to build the supporting major transport and services
> $50 000
$25 000 – $50 000
$14 000 – $25 000
$8 000 – $14 000
$5 000 – $8 000
$3 600 – $5 000
$2 400 – $3 600
$1 600 – $2 400
$800 – $1 600
<$800
- - - Average income needed for the cheapest newly built house by a formal developer, 2015
- - - Average annual urban household income, 2014
MOZAMBIQUE
$16 169
$2 693
Rural | UrbanAnnual household income US$
No. of households (thousands) 2000 1500 1000 500 0 500 1000

Africa Housing Finance Yearbook 2015
145
infrastructure to service new sites, the lack of government support for low-costhousing schemes, and the limited ability of low income households to accessaffordable finance. While very few private projects aim to deliver affordablehousing, Casa Jovem in Costa de Sol Maputo is often mentioned as one suchexample. Casa Jovem is a 36 hectare housing project under development on theoutskirts of Maputo. The project comprises 1 680 flats in four to eight storeywalk-ups, and 300 houses. To date, 100 flats have been constructed. However,priced at US$47 000 – US$130 000, it is out of reach for most Mozambicans.
In its five-year Plan (2010-2014), the government committed to building 100 000houses and servicing 300 000 plots of land by 2014. According to local newssources, the government had only delivered 1922 houses by the end of 2014. Thehousing target in the new five-year plan (2015-2020) is very modest with the stateonly committing to build 35 000 by 2019 (7 000 a year). Through the ‘HousingAction Plan for the Young, Civil Servants, and Old Combatants’, these broaddelivery plans get more detail: 20 percent of the planned housing delivery is to becompleted by government, 30 percent by the private sector and 50 percent byresidents themselves through self-construction. Only five percent of houses areto be fully subsidised. The FFH will take the lead in the implementation of theaction plan and will collaborate with all municipalities. The FFH foresees thedevelopment of public private partnerships to diversify its financial resources.
Over the years, there have been some noteworthy public private partnershiparrangements. This includes the construction of the project Intaka (which beganin 2012), with a scope of 5 000 houses in the southern city of Matola, inpartnership with a Chinese construction company. Unit prices are expected to beUS$63 000 – US$158 100. An agreement with the Chinese government promiseda further 5 000 houses in other cities. A partnership with a Spanish constructiongroup will see the development of 4 500 houses in three provinces, with pricesstarting at US$30 000 in Maputo City Tower, where construction was launched inApril 2014. In 2013, FFH launched the construction of 100 houses in Mutaunha,(in Nampula) financed through the sale of houses in the Olympic Village.Furthermore, according to a 2014 announcement, 240 apartments are expectedto be constructed during the second phase of construction. The project is valuedat US$30 million and will increase the housing stock of the Olympic Village toabout 1 100 homes. Other developments include a US$217 million facilityprovided through three credit lines by the Indian government, in 2013, that willfund public works and housing projects. The projects will include the constructionof 1 200 houses in Tete (400 Units), Zambézia (400 units) and Cabo Delgado(400 units) provinces. This project was put out to tender in September 2014. Inaddition, FFH signed agreements for a new social housing project in the Provincesof Cabo Delegado, Nampula, Tete and Maputo, where the Macau CharlstrongEngenharia, Technologia e Consultoria, Ltd, will construct 50 000 housing units ata total cost of US$5.5 billion. According to its website, the South African company,Sasol, in collaboration with Companhia Mocambicana de Hidrocarbonetos (CMH)and the International Finance Corporation (IFC) is aiming to deliver 97 houses inVilanculo on 22ha of land. These houses are intended for their staff complementworking there, the majority of which being Mozambicans.
Despite the multitude of new housing developments initiated, the pricing of theseunits only make them affordable to middle and higher income earners and civilservants. But they are still meeting otherwise previously unmet demand.
Going forward, with construction of the new ring road underway in Maputo, hugetracts of land in the north and the north-west of the city will open up fordevelopment and are expected to create a much needed opportunity to createbig scale affordable housing projects.
Property markets
The state owns all land in Mozambique. Land rights may not be sold, mortgagedor otherwise alienated. The Land Law recognises a “use right to land”, known bythe Portuguese acronym DUAT (directo de uso e aproveitamento dos terras).Any investment made on the land itself, is considered to be private property andcan be bought, sold or mortgaged.
Land use rights are obtained by inheritance, occupation, state grant, purchase orlease. In urban Mozambique most residents access land through the land market(62 percent), either obtaining land on the formal market by buying or leasing use-
rights held by DUAT holders or, more commonly, obtaining use-rights on theinformal markets. Other means of accessing land include customary rights systemssuch as inheritance or borrowing (19 percent), state allocation (13 percent) andoccupation (6 percent). Most rural land is held by communities, which haveperpetual DUATs based on their traditional occupancy. Foreign persons andentities with local residences may obtain DUATs in connection with approvedinvestment projects. Some developers are cautioned by the fact that land can beleased for 50 years with an option of renewal. According to the Global HousingIndicators, only 20 percent of properties are registered. It takes an estimated 40days to complete the six procedures involved in registering property and theprocess costs an estimated 6.9 percent of the property value (USAID, 2011).
The registration and cadastre systems still only cover limited urban areas. Thislimits the amount of formally financeable land through mortgages and contributesto a general lack of clarity on property titles. Secondary sales are also limited.Apart from the fact that they are difficult due to the protracted procedures andconsents necessary because of leasehold tenure, owners also avoid the risk offorfeiting current rights in the process of sale (fearing, for example, that the titlemay be questioned). Some rented housing stock converted to private ownershipis emerging from government’s policy since 1991 of divestiture to existing tenantsat concessionary prices and interest rates. The majority of this stock has alreadybeen sold.
A country specific property market issue pertains to the occurrence of“downward raiding” by higher income earners of plots occupied by low incomegroups due to the unmet demand for suitable land for housing. As a result localbuyers are pushed out of the cities into cheaper areas. The ensuing land scramblehas caused further problems as some local Mozambicans have faced losing theirhomes (especially those without a formal title to their houses).
Finally, using land as collateral is limited. Collateral enforcement through the regularcourt systems takes a long time (on average three years) and there are manyinstances of fraudulent titles.
Policy and regulation
One of the major constraints in Mozambique’s property market has beenlegislative. Many of the laws governing property predate as far as the 1960s andhave not been improved since then. Furthermore, there is no single HousingAgency in Mozambique. DNHU (the National Directorate for Housing andUrbanisation) and FFH (the Housing Promotion Fund, both under the sameministry, MOPH; "Ministério das Obras Públicas e Habitação") are the twogovernment agencies with specific mandate for housing. With the reorganisationof the MOPH in 2010, the different departmental roles were clarified so thatDNHU is in charge of the politics side and FFH has the mandate to act as animplementation agency of the housing policies. At the same time, within theMOPH, a Directorate that is responsible for the building materials was alsocreated.
The list below provides a brief overview of the main policy and regulationframeworks governing the housing sector.
n Article 109 of Mozambique’s Constitution (2004): States that all ownershipof land vests in the state and all Mozambicans shall have the right to use andenjoy land as a means for the creation of wealth and social well-being. TheConstitution further provides that the state shall recognise and protect landrights acquired through inheritance or by occupation, unless there is a legalreservation or the land has been lawfully granted to another person or entity.
n The Land Law (1997): The 1997 Land Law reasserts the state’s ownership ofland and provides that individuals, communities and entities can obtain long-term or perpetual rights to use and benefit from land. The Land Law protectsthe customary rights of communities to their traditional territories andrecognises rights obtained through traditional and good-faith land occupancyas equivalent to rights obtained by government grant. Community land userights are legally equivalent to rights granted by the government to individualsand entities. Women and men have equal rights to hold land. Nationals haveunrestricted rights of access to land; foreign individuals and entities must havelocal residence and an approved investment plan.

146
n Rural Land Law Regulations (1998): Provides rules for the acquisition andtransfer of use-rights. The process for identifying and recording the rights oflocal communities and good-faith occupants is governed by the 2000 TechnicalAnnex to the Land Law Regulations.
n National Land Registry and Real Estate Cadastre (Decree No. 1/2003):Established new provisions for the registration of inherited land use rightsand secure rights to customary rights-of-way.
n Urban Land Regulations (2006): Apply to existing areas of towns and villagesand to areas subject to an urbanisation plan. The regulations govern thepreparation of land use plans, access to urban land, and the rights andobligations of owners of buildings and DUAT holders.
n Financial Sector Development Strategy 2013-2022 (MFSDS) (2013): Providesan overall vision and a comprehensive and detailed roadmap for reforms inthe financial sector. The strategy foresees the elaboration of a policy onhousing finance, which will address necessary reforms for the developmentof the financial market for construction and purchase of housing. A first stepin improving housing finance has already been implemented by revising thestatus of the FFH, giving it access to a variety of refinancing resources.
n Economic and Social Plan and the Slum Upgrading Strategy (2012): Both addemphasis to housing and urban infrastructure upgrading.
n Housing Policy (2011): The policy foresees the creation of adequate housingat an affordable price for all social groups. The policy recognises the need toimprove land management, facilitate access to infrastructure as well aspromotion of housing construction and availing financing resources. Ithighlights the need for the creation of institutional structures which will allowcoordination of the joint effort of line ministries in implementing necessaryreforms.
Opportunities
Mozambique is experiencing healthy rates of economic growth and foreigninvestment. Analysts suggest that the development of the natural gas and coalreserves in Mozambique should have a dramatic impact on GDP growth andcreate opportunities in the industrial and commercial sectors. While this has, andwill continue to support, a boom in the higher end property market, the need forgreater supply of affordable housing is significant. Housing finance is largely cash-based, and there is a dire need for long-term housing finance.
Therefore, there are enormous opportunities for both the public and privatesectors to strengthen the development of housing finance, as well as increase itssupply. Possible initiatives include expanding tailored housing loan products to lowincome groups; and introducing innovative and competitive housing solutions andproducts for the poor. There is enormous need and potential for housingmicrofinance. This is due to a number of reasons such as: a pre-existingmicrofinance industry, self-build being an accepted building method, provision ofstarter plots by the Housing Promotion Fund and secure tenure among urbandwellers.
Furthermore, given the price escalations of building materials, opportunities existregarding the use of alternate approaches, technologies and materials that couldhelp reduce the need for imported building materials and speed up the deliveryof affordable housing.
Sources
African Economic Outlook (2015). Mozambique 2015. AfDB, OECD & UNDP.Allen, C. and Johnsen, V. (2008). Access to Housing Finance in Africa: Exploringthe Issues (No. 7) Mozambique. Paper commissioned by the FinMark Trust withsupport from Habitat for Humanity.African Union for Housing Finance, (2014). Mozambique Property Boom.Financing Housing in Africa, Issue 35, May 2014.Bank of Mozambique (2014), Economic Review and Inflation Outlook July 2014.Broll (2014), The Broll Report 2014/2015.Cordero, L. (2013). Overview and Trends of Housing Finance in Mozambique.UN-Habitat.EIU (2015). Country Risk Service: Mozambique, August 2015.Global Real Estate Institute, 2014 Africa GRI 2014: Africa's Most Senior RealEstate Event, Nairobi – 18 & 19 June 2014, Discussion summaries provided byMBA students of the Department of Real Estate and Construction Management(RECM) from the University of Nairobi.Habitat for Humanity, 2011. The Global Housing Policy Indicators AssessmentTool, 23 May 2011.Ministry of Finance (2013) Financial Sector Development Strategy, Ministry of Public Works and Housing (2011) Housing Policy and Strategy forMozambique.Ministry of Planning and Development (2010). Poverty and Wellbeing inMozambique: Third National Poverty Assessment (2008/09).Prime Yield (2013) Guide to Property Investment in Mozambique.PWC (2015) Real Estate: Building the future of Africa, March 2015.Standard Bank (2014), Monthly economic newsletter, Edition September 2014.USAID (2011), Property Rights and Resource Governance: Mozambique.USAID Country Profile.World Bank (2014). Doing Business 2013: Mozambique.
Websites
www.afdb.org www.africaneconomicoutlook.org www.africanreview.com www.allafrica.com www.bancomoc.mz http://www.clubofmozambique.com www.finscope.org.za www.globalcement.com http://globalhousingindicators.org www.howwemadeitinafrica.com http://propertymaputo.comwww.mozambiqueinformation.com www.reuters.com www.theeconomist.com www.unhabitat.org www.ventures-africa.com www.worldbank.org

Africa Housing Finance Yearbook 2015
147
Namibia
small and medium-sized enterprises. Furthermore, there is Development Bank ofNamibia responsible for financing development infrastructure, one savings bank(Nampost), an ABSA Representative Office, 16 insurance companies and 297microlenders. Namibia’s banks are regulated by the Bank of Namibia (BoN orCentral Bank) while insurance companies and microlenders and regulated by theNamibia Financial Institution Supervisory Authority (NAMFISA).
The banking sector recorded an increase in the financial market share growingfrom 40 percent in 2013 to 42.9 percent in 2014. Traditionally, lending tohouseholds and corporations has been a significant part of bank credit and hasbeen increasing, with about 34 percent of the banks’ total assets being in the formof mortgages in 2014.
Banks are well capitalised and highly profitable even though, according to theEconomist Intelligence Unit (EIU) (2015), banking institutions are vulnerable toshock in the property market such as rises in interest rates or fall in house prices.According to NAMFISA (2015) the household debt to disposable income (83.9compared to 87 in 2014) remains an area of concern especially for law makersdespite a low level of NPLs – 1.5 percent of gross loans recorded in 2014 from1.3 in 2013. The concentration of lending in mortgages heightens the bankingsector’s vulnerability to shocks in the property market. Mortgage loans rose by12.2 percent in December 2014 from 13.0 percent in December 2013 thereforebearing a huge impact on the household debt which increased from 11.1 percentin December 2013 to 15.0 in December 2014.
Overview
Namibia is a middle income country in Southern Africa, with the GDP per capitaof US$5 719 in 2015. Namibia is one of Sub-Saharan Africa's most stablecountries, as well as one of its most attractive investment destinations.
The country recorded a slight increase in the real GDP growth which strengthenedfrom five percent in 2014 to 5.5 percent in 2015. This steady increase is forecastedto strengthen further over the short to medium term. However, the economyportrayed an improvement in agriculture, construction and the utility sectors.
The bulk of Namibia’s imports, including most food products, are sourced fromSouth Africa. As a result, domestic inflation will remain heavily influenced byinflationary trends in South Africa. According to the Bank of Namibia website(2015) the inflation rate for Namibia was recorded at 3.30 percent.
Namibia suffers from relatively high rates of unemployment, and while this hasbeen improving over the past few years, it still stands at 28.1 percent, representinga 2.9 percent increase from the 27.4 percent recorded in 2014. Furthermore,Namibia has a Gini coefficient of 0.59712 making it one of the most unequalsocieties in the world. In Namibia, the richest 10 percent earn 107 times theincome of poorest 10 percent (compared to 16 times in the US). The ratiohighlights the fact that Namibia is effectively two economies – one modern witha skilled workforce of around 200 000, and the other based on subsistence farming,employing the majority of the populace who live below the poverty line, currentlyat 28.7 percent.
Access to finance
Namibia’s financial banking system, with strong links to South African financialinstitutions, is mature and efficient. There are 7.5 commercial bank branches per100 000 adults and 50 ATMs per 100 000 adults in Namibia. Namibia scores highin terms of ‘ease of getting credit’, in 61st place out of 189 countries, althoughdown 11 places from 50th place recorded in 2014.
There are four large commercial banks in Namibia, all privately owned. Three ofthe banks (Nedbank, Standard Bank and FNB Namibia) are subsidiaries of SouthAfrican banks; the fourth (Bank Windhoek) is Namibian-owned. EBank, abranchless commercial bank began operations in November 2014 and is Namibianowned. FIDES Bank Namibia, a micro-credit bank and the SME Bank focus on
KEY FIGURES
Main Urban CentresWindhoek (capital), Walvis Bay,Swakopmund
Exchange Rate: 1 US$***Inflation 2013 | 2014 (est.) | 2015 (prov.) | 2016 (prov.) *
12.58 Namibian Dollar (NAD)6.0 | 5.3 | 4.1 | 5.0
Population^ | Population growth rate (2013)^Urban population (% of total)^ | Urbanisation rate (% in 2013)^
2 347 988 | 1.9245.68 | 4.13
GDP / capita (current US$)^ | GDP growth rate (annual %)^GNI / capita, Atlas method (current US$) ^Population below national poverty line*Unemployment rate (%)*Gini co-efficient (year of survey)^^HDI (Global Ranking)" | HDI (Country Index Score)”
5 719.58 | 4.485 82028.728.1?>61.32 (2009)127 | 0.624
Lending Interest Rate^Mortgage Interest Rate (%) | Mortgage Term (years)#Credit % of GDP^Average Mortgages % of GDP° Price To Rent Ratio City Centre** | Outside City Centre**Gross Rental Yield City Centre** | Outside of City Centre**Outstanding home loan (% age 15+)##
8.7010.50 | 2047.5418.21% (2011)12.98 | 3.037.71% | 32.97%5.13
What is the cost of standard 50kg bag of cement (in US$)? #What is the price of the cheapest, newly built house by a formaldeveloper or contractor (in US$)? #What is the size of this house (in m2)? #What is the average rental price for a formal unit (in US$/month)#What is the minimum plot size for residential property (in m²)#
8.04
18 56342464300
Ease of doing business rank !Number of procedures to register property !Time (days) to register property !Cost (% of property value) to register property !
8885213.80
*** Conmill.com The Currency Converter^ World Bank's World Development Indicators (2014)~ World Bank PovcalNet: an online poverty analysis tool, various years^^ The World Bank's PovCalnet" UNDP's International Human Development Indicators (2014)° Various: Badev et al. "Housing Finance Across Countries: New Data and Analysis" – Unpublished
paper/Hofinet/World Bank## Global Financial Inclusion Database (FINDEX)# CAHF Annual Survey Data (September 2015)! World Bank's Doing Business Survey Data (2015)** Numbeo Online User-Contributed Database?> Namibia Statistics Agency Namibia Labour Force Survey 2014 Report
148
The infrastructure to facilitate mortgage lending is fairly well developed. In termsof the World Bank’s 2015 Doing Business Report, Namibia scores four out of apossible eight on the ‘depth of credit information’ index, as the country has threeprivate credit bureaus that include data on about 64.3 percent of the adultpopulation. Government has issued a bill on the Supervision of FinancialInstitutions, which includes the licensing and regulations of the credit bureau sector.What is lacking is a collateral registry system unified geographically and by assettype.
Some microlending for housing purposes is on the increase through organisationssuch as the Shack Dwellers Federation of Namibia (SDFN), a communityorganisation that aims to improve living conditions of poor Namibians by providingits members with building loans ranging from N$20 000 (US$1 467) to N$ 35 000(US$2 568). The loans are repayable within a period of 11 years at an interest rateof 0.5 percent per month. The government’s Financial Sector Strategy also includesimproved consumer literacy and protection, and local ownership in commercialbanks. Pension-based lending for housing is allowed, although concerns have beenraised that part of the money is diverted for consumer rather than long-termhousing spending. Better enforcement for correct use is needed.
To promote enhanced access to financial services, Namibia launched a FinancialSector Charter (FSC) in May 2009, which will be in effect until 31 December 2019.The FSC is a voluntary code of conduct for the transformation of the Namibianfinancial industry. Among its objectives are creating greater access to andaffordability of financial products and services. There are specific targets regardinglending to formerly disadvantaged members of the population, which shouldencourage even greater lending by the financial sector. The FSC was followed bya Financial Sector Strategy 2011-2021.
FinScope Namibia 2014 reports that the number of people who are unbanked hasdecreased from 50 percent in 2007 to 31 percent in 2012, with usage of insurancedoubling over the period. Transaction banking and savings also increased by about30 percent. Use of credit and loans went up by five percent, from 15 percent in2007 to 20 percent in 2011. The FSC targets anticipate that 74 percent ofNamibians will have access to financial service by 2019. In 2012, the FSCdeveloped new legislation to establish a regulatory framework for tier II banks,which will serve as microfinance oriented banks with a special focus on serving thelow income segment of society.
The Mass Housing Development Programme (MHDP) was launched andimplemented by the Government of the Republic of Namibia in 2013 aimed atincreasing investment in the affordable housing sector to increase the productionof the housing stock and significantly increase the supply towards meeting thedemand for housing in the country. The increase in the housing supply will resultin the reduction of the prices for houses in the long run as the economic principleof supply and demand dictates.
Furthermore, in order to ensure that the government can deliver on its affordablehousing delivery targets, the Presidency has proposed that the funding model aswas proposed in the mass housing Blueprint will be used for the implementationof the Mass Housing Development Initiative including financing modalities tailor-made to resource the sub-programmes. Private developers play a vital role in thehousing construction industry and therefore have been encouraged to refrainfrom charging exorbitant and inflated prices.
The model consists of four major sources of funding, namely:
1) Government grants and subsidies: The government will provide, within itsresource capacity, annual grants to households in the income bracket ofbetween N$1 500 (US$11 049) and N$4 900 (US$36 092) per month. Tostart with, government subsidies will mainly go towards land development,building input cost mitigation, rural sanitation and programme management.Current government grants provided under 2013/2016 MTEF for housingprojects will be diverted to the mass housing development programme andwill serve as a start-up capital to kick start the programme.
2) Public Private Partnerships Significant financial resources will be mobilisedthrough public private partnerships to be entered into between the NationalHousing Enterprise (NHE) and private sector entities. The partnership model,which is already being pursued by the NHE in its current capital financing
operations, entails the mobilisation of funding through turnkey solutions,bridging finance and co-end user financing. Turnkey funding solutions areprovided by companies that bring in finances and have the technical capacityto construct, whereas bridging financiers are those that provide funding toenable the roll out of projects and immediately recoup their investment at thecompletion of such projects. End-user financing is provided by commercialbanks that have entered into partnerships with NHE to finance part of theclients, while NHE finances the remainder of the clients. The first phase of theprogramme is being implemented using conventional building materials (brickand mortar) whereas alternative building materials may be considered insubsequent phases.
3) Debt financing by local and foreign financial institutions. The option of debtfinancing through conventional way of borrowing will also be pursued infinancing part of the programme. In certain instances, borrowing by NHEwill require government support through the provision of a guarantee orother facilitative support.
4) Savings of households involved in SDFN housing schemes: The utilisation ofsavings of households involved in the Shack Dwellers Federation of Namibia(SDFN) housing saving schemes will also be used to partly fund land servicingand people housing processes component of the programme. An annualbudgetary allocation of N$50 million (US$3.68 million) will be made to theTwahangana Fund operating under the auspices of SDFN assisted byNamibian Housing Action Group (NHAG).
Affordability
According to the March 2015 First National Bank (FNB) Housing Index, a medianhousing unit costs N$842 000 (about US$65 154), up from N$774 000(US$59 923) by a private developer in June 2014, while a small-sized propertycosts N$280 000 (US$18 563) by a public developer (NHE). In terms ofaffordability at the current interest rate, households need to earn N$10 500(US$70 743) to afford a small house and N$38 700 (US$2 989) for a mediumhouse. The average price of a house financed by FNB costs NS$720 000 (aboutUS$65 498). As 93 percent of the population earn less that N$7 000 (US$51 362)a month, the majority of the population cannot afford mortgaged housing in urbancentres across the country.
A significant component of this cost is land and services accounting for over halfof the cost. The average price per square metre for construction of a house by agovernment appointed contractor is approximately N$5 000 (US$36 687). InJune 2014, the Ministry of Works and Transport compiled a new mass housingprice guideline that proposes lower charges per square metre to curb theexorbitant charges made by many companies and middlemen who won tenders.Part of the recommendations was that companies reduce their prices by between15-30 percent to get the charge to around N$5 000 (US$36 687) per m2 asoriginally requested.
Despite these interventions, Namibia remains the second only to Dubai, in housingprice increase in the world. The status quo has prompted a section of disgruntledyouth lead by expelled Swapo Youth leader, Job Amupanda, to form the AffirmativeRepositioning Movement aimed at restoring the dignity of Namibian youth throughaccess to serviced and affordable land. ARM threatened to grab land if theirdemands were not met by 31st July 2015. Government engaged the group a weekbefore the set deadline and together agreed to service 200 000 plots under theMass Land Servicing Programme (MLSP). This has brought back a sense of calmand hope in the country. However, until such time that such agreement is realised,housing supply remains low and therefore increase the already high demand forhousing.
Housing supply
To date, the national housing backlog is estimated at over 100 000 housing units,which is growing at an annual rate of about 3 700 units. According to FinScopeNamibia 2011, the majority of Namibians claim they own their housing, althoughthe majority cannot prove this with a title deed. Only 24.3 percent say they boughttheir home; the majority (62.4 percent) say they built it themselves. A further11.8 percent inherited their homes. Some 38 percent funded the ownership(purchase or construction) of their housing themselves through savings. Anadditional 36 percent said that their housing did not cost anything, as they hadused found materials to construct the dwelling which suggests a high level of

Africa Housing Finance Yearbook 2015
149
informal housing. 80 percent of households have access to water within their yardand only 52 percent of Namibians have access to some form of toilet.
The main goal of the MHDP Is to construct 185 000 units by 2030 averaging10 000 units per year. The programme has faced funding challenges whichgovernment is currently addressing. Although the MHDP has produced morethan 1 000 units between March 2014 and April 2015, the national backlogremains relatively high in excess of over 100 000 units.
Since 2003, the NHE has built about 450 houses per year for its target market:households earning between N$5 000 (US$366) and N$20 000 (US$1 467) permonth. Apart from constructing houses, the NHE has also been involved inservicing land in a number of local authority areas, resulting in a total investmentin service infrastructure of about N$145 million (about US$10.7 million) between2006 and 2012. Small NHE houses cost about N$275 000 (about US$20 235),on average inclusive of land cost. NHE loans are offered at a maximum of prime(10.25) minus one percent.
The private sector continues to engage with the demand for affordable housing.To this end, NHE has partnered with FNB Namibia, Standard Bank and BankWindhoek which partnerships have assisted the institution with the necessaryliquidity to develop housing more quickly. As a result of such partnerships, NHEhas been able to implement in-house projects in towns such as Eenhana,Swakopmund, Ongwediva, Windhoek, Luderitz and Otjiwarongo to the value ofmore than N$365 million (about US$26.7). Most of these projects have beencompleted while others are near completion. In the NGO sector, SDFN and itsservice NGO, NHAG, are active in 84 cities across Namibia and has since secured1 621 hectares, providing over 6 000 families with secure tenure and 1 576 ofthese with toilets, water and electricity.
Property markets
According to the World Bank’s 2015 Doing Business Report, Namibia ranks 61st
out of 189 countries for ease of registering a property, a significant rise of 117places from 2014s ranking of 178. On average the eight procedures involved inregistering a property take 52 days and cost 13.8 percent of the property value.In mitigating risks associated with quality, Namibia made transferring propertymore difficult by requiring a building compliance certificate before conveyancingcan go ahead. The limited availability of serviced land is mainly due to a lengthyand outdated approval process for proclamation, surveying, subdivision andregistration of land. According to the Presidency (2013), the various cumbersomeprocedures applicable in the process of acquiring a property in Namibia do havea bearing on escalating property prices of the limited housing stock available. Thegovernment in 2015 resolved to amend such processes in accordance with theagreement reached with the Affirmative Repositioning Movement to fast trackland delivery.
The scarcity of available serviced land is both slowing down the process of housingdelivery and pushing up the prices of serviced land, and is the key challenge facingthe housing sector. Land prices saw an increase of 109 percent month-on-monthin May 2014 and averaged N$122 000 (US$8 998 for a 300m2 serviced standand is therefore likely to add inflationary price pressure to new housing deliveryfurther down the line. Land auctioning, the main technique used by localauthorities to dispose of land until recently, is yet another contributing factor to therising property prices.
Policy and regulation
According to the Presidency (2015) the Vision of the Namibian Government is toeradicate poverty in its entirety by, among others, providing affordable housing toall Namibians in line with Vision 2030 through increased investment in the housingportfolio and in the process eliminate all shacks that are prevalent in variousregions and local authority areas in Namibia.
Within the context of the 4th National Development Plan (NDP4), governmentundertakes to have a “robust and effective housing delivery programme whereaffordability is the key feature of the programme”, a concept that has seen theinitiation of the MHDP as well as the MLSP. If these programmes are implementedeffectively, government may attain its objective of housing 60 percent of itspopulation by the end of NDP4 (2016/17). It is likely that extension on deadlinesmay be sanctioned given unexpected delays experienced especially in theimplementation of the MHDP.
In 2013, a National Housing Technical Committee was also established to developa mass housing development strategy. Spanning a number of governmentdepartments, the committee submitted its proposal to the Ministry of Regional andLocal Government, Housing and Rural Development in March 2013. A memberof the group, the NHE highlighted limited access to affordable, serviced land, theinflexibility in the current land tenure system, legislative and policy constraints thatslow delivery and a rapidly appreciating property market as some of the challenges.The proposed plan sets out a differentiated funding model to cater for differenteconomic and social segments of the Namibian population, drawing ongovernment, private sector and household financial resources. A N$2.9 billion(US$212 million) budget was earmarked for allocation to the Ministry of Regional,Local Government, Housing and Rural Development to cater for the servicing ofland and improved sanitary standards in urban, peri-urban and rural areas. Theprogramme has been characterised by funding challenges which government isaddressing by assessing local and foreign markets for potential institutions toprovide affordable funding to the programme.
Opportunities
Over the past two years, government has showed renewed interest in addressingthe housing needs of the country by allocating more resources into the housingportfolio. The MLSP is expected to contribute to the enhancement of the
> $50 000
$25 000 – $50 000
$14 000 – $25 000
$8 000 – $14 000
$5 000 – $8 000
$3 600 – $5 000
$2 400 – $3 600
$1 600 – $2 400
$800 – $1 600
<$800
- - - Average income needed for the cheapest newly built house by a formal developer, 2015
- - - Average annual urban household income, 2014
NAMIBIA
$15 244
$8 427
Rural | UrbanAnnual household income US$
No. of households (thousands) 60 40 20 0 20 40 60

150
affordability capacity of many Namibians as the cost of servicing this land will besubsidised by government (100 percent). This will impact positively on the endprices of houses. The MHDP and the MLSP will in no doubt have a positive impacton the social well-being of most Namibians.
Regarding alternative building methods, a trial by NHE in which land was offeredto alternative building technology developers to showcase their products provedthat this building method does not necessarily offer cheap products as prices weregenerally the same and in some instance more expensive. The only advantagethat could be drawn from ABTs is the time frame for delivery of houses which isfaster compared to traditional building methods. Therefore, construction usingtraditional brick and mortar may dominate the housing market in the foreseeablefuture.
Not much has changed regarding the status of commercial banks as they remainoverexposed to mortgages, which remains an ongoing concern in the economy.Therefore, there have been calls to provide greater opportunities for fundraisingthrough securitisation, for example. This could increase the number of investmentinstruments and deepen the financial sector, as well as enable local authorities toraise the funds necessary for urban infrastructure development and thus increasethe housing provision.
The recognised successes of the Shack Dwellers Federation of Namibia throughits group savings and lending methods, incremental approaches to housing anduse of land laws such as the Flexible Land Tenure System suggest a high potentialfor housing microfinance.
Sources
Bank of Namibia (2014). Annual Report.Economist (2014). EBH employees to get affordable housing, 22 August 2014.FNB (2014). Housing Index: Shift in Housing Mix towards Middle PriceSegment, March 2015.IndexMundi Factbook, Namibia: 2015How We Made it in Africa: Insight into Business in Africa.www.howwemadeitinafrica.com. Immanuel, S. (2014). New Mass Housing Prices, 27 June 2014. NamibianInstitute for Public Policy Research (2010). Housing Policy and Delivery inNamibia.Immanuel, S. (2015, July 27). Uphill task awaits Govt. The Namibia, pp. 2.Kalili, N., Adongo, J. and Larson, T. (2008). Access to Housing Finance in Africa:Exploring the Issues (No. 5) Namibia. Namibia Policy Research Unit. Papercommissioned by the FinMark Trust with support from Habitat for Humanity.Ministry of Finance (2015) Quarterly Economic Update, January 2015.Namibia Financial Institution Supervisory Authority (2014). Annual Report.Namibia Financial Institution Supervisory Authority (2015). Namibia FinancialStability Report.Namibia Statistics Agency (2014) The Namibia Labour Force Survey 2014Report.National Housing Enterprise (2015) Mass Housing Development ProgrammeProgress Report.National Planning Commission (2014). Special Programmes: Housing Sector.http://www.npc.gov.na/?page_id=424The Presidency (2013). Summary of the Blueprint on Mass HousingDevelopment Initiative in Namibia, October 2013.The Presidency (2015). 2015 State of the Nation Address, 21 April 2015.World Bank (2014). Doing Business Report 2014: Namibia.
Websites
www.africaneconomicoutlook.orgwww.allafrica.comwww.bon.com.nawww.dbn.com.nawww.doingbusiness.orgwww.economist.com.nawww.fnbnamibia.com.nawww.hofinet.org www.howwemadeitinafrica.comwww.mfw4a.orgwww.moneyweb.co.zawww.knoema.comwww.nhe.com.nawww.npc.gov.nawww.sdinet.org/country/namibiawww.unhabitat.org

Africa Housing Finance Yearbook 2015
151
Niger
Access to finance
Penetration of formal financial services is very low in Niger. In the past decade,however, Niger has witnessed the establishment of a number of new insurancecompanies, microfinance institutions and commercial banks and an increase inbranches (49 in 2009, and some more recently, in the capital), most of whichbelong to the four largest commercial banks in Niger. The branches areconcentrated in Niamey, the capital, with very few in other main cities. There are11 commercial banks, a bank of agriculture (Bagri) established in 2011 and onemortgage bank (Banque d’Habitat), created early 2011 but still not operating. Thepractice of microfinance in the country is steadily growing, with about 15 activemicrofinance institutions (MFIs). Capital Finance and some others provide housingfinance products, primarily for land purchase. These 15 MFIs reported to the MixMarket (an online repository of microfinance performance data and analysis) in thesecond quarter of 2015, and disbursed a total of US$15.9 million loans to 136 328borrowers. These MFIs also held US$5.7 million in deposits from 321 151consumers in the country. The data provided by Mix Market did not includedeposits and loans disbursed by Asusu SA, one of the most popular MFIs in Niger.However, it is difficult to estimate the amount used for housing.
Prior to 2000, the government of Niger offered housing finance and governmentsubsidised homes to government employees through a public and private ownedcredit and loan institution known as Crédit du Niger (CDN) and through agovernment-owned housing development company called Société Nationale
Overview
The Niger Republic is a landlocked country in the north-western part of Africa.It is bordered by Algeria and Libya to the North, Benin and Nigeria to the south,Burkina Faso and Mali to the west and Chad to the east. It covers 1 267 000 km2
with two-thirds of its land mass desert. The population is concentrated in thenarrow strip in the south where the main economic activities are farming andherding. Only 12.3 percent is arable land and the main cash crops are onion ‘violetde Galmi”, peanuts, sesame and black eyed peas “niebes”. The country is rich innatural resources; uranium, petroleum, coal, gold, molybdenum, tin, phosphates,iron ore, gypsum and salt. In 1993 Niger was the first producer of uranium andthen became third largest producer of uranium in the world in 2012. Also, Nigerstarted producing petroleum in 2012. Among the natural resources only uraniumand petroleum are being exploited. Niger in spite of its resources is among theleast developed countries in the world with one of the lowest humandevelopment index, which, at 0.337 in 2013 and ranking last of 187 countries. Thecountry has suffered from political instability and is still suffering from externalthreats along its borders; conflicts in Mali and Libya and religious conflicts ‘bokoharam’ in Nigeria.
The country’s economic growth slightly improved in 2014 and 2015 as illustratedby the GDP in spite of armed conflicts in the neighbouring countries and threatsfrom ‘boko haram’. The real GDP growth rate in 2014 increased to 6.9 percentas expected from 4.1 percent in 2013 despite security challenges. The growthwas driven mainly by the construction sector, communication, transportation andagriculture which enjoyed a favourable weather and the implementation of thereforms in mining legislation which raises the country’s tax revenue, especially ValueAdded Tax. The trend is expected to continue in 2016 with an estimated GDP rateof six percent.
Niger Republic has a young and growing population, 18 million inhabitants, threemillion live in cities, making the country lightly urbanised compared to othercountries in the region. With a fertility rate of 7.6 children born per woman, oneof the highest in the world, the urban population is estimated to double in 12years and the demand for housing to remain very high.
KEY FIGURES
Main Urban Centres Niamey (capital)
Exchange Rate: 1 US$***Inflation 2013 | 2014 (est.) | 2015 (prov.) | 2016 (prov.) *
593.20 West African CFA1.1 | 0.5 | 1.3 | 1.0
Population^ | Population growth rate (2013)^Urban population (% of total)^ | Urbanisation rate (% in 2013)^
18 534 802 | 3.8718.47 | 5.23
GDP / capita (current US$)^ | GDP growth rate (annual %)^GNI / capita, Atlas method (current US$) ^Population below national poverty line*Unemployment rate (%)*Gini co-efficient (year of survey)^^HDI (Global Ranking)" | HDI (Country Index Score)”
440.72 | 6.9043059.55.131.16 (2011)187 | 0.337
Lending Interest Rate^Mortgage Interest Rate (%) | Mortgage Term (years)#Credit % of GDP^Average Mortgages % of GDP° Price To Rent Ratio City Centre** | Outside City Centre**Gross Rental Yield City Centre** | Outside of City Centre**Outstanding home loan (% age 15+)##
...8.50 | 1514.20.........1.91
What is the cost of standard 50kg bag of cement (in US$)? #What is the price of the cheapest, newly built house by a formaldeveloper or contractor (in US$)? #What is the size of this house (in m2)? #What is the average rental price for a formal unit (in US$/month)#What is the minimum plot size for residential property (in m²)#
10.96
10 958...500 – 3 000200
Ease of doing business rank !Number of procedures to register property !Time (days) to register property !Cost (% of property value) to register property !
1684359.00
*** Conmill.com The Currency Converter^ World Bank's World Development Indicators (2014)~ World Bank PovcalNet: an online poverty analysis tool, various years^^ The World Bank's PovCalnet" UNDP's International Human Development Indicators (2014)° Various: Badev et al. "Housing Finance Across Countries: New Data and Analysis" – Unpublished
paper/Hofinet/World Bank## Global Financial Inclusion Database (FINDEX)# CAHF Annual Survey Data (September 2015)! World Bank's Doing Business Survey Data (2015)** Numbeo Online User-Contributed Database

152
d’Urbanisme et de Construction Immobilière (SONUCI). SONUCI is stilloperating but CDN has been liquidated, and in 2011 was replaced by Banqued’Habitat which to date is still not operating. In 2012, SONUCI developed astrategic partnership with some housing developers to build 2 000 houses by2014. In 2013, construction was under way and each of the three prototypehouses had been built and could be visited by potential clients. Construction is stillunderway in 2015.
A few commercial banks, such as Bank of Africa, Ecobank, Banque Atlantique NigerSA, BIA Niger and Sonibank offer housing loans to employees of privatecompanies. In most cases these companies are the banks’ clients and the loans aresecured by the employer, or are mutual guarantee loans. In 2011, Ecobank and thenational labour union of teachers (Syndicat National des Enseignants du Niger, orSNEN) signed a partnership agreement to finance an affordable housingdevelopment programme for teachers all over the country. Some of thebeneficiaries were awarded their homes in 2012 and 2013. The initiative has hada positive impact in Niger, and other trade unions have developed similar projectswith commercial banks or microfinance institutions. For the first time a tradeunion, Confederation Nigerienne Du Trvail (CNT), has developed a similarprogramme with the exception of accepting non-members of the union toparticipate in the programme as long as they meet the eligibility criteria.
Mortgage financing is still in an embryonic stage due to the low average incomeof employees in Niger, as well as other constraints, such as the low percentage ofthe population who are employed. There is no mortgage bank in Niger, howeversome commercial banks, as stated above, offer housing loans under certaincircumstances such as having fixed employment for an individual seeking loan withthe employer as a collateral and having a partnership or other agreements fordevelopers or institutions in the housing industry. In most cases the down paymentor requirement is a minimum of 10 percent-25 percent of the loan. The interestrate is between 8 percent and 10 percent. Apart from banks and other formalenterprises some private but informal housing promoters use their personal fundsto build houses for low income and higher income brackets for rentals. Otherforms of housing finance include personal savings, remittances and family assistance.
As with the majority of the West African Economic and Monetary Union countries,long-term funding remains a major challenge for Niger’s housing market.Nevertheless, there are opportunities for developing national and regionalmortgage banks and credit bureaux.
Affordability
Access to mortgage finance is extremely limited, and when available, interest ratesand loan tenure render the cost of borrowing very high. As such, the majority ofthe population cannot afford housing. The smallest mortgage available is CFAFrancs 6.5 million (about US$14 444), which, at an interest rate of 10.5 percentand repayable over seven to 15 years, would require a monthly repayment of
US$129 to US$218. About seven percent of the country’s population earn belowUS$60 a month (or US$2 a day), which makes even the smallest mortgageunaffordable. The high cost of borrowing in terms of interest rates also contributesto the low mortgage affordability in the country. Only about 22 percent of salaryworkers (representing less than one percent of the entire population), in mostcases high-level government officials, and to some extent middle management staffin private companies and international organisations have access to housing finance.
The majority of the population in the urban areas rent their homes. Rental homesare provided primarily by informal housing promoters and SONUCI. Rent variesaccording to the quality and location of homes. It ranges from the equivalent ofUS$150 to US$3 000 a month in Niamey. Other forms of rentals include thepopularly known ‘rooms’ or ‘room and parlour’ arrangements. These are found allover Niger, especially in the popular streets of the capital, and the average rent isbetween US$20 and US$100 a month. At present no company or institutionprovides rentals on a larger scale, not even SONUCI – that used to do so in thepast. Additionally, less than 0.1 percent of the population has access to governmentsubsidies for housing due to the fact that only salaried workers (and particularlygovernment employees) qualify for subsidised houses.
Housing supply
Housing stock in Niger can be classified in three categories, based on the materialused for construction: construction with mud and straw, and ceilings of wood(maison en terrecuite /banco); construction with mud and plaster with cement, andcorrugated iron sheet for the ceiling (maison en semi dur); and construction withcement, concrete and stone, and corrugated iron for the ceiling (maison en dur)– modern homes. The average cost of construction of the different categoriesdepends on the geographical location, the size of the land, the plan and the qualityof the material used. The three categories are found all over Niger. In the capital,housing stock is predominantly constructed with durable materials, cement andconcrete.
According to Sahel Dimanche, the public national newspaper, the rate of housingsupply is insufficient to meet the demand, as illustrated by different national surveys.Demand is estimated to be 50 000 units per annum, for the whole nation and6 000 for Niamey, the capital. The economic growth, political crisis in Libya andMali and the rate of urbanisation have all accentuated rent and demand for housesin Niamey as well as in other cities. The absence of mortgage banks in theprovision of end-user finance is a major challenge to the development of housing.
There are no recent statistics about the number of registered companies in theconstruction industry but majority of the companies are in roads and other urbaninfrastructure with very few in the real estate sector. Those in the real estatesector focus on land acquisition from traditional proprietors and servicing the landinto plots. The serviced plots are sold to potential homeowners who build theirhomes incrementally. The majority of potential homeowners finance these
> $50 000
$25 000 – $50 000
$14 000 – $25 000
$8 000 – $14 000
$5 000 – $8 000
$3 600 – $5 000
$2 400 – $3 600
$1 600 – $2 400
$800 – $1 600
<$800
- - - Average income needed for the cheapest newly built house by a formal developer, 2013
- - - Average annual urban household income, 2014
NIGER
$5 278
$2 091
Rural | UrbanAnnual household income US$
No. of households (thousands) 1400 1200 1000 800 600 400 200 0 200 400
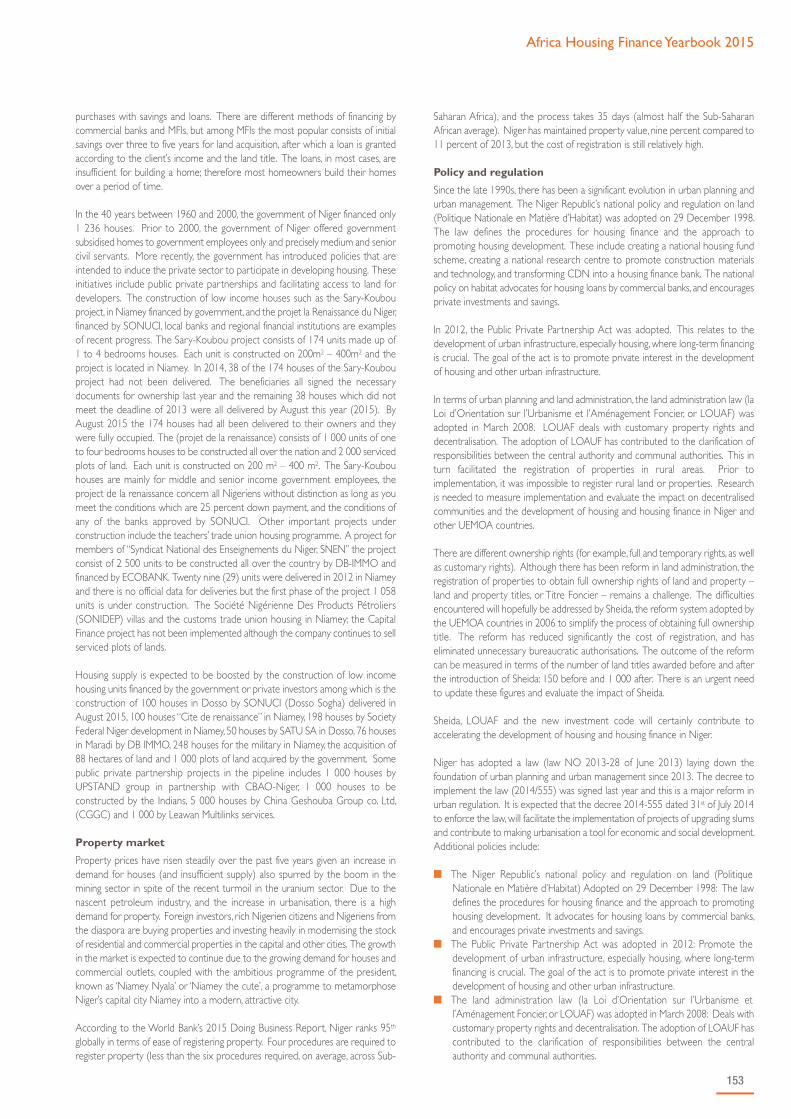
Africa Housing Finance Yearbook 2015
153
purchases with savings and loans. There are different methods of financing bycommercial banks and MFIs, but among MFIs the most popular consists of initialsavings over three to five years for land acquisition, after which a loan is grantedaccording to the client’s income and the land title. The loans, in most cases, areinsufficient for building a home; therefore most homeowners build their homesover a period of time.
In the 40 years between 1960 and 2000, the government of Niger financed only1 236 houses. Prior to 2000, the government of Niger offered governmentsubsidised homes to government employees only and precisely medium and seniorcivil servants. More recently, the government has introduced policies that areintended to induce the private sector to participate in developing housing. Theseinitiatives include public private partnerships and facilitating access to land fordevelopers. The construction of low income houses such as the Sary-Koubouproject, in Niamey financed by government, and the projet la Renaissance du Niger,financed by SONUCI, local banks and regional financial institutions are examplesof recent progress. The Sary-Koubou project consists of 174 units made up of1 to 4 bedrooms houses. Each unit is constructed on 200m2 – 400m2 and theproject is located in Niamey. In 2014, 38 of the 174 houses of the Sary-Koubouproject had not been delivered. The beneficiaries all signed the necessarydocuments for ownership last year and the remaining 38 houses which did notmeet the deadline of 2013 were all delivered by August this year (2015). ByAugust 2015 the 174 houses had all been delivered to their owners and theywere fully occupied. The (projet de la renaissance) consists of 1 000 units of oneto four bedrooms houses to be constructed all over the nation and 2 000 servicedplots of land. Each unit is constructed on 200 m2 – 400 m2. The Sary-Koubouhouses are mainly for middle and senior income government employees, theproject de la renaissance concern all Nigeriens without distinction as long as youmeet the conditions which are 25 percent down payment, and the conditions ofany of the banks approved by SONUCI. Other important projects underconstruction include the teachers’ trade union housing programme. A project formembers of “Syndicat National des Enseignements du Niger, SNEN” the projectconsist of 2 500 units to be constructed all over the country by DB-IMMO andfinanced by ECOBANK. Twenty nine (29) units were delivered in 2012 in Niameyand there is no official data for deliveries but the first phase of the project 1 058units is under construction. The Société Nigérienne Des Products Pétroliers(SONIDEP) villas and the customs trade union housing in Niamey; the CapitalFinance project has not been implemented although the company continues to sellserviced plots of lands.
Housing supply is expected to be boosted by the construction of low incomehousing units financed by the government or private investors among which is theconstruction of 100 houses in Dosso by SONUCI (Dosso Sogha) delivered inAugust 2015, 100 houses “Cite de renaissance” in Niamey, 198 houses by SocietyFederal Niger development in Niamey, 50 houses by SATU SA in Dosso, 76 housesin Maradi by DB IMMO, 248 houses for the military in Niamey, the acquisition of88 hectares of land and 1 000 plots of land acquired by the government. Somepublic private partnership projects in the pipeline includes 1 000 houses byUPSTAND group in partnership with CBAO-Niger, 1 000 houses to beconstructed by the Indians, 5 000 houses by China Geshouba Group co. Ltd,(CGGC) and 1 000 by Leawan Multilinks services.
Property market
Property prices have risen steadily over the past five years given an increase indemand for houses (and insufficient supply) also spurred by the boom in themining sector in spite of the recent turmoil in the uranium sector. Due to thenascent petroleum industry, and the increase in urbanisation, there is a highdemand for property. Foreign investors, rich Nigerien citizens and Nigeriens fromthe diaspora are buying properties and investing heavily in modernising the stockof residential and commercial properties in the capital and other cities. The growthin the market is expected to continue due to the growing demand for houses andcommercial outlets, coupled with the ambitious programme of the president,known as ‘Niamey Nyala’ or ‘Niamey the cute’, a programme to metamorphoseNiger’s capital city Niamey into a modern, attractive city.
According to the World Bank’s 2015 Doing Business Report, Niger ranks 95th
globally in terms of ease of registering property. Four procedures are required toregister property (less than the six procedures required, on average, across Sub-
Saharan Africa), and the process takes 35 days (almost half the Sub-SaharanAfrican average). Niger has maintained property value, nine percent compared to11 percent of 2013, but the cost of registration is still relatively high.
Policy and regulation
Since the late 1990s, there has been a significant evolution in urban planning andurban management. The Niger Republic’s national policy and regulation on land(Politique Nationale en Matière d’Habitat) was adopted on 29 December 1998.The law defines the procedures for housing finance and the approach topromoting housing development. These include creating a national housing fundscheme, creating a national research centre to promote construction materialsand technology, and transforming CDN into a housing finance bank. The nationalpolicy on habitat advocates for housing loans by commercial banks, and encouragesprivate investments and savings.
In 2012, the Public Private Partnership Act was adopted. This relates to thedevelopment of urban infrastructure, especially housing, where long-term financingis crucial. The goal of the act is to promote private interest in the developmentof housing and other urban infrastructure.
In terms of urban planning and land administration, the land administration law (laLoi d’Orientation sur l’Urbanisme et l’Aménagement Foncier, or LOUAF) wasadopted in March 2008. LOUAF deals with customary property rights anddecentralisation. The adoption of LOAUF has contributed to the clarification ofresponsibilities between the central authority and communal authorities. This inturn facilitated the registration of properties in rural areas. Prior toimplementation, it was impossible to register rural land or properties. Researchis needed to measure implementation and evaluate the impact on decentralisedcommunities and the development of housing and housing finance in Niger andother UEMOA countries.
There are different ownership rights (for example, full and temporary rights, as wellas customary rights). Although there has been reform in land administration, theregistration of properties to obtain full ownership rights of land and property –land and property titles, or Titre Foncier – remains a challenge. The difficultiesencountered will hopefully be addressed by Sheida, the reform system adopted bythe UEMOA countries in 2006 to simplify the process of obtaining full ownershiptitle. The reform has reduced significantly the cost of registration, and haseliminated unnecessary bureaucratic authorisations. The outcome of the reformcan be measured in terms of the number of land titles awarded before and afterthe introduction of Sheida: 150 before and 1 000 after. There is an urgent needto update these figures and evaluate the impact of Sheida.
Sheida, LOUAF and the new investment code will certainly contribute toaccelerating the development of housing and housing finance in Niger.
Niger has adopted a law (law NO 2013-28 of June 2013) laying down thefoundation of urban planning and urban management since 2013. The decree toimplement the law (2014/555) was signed last year and this is a major reform inurban regulation. It is expected that the decree 2014-555 dated 31st of July 2014to enforce the law, will facilitate the implementation of projects of upgrading slumsand contribute to making urbanisation a tool for economic and social development.Additional policies include:
n The Niger Republic’s national policy and regulation on land (PolitiqueNationale en Matière d’Habitat) Adopted on 29 December 1998: The lawdefines the procedures for housing finance and the approach to promotinghousing development. It advocates for housing loans by commercial banks,and encourages private investments and savings.
n The Public Private Partnership Act was adopted in 2012: Promote thedevelopment of urban infrastructure, especially housing, where long-termfinancing is crucial. The goal of the act is to promote private interest in thedevelopment of housing and other urban infrastructure.
n The land administration law (la Loi d’Orientation sur l’Urbanisme etl’Aménagement Foncier, or LOUAF) was adopted in March 2008: Deals withcustomary property rights and decentralisation. The adoption of LOAUF hascontributed to the clarification of responsibilities between the centralauthority and communal authorities.

154
Opportunities
Niger offers great opportunities for housing and mortgage products, for thefollowing reasons: a huge deficit in affordable and adequate houses, the uraniumexploitation, the exploitation of petroleum and complementary activities, the influxof foreign investors in the mining, petroleum and agricultural sectors and asignificant increase in the income of middle class Nigeriens. The nascent energyindustry among which is the Salkadamna project, one of the largest coal mines inAfrica, exploitation which starts in 2016. The development of cement industriesas illustrated by the authorisation awarded to Dangote Group to boost cementproduction. Niger is very rich in mineral resources especially resources such aslimestone and gypsum used in making cement. In spite of the abundance ofresources, there is only one company that manufactures cement in Niger “SocieteNigerienne de Cimenterie, SNC”. Although SNC has a very good product, itsproduction cannot meet local consumption, the country therefore has to importto satisfy its needs. The price of cement in Niger is very high at CFA6 500 for a50kg bag compared to CFA3 000 in Senegal. Niger being a landlocked countrypays a relatively high cost for logistics. Cement production can be very costly interms of energy consumption, that is probably why the industry was notdeveloped, but the rate of urbanisation, the government programme for housing,the development of energy show that infrastructure favours the development ofthe cement industry. A part from Dangote there are other foreign investorsinterested in the production of cement in Niger, some of them are in the processof obtaining their authorisation among which are ADOHA group, a Moroccangroup and one of the big producers in northern Africa. The development ofcement industries will definitely contribute to local supply of cement, generateemployment, revenues for the government, make cement price competitive andaccelerate the development of urban infrastructures and housing.
The Niger market also offers potential for other urban infrastructure investment.There is a need for long-term financing to develop affordable houses for themajority of people in Niger, and higher income properties for the minorities andexpatriates. The ambitious government programme to transform the capital cityof Niamey into a modern city also bodes well for increased investment. Thereform in land management, registration of properties and fiscal advantages offeredby the government of Niger Republic to formal private enterprises are incentivesfor promoting a dynamic housing development business and housing finance.
Sources
African Development Bank Statistics Pocketbook 2015.African Economic Outlook (2015).Capital Finance (2012). Housing Project Capital Finance, Niger 2012:Présentation du projet de logements sociaux de Capital Finance, Niger.Economic Commission for Africa (2012). African Statistics Pocketbook 2012.INS-Niger (2011). Annuaire Statistiques 2011. Le Sahel Dimanche (2011).16 au 19 septembre 2011.l'Institut National de la Statistique (INS-Niger) (2010). Annuaire Statistiques descinquante ans d’indépendance du Niger. Edition Spécial.Ministère de l’Equipement de l’habitat et de l’Aménagement du territoire etCabinet du Premier Ministre, consultant Gilles Horenfel (2002). Revue de lapolitique de financement de l’habitat au Niger, Rapport Final Provisoire.Salissou, M. (2010). Vulnérabilité à la pauvreté au Niger, Institut National 2006.Analyse des données de l’Enquête Nationale Budget/Consommation de2007/2008. UN-Habitat (2007). Profil Urbain National du Niger 2007.World Bank (2014). Doing Business 2014 Report: Niger.World Bank (2015). Doing Business 2015 Report.World Bank and IMF (2010). Niger Financial Sector Assessment ProgrammeApril 2010.World Bank Data 2014.
Websites
Afdb.org www.afdb.orgwww.af-reuters.comwww.doingbusiness.orgwww.gouv.newww.lesahel.org www.stat-niger.org www.tamtaminfo.comwww.undp.org www.unhabitat.org www.united4design.com www.wkipedia.org www.worldbank.org

Africa Housing Finance Yearbook 2015
155
Nigeria
(56 percent). The major issues that continue to affect housing in Nigeria includeinadequate access to finance, slow administrative procedures, and the high cost ofland registration and titling.
Access to finance
The Nigeria banking sector has grown tremendously over the past few years, bothin volume of activity and sophistication. The commercial banking sector assets,according to the Central Bank of Nigeria, experienced growth of 13 percentbetween 2013 and 2014. There has also been on-going acquisition of banks withinthe sector, contributing to the continued consolidation of the sector and theincrease in competition amongst players.
While consumer credit has grown by eight percent between 2013 and 2014, fromN782 billion (US$3.93 billion) to N848 billion (US$4.26 billion), the ratio ofconsumer credit to total credit to the private sector has remained relatively flat1.While there are several initiatives that have aided the credit growth across theboard, portfolio diversification within the Nigerian banking sector is not seen tohave improved.
The microfinance banking industry experienced a strong growth of 11 percent inassets2 over the past year, as well as 26 percent in net loans and advances3. Withinthe same time period, growth attributed to the standardisation of the microfinancebanking model has led to increased partnerships and better funding practices.Even with the recapitalisation of the microfinance bank, which led to a 13.4 percent
Overview
This year has been an exciting yet uncertain year for Nigeria. The presidential andstate elections took place in April, leading to a new party, the All ProgressiveCongress, taking the presidential office. The Naira has spiralled up and downagainst the US Dollar for the majority of the year leaving local and foreign investorsunsure of the future.
The Nigerian real estate sector is growing fast and is now the sixth largest sectorin the economy. Even though it is still unclear what the new government’s agendais with regards to housing delivery and strengthening the housing and mortgagemarket, government regulatory reforms in the past ten years are helping to createan enabling environment for housing delivery.
Despite the growth, the quality of housing stock in Nigeria is poor because theconstruction industry is driven by cost minimisation rather than value maximisation.The lack of a regulatory body and a non-existent legally binding building code hasled to the continued poor performance of contractors leading to poorlyconstructed buildings.
Almost half of Nigeria’s population live in cities, with 80 percent living in slumconditions. Rapid growth of cities have engulfed nearby towns and villages, andpushed back mangrove, while the lack of adequate infrastructure and planninghave caused deforestation, congestion, poor health, and poverty.
Where populations are expanding rapidly land is becoming increasingly scarce andcommunal land rights are more individualised. In rural areas commercial and otherinterest have bought up rights to smallholdings either on the informal market orvia applications for certification from the government. In urban areas where themajority of the population live in informal settlements the government takes overthe land if development needs are deemed to be of high interest. For example inthe Nigerian capital, Abuja, the government has destroyed more than 800 000homes since 2003 because they do not fit in to the Abuja master plan that focuseson prestige and luxury.
For the majority of Nigerians mortgage finance is not an option due to the lackof a robust system. Nigeria has a low homeownership rate of 25 percent,lower than that of Indonesia (84 percent), Kenya (73 percent), and South Africa
KEY FIGURES
Main Urban CentresLagos (capital), Abuja, PortHarcourt
Exchange Rate: 1 US$***Inflation 2013 | 2014 (est.) | 2015 (prov.) | 2016 (prov.) *
198.97 Nigerian Naira (NGN)8.6 | 8.1 | 8.3 | 7.6
Population^ | Population growth rate (2013)^Urban population (% of total)^ | Urbanisation rate (% in 2013)^
178 516 904 | 2.7846.94 | 4.61
GDP / capita (current US$)^ | GDP growth rate (annual %)^GNI / capita, Atlas method (current US$) ^Population below national poverty line*Unemployment rate (%)*Gini co-efficient (year of survey)^^HDI (Global Ranking)" | HDI (Country Index Score)”
3 184.62 | 6.312 95046.07.542.95 (2009)152 | 0.504
Lending Interest Rate^Mortgage Interest Rate (%) | Mortgage Term (years)#Credit % of GDP^Average Mortgages % of GDP° Price To Rent Ratio City Centre** | Outside City Centre**Gross Rental Yield City Centre** | Outside of City Centre**Outstanding home loan (% age 15+)##
16.5520.00 | 1014.610.58% (2011)1.27 | 7.8378.47% | 12.77%6.26
What is the cost of standard 50kg bag of cement (in US$)? #What is the price of the cheapest, newly built house by a formaldeveloper or contractor (in US$)? #What is the size of this house (in m2)? #What is the average rental price for a formal unit (in US$/month)#What is the minimum plot size for residential property (in m²)#
11.00
16 4003584250
Ease of doing business rank !Number of procedures to register property !Time (days) to register property !Cost (% of property value) to register property !
17012.107018.60
*** Conmill.com The Currency Converter^ World Bank's World Development Indicators (2014)~ World Bank PovcalNet: an online poverty analysis tool, various years^^ The World Bank's PovCalnet" UNDP's International Human Development Indicators (2014)° Various: Badev et al. "Housing Finance Across Countries: New Data and Analysis" – Unpublished
paper/Hofinet/World Bank## Global Financial Inclusion Database (FINDEX)# CAHF Annual Survey Data (September 2015)! World Bank's Doing Business Survey Data (2015)** Numbeo Online User-Contributed Database

156
increase in paid up capital, the number of microfinance banks grew from 820 to903 within the same time period, most of which are state level microfinance banks.
According to Global Findex (2014), between 2011 and 2014, access to finance4
grew from 30 percent to 44 percent. The growth has been driven by growthpayments, however there has been a significant lag in the impact on access toloans – two percent in 2011 to five percent in 2014. Mortgage finance is stilla small percentage of Nigeria’s GDP, at 0.5 percent. In comparison to the UK(80 percent), USA (77 percent), and South Africa (31 percent). It is clear that themortgage finance in Nigeria is still in its infancy and does not cater to low incomeearners. The government both federal and states are consciously trying to bridgethis gap through policies and funds – land swap initiatives, affordable and masshousing schemes and accessible mortgage finance.
In addition to the Primary Mortgage Banks (PMBs), 19 registered banks also offermortgages. Interest rates are high and vary considerably from bank to bank. Asat September 2014, prime mortgage rates among commercial banks ranged from11 percent to 27 percent, and maximum mortgage rates ranged from 18 percentto 31 percent. For leading, commercial banks offering mortgages, a down paymentis required of 20-30 percent of the property value, and a repayment term thatranges from 10-15 years.
The Federal Mortgage Bank of Nigeria (FMBN), Nigeria’s apex mortgageinstitution, promotes mortgage lending and manages the Nigerian housing policy.The FMBN raises capital through the National Housing Fund (NHF), which obtainsfunding mostly by contributions from salaried employees earning N3 000(US$15.70) and above monthly, of 2.5 percent of their salary. Contributors receivea two percent interest rate per annum and are entitled to apply for the NHF-sponsored loan. Up to N15 million (US$75 360) can be borrowed, and theborrower must make a deposit of between 10 percent and 30 percent. In January2015, FMBN reached an average NHF collection of N2.4 billion per month fromits over 4 million subscribers, however only 60 000 houses had been built,representing 1.5 percent penetration. The Nigerian Mortgage RefinanceCorporation (NMRC) which launched in 2013, is a liquidity facility with aUS$250 million, 40 year term loan from the World Bank. The NMRC provideslong-term refinancing to mortgage originators, hopefully also reducing interestrates. This year the NMRC is raising additional equity capital of N2.8 billion(US$143 million) through a shelf registration programme. The move to raiseadditional capital was to generate confidence in the credit standing of the NMRCas a bond issuing institution.
While the agency has launched initiatives most of which addressing marketstructure issues6 the impact on the housing delivery has been poor. The agencylaunched its first application for 10 000 housing units in July 2014, but about 66 402applications were received. Of this figure, 25 000 applications are said to havebeen pre-qualified; 9 000 have been given offer letters, while monies have beendisbursed to 33 Nigerians to acquire their homes.
The National Pension Commission recently stated its plan for its over seven millionsubscribers to the Contribution Pension Scheme (CPS) to apply part of theirRetirement Savings Account as equity contribution for residential mortgage. Theprocess is said to be at an advanced stage, and is expected to help bridge thehousing deficit.
Affordability
More than half of Nigeria’s estimated population of 178.5 million live on less thanUS$1 a day. The unemployment rate increased by 861 111 in the first quarter of2015, representing 7.5 percent compared to 6.4 percent in the last quarter of2014. Coupled with the high rate of unemployment, minimum wage remains atN18 000 (US$90.43) per month. Home prices and rent have grown ahead ofgeneral inflation and homes for rent and sale on the market are very expensive.
Within the Federal Governments’ Affordable Home Ownership Scheme launchedin 2014 the minimum price of a 30 m2 home is N4.5 million (US$22 607.95), andis payable over the maximum of 15 years. This will mean monthly payments ofN25 000 (US$125.60) a month. In agreement with National Housing policy thatstates that no more than 20 percent should be spent on housing expenditure, theaverage monthly income of a Nigerian should be N125 000 (US$628.00). This is
unrealistic for the majority of Nigerians who earn minimum wage or less. Evensome middle income earners, identified by the African Development Bank whoearn between N75 000 (US$376.80) and N300 000 (US$1 507.20) are unableto afford a home on the Federal Government’s Affordable Home OwnershipScheme. It is therefore no surprise that the take-up of the Affordable HomeOwnership Scheme, has been weak due.
There are several factors that contribute to the high cost of housing; land allocationcosts, high cost of funding, building materials and construction, logistical challenges,and the dearth of skilled artisans. In addition, taxes and fees also increase the saleprice of a house. In Nigeria it takes on average four months and 12 proceduresto conclude a perfection of title to land (paying stamp duty, registration of land titleand obtaining Governor’s consent).
The high cost and time required to obtain certificates of occupancy increase landprices and keep land transactions within the informal market while reducingsecurity of tenure after the sale. Fifty to 60 percent of the total construction inputgoes to building materials and with the tumble of the naira to the dollar this yearit was expected that the price of construction would increase due to a largemajority of material imports.
In an effort to ensure that land transactions are carried out with minimum difficultly,in January 2015, Lagos State cut down land use charges in the state from 13 percentto three percent of a property’s value. The Federal Government is also pushingfor a reduction in land transaction fees from 16 percent to three percent. As aresult of the high cost of housing7 in Nigeria, 51 percent of Nigerians live in rentedaccommodation and 40 percent of which are paying between N20 000(US$100.48) and N100 000 (US$502.40) yearly (Kolawole, Y 2014).
With the majority of the population renting and low regulatory monitoringregarding rentals, landlords and estate agents dictate the market. To curb this, the2011 Lagos Tenancy Bill was written into law. It states that landlords can onlycharge for one year’s rent in advance. However, the law is not being enforcedand people seeking rented accommodation are still facing issues of landlordsrequesting payments of two or more years. Agency fees are another expense theLagos Tenancy Law has been unable to govern. Even though it is already very highin Nigeria, at 10 percent, exceeding the rest of Africa; in Ghana it is five percentand Kenya is 1.25 percent, the law has led to agencies charging 20 percent toensure they receive the two years’ worth of commission.
Overall, the policies and interventions implemented by the federal and stategovernments cater mainly for the middle to high income section of the populace.In some cases they do reach low income earners but they are rarely directed atthe informal sector.
Housing supply
In Nigeria, neither the government nor the private sector provides sufficienthousing delivery. Housing production is at approximately 100 000 units per year –is highly inadequate as 800 000 are required per year in order to bridge the17 million deficit. It is estimated that it will cost US$363 billion to curb the housingdeficit and the number is expected to grow to two million houses per year at thecurrent population growth of 2.8 percent per year.
The rapid population increase and rural to urban migration have contributed tothe shortfall of housing in Nigeria. The cost of building materials, access toinfrastructure, deficiency of housing finance arrangement, stringent loan conditionsfrom mortgage banks, time to process legal documents and inadequategovernment policies are also major issues affecting housing delivery.
Through the National Policy on Housing (2006), the Federal Government set atarget of delivering one million housing units every year. This is being done throughland swap initiatives, affordable and mass housing schemes and accessible mortgagefinance to ensure low and middle income earners have access to safe, decent andaffordable housing. However the policies in place are yet to meet the housingdeficit, for example the Affordable Housing Scheme can only provide about3 percent of the required housing stock needed.

Africa Housing Finance Yearbook 2015
157
In November 2014, the Federal Capital Territory in partnership with the NigeriaLabour Congress, the Trade Union Congress and Good Homes Development Co.Ltd laid the foundation for 40 000 housing units for workers in Abuja. The hopeis that this scheme, currently under construction, will empower civil servants toown a house.
The Nigerian government has identified the need for public private partnershipsfor low income housing supply. To this end, in October 2014, the Minister of Lands,Housing and Urban Development, stated that the Federal Government hascreated an enabling environment for the private sector to take the front seat inthe provision of housing for millions of Nigerians.
In May 2015, Lafarge Africa Plc. in partnership with LAPO Microfinance announcedtheir construction of 500 housing units in the Federal Capital Territory, Abuja onland provided by Federal Ministry of Lands, Housing and Urban Development.Another development in process with a public private partnership model, is the10 000 unit Rock City housing project taking place in Abuja. The partnership isbetween Rock of Ages Properties (Chicason Group) and the Federal CapitalDevelopment Authority's Development Control Department. Chicason is aimingto expand this to Nigeria’s 36 states and deliver 100 000 homes.
The informal workforce is one that continues to be left out of government andprivate sector led initiatives. Instead they find unused pockets of land to build anddevelop units in un-serviced areas.
Policy and Regulation
The 1999 Nigerian Constitution states that all citizens have the right to acquire andown immovable property. Similarly Vision 20:2020 advocates for adequate housingfor all Nigerian citizens. Even though the new federal administration has not placedhousing at the forefront of its agenda, continued housing policies and regulationsare in place with an aim to shrink the housing deficit and meet the demand of theNigerian population.
The Land Use Act (1978) continues to dictate and hinder the land market inNigeria. To date the objectives8 of the Act have not been achieved and further tothis, the law has led to further distortion and abuse of citizens’ rights to access andown land. Via the Land Use Act, urban land is managed by the Governor of astate through a Land Use and Allocation Committee which dispenses land throughthe granting of Certificates of Occupancy. ‘Other lands’ (not urban) is managedby Local Government through a Land Allocation Advisory Committee. Legally aNigerian who has a Certificate of Occupancy does not own the land but is astatutory occupant. This Act is constantly in contention and a committee wascreated to develop a bill to amend the Act. However, even though a conclusionwas met in 2014 where amendments were made, the core of the Act remains thesame, stating that the Governor of the State owns all land in that State andtherefore is responsible for the allocation of land.
Nigeria has three distinct land markets; 1) a market for direct state allocation, 2)a market for pre-1978 land rights, which have not been converted, and 3) aninformal market where no statuary of occupancy exists. As a result, the majorityof transactions are informal or private. It is estimated that one percent of landtransactions occur on the formal market and 25 percent involve a certificate ofoccupancy but the transactions are done without required consent, payment oftaxes and registration.
The 2012 National Housing Policy emphasizes the role of private sector financingwith the hope of bringing about mass housing, skills acquisition, disastermanagement, urban renewal, slum upgrading, and job creation. The target of thepolicy is to ensure one million houses are built yearly, through a variety of schemessuch as NMRC.
Other policies and regulations that impact the housing market are the NationalHousing Fund Act (1992) and the Federal Mortgage Bank Act (1993). Both Actsaim to ensure a constant supply of loans to Nigerians for the purpose of building,purchasing and improvement of residential properties. FMBN, as part of theFederal Mortgage Bank Act, serves as a secondary mortgage institution, providingcredit facilities to primary mortgage institutions, real estate developmentcompanies or bodies, housing corporations and housing operatives. FMBNadministers and collects the Federal Housing Fund.
To improve on the objectives of the National Housing Fund Act, The ManagingDirector/Chief Executive Officer of FMBN, Gimba Yau Kumo, stated in July 2015that the Federal Mortgage Bank had developed FMBN Home Renovation Loan(FHRL) (Ezea. S, 2015 ). FHRL has been designed to assist contributors to theNational Housing Fund for renovations.
Property markets
The Nigerian real estate sector is growing faster than the average GDP at a rateof 8.7 percent (GDP growth at 7.4 percent). BMI estimates that the real estateindustry value will grow over the next 2 years, from USD 11.4 billion in 2015 toUSD 16.5 billion. This fast growth can be attributed to the fast growing middleclass driving demand for residential property development and, indirectly retail,industrial and commercial real estate development.
Nigeria’s property market is currently stimulated by several large scale projects,including Eko Atlantic9, the World Trade Centre Project in Abuja, and the WingsProject in Lagos10. The affordable housing market growth is stifled due tostructural issues like predominance of less than mortgageable quality housing andlow number of titled land. Land prices are on the rise, driven by low availability,recent devaluation of the naira and the increase in inflation. However real estatecompanies are increasingly selling more land units than home units, as a result ofthe higher impact the macroeconomic drivers have on the cost of building, whichthreatens their profit margins. Stakeholders in the real estate market have alludedthe speculative pricing approach of both land and home units, rather than the
> $50 000
$25 000 – $50 000
$14 000 – $25 000
$8 000 – $14 000
$5 000 – $8 000
$3 600 – $5 000
$2 400 – $3 600
$1 600 – $2 400
$800 – $1 600
<$800
- - - Average income needed for the cheapest newly built house by a formal developer, 2013
- - - Average annual urban household income, 2014
NIGERIA
$10 953
$8 936
Rural | UrbanAnnual household income US$
No. of households (thousands) 5000 4000 3000 2000 1000 0 1000 2000 3000 4000 5000

158
assessment of demand characteristics of the area where the land and home unitsare located – poor data has been identified as a driving factor to this practice.Where titles do exist, geospatial data and the formal registry system is inadequate,and bottlenecks arise in the property transfer system.
According to the World Bank’s Doing Business 2014 & 2015 Reports, Nigeriaranks close to the worst globally, 185th out of 189 countries for registering property.The World Bank estimated that this registration process takes 70 days in 2015(77 days in 2014) , and costs about 18.6% (20.8% in 2014) percent of the valueof the property, more than double the average for Sub-Saharan Africa, and fivetimes the OECD average.
Opportunities
While there has been some growth in the housing sector, it appears only to servethe high income customer segment – the luxury residential market is expected tosoon experience an oversupply. The mid to low income segment, where thehousing gap lies mostly, has yet to experience change. As seen in the otheremerging markets, housing for the mid to low income customer segment isprofitable. For this segment of the market, housing microfinance would play asignificant role in capturing this opportunity.
Regardless of the issues facing the sector, real estate projects are increasingly beinglaunched and completed and investors are even getting higher. With severalhousing initiatives (e.g. NMRC, FMBN etc.) playing a dual role of ensuring long-term funding as well as driving initiatives that address the structural issues facingthe property market, especially within the residential property sector, de-risking ofthe sector is bound to happen and new investors can expect the market tocontinue delivering positive results.
Sources
African Economic Outlook. Country profile for Nigeria.Ayere, S. (2013). Housing Finance in Nigeria: the Mortgage RefinanceCompany. Presentation to the African Union for Housing Finance, April.Business Monitor International data.Central Bank of Nigeria (2013). Annual Report 2011.Central Bank of Nigeria (2013). Deposit and Lending Rates for the BankingIndustry at 2 August.Central Bank of Nigeria (2014). Financial Stability Report December 2013.Demirguc-Kunt, A. and Klapper, L. (2012). Measuring Financial Inclusion: TheGlobal Findex. World Bank Policy Research WP 6025.Ezea. S. (2015). How to re-engineer National Housing Fund, by FMBN, TheGaurdian, 2 July, accessed August 2015.Global Real Estate Institute, 2014 Africa GRI 2014: Africa's Most Senior RealEstate Event, Nairobi – 18 & 19 June 2014, Discussion summaries provided byMBA students of the Department of Real Estate and Construction Management(RECM) from the University of Nairobi.Kolawole, Y. (2014) 51% of adult Nigerians live in rented houses – NOI Polls',Vanguard, 24 November, accessed August 2015.
Kumolu, C. (2015) FMBN out with measures to encourage home ownership,Vanguard, 23 June, accessed September 2015.National Bureau of Statistics (2013). Gross Domestic Product for Nigeria.Revised 2011 and estimates for Q1-Q4 2012.National Housing Policy, adopted 15 December 2011.www.socialhousingnigeria.com. Nubi, T. (2010). Towards Sustainable Housing Finance in Nigeria. The Challengesof Developing Adequate Housing Stock and a Road Map. Housing FinanceInternational, Vol 24, No 4, pp 22-28.Olayinka, A (2011). Mortgage Banking/Housing Finance Sector in Nigeria: Past,Present, Future. Presentation to the stakeholders’ workshop onmortgage/housing finance in Nigeria, August. Pison Housing Company (2010). Access to Housing Finance in Africa: Exploringthe Issues (No. 12) Nigeria. Paper commissioned by the FinMark Trust andEFInA.PWC (2015) Real Estate: Building the future of Africa.USAID (2010) Country profile: property rights and resource governance,Nigeria.World Bank (2015). Doing Business 2015. Nigeria.
Websites
www.allafrica.com www.africaneconomicoutlook.org www.businessdayonline.com www.businessmonitor.comwww.cenbank.org www.fmbn.gov.ng www.howwemadeitinafrica.com www.mfw4a.org www.mixmarket.org www.nigerianstat.gov.ng www.socialhousingnigeria.comwww.thenationonlineng.net www.ventures-africa.com
1 From 6.8 percent in 2013 to 6.4 percent in 20142 From N270 billion in 2013 to N300 billion in 20143 From N129 billion in 2013 to N163 billion in 2014.4 A person who has access to finance is defined as an adults with an account at a formal financial institution5 A simplified method of registering securities that permits corporations to file a relatively uncomplicated registration form and, during the subsequent two years, issue the securities. Shelf registration is supposed
to provide more flexibility for corporations when they are raising funds in the capital markets (thefreedictionary.com)6 Market structure issues include develop unique underwriting standards, working to improve the titling system, enforced mortgagees’ rights, etc.)7 Average price per square meter for an apartment in a city centre is N199 755.00 (US$ 1003.57) and on the outside of the city centre is N209 706.00 (US$ 1 053.56)8 The objectives of the Land Use Act are to: (1) make land accessible to all Nigerians; (2) prevent speculative purchases of communal land; (3) streamline and simplify the management and ownership of land;
(4) make land available to governments at all levels for development; and (5) provide a system of government administration of rights that would improve tenure security (USAID, 2010).9 A prime mixed-use property development consisting of 10 districts will become home to 250 000 residents; Residential and office plots will sell at US$1 500/m2.10 The Wings Project is led by Oando PLC.
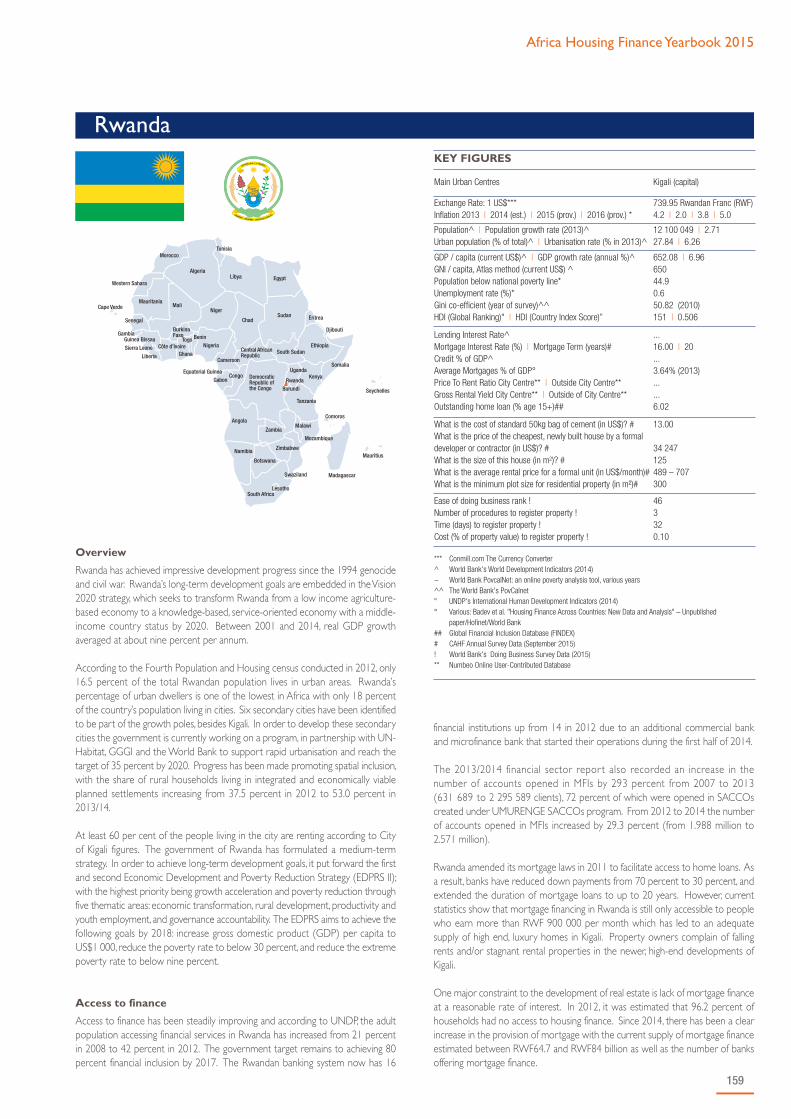
Africa Housing Finance Yearbook 2015
159
Rwanda
financial institutions up from 14 in 2012 due to an additional commercial bankand microfinance bank that started their operations during the first half of 2014.
The 2013/2014 financial sector repor t also recorded an increase in thenumber of accounts opened in MFIs by 293 percent from 2007 to 2013(631 689 to 2 295 589 clients), 72 percent of which were opened in SACCOscreated under UMURENGE SACCOs program. From 2012 to 2014 the numberof accounts opened in MFIs increased by 29.3 percent (from 1.988 million to2.571 million).
Rwanda amended its mortgage laws in 2011 to facilitate access to home loans. Asa result, banks have reduced down payments from 70 percent to 30 percent, andextended the duration of mortgage loans to up to 20 years. However, currentstatistics show that mortgage financing in Rwanda is still only accessible to peoplewho earn more than RWF 900 000 per month which has led to an adequatesupply of high end, luxury homes in Kigali. Property owners complain of fallingrents and/or stagnant rental properties in the newer, high-end developments ofKigali.
One major constraint to the development of real estate is lack of mortgage financeat a reasonable rate of interest. In 2012, it was estimated that 96.2 percent ofhouseholds had no access to housing finance. Since 2014, there has been a clearincrease in the provision of mortgage with the current supply of mortgage financeestimated between RWF64.7 and RWF84 billion as well as the number of banksoffering mortgage finance.
Overview
Rwanda has achieved impressive development progress since the 1994 genocideand civil war. Rwanda’s long-term development goals are embedded in the Vision2020 strategy, which seeks to transform Rwanda from a low income agriculture-based economy to a knowledge-based, service-oriented economy with a middle-income country status by 2020. Between 2001 and 2014, real GDP growthaveraged at about nine percent per annum.
According to the Fourth Population and Housing census conducted in 2012, only16.5 percent of the total Rwandan population lives in urban areas. Rwanda’spercentage of urban dwellers is one of the lowest in Africa with only 18 percentof the country’s population living in cities. Six secondary cities have been identifiedto be part of the growth poles, besides Kigali. In order to develop these secondarycities the government is currently working on a program, in partnership with UN-Habitat, GGGI and the World Bank to support rapid urbanisation and reach thetarget of 35 percent by 2020. Progress has been made promoting spatial inclusion,with the share of rural households living in integrated and economically viableplanned settlements increasing from 37.5 percent in 2012 to 53.0 percent in2013/14.
At least 60 per cent of the people living in the city are renting according to Cityof Kigali figures. The government of Rwanda has formulated a medium-termstrategy. In order to achieve long-term development goals, it put forward the firstand second Economic Development and Poverty Reduction Strategy (EDPRS II);with the highest priority being growth acceleration and poverty reduction throughfive thematic areas: economic transformation, rural development, productivity andyouth employment, and governance accountability. The EDPRS aims to achieve thefollowing goals by 2018: increase gross domestic product (GDP) per capita toUS$1 000, reduce the poverty rate to below 30 percent, and reduce the extremepoverty rate to below nine percent.
Access to finance
Access to finance has been steadily improving and according to UNDP, the adultpopulation accessing financial services in Rwanda has increased from 21 percentin 2008 to 42 percent in 2012. The government target remains to achieving 80percent financial inclusion by 2017. The Rwandan banking system now has 16
KEY FIGURES
Main Urban Centres Kigali (capital)
Exchange Rate: 1 US$***Inflation 2013 | 2014 (est.) | 2015 (prov.) | 2016 (prov.) *
739.95 Rwandan Franc (RWF)4.2 | 2.0 | 3.8 | 5.0
Population^ | Population growth rate (2013)^Urban population (% of total)^ | Urbanisation rate (% in 2013)^
12 100 049 | 2.7127.84 | 6.26
GDP / capita (current US$)^ | GDP growth rate (annual %)^GNI / capita, Atlas method (current US$) ^Population below national poverty line*Unemployment rate (%)*Gini co-efficient (year of survey)^^HDI (Global Ranking)" | HDI (Country Index Score)”
652.08 | 6.9665044.90.650.82 (2010)151 | 0.506
Lending Interest Rate^Mortgage Interest Rate (%) | Mortgage Term (years)#Credit % of GDP^Average Mortgages % of GDP° Price To Rent Ratio City Centre** | Outside City Centre**Gross Rental Yield City Centre** | Outside of City Centre**Outstanding home loan (% age 15+)##
...16.00 | 20...3.64% (2013)......6.02
What is the cost of standard 50kg bag of cement (in US$)? #What is the price of the cheapest, newly built house by a formaldeveloper or contractor (in US$)? #What is the size of this house (in m2)? #What is the average rental price for a formal unit (in US$/month)#What is the minimum plot size for residential property (in m²)#
13.00
34 247 125489 – 707300
Ease of doing business rank !Number of procedures to register property !Time (days) to register property !Cost (% of property value) to register property !
463320.10
*** Conmill.com The Currency Converter^ World Bank's World Development Indicators (2014)~ World Bank PovcalNet: an online poverty analysis tool, various years^^ The World Bank's PovCalnet" UNDP's International Human Development Indicators (2014)° Various: Badev et al. "Housing Finance Across Countries: New Data and Analysis" – Unpublished
paper/Hofinet/World Bank## Global Financial Inclusion Database (FINDEX)# CAHF Annual Survey Data (September 2015)! World Bank's Doing Business Survey Data (2015)** Numbeo Online User-Contributed Database

The Development Bank of Rwanda (BRD) plays a major role in ensuring thatRwandans are properly housed through financing of large-scale real estate projectsas well as individual home buying and construction. In 2014, the bank invested overRWF5 billion in mortgage financing for affordable housing in both low and middleincome categories. More so the bank launched another product, the Gira Icumbiwhich enables potential homeowners to save for at least one year until they havesaved 10 percent of the cost of their home, after which they are able to access ahome loan.
In addition to the above, mortgage products offered by other financial institutionshave gone a long way in creating an enabling ground for Rwandans especially thosein urban settlements to own decent homes. Banks like I&M Bank, Cogebanque,Ecobank, Access Bank, KCB and BK are also big mortgage lenders. From 2004 to2007, mortgage lending almost doubled from 1.8 percent mortgage debt to GDPto 2.6 percent. Rwanda’s mortgage market in 2009 was worth between RWF33billion and RWF47 billion (US$60 million and US$80 million), a small numbercompared to its estimated potential demand of more than RWF200 billion(US$340 million).
A regional bank KCB has also played a pivotal role in the mortgage market byenabling their clients to own homes through providing them with 100 percentmortgage finance. The bank has designed a product where a client can access fullsponsorship to construct a home provided that they own the land on which thehome is being built.
Despite the above innovations, Rwanda’s mortgage market still faces a number ofchallenges, the most critical being the lack of liquidity. The Rwandan stock market,in existence since early 2008, has provided some facility for this including BCR’s 10-year note issue worth RWF5 billion (US$8.4 million). As a result, the BCR is nowoffering 20-year loans, funding mortgages with a mix of short-term deposits(65 percent) and the bond issues proceeds (35 percent).
Rwanda has a well-established micro-lending sector, with 22 MFIs reporting to theMix Market in 2013. Between them, they have issued US$128.1 million in loansto 80 413 borrowers, and have collected US$56.5 million in deposits from 285 603depositors. The government has enacted facilitative, specialized microfinance lawsand some housing microfinance lenders are emerging. A study conducted byNgoga Thierry (2014) reports an increase in registering mortgages. In 2013, theamount of registered mortgages doubled to 12 804 from 6 129 in 2010.
The Global Financial Inclusion (Global Findex) Database shows that loans for homeimprovement and construction are more popular than loans for home purchase,suggesting the importance of the micro lending sector. In 2011, eight percent ofthe top 60 percent of income earners over the age of 15 reported having anoutstanding loan for home construction, versus 1.8 percent for home purchase.This was similar for the bottom 40 percent of income earners over the age of 15
with 6.5 percent reporting having an outstanding loan for home construction,versus 1.9 percent for home purchase.
In addition to land titles banks consider many other factors besides collateralbefore making a final decision to extend loans. These factors include how long onehas lived in a particular area, whether one has earned a steady income over time,and whether one is able to secure a solid co-signer and the usually high transactioncost of lending to small borrowers. As a result majority of Rwandans prefer to buycheaper undeveloped land and invest in developing them gradually over timerather than buying more expensive developed houses.
Findings from a survey conducted by USAID in Rwanda showed that, mortgageusage among those who owned property only 15 percent of respondentsreported using mortgage to acquire their properties (most of those who accessedmortgages used them to finance multistoried properties (36.4 percent) followedby enclosed housing properties (20.5 percent). Only 10.5 percent of bungalowowners used mortgages to finance acquisition of their property.
A Real Estates Investment Trusts (REITs) initiative by the development bank ofRwanda (BRD) aims to increase affordable houses by the end of the year. Fundsraised will be used to setup houses for the low and middle market segments.Under this initiative, BRD will start investment groups which will then float shareson local capital markets, with the proceeds going to real estate development.
Affordability
FinScope Rwanda 2012 found that 87 percent of adults are from householdsinvolved in farming activities. In Kigali, 26 percent generated their income frompiecework, 19 percent from business, 11 percent from government employmentand 15 percent from farming activities. More so, 44 percent of adults reportedhaving more than one source of income. Three percent of adults do not generatean income, but depend rather on government grants, remittances or householdtransfers to subsist.
Access to mortgage finance is limited by household affordability as well as theirregularity of incomes among some borrowers. Further, deposit requirements ofup to 30 percent and short repayment periods make mortgage financeinaccessible to the majority of people without formal employment.
Home Finance Guarantors Africa Reinsurance Limited, a South African company,has been working with Soras Assurances Generales Ltd to establish collateralreplacement guarantees. In July, Soras announced a partnership with BCR andKCB to offer the Collateral Replacement Indemnity to their mortgage clients.
In another effort to increase the number of affordable houses, KCB partneredwith Region Holdings, a property investment firm to construct low budget homesfor low income earners such as those earning less than Rwf 600 000 per month.
160
> $50 000
$25 000 – $50 000
$14 000 – $25 000
$8 000 – $14 000
$5 000 – $8 000
$3 600 – $5 000
$2 400 – $3 600
$1 600 – $2 400
$800 – $1 600
<$800
- - - Average income needed for the cheapest newly built house by a formal developer, 2015
- - - Average annual urban household income, 2014
RWANDA
$18 484
$2 377
Rural | UrbanAnnual household income US$
No. of households (thousands) 1200 1000 800 600 400 200 0 200 400

Africa Housing Finance Yearbook 2015
161
Cost of housing in Rwanda, is still on the high end, for instance houses on themarket today cost Rwf700 million (about US$1 million) while the lowest decentones cost Rwf25 million, according to information from property developers.Statistics from the CoK show that about 80 percent of city dwellers earn belowRwf300 000 per month. This makes renting high-end houses a dream to many ofthem.
It is worth noting however that the reason behind the high prices is due to highborrowing costs for property developers as well as low levels of infrastructuredevelopment within the city suburbs. In addition high electricity prices andunreliable availability of water in the city increases costs.
Housing supply
However while construction remains the fastest growing sub-sector of theRwandan economy (accounting for 27.2 percent of total turnover of the industrialsector), supply of affordable housing to the growing urban population remains amajor challenge. According to Rwanda’s National housing policy, one priorityproblem to be addressed according to the EDPRS2 and Sector Strategy, is theshortage of decent housing which is affordable and accessible through the formalmarket. This problem is coupled with the current inability of the private sector tosatisfy the growing demand for housing. The supply of housing according todemand is challenged by predominantly low income levels, resulting in a lowpurchase power for conventionally constructed housing units.
As of 2015, at least 60 per cent of city dwellers were renting. According to Cityof Kigali (CoK), the city needs over 1 000 units per year, especially for the lowerand middle market segments. Most of the houses available on the real estatemarket target the customers that can afford them, ignoring those that cannotafford them who are at times forced to stay in inhabitable dwellings. From theavailable Kigali housing market, it has been found that by 2022, CoK will require atleast 344 068 dwelling units (DU).
However, only 37 594 dwelling units will be supplied by 2022 considering thecurrent circumstances. Hence, there will be a shortfall of 306 474 dwelling units.
Rwanda Housing Authority (RHA) emphasizes that it is prioritizing low costhousing in 2015 in a bid to respond to a long standing shortage of cost friendlydwelling units in the city. During the National Leadership retreat in March 2014,leaders emphasized the need to provide low cost housing units a priority for thegovernment and RHA was tasked to oversee the development.
The Director General of RHA, reports that the body has acquired prime land inNdera and Kanombe in Kicukiro District, which is suitable for the establishment ofmore than 2 000 dwelling units. The construction of the housing units is on course,adding that the authority is currently looking for a consultancy firm to draw thehousing designs for the proposed units. The sites will be designed to accommodatebetween 70 to 100 high-density low rise apartment blocks per hectare. Thehousing units in Kanombe and Ndera are both targeting low and medium incomeearners and will have two to four bedrooms. Each unit will cost a buyer betweenRwf15 million to Rwf30 million, according to RHA.
In March 2015, another housing project was launched by the minister ofinfrastructure to see the construction of 7 480 affordable housing units in Kigali, amove seen to close the looming dwelling units shortage. It is expected to berolled out in other major towns in the country to provide affordable housing fortown dwellers. According to the plan, the project that will be located in Batsinda(Kigali) is expected to be finished in two years and will be carried out in twophases with the first kicking off this month which will involve roads construction.The project will see the construction of affordable housing units in Kanombe andNdera the outskirts of the city with each project having 2 000 units, 2 743 unitsand 128 housing units in Rugarama Ziniya Pilot Project respectively. This accordingto experts will help the city of Kigali through its city master plan to address thechallenge of accommodating the expected population growth from over onemillion currently to over 4.4 million by 2030.
The Kigali city has adopted a low cost model house worth US$10 000. In thismodel, some building materials, especially bricks are made on site which reducesconstruction costs since there are no transport costs in this case. The model
which is funded by the government of Rwanda is going to be employed in a pilotproject to provide 250 low cost houses in Batsinda, Gasabo district and it will becarried out by the City of Kigali. Private enterprises that want to play a role inprovision of affordable housing for low income households are also adopting thelow cost housing model.
The recent shift of commercial banks to boost the mortgage sector by increasingloans going to the sector mainly developers has led to an increase in housingunits being constructed resulting in a decline in the cost of a unit to as low asRwf 20 million.
In 2013, Rwanda’s insurance sector saw the entry of a new company, UAP HoldingLtd. In July 2014, the company announced that it would invest RWF34 billion inthe local real estate industry in a bid to ease the housing shortage that Rwandafaces, especially in the City of Kigali. The project in Kigali is expected to boost itsearnings from investments.
The chairman of REITs Rwanda says their target is to set up affordable housing inNyamirambo and Gikondo, which have many informal settlements. They aretargeting 2 500 units for low income earners during the first phase.
Property markets
In the last 13 years there has been a high demand for both residential andcommercial buildings, the annual demand for residential houses is increasing at arate of 25 000 per year and investment in the sector growing from US$100 millionto US$480 million. All this has been as a result of population growth, an emergingand growing middle class, increased diaspora investment in Rwandan propertymarkets and the government investment in infrastructure expansion andmodernization of urban and rural infrastructure.
Rwanda’s real estate sector faces many challenges including low supply. Forinstance annual demand is estimated at 25 000 units of which 8 000 – 10 000 arein Kigali. Rental is still high due to a lack of supply. Prices of plots of land andhouses are influenced by the type of infrastructure developments in a particulararea and the demand of the services.
According to the World Bank’s 2015, Doing Business Report, Rwanda madedealing with construction permits much easier by eliminating the fee for obtaininga freehold title and by streamlining the process for obtaining occupancy permit.Globally, the country stands at 34 in the ranking of 189 economies on the ease ofdealing with construction permits.
Furthermore the country recorded a significant improvement on the indicator ofconstruction permits, with a reduction of procedures from 13 to 10, and timetaken to acquire the relevant documents from 104 days to 77.5 (Doing BusinessReport 2015). In 2014 the county reduced the building permit fees, implementedan electronic platform for building permit applications and streamlined procedures.
Policy and Regulation
The government of Rwanda is committed to accelerating growth rate in order toreach 11.5 percent per annum (EDPRS2). It is believed that the ‘urban economy’can contribute significantly to this growth. Therefore the government is workingon strategies to urbanise the country starting with six secondary cities – Rubavu,Musanze, Nyagatare, Muhanga, Huye and Rusizi which are considered poles ofgrowth. The EDPRS 2 (2013-18) for the first time, emphasized the significance ofgood planning and development management. This process has led to creation ofthe urbanisation and rural settlement sector, by which strategic goals and objectivesfor a sustainable, well-managed and integrated growth were outlined.
The government is also working on the promotion of “Grouped Settlements” thisencourages local communities to settle in grouped morphologies to enableefficient servicing and use of resources. Secondary development within groupedsettlements will be based on the support by private or semi-private players, namelyland developers, private operators and enterprises, including banks, insurancecompanies, associations, community groups, and housing cooperatives. This typeof conception is based on the principles of affordability of the rural housing schemeto the beneficiary and empowerment to participate in its implementation, and onintegrating the entire social cross-section of households.

162
The National Housing Policy which was rolled out in March 2015 aims at fast-tracking affordable housing projects. Under the new instructions, the localgovernment authorities would be required to inform its residents about thehousing schemes under which they can apply for support. Government willsupport the supply of housing which is affordable to people within all incomesegments, and the creation of an enabling environment to do so. This policy willset the pace for private sector investment, as well as address economic, social andenvironmental standards to setup affordable housing support.
In August 2015, the division for Housing and Urban Planning at the Ministry ofinfrastructure (MININFRA) announced measures to ensure every Rwandan hasaccess to affordable housing. Under the new instructions, the government willoffer basic infrastructure to developers including offering land than can cover30 percent of the costs for affordable housing development. In addition to theabove other infrastructure support will include roads, telecommunication,electricity distribution and social amenities. The below policies are in place totarget housing delivery.
The law Governing Urban Planning and Building in Rwanda from 2012 establishesthe basis for planning and building in Rwanda, including general provisions on thetypes of plans and the types of urban development related activities and tools, aswell as general provisions on building. It refers to a number of implementingorders to be developed, many of which have by now been drafted and submittedfor cabinet approval in 2014.
The law governing human habitation in Rwanda, gazette in 2011, governs theoccupation of land, and construction on lands reserved for human habitation. Itincludes provisions for grouped settlement sites on occupied land, and requiresminimum infrastructure provision for human settlements.
Opportunities
Housing finance demand, both mortgage and microfinance, in rapidly urbanisingRwanda has barely been met, and there is great potential for growth. More playersare needed in the market to improve accessibility. As a top regional performer inreforming the macroeconomic environment, the state has performed its role as amarket maker well. Rwanda has made tremendous progress in registeringproperty, and this shows the commitment of the government to improve theproperty market by making it more inviting for developers.
The government has established a Housing bank to provide loans to Rwandans soas to own houses at an affordable rate in three major ways; housing for employees,housing for sale and housing for rent to low income households. However thisonly benefits people with a reliable income.
RHB together with the National Social Security Fund (NSSF) are coming up withoptions to benefit those with less income so as to get low cost houses. A pilot inRHB is providing funds for expropriation of land for development of affordablehousing and a pilot in Batsinda is being financed by the NSS because access tohousing for the low income households requires subsidies from stakeholders, forsuch houses to truly be available.
Another opportunity is that the government is committed to strengthening of theongoing integration and coordination initiatives, resulting in cross-sectoralpartnership agreements; and in both public private partnership objectives as animportant area to be emphasized for its positive prospects.
Sources
Buckley R., (2014). Affordable Housing in Rwanda: Opportunities, Options, andChallenges: Some Perspectives from the International Experience.City of Kigali Development Plan 2012/13.Economic Development Poverty Reduction Strategy II.Financial Sector Development programme Phase II (FSDP II).Land Market Values, Urban Land Policies, and their Impacts in Urban Centers ofRwanda, Final Research Report 2014.National Bank of Rwanda. Annual Report (July 2013-June 2014).Rwanda Economic Update: Financing Development in Rwanda 2015.Rwanda Ministry of Infrastructure; Urbanisation and Rural Settlement SectorStrategic Plan 2012/13-17/18.Rwanda Ministry of Infrastructure National Housing Policy 2014.Land Governance Monitoring: A Pilot Study In Rwanda (Ngoga Thierry 2014).Rwanda Vision 2020, 2000.Rwanda Housing Authority; Affordable Housing Development Project InRwanda 2011.The Fourth Population and housing census, Rwanda 2012SENNOGA E. B.;DIABATE A. S.; African Economic Outlook, Rwanda 2015.USAID, LAND PROJECT: Land Market Values, Urban Land Policies, and theirImpacts in Urban Centers of Rwanda.World Bank (2015). Doing Business 2015: Rwanda. World Bank 2012; Informal Housing: Reducing Disaster Vulnerability ThroughSafer Construction.Vision 2020 Umurenge programme (VUP).
Websites
http://www.rha.gov.rw/index.php?id=469&tx_ttnews[tt_news]=124&cHash=2d5741fddf91457fa864523996ac8f55http://www.worldbank.org/en/country/rwanda/overviewhttp://focus.rw/wp/2013/09/supplement-land-registration-reforms-boost-doing-business-in-rwanda/http://fortuneofafrica.com/rwanda/financial-institutions/http://www.monpalais.com/2015/03/rwandas-new-housing-project-commence-with-massive-construction/http://www.theeastafrican.co.ke/Rwanda/Business/Cimerwa-turns-to-peat-energy-to-lower-costs/-/1433224/2234412/-/1bru39/-/index.html http://www.newtimes.co.rw/section/ar ticle/2015-01-02/184602/Rwandahttp://www.newtimes.co.rw/section/article/2015-01-19/185101/ https://www.brd.rw/?Mortgage-financing-BRD-takes-lead http://www.numbeo.com/cost-of-living/country_result.jsp?country=Rwanda
Africa Housing Finance Yearbook 2015
163
Senegal
day Senegal remains the pioneer in housing cooperative system in West Africa.The housing cooperatives are granted land by the government and thecooperatives pay the cost of lot servicing. Cost of home construction is financedby the (Banque de l'Habitat du senegal, BHS). The cooperatives also receivedtechnical assistance from BHS. The housing cooperatives of Senegal arecontributing a great deal to the national economy and providing affordable homesfor low income families.
Access to finance
Senegal’s financial sector consists of a diversified range of institutions that are notfully integrated. Some 20 banks are listed by the central bank, as well as twonon-bank financial institutions. Access to finance in the country is low, only about15 percent of the country’s population over the age of 15 have a bank account,seven percent have savings and four percent have loans as stated in global Findex2015. Three major banks control two-thirds of all deposits, and the governmentowns over 25 percent of the shares in seven of the country’s banks. Many factorshinder the country’s banking system from distributing medium-term and long-term credit to businesses and individuals.
The country has a growing microfinance sector, which includes profitablemicrofinance institutions and sound supervision. However, access to finance forhousing and for small and medium-sized enterprises remains a challenge. ForSMME finance, for example, an estimated 80 percent of bank credit applications
Overview
Senegal is a low to middle income country located in West Africa on the AtlanticCoast. The country has about 14.5 million inhabitants, of which more than 50 percentare under 20 years of age, and only 3.5 percent are over 65. Comprising an areaof 196 700 m2, Senegal is highly urbanised: 43 percent of the population live inurban areas, and 49 percent of these are concentrated in Greater Dakar, the capital.Dakar has a concentration of about 547 people per km2.
The tertiary sector dominates the economy, with commerce, transport,telecommunications and other services sub-sectors contributing 60 percent ofeconomic growth. Still, fishing, tourism and agriculture remain important economicactivities. The economy has been growing steadily and growth is expected tocontinue in the future. GDP growth has hovered around four percent since 2010,3.7 percent in 2012, and the GDP initially estimated at 4.9 percent in 2014 wasreversed to 4.5 because of the expected negative impact of Ebola virus outbreak.The economy according to the new development strategy; “Plan SénégalEmergent, (PSE)” is expected to grow by 4.8 percent in 2015.
The country’s average annual rate of inflation was low at 0.7 percent in 2013 and-1.1 percent in 2014 and estimated at two percent in 2016. The economy isparticularly vulnerable to fluctuations in the global price of oil, as Senegal importsall of its fossil fuels to support its energy demands. Power outages and the highcost of electricity led to riots in June 2011. As a result, the government hascommitted itself to implementing energy efficiency measures.
Since independence, housing has been a major concern for the Senegalesegovernment because of scarcity of land and the rate of rural immigration to thecities, especially Dakar. As a result the government has initiated a series ofprogrammes among which are ‘Operation Parcelles Assainies’, implemented in theseventies by OHLM (office des habitats à loyers moderes) and lately by PresidentMack Sal initiative of expanding the capital to outside Dakar to boost infrastructuredevelopment, employment and providing equal opportunity for all Senegalese tobe coming homeowners. The president Wade’s initiatives, ‘”One family-Onehome.” In the 1970s the government supported communities’ initiatives fordevelopment and organised cooperatives with the help of developmentorganisations. The result is that Senegal was the first to implement a housingcooperative system project financed by the government of Senegal and to this
KEY FIGURES
Main Urban Centres Dakar (capital)
Exchange Rate: 1 US$***Inflation 2013 | 2014 (est.) | 2015 (prov.) | 2016 (prov.) *
593.20 West African CFA0.7 | -0.4 | 2.0 | 0.0
Population^ | Population growth rate (2013)^Urban population (% of total)^ | Urbanisation rate (% in 2013)^
14 548 171 | 2.8943.39 | 3.62
GDP / capita (current US$)^ | GDP growth rate (annual %)^GNI / capita, Atlas method (current US$) ^Population below national poverty line*Unemployment rate (%)*Gini co-efficient (year of survey)^^HDI (Global Ranking)" | HDI (Country Index Score)”
1 070.85 | 3.921 05046.79.940.31 (2011)163 | 0.485
Lending Interest Rate^Mortgage Interest Rate (%) | Mortgage Term (years)#Credit % of GDP^Average Mortgages % of GDP° Price To Rent Ratio City Centre** | Outside City Centre**Gross Rental Yield City Centre** | Outside of City Centre**Outstanding home loan (% age 15+)##
...11.00 | 2033.340.07% (2010)......3.90
What is the cost of standard 50kg bag of cement (in US$)? #What is the price of the cheapest, newly built house by a formaldeveloper or contractor (in US$)? #What is the size of this house (in m2)? #What is the average rental price for a formal unit (in US$/month)#What is the minimum plot size for residential property (in m²)#
5.06
21 91546253 – 4,000200
Ease of doing business rank !Number of procedures to register property !Time (days) to register property !Cost (% of property value) to register property !
16157115.20
*** Conmill.com The Currency Converter^ World Bank's World Development Indicators (2014)~ World Bank PovcalNet: an online poverty analysis tool, various years^^ The World Bank's PovCalnet" UNDP's International Human Development Indicators (2014)° Various: Badev et al. "Housing Finance Across Countries: New Data and Analysis" – Unpublished
paper/Hofinet/World Bank## Global Financial Inclusion Database (FINDEX)# CAHF Annual Survey Data (September 2015)! World Bank's Doing Business Survey Data (2015)** Numbeo Online User-Contributed Database

164
are denied because of insufficient collateral. The microfinance sector is highlysaturated, with six major institutions accounting for 87 percent of customers and90 percent of all outstanding credit. In 2015, there were 71 MFIs registered onthe Mix Market, an online source of microfinance performance data and analysis,with 295 606 active borrowers, a gross loan portfolio of US$497 million andUS$414 million deposit. Credit Mutuel du Senegal, CMS has the largest loanportfolio size of US$203 million and the largest savings of US$243 million.According to the World Bank’s 2015 Doing Business Report for ease of gettingcredit, Senegal ranks 131th out of 189 countries. There is one public registry andno private credit bureaus in Senegal.
Senegal has a housing bank (Banque de l’Habitat du Senegal, BHS), founded in1979, which dominates the housing finance sector, although commercial lendersare beginning to chase market share. The main objective of BHS is to finance realestate and homeownership, emphasising the affordable housing market. Accordingto Banque Centrale Des Etats de l’Afrique de l’Ouest (BCEAO), Senegal is themost active country among the member states of UEMOA with housing loans ofBHS representing 30 percent of the total housing loans (CFA203.7 billions) of theunion in 2013. Loans are used to acquire land, to build housing and to purchasehousing. BHS has introduced a housing-savings product that encourages saving forhousing by offering borrowers a reduced interest rate on their loan when theysave 10 percent towards the purchase price. The minimum first payment isCFA50 000 (about US$100) and 3.5 percent interest is paid on the capital at theend of December each year. Short-term, non-mortgage loans dominate BHS’sactivities, however, growing by 50 percent between 2009 and 2010, while long-term loans increased by only 2.3 percent in the same period. Interest rates forloans are low for the continent, at about nine percent. At the end of 2011,the bank’s collection of savings and credit lines amounted to CFA156.5 billion(US$317 million). These consisted mainly of housing savings loans, which increasedby 2.04 percent. In 2012, it was announced that the French Development Agencyhad granted a €8 million (US$10.6 million) credit line to BHS to finance anddevelop Senegal’s mortgage market. The focus of the credit line would be onshort and mid-term mortgages, targeting consumers with an income of less thanCFA35 000 (US$59). The Central Bank of the States of West Africa and theHousing Bank of Senegal have increased the capital of the Housing Bank of Senegalto CFA Francs 10 billion (US$20 million) after having held a meeting related to theincrease in the minimum capital of credit institutions in the WAEMU.
According to Global Findex 2014, only 15 percent of Senegalese over the age of15 have bank accounts, seven percent have formal savings, four percent have aloan from a financial institution, and only 3.9 percent have an outstanding mortgageat a financial institution. Some 41 percent of Senegalese over the age of 15reported having a loan from family or friends, and it is possible that some of theseloans are used for housing purposes. Senegal offers on average 6.8 percentinterest rate, the lowest interest rate in the UEMOA and seven to 15 years bondterm. The minimum down payment is 10 percent of the value of the house andthe homeowner deeds (titre Foncier) as collateral). microfinance institutions at
present do not offer mortgage, although it is possible that borrowers usemicroloans for housing purposes.
Affordability
Housing affordability is limited, given the high price of land and absence of officialor fixed prices. There are very few developers and many speculators whose mainclients are people in the higher income bracket. Rents and prices of a propertydepend on the geographical location, the architectural plan and the quality ofmaterial used for construction. Dakar being a regional headquarters of corporateand international organisations has a concentration of expatriates in the residentialzones where there are varieties of houses, simple well constructed houses,apartments, luxurious villas and condominiums. The majority of Senegalese live inthe suburbs, the HLM and other unplanned settlements. According to AfricanReport 2015, Knight Frank, the average rent for a four bedroom apartment costsUS$4 000 a month. According to a local survey, rents have more than doubledin the past years and a minimum rent of a room for students is CFA50 000(US$84 280). According to the Senegal National Statistics Dakar property surgedby about 256 percent between 1994 and 2010. In 2012, a 150m2 plot of landcosts about CFA2.5 million (US$4 214.43), although it can cost as much asCFA4 million (US$7 743.08) in high income areas, and as little as CFA1.7 million(US$2 865.81) in more remote areas. When developed as a four-roomed house,the property can sell for CFA25 million (US$49 202), and in wealthier areas forCFA55 million (US$108 246). The rental prices range between CFA150 000 toCFA500 000 (US$ 253 to US$ 843).
About 60 percent of the population earn less than US$2 a day which makes thecheapest house unaffordable. The cheapest newly built house is a three bedroomhouse built on 150 m2 in Diamniiadio suburb of Dakar and sold for CFA13 000 000(US$21 915) with a mortgage monthly payment of CFA88 627 (US$149.40) for15 years. The government efforts to make homes affordable are undermined byspeculators who end up buying government subsidised homes intended for lowincome families from the beneficiaries.
Housing supply
Most houses in Senegal (about 80 percent of urban housing) is self-built withcement, concrete and stone with corrugated iron for the ceiling, without anarchitect, and at a total cost of less than CFA Francs 30 million (US$50 573) orwell above depending on the plan, the geographical situation and the quality ofmaterial used. Informal settlements account for 25 percent of urban spaces inSenegal and for 30 percent of inhabited areas in Dakar. In fact, the dominance ofinformal housing construction may be due to the building code, which onlyrequires architectural plans and building permits for buildings costing more thanCFA Francs 30 million (US$50 573). The building code though supportsincremental construction, but in the absence of any regulation or constructionexpertise hazardous building practices are rampant. In September 2012, floodingin Dakar destroyed more than 10 000 homes and 33 000 families were displaced
> $50 000
$25 000 – $50 000
$14 000 – $25 000
$8 000 – $14 000
$5 000 – $8 000
$3 600 – $5 000
$2 400 – $3 600
$1 600 – $2 400
$800 – $1 600
<$800
- - - Average income needed for the cheapest newly built house by a formal developer, 2012- - - Average annual urban household income, 2014
SENEGAL
$8 256
$7 959
Rural | UrbanAnnual household income US$
No. of households (thousands) 250 200 150 100 50 0 50 100 150 200 250
Africa Housing Finance Yearbook 2015
165
in 2009 due to floods. A critical issue in Dakar is the rapid urbanisation rate andthe city’s inability to keep up with the necessary water drainage and seweragesystems. According to the Secretary General of Ministry of Economy, Financesand Planning, demand for housing is estimated at 300 000 units per year whilesupply is about 50 000 which means a deficit of 250 000. There are severalconstraints to the housing supply, especially for low income earners. A lack offormal market players, limited availability of serviced land, limited availability ofrelevant financial products, high construction costs and weak policy all constrain themarket. In response to these challenges, the government introduced its ‘one familyone roof ’ initiative, focusing on the affordable housing market to address thedemand for housing. The provisions in the programme include free housing andland, tax breaks and a range of subsidies which are offered to homebuyers whopurchase housing that costs less than US$15 000. Implementation is slow, however,and the supply of housing insufficient. A land regularisation programmeadopted by the government in 1991 is equally slow: by 2010, only 6 469 plotshad been regularised. To boost housing supply, the government has granted in2015 CFA1 billion (US$ 1 685 772) to Fonds de garantie pour des investissementsprioritaires “Fongip” to create a special guarantee fund for small and mediumenterprises in the housing sector (Fonds de garantie pour l’acqusition dulodgement (Fogalog), to facilitate access to financing for small and mediumenterprises, SME in the sector. Fongip is a national guarantee fund created tofacilitate access to financing SMEs who are in the sectors considered to be on thegovernment’s agenda priority among which is low income houses. The fund isamong the innovative instruments to boost the economy of Senegal as plannedin the (Le Plan Senegal Emergent, PSE.) Housing especially low income houses areamong the top priorities, and the government of Senegal plan to use Fogalog tobridging the gap between housing supply and demand.
Senegal ranks 151 in the World Bank’s 2015 Doing Business Report in dealingwith construction permits, with five procedures required and an estimated 71 daysto get a construction permit; and improved its ranks in doing business 2015, 161st
out of 189 countries compared to 171st in 2014. Property registration and theprocedure costs at 15.2 percent of the property value remains the highest in theUEMOA. Still, the housing backlog in Senegal has made this a country of particularinterest for investors. Shelter Afrique has been working in Senegal for some timeand have completed 18 projects, with a further five projects ongoing in 2015. Theprojects range in price from US$1 million to US$8 million. Shelter Afrique hasapproved a CFA Francs 2.7 billion project in Espace Mamelles (15 minutes fromdowntown Dakar) to develop 120 apartments partially funded through a leasepurchase scheme offered by the developer. The apartments will be set in 12building blocks, each comprising 10 two and three bedroom units spread overfour floors.
Habitat for Humanity has provided construction and financial services in Senegalsince 2001. Working with housing co-operatives, the NGO has supported theconstruction of over 300 houses. Since 2009, the emphasis has been onsupporting households to improve the quality of their housing, providingconstruction technical assistance specifically to address the risk of flooding, as wellas affordable housing microfinance. Housing supply is expected to be boosted bythe various programme of the government among which is the development ofa new urban centre (Le pole urbain de Diamniando).
Property markets
Senegal property market is booming. In 2011, the government of Senegal passeda new Land Tenure Act la loi No 2011-07 du 30 mars 20110, ensuring security oftenure. The Act authorises the holders of temporary occupancy permits in urbancentres to transform them, at no cost, into permanent title deeds. The goal of theAct is to promote the development of mortgage activities and induce capitalisationof properties. With reinforced security of tenure, it is expected that landlords willinvest in upgrading their properties. Most houses in the capital have beenupgraded and land and homes prices have escalated. Dakar residents and evenSenegalese in diaspora are taking advantage of the new law, for many areregistering their properties and the values of property are appreciating. This resultis expected to be duplicated in other regions of the country.
The rental market in Senegal is said to favour the landlord. In theory, rents onresidential leases are fixed by law according to the market value of the premises.In practice, however, rents are decided solely by the landlord. Presently, there is
little financing available for producing rental housing on a large scale but the marketis promising, considering the efforts of the government in securing long-termfinancing for affordable homes to sustain the growth in the sector.
According to real estate consultancy Knight Frank’s 2015 property report forSenegal, the residential construction market is quite dynamic, with a fewdevelopments along the coast particularly the waterfront scheme. Middle to lowincome households can expect housing development along the AutoRoute andDiaminadio about 30 km from Dakar. The property market is strongly influencedby the importance of the informal sector but the government is providingincentives among which are Fongip to lure informal entreprises to becomingformal. The incentives to promote formal enterprises and the new Land TenureAct hopefully will stimulate the formalisation of the real estate market.
Policy and regulation
Senegal’s housing sector suffers under a complex legal and regulatory framework.UN-Habitat reports that 12 central departments of the various ministries areinvolved in processes related to housing. Coordination between these bodies iscomplicated, and this creates delays in the process and cost overruns. The opacityof the system undermines the enforcement of laws and regulations, or worse,supports corrupt responses. Law 96-06 of March 1996 (Local CommunitiesCode) sought to transfer land management responsibilities and powers tomunicipalities and local administrations. While this was intended to improvemanagement, the law did not deal with the customary and informal practices thatexisted. This has resulted in a management stalemate, and as UN-Habitat suggests,reinforces the proliferation of squatter settlements.
The government’s regulatory efforts to improve access to housing for the averageSenegalese and low income families is not yielding expected results; on thecontrary it has burdened the low income earners and frustrated housingcooperatives and other syndicates. Other laws/policies influencing housing include;
n Rural land Tenure adopted in 2009: Enables legal recognition of rightslegitimated by customary rules and practices. It reinforces the decentralizationand devolution of the authorities over land matters. Provides for formalizationof individual and collective use rights and the possibilities of transferring theserights into private titles. Decentralizes land administration and allowsdecentralization and allows for registration of customary land rights.
n Rent control law adopted in 2014 (Loi 04 2014): Reduce monthly rents in thefollowing brackets: 29% for monthly payment between CFA0 to 150 00014% between CFA150 000to 500 000, 4% monthly payment aboveCFA500 000.
Opportunities
The Senegal housing market is flourishing due to a number of factors among whichare its geographical situation, the political stability, the ambitious infrastructureprogramme of the current government, the presence of many internationalorganisations and development agencies, dynamic cultural events, and a robusttourist industry.
Dakar, the capital, is the home to the regional headquarters of many internationalorganisations and some regional organisations. The current growth rate, the rateof urbanisation, the government infrastructure programme and the commitmentof the African Development Bank to support the government programmes, areindicators that the housing boom is here to stay.
The current boom has concealed the poor performance of Senegal as far asdealing with construction and registration of property (World Bank’s 2015 DoingBusiness Report). Although the country has improved its business climate still thegovernment needs to address the complexity of the housing policies so thataverage and low income families can benefit from the housing boom.

166
Sources
Average cost of construction: Profil du Secteur Logement du Senegal ONU-Habitat 2012.Rent High Income: Africa Report 2015 Knight Frank. Rent rural areas: J.O 6523 du 13/05/2010.African Economic Outlook Statistics. African Economic Outlook (2015).African Report 2015, Franck Knight. BCEAO. Annuaire des Banques et Etablissement Financiers de l’UEMOA 2013.BCEAO. Rapport Annuel 2014.BCEAO. Notes d’Analyse Sur Les Conditions de Financement Bancaires del’Habitat dans les pays de l’UEMOA Octobre 2014.Demirguc-Kunt, A. and Klapper, L. (2012). Measuring Financial Inclusion: TheGlobal Findex. World Bank Policy Research WP 6025.Diallo, A. (2003). Regulation and Supervision of Microfinance NGOs in Senegal. Diop, C. (undated). Urban Decentralisation Development Program. Faye, J. (2008). Land and Decentralisation in Senegal. Financial Standards Foundation (2009). Country Brief: Senegal. Jenkins, H. (2010). The Impact of Regulation of MFIs on Microlending in Senegal.Eastern Mediterranean University.Mbow, C., Diop, A. and Diaw, A.T. (2009). Flood Risk and Land Occupation inDarkar Outskirts. Does Climate Variability Reveal Inconsistent UrbanManagement?Payne, G., Rakodi, C. and Durand-Lasserve, A. (2008). Social and EconomicImpacts of Land Titling Programmes in Urban and Peri-Urban Areas:International Experience and Case Studies of Senegal and South Africa. UNDP (2012). Senegal: National Greenhouse Gas Reduction programmethrough Energy Efficiency in the Built Environment. Proposal under Regional:SPWA-CC: GEF Strategic programme for West Africa: Energy Component(PROGRAM) to be funded under the GEF Trust Fund. UN-Habitat (2011). Low Income Housing: Approaches to Helping the UrbanPoor Find Adequate Housing in African Cities. UN-Habitat (2012). Housing Sector Profile. Senegal.World Bank (2015). Doing Business 2015: Senegal.
Websites
www.africainvestor.com www.africaneconomicoutlook.org www.bceao.intwww.bhs.sn www.citiesalliance.org www.doingbusiness.orgwww.globalpropertyguide.comwww.hofinet.orgwww.housingfinanceafrica.orgwww.housinginternational.coopwww.knightfranck.comwww.mfw4a.org www.mixmarket.org www.seneweb.comwww.shelterafrique.orgwww.thegef.org www.unhabitat.orgwww.worldbank.org

Africa Housing Finance Yearbook 2015
167
Seychelles
largest banks have a 69.5 percent share in the system’s total assets. Lending rategoes up to 11.65 percent.
Access to finance in the Seychelles is moderate. The International Monetary Fundreports that there are 37.21 commercial bank branches per 100 000 adults and67.39 ATMs per 1 000 km2 (or 51.21 ATMS per 100 000 adults – 2012).Outstanding loans from commercial banks as a percentage of GDP are 36.23 percent.The levels of bank lending to individuals and business are also low, even as mostof the banking assets held are in government obligations. Seychelles scores 171st
out of 189 countries on the World Bank’s ‘ease of getting credit’ indicator, accordingto its 2015 Doing Business Report, falling one place from 170th the previous year.Microfinance is extremely limited, but growing slowly as international microfinanceinstitutions begin to infiltrate the local financial services market. As part of thecountry’s private sector development strategy, the government worked with theInternational Finance Corporation to put in place regulations to create a creditinformation system, which became operational on 1 July 2012. The World Bank,together with the Seychelles government, prepared a Country PartnershipStrategy (CPS) in 2012, focusing on reducing vulnerability to external shocks,building competitiveness, strengthening public-sector management and restructuringsocial-service provision. This CPS is worth approximately US$7 million a year (totalof US$21 million) and will also support Seychelles' attempts to develop andmanage an oil industry, should commercially viable reserves be identified. The IFC,the World Bank's private sector arm, will play a key role in the CPS, with aparticular focus on the financial sector, small and medium-sized enterprises, capital-
Overview
The Seychelles is a tiny country, comprising 115 islands covering a widegeographical area in the Indian Ocean, northeast of Madagascar. With a smallpopulation of only about 92 000 people (2015 estimate), the Seychelles is rankedthird in terms of human development in Africa, with its Human DevelopmentIndex ranking 71st globally for the year 2014. It has met most of the MillenniumDevelopment Goals. The Seychellois economy is heavily dependent on the globaleconomic environment. Tourism dominates the economy and is the mainemployer. Fisheries are the country’s most important export sector, accountingfor over 90 percent of export revenues, but represent only about 11 percent ofemployment.
During 2014, the overall fragile state of the world economy proved challenging,particularly the weak performance of the euro area which has strong economiclink with Seychelles. Hence, from 6.6 percent in 2013, growth in real terms for theyear 2014 was at a lower rate of 2.8 percent.
The World Bank 2015 Doing Business report ranked Seychelles 85 out of 189countries in the Ease of Doing Business Index, a decline of five places comparedto a ranking of 80 in 2014.
Inflation has fluctuated considerably in the past few years as a result of exchangerate issues and a consequent depreciation of the rupee. From about 5.3 percentin 2007, it peaked at 31.8 percent in 2009, and by 2010 dropped quickly to a rateof -2.4 percent, due to the stability of commodity prices, the adjustment ofmonetary policies and the emergence of more conservative bank lending. In 2012,the average rate of inflation was 7.1 percent, reducing to an average of 4.3 percentin 2013 and going down further to 1.4 percent as at December 2014.
Access to finance
The Seychelles has a relatively well developed financial system. Nine banks arelisted on the Central Bank of Seychelles website, together with 13 ‘class A’exchange bureaux and 11 ‘class B’ exchange bureaux, three non-bank financialinstitutions (the Development Bank of Seychelles, the Seychelles Credit Union andthe Housing Finance Company), four domestic insurance companies, three non-domestic insurance companies and multiple insurance intermediaries. The two
KEY FIGURES
Main Urban Centres Victoria (capital)
Exchange Rate: 1 US$***Inflation 2013 | 2014 (est.) | 2015 (prov.) | 2016 (prov.) *
12.96 Seychelles Rupee (SCR)4.5 | 3.5 | 3.5 | 3.0
Population^ | Population growth rate (2013)^Urban population (% of total)^ | Urbanisation rate (% in 2013)^
91 526 | 1.7953.56 | 2.41
GDP / capita (current US$)^ | GDP growth rate (annual %)^GNI / capita, Atlas method (current US$) ^Population below national poverty line*Unemployment rate (%)*Gini co-efficient (year of survey)^^HDI (Global Ranking)" | HDI (Country Index Score)”
16 185.90 | 5.313 99037.8...65.12 (2006)71 | 0.756
Lending Interest Rate^Mortgage Interest Rate (%) | Mortgage Term (years)#Credit % of GDP^Average Mortgages % of GDP° Price To Rent Ratio City Centre** | Outside City Centre**Gross Rental Yield City Centre** | Outside of City Centre**Outstanding home loan (% age 15+)##
11.6512.50 | 3026.273.31% (2013).........
What is the cost of standard 50kg bag of cement (in US$)? #What is the price of the cheapest, newly built house by a formaldeveloper or contractor (in US$)? #What is the size of this house (in m2)? #What is the average rental price for a formal unit (in US$/month)#What is the minimum plot size for residential property (in m²)#
7.56
160 000100......
Ease of doing business rank !Number of procedures to register property !Time (days) to register property !Cost (% of property value) to register property !
854337.00
*** Conmill.com The Currency Converter^ World Bank's World Development Indicators (2014)~ World Bank PovcalNet: an online poverty analysis tool, various years^^ The World Bank's PovCalnet" UNDP's International Human Development Indicators (2014)° Various: Badev et al. "Housing Finance Across Countries: New Data and Analysis" – Unpublished
paper/Hofinet/World Bank## Global Financial Inclusion Database (FINDEX)# CAHF Annual Survey Data (September 2015)! World Bank's Doing Business Survey Data (2015)** Numbeo Online User-Contributed Database
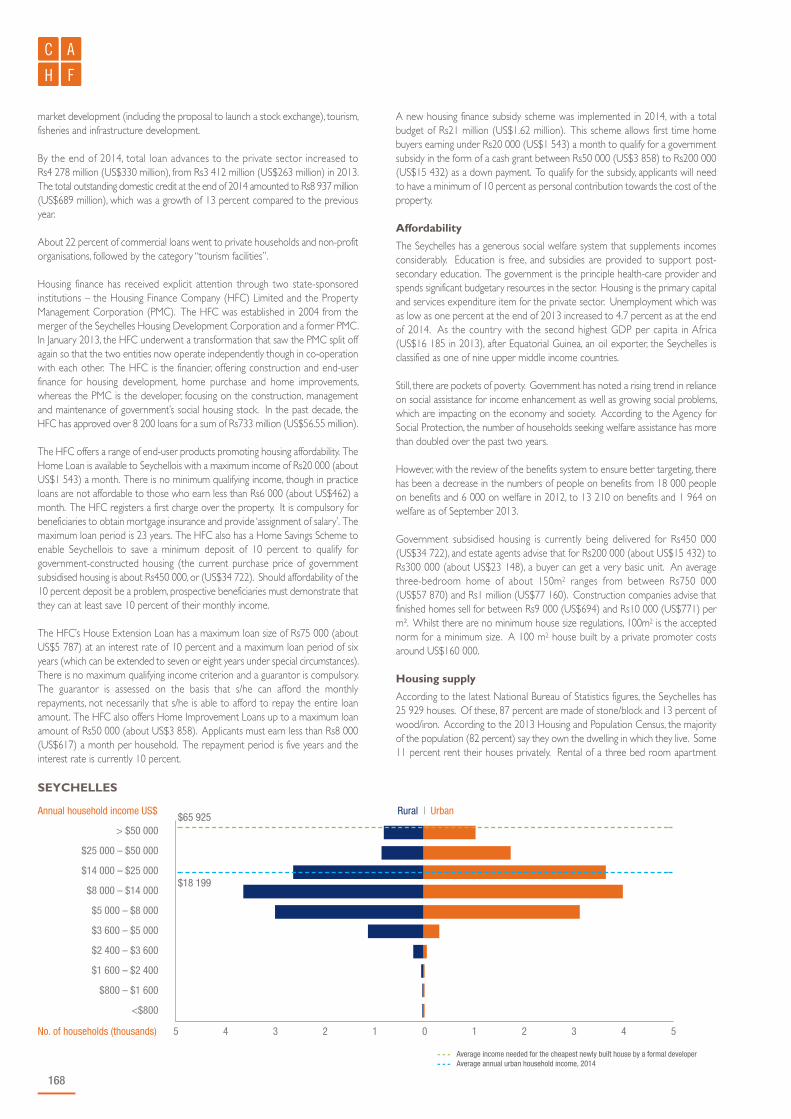
168
market development (including the proposal to launch a stock exchange), tourism,fisheries and infrastructure development.
By the end of 2014, total loan advances to the private sector increased toRs4 278 million (US$330 million), from Rs3 412 million (US$263 million) in 2013.The total outstanding domestic credit at the end of 2014 amounted to Rs8 937 million(US$689 million), which was a growth of 13 percent compared to the previousyear.
About 22 percent of commercial loans went to private households and non-profitorganisations, followed by the category “tourism facilities”.
Housing finance has received explicit attention through two state-sponsoredinstitutions – the Housing Finance Company (HFC) Limited and the PropertyManagement Corporation (PMC). The HFC was established in 2004 from themerger of the Seychelles Housing Development Corporation and a former PMC.In January 2013, the HFC underwent a transformation that saw the PMC split offagain so that the two entities now operate independently though in co-operationwith each other. The HFC is the financier, offering construction and end-userfinance for housing development, home purchase and home improvements,whereas the PMC is the developer, focusing on the construction, managementand maintenance of government’s social housing stock. In the past decade, theHFC has approved over 8 200 loans for a sum of Rs733 million (US$56.55 million).
The HFC offers a range of end-user products promoting housing affordability. TheHome Loan is available to Seychellois with a maximum income of Rs20 000 (aboutUS$1 543) a month. There is no minimum qualifying income, though in practiceloans are not affordable to those who earn less than Rs6 000 (about US$462) amonth. The HFC registers a first charge over the property. It is compulsory forbeneficiaries to obtain mortgage insurance and provide ‘assignment of salary’. Themaximum loan period is 23 years. The HFC also has a Home Savings Scheme toenable Seychellois to save a minimum deposit of 10 percent to qualify forgovernment-constructed housing (the current purchase price of governmentsubsidised housing is about Rs450 000, or (US$34 722). Should affordability of the10 percent deposit be a problem, prospective beneficiaries must demonstrate thatthey can at least save 10 percent of their monthly income.
The HFC’s House Extension Loan has a maximum loan size of Rs75 000 (aboutUS$5 787) at an interest rate of 10 percent and a maximum loan period of sixyears (which can be extended to seven or eight years under special circumstances).There is no maximum qualifying income criterion and a guarantor is compulsory.The guarantor is assessed on the basis that s/he can afford the monthlyrepayments, not necessarily that s/he is able to afford to repay the entire loanamount. The HFC also offers Home Improvement Loans up to a maximum loanamount of Rs50 000 (about US$3 858). Applicants must earn less than Rs8 000(US$617) a month per household. The repayment period is five years and theinterest rate is currently 10 percent.
A new housing finance subsidy scheme was implemented in 2014, with a totalbudget of Rs21 million (US$1.62 million). This scheme allows first time homebuyers earning under Rs20 000 (US$1 543) a month to qualify for a governmentsubsidy in the form of a cash grant between Rs50 000 (US$3 858) to Rs200 000(US$15 432) as a down payment. To qualify for the subsidy, applicants will needto have a minimum of 10 percent as personal contribution towards the cost of theproperty.
Affordability
The Seychelles has a generous social welfare system that supplements incomesconsiderably. Education is free, and subsidies are provided to support post-secondary education. The government is the principle health-care provider andspends significant budgetary resources in the sector. Housing is the primary capitaland services expenditure item for the private sector. Unemployment which wasas low as one percent at the end of 2013 increased to 4.7 percent as at the endof 2014. As the country with the second highest GDP per capita in Africa(US$16 185 in 2013), after Equatorial Guinea, an oil exporter, the Seychelles isclassified as one of nine upper middle income countries.
Still, there are pockets of poverty. Government has noted a rising trend in relianceon social assistance for income enhancement as well as growing social problems,which are impacting on the economy and society. According to the Agency forSocial Protection, the number of households seeking welfare assistance has morethan doubled over the past two years.
However, with the review of the benefits system to ensure better targeting, therehas been a decrease in the numbers of people on benefits from 18 000 peopleon benefits and 6 000 on welfare in 2012, to 13 210 on benefits and 1 964 onwelfare as of September 2013.
Government subsidised housing is currently being delivered for Rs450 000(US$34 722), and estate agents advise that for Rs200 000 (about US$15 432) toRs300 000 (about US$23 148), a buyer can get a very basic unit. An averagethree-bedroom home of about 150m2 ranges from between Rs750 000(US$57 870) and Rs1 million (US$77 160). Construction companies advise thatfinished homes sell for between Rs9 000 (US$694) and Rs10 000 (US$771) perm2. Whilst there are no minimum house size regulations, 100m2 is the acceptednorm for a minimum size. A 100 m2 house built by a private promoter costsaround US$160 000.
Housing supply
According to the latest National Bureau of Statistics figures, the Seychelles has25 929 houses. Of these, 87 percent are made of stone/block and 13 percent ofwood/iron. According to the 2013 Housing and Population Census, the majorityof the population (82 percent) say they own the dwelling in which they live. Some11 percent rent their houses privately. Rental of a three bed room apartment
> $50 000
$25 000 – $50 000
$14 000 – $25 000
$8 000 – $14 000
$5 000 – $8 000
$3 600 – $5 000
$2 400 – $3 600
$1 600 – $2 400
$800 – $1 600
<$800
- - - Average income needed for the cheapest newly built house by a formal developer - - - Average annual urban household income, 2014
SEYCHELLES
$65 925
$18 199
Rural | UrbanAnnual household income US$
No. of households (thousands) 5 4 3 2 1 0 1 2 3 4 5

Africa Housing Finance Yearbook 2015
169
ranges from Rs16000 (US$1 234) to Rs19000 (US$1 466). Just under sevenpercent say they live rent free in a dwelling they do not own. The vast majorityof households (93 percent) have access to treated, piped water, and 82.4 percenthave flush toilets connected to a septic tank. In terms of energy use, 98 percentuse electricity for lighting and 92 percent use gas for cooking. In addition, 94 percentof the population has access to mobile phone and 95 percent possess a televisionset.
The Central Bank reports that a slight increase of one percent has been noted inthe construction sector in 2014. However, some major construction projects arein the pipeline. The government has continued to focus its investments in publicinfrastructure such as roads, water and energy. In fact production statistics showedan increase of 12 percent and 9.9 percent in the production of crusher/concretedust and aggregates, respectively. However, block production declined by 5.7 percent,in view of increased competition from block and brick imports.
A Rs 90 million (US$6.94 million) grant from the Chinese government wasreceived in March 2012, targeted at a variety of local projects, including housingand solar energy products. In 2013, development grants amounted to Rs129 million,allocated to the Public Utilities Corporation (Rs125 million), and the SeychellesPublic Transport Corporation (Rs4.0 million).
In 2014, at least four housing projects have been identified, sponsored by theUnited Arab Emirates (UAE) Government (Rs72.3 million), Corgat Estate housingproject from the Chinese Government amounting (Rs21 million) and a capitalgrant from the Indian Government (Rs66.2 million).
There is no legislation governing the minimum size of a plot of land. Propertiescan range from as small as 200 m2 to sizeable small holdings. Anecdotally, quite alot of land is privately held, with prices ranging from Rs125 per m2 (about US$9.64)to Rs375 per m2 (about US$28.93) for unserviced land. Serviced land averagesabout Rs1 000 per m2 (about US$77.16).
Property market
The Seychellois property market is strong, driven primarily by the tourist industry.Real estate websites advertise properties in US dollars or euros, and investorsbuy new and existing properties, as well as land. Land in the country is in greatdemand, and the tourism and agricultural industries compete with the housingindustry for sites. Conflicts over land and housing are set to deepen as theurbanisation rate continues to grow.
The Seychelles ranks 78th out of 189 countries according to the World Bank’s2015 Doing Business Report for the indicator ‘ease of registering property’. Thefour procedures take 33 days and cost seven percent of the property value.
Policy and regulation
The Ministry of Land Use and Housing is intent, through a variety of measures, onensuring access to adequate housing for all Seychellois. Though the governmentcontinues to develop innovative programmes to address the demand foraffordable housing, there is a need to increase its capacity to meet the considerabledemand in the affordable and low income markets.
The government of Seychelles plans to spend Rs1.2 billion (US$92.5 million) oncapital investment projects in 2015. The highest share – Rs329 million (US$25.3 million)– will be allocated to social housing and community development projects in anongoing effort to provide affordable housing and community services.
In 2012, Seychelles adopted a new housing policy under which the governmentpledges to work closely with financial institutions by encouraging the supply offinance within the housing sector. Accordingly, the government worked with theSeychelles Housing Finance Company to ensure that people who earn less thanRs8 000 (US$617) a year are able to access lower interest rates. The governmentof Seychelles has obtained assistance from the World Bank with regard to technicalassistance for social housing. The Financial Services Authority Act, 2013, led to thecreation of the Financial Services Authority, the regulator for non-bank financialservices in the Seychelles.
Opportunities
The Seychelles has been ranked 85th out of 189 countries overall in the WorldBank’s 2015 Doing Business Report. With the country being a tourist destination,there is a focus on housing for the high income class, and the property market islimited to the luxury market. House prices in Mahe, the largest of the islands, canstar t at US$160 000, a furnished two-bedroom house selling up to aboutUS$1 000 000. In a bid to open the country to more foreign investment, recentchanges in the law of property ownership have been approved to offer freeholdtitle and residency rights to foreign owners and their immediate families.
Sources
Central Bank of Seychelles (2014). Annual Report 2014.Financial Standards Foundation (2010). Country Brief: Seychelles. International Monetary Fund (2010). IMF Country Report: Seychelles. National Bureau of Statistics (2010). Population & Housing Census 2013.Highlights.National Bureau of Statistics (2013). Seychelles in Figures.UN-Habitat (2004). Human Settlements Country Profile: Seychelles. United Nations Development Programme (2007). Capacity Development forSustainable Land Management in Seychelles. United Nations Research Institute for Social Development (2009). Social Policyin the Seychelles. World Bank. (2015). Doing Business 2015 Report: Seychelles. International Finance Corporation, Country Partnership Strategy for theRepublic of Seychelles, FY 2012 – 2015, 2012
Websites
www.afdb.orgwww.africaneconomicoutlook.orgwww.afrol.comwww.cbs.schttp://fas.imf.orghttp://www.globalpropertyguide.com/www.luh.gov.scwww.mfw4a.orgwww.nation.scwww.nsb.gov.scwww.nytimes.comhttp://www.seychellesweekly.com/www.sib.gov.scwww.statehouse.gov.sc

170

Africa Housing Finance Yearbook 2015
171
Sierra Leone
It is estimated that Sierra Leone’s fiscal deficit, as a share of GDP, increased from3.9 percent in 2014 to 4.8 percent in 2015, owing mainly to three developmentswithin this period: high expenditure on tackling Ebola, a remarkable slowdown ofeconomic activities due to Ebola, and a significant lowering of mining revenue dueto suspension of iron ore mining. This deficit situation is, however, expected to easeto 4.2 percent in 2016 as the effects of Ebola and of the suspension of miningactivities in the country continue towards the end of 2015 until the recovery fromEbola gain grounds. In this regard, a 5.5 percent fiscal rebound for 2016 is expectedas investment picks up.
The inflation rate was estimated at 8.50 percent in September 2015, up by almosttwo percent points from the 7.3 inflation rate in 2014. The tight monetary policythat is being implemented currently is helping to keep food prices low while alsokeeping inflation in the country to a minimum. The lack of infrastructure, a poorlytrained labour force and an unattractive environment for the private sector are keyissues that the Sierra Leonean government must face if it is to maintain its growthlevels. Unemployment has remained unchanged in 2015 from 2014 at 3.4 percent.The Sierra Leone government has developed the Agenda for Prosperity Strategyto drive economic growth and employment in the country from 2013 to 2017.
An estimated 40 percent of Sierra Leone’s population live in urban areas with anurban population growth rate of 2.74 percent. With the rapid spate ofurbanisation, the country has witnessed a significant explosion of urban centresespecially Freetown, the nation’s capital. This has led to the development of many
Overview
Sierra Leone, a country situated in West Africa and bordered by Guinea, Liberiaand the Atlantic Ocean, is one of the world’s poorest nations with a ranking of 183in the 2014 UNDP’s Human Development Index. Since the end of the civil warin 2002, the country has made progressive strides towards development. GDPgrowth was most dramatic immediately after the war, reaching 9.4 percent in 2004,but coming down to its lowest rate, 3.2 percent, in January 2010. In 2012, GDPgrowth was measured at 5.9 percent due to the slow recovery in the mining sector,most specifically iron ore production. Current estimates have put economicgrowth rate as slowing down to six percent in 2014 compared to the originalprojection of 13.8 percent. GDP growth rate is projected to go as low as-2.5 percent in 2015 and the economy is projected to recover slightly reaching2.8 percent in 2016. This projected GDP was not realised due to suspension ofoperation by major iron ore mining companies like the African Minerals andLondon Mining companies as a result of dramatic fall in global iron ore prices. Theeconomic slowdown can also be attributed to the Ebola epidemic that hit thecountry in the middle of 2014. Agriculture remains the biggest contributor toGDP (52.7 percent in 2013) and 47.9 percent in 2014, industry (inclusive ofmining) at 18.6 and services at 33.5 percent. The construction sector continuedto slow in 2013 and 2014, to 1.3 and 1.2 percent of GDP respectively.
Much foreign direct investment, previously in the pipe line, is likely to be cancelled.Domestic activity will shift towards government consumption as the recoveryeffort focuses on Ebola containment. Gross domestic product (GDP) in 2014was estimated to be over $400 million lower than under the projection beforeEbola. For 2015 the loss in GDP is projected to be over $900 million.
A 2014 UNDP Human Development Index report has pointed out that despiterecent economic growth, multidimensional poverty and inequality remains veryhigh. In a country of an estimated population of 6.2 million, the report noted thatincome pover ty is 52.9 percent (those earning less than $2/day) and that72.7 percent of Sierra Leoneans are multi-dimensionally poor, among the highestin the world. This means that almost three quarters of Sierra Leone’s populationlive below the poverty line and faced deprivations such as poor health facilities, lackof educational opportunities, inadequate living standard, lack of income,disempowerment, poor quality of work and threat from violence.
KEY FIGURES
Main Urban Centres Freetown (Capital)
Exchange Rate: 1 US$***
Inflation 2013 | 2014 (est.) | 2015 (prov.) | 2016 (prov.) *
3892.68 Sierra LeoneanLeone (SLL)9.8 | 10.0 | 9.4 | 8.3
Population^ | Population growth rate (2013)^Urban population (% of total)^ | Urbanisation rate (% in 2013)^
6 205 382 | 1.8439.58 | 2.74
GDP / capita (current US$)^ | GDP growth rate (annual %)^GNI / capita, Atlas method (current US$) ^Population below national poverty line*Unemployment rate (%)*Gini co-efficient (year of survey)^^HDI (Global Ranking)" | HDI (Country Index Score)”
788.41 | 6.9872052.93.435.35 (2011)183 | 0.374
Lending Interest Rate^Mortgage Interest Rate (%) | Mortgage Term (years)#Credit % of GDP^Average Mortgages % of GDP° Price To Rent Ratio City Centre** | Outside City Centre**Gross Rental Yield City Centre** | Outside of City Centre**Outstanding home loan (% age 15+)##
19.4121.00 | 204.83.........9.34
What is the cost of standard 50kg bag of cement (in US$)? #What is the price of the cheapest, newly built house by a formaldeveloper or contractor (in US$)? #What is the size of this house (in m2)? #What is the average rental price for a formal unit (in US$/month)#What is the minimum plot size for residential property (in m²)#
10.00
50 0008083150
Ease of doing business rank !Number of procedures to register property !Time (days) to register property !Cost (% of property value) to register property !
14075610.80
*** Conmill.com The Currency Converter^ World Bank's World Development Indicators (2014)~ World Bank PovcalNet: an online poverty analysis tool, various years^^ The World Bank's PovCalnet" UNDP's International Human Development Indicators (2014)° Various: Badev et al. "Housing Finance Across Countries: New Data and Analysis" – Unpublished
paper/Hofinet/World Bank## Global Financial Inclusion Database (FINDEX)# CAHF Annual Survey Data (September 2015)! World Bank's Doing Business Survey Data (2015)** Numbeo Online User-Contributed Database

172
informal settlements and slums in Freetown now boasting of over 28 informalsettlements. This has posed significant challenges to both local and nationalgovernment authorities in terms of overcrowded neighbourhoods, and putenormous pressure on the delivery of social services. The Ebola outbreak whichnearly brought the country to a complete stop brought the issue of slums into theforefront as it makes contact tracing of suspected Ebola patients insurmountable.
Access to finance
Sierra Leone is home to 13 commercial banks (six Nigerian, one British, oneGerman, one Malaysian and one from Togo, along with two state-owned banksand one domestic private bank), nine insurance companies and three housingfinance companies (Sierra Leone Housing Corporation, Alliance Housing FinanceCompany Limited and Home Finance Company Limited). With support fromdevelopment partners, around 60 Financial Services Associations and 20community banks have been established throughout the country to help withfinancial intermediation. Commercial banks are well capitalised and looking forinnovative ways to serve the market with new products and services.
At the end of the 2013 financial year, credit to the private sector given bycommercial banks expanded by 1.75 percent, from Le971.65 billion ($390 million)at the end of June 2013 to Le988.55 billion ($450 million) at end December 2013.The domestic credit of private sector in 2014 accounted for 4.8 percent of GDP.Commercial banks’ resource base increased by 21.3 percent during 2012 asdeposits had increased by 22.74 percent, from Le2.3 trillion (US$530 million)to Le2.83 trillion (US$650 million). Savings increased by Le162.18 billion(US$370 000), bringing the total to Le692.94 billion (US$160 million). Non-performing loans as a percentage of total gross loans decreased from 15.1 percentin 2011 to 14.7 percent in 2012, and the capital-asset ratio of the banks was at15 percent. Estimated non-performing loans in commercial banks across thecountry were estimated at 18 percent in 2014. Interest rates for loans in somecommercial banks in 2015 vary from 15, 16 and 17 percent, whilst prime lendingrates are at 17 percent.
In 2008, Sierra Leone adopted a strategy for reform of the financial sector tostrengthen banking supervision, enhance competition, increase access tocommercial bank finance and improve the payment system. The financial sectorstill faces a number of challenges such as the high costs of financing, operatingcosts and limited bank branch infrastructure. The high concentration of thebanking sector also limits competition. These factors contribute to the low shareof credit to the private sector.
The Sierra Leone Stock Exchange started operating in 2001 as a private company.The three housing finance companies – Sierra Leone Housing Corporation,Alliance Housing Finance Company Limited and Home Finance Company Limited– are listed on the Bank of Sierra Leone website. The National Social Security andInsurance Trust (NASSIT) was established in 2004 with a mandate to administerSierra Leone's National Pension Scheme. Under this programme NASSIT decidedto invest in housing finance and has been the key financier of Home FinanceCompany (HFC) Mortgage. NASSIT have also helped fund Regimauel GrayEstates, which is one of the leading Real estate Developers in the country toconstruct 10 high income housing units that were going for a purchase price ofabout US$100 000. HFC Mortgage and Savings Bank offers eight differentmortgage products – Home Purchase Mortgage, Group Scheme ConstructionStage Payment, Home Completion Mortgage, Home Improvement Mortgage,Home Equity Mortgage, Buy Land and Build Own Home Mortgage, ConstructionFinance Mortgage and Construction Stage Payment Mortgage.
All mortgage products are offered to residents and non-resident Sierra Leoneans,although with longer repayment periods, and lower deposits required, for residents.The Home Purchase Mortgage and Group Scheme Construction Stage Paymentproducts offer a maximum loan amount of US$120 000 for a 20-year term, witha 20 percent deposit (for residents). The average 20-year fixed rate mortgagedipped from 4.58 percent in 2013 to 4.10 in 2014. The Home CompletionMortgage requires a 30 percent deposit over 15 years at an interest rate of sixpercent, whereas the Home Improvement Mortgage requires a 50 percent depositat an interest rate of six percent also. The ‘Buy Land and Build Own HomeMortgage’ product allows the applicant to buy land for a maximum amount ofUS$10 000 and then provides a further US$30 000 to build. To apply for this
product the applicant must be an existing customer of HFC. In addition, thebuilder must be approved by the bank, the building plans must have been approvedand the purchase of land requires the applicant to have secured title. Onceapproved, the loan can be disbursed directly to the customer. The minimum downpayment for this product is 20 percent of the cost of the land.
The Construction Finance Mortgage is targeted at estate developers for theconstruction of residential properties. The maximum term of the loan is 36months and the developer must produce a title over the land. The ConstructionStage Payment Mortgage is also aimed at developers; however, the difference isthat the developer constructs residential houses for prospective HFC mortgagecustomers who may require funds to enable them to complete the homes. Themaximum loan term is 12 months. HFC Mortgage and Savings Company have asat 2015 financial year about $20 million to operate its various mortgage and loanschemes. HFC Mortgage and Savings Bank have been gradually increasing itscustomer base and now boasting of nearly a 1 000 customers who have used orare using one of its six mortgage products. Other commercial banks too are alsooffering a variety of mortgage products to their customers.
In 2012, the World Bank launched the Global Financial Inclusion (Global Findex)Database to explore levels of financial inclusion around the world. According to2014 Global Findex database, 16 percent of adults (15 years+) and 12 percent ofadult women have accounts with a financial institution. The percentage of youngadults (15-24) is about five percent. According to the report, about 11.7 percentof adults living in rural areas and 20.2 percent of adults living in urban areas havingaccount with a financial institution. The majority of those with accounts usethem to receive wages. Use of credit is fairly common; four percent of adultsover 15 years of age report that they had a loan with a financial institution and9.3 percent adults stated they have outstanding mortgage with a financialinstitution. However, the vast majority of these loans were from family or friendsis reported at 43 percent and seven percent of adults have borrowed from aprivate informal lender. The percentage of adults with mortgage loans hassubstantially increased from 0.4 percent in the 2011 Findex database to9.3 percent. In 2014, 11 percent of adults have saved at a financial institution witha large percentage of adults saving mostly for education or school fees and tostart a business or farm.
There are two licensed, deposit taking microfinance Institutions in the country:Ecobank microfinance Institution (EMSL Ltd) and Bank for Innovation andPartnership (BIP), and eight credit-only MFIs. Finance Salone and Hope Microhave the largest number of borrowers; however ProCredit Bank – SLE, FinanceSalone and BRAC – SLE have the largest share of loans. The most recent data fromMFI sector for 2015 put total loans given out by the various microfinanceinstitutions at US$17.3 million to 106 938 borrowers. They have also receiveddeposits amounting to US$5 million from 51 428 depositors. In June 2015,BRAC-SLE reported total loans of about US$3 million issued to 21 040 borrowersand zero deposit. There are no updated figures from the other MFIs. In a June2015 report, the Sierra Leone Association of Microfinance firms detailed theimpact of the Ebola epidemic on its especially with majority of their customerswho are traders and farmers been severely affected due to the economicslowdown. The report stated that the Ebola outbreak has affected microfinancefunders as loan disbursement reduced by 36 percent during the Ebola period andoutstanding loan portfolio fell from US$18 million to US$14.9 million. The numberof active clients dropped from 78 000 to 73 000 during the crisis while portfolio-at-risk doubled from 11 percent to 22 percent. During this period, the eightregistered MFIs reported decrease in revenue and operational self-sufficiencydropped from 105 percent in June 2014 to 78 percent in December 2014.
There are two development banks in the country: the National DevelopmentBank and the National Cooperative Development Bank. These banks work inconjunction with the MFIs, mainly in urban centres. Rotating savings and creditassociations are informal savings and credit institutions used commonly throughoutthe country.
According to the World Bank 2015 Doing Business Report, Sierra Leone rank140, which is unchanged from the 2014 ranking. Sierra Leone ranking in terms ofthe ‘ease of getting credit’ indicator in the World Bank’s 2015 is 151 which is a verybig drop from 2014 rank of 147. In terms of starting a business, Sierra Leone is

Africa Housing Finance Yearbook 2015
173
rank 91 in 2015 compared to 87 in 2014. The Credit Reference Bureau Act of2010 has been adopted, which requires all commercial banks to refer to it beforemaking out loans to customers. In 2014, the public credit registry had informationon 23 725 individuals and 11508 firms, comprising one percent of the population,which is 0.1 percent increase from the 2013 figure. Borrowers can inspect theirdata in the public registry, and data on both firms and individuals are distributed.In 2014, Sierra Leone scores five out of a possible 12 points on the ‘strength of legalrights’ index. The strength of legal rights index is one of the indicators used in theWorld Bank Doing Business Report. There is no collateral registry in operationin the country.
Affordability
Housing affordability is a serious challenge in Sierra Leone, where more than60 percent of the population live on less than US$1.25 a day and 60 percent ofthe youth are unemployed which is a pertinent social issue. Youth unemploymentis projected to grow even further in the next five years. The lowest housing unitis a single bedroom and a living room (parlour) with an estimated area of 20 m2.The prevalent housing units that are available for rent are mostly two and threebedroom apartments with estimated area of 200 and 250 m2 respectively. Theprices to rent these aforementioned housing units per year depend on thelocation. In the east end of Freetown, average rental process for a three bedroomapartment ranges between US$1 000 – 1 500, whilst in the central and westend of Freetown, rental prices for three bedroom ranges between US$3 000 –US$5 000. Average rental prices for two and one bedroom apartments rangesbetween US$500 – 1 000 and US$100 – 250. The widespread proliferation ofslums in most urban centres is a direct consequence of the extreme difficultiesencountered by the urban poor to afford decent housing. With poverty soprevalent, most urban poor do not have the income required to open a bankaccount, thus making it almost impossible to access mortgage facilities offered suchas HFC Mortgage. As a result, the HFC Mortgage and Savings Bank products areaffordable to only a fraction of the population.
The lending rate by banks in Sierra Leone which is the rate charged by banks onloans to prime customers was 19.41 percent (measured in 2014) percent (end2013), making borrowing very expensive. The average rate of savings remainedat 6.4 percent since 2014. In a recent SALHOC survey, 70.5 percent of surveyrespondents stated that they find it very difficult to rent a house due to very highrental prices. However, the Sierra Leone Housing Corporation (SALHOC) andthe Sierra Leone Investment and Export Promotion Agency (SLIEPA) have beenable to attract some private sector developers and international NGOs to revivethe provision of affordable low-cost housing units to all income groups. The majorhindrance to the provision of affordable low-cost housing units is the hugeconstruction cost considering the fact that most of the building materials have tobe imported into the country. The average costs to build a two bedroom andthree bedroom flats are US$15 000 and US$25 000 respectively.
Housing supply
Sierra Leone, like many African countries, struggles to house the majority of itspoor population. Access to affordable housing remains a challenge for government,which is why housing is noted as a critical area with regards poverty alleviation. Thewar in Sierra Leone (from 1991 to 2002) left many people destitute and destroyedclose to 350 000 dwellings. The war caused many people to flee to Freetown, thecapital and largest city in Sierra Leone. There is an estimated 800 000 houseswith an average house size of six based on the 2004 housing and populationcensus. The proposed 2014 Housing and Population Census was postponed dueto the Ebola outbreak but has already been reschedule for December 2015. Thiscensus is expected to provide updated information on number of houses, averagehouse size and socio-economic data.
A national survey conducted in 2004 found that 73 percent of households livedin single storey houses. Nationally, 75 percent of households were recorded asowner occupiers and 19 percent as renters. The quality of houses that mosthouseholds live in is inadequate: 37 percent live in a house constructed with mudbricks, 35 percent in houses made with mud walls and 17 percent in cementconstructed houses. Those living in mud walled houses are vulnerable, as thecountry is prone to seasonal rains. Many of these poor quality houses are also builtin environmentally challenged areas which have led to several landslides, mudslidesand flooding over the years. It should be stated that housing supply is notcommensurate with the ever increase in housing demand. This has caused rentalsto increase yearly and have placed tremendous economic hardships on bothmiddle and low income earners who according to a 2015 SALHOC survey arespending over 40 percent of their earnings on housing needs.
NASSIT has plans to support private developers to construct on a large scalevarious housing delivery schemes for all income groups. A 2010 housing needsassessment conducted in Freetown showed that there is a housing supply deficitof 120 000 houses. NASSIT have acquired land in all the four provincial urbantowns and intends to roll out a significant number of housing units. The SierraLeone Housing Corporation (SALHOC), the statutory body charged with thedelivery of low cost housing, has within the past year developed strategicpartnerships with private sector developers and International NGOs. 2014 alsosaw the entry into the property market of Trillium Hills and White Sands Project.The Trillium project is a real estate and property investment business gearedtowards creating not only an attractive and conducive living environment for thepeople of Sierra Leone, but also aimed at creating jobs for the youth and skilledpeople and at the same time foster wealth creation for the cottage industries andconstruction sector of the economy. HFC Mortgage has started funding a realestate developer i.e. SPARKLIGHT who are currently building about 50 low-costhousing units at Gloucester.
> $50 000
$25 000 – $50 000
$14 000 – $25 000
$8 000 – $14 000
$5 000 – $8 000
$3 600 – $5 000
$2 400 – $3 600
$1 600 – $2 400
$800 – $1 600
<$800
- - - Average income needed for the cheapest newly built house by a formal developer, 2015
- - - Average annual urban household income, 2014
SIERRA LEONE
$33 607
$4 088
Rural | UrbanAnnual household income US$
No. of households (thousands) 300 250 200 150 100 50 0 50 100 150

174
Property markets
According to a 2013 Knight Frank report, rental for the industrial sector dominatesthe property market, with prime rental rates of US$3 per m2 per month inFreetown. The office and retail market have prime rates of US$17 per m2 permonth. Specifically, with regard to residential property, a four-bedroom executivehouse in a prime location is rented for US$4 000 – 5 000 a month.
The World Bank’s 2015 Doing Business Report ranks Sierra Leone 158th out of189 countries in terms of ease of registering a property. This is an improvementfrom a rank of 161 in 2014. It takes 55 days to complete the seven proceduresinvolved in registering a property, and costs 11 percent of the property value. In2013, Sierra Leone made registering property easier by computerising the Ministryof Lands, Country Planning and the Environment, reducing the time needed forproperty registration by 19 days.
All land is registered with the Ministry of Land, Environment and Country Planning.Paramount chiefs and other community authorities are the predominant landowners followed. There are a few state lands which are under the custodian ofthe Ministry of Land. These traditional authorities allocate land-use-rights toextended families for further division among family members or lineages attachedto a particular chiefdom. No significant land-related decision is final until theparamount chief approves. This complex land tenure system has make acquiringland very challenging and rift with so many court cases. However, a draft nationalland policy formulated in 2014, which is geared towards revolutionizing landownership, use and management is now under review. Sierra Leone propertymarkets have been in a very shambolic state with no effective industry regulator.This has led to indiscriminate rental prices and the absence of a code of practiceto guide proceedings. As a result therefore, many urban dwellers have been pricedout of the formal property market and as such resorted to building makeshifthouses in slum areas. Mortgages exist but since there is only a small stock ofmodern housing and other buildings, the real estate market is minimally active andmortgages are not common.
Policy and regulation
Access to land in Sierra Leone is especially difficult for the poor and even moreso for women. Land tenure is still based and reliant on customary law, where theland is dominated by male heads. Land tenure in urban areas follows the Englishland law. Land in Sierra Leone is classified as state land, private land and communalland. In Freetown and the Western Area, statutory laws recognise private freeholdland, while under the Province Land Act of 1960 in the three provinces is governedby customary law with chiefs serving as custodians. Customary law is unwritten,varies across the 149 chiefdoms, and evolves over time. It is enforceable in bothformal and non-formal courts. The 2004 Local Council Act gives local councils theright to acquire and hold land. Local councils have the responsibility for thecreation and improvement of human settlements. It is on this basis that SALHOChas established working contacts with all the district councils in order to facilitatethe process of acquiring land for its future low-cost housing projects. TheConstitution of the Republic of Sierra Leone Act No. 6 of 1991 does not clarifyto whom the land belongs, and causes problems when it comes to ownership.Land titles in cities such as Freetown are delivered through a grant from the stateor possessory title to state land based on adverse possession.
UN-Habitat together with the National Commission for Social Action, the Ministryfor Lands, Housing, Town and Country Planning and Environment, and the UNDP,worked on a Framework document for human settlement development to dealwith the growing urban population. The framework document is for theresettlement, reconstruction and rehabilitation of the country. The programme isexpected to translate into a national housing policy and implementation strategy.The World Bank has also provided support for Sierra Leone through revising andupdating the national housing policy, preparing the outline of a five to 10 yearnational housing programme and preparing a report on the slum and informalsettlements in Freetown. The government however, through the Agenda forProsperity is in the process of developing the requisite legal framework to get thepublic sector in the real estate and property business to work with privatedevelopers to harmonize and produce affordable housing schemes for all income
earners. It should be pointed out all these plans are in their embryonic stage atthe moment. No construction plans have yet been submitted to the effect. Low-cost housing units from private developers will mostly be mortgaged whilst thosethat will be supplied by the government through SALHOC may be highlysubsidised by the government since they will be geared towards low and middleincome earners.
Opportunities
The business environment in Sierra Leone has been improving. In 2013, SierraLeone’s ranking improved by eight places in the World Bank’s Doing BusinessReport, although it dropped by two places in 2014, placing 140th out of 189countries. It remains unchanged at 140th in 2015. As the macroeconomicenvironment improves, an important area of opportunity is the housing sector.There is certainly considerable scope for growth in the housing financing marketsand housing suppliers should consider how to package their offerings to suit theaffordability criteria of the majority of the population. Despite the Ebola epidemicslowing down the country, there has been significant movement and collaborationbetween SALHOC and other private sector developers to increase the supply ofhousing units, developed effective policies to regulate the real estate market. Thecountry can now boast of about four private sector developers currently workingin the real estate business with some having already constructed some housingunits and others have already secure land and are on the verge of commencingconstruction work. With the mining sector expected to resume full scaleoperation and expansion, it is expected that income levels of urban dwellers wouldbe on the increase thereby putting them in a position to be able to accessmortgage facilities to buy these homes. In a recent survey conducted by SALHOC,about 80 percent of survey respondents stated their willingness to use the availablemortgage instruments to buy land and build houses.
Sources
African Economic Outlook (2014)-Sierra Leone Country Profile.Bank of Sierra Leone (2013)-Annual Report and Statement of Accounts, for theyear ended 31 December 2012 . Bank of Sierra Leone (2014)- Economic and Financial Review, 2013.Making Finance Work for Africa, Sierra Leone: Financial Sector Profile.www.mfw4a.org/sierra-leone. Sierra Leone/European Community (2008). Country Strategy Paper andNational Indicative Programme for the period 2008-2013.Sierra Leone Gazette (2009). The Home Mortgage Finance Act, 2009. Vol.CXL No. 26, 11 June 2009.World Bank (2012). The Little Data Book on Financial Inclusion.World Bank (2014). Doing Business 2015.SALHOC’s Customer Perception Survey and Housing Needs Assessment 2015.HFC Mortgage Annual Report 2014.
Websites
www.bsl.gov.slhttp://data.worldbank.org/www.ecowas.int/?lang=enhttp://hfcsl.netwww.mitaf.esglobal.comwww.tradingeconomics.comwww.undp.orgwww.unhabitat.orgwww.mfw4a.orgwww.worldbank.org http://www.worldbank.org/en/country/sierraleone/overviewhttp://www.mixmarket.org/mfi/country/Sierra%20Leonehttp://www.bsl.gov.sl/pdf/SLAMFI_LAUNCHING.pdfhttp://usaidlandtenure.net/sites/default/files/country-profiles/full-reports/USAID_Land_Tenure_Sierra_Leone_Profile.pdf

Africa Housing Finance Yearbook 2015
175
SomaliaKEY FIGURES
Main Urban Centres Mogadishu
Exchange Rate: 1 US$***Inflation 2013 | 2014 (est.) | 2015 (prov.) | 2016 (prov.) *
669.03 Somali Shilling (SOS)| | |
Population^ | Population growth rate (2013)^Urban population (% of total)^ | Urbanisation rate (% in 2013)^
10 805 651 | 2.9139.08 | 4.11
GDP / capita (current US$)^ | GDP growth rate (annual %)^GNI / capita, Atlas method (current US$) ^Population below national poverty line*Unemployment rate (%)*Gini co-efficient (year of survey)^^HDI (Global Ranking)" | HDI (Country Index Score)”
128.1 | 2.60"| 122.90"| 73||7.60.48||165 | 0.285||
Lending Interest Rate^Mortgage Interest Rate (%) | Mortgage Term (years)#Credit % of GDP^Average Mortgages % of GDP° Price To Rent Ratio City Centre** | Outside City Centre**Gross Rental Yield City Centre** | Outside of City Centre**Outstanding home loan (% age 15+)##
20 – 25*_8.50 | 30......16.7 | …6%* | …2.43
What is the cost of standard 50kg bag of cement (in US$)? #What is the price of the cheapest, newly built house by a formaldeveloper or contractor (in US$)? #What is the size of this house (in m2)? #What is the average rental price for a formal unit (in US$/month)#What is the minimum plot size for residential property (in m²)#
14.00
100 000...500260
Ease of doing business rank !Number of procedures to register property !Time (days) to register property !Cost (% of property value) to register property !
...
...30*_...
*** Conmill.com The Currency Converter^ World Bank's World Development Indicators (2014)~ World Bank PovcalNet: an online poverty analysis tool, various years^^ The World Bank's PovCalnet" UNDP's International Human Development Indicators (2014)° Various: Badev et al. "Housing Finance Across Countries: New Data and Analysis" – Unpublished
paper/Hofinet/World Bank## Global Financial Inclusion Database (FINDEX)# CAHF Annual Survey Data (September 2015)! World Bank's Doing Business Survey Data (2015)** Numbeo Online User-Contributed Database"| United Nations (2014) World Statistics Pocket Book|| United Nations Development Programme (2012) Somalia Human Development Report 2012*_ Datagrid Somalia
replaces the currency circulating, which is currently printed by the private sector.the World Bank and African Development Bank are assisting with rebuilding stateinstitutions such as the Ministry of Finance and Central Bank.
According to the African Economic Outlook (2014) humanitarian anddevelopment aid in 2012 amounted to US$ 750 million, or around US$ 76 percapita1. Annual remittances, estimated at US$ 1-1.5 billion, are the largestcontributor to national capital inflows and wealth. Total external sovereign debtto public creditors is estimated at US$ 5.7 billion (around 80 percent of GDP), ofwhich US$ 1.5 billion is owed to multilateral creditors (79 percent inarrears), US$ 2.5 billion to Paris Club creditors (most of which is in arrears)and US$ 1.6 billion to non-Paris Club bilateral creditors2.
Access to finance
For two decades since 1991, Somalia had been functioning without banks; allinstitutions that regulated the economy collapsed and the country was suspendedfrom accessing global financial markets. In recent years, the banking system isstarting to re-emerge with limited functionality. The country’s financial systemmainly comprises the Central Bank of Somalia, money transfer agencies (SomaliaRemittance companies/Hawala system) and microfinance institutions, as well asnewly established commercial banks. In the absence of formal and establishedcommercial banking activities, all economic transactions are settled in cash. Thereare no fixed income markets in Somalia and no formal credit facilities. Somalia’s
Overview
Somalia, a country of almost 640 000 km2, is located in the ‘Horn of Africa’. It isbordered by Ethiopia to the west, Djibouti to the northwest, Kenya to the southwest, and the Indian Ocean to the east, and is divided into three regions, namely;Puntland, Somaliland and South-central Somalia. While all three regions belong tothe country ‘Somalia’, they are autonomously governed with each having their owngovernance structure. The capital city of Mogadishu makes up 15 percent ofSomalia’s population.
Somalia has a recent history of political instability and as a result has suffered frominternational disinvestment. Following the collapse of the central state authorityin 1991 a Transitional Federal Government of Somalia was established which in2012 was succeeded by the Federal Government of Somalia (FGS). This structureis the face of transition in Somalia and a plan for the reconstruction anddevelopment of the country has been formulated. Renewed interest from theinternational community is demonstrated through the New Deal Compact andinvestment interest from countries such as Turkey, China and organisations such asthe World Bank.
The country’s GDP was estimated at US$ 1.3 billion in 2012 with an estimatedaverage annual growth rate of 2.6 percent. Agriculture is the mainstay of theeconomy and of livelihoods, accounting for about 60 percent of GDP andemploying 65 percent of the workforce. Two thirds of this is livestock, which onits own accounts for about 40 percent of GDP and more than 50 percent ofexport earnings. Exports also include fish, charcoal, bananas, hides and skins, andscrap metal. Still, 73 percent of the population lives in poverty and 43 percent inextreme poverty.
Experiencing a trade deficit, the country is highly dependent on imports of food,fuel, construction materials and manufactured goods. Despite the long conflict,the more stable regions of Somalia boast a vibrant and dynamic private sector,specifically the financial sector. In addition, Somalia continues to rely heavily oninflows of aid and remittances.
The inflation rate is very high, estimated to remain in the range of 300 percent, dueto individuals circulating counterfeit currency. The inflationary trend is expectedto lessen when the central bank effectively takes full charge of monetary policy and

176
largely informal economy is characterised by major information and data gaps,making estimates of economic aggregates highly uncertain. This notwithstanding,the private sector is vibrant and growing.
The principle pillar of the Somalia financial system is the presence of remittancecompanies offering money exchange and remittance services, and therebyconnecting Somalia with the rest of the world. The informal Hawala system isused in Somalia, has 17 organisations and is based on trust. The Hawala systemconsists of money transfer companies which offer financial services to people andencompasses informal credit systems. The largest of these organisations isDababshill, Amal Express, Kaah Express and North American Money Transfers.The movement of funds within Somalia is through mobile telephone schemes:70 percent of Somali people have access to mobile services3. Loans aretraditionally secured through family members not banks. Loans are used for realestate development in some instances.
Access to finance by households is also enabled by a growing microfinance sector.Key players include Silatech, Kaah Express, Barwaquo Microfinance Bank, KaabaMicrofinance Institution (has 5 000 clients and is a field partner of Kiva) etc. Loansare offered for a period of up to 6 months4. According to Kiva, the average loansize in Somalia is US$ 542 and the average loan size/ GDP per capita PPP is 90.42percent. Total loans provided by Kiva amounts to US$ 120 975 in 2014.Microfinance facilities and informal facilitators charge between 5 percent – 10 percentcommission.
The reconstruction of the Central Bank is still underway, and Somalia’s sixcommercial banks (including the International Bank of Somalia, First Somali Bank,Salaam Somali Bank, Somalia’s Premier Bank and Tawakal Money (Express) are allnew players. The four Islamic financial institutions offering mortgage/home loansare Salaam Somali Bank, Dahabshiil Bank International, Premier Bank andInternational Bank of Somalia (IBS).
The International Bank of Somalia offers financing for investors. This includes realestate advisory and housing financing; finance is also offered for infrastructuredevelopment projects. Salaam Somali Bank offers finance packages for megaconstruction projects and smaller scale housing for individuals. Only 3 percent ofSomalia’s population is banked, says the managing director of Premier Bank. Thereis currently one ATM in the capital city and Premier Bank hopes to erect five morearound the city. In addition, there are two central banks in Somaliland and Puntlandwhich also offer commercial banking services. Lack of a formal bank structuredrives investment away as it is deemed too risky with limited regulations to providecredit. With this in mind, Takaful Insurance offers products to insure propertiesagainst fire, theft, political violence and terrorism, which will assist in riskmanagement5.
Affordability
Somalia has long been one of the world’s poorest and least developed countries,bearing relatively few natural resources6. Somalia’s GDP per capita is US$128.17.The youth unemployment rate is almost 70 percent. Using a poverty line of US$2a day PPP, the incidence of poverty is 61 percent in urban areas, 80 percent forrural areas and 73 percent overall. Using a poverty line of US$1 a day (ppp), theincidence of poverty is 43 percent8.
From 2002 to 2008 the consumption of cement in Somalia has remained thesame at 0.1 MTA (Global Cement Report). The low consumption is mainly dueto the volatile political situation. Cement is expensive: about US$14 per 50kg bag.Using the GNI per capita of US$122.90, ± 8.8 bags of cement can be bought –far below the estimated 35 – 40 bags of cement that would be required to builda basic 40m2 house. With 73 percent of the population earning less than US$60a month, the affordability for formal housing is extremely limited.
According to Datagrid Somalia, the average house price per square meter isUS$250. The average rental price for a formal unit is US$500. The average plotsize is 400m2. The price of the cheapest newly built house built by a developer inSomalia is US$100 000. The current rental market is booming according to anarticle by The Somali Investor9. Rent has increased in some places from US$ 300five years ago to between US$2 000 and US$3 000 due to increased demand.
These figures are biased toward city and urban areas such as Mogadishu andHargeisa.
Property markets
The housing and property market in general is booming in Somalia with rental andhouse prices increasing by over 100 percent over the past five years. The need forhousing is largely due to returning refugees, overcrowding of existing householdsand new businesses, and as a result, demand exceeds supply, pushing up prices forthe benefit of investors. Although the housing market is favourable, in many casesland is unregistered and ownership cannot be proven. Protection of individualand collective ownership of land and other property depends entirely on clansupport and/or the military might of related factions. Land, including its accessand its utilisation, is already a problem in Mogadishu, as internally displaced persons(IDPs) and refugees seek housing. For the first time in Somalia, title deeds havebeen handed over to 500 displaced households in Baidoa. This pilot projectidentified secure land tenure to protect people from evictions from IDP camps.Still, there are cases of fraud and land being sold to multiple people.
Officially, land registration in Somaliland takes approximately 30 days and costsabout US$ 3010. It is only the mayor's office which registers property and theprocedure is cumbersome, given the collapse of the government and the loss ofland document archives. However the procedure of new plot demarcation doesnot take long. It is the process of transferring old plots, where old plotdocumentations has to go through several verification processes, that increasesthe time involved. The process of acquiring land amounts to about one percentof the property value, however this amount keeps varying11. The price of propertyaround airports is high.
Housing supply
There are approximately 2 million households in Somalia with an averagehousehold size of six people. In 2009, 73.6 percent of the urban population inSomalia were living in slums12. Just under a quarter (24 percent) of the populationhas access to formal housing (60 percent in urban areas and six percent in ruralareas)13. About 24 percent of houses in Somalia are constructed with durablematerials and can be classified as permanent structures. Around 56 percent havewalls or roofs constructed utilising semi-durable materials. The remaining 20 percentare categorised as temporary, as they are makeshift houses utilising sticks, plasticsheets, and similar materials. In rural areas, 90 percent of households are owneroccupied as opposed to 60 percent in urban areas. One in every four houses isrented in urban areas as opposed to one in every 25 in rural areas. Land is largelyowned by the government.
A key component of formal housing is cement. Cement has largely been importedby the Dahabshill organisation (dealing largely with remittances) indicating thatthere is a form of investment in infrastructure. Plans have been approved toestablish a cement terminal at Berbera port in Somalia14. While the GlobalCement Report for Somalia suggests that the short term future seems bleak,various articles indicate that the construction market is booming due to thestrengthening political situation. Also plans for investment in the sector shows apositive outlook for the construction industry in Somalia.
The government of Japan has funded 1000 houses in Puntland for internallydisplaced persons of which 500 were complete in 2013. Another 150 houseswere provided by the Common Humanitarian Fund (CHF). According to theSomalia Real Estate Association, 10 200 units were in the pipeline in March 2015.In addition, the Darul-Salaam City, a gated estate situated on the outskirts ofMogadishu is a large scale housing project with over 6 000 units proposed to beconstructed over the next three years. There is also the Jazeera Estate which isbeing constructed in Mogadishu, 3km from the airport. This gated developmentis proposed to have over 1 200 apartments, villas and townhouses as well ascommercial and public facilities.
Policy and regulation
The main shift in policy and regulation in Somalia is the endorsement of a NewDeal Compact between the Federal Government of Somalia and the internationalcommunity. It is an overarching framework for all international donor and partnerengagement with the country. This compact aims to guide reconstruction and

Africa Housing Finance Yearbook 2015
177
> $50 000
$25 000 – $50 000
$14 000 – $25 000
$8 000 – $14 000
$5 000 – $8 000
$3 600 – $5 000
$2 400 – $3 600
$1 600 – $2 400
$800 – $1 600
<$800
- - - Average income needed for the cheapest newly built house by a formal developer, 2015
- - - Average annual urban household income, 2014
SOMALIA
$37 220
$1 522
Rural | UrbanAnnual household income US$
No. of households (thousands) 800 600 400 200 0 200 400
reconciliation of Somalia over a three year period (2014 – 2016). Through theCompact the Somalia Development and Reconstruction Facility has been setupwhich will oversee activities of development partners. This facility will serve tobring together several funds from the World Bank, United Nations, AfricanDevelopment Bank and Special Financing Facility (with pledges amounting to €1.5billion). In addition, democratic elections will be held for Somalia in 2016.According to the African Economic Outlook the FGS has developed a two yeareconomic recovery plan for 2014/2015, to rebuild the Somalia economy andimprove service delivery.
There are currently no housing laws and regulations, however a housing-relatedlaw is in the process of being formulated. There are no building standards or urbanand master planning in place to regulate the development of housing.
The UN-Habitat has assisted the Somali government by developing a strategy forinternally displaced people and urban rehabilitation. The government seeks torelocate 160 000 people to areas outside the city of Mogadishu. With assistancefrom UN-Habitat, there is a land department in Mogadishu. Customary land lawsare still in use. There is a need to develop tenure security to attract further privatesector development.
The Somalia Real Estate Association was formed in 2014 to manage propertyefficiently by gathering information and streamlining the industry and create aquality product. While the association is not fully functional, this is a positive forfuture development.
Opportunities
Somalia is undergoing drastic positive change with increased investment interestfrom the Somalia diaspora and foreign investors. The Aden Abdule InternationalAirport was reopened has seen 10 – 15 daily flights and the Albayrak ocean porthas experienced increased volumes of trade in the last six months. Somalia hasreceived substantial investment from Turkey with a number of agreements in placethat spread across various sectors such as trade, education, infrastructuredevelopment and humanitarian assistance. Increased industry, business, as well aslatent mining opportunities (oil and gas) indicate a niche for housing development.A clear affordable housing gap exists to service population growth, displacedcommunities and the housing demand created by revived economic activity. Theestablishment of various associations related to investment, economic growth andreal estate indicate a renewed appetite to absorb opportunities especially in thehousing sector. This will create a multiplier effect leading to job creation, increasedper capita income, demand for more economic activity and hence redevelopmentof Somalia.
The commitment to establish formal finance institutions and to operationalise theCentral Bank will assist in creating a favourable investment environment. This willassist with the lack of formal credit facilities to offer mortgage loans and allow the
private sector to add to the housing stock in Somalia. The thriving informal financialsector, as well as the strong presence of microfinance institutions, creates a uniqueopportunity to support housing development.
Sources
African Development Bank (2014) Partner of Choice for Eastern Africa wewant: EARC Report.African Development Bank Group (2013) Somalia: Country Brief 2013-2015.African Economic Outlook (2014) Somalia. African Economic Outlook (2014) Global Value Chains and Africa'sIndustrialisation.Amoo F. (date unknown) Somalia. Available [Online]:http://fic.wharton.upenn.edu/fic/africa/Somaliapercent20Final.pdf Bertelsmann Stiftung’s Transformation Index (BTI) (2014) Somalia CountryReport. Global Cement Report (Date Unknown) Somalia. pp 315.Istanbul Conference on Somalia (2010) Banking, remittances, and the role of thecentral bank in promoting financial and private sector development in Somalia.Shuraako (2013) Somalia Banking: Transfers, Challenges and Opportunities. Shuraako (2014) Land Tenure in Somalia: A Potential Foundation for Securityand Prosperity. United Nations Habitat (2012) State of the World’s Cities Report 2012/2013:Prosperity of Cities.United Nations Habitat (2011) Land, Property and Housing in Somalia. United Nations (2014) World Statistics Pocket Book.United Nations Development Programme (2012) Somalia HumanDevelopment Report 2012. Electronic communication: Data Grid Somalia. Available Online[http://datagridsomalia.com/].

Websites
www.theguardian.com www.somalilandpress.com mirror.unhabitat.org www.mbali.infodev.oneearthfuture.org somaliainvestor.so www.reuters.com www.silatech.comwww.fsnau.org/idswww.kiva.orgwww.unhcr.org www.afdb.org landwise.landesa.orgwww.unicef.org www.ruralpovertyportal.org operations.ifad.orgdata.un.orgunstats.un.org data.worldbank.org www.somalieconomicforum.org www.somaliinvestments.com www.savannahbusinessconsultants.com tradeinvestsomalia.com http://www.nrc.no/?did=9197402#.VcTCfPmqqko
178
1 African Development Bank, 20132 African Economic Outlook, 20143 Shuraako (2013)4 www.kiva.org5 http://www.somaliainvestor.so/index.php/property/item/54-building-sector-picks-up 6 Human Development Report, 20127 United Nations, 20148 Human Development Report, 20129 http://somaliainvestor.so/index.php/business/item/78-rediscovering-real-estate-in-somalia.10 Datagrid Somalia11 somaliainvestor.so 12 United Nations State of the World’s Cites Report 2012/201313 United Nations Habitat, 201114 http://www.globalcement.com/news/itemlist/tag/Somalia

Africa Housing Finance Yearbook 2015
179
South Africa
On the face of it, South Africa has investor friendly policies and regulations. In its2015 Doing Business Report, the World Bank ranked South Africa 43rd overall,and second in Sub-Saharan Africa, after Mauritius. South Africa was also rankedfirst in Sub-Saharan Africa in terms of dealing with construction permits andprotecting investors. And yet, business confidence has been declining and fears ofa recession are being expressed in the local media.
Access to finance
South Africa has a sophisticated banking system with 32 registered banks (18 ofthese foreign), of which four dominate: Absa Bank, First National Bank, Nedbankand Standard Bank. The capital-adequacy ratio for the banking sector as a wholewas 14.5 percent in March 2015, well above the minimum prudential requirementof 10 percent. According to PWC, South Africa remains in the top ten countriesglobally for the indicator relating to soundness of banks.
Access to financial services has been an explicit area of focus by the governmentand the financial sector, since the 2003 promulgation of the Financial SectorCharter. The FSC is now enshrined in legislation, promoting transformation in theownership and management of the banking industry, as well as increased accessto financial services for those previously denied – primarily low income black SouthAfricans. While the current phase of the FSC does not have explicit housingfinancing targets, it promotes a broader ‘empowerment financing’ target (housing,SMEs, infrastructure and agriculture) of ZAR48 billion (US$3.59 billion).
Overview
South Africa is the second largest economy in Africa, and at US$341.2 billion, isclassified as a middle-income country. South Africa has well-developedtransportation, IT, and services infrastructure, legislation that supports privateinvestment, a world-class financial sector and a well-diversified economy. TheJohannesburg Stock Exchange ranks was established during the gold rush in 1887,and with a market capitalisation of US$1 trillion at the end of 2013, is now the 19th
largest stock exchange in the world, and the largest in Africa. Historicallydominated by mining, the services sector now leads the economy. The country hasenjoyed growth since its first democratic elections in 1994, and this has supportedan extensive social security programme providing social grants and considerablepublic infrastructure investment.
This notwithstanding, South Africa continues to be one of the least equaleconomies in the world, with a Gini coefficient of 0.65. The country suffers froma high unemployment rate of 25 percent (or 34.9 percent including discouragedjob seekers). This is worse among the youth, where 49.9 percent are unemployedand a further 13.2 percent have stopped looking for work.
Consumer confidence hit a 14-year low in the second quarter of 2015 – a declineexpressed across all income groups; however most significantly among low andmiddle income households. Consumers are pessimistic about the economy andthe rising cost of living. According to the FNB/BER Consumer Confidence Indexfor 2015, poor consumer sentiment has been exacerbated by frequent poweroutages, the impact of drought on harvests and consequent food inflation, furtherdepreciation in the rand, the persistence of xenophobic violence, a 19 percentincrease in the petrol price, and tighter credit conditions, among other things.Tensions between the ruling party, opposition parties and the unions have beenincreasing in recent years, undermining the positive spirit that carried the countryso successfully in its early, post-apartheid years.
The International Monetary Fund (IMF) projected growth at two percent for2015/2016 from 1.5 percent in 2014 mainly due to anticipation of fewer days lostto strikes. After declining to 5 percent in 2015 on lower oil prices, inflation isprojected to rebound to 6.1 percent in 2016. In 2014, the finance, real estate andbusiness services sector was the largest contributor to the country’s GDP at 20.6percent.
KEY FIGURES
Main Urban CentresPretoria (capital),Johannesburg, Cape Town
Exchange Rate: 1 US$***
Inflation 2013 | 2014 (est.) | 2015 (prov.) | 2016 (prov.) *
11,32 South African Rand(ZAR)5.7 | 6.1 | 4.9 | 5.3
Population^ | Population growth rate (2013)^Urban population (% of total)^ | Urbanisation rate (% in 2013)^
54 001 953 | 1.5864.30 | 2.37
GDP / capita (current US$)^ | GDP growth rate (annual %)^GNI / capita, Atlas method (current US$) ^Population below national poverty line*Unemployment rate (%)*Gini co-efficient (year of survey)^^HDI (Global Ranking)" | HDI (Country Index Score)”
6 477.86 | 1.526 80045.525.065.02 (2010)118 | 0.658
Lending Interest Rate^Mortgage Interest Rate (%) | Mortgage Term (years)#Credit % of GDP^Average Mortgages % of GDP° Price To Rent Ratio City Centre** | Outside City Centre**Gross Rental Yield City Centre** | Outside of City Centre**Outstanding home loan (% age 15+)##
9.139.50 | 2067.2222.54% (2014)8.34 | 9.1212% | 10.96%9.17
What is the cost of standard 50kg bag of cement (in US$)? #What is the price of the cheapest, newly built house by a formaldeveloper or contractor (in US$)? #What is the size of this house (in m2)? #What is the average rental price for a formal unit (in US$/month)#What is the minimum plot size for residential property (in m²)#
5.35
26 763.004046560 – 100
Ease of doing business rank !Number of procedures to register property !Time (days) to register property !Cost (% of property value) to register property !
437236.20
*** Conmill.com The Currency Converter^ World Bank's World Development Indicators (2014)~ World Bank PovcalNet: an online poverty analysis tool, various years^^ The World Bank's PovCalnet" UNDP's International Human Development Indicators (2014)° Various: Badev et al. "Housing Finance Across Countries: New Data and Analysis" – Unpublished
paper/Hofinet/World Bank## Global Financial Inclusion Database (FINDEX)# CAHF Annual Survey Data (September 2015)! World Bank's Doing Business Survey Data (2015)** Numbeo Online User-Contributed Database

180
The 2014 FinScope survey indicates that 75 percent of the South African adultpopulation is banked and 86 percent are financially included, using some financialproduct or service from the formal sector. Only six percent of adults relyexclusively on informal mechanisms to manage their money, and this reflects adecrease of 6 percent since 2004. Thirty-four percent use a combination of formaland informal mechanisms to manage their financial needs; 13 percent borrow frombanks and five percent borrow informally.
Given the policy attention on financial access, as well as other broader, macro-economic factors at play, South Africa’s consumer credit market has grown rapidly.By the first quarter of 2015, the total outstanding consumer credit book wasZAR1.61 trillion, over half of which (53 percent, or ZAR 849 billion) was mortgagedebt. There were 1.8 million mortgage accounts, of which 3 percent were 90 daysor more in arrears. The next largest consumer credit segment was secured credit(primarily vehicle finance). The total value of the secured credit market wasZAR354 billion (US$ 26 billion), and comprised 4.4 million accounts, of which 14percent were non-performing (90-days arrears or more). Credit facilities followed,comprising ZAR207 billion (US$15.5 billion), and involving 26.2 million accounts,of which 12 percent were non-performing.
Consulting firm, Eighty20, has noted that the structure of South Africa’s creditmarket has changed since 2008, however, and this has impacted substantially onaccess to housing finance. Where mortgages accounted for 47 percent of thevalue of all loans granted in 2008, by 2012, only a quarter of the value of all loansgranted were mortgages. Unsecured loans and credit card facilities, on the otherhand, have become much more significant, doubling in value from 20 percent in2008, to 40 percent in 2012. In the past two years, the market seems to becorrecting, so that by 2014, the mortgage book comprised 31 percent of all loansgranted in that year, versus 32 percent for unsecured loans and credit facilities.
The bulk of South Africa’s mortgage market is focused on a minority of thepopulation – households earning outside the FSC target threshold of ZAR18 600(US$1 394) in 2014. While the datasets don’t align entirely, roughly 25 percentof mortgages granted (by number) in 2014 were for less than ZAR350 000(US$26 238) with only three percent of all mortgages (again, by number) goingto individuals earning less than ZAR15 000 (US$1 124) per month. There aremultiple reasons for this – the entry level price of new housing is about ZAR350 000,and household affordability for credit is constrained. In 2008, on the back of theglobal financial crisis, many banks pulled back from offering 100 percent mortgages.However, many have subsequently returned to 100 percent lending in theaffordable market where the mostly first-time borrowers do not have equity orsavings with which to make a deposit.
Credit indebtedness is a significant challenge, and only 42.8 percent of credit activeconsumers were current on their accounts at the end of Q2 2015; a further 45.1percent were more than three months in arrears. According to the PWC 2015Bank Analysis, retail mortgages represent the largest value of non-performing loans(NPLs) at 38 percent – this given their size and their overall proportion of theconsumer credit market. This reflected a decrease from 43 percent in 2014,indicating the progress of banks in terms of recovering funds. By number, however,mortgages represent a tiny proportion of NLPs – only six percent were 90 daysor more in arrears in February 2015, versus 42 percent of retail apparel accounts,42 percent of retail furniture accounts, and 35 percent of personal loans, thesebeing the consumer credit categories with the highest levels of indebtedness.
The credit indebtedness challenge is likely to be exacerbated by rising interestrates, forecast to increase further in 2015. The key monetary policy interest rate(the repo rate) is currently at six percent per annum, with bank’s prime lending andvariable mortgage interest rates at a level of 9. five percent per annum. Typically,borrowers in the affordable market access mortgages at a premium of twopercentage points above the conventional market. An analysis of performanceindicates that borrowers in the affordable market have more erratic paymentpatterns than borrowers in the conventional market, although the analysis showsno difference in the proportion of borrowers who cease making payments entirely.While mortgage loan providers may charge a premium to off-set higher risk andcosts associated with more erratic payment patterns in the affordable market, thispremium may well exacerbate the problem. Monthly instalments on the averageloan would be approximately ZAR350 more than they would be in the
conventional market. This places an additional financial burden on householdswith the least affordability, and becomes an ‘access tax’ of sorts, likely makingborrowers more vulnerable to economic shock.
The non-mortgage housing finance sector in South Africa has been growing, butremains a fraction in value of the mortgage market. Lending volumes areunfortunately not as well reported and quantified. Eighty20 reports NationalCredit Regulator figures showing that about ZAR1 775 million (US$133 million),involving 22 296 loans, was originated in the pension-backed loans market in 2014,versus Banking Association figures of ZAR1 942 million (US$145.5 million),involving 77 985 loans in just the “affordable market”, in the same year. Thediscrepancy cannot be resolved. The housing micro loans sector is in partsupported with wholesale finance and equity by the National Housing FinanceCorporation and the Rural Housing Loan Fund, both state-supported housingfinanciers. By the end of March 2015, the RHLF had financed a total of 455 315housing micro loans in rural areas.
Affordability
Housing affordability in South Africa is a critical challenge, bedevilling all housingpractitioners in the public and private sectors. The reasons for this are many,among which are low incomes (social grants are the primary source of income for39.5 percent of households, and by August 2014, social grants were beingdistributed to 16.3 million grant recipients); building costs have been rising fasterthan inflation; and the government subsidised house has had a distortive impacton the base price of an entry-level house. In 2015, the cheapest, newly built housewas estimated at about ZAR370 000 (US$27 737), affordable at current mortgagerates to households earning about ZAR15 000 (US$1 124) per month –estimated at about 15 percent of the population.
The situation is not new. In 1994, it was estimated that South Africa had a housingbacklog of three million units. To address this and the related housing affordabilitychallenges, the Reconstruction and Development Programme, or RDP, subsidywas introduced, entitling all households earning less than ZAR3 500 (US$262)per month (86 percent of the population at the time), and satisfying a range ofother criteria, to apply for a fully subsidised house. In terms of the RDPprogramme, subsidy beneficiaries get freehold title to a 180 – 250m2 servicedstand with a 40m2 top structure, entirely for free. This is still true today, althougheligibility criteria have changed somewhat. The current government position onthis is that applicants must be older than 40 years of age.
This still leaves a “gap” however, of households earning between the ZAR3 500upper income threshold for the RDP subsidy, and the R15 000 incomerequirement for a mortgage for the cheapest newly built house. It is estimated thatabout 30 percent of the population fits into this gap. In an effort address this, thegovernment introduced the Finance Linked Individual Subsidy Programme (FLISP)in 2012 (and in an earlier iteration in 2007). The subsidy offers beneficiaries aonce-off capital contribution of between ZAR20 000 and ZAR87 000 (US$1 499and US$6 522), depending on household income, which is to be tied to amortgage to purchase a new or existing house. However, for various reasons, thisprogramme has been unsuccessful, with fewer than 3 000 subsidies issued, and isunder review.
Increasingly, government is recognising this issue of the ‘gap’ market – especially asit impacts upon key public sector workers. In 2015, this issue was one of the keydrivers behind the signing of a Memorandum of Understanding between theBanking Association South Africa and the Department of Human Settlements.
Housing supply
Affordable housing supply in the country is dominated by government-subsidiseddelivery. Since 1994, an estimated 3.4 million housing units have been built by thestate. Of these, an estimated 1.4 million are formally registered on the DeedsRegistry, making government-subsidised housing comprise 24 percent of the totalresidential property market in South Africa. According to the 20 Year Review,approximately 12.5 million individuals (close to 25 percent of the population) havebeen aided by the state and provided with better quality accommodation andsome form of an asset. Approximately 56 percent of all subsidies allocated havebeen to woman-headed households. Despite these impressive developments inthe subsidised market, the housing backlog remains stubbornly fixed, estimated at

Africa Housing Finance Yearbook 2015
181
about 2.1 million houses in 2015. The Department of Human Settlements reportsthat subsidised delivery decreased to 105 936 units per annum in 2013/14 – butdeeds registry data suggests that only about 16 051 government-sponsoredhousing units were formally registered. In terms of government’s Medium TermStrategic Framework, the Minister of Human Settlements has promised thedelivery of 1.5 million new housing opportunities by 2019, comprising an estimated750 000 households in upgraded informal settlements, the delivery of 563 000subsidised housing units, 70 000 FLISP-supported housing units targeted at the‘gap’ market, 40 000 further affordable housing market units, 27 000 social housingunits, 10 000 community residential units (basic rental housing with sharedablutions), and 35 000 affordable rental units.
In fact, housing delivery has been declining across the board since 2012. Accordingto ABSA, only 163 103 residential units were completed by the private sector(not including subsidised housing delivery) across the country between 2011 –2014. Houses smaller than 80m2 (a poor proxy for low income housing)comprised just under half of this, but fell to an all time annual low of 15 444 unitscompleted in 2014. The delivery of flats, on the other hand, increased: from 3 880units in 2011 to 7 102 flats delivered in 2014. Rental housing is increasingly asignificant component of new housing delivery, and a new investment target hasbeen the delivery of student accommodation. In 2015, Indluplace Propertiesbecame the first residential-focused fund on the JSE’s real estate sector. JSE-listedSA Corporate Real Estate Fund is also planning to separately list its housinginterests once its residential portfolio has grown to ZAR3 billion – double itscurrent size.
Pension and provident funds have been targeting investments in the affordablehousing space., South Africa’s state-owned electricity company, Eskom, committedZAR100 million (US$7.5 million) to the development of around 20 000 newaffordable homes through an investment in global private equity funder,International Housing Solutions (IHS). This investment follows the commitment ofmore than half a billion rand to IHS’ second fund by the National Housing FinanceCorporation and the IFC. IHS’ first fund financed over 28 000 units with acombined total value of more than R8,6 billion.
Property markets
South Africa’s residential property market is the largest component of the SouthAfrican property market, comprising the majority of property assets within thecountry, and an important component of household wealth. The South Africandeeds registry counts 6.7 million properties on its registry, worth ZAR5.2 trillion.Of this, about 5.8 million registered properties, or 86 percent, are consideredresidential, ranging from sectional title and freehold properties, to estates, includinggovernment- sponsored homes, homes occupied by their owners or rented toothers, and holiday homes; found across the country, from rural areas, to miningtowns, to small and secondary cities, to metro municipalities. Almost 60 percentof the total formal residential property market is found in the eight metromunicipalities.
The majority of the residential property market – 63 percent in 2013 – includeshomes valued at less than ZAR600 000 (US$44 979). Of this, two thirds arehomes that are valued at less than ZAR300 000 (US$22 490), of which themajority (estimated at about a quarter of the total residential property market)are estimated to be government sponsored homes.
South Africa has a well-established property market and a world-class cadastralsystem. According to the World Bank’s 2015 Doing Business Report, South Africais ranked 97th of 189 countries globally, in terms of how easy it is to registerproperty. It takes 23 days to go through the seven procedures required, and costsan estimated 6.2 percent of the property value.
Still, the registration of title deeds remains a serious challenge. Just over half of thethree million subsidised properties delivered by the state since 1994 are formallyregistered in the deeds registry, comprising 24 percent of the overall propertymarket. The remaining properties have not been registered and do not have titledeeds meaning they cannot be used to gear finance or for sale. Attention to thisbacklog has become a key area of focus for government, and is the mandate of theEstate Agency Affairs Board. In terms of government policy, only those subsidisedproperties that are registered and older than eight years can be traded. Churnrates in this market segment are therefore low, although they are starting toimprove, providing an important source of supply for lower income earnersseeking to purchase housing.
Policy and regulation
South Africa has been attentive to the need for a clear policy environment sinceits release of the Housing White Paper in 1994. This was followed by the HousingAct in 1997, which set out basic roles and relationships of the three spheres ofgovernment with respect to housing, and how government would respond to theconstitutional obligation on the state to ensure access to adequate housing on aprogressive basis. In 2004, Cabinet approved a Comprehensive Plan for theDevelopment of Integrated Sustainable Human Settlements, known as BreakingNew Ground (BNG). However, implementation arrangements were neverfinalised, seriously weakening its impact. BNG was later incorporated into thebroader National Development Plan (NDP), the blueprint for the nation’sambitions to eliminate poverty and reduce inequality by 2030. One of theaffordable housing activities recommended by the NDP is to “conduct acomprehensive review of the grant and subsidy regime for housing with a view toensure diversity in product and finance options that would allow for morehousehold choice and greater spatial mix and flexibility”. The Department ofHuman Settlements is currently working on the development of a new HousingWhite Paper.
Within the current national policy framework, other interventions that enhanceaccess to housing finance and improve housing affordability, include the NationalHousing Finance Corporation (NHFC), the Rural Housing Loan Fund (RHLF), andNurcha (originally the National Urban Reconstruction and Housing Agency). In
> $50 000
$25 000 – $50 000
$14 000 – $25 000
$8 000 – $14 000
$5 000 – $8 000
$3 600 – $5 000
$2 400 – $3 600
$1 600 – $2 400
$800 – $1 600
<$800
- - - Average income needed for the cheapest newly built house by a formal developer, 2015
- - - Average annual urban household income, 2014
SOUTH AFRICA
$14 578
$12 148
Rural | UrbanAnnual household income US$
No. of households (thousands) 1000 500 0 500 1000 1500 2000

182
terms with government policy to consolidate all housing-related DFIs into a singleentity, it is expected that RHLF and Nurcha will be incorporated into the NHFCwithin the 2015/16 financial year.
To address the scarcity of serviced land for housing, the Housing DevelopmentAgency (HDA) was established in 2009 with a mission to fast track the acquisitionand release of state, private and communally owned land for human settlementdevelopments. It will now become a fully-fledged property development agency,focused on acquiring and preparing land, to be project managers to assistmunicipalities and to drive rapid housing delivery. The Social Housing RegulatoryAuthority was established in 2010 to regulate and invest in the delivery ofaffordable rental homes, with a focus on social housing.
Opportunities
Residential markets in South Africa behave in very different ways, across numerousproperty market indicators – growth in values and sales prices, transfer rates ofnew properties and resales, access to mortgage finance, and growth in equity.Comparing and trending indicators, it appears housing markets are operating intwo different economies – those below ZAR600 000, largely governmentfacilitated, growing quickly despite limited private investment – and those aboveZAR600 000, growing stably, with ready access to credit, and experiencing anuptick in activity. By understanding more about the strengths and characteristicsof these sub-markets, more nuanced and appropriate approaches can be devisedto expand housing options more representative of present and future housingneeds, thereby enabling property to improve household economic strength andwell-being.
Very clear opportunities exist in the below ZAR600 000 market for developers,lenders and investors – the demand is significant and current supply is insufficient.There is a great demand for affordable rental accommodation in centres ofeconomic development for low income earners and students – and somedevelopers have been responding to this.
Still in 2015, the affordable housing market is desperate for innovative solutionswhich might be found in the resale of government-subsidised housing, the deliveryof incremental housing on serviced stands, inner city rental, or conversion of officeblocks to residential accommodation for sale or for rent. While the state housingsubsidy creates some market distortion, demand should be responsive toalternative housing and financing approaches. Large and successful non-governmental funders in affordable housing projects have learned that the key tosuccessfully funding affordable housing developments in South Africa is flexibility.
Sources
ABSA (2015). Housing Review, Third Quarter 2015.CAHF (2015) Affordable Housing Finance in South Africa: Understandingmarket performance. CAHF (2015). The South African Residential Property Market: An Overview Creamer, T. (2014). IMF cuts SA’s 2014 growth outlook again, warns of tighterfiscal conditions, 24 July 2014.EIU (2014). Country Risk Service, July 2014.Finscope (2014). South Africa 20143 Survey Results. Finmark Trust.FNB Property Barometer (2015). House Price Index, September 2015. FNB/BER Consumer Confidence Index, July 2015.Lefifi, T.A. (2014). Ratings Agency divided on SA banks after Moody’sdowngrade, 24 August 2014.Melzer, I (2015) A review of demand. Presentation to the workshop betweenthe Banking Association and the Department of Human Settlements.Melzer, I (2015) Pension-backed lending – what we know for now: origination.Melzer, I (2015) FSC Mortgage Loan Performance. Report prepared for CAHF.Melzer, I (2010) Assessing Access to and Performance of FSC Loans. Reportprepared for the FinMark Trust.National Credit Regulator (2015). Credit Bureau Monitor, Second Quarter, June2015.National Planning Commission (2012). National Development Plan 2013: OurFuture – Make it Work.PWC (2015). PwC analysis of major banks’ results for the reporting periodended.South African Institute of Race Relations (2015). South Africa’s HousingConundrum.Standard Bank (2013). Standard Bank Group signs affordable housingagreement with European Investment Bank, 30 October 2013.StatsSA (2014). Quarterly Labour Force Survey: Quarter 2, 29 July 2014.The Presidency (2014). Twenty Year Review: South Africa 1994-2014.World Bank (2015). Doing Business 2015: South Africa.
Websites
www.absa.co.zawww.bbc.comwww.bdlive.co.zawww.dhs.gov.zawww.doingbusiness.orgwww.eighty20.co.za www.engineeringnews.co.zawww.fin24.comwww.finmark.org.zawww.finweek.comwww.globalpropertyguide.comwww.housingfinanceafrica.org www.ncr.org.zawww.property24.comwww.propertywheel.co.zawww.resbank.co.zawww.standardbank.comwww.statssa.gov.zahttp://www.treasury.gov.za/publications/other/imf/2015/IMF%20June%202015%20Staff%20Visit%20-%20Concluding%20Statement%20June%209,%202015.pdfhttp://www.gov.za/address-l-n-sisulu-mp-minister-human-settlements-banking-association-summit-delivered-hda-ceo-mr http://www.gov.za/speeches/minister-lindiwe-sisulu-human-settlements-dept-budget-vote-201516-7-may-2015-0000http://www.bdlive.co.za/business/financial/2015/03/25/big-banks-set-to-stay-profitablehttps://wwwrs.resbank.co.za/webindicators/MonthlyIndicators.aspx?DataType=MRDMAhttp://www.bdlive.co.za/economy/2015/08/31/july-credit-growth-rises-in-line-with-increase-in-money-supply
Africa Housing Finance Yearbook 2015
183
South Sudan
In 2014/15, the government’s budget was US$5.6 billion. Oil revenue fundedabout 50 percent of the budget (US$2.5 billion in oil revenues was realised, fromtransit fees to North Sudan). The revenues would have been higher ; however,they were affected by lower oil prices7, on the international market, and reducedoutput. In order for the government to meet its target for budgeted revenues, itborrowed over US$ 1 billion from oil companies. However, this was not enoughto cover the budget deficit. The government was therefore forced it to tap intoits reserve funds. At the beginning of 2013, reserve funds stood at close toUS$1 billion; however, by the February 2015, they were estimated at US$309.7million.
Fiscal management is a challenge in South Sudan. The budget planning andpreparation system tends to only focus on preparing expenditure projections, withminimal attention paid on the feasibility of the specific budget proposals, from amacroeconomic and microeconomic perspective.
Access to finance
South Sudan’s financial sector is unsophisticated, shallow and its contribution toeconomic growth and poverty reduction is still inadequate. Only one percent ofhousehold population8 has a bank account, despite entry of new commercial banks– the number of commercial banks9 increased from eight in March 2012 to 28 inMarch 2015. The balance of the households instead rely on a narrow range ofoften risky and expensive, informal financial services. This constrains their ability
Overview
South Sudan, the world newest economy, born in July 2011, after 40 years of war1
with North Sudan, descended into internal conflict towards the end of 2013, overpolitical differences2. within the ruling party – the South People’s LiberationMovement (SPLM). The conflict threatened to reverse progress made towardsachieving social cohesion, particularly, among the two main ethnic groups – theDinka and the Nuer.
The conflict, which led to a shutdown of key oil fields in the north of the country,reducing oil output by about a half3, highlighted the need to diversify from 98percent dependence on petroleum for revenue, with which to develop a countryof about 11 million people, half of which is illiterate and dependent on subsistencefarming as the main source of income. Prior to the conflict, the country hadinitiated a number of reforms in the management of oil revenues. The PetroleumManagement Bill (2012) espouses for more credible and transparent managementof oil revenues. The above initiatives in management of public financing are criticalto macroeconomic stability, and socio-economic development and transformationof country, including the development of a vibrant housing industry.
The economic growth outlook is, however, still uncertain, and largely dependenton the evolution of political peace4 prospects to end the civil war. The IMFestimated a 15 percent reduction in real GDP, in 2014, as a result of the conflict,and yet, the country was expected to achieve an average growth rate of about30.7 percent in that year, after a sharp decline of -26.7 percent in 20135. Accordingto the African Economic Outlook (2015), GDP will contract by -7.5 percent in2015, because of the impact of the conflict on the economy, and the fallinginternational oil price. GDP growth, in 2015, is expected to continue to benefitfrom the low production of oil.
A contraction in GDP growth rates; clearly indicates that the government will nothave enough money to cover its operational expenses, a significant portion (over50 percent) of which have been allocated to the military. The recent civil war(end of 2013 through 2014) “literally” halted government’s agenda on privatesector development. Several commitments made by the government to thegrowth of a strong, competitive and equitable private sector driven economy arepending. Military spending had to be prioritized, stifling resources to otherministries, and therefore rendering them partially ineffective (both financially andtechnically) to adequately implement their mandates6.
KEY FIGURES
Main Urban Centres Juba
Exchange Rate: 1 US$***Inflation 2013 | 2014 (est.) | 2015 (prov.) | 2016 (prov.) *
...22.7 | -5.6 | 11.2 | 5.0
Population^ | Population growth rate (2013)^Urban population (% of total)^ | Urbanisation rate (% in 2013)^
11 738 718 | 3.8418.59 | 4.93
GDP / capita (current US$)^ | GDP growth rate (annual %)^GNI / capita, Atlas method (current US$) ^Population below national poverty line*Unemployment rate (%)*Gini co-efficient (year of survey)^^HDI (Global Ranking)" | HDI (Country Index Score)”
1 113.41 | 36.1796050.6...45.48 (2009)… | …
Lending Interest Rate^Mortgage Interest Rate (%) | Mortgage Term (years)#Credit % of GDP^Average Mortgages % of GDP° Price To Rent Ratio City Centre** | Outside City Centre**Gross Rental Yield City Centre** | Outside of City Centre**Outstanding home loan (% age 15+)##
...17.00 | 10...............
What is the cost of standard 50kg bag of cement (in US$)? #What is the price of the cheapest, newly built house by a formaldeveloper or contractor (in US$)? #What is the size of this house (in m2)? #What is the average rental price for a formal unit (in US$/month)#What is the minimum plot size for residential property (in m²)#
30.00
33 000 120200464
Ease of doing business rank !Number of procedures to register property !Time (days) to register property !Cost (% of property value) to register property !
18695015.60
*** Conmill.com The Currency Converter^ World Bank's World Development Indicators (2014)~ World Bank PovcalNet: an online poverty analysis tool, various years^^ The World Bank's PovCalnet" UNDP's International Human Development Indicators (2014)° Various: Badev et al. "Housing Finance Across Countries: New Data and Analysis" – Unpublished
paper/Hofinet/World Bank## Global Financial Inclusion Database (FINDEX)# CAHF Annual Survey Data (September 2015)! World Bank's Doing Business Survey Data (2015)** Numbeo Online User-Contributed Database

184
to participate fully in the financial markets, to increase their incomes and tocontribute to economic growth.
Competition among the commercial banks is still limited, as evidenced by the highprofit margins. For example, by June 2014, the South Sudan branch of KenyaCommercial Bank contributed a profit of 7.1 percent to the Bank’s regionalbusiness, more than Tanzania, Uganda, Burundi and Rwanda combined10This profitwas registered, in spite of a 30 percent reduction in business volumes, particularlyNPLs11, which increased to US$11.6 million in 2014, from US$5.9 million in 2013.It is also worth noting that the Bank was able to make a profit, despite closure ofthree of the Bank’s branches12 (in Bor, Malakal and Bentiu), because of the conflict.
The levels of dynamism and innovation among financial products on the marketare still low. Over 90 percent of the loans are short-term (less than a year, atinterest rates of between 8 and 10 percent). Medium term loans of one to fiveyears, at interest rates of between 13 and 17 percent, constitute about fourpercent of the loans. Loans of over 5 years constitute the balance (one percent),and they are offered at interest rates of between 12 and 17 percent.
Since 2013, the government had planned to establish a Housing Finance Bank tohelp with the availability of longer-term loans (5 to 15 years). However, becauseof the conflict, the country still lacks a large scale mortgage lender, and the law forestablishing of the Housing Finance Bank is still pending.
Commercial bank loan portfolio has grown almost two-fold, over the last threeyears, increasing from SSP3.6 billion by December 2012, to SSP6.7 billion byDecember 2013, and SSP7.4 billion, by December 2014. By March 2015, the loanportfolio stood at SSP2 billion, and expected to exceed SSP8 billion at the end ofthe year.
Loans for domestic trade comprise the largest share of banks’ total lending. In2013, they constituted 35 percent of the total loans, but receded to 28 percentin 2014. Loans to the household sector comprise the second largest share ofbanks’ total lending. In 2013, they constituted 16.5 percent of the total loans, butreduced to 11.6 percent in 2014. Loans to building and construction constitutethe third largest share of banks’ total lending. In 2013, they constituted 13 percentof the total loans, but receded to 12.8 percent in 2014. Loans to the real estatesector comprise the fourth largest share of banks’ total lending. In 2013, theyconstituted 10.3 percent of the total loans in 2013, increasing to 11.6 percent in2014.
During the last three years (2012 to 2014), commercial banks have shown a higherpreference for government securities, than lending to the private sector. A 15-month oil production shutdown between January 2012 and April 2013 and thecivil conflict that erupted in December 2013 reduced fiscal revenues and depletedpreviously accumulated foreign exchange reserves, forcing the government to
control spending and incur domestic debt, by selling short-term securities13.Commercial banks’ portfolio in government securities increased from SSP3.5 billionin 2012, to SSP12.9 billion (the same amount for 2013 and 2014).
Investing in government securities is less risky than lending to the private sector,particularly in view of lack of collateral acceptable to banks and the insecurity inthe country. Land titles are not available and property rights14 not established.Banks are reluctant to lend against leased land because if the land is leased to aninvestor, there is no clarity about asset ownership and assets cannot be ceased forforeclosure because the land owner (who is not typically the borrower) is theultimate owner of the asset. This stifles economic activity and bankingintermediation, as entrepreneurs and businesses have to either postpone capitalpurchases or finance them slowly out of their own savings.
In January 2015, the Bank of South Sudan and the World Bank launched the CreditReference Bureau (CRB), after three years of piloting. The CRB will contribute tothe development of credit risk management procedures within banks and financialinstitutions, hence, supporting lending activity, increasing availability of financialproducts such as credit cards and debit cards, while at the same time, ensuringavailability of a secure, reliable and efficient service to lenders. The CRB will beimplemented by Credit Info Solutions; Prague Czech Republic, for a given periodof time, until designated staff at the Bank of South Sudan are equipped with thefundamental skills needed to implement it efficiently and effectively.
Affordability
Since the majority of housing (over 98 percent) in the country is provided byindividuals, this section on affordability analyzes the individuals’ abilities, to affordconstruction of a house and/or rental for a house.
Household welfare, measured by the percentage change in the Consumer PriceIndex (CPI), shows that the cost of living in South Sudan is much higher thanbefore, and therefore, less affordable. The annual growth rate in the CPI increasedby 23.1 percent in April 2015, compared to -1.0 percent for April 2014. Furnishing,household equipment and routine household maintenance, increased from 5.1percent in April 2014 to 21.6 percent in April 2015. Housing, water, electricity andgas, increased from -14.2 percent in April 2014 to 65.7 percent in April 2015.
Over the last three years, salaries of both the formally and informally employedhave stayed constant. The government, which employs 10 percent of thepopulation, has maintained salaries of the highest earning civil servants15 atbetween SSP8 000 and 15 000; middle earning civil servants16 at betweenSSP4 000 and 7 999; lower middle earning civil servants at between SSP2 000and 4 000 and low earning civil servants at between SSP300 and 1 900.
The significant change in CPI and the depreciation of the South Sudanese Poundagainst the US Dollar raised the cost of imported cement from SSP65 (for 50kg
> $50 000
$25 000 – $50 000
$14 000 – $25 000
$8 000 – $14 000
$5 000 – $8 000
$3 600 – $5 000
$2 400 – $3 600
$1 600 – $2 400
$800 – $1 600
<$800
- - - Average income needed for the cheapest newly built house by a formal developer, 2015
- - - Average annual urban household income, 2014
SOUTH SUDAN
$22 668
$2 464
Rural | UrbanAnnual household income US$
No. of households (thousands) 500 400 300 200 100 0 100 200

Africa Housing Finance Yearbook 2015
185
bag) in 2014 to SSP200 (US$29) in 2015. The cheapest house on the market isestimated at US$10 000, compared to US$3 500, two years ago. This house,however, cannot be afforded by the highest earning civil servant (SSP15 000).Instead, they could afford to buy a house of US$6 300. And yet, three years ago(2012), the highest ranking civil servant could comfortably afford a house of aboutUS$150 000. This discrepancy is a result of the depreciation of the SouthSudanese Pound against the US Dollar, which has devalued the salaries of highincome earning civil servants to a level so low that they cannot afford the cheapesthouse on the market. In 2013, the official exchange rate was I US$: SSP 2.68. In2015 (August), the official exchange rate was 1 US$: SSP 7. The US Dollar, ishowever, still very scarce.
All civil servants are paid a housing allowance. However, the allowance paid to lowearning civil servants (those that earn between SSP300 and 1 900) is notcommensurate to the price of rentals on the market. The housing allowance hasbeen constant for the last three years, despite an increase in rentals, from US$150,in 2013 to US$246, in 2014, for a one-bedroom house. The allowance paid to lowearning civil servants ranges between SSP630 (US$90) and SSP300 (US$43). Lowearning civil servants constitute 54 percent of the public service.
Housing supply
In the last three years, several investors have expressed interest in developingSouth Sudan’s housing industry. To date, however, there are very few mediumand/or large scale housing development projects that have been completed, inany of the ten states of the country. Notable examples of developers, whoseprojects have stalled, because of the insecurity in the country and generally lessfavourable investment climate, include; (i) Abu Malek; (ii) Rock City DevelopmentProject; (iii) Buluk Premier Housing Project; and (iv) the housing project betweenKenya Commercial Bank and the Government of South Sudan.
In October 2014, the scarcity of hard currency and the depreciation of the SouthSudanese Pound against the US Dollar, led to the suspension of a US$517 millionhousing project in Juba. Works were suspended because of a lack of dollars to buycement, which is imported from neighbouring countries. The project, which wasin advanced stages of construction (about 50 percent completion), had been jointlyventured into by China Jiangsu International, Stamco for Investment, a localcompany, and the government of Central Equatoria State17. The projectcomprised a US$160 million apartment block, a housing estate with villas inNyakuron at US$ 285 million, and a low cost housing estate in Luri at US$120million. The project comprises close to 3 000 housing units, each valued at aboutUS$150 000.
Presently, the majority of housing in the country is provided by individualsdepending on their ability to afford constructing a house. Although statistics fromthe latest National Household Survey (2010) indicated that 90 percent of housesare made from mud or sticks (known as Tukul/gottya), five percent are made fromstraw mats, three percent from wood and only about two percent of houses aremade of brick or concrete; a tour of Juba City shows otherwise. In Juba City, it isplausible to argue that about 40 percent of households in Tukul/Gottya haveupgraded their houses, with brick or concrete, and roofed them with iron sheets.A 2014 Rapid Shelter Sector Assessment conducted by REACH18, on behalf of theUnited Nations, to establish the places of origin, and type of housing, among others,of internally displaced people (IDPs), before the conflict broke out, establishedthat 31.4 percent of the IDPs were living in an iron sheet roofed house, 13.8percent were living in a concrete house, while 13.3 percent were living in aTukul/Gottya. These findings suggest a gradual shift towards decent, sustainable,healthy and liveable human settlements (See Section on Property Markets formore details).
Available statistics (2010) from the National Bureau of Statistics show that thevast majority of the population (93.3 percent) live in houses they own, 2.7 percentin rented houses, 0.6 percent in houses provided as part of work and 3.4 percentin houses provided free of charge, by the government. 31 percent of thepopulation live in houses with only one room, 64 percent live in houses with twoto four rooms, and five percent of the population live in houses with five to ninerooms. Only 12 percent of South Sudanese population live in serviced housing.
The government, through the Ministry of Lands, Housing and Physical Planning, ismandated to provide for all, affordable shelter in urban areas and facilitate slumimprovement and upgrading. However, for the past three years, the government’sannual budgets have underfunded development projects. In 2014/15, the annualbudget for the Directorate of Housing Policy and Schemes was SSP22.3 million,and was earmarked for ; (i) paying wages and salaries; (ii) construction of 50housing units (for senior civil servants); (iii) training on sustainable cities; (iv) trainingon new technologies of waste management and (v) research on housing – localbuilding materials. Of this budget, only SSP0.3 million was realised, and it was allused to paid wages and salaries.
Property markets
The residential property markets, which constitute about 15 percent of theproperty markets, are still under-developed, unsophisticated and hard to estimate,both in qualitative and quantitative terms. Nonetheless, there has been gradualdevelopment of decent, sustainable, healthy and liveable human settlements, totap into the readily available rental market (foreigners/expatriates and high incomeearning civil servants). In the last three years, the number of rental apartments(one bedroom units of 80 m2, built with concrete bricks and roofed with ironsheets) in Juba, has increased by about 50 percent. These apartments areconstructed by small firms, 90 percent of which are owned and funded by highranking government officials/politicians, using fraudulent sources of income. Inpractice, these firms lease land from households living in Tukul/gottyas, andredevelop it, with semi-detached one-bedroom rental units. The redevelopmentsare however not cognisant of the preferences of clients, but rather, the urgentneed to tap into the huge rental market.
Prior to the civil war (end of 2014) a one-bedroom apartment was rented out atbetween US$1 500 and US$2 000. However, during the war, several expatriatesleft the country, consequently scaling down demand. Today, a one-bedroomapartment is rented from US$1 200 to US$1 500.
Policy and regulation
South Sudan has several policies, strategies and regulatory frameworks thatespouse practical and feasible measures on how to adequately and sustainablydevelop the housing industry and housing finance sector. Notable ones include;(i) the national housing policy; (ii) the legal and regulatory framework for mobilisingpublic and private sector resources to build affordable and decent houses for thepopulation, (iii) the Ministry of Housing and Physical Planning 2013 – 2018Strategic Plan, which delineates several interventions that will help address thehousing shortage in the country; and (iv) a new Land Policy (2013) to addressissues pertaining to land acquisition and its management.
However, adequate implementation of policies, strategies and enforcement ofregulatory frameworks, has since their formulation proved problematic, becauseof the generally politically insecure environment. Budgetary allocations toimplement them have also been inadequate. Only 30 percent of the budget isallocated towards implementation of development programs, like the ones of theMinistry of Housing and Physical Planning. However, often, the allocations are notrealised (budget shortfall).
The technical capacity of the Ministry of Lands, Housing and Physical Planning, andother Government Agencies, to implement their policies and strategies is stillinadequate. Several of the policies and strategies are prepared with support fromdonors (technical assistance, through hiring of consultants), however, it has oftenbeen alleged that, technical assistance has not been an efficient way transferring ofknowledge to locals. Also, an inherent weakness within the Ministry of Lands,Housing and Physical Planning is to employ locals who are not capable enough(education), to implement the policies and strategies.
Opportunities
South Sudan offers several opportunities for all housing sector players, however,this will hinge on stability of the political economy. There is a need to institute long-term finance schemes within the banking system if the lending culture of banks isto appreciate. Clearly, the housing sector offers substantial opportunities, ifaffordability constraints are understood.

186
Given the affordability constraints, opportunities to grow the housing microfinancemarket are also suggested. There is a need to facilitate and support theestablishment of housing co-operatives in which individuals would obtain housesunder conditions that suit their incomes. The insurance, capital markets and socialsecurity sectors have not been tapped into. These sectors are key in the provisionof long-term funds to the mortgage industry.
Other opportunities include domestic manufacturing and supply of buildingmaterials (cement, iron, wood) and building urban sanitation services (solid andliquid waste management and sewer network system).
Sources
African Development Bank (2015). South Sudan Economic Outlook.Bank of South Sudan (2015): Statistical Bulletin.International Monetary Fund; South Sudan (2014): Article IV Consultation –Staff Report; Staff Statement and Press Release.South Sudan National Bureau of Statistics (2011).Government of South Sudan (2011). Statistical Yearbook for Southern Sudan.South Sudan National Bureau of Statistics (2014).TradeMark East Africa (2015): Scoping/Mapping of Private Sector and CivilSociety Organisations engaged in Trade and Regional Integration in South SudanWorld Bank (2015). Doing Business in Juba.
Websites
http://www.newnationsouthsudan.com/business-news/housing-project-suspended-over-dollar-scarcity.htmlhttp://www.southsudannation.com/lack-of-progress-in-peace-talks-will-lead-to-economic-collapse-in-south-sudan/http://mobile.nation.co.ke/lifestyle/South-Sudan-Violence-Central-Bank-of-Kenya-loans/-/1950774/2422488/-/format/xhtml/-/hdyt51/-/index.html http://www.newnationsouthsudan.com/business-news/housing-project-suspended-over-dollar-scarcity.html
1 African Development Bank (2012). A Study on South Sudan’s Competitiveness and an Assessment of the Country’s Cross-border Trade with Neighbouring Countries2 President Salva Kiir accused his Deputy; Riek Machar, of plotting to overthrow him3 Oil production has reduced from 350 000 barrels a day in 2011, to an average of 160 000 barrels a day in 2014/154 The deadline for a new peace proposal by the Intergovernmental Authority on development (IGAD) mediators, aiming at ending the 18-month conflict, is slated for August 17th, 2015.5 African Economic Outlook; South Sudan (2015)6 http://www.southsudannation.com/lack-of-progress-in-peace-talks-will-lead-to-economic-collapse-in-south-sudan/ 7 At the time the budget was passed, a barrel of oil on the world market was US$ 95; however in the course of the year, it reduced to US$ 508 South Sudan National Bureau of Statistics (2011)9 Major banks include Kenya Commercial Bank, Mountains Trade and Development Bank, Nile Commercial Bank, Buffalo Commercial Bank, Equity Bank, Commercial Bank of Ethiopia, and ECO Bank10 http://mobile.nation.co.ke/lifestyle/South-Sudan-Violence-Central-Bank-of-Kenya-loans/-/1950774/2422488/-/format/xhtml/-/hdyt51/-/index.html 11 Because of the conflict, borrowers could not honor monthly repayment of loans12 The closure of the three branches had a minimal impact on KCB’s profitability, because the bulk of its business is in Juba, the key financial State. Also, despite closure of the three branches, transactions were
done through bank branches in other parts of the country.13 IMF; South Sudan (2014): Article IV Consultation – Staff Report; Staff Statement and Press Release14 South Sudan does not have a collateral registry for both incorporated and non-incorporated entities, that is unified geographically and by asset type, with an electronic database indexed by debtor's name
(The World Bank Doing Business Report (2015).15 These include members of parliament, presidential advisors, ministers, the President of the Supreme Court, under-secretaries and legal counsels16 These include Justice of the Court of Appeal, High Court judges, and the first, second and third legal counsels, first lieutenant generals, lieutenant generals, major generals, brigadiers, assistant legal counsel
and public servants in grades one to six17 http://www.newnationsouthsudan.com/business-news/housing-project-suspended-over-dollar-scarcity.html 18 REACH (www.reach-initiative.org) is a joint initiative of IMPACT, its sister-organisation ACTED, and the United Nations Operational Satellite Applications Programme (UNOSAT). REACH was established in
2010 to facilitate the development of information tools and products that enhance the humanitarian community’s decision-making and planning capacity
Africa Housing Finance Yearbook 2015
187
Swaziland
According to the 2013 Labor Force Survey, the country is plagued by anunemployment rate as high as 28.1 percent of total employment. Unlike in mostlow and middle income countries, Small, Medium, and Micro Enterprises (SMMEs)currently absorb less than five percent of the reported employment. In additionto persistent unemployment, the labor market is challenged by one of the highestHIV infection rates (27%) globally and has an average life expectancy of only 51years4. Together these issues are significant contributors to poverty, and 39 percentof the population lived on less than US$1.25 per day as of 2009 (most recentdata available) which represents a much higher share than in other lower-middleincome countries, where an average of 22 percent of the population lives onUS$1.25 or less5.
Access to finance
Total assets of the banking sector as of December 2014 stood at E 13.4 billion, orapproximately 34 percent of GDP. Swaziland’s banking sector is comprised ofthree private commercial banks, all of which are subsidiaries of large South Africanbanks and one state-owned development bank. The South African subsidiarybanks control approximately 86 percent of the market. Together with Fincorp, adevelopment finance corporation and the largest consumer lender in Swaziland,the banks have 40 branches, 195 ATMs and approximately 800 POS terminals.
Financial sector indicators reflect a generally adequately capitalised and profitablebanking system, though performance varies among banks and asset quality is
Overview
The Kingdom of Swaziland (KoS) is a small, open, lower-middle income economywith 1 268 000 inhabitants. Swaziland’s economy is closely tied to that of SouthAfrica, which consumes 60 percent of its exports and provides 90 percent of itsimports1. Swaziland is a member of Southern Africa Development Community(SADC), the Common Monetary Area (CMA) and the Southern African CustomsUnion (SACU) and the Swazi Lilangeni is pegged to the South African Rand.Swaziland’s economic performance remained moderate in 2014, with the realGDP growth estimated to have declined to 2.5 percent from 3.0 percent in 2013,as the country is vulnerable to external shocks, particularly from South Africa aswell as persistent internal deficiencies. The decline mainly reflects the manufacturingsector, which accounts for about one third of GDP, and was significantly affected byshocks, with its growth performance decelerating to 1.3 percent from 2.5 percentin 2013. Other factors responsible for this decline include lack of competitivenessand low levels of private investment2.
This has been supported by growth in construction, sugar, and textile sectors alongwith strong revenues from the SACU which comprises over half of all fiscalrevenues for the KoS. However, growth in Swaziland has been half that of theneighbouring countries of Botswana, Lesotho, and Namibia. In addition, the KoSanticipates a 25 – 30 percent reduction of SACU revenues in the near term, andits removal in January 2015 from the African Growth and Opportunity Actframework with the United States may also negatively impact textile exports whichrepresent three percent of GDP.
After experiencing a fiscal crisis in 2010-11, mainly due to a significant decline ofalmost 25 percent in revenues from the SACU, the government has undertakenvarious fiscal reforms and Swaziland’s budgetary outturn has since improved. The2014-15 budget estimates indicate an increase in total revenue to E14.6 billon, ofwhich E7.5 billion (51%) is SACU revenue. This implies that 49 percent of thebudget will be financed by non-SACU revenue compared to 45 percent in 2013 –2014. This outcome strongly signals the government efforts to reduce dependencyon SACU revenue as the Swaziland Revenue Authority (SRA) is putting in placemeasures to strengthen and broaden the tax base in an effort to enhancedomestic tax revenues3.
KEY FIGURES
Main Urban Centres Mbabane (capital), Manzini
Exchange Rate: 1 US$***Inflation 2013 | 2014 (est.) | 2015 (prov.) | 2016 (prov.) *
12.58 Swazi Lilangeni (SZL)5.6 | 5.7 | 5.4 | 5.4
Population^ | Population growth rate (2013)^Urban population (% of total)^ | Urbanisation rate (% in 2013)^
1 267 704 | 1.4521.32 | 1.34
GDP / capita (current US$)^ | GDP growth rate (annual %)^GNI / capita, Atlas method (current US$) ^Population below national poverty line*Unemployment rate (%)*Gini co-efficient (year of survey)^^HDI (Global Ranking)" | HDI (Country Index Score)”
2 682.35 | 2.472 70063.022.551.49 (2009)148 | 0.530
Lending Interest Rate^Mortgage Interest Rate (%) | Mortgage Term (years)#Credit % of GDP^Average Mortgages % of GDP° Price To Rent Ratio City Centre** | Outside City Centre**Gross Rental Yield City Centre** | Outside of City Centre**Outstanding home loan (% age 15+)##
8.638.25 | 2527.53............
What is the cost of standard 50kg bag of cement (in US$)? #What is the price of the cheapest, newly built house by a formaldeveloper or contractor (in US$)? #What is the size of this house (in m2)? #What is the average rental price for a formal unit (in US$/month)#What is the minimum plot size for residential property (in m²)#
6.75
12 718 80...300
Ease of doing business rank !Number of procedures to register property !Time (days) to register property !Cost (% of property value) to register property !
1109217.10
*** Conmill.com The Currency Converter^ World Bank's World Development Indicators (2014)~ World Bank PovcalNet: an online poverty analysis tool, various years^^ The World Bank's PovCalnet" UNDP's International Human Development Indicators (2014)° Various: Badev et al. "Housing Finance Across Countries: New Data and Analysis" – Unpublished
paper/Hofinet/World Bank## Global Financial Inclusion Database (FINDEX)# CAHF Annual Survey Data (September 2015)! World Bank's Doing Business Survey Data (2015)** Numbeo Online User-Contributed Database

188
relatively weak. All banks show strong profitability, with an average return onassets (ROA) of 2.5 percent in 2014, and return on equity (ROE) of 21.4 percent.Asset quality has been on a generally improving trend, with NPLs declining from9.3 percent in 2010 to 6.9 percent in 2014. These averages, however, mask a widedisparity in levels of NPLs and provisioning coverage. Gross NPLs vary from onepercent to 19.1 percent, and net NPLs from 0 to 7.6 percent. Two banks hadloan-to-deposit ratios in excess of 100 percent. This high loan-to-deposit ratiorepresents a potential bottleneck to future credit expansion, and poses a risk tothe system given the absence of an active inter-bank market. All banks areadequately capitalised with capital ratios between 16.5 percent and 42.7 percentas of year-end 2014.
Based on data from the 2014 FinScope in Swaziland, the level of financial inclusionin Swaziland continues to improve with 65 percent of the adult population usingsome type of formal financial product. This is a substantial increase from 2011when only 50 percent of adults used formal products. This increase was primarilydriven by greater usage of formal savings in banks/savings and credit cooperatives(SACCOs) and formal remittances. These inclusion numbers rank Swaziland nearthe upper third of countries in Africa in terms of financial inclusion for thosecountries that have undergone a demand-side survey of financial services.
Rural residents are twice as likely to be financially excluded (32%) as urbanresidents (16%). This may be more of a function of lower incomes of ruralresidents as opposed to physical barriers which only three percent of personscite as their reason for being unbanked. Despite broad socio-economic challengesthe financial sector in Swaziland has been profitable, well capitalised and stable inrecent years.
The primary provider of mortgages in Swaziland is the Swaziland Building Society(SBS), with the four big banks providing the balance. The SBS was established in1962, and is a viable, self-financing development and housing finance institution,and the major provider of long-term mortgage lending.
It provides loans mainly for buying vacant land and housing construction but alsofor residential and commercial mortgages, and has E1.5 billion in assets. It alsoruns a rural housing scheme, which enables borrowers to build on Swazi NationalLand (SNL, where the land is held by the tribe), by mobilising pension andprovident funds as collateral. Through a pioneering project, it also lends toresidents of informal settlements by working with savings groups. The schemeinvolves providing loans to buy small plots and for house improvements.
SwaziBank provides normal commercial banking services with a particular focus onbusiness and development finance. It has been the most pro-active of the banksin serving lower income households and has won numerous banking awards. Thebank has historically obtained interest-free deposits from the government,channelled to, among others, its mortgage programme for public servants. Urbanpublic servants can borrow up to E400 000 (US$31 000), while rural publicservants can borrow up to E200 000 (US$15 400). A variety of other mortgageproducts are also available. Swazi Bank offers a rural housing loan, mortgagedeither by a freehold property, or secured with the borrower’s pension withdrawalbenefits. Commercial banks provide a few mortgages for the upper and middleincome settlements of the market.
The Swaziland National Housing Board (SNHB), apart from being a developerand owner of housing, also provides housing finance and developed land for sale.Nedbank, FNB and Standard Bank all offer mortgages in Swaziland. Urbanhousing loans are offered generally at a LTV ratio of 80 to 90 percent. FNBrequires a 40 percent deposit for a mortgage for a plot of land, while the SwaziBuilding Society allows an 80 percent LTV ratio for the purchase of a plot, and a95 percent LTV ratio for the purchase of a house. The maximum loan term acrossall the lenders is 25 years, although Nedbank allows 20 years and FNB 30 yearsfor house purchase. Interest rates are similar to what is available – 9.25 percentas per the prime rate in 2015. The Swaziland Building Society offers its mortgageat slightly below prime at 7.5 percent.
The vast majority of members of SACCOs and the Building Society also haveaccounts at banks; as such, the current product offerings are doing little to expandthe frontiers of financial inclusion. Because of the restrictions on SACCOs and the
building society, as non-bank depository institutions, to hold demand deposits anddirectly access the payment system, few persons can rely solely on a SACCO orbuilding society for banking services as the products do not meet modern needsfor financial services.
Microfinance institutions (MFIs) have little outreach with two not-for-profit MFIsthat serve 19 500 clients and one government-owned development financeinstitution serving 2 500 SMME clients and 11 000 clients for salary-based lending.The two not-for-profit MFIs have only E21.5 million in assets and struggle forsustainability compared to E790 million in the government-owned lender Fincorp,which was originally focused on SMMEs but has moved into salaried-based lendingto support its operations.
The capital market segment in Swaziland is small comprising of a limited numberof institutions, relatively new starting in 2010 and an extremely low level of activityin the primary and secondary markets – two dealers, five managers of collectiveinvestment schemes (CIS) and nine investment advisers which take custody ofassets and four exempt dealers. Of the four CISs, one controls about 61 percentof the total funds under management. There are only seven listed shares with onlyfour trades in shares and a number of government bonds with maturities fromthree, five and seven years listed on SSX but there were no trades in bonds. Theissuance programme for government bonds has not been stable. In the past year,one new company was listed in the first quarter of 2014, but this was anintroduction of existing shares rather than a capital-raising IPO.
Affordability
Since 2010, SNHB has had low-cost offerings priced at E280 000 (US$21 540) toE450 000 (US$34 615). This required a monthly income of E6 486 to E10 422(US$500 to US$802) to qualify to service the loan. This is beyond the reach ofthe vast majority in a country where more than 85 percent of the population isclassified as earning less than US$2 a day. Even employed people such as teacherswho typically earn less than US$600 a month would find it difficult to afford thisproduct.
Despite Swaziland’s classification as a low middle-income country, economic issuesthat are mainly associated with low income countries – such as a weak businessclimate and low foreign direct investment (FDI) inflows – prevail. The high rate ofHIV/AIDS and an uneven distribution of resources remain major social concerns.The Gini co-efficient of 0.51 is one of the highest in the world, indicating widedisparities in household income. Other challenges include a high unemploymentrate of 17.8 percent, and a low Human Development Index (HDI) ranking with ascore of 0.53 mainly due to the high HIV/AIDS prevalence. While Swaziland hasmade some improvements in the past three decades in the fight against thepandemic, the HIV prevalence of 26 percent among 15-49-year-olds is the highestin the world. This has contributed to plummeting life expectancy to 40.9 years aswell as high numbers of orphaned and vulnerable children. This poses challengesto housing demand, affordability and the associated risks and costs of lending.
The SNHB also has a rental portfolio of about 1 085 units in Mbabane (505) andMatsapha (486) and rentals range from E1 125 (US$87) to E4 200 (US$323).SNHB claims that this is discounted on the market rate charged by privatelandlords for similar units. As a result, the SHNB maintains a long waiting list,leading to frustration among those still in the queue.
The SBS has established lending for plot acquisition among low income earners.The scheme has less onerous income eligibility criteria than mortgages andprovides a starter property for incremental building. Loans are partly guaranteedby the state. Loan uptake has been modest, however, due to among other reasonsa reluctance to use plots as collateral among poorer households, reluctance to betaxed, general risk aversion by the SBS to lend more, and insufficient targetedmarketing. The concept is, however, pioneering and offers a platform for greaterlending, taking lessons learnt into consideration.
Housing supply
Self-build is the predominant method of housing supply. Households source fundsfrom social support networks (family and friends), moneylenders and other financesources such as business income and rental revenue.
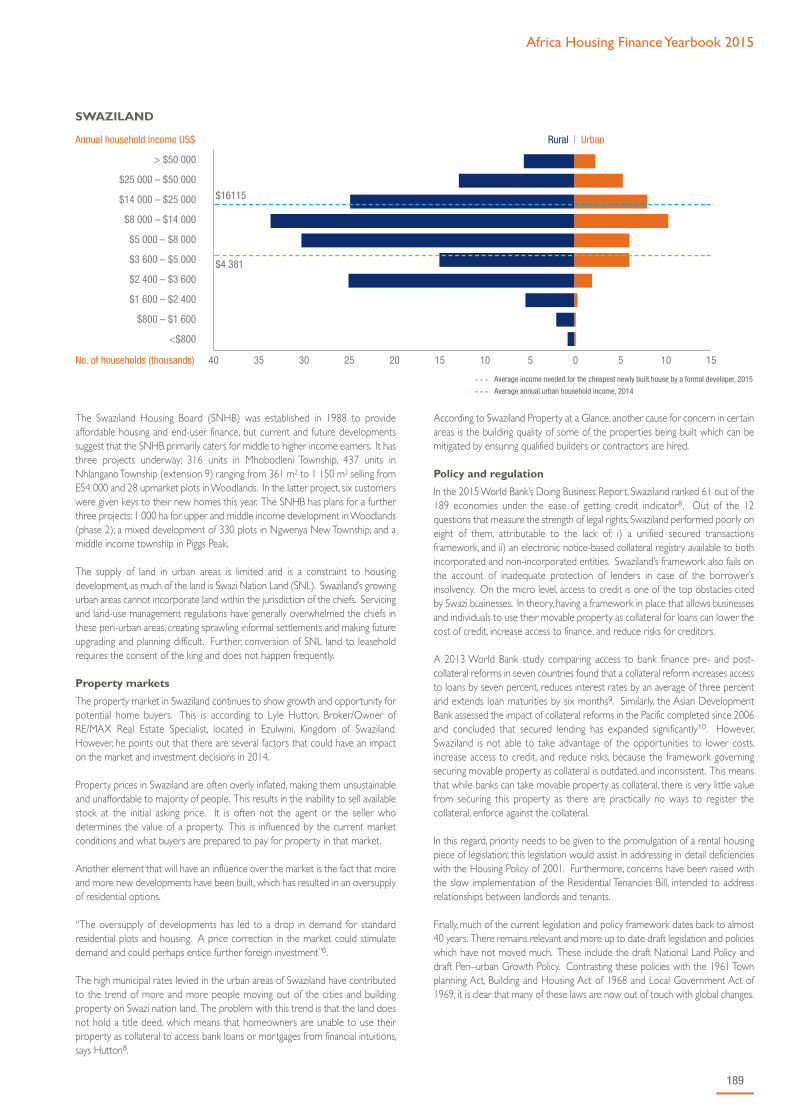
Africa Housing Finance Yearbook 2015
189
The Swaziland Housing Board (SNHB) was established in 1988 to provideaffordable housing and end-user finance, but current and future developmentssuggest that the SNHB primarily caters for middle to higher income earners. It hasthree projects underway; 316 units in Mhobodleni Township, 437 units inNhlangano Township (extension 9) ranging from 361 m2 to 1 150 m2 selling fromE54 000 and 28 upmarket plots in Woodlands. In the latter project, six customerswere given keys to their new homes this year. The SNHB has plans for a furtherthree projects: 1 000 ha for upper and middle income development in Woodlands(phase 2); a mixed development of 330 plots in Ngwenya New Township; and amiddle income township in Piggs Peak.
The supply of land in urban areas is limited and is a constraint to housingdevelopment, as much of the land is Swazi Nation Land (SNL). Swaziland’s growingurban areas cannot incorporate land within the jurisdiction of the chiefs. Servicingand land-use management regulations have generally overwhelmed the chiefs inthese peri-urban areas, creating sprawling informal settlements and making futureupgrading and planning difficult. Further, conversion of SNL land to leaseholdrequires the consent of the king and does not happen frequently.
Property markets
The property market in Swaziland continues to show growth and opportunity forpotential home buyers. This is according to Lyle Hutton, Broker/Owner ofRE/MAX Real Estate Specialist, located in Ezulwini, Kingdom of Swaziland.However, he points out that there are several factors that could have an impacton the market and investment decisions in 2014.
Property prices in Swaziland are often overly inflated, making them unsustainableand unaffordable to majority of people. This results in the inability to sell availablestock at the initial asking price. It is often not the agent or the seller whodetermines the value of a property. This is influenced by the current marketconditions and what buyers are prepared to pay for property in that market.
Another element that will have an influence over the market is the fact that moreand more new developments have been built, which has resulted in an oversupplyof residential options.
“The oversupply of developments has led to a drop in demand for standardresidential plots and housing. A price correction in the market could stimulatedemand and could perhaps entice further foreign investment”6.
The high municipal rates levied in the urban areas of Swaziland have contributedto the trend of more and more people moving out of the cities and buildingproperty on Swazi nation land. The problem with this trend is that the land doesnot hold a title deed, which means that homeowners are unable to use theirproperty as collateral to access bank loans or mortgages from financial intuitions,says Hutton8.
According to Swaziland Property at a Glance, another cause for concern in certainareas is the building quality of some of the properties being built which can bemitigated by ensuring qualified builders or contractors are hired.
Policy and regulation
In the 2015 World Bank’s Doing Business Report, Swaziland ranked 61 out of the189 economies under the ease of getting credit indicator8. Out of the 12questions that measure the strength of legal rights, Swaziland performed poorly oneight of them, attributable to the lack of: i) a unified secured transactionsframework, and ii) an electronic notice-based collateral registry available to bothincorporated and non-incorporated entities. Swaziland’s framework also fails onthe account of inadequate protection of lenders in case of the borrower’sinsolvency. On the micro level, access to credit is one of the top obstacles citedby Swazi businesses. In theory, having a framework in place that allows businessesand individuals to use their movable property as collateral for loans can lower thecost of credit, increase access to finance, and reduce risks for creditors.
A 2013 World Bank study comparing access to bank finance pre- and post-collateral reforms in seven countries found that a collateral reform increases accessto loans by seven percent, reduces interest rates by an average of three percentand extends loan maturities by six months9. Similarly, the Asian DevelopmentBank assessed the impact of collateral reforms in the Pacific completed since 2006and concluded that secured lending has expanded significantly10. However,Swaziland is not able to take advantage of the opportunities to lower costs,increase access to credit, and reduce risks, because the framework governingsecuring movable property as collateral is outdated, and inconsistent. This meansthat while banks can take movable property as collateral, there is very little valuefrom securing this property as there are practically no ways to register thecollateral, enforce against the collateral.
In this regard, priority needs to be given to the promulgation of a rental housingpiece of legislation; this legislation would assist in addressing in detail deficiencieswith the Housing Policy of 2001. Furthermore, concerns have been raised withthe slow implementation of the Residential Tenancies Bill, intended to addressrelationships between landlords and tenants.
Finally, much of the current legislation and policy framework dates back to almost40 years. There remains relevant and more up to date draft legislation and policieswhich have not moved much. These include the draft National Land Policy anddraft Peri–urban Growth Policy. Contrasting these policies with the 1961 Townplanning Act, Building and Housing Act of 1968 and Local Government Act of1969, it is clear that many of these laws are now out of touch with global changes.
> $50 000
$25 000 – $50 000
$14 000 – $25 000
$8 000 – $14 000
$5 000 – $8 000
$3 600 – $5 000
$2 400 – $3 600
$1 600 – $2 400
$800 – $1 600
<$800
- - - Average income needed for the cheapest newly built house by a formal developer, 2015
- - - Average annual urban household income, 2014
SWAZILAND
$16115
$4 381
Rural | UrbanAnnual household income US$
No. of households (thousands) 40 35 30 25 20 15 10 5 0 5 10 15

190
Opportunities
Swaziland continues to experience challenges for housing for lower to middleincome earners. The high levels of tenure security and the availability of housingmicrofinance products create an adequate platform for this. Still, housing financeplays a significant role in the Swazi credit economy though, the coming into law ofthe Consumer Credit Bill 2015 in the future may impact credit extension in theshort term as credit institutions adopted with the regulations of the piece oflegislation.
However the overall impression gained from the social perspective in Swazilandis that of a disheartened society that finds it difficult to trust formal institutions oreven community-based structures. Economic hardship, compounded by the factthat most families are confronted by death and sickness largely due to HIV/AIDS,has led to a fatalistic attitude to life with little hope and proactive planning for thefuture. People therefore tend to have a survivalist rather than an aspirationaloutlook. Compounding this, many households “inherit” the responsibility to lookafter the children of the deceased, with the elderly often becoming caregiversrather than being cared for; with life expectancy dropping from 60 a few years agoto 49 it remains difficult to comprehend how housing finance can succeed.
Sources
Cenfri (2014) Making Access Possible (MAP) Diagnostic Report Swaziland.Central Bank of Swaziland Annual Report 2014.FinScope, 2014.Oxford Economic Country Briefings: Swaziland.Swaziland National Housing Annual Report 2014.Swaziland Building Society Annual Report 2014.World Bank (2013). Doing Business 2015. Swaziland Country Profile.World Economic Forum (WEF), 2013.
Websites
www.allafrica.comwww.africaneconomicoutlook.orgwww.eswaziproperty.comwww.finscope.co.zawww.mfw4a.orgwww.mixmarket.orgwww.snbb.co.szwww.theafricareport.com
1 The World Factbook 2015.2 African Economic Outlook 2015.3 African Economic Outlook, Swaziland 2015.4 World Factbook 2015.5 World Development Indicators 2015.6 http://www.myproperty.co.za/news/8742/Swaziland-property-at-a-glance.aspx7 http://www.myproperty.co.za/news/8742/Swaziland-property-at-a-glance.aspx8 See Economy Rankings, World Bank Doing Business Report, available at http://www.doingbusiness.org/rankings.9 Inessa Love, María Soledad Martínez Pería & Sandeep Singh, Collateral Registries for Movable Assets, Does Their Introduction Spur Firms’ Access to Bank Finance?, Policy Research Working Paper 6477, The
World Bank, at 12-14 (June 2013).10 Asian Development Bank, Unlocking Finance for Growth, Secured Transactions Reform in Pacific Island Economies, 17 (2014).

Africa Housing Finance Yearbook 2015
191
Tanzania
percent to 90 percent of the population in 2013. The 2014 Global Findexdatabase reported the rate of account penetration to have doubled to 40 percentin Tanzania from year 2011 to 2014 mainly due to people adding a mobile moneyaccount rather than a financial institution account. The wide spread use of mobilefinancial services in Tanzania has led to increased financial institutions accountdormancy rates. According to Findex, while 37 percent of adults with an accountat a financial institution reported having made no deposit in the past year, 62percent of this group reported having made financial transactions using a mobilephone over that period. In 2010, the Bank of Tanzania issued regulations for acredit reference bureau within the framework of the Bank of Tanzania Act of 2006.By June 2013 Bank of Tanzania had registered two credit reference bureaus namelyDun & Bradstreet and Creditinfo Tanzania Limited. This has increased availabilityof borrowers’ credit information and has brought more hope to banks that theywill do away with defaulters.
Tanzania’s mortgage market is among the smallest in the East African region, (theratio of outstanding mortgage debt to GDP is 0.48 percent as at 30 June 20155.According to 2014 Findex very few Tanzanians – only 4.5 percent of the adultsaged 15 years and above report having an outstanding loan to purchase a home6.
According to the BoT (2014), the mortgage market recorded an annual growthrate in mortgage loan balances of 59 percent in 2014. A key element in thegrowth of the mortgage market has been the provision of long-term funding bythe Tanzania Mortgage Refinance Company (TMRC). The TMRC was established
Overview
Tanzania is a growing economy, straddling the East African and Southern Africaneconomic development communities. The country is one of the fastest growingcountries on the African continent, and is rich in natural resources. At least 31.6percent of the country’s 51 million people live in urban areas, with a populationgrowth rate of almost three percent and urbanisation rate of five percent perannum1.
The country has experienced impressive GDP growth rates over the past decadeaveraging almost seven percent per year. This growth is underpinned by risinginvestment in the natural gas sector, firm growth in private consumption, andgrowth in the telecommunications, transport, financial services, construction andmanufacturing sectors. The construction sector is also expected to grow as furtherinvestment is made in the gas, transport, power and urban property developmentsectors. The growth rate for the country is projected to remain above sevenpercent in the coming years2.
Inflation rates have portrayed an increasing trend in the first half of 2015 with therate increasing from four percent in January 2015 to six percent in August 2015falling from seven percent in 2014 and 16.1 percent in 2012. The rate is predictedto converge to slightly above seven percent in the long term3.
These positive economic indicators and reforms, as well as stable politicalleadership, have resulted in substantial multilateral and donor support for thecountry’s development agenda. Some of this support is specifically targeted atdeveloping the housing finance sector.
Access to finance
After two decades of economic liberalisation, Tanzania has 54 commercial banksand other private financial institutions. The private banking sector is sound andprofitable, with net profit after tax rising at a Compound Annual Growth Rate(CAGR) of 38.5 percent between 2010 and 20144.
According to Finscope (2013), the greatest area of growth in the non-bank formalsector has been in mobile facilities. A report on ‘Enabling Mobile Money Policies’in Tanzania by Groupe Speciale Mobile Association (GSMA) revealed there hasbeen a huge hike in the use of mobile finance since 2008, from less than one
KEY FIGURES
Main Urban CentresDodoma (capital), Dar-es-Salaam, Arusha
Exchange Rate: 1 US$***
Inflation 2013 | 2014 (est.) | 2015 (prov.) | 2016 (prov.) *
2 131.78 Tanzanian Shilling(TSh)7.9 | 6.8 | 5.1 | 5.6
Population^ | Population growth rate (2013)^Urban population (% of total)^ | Urbanisation rate (% in 2013)^
50 757 459 | 3.0130.90 | 5.32
GDP / capita (current US$)^ | GDP growth rate (annual %)^GNI / capita, Atlas method (current US$) ^Population below national poverty line*Unemployment rate (%)*Gini co-efficient (year of survey)^^HDI (Global Ranking)" | HDI (Country Index Score)”
998.06 | 6.9793028.23.537.82 (2011)159 | 0.488
Lending Interest Rate^Mortgage Interest Rate (%) | Mortgage Term (years)#Credit % of GDP^Average Mortgages % of GDP° Price To Rent Ratio City Centre** | Outside City Centre**Gross Rental Yield City Centre** | Outside of City Centre**Outstanding home loan (% age 15+)##
16.2018.00 | 1513.830.36% (2014)1.17 | 4.185.75% | 24.41%4.52
What is the cost of standard 50kg bag of cement (in US$)? #What is the price of the cheapest, newly built house by a formaldeveloper or contractor (in US$)? #What is the size of this house (in m2)? #What is the average rental price for a formal unit (in US$/month)#What is the minimum plot size for residential property (in m²)#
7.04
20 992 6537 – 8 000400
Ease of doing business rank !Number of procedures to register property !Time (days) to register property !Cost (% of property value) to register property !
1318674.50
*** Conmill.com The Currency Converter^ World Bank's World Development Indicators (2014)~ World Bank PovcalNet: an online poverty analysis tool, various years^^ The World Bank's PovCalnet" UNDP's International Human Development Indicators (2014)° Various: Badev et al. "Housing Finance Across Countries: New Data and Analysis" – Unpublished
paper/Hofinet/World Bank## Global Financial Inclusion Database (FINDEX)# CAHF Annual Survey Data (September 2015)! World Bank's Doing Business Survey Data (2015)** Numbeo Online User-Contributed Database

192
in 2010 under the Housing Finance Project (HFP) which was created withUS$40 million funding support from the World Bank to expand access toaffordable housing finance in Tanzania. The TMRC has 12 borrowing members(banks), nine of which are offering mortgage loans. In 2015, two non-borrowingmembers (Shelter Afrique and NHC) were also admitted.
By 30 June 2015, TMRC had extended loans by TZS 41.1 billion (US$19.28 million)to seven of its member banks in a bid to facilitate mortgage lending. Mortgageloans' average duration has also increased since the creation of the TMRC, fromfive to 10 years to 15-20 years. As at 30 June 2015, 21 lenders were offeringmortgage product (from only two in 2011) with more expected to enter themarket.
As at 30 June 2015, total mortgage debt stood at TZS 334 billion (US$156.82 million).Average loan size as at 30th June 2015 was TZS 75 million (US$35 182), an increasefrom 31 December 2014 when the average loan size was TZS 69 million (US$32 367).Demand for housing and housing loans remains extremely high but is constrainedby inadequate supply of affordable housing and high interest rates. Typical ratesoffered by lenders for the mortgage loan product vary between 18 and 22percent. Most lenders offer loans for home purchase but increasingly differentproducts are emerging such as loans for self-construction and for equitywithdrawal, which continue to be expensive and beyond the reach of the averageTanzanian.
Given affordability levels, the microfinance sector is especially important inaddressing housing supply in Tanzania and is growing steadily. A studycommissioned by the Bank of Tanzania found that 41 percent of Tanzanians whoborrow microloans planned to use these for housing construction orimprovements. Some 22 Microfinance Institutions (MFIs) report to the MixMarket, an online source of microfinance performance data and analysis. Based onthe most recent data found, these lenders had a gross loan portfolio of US$1.4 billion,364 813 active borrowers and 819 959 depositors giving an average loan size ofUS$3 838. The largest microlender in Tanzania is the National Microfinance BankPlc (NMB), with a gross loan portfolio of US$1.04 billion. In 2011, the TanzanianGovernment announced a plan to establish a Housing Microfinance Fund (HMFF) asone of the components of the Housing Finance Project with a US$3 millioncontribution from the World Bank. Progress has been slow as no loans wereextended up to March 2015 where additional funding of US$60 million was extendedby the World Bank for the Housing Finance Project. Out of the US$60 million,US$15 million was extended for the HMFF to make a total fund of US$18 million.On 31 July 2015, the first disbursement of TZS 1 billion (US$469 092) was madeunder the microfinance fund to DCB Commercial Bank Plc with the total creditline to the bank being TZS 3 billion (US$1.4 million). This has marked the firststep towards significant progress of the microfinance sector. DCB is looking tolend the funds to low income earners to renovate or construct new houses.For this microfinance housing product, the bank will lend up to TZS 30 million
(US$14 073) per borrower for a tenor of one to five years. Commercial MFIs arealso entering the affordable housing space. In 2015 Akiba Commercial Bank Plcintroduced a microfinance product for home improvement with loan amountsranging from TZS 500 000 (US$235) to TZS 20 million (US$9 382), repayableover 3 to 12 months.
Affordability
According to FinScope Tanzania 2013, 53 percent of all adults in Tanzania earn lessthan TZS 50 000 (about US$23) a month. 4.5 percent of adults are employed inthe formal sector, and another 22.4 percent earn their incomes from running theirown business (not farm related). According to the 2014 World Bank’s WorldDevelopment Indicators, household survey data for 2010-2014 showed anestimate of 43.5 percent of the Tanzanian population living on less than US$1.25a day with a national estimate of unemployment rate of 3.5 percent in 2012.According to a World Bank report, Tanzania’s work force is expected to grow to40 million workers who will need productive jobs by 2030. The share of thepopulation employed in emerging sectors is expected to increase to 22 percentwhereas the average income per worker is expected to only increase to US$1 900by 2030.
As mentioned, the average mortgage size is TZS 75 million (US$35 182), and somost clients are high income earners. Yet more than 70 percent of Tanzanianshave incomes of less than US$150 a month, and so are unable to access mortgagefinance. Most households therefore finance their housing through cash sourcedfrom household savings, others include micro credit loans and personal loans. Anumber of NGOs cater for the lower income market segments, but their reach isinsufficient to meet the scale of demand.
TMRC intervention has had a positive impact on interest rates. TMRC memberbanks can currently borrow from the TMRC at 11.5 percent and are therefore ableto extend mortgage loans to their customers at lower mortgage interest ratesthan those prevailing in the market. In May 2014, Bank of Africa (BOA) who is amember bank accessing funds from TMRC introduced a six month campaign forinterest rate reduction from 18 to 16 percent on their mortgage loan productwhich brought about competition for other mortgage lenders. Plans were alsounderway to re-launch the campaign in 2015.
A 50kg bag of cement costs US$7.04, but is more expensive in rural areas. Astandard sheet of surrogated iron for roofing, gauge 28 is US$9.85, gauge 30 isUS$8.44 and gauge 32 is US$6.57. The minimum plot size for residential propertyin urban areas is 400m2. The cheapest two bedroom 65m2 house offered fromthe Mwongozo Housing Estate developed about 19.5km from the KigamboniFerry was priced at TZS 44.75 million (US$20 992) VAT exclusive. Three bedroomhouses with the size ranging from 85m2 to 144m2 were priced from TZS 58.52 million(US$27 453) to TZS 128.9 million (US$60 467) VAT exclusive7.
> $50 000
$25 000 – $50 000
$14 000 – $25 000
$8 000 – $14 000
$5 000 – $8 000
$3 600 – $5 000
$2 400 – $3 600
$1 600 – $2 400
$800 – $1 600
<$800
- - - Average income needed for the cheapest newly built house by a formal developer, 2015
- - - Average annual urban household income, 2014
TANZANIA
$14 820
$2 259
Rural | UrbanAnnual household income US$
No. of households (thousands) 3500 3000 2500 2000 1500 1000 500 0 500 1000 1500 2000

Africa Housing Finance Yearbook 2015
193
Housing supply
Tanzania suffers from a shortage of good quality and affordable housing. Thecurrent housing deficit is estimated at three million housing units coupled with a200 000 unit annual demand. According to a thesis on Modelling InformalSettlement Growth in Dar-es-Salaam in 2011, about 50 to 80 percent of its urbanpopulation lives in informal settlements, and the informal housing shares morethan 50 percent of the whole urban housing stock. A Household Budget Surveyfor year 2011/2012 by the National Bureau of Statistics revealed that 18 percentof the households had connection to the electricity grid. This is an increase from12 percent reported in 2007. Coverage by the grid continued to be concentratedin Dar-es-Salaam and other urban areas with rural areas having coverage of only3.8 percent in 2011/2012.
The survey further revealed that there was an increase in the proportion ofhouseholds living in dwellings made of modern materials from 2007 to 2011/2012.In 2011/2012, 39 percent of households in Tanzania Mainland were constructedwith non-earth floors, 48 percent with durable walls and over half with metalroofs.
Survey on home ownership showed that more than 75 percent of households inTanzania Mainland owned the houses in which they were currently living.Ownership in rural areas, urban areas and Dar-es- salaam was 89.3 percent,57.9 percent and 37.1 percent respectively. Also, about 17.4 percent of householdswere living in privately rented houses, mostly in Dar-es-Salaam.
The Government of Tanzania has also played a pivotal role in ensuring that thehuge housing gaps are addressed. In July 2015, the government announced thatit is currently evaluating a considerable reduction on the Value Added Tax (VAT)on houses in order to boost the investment in real estate in Tanzania and raise livingstandards.
The National Housing Corporation (NHC) announced in 2011 that it was raisingits budget from US$23 million to US$230 million to increase the scale of deliveryin the country. By November 2014 NHC reported to have corporate investmentsworth TZS 600 billion (about US$281.5 million) and that it further plans for itsproject investment to grow to TZS 1 trillion (US$469 million) by year 2015.Alternative building materials are being explored as a way to deliver these houseson a rapid scale. Under the new ‘Public Servants Housing Scheme’, 50 000 houseswill be constructed over the next five years. By September 2014 it was reportedthat construction of 5 000 units had already started in Dar-es-Salaam and wasexpected to be completed within one year. Furthermore, under the TanzanianBuildings Agency (TBA), the government has already embarked on a special projectto construct 10 000 affordable housing units for low and higher income earnerpublic servants. By July 2015, TBA reported to have spent TZS 6 billion (US$2.8million) for construction of 850 units in Bunju B area in Dar-es-Salaam.
As part of its 2010 – 2015 vision, the NHC plans to build a minimum of 15 000housing units (including 5 000 affordable houses for low income earners) for bothsale (70 percent) and rental (30 percent), assuming the role of a master developer.In October 2013, NHC launched the sale of the 5 000 affordable housescompleted from this strategy. By June 2013, the NHC had a total of 175 jointventure projects under way, of which 55 were completed, 59 were underconstruction and 61 had been stalled. By December 2014, NHC reported thatassets owned by the Corporation had increased to 2 389 buildings with 17 111apartments at a net worth of TZS 2.911 trillion (US$1.4 billion). In September2012, the NHC announced a development in Arusha in northern Tanzania, whichwas expected for completion by January 2013. Some 100 apartments of 60m2
each were offered for sale at TZS 82 million (about US$38 466). This project hasbeen completed and is now selling. Furthermore in 2013, the NHC announcedthat it would add 510 housing units to the housing market in Dar es Salaam withinthe next two and half years, as part of three projects worth TZS 124 billion(US$58.17 million). The three high rise modern housing projects are expected tohouse over 3 000 people and have areas for commercial and recreational facilities.Apart from these three projects, another four projects of 1 000 units have alreadybeen handed over to contractors for implementation and are currently part ofNHC’s ongoing projects. These projects include: twin towers of 26 floors eachbuilt by China Railways Jianchan Engineering at TZS 68.3 billion (US$32.04 million);three storey buildings each with 16 floors at a cost of TZS 30.3 billion (US$14.21 million)
to be undertaken by Group Six International; and two structures with 16 floorsat a cost of TZS 24.9 billion (US$11.68 million) to be implemented by EstimConstruction.
In July – December 2014 (Nyumba Newsletter), NHC announced its plans tolaunch 3 projects which are expected to run for the next 5 to 10 years. Two ofthe projects called Safari City and USA River are aimed at building a total of 8 000houses in Arusha and the third project called Salama Creek Satelite City will aimto construct 9 500 houses in Dar-es-Salaam. While the USA River Satellite Cityis targeting the tourism industry, the Safari Satellite City is meant for de-congestingthe Arusha Central Business District (CBD). The Salama Creek Satelite City istargeting middle income earners and aims to de-congest the Dar-es-SalaamCentral Business District (CBD). In 2014 NHC signed a Memorandum ofUnderstanding (MoU) with China Poly Technologies Inc. for investment of ValhallaProject for construction of commercial and residential buildings located at Masakiin Dar es Salaam. NHC also signed two other MoUs with China Railway JianchangEngineering (CRJE) to jointly develop Salama Creek Satelite city located at UvumbaTemeke Dar es Salaam at a cost of US$1 billion and a Financial Square located inUpanga Kinondoni Dar es Salaam at a cost of US$500 million.
Property Markets
At 131st of 189 economies on the World Bank’s 2015 Doing Business Report,Tanzania ranks poorly in terms of ease of doing business although this is animprovement from year 2014 where it ranked 145th out of 189 economies. Itranks 123rd in terms of ease of registering property, down from 146th in 2014. Ittakes eight procedures and 67 days to register a property, at a cost of 4.5 percentof the property value – almost three times longer than the time it takes inOrganisation for Economic Cooperation and Development (OECD) countries,but comparable in terms of cost.
Lenders argue that an inadequate supply of mortgageable units makes it difficultfor a vibrant property market to exist. Recent offerings by the NHC have beensold out within days of becoming available. The demand for new, affordablehousing is considerable. A more fundamental problem, however, is the lack of landtitles. Data from the Bank of Tanzania suggests that 75 percent of land is notsurveyed in Dar es Salaam.
On the other hand NHC’s rental portfolio performed better than the sale ofhouses. During the year ended 30 June 2013, rental revenue increased toTZS 63 billion (US$29.55 million) as compared to TZS 47 billion(US$22.05 million) achieved in June 2012. NHC has sought to increase itsrentals to 60 percent of market rates, up from the average of 30 percent of marketrates that NHC tenants were charged in the past. The goal is to reach an averageof 85 percent of the market rate by June 2015. The government remains the soleand primary instrument for land delivery. While in principle, rights of occupancycan be bought, sold, leased and mortgaged in Tanzania; in practice the land marketis inhibited by many layers of government control. According to Shelter Afrique(2010), the formal market for transfers requires government approval, and landreceived through grants must be held for three years before the landholder cansell the rights. The transfer of a granted right of occupancy must be approved bythe municipality and registered. A holder of a customary right of occupancy cansell the right, subject to the approval of (and subject to any restrictions imposedby) the village council. Mortgages are regulated by formal law, and land rights mustbe registered before they can be mortgaged. There is a very limited formal landsale market in Tanzania. Most land transactions occur on the informal market, andthese tend to be leases. In rural areas, land sales were historically conductedbetween members of families or clans.
With notable inefficiencies, land acquisition, although improving, has been a hurdlein many respects towards the development of an efficient housing market; alongwith the limited availability of mortgage financing to support housing development.In recent years, the Ministry of Lands, Housing, and Human Settlements Divisionhas undertaken a drive towards implementing key steps such as improved plotallocation in greenfield areas, land regularisation and titling in existing informalsettlements that will enable it to encourage land development.

194
Policy and regulation
Since the time of independence in 1961, the government has recognised housingas one of the basic needs for all. The Ministry of Lands, Housing and HumanSettlements Development has been mandated to administer land and humansettlements in Tanzania on behalf of the President of Tanzania who serves as thetrustee of all land.
While housing development in Tanzania is guided by the National HumanSettlements Development Policy of 2000, the policy’s objectives largely catertowards the provision of adequate shelter, an efficient land delivery system, serviceprovision and better rural housing without specifically addressing the problemswithin the housing sector. Efforts are currently underway towards developing ahousing policy that will aim to address key issues surrounding the housing sector.
Mortgage finance in Tanzania is guided by the Mortgage Finance Act of 2008, andthe Banking and Financial Institutions (Mortgage Finance Regulations), 2015developed for regulating mortgage finance operations for banks and housingfinance companies. The Banking and Financial Institutions (Tanzania MortgageRefinance Company) Regulations, 2011 were also developed with support fromWorld Bank to guide the operations of the TMRC.
Finally, prudential norms were created for microfinance institutions in April 2005,intended to increase wholesale funding to MFIs and ensure their financial viability.Broader finance reform has also been initiated by the Bank of Tanzania through theBanking and Financial Institutions Act, the Bank of Tanzania Act and CompaniesAct. In 2013, the Bank of Tanzania launched its Financial Inclusion Policy, targeting50 percent formal financial inclusion by 2016. The proposed strategy tackles supplyside, demand side and structural obstacles. Furthermore, priorities for thisframework includes priorities such as payment platforms, infrastructure andconsumer protection.
Opportunities
The affordable housing market in Tanzania provides enormous potential for growthas large scale production is required. The relatively healthy economic growth andgood political management of the country provide an adequate platform for this.There is a great need for affordable housing finance for the average Tanzanian. Theuse of alternative and lower-cost technologies and materials is a key area ofopportunity which complemented by the government’s initiatives to addresshousing gaps, has the potential to bring down the long-term costs associated withbuilding housing.
Beyond mortgage finance, there are real opportunities for growth in the housingmicrofinance sector, which is also receiving policy attention and funding support.High levels of self-build coupled with a vibrant microfinance industry with goodlinks to the formal banking sector, and experimentation with housing, mean thathousing microfinance has enormous potential to contribute towards housing themajority of the population.
Sources
AfDB. (2015). African Economic Outlook 2015.African Union for Housing Finance (2014). Financing Housing in Africa, March2014. Issue 33.Bade, R. (2011). The Emergence and Work of the TanzaniaMortgage Refinance Company. Presentation to the African Union for HousingFinance Annual Conference. September 2011.Tanzania Mortgage Refinance Company (2015). Tanzania Mortgage MarketUpdate, 31 December 2014.Bank of Tanzania (2012). Annual Report. Bank of Tanzania (Unpublished 2015). Quarterly Mortgage Data, 30 June 2015.Demirguc-Kunt, A. Klapper, L. Singer, D. and Oudheusden, P.V. (2014). Measuring
Financial Inclusion: The Global Findex. World Bank Policy Research WP 7255.Doce, E. (2012). Housing Microfinance in Tanzania. Presentation to the AUHFConference, October.EIU (2014). Country Risk Service: Tanzania, July 2014.Heymans, M. (unpublished, 2011). Credit Bureau Activity in SADC Countries.Report commissioned by the FinMark Trust.Making Finance Work for Africa, Tanzania: Banks receive €16 million to boostmortgage lending, 19 September 2014.Masere, A. Tanzania Says Economy Will Expand by a Fifth After GDP Rebasing,23 June 2014, www.bloomberg.com.Mwakyusa, A. (2013). Tanzania: NHC implementing TZS 124 billion HousingProject in Dar es Salaam, 21 August 2013.Melzer, I. (2011). An Access Frontier for Housing Finance in Tanzania. Preparedfor the FinMark Trust and presented to the AUHF Conference.Mutero, J. (2010). Access to Housing Finance in Africa: Exploring the Issues (No.10) Tanzania. Report commissioned by the FinMark Trust.National Audit Office (2013). Report of the Controller and Auditor General onthe Financial Statements of the National Housing Corporation for the yearended 30 June 2013. National Housing Corporation (2010). Strategic Plan for 2010/11-2014/15,presented to Members of Parliament on 4 July 2010.National Housing Corporation (2014). Nyumba Newsletter for July –December 2014.NNkya, T.J. (2014). Financing affordable housing in Tanzania: Policy, Initiatives,Challenges and Opportunities, 29 May 2014. Presentation to the 6th GlobalHousing Finance Conference, Washington DC.Shelter Afrique (2010). Housing Study- Tanzania. Prepared by Urban Solutions.TanzaniaInvest (2013). Interview with Oscar Mgaya CEO of Tanzania MortgageRefinance Company, 18 October 2013.WAT Human Settlements Trust and Rooftops Canada (undated). Impact ofHousing Microfinance Programs in Tanzania: Three Case Studies fromKupongezana Upatu Group. World Bank (2013). World Bank (2015). Doing Business 2015 Report: Tanzania.World Bank (2014). World’s Development Indicators: TanzaniaWorld Bank (2012). Implementation Status and Results, Tanzania – HousingFinance Project (P117242), Public Disclosure Copy.Morisset, J (2014). When good is not good enough for 40m Tanzanians.The Banking and Financial Institutions (Mortgage Finance) Regulations, 2011.The Banking and Financial Institutions (Mortgage Finance) Regulations, 2015.
Websites
www.allafrica.comwww.africaneconomicoutlook.orgwww.businesstimes.co.tzwww.finscope.co.zawww.mfw4a.orgwww.mixmarket.orgwww.nhctz.comwww.tanzaniainvest.comwww.thecitizen.co.tzwww.dailynews.co.tzwww.unhabitat.orgwww.worldbank.orgwww.cia.gov/library/publications/the-world-factbookwww.afdb.org/en/countries/east-africa/tanzania/tanzania-economic-outlookwww.ieconomics.com/tanzania-inflation-rate-forecastwww.globalpropertyguide.com/Africa/Tanzania
1 www.cia.gov/library/publications/the-world-factbook/geos/tz.html2 www.afdb.org/en/countries/east-africa/tanzania/tanzania-economic-outlook3 www.ieconomics.com/tanzania-inflation-rate-forecast4 EY Africa Sub-Saharan Afrcan Banking Review for year 2014 5 Bank of Tanzania (BoT) Quarterly Mortgage Report as at 30 June 20156 http://datatopics.worldbank.org/financialinclusion/country/tanzania7 July – December 2014 NHC Nyumba Newsletter

Africa Housing Finance Yearbook 2015
195
Togo
and Senegal). Togo’s national financial system is highly concentrated, with one bankowning over one fifth of the total banks assets in the country. In 2013, a new bankreceived the government agreement, the Société Inter-Africaine de Banque(SIAB-Togo), bringing the number of banks to 13. In 2014, another bank joinedthe banking landscape with the accreditation of the Societe Generale-Benin auTogo increasing the number of banks to 142. On top of these, two financialintermediaries were recorded: The Fonds Africain de Garantie desInvestissements Privés en Afrique de l’Ouest (GARI) and the Regional MortgageRefinancing Fund (Caisse Régionale de Garantie Hypothécaire – CRRH). TheBanking system is dominated by commercial banks, a third of which aregovernment-owned. Public banks were supposed to be privatised in 2013, but sofar this has not happened. Togo is also the headquarters of the pan-African bankEcobank. In 2013 there were 183 bank branches, 191 ATM machines and 671 451bank accounts3.
As of March 2015, there were 92 registered microfinance institutions (MFIs)with 858 service points4. These MFIs had 2.6 million clients with total depositsof CFA Francs152.2 billion (US$260 million), a six percent increase compared tothe 2014 level. Total outstanding loans reached CFA Francs 127 billion (aroundUS$217 million). The Faîtière des Unités Coopératives d’Epargne et de Crédit(FUCEC – Togo) is the biggest microfinance network in Togo with over 500 000members and consolidated assets worth about CFA Francs 50 billion (aboutUS$85.3 million).
Overview
Togo is a small country in the Gulf of Guinea which became independent fromFrance in 1960. A strip of land between Ghana and Benin, Togo occupies an areaof 56 800 km2, with 56km of coastline, making it a transit country to the hinterland(Niger, Burkina Faso and Chad). Togo has a population of 6 993 2441 in 2013,growing at 2.6 percent per year.
Togo is part of the West African Economic and Monetary Union (WAEMU). Theeconomy is dominated by the primary sector which contributes up to 38 percentto economic growth, while industrial activities contribute 22 percent. In 2013,GDP growth was measured at 5.4 percent. This reached 5.5 percent in 2014according to African Economic Outlook estimates, and projected to 5.7 percentin 2015. GDP growth in Togo in 2014 was mainly driven by agriculture andinvestments in transportation infrastructure and an upturn in activities at the portof Lomé which now enjoys one of the most important investments of the sort onthe West African coast, owed to an over US$500 million private investment ininfrastructures brokered by the World Bank and its private sector branch theInternational Finance Corporation. Good economic prospects in Togo over recentyears are also the result of several ongoing economic and fiscal reforms in thecountry since 2008/2009. In 2014 the Office Togolais des Recettes (OTR), theone-stop tax collection office became fully operational and launched majorreforms in tax-collection, including tax paying through the banking system toincrease efficiency, among other goals. The inflation rate was kept below onepercent in 2014, almost a one point decrease from its 2013 level, one of the lowestin the West African Economic and Monetary Union zone.
Poverty is a major concern in Togo, with six in 10 people living below the povertyline, a figure which reaches nine in 10 people in the northern part of the country,despite government efforts, according to the 2011 poverty profile.
In April 2015, Togo held peaceful presidential elections, amid political tensions overthe need for deep constitutional reforms around the limitation of the number ofterm for the president, and a new government took office in June 2015.
Access to finance
Togo is part of the Central Bank of West African States of which there are sevenother member states (Benin, Burkina Faso, Côte d'Ivoire, Guinea-Bissau, Mali, Niger
KEY FIGURES
Main Urban Centres Lomé
Exchange Rate: 1 US$***Inflation 2013 | 2014 (est.) | 2015 (prov.) | 2016 (prov.) *
586 West African CFA1.8 | 0.9 | 1.7 | 2.7
Population^ | Population growth rate (2013)^Urban population (% of total)^ | Urbanisation rate (% in 2013)^
6 993 244 | 2.5539.47 | 3.80
GDP / capita (current US$)^ | GDP growth rate (annual %)^GNI / capita, Atlas method (current US$) ^Population below national poverty line*Unemployment rate (%)*Gini co-efficient (year of survey)^^HDI (Global Ranking)" | HDI (Country Index Score)”
646.12 | 5.7158058.77.645.96 (2011)166 | 0.473
Lending Interest Rate^Mortgage Interest Rate (%) | Mortgage Term (years)#Credit % of GDP^Average Mortgages % of GDP° Price To Rent Ratio City Centre** | Outside City Centre**Gross Rental Yield City Centre** | Outside of City Centre**Outstanding home loan (% age 15+)##
...9.00 | 1034.140.49% (Badev et al)......2.23
What is the cost of standard 50kg bag of cement (in US$)? #What is the price of the cheapest, newly built house by a formaldeveloper or contractor (in US$)? #What is the size of this house (in m2)? #What is the average rental price for a formal unit (in US$/month)#What is the minimum plot size for residential property (in m²)#
6.13
11 945 40...150
Ease of doing business rank !Number of procedures to register property !Time (days) to register property !Cost (% of property value) to register property !
14952959.30
*** Conmill.com The Currency Converter^ World Bank's World Development Indicators (2014)~ World Bank PovcalNet: an online poverty analysis tool, various years^^ The World Bank's PovCalnet" UNDP's International Human Development Indicators (2014)° Various: Badev et al. "Housing Finance Across Countries: New Data and Analysis" – Unpublished
paper/Hofinet/World Bank## Global Financial Inclusion Database (FINDEX)# CAHF Annual Survey Data (September 2015)! World Bank's Doing Business Survey Data (2015)** Numbeo Online User-Contributed Database

196
Over the past few years, the government increased initiatives directed to easeaccess to financial services for its population. In 2014, the government thereforecreated the National Inclusive Finance Fund (Fonds National de la FinanceInclusive – FNFI) with the aim of reaching those at the bottom of the revenueladder. The FNFI developed a number of microfinance products specificallytargeted to the needs of the poorest at close to zero interest rate. Microfinanceclients represent about 43 percent of Togo population, one of the highest in theWAEMU region, after Senegal, compared to an average of 16 percent for themonetary union. No microfinance institution offers housing finance products.
Togo has two social security institutions, the Togolese Pension Fund (CRT) for civilservants and the National Social Security Fund (CNSS) for private sectoremployees and other categories of government personnel. Recently a NationalHealth Insurance Institute was created, which is a national universal healthinsurance scheme currently only open to civil servants but expected to beextended to the whole population in the future. As in many African countries, bothsocial security institutions are unfunded defined benefit schemes and face financialdifficulties and structural challenges, among which structural deficits.
Access to credit as measured by credit to the economy was CFA Francs 763 billion5
(US$1.3 billion) in 2014, a nine percent increase from its 2013 level. Thisrepresents 33.7 percent of the GDP. Short-term loans represented more than51.1 percent of credits. A few banks offer housing finance and mortgage productsand services, ranging from loans for land acquisition to loans for housingenhancement and loans for housing purchase of construction. Conditions ofaccess to these products vary from one bank to the next, but the loan period isusually between four and 10 years. The interest rate is between 11 and 12 percenton average, while guarantees requested by the lending bank range from amortgage on the purchased land or house to life insurance. Some banks requesta percentage of up to five percent of the loan as a guarantee. The amount of theloan can be as high as 50 percent of the annual salary of the borrower. In generalthese loans are available to people with regular jobs and revenues from the publicand private sector.
According to a recent note prepared by the Central Bank, 2 923 housing loanapplications were approved by Togolese banks in 2013, the second highest numberof approved loans after Senegal (7 676), for a total of CFA Francs 10.7 billion(US$18.3 million), and represented 5.3 percent of total loans6. However, on averagethe proceeds of these loans were very small, at around CFA Francs 2.9 million(about US$4 950) per loan. Interest rates dropped in Togo, as in other WAEMUcountries by an average of one point compared to their 2006 level, according toa recent report on housing finance in the WAEMU region.
Lomé, the capital city, is also headquarters of the Regional Mortgage RefinancingFund (the Caisse Régionale de Refinancement Hypothécaire, or CRRH), aregional fund created in 2010 to facilitate access to long-term resources neededto provide long-term loans such as housing finance and mortgages. Several
Togolese banks such as EcoBank and Banque Atlantique Togo are shareholders ofthe fund.
In September 2014, the Ministry of Housing and Urban Development organiseda workshop to validate the feasibility study of a housing bank in Togo, as in Beninand in Mali. The validation of this study will launch the creation of this bank as akey instrument of the government housing policy. 12 months after this workshop,there has not been any significant change and it is not clear when this bank will becreated.
Affordability
The average income per person (gross national income per capita) is estimatedat US$580 according to the World Bank’s World Development Indicators in 2014.In Lomé, the price per square metre of land varies between CFA Francs 16 500(US$28) and CFA Francs 33 500 (US$57.17) in the suburbs and betweenCFA Francs 33 500 (US$57.71) and CFA Francs 83 500 (US$1 422.49)7 indowntown Lomé. The minimum size of a plot is 150m2 for a minimum housingsize of 40m2. On average, the land price in the country was estimated to CFAFrancs 8 5008 (US$14.50) per m2 in settlement areas in 2010.
While the cement price in Togo is the cheapest of all countries in the WAEMU, itis still far above the purchasing power of most Togolese. Indeed, a standard 50kgbag of cement costs between CFA Francs 4 000 (US$6.83) and CFA Francs 4 050(US$6.91). A standard galvanised sheet of iron for roofing costs between US$3.60and US$6.21. Other construction materials are also out of reach of the poorestpeople. However, the price of cement is expected to decrease in the near future.Indeed, in 2014 the cement sector leader, Heidelberg Cement, launched theconstruction of two new cement plants in Togo (of which one will be in theextreme North in Dapaong), with the goal of providing 1.7 million tons of cementeach year upon completion. In January 2015, the construction of another cementplant was launched in the city of Kara by Scantogo Mines, with an expectedproduction of 5 000 tons of clinker a day.
It will take between 10 and 15 years for a senior manager in the Togolese publicadministration to pay off the price of land in downtown Lomé. The cheapesthousing unit built by a developer is around CFA Francs seven million (or aboutUS$11 945)9. Under these conditions, housing affordability, is a mere dream formost Togolese, even for many with a formal job and a regular income. This pushedmost of low income households outside of the more urbanized areas, where theydevelop informal settlements. This is true for example on the northern outskirtsof the city of Lome, in Tsevie, where those households can afford to buy a pieceof land.
Housing supply
Over fifty years of government policy in Togo has not yielded much results in termsof meeting the demand for housing. Today housing supply is a real challenge that
> $50 000
$25 000 – $50 000
$14 000 – $25 000
$8 000 – $14 000
$5 000 – $8 000
$3 600 – $5 000
$2 400 – $3 600
$1 600 – $2 400
$800 – $1 600
<$800
- - - Average income needed for the cheapest newly built house by a formal developer, 2015
- - - Average annual urban household income, 2014
TOGO
$4 467
$3 671
Rural | UrbanAnnual household income US$
No. of households (thousands) 250 200 150 100 50 0 50 100 150
Africa Housing Finance Yearbook 2015
197
households overcome through self-construction. But self-construction and poorprovision of serviced lands, combined with a rural exodus, have contributed tourban sprawl on the northern side of Lomé, which is now mainly made up ofslums. Only richer people can afford to purchase land in Lomé and othersecondary cities and build formal houses. Conscious of challenges in the sector,the government of Togo has actively sought solutions to the problem of thehousing shortage, engaging, for example, with Shelter Afrique and privatedevelopers in an attempt to supply the housing needed in the market.
Despite several announcements in the past about housing constructions, therehas not been much progress. It is in this context that several private operatorsrecently launched a few new housing projects. One is in Lomé, the “Cité desanges”, which plans the delivery of empty plots but also 156 housing units ofdifferent standings, and a 20-apartment complex, mostly targeted to the upperincome quintiles, located on the west side of the city of Lomé. The project is beingcarried out by N Real Estates, a consortium of Togolese and foreign nationals. Thesecond project is the Résidence Esperanza, promoted by CECO Immo, aTogolese developer who planned to build 200 housing units in Sotouboua formiddle income households, in the center of the country. The project alreadystarted delivering a few of the promised units. The choice of Sotouboua to buildthese housing units is probably justified by the creation of a teachers’ school in thatcity. Finally, the government announced in January 2015 the launching of the CitéMokpokpo project which is supposed to deliver 1 000 social housing units. Theproject will be completed in public-private partnership with Ivorian real estateoperator Societe ivoirienne de promotion immobilière (SIPIM). Three local bankshave already expressed their support to the project, namely Orabank Togo, BIATogo, and Banque Atlantique by offering mortgage loans over 15 to 20 years. Thehousing units will cost between CFA Francs 7 million and CFA Francs 17 million(between US$ 11 945 and US$29 010). The government was clear that thetargeted population for this project is mainly civil servants. The project which ispartly located in Adidogome in the north-western part of Lomé will comprise420 villas and 120 apartments.
There is a growing but informal rental market, mainly in urban areas, such as Lome,the Capital city, in Kara in the North, and a few other secondary cities such asKpalime (in the west), Attakpame, Sotoubua and Sokode (in the center), andAneho (in the south-east). This market is operated by individuals who build andrent out their houses. There are also a few self-called real estate agents who serveas intermediaries between those offering and those demanding rentals, but in theabsence of any regulations on real estate, they operate according to their ownrules. Renting an apartment or a house in become more and more expensive,because of the high demand for housing in urban areas, while salaries, especially inthe public sector have not change much over the past 30 years. In Lome, oneneeds at least CFA francs 50 000 (US$85.32)10 to rent a one-bedroomapartment.
Property market
Togo’s formal property market is still developing. According to the 2010 generalpopulation and housing census, only 68 074 of all properties in the country had aproperty title, of which 14 238 were in Lomé. A study commissioned in 2008 bythe Ministry of Justice found that it took nine steps and 49 procedures to registerland in Togo, and cost on average CFA Francs 250 000 (US$427). Another studycommissioned in 2011 in preparation for the Togo Land Code found that a totalof 10 government agencies were involved in delivering a land title, through aprocess costing up to 25 percent of the property value. This cost does not includethe official cost of the land title, which comes to 11 percent of the value of theproperty. However, according to the World Bank’s 2015 Doing Business Report,Togo improved its ranking from 184th on the “Registering a property” indicator to182th. It still takes 295 days to complete all land titling procedures but it costs in2014, 9.30 percent of the value of the property, compared to 11.4 percent theprevious year.
There is no cadastre in Togo, despite the existence of a Central Directorate ofCartography and Cadastre. It has been reported recently in a diagnostic study onland problems in Togo, commissioned by the Ministry of Urban Development andHousing that the land title had lost its unimpeachable character due to rampantcorruption, which has resulted in many cases of double registration of the samepiece of land. Indeed, there were several court cases pending in which different
people claimed ownership of property title on the same piece of land because theregistry was corrupted at some point. It is expected that the new Land Code willhelp to address this kind of problem, streamline the titling procedure andinstitutions and give back value to the land title.
Obtaining a construction permit became mandatory in 2007. The rule is jointlyenforced by the Togolese Order of Geometers, the Ministry of UrbanDevelopment and Housing, and some municipalities such as that of Lomé or Kara.Yet, it is still very expensive to get such permit (which remains unaffordable tomost Togolese), as it costs 458.5 percent of per capita income, takes 155 days and12 procedures to obtain it. In 2014, Togo has improved construction permitprocedures, cutting down the time it takes to get it by half, from 309 days in 2013to 165 days in 2014. People thus continue with direct sales of properties on thebasis of a simple sales agreement in the informal market. Sometimes, for thosewho can afford it, the assistance of a notary is procured.
A few housing brokers operating on the Togolese housing market. Among thoseare Phillison and Co., Immowants, Le Logis, and Confortis international SA, whichare all private real estate agents offering a platform for home buyers and homesellers to meet. The last is also a developer and is trying to promote a newdevelopment on the northern side of Lome, the so-called Wellbeing City whichhas been announced for some years now.
Policy and regulation
The regulatory environment around housing and housing finance has not changedmuch over the past five decades. Most of the existing policies and regulationswere enacted between the 1950s and 1970s and guided the government’swillingness to provide adequate and affordable housing to every Togolese.Unfortunately most of these policies have failed to achieve the intended goals.Because of the failure of past policies, the housing deficit grew over the years andreached around 250 000 in 2014, requiring a supply of 23 000 units a year onaverage to clear the backlog.
Between the 1980s and the 1990s, little has happened on the policy side relatedto housing and housing finance. This was mainly because of the economic andfinancial crisis of the 1980s and the international embargo on Togo, between 1992and 2005.
However, during the decade starting in 2000, urban development, housing andland policy questions returned to the public policy agenda. The governmentadopted a few policy documents, including the adoption of the National UrbanSector Policy Statement, a Housing Policy Statement, and a new National HousingStrategy. The focus of the latter is to reorganise the housing sector through theadoption of adequate legislation, improve the existing real estate stock and provideall social strata, particularly low and middle income households, with affordablehousing that meets minimum safety, occupancy, structural stability and temporalstandards. The strategy stipulates that the government will contribute every yearto this demand by facilitating the supply (through public private partnerships andsubsidy programmes) of 2 500 housing units against an annual demand estimatedat 23 000 units. As of today, no concrete results can be shown on the ground.
Several other reforms were launched, including the revision of the Togo Land Code,the validation of a draft Law on Real Estate Development in December 2010(which are still pending at the National Assembly – the Parliament) and the draftingof the Togo Urban Development and Construction Code. The Real EstateDevelopment draft law covers areas such as conditions required to perform theprofession of real estate developer, social real estate development operations (thelaw imposes a minimum of 100 housing units for this type of operation) and theproduction of serviced land. An important change to be brought into the housingand real estate sector by this code is the creation of a new public entity with themandate to produce and sell serviced land – the Societe d’Equipement desTerrains Urbains (SETU).
Opportunities
One can say that Togo has fully recovered from more than a decade ofinternational embargos. The government has engaged in several importanteconomic and fiscal reforms which should continue improving the businessenvironment, but also the road and energy infrastructure. Togo was among the top

198
10 reformers according to the Doing Business report, improving its overall rankingby 15 places, from 164th to 149th in 2014. With a high demand for housing, severalcompanies have been positioning themselves to take advantage of a market thatis still untapped. Shelter Afrique confirmed its interest in investing in housingprojects in Togo by committing to the development of a pilot 153 housing unitproject in April 2014. The Moroccan real estate investment group Addohaexpressed interest in investing in cement plants but also in housing, while thefeasibility study for a housing bank in Togo is near completion. This is all inpreparation for major changes in the housing finance sector in Togo.
According to a recent study by the French Development Agency, the populationin Togo should increase by at least 50 percent between now and 2030, and doubleby 2050 depending on the fertility rate and rural to urban migration. As aconsequence, social demand, including demand for housing, will experience astrong increase, presenting an opportunity for developing innovative housingpolicies, especially in a context characterised by low incomes. The scarcity ofdevelopers today leaves the room for newcomers to take advantage of theseopportunities.
Sources
AfDB, OECD, UNDP and UNECA (2015). African Economic Outlook 2015.Country Note Togo.BCEAO (2015). Statistical Yearbook 2014: BCEAO : Dakar, June 2015.BCEAO (2014). Note d’analyse sur les conditions de financement bancaire del’habitat dans les pays de l’UEMOA : BCEAO : Dakar, Octobre 2014.BCEAO (2014). Commission Bancaire de l’UMOA. Rapport Annuel 2013.Abidjan, Juillet 2014. World Bank (2014). Doing Business 2015: Going Beyond Efficiency.Washington, DC: World Bank Group. DOI: 10.1596/978-1-4648-0351-2.License: Creative Commons Attribution CC BY 3.0 IGO.
Websites
www.africaneconomicoutlook.org/en/countries/west-africa/togo/www.doingbusiness.org www.hic-net.org www.uncdf.org/sites/default/files/Project/programme_document_-_togo_2.pdf www.bceao.inthttp://www.numbeo.com/cost-of-living/city_result.jsp?country=Togo&city=Lome www.data.worldbank.org
1 World Bank’s World Development Indicators 20142 BCEAO (Central Bank). Establissements de Crédit, paysage bancaire (at Mars 31st, 2015), available at the website http://www.bceao.int/Togo-2337.html 3 BCEAO (Central Bank). Commission Bancaire de l’UMOA, Rapport d’activités 2013, p. 28.4 BCEAO (Central Bank). Indicateurs des SFD de l’UMOA – 2015, available at the website http://www.bceao.int/IMG/pdf/indicateurs_au_31_mars_2015.pdf 5 BCEAO. Statistical Yearbook 2014, p.139.6 BCEAO (Central Bank). Note d’analyse sur les conditions de financement bancaire de l’habitat de l’habitat dans les pays de l’UEMOA, p.15.7 Estimated from data collected from various real estate advertisements. It is in line with the average estimated 8 500 CFA Francs per square meter in 2010 according to the Central Bank’s 2014 Statistical
yearbook.8 BCEAO. Statistical Yearbook 2014, p.130.9 Price offered by developers for the Mokpokpo Estate, a new government project being implemented in public private partnership with the Societe ivoirienne de promotion immobilière.10 www.numbeo.com

Africa Housing Finance Yearbook 2015
199
Tunisia
Access to finance
Tunisia has a reasonably well-developed financial sector regulated by the CentralBank of Tunisia. Over the past four decades, Tunisia has built up a sophisticatedmortgage-based housing finance system with a large number of financial institutionsoffering loan products for housing, including over 20 private commercial banks, inaddition to the three state-owned banks. Until the early 2000s, the publically-owned Housing Bank (Banque de l’Habitat), established as a result of the NationalHousing and Savings Fund’s shift to Universal bank, had been the single player inthe mortgage market. The de-compartmentalisation and deregulation of thebanking sector (Pursuant to the Law No. 2001-65 on credit institutions)haveallowed new actors to massively position themselves in this market. This move wasmainly due to (i) the declining performance of the main actor, the Housing Bank(The Housing Bank’s share of the home purchase savings collection marketdropped from over 80 percent in 2003 to less than 60 percent in 2014), and to(ii) the attractiveness of the housing finance market. Strategic interest in thismarket has led to fiercer competition between credit institutions which frequentlylaunch dedicated promotional campaigns, the most recent being Al Baraka Bank’s4
2015 “Maskan” advertising campaign. Overall, product offering in this market hasbecome largely undifferentiated but conditions of access to housing finance haveconsiderably expanded through the launching of specialized products tailored tovarious categories of clients.
While private lending is focused on high to middle income households, there havebeen savings-for-housing programmes for the formally employed since the 1970s.
Overview
Before the revolution of 2011, Tunisia was widely regarded as one of the mostperforming countries of the Middle East and North Africa (MENA) region becauseof its achievements in terms of economic and human development. Despite someremarkable results and progress, the pre-revolution Tunisian development modelfailed to bring about genuinely inclusive growth. Deterioration of economicgovernance and the capturing of resources by the elite during the last decade ofBen Ali’s rule hampered further economic development and triggered a surge insocial discontent which culminated in the fall of the regime in 2011.
After having achieved a successful historical democratic transition, embodied by theConstitution of 2014, Tunisia suffered two major terrorist attacks within a shortinterval in 2015. The Bardo National Museum attack in March 2015 and theSousse shooting on 26 June 2015 resulted in 60 civilian casualties, mostly foreigntourists. These have undermined transition to a stable political, economic, andsecurity environment conducive to economic growth. The GDP growth forecasthas indeed been revised from three to one percent1 in 2015 against 2.3 percentin 20142. This rate remains fairly below the average of 4.5 percent recorded duringthe 2000s.
The drop in the national savings rate (13.5 percent of GNI in 2014 against14.1 percent in 2013), along with the investment rate regression (19.2 percent ofGDP in 2014 against 20.3 percent in 2013) meant an increase in external financingneeds. The external indebtedness rate rose from 40.8 percent in 2013 to43.7 percent of GDP in 2014.
The unemployment rate recorded in 2014 was 15 percent, dropping by 0.3 percentfrom 15.3 percent in the fourth quarter of 2013. Women’s unemployment rateis high at 21.1 percent, the graduate unemployment rate is 38.7 percent3 withhigher education graduates suffering the most at 30.4 percent.
Housing is the second largest item of expenditure for Tunisian households. Theircapacities vary but they all seek better living conditions, driven by the emergenceof new needs that are in constant evolution. Although housing is increasinglyavailable, its affordability is increasingly problematic, especially since 2011.
KEY FIGURES
Main Urban Centres Tunis (capital), Sfax
Exchange Rate: 1 US$***Inflation 2013 | 2014 (est.) | 2015 (prov.) | 2016 (prov.) *
1.97 Tunisian Dinar (TND)6.1 | 5.5 | 5.0 | 4.4
Population^ | Population growth rate (2013)^Urban population (% of total)^ | Urbanisation rate (% in 2013)^
10 996 600 | 1.0166.65 | 1.29
GDP / capita (current US$)^ | GDP growth rate (annual %)^GNI / capita, Atlas method (current US$) ^Population below national poverty line*Unemployment rate (%)*Gini co-efficient (year of survey)^^HDI (Global Ranking)" | HDI (Country Index Score)”
3 829.11 | 2.3!*3 906.12!*15.512.835.79 (2010)90 | 0.721
Lending Interest Rate^Mortgage Interest Rate (%) | Mortgage Term (years)#Credit % of GDP^Average Mortgages % of GDP° Price To Rent Ratio City Centre** | Outside City Centre**Gross Rental Yield City Centre** | Outside of City Centre**Outstanding home loan (% age 15+)##
7.78!*8.00 | 1575.37!*9.25% (Badev et al)17.3 | 18.175.78% |5.5%10.68
What is the cost of standard 50kg bag of cement (in US$)? #What is the price of the cheapest, newly built house by a formaldeveloper or contractor (in US$)? #What is the size of this house (in m2)? #What is the average rental price for a formal unit (in US$/month)#What is the minimum plot size for residential property (in m²)#
3.52
25 500 50...120
Ease of doing business rank !Number of procedures to register property !Time (days) to register property !Cost (% of property value) to register property !
604396.10
*** Conmill.com The Currency Converter^ World Bank's World Development Indicators (2014)~ World Bank PovcalNet: an online poverty analysis tool, various years^^ The World Bank's PovCalnet" UNDP's International Human Development Indicators (2014)° Various: Badev et al. "Housing Finance Across Countries: New Data and Analysis" – Unpublished
paper/Hofinet/World Bank## Global Financial Inclusion Database (FINDEX)# CAHF Annual Survey Data (September 2015)! World Bank's Doing Business Survey Data (2015)** Numbeo Online User-Contributed Database!* Central Bank of Tunisia. Annual Report 2014

200
The Housing Bank is the exclusive manager of a state subsidised housing loan forlow income households called FOPROLOS. Loan rates for mortgages range from2.5 to 5.75 percent for three different income eligibility brackets, targetedat households earning a regular salary at between minimum wage and upto 4.5 times minimum wage (set at US$177 a month – from May 2014 onwards).This compares to an average 7.78 percent rate for mortgages available atcommercial rates, in July 2015.
Housing loans are regulated by the Central Bank. According to the Central Bank’s2014 annual report, the total value of long-term loans to home-buyers increasedby 7.3 percent between 2013 and 2014, reaching US$3.80 billion. Mortgagelending is approximately equivalent to 9.1 percent of GDP. Rules modified in20075 limit loan-to-value ratios to below 80 percent (though up to 90 percentin social lending programmes, like FOPROLOS), and a maximum term of 25 years.Part of this law also requires long-term liquidity matching requirements for loansover 10 years and a requirement that interest rates must be fixed for housingloans longer than 15 years. This requirement means many banks are funded bysovereign bonds and are resistant to offer loans beyond 15 years. Currentchallenges include a lack of liquidity in the banks and a high level of non-performingloans, which was reported to have increased from 12.0 percent in 2010 (pre-revolution) to 15.0 percent in 20146. It should be noted that the SupplementaryBudget Law for 2015 includes measures to treat debts held by beneficiaries ofhousing credits issued as part of social housing initiatives7.
In terms of secondary markets, Tunisia has a stock exchange (BVMT) and in 2001,developed the legal framework for securitisation to facilitate access to long-termfunding for mortgage finance. However, activity has been extremely limited withonly two transactions (in 2006 and 2007 respectively, amounting to US$80 million)by a single institution, the International Arab Bank of Tunisia (BIAT). There is alsoan alternative capital securities market for Tunisian companies that cannot be listedon the main market.
The Decree-Law No. 2011-117 on Micro-Finance Institutions of 5 November2011, opening the way for new entrants. The government has set up a licensingauthority with the assistance of the German Development Agency. This sector islikely to experience growth in the coming years, yet has been slow to launch dueto political and regulatory uncertainty for new entrants. However, the additionaluntapped market has been estimated at between 0.7 and 1.0 million.
The microfinance sector has yet to grow substantially due to restrictive regulationand interest-rate capsset before the Revolution. Only one institution, Enda Inter-Arabe, operates at any scale. At the end of 2013, Enda had 231 520 clients, anda gross loan portfolio of US$96 million, with a default rate of only 0.55 percent.In 2014, EBRD provided Enda with a loan for US$6.2 million to support them toscale their operations to Micro and Small and Medium Enterprises. In 2008, Endalaunched a new product called “Eddar” specifically for housing improvements torespond to the high demand in this market segment. Loan size and terms grewin 2014, ranging from US$567 to US$2 834, over a maximum period of 24 months.At the end of 2013, the Eddar loan made up 12 percent of Enda's total portfolio.Average loans were for US$900 and for a 15 month term.
Zitouna Bank was the first institution in 2009 to launch a Mourabaha product.The government is working with the Islamic Development Bank to issue its firstsukuk bonds, which has been presented as a cheap means to access long-termfinance.
Affordability
Due to progressive housing policies since independence in 1956, housingaffordability is higher in Tunisia compared to other countries in the region. Overallprice-to-income index is often quoted as five, yet this number does not reflectthe reality for low income households, a growing market segment as youthunemployment remains high at 40 percent8. These households usually cannotqualify for housing loans and do not have the capacity to pay for even a modestunit.
According to Brookings Institute, the size of Tunisia’s middle class reached morethan 40 percent of the total population in 2010, up from 25 percent in 2000. Percapita spending averaged US$2 360 a year in 2010, which ranged from US$1 496
in the Centre West region to US$3 228 in Tunis. In 2012, 1.2 percent ofhouseholds had expenditure of less than US$2 500 a month, 12.8 percent spentbetween US$2 500 – US$5 000, 24.9 percent between US$5 001 – US$7 500,20.9 percent between US$7 501 – US$10 000 and 40.2 percent above US$10 000.In May 2014, the minimum monthly income for a 48-hour working week increasedto US$177. Yet, this still leaves the lowest tier of formally employed people withonly approximately US$40 – US$80 a month to spend on housing.
In terms of affordability, a 2012 analysis by UN HABITAT calculated that amodest house of 75m2 built progressively on peri-urban land would cost aboutUS$14 000, or US$187.5 per m2. Such a unit has a price-to-annual-income ratioclose to nine for the lowest decile households. Assuming 30 percent of incomecould be mobilised for monthly housing payments, the repayments required on thecheapest housing loan makes this unit unaffordable to 30 percent of Tunisianshouseholds.
The government programme, FOPROLOS, was designed in 1977 to providehousing finance for low income groups and is still the main tool assisting access toaffordable housing. There are three main categories:
n FOPROLOS 1: Households earning between 1-2 times minimum wage canpurchase a unit below 50m2 atUS$25 500, with a loan of 90 percent LTV for25 years, at 2.5 percent per annum.
n FOPROLOS 2: Households earning between 2 – 3 times minimum wage canpurchase a unit below 75m2 atUS$32 100, with a loan of 90 percent LTV for25 years, at 4.0 percent per annum.
n FOPROLOS 3: Households earning between 3-4.5 times minimum wage canpurchase a unit of between80 – 100m2 at less than US$43 400, with a loanof 85 percent LTV for 25 years, at 5.75 percent per annum.
However, in recent years, the cost of a FOPROLOS home has become inaccessibleto the target groups, with housing costs at around US$510 per m2. Qualifyingcriteria do not enable households with irregular incomes to participate.Furthermore, loan ceilings have not increased with cost of production so it isdifficult for developers to offer a housing supply to match the subsidised financialproduct. There are clear indicators that, in its current shape, this mechanism isnot suited for the attainment of its set objectives, thus prompting a spillover of thedemand into the informal sector. According to data from MEATDD, the share ofapproved FOPROLOS housing units offered by private developers onlyrepresented on average six percent of the total approved housing units between2004 and 2013. FOPROLOS remains largely under utilised due to a lack ofadapted supply rather than a lack of resources. The cumulative surplus (unspentresources) of FOPROLOS nearly reached US$230 million at the end of 2013.
Housing supply
The 2014 census and housing survey released in September9 recorded a totalhousing stock of 3 289 903 units, an increase of 789 103 units since the last censusin 2004. This exceeds the number of households which was recorded at 2 712 976in 2014. 79.2 percent of Tunisians own their home and an estimated17.7 percentof the units are vacant, which are usually high-cost units purchased as secondaryhomes, luxury rental properties, or speculative investment properties.
Of the annual demand, estimated at 77 000 units per year, around 40 percent isbuilt informally on an incremental basis on quasi-formally subdivided land, whichis bought and acquired through notary deed.A total of 42 587 building permitswere issued in 201310. Of the formal units, approximately 80 percent areconstructed by individual households (responsible for 28 000 building permits and38 300 units per year), two percent by public developers and 18 percent byregistered developers, who tend to target middle to high income groups.
There is a state programme of subsidised construction finance for residentialproperty developers. The Housing Bank can finance up to 80 percent of the totalcost of a project if the housing units are “social” units at 6.78 percent per annum,and up to 70 percent if they are “economic” or “high-standing” units, at 7.28 and8.28 percent per annum respectively. This financing system was introduced as partof the National Housing Strategy (1988) that saw the private sector as animportant housing producer.

Africa Housing Finance Yearbook 2015
201
Property market
There are two land registration systems: the regime established by the Decree-Lawof 20 February 1964 on the registration of agricultural lands is compulsory, freeof charge, and state-administrated, whereas the second regime is optional and istriggered by voluntary applications for registration by land-owners, usually basedon a notarial deed. The land registration system involves three main actors: (1) theproperty court, which is the competent judicial authority, intervenes at the onsetof the registration process by issuing a registration judgement; (2) the Land Surveyand Topography Agency (Office de Topographie et de Cadastre, OTC) is a technicalbody mandated with boundary marking and allotment operations as well asestablishing land plans; (3) the Landed Property Registry (Conservation de laPropriété Foncière, CPF) is responsible for issuing, updating, and maintaining titledeeds.
The real estate and construction sector is an important contributor to nationalGDP and employment. In 2014, the number of jobs by the construction andsettlements sector was measured at 456 000, which represents 13.5 percent oftotal employment. The housing sector also accounted for three percent of therevenues of the state via taxes collected from rental and property management,VAT generated by construction and local land taxes.
Interest in Tunisian real estate is still high. Prices on the formal market have beenincreasing at a rate of eight percent per annum since 1990, and have continued torise following the revolution. The rental market has experienced additional pricepressure due to an increase in Libyans who arrived in Tunis to avoid the unrest inLibya. According to the Ministry’s Housing Observatory, in 2010 the average priceof a housing unit was US$36 180 at a size of 134m2, or US$270 per m2.Meanwhile, the Global Property Guide reports that the average sale price for ahouse in Tunis can reach as high as US$2 100 – US$4 100 per m2.
The number of registered real estate developers continues to increase in Tunisiaafter the regulatory framework for the profession was put in place in 1990. Thereare more than 2 700 registered developers today. However, this number is notindicative of an increase in the production of housing, as many investors registeras developers to benefit from tax incentives for property construction.
Policy and regulation
In force for more than 40 years, government financial assistance mechanisms forthe housing sector, mainly consist in financial subsidies (subsidised interest rates andtax exoneration on home saving accounts) and, to a lesser extent, land subsidiesthrough the Housing Land Agency (Agence Foncière d’Habitation) one of whosemain objectives is to reduce land speculation. This regime was enhanced in 2007through the issuing of direct subsidies by the National Solidarity Fund (FondsNational de Solidarité) targeted to benefit households wishing to purchase socialhousing. Complementary mechanisms were established in the 1980s in the formof slum upgrading schemes managed by the Urban Rehabilitation and Renovation
Agency (ARRU) and the National Programme for the Resorbing of RudimentaryLodging (PNRLR).
In 2014, the Ministry of Public Works, Housing and Settlements was focused on acomprehensive review of its housing policy, particularly in terms of exploringpublic-private partnerships, as well as reform of the subsidy programmes intendedto widen the scope and rationalise government housing aid including theexpansion of the mandate of FOPROLOS. Preliminary recommendations for anew National Housing Strategy were presented by the government in September2014 and included revitalising the role of the Housing Land Agency in landprovision and recalibration of the FOPROLOS financing scheme, among otheractivities.
Opportunities
Despite a slowdown in the pace of new constructions (as evidenced by a 6.5 percentdecrease in the demand for cement in Q1 2015 according to the Ministry ofIndustry), as the outlook of capital markets and the banking sector remainsuncertain, Tunisians continue to put their money in real estate as housing in Tunisiais still considered a secure and profitable form of investment. The constructionboom can be seen in both the informal and formal sector, particularly apparent inthe high costs for land, and construction materials. However, continued price risesare not sustainable, and risk further exclusion of low to middle-income Tunisiansfrom home ownership.
Contribution of the housing sector to GDP was estimated at US$2.8 billion in2014, representing 6.6 percent of GDP. More open legislation that allows propertypurchase by foreigners, and the removal of any need for purchase permission intourist areas, is also likely to spur investment interest in the property market,particularly as confidence in the Tunisian economy returns.
Other opportunities include the rise in demand and interest in Islamic housingfinance that will create diversified options for housing finance.
Demographic effects will continue to drive the market’s expansion even thoughhigher age at first marriage and the increasingly late arrival of youth in the labourmarket will hinder this quantitative evolution. With regard to solvency of thedemand, the impact of the economic changes underwent by the country since2011 will tend to “variabilise”income levels. Demand for housing credits will growin complexity and will less and less rely on traditional products, which will impactthe evolution of the nature of demand.
> $50 000
$25 000 – $50 000
$14 000 – $25 000
$8 000 – $14 000
$5 000 – $8 000
$3 600 – $5 000
$2 400 – $3 600
$1 600 – $2 400
$800 – $1 600
<$800
- - - Average income needed for the cheapest newly built house by a formal developer, 2015
- - - Average annual urban household income, 2014
TUNISIA
$15 704
$8 342
Rural | UrbanAnnual household income US$
No. of households (thousands) 300 200 100 0 100 200 300 400 500 600

202
1 Pursuant to the Supplementary Budget Law for 2015 adopted by the Assembly of the People’s Representatives (APR) on 5 August 2015.2 Central Bank of Tunisia (2015), Annual Report 2014.3 Central Bank of Tunisia data4 Islamic finance.5 Law No. 2007-12 issued on 3 January 2007 amending the law establishing FOPROLOS. 6 Central Bank of Tunisia data.7 The Supplementary Budget Law for 2015 was adopted by the Assembly of the People’s Representatives (ARP) on 5 August 2015. 8 OECD data9 National Institute of Statistics – Tunisia.10 MEATDD data
Sources
Achy, Lahcen. (2011). Tunisia’s Economic Challenges. Carnegie Middle EastCentre.African Development Bank. (2012). Tunisia: Interim Country Strategy Paper.Tunis.African Economic Outlook (2014). Tunisia Country Profile.Banque Centrale de Tunisie. (2015). Rapport Annuel 2014.EuroMonitor (2014). World Consumer Income and Expenditure Patterns: 14th
Edition.Hassler, O (2011).Housing and Real Estate Finance in Middle East and NorthAfrica Countries.Kahloun H (2014). Habitat informel.Sayah Z (2014). Promotion de l’accès au financement du logement.Taleb R (2014). Auto construction formelle des logements.UN-HABITAT (2011). Affordable Land and Housing in Africa. UN-HABITAT (2011). Tunisia: Housing Profile.World Bank. (2014). Doing Business: Tunisia.
Websites
www.africaneconomicoutlook.com www.bct.gov.tn www.bh.com.tn www.cgap.org www.endarabe.org.tn www.ins.nat.tn www.mehat.gov.tn www.mfw4a.org www.mixmarket.org

Africa Housing Finance Yearbook 2015
203
Uganda
Commercial banking accounts for the largest share of the financial sector, with25 licensed banks. Total assets of the commercial banks have increased byUS$1.8 million since 2011. The increase in bank assets was mainly driven by moreinvestment in government securities, which grew by 29.6 percent in 2014 toUSh4 trillion (US$1.3 million) at the end of June 2015.
During the last four years, however, overall asset quality has been on decline, dueto a persistent increase in NPLs. The ratio of NPLs to total loans increased from1.6 percent by June 2012; to 3.9 percent by June 2013 and 5.8 percent by June2014. This increase was attributed to (i) higher interest rates on new loans, (ii) re-pricing of existing loans at higher interest rates, and (iii) a slowdown in economicgrowth2.
Between 2013 and 2014, there was a gradual shift in bank lending by sector,with a higher preference to extend loans to households. Loans to householdsand personal loans grew by 44.3 percent at the end of December 2014, and39.8 percent at the end of December 2013, though they performed poorly theprevious year (December 2012), receding in growth by 13.7 percent.
The building, construction and real estate sector comprises the largest share ofbanks’ total lending. Bank credit to this sector as a share of total loans hasdominated during the last seven years, growing exponentially, from 5.1 percent inJune 2008 to 23.2 percent in June 2014. Between 2010 and 2014, loans to thissector comprised commercial mortgages, land purchases, road construction, loans
Overview
Uganda has a long and solid track record of prudent macro-economic policies,and positive development prospects, with significant fiscal investment, supportingeconomic growth. Uganda’s fiscal dynamics have improved, supported by higherrevenue collection capacity. The country is now less dependent on donor aid –the ratio of budget support to total donor aid has reduced from 49 percent in2005/6 to 29 percent in 2015/16.
Presently, GDP is USh75 trillion (US$25 billion), compared to USh40 trillion(US$16 billion), in 2010. Provisional results from the census (2014) indicate thatUganda has a population of 34.9 million people – this is three percent points lowerthan the figure of 37 million that had been previously calculated. The country’saverage per capita income has increased to US$706 from US$504 in 2014,bringing the country closer to a middle income status, an objective the governmentintends to achieve by 2020, as espoused by the 2nd National Development Plan(2015/16 – 2019/20).
The structure of the economy still comprises a sizeable informal sector, accountingfor 49 percent of economic output. The agricultural and industrial sectors – themain productive base of the economy – require substantial investment to spurcontinued growth and competitiveness. The competitiveness of the private sectorremains constrained by infrastructural gaps – unreliable electricity and inadequaterail and roads network.
The economy is projected to grow at 5.8 percent, in 2015/16, largely on accountof the recovery of private sector consumption, supported by stronger creditgrowth, as well as huge public investment in infrastructure. The medium outlookis promising, with real GDP expected to grow at a rate of 6.5 percent in the nextfive years, boosted by the development of the oil sector, value addition in themineral sector, and enhancing institutional efficiency in mainstreaming, coordinatingand following up implementation of EAC programs and projects. Uganda rankssecond in trading with partner states in the EAC Regional Bloc; with a marketshare of 25 percent.
Access to finance
Uganda’s financial sector is stable, relatively well-capitalised (37 percent of GDP)and has grown at an average rate of 17 percent per annum since 20061.
KEY FIGURES
Main Urban Centres Kamapala (Uganda)
Exchange Rate: 1 US$***
Inflation 2013 | 2014 (est.) | 2015 (prov.) | 2016 (prov.) *
3289.26 Ugandan Shilling(UGX)5.0 | 5.4 | 5.9 | 5.4
Population^ | Population growth rate (2013)^Urban population (% of total)^ | Urbanisation rate (% in 2013)^
38 844 624 | 3.3115.77 | 5.42
GDP / capita (current US$)^ | GDP growth rate (annual %)^GNI / capita, Atlas method (current US$) ^Population below national poverty line*Unemployment rate (%)*Gini co-efficient (year of survey)^^HDI (Global Ranking)" | HDI (Country Index Score)”
677.38 | 4.5166024.54.244.55 (2012)164 | 0.484
Lending Interest Rate^Mortgage Interest Rate (%) | Mortgage Term (years)#Credit % of GDP^Average Mortgages % of GDP° Price To Rent Ratio City Centre** | Outside City Centre**Gross Rental Yield City Centre** | Outside of City Centre**Outstanding home loan (% age 15+)##
21.5322.00 | 714.390.9% (2012)56.15 | 15.91.78% | 6.29%9.78
What is the cost of standard 50kg bag of cement (in US$)? #What is the price of the cheapest, newly built house by a formaldeveloper or contractor (in US$)? #What is the size of this house (in m2)? #What is the average rental price for a formal unit (in US$/month)#What is the minimum plot size for residential property (in m²)#
11.00
13 600 80250464
Ease of doing business rank !Number of procedures to register property !Time (days) to register property !Cost (% of property value) to register property !
15011432.60
*** Conmill.com The Currency Converter^ World Bank's World Development Indicators (2014)~ World Bank PovcalNet: an online poverty analysis tool, various years^^ The World Bank's PovCalnet" UNDP's International Human Development Indicators (2014)° Various: Badev et al. "Housing Finance Across Countries: New Data and Analysis" – Unpublished
paper/Hofinet/World Bank## Global Financial Inclusion Database (FINDEX)# CAHF Annual Survey Data (September 2015)! World Bank's Doing Business Survey Data (2015)** Numbeo Online User-Contributed Database
204
to general and specialized construction contractors and property developers andestate agents. A closer look at the activities to which credit was extended revealedthat over 50 percent of the credit was extended to both residential andcommercial mortgages. Credit extended to property developers and estateagents, as a share of credit extended to the building construction and real estatesector increased from 23.7 percent in June 2010 to 25 percent in June 2014.
Five banks dominate in mortgage finance. Housing Finance Bank is the marketleader, and for the last decade, it has held between 50 and 53 percent of totalmortgage finance book. By March 2015, the total mortgage portfolio wasestimated at USh1.7 trillion, and with the potential to grow in excess of 6 trillion(US$2 million) at the end of the year. This would represent a 15.4 percent increasecompared to 2014, which registered a total mortgage portfolio of USh5.2 trillion(US$1.7 million).
In the last two years, stiff competition among commercial banks has led to thedevelopment of more innovative housing finance products. Notably, are the mini-mortgages offered by Housing Finance Bank and Stanbic Bank. Mini-mortgages arecollateralized but differ from conventional mortgages in that their tenor is shorter(between 5 and 7 years), at interest rates of about 22 percent, and involveunderwriting of informal income.
Credit Guarantee Schemes have also been introduced to relax the terms againstwhich prospective homeowners’ access mortgages. The Credit Guarantee Schemethat was launched by the USAID/Uganda Private Health Support programme atCentenary Bank, three years ago, not only guarantees against the non-performanceof the loans (at a ratio of 60:40), but it has also been used to help customers scaleup the value of their collateral, such that they can access loans for which anadditional fee for utilising the guarantee is charged.
However, the absence of long-term funding schemes within the domestic bankingsystem continues to constrain the growth of the housing finance sector. NSSF isthe only suitable long term funder in the Ugandan market which invests its long-term assets in short-term equity or real estate.
Current efforts to reform the pension sector are expected to end NSSF’smonopoly. The passing of the Retirement Benefits Sector Liberalization Bill, willintroduce competition and improved governance within the pension sector. Also,recent efforts that have been embarked upon to create Real Estate InvestmentTrusts (REITS) will encourage and minimize the risk several private sectoroccupational schemes could face, when directly investing in real estate.
Centenary Bank, Opportunity Bank, Finance Trust Bank and Pride Microfinancehave all developed/are developing housing microfinance products, as a way ofretaining their clientele, and also broadening their product lines.
Centenary Bank offers three unique housing finance and housing microfinanceproducts; (i) Cente-Mortgage3: a medium-to-long term housing finance producttargeting salary earners as well as rural and urban low, middle and high regularincome earners engaged in self-employment; (ii) Cente-Home: a short to mediumterm loan for homeowners with regular income earnings for the purpose offinancing home improvement; and (iii) Cente-Land: a short-to-medium term loandesigned for the purpose of financing land purchase, survey and registration toformalize ownership.
Finance Trust Bank offers the personal development loan4 an affordable loan facilityto ease cash flow for personal development needs, including home improvement.Pride Microfinance offers the mortgage and asset finance loan.
Equity Bank offers the Development Loan5; a fund-based credit facility where acustomer has advanced money to set up a long-term development project,including building a house. Opportunity Bank is being supported by Habitat forHumanity Uganda (HFHU), under the Mastercard Project, to develop and later rollout a commercially viable housing microfinance product.
Through the Mastercard Project, HFHU supported Ugafode Microfinance, an MDI,design, test and roll out housing microfinance products that are affordable andflexible. Today, Ugafode has a range of products targeting low and moderateincome earners. Three products are explicitly for housing: asset acquisition loans,
micro-mortgage loans and flexible housing loans. With 12 949 active borrowersin 2015, Ugafode has a gross loan portfolio of US$8.42 million. Ugafode’s depositbase is strong, with 58 754 depositors saving almost US$4.24 million.
Since 2008, HFHU has been piloting a low income housing finance programme inits two microfinance institutions (Luweero and Lugazi). Through the programme,households, access loans for home improvement, and also build sanitation facilities.The average monthly income of households targeted is USh500 000 (US$217).The average loan size is USh2 million, for a tenor of two years. The loans areissued at a monthly interest of two percent.
Affordability
Although the demand for housing is high, effective demand is actually very lowbecause only a portion of employees’ income is documented. It is common forindividuals to complement their salaried income with other sources of revenues,from micro and small sized investments. Statistics from the Ministry of Finance,Planning and Economic Development, on documented income show that moreUgandans have crossed the poverty line, and, indeed, they are in a better position,than before to afford housing. Income poverty declined from 24.5 percent in2009/10 to 19.7 percent in 2012/13. Income inequality has also reduced by7.3 percent over the same period. The middle income class (Middle class is definedas a group of people who earn between US$4 a day and a maximum ofUS$20 a day) has grown seven-folds during the last two decades, increasingfrom 1.8 million individuals in 1992/93 to 12.6 million in 2012/13. Notably,between 2009/10 and 2012/13, 2.6 million Ugandans acquired middle class status.
The country’s average per capita income is estimated at US$706, compared toUS$504 in 2014. This income is however, still low to meet mortgage terms forbuying a house on the formal market. A case in point is private health workers –the majority (about 90 percent) earn too low to finance their housing needs –approximately USh700 000 (US$230). In addition to the low monthly salary, agreater portion (over 60 percent) of the salary is spent on food, rent, transportand school fees. The income and savings of the private health workers fallsbelow a level where they would secure mortgage financing in the formal market(USh1 million and above).
Mortgage lenders generally require a high down payment (between 20 and30 percent), to reduce credit risk and keep monthly payments affordable.However, since 2013, the high risk of lending to the real estate sector led to highLTV ratios. A survey by Bank of Uganda (May to June 2014), among selectedbanks, to assess LTV practices, established that the LTV ratio for mortgages hadrisen from 58 percent in March 2013 to 64 percent in March 2014. Other termsat which commercial banks offer mortgages include an interest rate of between19 and 25 percent; and loan repayments should not exceed 40 percent of anindividual’s salaried income. The tenor ranges between 5 and 20 years.
To date, there are no affordable housing projects that have been embarked uponon scale. Houses for sale start at USh105 million (US$30 000) for a basic two-bedroom house, and go as high as USh1.575 billion (US$450 000) for a four-bedroom house. The cheapest house built by a private developer in 2015 isUS$13 500 for a one bedroom 80m2 house. At current rates, this would cost anestimated US$308 a month (at 22 percent over a seven-year term). This translatesinto a monthly salary of US$771 (USh2.7 million), which is earned by less than twopercent of the population.
A key factor contributing towards the cost of housing is the infrastructurecomponent. Increasingly, given capacity constraints within local authorities,developers are developing local and bulk infrastructure as part of actualdevelopment, and covering this investment in the price of the housing rather thanspreading it over the long life of the services delivered, as a municipality might beable to do. This contributes as much as 15 percent – 25 percent to the purchaseprice. Another factor is the cost of building materials. For example, in 2015, TororoCement Limited invested US$25 – 30 million towards the expansion of its cementplant, increasing its capacity from 1.8Mt/yr in 2013 to 3Mt/yr to date. However,because of the weak shilling, which led to increase in cost of inputs in cementproduction, most of which are imported, the price of 50kg bag of cementincreased by 11.1 percent, between 2013 and 2015, from USh27 000 toUSh30 000 (US$10).

Africa Housing Finance Yearbook 2015
205
Housing supply
With a housing deficit of 1.6 million units, coupled with an annual populationgrowth rate estimated at 3.3 percent, and a 5.6 percent urbanisation rate, Ugandaneeds to move fast to match her population growth with decent and affordableshelter. Out of the total deficit, 1.29 million is in rural areas and 211 000 in urbancenters.
Presently, the supply of middle and high level residential properties outstripsdemand. To illustrate, during the last five years, the six modestly sized propertydevelopers6 have led efforts in the supply of residential properties, targeting themiddle and high income earners. Collectively, however, these developers have notbeen able to supply more than 5 000 units annually. Annually, each developer hadplanned to develop between 1 000 and 2 000 units, however, because of the highdebt exposure and the generally low demand for properties, particularly in 2011and 2012 (See Section on Property Markets for more details), the units deliveredannually, per developer, were estimated at between 500 and 1 000.
According to NHCCL’s Corporate Strategic Plan (2012 – 2016), the company’starget was to construct and sell houses equivalent to 70 percent of the housingbacklog within the income bracket of USh1.8 to 9 million (US$692 to 3 461) and50 percent of the backlog in the income bracket of USh9 to 29 million (US$ 3 461to 11 153). This brings the total number of houses that were to be constructedand sold in five years to 8 728 housing units. However by mid-2015, about 5 000units had been sold off. At this rate, it is plausible to argue that the company willnot be able to meet its target of 8 728 units by the end of 2016.
Also, there are several small sized firms (90 percent of which are solely owned)who incrementally develop small estates, comprising flats of about 20 apartments.The apartments are priced at over US$60 000, and they can comfortably beafforded by middle and high income earners. Collectively, the contribution of thesmall sized developers to the housing industry has been significant – the onlychallenge is that there are no formal mechanisms to track their input to theindustry.
INSSF is designing a project, in which it will enter into agreements with localdevelopers, to deliver an agreed number of units with specific standards. NSSF willpurchase the units and avail the same to prospective homeowners, using HousingFinance Bank, as the mortgage provider. This will help the developers dispose ofall the units early enough and also capitalise them to develop and deliver more.Preliminarily, this initiative is estimated to deliver houses in the range of US$60 000,a value that can only be afforded by less than one percent of the population.
Property markets
Uganda’s property markets are gradually developing, supported by the growth ofthe middle income class and, most recently (2012), the expected boom fromexploration of oil and gas. In the last six years (2009 to 2014), prices of residential
property increased by 115.3 percent, mainly as a result of the high demand for theproperties by the middle income class. However, between 2011 and 2012, therewas a slump in demand for residential properties, and consequently a drop inprices. In that period, interest rates for residential mortgages hit record levels(from an average of 20 percent in 2010, to an average of 27 percent in 2012) asBank of Uganda tightened its monetary policy stance to control inflation that hadrisen to 30 percent by October 2011.
Since a huge percentage (over 90 percent) of residential houses is purchasedthrough mortgages, the high bank lending rates, coincidently, led to a significantreduction in the demand for residential houses. Also, the introduction of morestringent lending requirements, coupled with the high interest rates, led to amarked reduction in demand for residential properties, particularly within themiddle income bracket. In addition, in 2012, homeowners who had failed to meettheir mortgage repayments, opted to sell their houses; marginally contributing tothe supply of housing on the market. The homeowners accessed loans at variableinterest rates which could either increase or decrease, depending on the inflationrate. Hence, the high inflationary pressures that were witnessed in late 2011 and2012; commensurately increased interest rates on their monthly repayments, tolevels that they could not comfortably afford. This situation could have beenavoided, had the homeowners been knowledgeable enough about the mortgageterms and also the opportunities they could seize, using their positive credit history.
The above notwithstanding, property markets are fast developing in adjacenttowns to Kampala City, largely because of the construction of large infrastructureprojects, to catalyse industrial development and economic growth. Notably, wasthe construction of several roads in Mukono (15 km from Kampala City), Wakiso(20 km from Kampala City) and Mpigi (30 km from Kampala City). The improvedroad network in these towns has spurred development of several housing projects,targeting modest, middle and high income earners.
The construction of the roads in the towns has also helped ease congestion in theCapital City – Kampala, where a lack of sufficient land has, in the past, forceddevelopers to build high rise structures without any greenery. In these towns(Mukono, Wakiso and Mpigi), better planned and organised housing estates arebeing developed. Joint ventures in developing housing projects are also common,where land owners partner with reputable developers like NHCCL, to buildmodestly sized housing estates of about 2 000 units.
Policy and regulation
The Draft Housing Policy (April 2012), delineates several measures on how toaddress the housing challenge in the country. The Policy notes that housing financeinstitutions need to work on their institutional framework to reduce operationalcosts, as one of the ways to bring down interest rates. The policy also calls onfinancial institutions to expand the range of securities for accessing mortgages toinclude insurance policies, pension and provident funds and employer guarantees.
> $50 000
$25 000 – $50 000
$14 000 – $25 000
$8 000 – $14 000
$5 000 – $8 000
$3 600 – $5 000
$2 400 – $3 600
$1 600 – $2 400
$800 – $1 600
<$800
- - - Average income needed for the cheapest newly built house by a formal developer, 2015
- - - Average annual urban household income, 2014
UGANDA
$11 149
$3 417
Rural | UrbanAnnual household income US$
No. of households (thousands) 3000 2500 2000 1500 1000 500 0 500

206
The Draft Housing Policy has however awaited cabinet approval for relatively longtime (since mid-2014).
The recently enacted National Land Policy (2013) advances several proposals onhow to improve land management, including addressing urban sprawl anddispute/conflict resolution over land. With respect to the land tenure regimes, theland policy notes that although Uganda shall maintain the multiple tenure systems,as enshrined in the constitution, the amended Land Act will be revised to allow alltenure regimes to evolve and develop appropriate incidents, in response tochanges in social structures, technology of land use and market demands.
Currently the MLHUD have so far registered about 112 condominium plans,guided by the Condominium Law (2001). The Condominium Law has helped,although in a small way, in increasing the number of housing units in the country.A major challenge, however, is that the Law is not well understood by professionalswho are supposed to implement it.
MLHUD is currently conducting a restructuring exercise aimed at streamliningoperations at the Ministry Zonal Offices, and the National Land InformationCenter. The restructuring exercise is aimed at ensuring that the correct personnelwith the required skills, qualifications and the appropriate number depending onthe volume of work at the Ministry Zonal Office will be recruited. The exercisewill also put in place an appropriate structure for smooth operation andmaintenance of the National Land Information System.
Opportunities
Uganda’s housing industry is gradually improving, with few, but increasing numberof innovative products; however, significant investments are needed to address thecurrent backlog, estimated at 1.6 million units, in 20137. Several factors still holdback the potential of the industry; including the high urbanisation rate (about fivepercent annually); and the low levels of income, which make it difficult, if notimpossible, for the vast majority to afford residential properties on the market.
The housing finance sector, though improving, still lacks the capacity and capital to:(a) expand the supply of affordable housing; and (b) provide appropriate housingfinance products. In particular, there is a growing demand for mortgage lendingto middle and high income groups, requiring loans of maturities of up to 20 years.The Bank of Uganda has picked interest in setting up a Mortgage Liquidity Facility(MLF). The MLF will be charged with developing the primary mortgage marketby providing funds to mortgage lenders at better rates and longer tenors, thusfacilitating affordability of housing finance, particularly among the lower middle andlow income earners. The last five years have seen a growing need for new andinnovative housing microfinance products, to serve the diverse housing needs ofhouseholds at the bottom end of the pyramid. Higher densities should bepromoted to optimize land use and reduce infrastructure costs.
Sources
Bank of Uganda (2014): Financial Stability Report.Bank of Uganda (2013): Financial Stability Report.Bank of Uganda (2012): Financial Stability Report.Bank of Uganda (2011): Financial Stability Report.Centenary Bank Annual Report (2014).Pride Microfinance Annual Report (2014).Ministry of Finance Planning and Economic Development (2014): Poverty StatusReport.Ministry of Lands Housing and Urban Development (2014): Habitat III NationalReport.National Housing and Construction Limited Corporate Strategic Plan (2012 –2016).Uganda Bureau of Statistics (2011): Consumer Price Index.World Bank (2015): Financial Sector Policy Credit: Implementation Completion& Results Report (IDA – 489890).World Bank (2015): The Growth Challenge: Can Ugandan Cities Get to Work?
Websites
http://www.businessdailyafrica.com/Banks-start-open-loan-pricing-July/-/539546/2322744/-/a8l3jhz/-/index.html http://www.theeastafrican.co.ke/news/Uganda-s-real-estate-sector-set-to-thrive-in-2015/-/2558/2570616/-/1ux7w9z/-/index.html www.financetrust.co.ug Ug.equitybankgroup.com
1 World Bank (2015): Financial Sector Policy Credit: Implementation Completion & Results Report (IDA – 489890)2 Between 2010 and 2015, real GDP growth averaged 5.5 percent per annum, compared to an average of 7 percent in the 1990s and 2000s3 To access this loan, an individual should have an account with the Bank, with at least 15 percent of the loan amount sought. The debt ratio ranges between 40 and 60 percent. The loan tenure is 3 years at
an interest rate of 25 percent.4 www.financetrust.co.ug 5 Ug.equitybankgroup.com 6 NHCCL, Akright Projects, Pearl Estates, Kensington Group, Nationwide Properties and Tirupati Uganda7 Uganda Habitat III National Report (2014)

Africa Housing Finance Yearbook 2015
207
Zambia
ZMW1 493 million (US$287 million) in July 2014 up from ZMW298.7 million(US$57 million) in 2013 and ZMW1 208 billion (US$241.6 million) in 2012. InMarch 2014, ZNBS held ZMW111.9 million (US$14.6 million) in mortgages.In 2014, government recapitalised the ZNBS with ZMW167 million (US$21.8million) in the hope of increasing access to mortgages by 159 percent. The numberof people accessing ZNBS mortgages has increased above 2 000 in 2015 from1 238 people in 2013 with long term demand recorded in Lusaka, Copperbeltand North Western regions.
Mortgage finance is expensive while interest rates are high and range between 14to 17 percent. Mortgage lenders still face difficulties in accessing wholesale finance,short maturities on available funds, inadequate matched funding for long termcredit, potential loss due to high default rates, high transaction costs and depositrequirements of 10 to 20 percent and relatively short loan repayment terms fromtwo to 10 years. There is a large cash economy in which 50 percent sales arecash.6
Zambia has a well-regulated banking sector with over 20 licensed commercialbanks, about 15 of which are subsidiaries of foreign banks, four are locally ownedprivate banks, and two are partly owned by the government. Bank lending forhousing mainly targets individuals or institutions in the formal sector. In 2015 thepolicy interest cap7 was 18.5 up from 12.5 percent in 2014 and 9.75 percent in20138. In 2015 commercial bank lending rates including mortgage interest rates
Overview
Zambia, the second largest copper producer in Africa, has had an average GDPgrowth rate of seven percent over the past decade. With an average GNI ofbetween US$1 830 and US$3 070 a year, Zambia was in 2011 reclassified by theWorld Bank as a lower middle income country1. In 2010, the GINI index was57.5, up from 54.6 in 20062 while annual inflation dropped from eight percent inAugust 2014 to 7.1 percent in June 2015. The Zambian Kwacha depreciated fromZMW 6.34 per USD in Dec 2014 to above ZMW12.0 per USD in September,2015.
Zambia has up to 2015 issued three bonds: a US$750 million 10-year Eurobondat a yield rate of 5.6 percent; a 10-year bond of US$1 billion at 8.6 percent; and aUS$1.25 billion bond of at a 10 percent yield rate. The bonds, whose repaymentperiod is between 20 and 25 years, have mainly been used for energy, road andrailway infrastructure and harmonisation of civil servants salaries.
Zambia’s population, estimated at 15 million in 20133, is very young with 46.2percent under 14 years of age and 2.4 percent older than 65 years. In 2014, theurban population, which is growing at 4.2 percent per annum, was estimated at6.1 million or 40.5 per cent of total population and will rise to 12.0 million by2030, and 25.8 million by 2050: a fivefold increase from 38.7 percent in 20104.The HIV/AIDS prevalence is 14.3 percent while the average life expectancy is 51.8years5.
Access to finance
In Zambia 36 percent of the population have an account but only two percenthave mobile accounts. About 25 percent males and 20 percent females haveaccounts while only 25 percent of the youths have accounts. Only 16 percent saveformally with financial institutions while 19 percent do not save at all. Of thosewho save 24 percent save for education and to start or expand a business. At least54 percent borrow formally or informally of which only six percent borrow fromfinancial institutions.
Mortgage financing remains the main source of housing finance with ZambiaNational Building Society (ZNBS), Pan African Building Society (PABS) and FinanceBuilding Society (PBS) being the major lenders. The residential mortgage markethas grown steadily as reflected in a loan portfolio for all Building Societies of
KEY FIGURES
Main Urban CentresLusaka (capital), Ndola,Livingstone
Exchange Rate: 1 US$***Inflation 2013 | 2014 (est.) | 2015 (prov.) | 2016 (prov.) *
7.66 Zambian Kwacha (ZMW)7.0 | 7.9 | 7.6 | 7.6
Population^ | Population growth rate (2013)^Urban population (% of total)^ | Urbanisation rate (% in 2013)^
15 021 002 | 3.2640.47 | 4.37
GDP / capita (current US$)^ | GDP growth rate (annual %)^GNI / capita, Atlas method (current US$) ^Population below national poverty line*Unemployment rate (%)*Gini co-efficient (year of survey)^^HDI (Global Ranking)" | HDI (Country Index Score)”
1 801.89 | 6.001 76060.513.157.50 (2010)141 | 0.561
Lending Interest Rate^Mortgage Interest Rate (%) | Mortgage Term (years)#Credit % of GDP^Average Mortgages % of GDP° Price To Rent Ratio City Centre** | Outside City Centre**Gross Rental Yield City Centre** | Outside of City Centre**Outstanding home loan (% age 15+)##
11.5717.00 | 2016.621.29% (2012)......4.64
What is the cost of standard 50kg bag of cement (in US$)? #What is the price of the cheapest, newly built house by a formaldeveloper or contractor (in US$)? #What is the size of this house (in m2)? #What is the average rental price for a formal unit (in US$/month)#What is the minimum plot size for residential property (in m²)#
7.50
65 000 71350288
Ease of doing business rank !Number of procedures to register property !Time (days) to register property !Cost (% of property value) to register property !
11154513.60
*** Conmill.com The Currency Converter^ World Bank's World Development Indicators (2014)~ World Bank PovcalNet: an online poverty analysis tool, various years^^ The World Bank's PovCalnet" UNDP's International Human Development Indicators (2014)° Various: Badev et al. "Housing Finance Across Countries: New Data and Analysis" – Unpublished
paper/Hofinet/World Bank## Global Financial Inclusion Database (FINDEX)# CAHF Annual Survey Data (September 2015)! World Bank's Doing Business Survey Data (2015)** Numbeo Online User-Contributed Database

208
were 20.5 percent up from 19.25 percent in 2014. For non-banking financialinstitutions the maximum interest rate charged is a factor of 1.6 while formicrofinance institutions (MFIs) it is 2.3 relative to the BOZ rate.
The microfinance sector comprises just over 40 MFIs up from 35 MFIs in 2014 and25 licensed MFIs in 2013. The BoZ requires a MFI to have at least 80 percent ofits total loan portfolio serving MSMEs, less than 20 percent of the total loanportfolio serving individuals in formal employment and an average loan size perborrower not exceeding ZMW2500 (US$326). Using this definition most MFIscan be classified as non-bank financial institutions. Most MFIs are payroll basedconsumer lenders, accounting for 92 percent of total MFIs assets; four aremicroenterprise lenders while six are deposit-taking financial institutions in termsof the 2006 Banking and Financial Services Act.
In 2013, 10 MFIs had reported to the MixMarket9 together indicating a gross loanportfolio of US$21.2 million, with 64 247 active borrowers and loan size rangingbetween ZMW1 000 – 5 000 at between 51 – 53 percent interest rate andrepayment term of less than 12 months. The MFIs also held a total of US$4.5 millionin deposits from 10 934 depositors. The BoZ minimum policy interest rate capsof 42 percent for MFIs forced some to streamline their operations, close marginalbranches with high operating costs or decrease loan sizes and group lending, in aneffort to make lending more cost effective. Due to high default rates, the firstcredit bureau was formed by the Bankers Association of Zambia in 2006. TheBoZ made it mandatory for banks and other financial service providers to gothrough the Credit Reference Bureau (CRB) before granting a loan. In 2012,TransUnion purchased CRB and remains the sole credit bureau in Zambia.
Some MFIs offer housing loan products in the range of ZMW5 000 to ZMW350 000(about US$950 to US$65 000)10 with maximum loan terms of 60 months at aninterest ranging between 51 and 53 percent annually. Lafarge, a building materialscompany, provides assistance of up to ZMW2 500 to its beneficiaries inpartnership with BancABC and ZNBS. In 2014 Lafarge donated 1 008 bags ofcement and free technical (home) designs to Habitat for Humanity Zambia tobuild 2 150 houses.
Pension-backed lending is permissible by Zambian law, though the huge reserveof pension funds, in excess of ZMW 4 380 billion (US$600 million), have not beenfully exploited to invest in housing. Private developers such as Lilayi Estates havearrangements to draw on pension funds to enable pensioners to purchase housingbut the packages are too expensive and limited. In Zambia public service workersare able to obtain salary-tied loans for home improvements. Other potentialsources of housing finance include the Lusaka Stock Exchange (LUSE), which listsmore than 24 companies, and Bonds and Derivatives Exchange (BaDEx). ANational Housing Bond Trust (NHBT) was established by government in 2008 tobonds through the capital markets but the initiative did not succeed. The LusakaCity Council has plans to issue a US$500 000 bond on the LUSE but institutionalconstraints have delayed the initiative.
Informal finance, administered mainly by Rotating Savings and Credit Associations(ROSCAs or ‘chilimba’), is commonly used for small loans and home constructionor purchase. The Peoples’ Process on Housing and Poverty in Zambia (PPHZ)’sSwalisano Urban Poor Fund allow members to access low-interest loans. Peoplein statutory and improvement areas could borrow using land records andOccupancy Licenses but Councils have been slow to allow their head-leases to beused as collateral.
Affordability
In Zambia, households spend a considerable proportion of their income on housingparticularly on rentals which range from US$300 to US$700 for two – threebedroom units. Seven percent of the population (about 1 051 470 people)11 withaverage monthly household expenditure above ZMW3 830 (US$500) spend asmuch as 50 percent of their income on rentals. About 30 percent (or 4 506 300people) with an average monthly expenditure between ZMW2 298 toZMW3 830 (US$300 to US$500) spend 30 percent on rentals while 63 percent(or 9 463 231 million people) with a monthly expenditure of less than ZMW2 298(US$300) spend up to 40 percent of their monthly income on rentals. Lowincome households in urban areas can afford a house costing between K61 300and ZMW100 000 (US$8 002 – US$13 054) while small scale farmers in rural
areas can afford a house costing K24 900 (US$3 250)12. While the sweetspotfor young professionals range between US$60 000 and US$100 00013.
The construction cost for an entire house range from ZMW8 000 (US$1 044) forone room, ZMW12 000 (US$1 567) for two rooms,14 and ZMW153 200(US$20 000) for houses constructed with basic materials to ZMW500 000(US$65 274) for a quality constructed house. A 84 m2 house built by SilverestGardens costs as much as US$79 800, a 90 m2 two bedroomed house costUS$60 000 while a 110 – 120 m2 three bedroomed house costs overUS$100 00015. National Pension and Savings Authority (NAPSA) NorthgateGardens and Kalulushi houses cost ZMW400 000 (US$52 219) for a lowcost house, ZMW700 000 (US$91 383) for a medium cost house and overZMW1 million (US$130 548) for a high cost house16.
Building material costs are relatively high with a standard 50kg bag of Dangote32.5R and 42R cement costing between ZMW 53 and 55 (about US$6.9 – 7.1).A standard sheet of corrugated iron17 for roofing costs ZMW47.00 per metre foran IT4 Norm Colour – and ZMW 35 per metre for an IT4 norm 0.40 GI/ Silverwhile the ZABS certified Corrugated Galvanised Roofing Sheets cost ZMW15.0/mfor a 32G (0.20MM), ZMW17.5/m for a 30G (0.25mm) and ZMW19.0/m for a28G (0.27mm) sheet18.
Housing supply
Zambia faces a current housing backlog of 1.5 million which is expected to reachover 3 million by 2030. UN-Habitat has forecast a deficit of 1.3 million urban unitsby 2030 if no efforts are made to deliver at least 46 000 units per annum until2030. The mining regions of the Copperbelt and North Western Provinces,Lusaka and the 33 newly created districts face the most critical shortage. Morethan 50 percent of the housing stock in Zambian towns is informal while almost90 percent of stock in rural areas is traditional housing. At least 20 percent of allstock in urban areas is traditional housing. Nearly 70 percent of Lusaka’s housingstock is informal and accommodates about 90 percent of the city’s population on20 percent of residential land.
In Zambia traditional housing suppliers have mainly been the mining houses, localauthorities and government through the NHA. By law, housing was supplied aspart of an employment contract but following the liberalisation reforms of the1990s, this link was broken and each household became responsible for its ownhousing19. Most current housing supply is a predominantly self-build and takes upto seven years to complete20.
NHA reports building 13 938 dwellings (including upgraded dwellings) betweenits inception in 1971 and 2002 but has produced less than 100 units per annumsince 1994. The NHA has entered into a 10-year partnership with MBCConstruction21 to build 500 000 houses. The National Pension Scheme Authority(NAPSA), Zambia State Insurance Corporation (ZSIC) and other semigovernment agencies have contributed to the rental stock. Due to the high costof completed units (e.g. NAPSA’s Northgate Gardens and Kalulushi Estates onthe Copperbelt), attributed to high input costs and provision of services toindividual plots, which NHA peg at ZMW60 000 (US$7 832.82), many unitsremain unoccupied. NAPSA has plans to put on rent out its expensive Kalulushiand North Gate units22.
Private developers like Meanwood, Lilayi Estates, Silverest Gardens, Nkwashi, Roma,Vorna Valley and Salama Park have come on board but their contribution isminimal (less than 5 000 completed units per annum) and focused more on thehigh end of the housing market. Some developers obtain land from governmentand resell it at high cost as serviced plots to individuals. New developers likeSmart Homes Africa23, plan to supply two to four-bedroom units and studenthousing in the US$40 000 to US$80 000 range. In 2013 government issuedStatutory Instruments (SI 33) and SI 68, which were later rescinded, prohibited theuse of foreign currency in domestic transactions and indexation24 in contracts,measures which undermined developers’ efforts to support housing affordability.Housing supply is also constrained by environmental approvals for new housingdevelopments which take around six – nine months, an inefficient land governancesystem, the high cost of infrastructure development and an unresponsive mortgagesystem which is required to grow and expand in tandem with increasing privateand public sector participation in housing supply.
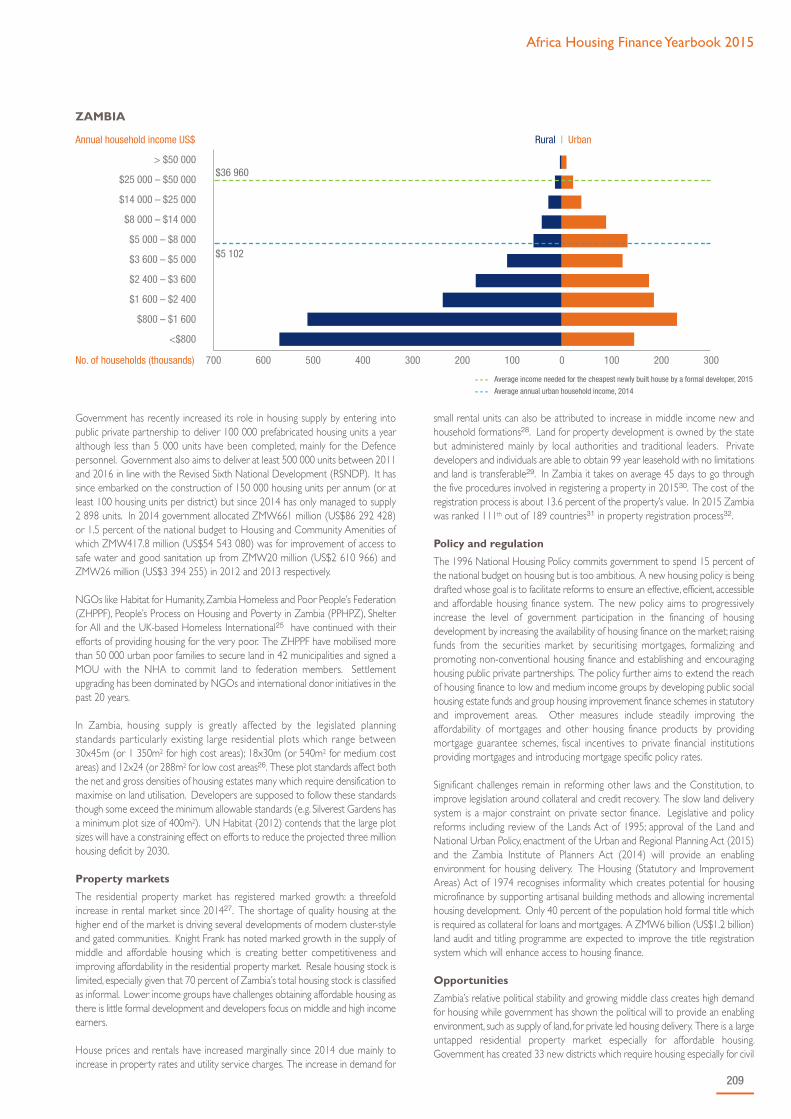
Africa Housing Finance Yearbook 2015
209
Government has recently increased its role in housing supply by entering intopublic private partnership to deliver 100 000 prefabricated housing units a yearalthough less than 5 000 units have been completed, mainly for the Defencepersonnel. Government also aims to deliver at least 500 000 units between 2011and 2016 in line with the Revised Sixth National Development (RSNDP). It hassince embarked on the construction of 150 000 housing units per annum (or atleast 100 housing units per district) but since 2014 has only managed to supply2 898 units. In 2014 government allocated ZMW661 million (US$86 292 428)or 1.5 percent of the national budget to Housing and Community Amenities ofwhich ZMW417.8 million (US$54 543 080) was for improvement of access tosafe water and good sanitation up from ZMW20 million (US$2 610 966) andZMW26 million (US$3 394 255) in 2012 and 2013 respectively.
NGOs like Habitat for Humanity, Zambia Homeless and Poor People’s Federation(ZHPPF), People’s Process on Housing and Poverty in Zambia (PPHPZ), Shelterfor All and the UK-based Homeless International25 have continued with theirefforts of providing housing for the very poor. The ZHPPF have mobilised morethan 50 000 urban poor families to secure land in 42 municipalities and signed aMOU with the NHA to commit land to federation members. Settlementupgrading has been dominated by NGOs and international donor initiatives in thepast 20 years.
In Zambia, housing supply is greatly affected by the legislated planningstandards par ticularly existing large residential plots which range between30x45m (or 1 350m2 for high cost areas); 18x30m (or 540m2 for medium costareas) and 12x24 (or 288m2 for low cost areas26. These plot standards affect boththe net and gross densities of housing estates many which require densification tomaximise on land utilisation. Developers are supposed to follow these standardsthough some exceed the minimum allowable standards (e.g. Silverest Gardens hasa minimum plot size of 400m2). UN Habitat (2012) contends that the large plotsizes will have a constraining effect on efforts to reduce the projected three millionhousing deficit by 2030.
Property markets
The residential property market has registered marked growth: a threefoldincrease in rental market since 201427. The shortage of quality housing at thehigher end of the market is driving several developments of modern cluster-styleand gated communities. Knight Frank has noted marked growth in the supply ofmiddle and affordable housing which is creating better competitiveness andimproving affordability in the residential property market. Resale housing stock islimited, especially given that 70 percent of Zambia’s total housing stock is classifiedas informal. Lower income groups have challenges obtaining affordable housing asthere is little formal development and developers focus on middle and high incomeearners.
House prices and rentals have increased marginally since 2014 due mainly toincrease in property rates and utility service charges. The increase in demand for
small rental units can also be attributed to increase in middle income new andhousehold formations28. Land for property development is owned by the statebut administered mainly by local authorities and traditional leaders. Privatedevelopers and individuals are able to obtain 99 year leasehold with no limitationsand land is transferable29. In Zambia it takes on average 45 days to go throughthe five procedures involved in registering a property in 201530. The cost of theregistration process is about 13.6 percent of the property’s value. In 2015 Zambiawas ranked 111th out of 189 countries31 in property registration process32.
Policy and regulation
The 1996 National Housing Policy commits government to spend 15 percent ofthe national budget on housing but is too ambitious. A new housing policy is beingdrafted whose goal is to facilitate reforms to ensure an effective, efficient, accessibleand affordable housing finance system. The new policy aims to progressivelyincrease the level of government participation in the financing of housingdevelopment by increasing the availability of housing finance on the market; raisingfunds from the securities market by securitising mortgages, formalizing andpromoting non-conventional housing finance and establishing and encouraginghousing public private partnerships. The policy further aims to extend the reachof housing finance to low and medium income groups by developing public socialhousing estate funds and group housing improvement finance schemes in statutoryand improvement areas. Other measures include steadily improving theaffordability of mortgages and other housing finance products by providingmortgage guarantee schemes, fiscal incentives to private financial institutionsproviding mortgages and introducing mortgage specific policy rates.
Significant challenges remain in reforming other laws and the Constitution, toimprove legislation around collateral and credit recovery. The slow land deliverysystem is a major constraint on private sector finance. Legislative and policyreforms including review of the Lands Act of 1995; approval of the Land andNational Urban Policy, enactment of the Urban and Regional Planning Act (2015)and the Zambia Institute of Planners Act (2014) will provide an enablingenvironment for housing delivery. The Housing (Statutory and ImprovementAreas) Act of 1974 recognises informality which creates potential for housingmicrofinance by supporting artisanal building methods and allowing incrementalhousing development. Only 40 percent of the population hold formal title whichis required as collateral for loans and mortgages. A ZMW6 billion (US$1.2 billion)land audit and titling programme are expected to improve the title registrationsystem which will enhance access to housing finance.
Opportunities
Zambia’s relative political stability and growing middle class creates high demandfor housing while government has shown the political will to provide an enablingenvironment, such as supply of land, for private led housing delivery. There is a largeuntapped residential property market especially for affordable housing.Government has created 33 new districts which require housing especially for civil
> $50 000
$25 000 – $50 000
$14 000 – $25 000
$8 000 – $14 000
$5 000 – $8 000
$3 600 – $5 000
$2 400 – $3 600
$1 600 – $2 400
$800 – $1 600
<$800
- - - Average income needed for the cheapest newly built house by a formal developer, 2015
- - - Average annual urban household income, 2014
ZAMBIA
$36 960
$5 102
Rural | UrbanAnnual household income US$
No. of households (thousands) 700 600 500 400 300 200 100 0 100 200 300

210
servants. Opportunities abound for upgrading the informal housing stock to adecent and acceptable standard. With the enactment of the URP Act, urban andland policies, mortgage markets will have a supporting land administration andplanning system to sustain growth. Investments from China and South Africa havecontinued though at a reduced pace, which are driving residential and commercialproperty demand. Demand is especially unmet in the affordable and studenthousing segments. There are good opportunities for expanding the microfinancesector while housing microfinance requires specialised institutions rather than usingthe traditional MFIs for this purpose.
Sources
AfDB, OECD and UNDP (2015) Zambia Economic Outlook, African EconomicOutlook, AfDB Zambia Field Office Bank of Zambia (2014) Bank of ZambiaMonetary Policy Statement, Jan-Jun 2014.Bank of Zambia (2013) Announcement of the Bank of Zambia Policy Rate,August 2013.Bank of Zambia (2013) Annual Report 2012.Bank of Zambia (2014) Annual Report 2013.Bank of Zambia (2015) Governor’s Press Statement on Recent EconomicDevelopments, August, 2015Centre for Affordable Housing Finance (2015) Data Tables.CSO (2010) Living Conditions Monitoring Survey, Lusaka.Demirguc-Kunt, A. and Klapper, L. (2012). Measuring Financial Inclusion: TheGlobal Findex. World Bank Policy Research WP 6025.Drummond, R., Chongo, B. and Mususa, P. (2013). Scoping Study: Overview ofthe Housing Finance Sector in Zambia. Report prepared for the FinMark TrustGardner, D. (2007). Access to Housing Finance in Africa: Exploring the Issue(No. 1) Zambia. Paper commissioned by FinMark Trust.Interviews with various banks and building societies. March 2014.Knight Frank (2013). Africa Report.KPMG (2014). Zambia Fiscal Guide 2013/14. Post Newspapers, Monday August 31, 2015.PricewaterhouseCoopers (2015) Real Estate: Building the Future of Africa.World Bank (2013). Doing Business in 2013: Zambia. World Bank (2014). Doing Business in 2014: Zambia. UNDESA, Population Division (2012). World Urbanisation Prospects: The 2011Revision, CD-ROM Edition.UN Habitat (2012) Zambia Urban Housing Sector Profile Study, Nairobi.ZIPAR (2015) Draft National Housing Policy. Lusaka.
Websites
www.afdb.orgwww.africaneconomicoutlook.orgwww.allafrica.comwww.bloomberg.comwww.boz.zmwww.constructionreviewonline.comwww.economywatch.com/Zambia Economic Statistics and Indicators. 23, Aug2015, EDT. www.esa.un.org/unpd/wup/CD-ROM/Default.aspxwww.finscope.co.zahttp://hofinet.org/countries/context.aspx?regionID=8&id=182www.kpmg.com/.../KPMG-Zambia-2015-budget-highlights.pdf www.lafarge.comwww.lusakatimes.com › Dec 30, 2014 – macroeconomic performance in 2014and outlook over the medium term, 2015 – 2017www.mfw4a.orgwww.mixmarket.orgwww.pwc.co.za/realestatewww.times.co.zmwww.tradingeconomics.comwww.zm.emb-japan.go.jp/ja/keizai/E.Macro.Report.1.2015.pdfwww.usaidlandtenure.net/zambiawww.unhabitat.orgwww.worldbank.orgwww.wsj.comwww.unfpa.orgwww.zamstats.gov.zmwww.znbs.co.zmwww.qfmzambia.com/2015/06/25/zambias-inflation-rise-to-7-1
1 With an average Gross National Income per capita of $1,070, Zambia has been classified as “Lower-Middle Income Country” although it is still plagued by high rates of poverty and inequality2 World Bank (2011) The Gini Coefficient is a single number that ranges between zero and one. A Gini Coefficient of ‘0’ denotes a perfectly equal distribution while a coefficient of ‘1’ denotes a perfectly unequal
distribution (i.e. one individual holds all the income and the rest hold no income). Therefore the closer the Gini coefficient is to ‘1’, the higher the inequality, while the closer it is to ‘0’, the less the inequality.3 CAHF 2015 Data Tables Zambia4 GRZ, 2013/UN Habitat, 20125 National AIDS Council (NAC), 20106 Pam Golding, 20157 In 2012, the Bank of Zambia (BoZ) introduced a policy interest rate as a benchmark indicator against which retail financial institutions are expected to adjust their lending rates.8 AfDB, 20159 MixMarket is an onlinesource of microfinance performance data and analysis10 At 2014 market exhange rates11 Using a 2013 population estimate of 15, 021,002 in 2015 CAHF Data Tables. In Zambia a household is defined as a minimum of 5.2 people living together under one house (LCMS, 2010)12 ZIPAR, 201513 Interview with Pam Golding, 201514 Peoples Process on Housing and Poverty in Zambia (PPHPZ) assisted-housing / UN Habitat (2012)15 Pam Golding (2015)16 Interview with NAPSA, September 201517 The M.M Integrated Steel Mills ZABS Certified Corrugated Galvanised Roofing Sheets cost ZMW15.0/m for a 32G (0.20MM), ZMW17.5/m for a 30G (0.25mm) and ZMW19.0/m for a 28G (0.27mm)
sheet.18 Post Newspaper advert of M.M Integrated Steel Mills, August 201519 UN Habitat, Zambia Urban Housing Sector Profile, 201220 Interview with Pam Golding, 201521 (an Australian joint venture company)22 Interview with NAPSA, September 201523 SmartHomes is a subsidiary of an American real estate and development company focusing on affordable housing in Africa. It mainly operates outside of Lusaka, the capital of Zambia24 Referencing the contract amount to another currency or commodity25 Others include Habitat for Humanity, Shelter for All (Shefa), and Slum Dwellers International26 Planning Standards and Guidelines, 198027 Interview with Pam Golding, 2015 28 CSO, 2015, Economic Census29 Interview with Pam Golding, 201530 World Bank 2015 Doing Business Report,31 www.doingbusiness.org/African Economic Outlook32 World Bank’s Ease of Doing Business, 2014
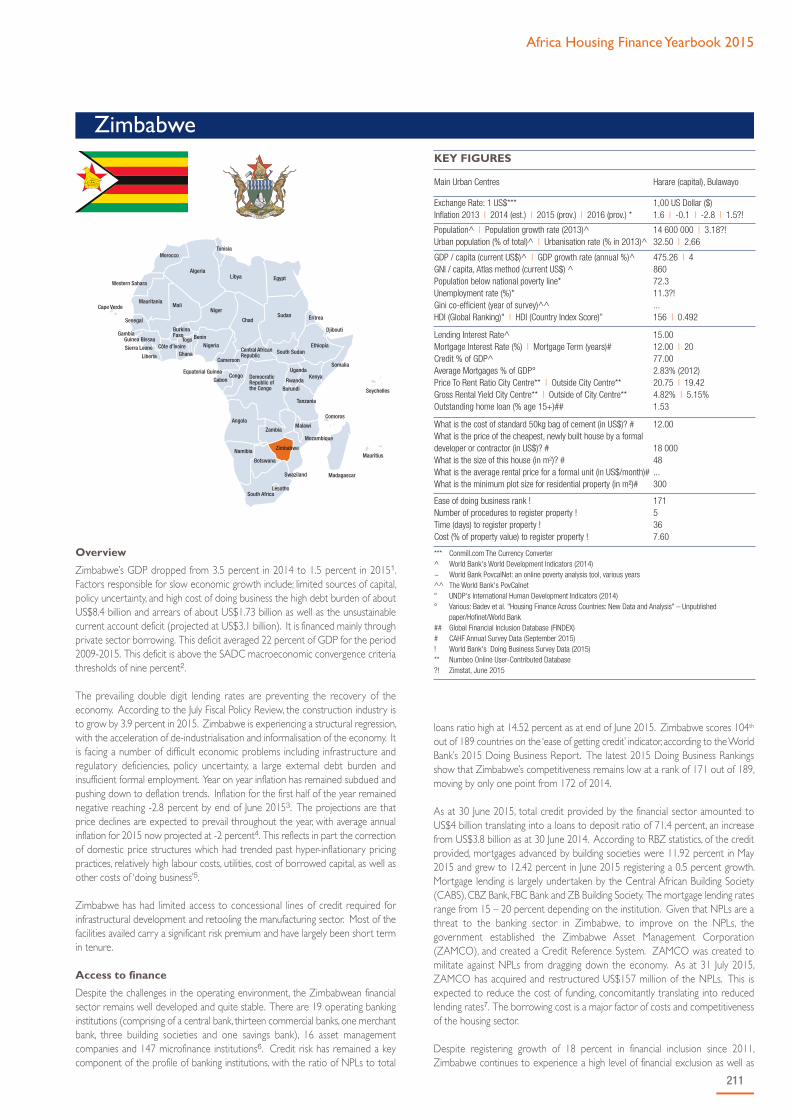
Africa Housing Finance Yearbook 2015
211
Zimbabwe
loans ratio high at 14.52 percent as at end of June 2015. Zimbabwe scores 104th
out of 189 countries on the ‘ease of getting credit’ indicator, according to the WorldBank’s 2015 Doing Business Report. The latest 2015 Doing Business Rankingsshow that Zimbabwe’s competitiveness remains low at a rank of 171 out of 189,moving by only one point from 172 of 2014.
As at 30 June 2015, total credit provided by the financial sector amounted toUS$4 billion translating into a loans to deposit ratio of 71.4 percent, an increasefrom US$3.8 billion as at 30 June 2014. According to RBZ statistics, of the creditprovided, mortgages advanced by building societies were 11.92 percent in May2015 and grew to 12.42 percent in June 2015 registering a 0.5 percent growth.Mortgage lending is largely undertaken by the Central African Building Society(CABS), CBZ Bank, FBC Bank and ZB Building Society. The mortgage lending ratesrange from 15 – 20 percent depending on the institution. Given that NPLs are athreat to the banking sector in Zimbabwe, to improve on the NPLs, thegovernment established the Zimbabwe Asset Management Corporation(ZAMCO), and created a Credit Reference System. ZAMCO was created tomilitate against NPLs from dragging down the economy. As at 31 July 2015,ZAMCO has acquired and restructured US$157 million of the NPLs. This isexpected to reduce the cost of funding, concomitantly translating into reducedlending rates7. The borrowing cost is a major factor of costs and competitivenessof the housing sector.
Despite registering growth of 18 percent in financial inclusion since 2011,Zimbabwe continues to experience a high level of financial exclusion as well as
Overview
Zimbabwe’s GDP dropped from 3.5 percent in 2014 to 1.5 percent in 20151.Factors responsible for slow economic growth include; limited sources of capital,policy uncertainty, and high cost of doing business the high debt burden of aboutUS$8.4 billion and arrears of about US$1.73 billion as well as the unsustainablecurrent account deficit (projected at US$3.1 billion). It is financed mainly throughprivate sector borrowing. This deficit averaged 22 percent of GDP for the period2009-2015. This deficit is above the SADC macroeconomic convergence criteriathresholds of nine percent2.
The prevailing double digit lending rates are preventing the recovery of theeconomy. According to the July Fiscal Policy Review, the construction industry isto grow by 3.9 percent in 2015. Zimbabwe is experiencing a structural regression,with the acceleration of de-industrialisation and informalisation of the economy. Itis facing a number of difficult economic problems including infrastructure andregulatory deficiencies, policy uncertainty, a large external debt burden andinsufficient formal employment. Year on year inflation has remained subdued andpushing down to deflation trends. Inflation for the first half of the year remainednegative reaching -2.8 percent by end of June 20153. The projections are thatprice declines are expected to prevail throughout the year, with average annualinflation for 2015 now projected at -2 percent4. This reflects in part the correctionof domestic price structures which had trended past hyper-inflationary pricingpractices, relatively high labour costs, utilities, cost of borrowed capital, as well asother costs of ‘doing business’5.
Zimbabwe has had limited access to concessional lines of credit required forinfrastructural development and retooling the manufacturing sector. Most of thefacilities availed carry a significant risk premium and have largely been short termin tenure.
Access to finance
Despite the challenges in the operating environment, the Zimbabwean financialsector remains well developed and quite stable. There are 19 operating bankinginstitutions (comprising of a central bank, thirteen commercial banks, one merchantbank, three building societies and one savings bank), 16 asset managementcompanies and 147 microfinance institutions6. Credit risk has remained a keycomponent of the profile of banking institutions, with the ratio of NPLs to total
KEY FIGURES
Main Urban Centres Harare (capital), Bulawayo
Exchange Rate: 1 US$***Inflation 2013 | 2014 (est.) | 2015 (prov.) | 2016 (prov.) *
1,00 US Dollar ($)1.6 | -0.1 | -2.8 | 1.5?!
Population^ | Population growth rate (2013)^Urban population (% of total)^ | Urbanisation rate (% in 2013)^
14 600 000 | 3.18?!32.50 | 2.66
GDP / capita (current US$)^ | GDP growth rate (annual %)^GNI / capita, Atlas method (current US$) ^Population below national poverty line*Unemployment rate (%)*Gini co-efficient (year of survey)^^HDI (Global Ranking)" | HDI (Country Index Score)”
475.26 | 486072.311.3?!...156 | 0.492
Lending Interest Rate^Mortgage Interest Rate (%) | Mortgage Term (years)#Credit % of GDP^Average Mortgages % of GDP° Price To Rent Ratio City Centre** | Outside City Centre**Gross Rental Yield City Centre** | Outside of City Centre**Outstanding home loan (% age 15+)##
15.0012.00 | 2077.002.83% (2012)20.75 | 19.424.82% | 5.15%1.53
What is the cost of standard 50kg bag of cement (in US$)? #What is the price of the cheapest, newly built house by a formaldeveloper or contractor (in US$)? #What is the size of this house (in m2)? #What is the average rental price for a formal unit (in US$/month)#What is the minimum plot size for residential property (in m²)#
12.00
18 00048...300
Ease of doing business rank !Number of procedures to register property !Time (days) to register property !Cost (% of property value) to register property !
1715367.60
*** Conmill.com The Currency Converter^ World Bank's World Development Indicators (2014)~ World Bank PovcalNet: an online poverty analysis tool, various years^^ The World Bank's PovCalnet" UNDP's International Human Development Indicators (2014)° Various: Badev et al. "Housing Finance Across Countries: New Data and Analysis" – Unpublished
paper/Hofinet/World Bank## Global Financial Inclusion Database (FINDEX)# CAHF Annual Survey Data (September 2015)! World Bank's Doing Business Survey Data (2015)** Numbeo Online User-Contributed Database?! Zimstat, June 2015

212
usage of informal financial products and services8. Many Zimbabweans aged 18years and above are still financially excluded, or not using either formal or informalfinancial products. This 18 percent improvement in financial inclusion was drivenmainly by mobile money and other electronic payment systems, such as card basedpayments9. The survey established that 45 percent of adult Zimbabweans usemobile money services and the majority reside in rural areas.
In efforts to promote financial inclusion, the Reserve Bank of Zimbabweestablished an additional banking class (deposit taking microfinance institution)dedicated to support low income and micro, small and medium enterprises10. Inthis regard, the Reserve Bank has so far issued two deposit taking microfinancelicences to African Century Limited which is finalising the infrastructural andoperational requirements before commencement of business, and to GetbucksFinancial Services (Pvt) Ltd. which has been operating as a credit only microfinanceinstitution. Also, to incentivise provision of new additional mortgage financing,government waived stamp duty on cession of mortgage bonds with effect fromJanuary 2015. This was meant to enhance availability of resources towardsfinancing the national housing programme. Improvement in financial inclusionresults in increased housing development.
Despite the banking sector having deposits increased by 14.2 percent fromUS$4.9 billion in June 2014 to US$5.6 billion as at end June 2015, these depositscontinue to be dominated by demand deposits, which account for 55.49 percentof total deposits11. On this note, lending has continued to be largely for the short-term requirements of working capital and consumer durables. The proportion oflending in 2015 to the construction sector continues to be low (2.59 percent). Thedepressed lending to capital intensive sectors such as construction, communication,mining and the manufacturing sector is reflective of the limited capacity of bankinginstitutions to provide long-term funding due to the short term nature of deposits.This is so because financial institutions have limited access to offshore lines ofcredit and the reluctance by the public to commit funds for long periods.
Limited availability of affordable long-term finance impacts negatively on the abilityof the mortgage lenders to provide affordable mortgages and as such lenderspass the high cost of borrowing to their customers. Mobile money is alsospreading quickly, linked to the rapid spread of mobile phone penetration. Otherefforts by the RBZ to streamline costs of doing business and stimulate economicactivity through affordable credit facilities in the domestic banking system includea downward review of lending rates. For housing finance it has been pegged tobe between 8 – 16 percent per annum, prime borrowers with low credit risk at6 – 10 percent per annum, borrowers with moderate credit risk 10 – 12 percentper annum, borrowers with high credit risk 12 – 18 percent per annum, and onconsumptive lending 10 – 18 percent per annum; these rates were to be effectedin October 201512. The default rate of 3 – 8 percent to be charged above theinterest rate charged to the borrower. This is expected to increase access andaffordability of housing finance in the country and hence boost affordable housinginvestment.
Despite the high cost of funds, financial institutions have developed innovations toreduce the cost of borrowing for low income clients. CABS offers a low pricedmortgage product for borrowers in high density areas for which an interest rateof 12 percent is charged as opposed to 15 percent that applies to borrowers inlow density areas. In an effort to enable low income earners to access housingfinance, building societies collaborate with employers to provide loans at subsidisedrates. CBZ has introduced a product called ‘the Cash-Plus Housing SavingsProduct’ targeted at the informal sector. It involves the potential borrower savingwith the institution for 12 months after which the client then qualifies for a loanequivalent to his/her savings.
Affordability
Zimbabwe’s fragile economy is headed for a contraction that could trigger anunprecedented humanitarian and economic crisis following a slowdown inrecovery and deteriorating liquidity situation witnessed for the past three years13.The economic contraction results in increased job losses and further erodedisposable incomes – rapid increase in poverty; this has affected affordability ofhousing finance as well as the housing itself.
The affordability of houses remains a typical question since the facilities meant forlow income earners are still beyond their reach. In late 2012, Harare City Councilsigned an agreement with CABS to build 3 102 core houses for low incomeearners in Budiriro, Harare. Beneficiaries were to pay an initial deposit and CABSwill provide mortgage finance which would be repaid over 15 years. Up toFebruary 2015 only 500 houses were bought since completion of the 3 102houses. Due to this low uptake by the prospective home seekers, the bank revisedthe mortgage terms; the upfront deposit of 10 percent is now required uponapplication, down from the initial 25 percent and extending the mortgage tenureto 20 years but this is still beyond the reach of many14. This is expected to boostuptake of the housing units.
In loan finance, there is a high default risk due to low economic performancemarked by retrenchments; the rate of NPLs stood at 14.52 percent as at 30 June2015. In most banks, low income earners (earning US$750 per month) qualify formortgages that are between US$15 000 and US$20 000 depending on theinstitution. CABS defines low income as a monthly income of at least US$750which is significantly above what most workers in industry and commerce, letalone in government service, take home15. The cheapest newly built house costsUS$18 000 on average which makes it houses beyond the reach of many since forone to buy this has to get an income of US$750 and above. While it is laudableto prioritise first-time buyers for these houses, the reality is the economy is nolonger creating new decent jobs, and even those that have been in formalemployment for a decade or more can no longer afford these most basic houses.
The major affordability concerns include high interest rates, prevailing interest ratesof up to 20 percent are considered not only prohibitive, but also punitive. Inaddition, because interest rates denote the cost of money, it means this factor iswidely seen as the most important element in determining affordability of housingloans. Also a 25 percent deposit/own contribution, the own contributionrequirement has been the main cause of slow uptake of mortgages because it isa cash flow item whose impact is immediate. One needs to be able to raise thecash deposit in an environment plagued by low levels of disposable income thusin Zimbabwe this makes housing unaffordable.
Housing supply
The major housing objective of Zimbabwe’s national strategy, the Medium TermPlan (2011-2015), is to eliminate the housing backlog and halve the housingdependency ratio at the household level by 2015. In the same spirit, thegovernment’s economic blueprint – Zimbabwe Agenda for Sustainable Socio-Economic transformation (ZIMASSET) also stipulates the government’s plans toconstruct 125 000 housing units by 201816. This would be attained through theprovision of housing stands, strengthening of public-private sector partnershipsand re-capitalisation of the National Housing and National Guarantee Fund, amongother measures. This is a daunting challenge considering that the current nationalhousing waiting list is estimated to be 1.5 million.
Government plays a pivotal role in housing development through the directprovision of houses, legislation as well as land. Recently, the government signed aUS$1.9 billion housing China-Africa Construction company expected to availhousing stock in phases17. Through legislation, the government’s 2012 NationalHousing Policy seeks to address the challenge of the huge housing backlog througha partnering and facilitating approach to housing development and managementso as to leverage community and private sector initiatives. In this regard, the policystrengthened the role of local authorities as well as encouraged the participationof civil society and the private sector in housing development.
Financial institutions are also promoting housing development projects. Thefinancial institutions support housing development through offering mortgage loansor by construction of the housing stock as was done by CABS (in partnershipwith City of Harare) in Budiriro; a project which started in 2012. ZB Bank and FBCBank, in addition to mortgage lending for buying and building houses, they hadeach contributed by servicing stands or building houses for sale. ZB Bank hadserviced stands in Springvale which range from US$11 000 to US$26 000(300 – 600 m2), 10 garden flats in Hatfield which range from US$109 000 toUS$130 000 and some in Beitbridge. CBZ developed the Nehosho housingproject in Gweru which consist of 1 095 undeveloped low cost-residential standswith prices ranging from US$15 000 to US$23 000. A minimum of 25 percent

Africa Housing Finance Yearbook 2015
213
deposit is required and monthly repayments on the mortgage range from US$200up to US$300.
Fidelity Life Assurance is expected to complete the servicing of stands of itshousing project in Southview, Harare before the end of 2015, buoyed by theUS$12.7 million raised through mortgage bonds18. A total of 5 304 stands wouldbe availed to the market, adding that 4 000 units had already been sold. Fidelityfirst embarked on housing development projects in 2011 and developed 317stands in phase one of Manresa Fidelity Park in Arcturus. National Social SecurityAuthority (NSSA) came on board to provide housing stock as efforts toimplement Zim-Asset, currently it is working on 680 low cost housing stands inMasvingo. Plans are that after Masvingo it moves to Bulawayo to constructbetween 800 and 1 000 housing stands19.
According to the Zimbabwe National Association of Housing Cooperatives(ZINAHCO), an apex body that represents housing co-operatives, since the year2000 through its membership, it had serviced more than 20 000 stands and hadbuilt more than 10 000 houses20. This apex body occasionally receives financialsupport from developmental partners. The cooperatives acquire land from privateowners, government or local authorities and then service it using subscriptionsfrom members. Many housing cooperatives are being registered and deliveringhousing developments in line with the goals of Zim-Asset. The biggest threat fromsuch institutions is the issue of bogus land allocation and distribution which leadto extortion and losses from seekers.
Bulawayo City Council in March 2015 commissioned a new suburb by unveiling391 medium density residential housing stands in Emhlangeni21. The project –Emhlangeni Phase One is the third in a series of pre sale housing projects that theBulawayo City Council is implementing. Emhlangeni contract was implemented ata cost of US$2.9 million and was started in September 2013.
Property markets
A strong property market usually denotes a growing economy and a weak one,the opposite. Zimbabwe’s housing market, despite the need being high, due to thedepressed demand, it is in doldrums22. The demand for residential propertyremains high, though activity has been hampered by low disposable incomes andthe deterioration in liquidity conditions, particularly during the first half of 2015.The market is still active, albeit at subdued levels, particularly for medium densityhouses, flats and cluster units. Prices for units in this category up to a value ofUS$150 000 have witnessed an increase due to the high demand. More expensivehomes are taking much longer to sell and have witnessed price stagnation.
In light of the prevailing economic situation, rentals have declined; rental per m2
went down to an average of US$7.57 compared to US$8.28 in 2014 mainly as aresult of lower rates on industrial space, decline in central business district officeand non-rental reviews23. There has been a marked increase in the number of
tenants moving out of residential properties as they could no longer sustaincurrent rentals. The increasing number of tenants failing to pay rentals due to theworsening liquidity crunch and joblessness has pushed some in re-negotiatingexisting contracts for downward rental reviews.
Zimbabwe ranks 94th out of 189 countries according to the World Bank’s 2015Doing Business Report for the indicator ‘ease of registering property’. The fiveprocedures take 36 days and cost 7.6 percent of the property value.
Policy and regulation
Housing in Zimbabwe has a vivid institutional and regulatory framework thatshapes the sector. The Acts that include Regional, Town and Country Planning Act[Chapter 29:12], Urban Councils Act [Chapter 29:15], Land Survey Act [Chapter27:06], Deeds Registry Act [Chapter 20: 05], Consolidated Land Acquisition Act[Chapter 20:10] and Rural Land Occupiers Act of 2002 and instruments likeNational Housing Policy of 2012 and Model Building By-laws all have an impact inurban housing. The intention is to stimulate and regulate the housing delivery forexample the Housing policy of 2012 addresses the need for more housing designsand development models, and an increased range of permissible building materialsand construction models. With the introduction of the new constitution in 2013,this will involve a relook at legislation and by-laws that are no longer relevant.
The country requires long-term funding to address infrastructure bottlenecksneeded for effective housing delivery including more capacity to avail loans forboth land and housing development. The Deed Registries Act [Chapter 20: 05]targets the issue of loan security and provides for the registration of mortgagebonds, and notarial bonds. This provides security in the housing finance sector.
The RBZ’s efforts to cut on the interest rates and promotion of financial inclusionare direct policy interventions to reduce the cost of capital and also the cost ofdoing business in Zimbabwe. This has a positive effect on housing finance bymaking the cost of borrowing lucrative for home builders.
Opportunities
Zimbabwe has several opportunities for investment in affordable housing. Thehousing backlog of 1.5 million people signifies a huge demand for housing thuspresents a readily available market for affordable housing units. The country hasabundant natural resources for affordable construction like wood. These resourcespresent an opportunity in affordable housing construction as they cut the cost ofbuilding. Housing has been stipulated by government as a priority, this is anopportunity, given the urgency by the state to avail housing to the homelesspopulace.
Despite the liquidity challenges, the country has a stable macroeconomicenvironment. Zimbabwe continues to enjoy low inflation and has implemented
> $50 000
$25 000 – $50 000
$14 000 – $25 000
$8 000 – $14 000
$5 000 – $8 000
$3 600 – $5 000
$2 400 – $3 600
$1 600 – $2 400
$800 – $1 600
<$800
- - - Average income needed for the cheapest newly built house by a formal developer, 2015
- - - Average annual urban household income, 2014
ZIMBABWE
$8 675
$8 308
Rural | UrbanAnnual household income US$
No. of households (thousands) 600 500 400 300 200 100 0 100 200 300
214
prudent fiscal policy characterised by a cash budgeting system which is anopportunity24. However, the country faces challenges on the external account. Itis hoped that the promising process of normalisation of relations with MultilateralFinancial Institutions will pave the way for a solution to the debt and arrearschallenge25. Such a development would lead to significant inflows which arerequired to address the current liquidity problems. It would also spur theperformance of the economy, leading to increased household incomes.
The peaceful environment that is safe for investment presents an opportunity forinvestors to invest in affordable housing or construction industry at large. It ishoped that the establishment of a PPC cement production plant in northernZimbabwe, and one in Masvingo, will support further growth in housing supply asthe cement capacity of the country increases. Also, there are other plans to opena US$400 million cement plant in Zimbabwe which is going to positively contributeto the price of cement. The government’s stance in various development policiesarticulates what is required in order to improve housing delivery; these now needto be implemented.
Sources
African Economic Outlook, Zimbabwe 2014.http://www.afdb.org/en/countries/southern-africa/zimbabwe/zimbabwe-economic-outlook/. Accessed 10/08/15.African Economic Outlook, Zimbabwe 2015.http://www.africaneconomicoutlook.org/en/outlook/forecast/. Accessed13/08/15.FinScope Survey 2012. FinScope Survey 2014. http://www.finmark.org.za/publication/finscope-zimbabwe-consumer-survey-2014. Accessed 13/08/15.Government of Zimbabwe (2011). Zimbabwe Medium Term Plan 2011-2015.Harare: Government Printers.Government of Zimbabwe (2012). National Housing Policy 2012.Harare:Government Printers.Government of Zimbabwe (2013). ZimAsset. Harare: Government PrintersHarare City Council (2015). www.hararecity.co.zw/index.php/departments/l.Accessed 08/08/15.http://constructionreviewonline.com/2015/05/zimbabwe-signs-us1-9bn-housing-project/. Accessed on 03/09/15.Ministry of Finance (2015). Zimbabwe Mid-Term Fiscal Policy – July 2015.Harare: Government Printers.Newsday (02/04/2015). 127m Boost for Fidelity Life Housing Project. Harare:Alpha Media Holdings.Reserve Bank of Zimbabwe (2015). Zimbabwe Monetary Policy – July 31 2015.Harare: Government Printers.The Herald (27 February 2015). CABS slashes deposits for Budiriro scheme.Harare: Zimpapers.The Sunday Mail (14 June 2015). Mortgage Lenders Remodel Facilities. ZBTarget Informal Market. Harare: Zimpapers.World Bank, Doing Business 2015. http://data.worldbank.org/news/release-of-world-development-indicators-2015. Accessed 09/08/15.Zimbabwe Bankers Association. http://baz.org.zw/resources/database. Accessed10/08/25.Zimbabwe National Statistical Agency (2013). Poverty Income Consumptionand Expenditure Survey 2011/12 Report.ZINAHCO (2015). http://cooperativehousingafrica.com/zimbabawe-national-association-of-housing-cooperatives-zinacho/. Accessed 08/08/15.
1 MoF (July 2015). Zimbabwe Mid Term Fiscal Policy 2 MoF (2015) Zimbabwe Mid-Term Fiscal Policy – July 20153 RBZ (2015), Zimbabwe Mid-Term Monetary Policy – July 20154 Zimbabwe National Statistical Agency (2013)5 MoF (2015), Zimbabwe Mid-Term Fiscal Policy – July 20156 RBZ (2015), Zimbabwe Mid-Term Monetary Policy – July 20157 RBZ (2015)8 2014 FinScope Consumer Survey 9 MoF (2015)10 RBZ (2015)11 MoF (201512 RBZ (2015)13 NewsDay (29 July 2015). Stop co-operatives from further destroying housing market14 The Herald (27 February 2015). CABS slashes deposits for Budiriro Scheme15 NewsDay (25 June 2015).Mortgage loans affordability under spotlight16 GoZ (2013), ZIMASSET17 Construction Review Online (accessed 02/09/15). Zimbabwe signs US$1.9bn housing project18 NewsDay (5 April 2015). $12,7m boost for Fidelity Life housing project19 The Chronicle (15 may 2015). NSSA to develop 1000 residential stands in Bulawayo.20 Parliament of Zimbabwe (7 May 2015). The first report of the Portfolio Committee on Small and Medium Enterprises and Cooperative Development and impact of housing cooperatives on the delivery
of national housing in Zimbabwe21 The Harare Times (7 March 2015). Bulawayo commissioned a new suburb – Emhlangeni22 NewsDay (29 July 2015). Stop co-operatives from further destroying housing market23 Financial Gazette, (23 April 2015). Rental defaults distress property market24 African Economic Outlook, Zimbabwe 201525 RBZ (2015). Zimbabwe Mid-Term Policy- July 2015

Africa Housing Finance Yearbook 2015
215
The Economic and Monetary Community of Central Africa, EMCCA (CEMAC)
the region and there is a single currency (CFA franc) and defined criteria formacroeconomic convergence. It was established in 1972 with headquartersin Yaounde, Cameroon. BEAC regulates the sector through its regionalbanking commission, COBAC, which shares responsibility with the nationalMinistries of Finance for licensing new banks and regulating microfinanceinstitutions. There is also a budgetary agreement between the French Treasury(Ministry of Finance) and BEAC with fixed convertibility of the CFA franc anda droit de regard (oversight with veto powers) by the French Treasury.
n The other two institutions are the CEMAC parliament and the court ofJustice. The court of Justice, which is in place since 2000, is located inN’Djamena. It assumes a judicial and audit function.
The region has an estimated population of 45 million (as of end of 2014) spreadover more than 3 million km2. Half of the population live in Cameroon and65 percent are below 25 years of age. The average population growth rate is2.8 percent. It has a combined GDP of US$88.2 billion (as of 2012). The real GDPgrowth rate of 4.6 percent in 2014 was mainly driven by oil, timber and agricultureexports. Cameroon is the largest economy in the region, with half of the region’stotal financial assets and contributes up to 29 percent of the region’s GDP. Themineral wealth includes deposits of gold, diamond, natural gas, oil, bauxite,aluminium, manganese and uranium. Other export products include naturalrubber, tobacco, cocoa, coffee, sugar, Tobacco and Banana. Due to inadequateprivate investments, there has been little exploitation of petroleum and othermineral resources, with the exception of oil and timber. Crude petroleum is animportant resource for these countries, apart from the Central African Republic:it accounts for 86 percent of the community’s exports; Equatorial Guinea dependson it for 70 percent of its GDP; Congo, 61 percent; Gabon, 50 percent; Chad,40 percent; and Cameroon, 10 percent. Timber is the community’s second largestexport product. The countries in the region are about 50 percent urbanised.Gabon has the highest level of urbanisation at 86 percent, with a third of thecountry’s population living in the capital Libreville.
Access to finance
The formal financial system across CEMAC countries is not well developed. Mostof the large banks are foreign-owned and are subsidiaries of foreign banks. Thereare also a few small to medium-sized banks from other African countries such asNigeria, Togo and South Africa. Recently, banks from Cameroon have also movedinto other countries in the region, including Gabon, Congo, Chad and EquatorialGuinea. The CEMAC banking system currently comprises of 48 active banks withCameroon having the most banks in the region (14), followed by Gabon (10) andChad (nine). Congo has six banks, Equatorial Guinea has five banks, and CentralAfrican Republic has four. The number of savings banks in the region remains low.On average, in the six countries, there are three bank branches per 100 000 adults.The mortgage finance market is still in its infancy, but with huge potential forgrowth. Very few banks in the CEMAC region provide medium-term and long-term credit. Some of the banks that grant this type of credit are the GaboneseDevelopment Bank, the National Investment Company (in Gabon and Cameroon),Afrilands First Bank (Cameroon), and SOCOFIN in Congo Republic.
Mortgage finance is mostly granted by government agencies, and the people whobenefit most are government employees. Only a very small percentage (5%) ofprivate sector employees have access to mortgage finance from commercial banks.This percentage is now increasing with ongoing efforts by real estate companiesin partnership with local commercial banks to extend end-user financingopportunities to the growing middle class. Those in the informal sector and alarge percentage of the middle class and lower income groups get housing finance(directly and indirectly) from different forms of MFIs. The microfinance sector isdeveloping in all countries in response to difficulties associated with accessingcredit through traditional banking channels. There are now over 800 microfinanceinstitutions in the region, with Cameroon having the most, followed by Chad,Congo, Central African Republic, Gabon and Equatorial Guinea respectively. Linkswith the traditional, formal banking sector are weak and the consolidation of microlenders is not sufficient to allow for meaningful regulation and oversight, or thedevelopment of strong links with the banking sector. However, BEAC, throughCOBAC, has developed a strategy for controlling the informal financial sector.
Overview
The Economic and Monetary Community of Central Africa (CommunautéÉconomique et Monétaire de l'AfriqueCentrale, CEMAC) is made up of six formerFrench colonies in Central Africa – Cameroon, Central African Republic, Chad,Congo Republic and Gabon; and Equatorial Guinea, a former Spanish colony. Itwas created in 1994 and became operational after the treaty’s ratification in 1999in N’Djamena, Chad. The main objectives of the treaty was to converge andmonitor national economic policies, to coordinate sectoral policies and toprogressively create a single market. This will help promote the entire process ofsub-regional integration through the forming of a monetary union, with the CentralAfrican CFA franc as a common currency. Discussions regarding forming amonetary union and a single market are still ongoing, it is still unclear if and whenthe monetary union and single market will be formed. CEMAC has itsheadquarters in Bangui, the capital of the Central African Republic. There areongoing plans since 2011 to unify the Douala and Libreville stock exchanges intoa unified CEMAC Securities and Stock Exchange. This is proving difficult asalthough the CEMAC heads of states opted for a regional stock exchange inLibreville in Gabon, the realities of the market are more favourable to the stockexchange of Douala, which was created by the Cameroon government. Accordingto experts, the narrowness of the market does not allow for the existence of twostock exchanges in the region.
The treaty that specified the legal and institutional arrangements of CEMACcreated the following four specialised institutions, each of which is regulated by aseparate legal convention than the treaty:
n Central African Economic Union (Union Economique de l’Afrique Central –UEAC) with an Executive Secretariat based in Bangui, Central AfricanRepublic. The Customs Union is one of the central pillars of CEMAC. It hasestablished a regime for trade between the countries and with othercountries. Trade inside the community has been duty free since 1998.
n The Central African Monetary Union (Union Monétaire de l’AfriqueCentrale), which specifies the responsibilities of the central bank, Banque desEtats d’Afrique Centrale (BEAC) and the Central African Banking Commission(COBAC). COBAC started functioning in 1993 with headquarters inLibreville, Gabon. It sets regulations and carries out on and off-site supervisionof the region’s banks and finance houses. BEAC is a single central bank for

216
COBAC, jointly with the Ministries of Finance of all six countries, now regulatesthe MFI sector in all six countries. There is an urgent need to develop mortgagefinance products that address the needs of the growing middle class and lowerincome groups who have no access to formal housing finance. There are ongoingefforts by both government and private sector interests to provide and extendaccess to end-user financing to the rapidly expanding middle class in thesecountries. Access to credit has also been improved through amendments to theOrganisation for the Harmonization of Business Law in Africa known through itsFrench acronym OHADA Uniform Act on Secured Transactions that broadensthe range of assets that can be used as collateral (including future assets), extendthe security interest to the proceeds of the original asset, and introduce thepossibility of out-of-court enforcement.
Affordability
In the formal sector, the state is the largest employer, offering an average monthlysalary of about 150 000 CFA francs (US$300). Though rapidly growing, theformal private sector is still very small. Most people are involved in the informalsector with a high percentage of people living under the national poverty line.These people cannot afford to finance their homes through existing bankingfunding instruments. Construction costs in the urban and semi-urban areas arehigh and increasing. It costs about 9 million CFA francs (US$18 000) to build astandard three bedroom house in the main urban areas. This is mainly because ofthe high costs of inputs such as cement, sand, plates, iron, finishings and decorations.These costs may decrease as new property developers come into the marketwith a business model that favours large scale procurement of inputs and withthe capacity to influence and better manage input costs. In Cameroon, thegovernment has set up local production facilities for some of the inputs to helpbring down the cost. It has also set up an agency to develop and promote the useof local materials for construction. These materials are exported to other CEMACcountries like Gabon, Congo Republic and Equatorial Guinea. In the rural areas,the construction costs are lower as most of the houses built are of a semi-standardand sub-standard, with local materials such as sun-dried bricks made from clay.Rental costs in the urban and semi-urban centres are also high. It costs on averageabout 150 000 CFA francs (US$300) a month to rent a three bedroom house inthe main urban areas. In the smaller towns, it is generally about 40 percent cheaper.This is not the case in N’djamena and Libreville, however, which are the second andthird most expensive cities in Africa for expatriates, as demand for accommodationfar exceeds supply. It costs up to US$6 500 a month for a standard three bedroomapartment in these cities. The government and the private sector are currentlyexploring and putting in place mechanisms to increase the number of affordablehousing units that enter these markets each year, either through ownership orrental, and also to ensure that middle class people and those in the lower incomegroups get access to affordable housing finance.
Housing supply
The number of new housing units that enter the market annually for rental andpurchase for ownership is insufficient to meet the demands of the increasinglyurbanised population in all CEMAC countries and the growing middle and upperclass population. The growing economy has swelled a middle class that needs tobe housed. A third of the Gabonese population lives in the capital Libreville, anda quarter of the Congolese population in the capital Brazzaville, both cities withhuge housing backlogs. The demand for housing has increased without asubsequent increase in supply. The discovery of oil in Equatorial Guinea, and neweconomic sectors that have opened up such as mining, telecommunications, retail,construction, energy, agro processing has seen the influx of expatriates, migrantworkers, and skilled diaspora populations returning to their countries, thusaccentuating the demand for housing. This increasing mismatch between demandand supply for housing continues to push up house prices both for ownership andrental.
The current stock of housing units is produced mainly through incremental self-construction, and less so by government agencies, and private developers. Thepoor live in sub-standard accommodation, often on land that is not well-servicedwith poor infrastructure like access to regular and clean water, electricity andsewage disposal facilities. With the newly set up cement factories in Cameroonthat also aim to service these markets, the costs of cement has stayed the same,which may help to increase supply of new affordable housing units. It is hoped thatwhen the new Dangote cement plant becomes operational, it will help to bring
down the cost of cement. There is an increasing number of local housingcompanies and developers from the USA, Canada, China and South Africa whoare going into these markets using a BOT (Build, Operate and Transfer) model.There are also ongoing efforts by some governments to increase housing supply.For example the government of Cameroon, through partnerships with privatedevelopers, set up a project to provide over 100 000 new units over the next fiveyears of which, half of these units are already in the market.
International oil and construction companies are driving the demand for highquality residential units in Malabo and Bata, Equatorial Guinea. There has been agreat deal of volume of home building in Malabo II and reserved governmentresidential areas in the east of the city. Mainly expatriates live in these new areasas they are expensive and not affordable to the average middle class person. Thecentral Klemat area in N’djamena, which is near the presidential palace, is also animportant residential district with new developments. Again, it is mostly for theexpatriate community and not affordable to middle class people. In Gabon, Congoand Central African Republic, the new housing developments are driven bydemand for high quality housing by expatriate communities. There are no large-scale development activities to provide housing for middle-income people in thesecountries, except for Cameroon. This situation will surely improve in the very nearfuture with the recent interest and activity of developers in the region.
Property market and opportunities
With fairly strong and sustainable economic growth due to economic reformsand the strong demand for its natural resources from emerging economies suchas China, India, Brazil, Russia, and developed economies like the USA and the EU,a growing middle class, increasingly urbanised populations, a huge housing backlog,and a large diaspora that is seeking to invest in real estate in these countries, hugeopportunities exist for residential high end and middle/low income housing in allareas of the value chain – real estate development, construction, finance and realestate management services. There are also huge opportunities for retail,commercial and industrial real estate in the urban and semi-urban areas. Theprospects for the property market are very good. For the potential to be realised,governments in the various countries and other stakeholders must continuouslyfind ways to increase supply and make them affordable to the middle and lowerincome groups. This is already been done in Cameroon with existing partnershipsbetween government and the private sector. Some global property developmentcompanies have started to take advantage of existing opportunities in the market,and through local subsidiaries and partnerships, are putting in place new housingdevelopment units for middle to high income end-users. An example is Optionsfor Homes GTA Canada, which through its local subsidiary (Options for HomesCameroon) is building housing units in Cameroon with the objective of building10 000 units per year in the next five years.
Policy and regulation
Governments in the CEMAC countries have been slow in putting in place reformsthat would address the constraints in this sector. The main constraints are in theareas of land ownership and property registration (getting land title certificates),access to serviced land, construction and development, and the availability offinance. According to the World Bank’s 2015 Doing Business Report, whencompared to the 2014 report most of the countries in the region have madesome progress on ease of doing business, issuing construction permits and accessto credit. Getting credit and registering property is still an issue. These needurgent attention. Gabon made transferring property more costly by increasing theproperty registration tax rate while Chad reduced the property registration taxrate. Cameroon improved its credit information system by passing regulation thatprovides for the establishment and operation of a credit registry database.Cameroon also made dealing with construction permits more complex byintroducing inspection and notification requirements. At the same time,government made it easier by decentralising the process of obtaining buildingpermits and by introducing strict time limits for processing the application andissuing the certificate of conformity. Governments should continue to introducereforms on land administration, construction, property registration and access tohousing finance. The government of Cameroon has taken a step to providesovereign guarantees to private developers. Because of the potential role thatMFIs could play, reforms and policies should also focus on tapping into thatpotential.
Africa Housing Finance Yearbook 2015
217
Sources
AfDB, OECD and UNDP (2014): The African Economic Outlook.CIA World Fact Book 2014Soededje et al (2009): Study on Cameroon. Unpublished.UNDP HDR (2014): Human Development Report.World Bank (2015). Doing Business 2015World Trade Organisation (2014): Report
Websites
www.africaneconomicoutlook.orgwww.allafrica.comDocument8www.cia.govwww.cemac.intwww.doingbusinessincameroon.comwww.mixmarket.orgwww.undp.orgwww.unhabitat.orgwww.worldbank.orgwww.africareview.comhttp://fas.imf.orgwww.beac.intwww.afribiz.infowww.imf.orgwww.wto.orgwww.doingbusiness.org

218

Africa Housing Finance Yearbook 2015
219
The East African Community
Communities (RECs), with the ultimate goal of creating a single market,encompassing 26 countries with combined GDP, estimated at US$624 billion, anda GDP per capita US$1 184. Presently, the EAC Regional Bloc is ranked the bestREC in Africa4.
The EAC is now common market of 143.5 million people (2014), with a combinednominal GDP of US$146 billion5, slightly over a quarter the size of Nigeria’seconomy, the largest on the continent. Kenya's economy6 is the largest in theEAC Region, and contributes 42 percent to the regional GDP. Tanzania and Ugandafollow with 33 percent and 17 percent, respectively. Rwanda and Burundi accountfor the balance.
Economic growth within the five partner states has generally been consistent andstrong, driven by (i) the diversified services sectors, which have over the pastdecade or so, replaced the agriculture sectors as the largest contributor to totalGDP, and (ii) the industrial sector. In Burundi for example, the share of agriculturein the economy receded from 48.4 percent in 2006, to 36.4 percent in 2015.Industrial output expanded its share of the economy from 10 percent to about15 percent, while services increased from 41 percent to 49 percent. The structuresof the economies of the other partner states, with the exception of Kenya7, havefollowed similar trends.
Between 2006 and 2015, all the partner states registered an average real GDPgrowth rate of more than four percent. With the exception of Burundi8, economicgrowth in all partner states is projected at above five percent in 2016. The Region’ssound economic growth and the improving business environment have beeninstrumental in the growth of Foreign Direct Investment (FDI). Overall FDIinflows9 into the region grew from US$2.57 billion in 2011 to US$3.85 billion in2012. The increase in FDI was mainly attributed to recent natural resourcediscoveries, including gas reserves in Tanzania and the oil fields in Uganda.
Average GDP per capita has increased from US$249.8 in 2002, to US$792.110 in2014. However, the distribution of the wealth has not been equitable. In thatperiod, the number of east Africans living below the poverty line increased from44 million to 53 million, even though all partner states, with the exception ofBurundi and Kenya, reduced the share of their population who lived below therespective national poverty line11.
Tanzania is the most urbanized country in the EAC. In 2014, 31 percent ofTanzanians lived in urban areas compared to 19 percent in 1990. Rwandaurbanized the fastest12 between 1990 and 2014, when the share of its populationliving in urban areas increased from five percent to 28 percent. Kenya’surbanisation rate increased from 18 percent to 25 percent and Uganda’s from 11percent to 16 percent during the same period. Burundi has the region’s lowestrate of urbanisation, at six percent in 1990 and 12 percent in 2014.
Access to finance
In all the five partner states, the levels of financial inclusion are improving, however,the financial markets still lack depth and breadth. Statistics from the latest FinScopeStudies (2013) show that in Uganda, Rwanda and Tanzania, less than a third of thepopulation have access to the formal financial system, while between 15 and25 percent of the population has no access to financial services at all. In 2010, lessthan a third of the population in the above three partner states had access to theformal financial system, while almost 65 percent of the population had no accessto financial services at all. In Burundi, the level of financial inclusion is still low, butimproving – 25.9 percent of the adult population had a savings account with aformal financial institution in 2014, compared to 23.8 percent in 2013 and 19 percentin 2011. Kenya ranks ahead of other partner states in ease of access to financialservices, with about 40 percent of the population having access to the formalfinancial system.
However, poor access to financial information and low levels of analytical capacityweaken commercial banks’ incentives to lend. In Burundi for example, only 10 percentof population is well informed about the various services available on the financialmarket. Further, interest spreads and banking industry margins are high. In East
Overview
The Treaty for the establishment of the East Africa Community (EAC) came intoforce on 7th July 2000. The EAC is a regional inter-governmental organisationcomprising five partner states; (i) the Republic of Burundi, (ii) the Republic of Kenya,(iii) the Republic of Rwanda, (iv) the United Republic of Tanzania, and (v) theRepublic of Uganda. The main objective of the EAC is to develop policies andprogrammes aimed at widening and deepening co-operation among the partnerstates.
Regional integration in the EAC, started with the signing of the Protocol for theestablishment of a Customs Union, in 2005. The Customs Union has liberalizedtrade among partner states, by eliminating some of the non-tariff barriers andharmonized trade formalities and customs procedures. Other notableachievements of the Customs Union include; (i) increase in cross border trade –trade between the five partner states increased from US$1.81 billion in 2004 toUS$5 billion by the end of 20131; and (ii) average revenue growth2 of 30 percentper annum since 2005 contrary to earlier concerns that the Customs Union wouldlead to loss in revenue.
In 2010, the five partner states signed a Common Market Protocol (CMP). TheCMP espouses for acceleration of regional socio-economic growth, through thefree movement of goods, persons and labour, the rights of establishment andresidence, and the free movement of services and capital. Key achievements inimplementing the CMP include; (i) operationalization of border posts on a 24 hourbasis, (ii) harmonization of immigration procedures, and (iii) waiving of the workpermit fees for EAC citizens3.
In 2013, the Protocol for the establishment of the East African CommunityMonetary Union was signed. The Protocol sets a framework for adoption of asingle regional currency and the establishment of an independent East AfricanCentral Bank, which will be responsible for price stability, financial stability andeconomic growth and development within the region.
To complement the region’s integration efforts, and address the problem ofoverlapping memberships in trade groupings, the EAC, COMESA and SADCformed the Tripartite Free Trade Area (FTA), in 2015. The rationale of the TripartiteFTA is to foster closer cooperation among the three Regional Economic

220
Africa, bank lending spreads, are about six to eight percent higher than in SouthAfrica, while banks’ return to assets is nearly three times as high13. There is a highpreference for liquidity in banks in all the partner states, as evidenced by the lowratio of net loans to assets (on average between 40 and 60 percent).
Nonetheless, in the last decade, commercial bank credit to the private sector, inall the partner states has grown by more 10 percent. The annual growth in creditto the private sector between 2002 and 2014 averaged 28 percent in Uganda,32 percent in Tanzania, and 15 percent in Kenya. In Rwanda and Burundi credit tothe private sector has grown at an annual average of 20 percent since 2005.
Mortgages (building, construction and real estate loans) comprise the largest shareof commercial total lending (between 15 and 35 percent) to the private sector, inall partner states. The growth of the mortgage industry in all the partner stateshas been modest, largely because of a lack of enough long-term funds within thedomestic banking system. However, there is a growing demand for mortgagelending to middle and high income groups, requiring loans of maturities of up to20 years. In Uganda, for instance, more than a half of the liabilities in the bankingsector (68 percent) are short term and do not exceed 30 days in maturity, whileliabilities with the longest maturity (greater than 12 months) only account for16 percent14.
Presently, the ratio of the mortgage debt to GDP in the partner states rangesbetween 0.3 and 2 percent, compared to less than one percent, a decade ago.Kenya has the most advanced and dynamic mortgage industry, with 37 financialinstitutions; a mortgage portfolio of US$1.5 billion, and 19 879 mortgage loans.Tanzania has the second most dynamic industry, with 19 financial institutions, amortgage portfolio of US$98 million, and 2 784 mortgage loans. In Uganda, fivebanks dominate in mortgage finance. The mortgage portfolio is estimated atUS$1.9 billion, with about 6 000 mortgage loans. In Rwanda, eight financialinstitutions offer mortgage finance. The mortgage portfolio is estimated atUS$68 million, and there are between 1 000 and 1 500 mortgage loans. InBurundi, three banks offer housing/real estate loans. The mortgage portfolio isestimated at US$52 million. There are about 1 600 mortgage loans.
Affordability
In all the par tner states, the cost of houses on the market, range betweenUS$40 000 and US$200 000. These houses are indeed expensive, and can onlybe afforded by less than 10 percent of the population15 in the region. In Rwanda,for example, only five percent of the population own houses in this price range.The high cost of construction (about 50 percent of the cost of the house) and thehigh cost of setting up the requisite support infrastructure16 (between 15 and25 percent of the cost of the house) are the reasons why current house pricesare not affordable to the majority of the population. With the cost of housesremaining high, more East Africans are being priced out of the real-estate marketand are instead looking to rent. In Uganda for example, 57 percent of thepopulation in urban areas rent, while in Kenya more than 75 percent of thebuildings under construction in urban areas are high-rise flats for rent17.
The irregularity of incomes of prospective homeowners also contributes to thelow levels of affordability of houses on the market. The informal sector is by farthe most important employer in all the partner states, supporting more than80 percent of the households, with irregular monthly incomes of below US$100.As such, these households are unable to access housing finance to invest in houseimprovement, house purchase or house completion. The terms at whichcommercial banks offer loans are not achievable; for example, several East Africansare not in salaried jobs while many earn below the required qualifying incomes(about US$ 700 per month) for mortgage loans.
The deposit requirements of up to 30 percent make mortgage finance inaccessibleto the majority of people without formal employment. In addition, collateralrequirements by lending institutions, including commercial banks, are a majorchallenge to many potential borrowers. The interest rates on mortgages are alsohigh, in range of 15 to 24 percent. In Kenya, the government is negotiating withlocal banks to reduce the interest lenders charge on mortgages to single digits, aspart of efforts to try to make purchasing a home affordable.
Housing supply
In varying degrees, all the five partner states face severe housing shortagesespecially in urban centres where shelter conditions are dire. In Kenya, governmenthas estimated an urban housing need of 150 000 dwellings a year, yet formalproduction is only 30 000 units, giving an annual deficit of 120 000 houses. InTanzania the annual demand for housing construction nationwide is estimated tobe 200 000 units. Uganda, has a housing deficit of 1.6 million units, 1.29 million inrural areas and 211 000 in urban centers. Rwanda’s annual delivery is estimated34 000 units.
Several factors account for this pressing housing challenge: high urban growth rates(average for the region is 22 percent), as a result of both rural-urban migration andnatural population growth (slightly over 3 percent per annum in each partnerstate) low incomes making it difficult, if not impossible, for the vast majority toafford the housing finance products typically on offer and weak housing marketsthat lack the capacity and capital to: (a) expand the supply of affordable housing;and (b) provide appropriate housing finance products.
Over 90 percent of existing housing is built incrementally by individual households,using own savings. Nonetheless, in the last decade, the region started attractingmodestly sized private real estate developers, to complement the governmentowned National Housing and Construction Companies, whose rate of delivery ofhousing has been very low. In Kenya, for example, the National HousingCorporation has developed 46 000 units in its entire 46-year lifetime18. In Uganda,the National Housing and Construction Company Limited has constructed lessthan 20 000 units in its 48 years of existence. Modestly sized private real estatedevelopers include Nationwide Properties (a construction arm of MukwanoGroup of Companies in Uganda) and Ultimate Developers Limited; however,because of the high debt exposure and the generally low demand for properties,they deliver fewer units than planned, annually19.
A major requirement in all five partner states is for developer finance to boosthousing supply in view of the low levels of formal housing production. PAHF, aprivate equity investment vehicle that is focused on sustainable development,provides risk capital on a joint venture basis to residential projects and also toprojects where commercial properties are combined with residential units.
Property markets
The residential property market in East Africa has registered significant growth,boosted by rapidly increasing consumerism, and the expansion of the middle class.A report by the African Development Bank estimates the size of the middle class –those spending between US$2 and US$20 a day – at about 29.3 million,representing an average of 22.6 percent of the population; 44.9 percent of Kenya’spopulation, 18.7 percent in Uganda, 12.1 percent in Tanzania, 7.7 percent inRwanda, and 5.3 percent in Burundi.
In the last five years (2010 to 2014), the high demand for quality infrastructure –well designed properties with great finishing and in safe and secure locations, bythe emerging middle class, led to a double-digit increase in the price of houses. Inthat period, there was a marked preference for apartments (of one to threebedrooms), compared to bungalows and maisonettes, because they are generallymore affordable. A three bedroom apartment costs between US$ 70 000 andUS$ 100 000, while a bungalow costs above US$ 150 000.
The ease of registering and transferring property in the region has also contributedto the growth of the residential property market. Notable reforms in theregistering and transferring property (i) Burundi made transferring property easierby creating a one-stop shop for property registration; (ii) Rwanda madetransferring property easier by eliminating the requirement to obtain a taxclearance certificate and by implementing the web-based Land AdministrationInformation System for processing land transactions; and (iii) Uganda madetransferring property easier by eliminating the need to have instruments of landtransfer physically embossed to certify payment of the stamp duty.
Huge investments in infrastructure, particularly the construction of road networks,connecting major towns to cities has catalysed the development of modestly sizedhousing projects (less than 300 units). However, these developments are targetingmiddle and high income earners, thus, creating a huge shortage of housing among

Africa Housing Finance Yearbook 2015
221
modest and low income earners. Real estate developers target middle and highincome earners, because, the high cost of land and construction materials, makesthe return on investment in low income housing projects meagre. Projectstargeting middle and high income earners make a margin of between 20 and30 percent, while low income housing projects make a margin of between 5 and10 percent.
Towards the end of 2014, to date, the demand for residential properties has beenlow. Exchange rate volatility and inflationary pressure have led to tightening ofmonetary policy and therefore a shift towards a high interest rates regime. Thehigh interest rates have contributed to a significant reduction in the demand forresidential houses, since they are purchased through mortgages.
Policy and regulation
All partner states, with the exception of Burundi20, have comprehensive policyand regulatory frameworks governing the housing industry and housing financesector. The policies and the frameworks are all pro-poor, and they delineate severalmeasures on how to address housing challenges in the partner states, includingexpanding the range of securities for accessing mortgages to include insurancepolicies, pension and provident funds and employer guarantees and also thedevelopment of housing finance products that cater to the needs of all incomegroups.
A major challenge however, has been inadequate implementation of the policies,and the low budget allocation to the Ministries of Housing, Lands and UrbanDevelopment. In Kenya, the Ministry Lands, Housing and Urban Development;receives only three percent of the national budget, similar to Rwanda, where theRwanda Housing Authority receives only two percent of the national budget. InUganda, the Ministry of Lands, Housing and Urban Development receives only0.2 percent of the national budget21, similar to Tanzania, where the Ministry ofLands and Human Settlements receives only 0.3 percent of the national budget.In Burundi, the Directorate of Land Management and Urban Planning receives lessthan one percent of the national budget.
Opportunities
Investing in alternative technology to deliver affordable housing, should bepromoted, in all partner states. Examples include the stabilized earth technology(ABT Select Brick and HydraForm stabilized earth blocks), which has the potentialto deliver cost effective building solutions that are less labour-intensive, and fast touse.
The establishment of the EAC Monetary Union (EAMU) should be fast tracked.The EAMU will help institute more stable and sustainable macro-economicenvironments within the partner states, including harmonizing interest rate policies.Other advantages of the EAMU include: (i) creation of a zone of economic,
monetary and financial stability; (ii) establishment and maintenance of sustainableand low risk debt budget financing mechanism; (iii) promotion of intra-regionaleconomic and financial system integration; and (iv)promotion of financial deepeningand inclusion.
The region’s insurance sector is a major source of long-term funds that should beadequately tapped into to develop the housing finance sector. However, the sectoris still underdeveloped, with a penetration (ratio of premiums underwritten to theGDP), estimated at less than four percent of GDP22. South Africa, in comparison,has a penetration rate of 14.2 percent, which is among the highest in the world23.The top five insurance companies in South Africa account for 74 percent of marketfor long-term insurance (life insurance)24, which they comfortably invest in long-term assets.
Sources
BDO (2015): A Synopsis of Kenya’s Insurance Industry – Opportunities forMergers and AcquisitionsIMF (2012): Assessing Bank Competition within the East African CommunityIMF (2015): South Africa Financial Sector Assessment ProgrammeKnight Frank (2015: Africa ReportKPMG (2014): Insurance in AfricaSociety for International Development (2012): State of East Africa; DeepeningIntegration and Intensifying ChallengesSociety for International Development (2013): State of East Africa – One People,One Destiny? The Future of Inequality in East AfricaWorld Bank Country Data (2014)World Investment Report (WIR) 2013 United Nations (2014): World Urbanisation Prospects
Websites
http://www.fsdt.or.tz/finscope/sites/default/files/pdfs/FinScope-Brochure-2013.pdf http://data.worldbank.org/indicator/NY.GDP.PCAP.CD http://esa.un.org/unpd/wup/Highlights/WUP2014-Highlights.pdfhttp://www.dawnpropertyconsult.co.zw/insight-east-africas-real-estate-sector/ http://asokoinsight.com/news/nairobi-residents-spend-40-per-cent-income-rent-kenya/http://www.theeastafrican.co.ke/business/USD17m-for-Rwanda-real-estate-/-/2560/1676040/-/y6rb1qz/-/index.htmlhttp://fas.imf.orgwww.beac.intwww.afribiz.infowww.imf.orgwww.wto.orgwww.doingbusiness.org
1 Society for International Development; 2013:State of East Africa2 This is mainly attributed to improved efficiency in revenue administration at border posts of partner states, including implementation of electronic cargo tracking systems to curb theft and diversion of goods
destined for markets.3 This is true for Kenya and Rwanda4 According to the Africa Development Bank5 World Bank Country Data (2014)6 In October 2014, Kenya joined the league of middle income countries, becoming Africa’s 9th largest economy, up from 12th, surpassing Ghana, Tunisia and Ethiopia. The other partner states are still categorised
as low income countries.7 In 2012, the service sector accounted for 47 percent of Kenya’s economy, marginally lower than it was in 2005. Agriculture’s share of the economy expanded from 24 to 26 percent between 2005 and 2012,
while that of industry shrank from 17 percent to 15.4 percent during the same period8 Burundi is expected to grow at 4.8 percent in 20159 World Investment Report (WIR) 2013 10 http://data.worldbank.org/indicator/NY.GDP.PCAP.CD 11 Society for International Development (2012): State of East Africa; Deepening Integration and Intensifying Challenges12 See United Nations (2014): World Urbanisation Prospects (http://esa.un.org/unpd/wup/Highlights/WUP2014-Highlights.pdf) 13 IMF (2012): Assessing Bank Competition within the East African Community14 Genesis (2009a)15 http://www.dawnpropertyconsult.co.zw/insight-east-africas-real-estate-sector 16 Developers invest in infrastructure to make housing estates more attractive to end buyers17 http://asokoinsight.com/news/nairobi-residents-spend-40-per-cent-income-rent-kenya/18 http://asokoinsight.com/news/nairobi-residents-spend-40-per-cent-income-rent-kenya/ 19 Annually, each developer had planned to develop between 3 000 and 5 000 units, during the last five years, however, because of the high debt exposure and the generally low demand for properties, particularly
in 2012 and 2013, the units delivered annually, per developer, slumped to between 500 and 1,00020 Burundi is in the process of developing a National Urban Planning and Housing Policy21 Calculations based on information presented in Budget Speech (2015/16) and Ministerial Policy Statements (2015 / 16) – Lands Housing and Urban Development Sector22 BDO (2015): A Synopsis of Kenya’s Insurance Industry – Opportunities for Mergers and Acquisitions23 KPMG (2014): Insurance in Africa24 IMF (2015): South Africa Financial Sector Assessment Programme

222

Africa Housing Finance Yearbook 2015
223
North Africa Regional Profile
According to the Global Competitiveness report (GCR 2014/2015), Morocco isranked the highest among North African countries in terms of competitiveness at72/144, followed by Algeria with a rank of 79/144, Tunisia 87/144, Egypt 119/144,and lastly, Libya 126/144 is ranked as the least competitive country in North Africa.
The housing finance sector in the region has long been dominated by state-ownedhousing banks, offering long-term loans on concessionary or heavily subsidisedterms, often crowding out market-based financing. All countries in North Africahave worked on expanding their mortgage systems in the past decade, movingtoward more market-based solutions. Housing finance is most developed inMorocco and Tunisia, where mortgage lending is equal to 17 percent and 12 percentrespectively of GDP, and continuing to expand at rates of between five to 11 percentper year. Access to housing finance in Morocco is enhanced through stateguarantees, targeted at different market segments.
Egypt was one of the first countries to reform its mortgage framework in 2001.More recently, other North African countries have taken concrete steps toestablish secure mortgage systems and improve access to secondary markets toenable long-term lending and greater access to housing finance for low incomegroups. For example, in March 2015, Morocco’s central bank published regulationsfor a Mortgage Refinance Company, which would promote secondary mortgagemarket activity and the availability of long-term finance. Credit ratings agencies arehelping to extend coverage for those in the formal sector by enabling banks tobetter understand risks in the market. Furthermore, Algeria has designedcomprehensive strategies to modernise its mortgage laws, but with limited results,as state housing finance programmes still dominate.
Housing microfinance is also growing in the region with a lot of support frominternational donors, particularly for the development of local SMEs. This form ofcredit access has the potential to provide a viable alternative to conventionalmortgage lending. Specific products for housing microfinance have emerged inTunisia, Egypt and Morocco. In 2014, Lafarge, an international building materialssupplier, announced a partnership with Al Amana and Attawfiq, two leadingmicrofinance providers to deliver housing microfinance solutions from US$200 toUS$6 000 to low income Moroccans.
Affordability
In spite of the high levels of homeownership (up to 80 percent in Tunisia, and over90 percent in Libya) and negative slum growth, affordability is a major problemacross North Africa, particularly for low and middle income households. Housingprices are rising in all North African countries. As a result, housing is becomingdifficult to afford due to steady demand and undersupply which caused a housingshortage. In Algeria, prices are rising and rental yields are expected to remainstable. In Tunisia, prices rose at eight percent per annum. In addition, Libya is facingthe same problem with significant undersupply which is hampering affordabilityand caused a shortage of about 350 000 to which the government is attemptingto respond with US$11 billion worth of large-scale residential projects in thepipeline. Furthermore, the cost of formal housing in Egypt exceeds the paymentcapacity of the majority of households.
As a result to these problems, the governments in North Africa are trying tointervene to make housing habitable, affordable and accessible to low incomeespecially in Morocco, Algeria and Egypt. In Morocco; the government has decidedto stand as guarantor which enables low income borrowers to borrow from banks.On the other hand, Algeria and Egypt are using other solutions such as buildingsocial housing units at low prices with payment facilities. In Algeria, The governmentis committed to building 1.6 million social housing units between 2015 and 2019..Housing price pressures are exacerbated by urbanisation from arid interior regionsto littoral cities, as well as the young population demographic of North Africa,which is pushing up demand for urban housing. Low affordability is having directsocial consequences, including overcrowding, with the number of occupants perhousehold as high as 5.5 in Algeria, as well as impacting the age for marriage as manyyoung people will wait until they can purchase their first home, before they marry.
Overview
North Africa has undergone a monumental transformation in the past few years,since the revolution of the Arab Spring that was set off by Tunisia’s ousting of BenAli in January 2011. The five countries that border the Mediterranean: Morocco,Algeria, Tunisia, Libya, and Egypt, are home to around 170 million people (16 percentof Africa’s population) with the region a prosperous one, responsible for producingone-third of Africa’s total GDP (around US$709 billion in 2013).
The economic outlook for North Africa in 2015 is more favourable than in2013/2014, as the region grew at three percent a year. The region recorded GDPgrowth estimated at 1.7 percent in 2014, illustrating a slight improvement in itseconomic performance (1.6 percent in 2013), compared to 3.9 percent for theentire continent. The regional GDP growth is projected at 4.5 percent and 4.4 percentin 2015 and 2016 respectively, on par with growth projections for the entirecontinent (4.5 percent in 2015). Tunisia’s revolution, which led to uprisings andrevolutions in both Egypt and Libya, as well as protests in Morocco and Algeria, haschanged the trajectory of the region.
Two major factors affected the overall macroeconomic outlook of the region. Onone hand, the continuous political transition process in Egypt, Tunisia and theinternational economic situation, marked by the drastic decline of oil prices sinceJune 2014, affected the economic performance of oil exporting countries (Algeriaand Libya); oil importers such as Egypt, Morocco and Tunisia have drawn moreadvantages in terms of their public finance, their trade balance and theircompetitiveness. To maintain competitiveness, central banks in Algeria, Egypt,Morocco, and Tunisia allowed their currencies to depreciate by four – eight percentagainst the U.S. dollar in the first three months of 2015. In trade-weighted terms,their exchange rates depreciated modestly.
Access to finance
In most North African countries, there is a long history of heavy state involvementin the financial sector. This tradition, combined with excess liquidity provided byoil wealth, macroeconomic instability and challenging bureaucracies, has hinderedthe development of financial systems in the region. However, the past decade hasprompted all countries to explore agendas for opening up of the banking sectorto more private sector and foreign participation, which is creating newopportunities, albeit at different rates of progress. In 2013 and 2014, Tunisiacontinued to prepare, with the support of the IMF, a series of financial sectorreforms focused on improving the soundness of the banking sector through therestructuring of three publically-owned banks. Across the region, monetary policyis focused on containing inflation (projected at 6.6 percent in 2015 and 6.4 percentin 2016), while supporting export diversification strategies (Morocco and Algeria)for more inclusive growth and more job opportunities in the region.

224
Housing supply
Both the number and the proportion of slum dwellers (from 20 percent of totalpopulation in 2000 to 13 percent in 2013) in North Africa have decreased in thelast twenty years. Egypt, Morocco, and especially Tunisia have been the mostsuccessful countries in this respect. These three countries reduced their collectiveslum populations from 20.8 million in 1990 to an estimated 11.8 million in 2010.The decrease is largely due to the successful implementation of housing policiesand programmes that have increased low income housing supply and systematicallyimproved slums and informal settlements.
Several countries have demonstrated a noteworthy improvement in affordablehousing and slum upgrading over the last two decades. Furthermore, many Africangovernments are gradually adopting and implementing policies and strategies aimedat making housing habitable, affordable and accessible which offers some promisefor expanding access to low and middle income households. While overall housingsupply may appear sufficient in most countries, housing prices on the private marketare quite high and there are a large number of vacant, high-end units, small rentalsectors and difficulty to access housing for lower-income households.
According to Econmonitor report, it shows that there is a positive outlook forhouses prices in Algeria Libya, Tunisia and Egypt. Furthermore, it shows that mostof North African countries suffer from undersupply in residential real estate likeAlgeria, Libya and Egypt, and only Tinisia is in balance between supply and demand.
Housing supply from the Net-Oil Importing Countries of North Africa (Morocco,Tunisia and Egypt) has pushed toward supporting a formal real estate sector andfacilitating private sector investment in the property market. Yet, affordable housingwhere profit margins are small and risks are high requires substantial governmentincentives, which have not been adequate in Tunisia, resulting in only the state-owned developer, SNIT, participating in the low income target market. In contrast,Morocco has been successful in offering attractive tax rebates and land atsubsidised rates to create a thriving private sector, and the government hascommitted to 900 000 additional units worth US$30 000 before 2020. Estimatesof the affordable housing shortage in Algeria range from 1.2 million to two milliondwellings based on an occupancy rate of five people per unit. They are alsoaddressing this supply shortage with large-scale housing construction, with 1.6 millionunits planned over the next five year term, from 2015 – 2019.
Across North Africa, most subsidies escape the poorest, and housing demand forlow income groups is delivered by the informal sector.
Property markets
A lack of private land supply is the main constraint In North Africa. Land is abottleneck in the supply chain and the main cause of high real estate prices inNorth Africa. Privately held land in Algeria, Libya and to a certain degree, Egypt,is a rare commodity relative to demand, which tends to magnify the pressure onprices and encourage speculation. Rigid land development regulations andcomplex registration procedures for titles have led to a scarcity of legallydevelopable land and have contributed to the region’s affordable housing shortfall.Most countries in North Africa ranked poorly in terms of property registration inthe World Bank’s 2015 Doing Business Report, with Morocco (115th), Algeria(157th) and Libya (189th) performing worst.
Price appreciation in the property market is becoming problematic, driven by alack of confidence in money markets or alternative investment opportunities. Thisis particularly severe in countries with limited capital markets and high volume ofoil wealth. Wealthy North Africans tend to invest in real estate as it is perceivedas the most secure store of money, particularly while the banking sector is weakand inflation is high.
Most property markets in North Africa have limited international integration, soare somewhat shielded from international financial dynamics. Morocco is theexception, with its markets being much more open to foreign direct investment.As a result, Morocco experienced more deeply the impact of the global financialcrisis and slow-down in the Euro-zone. To help policy-makers and investorsmonitor these dynamics and develop resilience in the property market, Moroccohas been the first country in the region to introduce a real estate price index thatis formulated quarterly by the Central Bank and National Land Agency.
Policy and regulation
Housing remains at the forefront of the agenda for most North Africangovernments. The link between affordable housing, economic development andsocial inclusion has been clearly recognised, particularly as many protests across theregion emphasize poor living conditions caused by failures in housing policy.
The housing sector in North Africa still tends to be over-regulated with the publicsector playing a primary role. Home-ownership is prioritised over rental oralternative tenure options, which has resulted in small rental markets. However,there is growing interest in lease-to-own programmes, such as those being usedand expanded in Algeria, to avoid the difficulties in accessing mortgage finance.
Net-Oil Exporters have committed large amounts of budget resources to responddirectly to housing demand and uphold constitutional mandates toward a citizen’sright to housing, crowding out private sector activities in the process. Net-OilImporters tend to have been more prudent and focused on development ofresilient and accessible financial systems, and implementing policies to increaseprivate sector investment in housing.
Opportunities
In 2015, the outlook is optimistic for much of North Africa. Improving theaffordability of housing is a priority for governments, who have all been assertivein preparing national housing policies and programmes, with varying degrees ofpriority placed on immediate delivery needs versus long term viability andsustainability. Yet, maintaining security in many of the countries of the regionremains the primary hurdle, before efforts toward diversifying and opening upeconomies and long-term policy reforms that will support affordable housingfinance will be able to gain any traction.
In the long-run, the regions real estate sector is expected to perform well andremain an attractive destination for investors. Future demand will be sustained bythe increasing urbanisation trend (at ±60% in 2013) and the commitment ofalmost all governments to provide financing for primary housing. Once securityconstraints are resolved, rising influx of tourists (71 million in 2013, up two percentyear-on-year) to the region (this figure is a collective for the Middle East and NorthAfrican region – known as MENA) will keep supporting the hospitality industryand attract top-retailers. Also, the large fiscal buffers (~3tn in sovereign wealthfunds) will sustain government spending in most economies, supporting economicgrowth and maintaining financial stability.
As North African countries stabilise and investor confidence returns, there arenew opportunities for developing cooperation and partnership within the region.An increasing openness to both knowledge exchange and economic integrationhas clear benefits, particularly in affordable housing, as many North African statesare facing similar challenges. Measures that facilitate the supply of land forresidential developments for low income groups or promote market-basedhousing finance solutions and private sector participation can be shared andtransferred between the countries of this region in order to strengthen eachindividual country’s efforts.
Sources
African Development Bank. (2013). The African Development Bank in NorthAfrica: Resilient Growth and Integration.African Economic Outlook (2014). AEO Regional Edition: North Africa. UN-HABITAT (2012). The State of Arab Cities. World Bank Group. (2014). Doing Business.World Bank, document for inclusive housing finance program
Websites
http://www.theafricareport.com/http://www.iut.nuhttp://www.afribiz.info/www.economonitor.comhttp://www.libya-businessnews.comwww.wto.orgwww.doingbusiness.org
Africa Housing Finance Yearbook 2015
225
Southern African Development Community (SADC)The Global Competiveness Report 2014/15 indicates that the top three factorsaffecting competiveness in the region include access to finance, corruption andinadequate supply of infrastructure. These are however being addressed throughthe RISDP. According to SAIIA, 2015 trade between SADC and the rest of theworld increased. 46.2 percent of exports out of SADC originate in South Africa.One major impediment to increased trade and economic growth in the regionremains the high cost of transport due to inadequate physical infrastructure anddelays at/or behind the-border barriers (SAIIA, 2015).
As part of an effort towards greater regional financial integration, increased tradeand competitiveness, SADC members have been exploring the possibility of asingle currency for the region by 2018.
According to PWC, 2014, to further support infrastructure development in Sub-Saharan Africa, the African Development Bank and EU launched the InfrastructureInvestment Programme for South Africa (IIPSA) in 2014. The intention of thisZAR1.5 billion fund is to provide alternative and innovative financing toorganisations that are undertaking infrastructure development projects in SouthAfrica or projects that cross two or more borders of SADC member countries.
Access to finance
While there are intentions for regional financial integration, the 15 member statesfunction as independent economies with their own, independent financial systems.As the largest economy in Africa, South Africa dominates, with 55.5 percent of theregion’s GDP. A number of South African lenders have extended to othercountries in the region. Standard Bank is licensed to operate in all of the SADCcountries. FNB is licensed in Botswana, Lesotho, Namibia, Swaziland, Tanzania,Zambia and Mozambique. Absa and its shareholder Barclay’s Bank operates inZambia, Tanzania and other countries. In 2011, there were 161 separate bankinginstitutions operating in the region, with 234 subsidiaries, thus in total there were234 bank licenses issued in SADC. Fifteen out of 161 banks have subsidiariesoperating in more than one jurisdiction while only eight banks have a presence inmore than five SADC countries. Select Africa, a regional housing micro lender,has its head office in South Africa but practices in Malawi, Mauritius, Uganda, Kenya,Lesotho, and Swaziland, and is building up operations in Tanzania and Mozambique.
According to FinScope (2015), 66 percent of adults in the region are financiallyincluded amounting to about 83.5 million people. Mauritius has the highestpercentage of financially included adults at 90 percent, followed by South Africa at86 percent and the lowest is Mozambique with 40 percent. While only 36 percentis banked, this is a significant increase from 24 percent in 2011, indicating progressin financial inclusion in the region. Still, exclusion rates are high at 34 percent(41.9 million people), hampering access to credit from formal institutions. Twelvepercent of adults rely on informal mechanisms and 18 percent use formal non-bank products/services. According to FinScope (2015) only 27 percent of adultshave insurance. Of the 83.4 million adults who are financially included in the region,about 53 percent say they have access to and use credit products. The numberof those who use credit for housing is not clear – certainly, mortgage exposure inthe region (outside of South Africa and Namibia) is very low. The mortgagepercent to GDP ratio ranges from 0.14 percent in Mozambique to 6.59 percentin Botswana and 22.54 percent in South Africa.
Findex 2014, explores use of loans for housing (whether they are secured orunsecured was not specified in the questionnaire). The percent of adults over theage of 15 that had an outstanding home loan in the SADC region ranged from1.53 percent in Zimbabwe to 9.63 percent in Botswana and 15.22 in Mauritius.This number may be low for various reasons – it may reflect that householdsfinance their housing not with credit but rather with their savings, or thathouseholds who use credit use personal and unsecured loans where the housingpurpose is unspecified. Further analysis in this regard is clearly needed.
The SADC Banking Association, which was established in 1998, aims to coordinatebanking related activities throughout the region to ensure acceleration ofdevelopment. The advanced financial system in South Africa has been identified
Overview
The Southern African Development Community (SADC) has its origins in theSouthern African Development Coordination Conference (SADCC), which wasestablished in 1980. In 1992, the member states signed the declaration and treatyestablishing SADC as a replacement to the SADCC. Currently SADC has 15 memberstates: Angola, Botswana, Democratic Republic of Congo (DRC), Lesotho,Madagascar, Malawi, Mauritius, Mozambique, Namibia, Seychelles, South Africa,Swaziland, United Republic of Tanzania, Zambia, and Zimbabwe. The vision ofSADC is for a regional community in which the people of Southern Africa canrealise economic well-being, improved living standards and quality of life, freedom,social justice, peace and security. SADC’s mission is to “promote sustainable andequitable economic growth and socio-economic development through efficientproductive systems, deeper co-operation and integration, good governance, anddurable peace and security, so that the region emerges as a competitive andeffective player in international relations and the world economy”.
Two strategic frameworks guide SADC’s operations and provide SADC memberstates with a comprehensive programme of long-term economic and socialpolicies. The Regional Indicative Strategic Development Plan (RISDP) whichprovides a governance framework that sets standards for good political, economicand corporate governance. The Strategic Indicative Plan for the Organ (SIPO)focuses on the maintenance of peace and stability in the region. A SADCSecretariat, which oversees the implementation of these plans, is based inGaborone, Botswana.
With a population of nearly 294 million in 2014, almost 70 percent of SADCresidents live in poverty. 39 percent of the population in the region is urbanised.According to the IMF, GDP is expected to grow to 3.8 in 2015 from 3.4 percentin 2014. GDP per capita is expected to increase to 1.7 percent in 2015. SouthAfrica dominates the region economically, accounting for 41 percent of SADC’stotal trade and 55.5 percent of SADC’s GDP in 2013, followed by Angola at13.6 percent. For the SADC region in general, the services sector makes up morethan half of the GDP, and is the main driver of regional growth, followed by industryat 31 percent and agriculture at 13 percent. These vary per country.

226
as playing a pivotal role in strengthening the region’s financial system. Due toSouth Africa’s role in the region, the country has been given the responsibility tomanage the SADC sub-committees that deal with regional integration of thefinancial sector. Furthermore, the SADC Protocol on Finance and Investment (FIP)remains the key instrument to facilitate regional integration and aims at making theSADC region an attractive destination for FDI and regional investment. In thisregard the harmonisation of tax policies, macroeconomic convergence in theregion, liberalisation of capital and current accounts as well as harmonisation of theCentral Bank’s policies amongst other issues.
The credit information infrastructure in the region is developing. A studyundertaken in 2011 found that nine SADC member states had either a private orpublic credit register that reports both positive and negative credit data on firmsand individuals. South Africa’s and Zambia’s regulatory framework is the mostdeveloped, while Angola and Mauritius have fairly well structured regulatorystandards under the central bank in those countries. Madagascar, the Seychellesand the DRC have neither private nor public registries in place – although theDRC does have a manual public register that works inefficiently. Namibia andSwaziland both have private sector credit bureaus in operation and both havedraft bills in place to license and regulate these entities. In February 2015, theGovernor of the Bank of Namibia launched the Namibia Data Sharing Alliance, topromote responsible financing. Both Malawi and Tanzania are in the process ofestablishing regulated credit sectors and have passed a Credit Reference BureauAct. Lesotho and Mozambique are also working towards this goal, investigatingways to set up regulatory frameworks.
In addition, Southern African Microfinance Project (SAMP) was set up to addresslimited access to financial services through the development of microfinance. Thisis done through policy and regulatory environment intervention. It also aims tounderstand investor requirements so that there is support at a local level to attractinternational microfinance.
Affordability
While GDP per capita in the region has been growing, levels of inequality remainhigh. South Africa, Angola and Namibia are among the most unequal economiesin the world. Seychelles, Lesotho, Botswana and Zambia are not far behind. Manypeople within the region live in inadequate housing. According to UN-HabitatState of the Cities report 2012/13, in 2009, over sixty percent of the urbanpopulation in most countries in SADC lived in slums, with the exception ofZimbabwe, South Africa and Namibia.
Levels of housing affordability across the region, and even in South Africa (whereabout 80 percent of the population cannot afford the cheapest, newly built houseby a private developer), are quite low. The 40 percent drop in oil prices sinceJune 2014, and the 30 percent drop in metals, has put increasing pressure onaffordability in 2015. At the same time, Finmark Trust (2014) has shown thatremittances are one of the key products used by the poor to support dependents,and cross border transfers from South Africa to other SADC countries have beenidentified as some of the most expensive channels globally. To address this, FinMarkTrust has been working with regulators and the private sector in Lesotho toreduce the costs of cross-border remittances – bringing the charge down toZAR 9.00 (less than US$1.00) per transaction, between Lesotho and South Africa.
The prices of the cheapest newly built houses by a private developer in the SADCregion range from about US$12 718 in Swaziland to US$31 000 in Mauritius,US$65 000 in Zambia, and US$200 000 in Angola. Angola and Seychelles wereamong the most expensive new, formal housing markets found this year. Atcurrent lending rates, only 2.2 percent of the Angolan urban population couldafford to buy the US$200 000 house; average income in Angola’s urban areas isonly nine percent of what is needed to afford that house.
Generally, formal housing supply is targeted at the upper income and expatpopulations seeking housing, with very little being built for the working poor. Onaverage, a 50 kg bag of cement costs US$6.41 for the SADC region, ranging fromUS$6 in Mozambique to US$23.40 in DRC and US$11 in Malawi.
Housing supply
Housing backlogs in countries within the SADC region range from an estimated2.1 million in South Africa; two million in Madagascar, Mozambique and Angolarespectively; to 100 000 units in Namibia. Zambia estimates that it will have abacklog of 3 million units by 2030, if no interventions are undertaken. ThePermanent Secretary for the Eastern Province suggested that an annual deliveryrate of 120 000 units was needed in order to address the situation. While thereare many government-led housing initiatives in the SADC region, housing supplyis largely insufficient.
According to International Housing Solutions, governments in SADC often focuson the poorest segments of the population while most private sector buildersfocus on the luxury end of the market, creating what is known as the gap market.The key challenge facing all countries in the region is how to promote affordablehousing delivery by the private sector, such that the state can better focus onaddressing the needs of the poorest segments of society.
South Africa has the most comprehensive subsidised housing programme in theregion. The national housing subsidy is targeted at about 50 percent of thepopulation in terms of household income. Recently, however, numerous politicianshave highlighted that the programme is not sustainable in the long term. In recentyears, the cost of the subsidised house, which is given away for free to qualifyingbeneficiaries who earn less than ZAR3 500 (about US$267) a month and havedependents, is estimated to be between ZAR150 000 – ZAR200 000 (US$11 459– US$15 279). If this house were constructed just for the 2.3 million householdsestimated to comprise the national housing backlog, this would require a total stateinvestment of above ZAR315 – ZAR420 billion (US$24 billion – US$32 billion).Even in a country as rich as South Africa, and even if spread over a longer periodof time, this is not a sustainable proposition, and it creates all sorts of unintendeddistortions in the property market that undermine the capacity even of lower-middle income earners to meet their own housing needs. Lower-middle andmiddle income earners in the region need to be able to engage in the housingmarket in an affordable way, purchasing a stand or an entry level, basic unit.
In Angola, government led housing delivery has inadvertently targeted the higherend of the market even with subsidized mortgages. Kilamba, one of the largesthousing developments on the continent, is a mixed-use development covering 5 000hectares housing over 70 000 people in about 20 000 units. Kilamba had very slowtake up rates due to entry level houses being too expensive and the difficulty inaccessing finance. The supply of this mass housing project was financed by theChinese in exchange for oil from Angola.
In a number of countries in the region, state-owned or supported housing deliveryentities have a mandate to work explicitly in the low-middle income target market,but many struggle to extend as far down market as their targets suggest theyshould. The Malawi Housing Corporation and Botswana Housing Corporationare the main housing developers in those countries, and there are similarcorporations in Lesotho, Tanzania, Namibia, and Swaziland.
A number of South African firms are also exploring opportunities north of theirborders, some in the SADC region. Basil Read, the developer for South Africa’sCosmo City (a mixed income, mixed use settlement with approximately 12 300units north of Johannesburg), has an international development arm, and OldMutual’s Housing Impact Fund has also been exploring opportunities. Furthermore,JSE-listed residential property developer, Calgro M3, has been awarded a tenderand committed ZAR812 million (US$60.8 million) to supply 1 000 low cost housesin Namibia.
In 2014, the IFC, World Bank and the National Housing Finance Corporation ofSouth Africa announced investments of more than US$63 million in InternationalHousing Solutions IHS Fund II, which will support the development of affordablehousing in South Africa and Sub-Saharan Africa (especially Southern Africa). IHSFund II expects to secure more than US$300 million in funding commitments toinvest in multi-unit and stand-alone housing developments in South Africa andGhana, and possibly other target markets under the right conditions. Marketsunder consideration include Zambia, Botswana, Namibia and Mauritius. UnderIHS’s first fund, the SA Workforce Housing Fund enabled the development ofmore than 28 000 units with a combined total value of more than US$8.6 billion.
Africa Housing Finance Yearbook 2015
227
Policy and regulation
A key issue of focus for SADC Member States in the past few years has been theFinance and Investment Protocol, which was entered into by the SADC MemberStates to give legal and practical effect to their commitments under the SADCTreaty. It was signed in August 2006, and has two overarching objectives. First, itseeks to improve the investment climate in each Member State; thereby catalysingforeign and intra-regional investment flows. Secondly, it seeks to enhancecooperation, coordination and harmonisation in domestic financial sectors in theregion.
The implementation of the FIP has been rather slow going – by 2011 only sevenMember States had implemented over 50 percent of their country commitmentsunder the protocol. When it comes to actual regional integration, only 14.3 percentof commitments have been achieved. More recently, however, with support fromthe FinMark Trust and other players such as the GIZ, the implementation of theFIP has been receiving increasing attention particularly in the areas of retailpayment systems, harmonisation of insurance regulations and improving creditinformation sharing across the region.
Housing policy across the region is at various stages of implementation. SouthAfrica has a highly developed policy, as its promotion of a subsidised housingdelivery programme is a cornerstone of the ruling party’s development strategy.South African Human Settlements Minister Lindiwe Sisulu has pledged to facilitatethe delivery of 1.5 million housing units within the five years of her term of office,to 2019. This target includes both fully subsidised housing and “affordable market”housing, in which a subsidy is combined with loan finance for lower-middle incomeworkers. It also includes a focus on informal settlement upgrading and rental andsocial housing. In terms of the Medium Term Strategic Framework, the humansettlements department is committed to revising the finance framework forhousing in South Africa. Policy recommendations to this effect have not yet beenreleased for comment, however.
In other countries, policy developments are also underway. In Namibia forexample, the government aims to eradicate poverty through increased investmentin the housing and eliminate all informal dwellings in line with Vision 2030. InZambia, a draft housing policy is being considered by the national government –however, this has been the situation for some time. Housing features strongly inMozambique’s five year strategy (2010 – 2014), and is also a key area of focus inTanzania, especially given the World Bank initiative with the Bank of Tanzania topromote housing finance markets in the country. Malawi originally drafted aNational Housing Policy in 2007, which is still under review. The policy advocatesfor broad access to housing for all, decentralisation, improving urban land markets,upgrading informal settlements and improving the quality of rural settlements.Resolution with respect to this policy is expected soon. UN Habitat has alsorecently published overviews of housing in Zambia and Zimbabwe. The policyflux in many countries undermines investment especially by international orregional housing developers and financiers who are seeking new markets. Nationalgovernments would do well to promote a clearer housing approach in theircountries to facilitate the attention of this potential capacity.
The SADC Industrialisation Strategy and Roadmap 2015 – 2065, approved in April2015, seeks to achieve economic transformation by encouraging regionalintegration and economic and technological transformation through enhancing itscompetitive and comparative advantages. This has direct connotation for housingand human settlement development as increased employment generating activitywill further increase demand for housing. Further, diversifying the economy andincreasing production rates will create an attractive investor destination. This willin turn spur demand for accommodation.
Property market and opportunities
In the World Bank’s 2015 Doing Business Report only six out of the 15 countriesimproved their position in the Doing Business ranking, namely Lesotho, Malawi,Mozambique, Namibia, Swaziland and Tanzania. With regard to registeringproperty, only the DRC has decreased the number of procedures in 2015. Fiveof the countries in the SADC region have decreased the time in days to registerproperty and four countries show a decrease in the cost to register property.
According to the Global Competiveness report, Mauritius is ranked as the mostcompetitive country in the SADC region, followed by South Africa, Botswana andNamibia.
SADC Investment Promotion Agencies are responsible for the promotion offoreign direct investment in their respective countries.
n Angolan Agency for Private Investmentn Botswana Investment & Trade Centre (which is the merged entity between
IFSC and BEDIA)n National Agency for Investment Promotionn Lesotho National Development Corporationn Malawi Investment Promotion Agencyn Board of Investmentn Investment Promotion Centren Ministry of Trade and Industryn Seychelles Investment Bureaun Department of Trade and Industryn Swaziland Investment Promotion Authorityn Tanzania Investment Centren Zambia Development Agencyn Zimbabwe Investment Agency
In general, member states have been undergoing policy reforms and therefinement of investment processes, which have improved their respective businessenvironments such as establishing investment promotion agencies, improvinginvestor protection and increasing the transparency of investment codes andpolicies. South Africa, Angola and Mozambique are major recipients of Foreigndirect investment (FDI) in the SADC region. Mauritius and Seychelles aredominated by real estate investment as opposed to oil and gas, which dominatesthe Angolan economy. While primary trade connections are dominated by theUnited States, China, the European Union and India, India shows the largest amountof FDI from a developing country perspective. SAIIA, 2015 shows that the realestate sector attracts the third highest FDI inflow into the SADC region atUS$18 027.5 million in 2014, preceded by coal, oil and gas and metals.
Increased cross border investment and attention is being paid to the SADC regionmakes it an attractive investment destination. This is coupled with advancedinfrastructure development in most countries. The US$3.5 million cross borderinvestment by the DBSA (SADC’s Project Preparation and Development FacilityFund manager) toward a Regional Interconnector Transmission Line Project whichruns through Mozambique, Zimbabwe and South Africa demonstrates increasedinvestment into the region. This also demonstrates regional interconnectivity.
Sources
African Economic Outlook (2013). Regional Edition / Southern Africa, 2013.AfDB, OECD, UNDP, ECA.African Economic Outlook (2015). South Africa. Demirguc-Kunt, Asli and Klapper, Leora (2012). Measuring Financial Inclusion:The Global Findex. World Bank Policy Research WP 6025.Finmark Trust (2015). Financial Inclusion in the SADC Region.McKeever, K., (2008). Regional Institutions and Social Development in SouthernAfrica. Annual Review of Sociology, 34:453–73 accessed 20 May 2012. Microfinance and Poverty Reduction in the SADC Region. 2008. Accessedfrom: http://www.docstoc.com/docs/36476656/Microfinance-and-Poverty-Reduction-in-the-SADC-Region-SUMMARY, date 25 May 2012.PWC (2014). Capital Projects and Infrastructure in East Africa, Southern Africaand West Africa. Regional Economic Performance in 2011 and Medium-term Prospects, TIFIDirectorate, 2012, accessed from:http://www.sadc.int/files/1613/3044/5755/Economic_Performance_2011_and_Medium_Term_Prospects.pdf.SADC Banking Association, accessed from:http://www.sadcbanking.org/index.asp, date 24 May 2012.
228
Websites
www.banking.org.zawww.doingbusiness.org www.finmark.org.zahttp://www.finscope.co.zawww.sadc.intwww.sanews.gov.zahttp://www.trademarksa.org/news/doubts-sadc-mulls-over-single-currencywww.worldbank.org http://www.finmark.org.za/project/samp http://www.finmark.org.za/wp-content/uploads/pubs/FACTsheet_FinInclusionSADC_20151.pdf http://www.saiia.org.za/doc_view/810-sadc-investment-perspectives-in-a-changing-international-investment-landscapehttp://www.dbsa.org/EN/NEWS/Pages/SADC-approves-more-than-US$3m-towards-regional-interconnector-project.aspx

Africa Housing Finance Yearbook 2015
229
The West African Economic and Monetary Union WAEMU (UEMOA)Access to finance
The formal financial system is developing and the banking system is concentratedin three to five commercial banks in the majority of the countries. Althoughfinancing entrepreneurial activities and housing remain challenging, manyprogrammes promote the banking system in the union. Banque Centrale desEtats de l’Afrique de l’Ouest (BCEAO) is a unique central bank for the eightcountries and governs the financial institutions across the union. The BCEAOheadquarters are in Dakar, Senegal, and each country has a national agency. In thelast decade, most countries in the region witnessed an increase in the number ofcommercial banks and microfinance institutions operating.
The housing finance market in UEMOA countries is under-developed. Few long-term mortgage vehicles exist and in most cases belong to government. Only a fewof the member countries have mortgage banks, among which are Banque del’habitat du Bénin, created in 2003 with operations starting in 2004; Banque del’Habitat du Burkina Faso, created and with operations starting in 2005; Banque del’Habitat de Côte d’Ivoire, created in 1994; Banque de l’Habitat du Mali created in1996; Banque de l’Habitat du Niger created in 2010 and not yet operating; andBanque de l’Habitat du Senegal (BHS) created and operating since 1979. BHS isthe most active of the mortgage banks of the union and represent 50 percent ofthe demand for mortgage authorised in 2014 and 30 percent of the disbursed loan(CFA60.4 billion) (US$ 101.82 million). The average interest rate in the union is7.44 percent and Senegal has the lowest rate (6.81 percent).
To promote mortgage activities and access to mortgage a regional mortgageinstitution, Caisse Regional de Refinancement Hypothecaire-UEMOA (CRRH-UEMOA), was created in 2010 as a result of efforts deployed by the BCEAO,BOAD and Conseil Regional de l’epargne publique et des marches financiers(CREPMF). The mission of the new institution is to promote easy access to long-term financing to commercial banks (its members) to enable them to financehousing loans. The total capital of CRRH–UEMOA is CFA Francs 3 426 million,60 percent of which belongs to financial institutions of the union, 15 percent toShelter Afrique and 25 percent to BOAD. The CRRH headquarters are in Lome,Togo. The new regional institution goal is to promote mortgage developmenturgently needed in the UEMOA countries.
CRRH-UEMOA, as expected, is reinforcing the capacity of commercial banks,unleashing construction activities, fostering housing development, generatinginvestments, employment opportunities and raising incomes, as currently illustratedby the number of members’ banks (shareholders), now 46, its success in theregional stock exchange, and the projects financed.
The governments of all the member states are promoting housing finance further,through different mechanisms. Among these are the establishment of mortgagebanks and housing development agencies, as well as fiscal incentives for privatecompanies and developers. Some commercial banks, members of CRRH are nowpromoting housing loans to individuals.
Affordability
In spite of the economic growth of the union, affordability is still a challenge anddepends on each country’s economic environment. In most cases the majority ofthe population who lives with less than US$2 a day has little or no capacity tofinance their homes. To address these affordability realities, some initiatives arebeing implemented, among which is the creation of the regional mortgage fundsCRRH and other plans to secure funds at competitive prices in the financialmarkets. The creation of CRRH has facilitated access to financing for its membersthus ameliorate banking conditions for mortgage loans.
To boost affordability each member state has a series of housing projects and fiscalincentives to foreign and local investors. There are incentives to promote the localsmall and medium enterprises among which are the mutual funds for housing inSenegal, allocation of land for free, fiscal incentives and reforms in registration ofproperty.
Overview
The West African Economic and Monetary Union (Union Economique etMonétaire Ouest Africaine, UEMOA) is a regional organisation of eight WestAfrican countries (Benin, Burkina Faso, Cote d’Ivoire, Guinea-Bissau, Mali, Niger,Senegal and Togo). They share the same money, West African francs (CFA Francs),monetary policies, and French as an official language. The objective of the unionis to promote regional economic integration and create a common market. Benin,Cote d’Ivoire, Guinea-Bissau, Senegal and Togo are on the coast of West Africawhereas Burkina Faso, Mali and Niger are landlocked countries. The climate rangesfrom warm and humid on the southern coast to dry and hot in the semi-aridcountries. The economy is predominantly agricultural. Cocoa, coffee, timber,cotton, onions, sesame seeds, Arabic gum and cashew nuts are among the cashcrops produced and exported by the union. Cote d’Ivoire, which represents thelargest economy of the union, has some manufacturing activities. Other economicactivities include fishery, livestock, mining, oil and gas.
Prior to 2010, on average, the population of the coastal countries mostly live in theurban areas, compared to the landlocked countries where the population isprimarily rural but today the rate of urbanisation of each country of the union isaccelerating. The average urban population of the union has practically doubled,from 19.8 percent of the total population in 1975 to 34.3 percent in 2013. Insome of the urban centres particularly in Abidjan the annual urbanisation rate is4.6 percent. The fastest growing urban areas include Abidjan, Dakar, Lome,Cotonou, Bamako, Niamey, Bissau and Ouagadougou.
Real GDP growth rose from 5.9 percent in 2013 to 6.5 percent in 2014 as a resultof good agricultural harvest, execution of some regional and national socioeconomic infrastructures and improvement in political stability of some of themembers’ countries. A peaceful election in Cote d’Ivoire in 2015 is a good signfor the economic growth of the union however there is concern for politicalstability of the landlocked countries among which are Burkina Faso that witnesseda Coup d’Etat in 2014 and another Coup d’Etat this year. The insecurity in thenorthern part of Mali and north east of Niger is also of great concern. The unionhas minimized the average annual inflation rate to -0.2 percent in 2014 from1.5 percent in 2013.
230
Apart from individual action to boost affordability the union has adopted commonmeasures among which are the reinforcement of the capacity of the mortgagebanks, the promotion of savings for housing and promotion for mortgageguarantee. In spite of the different programmes there is a need to support theprivate sector to develop affordable housing finance appropriate to the income ofthe majority in the UEMOA countries.
Housing supply
Housing supply differs from one country to the other but overall it is stilldominated by incremental, self-construction and informal entrepreneurs. Some ofthe upper-middle class use the services of government housing developmentagencies and to some extent private developers. They live in the residential zoneand the very poor live in slums. There is very little data on the stock of houses inthe union.
The housing supply is insufficient to meet the demand in all of the UEMOAcountries. The population growth rates of the eight countries are among thehighest in the world and the rate of urbanisation is growing in all of the membersof the union. To face this challenge, some of the presidents have establishedambitious housing programmes as part of their presidential campaigns. AlhassanOuattara of Cote d’Ivoire has a programme of 50 000 houses for five years at arate of 10 000 houses a year ; Issoufou Mahamadou of Niger has promised morethan 40 000 houses all over Niger. Cote d’Ivoire started implementing itsprogramme in January 2012 by laying the foundation of 2 000 social houses inYoupogon and Riveria, among the most popular streets in the capital. Out of the50 000 units of affordable homes promised by President Alhassan Ouattara ofCote d’Ivoire only a few have been supplied by the end of 2014. To accelerate theprocess and meet the deadline of 2015, the government is mobilising allstakeholders; the same is true for President Issoufou Mohamadou of Niger.
Also, as a result of the union’s economic growth, and the support of CRRH, mostcommercial banks of the union and private developers have different housingschemes. The impact cannot be measured as there has been little or no deliveryup till December 2014.
The governments of the union are focusing their efforts in improving the businessenvironment and sourcing foreign investment to develop urban infrastructure andhousing. To this end the UEMOA is initiating a series of investment forums tosource diversified investors. It is expected that the result of the efforts and thesuccess of CRRH will favour the emergence of mortgage activities and boosthousing supply across the union.
Property market and opportunities
The UEMOA countries are witnessing some social and economic changes dueprimarily to the economic boom and political reforms. The economic boom itselfis due to economic reforms, the demand for natural resources, and thedevelopment of infrastructure such as roads and telecommunication, whichfacilitate improved access to rural areas. As a result, there is high demand for landand properties. Political reforms such as decentralisation, high demand for land anddevelopment of roads is accelerating the urbanisation of villages around the capitaland other internal cities. Today there is an emergence of new cities in all thecountries in the union. There are different incentives to stimulate local and foreigninvestors to participate in the development of housing and other urbaninfrastructures.
The economic boom is positively affecting the UEMOA countries and the GDPgrowth rate is improving. Each member state has housing on the priority list ofits agenda and the government is promoting public private partnerships forhousing development and fiscal incentives for businesses. The union is witnessingthe arrival of some African giants of the sector among which are Dangote groupto produce cement in Niger and some other countries in the union; the Adohagroup, a Moroccan group in housing development is now present in Cote d’Ivoire.The return on investment is very high given the prices of rents in the residentialquarters of some of the cities especially in the capital.
All the available data on the stock of houses in the union indicates a gap betweensupply and demand. The different development programmes, such as urbaninfrastructure, electrification of new cities and rural areas, housing as well as therate of urbanisation and the population growth rate (both high), are indicators ofopportunities for the housing finance and housing development sectors, especiallyin the low income bracket.
Policy and regulation
There have been reforms in land administration, but the registration of propertiesto obtain full ownership rights – Titre Foncier – remains a challenge in all UEMOAcountries. The CRRH-UEMOA has proposed to undertake a regional study ofthe different regulations concerning full ownership rights in all its membercountries with a view of proposing a unique document recognised and acceptedby all the member states. There is no information regarding the study up tillSeptember 2015.
The World Bank’s 2015 Doing Business Report indicates that some difficultiespersist. The difficulties encountered will hopefully be addressed by Sheida, theland and registration reform system adopted by the union in 2006 to simplify theprocess of obtaining full ownership title.
Sources
AfDB, OECD, UNDP, UNECA (2013). African Economic Outlook 2013African Economic Outlook 2014Capital Finance (2012). Housing Project Capital Finance, Niger 2012.CIA (2013). The World Factbook.Economic Commission for Africa (2013). African Statistics Pocketbook 2013.l'Institut National de la Statistique (INS-Niger) (2010). La Population du Niger en2011INS-Niger (2011). Bulletin Trimestriel de Statistiques Premier Trimestre 2011.UN-Habitat (2007). Profil Urbain National du Niger 2007.UN-Habitat (2007. Profil Urbain de Ouagadougou 2007.UN-Habitat (2008). Profil Urbain National du Sénégal 2008.UNDP (2014). Human Development Report 2014. Statistical Index.World Bank Data World Bank (2014). Doing Business 2014World Bank and IMF (2010). Niger Financial Sector Assessment Programme April2010.
Websites
www.unhabitat.orgwww.data.worldbank.orgwww.undp.orgwww.cia.govwww.bhci.ciwww.bhs.snwww.bhm-sa.comwww.francesenegalimmo.comwww.bhb.bjwww.bceao.intwww.africaneconomicoutlook.orgwww.afdb.orgwww.uneca.orgwww.lesoleil.snwww.imf.orgwww.oecd.orgwww.wikipedia.orgwww.seneweb.comwww.leral.netwww.ccrhuemoa.org

‘Making financial markets work for the poor’ for over a decade by
n Identifying systemic constraints and opportunities for inclusive growth
n Facilitating and catalysing the next generation of development around
access to financial services
n Harnessing the power of markets to provide goods and services to poor
households on a sustainable basis
Take financial inclusion agendas from commitment to action
Enable, facilitate and identify changes to promote financial inclusion
Utilise lessons learnt to frame the regional agenda
Prioritise research and expertise to shape debate around financial inclusion
Inform decision-making for pro-poor growth and development
Beyond 2015
2002 – 2005
2005 – 2010
Making financial inclusion happen in Southern Africaand beyondCURRENT
2010 – 2015
2015 – 2020
Evolution of FinMark Trust since 2002 and way forward
Identification of keyobstacles for financialservices to reach thelow income populationin South Africa
Support pro-accesspolicy change andcommercial innovationwithin and outsideSouth Africa
Focus on regionalfinancial integrationwithin SADC
SADC to global
Credit fordevelopment
Paymentsand distribution
channels
Responsiblefinance
Managingrisk
Informationand research
(FinScope)
Data facility:Clients at the
centre
Regional financial
integration andFinancial inclusion
Extending the benefits of financial inclusion
Programme and theme structure
Tel: +27 11 315 9197 | Fax +27 86 518 3579 | www.finmark.org.za | www.finScope.co.za
n FinMark Trust footprint

FSD Africa is pleased to support CAHF in its workin promoting housing finance in Africa.
Financial Sector Deepening Africa (FSD Africa) – www.fsdafrica.org – is a non-profit
company, funded by the UK’s Department for International Development, which promotes
financial sector development across sub-Saharan Africa. It is located in Nairobi, Kenya.
FSD Africa sees itself as a catalyst for change, working with partners to build financial
markets that are robust, efficient and, above all, inclusive. It uses funding, research and
technical expertise to identify market failures and strengthen the capacity of its partners to
improve access to financial services and drive economic growth.
FSD Africa is also a regional platform. It fosters collaboration, best practice transfer,
economies of scale and coherence between development agencies, donors, financial
institutions, practitioners and government entities with a role in financial market development
in sub-Saharan Africa. In particular, FSD Africa provides strategic and operational support
to the FSD Network.
FSD Africa believes strong and responsive financial markets will be central to Africa’s
emerging growth story and the prosperity of its people.
If you are interested in working with FSD Africa then please email: [email protected]
www.fsdafrica.org

The IFC supports the growth of the private sector
in Africa with investments and advisory services.
IFC is pleased to support the sixth edition of the Africa Housing Finance
Yearbook, written and published by the Centre for Affordable Housing
Finance in Africa.
In 2015, IFC continues its support for housing finance, with new
and ongoing investments and advisory work in the West African
Economic and Monetary Union, Nigeria, Tanzania, Kenya, and
Rwanda.

US$60 millionThe cumulative value of loan approvals
US$50 millionShelter Afrique funds raised from African capital markets and International markets into affordable housing
Financing Affordable Housing in 44 African countries for over 30 years
www.shelterafrique.org [email protected] +254 204978000
Financing AfHousing in 44 Afcountries for over 30 years
fordable Financing African Housing in 44 Af
countries for over 30
fordable rican
countries for over 30
US$50 millionShelter Afrique funds raised from African capital markets and International markets into affordable housing
years
US$50 millionShelter Afrique funds raised from African capital markets and International markets into affordable housing
Shelter Afrique funds raised from African capital markets and International markets
US$60 millionThe cumulative value of loan approvals
US$60 millionThe cumulative value of loan approvals
The cumulative value of loan approvals
[email protected] +254 204978000
[email protected] +254 204978000
+254 204978000
+254 204978000
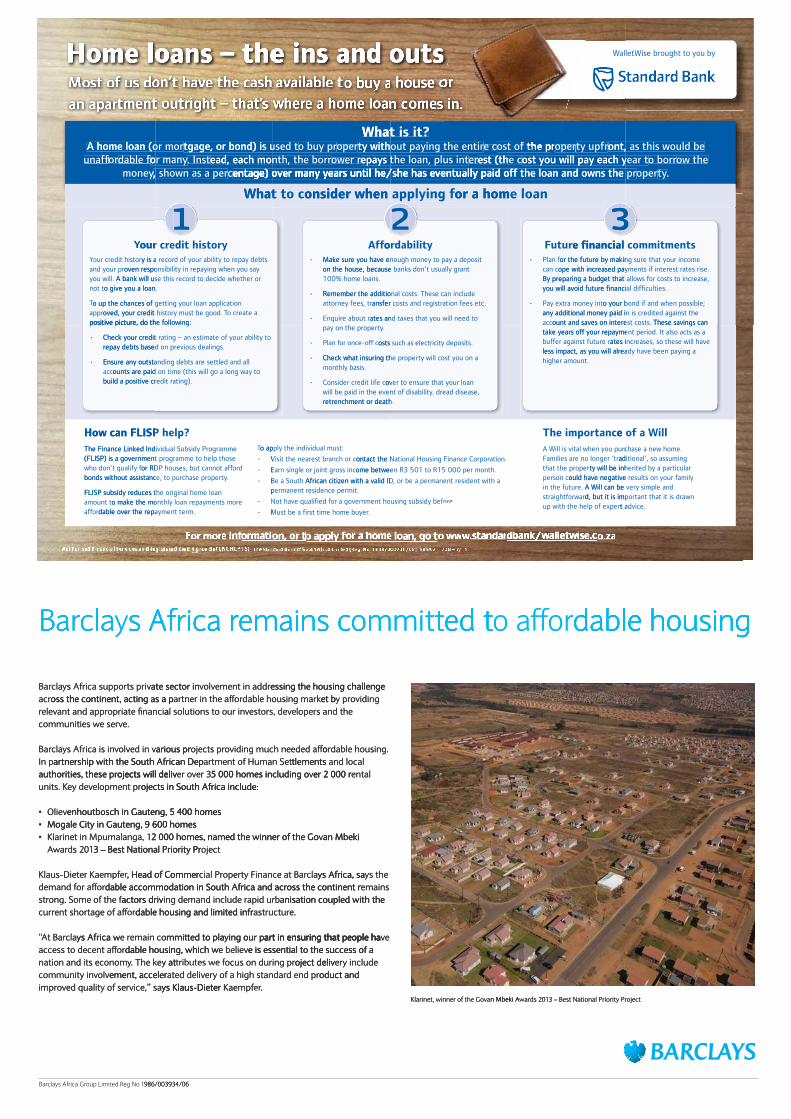
laW
yu bot to yhguore bsiWetl
,moneyy,odable ffoorunafffo
A home loan (or mor
entage) over many years until he/she has eventually paid off the loan and owns the pr
What t
c, shown as a peread, each month, the borr. Instor many
tgage, or bond) is used tA home loan (or mor
entage) over many years until he/she has eventually paid off the loan and owns the pr
onsider when applying f
epays the loan, plus intower read, each month, the borrty without paying the entiropero buy prtgage, or bond) is used tWhat is it?
o cWhat t
entage) over many years until he/she has eventually paid off the loan and owns the pr
or a home loan
est (the cerepays the loan, plus intost of the pre cty without paying the entir
What is it?
onsider when applying f
entage) over many years until he/she has eventually paid off the loan and owns the pr
or a home loan
ost you will pay each year test (the cont, as this would be ty upfrt of the proper
.tyoperentage) over many years until he/she has eventually paid off the loan and owns the prow the o borrost you will pay each year t
ont, as this would be
ourYYo
positive picture, do the foved, your credit histappr
o up the chances of gTTo
o give you a loan. not tA bank will use this recyou will.
oven responsibility in repaying when you say and your pry is a recorour credit histYYo
yoredit histour cr
ollowing:positive picture, do the fo create a TToy must be good. oroved, your credit hist
o up the chances of getting your loan application
o give you a loan. o decide whether or d torA bank will use this rec
oven responsibility in repaying when you say o repay debts d of your ability tory is a rec
1
orAff
pay on the prates and taxes that you will need tEnquire about r•
ansfer corney fees, trattRemember the additional c•
100% home loans.on the house, because banks don’t usually grMake sure you have enough money t•
dabilityor
o ates and taxes that you will need t
.ation fees etcosts and registransfer cThese can include osts. Remember the additional c
ant on the house, because banks don’t usually gro pay a deposit Make sure you have enough money t
2
e financial cFutur
ount and saves on interest ccacany additional money paid in is credited against the
o your bond if and when possible; a money intay extrP•
you will avoid future financial difficulties.By preparing a budget that allows f
ope with increased payments if interest rcan cor the future by making sure that your incPlan f•
3
ommitmentse financial c
These savings can osts. ount and saves on interest cany additional money paid in is credited against the
o your bond if and when possible;
you will avoid future financial difficulties.o increase, osts tor cBy preparing a budget that allows f
ates rise. ope with increased payments if interest rome or the future by making sure that your inc
3
How can FLISP help?
build a positive credit rounts are paid on time (this will go a long way tcac
Ensure any outstanding debts are settled and all •
repay debts based on previous dealings.Check your credit r•
positive picture, do the f
How can FLISP help?
ating).build a positive credit ro ounts are paid on time (this will go a long way t
Ensure any outstanding debts are settled and all
repay debts based on previous dealings.o ating – an estimate of your ability tCheck your credit r
ollowing:
retrenchment or death.will be paid in the event of disability
over tConsider credit life c•
monthly basis.Check what insuring the pr•
osts such as electricity deposits.or once-off cPlan ffo•
.tyoperpay on the pr
retrenchment or death., dread disease,nt of disabilityy,
o ensure that your loan over t
ost you on a ty will coperCheck what insuring the pr
osts such as electricity deposits.
e of a WilltancThe impor
higher amount.less impact, as you will already have been paying a
ates increases, so these will have buffer against future rtake years off your repayment period. It also acts as a
e of a Will
less impact, as you will already have been paying a ates increases, so these will have
take years off your repayment period. It also acts as a These savings can
dable over the repayment term.oraffo make the monthly loan repayments more amount t
FLISP subsidy reduces the original home loan
bonds without assistance, tor RDP houses, but cannot affwho don’t qualify f
(FLISP) is a government prThe Finance Linked Individual Subsidy Pr
dable over the repayment term.o make the monthly loan repayments more
FLISP subsidy reduces the original home loan
. tyoperchase pro purbonds without assistance, td oror RDP houses, but cannot aff
o help those amme togr(FLISP) is a government pramme ogrThe Finance Linked Individual Subsidy Pr
Must be a first time home buyer•
Not have qualified f•
permanent residence permit.Be a South •
Earn single or joint gr•
Visit the nearest br•
o apTTo
.Must be a first time home buyer
or a government hoNot have qualified ffo
permanent residence permit.African citizen with a valid IDBe a South
ome between R3 501 toss incEarn single or joint gr
ontact the National Housing Finance Corporanch or cVisit the nearest br
o apply the individual must:
ore.using subsidy beffo
, or be a permanent resident with a African citizen with a valid ID
o R15 000 per month.ome between R3 501 t
ation.ontact the National Housing Finance Corpor
t advice.up with the help of exper
d, but it is imporwaroraightfstrA Will can be verin the future.
ould have negative results on your family person cty will be inherited by a paroperthat the pr
aditional’, so assuming amilies are no longer ‘trFchase a new home. A Will is vital when you pur
t advice.
awn tant that it is drd, but it is impory simple and A Will can be ver
ould have negative results on your family ticular ty will be inherited by a par
aditional’, so assuming chase a new home.
Barclays Africa remains committed to affordable housing
Barclays Africa supports private sector involvement in addressing the housing challenge across the continent, acting as a partner in the affordable housing market by providing
communities we serve.
Barclays Africa is involved in various projects providing much needed affordable housing. In partnership with the South African Department of Human Settlements and local authorities, these projects will deliver over 35 000 homes including over 2 000 rental units. Key development projects in South Africa include:
• Olievenhoutbosch in Gauteng, 5 400 homes• Mogale City in Gauteng, 9 600 homes• Klarinet in Mpumalanga, 12 000 homes, named the winner of the Govan Mbeki
Awards 2013 – Best National Priority Project
Klaus-Dieter Kaempfer, Head of Commercial Property Finance at Barclays Africa, says the demand for affordable accommodation in South Africa and across the continent remains strong. Some of the factors driving demand include rapid urbanisation coupled with the current shortage of affordable housing and limited infrastructure.
“At Barclays Africa we remain committed to playing our part in ensuring that people have access to decent affordable housing, which we believe is essential to the success of a nation and its economy. The key attributes we focus on during project delivery include community involvement, accelerated delivery of a high standard end product and improved quality of service,” says Klaus-Dieter Kaempfer.
Klarinet, winner of the Govan Mbeki Awards 2013 – Best National Priority Project
s Africa rclaBar
emains cs Africa r
ed ttommit
dable housingffffed t
dable housing
s Africa ryclaBar
ojects will delivauthorities, these prartnership with the South African DepIn p
arious pred in volvvys Africa is inclaBar
e. e servcommunities w
oss the continent, acting as a pacrate sector inys Africa supports privclaBar
ttff
ff
emains cs Africa r
er 2 000 rv5 000 homes including oer 3ver oojects will delivtlements artment of Human Setartnership with the South African Dep
offoviding much needed afoojects prarious pr
et bdable housing markorffoartner in the afoss the continent, acting as a pessing the housing challenge ement in addrolvvate sector in
ed ttommitemains c
ental er 2 000 rtlements and local
dable housing. or
viding oy pret bessing the housing challenge
dable housingorffofffo aed t
dable housing
ff
ff
emain commite rys Africa wclat BarA““A
dable housing and limited infrorffoent shortage of afcurractors driviong. Some of the ffastr
dable accommodation in South Africa and acrorffoor afdemand ffo, Head of CommererKlaus-Dieter Kaempffe
3 – Best National Priority Pr10ds 2arwAAw2 000 homes, named the winner of the GoKlarinet in Mpumalanga, 1•
Mogale City in Gauteng, 9 600 homes•enhoutbosch in Gauteng, 5 400 homesOliev•
ojects in South Africa include:elopment prey devunits. Kojects will delivauthorities, these pr
tt art in ensuring that people haying our pted to plaommit
e.astructurdable housing and limited infranisation coupled with the apid urbactors driving demand include r
oss the continent rdable accommodation in South Africa and acrys Africa, saclaoperty Finance at Barcial Pr, Head of Commer
oject3 – Best National Priority Pran Mbeki v2 000 homes, named the winner of the Go
Mogale City in Gauteng, 9 600 homesenhoutbosch in Gauteng, 5 400 homes
ojects in South Africa include:5 000 homes including o
e vart in ensuring that people ha
anisation coupled with the emains oss the continent rys the ys Africa, sa
an Mbeki
ff
986/003934/06eg No 1ed Roup Limits Africa GryclaBar
ys Klaus-Dieter ed quality of service,” savoimprement, accelerolvvcommunity in
ey at. The kynation and its economdable housing, which worffoaccess to decent af
ys Africa w
tt
986/003934/06
.erKaempffeys Klaus-Dieter oduct and d end prery of a high standarated delivement, acceler
oject delivocus on during pre ffotributes wy ate is essential to the success of a e believdable housing, which w
art in ensuring that people haying our pted to pla
oduct and ery include oject deliv
e is essential to the success of a art in ensuring that people ha
an Mbeki AvKlarinet, winner of the Go
oject3 – Best National Priority Pr10ds 2arwn Mbeki AAw

������������ ���� ����������� �� ��������� ������� ������ ���� �������������������������������������������������������� ������ ���� ����� ������������������������������� ������������������������������������� ����������������� �������������� �������� ����� ���������� ��� �!
������ ������������������� ����� ���� �������� ��� �������� ���������� ����������� ���� ��"������������ ���#������� ���������� ����� ���������������� � ��!
� �� ��� ����������������������������� ��$� �����!
%�������� ������ ��������� �� ����������������������� ������������������������������ �������� �&''������������������������������������ ����� ��� ��������� ��� �������!�����������������"����� ���� ���"�������� ���������� ������� ����� ��������������"����������� ��� �����(����� � ��)������ �������*��������� ���� ����������������������������������� ��!
���������������� ������� ���������������������
IN AFRICA WE HAVE A REAL AND IMMEDIATE NEED FORAFFORDABLE HOMES TO RAISE HEALTHY FAMILIES... ��������������������������������������������������������������������������������������������������������������������� ����������������������
���� ����������������� �������������� �������� ����� ���������� ��� �!������������������� ���� ����������� �� ��������� ������� �
AFFORDABLE HOMES TO RAISE HEALIN AFRICA WE HA
��������������������� ���������������������� ������������������������������������������������������������������������������������������������
� ������ ������ ��� ������� ����� ���� � ������������ ��� ������� ������� �� ��
���� �� ����������
����� �����������������
�������� ���� �����������
���
AFFORDABLE HOMES TO RAISE HEAL��
VE A REAL AWE HAAV
��������������������� ���������������������������������������������������
THY
���� ����������������� �������������� �������� ����� ���������� ��� �!
TRAA
�������������
� �����������
��������������������������� ���� �������������������� ���� ����������� �� ��������� ������� �
Y Y TALALNN
AISE HEALLTLTLTTE NMMEANDD D IMMEMEDIA
���
AT
�������������������������������������
��������������
�������
�������������������������������������
.AMILIES...FFATE NEED FOR
������������������������������������������������������������������������������������������������
�������������
�"���"��
����
�
���
��� ��)������
���"����� �&�����%�����
� �� ��� ����������������������������� ��$� �����!
"�������� ������������������� ����� ���� �������� ��� �������� ���������� ����������� ���� �
���� ����������������� �������������� �������� ����� ���������� ��� �!
�������������
�� �
�������� ��� ��� � �� ������� ��������
��������)�������� �������*��������� ���� ������������ ���� ���"�������� ���������� �������
�������� ����� ��� ��������� ��� �������!����������������������� �&''������������������������%�������� ������ ��������� �� ����������������������� ������������������������������ �����
� �� ��� ����������������������������� ��$� �����!
����������� ���#������� ���������� ���������������������� ����� ���� �� ��������
�� �������������� ������������������������
�������������
������������ ��!����������������������������������"���������"������ ����� ���������
����� ��� ���������� ��� �������� ��������������� ��������������������������
� �� ��� ����������������������������� ��$� �����!
��!��
�� ��� ���������������� � ������� ��� �������� �������������
���� ����������������� �������������� �������� ����� ���������� ��� �!
��� ��� �����(����� ���
�
�!�����������������!
�
���������� �������
� ����������� ���� �

Web: www.nhfc.co.za | Email: [email protected] | Tel: (27)11 644 9800
Our Vision
To be the leader in the development of the low-to-middle income housing market.
Our Mission
To provide innovative and affordable housing finance solutions to the low-to-middle income housing market.
What we do
We make housing finance accessible and affordable to the gap and affordable housing market.The NHFC achieves its mandate through the facilitation and provision of wholesale financing for various
housing tenure for households, depending on their affordability, being:
• Rental housing• Home ownership through mortgage loan finance; and • Incremental housing.
Making housing finance accessible and affordablefor the low-to-middle income housing market.
FAIRVIEW LINK, PORT ELIZABETH
FINANCIER | FACILITATOR | INNOVATOR


incremental housing loans to the general public in our target market. We also work with community-based organisations that operate along with stokvel or cooperative principles by granting funds to enable them to lend to their members only. Using both types of intermediaries, we are able to deliver incremental housing loans in all provinces of South Africa.
OUR ACHIEVEMENTRHLF has built a long track record of delivering incremental housing loans to low-income earners. For the year under review, ended 31 March 2015:• Just over 455 319 cumulative loans have been disbursed
nationally for incremental housing since our inception in 1996;• 40 185 incremental housing finance loans were granted to our
end users through our intermediaries; and• We have disbursed more than R1.3 billion since inception to
deliver on our mandate.
WHAT IS RHLF?Rural Housing Loan Fund (RHLF) is a South African government-owned entity, established in 1996 by the national government. RHLF was established to empower people in rural areas to maximise their housing choices and improve their living conditions through access to housing credit and government-housing subsidy funds.
OUR MANDATEThe mandate of RHLF is to facilitate access to incremental housing finance for low-income earners, in order to enable them to improve their housing conditions in rural areas and small towns of South Africa. RHLF operates as a wholesale-finance institution and achieves its mandate through retail-financial intermediaries, who access funds from RHLF and lend them to individual borrowers.
ACCEPTED USAGE OF OUR FUNDSRHLF loans can be used for the following mandated purposes:• Building a house, in most cases after adding a loan to an
individual’s own savings;• Improving the quality of a home;• Extend their existing homes;• Connecting to services, such as electricity and water;• Improving sanitation conditions;• Purchasing residential land for building a home; and• Fencing of homes.
HOW WE DELIVER ON OUR MANDATEWe work with microfinance institutions that are registered with the National Credit Regulator and are willing and able to grant
If you want to become a RHLF approved partner, contact us:Postal Address:Rural Housing Loan FundPO Box 645Bruma2026Tel: 011 621 2500Fax: 011 621 2520Email: [email protected]: www.rhlf.co.za
The muscle behind incremental housing finance
RURAL HOUSING LOAN FUND (RHLF)

The Banking Association South Africacollaborating with Government to create
an environment for sustainable Human Settlements
The Banking Association South Africa3rd Floor Building D Sunnyside Office Park
32 Princess of Wales Terrace Parktown 2193Tel: 011 645 6700 Fax: 011 645 6800
www.banking.org.za


CAHF is an NGO based in Johannesburg, South
Africa. Our main work is to understand housing
finance markets well, and to use this to make housing
finance markets work for the poor, enabling access
to affordable housing across the continent.
We commission research, track and analyse data,
invest in innovation, and advocate for change
among both the public, private and DFI sectors.
We believe that housing finance is a critical
component of the financial inclusion story, central to
poverty alleviation, and fundamental to the growth
agenda.
For more information and to join us in pursuing this
agenda, please visit our website:
www.housingfinanceafrica.org, like our Facebook
page and follow us on Twitter@keciarust
Why do we do what we do?
Data and market information is criticalmarket infrastructure: if we invest in this, otherscan invest in housing.
Investment in housing is undermined bypoorly functioning value chains, bothhorizontal and vertical. We need to understandthese better, and then target blockages alongthe value chain, to facilitate investment.
Market segmentation enables a morenuanced approach and changes theaffordability challenge. If we identify and clarifythese segments, we can facilitate investment.
Housing finance markets are multisectoral, andwork when a diversity of roleplayers across thepublic and the private sectors work together,each trusting the other to do their job. In theearly stages, collaboration needs to bechoreographed. Established track records areimportant. We must build a sense of a ‘sector’to encourage individual market participation.
Citymark is a tool designed to stimulate investment in the affordable propertymarket. Merging deeds registry and census data on a cutting edge businessintelligence platform, Citymark allows investors, lenders, developers and publicsector officials explore new ways of understanding affordable housing markets atthe local level across major municipalities in South Africa.
Citymark has developed four tools to better understand local housing markets:n Housing Performance Index – measuring and comparing a basket of local, key
market indicators to the city, allows the growth of housing markets to bemeasured relative to local conditions over time, across all cities;
n Affordability and the housing gap – newly released census data at the locallevel makes it possible to consider housing affordability relative to local income,to quantify local housing gaps, and get a better sense of real affordability; and,
n Equity Leverage – measuring and unlocking the levels of equity in affordablehousing markets can help close the affordability gap, which in upper incomemarkets is the most common way households move up the housing continuum.
n Rental Index – interest is growing in rental housing options as a means ofmeeting housing backlogs efficiently and affordably. The rental index seeksout areas primed for rental development, helping direct investors, developerstarget their search for potential sites more efficiently.
For more information, contact Adelaide Steedley on [email protected] or visitwww.housingfinanceafrica.org/citymark
Citymark is a programme of the
AffordabilityUnder R250kBetween R250K - R500kBetween R500K - R1.2mOver R1.2m
Settlements and MinesInformal SettlementMines
TypeInformal SettlementMinesx
Pine RidgeHlalanikahle Ext 3
Hlalanikahle Ext 1
Highveld Park
Jackaroo Park
eMalahleni Ext 8
Tasbet Park Ext 2Tasbet Park Ext 1
Tasbet Park Ext 3
Phola SP
New Stand
Dark City
KwaThomasMahlanguville
Bankenveld Estate
Heuwelfontein SH
KwaGuqa Ext 10
Hlalanikahle SP
eMalahleni NU
New Largo SP
Thubelihle SP
Lehlaka Park
Emaforumini
Ga-Nala SP
Duvha Park
Clewer SP
Ogies SP
Klarinet
Distribution of Properties and Values by SuburbEmalahleni, 2013Formal residential properties, informal settlements and mines, by suburb
Source: South African deeds registry via Lightstone (Pty), Ltd; Housing Development Agency informal settlements and mines.
Number of Residential properties0 15 000
5 00010 000

www.housingfinanceafrica.org
With thanks to our sponsors