2015 Budget Draft
236
Budget 2 0 1 5
Transcript of 2015 Budget Draft
Budget
2 0 1 5

This page intentionally left blank.
10747 Renner Boulevard Lenexa, KS 66219
913.895.5500 www.waterone.org
Adopted December 9, 2014
by the Board of Water District No. 1 of Johnson County, Kansas
BOARD: Brenda Cherpitel, Chair
Joe Vaughan, Vice Chair Terrence D. Frederick
H. Richard "Dick" Noon Robert S. Olson Robert P. Reese James E. Vader
FINANCE COMMITTEE: Robert P. Reese, Committee Chair
Terrence D. Frederick Robert S. Olson
SENIOR STAFF:
Mike Armstrong, General Manager Ron Appletoft, Director of Finance
Eric Arner, Director of Legal / Auditing Colleen Browne, Director of Administration / Human Resources
C.J. George, Director of Information Technology Mandy Cawby and Dana Sargent Buhl, Acting Directors of Customer Relations
Tom Schrempp, Director of Production Dan Smith, Director of Distribution

This page intentionally left blank.

12/31/2014
EXECUTIVE SUMMARYExecutive Summary 1 - 7
OVERVIEWBudget Review and Approval Process 9Budget Process Diagram 10WaterOne Financial Overview 11Comparison of 2015 Proposed Budget to 2014 Budget 13Significant Account Summary By Category 14Explanation of Significant O&M Accounts 15 - 24Summary of Annual Capital 25
REVENUE & RATESRevenue Summary 27 - 28Water Rate Structure 29Billing Impact Comparison 30History of Water Sales By Rate Class 31Customer Growth 32History & Projection of Water Rates 33Water Rate Comparison with Neighboring Utilities 33Water Rates Compared to National Water & Sewer CPI 34History & Projection of Debt Service Coverage 34
O&MO&M By Division 35O&M By Category - All Accounts 36 - 40Comparison to Current Year Estimated Actuals 41 - 45
PERSONNEL Introduction 47WaterOne Organizational Chart (Detail) 48 - 49Summary of New Personnel Costs 50 - 51New Personnel Requests - Description 52 - 60Employee Benefits 61 - 6510-Year History of Full Time Equivalents 66Customers Served Per Employee 67
TABLE OF CONTENTS2015 Proposed Budget
TOC - 1
12/31/2014
TABLE OF CONTENTS2015 Proposed Budget
TOTAL CIP (CAPITAL IMPROVEMENTS PROGRAM)CIP Overview 69 - 70Master Plan 71 - 73Transmission & Distribution (T&D) 74 - 76Annual Capital (AC) 77History of Budgeted Annual Capital - Replacement v. New 78Annual Capital Statement by Budget Department 79Capital Carry Overs from Prior Years 80 - 81
GENERAL MANAGEROrganization Chart & Division Description 83WaterOne Mission Statement 83Expenditures By Categories - Chart & Table 84Division O&M as a Percentage of WaterOne - Chart 85Significant Accounts - Table 85Employee Headcount - Table 85Significant Accounts - Descriptions 86Division Annual Capital as a Percentage of WaterOne - Chart 86Annual Capital Projects (listed) 86Annual Capital Detail 87
PRODUCTIONOrganization Chart & Division Description 89Division Mission Statement 89Expenditures By Categories - Chart & Table 90Division O&M as a Percentage of WaterOne - Chart 91Significant Accounts - Table 91Employee Headcount - Table 92Significant Accounts - Descriptions 92 - 93Division Annual Capital as a Percentage of WaterOne - Chart 94Annual Capital Projects (listed) 94 - 95Master Plan Projects (listed) 96Annual Capital Detail 97 - 108
TOC - 2
12/31/2014
TABLE OF CONTENTS2015 Proposed Budget
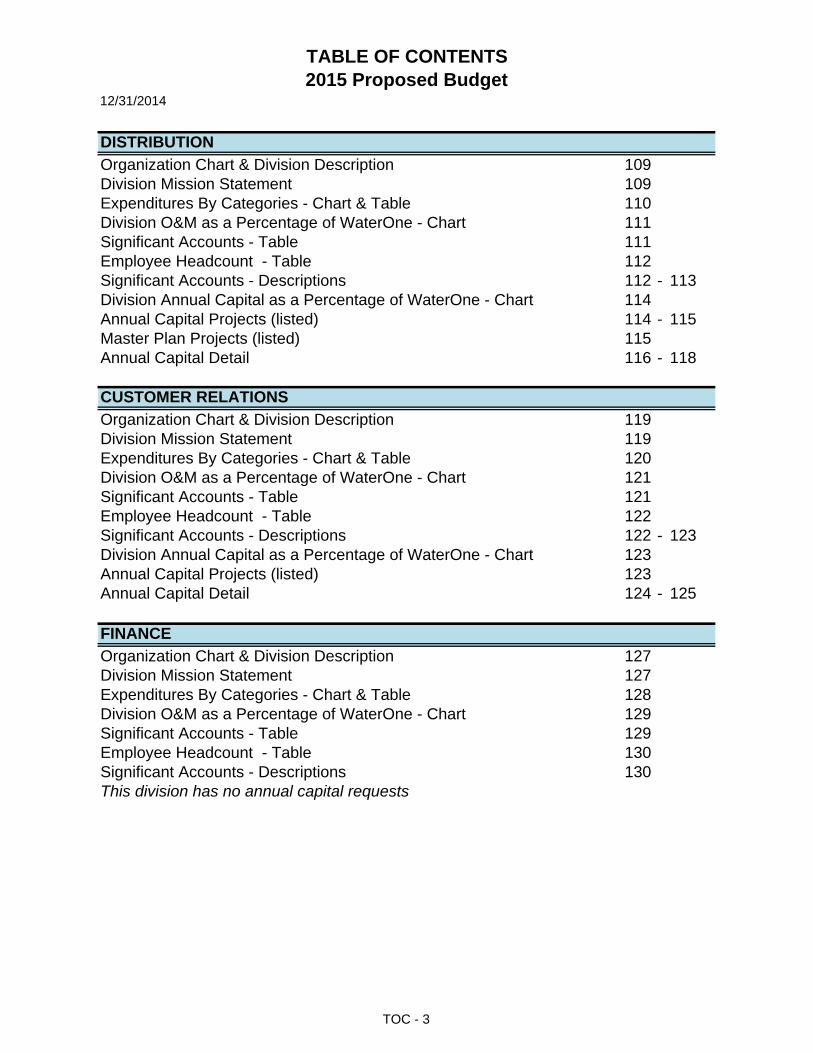
DISTRIBUTIONOrganization Chart & Division Description 109Division Mission Statement 109Expenditures By Categories - Chart & Table 110Division O&M as a Percentage of WaterOne - Chart 111Significant Accounts - Table 111Employee Headcount - Table 112Significant Accounts - Descriptions 112 - 113Division Annual Capital as a Percentage of WaterOne - Chart 114Annual Capital Projects (listed) 114 - 115Master Plan Projects (listed) 115Annual Capital Detail 116 - 118
CUSTOMER RELATIONSOrganization Chart & Division Description 119Division Mission Statement 119Expenditures By Categories - Chart & Table 120Division O&M as a Percentage of WaterOne - Chart 121Significant Accounts - Table 121Employee Headcount - Table 122Significant Accounts - Descriptions 122 - 123Division Annual Capital as a Percentage of WaterOne - Chart 123Annual Capital Projects (listed) 123Annual Capital Detail 124 - 125
FINANCEOrganization Chart & Division Description 127Division Mission Statement 127Expenditures By Categories - Chart & Table 128Division O&M as a Percentage of WaterOne - Chart 129Significant Accounts - Table 129Employee Headcount - Table 130Significant Accounts - Descriptions 130This division has no annual capital requests
TOC - 3
12/31/2014
TABLE OF CONTENTS2015 Proposed Budget
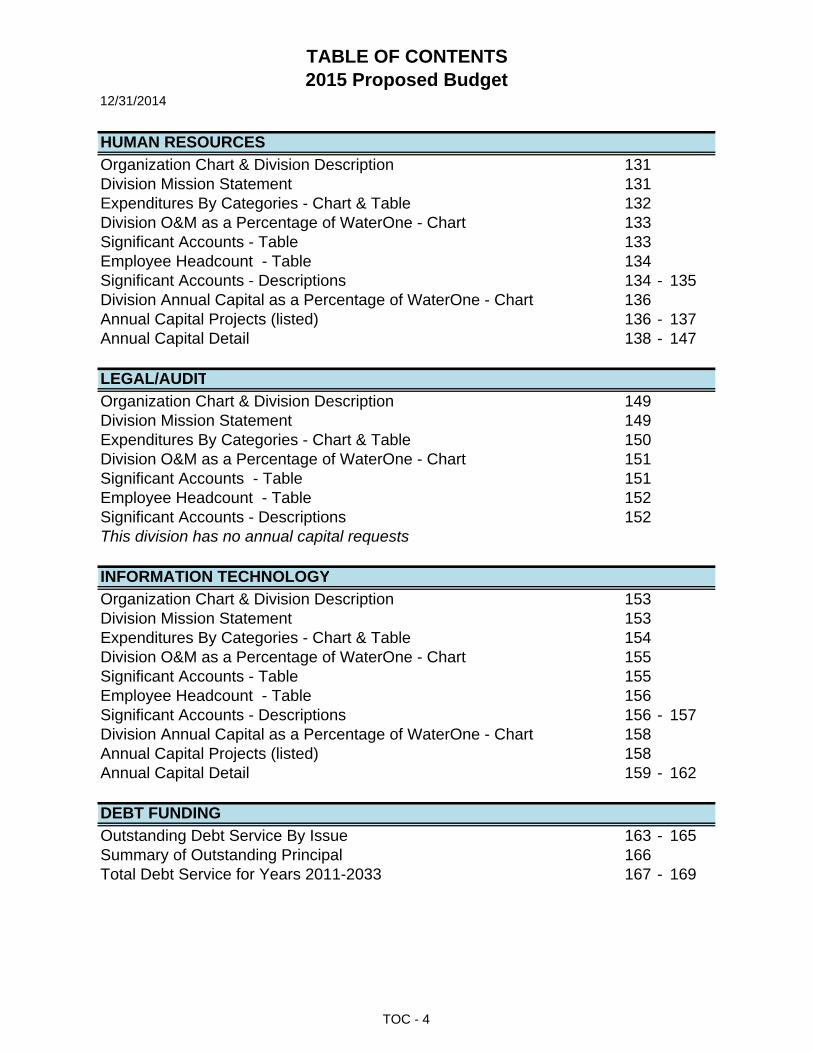
HUMAN RESOURCESOrganization Chart & Division Description 131Division Mission Statement 131Expenditures By Categories - Chart & Table 132Division O&M as a Percentage of WaterOne - Chart 133Significant Accounts - Table 133Employee Headcount - Table 134Significant Accounts - Descriptions 134 - 135Division Annual Capital as a Percentage of WaterOne - Chart 136Annual Capital Projects (listed) 136 - 137Annual Capital Detail 138 - 147
LEGAL/AUDITOrganization Chart & Division Description 149Division Mission Statement 149Expenditures By Categories - Chart & Table 150Division O&M as a Percentage of WaterOne - Chart 151Significant Accounts - Table 151Employee Headcount - Table 152Significant Accounts - Descriptions 152This division has no annual capital requests
INFORMATION TECHNOLOGYOrganization Chart & Division Description 153Division Mission Statement 153Expenditures By Categories - Chart & Table 154Division O&M as a Percentage of WaterOne - Chart 155Significant Accounts - Table 155Employee Headcount - Table 156Significant Accounts - Descriptions 156 - 157Division Annual Capital as a Percentage of WaterOne - Chart 158Annual Capital Projects (listed) 158Annual Capital Detail 159 - 162
DEBT FUNDINGOutstanding Debt Service By Issue 163 - 165Summary of Outstanding Principal 166Total Debt Service for Years 2011-2033 167 - 169
TOC - 4
12/31/2014
TABLE OF CONTENTS2015 Proposed Budget
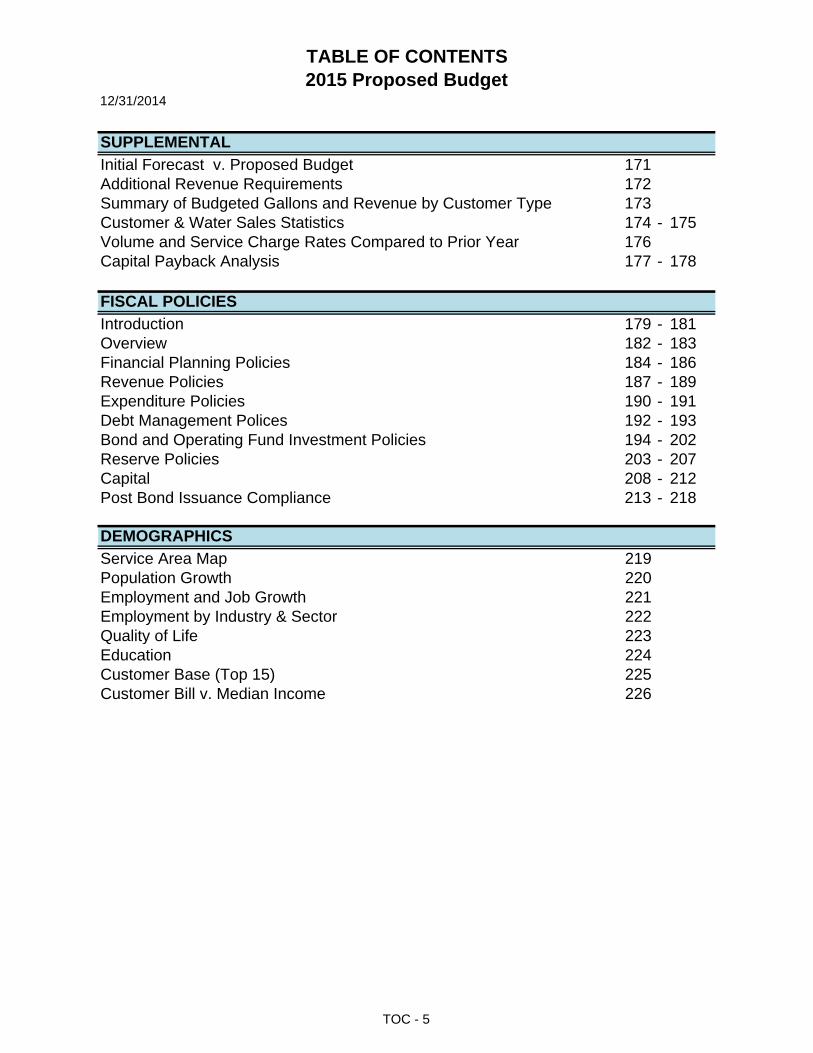
SUPPLEMENTALInitial Forecast v. Proposed Budget 171Additional Revenue Requirements 172Summary of Budgeted Gallons and Revenue by Customer Type 173Customer & Water Sales Statistics 174 - 175Volume and Service Charge Rates Compared to Prior Year 176Capital Payback Analysis 177 - 178
FISCAL POLICIESIntroduction 179 - 181Overview 182 - 183Financial Planning Policies 184 - 186Revenue Policies 187 - 189Expenditure Policies 190 - 191Debt Management Polices 192 - 193Bond and Operating Fund Investment Policies 194 - 202Reserve Policies 203 - 207Capital 208 - 212Post Bond Issuance Compliance 213 - 218
DEMOGRAPHICSService Area Map 219Population Growth 220Employment and Job Growth 221Employment by Industry & Sector 222Quality of Life 223Education 224Customer Base (Top 15) 225Customer Bill v. Median Income 226
TOC - 5

This page intentionally left blank.
EXECUTIVESUMMARY
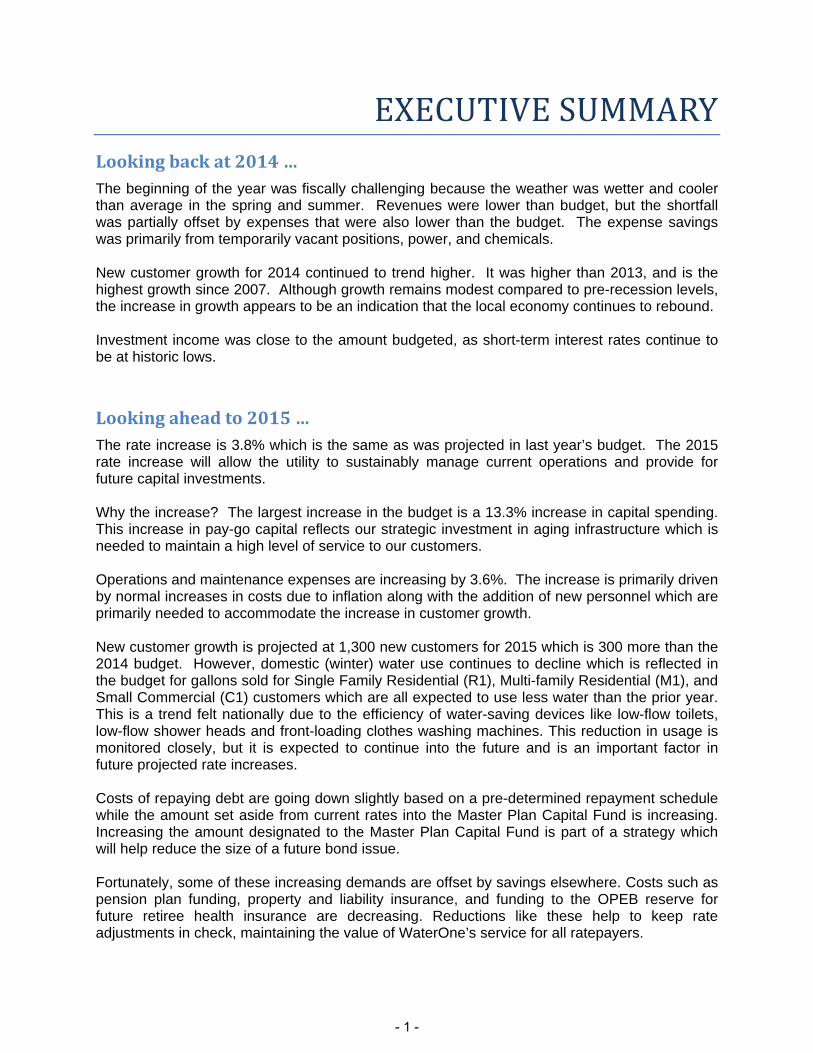
Lookingbackat2014…The beginning of the year was fiscally challenging because the weather was wetter and cooler than average in the spring and summer. Revenues were lower than budget, but the shortfall was partially offset by expenses that were also lower than the budget. The expense savings was primarily from temporarily vacant positions, power, and chemicals. New customer growth for 2014 continued to trend higher. It was higher than 2013, and is the highest growth since 2007. Although growth remains modest compared to pre-recession levels, the increase in growth appears to be an indication that the local economy continues to rebound. Investment income was close to the amount budgeted, as short-term interest rates continue to be at historic lows.
Lookingaheadto2015…The rate increase is 3.8% which is the same as was projected in last year’s budget. The 2015 rate increase will allow the utility to sustainably manage current operations and provide for future capital investments. Why the increase? The largest increase in the budget is a 13.3% increase in capital spending. This increase in pay-go capital reflects our strategic investment in aging infrastructure which is needed to maintain a high level of service to our customers. Operations and maintenance expenses are increasing by 3.6%. The increase is primarily driven by normal increases in costs due to inflation along with the addition of new personnel which are primarily needed to accommodate the increase in customer growth. New customer growth is projected at 1,300 new customers for 2015 which is 300 more than the 2014 budget. However, domestic (winter) water use continues to decline which is reflected in the budget for gallons sold for Single Family Residential (R1), Multi-family Residential (M1), and Small Commercial (C1) customers which are all expected to use less water than the prior year. This is a trend felt nationally due to the efficiency of water-saving devices like low-flow toilets, low-flow shower heads and front-loading clothes washing machines. This reduction in usage is monitored closely, but it is expected to continue into the future and is an important factor in future projected rate increases. Costs of repaying debt are going down slightly based on a pre-determined repayment schedule while the amount set aside from current rates into the Master Plan Capital Fund is increasing. Increasing the amount designated to the Master Plan Capital Fund is part of a strategy which will help reduce the size of a future bond issue. Fortunately, some of these increasing demands are offset by savings elsewhere. Costs such as pension plan funding, property and liability insurance, and funding to the OPEB reserve for future retiree health insurance are decreasing. Reductions like these help to keep rate adjustments in check, maintaining the value of WaterOne’s service for all ratepayers.
- 1 -
WATERONE 2015 BUDGET 12/31/2014 EXECUTIVE SUMMARY
h:\finance\finshare\1budget\2015 budget\final budget book\02-exec summary\2015 exec summary.docx
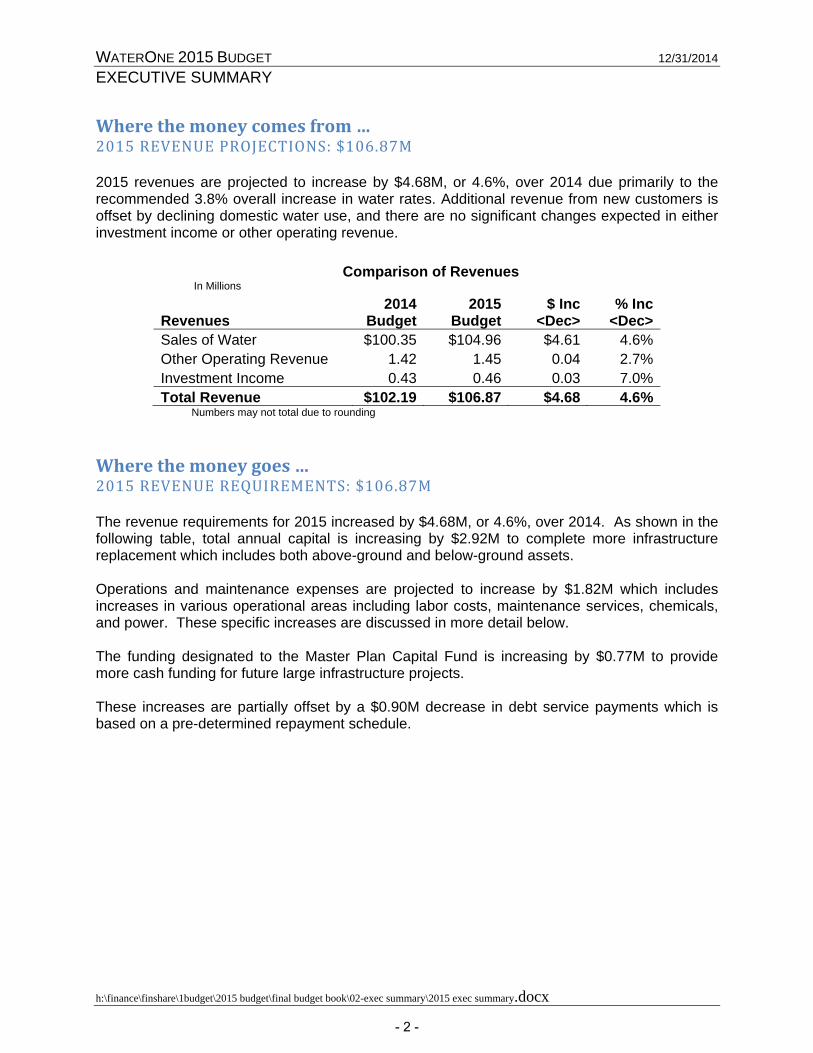
Wherethemoneycomesfrom…2015REVENUEPROJECTIONS:$106.87M 2015 revenues are projected to increase by $4.68M, or 4.6%, over 2014 due primarily to the recommended 3.8% overall increase in water rates. Additional revenue from new customers is offset by declining domestic water use, and there are no significant changes expected in either investment income or other operating revenue.
Comparison of Revenues
In Millions
Revenues 2014
Budget 2015
Budget$ Inc
<Dec> % Inc
<Dec> Sales of Water $100.35 $104.96 $4.61 4.6% Other Operating Revenue 1.42 1.45 0.04 2.7% Investment Income 0.43 0.46 0.03 7.0% Total Revenue $102.19 $106.87 $4.68 4.6%
Numbers may not total due to rounding Wherethemoneygoes…2015REVENUEREQUIREMENTS:$106.87M The revenue requirements for 2015 increased by $4.68M, or 4.6%, over 2014. As shown in the following table, total annual capital is increasing by $2.92M to complete more infrastructure replacement which includes both above-ground and below-ground assets. Operations and maintenance expenses are projected to increase by $1.82M which includes increases in various operational areas including labor costs, maintenance services, chemicals, and power. These specific increases are discussed in more detail below. The funding designated to the Master Plan Capital Fund is increasing by $0.77M to provide more cash funding for future large infrastructure projects. These increases are partially offset by a $0.90M decrease in debt service payments which is based on a pre-determined repayment schedule.
- 2 -

WATERONE 2015 BUDGET 12/31/2014 EXECUTIVE SUMMARY
h:\finance\finshare\1budget\2015 budget\final budget book\02-exec summary\2015 exec summary.docx
2015 Annual Budget - $106,872,840
Comparison of Revenue Requirements In millions
Numbers may not total due to rounding
OPERATIONS&MAINTENANCEEXPENSES:$52.25M Operations and Maintenance (O&M) expenses represent 49% of the 2015 budget. This is the same proportion as 2014 although it is an increase of $1.82M year-over-year. The table on the next page shows the breakdown of the significant O&M expenses including the difference between 2014 and 2015 followed by further discussion of the major operating costs.
O&M49%
Debt Service21%
Repayment to Master Plan
2%
Master Plan3%
Annual Capital24%
Restricted1%
Revenue Requirements 2014
Budget2015
Budget $ Inc
<Dec> % Inc
<Dec>Operations & Maintenance Expense $50.42 $52.25 $1.82 3.6%Total Annual Capital 22.03 24.95 2.92 13.3%Debt Service 23.53 22.62 <0.90> <3.8%>Designated to Master Plan 2.66 3.43 0.77 28.8%Repayment to Master Plan 2.25 2.37 0.12 5.1%Restricted 1.30 1.26 <0.04> <3.1%>Total Revenue Requirements $102.19 $106.87 $4.68 4.6%
Labor36%
Benefits16%Power
16%
Chemicals12%
Services14%
All Other6%
2015 O&M
- 3 -

WATERONE 2015 BUDGET 12/31/2014 EXECUTIVE SUMMARY
h:\finance\finshare\1budget\2015 budget\final budget book\02-exec summary\2015 exec summary.docx
In millions O&M
2014 Budget
2015 Budget
$ Inc <Dec>
% Inc <Dec>
Labor $18.34 $19.10 $0.76 4.1% Services 7.19 7.53 0.34 4.7% Chemicals 5.83 6.07 0.24 4.2% Power 7.95 8.16 0.21 2.7% Benefits 8.44 8.43 <0.01> <0.1%> All Other 2.67 2.95 0.28 10.4% Total $50.42 $52.25 $1.82 3.6%
Numbers may not total due to rounding Labor Labor costs include:
The annual true-up to the 2014 base to reflect the actual outcome of payroll and benefits after turn-over, retirements and vacancies.
A 3.5% performance compensation adjustment to maintain WaterOne’s competitiveness with other employers of choice.
Overtime. Transfers of labor costs to capital projects, capturing true project costs. A net increase of 7.275 Full Time Equivalent (FTE) positions.
All positions are assessed based on operational needs including those related to continuing increases in customer growth. A number of the new positions requested for 2015 were eliminated in 2010 and 2011 as business activity slowed because of the recession.
Requested Positions SCADA Analyst - Full Time Storekeeper - Full Time HVAC Tech - Full Time Fleet Mechanic - Full Time System Engineer – Network - Full Time Fleet Clerk - Part Time Water Quality Tech - Full Time Hydrant Auditor - Summer Communication Specialist - Reclassification of Part Time to Full Time
Services All support services (net of transfers) increased $338,469 or 4.7%, in 2015. The largest increases were in maintenance services for work on the Kansas Wellfield and the Horizontal Collector Well on the Missouri River. Chemicals An increase of $243,333, or 4.2%, in the 2015 chemical budget is primarily due to an increase in the projected total water produced, a slight increase in chemical prices and a decrease to the budgeted water produced at Wolcott during January and February when the river level and temperature are likely to reduce the intake capacity of the horizontal collector well. Power The power budget increased $211,898, or 2.7%, for 2015. The budget is increasing primarily due to an increase in the projected total water produced and a decrease to the budgeted water produced at Wolcott during January and February when the river level and temperature are likely to reduce the intake capacity of the horizontal collector well. The
- 4 -

WATERONE 2015 BUDGET 12/31/2014 EXECUTIVE SUMMARY
h:\finance\finshare\1budget\2015 budget\final budget book\02-exec summary\2015 exec summary.docx
decrease to the budgeted water produced at Wolcott during January and February is effective for the 2015 budget in order to bring the budget in line with actual operating conditions over the past two winters. A 5% projected rate increase from the Board of Public Utilities is included. The rate projections are subject to change when BPU proposes and approves actual rate increases in the fall. Benefits Benefits (net of transfers to capital) decreased $7,883 or 0.1% for 2015. Following three out of the last five years of no health insurance premium increases, health insurance costs are projected to increase 7.7%. The health insurance increase is being offset by two reductions. First, there is a decrease in the required contribution to the employee pension plans which is primarily due to investment gains. Second, there is a decrease in the funding needed for the OPEB reserve which helps fund future retiree health insurance costs. The decrease is based on the funding projected in the biennial actuarial valuation.
TOTALANNUALCAPITAL:$24.95M The Total Annual Capital budget for 2015 increased $2.92M, or 13.3%. Approximately 96% of the budget is used to maintain current facilities and equipment. These needs are continually being evaluated to determine the proper time to replace versus repair.
Total Annual Capital By Division
The Transmission & Distribution (T&D) budget has increased by $0.57M to $13.74M. WaterOne continues to execute its asset management strategy to target replacement of aging
- 5 -

WATERONE 2015 BUDGET 12/31/2014 EXECUTIVE SUMMARY
h:\finance\finshare\1budget\2015 budget\final budget book\02-exec summary\2015 exec summary.docx
infrastructure at the lowest life-cycle cost. The increase in 2015 is primarily for distribution main replacements and transmission main condition assessment. Annual Capital increased for 2015 by $2.35M. These capital requests are used to replace obsolete or worn-out equipment, purchase new equipment and technology, and make improvements to existing assets. Approximately $9.68M is for replacement while $0.94M is for new capital. The primary reason for the increase in 2015 is due to more Production Division replacement projects including replacing large pumps and SCADA equipment.
Total Annual Capital In millions
Total Annual Capital
2014 Budget
2015 Budget
$ Inc <Dec>
% Inc <Dec>
Transmission & Distribution $13.17 $13.74 $0.57 4.3%Production 4.38 6.12 1.75 40.0%Human Resources (incl. Fleet) 1.54 1.61 0.07 4.4%Customer Relations 1.10 1.13 0.03 2.6%Information Technology 1.11 1.08 <0.02> <2.0%>Distribution 0.19 0.68 0.48 250.2%All Other 0.54 0.59 0.05 8.7%Total Annual Capital $22.03 $24.95 $2.92 13.3%
Numbers may not total due to rounding
DEBTSERVICE:$22.62M Debt Service for 2015 decreased $0.9M, or 3.8%, from 2014 as determined by the previously scheduled bond principal and interest payments. 2015 is the second year of using capitalized interest from the 2014 bond issue which was issued for the Hedge Lane Pump Station and related transmission mains. In 2016 there will be an increase in debt service related to the 2014 bond issue.
DESIGNATEDTOMASTERPLAN:$3.43M “Designated to Master Plan” funding sets aside a portion of current revenues to help fund major capital improvements. This debt management strategy recognizes that current customers benefit from Master Plan projects and contributes a percentage of annual water sales accordingly. These funds also reduce reliance on future debt, benefitting all ratepayers. The 2015 budget of $3.43M is 3.2% of total revenue. The targeted minimum contribution is 5.0% of total revenue. The strategy is to get to the target level by 2018.
REPAYMENTTOMASTERPLAN:$2.37M The $2.37M repayment is the second of a two year repayment to the Master Plan fund for the 2013 early retirement of the Series 2003 bonds. The funds were borrowed from the OPEB reserve which is part of the Master Plan Capital Fund.
- 6 -

WATERONE 2015 BUDGET 12/31/2014 EXECUTIVE SUMMARY
h:\finance\finshare\1budget\2015 budget\final budget book\02-exec summary\2015 exec summary.docx
RESTRICTED:$1.26M Restricted funds are resources that WaterOne needs to maintain for various reasons. The budget consists of funding mandated by the bond covenants, calculated increases in the negative cash flow reserve, and changes in investment income restricted to the Master Plan Capital Fund. Interest rates and projected revenue requirements will cause the required threshold of restricted funds to fluctuate from year to year.
INSUMMARY Despite the challenges of declining domestic water consumption, below average customer growth in recent years, historically low investment yields, and an aging infrastructure, WaterOne’s financial position continues to be strong thanks to its capital investment strategy, quality staff, and ability to adapt to the variability of weather. WaterOne remains committed to its track record of steady and predictable rate adjustments which provide stability for its residential customers and the rebounding business community. The 2015 budget provides the resources needed to deliver on WaterOne’s vision of “Setting the Standard for Utility Excellence.”
- 7 -

This page intentionally left blank.
- 8 -

WATERONE 2015 BUDGET OVERVIEW Budget Review and Approval Process The Finance Division kicks off the budget planning cycle in the first quarter with an initial planning meeting to go over budget targets and challenges with managers and directors. All budget forms, instructions, standards, and schedules are then posted on WaterOne’s Unity SharePoint site. Managers and those assigned to assist them begin preparing their budget submissions. The Financial Planning Department provides specialized help to each department in preparation of their budget, including one-on-one meetings, training, and guidance as needed to ensure an organized district-wide approach to budget preparation. Each department is required to document and justify requests. For specialized requests such as computer equipment, modifications to facilities, and fleet, the department responsible for the asset’s installation and/or maintenance works with the requestor to ensure that it meets the stated needs and that the amount is appropriate. Managers prepare departmental budgets for the next fiscal year for their respective director’s approval by assessing current operating conditions, staffing needs, and program development plans. Submissions are also made for the ensuing five budget years for both capital and personnel. After the directors review and approve the requests, they are submitted to Financial Planning to be compiled, reviewed and analyzed. Financial modeling is updated with the latest budget submissions and any other revised assumptions and the water rates required to support the budget are produced. A revised 5-year projection is produced so that any longer range impacts may be reviewed as well. Each division reviews their budget requests with the General Manager and Director of Finance. The recommended budget plans are analyzed using such measures as prior year requests compared to prior year actual expenditures, trend analysis tools, current financial goals, and strategic objectives. Once final approval is received from the General Manager, the appropriate documents are prepared for Board review. The Board reviews the recommended budget in two work sessions in the fall. Once the Board has fully reviewed the recommended budget and provided direction to management, a public hearing is held in November. Additional adjustments to the recommended budget may be made at that time. The final budget is approved at the regularly scheduled December Board meeting. Water rates to support the budget become effective with water used on or after the beginning of the new fiscal year on January 1.
- 9 -

2015 BUDGET PROCESS
H:\...\2015 Budget\Board Budget Draft\dateflow.ppt
budget website launch - forms & instructions online
STRATEGY
Submissions:
•Operations & Maintenance Requests
•Fleet Requests
•Capital Requests
•Current Personnel Modifications
• Additional Personnel Requests
•5-Year Personnel & Capital
NEEDS ASSESSMENT
Decision:final budget review by G.M. & directors before submission to Board
Submission:prior year capital carry-over requests
Submission:proposed budget
to Board
Finance Committee Meetings: Board review of operating and capital budgets; Staff presentations on key budget drivers & components
Public Hearing:proposed budget and rate impact
REVIEW & DEVELOPMENT
Board Meeting:
final adoption of budget
ADOPTION
December
November
October
September
August
July
June
April
May
Budget Kick-OffMarch
Division Budget Meetings:director and managers review submissions with
G.M., Finance staff, Human Resources, and Fleet management
- 10 -

WATERONE FINANCIAL OVERVIEW4.9% 4.4% 4.9% 3.2% 3.9% 3.8% 3.6% 3.3% 3.3% 3.2% 3.2% W A T E R R A T E S
TOTAL ANNUAL OPERATING BUDGET 2010 2011 2012 2013 2014 2015 2016 2017 2018 2019 2020 LONG TERM MODEL ACTUAL ACTUAL ACTUAL ACTUAL BUDGET ADOPTED PROJECTION PROJECTION PROJECTION PROJECTION PROJECTION PROJECTION ASSUMPTIONS
REVENUES PROVIDED: Customer Growth per YearSales Of Water 80,897,855$ 92,044,865$ 114,672,701$ 97,594,794$ 100,347,319$ 104,958,840$ 109,366,382$ 113,829,882$ 118,693,408$ 123,513,463$ 128,552,076$ 2015 2016 2017 2018 2019 2020Sales Of Water - Wholesale - - - - - - - - - - - 1,300 1,500 1,800 2,000 2,000 2,000Other Operating Revenues 1,363,021 1,235,783 1,369,535 1,273,121 1,415,500 1,454,000 1,464,000 1,474,000 1,494,000 1,524,000 1,544,000
Total Operating Revenues 82,260,876 93,280,648 116,042,236 98,867,915 101,762,819 106,412,840 110,830,382 115,303,882 120,187,408 125,037,463$ 130,096,076$ Gallons Per Customer Per Year:R1 90,300 gallons
Investment Income ( General and P&I Funds ) 309,599 277,094 228,044 197,373 270,000 420,000 530,000 1,290,000 1,930,000 2,670,000 3,150,000 M1 460,800 gallonsInvestment Income (Bond & SDC Fund) 37,213 35,339 7,266 - 160,000 40,000 - 20,000 670,000 290,000 200,000 C1 217,000 gallons
Total Investment Income 346,812 312,433 235,310 197,373 430,000 460,000 530,000 1,310,000 2,600,000 2,960,000$ 3,350,000$ C2 1,506,000 gallons
Interest % Yield on Investment IncomeTOTAL REVENUES PROVIDED 82,607,688$ 93,593,081$ 116,277,546$ 99,065,287$ 102,192,819$ 106,872,840$ 111,360,382$ 116,613,882$ 122,787,408$ 127,997,463$ 133,446,076$ 2015 2016 2017 2018 2019 2020
0.35% 0.50% 1.25% 1.75% 2.25% 2.50%REVENUE REQUIREMENTS:
Operations & Maintenance Expense 41,410,646$ 43,612,653$ 48,869,902$ 47,214,225$ 50,424,719$ 52,247,866$ 54,484,493$ 56,902,162$ 59,180,721$ 62,581,901$ 64,027,815$ O&M Assumptions (2016-2020)
Annual Capital 4,265,136 5,572,153 5,275,895 3,166,509 8,856,000 11,207,000 11,280,000 11,730,000 12,200,000 12,680,000 13,180,000 Current Year CO's to be Spent in Following Year 5,453,429 3,742,491 6,109,537 4,207,532 - - - - - - - Payroll 4.5%Transmission and Distribution (T&D) Funding 9,400,000 9,800,000 11,170,000 11,950,000 13,174,000 13,743,000 14,776,000 15,903,000 17,126,000 18,443,000 19,888,000 Power 3.0%
Total Pay as You Go Annual Capital + T&D 19,118,565 19,114,644 22,555,432 15,116,509 22,030,000 24,950,000 26,056,000 27,633,000 29,326,000 31,123,000 33,068,000 Chemicals 4.0%Health Ins. 10.0%
Debt Service Funding 21,171,389 22,116,799 18,923,282 21,273,985 23,528,410 22,624,501 24,663,482 24,831,043 25,082,706 24,910,606 28,086,660 All Other O&M 3.0%
Investment Income (Bond & SDC Fund) 37,213 35,339 10,000 - 160,000 40,000 - 20,000 670,000 290,000 200,000 Designated Master Plan 341,277 2,507,648 15,245,657 4,063,989 2,659,690 3,425,473 5,156,406 6,077,676 7,397,982 7,731,956 6,943,601 Annual Capital AssumptionsRepayment of Bond Payoff to Master Plan - - 3,754,167 3,587,500 2,250,000 2,365,000 - - - - - Inflation rate at 4%
Total Transfers to Master Plan 378,490 2,542,987 19,009,824 7,651,489 5,069,690 5,830,473 5,156,406 6,097,676 8,067,982 8,021,956 7,143,601
Bond Covenant & Capital Reserves - - - - 720,000 790,000 560,000 670,000 660,000 870,000 570,000 Negative Cash Flow Reserve 502,927 500,000 500,000 500,000 420,000 430,000 440,000 480,000 470,000 490,000 550,000
TOTAL REVENUE REQUIREMENTS 82,582,017$ 87,887,083$ 109,858,440$ 91,756,208$ 102,192,819$ 106,872,840$ 111,360,382$ 116,613,882$ 122,787,408$ 127,997,463$ 133,446,076$ Funds Available for Reservation 25,671$ 5,705,998$ 6,419,105$ 7,309,079$ -$ -$ -$ -$ -$ -$ -$
Senior Parity and 2nd Lien Debt Service Coverage 1.95 2.26 3.56 2.44 2.20 2.41 2.31 2.40 2.54 2.63 2.47
LONG RANGE MASTER PLAN BUDGET
Carryover Reserves Available for Future Awards 11,497,139$ 23,286,901$ 17,610,555$ 26,250,055$ 32,263,852$ 35,004,117$ 8,885,194$ 8,726,509$ 20,894,321$ 36,793,452$ 17,844,616$ Funding Sources:
Net Bond Proceeds 28,165,735 (2,230,875) - - 78,300,000 - - - 41,000,000 - 15,000,000 Designated Reserve for Master Plan Projects 1,232,037 2,507,648 15,245,657 8,563,989 2,659,690 3,425,473 5,156,406 6,077,676 7,397,982 7,731,956 6,943,601 SDC Revenue 4,600,000 4,900,000 6,600,000 8,700,000 6,311,500 6,311,500 7,282,500 9,001,800 10,510,000 11,040,000 11,380,000 Assumes all 5/8" SDC'sDesignated General Fund - - - - - - - - - - - Reserve Transfers (4,672,816) (2,899,271) 4,181,807 - 513,571 - - - - - - Investment Income - 31,764 40,364 - 160,000 40,000 - 20,000 670,000 290,000 200,000
Total Funding Sources 29,324,956$ 2,309,266$ 26,067,828$ 17,263,989$ 87,944,761$ 9,776,973$ 12,438,906$ 15,099,476$ 59,577,982$ 19,061,956$ 33,523,601$
TOTAL FUNDS AVAILABLE 40,822,095$ 25,596,167$ 43,678,383$ 43,514,044$ 120,208,613$ 44,781,090$ 21,324,101$ 23,825,985$ 80,472,302$ 55,855,408$ 51,368,216$ Master Plan Project Costs (Award Basis) 17,535,195$ 7,985,612$ 17,428,328$ 11,250,192$ 85,204,497$ 35,895,896$ 12,597,592$ 2,931,664$ 43,678,850$ 38,010,792$ 44,640,163$
0
Operations & Maintenance
49%
Annual Cap23%
Reserves7%
Debt Service Funding
21%
2015 REVENUE REQUIREMENTS
$34.96$37.00
$39.37$41.31
$42.80$45.50
$48.37$51.42
$54.66
$58.11$61.78
$34.96 $36.48$38.25 $39.49 $40.79 $42.37 $43.88
$45.33$46.84 $48.35 $49.88
$20
$30
$40
$50
$60
$70
2010 2011 2012 2013 2014 2015 2016 2017 2018 2019 2020
Typi
cal (
R1)
Sin
gle
Fam
ily C
usto
mer
-7,
500
Gal
/Mo
National Water & Sewer IndexWaterOne vs. All Cities Water & Sewer System Maintenance CPI
CPI WaterOne
4.9% 4.4% 4.9% 3.2% 3.9% 3.8% 3.6% 3.3% 3.3% 3.2% 3.2% Projected Rate Increases
Rate increases beyond the current year are not formally adopted by the Board and are subject
to change in the future.
$42.37
$0 $10 $20 $30 $40 $50 $60 $70
Spring Hill
Water 7
BPU
DeSoto
KCMO
Bonner Springs
Gardner
Miami RWD2
WaterOne
Olathe
2015 rates are shown when available. In instances where 2015 rates are not yet determined, current 2014 rates are shown.
Average Monthly Water Bill for Typical Customer at 7,500 Gal
Proposed
4:13 PM 2/27/2015 \\waterone.org\dfs2\Finance\FINSHARE\10YEAR\Approved Budgets\20 Year Model Approved 2015 Budget.xlsm- 11 -

This page left intentionally blank.
- 12 -
WaterOne 2015 Budget SCHEDULE A
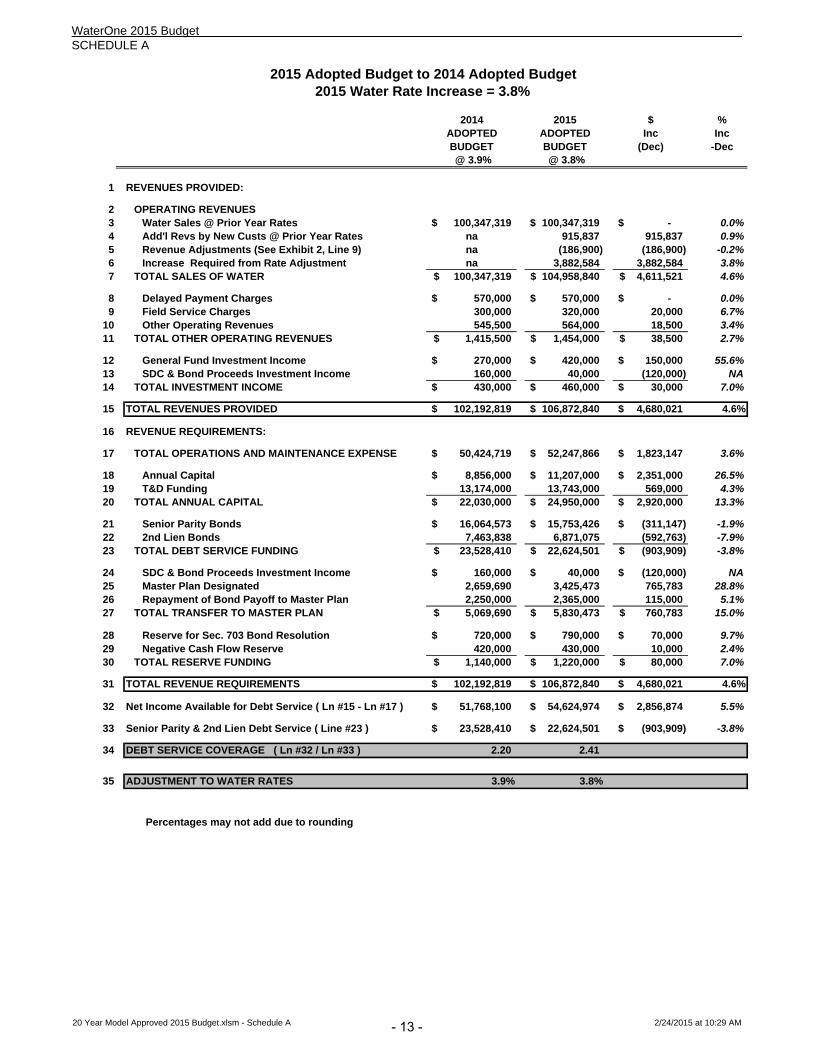
2014 2015 $ %ADOPTED ADOPTED Inc IncBUDGET BUDGET (Dec) -Dec @ 3.9% @ 3.8%
1 REVENUES PROVIDED:
2 OPERATING REVENUES3 Water Sales @ Prior Year Rates 100,347,319$ 100,347,319$ -$ 0.0%4 Add'l Revs by New Custs @ Prior Year Rates na 915,837 915,837 0.9%5 Revenue Adjustments (See Exhibit 2, Line 9) na (186,900) (186,900) -0.2%6 Increase Required from Rate Adjustment na 3,882,584 3,882,584 3.8%7 TOTAL SALES OF WATER 100,347,319$ 104,958,840$ 4,611,521$ 4.6%
8 Delayed Payment Charges 570,000$ 570,000$ -$ 0.0%9 Field Service Charges 300,000 320,000 20,000 6.7%
10 Other Operating Revenues 545,500 564,000 18,500 3.4%11 TOTAL OTHER OPERATING REVENUES 1,415,500$ 1,454,000$ 38,500$ 2.7%
12 General Fund Investment Income 270,000$ 420,000$ 150,000$ 55.6%13 SDC & Bond Proceeds Investment Income 160,000 40,000 (120,000) NA14 TOTAL INVESTMENT INCOME 430,000$ 460,000$ 30,000$ 7.0%
15 TOTAL REVENUES PROVIDED 102,192,819$ 106,872,840$ 4,680,021$ 4.6%
16 REVENUE REQUIREMENTS:
17 TOTAL OPERATIONS AND MAINTENANCE EXPENSE 50,424,719$ 52,247,866$ 1,823,147$ 3.6%
18 Annual Capital 8,856,000$ 11,207,000$ 2,351,000$ 26.5%19 T&D Funding 13,174,000 13,743,000 569,000 4.3%20 TOTAL ANNUAL CAPITAL 22,030,000$ 24,950,000$ 2,920,000$ 13.3%
21 Senior Parity Bonds 16,064,573$ 15,753,426$ (311,147)$ -1.9%22 2nd Lien Bonds 7,463,838 6,871,075 (592,763) -7.9%23 TOTAL DEBT SERVICE FUNDING 23,528,410$ 22,624,501$ (903,909)$ -3.8%
24 SDC & Bond Proceeds Investment Income 160,000$ 40,000$ (120,000)$ NA25 Master Plan Designated 2,659,690 3,425,473 765,783 28.8%26 Repayment of Bond Payoff to Master Plan 2,250,000 2,365,000 115,000 5.1%27 TOTAL TRANSFER TO MASTER PLAN 5,069,690$ 5,830,473$ 760,783$ 15.0%
28 Reserve for Sec. 703 Bond Resolution 720,000$ 790,000$ 70,000$ 9.7%29 Negative Cash Flow Reserve 420,000 430,000 10,000 2.4%30 TOTAL RESERVE FUNDING 1,140,000$ 1,220,000$ 80,000$ 7.0%
31 TOTAL REVENUE REQUIREMENTS 102,192,819$ 106,872,840$ 4,680,021$ 4.6%
32 Net Income Available for Debt Service ( Ln #15 - Ln #17 ) 51,768,100$ 54,624,974$ 2,856,874$ 5.5%
33 Senior Parity & 2nd Lien Debt Service ( Line #23 ) 23,528,410$ 22,624,501$ (903,909)$ -3.8%
34 DEBT SERVICE COVERAGE ( Ln #32 / Ln #33 ) 2.20 2.41
35 ADJUSTMENT TO WATER RATES 3.9% 3.8%
Percentages may not add due to rounding
2015 Adopted Budget to 2014 Adopted Budget2015 Water Rate Increase = 3.8%
20 Year Model Approved 2015 Budget.xlsm - Schedule A 2/24/2015 at 10:29 AM- 13 -
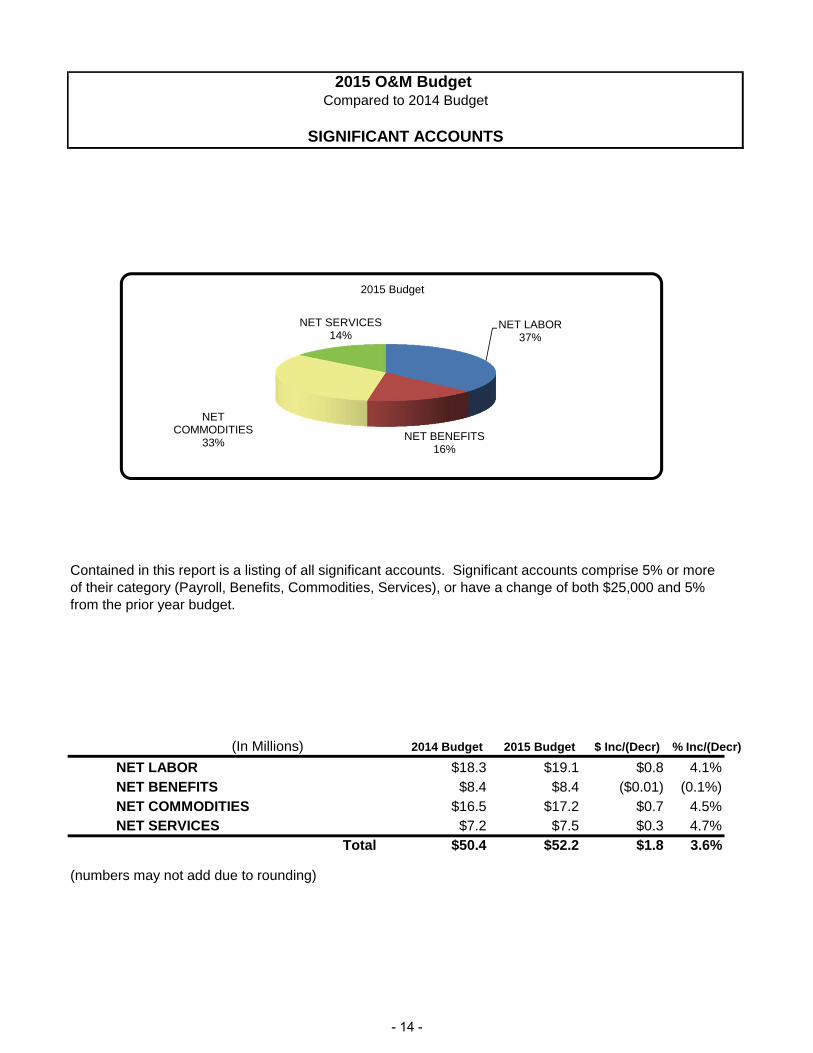
2015 O&M Budget Compared to 2014 Budget
SIGNIFICANT ACCOUNTS
(In Millions) 2014 Budget 2015 Budget $ Inc/(Decr) % Inc/(Decr)
NET LABOR $18.3 $19.1 $0.8 4.1%NET BENEFITS $8.4 $8.4 ($0.01) (0.1%)NET COMMODITIES $16.5 $17.2 $0.7 4.5%NET SERVICES $7.2 $7.5 $0.3 4.7%
Total $50.4 $52.2 $1.8 3.6%
(numbers may not add due to rounding)
Contained in this report is a listing of all significant accounts. Significant accounts comprise 5% or more of their category (Payroll, Benefits, Commodities, Services), or have a change of both $25,000 and 5% from the prior year budget.
NET LABOR37%
NET BENEFITS16%
NET COMMODITIES
33%
NET SERVICES14%
2015 Budget
- 14 -
2015 Budget Compared to 2014 Budget
By Category
ACCOUNTS ‐ BY CATEGORY
12/12/2014
2014 2015 $ DIF % DIF
PAYROLL
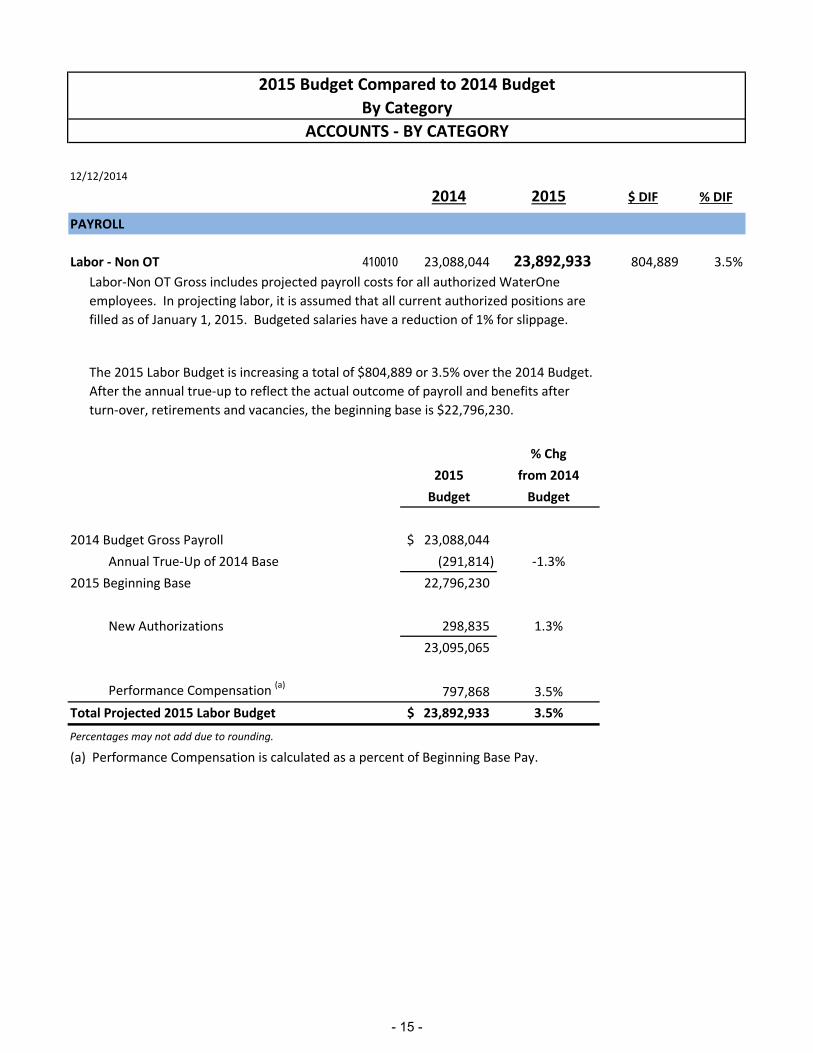
Labor ‐ Non OT 410010 23,088,044 23,892,933 804,889 3.5%
% Chg
2015 from 2014
Budget Budget
2014 Budget Gross Payroll 23,088,044$
Annual True‐Up of 2014 Base (291,814) ‐1.3%
2015 Beginning Base 22,796,230
New Authorizations 298,835 1.3%
23,095,065
Performance Compensation (a)
797,868 3.5%
Total Projected 2015 Labor Budget 23,892,933$ 3.5%
Percentages may not add due to rounding.
(a) Performance Compensation is calculated as a percent of Beginning Base Pay.
Labor‐Non OT Gross includes projected payroll costs for all authorized WaterOne
employees. In projecting labor, it is assumed that all current authorized positions are
filled as of January 1, 2015. Budgeted salaries have a reduction of 1% for slippage.
The 2015 Labor Budget is increasing a total of $804,889 or 3.5% over the 2014 Budget.
After the annual true‐up to reflect the actual outcome of payroll and benefits after
turn‐over, retirements and vacancies, the beginning base is $22,796,230.
- 15 -
12/12/2014
2014 2015 $ DIF % DIF
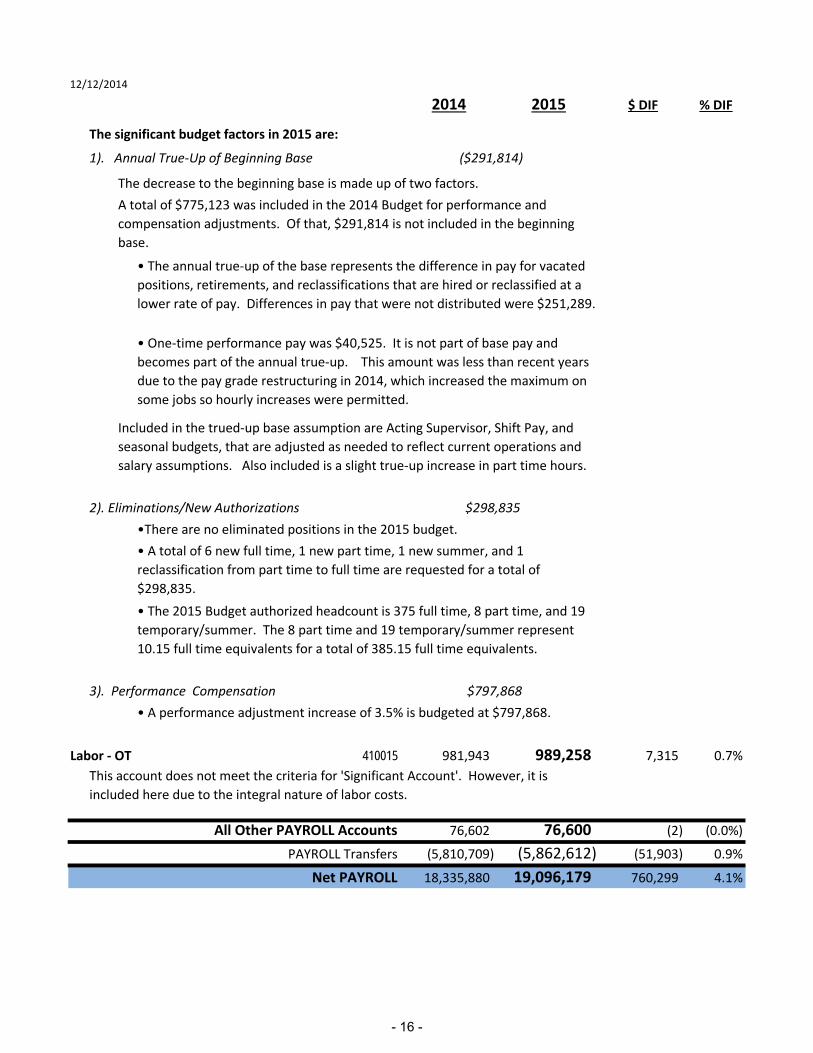
Labor ‐ OT 410015 981,943 989,258 7,315 0.7%
All Other PAYROLL Accounts 76,602 76,600 (2) (0.0%)
PAYROLL Transfers (5,810,709) (5,862,612) (51,903) 0.9%
Net PAYROLL 18,335,880 19,096,179 760,299 4.1%
1). Annual True‐Up of Beginning Base ($291,814)
The significant budget factors in 2015 are:
The decrease to the beginning base is made up of two factors.
A total of $775,123 was included in the 2014 Budget for performance and
compensation adjustments. Of that, $291,814 is not included in the beginning
base.
This account does not meet the criteria for 'Significant Account'. However, it is
included here due to the integral nature of labor costs.
Included in the trued‐up base assumption are Acting Supervisor, Shift Pay, and
seasonal budgets, that are adjusted as needed to reflect current operations and
salary assumptions. Also included is a slight true‐up increase in part time hours.
2). Eliminations/New Authorizations $298,835
3). Performance Compensation $797,868
• A performance adjustment increase of 3.5% is budgeted at $797,868.
•There are no eliminated positions in the 2015 budget.
• A total of 6 new full time, 1 new part time, 1 new summer, and 1
reclassification from part time to full time are requested for a total of
$298,835.
• The 2015 Budget authorized headcount is 375 full time, 8 part time, and 19
temporary/summer. The 8 part time and 19 temporary/summer represent
10.15 full time equivalents for a total of 385.15 full time equivalents.
• One‐time performance pay was $40,525. It is not part of base pay and
becomes part of the annual true‐up. This amount was less than recent years
due to the pay grade restructuring in 2014, which increased the maximum on
some jobs so hourly increases were permitted.
• The annual true‐up of the base represents the difference in pay for vacated
positions, retirements, and reclassifications that are hired or reclassified at a
lower rate of pay. Differences in pay that were not distributed were $251,289.
- 16 -

12/12/2014
2014 2015 $ DIF % DIF
BENEFITS
Employee Insurance ‐ Health 413010 3,879,201 4,176,450 297,249 7.7%
Total Pension Accounts 3,997,575 3,630,407 (367,168) (9.2%)
% Change
from 2014
2015 Budget Budget
Defined Benefit (DB) Plans
412010 ‐ Defined Benefit 2,656,864 (13.3%)
412050 ‐ Cash Balance (New Plan) 55,426 NA (a)
Total DB Plans 2,712,290
Defined Contribution (DC) Plans
412020 ‐ Base 461,789 (16.6%)
412052 ‐ Base (New Plan) 72,956 NA (a)
Total DC ‐ Base 534,745
412030 ‐ Match 317,711 (16.6%)
412051 ‐ Match (New Plan) 65,661 NA (a)
Total DC ‐ Match 383,372
Grand Total Pension 3,630,407 (9.2%)
The budgeted components of the increase in health insurance are a 4.9% experience
premium increase, a 1% increase for the Affordable Care Act (ACA), and a 1.8%
increase for six additional full time personnel plus a reclassification from part time to
full time. Changes in the employee coverage mix are included in the 4.9% premium
increase.
The Total Pension budget is comprised of both Defined Benefit Plans and Defined
Contribution Plans, which include plans for employees hired prior to 1/1/2014 and
employees hired 1/1/2014 and after (the "new" plan). The total projected pension
cost has decreased, and the majority of the projected reduction is due to the addition
of a 2013 gain and the expiration of a 2004 loss in the pre‐2014 Defined Benefit Plan.
(a) The 2014 budget for these accounts was zero. The plans did not become effective
until 01/01/2014
- 17 -
12/12/2014
2014 2015 $ DIF % DIF
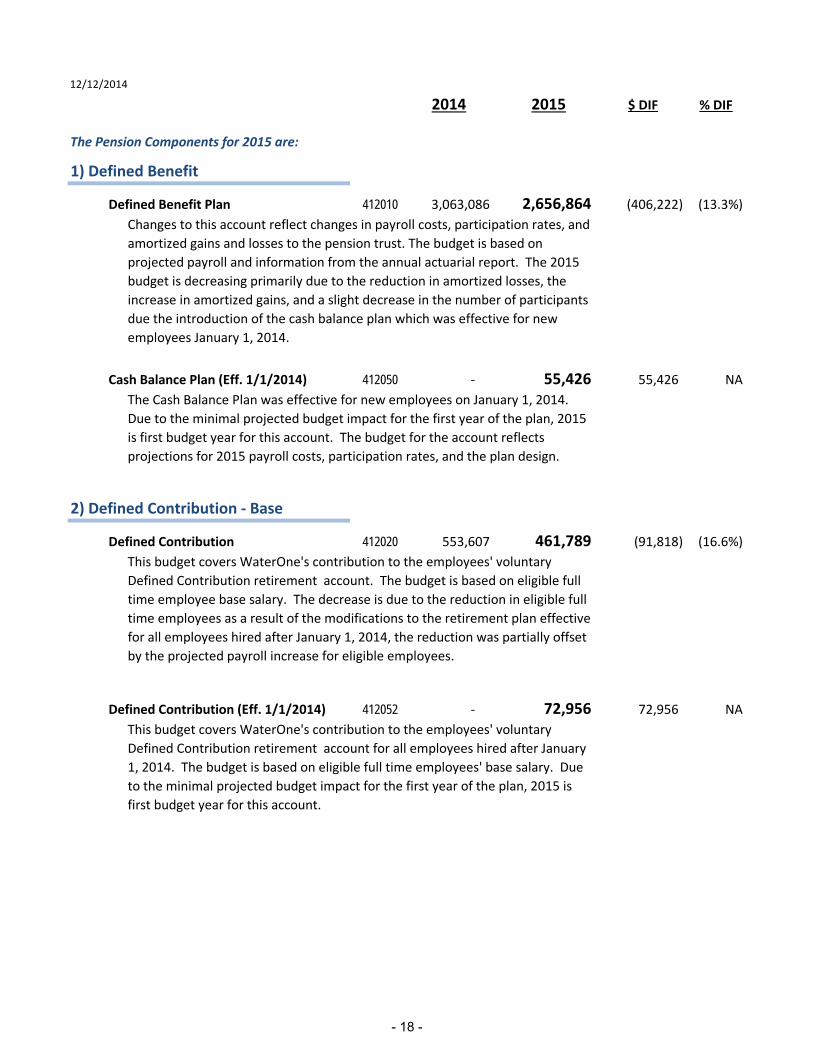
The Pension Components for 2015 are:
1) Defined Benefit
Defined Benefit Plan 412010 3,063,086 2,656,864 (406,222) (13.3%)
Cash Balance Plan (Eff. 1/1/2014) 412050 ‐ 55,426 55,426 NA
2) Defined Contribution ‐ Base
Defined Contribution 412020 553,607 461,789 (91,818) (16.6%)
Defined Contribution (Eff. 1/1/2014) 412052 ‐ 72,956 72,956 NA
The Cash Balance Plan was effective for new employees on January 1, 2014.
Due to the minimal projected budget impact for the first year of the plan, 2015
is first budget year for this account. The budget for the account reflects
projections for 2015 payroll costs, participation rates, and the plan design.
This budget covers WaterOne's contribution to the employees' voluntary
Defined Contribution retirement account. The budget is based on eligible full
time employee base salary. The decrease is due to the reduction in eligible full
time employees as a result of the modifications to the retirement plan effective
for all employees hired after January 1, 2014, the reduction was partially offset
by the projected payroll increase for eligible employees.
This budget covers WaterOne's contribution to the employees' voluntary
Defined Contribution retirement account for all employees hired after January
1, 2014. The budget is based on eligible full time employees' base salary. Due
to the minimal projected budget impact for the first year of the plan, 2015 is
first budget year for this account.
Changes to this account reflect changes in payroll costs, participation rates, and
amortized gains and losses to the pension trust. The budget is based on
projected payroll and information from the annual actuarial report. The 2015
budget is decreasing primarily due to the reduction in amortized losses, the
increase in amortized gains, and a slight decrease in the number of participants
due the introduction of the cash balance plan which was effective for new
employees January 1, 2014.
- 18 -
12/12/2014
2014 2015 $ DIF % DIF
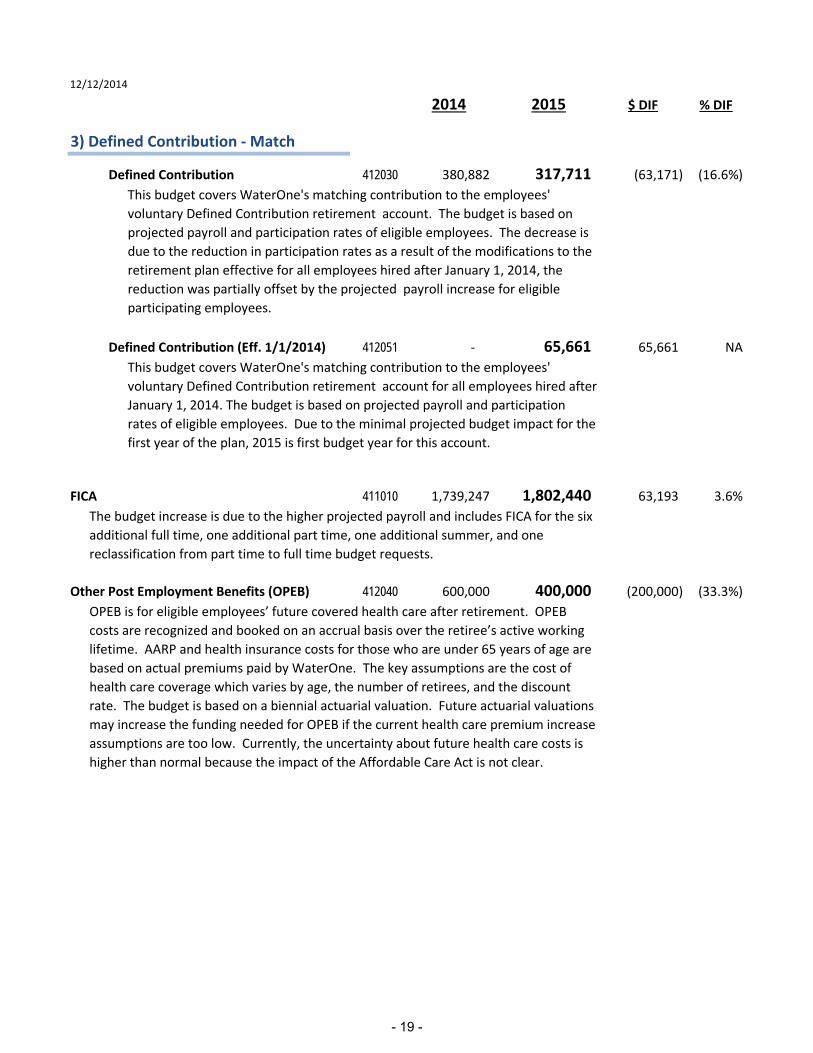
3) Defined Contribution ‐ Match
Defined Contribution 412030 380,882 317,711 (63,171) (16.6%)
Defined Contribution (Eff. 1/1/2014) 412051 ‐ 65,661 65,661 NA
FICA 411010 1,739,247 1,802,440 63,193 3.6%
Other Post Employment Benefits (OPEB) 412040 600,000 400,000 (200,000) (33.3%)
OPEB is for eligible employees’ future covered health care after retirement. OPEB
costs are recognized and booked on an accrual basis over the retiree’s active working
lifetime. AARP and health insurance costs for those who are under 65 years of age are
based on actual premiums paid by WaterOne. The key assumptions are the cost of
health care coverage which varies by age, the number of retirees, and the discount
rate. The budget is based on a biennial actuarial valuation. Future actuarial valuations
may increase the funding needed for OPEB if the current health care premium increase
assumptions are too low. Currently, the uncertainty about future health care costs is
higher than normal because the impact of the Affordable Care Act is not clear.
This budget covers WaterOne's matching contribution to the employees'
voluntary Defined Contribution retirement account for all employees hired after
January 1, 2014. The budget is based on projected payroll and participation
rates of eligible employees. Due to the minimal projected budget impact for the
first year of the plan, 2015 is first budget year for this account.
This budget covers WaterOne's matching contribution to the employees'
voluntary Defined Contribution retirement account. The budget is based on
projected payroll and participation rates of eligible employees. The decrease is
due to the reduction in participation rates as a result of the modifications to the
retirement plan effective for all employees hired after January 1, 2014, the
reduction was partially offset by the projected payroll increase for eligible
participating employees.
The budget increase is due to the higher projected payroll and includes FICA for the six
additional full time, one additional part time, one additional summer, and one
reclassification from part time to full time budget requests.
- 19 -
12/12/2014
2014 2015 $ DIF % DIF
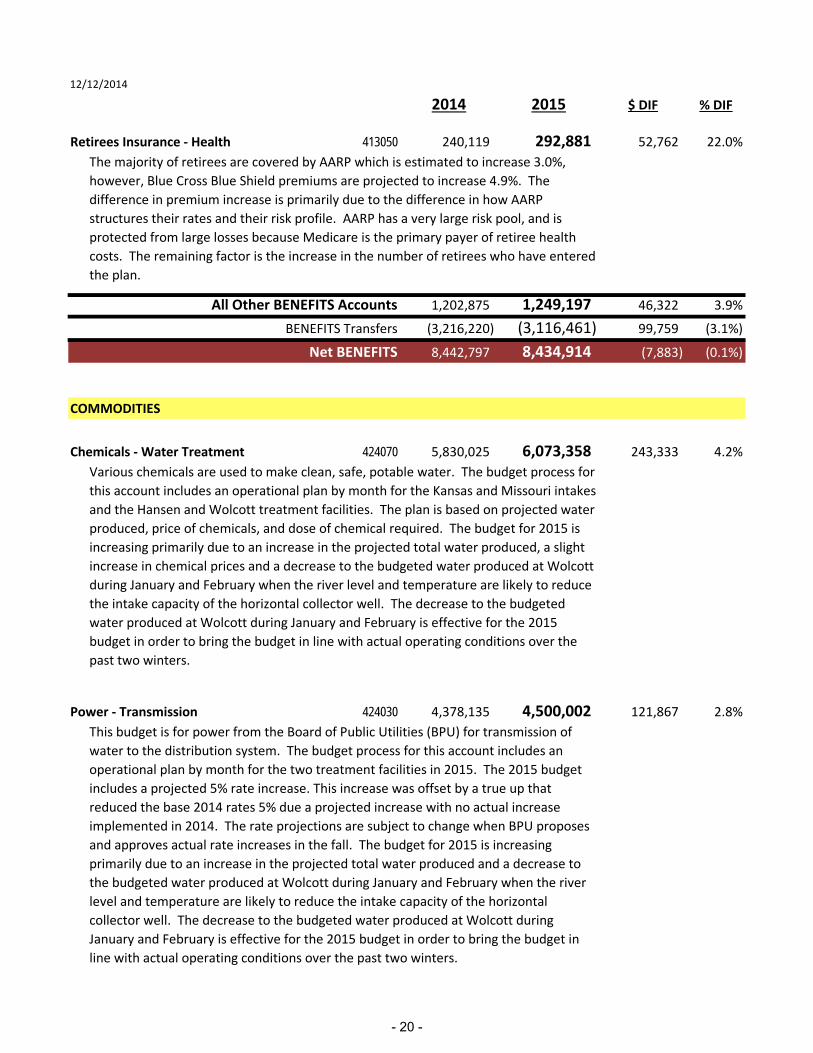
Retirees Insurance ‐ Health 413050 240,119 292,881 52,762 22.0%
All Other BENEFITS Accounts 1,202,875 1,249,197 46,322 3.9%
BENEFITS Transfers (3,216,220) (3,116,461) 99,759 (3.1%)
Net BENEFITS 8,442,797 8,434,914 (7,883) (0.1%)
COMMODITIES
Chemicals ‐ Water Treatment 424070 5,830,025 6,073,358 243,333 4.2%
Power ‐ Transmission 424030 4,378,135 4,500,002 121,867 2.8%
This budget is for power from the Board of Public Utilities (BPU) for transmission of
water to the distribution system. The budget process for this account includes an
operational plan by month for the two treatment facilities in 2015. The 2015 budget
includes a projected 5% rate increase. This increase was offset by a true up that
reduced the base 2014 rates 5% due a projected increase with no actual increase
implemented in 2014. The rate projections are subject to change when BPU proposes
and approves actual rate increases in the fall. The budget for 2015 is increasing
primarily due to an increase in the projected total water produced and a decrease to
the budgeted water produced at Wolcott during January and February when the river
level and temperature are likely to reduce the intake capacity of the horizontal
collector well. The decrease to the budgeted water produced at Wolcott during
January and February is effective for the 2015 budget in order to bring the budget in
line with actual operating conditions over the past two winters.
Various chemicals are used to make clean, safe, potable water. The budget process for
this account includes an operational plan by month for the Kansas and Missouri intakes
and the Hansen and Wolcott treatment facilities. The plan is based on projected water
produced, price of chemicals, and dose of chemical required. The budget for 2015 is
increasing primarily due to an increase in the projected total water produced, a slight
increase in chemical prices and a decrease to the budgeted water produced at Wolcott
during January and February when the river level and temperature are likely to reduce
the intake capacity of the horizontal collector well. The decrease to the budgeted
water produced at Wolcott during January and February is effective for the 2015
budget in order to bring the budget in line with actual operating conditions over the
past two winters.
The majority of retirees are covered by AARP which is estimated to increase 3.0%,
however, Blue Cross Blue Shield premiums are projected to increase 4.9%. The
difference in premium increase is primarily due to the difference in how AARP
structures their rates and their risk profile. AARP has a very large risk pool, and is
protected from large losses because Medicare is the primary payer of retiree health
costs. The remaining factor is the increase in the number of retirees who have entered
the plan.
- 20 -
12/12/2014
2014 2015 $ DIF % DIF
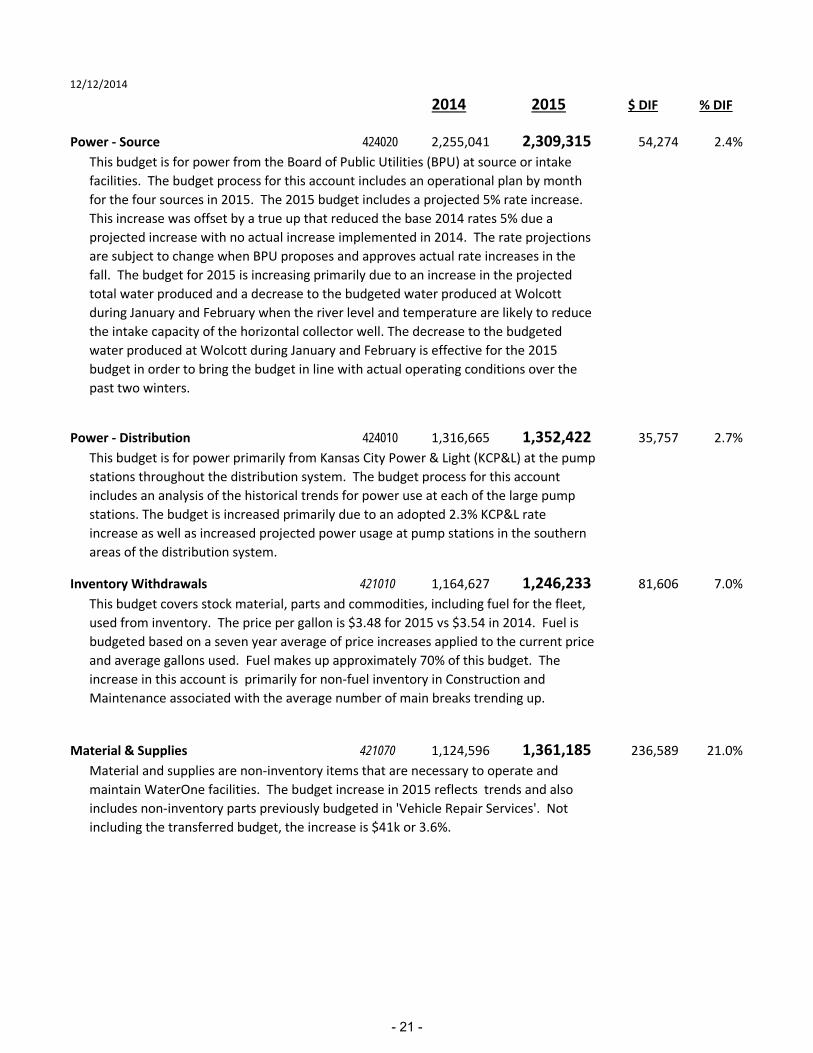
Power ‐ Source 424020 2,255,041 2,309,315 54,274 2.4%
Power ‐ Distribution 424010 1,316,665 1,352,422 35,757 2.7%
Inventory Withdrawals 421010 1,164,627 1,246,233 81,606 7.0%
Material & Supplies 421070 1,124,596 1,361,185 236,589 21.0%
Material and supplies are non‐inventory items that are necessary to operate and
maintain WaterOne facilities. The budget increase in 2015 reflects trends and also
includes non‐inventory parts previously budgeted in 'Vehicle Repair Services'. Not
including the transferred budget, the increase is $41k or 3.6%.
This budget is for power from the Board of Public Utilities (BPU) at source or intake
facilities. The budget process for this account includes an operational plan by month
for the four sources in 2015. The 2015 budget includes a projected 5% rate increase.
This increase was offset by a true up that reduced the base 2014 rates 5% due a
projected increase with no actual increase implemented in 2014. The rate projections
are subject to change when BPU proposes and approves actual rate increases in the
fall. The budget for 2015 is increasing primarily due to an increase in the projected
total water produced and a decrease to the budgeted water produced at Wolcott
during January and February when the river level and temperature are likely to reduce
the intake capacity of the horizontal collector well. The decrease to the budgeted
water produced at Wolcott during January and February is effective for the 2015
budget in order to bring the budget in line with actual operating conditions over the
past two winters.
This budget is for power primarily from Kansas City Power & Light (KCP&L) at the pump
stations throughout the distribution system. The budget process for this account
includes an analysis of the historical trends for power use at each of the large pump
stations. The budget is increased primarily due to an adopted 2.3% KCP&L rate
increase as well as increased projected power usage at pump stations in the southern
areas of the distribution system.
This budget covers stock material, parts and commodities, including fuel for the fleet,
used from inventory. The price per gallon is $3.48 for 2015 vs $3.54 in 2014. Fuel is
budgeted based on a seven year average of price increases applied to the current price
and average gallons used. Fuel makes up approximately 70% of this budget. The
increase in this account is primarily for non‐fuel inventory in Construction and
Maintenance associated with the average number of main breaks trending up.
- 21 -
12/12/2014
2014 2015 $ DIF % DIF
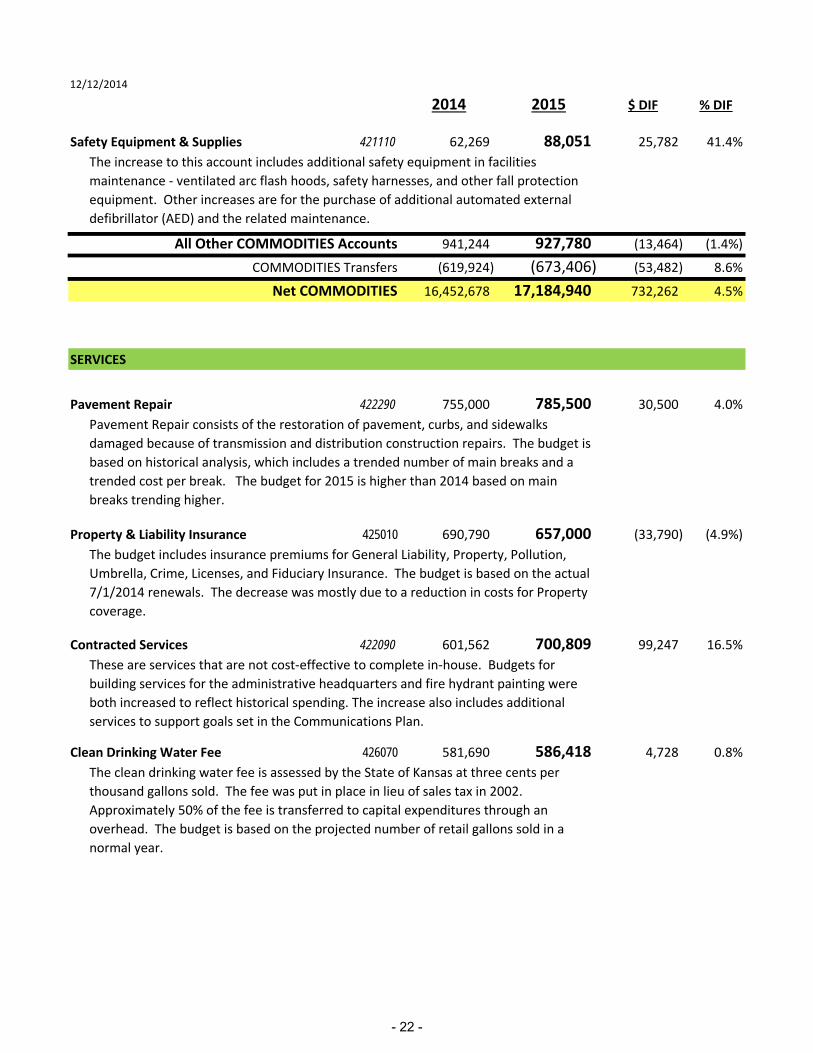
Safety Equipment & Supplies 421110 62,269 88,051 25,782 41.4%
All Other COMMODITIES Accounts 941,244 927,780 (13,464) (1.4%)
COMMODITIES Transfers (619,924) (673,406) (53,482) 8.6%
Net COMMODITIES 16,452,678 17,184,940 732,262 4.5%
SERVICES
Pavement Repair 422290 755,000 785,500 30,500 4.0%
Property & Liability Insurance 425010 690,790 657,000 (33,790) (4.9%)
Contracted Services 422090 601,562 700,809 99,247 16.5%
Clean Drinking Water Fee 426070 581,690 586,418 4,728 0.8%
The budget includes insurance premiums for General Liability, Property, Pollution,
Umbrella, Crime, Licenses, and Fiduciary Insurance. The budget is based on the actual
7/1/2014 renewals. The decrease was mostly due to a reduction in costs for Property
coverage.
These are services that are not cost‐effective to complete in‐house. Budgets for
building services for the administrative headquarters and fire hydrant painting were
both increased to reflect historical spending. The increase also includes additional
services to support goals set in the Communications Plan.
The clean drinking water fee is assessed by the State of Kansas at three cents per
thousand gallons sold. The fee was put in place in lieu of sales tax in 2002.
Approximately 50% of the fee is transferred to capital expenditures through an
overhead. The budget is based on the projected number of retail gallons sold in a
normal year.
The increase to this account includes additional safety equipment in facilities
maintenance ‐ ventilated arc flash hoods, safety harnesses, and other fall protection
equipment. Other increases are for the purchase of additional automated external
defibrillator (AED) and the related maintenance.
Pavement Repair consists of the restoration of pavement, curbs, and sidewalks
damaged because of transmission and distribution construction repairs. The budget is
based on historical analysis, which includes a trended number of main breaks and a
trended cost per break. The budget for 2015 is higher than 2014 based on main
breaks trending higher.
- 22 -

12/12/2014
2014 2015 $ DIF % DIF
PC Software License & Maintenance 426250 511,661 520,061 8,400 1.6%
Water Billing Services 422430 461,733 494,897 33,164 7.2%
Vehicle Repair Services 422420 245,619 50,000 (195,619) (79.6%)
Maintenance Services 422240 234,935 387,635 152,700 65.0%
The budget is for outsourced maintenance services that are not cost‐effective to
complete in‐house. The budget is increasing due to the higher costs of the Kansas
River wells rehab and the first required maintenance contract for the Missouri River
horizontal collector well. The horizontal collector well maintenance work will be
completed by the end of 2014 and the charges will begin amortization during 2015.
Other increases include repairs at the administrative headquarters and additional lab
equipment maintenance.
This category is for outside services for vehicle repair. The more difficult and time
consuming projects are outsourced when in‐house experienced staff is not available.
In previous years this account has included material and supplies utilized during in‐
house vehicle maintenance. The budget for 2015 has been reduced in order to move
those expenses into the material and supplies budget.
The printing and mailing of water bills is outsourced. There are two items in this
budget. The first is water bills, which includes regular, corrected, and final bills. The
budget is developed using actual bills and customer counts. There is a a savings from
the increase in the ebill adoption rate, but this savings is offset by an increase the
number of billing inserts and the corresponding increase in postage and paper costs.
The second part of the budget is for dunning notices, which are budgeted based on
actual history.
1. PC and Application software: SAP, Microsoft, document management system, virus
protection, and miscellaneous software. This portion of the budget has increased
primarily due increases in the annual maintenance contracts for SAP and Microsoft.
2. GIS software: GIS, computer aided design, hydraulic modeling, and SCADA software.
This account decreased slightly in 2015 primarily due to a reduction in the budgeted
annual ESRI contract.
This account covers the District’s software licenses and maintenance on that software.
It is divided into two areas. One area experienced a budget increase while the other
decreased in 2015 which is described below.
- 23 -
12/12/2014
2014 2015 $ DIF % DIF
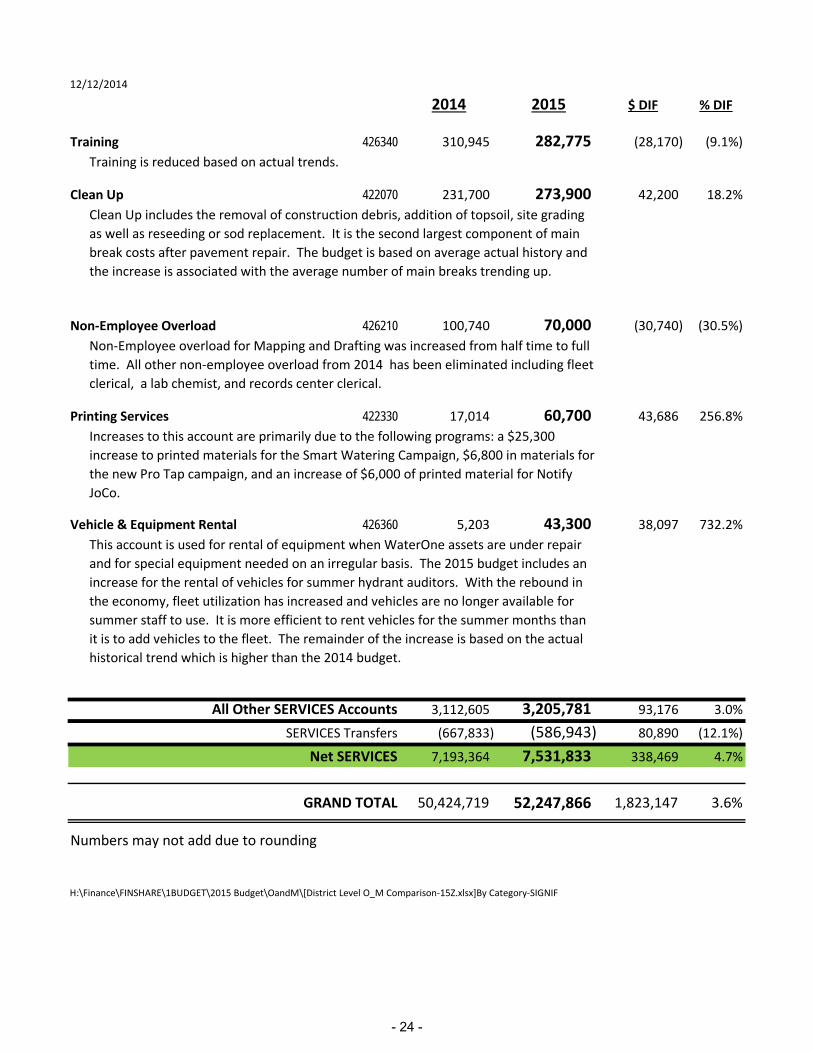
Training 426340 310,945 282,775 (28,170) (9.1%)
Clean Up 422070 231,700 273,900 42,200 18.2%
Non‐Employee Overload 426210 100,740 70,000 (30,740) (30.5%)
Printing Services 422330 17,014 60,700 43,686 256.8%
Vehicle & Equipment Rental 426360 5,203 43,300 38,097 732.2%
All Other SERVICES Accounts 3,112,605 3,205,781 93,176 3.0%
SERVICES Transfers (667,833) (586,943) 80,890 (12.1%)
Net SERVICES 7,193,364 7,531,833 338,469 4.7%
GRAND TOTAL 50,424,719 52,247,866 1,823,147 3.6%
Numbers may not add due to rounding
H:\Finance\FINSHARE\1BUDGET\2015 Budget\OandM\[District Level O_M Comparison‐15Z.xlsx]By Category‐SIGNIF
This account is used for rental of equipment when WaterOne assets are under repair
and for special equipment needed on an irregular basis. The 2015 budget includes an
increase for the rental of vehicles for summer hydrant auditors. With the rebound in
the economy, fleet utilization has increased and vehicles are no longer available for
summer staff to use. It is more efficient to rent vehicles for the summer months than
it is to add vehicles to the fleet. The remainder of the increase is based on the actual
historical trend which is higher than the 2014 budget.
Increases to this account are primarily due to the following programs: a $25,300
increase to printed materials for the Smart Watering Campaign, $6,800 in materials for
the new Pro Tap campaign, and an increase of $6,000 of printed material for Notify
JoCo.
Non‐Employee overload for Mapping and Drafting was increased from half time to full
time. All other non‐employee overload from 2014 has been eliminated including fleet
clerical, a lab chemist, and records center clerical.
Clean Up includes the removal of construction debris, addition of topsoil, site grading
as well as reseeding or sod replacement. It is the second largest component of main
break costs after pavement repair. The budget is based on average actual history and
the increase is associated with the average number of main breaks trending up.
Training is reduced based on actual trends.
- 24 -
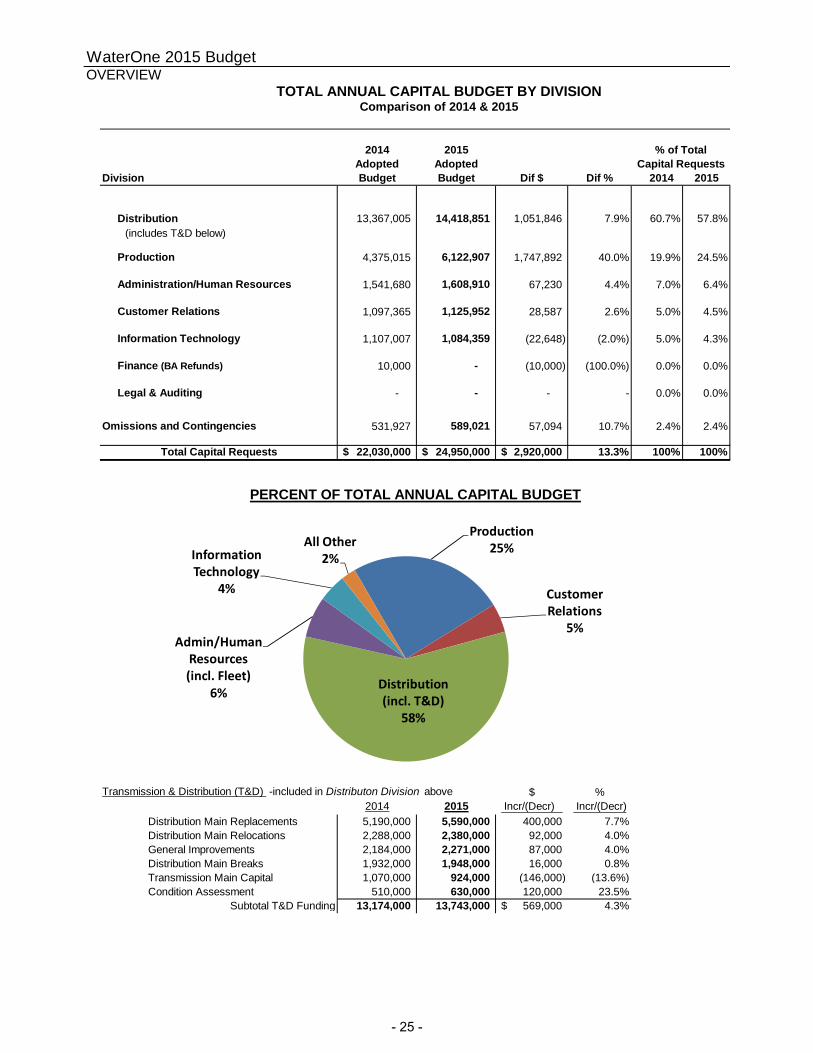
WaterOne 2015 BudgetOVERVIEW
TOTAL ANNUAL CAPITAL BUDGET BY DIVISIONComparison of 2014 & 2015
2014 2015Adopted Adopted
Division Budget Budget Dif $ Dif % 2014 2015
Distribution 13,367,005 14,418,851 1,051,846 7.9% 60.7% 57.8%(includes T&D below)
Production 4,375,015 6,122,907 1,747,892 40.0% 19.9% 24.5%
Administration/Human Resources 1,541,680 1,608,910 67,230 4.4% 7.0% 6.4%
Customer Relations 1,097,365 1,125,952 28,587 2.6% 5.0% 4.5%
Information Technology 1,107,007 1,084,359 (22,648) (2.0%) 5.0% 4.3%
Finance (BA Refunds) 10,000 - (10,000) (100.0%) 0.0% 0.0%
Legal & Auditing - - - - 0.0% 0.0%
Omissions and Contingencies 531,927 589,021 57,094 10.7% 2.4% 2.4%
Total Capital Requests 22,030,000$ 24,950,000$ 2,920,000$ 13.3% 100% 100%
Transmission & Distribution (T&D) -included in Distributon Division above $ %2014 2015 Incr/(Decr) Incr/(Decr)
Distribution Main Replacements 5,190,000 5,590,000 400,000 7.7%Distribution Main Relocations 2,288,000 2,380,000 92,000 4.0%General Improvements 2,184,000 2,271,000 87,000 4.0%Distribution Main Breaks 1,932,000 1,948,000 16,000 0.8%Transmission Main Capital 1,070,000 924,000 (146,000) (13.6%)Condition Assessment 510,000 630,000 120,000 23.5%
Subtotal T&D Funding 13,174,000 13,743,000 569,000$ 4.3%
% of TotalCapital Requests
PERCENT OF TOTAL ANNUAL CAPITAL BUDGET
Production25%
Customer Relations
5%
Distribution (incl. T&D)
58%
Admin/Human Resources (incl. Fleet)
6%
Information Technology
4%
All Other2%
- 25 -

This page intentionally left blank.
- 26 -

WATERONE 2015 BUDGET REVENUES & RATES
2015 REVENUE SUMMARY
OPERATING REVENUE ASSUMPTIONS Comparison of Revenues Revenue Type 2014 Budget 2015 Budget $ Inc<Dec> % Inc<Dec> Sales of Water $100,347,319 $104,958,840 $ 4,611,521 4.6%Other Operating Revenues 1,415,500 1,454,000 38,500 2.7%Investment Income 430,000 460,000 30,000 7.0%Total $102,192,819 $106,872,840 $4,680,021 4.6% Sales of Water Sales of Water in 2015 is projected to increase 4.6% or $4,611,521
An overall 3.8% rate increase is proposed, which will produce $3,882,584 additional water sales revenue.
1,300 new customers will provide additional revenue of $915,837. WaterOne projects new customer growth by analyzing the long term historical average as well as the recent growth trends.
The true-up of 2013 actual and 2014 estimated actual for customer growth caused a revenue increase of $468,395. The 2014 budget for customer growth is 1,000 and the estimated actual is 1,300.
A 1% budgeted reduction in single family residential (R1) gallons per customer caused revenues to decrease by $448,529. A reduction in multi-family residential (M1) and small commercial (C1) gallons per customer caused revenue to decrease $102,885. Trends in residential usage are declining due to more efficient appliances and plumbing fixtures.
The water sales budget is developed assuming “normal” weather which means that average temperature, rainfall, and rain frequency are assumed.
- 27 -
WATERONE 2015 BUDGET REVENUES & RATES
Other Operating Revenues Delayed Payment Charges Delayed Payment Charges are applied to water bills paid after the due date. Budgeted revenues from this source are $570,000 which is no change from the 2014 budget. Field Service Charges Field Service Charges are assessed when service is restored after being shut off for delinquent payment or other rule violations. This category also includes charges assessed for returned checks. Field Service Charges for 2015 are budgeted to be $320,000, which is a 6.7% increase from the 2014 budget. This account is budgeted based on trends which have been increasing. Miscellaneous Revenue Miscellaneous Revenue includes revenue sources from interest income on WaterOne checking accounts, rental income from farm land and wireless phone antennas, sale of miscellaneous equipment, purchasing card revenue sharing, reimbursements from Johnson County Wastewater for WaterOne’s IT time, and HomeServe commissions. It is budgeted that these revenues will total $564,000, an increase of $18,500 or 3.4% when compared to the 2014 budget. This increase is due to increased checking account interest and antenna rental income. The antenna rental income budget is based on scheduled increases agreed upon in the rental contracts . Five of the seven contracts are scheduled to increase in 2015. INVESTMENT INCOME Investment income is earned on invested balances in the General Fund and on Master Plan funds. Investment income in 2015 is budgeted to be $460,000. This is an increase of $30,000 or 7.0% relative to the 2014 budget. The increase is primarily due to a higher projected General Fund balance. NON-OPERATING REVENUE (not a funding source for the Annual Budget) System Development Charges (SDCs) SDCs are paid by new customers when they apply for a service connection permit. They cannot be used for operating expenses and therefore the revenue is not included as a funding source for the annual budget. SDCs are used exclusively at this time to fund Master Plan, though they could be utilized for retirement of debt should the right opportunity arise. For 2015, SDC income is budgeted at $6,311,500 compared to the 2014 budget of $4,855,000. SDCs are conservatively budgeted by assuming that all of the budgeted customer growth will be 5/8” service connections.
- 28 -

WATERONE 2015 BUDGET REVENUES & RATES
WATER RATE STRUCTURE WaterOne uses a Peak Management Rate (PMR) fee structure for water rates. This is an inclining rate structure designed to encourage customers to reduce peak usage. This delays the need for additional capacity and/or recovers costs more equitably from those customers who choose to have peak water usage. PMR rates are designed to charge a higher amount for water usage above the customer’s base usage. Block 1 rates are for volumes up to 125% of the customer’s Average Winter Consumption (AWC). Block 2 rates are for those gallons used in excess of 125% of the customer’s AWC. Each customer’s AWC is calculated individually based on their actual consumption over the prior winter. There is also a Default AWC for each customer class and the customer is given the benefit of whichever is higher. The Default AWC is used when no individual customer AWC is set, such as for new customers. The typical customer is defined by a usage pattern of 7,500 gallons per month. This number of gallons is the benchmark for the American Water Works Association (AWWA). The typical customer’s bill is calculated as follows:
Block Gallons 2015 Rates per 1,000 gallons Total 1 5,930 $3.89 $23.07 2 1,570 $5.19 $8.15
Service Charge NA $11.15 $11.15 7,500 $42.37 The 2015 rate increase requires the typical customer to pay an additional $1.58 per month. The schedule on the following page provides the monthly bill impact for a variety of customers.
- 29 -

Rate Class Meter Monthly Block 1 2014 2015 % Monthly
Size Consumption (In Gallons)
Gallon % Avg Bill Avg Bill Increase/
(Decrease)
Increase/
(Decrease)
AWWA Typical Customer 5/8" 7,500 79% 40.79$ 42.37$ 3.9% 1.58$
Single Family Residential
Low Usage 5/8" 3,662 98% 24.46$ 25.49$ 4.2% 1.03$
Moderate Usage 5/8" 7,212 86% 38.99$ 40.52$ 3.9% 1.53$
High Usage 5/8" 12,061 64% 61.42$ 63.71$ 3.7% 2.29$
Low Usage 1" 4,014 93% 35.80$ 37.68$ 5.3% 1.88$
Moderate Usage 1" 9,597 71% 59.94$ 62.65$ 4.5% 2.71$
High Usage 1" 27,324 40% 143.74$ 149.30$ 3.9% 5.56$
Multi‐Family Residential
Low Usage 1" 10,087 99% 61.05$ 63.87$ 4.6% 2.82$
Moderate Usage 1" 20,463 97% 100.71$ 104.90$ 4.2% 4.19$
High Usage 1" 44,901 76% 205.40$ 213.17$ 3.8% 7.77$
Low Usage 1 1/2" 22,503 99% 125.90$ 130.53$ 3.7% 4.63$
Moderate Usage 1 1/2" 40,447 98% 194.10$ 201.09$ 3.6% 6.99$
High Usage 1 1/2" 91,255 74% 414.01$ 428.53$ 3.5% 14.52$
Low Usage 2" 26,213 99% 159.39$ 164.81$ 3.4% 5.42$
Moderate Usage 2" 51,055 97% 254.40$ 263.10$ 3.4% 8.70$
High Usage 2" 143,952 67% 661.61$ 684.23$ 3.4% 22.62$
Small Commercial
Low Usage 5/8" 631 99% 15.58$ 16.36$ 5.0% 0.78$
Moderate Usage 5/8" 2,666 93% 23.46$ 24.51$ 4.5% 1.05$
High Usage 5/8" 17,979 63% 89.18$ 92.49$ 3.7% 3.31$
Low Usage 3/4" 1,546 97% 22.47$ 23.38$ 4.0% 0.91$
Moderate Usage 3/4" 7,929 73% 49.11$ 50.93$ 3.7% 1.82$
High Usage 3/4" 37,045 42% 182.96$ 189.34$ 3.5% 6.38$
Low Usage 1" 2,630 98% 32.95$ 34.80$ 5.6% 1.85$
Moderate Usage 1" 12,543 80% 73.32$ 76.55$ 4.4% 3.23$
High Usage 1" 51,618 51% 248.95$ 258.17$ 3.7% 9.22$
Large Commercial
Low Usage 1 1/2" 13,793 89% 94.77$ 98.33$ 3.8% 3.56$
High Usage 1 1/2" 104,689 59% 488.71$ 505.74$ 3.5% 17.03$
Low Usage 2" 25,028 92% 157.13$ 162.46$ 3.4% 5.33$
High Usage 2" 175,355 65% 797.17$ 824.42$ 3.4% 27.25$
Low Usage 3" 100,277 90% 527.08$ 544.91$ 3.4% 17.83$
High Usage 3" 522,029 69% 2,304.14$ 2,382.87$ 3.4% 78.73$
Low Usage 4" 327,298 96% 1,474.43$ 1,512.91$ 2.6% 38.48$
High Usage 4" 2,872,859 77% 11,861.81$ 12,257.11$ 3.3% 395.30$
Proposed
Monthly Bill Impact
By Rate Class and Meter Size
- 30 -

HISTORY OF WATER SALES BY RATE CLASS
Wet Normal Very Dry Normal Normal Normal
In Million $'s 2010 2011 2012 20132014
Budget2015
BudgetR1 52.0$ 59.4$ 74.3$ 63.0$ 64.0$ 66.8$ M1 7.7$ 8.3$ 9.5$ 9.0$ 9.7$ 10.2$ C1 4.4$ 5.1$ 6.4$ 5.3$ 5.4$ 5.8$ C2 16.4$ 18.9$ 24.0$ 19.9$ 20.9$ 22.0$ C3 0.3$ 0.3$ 0.5$ 0.4$ 0.4$ 0.3$ W1 -$ -$ -$ -$ -$ -$
Total 80.9$ 92.0$ 114.7$ 97.6$ 100.3$ 105.0$
R1 = Single Family Residential C2 = Large CommercialM1 = Multi-Family Residential C3 = Temporary CommercialC1 = Small Commercial W1 = Wholesale
H:\Finance\FINSHARE\1BUDGET\2015 Budget\BOARD Budget Draft\05-Revenues and Rates\[2015 Summary Charts.xls]SalesHistory 2015 8/27/14 9:25 AM
$0
$10
$20
$30
$40
$50
$60
$70
$80
$90
$100
$110
$120
$130
2010 2011 2012 2013 2014Budget
2015Budget
W1
C3
C2
C1
M1
R1
Millions
- 31 -
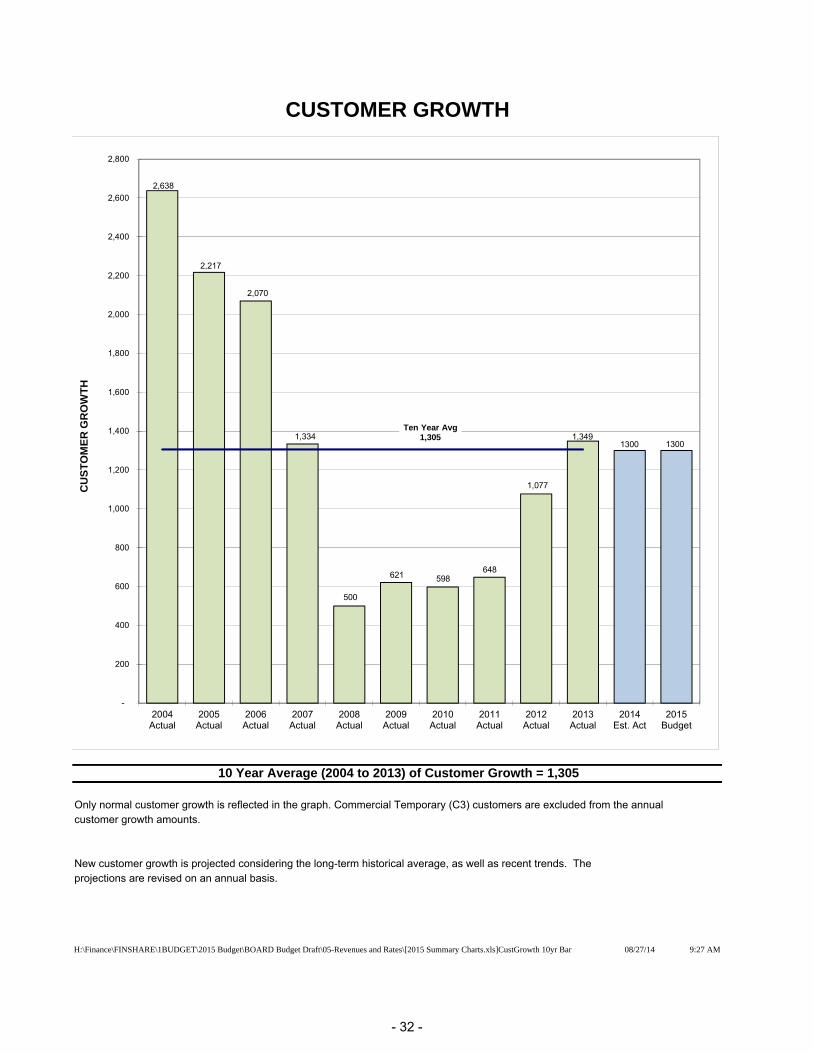
CUSTOMER GROWTH
Only normal customer growth is reflected in the graph. Commercial Temporary (C3) customers are excluded from the annualcustomer growth amounts.
New customer growth is projected considering the long-term historical average, as well as recent trends. Theprojections are revised on an annual basis.
H:\Finance\FINSHARE\1BUDGET\2015 Budget\BOARD Budget Draft\05-Revenues and Rates\[2015 Summary Charts.xls]CustGrowth 10yr Bar 08/27/14 9:27 AM
10 Year Average (2004 to 2013) of Customer Growth = 1,305
2,638
2,217
2,070
1,334
500
621 598 648
1,077
1,349 1300 1300
-
200
400
600
800
1,000
1,200
1,400
1,600
1,800
2,000
2,200
2,400
2,600
2,800
2004Actual
2005Actual
2006Actual
2007Actual
2008Actual
2009Actual
2010Actual
2011Actual
2012Actual
2013Actual
2014Est. Act
2015Budget
CU
ST
OM
ER
GR
OW
TH
Ten Year Avg 1,305
- 32 -
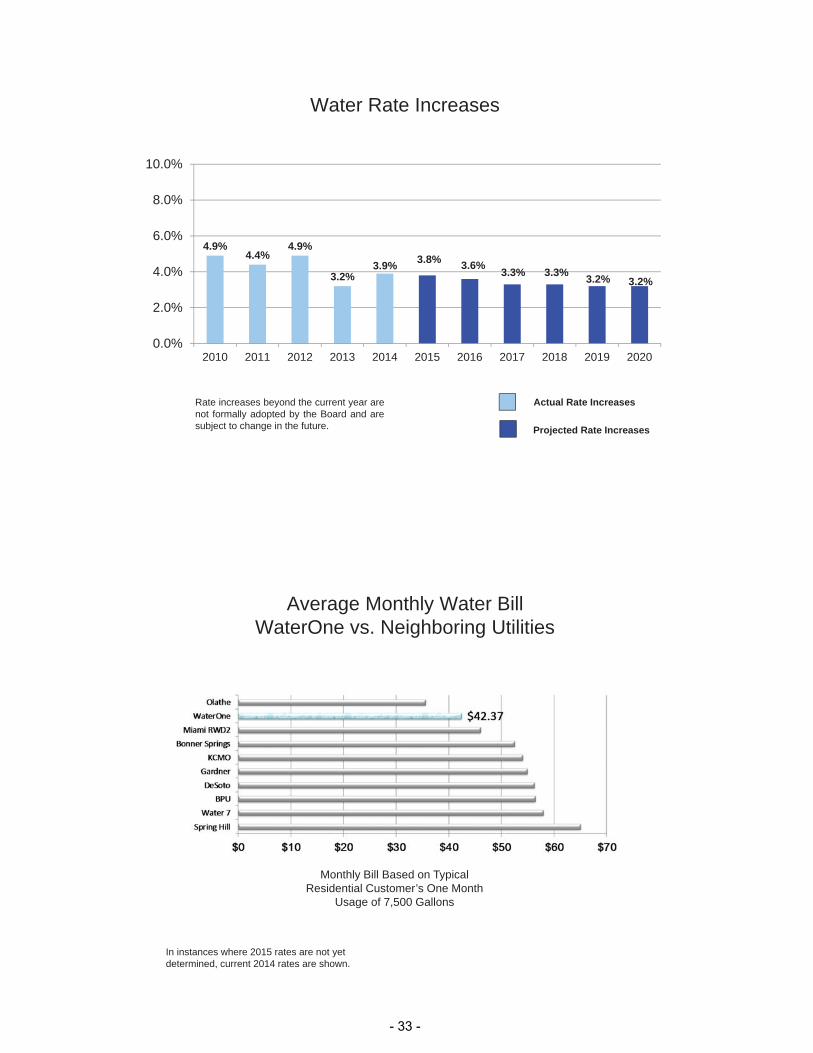
Water Rate Increases
Actual Rate Increases
Projected Rate Increases
Rate increases beyond the current year arenot formally adopted by the Board and aresubject to change in the future.
4.9%4.4%
4.9%
3.2%3.9% 3.8% 3.6% 3.3% 3.3% 3.2% 3.2%
0.0%
2.0%
4.0%
6.0%
8.0%
10.0%
2010 2011 2012 2013 2014 2015 2016 2017 2018 2019 2020
Monthly Bill Based on Typical Residential Customer’s One Month
Usage of 7,500 Gallons
Average Monthly Water BillWaterOne vs. Neighboring Utilities
In instances where 2015 rates are not yet determined, current 2014 rates are shown.
- 33 -
$20
$30
$40
$50
$60
$70
2010 2011 2012 2013 2014 2015 2016 2017 2018 2019 2020
WaterOne CPI (a)
4.9% 4.4% 4.9% 3.2% 3.9% 3.8% 3.6% 3.3% 3.3% 3.2% 3.2%
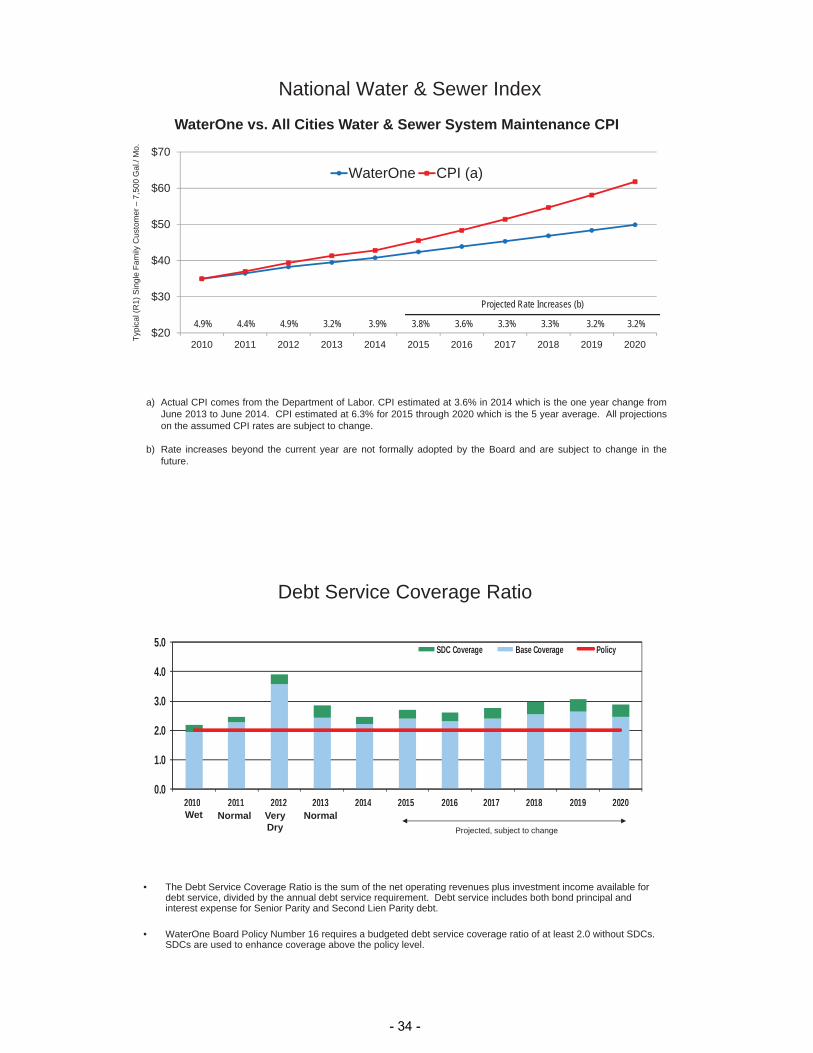
National Water & Sewer Index
Typi
cal (
R1)
Sin
gle
Fam
ily C
usto
mer
–7,
500
Gal
./ M
o.WaterOne vs. All Cities Water & Sewer System Maintenance CPI
Projected Rate Increases (b)
a) Actual CPI comes from the Department of Labor. CPI estimated at 3.6% in 2014 which is the one year change fromJune 2013 to June 2014. CPI estimated at 6.3% for 2015 through 2020 which is the 5 year average. All projectionson the assumed CPI rates are subject to change.
b) Rate increases beyond the current year are not formally adopted by the Board and are subject to change in thefuture.
0.0
1.0
2.0
3.0
4.0
5.0
2010 2011 2012 2013 2014 2015 2016 2017 2018 2019 2020
SDC Coverage Base Coverage Policy
• The Debt Service Coverage Ratio is the sum of the net operating revenues plus investment income available for debt service, divided by the annual debt service requirement. Debt service includes both bond principal and interest expense for Senior Parity and Second Lien Parity debt.
• WaterOne Board Policy Number 16 requires a budgeted debt service coverage ratio of at least 2.0 without SDCs. SDCs are used to enhance coverage above the policy level.
Projected, subject to change
Debt Service Coverage Ratio
Wet Normal Very Dry
Normal
- 34 -

WaterOne 2015 BudgetO&M
OPERATIONS & MAINTENANCE BUDGET BY DIVISIONComparison of 2014 & 2015
2014 2015Division Budget Budget $ Dif % Dif 2014 2015
Production 24,728,594$ 25,363,183$ 634,589$ 2.6% 49.0% 48.5%
Distribution 9,621,095 10,156,992 535,896 5.6% 19.1% 19.4%
Admin/Human Resources 4,670,131 4,727,708 57,577 1.2% 9.3% 9.0%
Customer Relations 4,043,489 4,068,893 25,404 0.6% 8.0% 7.8%
Information Technology 3,432,994 3,899,542 466,548 13.6% 6.8% 7.5%
Finance 1,852,854 1,964,957 112,103 6.1% 3.7% 3.8%
Legal & Auditing 1,501,571 1,490,317 (11,254) (0.7%) 3.0% 2.9%
General Manager 573,990 576,274 2,284 0.4% 1.1% 1.1%
TOTAL 50,424,719$ 52,247,866$ 1,823,147$ 3.6% 100% 100%(totals may not add due to rounding)
PERCENT OF TOTAL BUDGET BY DIVISION
H:\Finance\FINSHARE\1BUDGET\2015 Budget\OandM\[District Level O_M Comparison-15Z.xlsx]CY vs. PY by div
% of TotalO&M Requests
Production 48.5%
Distribution 19.4% Information
Technology 7.5%
Customer Relations 7.8%
Finance 3.8%
Admin/Human Resources
9.0%
Legal & Auditing 2.9%
General Manager 1.1%
- 35 -

WaterOne 2015 Budget
Operations and Maintenance
2015 Budget Compared to 2014 Budget
O&M ACCOUNTS BY CATEGORY
H:\Finance\FINSHARE\1BUDGET\2015 Budget\OandM\[District Level O_M Comparison‐15Z.xlsx]By Category‐ALL ACCTS
12/12/2014
2014 2015 $ DIF % DIF
PAYROLL
Labor ‐ Non OT 410010 23,088,044 23,892,933 804,889 3.5%
Labor ‐ OT 410015 981,943 989,258 7,315 0.7%
Water Board Salaries 410080 51,600 51,600 ‐ 0.0%
Labor ‐ Vacation Earned 410020 25,002 25,000 (2) 0.0%
TOTAL PAYROLL BEFORE TRANSFERS 24,146,589 24,958,791 812,202 3.4%
PAYROLL Transfers (5,810,709) (5,862,612) (51,903) 0.9%
Net PAYROLL 18,335,880 19,096,179 760,299 4.1%
BENEFITS
Employee Insurance ‐ Health 413010 3,879,201 4,176,450 297,249 7.7%
Pension ‐ Defined Benefit 412010 3,063,086 2,656,864 (406,222) ‐13.3%
Pension ‐ Cash Balance Plan 412050 ‐ 55,426 55,426 NA
Pension ‐ Defined Contribution (Old) District 412020 553,607 461,789 (91,818) ‐16.6%
Pension ‐ Defined Contribution (New) District 412052 ‐ 72,956 72,956 NA
Pension ‐ Defined Contribution (Old) Match 412030 380,882 317,711 (63,171) ‐16.6%
Pension ‐ Defined Contribution (New) Match 412051 ‐ 65,661 65,661 NA
FICA 411010 1,739,247 1,802,440 63,193 3.6%
Worker's Compensation 411020 554,975 542,874 (12,101) ‐2.2%
Other Post Employment Benefits (OPEB) 412040 600,000 400,000 (200,000) ‐33.3%
Retirees Insurance ‐ Health 413050 240,119 292,881 52,762 22.0%
Employee Insurance ‐ Dental 413020 213,925 228,256 14,331 6.7%
Retirees Insurance ‐ Health Subsidy 413052 136,000 110,000 (26,000) ‐19.1%
Employee Health ‐ Retiree Subsidy 413015 (136,000) (110,000) 26,000 ‐19.1%
Employee Insurance ‐ Life 413030 90,594 96,663 6,069 6.7%
Other Tangible Employee Benefits 414030 67,680 77,840 10,160 15.0%
Employee Insurance ‐ Long Term Disability 413040 69,199 75,802 6,603 9.5%
Car Allowance ‐ Employees 426065 51,700 53,700 2,000 3.9%
Employee Insurance ‐ Vision 413025 47,683 51,847 4,164 8.7%
Compensation & Benefits Consulting Services 414020 35,000 42,000 7,000 20.0%
Unemployment Insurance 411050 23,114 28,899 5,785 25.0%
Health Related Training & Counseling 414060 26,647 28,629 1,982 7.4%
Employees Association Activity 414040 19,422 20,437 1,015 5.2%
Tuition Reimbursement 414100 20,000 20,000 ‐ 0.0%
Service Awards 414070 18,200 17,950 (250) ‐1.4%
WOW & Water Spout Awards 414090 10,000 10,000 ‐ 0.0%
Bold = See 'Overview' for more- 36 -

WaterOne 2015 Budget
Operations and Maintenance
12/12/2014
2014 2015 $ DIF % DIF
125D Flexible Benefit Plan 414010 11,014 9,993 (1,021) ‐9.3%
Retirees Insurance ‐ Life 413060 4,822 5,407 585 12.1%
Flowers, Cards, Memorials 414050 2,500 2,500 ‐ 0.0%
Vending Costs & Revenues 414080 (3,600) (3,600) ‐ 0.0%
Worker's Comp ‐ Returns Of Premium/Divid 411030 (60,000) (60,000) ‐ 0.0%
TOTAL BENEFITS BEFORE TRANSFERS 11,659,017 11,551,375 (107,642) ‐0.9%
BENEFITS Transfers (3,216,220) (3,116,461) 99,759 ‐3.1%
Net BENEFITS 8,442,797 8,434,914 (7,883) ‐0.1%
COMMODITIES
Chemicals ‐ Water Treatment 424070 5,830,025 6,073,358 243,333 4.2%
Power ‐ Transmission 424030 4,378,135 4,500,002 121,867 2.8%
Power ‐ Source 424020 2,255,041 2,309,315 54,274 2.4%
Material & Supplies 421070 1,124,596 1,361,185 236,589 21.0%
Power ‐ Distribution 424010 1,316,665 1,352,422 35,757 2.7%
Inventory Withdrawals 421010 1,164,627 1,246,233 81,606 7.0%
Electricity 424040 204,910 203,500 (1,410) ‐0.7%
Natural Gas 424050 182,600 172,000 (10,600) ‐5.8%
BPU Water Purchased In‐House 424065 178,000 166,518 (11,482) ‐6.5%
Safety Equipment & Supplies 421110 62,269 88,051 25,782 41.4%
Uniforms 421160 84,688 87,860 3,172 3.7%
Small Tools & Equip 421130 49,227 72,452 23,225 47.2%
On‐Line Analyzer Supplies 421090 60,000 60,000 ‐ 0.0%
Office Supplies 421080 37,920 37,885 (35) ‐0.1%
Kitchen Supplies 421040 35,000 35,000 ‐ 0.0%
Other General Settlement 599000 24,329 27,900 3,571 14.7%
Crushed Rock 421020 26,000 27,200 1,200 4.6%
Postage 426280 22,520 22,500 (20) ‐0.1%
Paper & Print Shop Supplies 421100 10,000 10,000 ‐ 0.0%
OT Meals 426230 5,950 5,410 (540) ‐9.1%
Medical & First Aid Supplies 421060 4,100 4,100 ‐ 0.0%
Software ‐ Misc Small Purchases 421140 10,000 4,000 (6,000) ‐60.0%
Proactive Safety Recognition 421120 3,000 4,000 1,000 33.3%
Envelopes 421030 3,500 3,500 ‐ 0.0%
Topsoil 421150 1,500 1,750 250 16.7%
Warm Water For Ice Control 424080 4,000 ‐ (4,000) ‐100.0%
Hardware ‐ Misc Small Purchases 421035 5,000 ‐ (5,000) ‐100.0%
Cash Discount Taken 426560 (11,000) (17,795) (6,795) 61.8%
TOTAL COMMODITIES BEFORE TRANSFERS 17,072,602 17,858,346 785,744 4.6%
COMMODITIES Transfers (619,924) (673,406) (53,482) 8.6%
Net COMMODITIES 16,452,678 17,184,940 732,262 4.5%
Bold = See 'Overview' for more- 37 -

WaterOne 2015 Budget
Operations and Maintenance
12/12/2014
2014 2015 $ DIF % DIF
SERVICES
Pavement Repair 422290 755,000 785,500 30,500 4.0%
Contracted Services 422090 601,562 700,809 99,247 16.5%
Property & Liability Insurance 425010 690,790 657,000 (33,790) ‐4.9%
Clean Drinking Water Fee 426070 581,690 586,418 4,728 0.8%
PC Software License & Maintenance 426250 511,661 520,061 8,400 1.6%
Water Billing Services 422430 461,733 494,897 33,164 7.2%
Maintenance Services 422240 234,935 387,635 152,700 65.0%
Security and/or Security Guards 422340 368,000 381,903 13,903 3.8%
Training 426340 310,945 282,775 (28,170) ‐9.1%
Clean Up 422070 231,700 273,900 42,200 18.2%
Uncollectible Accounts 426350 200,000 219,685 19,685 9.8%
Communications 423100 179,200 201,500 22,300 12.4%
Data Connection 423030 199,200 199,200 ‐ 0.0%
Maintenance ‐ PC & Server Hardware 422210 152,190 173,381 21,191 13.9%
Engineering 422100 147,500 147,500 ‐ 0.0%
Wireless Phone 423120 157,900 147,160 (10,740) ‐6.8%
Kansas River Water Assurance Dist. (KRWAD) 426190 118,000 139,128 21,128 17.9%
Laboratory Services 422170 157,859 137,859 (20,000) ‐12.7%
Mowing & Landscaping 422270 105,001 108,759 3,758 3.6%
Cleaning & Inspecting Facilities 422080 97,928 100,484 2,555 2.6%
Land Based Telecommunications 423070 61,000 74,000 13,000 21.3%
Non‐Employee Overload 426210 100,740 70,000 (30,740) ‐30.5%
Dues & Local Meetings 426120 55,255 63,962 8,707 15.8%
Meter Reading ‐ AMR Services 422260 66,944 62,190 (4,754) ‐7.1%
Property Tax Assessment 426290 63,291 61,853 (1,438) ‐2.3%
Printing Services 422330 17,014 60,700 43,686 256.8%
Property & Liability Insurance ‐ Self Ins. 425030 60,000 60,000 ‐ 0.0%
Bank Lockbox Processing Fees 426060 60,500 59,400 (1,100) ‐1.8%
Checking Account Service Fees 426040 54,000 55,000 1,000 1.9%
Contractual Fee To Consol. Gov. Wy'dot. 426090 52,500 52,500 ‐ 0.0%
Vehicle Repair Services 422420 245,619 50,000 (195,619) ‐79.6%
KS State Water Analysis 422160 50,000 50,000 ‐ 0.0%
Wireless Broadband and Long Dist 423060 50,460 48,312 (2,148) ‐4.3%
Subscriptions & Reference Materials 426330 36,540 47,369 10,829 29.6%
AWWA Research Foundation Fees 426030 54,183 45,000 (9,183) ‐16.9%
Recruitment Costs 426130 45,000 45,000 ‐ 0.0%
Financial Advisory Services 422120 39,375 44,870 5,495 14.0%
Bold = See 'Overview' for more- 38 -
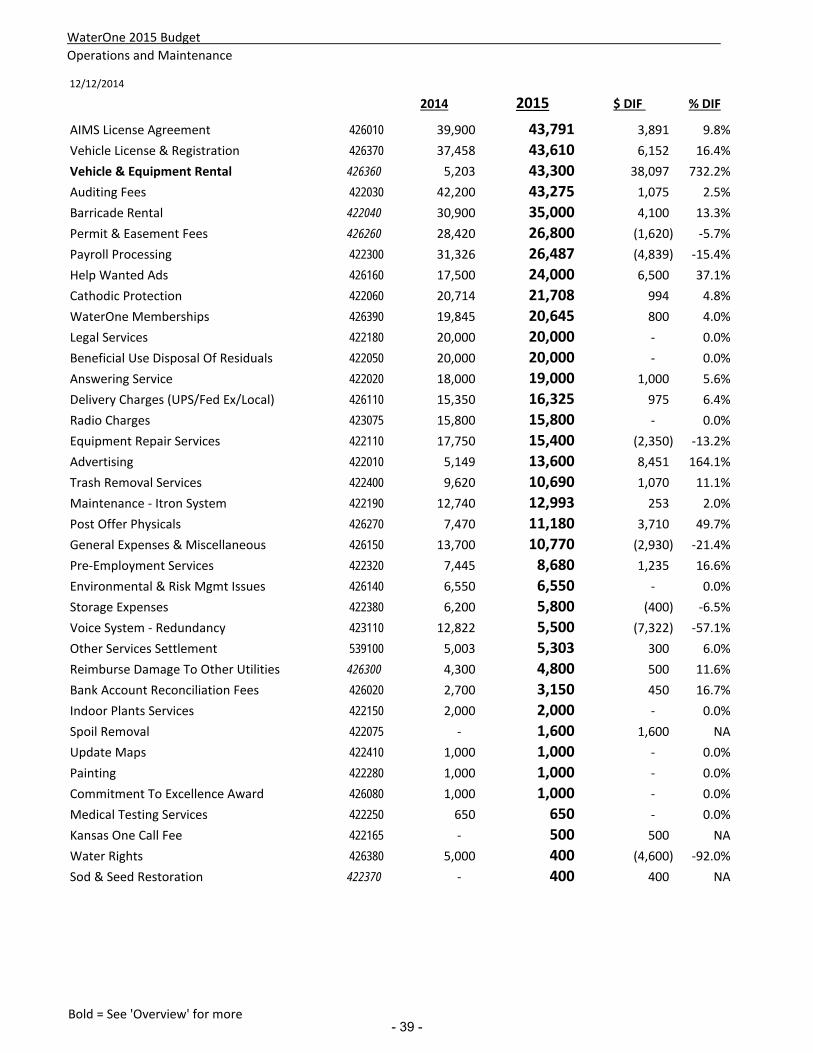
WaterOne 2015 Budget
Operations and Maintenance
12/12/2014
2014 2015 $ DIF % DIF
AIMS License Agreement 426010 39,900 43,791 3,891 9.8%
Vehicle License & Registration 426370 37,458 43,610 6,152 16.4%
Vehicle & Equipment Rental 426360 5,203 43,300 38,097 732.2%
Auditing Fees 422030 42,200 43,275 1,075 2.5%
Barricade Rental 422040 30,900 35,000 4,100 13.3%
Permit & Easement Fees 426260 28,420 26,800 (1,620) ‐5.7%
Payroll Processing 422300 31,326 26,487 (4,839) ‐15.4%
Help Wanted Ads 426160 17,500 24,000 6,500 37.1%
Cathodic Protection 422060 20,714 21,708 994 4.8%
WaterOne Memberships 426390 19,845 20,645 800 4.0%
Legal Services 422180 20,000 20,000 ‐ 0.0%
Beneficial Use Disposal Of Residuals 422050 20,000 20,000 ‐ 0.0%
Answering Service 422020 18,000 19,000 1,000 5.6%
Delivery Charges (UPS/Fed Ex/Local) 426110 15,350 16,325 975 6.4%
Radio Charges 423075 15,800 15,800 ‐ 0.0%
Equipment Repair Services 422110 17,750 15,400 (2,350) ‐13.2%
Advertising 422010 5,149 13,600 8,451 164.1%
Trash Removal Services 422400 9,620 10,690 1,070 11.1%
Maintenance ‐ Itron System 422190 12,740 12,993 253 2.0%
Post Offer Physicals 426270 7,470 11,180 3,710 49.7%
General Expenses & Miscellaneous 426150 13,700 10,770 (2,930) ‐21.4%
Pre‐Employment Services 422320 7,445 8,680 1,235 16.6%
Environmental & Risk Mgmt Issues 426140 6,550 6,550 ‐ 0.0%
Storage Expenses 422380 6,200 5,800 (400) ‐6.5%
Voice System ‐ Redundancy 423110 12,822 5,500 (7,322) ‐57.1%
Other Services Settlement 539100 5,003 5,303 300 6.0%
Reimburse Damage To Other Utilities 426300 4,300 4,800 500 11.6%
Bank Account Reconciliation Fees 426020 2,700 3,150 450 16.7%
Indoor Plants Services 422150 2,000 2,000 ‐ 0.0%
Spoil Removal 422075 ‐ 1,600 1,600 NA
Update Maps 422410 1,000 1,000 ‐ 0.0%
Painting 422280 1,000 1,000 ‐ 0.0%
Commitment To Excellence Award 426080 1,000 1,000 ‐ 0.0%
Medical Testing Services 422250 650 650 ‐ 0.0%
Kansas One Call Fee 422165 ‐ 500 500 NA
Water Rights 426380 5,000 400 (4,600) ‐92.0%
Sod & Seed Restoration 422370 ‐ 400 400 NA
Bold = See 'Overview' for more- 39 -

WaterOne 2015 Budget
Operations and Maintenance
12/12/2014
2014 2015 $ DIF % DIF
Interest On Security Deposits 426170 454 360 (94) ‐20.7%
Maintenance ‐ Telephone System 422230 10,000 ‐ (10,000) ‐100.0%
Site Visit & Investigation Costs 426325 2,000 ‐ (2,000) ‐100.0%
Property & Liability Insurance ‐ Return 425020 (5,000) ‐ 5,000 ‐100.0%
Job Work Revenue Credits 426180 (6,187) (20,000) (13,813) 223.3%
TOTAL SERVICES BEFORE TRANSFERS 7,861,197 8,118,776 257,579 3.3%
SERVICES Transfers (667,833) (586,943) 80,890 ‐12.1%
Net SERVICES 7,193,364 7,531,833 338,469 4.7%
GRAND TOTAL 50,424,719 52,247,866 1,823,147 3.6%
Numbers may not add due to rounding
Bold = See 'Overview' for more- 40 -
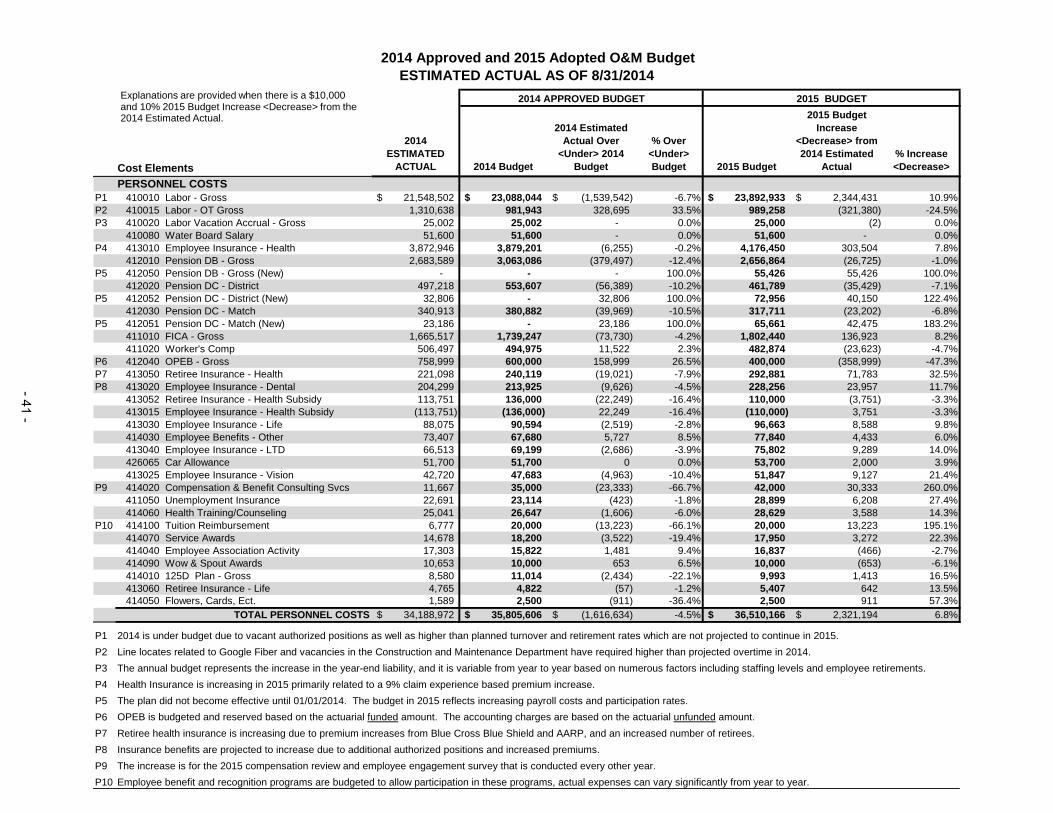
2015 BUDGET
Cost Elements
2014 ESTIMATED
ACTUAL 2014 Budget
2014 Estimated Actual Over
<Under> 2014 Budget
% Over <Under> Budget 2015 Budget
2015 Budget Increase
<Decrease> from 2014 Estimated
Actual % Increase <Decrease>
PERSONNEL COSTSP1 410010 Labor - Gross 21,548,502$ 23,088,044$ (1,539,542)$ -6.7% 23,892,933$ 2,344,431$ 10.9%P2 410015 Labor - OT Gross 1,310,638 981,943 328,695 33.5% 989,258 (321,380) -24.5%P3 410020 Labor Vacation Accrual - Gross 25,002 25,002 - 0.0% 25,000 (2) 0.0%
410080 Water Board Salary 51,600 51,600 - 0.0% 51,600 - 0.0%P4 413010 Employee Insurance - Health 3,872,946 3,879,201 (6,255) -0.2% 4,176,450 303,504 7.8%
412010 Pension DB - Gross 2,683,589 3,063,086 (379,497) -12.4% 2,656,864 (26,725) -1.0%P5 412050 Pension DB - Gross (New) - - - 100.0% 55,426 55,426 100.0%
412020 Pension DC - District 497,218 553,607 (56,389) -10.2% 461,789 (35,429) -7.1%P5 412052 Pension DC - District (New) 32,806 - 32,806 100.0% 72,956 40,150 122.4%
412030 Pension DC - Match 340,913 380,882 (39,969) -10.5% 317,711 (23,202) -6.8%P5 412051 Pension DC - Match (New) 23,186 - 23,186 100.0% 65,661 42,475 183.2%
411010 FICA - Gross 1,665,517 1,739,247 (73,730) -4.2% 1,802,440 136,923 8.2% 411020 Worker's Comp 506,497 494,975 11,522 2.3% 482,874 (23,623) -4.7%
P6 412040 OPEB - Gross 758,999 600,000 158,999 26.5% 400,000 (358,999) -47.3%P7 413050 Retiree Insurance - Health 221,098 240,119 (19,021) -7.9% 292,881 71,783 32.5%P8 413020 Employee Insurance - Dental 204,299 213,925 (9,626) -4.5% 228,256 23,957 11.7%
413052 Retiree Insurance - Health Subsidy 113,751 136,000 (22,249) -16.4% 110,000 (3,751) -3.3% 413015 Employee Insurance - Health Subsidy (113,751) (136,000) 22,249 -16.4% (110,000) 3,751 -3.3% 413030 Employee Insurance - Life 88,075 90,594 (2,519) -2.8% 96,663 8,588 9.8% 414030 Employee Benefits - Other 73,407 67,680 5,727 8.5% 77,840 4,433 6.0% 413040 Employee Insurance - LTD 66,513 69,199 (2,686) -3.9% 75,802 9,289 14.0% 426065 Car Allowance 51,700 51,700 0 0.0% 53,700 2,000 3.9% 413025 Employee Insurance - Vision 42,720 47,683 (4,963) -10.4% 51,847 9,127 21.4%
P9 414020 Compensation & Benefit Consulting Svcs 11,667 35,000 (23,333) -66.7% 42,000 30,333 260.0% 411050 Unemployment Insurance 22,691 23,114 (423) -1.8% 28,899 6,208 27.4% 414060 Health Training/Counseling 25,041 26,647 (1,606) -6.0% 28,629 3,588 14.3%
P10 414100 Tuition Reimbursement 6,777 20,000 (13,223) -66.1% 20,000 13,223 195.1% 414070 Service Awards 14,678 18,200 (3,522) -19.4% 17,950 3,272 22.3% 414040 Employee Association Activity 17,303 15,822 1,481 9.4% 16,837 (466) -2.7% 414090 Wow & Spout Awards 10,653 10,000 653 6.5% 10,000 (653) -6.1% 414010 125D Plan - Gross 8,580 11,014 (2,434) -22.1% 9,993 1,413 16.5% 413060 Retiree Insurance - Life 4,765 4,822 (57) -1.2% 5,407 642 13.5% 414050 Flowers, Cards, Ect. 1,589 2,500 (911) -36.4% 2,500 911 57.3%
TOTAL PERSONNEL COSTS 34,188,972$ 35,805,606$ (1,616,634)$ -4.5% 36,510,166$ 2,321,194$ 6.8%
P1 2014 is under budget due to vacant authorized positions as well as higher than planned turnover and retirement rates which are not projected to continue in 2015.P2 Line locates related to Google Fiber and vacancies in the Construction and Maintenance Department have required higher than projected overtime in 2014. P3 The annual budget represents the increase in the year-end liability, and it is variable from year to year based on numerous factors including staffing levels and employee retirements.P4 Health Insurance is increasing in 2015 primarily related to a 9% claim experience based premium increase.P5 The plan did not become effective until 01/01/2014. The budget in 2015 reflects increasing payroll costs and participation rates. P6 OPEB is budgeted and reserved based on the actuarial funded amount. The accounting charges are based on the actuarial unfunded amount.P7 Retiree health insurance is increasing due to premium increases from Blue Cross Blue Shield and AARP, and an increased number of retirees. P8 Insurance benefits are projected to increase due to additional authorized positions and increased premiums.P9 The increase is for the 2015 compensation review and employee engagement survey that is conducted every other year.P10 Employee benefit and recognition programs are budgeted to allow participation in these programs, actual expenses can vary significantly from year to year.
2014 APPROVED BUDGET
ESTIMATED ACTUAL AS OF 8/31/20142014 Approved and 2015 Adopted O&M Budget
Explanations are provided when there is a $10,000 and 10% 2015 Budget Increase <Decrease> from the 2014 Estimated Actual.
- 41 -

2015 BUDGET
Cost Elements
2014 ESTIMATED
ACTUAL 2014 Budget
2014 Estimated Actual Over
<Under> 2014 Budget
% Over <Under> Budget 2015 Budget
2015 Budget Increase
<Decrease> from 2014 Estimated
Actual % Increase <Decrease>
2014 APPROVED BUDGET
ESTIMATED ACTUAL AS OF 8/31/20142014 Approved and 2015 Adopted O&M Budget
Explanations are provided when there is a $10,000 and 10% 2015 Budget Increase <Decrease> from the 2014 Estimated Actual.
COMMODITIES 424070 Chemicals - Water Treatment 5,937,890$ 5,830,025$ 107,865$ 1.9% 6,073,358$ 135,468$ 2.3%
C1 424030 Power - Treatment 4,015,338 4,378,135 (362,797) -8.3% 4,500,002 484,664 12.1%C1 424020 Power - Source 1,986,292 2,255,041 (268,749) -11.9% 2,309,315 323,023 16.3%
421070 Material & Supplies 1,277,741 1,124,596 153,145 13.6% 1,361,185 83,444 6.5% 424010 Power - Distribution 1,333,953 1,316,665 17,288 1.3% 1,352,422 18,469 1.4% 421010 Inventory Withdrawals 1,207,564 1,164,627 42,937 3.7% 1,246,233 38,669 3.2% 424040 Electricity 192,605 204,910 (12,305) -6.0% 203,500 10,895 5.7%
C2 424050 Natural Gas 194,446 182,600 11,846 6.5% 172,000 (22,446) -11.5%C3 424065 Water Purchased In House 111,466 178,000 (66,534) -37.4% 166,518 55,052 49.4%C4 421110 Safety Equip & Supplies 69,310 62,269 7,041 11.3% 88,051 18,741 27.0%
421160 Uniforms 85,811 84,688 1,123 1.3% 87,860 2,049 2.4% 421130 Small Tools & Equipment 71,119 49,227 21,892 44.5% 72,452 1,333 1.9% 421090 On-Line Analyzer Supplies 65,603 60,000 5,603 9.3% 60,000 (5,603) -8.5% 421080 Office Supplies 38,838 37,920 918 2.4% 37,885 (953) -2.5% 421040 Kitchen Supplies 31,270 35,000 (3,730) -10.7% 35,000 3,730 11.9% 599000 Other General Settlement 29,498 24,329 5,169 21.2% 27,900 (1,598) -5.4% 519210 Crushed Rock 28,899 26,000 2,899 11.2% 27,200 (1,699) -5.9% 426280 Postage 23,403 22,520 883 3.9% 22,500 (903) -3.9% 421100 Paper 7,309 10,000 (2,691) -26.9% 10,000 2,691 36.8% 426230 OT Meals 5,448 5,950 (502) -8.4% 5,410 (38) -0.7% 421060 Med/1st Aid Supplies 1,489 4,100 (2,611) -63.7% 4,100 2,611 175.3% 421120 Proactive Safety Recognition 2,585 3,000 (415) -13.8% 4,000 1,415 54.8% 421140 Software - Small Purchases 10,952 10,000 952 9.5% 4,000 (6,952) -63.5% 421030 Envelopes 3,225 3,500 (275) -7.9% 3,500 275 8.5% 421150 Topsoil 2,660 1,500 1,160 77.3% 1,750 (910) -34.2% 421035 Hardware-Small Purchases 1,577 5,000 (3,423) -68.5% - (1,577) -100.0% 424080 Warm Water -Ice Control - 4,000 (4,000) -100.0% - - 100.0% 426560 Cash Discounts Taken (16,296) (11,000) (5,296) 48.1% (17,795) (1,499) 9.2%
TOTAL COMMODITIES 16,719,996$ 17,072,602$ (352,606)$ -2.1% 17,858,346$ 1,138,350$ 6.8%
C1
C2
C3
C4
Power for treatment and source are under budget in 2014 due to lower than projected power rates. The 2015 budget is increasing due to higher budgeted production and less production at Wolcott during January and February. (See page 20-21 for detailed explanation)
The budget for safety equipment and supplies is increasing in 2015 to include additional automated external defibrillators and safety equipment in facilities maintenance. (See page 22 for detailed explanation)
The budget for this account is based on a three year historical average. The purchased water is used at the MO Intake and presed as bearing water for pumps, to wash the intake screen, and as dilution for the chlorine dioxide generator.
Natural gas is over budget in 2014 due to higher than projected gas prices and demands during the winter months. Gas prices have decreased through the summer and are expected to remain relatively stable in 2015 with demands budgeted as a "normal" year.
- 42 -
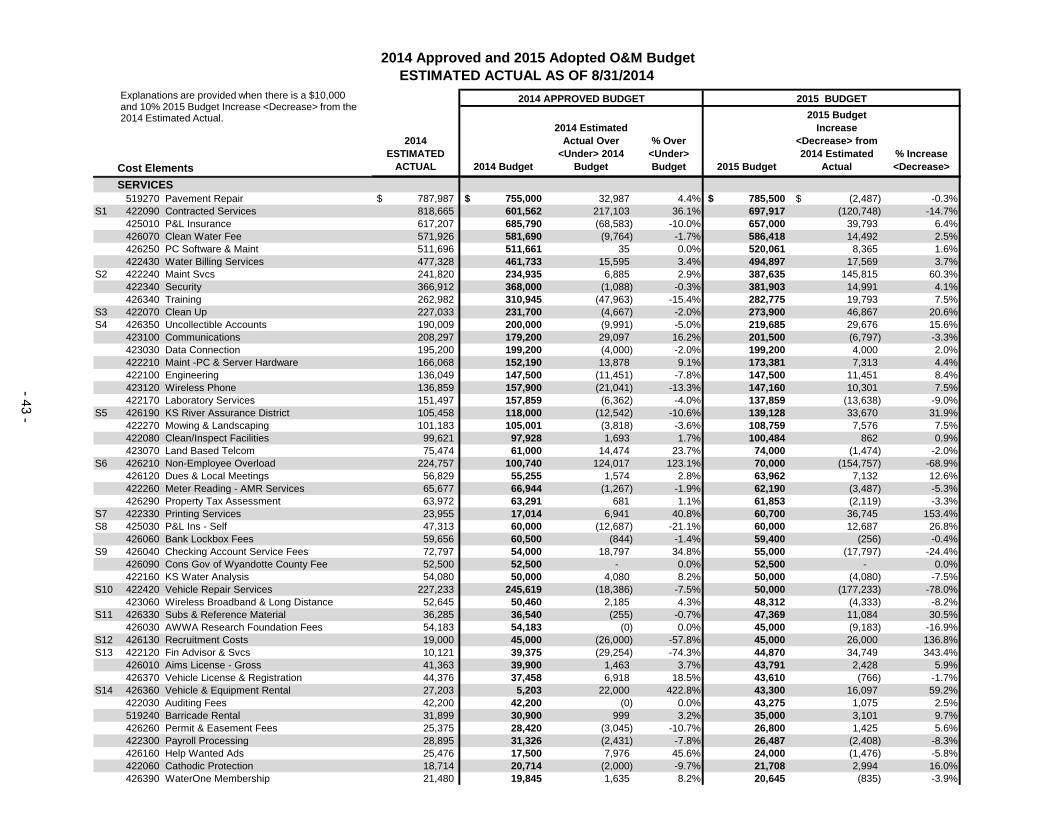
2015 BUDGET
Cost Elements
2014 ESTIMATED
ACTUAL 2014 Budget
2014 Estimated Actual Over
<Under> 2014 Budget
% Over <Under> Budget 2015 Budget
2015 Budget Increase
<Decrease> from 2014 Estimated
Actual % Increase <Decrease>
2014 APPROVED BUDGET
ESTIMATED ACTUAL AS OF 8/31/20142014 Approved and 2015 Adopted O&M Budget
Explanations are provided when there is a $10,000 and 10% 2015 Budget Increase <Decrease> from the 2014 Estimated Actual.
SERVICES 519270 Pavement Repair 787,987$ 755,000$ 32,987 4.4% 785,500$ (2,487)$ -0.3%
S1 422090 Contracted Services 818,665 601,562 217,103 36.1% 697,917 (120,748) -14.7% 425010 P&L Insurance 617,207 685,790 (68,583) -10.0% 657,000 39,793 6.4% 426070 Clean Water Fee 571,926 581,690 (9,764) -1.7% 586,418 14,492 2.5% 426250 PC Software & Maint 511,696 511,661 35 0.0% 520,061 8,365 1.6% 422430 Water Billing Services 477,328 461,733 15,595 3.4% 494,897 17,569 3.7%
S2 422240 Maint Svcs 241,820 234,935 6,885 2.9% 387,635 145,815 60.3% 422340 Security 366,912 368,000 (1,088) -0.3% 381,903 14,991 4.1% 426340 Training 262,982 310,945 (47,963) -15.4% 282,775 19,793 7.5%
S3 422070 Clean Up 227,033 231,700 (4,667) -2.0% 273,900 46,867 20.6%S4 426350 Uncollectible Accounts 190,009 200,000 (9,991) -5.0% 219,685 29,676 15.6%
423100 Communications 208,297 179,200 29,097 16.2% 201,500 (6,797) -3.3% 423030 Data Connection 195,200 199,200 (4,000) -2.0% 199,200 4,000 2.0% 422210 Maint -PC & Server Hardware 166,068 152,190 13,878 9.1% 173,381 7,313 4.4% 422100 Engineering 136,049 147,500 (11,451) -7.8% 147,500 11,451 8.4% 423120 Wireless Phone 136,859 157,900 (21,041) -13.3% 147,160 10,301 7.5% 422170 Laboratory Services 151,497 157,859 (6,362) -4.0% 137,859 (13,638) -9.0%
S5 426190 KS River Assurance District 105,458 118,000 (12,542) -10.6% 139,128 33,670 31.9% 422270 Mowing & Landscaping 101,183 105,001 (3,818) -3.6% 108,759 7,576 7.5% 422080 Clean/Inspect Facilities 99,621 97,928 1,693 1.7% 100,484 862 0.9% 423070 Land Based Telcom 75,474 61,000 14,474 23.7% 74,000 (1,474) -2.0%
S6 426210 Non-Employee Overload 224,757 100,740 124,017 123.1% 70,000 (154,757) -68.9% 426120 Dues & Local Meetings 56,829 55,255 1,574 2.8% 63,962 7,132 12.6% 422260 Meter Reading - AMR Services 65,677 66,944 (1,267) -1.9% 62,190 (3,487) -5.3% 426290 Property Tax Assessment 63,972 63,291 681 1.1% 61,853 (2,119) -3.3%
S7 422330 Printing Services 23,955 17,014 6,941 40.8% 60,700 36,745 153.4%S8 425030 P&L Ins - Self 47,313 60,000 (12,687) -21.1% 60,000 12,687 26.8%
426060 Bank Lockbox Fees 59,656 60,500 (844) -1.4% 59,400 (256) -0.4%S9 426040 Checking Account Service Fees 72,797 54,000 18,797 34.8% 55,000 (17,797) -24.4%
426090 Cons Gov of Wyandotte County Fee 52,500 52,500 - 0.0% 52,500 - 0.0% 422160 KS Water Analysis 54,080 50,000 4,080 8.2% 50,000 (4,080) -7.5%
S10 422420 Vehicle Repair Services 227,233 245,619 (18,386) -7.5% 50,000 (177,233) -78.0% 423060 Wireless Broadband & Long Distance 52,645 50,460 2,185 4.3% 48,312 (4,333) -8.2%
S11 426330 Subs & Reference Material 36,285 36,540 (255) -0.7% 47,369 11,084 30.5% 426030 AWWA Research Foundation Fees 54,183 54,183 (0) 0.0% 45,000 (9,183) -16.9%
S12 426130 Recruitment Costs 19,000 45,000 (26,000) -57.8% 45,000 26,000 136.8%S13 422120 Fin Advisor & Svcs 10,121 39,375 (29,254) -74.3% 44,870 34,749 343.4%
426010 Aims License - Gross 41,363 39,900 1,463 3.7% 43,791 2,428 5.9% 426370 Vehicle License & Registration 44,376 37,458 6,918 18.5% 43,610 (766) -1.7%
S14 426360 Vehicle & Equipment Rental 27,203 5,203 22,000 422.8% 43,300 16,097 59.2% 422030 Auditing Fees 42,200 42,200 (0) 0.0% 43,275 1,075 2.5% 519240 Barricade Rental 31,899 30,900 999 3.2% 35,000 3,101 9.7% 426260 Permit & Easement Fees 25,375 28,420 (3,045) -10.7% 26,800 1,425 5.6% 422300 Payroll Processing 28,895 31,326 (2,431) -7.8% 26,487 (2,408) -8.3% 426160 Help Wanted Ads 25,476 17,500 7,976 45.6% 24,000 (1,476) -5.8% 422060 Cathodic Protection 18,714 20,714 (2,000) -9.7% 21,708 2,994 16.0% 426390 WaterOne Membership 21,480 19,845 1,635 8.2% 20,645 (835) -3.9%
- 43 -

2015 BUDGET
Cost Elements
2014 ESTIMATED
ACTUAL 2014 Budget
2014 Estimated Actual Over
<Under> 2014 Budget
% Over <Under> Budget 2015 Budget
2015 Budget Increase
<Decrease> from 2014 Estimated
Actual % Increase <Decrease>
2014 APPROVED BUDGET
ESTIMATED ACTUAL AS OF 8/31/20142014 Approved and 2015 Adopted O&M Budget
Explanations are provided when there is a $10,000 and 10% 2015 Budget Increase <Decrease> from the 2014 Estimated Actual.
S15 422050 Beneficial Use Disposal of Residual - 20,000 (20,000) -100.0% 20,000 20,000 100.0% 422180 Legal Services 16,588 20,000 (3,412) -17.1% 20,000 3,412 20.6% 422020 Answering Service 16,142 18,000 (1,858) -10.3% 19,000 2,858 17.7% 426110 Delivery Charges 15,353 15,350 3 0.0% 16,325 972 6.3% 423075 Radio Charges (Fleet) 15,959 15,800 159 1.0% 15,800 (159) -1.0% 422110 Equip Repair Svcs 12,287 17,750 (5,463) -30.8% 15,400 3,113 25.3%
S16 422010 Advertising 3,532 5,149 (1,617) -31.4% 13,600 10,068 285.0% 422400 Trash Removal Services 9,126 9,620 (494) -5.1% 10,690 1,564 17.1% 422190 Maint -Itron System 11,082 12,740 (1,658) -13.0% 12,993 1,911 17.2% 426270 Post Offer Physical 9,456 7,470 1,986 26.6% 11,180 1,724 18.2% 426150 General Expense & Miscellaneous 11,661 13,700 (2,039) -14.9% 10,770 (891) -7.6% 422320 Pre-Employment Services 7,914 7,445 469 6.3% 8,680 766 9.7% 426140 Environ & Risk Management 16,514 6,550 9,964 152.1% 6,550 (9,964) -60.3% 422380 Storage Expenses 3,535 6,200 (2,665) -43.0% 5,800 2,265 64.1% 423110 Voice System - Redundant 4,951 12,822 (7,871) -61.4% 5,500 549 11.1% 539100 Other Serv Settlement 8,092 5,003 3,089 61.7% 5,303 (2,789) -34.5% 426300 Reimburse Other Utility 4,169 4,300 (131) -3.1% 4,800 631 15.1% 426020 Bank Account Reconciliation Fees 3,076 2,700 376 13.9% 3,150 74 2.4% 422150 Indoor Plants Svcs 2,192 2,000 192 9.6% 2,000 (192) -8.8% 519250 Spoil Removal 9,824 - 9,824 100.0% 1,600 (8,224) -83.7% 422280 Painting 592 1,000 (408) -40.8% 1,000 408 68.8% 422410 Update Maps 333 1,000 (667) -66.7% 1,000 667 200.0% 426080 Commitment To Excellence Program 970 1,000 (30) -3.0% 1,000 30 3.1% 422250 Medical Testing Services 217 650 (433) -66.7% 650 433 200.0% 422165 Kansas One Call 500 - 500 100.0% 500 - 0.0% 422370 Sod & Seed Restoration - - - 100.0% 400 - 100.0% 426380 Water Rights - 5,000 (5,000) -100.0% 400 400 100.0% 426170 Interest On Security Deposit 394 454 (60) -13.3% 360 (34) -8.5% 422230 Maint -Telephone System - 10,000 (10,000) -100.0% - - 100.0% 426325 Site visit / Investigations 2,000 2,000 - 0.0% - (2,000) -100.0%
S17 426180 Job Work Revenue Credit (7,059) (6,187) (872) 14.1% (20,000) (12,941) 183.3%TOTAL SERVICES 8,056,654$ 7,861,197$ 195,456$ 2.5% 8,115,884$ 59,230$ 0.7%
S1
S2
S3
S4
S5
S6
S7
S8
The 2015 budget is increasing due to a planned increase in the number of billing inserts as well as postage and paper costs. (See page 23 for detailed explanation)
Claims for 2014 have been below the historical average.
The budget is increasing in 2015 for building services at the administrative headquarters, fire hydrant painting and services that support the communications plan.
The budget for 2015 is increasing due to the higher costs of the Kansas River wells rehab, the first required maintenance contract for the Missouri River horizontal collector well, and additional lab equipment maintenance.
The 2015 budget is based on the three year average historical costs and the average number of main breaks which are trending up.
The uncollectible accounts budget is based on increased total sales revenue and an increased uncollectible rate from .20% in 2014 to .21% in 2015.
KS River Assurance District (KRWAD) is budgeted based on a member allocation estimate from KRWAD which has increased in 2015. The 2014 expense is lower than projected due to a credit received based on a reconciliation of the 2012 member allocations.
Non-Employee overload is higher than projected in 2014 due to operational needs in CMVS, Applications, and Operations. Some of the increases are offset with vacant authorized positions.
- 44 -

2015 BUDGET
Cost Elements
2014 ESTIMATED
ACTUAL 2014 Budget
2014 Estimated Actual Over
<Under> 2014 Budget
% Over <Under> Budget 2015 Budget
2015 Budget Increase
<Decrease> from 2014 Estimated
Actual % Increase <Decrease>
2014 APPROVED BUDGET
ESTIMATED ACTUAL AS OF 8/31/20142014 Approved and 2015 Adopted O&M Budget
Explanations are provided when there is a $10,000 and 10% 2015 Budget Increase <Decrease> from the 2014 Estimated Actual.
S9
S10
S11
S12
S13
S14
S15
S16
S17
TRANSFERSTOTAL TRANSFERS (10,021,827)$ (10,314,686.0)$ 292,859$ -2.8% (10,236,530.0)$ (214,703.0)$ 2.1%
In 2014 transfers are slightly lower than budgeted due to less capital work.
TOTAL O&M $48,943,794 50,424,719 ($1,480,925) -2.9% 52,247,866 $3,304,072 6.8%Numbers may not total due to rounding
The budget is increased for 2015 to due to the projected costs of electronic service manuals in Fleet and to move reference materials previously budgeted in the training cost element into this account.
The budget for 2015 includes investment advisor services which are also included in the 2014 budget and will not be utilized.
This account can vary significantly each year based on damages to WaterOne property reimbursed by a third party. The 2015 budget is based on a 5 year historical average.
This account is under budget in 2014 due to less utilization of agencies to assist in recruitment of new hires. Recruitment agencies are engaged depending on the types of positions that need filled during the year.
This account is over in 2014 due to increased fleet utilization leaving less vehicles available for summer staff to use. It is more efficient to rent vehicles for the summer months than it is to add vehicles to the fleet. The 2015 budget has been increased to reflect this change.
This account is for ongoing research related to the potential testing of reuse technologies for lime residual materials currently stored on top of the capped Monofill #2.
The 2015 budget is increasing due to projected costs related to the Smart Watering campaign and social media paperless billing advertisements.
FDIC fees are more than projected in 2014 due to a higher account balance related to Bond proceeds in the General Fund.
The budget for 2015 has been reduced in order to reclass expenses incurred during in-house repairs into the material and supplies budget.
- 45 -

This page intentionally left blank.
- 46 -

WaterOne 2015 Budget Personnel INTRODUCTION
This section contains:
new positions organization chart of WaterOne explanation of benefit expenditures by major category history of full time equivalent employees average customers served per employee
In 2015, a total of 374 full time, 10 part time, and 19 temporary/summer positions are budgeted including new authorizations. The budget also includes a reclassification of a part time Communications Specialist in the Public Relations department to full time and a slight true-up increase in part time hours. The total FTEs after all adjustments is 385.15. Six new full time, one part time, and one temporary/summer position are requested at a first year payroll cost of $280,320. The reclassification from part time to full time is a first year cost of $18,515 for a total additional personnel cost of $298,835. This represents 7.275 FTEs. The organization chart is color coded to show the reclassification and the additional personnel requests. Following the organization chart, are justifications and first year salary, benefits, and capital costs for the new personnel requests. The total first year cost for payroll, salary, benefits and capital is $439,001. The budget includes a performance compensation adjustment of 3.5%. Employee benefits are allocated to divisions based on headcount or percent of payroll. However, they are consolidated in this section for discussion. FIVE YEAR PERSONNEL PLAN For long range forecasting and operational planning purposes, WaterOne maintains a Five-Year Personnel Plan beyond the next budget year being currently planned. All financial projections include this planned headcount and the plan is updated as part of the annual budget process. For this budget cycle, the five-year plan is from 2016 to 2020.
- 47 -

General Manager
WATER ONE
Executive Asst/Asst to Board (1)
Cust Rel’s Division
Director – Cust Rel’s
Finance DivisionDir - Finance
Admin/HR DivDir – Adm/HR
Legal/Auditing DivisionDirector – Legal/Auditing
Staff Analyst (1)
Sr Acct (1)Accts Payable Coord (1)Acct I (1) Sr Acctg Clerk AP (1)
AccountingMgr - Accounting
Sr. Fin Analyst (2)Fin Analyst III (1)
Financial PlanningMgr – Financial Plng
Acct III (1)
Cash & InvestmentsMgr - Cash & Inv
PT AdmAsst (1)
Deputy Gen’l Counsel (1)Insurance Coord (1)RecCtr & Arch Crd (1)Smr Legal Research Intern (1)
AuditingMgr - Auditing
Sr Auditor (1)Auditor IV (1)PT Auditing Control Clk (1)
Meter Reading:Foreman – Meter Reading (1)FT Meter Reader (13) Sr. HR Generalist (1)
HR Generalist (1)HR Intern (1)PT HR Genrlst (1)PT Mail Clk/Msg (1)
Admin-Ben & Payroll (1)HR Asst (1)
Purch & Mtl MgmtMgr - Purch & Mtr
Sr. Storekeeper (1)Storekeeper (2)Smr Storekeeper (1)Storekeeper (1)
41 FT1 New FT Recl
5 PT<1> PT Recl
2 Smr45.0 FTE
17 FT1 New FT
0 PT1 Smr
18.25 FTE
25 FT1 New FT
<1> FT Recl1 PT
2 PT Recl1 New PT1 Intern
27.85 FTE
8 FT1 PT
1 Smr8.875 FTE
2 FT0 PT
0 Smr 2 FTE
Data Analyst (1)
New
Customer Service:Team Lead (1)Acct Admin Rep (4)Cst Rep/Teller (1)Cst Rep (3)PT Cst Rep (4)
Meter ServicesMgr – Meter Services
Personnel AdminMgr - Human Resources
PT Comm’s Spec (1)Comm’s Spec (1)
CommunicationsMgr –
Communications
Field Srv Rep/AMR (1)Conservation Srvs Coord (1)
Meter Services:Foreman- Meter Srvcs (1)Meter Repair (5)Smr Meter Repair (2)
Customer Accounts:Supv Front Off & Coll (1)Cst & Acct Admin Rep (2)Cst Acct Fld Rep (2)
Customer ServiceMgr – Customer Srv
Admin Asst - Legal (1)
Reclass PT to FT
NUMBER OF POSITIONS AUTHORIZED2014 AUTHORIZED 368 FT 8 PT 18 TEMP/SUMMER
ELIMINATIONS 0 0 0
RECLASS * 1 <1> 0
MID YEAR RECLASS <1> 2 0
NEW * 6 1 1
2015 AUTHORIZED 374 FT 10 PT 19 TEMPORARY/SUMMER
(6.0 FTE) (5.15 FTE)
G:\855VAD\VisioOrgCharts\TotalOrgPage1.vsd
* New = Total of 7.275 FTE (Includes Reclass from PT to FT)
*Rcl FT to PT
New
Elimination
COLOR LEGEND
Mid Yr Recl
Reclass
*MidYr Recl of a FT Admin Asst to a PT Admin Asst and a
PT HR Generalist
Safety & Security SrvsMgr - Safety & Security
Srvs
Custodial Services:Foreman - Custodian (1)Custodian (5)
Fleet & Bldg ServicesMgr - Flt & Bldg Srv’s
Learning & Development Leader (1)
Fleet Services: Foreman - Fleet Mech (1)Fleet Mech (4)Operations Coord (1)Fleet Mechanic (1)PT Fleet Clerk (1)
New
Safety Specialist (2)Safety & Security Administrator (1)
New
Learning & Development
AdmAsst (1)*Rcl FT to PT
- 48 -
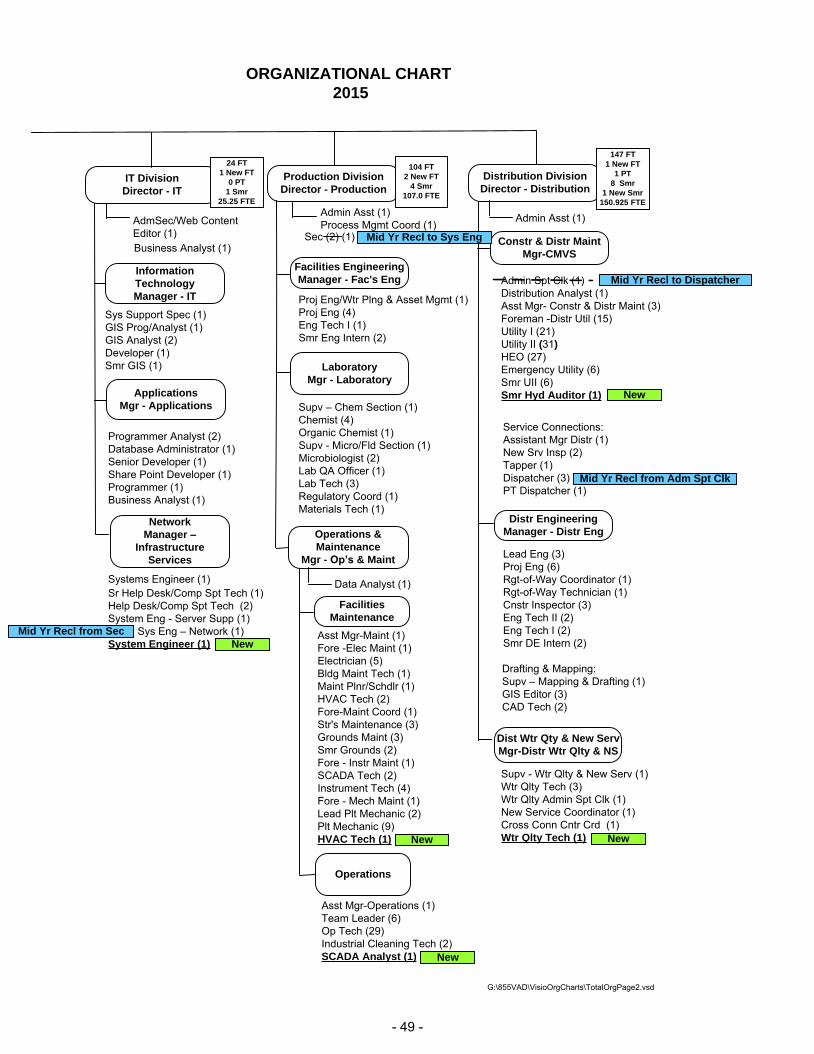
ORGANIZATIONAL CHART 2015
G:\855VAD\VisioOrgCharts\TotalOrgPage2.vsd
Business Analyst (1)
AdmSec/Web Content Editor (1)
Programmer Analyst (2)Database Administrator (1)Senior Developer (1)Share Point Developer (1)Programmer (1)Business Analyst (1)
Sys Support Spec (1)GIS Prog/Analyst (1)GIS Analyst (2)Developer (1) Smr GIS (1)
Information TechnologyManager - IT
IT DivisionDirector - IT
24 FT1 New FT
0 PT1 Smr
25.25 FTE
Admin Asst (1)Process Mgmt Coord (1)
Proj Eng/Wtr Plng & Asset Mgmt (1)Proj Eng (4)Eng Tech I (1)Smr Eng Intern (2)
Asst Mgr-Maint (1)Fore -Elec Maint (1)Electrician (5)Bldg Maint Tech (1)Maint Plnr/Schdlr (1)HVAC Tech (2)Fore-Maint Coord (1)Str's Maintenance (3)Grounds Maint (3)Smr Grounds (2)Fore - Instr Maint (1)SCADA Tech (2)Instrument Tech (4)Fore - Mech Maint (1)Lead Plt Mechanic (2)Plt Mechanic (9)HVAC Tech (1)
Production DivisionDirector - Production
104 FT2 New FT
4 Smr107.0 FTE
Facilities EngineeringManager - Fac's Eng
Admin Asst (1)
Supv - Wtr Qlty & New Serv (1)Wtr Qlty Tech (3)Wtr Qlty Admin Spt Clk (1) New Service Coordinator (1)Cross Conn Cntr Crd (1)Wtr Qlty Tech (1)
Distribution DivisionDirector - Distribution
Constr & Distr MaintMgr-CMVS
147 FT1 New FT
1 PT8 Smr
1 New Smr150.925 FTE
Admin Spt Clk (1)Distribution Analyst (1)Asst Mgr- Constr & Distr Maint (3)Foreman -Distr Util (15)Utility I (21) Utility II (31)HEO (27)Emergency Utility (6)Smr UII (6)Smr Hyd Auditor (1)
Drafting & Mapping:Supv – Mapping & Drafting (1)GIS Editor (3)CAD Tech (2)
Asst Mgr-Operations (1)Team Leader (6)Op Tech (29)Industrial Cleaning Tech (2)SCADA Analyst (1)
Lead Eng (3)Proj Eng (6)Rgt-of-Way Coordinator (1)Rgt-of-Way Technician (1)Cnstr Inspector (3)Eng Tech II (2)Eng Tech I (2)Smr DE Intern (2)
ApplicationsMgr - Applications
NetworkManager –
Infrastructure Services
Distr EngineeringManager - Distr Eng
New New
Sr Help Desk/Comp Spt Tech (1)Help Desk/Comp Spt Tech (2)System Eng - Server Supp (1) Sys Eng – Network (1)System Engineer (1)
Systems Engineer (1)
New
Dist Wtr Qty & New ServMgr-Distr Wtr Qlty & NS
Mid Yr Recl from Sec
Mid Yr Recl to Sys Eng
Supv – Chem Section (1)Chemist (4)Organic Chemist (1)Supv - Micro/Fld Section (1)Microbiologist (2)Lab QA Officer (1)Lab Tech (3)Regulatory Coord (1)Materials Tech (1)
Sec (2) (1)
Service Connections:Assistant Mgr Distr (1)New Srv Insp (2)Tapper (1)Dispatcher (3)PT Dispatcher (1)
Operations
New
New
Mid Yr Recl to Dispatcher
Mid Yr Recl from Adm Spt Clk
Operations & Maintenance
Mgr - Op’s & Maint
LaboratoryMgr - Laboratory
Data Analyst (1)
Facilities Maintenance
- 49 -
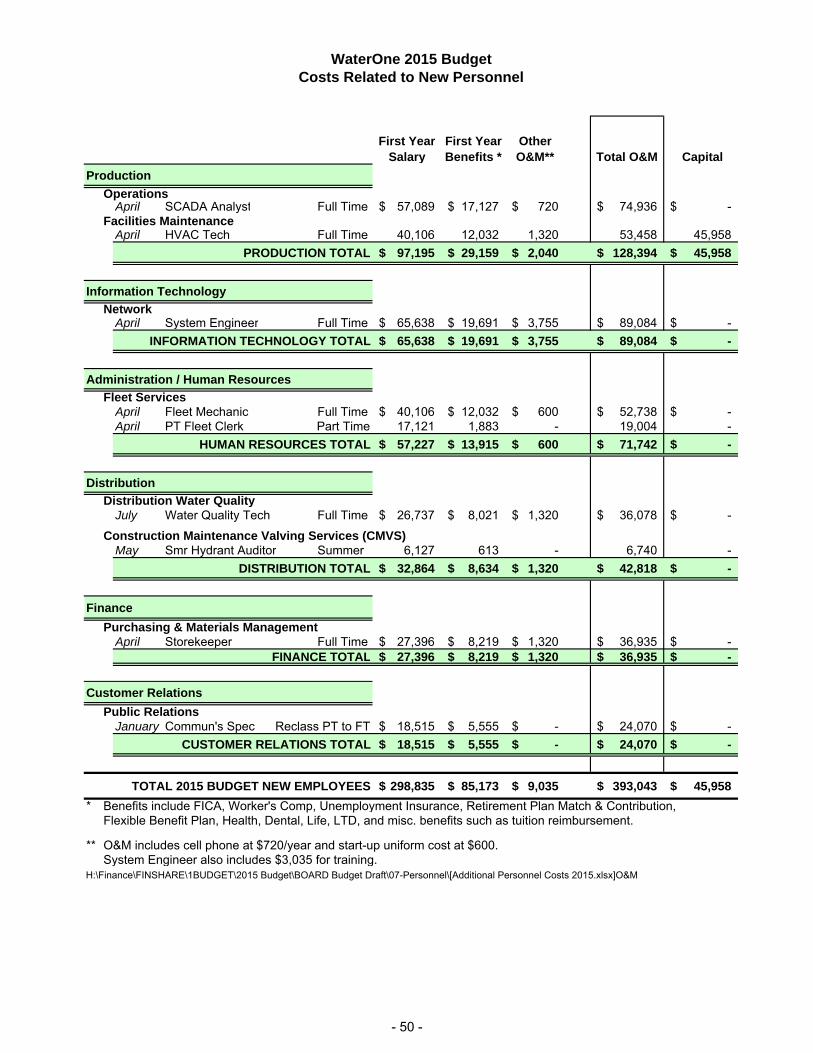
WaterOne 2015 BudgetCosts Related to New Personnel
First Year Salary
First Year Benefits *
Other O&M** Total O&M Capital
Production
OperationsApril SCADA Analyst Full Time 57,089$ 17,127$ 720$ 74,936$ -$
Facilities MaintenanceApril HVAC Tech Full Time 40,106 12,032 1,320 53,458 45,958
PRODUCTION TOTAL 97,195$ 29,159$ 2,040$ 128,394$ 45,958$
Information Technology
NetworkApril System Engineer Full Time 65,638$ 19,691$ 3,755$ 89,084$ -$
INFORMATION TECHNOLOGY TOTAL 65,638$ 19,691$ 3,755$ 89,084$ -$
Administration / Human Resources
Fleet ServicesApril Fleet Mechanic Full Time 40,106$ 12,032$ 600$ 52,738$ -$ April PT Fleet Clerk Part Time 17,121 1,883 - 19,004 -
HUMAN RESOURCES TOTAL 57,227$ 13,915$ 600$ 71,742$ -$
Distribution
Distribution Water QualityJuly Water Quality Tech Full Time 26,737$ 8,021$ 1,320$ 36,078$ -$
Construction Maintenance Valving Services (CMVS)May Smr Hydrant Auditor Summer 6,127 613 - 6,740 -
DISTRIBUTION TOTAL 32,864$ 8,634$ 1,320$ 42,818$ -$
Finance
Purchasing & Materials ManagementApril Storekeeper Full Time 27,396$ 8,219$ 1,320$ 36,935$ -$
FINANCE TOTAL 27,396$ 8,219$ 1,320$ 36,935$ -$
Customer Relations
Public RelationsJanuary Commun's Spec Reclass PT to FT 18,515$ 5,555$ -$ 24,070$ -$
CUSTOMER RELATIONS TOTAL 18,515$ 5,555$ -$ 24,070$ -$
TOTAL 2015 BUDGET NEW EMPLOYEES 298,835$ 85,173$ 9,035$ 393,043$ 45,958$
* Benefits include FICA, Worker's Comp, Unemployment Insurance, Retirement Plan Match & Contribution,Flexible Benefit Plan, Health, Dental, Life, LTD, and misc. benefits such as tuition reimbursement.
** O&M includes cell phone at $720/year and start-up uniform cost at $600.System Engineer also includes $3,035 for training.
H:\Finance\FINSHARE\1BUDGET\2015 Budget\BOARD Budget Draft\07-Personnel\[Additional Personnel Costs 2015.xlsx]O&M
- 50 -

CAPITAL FLEET* TotalProduction
AP-15007 3/4 Ton Cargo Van -$ 45,958$ 45,958$ Total HVAC Tech -$ 45,958$ 45,958$
TOTAL Capital for New Positions -$ 45,958$ 45,958$
* Includes overheads.
H:\Finance\FINSHARE\1BUDGET\2015 Budget\BOARD Budget Draft\07-Personnel\[Additional Personnel Costs 2015.xlsx]Capital
HVAC Tech
2015 BudgetCapital Related to New Personnel Requests
- 51 -

WaterOne 2015 BudgetPERSONNEL
TotalFull Yr First Yr 2015
Position Salary Salary Benefits O&M Capital Costs
SCADA Analyst $76,119 $57,089 $17,127 $720 $0 $74,936
Department OperationsType Full TimeStart Date April 2015
Justification
Production 2015
Currently, there are 67 daily reports generated each week for membrane filter performance, SCADA alarms, energy management, pump changes, shift reports, performance indicators, taste and odors, and chlorite. These reports need to be reviewed for patterns that show opportunities for process improvement, corrective action, and training. Additional daily reports are needed for inventory control, chemical usage, unit cost of treating water, and distribution related performance indicators. The existing reports take approximately 20 minutes per report each week to generate and review. It is projected that two additional reports will be available in 2015 and three more in 2016 for a total of 72 daily reports to generate and review each week. There arefive compliance reports generated at the end of each month for turbidity and disinfection. There are over 273,720 records compiled from the SCADA system and LIMS to generate these reports. Each record has to be checked for inaccuracies and validated. Each report requires eight hours per month to review and validate.
The Operations Department operates multiple systems including chemical feeds, pumps, filters and other ancillary systems. It requires extensive standard operating procedures (SOPs). The SCADA Analyst is needed to keep the SOPsup to date, help identify needed changes by comparing reported problems against procedures, and to assist the Team Leaders with performance measurement and training. Each year the analyst will review half of the SOPs which will require approximately eight hours each.
If the SCADA Analyst is not hired, the position could be outsourced. Outsourcing for this work is more expensive and less efficient than hiring a full time employee. If the tasks performed by the SCADA Analyst were not completed, the existing staff would be limited in their ability to compile data and extract useful information. It is likely that opportunities for improvement will be missed if data analysis responsibilities are not the primary function of a position.
- 52 -

WaterOne 2015 BudgetPERSONNEL
TotalFull Yr First Yr 2015
Position Salary Salary Benefits O&M Capital Costs
HVAC Tech $53,475 $40,106 $12,032 $1,320 $45,958 $99,416
Department Facilities MaintenanceType Full TimeStart Date April 2015
Justification
Total Production Division $129,594 $97,195 $29,159 $2,040 $45,958 $174,352
Production 2015 Cont'd
Currently, there are approximately 825 pieces of HVAC equipment which have a total of 5,223 hours of recommended annual preventative maintenance work and only two full time HVAC Technicians. With the volume of equipment and the current staffing level, only minimal preventative maintenance is completed to ensure equipment reliability and availability. The HVAC Technicians work in almost an entirely reactionary mode and are not able to complete the preventative maintenance necessary to get the full life expectancy out of the equipment.
District facilities continue to be added with no additional HVAC support. Most recently Wolcott Treatment Facility and Nall Pumping Station were built adding approximately 80 pieces of HVAC related equipment. The Hedge Lane Pump Station is planned to be online in 2016 which will continue to increase HVAC equipment with additional facilities continuing to increase HVAC equipment within the five year plan.
If the HVAC Technician is not hired, the appropriate level of preventative maintenance will not be completed which will reduce the useful life of the assets,increase unplanned repair expense, and increase unplanned downtime.
- 53 -

WaterOne 2015 BudgetPERSONNEL
TotalFull Yr First Yr 2015
Position Salary Salary Benefits O&M Capital Costs
System Engineer $87,517 $65,638 $19,691 $3,755 $0 $89,084
Department Infrastructure ServicesType Full TimeStart Date April 2015
Justification
Total IT Division $87,517 $65,638 $19,691 $3,755 $0 $89,084
Information Technology 2015
At the current staffing level, the Network Department does not have the necessary resources to meet the minimum identified requirements for the level of support for network maintenance and design.
If the System Engineer - Network Support is not hired, a consultant could be utilized to complete the network support requirements at an estimated annual cost of $129,400. Using an external consultant is not optimal for these critical network functions due to the increased cost.
The System Engineer - Network Support will primarily be responsible for maintenance and security tasks which include router, switch, virtual private network, Wi-Fi, cellular data, radio system maintenance, and capacity planning/performance monitoring. The System Engineer - Network Support will also perform network design tasks such as network upgrades and expansion planning.
- 54 -
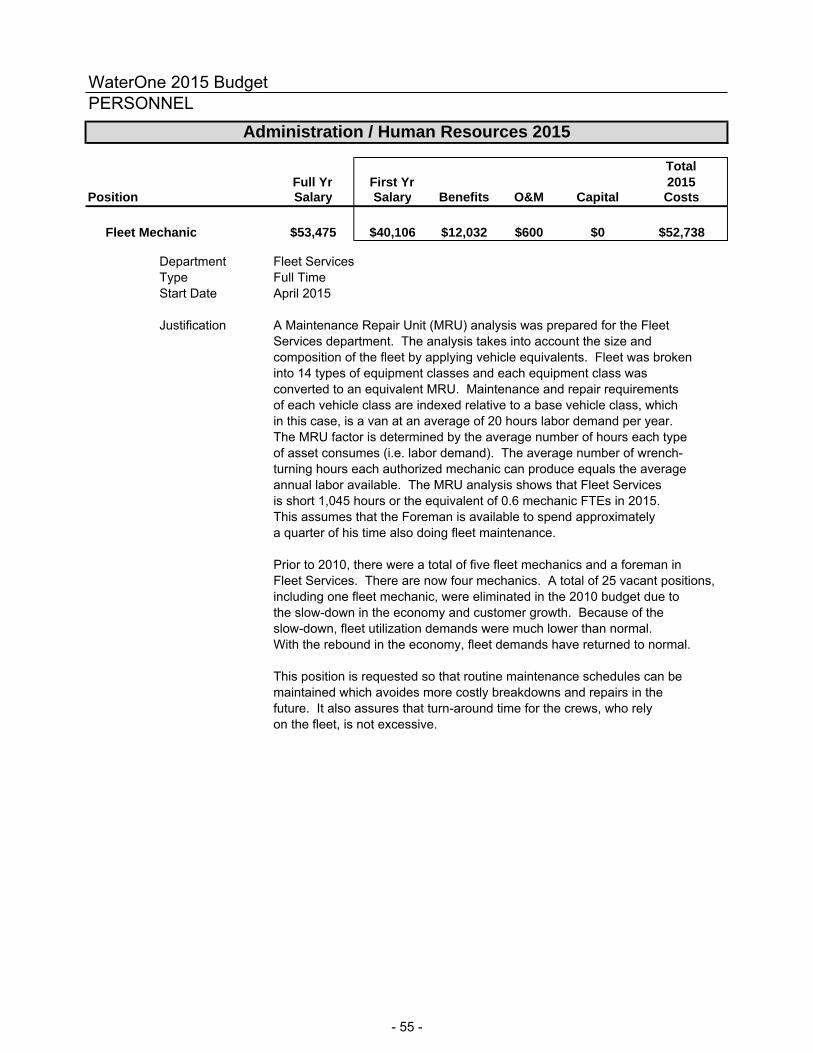
WaterOne 2015 BudgetPERSONNEL
TotalFull Yr First Yr 2015
Position Salary Salary Benefits O&M Capital Costs
Fleet Mechanic $53,475 $40,106 $12,032 $600 $0 $52,738
Department Fleet ServicesType Full TimeStart Date April 2015
Justification A Maintenance Repair Unit (MRU) analysis was prepared for the FleetServices department. The analysis takes into account the size and composition of the fleet by applying vehicle equivalents. Fleet was brokeninto 14 types of equipment classes and each equipment class was converted to an equivalent MRU. Maintenance and repair requirementsof each vehicle class are indexed relative to a base vehicle class, whichin this case, is a van at an average of 20 hours labor demand per year.The MRU factor is determined by the average number of hours each typeof asset consumes (i.e. labor demand). The average number of wrench-turning hours each authorized mechanic can produce equals the averageannual labor available. The MRU analysis shows that Fleet Servicesis short 1,045 hours or the equivalent of 0.6 mechanic FTEs in 2015.This assumes that the Foreman is available to spend approximatelya quarter of his time also doing fleet maintenance.
Prior to 2010, there were a total of five fleet mechanics and a foreman inFleet Services. There are now four mechanics. A total of 25 vacant positions,including one fleet mechanic, were eliminated in the 2010 budget due to the slow-down in the economy and customer growth. Because of the slow-down, fleet utilization demands were much lower than normal. With the rebound in the economy, fleet demands have returned to normal.
This position is requested so that routine maintenance schedules can bemaintained which avoides more costly breakdowns and repairs in the future. It also assures that turn-around time for the crews, who relyon the fleet, is not excessive.
Administration / Human Resources 2015
- 55 -

WaterOne 2015 BudgetPERSONNEL
TotalFull Yr First Yr 2015
Position Salary Salary Benefits O&M Capital Costs
PT Fleet Clerk $22,828 $17,121 $1,883 $0 $0 $19,004
Department Fleet ServicesType Part TimeStart Date April 2015
Justification Support staff in the Fleet Services department currently consists of one full time Operations Coordinator. This is not enough staff to completethe fleet services workload.
The duties consist of preparing and tracking vehicle records formaintenance, fuelmaster reports, inventory, inspections, work orders, running cars, picking up parts, and processing new and replacementvehicles. There are a total of 233 vehicles in the fleet and five fuel tanksthat require record maintenance and analysis. The average number of annual maintenance work orders is 2,940 and an average of 24 to 25vehicles are new or replaced each year.
Currently, a contract employee is working two hours per day. This is not aworkable solution because a contract employee cannot drive a district vehicle. As a result, they are unable to run cars for repairs or pick up parts.In addition, non-employee overload personnel do not have SAP experience, which limits their ability to assist with reports and analysis.Only WaterOne employees can be in the SAP system to workflow the fleetprocess.
Because we are using non-employee overload, approximately 12 hours perweek is spent by mechanics and the Operations Coordinator running cars and picking up parts, which takes time from their other assignedduties and is not an efficient use of their time.
Total HR Division $76,303 $57,227 $13,915 $600 $0 $71,742
Administration / Human Resources Cont'd
- 56 -
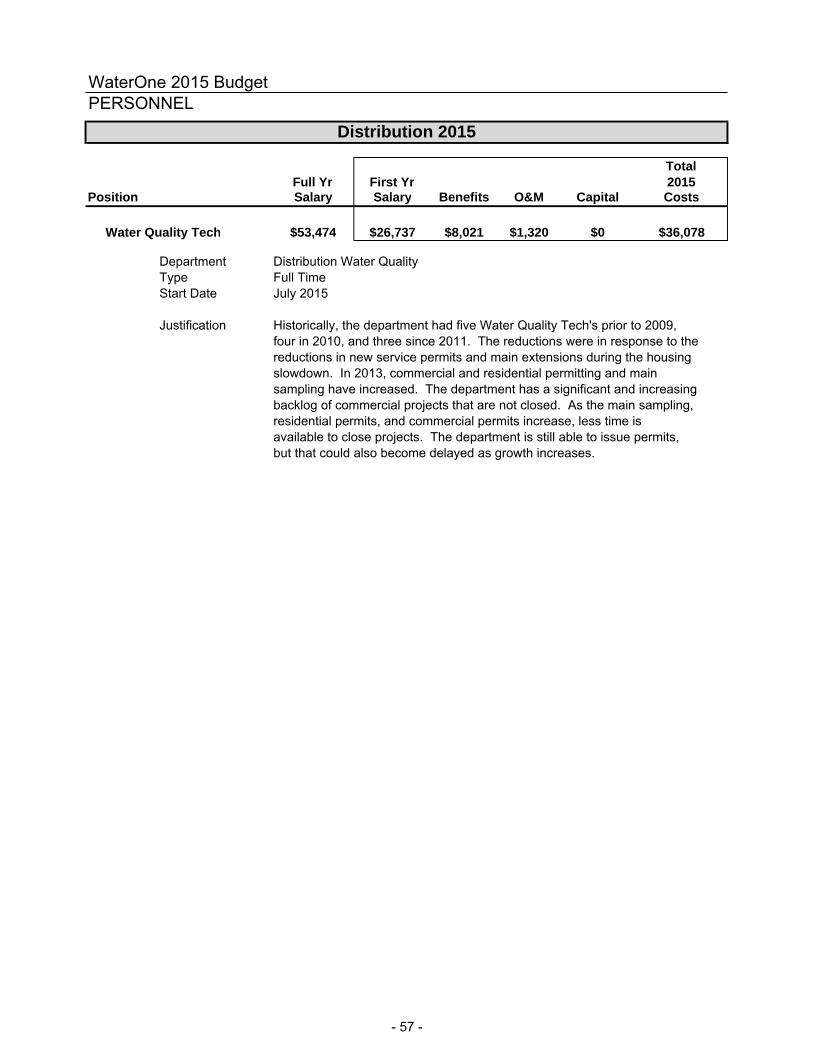
WaterOne 2015 BudgetPERSONNEL
TotalFull Yr First Yr 2015
Position Salary Salary Benefits O&M Capital Costs
Water Quality Tech $53,474 $26,737 $8,021 $1,320 $0 $36,078
Department Distribution Water QualityType Full TimeStart Date July 2015
Justification Historically, the department had five Water Quality Tech's prior to 2009, four in 2010, and three since 2011. The reductions were in response to thereductions in new service permits and main extensions during the housingslowdown. In 2013, commercial and residential permitting and mainsampling have increased. The department has a significant and increasingbacklog of commercial projects that are not closed. As the main sampling,residential permits, and commercial permits increase, less time is available to close projects. The department is still able to issue permits,but that could also become delayed as growth increases.
Distribution 2015
- 57 -

WaterOne 2015 BudgetPERSONNEL
TotalFull Yr First Yr 2015
Position Salary Salary Benefits O&M Capital Costs
Summer Hydrant Auditor $6,127 $6,127 $613 $0 $0 $6,740
Department Constructon Maintenance Valving Services (CMVS)Type SummerStart Date May 2015
Justification Based on the growing number of new service connections and the resultingincrease in hydrants and valves, an additional Summer Hydrant Auditor isneeded to keep up with audits. Fire Hydrants are audited once every year and valves once every three years (except for transmission main valves whichare audited annually).
Total Distribution Division $59,601 $32,864 $8,634 $1,320 $0 $42,818
Distribution 2015 Cont'd
- 58 -

WaterOne 2015 BudgetPERSONNEL
TotalFull Yr First Yr 2015
Position Salary Salary Benefits O&M Capital Costs
Storekeeper $36,528 $27,396 $8,219 $1,320 $0 $36,935
Department Purchasing & Materials Management
Type Full Time
Start Date April 2015
Justification The Storekeeper's primary duties consist of the following: orders are received and placed in the warehouse; inventory is withdrawn and issued to crews, contractors, and customers.
Orders received (goods receipt) are received and placed in the warehouse in bulk and processed in SAP as one transaction.Inventory withdrawn (goods issued) are in small numbers and each individual withdrawal is processed as a separate transaction inSAP.
Historical data shows that there are 700 goods receipt transactions and 10,000 goods issue transactions per year per Storekeeper.The overall workload varies throughout the year as constructionactivity varies, which is generally busier in the summer months.
In addition, the Storekeepers clean the dock and warehouse, cleanand return salvaged materials from jobs to stock, order materials, process daily work orders, maintain the warehouse shelving and bins, take periodic cycle counts of inventory and non-inventorymaterials, issue fire hydrant meters, and operate a cashdrawer.
In 2009, there was an economic downturn. Inventory withdrawals dropped from around $7M in 2006 to $3M in 2009. In response,a Storekeeper was eliminated in 2009. The PurchasingAgent and Supervisor of Materials Management positions wereeliminated in 2010. The Manager absorbed the Foreman duties and has been covering the purchasing functions. Thiswas a short-term solution to respond to the economicdownturn.
This reduced level of staffing is no longer manageable now thatthe economy is rebounding. Inventory withdrawals were over$5M in 2013, which is the highest level since 2008. Based onTransmission & Distribution (T&D) growth, the number of goods receipts and goods issued are expected to increase significantly.
Total Finance Division $36,528 $27,396 $8,219 $1,320 $0 $36,935
Finance 2015
- 59 -

WaterOne 2015 BudgetPERSONNEL
TotalFull Yr First Yr 2015
Position Salary Salary Benefits O&M Capital Costs
'Reclass' Comm's Specialist $49,660 $18,515 $5,555 $0 $0 $24,070
Department Public RelationsType Full TimeStart Date April 2015
Justification This is a reclass from part time to full time. It is requested so the communication objectives of the Public Relations department canbe met. These objectives are to grow with its audience, adapt newprojects to stakeholder needs, increase the ability to communictewith customers and employees and keep them informed, and creategoodwill.
Under the current part time staffing level, the enhanced communicationobjectives cannot be met. Additional and expanded tasks include an increase in community and media relations and marketing. For media relations, the best practice is to visit several news outlets peryear. There will be a new focus on school outreach. Marketing will beenhanced with SmartWatering, Notify JoCo, and the Pro TapCampaign.
Internal communication will also be expanded to include further website development, employee surveys, and an annual report.
Total Cust Reltns Division $49,660 $18,515 $5,555 $0 $0 $24,070
Customer Relations 2015
- 60 -
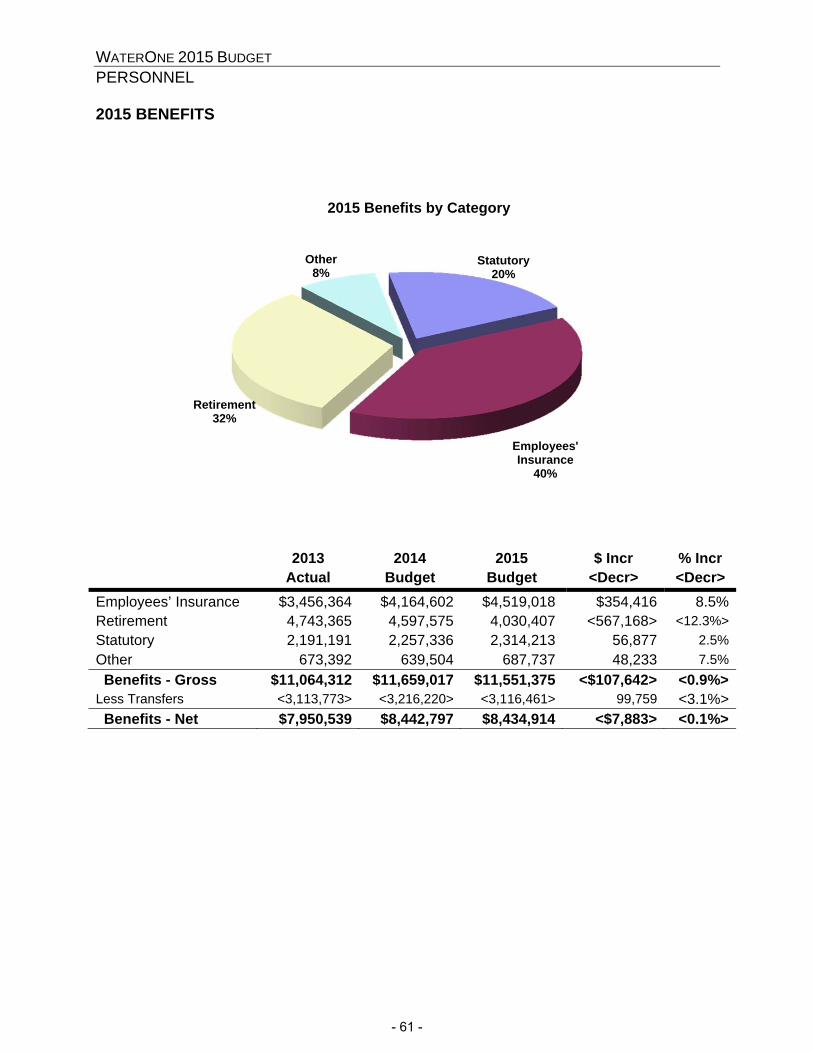
WATERONE 2015 BUDGET PERSONNEL 2015 BENEFITS
2013 2014 2015 $ Incr % Incr Actual Budget Budget <Decr> <Decr>
Employees’ Insurance $3,456,364 $4,164,602 $4,519,018 $354,416 8.5%Retirement 4,743,365 4,597,575 4,030,407 <567,168> <12.3%>Statutory 2,191,191 2,257,336 2,314,213 56,877 2.5%Other 673,392 639,504 687,737 48,233 7.5% Benefits - Gross $11,064,312 $11,659,017 $11,551,375 <$107,642> <0.9%>Less Transfers <3,113,773> <3,216,220> <3,116,461> 99,759 <3.1%> Benefits - Net $7,950,539 $8,442,797 $8,434,914 <$7,883> <0.1%>
Statutory20%
Employees' Insurance
40%
Retirement32%
Other8%
2015 Benefits by Category
- 61 -

WATERONE 2015 BUDGET PERSONNEL A table and explanation of significant employee benefit expense budgets follows.
Benefit Expenses 2013 2014 2015 $ Incr % Incr Actual Budget Budget <Decr> <Decr>
Employees’ Ins - Health $3,264,333 $3,879,201 $4,176,450 $297,249 7.7%Defined Benefit Plan(1) 3,149,717 3,063,086 2,656,864 <406,222> <13.3%>FICA 1,627,525 1,739,247 1,802,440 63,193 3.6%Worker’s Compensation 547,775 554,975 542,874 <12,101> <2.2%>Defined Contr Base(2) 488,268 553,607 461,789 <91,818> <16.6%>OPEB 838,498 600,000 400,000 <200,000> <33.3%>Defined Contr Match(3) 334,011 380,882 317,711 <63,171> <16.6%>Retirees’ Ins - Health 173,295 240,119 292,881 52,762 22.0%Employees’ Ins - Dental 189,077 213,925 228,256 14,331 6.7%Employees’ Ins - Life 80,947 90,594 96,663 6,069 6.7%Other Employee Benefits 94,118 67,680 77,840 10,160 15.0%Emp Ins – LT Disab 60,716 69,199 75,802 6,603 9.5%DefCont Base Eff 1/1/14(2) 0 0 72,956 72,956 N/ADefContr Mtch Eff 1/1/14(3) 0 0 65,661 65,661 N/ACash Bal Plan Eff 1/1/14(1) 0 0 55,426 55,426 N/AEmployees’ Ins - Vision 38,209 47,683 51,847 4,164 8.7%Comp & Ben Cons Sv 29,562 35,000 42,000 7,000 20.0%Unemployment Ins 66,005 23,114 28,899 5,785 25.0%Tuition Reimbursement 5,357 20,000 20,000 0 0.0%Service Awards 12,649 18,200 17,950 <250> <1.4%>All Other Accounts 64,250 62,505 67,066 4,561 7.3%
Total Benefit Expense $11,064,312 $11,659,017 $11,551,375 <$107,642> <0.9%>Numbers may not add due to rounding.
Employees’ Ins Health The budgeted components of the increase in health insurance are a 4.9% experience premium increase, a 1% increase for the Affordable Care Act (ACA), and a 1.8% increase for six additional full time personnel plus a reclassification from part time to full time. Changes in the employee coverage mix are included in the 4.9% premium increase. Total Pension Accounts The total Pension budget is comprised of both Defined Benefit Plans and Defined Contribution Plans, which include plans for employees hired prior to 1/1/2014 and employees hired 1/1/2014 and after (the “new” plan). The total projected pension cost has decreased, and the majority of the projected reduction is due to the addition of a 2013 gain and the expiration of a 2004 loss in the pre-2014 Defined Benefit Plan.
- 62 -
WATERONE 2015 BUDGET PERSONNEL
1. Defined Benefit Plan
Defined Benefit Plan: Changes to this account reflect changes in payroll costs, participation rates, and amortized gains and losses to the pension trust. The budget is based on projected payroll and information from the annual actuarial report. The 2015 budget is decreasing primarily due to the reduction in amortized losses, the increase in amortized gains, and a slight decrease in the number of participants due to the introduction of the cash balance plan which was effective for new employees January 1, 2014.
Cash Balance Plan (Eff. 1/1/2014): The Cash Balance Plan was effective for new employees on January 1, 2014. Due to the minimal projected budget impact for the first year of the plan, 2015 is the first budget year for this account. The budget for the account reflects projections for 2015 payroll costs, participation rates and the plan design.
2. Defined Contribution – Base Defined Contribution: This budget covers WaterOne’s contribution to the employees’ voluntary Defined Contribution retirement account. The budget is based on eligible full time employee base salary. The decrease is due to the reduction in eligible full time employees as a result of the modifications to the retirement plan effective for all employees hired after January 1, 2014. The reduction was partially offset by the projected payroll increase for eligible employees.
Defined Contribution Base (Eff. 1/1/2014): This budget covers WaterOne’s contribution to the employees’ voluntary Definted Contribution retirement account for all employees hired after January 1, 2014. The budget is based on eligible full time employees’ base salary. Due to the minimal projected budget impact for the first year of the plan, 2015 is the first budget year for this account.
3. Defined Contribution – Match
Defined Contribution: This budget covers WaterOne’s matching contribution to the employees’ voluntary Defined Contribution retirement account. The budget is based on projected payroll and participation rates of eligible employees. The decrease is due to the reduction in participation rates as a result of the modifications to the retirement plan effective for all employees hired after January 1, 2014. The reduction was partially offset by the projected payroll increase for eligible participating employees.
Defined Contribution Match (Eff. 1/1/2014): This budget covers WaterOne’s matching contribution to the employees’ voluntary Defined Contribution retirement account for all employees hired after January 1, 2014. The budget is based on projected payroll and participation rates of eligible employees. Due to the minimal projected budget impact for the first year of the plan, 2015 is the first budget year for this account.
- 63 -

WATERONE 2015 BUDGET PERSONNEL
FICA The budget increase is due to the higher projected payroll and includes FICA for the six additional full time, one additional part time, one additional summer, and one reclassification from part time to full time budget requests. Worker’s Compensation The Worker’s Compensation insurance policy renews in July of each year so premiums that are effective beginning in July 2014 will be in effect for the first half of the 2015 budget. There is a 1% premium increase over current actual rates for the first half of 2015 and an additional 10% increase is projected for the second half of the year. These premium increases are not reflected in the budget increase because last year’s budgeted rates were too high. Other Post-Employment Benefits (OPEB) OPEB is for eligible employees’ future covered health care after retirement. OPEB costs are recognized and booked on an accrual basis over the retiree’s active working lifetime. AARP and health insurance costs for those who are under 65 years of age are based on actual premiums paid by WaterOne. The key assumptions are the cost of health care coverage which varies by age, the number of retirees, and the discount rate. The budget is based on a biennial actuarial valuation. Future actuarial valuations may increase the funding needed for OPEB if the current health care premium increase assumptions are too low. Currently, the uncertainty about future health care costs is higher than normal because the impact of the Affordable Care Act is not clear.
Retirees’ Insurance - Health The majority of retirees are covered by AARP which is estimated to increase 3.0%, however, Blue Cross Blue Shield premiums are projected to increase 4.9%. The difference in premium increase is primarily due to the difference in how AARP structures their rates and their risk profile. AARP has a very large risk pool, and is protected from large losses because Medicare is the primary payer of retiree health costs. The remaining factor is the increase in the number of retirees who have entered the plan. Employees’ Insurance - Dental The current budget is based on a 5.0% premium increase, the current coverage mix, and six additional full time requests plus a reclassification from part time to full time. Employees’ Insurance - Life The budget increase includes the projected payroll increase, a premium rate increase, and six new full time and one reclassification from part time to full time personnel requests. Basic and AD&D rates are expected to increase 5%. The rates are budgeted at $0.1995 and $0.0294 per $1,000.
- 64 -

WATERONE 2015 BUDGET PERSONNEL
Other Employee Benefits This budget funds various activities such as retirement parties, United Way activities, Employee Day, and Pancakes with Santa. The increase is almost entirely due to the increase in the number of employees who will be retiring. Employee Insurance - Long Term Disability (LTD) The budget increase is due to a rate increase, the increased payroll projection, and six full time additional personnel requests and one reclassification from part time to full time. The LTD rate per $100 of payroll is increased 5% to $0.315 per $100 of full time payroll. Employees’ Insurance - Vision The budget includes an anticipated 7% rate increase. It is based on the current mix of family and individual coverage. It also includes six additional full time and one reclassification from part time to full time requests. Compensation and Benefit Consulting Services This budget funds benefit consulting projects. The increase is for the compensation review and the Employee Engagement Survey that is conducted every other year. Unemployment Insurance The 2015 unemployment rate is increased from 0.10% to 0.12%. The unemployment budget is developed based on the projected 2015 payroll budget.
Tuition Reimbursement This budget is used to reimburse employees for approved post secondary education. It includes the same provision as last year which assumes that eight employees will participate. Service Awards This budget funds the service award programs. These programs provide for employee service awards, retirement events, and the service award recognition event. The budget is based on history and the projected number of recipients.
- 65 -

WaterOne 2015 BudgetPersonnel
2006 2007 2008 2009 2010 2011 2012 2013 2014 2015Full Time 348 355 366 371 362 350 357 360 368 374Part Time 19 18 19 20 15 14 13 13 8 10Summer 19 21 22 22 13 15 15 15 18 19Total 386 394 407 413 390 379 385 388 394 403
Total FTE 365.7 372.8 385.2 390.1 375.8 363.5 369.6 373.4 377.7 385.2
H:\Finance\FINSHARE\1BUDGET\2015 Budget\Personnel\[headcount_history_division-2015 15Z.xls]Graph 2/25/15 9:41 AM
365.7 372.8385.2 390.1
375.8363.5 369.6 373.4 377.7 385.2
200
250
300
350
400
450
2006 2007 2008 2009 2010 2011 2012 2013 2014 2015
History of Full Time Equivalent Employees
1
813
6
-23
-11
63
69
-30
-25
-20
-15
-10
-5
0
5
10
15
20
2006 2007 2008 2009 2010 2011 2012 2013 2014 2015
Headcount Change (Full Time, Part Time, & Summer Positions)
- 66 -

WATERONE 2015 BUDGET PERSONNEL Average Customers Served Per Employee The local recovery in the housing market is causing customer growth to increase. The revised 2015 projections are now estimated at 1,300 customers. WaterOne adjusted its employee base in 2010-2011 but since has added a modest amount of new employees in order to provide the level of service that is expected. The result is that average customers served per employee has been relatively stable since 2011. The ratio of customers served per employee is used as a broad measure to check the balance of the number of customers to the number of personnel. The following chart shows a 10 year look at this ratio which includes the estimate for 2015.
367
365
356352
366
380376
375 374
370
330
340
350
360
370
380
390
400
2006 2007 2008 2009 2010 2011 2012 2013 2014Budget
2015Budget
Cu
st S
erve
d p
er E
mp
loye
e
- 67 -

This page intentionally left blank.
- 68 -
WATERONE 2015 BUDGET TOTAL CIP
CAPITAL IMPROVEMENT PROGRAM
WaterOne provides water service to approximately 408,000 residents of Johnson County in 17 municipalities and encompasses 272 square miles. While WaterOne’s service territory is only about 55% developed, portions of the distribution system are over 50 years old. This puts WaterOne in the position of planning and building for the growth of the system while at the same time dealing with the challenges of aging infrastructure. In order to meet its diverse capital needs, WaterOne has developed a Capital Improvement Program (CIP) that consists of three components.
1. Master Plan – The Master Plan includes projects to build new or replace facilities related to water treatment, pumping, storage, transmission mains, and new distribution mains. Master Plan projects are designed to increase the water supply to serve new customers and to protect existing facilities from becoming obsolete. The projects in this category are more complex, more costly, and have a useful life of at least 20 years. Periodically, an engineering Master Plan study is done to provide a comprehensive long-range plan for the improvement and expansion of the water system. Replacement projects that meet the Master Plan criteria are identified by a detailed assessment of existing infrastructure needs through an asset management program.
2. Transmission & Distribution (T&D) – The T&D capital program includes spending on water
main, fire hydrant, and service connection assets. T&D expenditures are categorized, planned, and reported based on the following components: distribution main replacements, transmission main repair and replacements, relocation projects, general system improvements, condition assessments of mains, and capital main breaks.
3. Annual Capital – Annual Capital consists of the current year budget plus a rolling five-year plan for new and replacement projects or equipment purchases associated with ongoing operational needs. The most significant expenditures in the Annual Capital budget include water production, information technology, distribution and fleet equipment, as well as meter replacement. In contrast to Master Plan, the majority of Annual Capital is spent on replacement of existing assets, and as WaterOne continues to age, the percentage of Annual Capital spent on replacement continues to increase. Annual Capital replacement projects are also identified by asset management programs, but they are usually less costly and tend to have shorter useful lives than Master Plan projects.
The major sources of funds for these capital expenditures are:
System Development Charges (SDCs) – SDCs are paid by new customers when they apply for a service connection permit. The amount of the SDC, based on a growth pays for growth philosophy, is approved by the Board and is based on the result of an annual cost of service analysis. The SDC is designed so that new customers, through a “buy-in” methodology, pay for their share of the cost of capacity. SDCs are used to fund the Master Plan or pay off outstanding debt.
Water Sales Revenue – Funds are budgeted on a “pay-as-you-go” basis from current water rates to fund Annual Capital, T&D, and Master Plan.
Long-Term Debt – WaterOne issues tax exempt revenue bonds for funding of the Master Plan
when necessary. Bonds are used to fund the construction of significant expansions and replacements. The use of bonds helps avoid abnormally large water rate increases and improves equity between generations of WaterOne customers.
- 69 -

WATERONE 2015 BUDGET TOTAL CIP
CIP Funding
FUNDING 2015 2016 2017 2018 2019 2020 Total
Bonds & Investment Income $0 $0 $0 $41,000,000 $0 $15,000,000 $56,000,000
SDC & Investment Income $6,351,500 $7,282,500 $9,021,800 $11,180,000 $11,330,000 $11,580,000 $56,745,800
Water Rates $28,375,473 $31,212,406 $33,710,676 $36,723,982 $38,854,956 $40,011,601 $208,889,094
Total CIP Funding $34,726,973 $38,494,906 $42,732,476 $88,903,982 $50,184,956 $66,591,601 $321,634,894
CIP Expenditures
EXPENDITURES 2015 2016 2017 2018 2019 2020 Total
Master Plan $35,895,896 $12,597,592 $2,931,664 $43,678,850 $38,010,792 $44,640,163 $177,754,957
Annual Capital $11,207,000 $11,280,000 $11,730,000 $12,200,000 $12,680,000 $13,180,000 $72,277,000
Transmission & Distribution $13,743,000 $14,776,000 $15,903,000 $17,126,000 $18,443,000 $19,888,000 $99,879,000
Total CIP Expenditures $60,845,896 $38,653,592 $30,564,664 $73,004,850 $69,133,792 $77,708,163 $349,910,957
Bonds17%
SDC18%
Water Rates65%
Transmission & Distribution
28%
Master Plan51%
Annual Capital21%
- 70 -

WATERONE 2015 BUDGET TOTAL CIP
2015 Master Plan
Master Plan Purpose and Funding Source & Treatment - These facilities consist of structures including river intakes, collector wells, a
river weir, reservoirs, residual monofills, supply mains and treatment plants. WaterOne’s raw water is derived from several sources: the Kansas well field, an intake on the Kansas River, an intake on the Missouri River, and a collector well on the Missouri River. These four sources provide 200 million gallons per day (mgd). The Wolcott Plant is the most recent addition to the production facilities and is currently producing 30 mgd.
Pumping and Storage – These facilities consist of equipment and structures including pumps, pump
stations, underground and ground level reservoirs as well as elevated storage in water towers. Pumping provides a target hydraulic pressure of 40 psi to the distribution system in order to meet Board policy requirements. Storage is primarily needed to maintain adequate supply during peak demand periods, for fire protection, and to serve as emergency pressure to the system in the event of equipment failure or power interruption. There is currently 83 million gallons of storage capacity in the distribution system.
New & Replacement Transmission Mains and New Distribution Mains – These facilities include
water mains, pressure reducing valves, and appurtenances for the mains. Transmission mains are defined as greater than 16” in diameter. Distribution mains are 16” in diameter and smaller. New or replacement mains included in the Master Plan are primarily related to the latest Water Supply Master Plan developed by WaterOne’s consulting engineers.
Source & Treatment
52%
Pumping & Storage
15%
Phase V Transmission &
Distribution33%
- 71 -
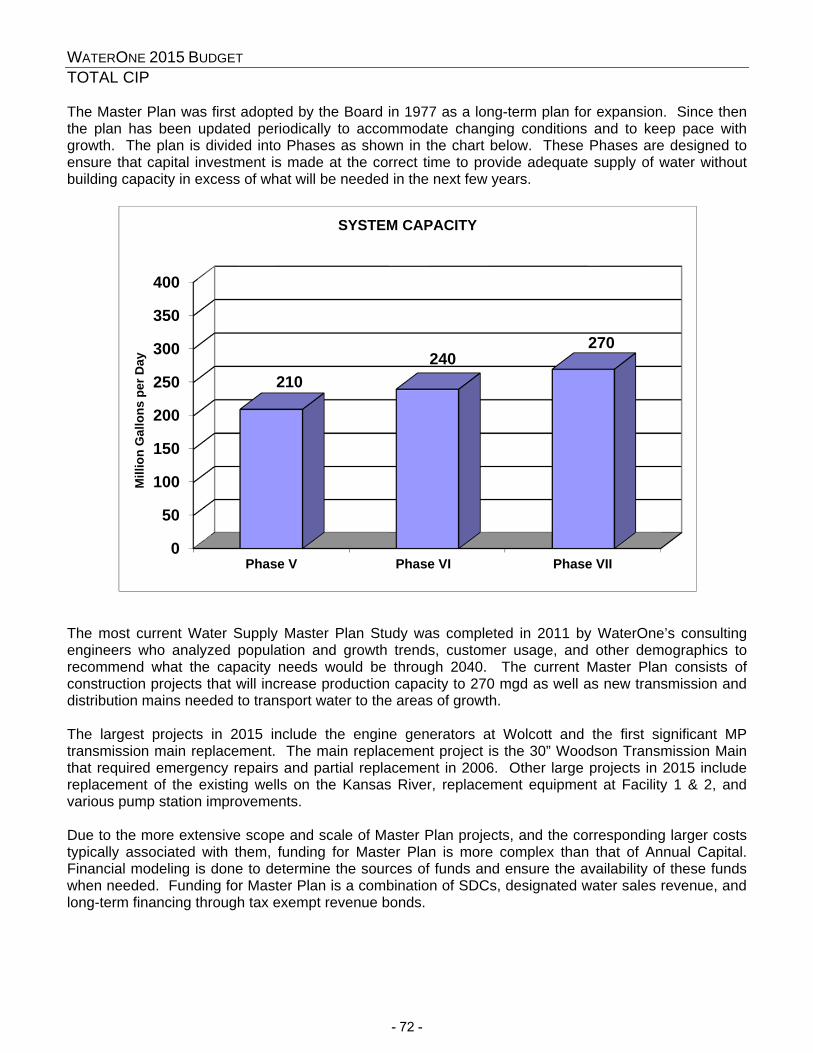
WATERONE 2015 BUDGET TOTAL CIP The Master Plan was first adopted by the Board in 1977 as a long-term plan for expansion. Since then the plan has been updated periodically to accommodate changing conditions and to keep pace with growth. The plan is divided into Phases as shown in the chart below. These Phases are designed to ensure that capital investment is made at the correct time to provide adequate supply of water without building capacity in excess of what will be needed in the next few years. The most current Water Supply Master Plan Study was completed in 2011 by WaterOne’s consulting engineers who analyzed population and growth trends, customer usage, and other demographics to recommend what the capacity needs would be through 2040. The current Master Plan consists of construction projects that will increase production capacity to 270 mgd as well as new transmission and distribution mains needed to transport water to the areas of growth. The largest projects in 2015 include the engine generators at Wolcott and the first significant MP transmission main replacement. The main replacement project is the 30” Woodson Transmission Main that required emergency repairs and partial replacement in 2006. Other large projects in 2015 include replacement of the existing wells on the Kansas River, replacement equipment at Facility 1 & 2, and various pump station improvements. Due to the more extensive scope and scale of Master Plan projects, and the corresponding larger costs typically associated with them, funding for Master Plan is more complex than that of Annual Capital. Financial modeling is done to determine the sources of funds and ensure the availability of these funds when needed. Funding for Master Plan is a combination of SDCs, designated water sales revenue, and long-term financing through tax exempt revenue bonds.
0
50
100
150
200
250
300
350
400
Phase V Phase VI Phase VII
210240
270
Mill
ion
Gal
lons
per
Day
SYSTEM CAPACITY
- 72 -
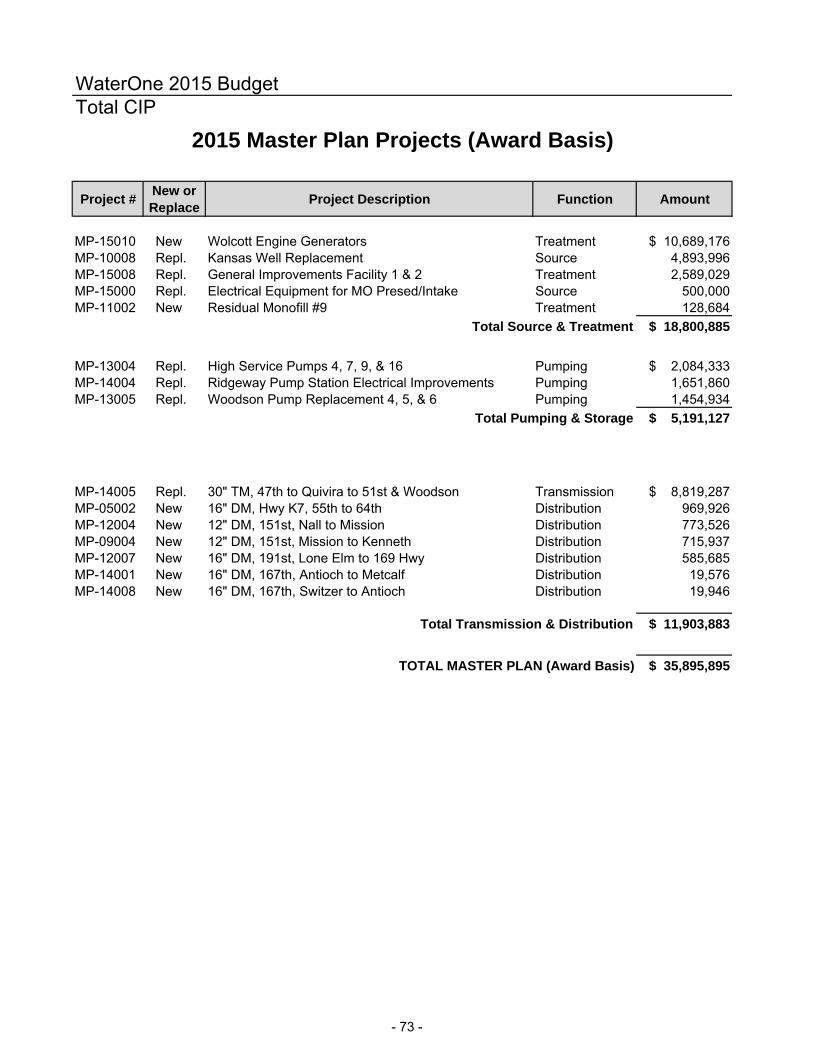
WaterOne 2015 BudgetTotal CIP
Project #New or Replace
Project Description Function Amount
MP-15010 New Wolcott Engine Generators Treatment $ 10,689,176 MP-10008 Repl. Kansas Well Replacement Source 4,893,996 MP-15008 Repl. General Improvements Facility 1 & 2 Treatment 2,589,029 MP-15000 Repl. Electrical Equipment for MO Presed/Intake Source 500,000 MP-11002 New Residual Monofill #9 Treatment 128,684
Total Source & Treatment $ 18,800,885
MP-13004 Repl. High Service Pumps 4, 7, 9, & 16 Pumping $ 2,084,333 MP-14004 Repl. Ridgeway Pump Station Electrical Improvements Pumping 1,651,860 MP-13005 Repl. Woodson Pump Replacement 4, 5, & 6 Pumping 1,454,934
Total Pumping & Storage $ 5,191,127
MP-14005 Repl. 30" TM, 47th to Quivira to 51st & Woodson Transmission $ 8,819,287 MP-05002 New 16" DM, Hwy K7, 55th to 64th Distribution 969,926 MP-12004 New 12" DM, 151st, Nall to Mission Distribution 773,526 MP-09004 New 12" DM, 151st, Mission to Kenneth Distribution 715,937 MP-12007 New 16" DM, 191st, Lone Elm to 169 Hwy Distribution 585,685 MP-14001 New 16" DM, 167th, Antioch to Metcalf Distribution 19,576 MP-14008 New 16" DM, 167th, Switzer to Antioch Distribution 19,946
Total Transmission & Distribution $ 11,903,883
TOTAL MASTER PLAN (Award Basis) $ 35,895,895
2015 Master Plan Projects (Award Basis)
- 73 -

WATERONE 2015 BUDGET TOTAL CIP
2015 Transmission & Distribution Funding
Transmission & Distribution Purpose and Funding
Distribution Main Replacements - Main replacements are budgeted based on the results of a water main asset management project that was developed in 2003 with the most recent update completed in 2013. The objective of the project was to produce a financial model that would identify the appropriate level of main replacement due to “wear-out”. The goal is to replace all assets, including water mains, at the time which produces the lowest life-cycle cost of that particular asset. The decision as to which main replacement projects are the highest priority is determined by a decision matrix that includes many factors, some of which are:
The number of breaks per mile per year Condition assessment A risk analysis of the consequence of failure Coordinating replacements with municipal street improvement projects
Restoration of streets, curbs, and sidewalks are a significant component of replacement costs, so WaterOne is communicating with the municipalities’ public works departments in order to coordinate the replacement of water mains with the municipalities’ street projects. The goal is to minimize costs as well as reduce traffic disruptions to the public. WaterOne continues to use and investigate various condition assessment methods to improve its knowledge of the condition of underground assets. Different replacement technologies and techniques are also being used depending on the size, location, difficulty of replacement, and the type of restoration required.
Distribution Main Relocations - These projects are constructed in coordination with street
improvement projects planned by the municipalities that WaterOne serves. As the municipalities’ populations grow, those municipalities’ street improvement projects require main relocation so they are not in conflict with future streets. Mains that are in public right-of-way are paid for by WaterOne, while mains in private easement are paid for by the requesting city.
General Improvements
16%
Distribution Main Breaks
14%
Distribution Main Relocations
17%
Distribution Main Replacements
41%
Condition Assessment
5%Transmission Main Repair & Replacements
7%
- 74 -

WATERONE 2015 BUDGET TOTAL CIP
General Improvements - General system improvements include normal service connection rehabilitation, main upsizing and downsizing, and installing new mains, valves, and fire hydrants. WaterOne has approximately 140,000 service connections which are the pipe and related material that connect the water main to the meter. These service connections require ongoing replacement and rehabilitation in order to maintain a reliable water supply. Main upsizing occurs when a main is replaced with a larger diameter main to allow for increased capacity or water flow. Most upsizing is paid for by WaterOne and is done in conjunction with relocation projects to improve water flow throughout the system. Some upsizing is done when new housing and commercial development occurs and is paid for by the developer. New mains are occasionally installed to extend the system, but are primarily needed to provide redundant supply or improve fire protection water flow in a particular area.
Distribution Main Breaks - Main breaks are unplanned construction to replace sections of a water main or an entire fire hydrant that is broken and leaking. If the nature of the leak is such that a clamp can be used to make the repair, it is considered to be an operational maintenance cost. If a section of main is taken out and replaced with new main, it is considered to be a capital improvement. Given our aging infrastructure, the number of capital main breaks has increased over time and is expected to continue to increase into the future. WaterOne takes steps to minimize the rate of increase in breaks through a replacement program, which is described above in the Main Replacements section.
Transmission Main Repair & Replacements - This category includes combination air
valve replacements and relocations, blow off replacements and relocations, blind flanges and related bolt replacements, and transmission main capital breaks. New installations and extensive replacements of transmission mains are funded in Master Plan.
Condition Assessment - This category includes hiring contractors to assess main
condition as well as WaterOne construction of manways for access to the entrance of the pipe.
- 75 -

WATERONE 2015 BUDGET TOTAL CIP
2010Actual
2011Actual
2012Actual
2013Actual
2014Budget
2015Budget
Other $0.7 $0.3 $0.2 $0.0 $0.0 $0.0
Condition Assessment $0.0 $0.4 $0.7 $0.4 $0.5 $0.6
Transmission Repair & Replacements $0.0 $0.0 $0.8 $0.7 $0.3 $0.9
Distribution Main Breaks $1.6 $1.7 $2.2 $1.5 $2.2 $1.9
General Improvements $1.7 $1.9 $1.5 $1.6 $2.0 $2.3
Distribution Main Relocations $2.5 $2.2 $1.5 $2.1 $2.2 $2.4
Distribution Main Replacements $2.4 $2.9 $3.4 $8.0 $4.7 $5.6
$0.0
$2.0
$4.0
$6.0
$8.0
$10.0
$12.0
$14.0
$16.0
In M
illions
Transmission & Distribution by Category
- 76 -
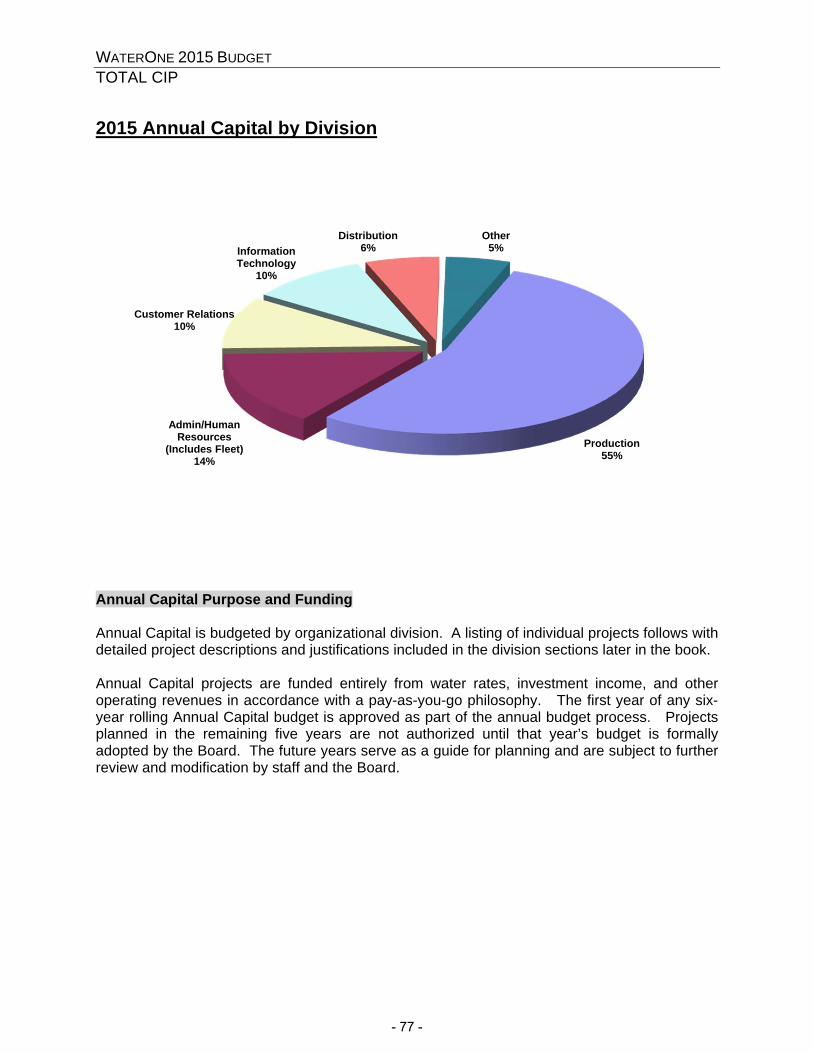
WATERONE 2015 BUDGET TOTAL CIP
2015 Annual Capital by Division
Annual Capital Purpose and Funding
Annual Capital is budgeted by organizational division. A listing of individual projects follows with detailed project descriptions and justifications included in the division sections later in the book. Annual Capital projects are funded entirely from water rates, investment income, and other operating revenues in accordance with a pay-as-you-go philosophy. The first year of any six-year rolling Annual Capital budget is approved as part of the annual budget process. Projects planned in the remaining five years are not authorized until that year’s budget is formally adopted by the Board. The future years serve as a guide for planning and are subject to further review and modification by staff and the Board.
Production55%
Admin/Human Resources
(Includes Fleet)14%
Customer Relations10%
Information Technology
10%
Distribution6%
Other5%
- 77 -
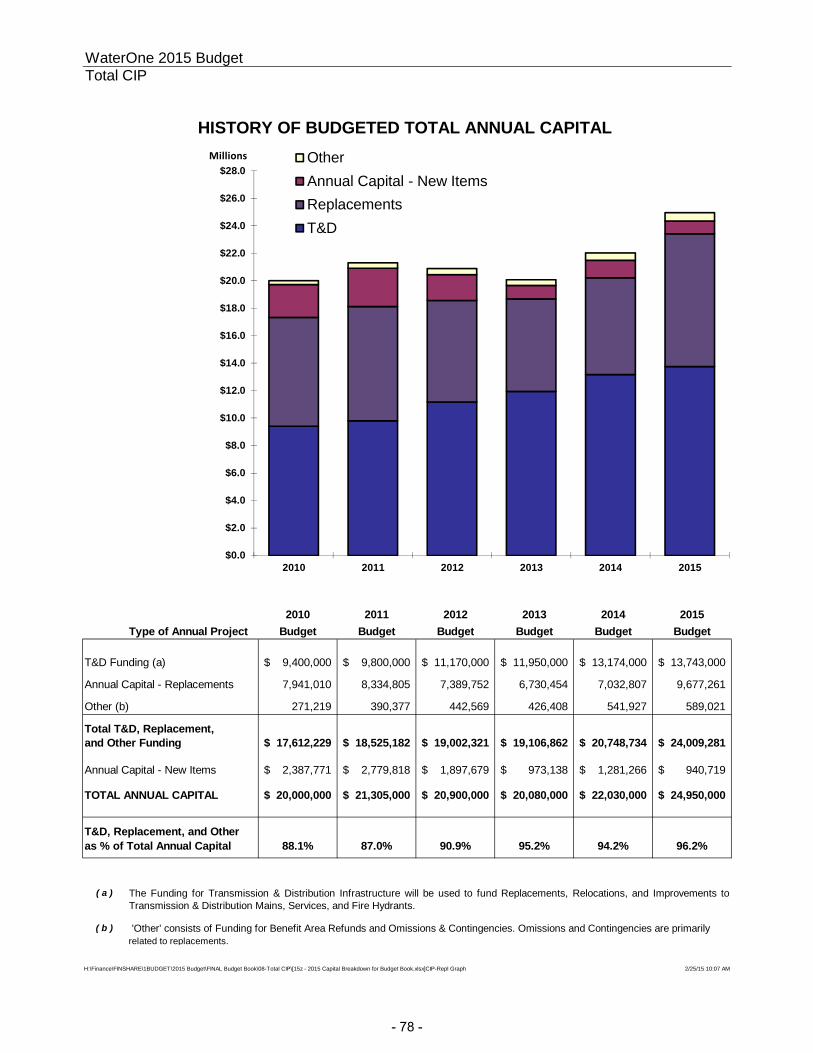
WaterOne 2015 Budget Total CIP
2010 2011 2012 2013 2014 2015Type of Annual Project Budget Budget Budget Budget Budget Budget
T&D Funding (a) 9,400,000$ 9,800,000$ 11,170,000$ 11,950,000$ 13,174,000$ 13,743,000$
Annual Capital - Replacements 7,941,010 8,334,805 7,389,752 6,730,454 7,032,807 9,677,261
Other (b) 271,219 390,377 442,569 426,408 541,927 589,021
17,612,229$ 18,525,182$ 19,002,321$ 19,106,862$ 20,748,734$ 24,009,281$
Annual Capital - New Items 2,387,771$ 2,779,818$ 1,897,679$ 973,138$ 1,281,266$ 940,719$
TOTAL ANNUAL CAPITAL 20,000,000$ 21,305,000$ 20,900,000$ 20,080,000$ 22,030,000$ 24,950,000$
T&D, Replacement, and Otheras % of Total Annual Capital 88.1% 87.0% 90.9% 95.2% 94.2% 96.2%
( a )
( b )
related to replacements.
H:\Finance\FINSHARE\1BUDGET\2015 Budget\FINAL Budget Book\08-Total CIP\[15z - 2015 Capital Breakdown for Budget Book.xlsx]CIP-Repl Graph 2/25/15 10:07 AM
The Funding for Transmission & Distribution Infrastructure will be used to fund Replacements, Relocations, and Improvements toTransmission & Distribution Mains, Services, and Fire Hydrants.
'Other' consists of Funding for Benefit Area Refunds and Omissions & Contingencies. Omissions and Contingencies are primarily
Total T&D, Replacement, and Other Funding
HISTORY OF BUDGETED TOTAL ANNUAL CAPITAL
$0.0
$2.0
$4.0
$6.0
$8.0
$10.0
$12.0
$14.0
$16.0
$18.0
$20.0
$22.0
$24.0
$26.0
$28.0
2010 2011 2012 2013 2014 2015
OtherAnnual Capital - New ItemsReplacementsT&D
Millions
- 78 -
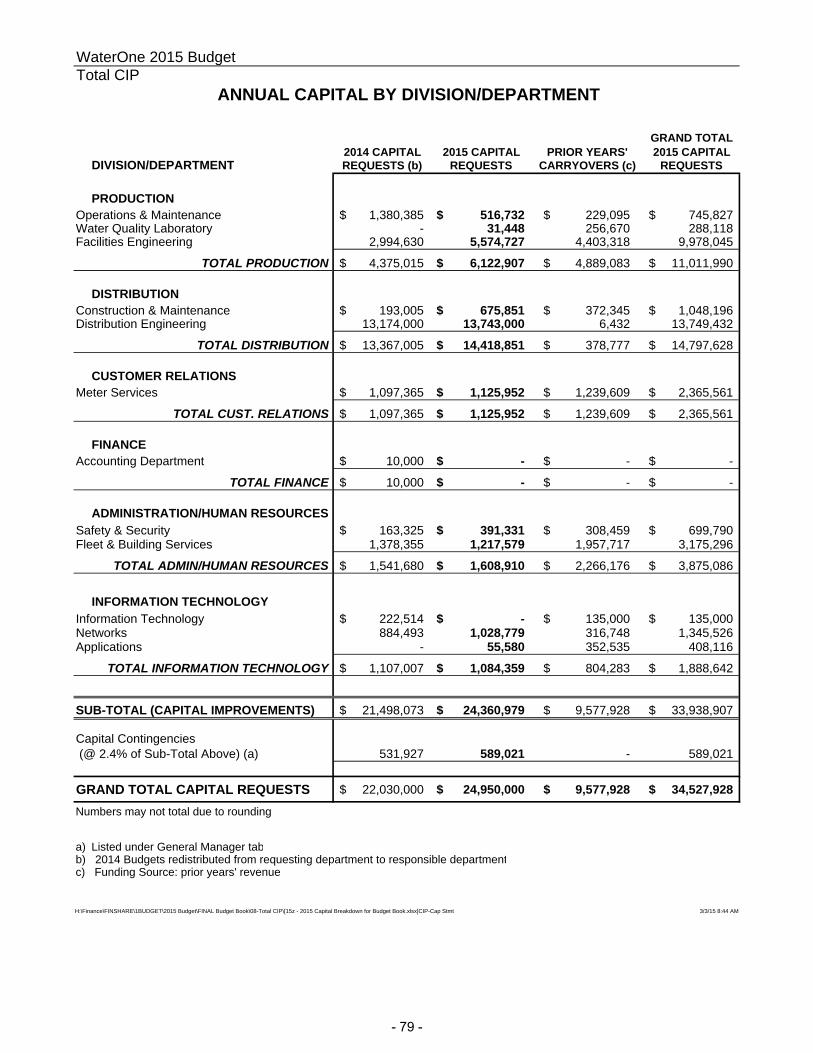
WaterOne 2015 BudgetTotal CIP
GRAND TOTAL2014 CAPITAL 2015 CAPITAL PRIOR YEARS' 2015 CAPITAL
DIVISION/DEPARTMENT REQUESTS (b) REQUESTS CARRYOVERS (c) REQUESTS
PRODUCTIONOperations & Maintenance 1,380,385$ 516,732$ 229,095$ 745,827$ Water Quality Laboratory - 31,448 256,670 288,118 Facilities Engineering 2,994,630 5,574,727 4,403,318 9,978,045
TOTAL PRODUCTION 4,375,015$ 6,122,907$ 4,889,083$ 11,011,990$
DISTRIBUTIONConstruction & Maintenance 193,005$ 675,851$ 372,345$ 1,048,196$ Distribution Engineering 13,174,000 13,743,000 6,432 13,749,432
TOTAL DISTRIBUTION 13,367,005$ 14,418,851$ 378,777$ 14,797,628$
CUSTOMER RELATIONSMeter Services 1,097,365$ 1,125,952$ 1,239,609$ 2,365,561$
TOTAL CUST. RELATIONS 1,097,365$ 1,125,952$ 1,239,609$ 2,365,561$
FINANCEAccounting Department 10,000$ -$ -$ -$
TOTAL FINANCE 10,000$ -$ -$ -$
ADMINISTRATION/HUMAN RESOURCESSafety & Security 163,325$ 391,331$ 308,459$ 699,790$ Fleet & Building Services 1,378,355 1,217,579 1,957,717 3,175,296
TOTAL ADMIN/HUMAN RESOURCES 1,541,680$ 1,608,910$ 2,266,176$ 3,875,086$
INFORMATION TECHNOLOGYInformation Technology 222,514$ -$ 135,000$ 135,000$ Networks 884,493 1,028,779 316,748 1,345,526 Applications - 55,580 352,535 408,116
TOTAL INFORMATION TECHNOLOGY 1,107,007$ 1,084,359$ 804,283$ 1,888,642$
SUB-TOTAL (CAPITAL IMPROVEMENTS) 21,498,073$ 24,360,979$ 9,577,928$ 33,938,907$
531,927 589,021 - 589,021
GRAND TOTAL CAPITAL REQUESTS 22,030,000$ 24,950,000$ 9,577,928$ 34,527,928$
Numbers may not total due to rounding
a) Listed under General Manager tabb) 2014 Budgets redistributed from requesting department to responsible departmentc) Funding Source: prior years' revenue
H:\Finance\FINSHARE\1BUDGET\2015 Budget\FINAL Budget Book\08-Total CIP\[15z - 2015 Capital Breakdown for Budget Book.xlsx]CIP-Cap Stmt 3/3/15 8:44 AM
ANNUAL CAPITAL BY DIVISION/DEPARTMENT
Capital Contingencies (@ 2.4% of Sub-Total Above) (a)
- 79 -

WaterOne 2015 BudgetTotal CIP
*2014 Budget
12-31-2014 Unspent
Budget Carry-Over to 2015
PRODUCTION
AC-14612 SCADA Hardware and Software 278,142$ 107,116$ 107,116$
AC-14500 On-Line Analyzers (Treatment/Dist) 281,164 75,784 75,784
AC-14706 Replace MO Presed Chem Level Devices 67,310 29,506 29,506
AC-14703 Spare Parts for Pall Membrane Filters 16,689 16,689 16,689
Operations & Maintenance Department Subtotal 643,306$ 229,095$ 229,095$
AC-14200 Inductively Coupled Plasma - Mass Spect. 202,488$ 202,488$ 202,488$
AC-13032 Temperature Monitoring & Alarm System 30,817 30,817 30,817
AC-14201 UV-Vis Spectrophotometer 23,365 23,365 23,365
Water Quality Laboratory Department Subtotal 256,670$ 256,670$ 256,670$
AC-13038 F2 North HVAC Improvements 287,574$ 270,968$ 977,632$
AC-13039 Facility 2 HVAC Improvements 927,896 868,899 516,892
AC-14019 Paint Exterior & Interior of Wells Tank 445,028 443,913 443,913
AC-14030 Facility 1 Carbon Dioxide Tank Replacement 599,063 465,502 388,499
AC-14027 Kansas Presed Effluent Control Enhancement 200,874 82,123 288,150
AC-14100 Admin HQ Workspace Reconfiguration 278,142 278,142 278,142
OC-14013 Chlorine System Improvements 192,069 192,069 236,217
AC-12004 O&M HVAC Improvements 500,000 421,108 214,039
AC-14060 Renner Yard North Gate Replacement 83,444 79,815 205,421
AC-14065 Adjustable Frequency Drives (AFDs) 178,011 178,011 199,800
AC-14034 Replace O&M Fire Alarm System 34,744 29,741 140,217
AC-14026 Missouri River Intake Safety Enhancement 225,852 206,117 135,600
AC-14035 Replace Control Room Halon System 114,272 110,382 110,151
AC-14041 Repl Lime & Soda Ash Dust Coll. -Fac2 220,290 220,139 85,880
AC-14032 Ridgway Pump Station Stone Fascia Replace 35,825 35,825 35,825
AC-10057 Refurbishment of Pressure Monitoring Station 50,000 36,311 33,900
AC-14038 Missouri Presed Influent Valving Enhance 83,165 68,955 32,657
AC-14028 Paint Fleet Carwash Bay 36,512 29,558 30,025
AC-14037 Kansas River Level Gauge 28,148 28,148 28,148
OC-14010 Replacement Gas Line O&M Fleet Garage 22,210 22,210 22,210
Facilities Engineering Department Subtotal 4,543,118$ 4,067,936$ 4,403,318$
PRODUCTION TOTAL 5,443,093$ 4,553,700$ 4,889,083$
PRIOR YEARS' CAPITAL CARRY-OVERSProjects funded from Prior Year Revenues Carried Over to 2015
- 80 -

WaterOne 2015 BudgetTotal CIP
*2014 Budget
12-31-2014 Unspent
Budget Carry-Over to 2015
PRIOR YEARS' CAPITAL CARRY-OVERSProjects funded from Prior Year Revenues Carried Over to 2015
DISTRIBUTION
AC-12032 GPS Equipment 107,000$ 107,000$ 107,000$
AC-12070 Snow Removal Equipment 57,000 55,011 55,011
AC-14009 Pumps, Saws, Locating Equip. and Tools 122,383 48,183 48,183
AC-11055 Permalogs 45,000 45,000 45,000
AC-11050 Valve Maintenance Vacuum and Operator 40,000 40,000 40,000
AC-14016 Portable Valve Operators 22,808 22,808 28,404
AP-14772 Equipment - New UII Leak Correlator 27,814 27,814 27,814
AC-13014 Leak Correlator 46,000 20,933 20,933
Construction and Maintenance Department Subtotal 468,005$ 366,749$ 372,345$
AC-13022 Replace Pressure Data Loggers 13,207$ 3,713$ 3,713$
AC-12043 Replace Pressure Data Loggers 9,944 2,719 2,719
Distribution Engineering Department Subtotal 39,870$ 6,432$ 6,432$
DISTRIBUTION TOTAL 507,875$ 373,181$ 378,777$
INFORMATION TECHNOLOGY
AC-14002 LAN/WAN Upgrades and Enhancements 394,962$ 260,236$ 260,236$
AC-14007 GIS Upgrades and Enhancements 222,514 222,514 135,000
AC-11905 SAP Upgrades and Enhancements 191,745 166,834 166,834
AC-13023 Records Information Management 110,059 110,059 110,059
AC-13902 Disaster Recovery Phase II 110,059 56,512 56,512
AC-13901 Renew Microsoft Contract 33,019 33,019 33,019
AP-13999 PC & Software for Developer 17,279 17,279 15,279
AC-11077 Extranet Redevelopment 60,009 45,519 14,814
AC-12901 SharePoint Administration Tools 25,367 12,530 12,530
INFORMATION TECHNOLOGY TOTAL 1,165,014$ 924,503$ 804,283$
CUSTOMER RELATIONS
AC-14008 Annual Meter Replacement 1,072,777$ 710,468$ 710,468$
AC-13004 Annual Meter Replacement (Meter Test Bench) 557,826 557,826 529,141
CUSTOMER RELATIONS TOTAL 1,630,603$ 1,268,294$ 1,239,609$
- 81 -
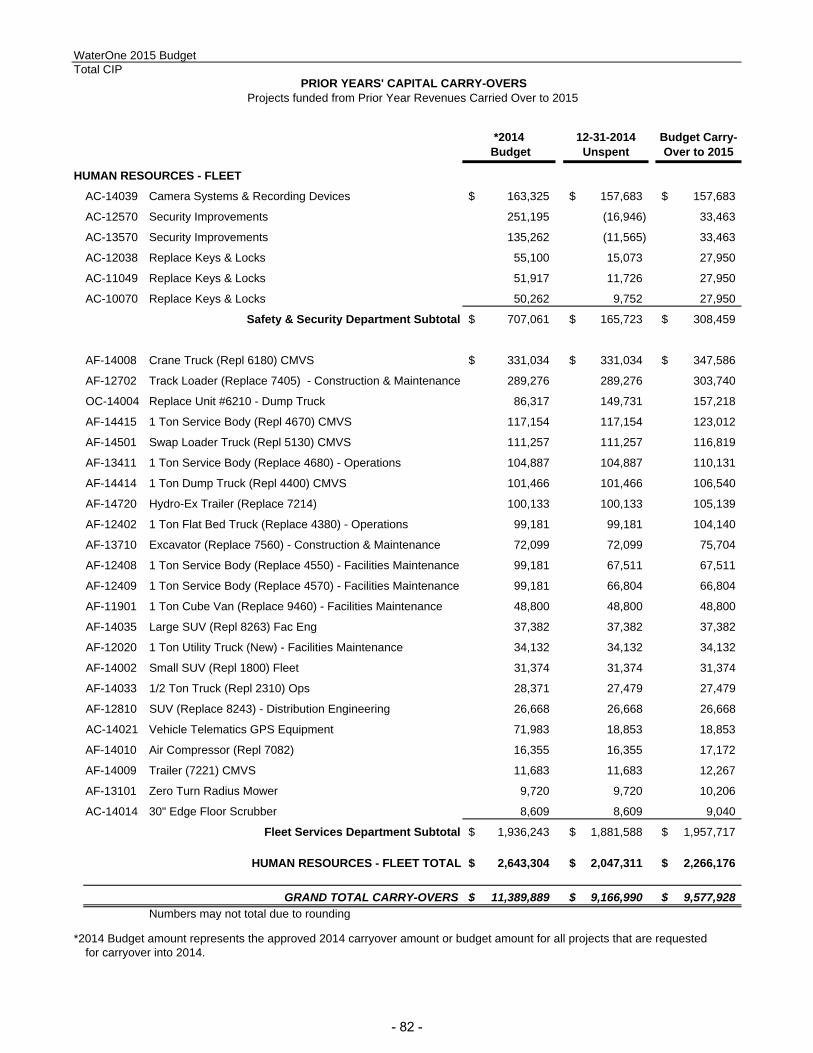
WaterOne 2015 BudgetTotal CIP
*2014 Budget
12-31-2014 Unspent
Budget Carry-Over to 2015
PRIOR YEARS' CAPITAL CARRY-OVERSProjects funded from Prior Year Revenues Carried Over to 2015
HUMAN RESOURCES - FLEET
AC-14039 Camera Systems & Recording Devices 163,325$ 157,683$ 157,683$
AC-12570 Security Improvements 251,195 (16,946) 33,463
AC-13570 Security Improvements 135,262 (11,565) 33,463
AC-12038 Replace Keys & Locks 55,100 15,073 27,950
AC-11049 Replace Keys & Locks 51,917 11,726 27,950
AC-10070 Replace Keys & Locks 50,262 9,752 27,950
Safety & Security Department Subtotal 707,061$ 165,723$ 308,459$
AF-14008 Crane Truck (Repl 6180) CMVS 331,034$ 331,034$ 347,586$
AF-12702 Track Loader (Replace 7405) - Construction & Maintenance 289,276 289,276 303,740
OC-14004 Replace Unit #6210 - Dump Truck 86,317 149,731 157,218
AF-14415 1 Ton Service Body (Repl 4670) CMVS 117,154 117,154 123,012
AF-14501 Swap Loader Truck (Repl 5130) CMVS 111,257 111,257 116,819
AF-13411 1 Ton Service Body (Replace 4680) - Operations 104,887 104,887 110,131
AF-14414 1 Ton Dump Truck (Repl 4400) CMVS 101,466 101,466 106,540
AF-14720 Hydro-Ex Trailer (Replace 7214) 100,133 100,133 105,139
AF-12402 1 Ton Flat Bed Truck (Replace 4380) - Operations 99,181 99,181 104,140
AF-13710 Excavator (Replace 7560) - Construction & Maintenance 72,099 72,099 75,704
AF-12408 1 Ton Service Body (Replace 4550) - Facilities Maintenance 99,181 67,511 67,511
AF-12409 1 Ton Service Body (Replace 4570) - Facilities Maintenance 99,181 66,804 66,804
AF-11901 1 Ton Cube Van (Replace 9460) - Facilities Maintenance 48,800 48,800 48,800
AF-14035 Large SUV (Repl 8263) Fac Eng 37,382 37,382 37,382
AF-12020 1 Ton Utility Truck (New) - Facilities Maintenance 34,132 34,132 34,132
AF-14002 Small SUV (Repl 1800) Fleet 31,374 31,374 31,374
AF-14033 1/2 Ton Truck (Repl 2310) Ops 28,371 27,479 27,479
AF-12810 SUV (Replace 8243) - Distribution Engineering 26,668 26,668 26,668
AC-14021 Vehicle Telematics GPS Equipment 71,983 18,853 18,853
AF-14010 Air Compressor (Repl 7082) 16,355 16,355 17,172
AF-14009 Trailer (7221) CMVS 11,683 11,683 12,267
AF-13101 Zero Turn Radius Mower 9,720 9,720 10,206
AC-14014 30" Edge Floor Scrubber 8,609 8,609 9,040
Fleet Services Department Subtotal 1,936,243$ 1,881,588$ 1,957,717$
HUMAN RESOURCES - FLEET TOTAL 2,643,304$ 2,047,311$ 2,266,176$
GRAND TOTAL CARRY-OVERS 11,389,889$ 9,166,990$ 9,577,928$
Numbers may not total due to rounding
*2014 Budget amount represents the approved 2014 carryover amount or budget amount for all projects that are requestedfor carryover into 2014.
- 82 -
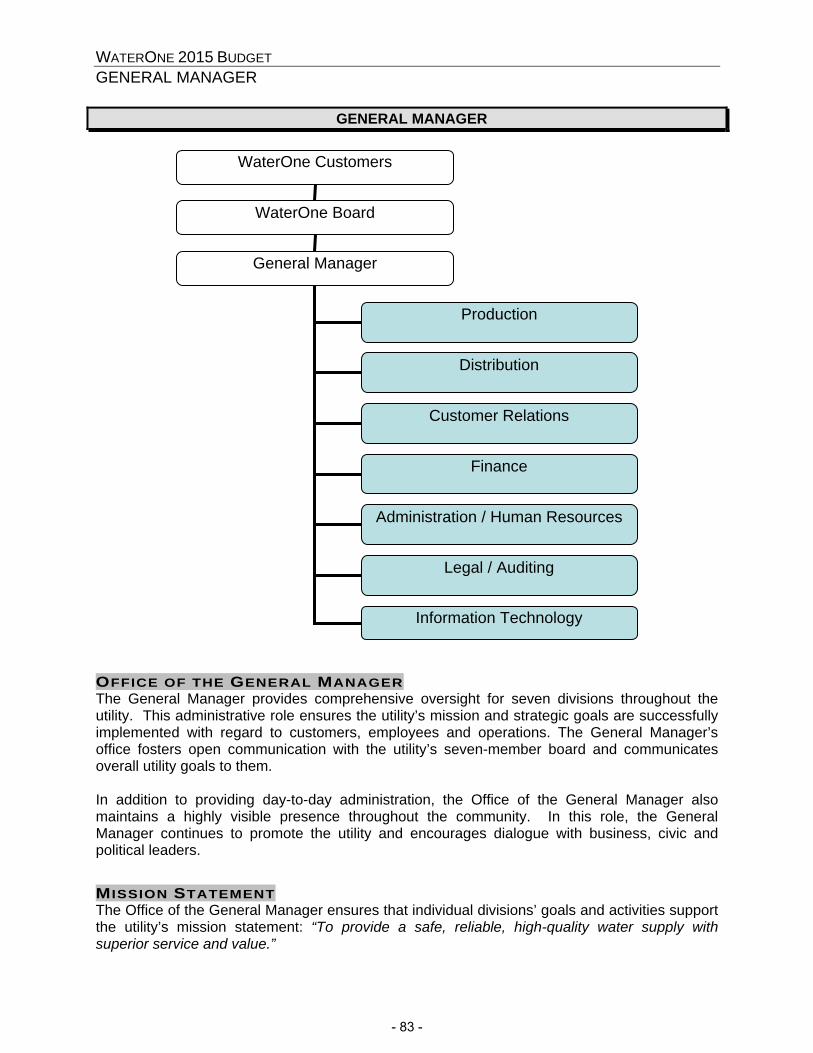
WATERONE 2015 BUDGET GENERAL MANAGER
GENERAL MANAGER
OFFICE OF THE GENERAL MANAGER The General Manager provides comprehensive oversight for seven divisions throughout the utility. This administrative role ensures the utility’s mission and strategic goals are successfully implemented with regard to customers, employees and operations. The General Manager’s office fosters open communication with the utility’s seven-member board and communicates overall utility goals to them. In addition to providing day-to-day administration, the Office of the General Manager also maintains a highly visible presence throughout the community. In this role, the General Manager continues to promote the utility and encourages dialogue with business, civic and political leaders. MISSION STATEMENT The Office of the General Manager ensures that individual divisions’ goals and activities support the utility’s mission statement: “To provide a safe, reliable, high-quality water supply with superior service and value.”
WaterOne Customers
WaterOne Board
General Manager
Production
Customer Relations
Finance
Administration / Human Resources
Information Technology
Distribution
Legal / Auditing
- 83 -
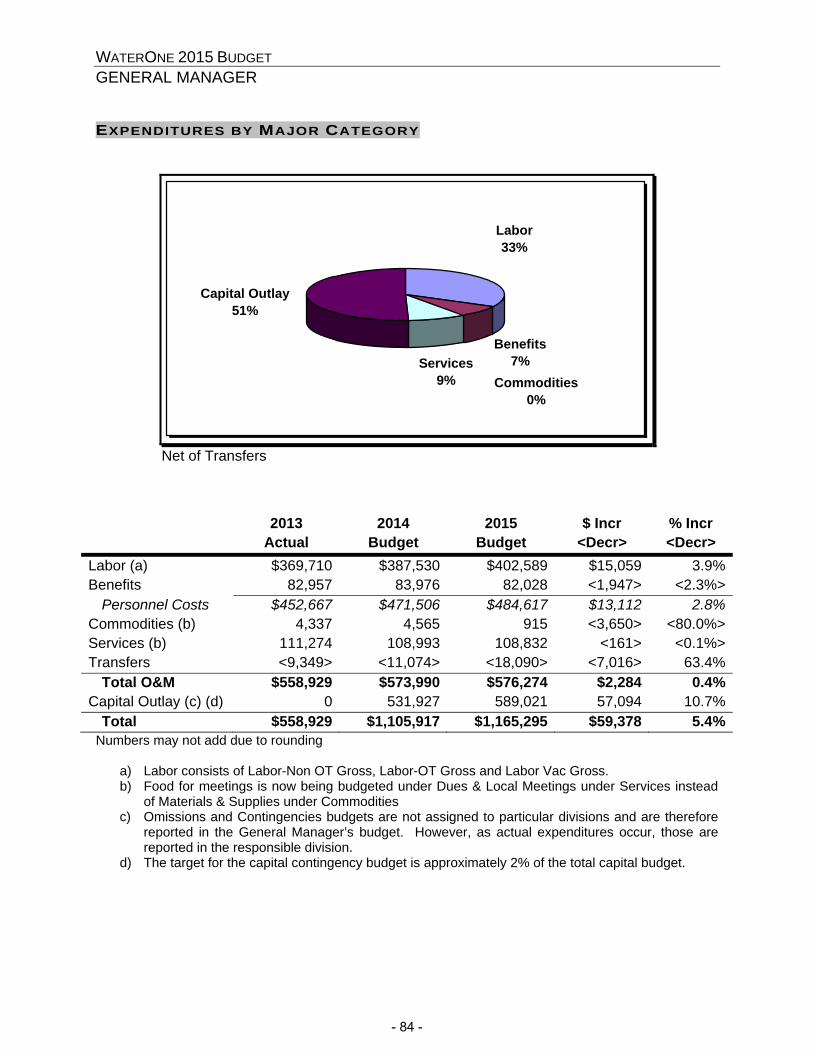
WATERONE 2015 BUDGET GENERAL MANAGER EXPENDITURES BY MAJOR CATEGORY
Services9% Commodities
0%
Capital Outlay51%
Benefits7%
Labor33%
Net of Transfers
2013 2014 2015 $ Incr % Incr Actual Budget Budget <Decr> <Decr>
Labor (a) $369,710 $387,530 $402,589 $15,059 3.9%Benefits 82,957 83,976 82,028 <1,947> <2.3%> Personnel Costs $452,667 $471,506 $484,617 $13,112 2.8%Commodities (b) 4,337 4,565 915 <3,650> <80.0%>Services (b) 111,274 108,993 108,832 <161> <0.1%>Transfers <9,349> <11,074> <18,090> <7,016> 63.4% Total O&M $558,929 $573,990 $576,274 $2,284 0.4%Capital Outlay (c) (d) 0 531,927 589,021 57,094 10.7% Total $558,929 $1,105,917 $1,165,295 $59,378 5.4%
Numbers may not add due to rounding
a) Labor consists of Labor-Non OT Gross, Labor-OT Gross and Labor Vac Gross. b) Food for meetings is now being budgeted under Dues & Local Meetings under Services instead
of Materials & Supplies under Commodities c) Omissions and Contingencies budgets are not assigned to particular divisions and are therefore
reported in the General Manager’s budget. However, as actual expenditures occur, those are reported in the responsible division.
d) The target for the capital contingency budget is approximately 2% of the total capital budget.
- 84 -

WATERONE 2015 BUDGET GENERAL MANAGER SIGNIFICANT DIVISION OPERATING BUDGETS BY COST ELEMENT
Division in Relation to Total WaterOne O&M Budget1%
99%
General Manager Balance of WaterOne
The 2015 Significant Cost Elements are described below.
2013 2014 2015 $ Incr % Incr Actual Budget Budget <Decr> <Decr>
Labor - Non OT $318,756 $335,590 $350,690 $15,100 4.5%Benefits 82,957 83,976 82,028 <1,947> <2.3%>Water Board Salaries 51,600 51,600 51,600 0 0.0%WaterOne Memberships 23,923 19,845 20,645 800 4.0%Subtotal $477,236 $491,011 $504,963 $13,952 2.8%
All Other Accounts 91,042 94,053 89,401 <4,652> <4.9%>Less Transfers <9,349> <11,074> <18,090> <7,016> 63.4%Total O&M $558,929 $573,990 $576,274 $2,284 0.4%
Numbers may not add due to rounding DIVISION PERSONNEL 2014 + - 2015
Budget Budget
Headcount Full Time 2 2 Part Time 0 0 Temporary/Summer 0 0 Total Headcount 2 0 0 2
Total Full Time Equivalents (FTEs) 2 2
- 85 -
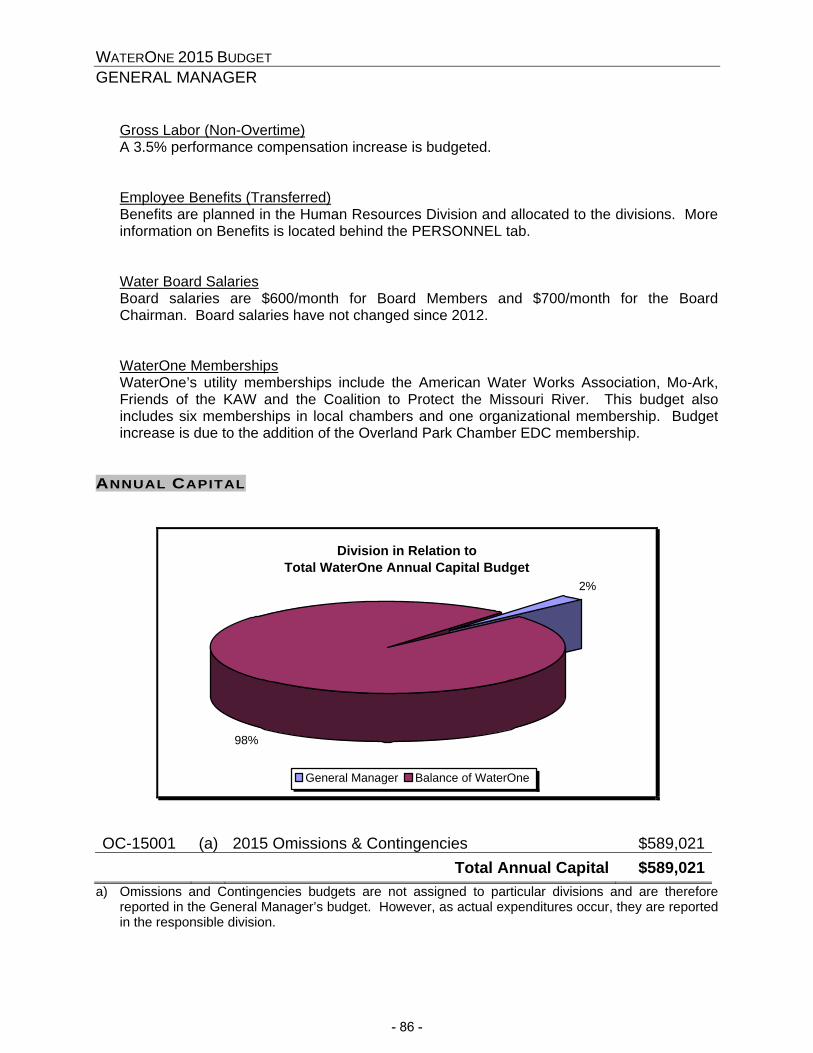
WATERONE 2015 BUDGET GENERAL MANAGER
Gross Labor (Non-Overtime) A 3.5% performance compensation increase is budgeted. Employee Benefits (Transferred) Benefits are planned in the Human Resources Division and allocated to the divisions. More information on Benefits is located behind the PERSONNEL tab. Water Board Salaries Board salaries are $600/month for Board Members and $700/month for the Board Chairman. Board salaries have not changed since 2012. WaterOne Memberships WaterOne’s utility memberships include the American Water Works Association, Mo-Ark, Friends of the KAW and the Coalition to Protect the Missouri River. This budget also includes six memberships in local chambers and one organizational membership. Budget increase is due to the addition of the Overland Park Chamber EDC membership.
ANNUAL CAPITAL
Division in Relation to Total WaterOne Annual Capital Budget
2%
98%
General Manager Balance of WaterOne
OC-15001 (a) 2015 Omissions & Contingencies $589,021 Total Annual Capital $589,021
a) Omissions and Contingencies budgets are not assigned to particular divisions and are therefore reported in the General Manager’s budget. However, as actual expenditures occur, they are reported in the responsible division.
- 86 -

WaterOne 2015 Budget
GENERAL MANAGERNew
Project #
OC‐15001
Project Description
2015 Omissions & Contingencies
Justification
This is a contingency for unanticipated projects. Each O&C is reviewed and approved separately at the time of request and is assigned a unique project number. The project is budgeted to be about 2% of total annual capital.
Plan
$589,021
Year
2015
8/28/201411:05:04 AM
- 87 -

This page intentionally left blank.
- 88 -

WATERONE 2015 BUDGET PRODUCTION
PRODUCTION DIVISION
DIVISION DESCRIPTION The Production Division is responsible for the treatment of raw water and for pumping finished potable water to customers. It is also responsible for facility improvement projects, building electrical systems, mechanical equipment, SCADA, and structural maintenance. Staff collects daily water samples and oversees bacteriological and chemical analysis as required by state and federal regulations. Water quality analysis is performed at all stages of water production to ensure that the water meets or exceeds regulation and performance goals.
MISSION STATEMENT Produce and deliver high quality drinking water to our customers in a reliable and efficient manner and in quantities required to meet our customer’s needs, including the engineering and maintenance services necessary to accomplish that goal.
Office of the Director of Production
Facilities Engineering
Facilities Maintenance
Operations & Maintenance
Operations
Water Quality Lab
- 89 -

WATERONE 2015 BUDGET PRODUCTION EXPENDITURES BY MAJOR CATEGORY
Labor20%
Benefits6%
Commodities50%
Capital Outlay19%
Services5%
Net of Transfers
2013 2014 2015 $ Incr % Incr Actual Budget Budget <Decr> <Decr>
Labor (a) $6,556,013 $6,944,339 $7,030,601 $86,262 1.2%Benefits 2,163,359 2,046,764 1,989,634 <57,129> <2.8%> Personnel Costs $8,719,372 $8,991,103 $9,020,235 $29,133 0.3%Commodities 13,482,086 15,006,033 15,482,704 476,671 3.2%Services 1,325,659 1,334,640 1,435,045 100,405 7.5%Transfers <750,836> <603,182> <574,802> 28,380 <4.7%> Total O&M $22,776,280 $24,728,594 $25,363,183 $634,589 2.6%Capital Outlay 4,520,254 4,375,015 6,122,907 1,747,892 40.0% Total $27,296,533 $29,103,609 $31,486,090 $2,382,481 8.2%
Numbers may not add due to rounding (a) Labor consists of Labor-Non OT Gross, Labor-OT Gross and Labor Vac Gross.
- 90 -

WATERONE 2015 BUDGET PRODUCTION SIGNIFICANT DIVISION OPERATING BUDGETS BY COST ELEMENT
Division in Relation to Total WaterOne O&M Budget
49%
51%
Production Balance of WaterOne
The 2015 Significant Cost Elements are described below.
2013 2014 2015 $ Incr % Incr Actual Budget Budget <Decr> <Decr>
Labor - Non OT $6,128,086 $6,641,794 $6,757,528 $115,734 1.7%Chemicals - Water Treatment 5,240,677 5,830,025 6,073,358 243,333 4.2%Power - Transmission 3,768,561 4,378,135 4,500,002 121,867 2.8%Power - Source 1,917,691 2,255,041 2,309,315 54,274 2.4%Benefits 2,163,359 2,046,764 1,989,634 <57,130> <2.8%>Power - Distribution 1,291,617 1,316,665 1,352,422 35,757 2.7%Material & Supplies 857,953 795,046 795,216 170 0.0%Subtotal $21,367,944 $23,263,470 $23,777,475 $514,005 2.2% All Other Accounts 2,159,172 2,068,306 2,160,510 92,204 4.5% Less Transfers <750,836> <603,182> <574,802> 28,380 <4.7%>
Total O&M $22,776,280 $24,728,594 $25,363,183 $634,589 2.6%Numbers may not add due to rounding
- 91 -

WATERONE 2015 BUDGET PRODUCTION DIVISION PERSONNEL 2014 + - 2015
Budget Budget
Headcount Full Time 105 2 (b) <1> (a) 106 Part Time 0 0 Temporary/Summer 4 4 Total Headcount 109 2 (b) <1> (a) 110
Total Full Time Equivalents (FTEs) 106 2.0 (b) <1.0> (a) 107
a) Mid-Year 2014 Reclassification - relinquished one open position to IT to hire unbudgeted position. b) Budgeted New Positions: FT SCADA Analyst & FT HVAC Technician
Gross Labor (Non-Overtime) A 3.5% performance compensation increase is budgeted. Budget includes new positions and eliminated position shown in table above. See PERSONNEL tab for more information on budgeted additional personnel. Employee Benefits (Transferred) Benefits are planned in the Human Resources Division and allocated to the divisions. More information on Benefits is located behind the PERSONNEL tab. Chemicals – Water Treatment The budget process for this account includes an operational plan by month for the Kansas and Missouri intakes and the Hansen and Wolcott treatment facilities. The plan is based on projected water produced, price of chemicals, and dose of chemical required. The budget for 2015 is increasing primarily due to an increase in the projected total water produced, a slight increase in chemical prices and a decrease to the budgeted water produced at Wolcott during January and February when the river level and temperature are likely to reduce the intake capacity of the horizontal collector well. The decrease to the budgeted water produced at Wolcott during January and February is effective for the 2015 budget in order to bring the budget in line with actual operating conditions over the past two winters. Power - Transmission This budget is for power from the Board of Public Utilities (BPU) for transmission of water to the distribution system. The budget process for this account includes an operational plan by month for the two treatment facilities in 2015. The 2015 budget includes a projected 5% rate increase. This increase was offset by a true up that reduced the base 2014 rates 5% due a projected increase with no actual increase implemented in 2014. The rate projections are subject to change when BPU proposes and approves actual rate increases in the fall. The budget for 2015 is increasing primarily due to an increase in the projected total water produced and a decrease to the budgeted water produced at Wolcott during January and February when the river level and temperature are likely to reduce the intake capacity of the horizontal collector well. The decrease to the budgeted water produced at Wolcott during
- 92 -

WATERONE 2015 BUDGET PRODUCTION
January and February is effective for the 2015 budget in order to bring the budget in line with actual operating conditions over the past two winters.
Power - Source This budget is for power from the Board of Public Utilities (BPU) at source or intake facilities. The budget process for this account includes an operational plan by month for the four sources in 2015. The 2015 budget includes a projected 5% rate increase. This increase was offset by a true up that reduced the base 2014 rates 5% due a projected increase with no actual increase implemented in 2014. The rate projections are subject to change when BPU proposes and approves actual rate increases in the fall. The budget for 2015 is increasing primarily due to an increase in the projected total water produced and a decrease to the budgeted water produced at Wolcott during January and February when the river level and temperature are likely to reduce the intake capacity of the horizontal collector well. The decrease to the budgeted water produced at Wolcott during January and February is effective for the 2015 budget in order to bring the budget in line with actual operating conditions over the past two winters. Power - Distribution This budget is for power primarily from Kansas City Power & Light (KCP&L) at the pump stations throughout the distribution system. The budget process for this account includes an analysis of the historical trends for power use at each of the large pump stations. The budget is increased primarily due to an adopted 2.3% KCP&L rate increase as well as increased projected power usage at pump stations in the southern areas of the distribution system. Material & Supplies Material and supplies are non-inventory items that are necessary to complete in-house lab services and to operate and maintain WaterOne facilities. The budget is increasing slightly in 2015 to reflect actual historical charges for materials used in facilities maintenance.
- 93 -

WATERONE 2015 BUDGET PRODUCTION ANNUAL CAPITAL
Division in Relation to Total WaterOne Annual Capital Budget
25%
75%
Production Balance of WaterOne
New
AC-15036 AHQ Roof Fall Protection System $83,371
AC-15042 Facility 2 North Eye Wash Station 22,232
AC-15705 Motorized Lift 18,897
AC-15703 Gas Monitor Calibration Station 7,615
Annual Capital - New $132,115
Replacement / Refurbish
AC-15037 SCADA Replacement & Upgrades $1,389,512AC-15044 Chiller & Air Handling Unit Replacement 789,243AC-15213 Delmar and Wash Water Tank Painting 733,663AC-15023 KS Presed Pump #5 Rebuild 500,226AC-15000 Emergency Equipment Replacements 444,644AC-15004 Facility 1 Roof Replacement 444,644
AC-15029 Electrical Equipment Replacements 377,948
AC-15043 Facility 2 Carbon Upgrades 366,832AC-15030 Paving Restorations 355,715AC-15028 Reservoir Transfer Pumps #1 & #2 Rebuild 277,903AC-15035 O&M Carpet & Ceiling Tile Replacement 94,487
- 94 -
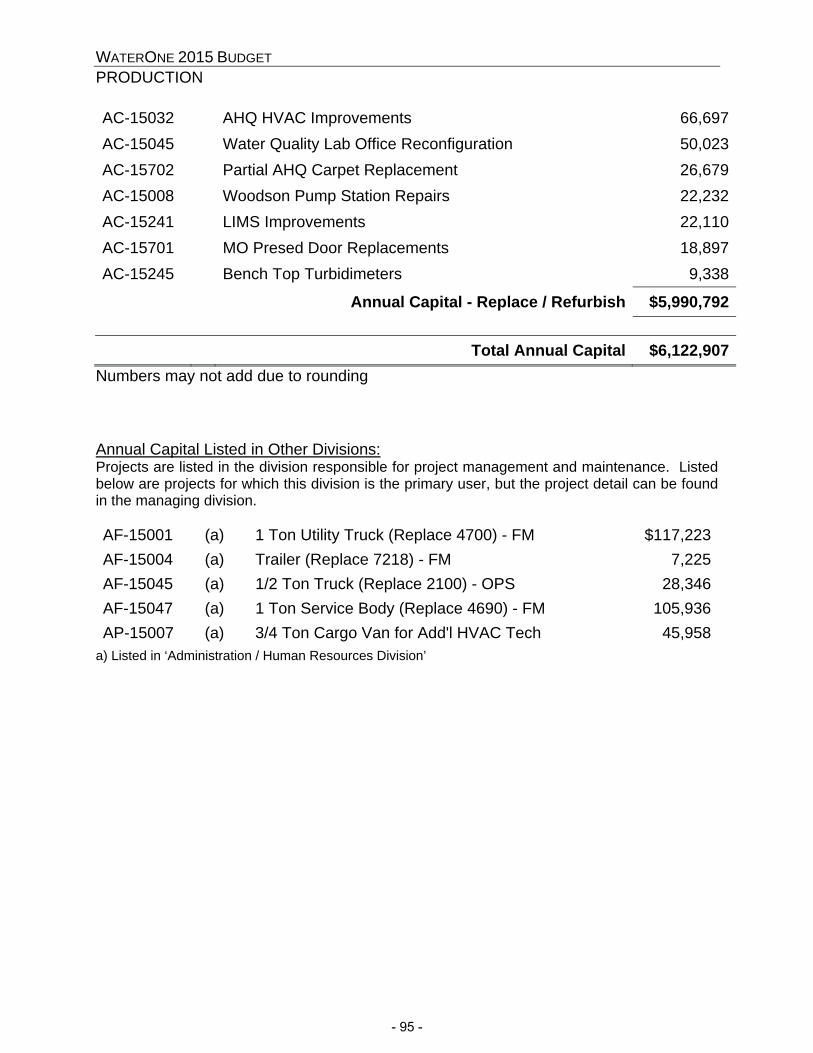
WATERONE 2015 BUDGET PRODUCTION AC-15032 AHQ HVAC Improvements 66,697AC-15045 Water Quality Lab Office Reconfiguration 50,023AC-15702 Partial AHQ Carpet Replacement 26,679AC-15008 Woodson Pump Station Repairs 22,232AC-15241 LIMS Improvements 22,110AC-15701 MO Presed Door Replacements 18,897AC-15245 Bench Top Turbidimeters 9,338
Annual Capital - Replace / Refurbish $5,990,792
Total Annual Capital $6,122,907 Numbers may not add due to rounding Annual Capital Listed in Other Divisions: Projects are listed in the division responsible for project management and maintenance. Listed below are projects for which this division is the primary user, but the project detail can be found in the managing division. AF-15001 (a) 1 Ton Utility Truck (Replace 4700) - FM $117,223 AF-15004 (a) Trailer (Replace 7218) - FM 7,225 AF-15045 (a) 1/2 Ton Truck (Replace 2100) - OPS 28,346 AF-15047 (a) 1 Ton Service Body (Replace 4690) - FM 105,936 AP-15007 (a) 3/4 Ton Cargo Van for Add'l HVAC Tech 45,958
a) Listed in ‘Administration / Human Resources Division’
- 95 -
WATERONE 2015 BUDGET PRODUCTION MASTER PLAN MP-15010 New Wolcott Engine Generators $10,689,176MP-10008 Repl. Kansas Well Replacement 4,893,996MP-15008 Repl. General Improvements Facility 1 & 2 2,589,029MP-15000 Repl. Electrical Equipment for MO Presed/Intake –Design Eng. 500,000MP-11002 New Residual Monofill #9–Design Engineering 128,684
Source & Treatment $18,800,885
MP-13004 Repl. High Service Pumps 4, 7, 9, & 16 $2,084,333MP-14004 Repl. Ridgeway Pump Station Electrical Improvements 1,651,860MP-13005 Repl. Woodson Pump Replacement 4, 5, & 6 1,454,934
Pumping & Storage $5,191,127
Total 2015 Master Plan Capital $23,992,012
Total Capital $30,114,919
- 96 -
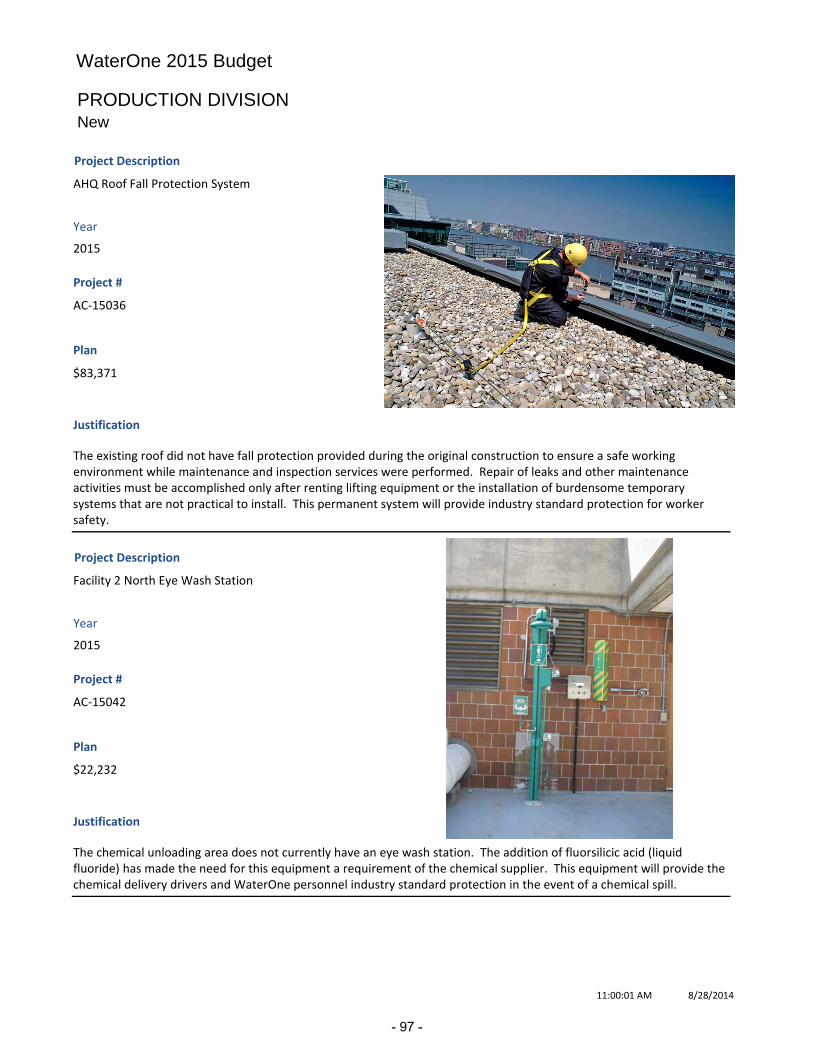
WaterOne 2015 Budget
PRODUCTION DIVISIONNew
Project #
AC‐15036
Project Description
AHQ Roof Fall Protection System
Justification
The existing roof did not have fall protection provided during the original construction to ensure a safe working environment while maintenance and inspection services were performed. Repair of leaks and other maintenance activities must be accomplished only after renting lifting equipment or the installation of burdensome temporary systems that are not practical to install. This permanent system will provide industry standard protection for worker safety.
Plan
$83,371
Year
2015
Project #
AC‐15042
Project Description
Facility 2 North Eye Wash Station
Justification
The chemical unloading area does not currently have an eye wash station. The addition of fluorsilicic acid (liquid fluoride) has made the need for this equipment a requirement of the chemical supplier. This equipment will provide the chemical delivery drivers and WaterOne personnel industry standard protection in the event of a chemical spill.
Plan
$22,232
Year
2015
8/28/201411:00:01 AM
- 97 -
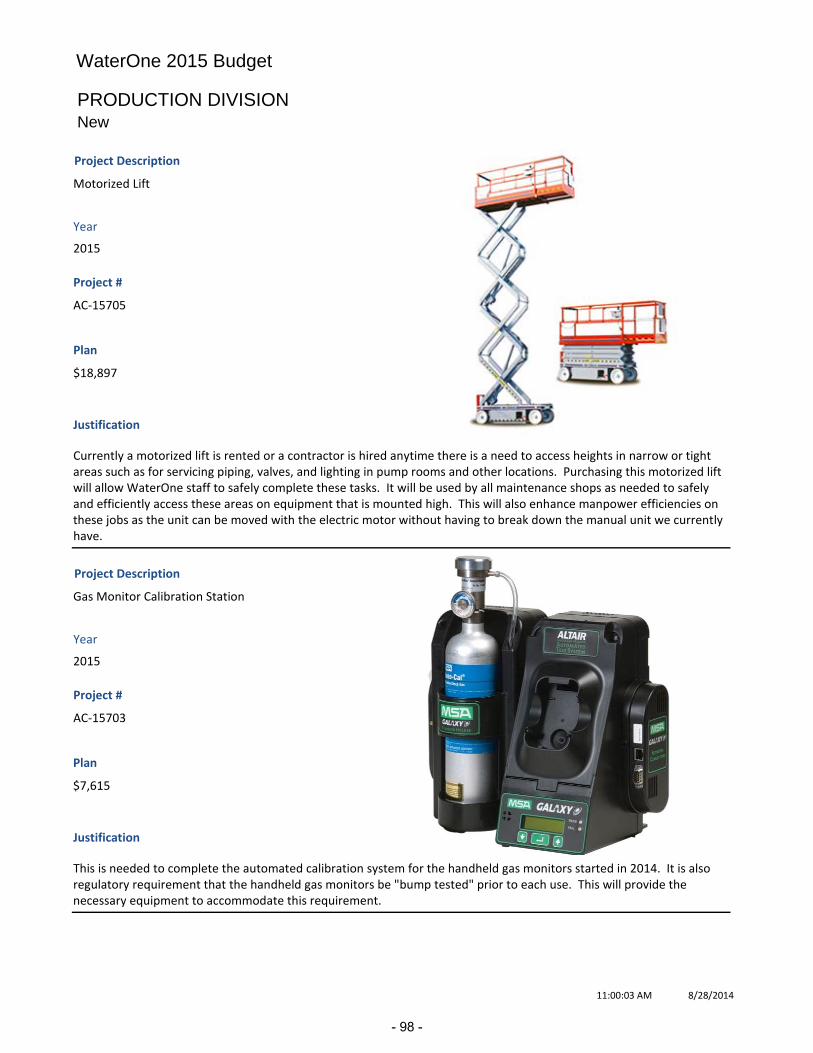
WaterOne 2015 Budget
PRODUCTION DIVISIONNew
Project #
AC‐15705
Project Description
Motorized Lift
Justification
Currently a motorized lift is rented or a contractor is hired anytime there is a need to access heights in narrow or tight areas such as for servicing piping, valves, and lighting in pump rooms and other locations. Purchasing this motorized lift will allow WaterOne staff to safely complete these tasks. It will be used by all maintenance shops as needed to safely and efficiently access these areas on equipment that is mounted high. This will also enhance manpower efficiencies on these jobs as the unit can be moved with the electric motor without having to break down the manual unit we currently have.
Plan
$18,897
Year
2015
Project #
AC‐15703
Project Description
Gas Monitor Calibration Station
Justification
This is needed to complete the automated calibration system for the handheld gas monitors started in 2014. It is also regulatory requirement that the handheld gas monitors be "bump tested" prior to each use. This will provide the necessary equipment to accommodate this requirement.
Plan
$7,615
Year
2015
8/28/201411:00:03 AM
- 98 -

WaterOne 2015 Budget
PRODUCTION DIVISIONReplace
Project #
AC‐15037
Project Description
SCADA Replacement & Upgrades
Justification
SCADA systems increase efficiency and effectiveness of the treatment and distribution of water. Portions of the existing SCADA equipment have exceeded the estimated useful life. This replacement and upgrade will enable WaterOne to upgrade the current system leveraging updated technology.
Plan
$1,389,512
Year
2015
Project #
AC‐15044
Project Description
Chiller & Air Handling Unit Replacement
Justification
This project will replace Chiller #3 and Air Handling Units (AHUs) #1 and #3 in the O&M building at the Hansen Treatment Plant. This equipment will be 23 years old in 2015 and has an estimated useful life of 25 years. The chiller has required maintenance including replacement of compressors and repairs for refrigerant leaks. The AHUs have been inspected and have internal corrosion. Their current design of constant speed fans and variable pitched louvers no longer match the higher efficiency designs which utilize variable speed drives to operate fans which then match airflows to what is actually needed. The new AHUs will also be appropriately sized to the existing building space as the original AHUs were oversized in anticipation of a third floor being added to the O&M Building, which is no longer planned.
Plan
$789,243
Year
2015
10/1/20148:43:03 AM
- 99 -
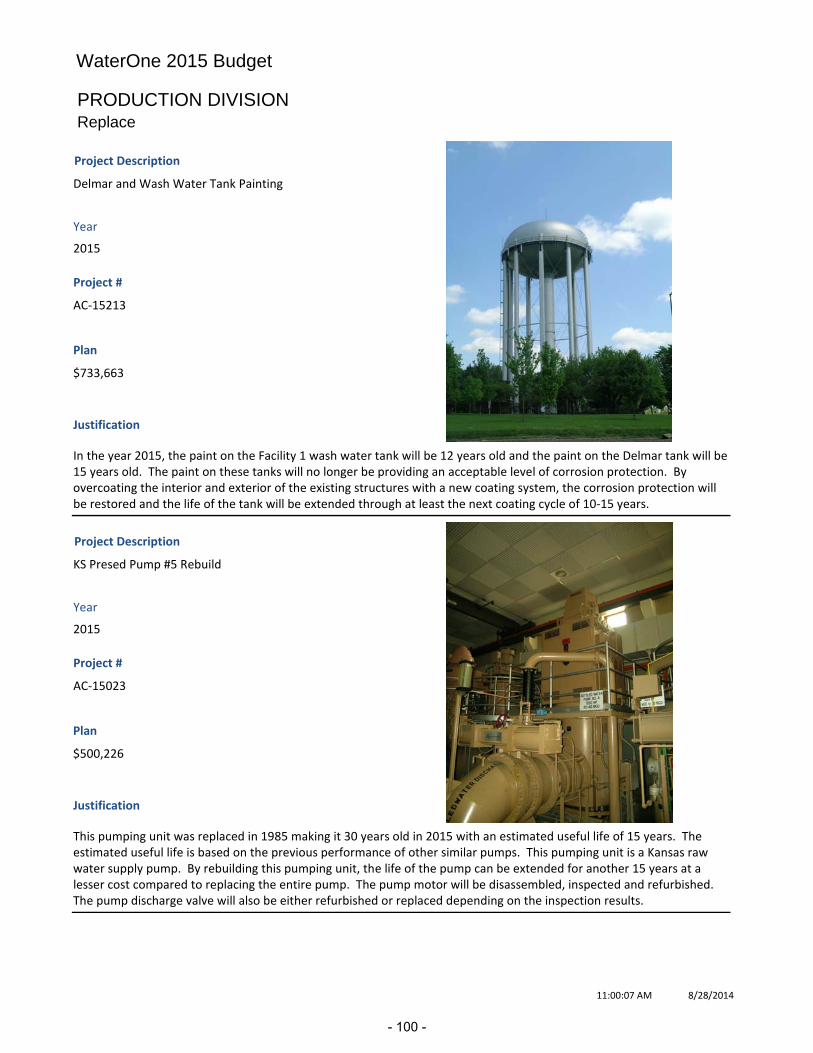
WaterOne 2015 Budget
PRODUCTION DIVISIONReplace
Project #
AC‐15213
Project Description
Delmar and Wash Water Tank Painting
Justification
In the year 2015, the paint on the Facility 1 wash water tank will be 12 years old and the paint on the Delmar tank will be 15 years old. The paint on these tanks will no longer be providing an acceptable level of corrosion protection. By overcoating the interior and exterior of the existing structures with a new coating system, the corrosion protection will be restored and the life of the tank will be extended through at least the next coating cycle of 10‐15 years.
Plan
$733,663
Year
2015
Project #
AC‐15023
Project Description
KS Presed Pump #5 Rebuild
Justification
This pumping unit was replaced in 1985 making it 30 years old in 2015 with an estimated useful life of 15 years. The estimated useful life is based on the previous performance of other similar pumps. This pumping unit is a Kansas raw water supply pump. By rebuilding this pumping unit, the life of the pump can be extended for another 15 years at a lesser cost compared to replacing the entire pump. The pump motor will be disassembled, inspected and refurbished. The pump discharge valve will also be either refurbished or replaced depending on the inspection results.
Plan
$500,226
Year
2015
8/28/201411:00:07 AM
- 100 -

WaterOne 2015 Budget
PRODUCTION DIVISIONReplace
Project #
AC‐15004
Project Description
Facility 1 Roof Replacement
Justification
The Facility 1 roof consists of several different sections all of which have been installed on different construction projects over the years. The majority of the sections have reached or exceeded their useful life of 20 years. Some small leaks have developed and have been able to be repaired, but the overall condition of the roofing material is degrading. A roof failure could cause damage to the equipment within the facility which would affect the overall capacity of the facility.
Plan
$444,644
Year
2015
Project #
AC‐15000
Project Description
Emergency Equipment Replacements
Justification
For certain assets, the most cost effective asset management strategy is to run the asset to failure because the consequence of failure is low or the asset was designed with redundancy. Since 2007 there has been an annual project to refurbish or replace water production equipment that has been run to failure. When these assets fail, they still need to be replaced in a timely manner which is normally difficult through the normal budget process. The budget amount is determined by reviewing a five year history of these kinds of equipment failures.
Plan
$444,644
Year
2015
8/28/201411:00:09 AM
- 101 -
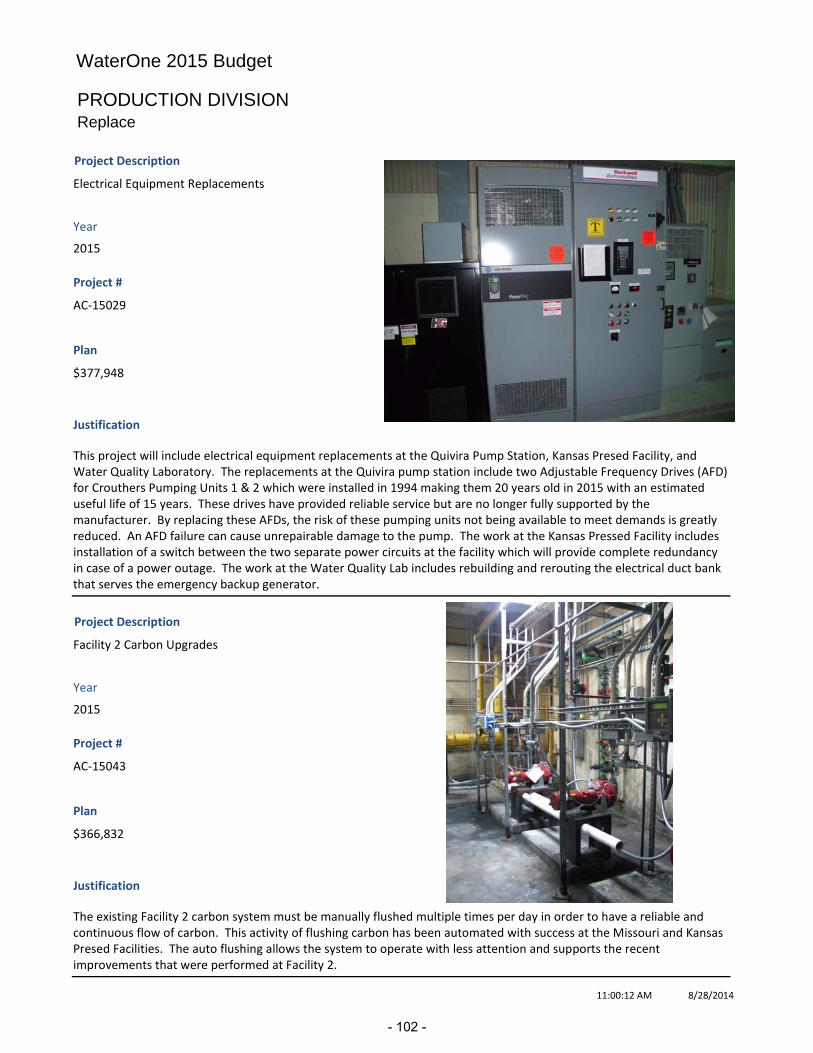
WaterOne 2015 Budget
PRODUCTION DIVISIONReplace
Project #
AC‐15029
Project Description
Electrical Equipment Replacements
Justification
This project will include electrical equipment replacements at the Quivira Pump Station, Kansas Presed Facility, and Water Quality Laboratory. The replacements at the Quivira pump station include two Adjustable Frequency Drives (AFD) for Crouthers Pumping Units 1 & 2 which were installed in 1994 making them 20 years old in 2015 with an estimated useful life of 15 years. These drives have provided reliable service but are no longer fully supported by the manufacturer. By replacing these AFDs, the risk of these pumping units not being available to meet demands is greatly reduced. An AFD failure can cause unrepairable damage to the pump. The work at the Kansas Pressed Facility includes installation of a switch between the two separate power circuits at the facility which will provide complete redundancy in case of a power outage. The work at the Water Quality Lab includes rebuilding and rerouting the electrical duct bank that serves the emergency backup generator.
Plan
$377,948
Year
2015
Project #
AC‐15043
Project Description
Facility 2 Carbon Upgrades
Justification
The existing Facility 2 carbon system must be manually flushed multiple times per day in order to have a reliable and continuous flow of carbon. This activity of flushing carbon has been automated with success at the Missouri and Kansas Presed Facilities. The auto flushing allows the system to operate with less attention and supports the recent improvements that were performed at Facility 2.
Plan
$366,832
Year
2015
8/28/201411:00:12 AM
- 102 -
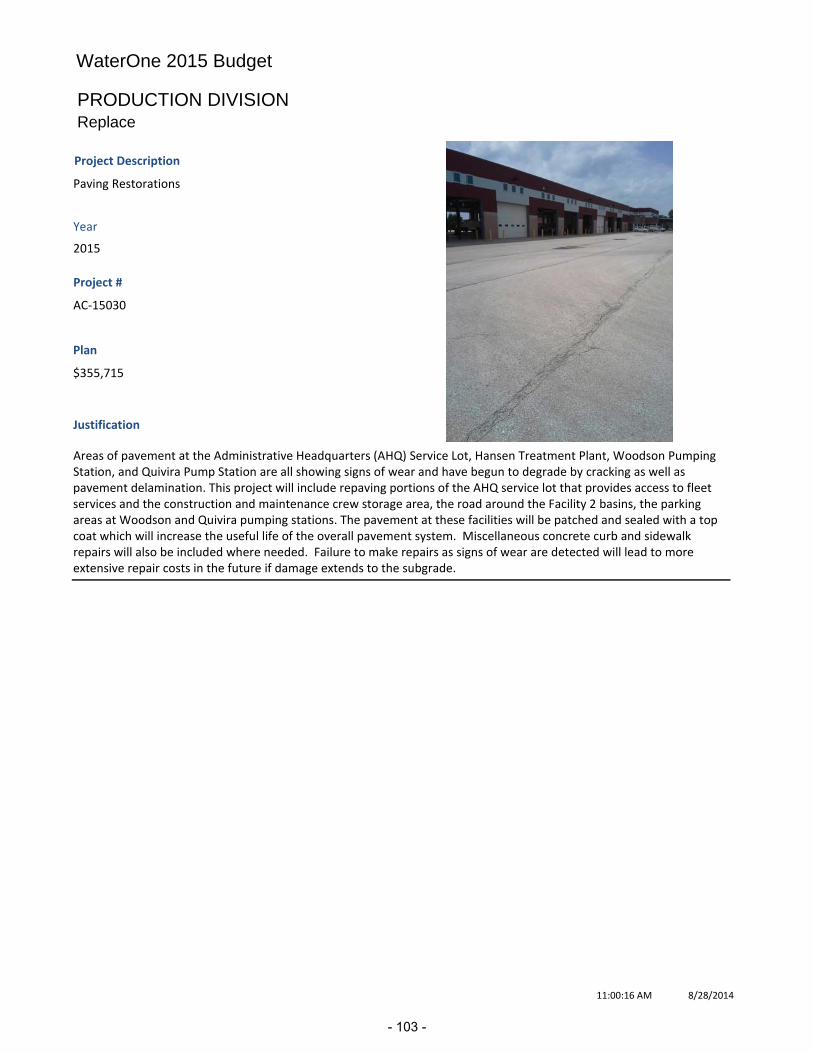
WaterOne 2015 Budget
PRODUCTION DIVISIONReplace
Project #
AC‐15030
Project Description
Paving Restorations
Justification
Areas of pavement at the Administrative Headquarters (AHQ) Service Lot, Hansen Treatment Plant, Woodson Pumping Station, and Quivira Pump Station are all showing signs of wear and have begun to degrade by cracking as well as pavement delamination. This project will include repaving portions of the AHQ service lot that provides access to fleet services and the construction and maintenance crew storage area, the road around the Facility 2 basins, the parking areas at Woodson and Quivira pumping stations. The pavement at these facilities will be patched and sealed with a top coat which will increase the useful life of the overall pavement system. Miscellaneous concrete curb and sidewalk repairs will also be included where needed. Failure to make repairs as signs of wear are detected will lead to more extensive repair costs in the future if damage extends to the subgrade.
Plan
$355,715
Year
2015
8/28/201411:00:16 AM
- 103 -
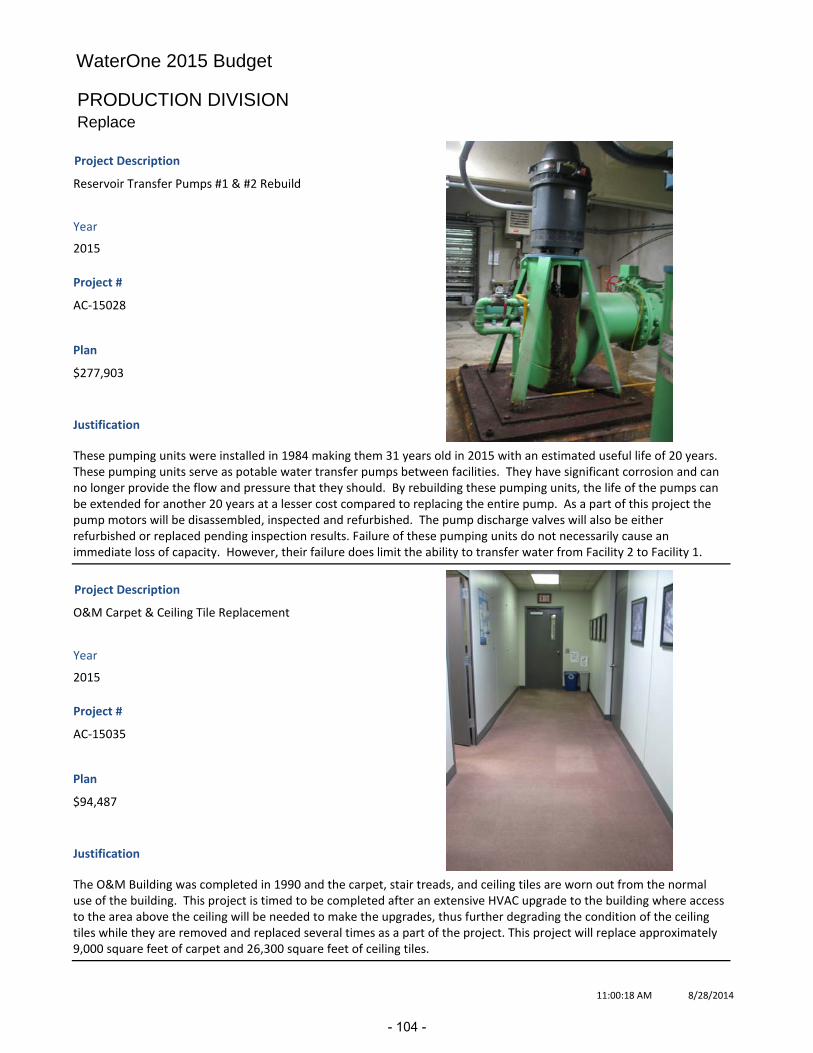
WaterOne 2015 Budget
PRODUCTION DIVISIONReplace
Project #
AC‐15028
Project Description
Reservoir Transfer Pumps #1 & #2 Rebuild
Justification
These pumping units were installed in 1984 making them 31 years old in 2015 with an estimated useful life of 20 years. These pumping units serve as potable water transfer pumps between facilities. They have significant corrosion and can no longer provide the flow and pressure that they should. By rebuilding these pumping units, the life of the pumps can be extended for another 20 years at a lesser cost compared to replacing the entire pump. As a part of this project the pump motors will be disassembled, inspected and refurbished. The pump discharge valves will also be either refurbished or replaced pending inspection results. Failure of these pumping units do not necessarily cause an immediate loss of capacity. However, their failure does limit the ability to transfer water from Facility 2 to Facility 1.
Plan
$277,903
Year
2015
Project #
AC‐15035
Project Description
O&M Carpet & Ceiling Tile Replacement
Justification
The O&M Building was completed in 1990 and the carpet, stair treads, and ceiling tiles are worn out from the normal use of the building. This project is timed to be completed after an extensive HVAC upgrade to the building where access to the area above the ceiling will be needed to make the upgrades, thus further degrading the condition of the ceiling tiles while they are removed and replaced several times as a part of the project. This project will replace approximately 9,000 square feet of carpet and 26,300 square feet of ceiling tiles.
Plan
$94,487
Year
2015
8/28/201411:00:18 AM
- 104 -
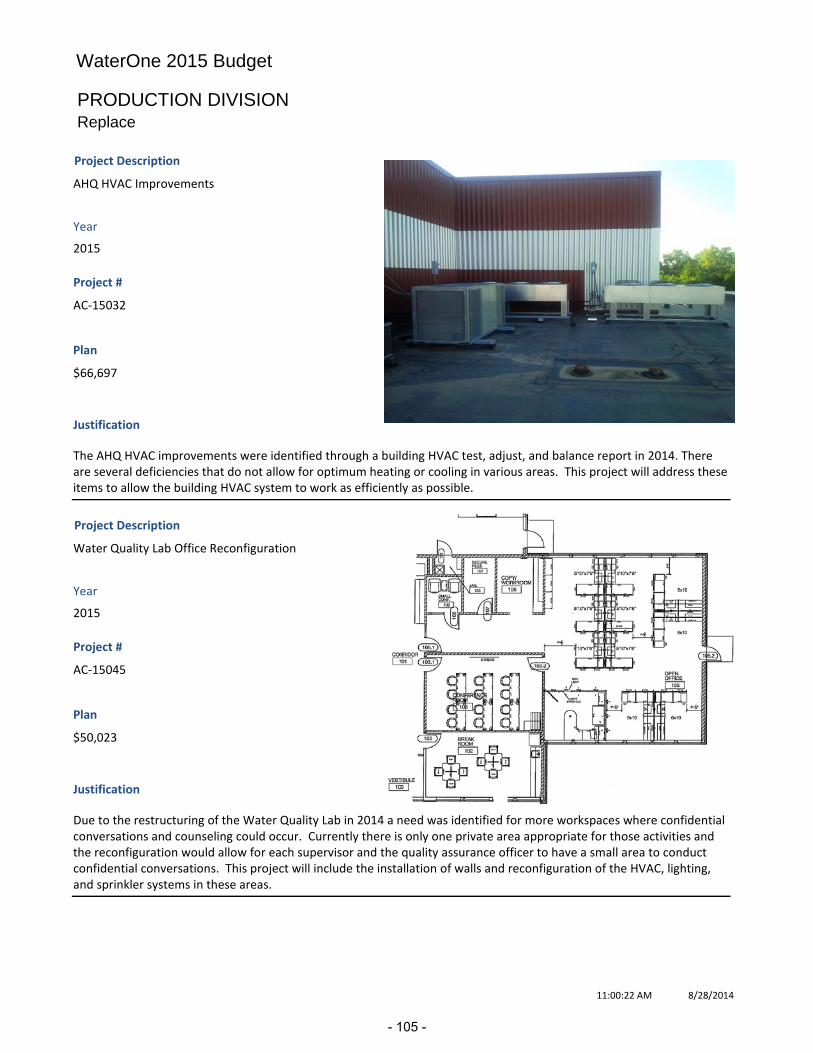
WaterOne 2015 Budget
PRODUCTION DIVISIONReplace
Project #
AC‐15032
Project Description
AHQ HVAC Improvements
Justification
The AHQ HVAC improvements were identified through a building HVAC test, adjust, and balance report in 2014. There are several deficiencies that do not allow for optimum heating or cooling in various areas. This project will address these items to allow the building HVAC system to work as efficiently as possible.
Plan
$66,697
Year
2015
Project #
AC‐15045
Project Description
Water Quality Lab Office Reconfiguration
Justification
Due to the restructuring of the Water Quality Lab in 2014 a need was identified for more workspaces where confidential conversations and counseling could occur. Currently there is only one private area appropriate for those activities and the reconfiguration would allow for each supervisor and the quality assurance officer to have a small area to conduct confidential conversations. This project will include the installation of walls and reconfiguration of the HVAC, lighting, and sprinkler systems in these areas.
Plan
$50,023
Year
2015
8/28/201411:00:22 AM
- 105 -
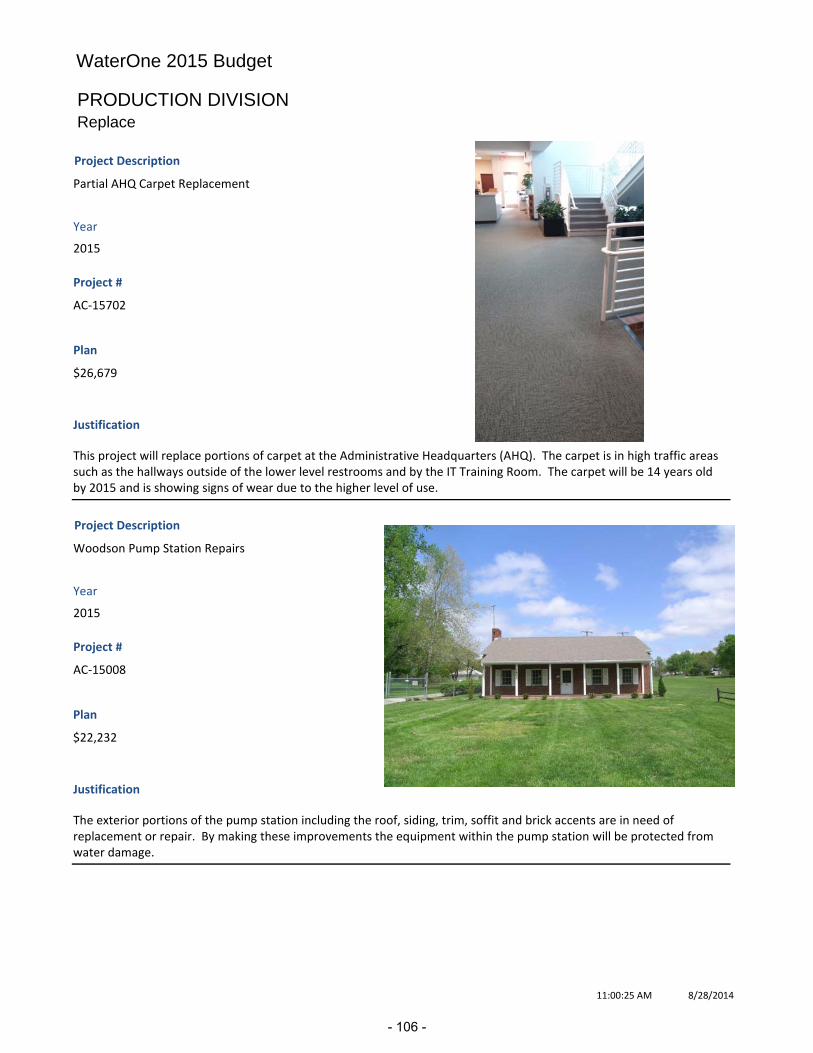
WaterOne 2015 Budget
PRODUCTION DIVISIONReplace
Project #
AC‐15702
Project Description
Partial AHQ Carpet Replacement
Justification
This project will replace portions of carpet at the Administrative Headquarters (AHQ). The carpet is in high traffic areas such as the hallways outside of the lower level restrooms and by the IT Training Room. The carpet will be 14 years old by 2015 and is showing signs of wear due to the higher level of use.
Plan
$26,679
Year
2015
Project #
AC‐15008
Project Description
Woodson Pump Station Repairs
Justification
The exterior portions of the pump station including the roof, siding, trim, soffit and brick accents are in need of replacement or repair. By making these improvements the equipment within the pump station will be protected from water damage.
Plan
$22,232
Year
2015
8/28/201411:00:25 AM
- 106 -

WaterOne 2015 Budget
PRODUCTION DIVISIONReplace
Project #
AC‐15241
Project Description
LIMS Improvements
Justification
LIMS is the central location for all data created in the Laboratory. Failure of the system could result in our inability to supply the state, public, and all customers with information about the water. These updates are necessary to keep the software up to date with current processes and testing procedures.
Plan
$22,110
Year
2015
Project #
AC‐15701
Project Description
MO Presed Door Replacements
Justification
This project will replace eight doors and door frames at the Missouri Presed facility. The facility was built in 1984 making the doors 31 years old in 2015. The doors and frames are rusted and require replacement.
Plan
$18,897
Year
2015
8/28/201411:00:28 AM
- 107 -
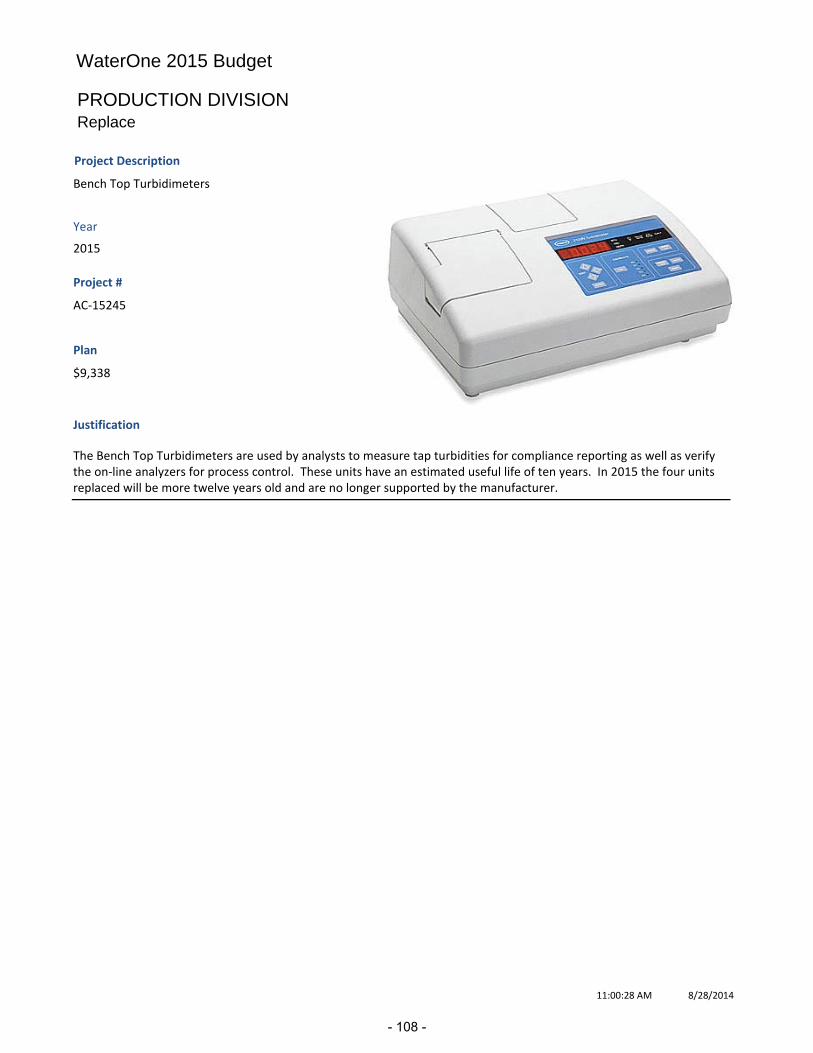
WaterOne 2015 Budget
PRODUCTION DIVISIONReplace
Project #
AC‐15245
Project Description
Bench Top Turbidimeters
Justification
The Bench Top Turbidimeters are used by analysts to measure tap turbidities for compliance reporting as well as verify the on‐line analyzers for process control. These units have an estimated useful life of ten years. In 2015 the four units replaced will be more twelve years old and are no longer supported by the manufacturer.
Plan
$9,338
Year
2015
8/28/201411:00:28 AM
- 108 -

WATERONE 2015 BUDGET DISTRIBUTION
DISTRIBUTION DIVISION
DIVISION DESCRIPTION The Distribution Division maintains the subsurface piping infrastructure system and provides the professional services necessary to deliver water to our customers. It consists of three departments: Construction, Maintenance, Valving and Services (CMVS); Distribution Engineering; and Distribution Water Quality & New Services. The primary mission of CMVS is to operate, maintain and rehabilitate the distribution system. This includes the relocation of pipelines as a result of road improvement projects that are initiated by governmental entities; the installation of new pipelines for improvements to the distribution system; 24/7 emergency response for repairs to failed pipelines; maintenance of over 2,600 miles of pipeline, 17,000 fire hydrants and 31,000 valves, as well as over 140,000 service lines.
Distribution Engineering reviews and develops plans for capital improvement projects and coordinates the relocation of WaterOne pipelines with our Construction & Maintenance crews. Engineering designs and coordinates projects to replace aging infrastructure and upgrade existing facilities. In addition, the department is responsible for the installation of distribution piping to serve the residential and commercial development that occurs in our service territory. In the Distribution Water Quality & New Services department, the New Service Connection Section works with builders, developers, plumbing contractors, and private property owners to review plans, investigate water availability and process applications for residential and commercial service connection permits. The Water Quality Section is responsible for handling water quality concerns from our customers. The department also administers WaterOne’s Cross-Connection Control Program, Fire Service Line Flushing Program and provides for the sampling of water on all new pipelines installed in the distribution system.
MISSION STATEMENT Deliver high quality drinking water to our customers in quantities required to meet their needs, reliably and efficiently, in a manner consistent with excellent customer service. Provide engineering services to the various cities served by WaterOne and the development community in a professional and timely manner. These activities are completed with an emphasis and focus on the safety of the public and the employees.
Office of the Director of Distribution
Distribution Engineering
Distribution Water Quality
& New Services
Construction, Maintenance, Valving
& Services
- 109 -

WATERONE 2015 BUDGET DISTRIBUTION EXPENDITURES BY MAJOR CATEGORY
Services6%
Commodities2%
Capital Outlay
59%
Benefits13%
Labor20%
Net of Transfers
2013 2014 2015 $ Incr % Incr Actual Budget Budget <Decr> <Decr>
Labor (a) $8,847,234 $9,105,619 $9,360,876 $255,257 2.8%Benefits 3,038,620 3,221,196 3,180,918 <40,278> <1.3%> Personnel Costs $11,885,853 $12,326,815 $12,541,794 $214,979 1.7%Commodities 452,006 340,259 547,859 207,600 61.0%Services 1,532,457 1,357,681 1,475,684 118,003 8.7%Transfers <4,299,850> <4,403,660> <4,408,345> <4,686> 0.1% Total O&M $9,570,466 $9,621,095 $10,156,992 $535,896 5.6%Capital Outlay 14,022,742 13,367,005 14,418,851 1,051,846 7.9% Total $23,593,209 $22,988,100 $24,575,843 $1,587,742 6.9%Numbers may not add due to rounding (a) Labor consists of Labor-Non OT Gross, Labor-OT Gross and Labor Vac Gross.
- 110 -
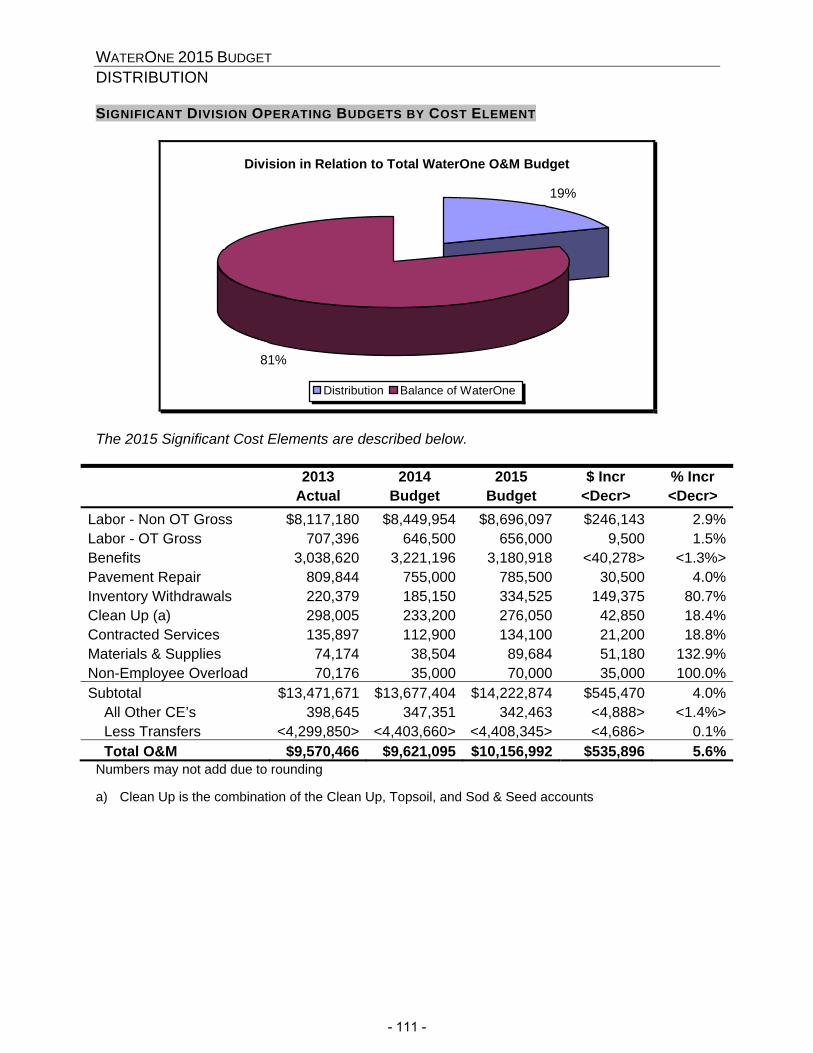
WATERONE 2015 BUDGET DISTRIBUTION SIGNIFICANT DIVISION OPERATING BUDGETS BY COST ELEMENT
Division in Relation to Total WaterOne O&M Budget
19%
81%
Distribution Balance of WaterOne
The 2015 Significant Cost Elements are described below.
2013 2014 2015 $ Incr % Incr Actual Budget Budget <Decr> <Decr>
Labor - Non OT Gross $8,117,180 $8,449,954 $8,696,097 $246,143 2.9%Labor - OT Gross 707,396 646,500 656,000 9,500 1.5%Benefits 3,038,620 3,221,196 3,180,918 <40,278> <1.3%>Pavement Repair 809,844 755,000 785,500 30,500 4.0%Inventory Withdrawals 220,379 185,150 334,525 149,375 80.7%Clean Up (a) 298,005 233,200 276,050 42,850 18.4%Contracted Services 135,897 112,900 134,100 21,200 18.8%Materials & Supplies 74,174 38,504 89,684 51,180 132.9%Non-Employee Overload 70,176 35,000 70,000 35,000 100.0%Subtotal $13,471,671 $13,677,404 $14,222,874 $545,470 4.0% All Other CE’s 398,645 347,351 342,463 <4,888> <1.4%> Less Transfers <4,299,850> <4,403,660> <4,408,345> <4,686> 0.1% Total O&M $9,570,466 $9,621,095 $10,156,992 $535,896 5.6%
Numbers may not add due to rounding a) Clean Up is the combination of the Clean Up, Topsoil, and Sod & Seed accounts
- 111 -
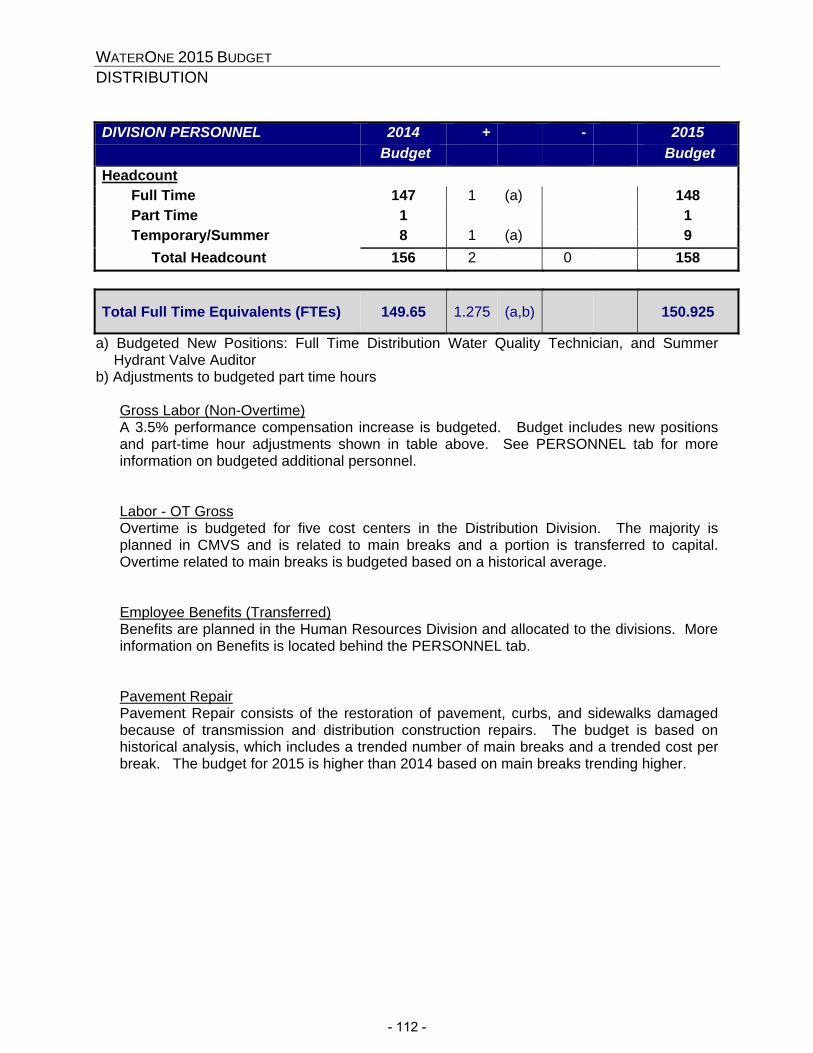
WATERONE 2015 BUDGET DISTRIBUTION DIVISION PERSONNEL 2014 + - 2015
Budget Budget
Headcount Full Time 147 1 (a) 148 Part Time 1 1 Temporary/Summer 8 1 (a) 9 Total Headcount 156 2 0 158
Total Full Time Equivalents (FTEs) 149.65 1.275 (a,b) 150.925
a) Budgeted New Positions: Full Time Distribution Water Quality Technician, and Summer Hydrant Valve Auditor
b) Adjustments to budgeted part time hours
Gross Labor (Non-Overtime) A 3.5% performance compensation increase is budgeted. Budget includes new positions and part-time hour adjustments shown in table above. See PERSONNEL tab for more information on budgeted additional personnel. Labor - OT Gross Overtime is budgeted for five cost centers in the Distribution Division. The majority is planned in CMVS and is related to main breaks and a portion is transferred to capital. Overtime related to main breaks is budgeted based on a historical average. Employee Benefits (Transferred) Benefits are planned in the Human Resources Division and allocated to the divisions. More information on Benefits is located behind the PERSONNEL tab. Pavement Repair Pavement Repair consists of the restoration of pavement, curbs, and sidewalks damaged because of transmission and distribution construction repairs. The budget is based on historical analysis, which includes a trended number of main breaks and a trended cost per break. The budget for 2015 is higher than 2014 based on main breaks trending higher.
- 112 -

WATERONE 2015 BUDGET DISTRIBUTION
Inventory Withdrawals Inventory consists of pipe, clamps, gaskets, and other material used in the maintenance of the transmission and distribution system. The budget is based on average actual history. Most of the increase was costs transferred from the fleet cost centers. Various items that were being charged to the fleet accounts were not vehicle-related expenses, so the budgets were moved to the appropriate cost centers. However, there were increases associated with the average number of main breaks trending up. Clean Up Clean Up includes the removal of construction debris, addition of topsoil, site grading as well as reseeding or sod replacement. It is the second largest component of main break costs after pavement repair. The budget is based on average actual history and the increase is associated with the average number of main breaks trending up. Contracted Services Contracted Services consists of services that WaterOne does not have the resources for or are not cost effective to perform in-house. Most of this budget is related to repainting of fire hydrants but also includes street sawing, vacuum services, and locating underground facilities. The increase is related to fire hydrant painting and is based on history. Materials & Supplies Materials & Supplies consists of various items such as extension cords, slings, repair parts, gas cylinders, and miscellaneous equipment used in the maintenance of the transmission and distribution system. The budget is based on average actual history. Costs were transferred in the amount of $53,000 from the fleet cost centers. Items that were being charged to the fleet accounts were not vehicle-related expenses. Therefore the budgets were moved to the appropriate cost centers. Non-Employee Overload A non-employee overload is being budgeted for Mapping & Drafting in lieu of a new employee request. The workload in Mapping & Drafting is increasing due to more main replacement, more main extensions, and special projects related to posting GPS data and posting easements. The budget includes funding a non-employee overload for a full year. The 2014 budget only funded a half year.
- 113 -
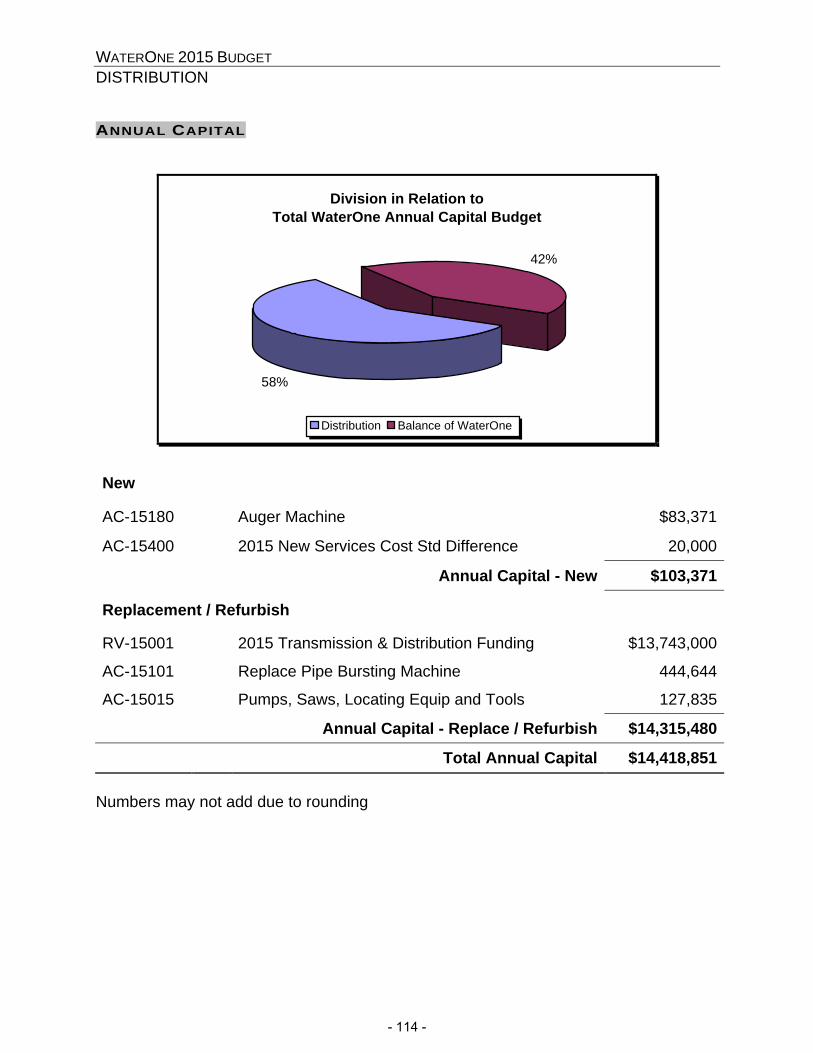
WATERONE 2015 BUDGET DISTRIBUTION
ANNUAL CAPITAL
Division in Relation to Total WaterOne Annual Capital Budget
58%
42%
Distribution Balance of WaterOne
New
AC-15180 Auger Machine $83,371
AC-15400 2015 New Services Cost Std Difference 20,000
Annual Capital - New $103,371
Replacement / Refurbish
RV-15001 2015 Transmission & Distribution Funding $13,743,000
AC-15101 Replace Pipe Bursting Machine 444,644
AC-15015 Pumps, Saws, Locating Equip and Tools 127,835
Annual Capital - Replace / Refurbish $14,315,480
Total Annual Capital $14,418,851
Numbers may not add due to rounding
- 114 -
WATERONE 2015 BUDGET DISTRIBUTION Annual Capital Listed in Other Divisions: Projects are listed in the division responsible for project management and maintenance. Listed below are projects for which this division is the primary user, but the project detail can be found in the managing division. AF-15002 (a) Tandem Axle Hydro Excavator $433,529
AF-15725 (a) Skid Steer (Replace 7501) - CMVS 75,589
AF-15022 (a) Track Skid Steer (Replace 7516) - CMVS 61,302
AF-15000 (a) 3/4 Ton Pickup (Replace 2580) - CMVS 44,650
AF-15007 (a) 1/2 Ton Truck (Replace 2018) - CMVS 34,565
AF-15006 (a) Backhoe Trailer (Replace 7234) - CMVS 30,752
AF-15055 (a) 1/2 Ton Truck (Replace 2013) - CMVS 29,207
a) Listed in ‘Administration / Human Resources Division’ MASTER PLAN CAPITAL MP-14005 Repl. 30" TM Replace, 47th to Quivira to 51st & Woodson $8,819,287
MP-05002 New 16" DM, Hwy K7, 55th to 64th 969,926
MP-12004 New 12" DM, 151st, Nall to Mission 773,526
MP-09004 New 12" DM, 151st, Mission to Kenneth 715,937
MP-12007 New 16" DM, 191st, Lone Elm to 169 Hwy 585,685
MP-14008 New 16" DM, 167th, Switzer to Antioch - Right of Way 19,946
MP-14001 New 16" DM, 167th, Antioch to Metcalf - Right of Way 19,576
Total 2015 Master Plan Capital $11,903,883
Total Capital $26,322,734
- 115 -

WaterOne 2015 Budget
DISTRIBUTION DIVISIONNew
Project #
AC‐15180
Project Description
Auger Machine
Justification
Auger equipment is used to install water service lines as well as bore larger holes in order to insert small distribution water mains under driveways. The highly compact drill can be operated from a small launch pit and bore up to 200 feet. Rather than cut the driveways, this machine could be used to install water main without disruption to the resident and without incurring driveway restoration costs. In addition, new road service line crossings could be drilled in instead of cutting or digging the road or hiring a directional driller saving both time and restoration costs (see payback analysis in Supplemental section).
Plan
$83,371
Year
2015
Project #
AC‐15400
Project Description
2015 New Services Cost Std Difference
Justification
This project collects any costs associated with new service connections which are not captured by the New Service Connection Standard charged to the customer.
Plan
$20,000
Year
2015
8/28/201411:04:31 AM
- 116 -

WaterOne 2015 Budget
DISTRIBUTION DIVISIONReplace
Project #
RV‐15001
Project Description
2015 Transmission & Distribution Funding
Justification
Replacements ‐ $5,590,000; Relocations ‐ $2,380,000; General Improvement ‐ $2,271,000; Main Breaks ‐ $1,948,000; Transmission Main Capital ‐ $924,000; Condition Assessment ‐ $630,000
Plan
$13,743,000
Year
2015
Project #
AC‐15101
Project Description
Replace Pipe Bursting Machine
Justification
Static pipe bursting equipment is used to replace deteriorated cast iron, ductile iron, or PVC pipelines in areas where open‐cut methods or horizontal directional drill (HDD) methods are not as cost effective. The current pipe bursting machine is 7 years old which is its expected useful life. It currently has multiple mechanical issues and consistently needs maintenance. Typical pipe bursting projects occur where the alternative installation would have been via open‐cut or HDD in the right‐of‐way, behind the curb line or in the street. As the need to replace pipe has increased, a decrease in available space within the right‐of‐way has also occurred forcing more and more replacements in the street. Static pipe bursting allows for the replacement of pipe where it already exists, thereby saving both costs and space. Projects where WaterOne has already used pipe bursting have demonstrated savings in restoration costs over open‐cut in the roadway (see payback analysis in Supplemental section).
Plan
$444,644
Year
2015
8/28/201411:04:32 AM
- 117 -
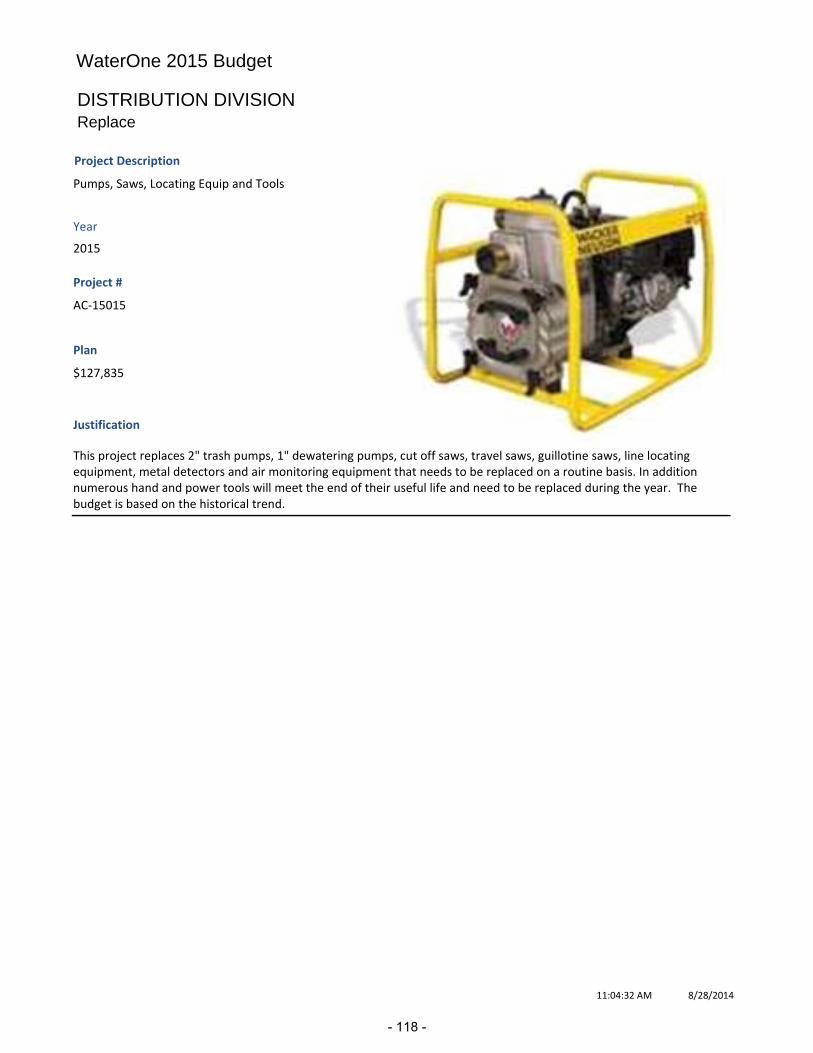
WaterOne 2015 Budget
DISTRIBUTION DIVISIONReplace
Project #
AC‐15015
Project Description
Pumps, Saws, Locating Equip and Tools
Justification
This project replaces 2" trash pumps, 1" dewatering pumps, cut off saws, travel saws, guillotine saws, line locating equipment, metal detectors and air monitoring equipment that needs to be replaced on a routine basis. In addition numerous hand and power tools will meet the end of their useful life and need to be replaced during the year. The budget is based on the historical trend.
Plan
$127,835
Year
2015
8/28/201411:04:32 AM
- 118 -
WATERONE 2015 BUDGET CUSTOMER RELATIONS
CUSTOMER RELATIONS DIVISION
DIVISION DESCRIPTION Customer Relations provides the account services necessary to complete the sale of water to our customers and engage with our customers as a utility service provider. Customer Relations is responsible for planning, organizing, and directing the full range of customer-related functions. This includes all aspects of customer service, meter reading, billing, collections, and communications. The division relies on its data analysis to ensure the accuracy of its systems as well as the development of business solutions to improve efficiency. The division also plays a critical role in emergency preparedness.
MISSION STATEMENT Deliver outstanding service to the utility’s customers by being responsive to their needs, delivering timely and informative communications, and providing accurate account management.
Office of the Director of Customer Relations
Communications Customer Service Meter Services
- 119 -

WATERONE 2015 BUDGET CUSTOMER RELATIONS EXPENDITURES BY MAJOR CATEGORY
Services19%
Commodities1%
Capital Outlay22%
Benefits17%
Labor41%
Net of Transfers
2013 2014 2015 $ Incr % Incr Actual Budget Budget <Decr> <Decr>
Labor (a) $1,861,506 $2,285,468 $2,312,380 $26,912 1.2%Benefits 696,206 875,200 865,210 <9,990> <1.1%> Personnel Costs $2,557,712 $3,160,668 $3,177,590 $16,922 0.5%Commodities (b) 24,455 27,653 52,594 24,941 90.2%Services 890,624 856,621 973,959 117,338 13.7%Transfers (c) <6,732> <1,452> <135,250> <133,797> 9212.1% Total O&M $3,466,058 $4,043,489 $4,068,893 $25,404 0.6%Capital Outlay 1,058,705 1,097,365 1,125,952 28,587 2.6% Total $4,524,763 $5,140,854 $5,194,845 $53,991 1.1%Numbers may not add due to rounding.
(a) Labor consists of Labor-Non OT Gross, Labor-OT Gross and Labor Vac Gross. (b) The 90.2% increase in Commodities is primarily because Materials and Supplies for Maintenance
of Meters is moved from CMVS in the Distribution Division to Meter Services in the CCR Division effective with the 2015 budget.
(c) Effective in 2014, the Meter Services staff is moved from CMVS to the Customer Relations Division. Transfers for New Services Labor (Overhead No. 5) are therefore budgeted in this division for the first time in 2015.
- 120 -
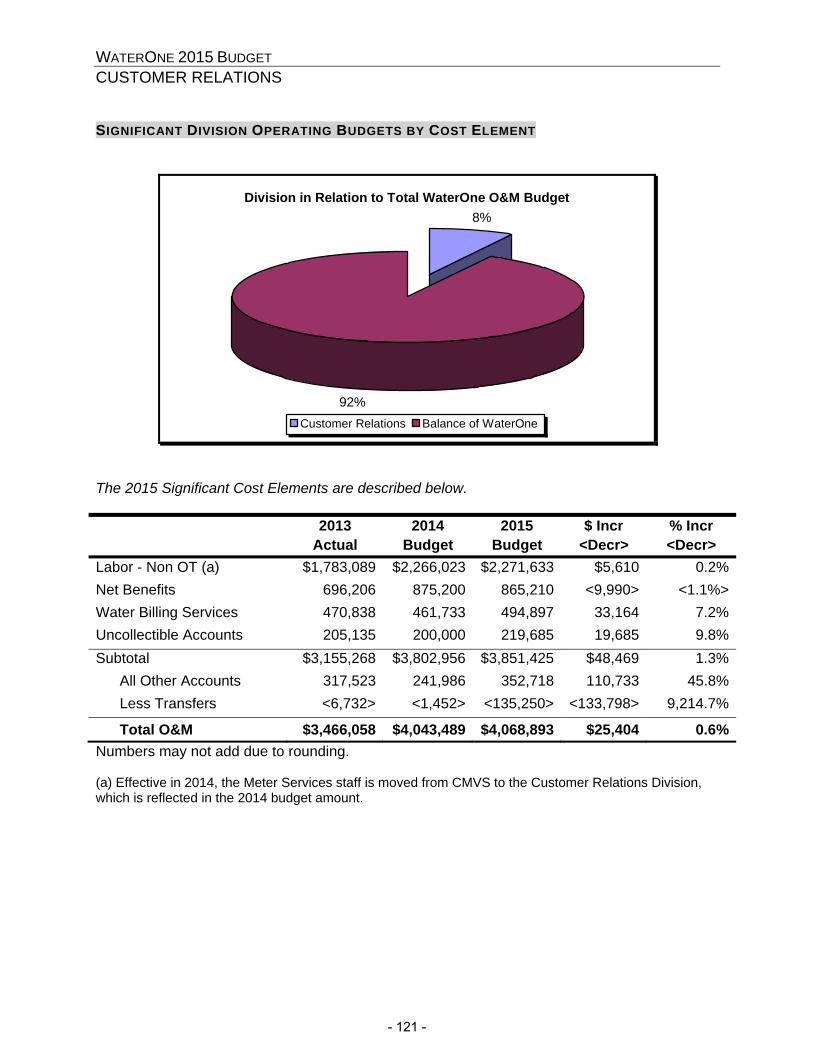
WATERONE 2015 BUDGET CUSTOMER RELATIONS SIGNIFICANT DIVISION OPERATING BUDGETS BY COST ELEMENT
Division in Relation to Total WaterOne O&M Budget8%
92%Customer Relations Balance of WaterOne
The 2015 Significant Cost Elements are described below.
2013 2014 2015 $ Incr % Incr Actual Budget Budget <Decr> <Decr>
Labor - Non OT (a) $1,783,089 $2,266,023 $2,271,633 $5,610 0.2%Net Benefits 696,206 875,200 865,210 <9,990> <1.1%>Water Billing Services 470,838 461,733 494,897 33,164 7.2%Uncollectible Accounts 205,135 200,000 219,685 19,685 9.8%Subtotal $3,155,268 $3,802,956 $3,851,425 $48,469 1.3%
All Other Accounts 317,523 241,986 352,718 110,733 45.8%Less Transfers <6,732> <1,452> <135,250> <133,798> 9,214.7%
Total O&M $3,466,058 $4,043,489 $4,068,893 $25,404 0.6%Numbers may not add due to rounding. (a) Effective in 2014, the Meter Services staff is moved from CMVS to the Customer Relations Division, which is reflected in the 2014 budget amount.
- 121 -

WATERONE 2015 BUDGET CUSTOMER RELATIONS
DIVISION PERSONNEL 2014 + - 2015
Budget Budget
Headcount Full Time 41 1 (a) 42 Part Time 5 <1> (a) 4 Temporary/Summer 2 2 Total Headcount 48 1 <1> 48
Total Full Time Equivalents (FTEs) 44.5 1.1 (a,b) <0.6> (a) 45.0
a) Budgeted Reclassification of Part Time Communications Specialist to Full Time b) Adjustments to budgeted part time hours
Gross Labor (Non-Overtime) A 3.5% performance compensation increase is budgeted. Budget includes reclassification of one position and part time hour adjustments shown in table above. See PERSONNEL tab for more information on budgeted reclassification. Employee Benefits (Transferred) Benefits are planned in the Human Resources Division and allocated to the divisions. More information on Benefits is located behind the PERSONNEL tab. Water Billing Services The printing and mailing of water bills is outsourced. There are two items in this budget. The first is water bills, which includes regular, corrected, and final bills. The budget is developed using actual bills and customer counts. There is a savings from the increase in the ebill adoption rate, but this savings is offset by an increase in the number of billing inserts and the corresponding increase in paper and postage costs. The second part of the budget is for dunning notices, which are budgeted based on actual history. Uncollectible Accounts This is the estimated cost for uncollected water bills. Current actual uncollected water bill costs as a percent of water sales is used as the basis for the budget, which reflects existing economic conditions and operational practices. The Customer Accounts Department attempts to collect final bills for 60 days. After that time, accounts that remain unpaid are referred to an outside agency for collection and are considered uncollectible and are written off. Based on the recent average historical write-off, the budget is .21% of gross water sales.
- 122 -

WATERONE 2015 BUDGET CUSTOMER RELATIONS
ANNUAL CAPITAL
Division in Relation to Total WaterOne Annual Capital Budget
Balance of WaterOne95%
Customer Relations5%
Customer Relations Balance of WaterOne
New AC-15021 Residential Meter Interface Units - AMR $14,673
Annual Capital - New $14,673
Replacement / Refurbish
AC-15014 Meter Replacements $1,101,385
AC-15020 Automatic Meter Reading Replacements 9,894
Annual Capital - Replace / Refurbish $1,111,279
Total Annual Capital $1,125,952Numbers may not add due to rounding Annual Capital Listed in Other Divisions: Projects are listed in the division responsible for project management and maintenance. Listed below are projects for which this division is the primary user, but the project detail can be found in the managing division. AF-15003 (a) SUV (Replace 8320) Cst Accts $28,913
a) Listed in ‘‘Administration / Human Resources Division’’
- 123 -

WaterOne 2015 Budget
CUSTOMER RELATIONS DIVISIONNew
Project #
AC‐15021
Project Description
Residential Meter Interface Units ‐ AMR
Justification
The purpose of the requested MIUs will be to convert up to 150 residential meters that provide suitable economic or safety benefits.
Plan
$14,673
Year
2015
8/28/201411:04:05 AM
- 124 -

WaterOne 2015 Budget
CUSTOMER RELATIONS DIVISIONReplace
Project #
AC‐15014
Project Description
Meter Replacements
Justification
Annual program to replace defective and old meters. This program targets meters that have been in service greater than twenty years. This request is for approximately 7,300 meters or 5% of the meters in service.
Plan
$1,101,385
Year
2015
Project #
AC‐15020
Project Description
Automatic Meter Reading Replacements
Justification
Replace AMR devices that stopped working and aren't under warranty.
Plan
$9,894
Year
2015
8/28/201411:04:06 AM
- 125 -

This page intentionally left blank.
- 126 -

WATERONE 2015 BUDGET FINANCE
FINANCE DIVISION
DIVISION DESCRIPTION The Accounting Department ensures that financial activities are accurately identified, recorded and reported on a timely basis in compliance with Generally Accepted Accounting Principles. The Financial Planning Department develops annual and long-term financial plans utilizing various modeling tools. The department analyzes the revenue structure to maintain equitable rates and to insure adequate funds are available to achieve WaterOne’s strategic objectives. The Cash & Investments Department has the function of planning for optimum timing of cash flows with the goal of having funds as close to fully invested as possible. Purchasing is responsible for the procurement of materials, supplies, and services for WaterOne. Materials Management is responsible for warehousing/inventory management, the receipt and issuance of materials, and quality control. The department also administers the purchasing card program.
MISSION STATEMENT Assure the overall financial strength of WaterOne through effective planning and the establishment of sound financial controls and reporting mechanisms.
Office of the Director
of Finance
Financial Planning
Cash & Investments
Accounting Purchasing & Materials
Management
- 127 -

WATERONE 2015 BUDGET FINANCE EXPENDITURES BY MAJOR CATEGORY
Labor50%
Benefits21%
Services27%
Capital Outlay0%
Commodities2%
Net of Transfers
2013 2014 2015 $ Incr % Incr Actual Budget Budget <Decr> <Decr>
Labor (a) $1,245,582 $1,256,013 $1,322,804 $66,791 5.3%Benefits 379,398 409,888 417,793 7,905 1.9% Personnel Costs $1,624,980 $1,665,901 $1,740,597 $74,696 4.5%Commodities 13,029 44,785 38,375 <6,410> <14.3%>Services 768,125 835,350 840,722 5,372 0.6%Transfers <621,647> <693,182> <654,737> 38,445 <5.5%> Total O&M $1,784,487 $1,852,854 $1,964,957 $112,103 6.1%Capital Outlay (b) 0 10,000 0 <10,000> <100.0%> Total $1,784,487 $1,862,854 $1,964,957 $102,103 5.5%Numbers may not add due to rounding (a) Labor consists of Labor-Non OT Gross, Labor-OT Gross and Labor Vac Gross. (b) Capital includes funding for Benefit Area Refunds
- 128 -

WATERONE 2015 BUDGET FINANCE SIGNIFICANT DIVISION OPERATING BUDGETS BY COST ELEMENT
Division in Relation to Total WaterOne O&M Budget4%
96%
Finance Balance of WaterOne
The 2015 Significant Cost Elements are described below.
2013 2014 2015 $ Incr % Incr Actual Budget Budget <Decr> <Decr>
Labor - Non OT $1,227,858 $1,253,708 $1,320,353 $66,645 5.3%Clean Drinking Water Fee 544,798 581,690 586,418 4,728 0.8%Benefits 379,398 409,888 417,793 7,905 1.9%Property Tax Assessment 56,115 63,291 61,853 <1,438> <2.3%>Bank Lockbox Proc Fees 61,677 60,500 59,400 <1,100> <1.8%>Ckg Acct Service Fees 61,725 54,000 55,000 1,000 1.9%Subtotal $2,331,571 $2,423,077 $2,500,817 $77,740 3.2%All Other Accounts 74,563 122,959 118,877 <4,082> <3.3%>Less Transfers <621,647> <693,182> <654,737> 38,445 <5.5%>
Total O&M $1,784,487 $1,852,854 $1,964,957 $112,103 6.1%Numbers may not add due to rounding
- 129 -
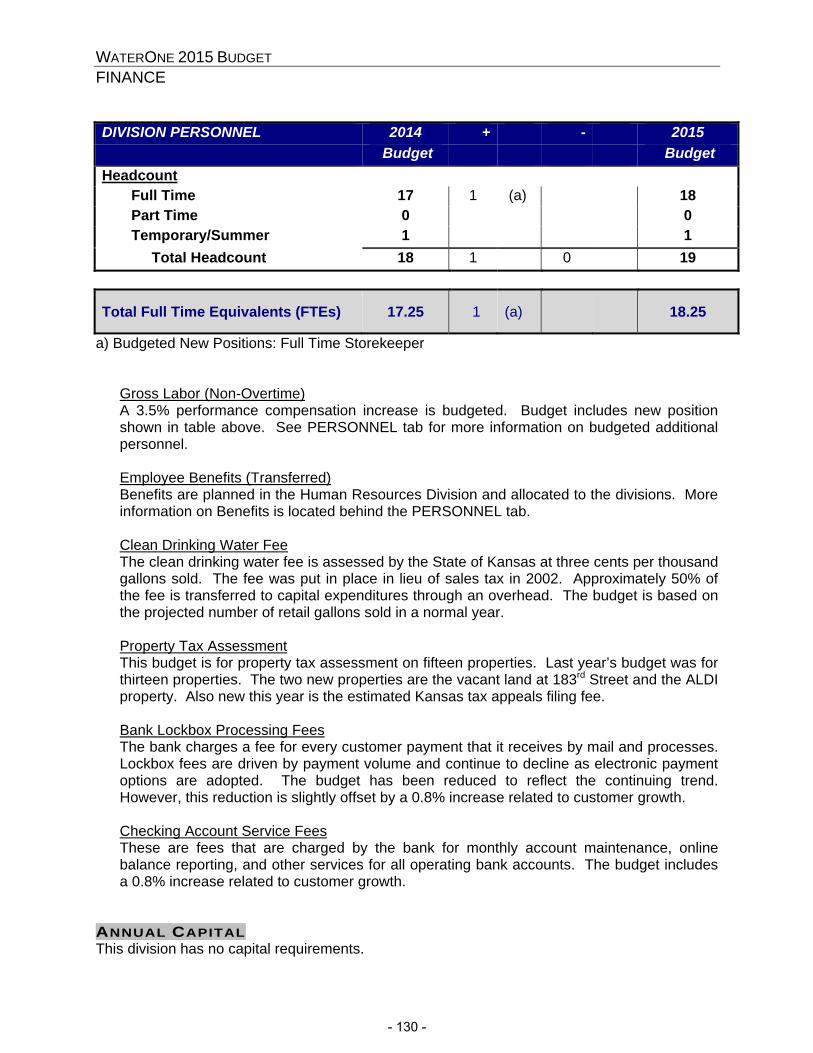
WATERONE 2015 BUDGET FINANCE
DIVISION PERSONNEL 2014 + - 2015
Budget Budget
Headcount Full Time 17 1 (a) 18 Part Time 0 0 Temporary/Summer 1 1 Total Headcount 18 1 0 19
Total Full Time Equivalents (FTEs) 17.25 1 (a) 18.25
a) Budgeted New Positions: Full Time Storekeeper
Gross Labor (Non-Overtime) A 3.5% performance compensation increase is budgeted. Budget includes new position shown in table above. See PERSONNEL tab for more information on budgeted additional personnel. Employee Benefits (Transferred) Benefits are planned in the Human Resources Division and allocated to the divisions. More information on Benefits is located behind the PERSONNEL tab. Clean Drinking Water Fee The clean drinking water fee is assessed by the State of Kansas at three cents per thousand gallons sold. The fee was put in place in lieu of sales tax in 2002. Approximately 50% of the fee is transferred to capital expenditures through an overhead. The budget is based on the projected number of retail gallons sold in a normal year. Property Tax Assessment This budget is for property tax assessment on fifteen properties. Last year’s budget was for thirteen properties. The two new properties are the vacant land at 183rd Street and the ALDI property. Also new this year is the estimated Kansas tax appeals filing fee. Bank Lockbox Processing Fees The bank charges a fee for every customer payment that it receives by mail and processes. Lockbox fees are driven by payment volume and continue to decline as electronic payment options are adopted. The budget has been reduced to reflect the continuing trend. However, this reduction is slightly offset by a 0.8% increase related to customer growth. Checking Account Service Fees These are fees that are charged by the bank for monthly account maintenance, online balance reporting, and other services for all operating bank accounts. The budget includes a 0.8% increase related to customer growth.
ANNUAL CAPITAL This division has no capital requirements.
- 130 -
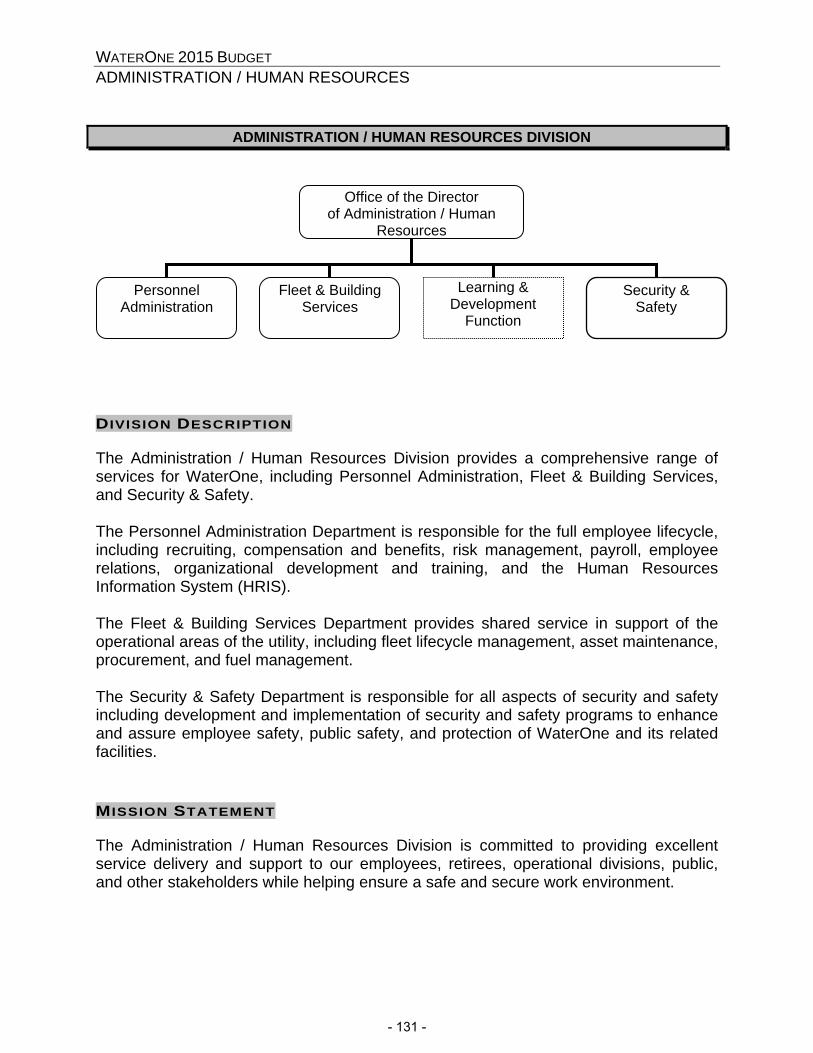
WATERONE 2015 BUDGET ADMINISTRATION / HUMAN RESOURCES
ADMINISTRATION / HUMAN RESOURCES DIVISION
DIVISION DESCRIPTION The Administration / Human Resources Division provides a comprehensive range of services for WaterOne, including Personnel Administration, Fleet & Building Services, and Security & Safety. The Personnel Administration Department is responsible for the full employee lifecycle, including recruiting, compensation and benefits, risk management, payroll, employee relations, organizational development and training, and the Human Resources Information System (HRIS). The Fleet & Building Services Department provides shared service in support of the operational areas of the utility, including fleet lifecycle management, asset maintenance, procurement, and fuel management. The Security & Safety Department is responsible for all aspects of security and safety including development and implementation of security and safety programs to enhance and assure employee safety, public safety, and protection of WaterOne and its related facilities.
MISSION STATEMENT The Administration / Human Resources Division is committed to providing excellent service delivery and support to our employees, retirees, operational divisions, public, and other stakeholders while helping ensure a safe and secure work environment.
Office of the Director of Administration / Human
Resources
Personnel Administration
Learning & Development
Function
Fleet & Building Services
Security & Safety
- 131 -
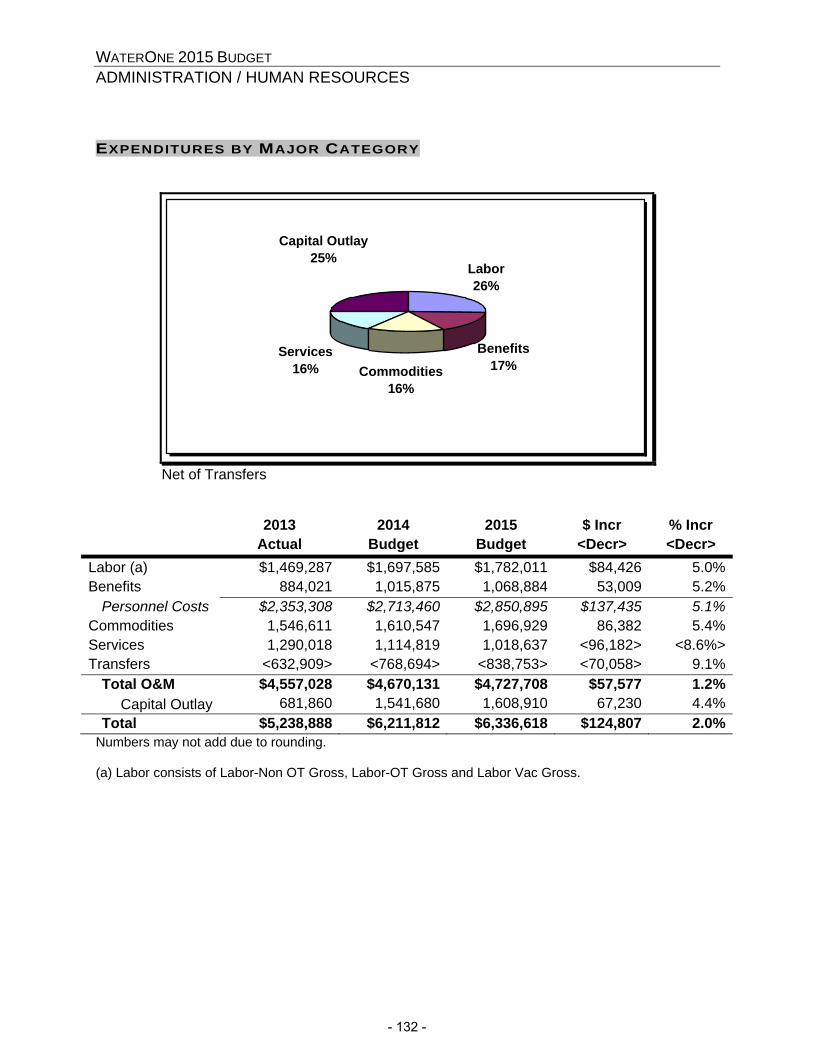
WATERONE 2015 BUDGET ADMINISTRATION / HUMAN RESOURCES EXPENDITURES BY MAJOR CATEGORY
Labor26%
Benefits17%
Capital Outlay25%
Services16% Commodities
16%
Net of Transfers
2013 2014 2015 $ Incr % Incr Actual Budget Budget <Decr> <Decr>
Labor (a) $1,469,287 $1,697,585 $1,782,011 $84,426 5.0%Benefits 884,021 1,015,875 1,068,884 53,009 5.2% Personnel Costs $2,353,308 $2,713,460 $2,850,895 $137,435 5.1%Commodities 1,546,611 1,610,547 1,696,929 86,382 5.4%Services 1,290,018 1,114,819 1,018,637 <96,182> <8.6%>Transfers <632,909> <768,694> <838,753> <70,058> 9.1% Total O&M $4,557,028 $4,670,131 $4,727,708 $57,577 1.2%
Capital Outlay 681,860 1,541,680 1,608,910 67,230 4.4% Total $5,238,888 $6,211,812 $6,336,618 $124,807 2.0%
Numbers may not add due to rounding. (a) Labor consists of Labor-Non OT Gross, Labor-OT Gross and Labor Vac Gross.
- 132 -

WATERONE 2015 BUDGET ADMINISTRATION / HUMAN RESOURCES SIGNIFICANT DIVISION OPERATING BUDGETS BY COST ELEMENT
Division in Relation to Total WaterOne O&M Budget9%
91%Human Resources Balance of WaterOne
The 2015 Significant Cost Elements are described below.
2013 2014 2015 $ Incr % Incr Actual Budget Budget <Decr> <Decr>
Labor - Non OT $1,396,300 $1,672,861 $1,751,135 $78,274 4.7%Benefits 884,021 1,015,875 1,068,884 53,009 5.2%Inventory Withdrawals 951,842 965,257 872,804 <92,453> <9.6%>Security / Security Guards 396,072 368,000 381,903 13,903 3.8%Vehicle Repair Services 347,427 245,619 50,000 <195,619> <79.6%>Material & Supplies 226,322 266,566 440,985 174,419 65.4%Electricity 195,438 204,360 202,950 <1,410> <0.7%>Contracted Services 94,646 92,652 130,688 38,036 41.1%Property & Liab. Insurance 95,957 108,990 104,000 <4,990> <4.6%>Subtotal $4,588,025 $4,940,180 $5,003,349 $63,169 1.3%
All Other Accounts 601,912 498,646 563,112 64,467 12.9%Less Transfers <632,909> <768,694> <838,753> <70,059> 9.1%Total O&M $4,557,028 $4,670,131 $4,727,708 $57,577 1.2%
Numbers may not add due to rounding.
- 133 -
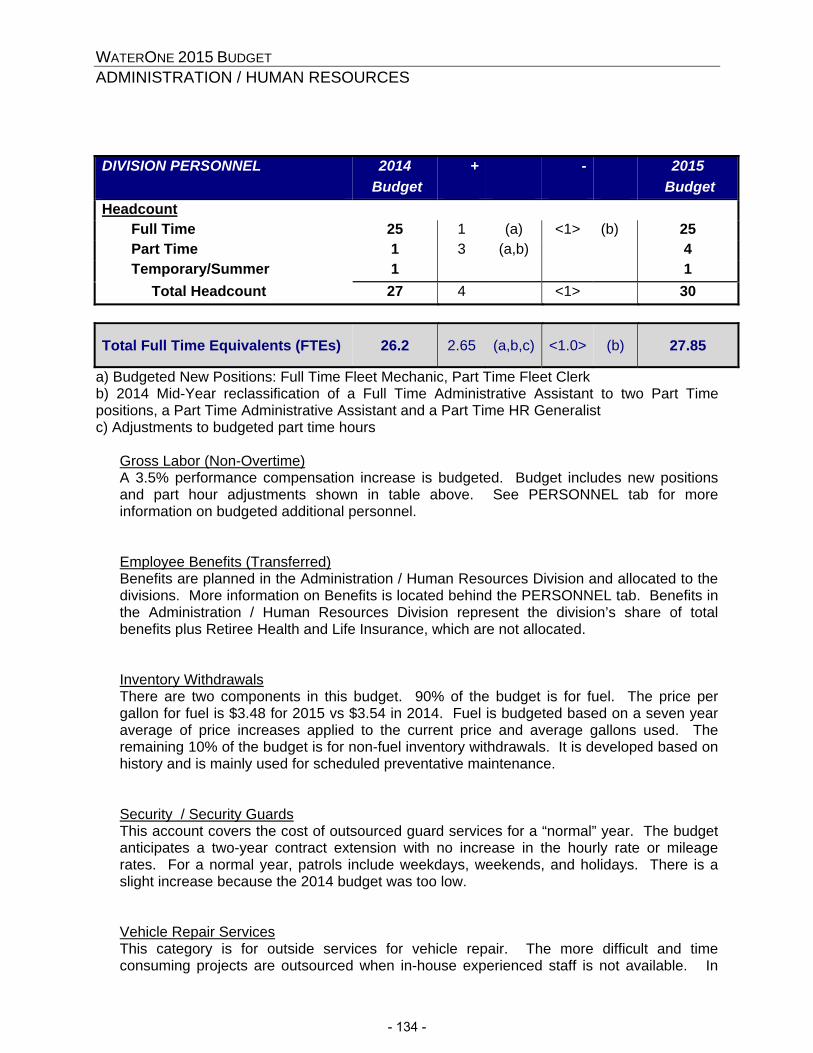
WATERONE 2015 BUDGET ADMINISTRATION / HUMAN RESOURCES DIVISION PERSONNEL 2014 + - 2015
Budget Budget
Headcount Full Time 25 1 (a) <1> (b) 25 Part Time 1 3 (a,b) 4 Temporary/Summer 1 1 Total Headcount 27 4 <1> 30
Total Full Time Equivalents (FTEs) 26.2 2.65 (a,b,c) <1.0> (b) 27.85
a) Budgeted New Positions: Full Time Fleet Mechanic, Part Time Fleet Clerk b) 2014 Mid-Year reclassification of a Full Time Administrative Assistant to two Part Time positions, a Part Time Administrative Assistant and a Part Time HR Generalist c) Adjustments to budgeted part time hours
Gross Labor (Non-Overtime) A 3.5% performance compensation increase is budgeted. Budget includes new positions and part hour adjustments shown in table above. See PERSONNEL tab for more information on budgeted additional personnel. Employee Benefits (Transferred) Benefits are planned in the Administration / Human Resources Division and allocated to the divisions. More information on Benefits is located behind the PERSONNEL tab. Benefits in the Administration / Human Resources Division represent the division’s share of total benefits plus Retiree Health and Life Insurance, which are not allocated. Inventory Withdrawals There are two components in this budget. 90% of the budget is for fuel. The price per gallon for fuel is $3.48 for 2015 vs $3.54 in 2014. Fuel is budgeted based on a seven year average of price increases applied to the current price and average gallons used. The remaining 10% of the budget is for non-fuel inventory withdrawals. It is developed based on history and is mainly used for scheduled preventative maintenance. Security / Security Guards This account covers the cost of outsourced guard services for a “normal” year. The budget anticipates a two-year contract extension with no increase in the hourly rate or mileage rates. For a normal year, patrols include weekdays, weekends, and holidays. There is a slight increase because the 2014 budget was too low. Vehicle Repair Services This category is for outside services for vehicle repair. The more difficult and time consuming projects are outsourced when in-house experienced staff is not available. In
- 134 -

WATERONE 2015 BUDGET ADMINISTRATION / HUMAN RESOURCES
previous years this account has included material and supplies utilized during in-house vehicle maintenance. The budget for 2015 has been reduced in order to move those expenses into the material and supplies budget. Material & Supplies This category is primarily for vehicle repair parts and supplies for custodial and maintenance services. Accounts are budgeted based on multi-year averages. In previous years this account has not included material and supplies utilized during in-house vehicle maintenance and repairs. The budget for 2015 has been increased to reflect the reduction of the budget for vehicle repair services. Electricity This budget covers the cost of electricity for the Administrative/Service Center and the Fleet Building. It is based on recent actual history plus an estimated 2.3% increase in rates from KCP&L. Actuals have been lower than budget. Contracted Services This budget is for external consultant studies, the cost of the service provider for GPS Automatic Vehicle Locator (AVL), and paper shredding services. Using a paper shredding service is new in this year’s budget. Formerly this was under the Trash Removal budget. Almost all of the increase in the budget is for the AVL program, which is increased based on the number of vehicles in each cost center. The remainder is for the transfer from the trash removal budget. Property & Liability Insurance This budget is for auto insurance premiums only and is estimated based on actual 2013 rates plus an estimated 5% increase. The Property & Liability insurance policy renews in July of each year so premiums that are effective beginning in July 2014 will be in effect for the first half of the 2015 budget. (All other property and liability insurance premiums are budgeted in the Legal / Audit Division.)
- 135 -

WATERONE 2015 BUDGET ADMINISTRATION / HUMAN RESOURCES ANNUAL CAPITAL
Division in Relation to Total WaterOne Annual Capital Budget
Balance of WaterOne
94%
Admin/Human Resources
6%
Admin/Human Resources Balance of WaterOne
The Administration / Human Resources Division includes the Fleet & Building Services department which is responsible for the maintenance of the fleet. Vehicles and fleet equipment are shown below; the description includes the user department. In previous budgets, vehicles were listed in the user department. New
AP-15007 3/4 Ton Cargo Van for HVAC Tech $45,958
Annual Capital - New $45,958
Replacement / Refurbish
AF-15002 Tandem Axle Hydro Excavator (Repl 6010) 433,529AC-15022 Upgrade Access Control Readers 227,369AC-15024 Security Equipment 141,730AF-15001 1 Ton Utility Truck (Replace 4700) - FM 117,223AF-15726 Service Truck (Replace 4100) - Flt Srv's 115,357AF-15047 1 Ton Service Body (Replace 4690) - FM 105,936AF-15725 Skid Steer (Replace 7501) - CMVS 75,589AF-15022 Track Skid Steer (Replace 7516) - CMVS 61,302AF-15000 3/4 Ton Pickup (Replace 2580) - CMVS 44,650AF-15007 1/2 Ton Truck (Replace 2018) - CMVS 34,565AF-15261 1/2 Ton Truck (Replace 2020) - Flt Srv's 31,236
- 136 -
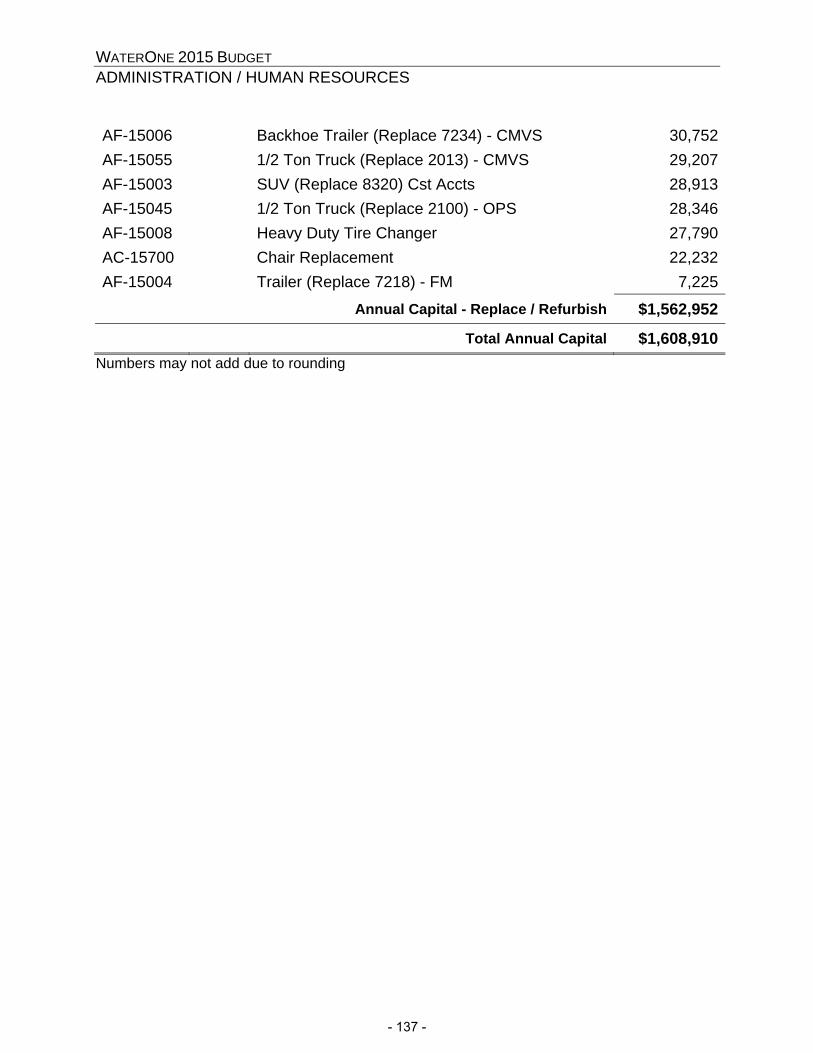
WATERONE 2015 BUDGET ADMINISTRATION / HUMAN RESOURCES AF-15006 Backhoe Trailer (Replace 7234) - CMVS 30,752AF-15055 1/2 Ton Truck (Replace 2013) - CMVS 29,207AF-15003 SUV (Replace 8320) Cst Accts 28,913AF-15045 1/2 Ton Truck (Replace 2100) - OPS 28,346AF-15008 Heavy Duty Tire Changer 27,790AC-15700 Chair Replacement 22,232AF-15004 Trailer (Replace 7218) - FM 7,225
Annual Capital - Replace / Refurbish $1,562,952
Total Annual Capital $1,608,910Numbers may not add due to rounding
- 137 -

WaterOne 2015 Budget
ADMINISTRATION/HUMAN RESOURCES DIVISIONNew
Project #
AP‐15007
Project Description
3/4 Ton Cargo Van for HVAC Tech
Justification
This vehicle request supports the HVAC Tech position that is requested in the 2015 budget. (See the justification in the Personnel Section.)
Plan
$45,958
Year
2015
Project #
AF‐15003
Project Description
SUV (Replace 8320) Cst Accts
Justification
WaterOne Fleet Replacement Standard: 7 years and 100,000 Miles. Unit #8320: 9 Years, 79,155 miles as of 6/1/14. The unit has exceeded the age criteria. Utilization is higher so it will reach the mileage criteria before year‐end 2015. The replacement will be configured the same.
Plan
$28,913
Year
2015
8/28/201411:03:36 AM
- 138 -

WaterOne 2015 Budget
ADMINISTRATION/HUMAN RESOURCES DIVISIONReplace
Project #
AF‐15002
Project Description
Tandem Axle Hydro Excavator (Repl 6010)
Justification
This request is for a new Hydro Excavator truck for the Distribution Division. This is a Class 8 truck with a hydro excavation package mounted to the frame. The unit will provide pot holing, utility spotting and open trench repair capabilities. These functions are useful in preventing damage to other utilities. Currently, there is an identical unit in the fleet that is our highest used commercial vehicle. A second unit will provide CMVS with the ability to improve operations.
Plan
$433,529
Year
2015
Project #
AC‐15022
Project Description
Upgrade Access Control Readers
Justification
This project would complete the replacement of all of the current access control card readers throughout WaterOne's facilities with the latest technology.
Plan
$227,369
Year
2015
10/1/201410:38:26 AM
- 139 -
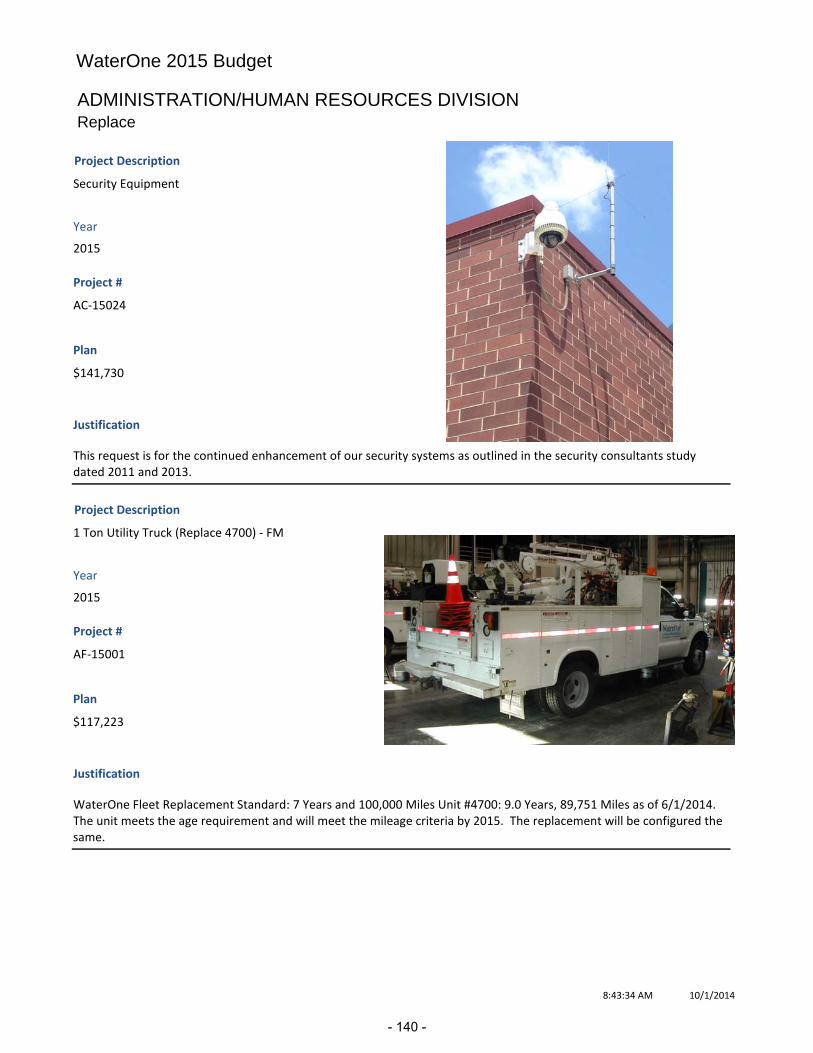
WaterOne 2015 Budget
ADMINISTRATION/HUMAN RESOURCES DIVISIONReplace
Project #
AC‐15024
Project Description
Security Equipment
Justification
This request is for the continued enhancement of our security systems as outlined in the security consultants study dated 2011 and 2013.
Plan
$141,730
Year
2015
Project #
AF‐15001
Project Description
1 Ton Utility Truck (Replace 4700) ‐ FM
Justification
WaterOne Fleet Replacement Standard: 7 Years and 100,000 Miles Unit #4700: 9.0 Years, 89,751 Miles as of 6/1/2014. The unit meets the age requirement and will meet the mileage criteria by 2015. The replacement will be configured the same.
Plan
$117,223
Year
2015
10/1/20148:43:34 AM
- 140 -

WaterOne 2015 Budget
ADMINISTRATION/HUMAN RESOURCES DIVISIONReplace
Project #
AF‐15726
Project Description
Service Truck (Replace 4100) ‐ Flt Srv's
Justification
WaterOne Fleet Replacement Standard: 7 Years and 100,000 Miles Unit #4100: 10.6 Years, 58,961 Miles as of 6/1/2014 The unit meets the year criteria. It does not meet the mileage criteria, but it has had excessive engine repairs. The replacement vehicle will be configured the same.
Plan
$115,357
Year
2015
Project #
AF‐15047
Project Description
1 Ton Service Body (Replace 4690) ‐ FM
Justification
WaterOne Fleet Replacement Standard: 7 Years and 100,000 Miles Unit #4690: 9.1 Years, 92,814 Miles as of 6/1/2014 The unit meets the year requirement and will meet the mileage requirement by 2015. The replacement will be configured the same.
Plan
$105,936
Year
2015
8/28/201411:03:43 AM
- 141 -
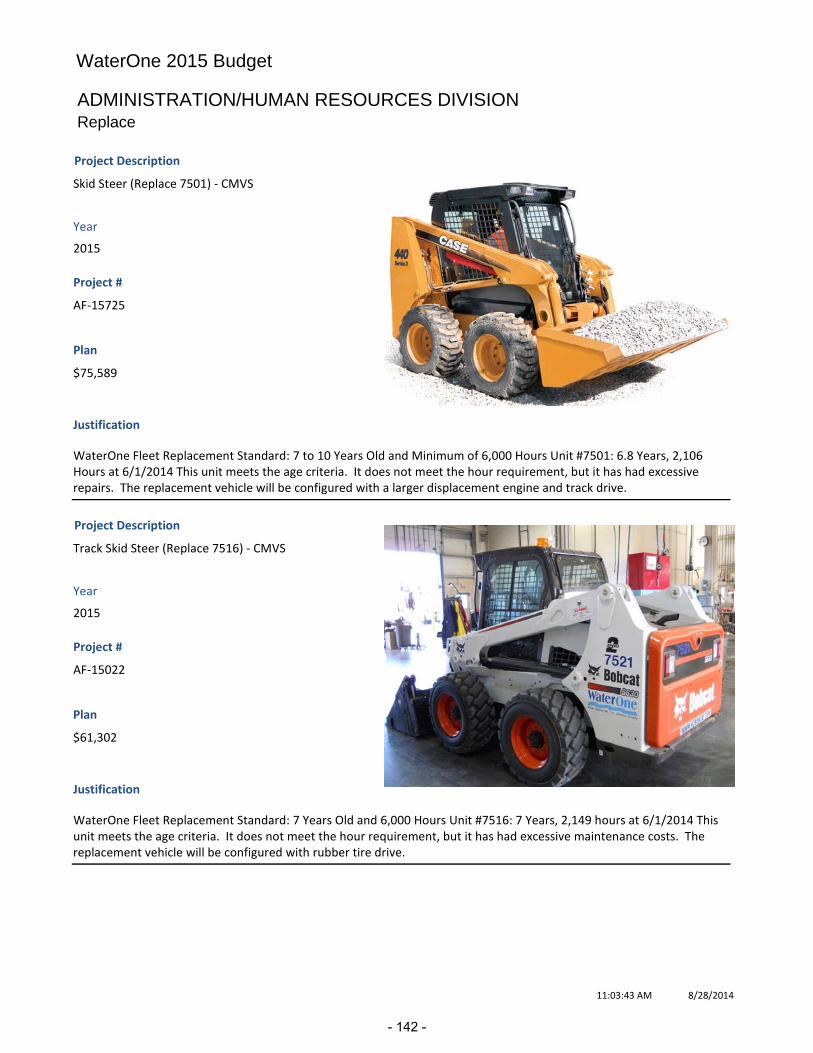
WaterOne 2015 Budget
ADMINISTRATION/HUMAN RESOURCES DIVISIONReplace
Project #
AF‐15725
Project Description
Skid Steer (Replace 7501) ‐ CMVS
Justification
WaterOne Fleet Replacement Standard: 7 to 10 Years Old and Minimum of 6,000 Hours Unit #7501: 6.8 Years, 2,106 Hours at 6/1/2014 This unit meets the age criteria. It does not meet the hour requirement, but it has had excessive repairs. The replacement vehicle will be configured with a larger displacement engine and track drive.
Plan
$75,589
Year
2015
Project #
AF‐15022
Project Description
Track Skid Steer (Replace 7516) ‐ CMVS
Justification
WaterOne Fleet Replacement Standard: 7 Years Old and 6,000 Hours Unit #7516: 7 Years, 2,149 hours at 6/1/2014 This unit meets the age criteria. It does not meet the hour requirement, but it has had excessive maintenance costs. The replacement vehicle will be configured with rubber tire drive.
Plan
$61,302
Year
2015
8/28/201411:03:43 AM
- 142 -

WaterOne 2015 Budget
ADMINISTRATION/HUMAN RESOURCES DIVISIONReplace
Project #
AF‐15000
Project Description
3/4 Ton Pickup (Replace 2580) ‐ CMVS
Justification
WaterOne Fleet Replacement Standard: 7 Years and 100,000 Miles Unit #2580: 11.7 Years, 90,625 Miles at 6/1/2014 This unit meets the age criteria. Utilization is higher, so it will reach the mileage criteria before year‐end 2015. The replacement unit capacity is increased from a 1/2 Ton Pickup to a 3/4 Ton Pickup to meet towing needs and extend durability.
Plan
$44,650
Year
2015
Project #
AF‐15007
Project Description
1/2 Ton Truck (Replace 2018) ‐ CMVS
Justification
WaterOne Fleet Replacement Standard: 7 Years and 100,000 Miles Unit #2018: 6.6 Years, 67,418 Miles as of 6/1/2014 The unit meets the year criteria by 2015. It will meet the mileage criteria by late 2015 because it has been moved to a higher mileage area and is now being used by the Leak Correlator. The replacement unit will be 4‐wheel drive and the cab will be configured to include additional space.
Plan
$34,565
Year
2015
8/28/201411:03:44 AM
- 143 -

WaterOne 2015 Budget
ADMINISTRATION/HUMAN RESOURCES DIVISIONReplace
Project #
AF‐15261
Project Description
1/2 Ton Truck (Replace 2020) ‐ Flt Srv's
Justification
WaterOne Fleet Replacement Standard: 7 Years and 100,000 Miles Unit #2020: 6.6 Years, 104,179 Miles at 6/1/2014 The unit will meet both criteria by 2015. The replacement unit will be configured the same.
Plan
$31,236
Year
2015
Project #
AF‐15006
Project Description
Backhoe Trailer (Replace 7234) ‐ CMVS
Justification
WaterOne Fleet Replacement Standard: Every 5 to 10 Years depending on condition. Unit #7234: 8.3 Years at 1/1/2014 The unit has exceeded the minimum age requirement and is in poor condition. The replacement trailer will be configured the same.
Plan
$30,752
Year
2015
8/28/201411:03:44 AM
- 144 -

WaterOne 2015 Budget
ADMINISTRATION/HUMAN RESOURCES DIVISIONReplace
Project #
AF‐15055
Project Description
1/2 Ton Truck (Replace 2013) ‐ CMVS
Justification
WaterOne Fleet Replacement Standard: 7 Years and 100,000 Miles Unit #2013: 7.8 Years, 92,254 Miles at 6/1/2014 The unit meets the year criteria and will meet the mileage criteria by 2015. The replacement unit will be configured the same.
Plan
$29,207
Year
2015
Project #
AF‐15045
Project Description
1/2 Ton Truck (Replace 2100) ‐ OPS
Justification
WaterOne Fleet Replacement Standard: 7 Years and 100,000 Miles Unit #2100: 15.6 Years, 82,390 Miles at 6/1/2014 The unit meets the year criteria and will meet the mileage criteria by 2015. The replacement unit will be configured the same.
Plan
$28,346
Year
2015
8/28/201411:03:44 AM
- 145 -
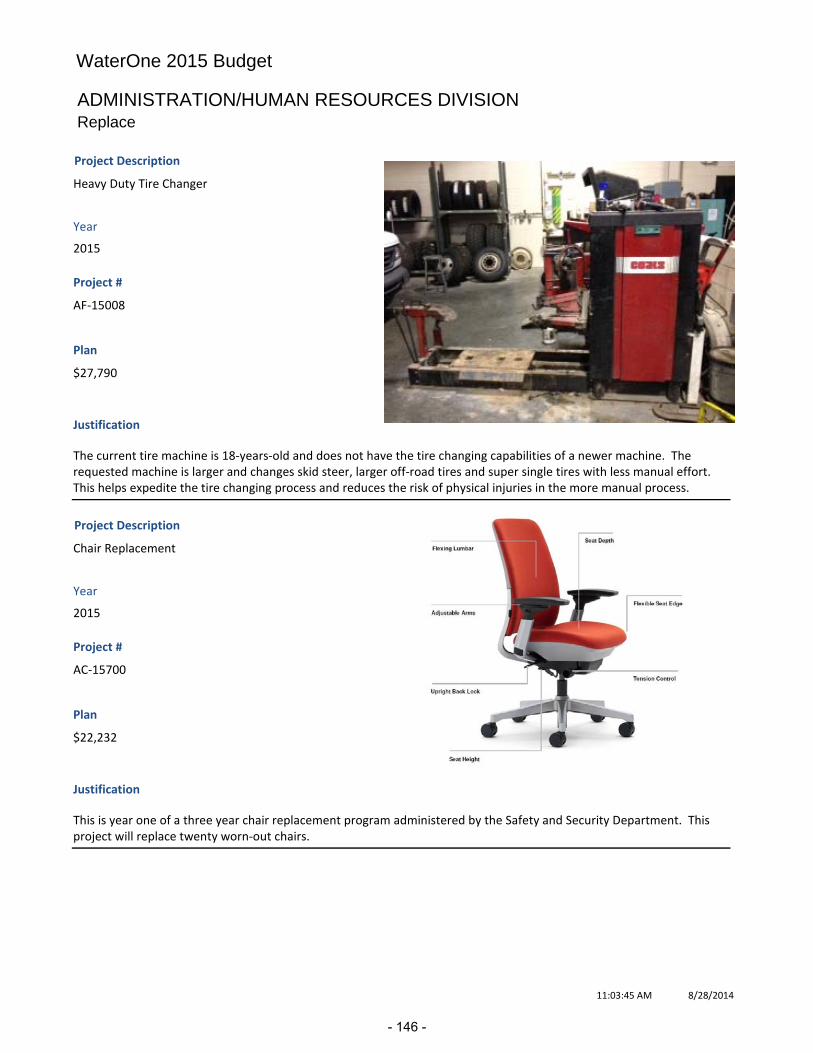
WaterOne 2015 Budget
ADMINISTRATION/HUMAN RESOURCES DIVISIONReplace
Project #
AF‐15008
Project Description
Heavy Duty Tire Changer
Justification
The current tire machine is 18‐years‐old and does not have the tire changing capabilities of a newer machine. The requested machine is larger and changes skid steer, larger off‐road tires and super single tires with less manual effort. This helps expedite the tire changing process and reduces the risk of physical injuries in the more manual process.
Plan
$27,790
Year
2015
Project #
AC‐15700
Project Description
Chair Replacement
Justification
This is year one of a three year chair replacement program administered by the Safety and Security Department. This project will replace twenty worn‐out chairs.
Plan
$22,232
Year
2015
8/28/201411:03:45 AM
- 146 -
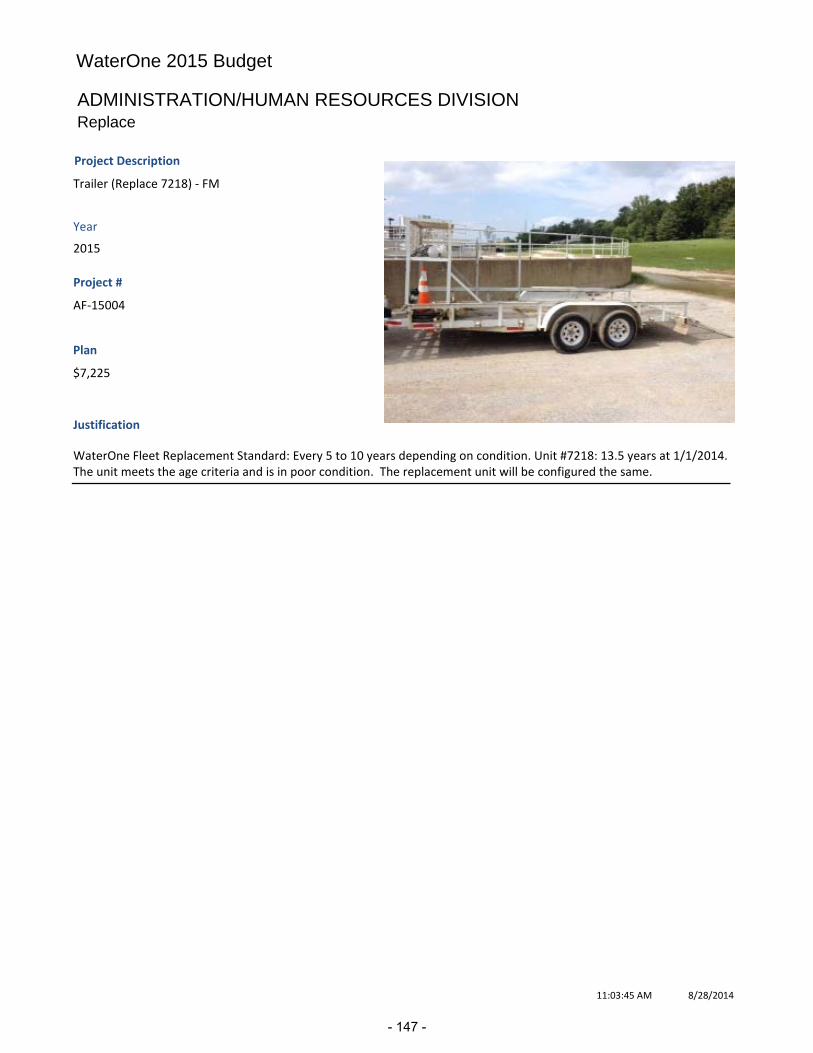
WaterOne 2015 Budget
ADMINISTRATION/HUMAN RESOURCES DIVISIONReplace
Project #
AF‐15004
Project Description
Trailer (Replace 7218) ‐ FM
Justification
WaterOne Fleet Replacement Standard: Every 5 to 10 years depending on condition. Unit #7218: 13.5 years at 1/1/2014. The unit meets the age criteria and is in poor condition. The replacement unit will be configured the same.
Plan
$7,225
Year
2015
8/28/201411:03:45 AM
- 147 -

This page intentionally left blank.
- 148 -

WATERONE 2015 BUDGET LEGAL / AUDITING
LEGAL / AUDITING DIVISION
DIVISION DESCRIPTION The Legal Division provides in-house expertise to the Board and its committees, the General Manager, and staff. It reviews and recommends additions, amendments or revocations of WaterOne’s Rules and Regulations, Board Policies and contract documents and agreements, and conducts and supervises litigation involving the Board or WaterOne. In addition, the Legal Division provides legislative lobbying services. The Governmental Affairs Coordinator provides representation of WaterOne in the State Capitol on legislative issues. The Legal Division is also responsible for the insurance functions related to property and casualty insurance coverage and risk management. The Division manages all operations and personnel of the WaterOne Records Center and responds to official records requests submitted by members of the public under the Kansas Open Records Act. Auditing is an independent appraisal and evaluation function established within WaterOne as a service to management and the Board.
MISSION STATEMENT Provide competent, ethical, consistent and timely legal, auditing, and insurance services to the WaterOne Board and management, as well as providing a governmental affairs representative in the State Capitol related to legislative issues.
Office of the Director of Legal / Audit
Auditing Legal Function
- 149 -

WATERONE 2015 BUDGET LEGAL / AUDITING EXPENDITURES BY MAJOR CATEGORY
Services43%
Commodities0% Benefits
14%
Labor43%
Net of Transfers
2013 2014 2015 $ Incr % Incr Actual Budget Budget <Decr> <Decr>
Labor (a) $649,201 $671,397 $696,955 $25,558 3.8%Benefits 199,326 215,961 212,699 <3,262> <1.5%> Personnel Costs $848,527 $887,358 $909,654 $22,296 2.5%Commodities 5,321 8,380 3,230 <5,150> <61.5%>Services 838,330 744,701 731,084 <13,617> <1.8%>Transfers <130,910> <138,868> <153,651> <14,784> 10.6% Total O&M $1,561,268 $1,501,571 $1,490,317 <$11,254> <0.7%>Capital Outlay 0 0 0 0 NA Total $1,561,268 $1,501,571 $1,490,317 <$11,254> <0.7%>Numbers may not add due to rounding (a) Labor consists of Labor-Non OT Gross, Labor-OT Gross and Labor Vac Gross.
- 150 -

WATERONE 2015 BUDGET LEGAL / AUDITING SIGNIFICANT DIVISION OPERATING BUDGETS BY COST ELEMENT
Division in Relation to Total WaterOne O&M Budget
97%
3%
Legal/Audit Balance of WaterOne
The 2015 Significant Cost Elements are described below.
2013 2014 2015 $ Incr % Incr Actual Budget Budget <Decr> <Decr>
Labor - Non OT Gross $643,471 $670,881 $696,406 $25,525 3.8%Benefits 199,326 215,961 212,699 <3,262> <1.5%>Property & Liability Insurance 554,202 581,800 553,000 <28,800> -5.0%Property & Liability Ins - Self Ins 88,737 60,000 60,000 0 0.0%Auditing Fees 40,971 42,200 43,275 1,075 2.5%Subtotal $1,526,707 $1,570,842 $1,565,380 <$5,462> <0.3%>
All Other CE’s 165,471 69,597 78,588 8,991 12.9%Less Transfers <130,910> <138,868> <153,651> <14,784> 10.6%Total O&M $1,561,268 $1,501,571 $1,490,317 <$11,254> <0.7%>Numbers may not add due to rounding
- 151 -

WATERONE 2015 BUDGET LEGAL / AUDITING
DIVISION PERSONNEL 2014 + - 2015
Budget Budget
Headcount Full Time 8 8 Part Time 1 1 Temporary/Summer 1 1 Total Headcount 10 0 0 10
Total Full Time Equivalents (FTEs) 8.85 0.025 (a) 8.875
a) Adjustments to budgeted part time hours Gross Labor (Non-Overtime) A 3.5% performance compensation increase is budgeted. Employee Benefits (Transferred) Benefits are planned in the Human Resources Division and allocated to the divisions. More information on Benefits is located behind the PERSONNEL tab. Property & Liability Insurance The budget includes insurance premiums for General Liability, Property, Pollution, Umbrella, Crime, Licenses, and Fiduciary Insurance. The budget is based on the actual 7/1/2014 renewals. The decrease was mostly due to a reduction in costs for Property coverage.
Property & Liability - Self Insurance This budget provides for deductibles and claims that are not covered by insurance. The budgeted amount is based on actual history. Auditing Fees The budget for auditing fees includes the fee for the annual external audit, the Kansas filing fee for the Division of Accounts and Reports, and the publication of the annual financial statement. Fees are established through the RFP process and approved by the Board. There is no change in this budget.
ANNUAL CAPITAL This division has no capital requirements.
- 152 -
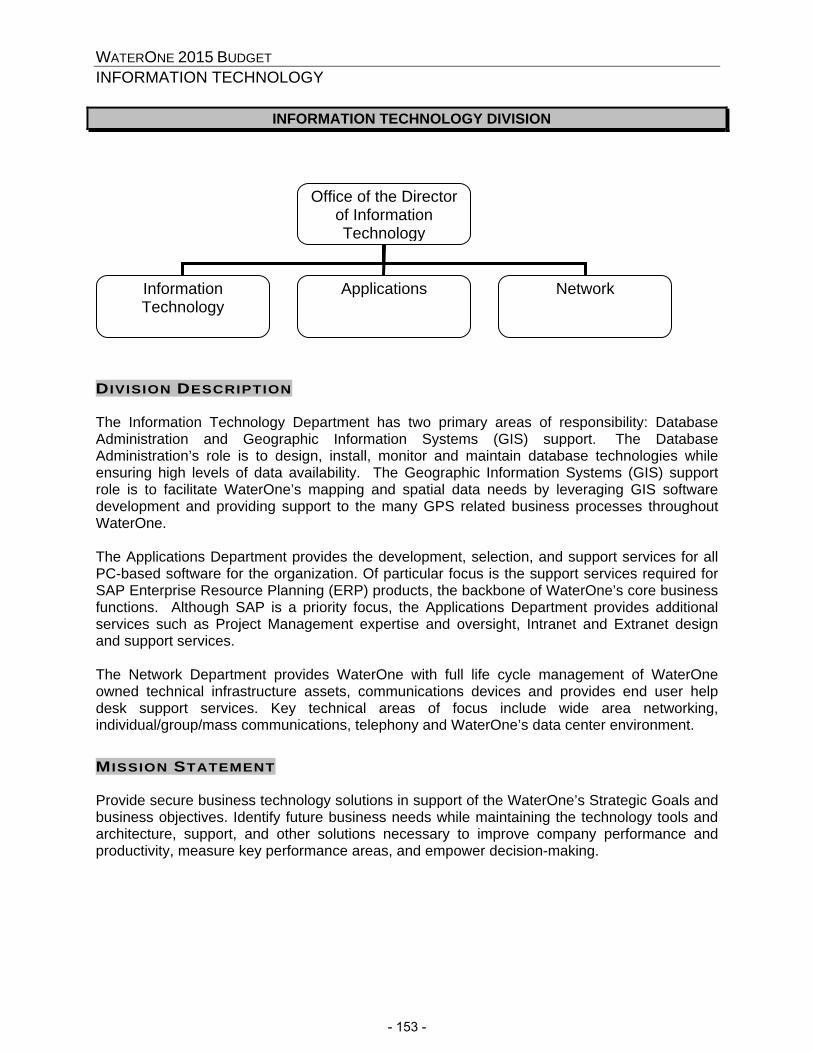
WATERONE 2015 BUDGET INFORMATION TECHNOLOGY
INFORMATION TECHNOLOGY DIVISION
DIVISION DESCRIPTION The Information Technology Department has two primary areas of responsibility: Database Administration and Geographic Information Systems (GIS) support. The Database Administration’s role is to design, install, monitor and maintain database technologies while ensuring high levels of data availability. The Geographic Information Systems (GIS) support role is to facilitate WaterOne’s mapping and spatial data needs by leveraging GIS software development and providing support to the many GPS related business processes throughout WaterOne. The Applications Department provides the development, selection, and support services for all PC-based software for the organization. Of particular focus is the support services required for SAP Enterprise Resource Planning (ERP) products, the backbone of WaterOne’s core business functions. Although SAP is a priority focus, the Applications Department provides additional services such as Project Management expertise and oversight, Intranet and Extranet design and support services. The Network Department provides WaterOne with full life cycle management of WaterOne owned technical infrastructure assets, communications devices and provides end user help desk support services. Key technical areas of focus include wide area networking, individual/group/mass communications, telephony and WaterOne’s data center environment.
MISSION STATEMENT Provide secure business technology solutions in support of the WaterOne’s Strategic Goals and business objectives. Identify future business needs while maintaining the technology tools and architecture, support, and other solutions necessary to improve company performance and productivity, measure key performance areas, and empower decision-making.
Office of the Director of Information Technology
Network Applications Information Technology
- 153 -
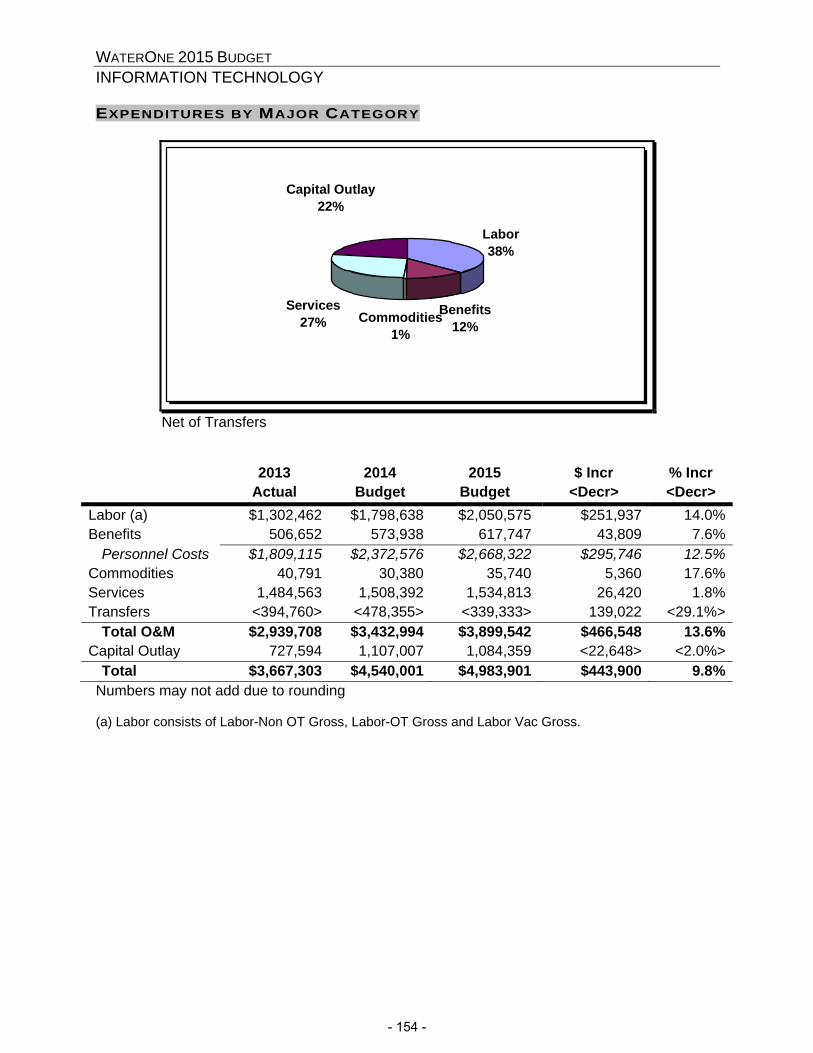
WATERONE 2015 BUDGET INFORMATION TECHNOLOGY EXPENDITURES BY MAJOR CATEGORY
Labor38%
Benefits12%
Capital Outlay22%
Services27% Commodities
1%
Net of Transfers
2013 2014 2015 $ Incr % Incr Actual Budget Budget <Decr> <Decr>
Labor (a) $1,302,462 $1,798,638 $2,050,575 $251,937 14.0%Benefits 506,652 573,938 617,747 43,809 7.6% Personnel Costs $1,809,115 $2,372,576 $2,668,322 $295,746 12.5%Commodities 40,791 30,380 35,740 5,360 17.6%Services 1,484,563 1,508,392 1,534,813 26,420 1.8%Transfers <394,760> <478,355> <339,333> 139,022 <29.1%> Total O&M $2,939,708 $3,432,994 $3,899,542 $466,548 13.6%Capital Outlay 727,594 1,107,007 1,084,359 <22,648> <2.0%> Total $3,667,303 $4,540,001 $4,983,901 $443,900 9.8%Numbers may not add due to rounding (a) Labor consists of Labor-Non OT Gross, Labor-OT Gross and Labor Vac Gross.
- 154 -
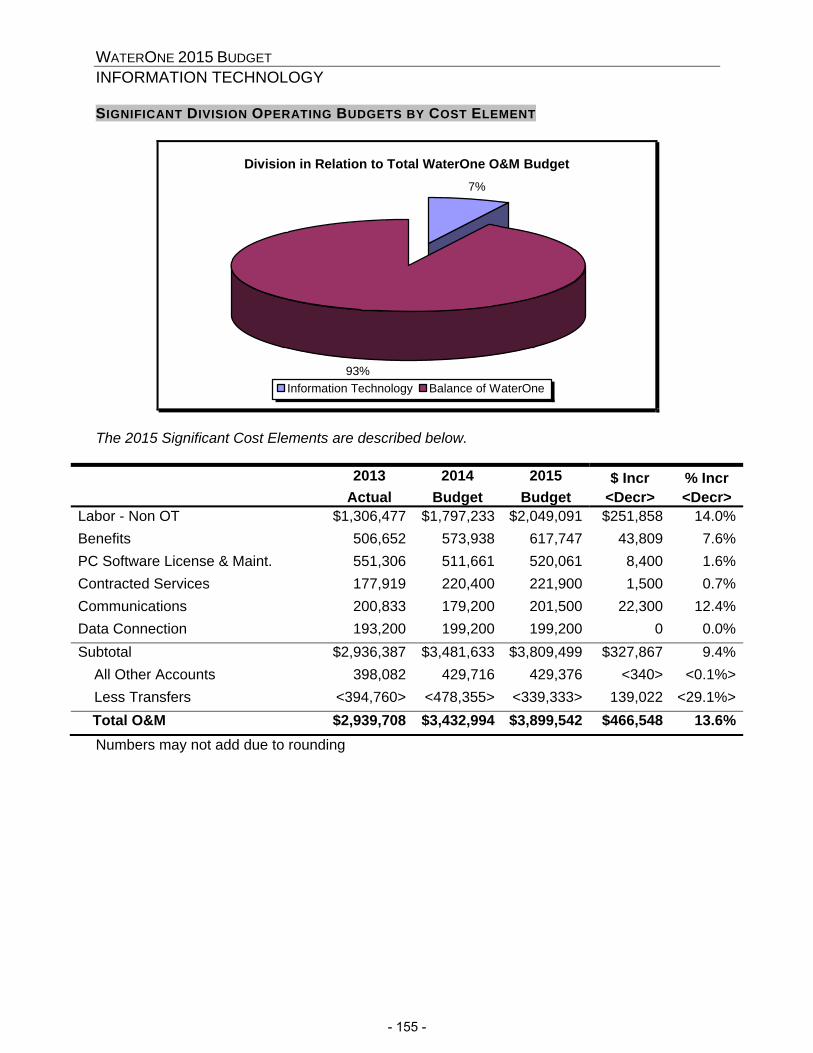
WATERONE 2015 BUDGET INFORMATION TECHNOLOGY SIGNIFICANT DIVISION OPERATING BUDGETS BY COST ELEMENT
Division in Relation to Total WaterOne O&M Budget7%
93%Information Technology Balance of WaterOne
The 2015 Significant Cost Elements are described below.
2013 2014 2015 $ Incr % Incr Actual Budget Budget <Decr> <Decr>
Labor - Non OT $1,306,477 $1,797,233 $2,049,091 $251,858 14.0%Benefits 506,652 573,938 617,747 43,809 7.6%PC Software License & Maint. 551,306 511,661 520,061 8,400 1.6%Contracted Services 177,919 220,400 221,900 1,500 0.7%Communications 200,833 179,200 201,500 22,300 12.4%Data Connection 193,200 199,200 199,200 0 0.0%Subtotal $2,936,387 $3,481,633 $3,809,499 $327,867 9.4% All Other Accounts 398,082 429,716 429,376 <340> <0.1%> Less Transfers <394,760> <478,355> <339,333> 139,022 <29.1%>
Total O&M $2,939,708 $3,432,994 $3,899,542 $466,548 13.6%Numbers may not add due to rounding
- 155 -

WATERONE 2015 BUDGET INFORMATION TECHNOLOGY DIVISION PERSONNEL 2014 + - 2015
Budget Budget
Headcount Full Time 23 2 (a,b) 25 Part Time 0 0 Temporary/Summer 1 1 Total Headcount 24 2 0 26
Total Full Time Equivalents (FTEs) 23.25 2.0 (a,b) 25.25
a) Mid Year 2014 Reclassification - Production relinquished open position to IT to hire unbudgeted position.
b) Budgeted New Position: Systems Engineer - Network Support Gross Labor (Non-Overtime) A 3.5% performance compensation increase is budgeted. Budget includes mid-year 2014 addition of headcount, new 2015 position and part hour adjustments shown in table above. See PERSONNEL tab for more information on budgeted additional personnel. Employee Benefits (Transferred) Benefits are planned in the Human Resources Division and allocated to the divisions. More information on Benefits is located behind the PERSONNEL tab. PC Software License & Maintenance This account covers WaterOne’s software licenses and maintenance on that software. It is divided into two areas. One area experienced a budget increase while the other decreased in 2015 which is described below.
1. PC and Application software: SAP, Microsoft, document management system, virus protection, and miscellaneous software. This portion of the budget has increased primarily due increases in the annual maintenance contracts for SAP and Microsoft.
2. GIS software: GIS, computer aided design, hydraulic modeling software, and
SCADA software. This account decreased slightly in 2015 primarily due to a reduction to the budgeted annual ESRI contract.
- 156 -

WATERONE 2015 BUDGET INFORMATION TECHNOLOGY
Contracted Services Outside vendors are used to provide services that we do not have the resources for or are not cost-effective to complete in-house. WaterOne contracts for various services including backup SAP basis administration support, functional consulting services for SAP, GIS and Microsoft projects, and the Notify JoCo mass notification system. The increase in 2015 is due to an increase to the annual agreement with CyberTech for GIS Support. Communications This account is for the data communication lines needed for the phone system and networks utilized at the Treatment Plants, Administrative Office, and other locations including pump stations, PRV vaults, and telemetry locations throughout the service area. This account has increased in recent years due to the addition of more network locations. The 2015 budget is increasing to reflect increases in the bandwidth required to support additional systems. Data Connection This provides network access between the Administrative Service Center, the Hansen Treatment Plant, and the Wolcott Treatment Plant. The vendor provides fully diverse and redundant connectivity between the three facilities for all data communications, including data mirroring for SAP production data, data backups, and the telephone system.
- 157 -
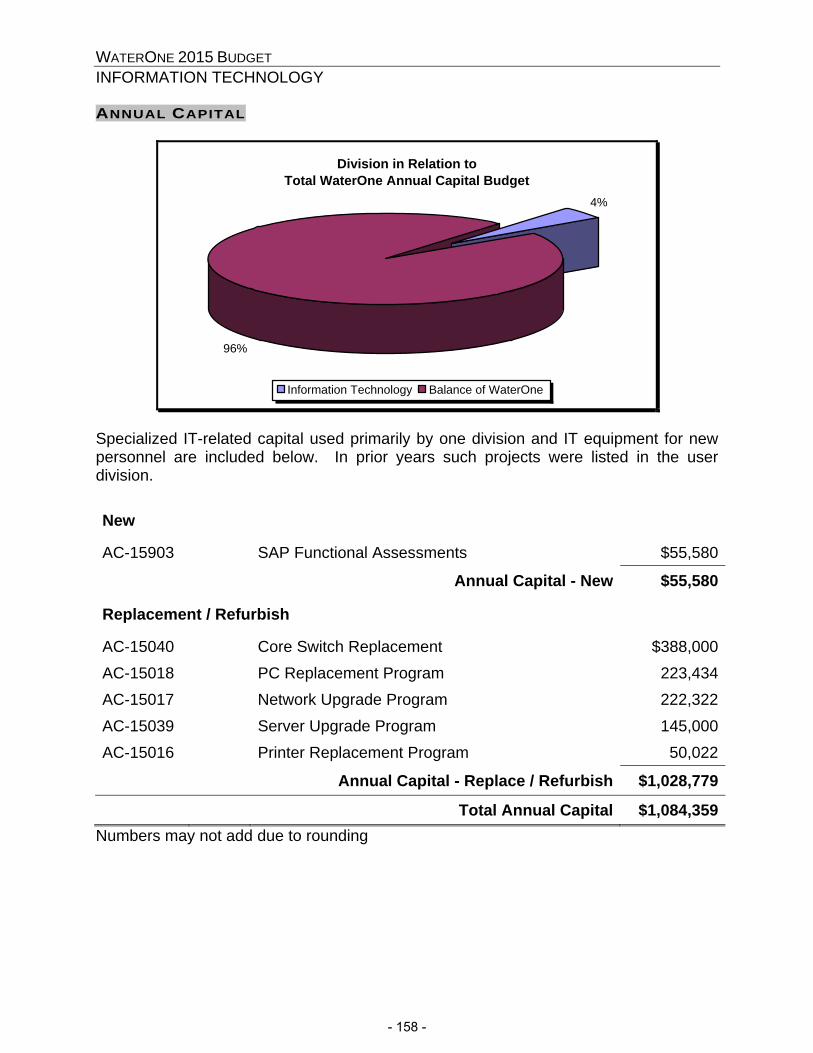
WATERONE 2015 BUDGET INFORMATION TECHNOLOGY ANNUAL CAPITAL
Division in Relation to Total WaterOne Annual Capital Budget
4%
96%
Information Technology Balance of WaterOne
Specialized IT-related capital used primarily by one division and IT equipment for new personnel are included below. In prior years such projects were listed in the user division.
New
AC-15903 SAP Functional Assessments $55,580
Annual Capital - New $55,580
Replacement / Refurbish
AC-15040 Core Switch Replacement $388,000AC-15018 PC Replacement Program 223,434AC-15017 Network Upgrade Program 222,322AC-15039 Server Upgrade Program 145,000AC-15016 Printer Replacement Program 50,022
Annual Capital - Replace / Refurbish $1,028,779
Total Annual Capital $1,084,359Numbers may not add due to rounding
- 158 -

WaterOne 2015 Budget
INFORMATION TECHNOLOGY DIVISIONNew
Project #
AC‐15903
Project Description
SAP Functional Assessments
Justification
There have not been many functional changes applied to the Project Systems, Materials Management, and Supply Chain modules since 2005. In the last several years, internal processes have changed and additional functionality is being requested. A functional assessment of our current SAP configuration for certain processes utilizing these modules will identify configuration changes that WaterOne can make to enhance our business processes. This project will provide a chance to take advantage of additional SAP functionality.
Plan
$55,580
Year
2015
8/28/201411:05:31 AM
- 159 -

WaterOne 2015 Budget
INFORMATION TECHNOLOGY DIVISIONReplace
Project #
AC‐15040
Project Description
Core Switch Replacement
Justification
This project will replace the network core switches located in the Data Center and at the Hansen and Wolcott Treatment plants. The manufacturer of the current equipment will no longer support the equipment in the future. The core switches support all traffic on WaterOne networks. This project will redesign the network to take advantage of newer technology to provide for increased redundancy and greater performance.
Plan
$388,000
Year
2015
Project #
AC‐15018
Project Description
PC Replacement Program
Justification
This program was established to annually provide the necessary funding to replace computers 4 years or older as they become non‐functional or obsolete. This timeframe is aligned with the manufacturer warranty for hardware. The PCs included in this program are all 4 or more years old and are unable to be upgraded or expanded to meet new software performance requirements. The 2015 budget includes: 85 Standard Desktop PC's @ $1,600; 12 Field Laptops @ $2,500; 10 Standard Notebook PC's with desktop option @ $2,600; 10 Tablets @ $900;
Plan
$223,434
Year
2015
10/1/20148:43:28 AM
- 160 -

WaterOne 2015 Budget
INFORMATION TECHNOLOGY DIVISIONReplace
Project #
AC‐15017
Project Description
Network Upgrade Program
Justification
This program provides LAN, WAN, and Telephony and software necessary to support continuing business operations. This program provides for replacement components and normal expansion requirements that support these critical infrastructure components. Additionally, this program provides for miscellaneous software used to monitor and manage the hardware components that make up the network. This critical program is a necessary and recurring component of providing reliable network and telephone services.
Plan
$222,322
Year
2015
Project #
AC‐15039
Project Description
Server Upgrade Program
Justification
This program provides server hardware and software necessary to support continuing business operations. This program provides for servers and server components necessary to replace equipment that is no longer meeting the district's needs or out of warranty and for normal expansion requirements that support the critical infrastructure needs. Additionally, this program provides for miscellaneous software used to monitor and manage the hardware components that make up our server environment. This critical program is a necessary and recurring component of providing reliable computing services. The budget includes: 4 Servers @ $20,000; Server Components $15,000; Storage Upgrades $50,000
Plan
$145,000
Year
2015
10/1/20148:43:30 AM
- 161 -

WaterOne 2015 Budget
INFORMATION TECHNOLOGY DIVISIONReplace
Project #
AC‐15016
Project Description
Printer Replacement Program
Justification
Annual program to replace printers that are technically deficient (one or more functions does not work or has a very high cost of operation due to its age), functionally obsolete (does not meet the needs of the users or applications), or failure critical (may fail at any point and would be prohibitively expensive to repair). Over 15 printers are currently more than 10 years old. Whenever possible, printers are consolidated which reduces the total number of printers supported, however, the new printer may be a more expensive printer to handle the increased demands and to provide greater functionality. The 2015 budget includes 8 Black & White Laserjet printers @ $1,000; 1 Color Laserjet @ $2,000; 1 Plotter @ $20,000; 3 Multi‐Function Printers @ $10,000.
Plan
$50,022
Year
2015
8/28/201411:05:37 AM
- 162 -

WATERONE 2015 BUDGET DEBT FUNDING
h:\finance\finshare\1budget\2015 budget\board budget draft\17-debt funding\debtservtxt2015.docx 9:00 AM 8/20/2014
DEBT SERVICE
In 2015, WaterOne will be responsible for paying the debt service on the outstanding Senior Parity Bonds (Series 2007), and the Second Lien Parity Bonds (Series 2009, 2010, 2012 and 2014.) WaterOne’s objective is to structure the composite debt service to be approximately level on a year to year basis, to avoid significant roller-coaster types of increases and decreases in debt service and the related instability of water rates. Structured into the level debt service is an allowance for later years to blend in new debt while minimizing abrupt changes in total annual debt service. WaterOne’s general practice is to realize savings from bond refinancing so as to keep debt service level from year to year rather than obtain large up front savings where debt service will be lowered one year and then rebound up to previous levels, thus causing instability in water rates.
Total Debt Service
0.0
5.0
10.0
15.0
20.0
25.0
30.0
In M
illio
ns
2014 Issue 2012 Issue 2010 Issue 2009 Issue 2007 Issue
- 163 -
WATERONE 2015 BUDGET DEBT FUNDING
h:\finance\finshare\1budget\2015 budget\board budget draft\17-debt funding\debtservtxt2015.docx 11:01 AM 8/27/2014
Below is a brief description and history of each outstanding bond issue. The pages subsequent to these descriptions contain tables which depict three important areas of statistics involving bonds; debt service by year for each issue, and outstanding bonds as of the beginning of each year.
Water Revenue Bonds, Series 2007 The 2007 Series Bonds were issued on April 1, 2007 for the purpose of funding Master Plan projects which included a new Treatment Plant on the Missouri River and the associated distribution system necessary to deliver an additional 30 million gallons a day (mgd) of capacity.
Original Amount of Bonds issued $180,245,000 Outstanding Bonds on Jan. 1, 2015 155,780,000 Debt Service Requirement for 2015 15,753,426 Funding for Principal to be Retired in 2015 9,090,000 True Interest Cost (TIC) at time of original 2007 bond issue 4.1531961%
Water Revenue Refunding Bonds, Series 2009 The 2009 Series Bonds were issued on September 30, 2009 for the purpose of refunding $26,930,000 of the 1996A, 1999, and 2000 Series Bonds. The 2009 refunding resulted in a savings of approximately $2.6 million over 12 years.
Original Amount of Bonds issued $26,190,000 Outstanding Bonds on Jan. 1, 2015 10,550,000 Debt Service Requirement for 2015 3,398,563 Funding for Principal to be Retired in 2015 3,085,000 True Interest Cost (TIC) at time of original 2009 bond issue 2.2643484%
Water Revenue Bonds, Series 2010 The 2010 Series Bonds were issued on July 1, 2010 for the purpose of providing funds to pay the cost of making certain capital improvements to the water system, to pay the cost of issuance of the Series 2010 Bonds, to provide funds for capitalized interest and to fund the 2010 Bond Reserve.
Original Amount of Bonds issued $28,890,000 Outstanding Bonds on Jan. 1, 2015 27,465,000 Debt Service Requirement for 2015 1,648,388 Funding for Principal to be Retired in 2015 570,000 True Interest Cost (TIC) at time of original 2010 bond issue 3.674516%
- 164 -
WATERONE 2015 BUDGET DEBT FUNDING
h:\finance\finshare\1budget\2015 budget\board budget draft\17-debt funding\debtservtxt2015.docx 9:00 AM 8/20/2014
Water Revenue Refunding Bonds, Series 2012 The 2012 Series Bonds were issued on November 1, 2012 for the purpose of refunding $7,195,000 of the 2002 Series Bonds. The 2012 refunding resulted in a savings of approximately $967,000 over 7 years.
Original Amount of Bonds issued $6,605,000 Outstanding Bonds on Jan. 1, 2015 4,765,000 Debt Service Requirement for 2015 1,624,125 Funding for Principal to be Retired in 2015 1,545,000 True Interest Cost (TIC) at time of original 2012 bond issue 0.918858%
Water Revenue Bonds, Series 2014 The 2014 Series Bonds were issued on February 11, 2014 for the purpose of providing funds to pay the cost of making certain capital improvements to the water system, to pay the cost of issuance of the Series 2014 Bonds, to provide funds for capitalized interest and to fund the 2014 Bond Reserve
Original Amount of Bonds issued $86,350,000 Outstanding Bonds on Jan. 1, 2015 86,150,000 Debt Service Requirement for 2015 200,000 Funding for Principal to be Retired in 2015 200,000 True Interest Cost (TIC) at time of original 2014 bond issue 3.449549%
- 165 -
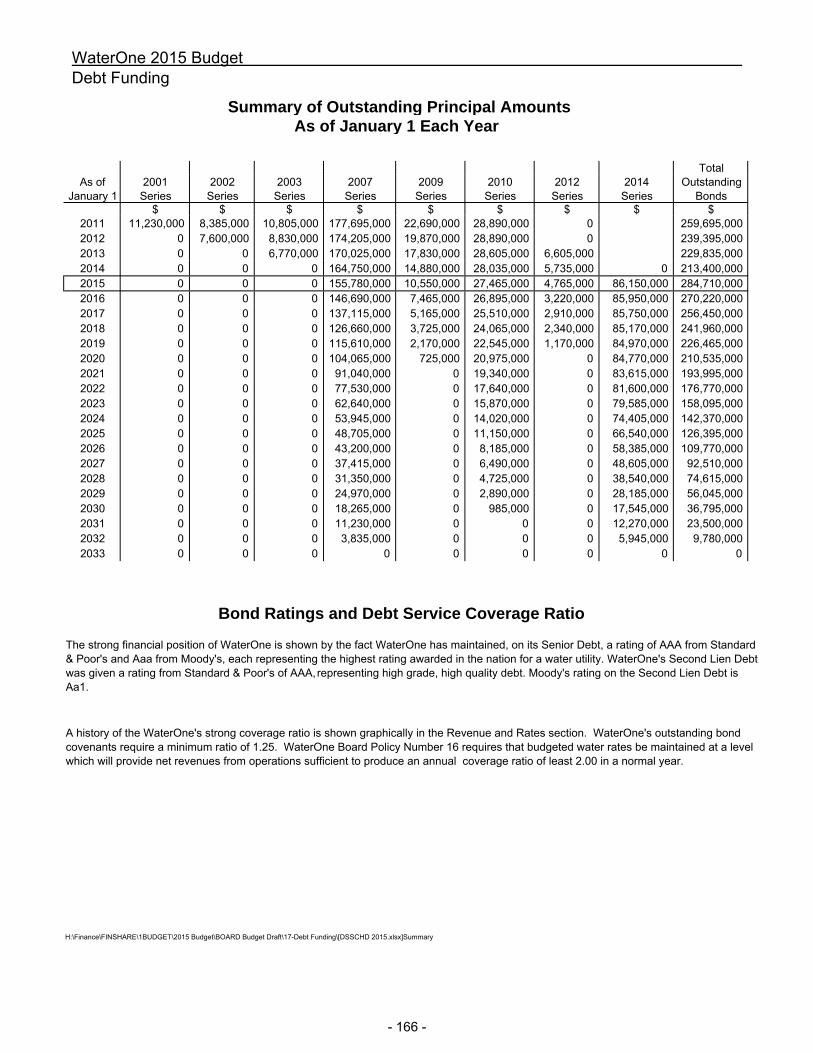
WaterOne 2015 Budget Debt Funding
TotalAs of 2001 2002 2003 2007 2009 2010 2012 2014 Outstanding
January 1 Series Series Series Series Series Series Series Series Bonds$ $ $ $ $ $ $ $ $
2011 11,230,000 8,385,000 10,805,000 177,695,000 22,690,000 28,890,000 0 259,695,0002012 0 7,600,000 8,830,000 174,205,000 19,870,000 28,890,000 0 239,395,0002013 0 0 6,770,000 170,025,000 17,830,000 28,605,000 6,605,000 229,835,0002014 0 0 0 164,750,000 14,880,000 28,035,000 5,735,000 0 213,400,0002015 0 0 0 155,780,000 10,550,000 27,465,000 4,765,000 86,150,000 284,710,0002016 0 0 0 146,690,000 7,465,000 26,895,000 3,220,000 85,950,000 270,220,0002017 0 0 0 137,115,000 5,165,000 25,510,000 2,910,000 85,750,000 256,450,0002018 0 0 0 126,660,000 3,725,000 24,065,000 2,340,000 85,170,000 241,960,0002019 0 0 0 115,610,000 2,170,000 22,545,000 1,170,000 84,970,000 226,465,0002020 0 0 0 104,065,000 725,000 20,975,000 0 84,770,000 210,535,0002021 0 0 0 91,040,000 0 19,340,000 0 83,615,000 193,995,0002022 0 0 0 77,530,000 0 17,640,000 0 81,600,000 176,770,0002023 0 0 0 62,640,000 0 15,870,000 0 79,585,000 158,095,0002024 0 0 0 53,945,000 0 14,020,000 0 74,405,000 142,370,0002025 0 0 0 48,705,000 0 11,150,000 0 66,540,000 126,395,0002026 0 0 0 43,200,000 0 8,185,000 0 58,385,000 109,770,0002027 0 0 0 37,415,000 0 6,490,000 0 48,605,000 92,510,0002028 0 0 0 31,350,000 0 4,725,000 0 38,540,000 74,615,0002029 0 0 0 24,970,000 0 2,890,000 0 28,185,000 56,045,0002030 0 0 0 18,265,000 0 985,000 0 17,545,000 36,795,0002031 0 0 0 11,230,000 0 0 0 12,270,000 23,500,0002032 0 0 0 3,835,000 0 0 0 5,945,000 9,780,0002033 0 0 0 0 0 0 0 0 0
H:\Finance\FINSHARE\1BUDGET\2015 Budget\BOARD Budget Draft\17-Debt Funding\[DSSCHD 2015.xlsx]Summary
A history of the WaterOne's strong coverage ratio is shown graphically in the Revenue and Rates section. WaterOne's outstanding bond covenants require a minimum ratio of 1.25. WaterOne Board Policy Number 16 requires that budgeted water rates be maintained at a level which will provide net revenues from operations sufficient to produce an annual coverage ratio of least 2.00 in a normal year.
The strong financial position of WaterOne is shown by the fact WaterOne has maintained, on its Senior Debt, a rating of AAA from Standard & Poor's and Aaa from Moody's, each representing the highest rating awarded in the nation for a water utility. WaterOne's Second Lien Debt was given a rating from Standard & Poor's of AAA, representing high grade, high quality debt. Moody's rating on the Second Lien Debt is Aa1.
Bond Ratings and Debt Service Coverage Ratio
Summary of Outstanding Principal Amounts As of January 1 Each Year
- 166 -
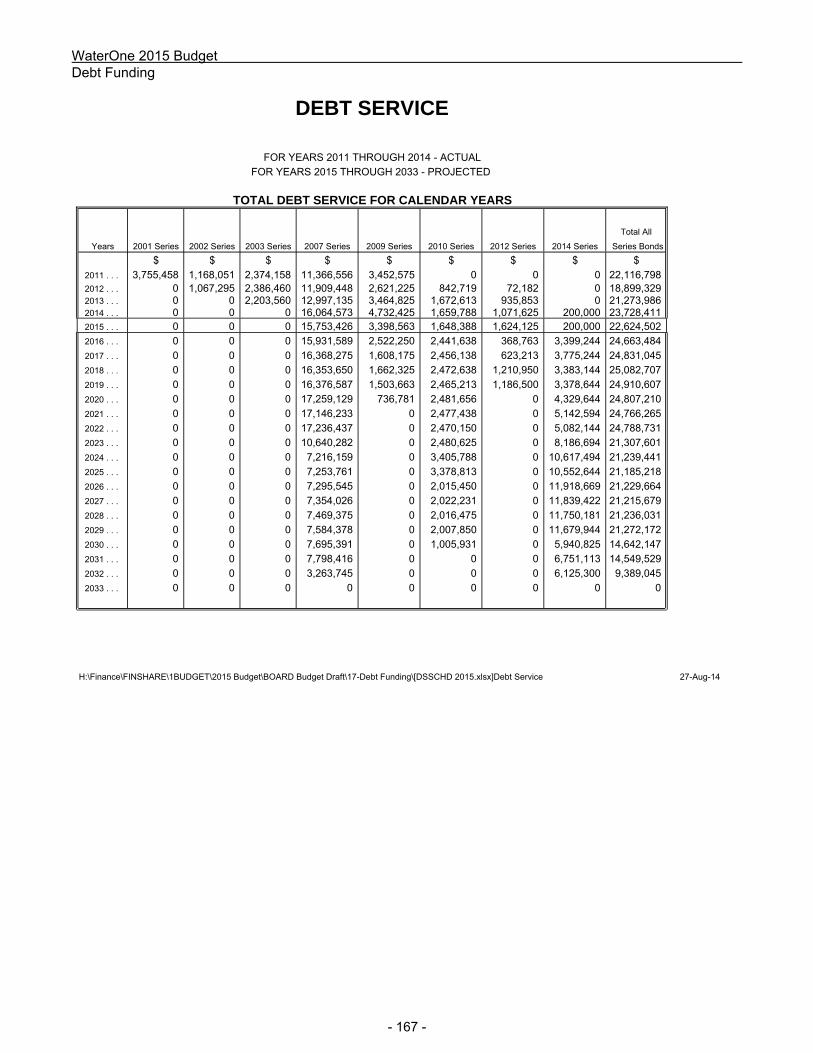
WaterOne 2015 Budget Debt Funding
Total All
Years 2001 Series 2002 Series 2003 Series 2007 Series 2009 Series 2010 Series 2012 Series 2014 Series Series Bonds
$ $ $ $ $ $ $ $ $
2011 . . . 3,755,458 1,168,051 2,374,158 11,366,556 3,452,575 0 0 0 22,116,7982012 . . . 0 1,067,295 2,386,460 11,909,448 2,621,225 842,719 72,182 0 18,899,3292013 . . . 0 0 2,203,560 12,997,135 3,464,825 1,672,613 935,853 0 21,273,9862014 . . . 0 0 0 16,064,573 4,732,425 1,659,788 1,071,625 200,000 23,728,4112015 . . . 0 0 0 15,753,426 3,398,563 1,648,388 1,624,125 200,000 22,624,502
2016 . . . 0 0 0 15,931,589 2,522,250 2,441,638 368,763 3,399,244 24,663,484
2017 . . . 0 0 0 16,368,275 1,608,175 2,456,138 623,213 3,775,244 24,831,045
2018 . . . 0 0 0 16,353,650 1,662,325 2,472,638 1,210,950 3,383,144 25,082,707
2019 . . . 0 0 0 16,376,587 1,503,663 2,465,213 1,186,500 3,378,644 24,910,607
2020 . . . 0 0 0 17,259,129 736,781 2,481,656 0 4,329,644 24,807,210
2021 . . . 0 0 0 17,146,233 0 2,477,438 0 5,142,594 24,766,265
2022 . . . 0 0 0 17,236,437 0 2,470,150 0 5,082,144 24,788,731
2023 . . . 0 0 0 10,640,282 0 2,480,625 0 8,186,694 21,307,601
2024 . . . 0 0 0 7,216,159 0 3,405,788 0 10,617,494 21,239,441
2025 . . . 0 0 0 7,253,761 0 3,378,813 0 10,552,644 21,185,218
2026 . . . 0 0 0 7,295,545 0 2,015,450 0 11,918,669 21,229,664
2027 . . . 0 0 0 7,354,026 0 2,022,231 0 11,839,422 21,215,679
2028 . . . 0 0 0 7,469,375 0 2,016,475 0 11,750,181 21,236,031
2029 . . . 0 0 0 7,584,378 0 2,007,850 0 11,679,944 21,272,172
2030 . . . 0 0 0 7,695,391 0 1,005,931 0 5,940,825 14,642,147
2031 . . . 0 0 0 7,798,416 0 0 0 6,751,113 14,549,529
2032 . . . 0 0 0 3,263,745 0 0 0 6,125,300 9,389,045
2033 . . . 0 0 0 0 0 0 0 0 0
H:\Finance\FINSHARE\1BUDGET\2015 Budget\BOARD Budget Draft\17-Debt Funding\[DSSCHD 2015.xlsx]Debt Service 27-Aug-14
DEBT SERVICE
FOR YEARS 2011 THROUGH 2014 - ACTUAL
FOR YEARS 2015 THROUGH 2033 - PROJECTED
TOTAL DEBT SERVICE FOR CALENDAR YEARS
- 167 -
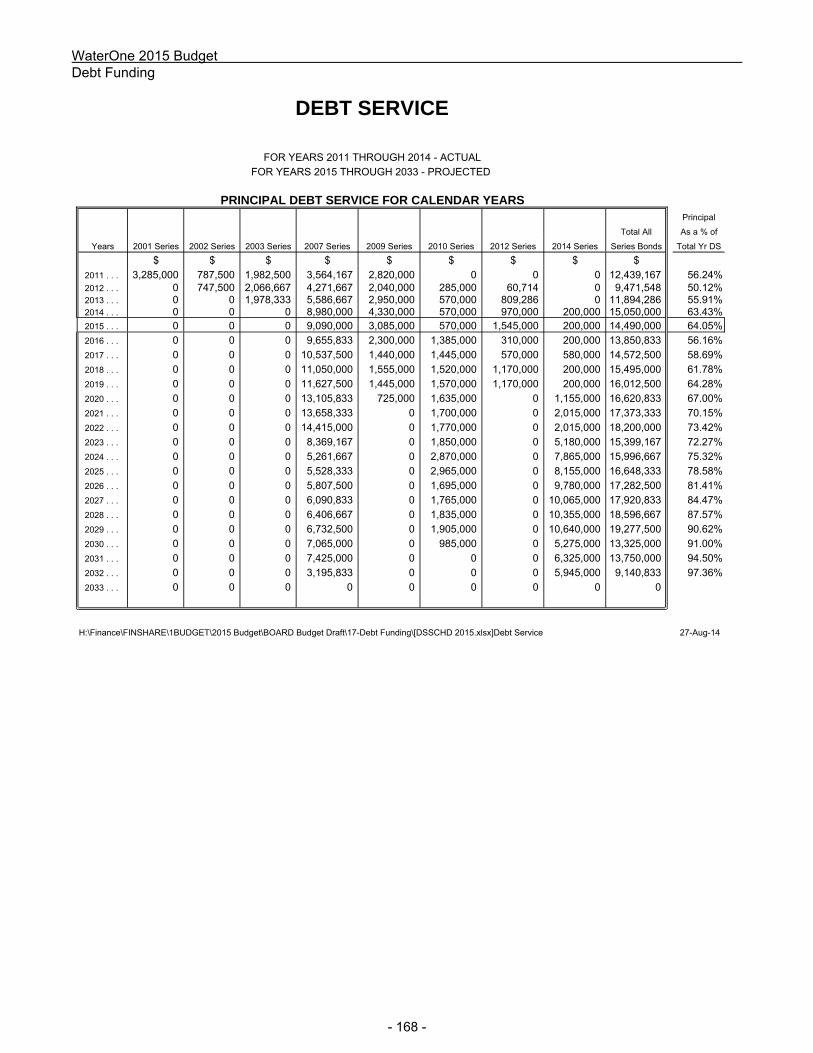
WaterOne 2015 Budget Debt Funding
DEBT SERVICE
FOR YEARS 2011 THROUGH 2014 - ACTUAL
FOR YEARS 2015 THROUGH 2033 - PROJECTED
Principal
Total All As a % of
Years 2001 Series 2002 Series 2003 Series 2007 Series 2009 Series 2010 Series 2012 Series 2014 Series Series Bonds Total Yr DS
$ $ $ $ $ $ $ $ $
2011 . . . 3,285,000 787,500 1,982,500 3,564,167 2,820,000 0 0 0 12,439,167 56.24%2012 . . . 0 747,500 2,066,667 4,271,667 2,040,000 285,000 60,714 0 9,471,548 50.12%2013 . . . 0 0 1,978,333 5,586,667 2,950,000 570,000 809,286 0 11,894,286 55.91%2014 . . . 0 0 0 8,980,000 4,330,000 570,000 970,000 200,000 15,050,000 63.43%2015 . . . 0 0 0 9,090,000 3,085,000 570,000 1,545,000 200,000 14,490,000 64.05%
2016 . . . 0 0 0 9,655,833 2,300,000 1,385,000 310,000 200,000 13,850,833 56.16%
2017 . . . 0 0 0 10,537,500 1,440,000 1,445,000 570,000 580,000 14,572,500 58.69%
2018 . . . 0 0 0 11,050,000 1,555,000 1,520,000 1,170,000 200,000 15,495,000 61.78%
2019 . . . 0 0 0 11,627,500 1,445,000 1,570,000 1,170,000 200,000 16,012,500 64.28%
2020 . . . 0 0 0 13,105,833 725,000 1,635,000 0 1,155,000 16,620,833 67.00%
2021 . . . 0 0 0 13,658,333 0 1,700,000 0 2,015,000 17,373,333 70.15%
2022 . . . 0 0 0 14,415,000 0 1,770,000 0 2,015,000 18,200,000 73.42%
2023 . . . 0 0 0 8,369,167 0 1,850,000 0 5,180,000 15,399,167 72.27%
2024 . . . 0 0 0 5,261,667 0 2,870,000 0 7,865,000 15,996,667 75.32%
2025 . . . 0 0 0 5,528,333 0 2,965,000 0 8,155,000 16,648,333 78.58%
2026 . . . 0 0 0 5,807,500 0 1,695,000 0 9,780,000 17,282,500 81.41%
2027 . . . 0 0 0 6,090,833 0 1,765,000 0 10,065,000 17,920,833 84.47%
2028 . . . 0 0 0 6,406,667 0 1,835,000 0 10,355,000 18,596,667 87.57%
2029 . . . 0 0 0 6,732,500 0 1,905,000 0 10,640,000 19,277,500 90.62%
2030 . . . 0 0 0 7,065,000 0 985,000 0 5,275,000 13,325,000 91.00%
2031 . . . 0 0 0 7,425,000 0 0 0 6,325,000 13,750,000 94.50%
2032 . . . 0 0 0 3,195,833 0 0 0 5,945,000 9,140,833 97.36%
2033 . . . 0 0 0 0 0 0 0 0 0
H:\Finance\FINSHARE\1BUDGET\2015 Budget\BOARD Budget Draft\17-Debt Funding\[DSSCHD 2015.xlsx]Debt Service 27-Aug-14
PRINCIPAL DEBT SERVICE FOR CALENDAR YEARS
- 168 -

WaterOne 2015 Budget Debt Funding
DEBT SERVICE
FOR YEARS 2011 THROUGH 2014 - ACTUAL
FOR YEARS 2015 THROUGH 2033 - PROJECTED
Interest
Total All As a % of
Years 2001 Series 2002 Series 2003 Series 2007 Series 2009 Series 2010 Series* 2012 Series 2014 Series** Series Bonds Total Yr DS
$ $ $ $ $ $ $ $ $
2011 . . . 470,458 380,551 391,658 7,802,389 632,575 0 0 0 9,677,632 43.76%2012 . . . 0 319,795 319,794 7,637,781 581,225 557,719 11,467 0 9,427,781 49.88%2013 . . . 0 0 225,227 7,410,468 514,825 1,102,613 126,567 0 9,379,699 44.09%2014 . . . 0 0 0 7,084,573 402,425 1,089,788 101,625 0 8,678,410 36.57%2015 . . . 0 0 0 6,663,426 313,563 1,078,388 79,125 0 8,134,501 35.95%
2016 . . . 0 0 0 6,275,755 222,250 1,056,638 58,763 3,199,244 10,812,649 43.84%
2017 . . . 0 0 0 5,830,775 168,175 1,011,138 53,213 3,195,244 10,258,543 41.31%
2018 . . . 0 0 0 5,303,650 107,325 952,638 40,950 3,183,144 9,587,706 38.22%
2019 . . . 0 0 0 4,749,087 58,663 895,213 16,500 3,178,644 8,898,106 35.72%
2020 . . . 0 0 0 4,153,295 11,781 846,656 0 3,174,644 8,186,377 33.00%
2021 . . . 0 0 0 3,487,900 0 777,438 0 3,127,594 7,392,931 29.85%
2022 . . . 0 0 0 2,821,437 0 700,150 0 3,067,144 6,588,731 26.58%
2023 . . . 0 0 0 2,271,115 0 630,625 0 3,006,694 5,908,434 27.73%
2024 . . . 0 0 0 1,954,492 0 535,788 0 2,752,494 5,242,773 24.68%
2025 . . . 0 0 0 1,725,428 0 413,813 0 2,397,644 4,536,884 21.42%
2026 . . . 0 0 0 1,488,045 0 320,450 0 2,138,669 3,947,164 18.59%
2027 . . . 0 0 0 1,263,193 0 257,231 0 1,774,422 3,294,846 15.53%
2028 . . . 0 0 0 1,062,708 0 181,475 0 1,395,181 2,639,365 12.43%
2029 . . . 0 0 0 851,878 0 102,850 0 1,039,944 1,994,672 9.38%
2030 . . . 0 0 0 630,391 0 20,931 0 665,825 1,317,147 9.00%
2031 . . . 0 0 0 373,416 0 0 0 426,113 799,528 5.50%
2032 . . . 0 0 0 67,911 0 0 0 180,300 248,211 2.64%
2033 . . . 0 0 0 0 0 0 0 0 0
* The 2010 Bonds had capitalized interest for years 2011 and 2012. This interest is not included.
** The 2014 Bonds had capitalized interest for years 2014 and 2015. This interest is not included.
H:\Finance\FINSHARE\1BUDGET\2015 Budget\BOARD Budget Draft\17-Debt Funding\[DSSCHD 2015.xlsx]Debt Service 27-Aug-14
INTEREST DEBT SERVICE FOR CALENDAR YEARS
- 169 -

This page intentionally left blank.
- 170 -
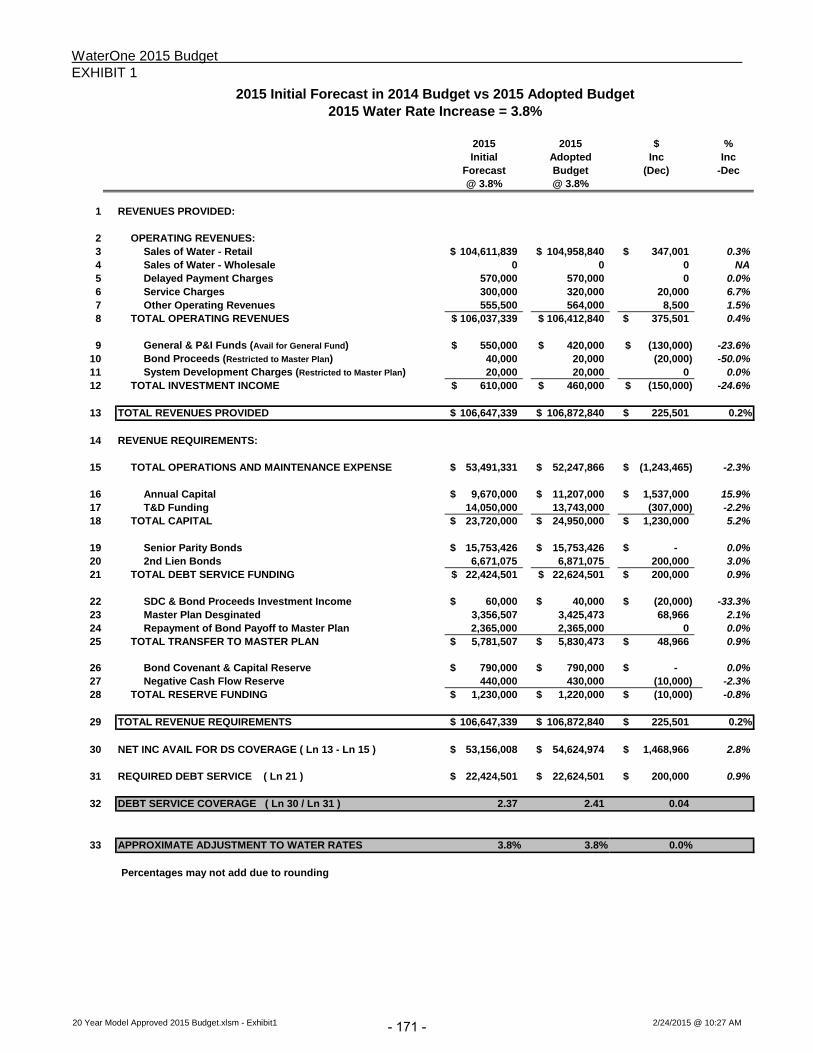
WaterOne 2015 Budget EXHIBIT 1
2015 Initial Forecast in 2014 Budget vs 2015 Adopted Budget2015 Water Rate Increase = 3.8%
2015 2015 $ %Initial Adopted Inc Inc
Forecast Budget (Dec) -Dec@ 3.8% @ 3.8%
1 REVENUES PROVIDED:
2 OPERATING REVENUES:3 Sales of Water - Retail 104,611,839$ 104,958,840$ 347,001$ 0.3%4 Sales of Water - Wholesale 0 0 0 NA5 Delayed Payment Charges 570,000 570,000 0 0.0%6 Service Charges 300,000 320,000 20,000 6.7%7 Other Operating Revenues 555,500 564,000 8,500 1.5%8 TOTAL OPERATING REVENUES 106,037,339$ 106,412,840$ 375,501$ 0.4%
9 General & P&I Funds (Avail for General Fund) 550,000$ 420,000$ (130,000)$ -23.6%10 Bond Proceeds (Restricted to Master Plan) 40,000 20,000 (20,000) -50.0%11 System Development Charges (Restricted to Master Plan) 20,000 20,000 0 0.0%12 TOTAL INVESTMENT INCOME 610,000$ 460,000$ (150,000)$ -24.6%
13 TOTAL REVENUES PROVIDED 106,647,339$ 106,872,840$ 225,501$ 0.2%
14 REVENUE REQUIREMENTS:
15 TOTAL OPERATIONS AND MAINTENANCE EXPENSE 53,491,331$ 52,247,866$ (1,243,465)$ -2.3%
16 Annual Capital 9,670,000$ 11,207,000$ 1,537,000$ 15.9%17 T&D Funding 14,050,000 13,743,000 (307,000) -2.2%18 TOTAL CAPITAL 23,720,000$ 24,950,000$ 1,230,000$ 5.2%
19 Senior Parity Bonds 15,753,426$ 15,753,426$ -$ 0.0%20 2nd Lien Bonds 6,671,075 6,871,075 200,000 3.0%21 TOTAL DEBT SERVICE FUNDING 22,424,501$ 22,624,501$ 200,000$ 0.9%
22 SDC & Bond Proceeds Investment Income 60,000$ 40,000$ (20,000)$ -33.3%23 Master Plan Desginated 3,356,507 3,425,473 68,966 2.1%24 Repayment of Bond Payoff to Master Plan 2,365,000 2,365,000 0 0.0%25 TOTAL TRANSFER TO MASTER PLAN 5,781,507$ 5,830,473$ 48,966$ 0.9%
26 Bond Covenant & Capital Reserve 790,000$ 790,000$ -$ 0.0%27 Negative Cash Flow Reserve 440,000 430,000 (10,000) -2.3%28 TOTAL RESERVE FUNDING 1,230,000$ 1,220,000$ (10,000)$ -0.8%
29 TOTAL REVENUE REQUIREMENTS 106,647,339$ 106,872,840$ 225,501$ 0.2%
30 NET INC AVAIL FOR DS COVERAGE ( Ln 13 - Ln 15 ) 53,156,008$ 54,624,974$ 1,468,966$ 2.8%
31 REQUIRED DEBT SERVICE ( Ln 21 ) 22,424,501$ 22,624,501$ 200,000$ 0.9%
32 DEBT SERVICE COVERAGE ( Ln 30 / Ln 31 ) 2.37 2.41 0.04
33 APPROXIMATE ADJUSTMENT TO WATER RATES 3.8% 3.8% 0.0%
Percentages may not add due to rounding
20 Year Model Approved 2015 Budget.xlsm - Exhibit1 2/24/2015 @ 10:27 AM- 171 -

WaterOne 2015 Budget EXHIBIT 2
ADDITIONAL REVENUE REQUIREMENTS FOR 2015Based on a 3.8% rate increase
2014 2015 $ ADOPTED ADOPTED Inc BUDGET BUDGET (Dec)
CHANGES IN REVENUE REQUIREMENTS:
1 INCREASED OPERATIONS & MAINTENANCE EXPENSES: 50,424,719$ 52,247,866$ 1,823,147$ Gross Payroll (Includes Overtime) 812,202$ 3.4%Health 297,249$ 7.7%Chemicals 243,333$ 4.2%Power 211,898$ 2.7%Pension DB & DC (367,169)$ -9.2%Other 625,634$ 5.3%
2 INCREASED CAPITAL: 22,030,000$ 24,950,000$ 2,920,000$ Annual Capital 2,351,000$ T&D Funding 569,000$
3 DECREASED DEBT SERVICE FUNDING: 23,528,410$ 22,624,501$ (903,909)$
4 INCREASED FUNDING TO REQUIRED RESERVES: 1,140,000$ 1,220,000$ 80,000$ Bond Covenant and Contingency Reserves 70,000$ Negative Cash Flow 10,000$
5 INCREASED TRANSFERS TO MASTER PLAN: 5,069,690$ 5,830,473$ 760,783$ SDC & Bond Proceeds Investment Income (120,000)$ Master Plan Designated 765,783$ Repayment of Bond Payoff to Master Plan 115,000$
6 TOTAL INCREASE IN REVENUE REQUIREMENTS 102,192,819$ 106,872,840$ 4,680,021$
CHANGES IN REVENUES AVAILABLE:
7 INCREASED INVESTMENT INCOME: 430,000$ 460,000$ 30,000$ General Fund Investment Income 150,000$ SDC & Bond Proceeds Investment Income (120,000)$
8 INCREASED REVENUE FROM OTHER OPER REVENUE: 1,415,500$ 1,454,000$ 38,500$
9 DECREASED REVENUE FROM REVENUE ADJUSTMENTS: -$ (186,900)$ (186,900)$ Lower R1 Gallons per Customer (448,529)$ 1% reductionLower M1, C1 Gallons and Allocations (102,885)$ 1 year adjustmentTrue-up of 2013 Actual Customers 301,381$ Annual adjustmentTrue-up of 2014 Estimated Actual Customers 167,014$ Annual adjustmentTrue-up of Meter Size Mix for Classes (103,881)$ Annual adjustment
10 INCREASED REVENUE FROM 2015 NEW CUSTOMERS @ 2014 RATES: -$ 915,837$ 915,837$
11 TOTAL INCREASE IN REVENUES AVAILABLE 1,845,500$ 2,642,937$ 797,437$
Rate Adjustment12 ADJUSTMENT TO WATER RATES IN 2015 (Line #6 - #11) 3.8% 3,882,584$
20 Year Model Approved 2015 Budget.xlsm - Exhibit2 2/24/2015 at 10:27 AM- 172 -

WaterOne 2015 Budget EXHIBIT 3
Summary of Budgeted Gallons and Revenue by Customer Typeand
Customer Growth by Customer Type with SDC Revenue
(A) (B) (C) (D) (E) (F) (G) (H) (I) (J)% %
Budgeted Avg Annual Budgeted Budgeted Budgeted Budgeted Budgeted Volume Service Average Gallons Total Block 1 Block 2 Volume Charge Service Charge Charge Charge
Customer Type Customers Per Cust 1,000 Gals Gallons Gallons Revenue Revenue Revenue Revenue(B x C) (G/ (G+H) (H/ (G+H)
1 Residential (R1) 130,165 90,300 11,753,900 9,461,889 2,292,010 48,702,283$ 18,052,424$ 73% 27%2 Multi Family (M1) 4,493 460,800 2,070,374 1,821,930 248,445 8,376,735 1,781,087 82% 18%3 Small Commercial (C1) 4,950 217,000 1,074,150 708,939 365,211 4,653,218 1,121,911 81% 19%4 Large Commercial (C2) 3,073 1,504,811 4,624,284 3,436,406 1,187,878 19,532,705 2,427,246 89% 11%
5 Subtotal 142,681 136,828 19,522,708 15,429,164 4,093,544 81,264,941$ 23,382,668$ 78% 22%
6 Temp. Commercial (C3) 184 133,500 24,564 10,332 14,232 114,056$ 197,174$ 37% 63%
7 Total Retail 142,865 136,823 19,547,272 15,439,495 4,107,777 81,378,998$ 23,579,842$ 78% 22%"Per Customer" shown in whole gallons.
(G+H)
Total Water Sales Revenue $104,958,840
Block 1 Rate $3.89Block 2 Rate $5.19
per 1,000 gallons
CUSTOMER GROWTH SDC's2014 2014 2015 2015 2015
Customer Type Budget Est. Actual Budget Rate Budget8 Residential (R1) 912 1,192 1,185 $4,855 $5,753,1759 Multi Family (M1) 33 33 40 $4,855 $194,200
10 Small Commercial (C1) 32 52 45 $4,855 $218,47511 Large Commercial (C2) 23 23 30 $4,855 $145,65012 TOTAL 1,000 1,300 1,300 $6,311,500
20 Year Model Approved 2015 Budget.xlsm - Exhibit3 2/24/2015 at 10:30 AM- 173 -

WaterOne 2015 Budget EXHIBIT 4
CUSTOMER & WATER SALES STATISTICSADOPTED 2014 BUDGET COMPARED TO ADOPTED 2015 BUDGET
ADOPTED 2014 BUDGET ADOPTED 2015 BUDGET
Per Average Per Average1,000 Per % 1,000 Per
Amount Gal Customer Amount Inc Gal Customer
1 RESIDENTIAL - SINGLE FAMILY (R1):2 Average Customers Served 128,513 130,165 1.3%3 % of Total Customers Served 91.13 91.114 Thousand Gallons Sold 11,720,385.6 91,200 11,753,899.5 0.3% 90,3005 % of Total Gallons Sold 60.4% 60.1%6 Service Charge Revenue 16,902,145$ 1.44$ 131.52$ 18,052,424$ 6.8% 1.54$ 138.69$ 7 Volume Charge Revenue 47,080,271 4.02 366.35 48,702,283 3.5% 4.14 374.16 8 Total Water Sales Revenue 63,982,416$ 5.46$ 497.87$ 66,754,707$ 4.3% 5.68$ 512.85$ 9 % of Volume Water Sales 60.26% 59.85%
10 % of Total Water Sales 63.76% 63.60%
11 RESIDENTIAL - MULTI-FAMILY (M1):12 Average Customers Served 4,438 4,493 1.2%13 % of Total Customers Served 3.15 3.1414 Thousand Gallons Sold 2,058,344.4 463,800 2,070,374.4 0.6% 460,80015 % of Total Gallons Sold 10.6% 10.6%16 Service Charge Revenue 1,670,654$ 0.81$ 376.44$ 1,781,087$ 6.6% 0.86$ 396.41$ 17 Volume Charge Revenue 8,050,597 3.91 1,814.01 8,376,735 4.1% 4.05 1,864.40 18 Total Water Sales Revenue 9,721,251$ 4.72$ 2,190.46$ 10,157,822$ 4.5% 4.91$ 2,260.81$ 19 % of Volume Water Sales 10.3% 10.3%20 % of Total Water Sales 9.7% 9.7%
21 SMALL COMMERCIAL (C1):22 Average Customers Served 4,873 4,950 1.6%23 % of Total Customers Served 3.46 3.4624 Thousand Gallons Sold 1,067,674.3 219,100 1,074,150.0 0.6% 217,00025 % of Total Gallons Sold 5.5% 5.5%26 Service Charge Revenue 1,030,486$ 0.97$ 211.47$ 1,121,911$ 8.9% 1.04$ 226.65$ 27 Volume Charge Revenue 4,344,303 4.07 891.50 4,653,218 7.1% 4.33 940.04 28 Total Water Sales Revenue 5,374,789$ 5.03$ 1,102.97$ 5,775,129$ 7.5% 5.38$ 1,166.69$ 29 % of Volume Water Sales 5.6% 5.7%30 % of Total Water Sales 5.4% 5.5%
31 LARGE COMMERCIAL (C2):32 Average Customers Served 3,018 3,073 1.8%33 % of Total Customers Served 2.14 2.1534 Thousand Gallons Sold 4,541,211.4 1,504,709 4,624,283.8 1.8% 1,504,81135 % of Total Gallons Sold 23.4% 23.7%36 Service Charge Revenue 2,323,888$ 0.51$ 770.01$ 2,427,246$ 4.5% 0.52$ 789.86$ 37 Volume Charge Revenue 18,544,792 4.08 6,144.73 19,532,706 5.3% 4.22 6,356.23 38 Total Water Sales Revenue 20,868,680$ 4.60$ 6,914.74$ 21,959,952$ 5.2% 4.75$ 7,146.10$ 39 % of Volume Water Sales 23.7% 24.0% 40 % of Total Water Sales 20.8% 20.9%
41 SUB-TOTAL RETAIL:42 Average Customers Served 140,842 142,681 1.3%43 % of Total Customers Served 99.87 99.8744 Thousand Gallons Sold 19,387,615.7 137,655 19,522,707.7 0.7% 136,82845 % of Total Gallons Sold 99.9% 99.9%46 Service Charge Revenue 21,927,173$ 1.13$ 155.69$ 23,382,668$ 6.6% 1.20$ 163.88$ 47 Volume Charge Revenue 78,019,963 4.02 553.95 81,264,942 4.2% 4.16 569.56 48 Total Water Sales Revenue 99,947,136$ 5.16$ 709.64$ 104,647,610$ 4.7% 5.36$ 733.44$ 49 % of Volume Water Sales 99.9% 99.9%50 % of Total Water Sales 99.6% 99.7%
20 Year Model Approved 2015 Budget.xlsm - Exhibit4 2/24/2015 at 10:30 AM- 174 -
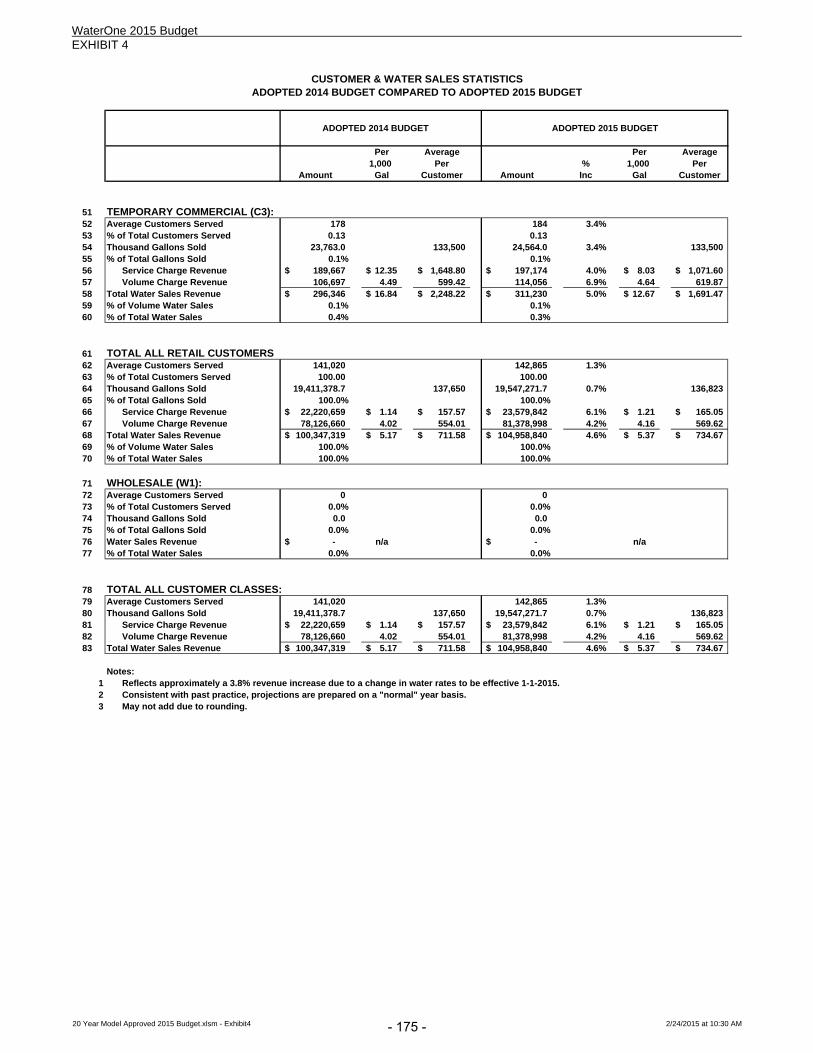
WaterOne 2015 Budget EXHIBIT 4
CUSTOMER & WATER SALES STATISTICSADOPTED 2014 BUDGET COMPARED TO ADOPTED 2015 BUDGET
ADOPTED 2014 BUDGET ADOPTED 2015 BUDGET
Per Average Per Average1,000 Per % 1,000 Per
Amount Gal Customer Amount Inc Gal Customer
51 TEMPORARY COMMERCIAL (C3):52 Average Customers Served 178 184 3.4%53 % of Total Customers Served 0.13 0.1354 Thousand Gallons Sold 23,763.0 133,500 24,564.0 3.4% 133,50055 % of Total Gallons Sold 0.1% 0.1%56 Service Charge Revenue 189,667$ 12.35$ 1,648.80$ 197,174$ 4.0% 8.03$ 1,071.60$ 57 Volume Charge Revenue 106,697 4.49 599.42 114,056 6.9% 4.64 619.87 58 Total Water Sales Revenue 296,346$ 16.84$ 2,248.22$ 311,230$ 5.0% 12.67$ 1,691.47$ 59 % of Volume Water Sales 0.1% 0.1%60 % of Total Water Sales 0.4% 0.3%
61 TOTAL ALL RETAIL CUSTOMERS62 Average Customers Served 141,020 142,865 1.3%63 % of Total Customers Served 100.00 100.0064 Thousand Gallons Sold 19,411,378.7 137,650 19,547,271.7 0.7% 136,82365 % of Total Gallons Sold 100.0% 100.0%66 Service Charge Revenue 22,220,659$ 1.14$ 157.57$ 23,579,842$ 6.1% 1.21$ 165.05$ 67 Volume Charge Revenue 78,126,660 4.02 554.01 81,378,998 4.2% 4.16 569.62 68 Total Water Sales Revenue 100,347,319$ 5.17$ 711.58$ 104,958,840$ 4.6% 5.37$ 734.67$ 69 % of Volume Water Sales 100.0% 100.0%70 % of Total Water Sales 100.0% 100.0%
71 WHOLESALE (W1):72 Average Customers Served 0 073 % of Total Customers Served 0.0% 0.0%74 Thousand Gallons Sold 0.0 0.075 % of Total Gallons Sold 0.0% 0.0%76 Water Sales Revenue -$ n/a -$ n/a77 % of Total Water Sales 0.0% 0.0%
78 TOTAL ALL CUSTOMER CLASSES:79 Average Customers Served 141,020 142,865 1.3%80 Thousand Gallons Sold 19,411,378.7 137,650 19,547,271.7 0.7% 136,82381 Service Charge Revenue 22,220,659$ 1.14$ 157.57$ 23,579,842$ 6.1% 1.21$ 165.05$ 82 Volume Charge Revenue 78,126,660 4.02 554.01 81,378,998 4.2% 4.16 569.62 83 Total Water Sales Revenue 100,347,319$ 5.17$ 711.58$ 104,958,840$ 4.6% 5.37$ 734.67$
Notes:1 Reflects approximately a 3.8% revenue increase due to a change in water rates to be effective 1-1-2015.2 Consistent with past practice, projections are prepared on a "normal" year basis.3 May not add due to rounding.
20 Year Model Approved 2015 Budget.xlsm - Exhibit4 2/24/2015 at 10:30 AM- 175 -
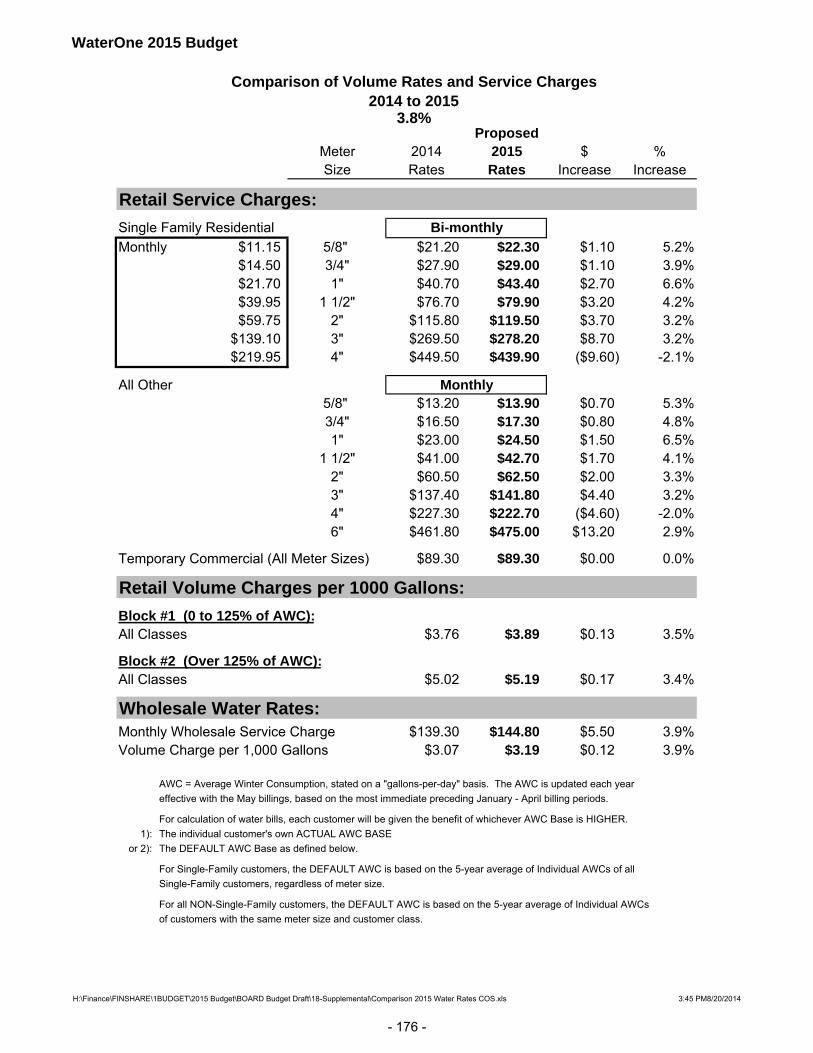
WaterOne 2015 Budget
Comparison of Volume Rates and Service Charges2014 to 2015
3.8%Proposed
Meter 2014 2015 $ %Size Rates Rates Increase Increase
Retail Service Charges:
Single Family Residential Bi-monthly
Monthly $11.15 5/8" $21.20 $22.30 $1.10 5.2%$14.50 3/4" $27.90 $29.00 $1.10 3.9%$21.70 1" $40.70 $43.40 $2.70 6.6%$39.95 1 1/2" $76.70 $79.90 $3.20 4.2%$59.75 2" $115.80 $119.50 $3.70 3.2%
$139.10 3" $269.50 $278.20 $8.70 3.2%$219.95 4" $449.50 $439.90 ($9.60) -2.1%
All Other Monthly5/8" $13.20 $13.90 $0.70 5.3%3/4" $16.50 $17.30 $0.80 4.8%1" $23.00 $24.50 $1.50 6.5%
1 1/2" $41.00 $42.70 $1.70 4.1%2" $60.50 $62.50 $2.00 3.3%3" $137.40 $141.80 $4.40 3.2%4" $227.30 $222.70 ($4.60) -2.0%6" $461.80 $475.00 $13.20 2.9%
Temporary Commercial (All Meter Sizes) $89.30 $89.30 $0.00 0.0%
Retail Volume Charges per 1000 Gallons:
Block #1 (0 to 125% of AWC):All Classes $3.76 $3.89 $0.13 3.5%
Block #2 (Over 125% of AWC):All Classes $5.02 $5.19 $0.17 3.4%
Wholesale Water Rates: Monthly Wholesale Service Charge $139.30 $144.80 $5.50 3.9%Volume Charge per 1,000 Gallons $3.07 $3.19 $0.12 3.9%
AWC = Average Winter Consumption, stated on a "gallons-per-day" basis. The AWC is updated each year
effective with the May billings, based on the most immediate preceding January - April billing periods.
For calculation of water bills, each customer will be given the benefit of whichever AWC Base is HIGHER.
1): The individual customer's own ACTUAL AWC BASE
or 2): The DEFAULT AWC Base as defined below.
For Single-Family customers, the DEFAULT AWC is based on the 5-year average of Individual AWCs of all
Single-Family customers, regardless of meter size.
For all NON-Single-Family customers, the DEFAULT AWC is based on the 5-year average of Individual AWCs
of customers with the same meter size and customer class.
H:\Finance\FINSHARE\1BUDGET\2015 Budget\BOARD Budget Draft\18-Supplemental\Comparison 2015 Water Rates COS.xls 3:45 PM8/20/2014
- 176 -
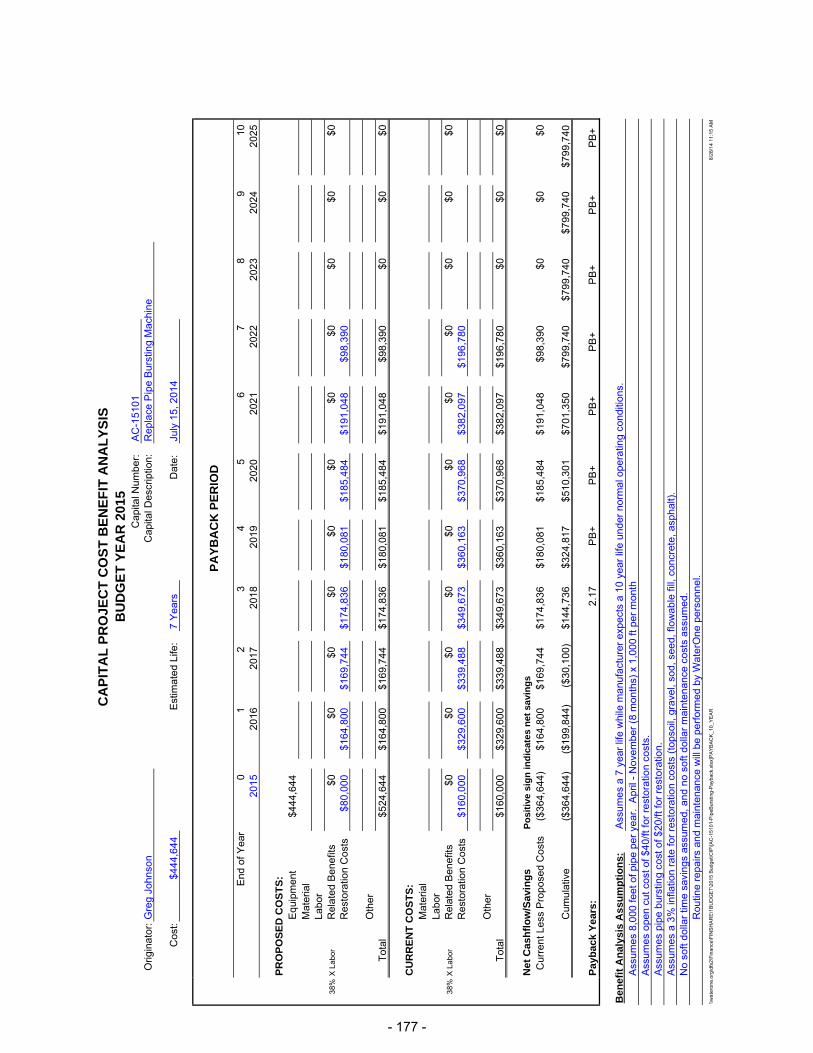
CA
PIT
AL
PR
OJE
CT
CO
ST
BE
NE
FIT
AN
AL
YS
ISB
UD
GE
T Y
EA
R 2
015
Cap
ital N
umbe
r:A
C-1
5101
Orig
inat
or:
Gre
g Jo
hnso
nC
apita
l Des
crip
tion:
Rep
lace
Pip
e B
urst
ing
Mac
hine
Cos
t:$4
44,6
44E
stim
ated
Life
:7
Yea
rsD
ate:
July
15,
201
4
PA
YB
AC
K P
ER
IOD
End
of Y
ear
01
23
45
67
89
1020
1520
1620
1720
1820
1920
2020
2120
2220
2320
2420
25
PR
OP
OS
ED
CO
ST
S:
Equ
ipm
ent
$444
,644
M
ater
ial
Labo
r38
%X
Lab
orR
elat
ed B
enef
its$0
$0$0
$0$0
$0$0
$0$0
$0$0
Res
tora
tion
Cos
ts$8
0,00
0$1
64,8
00$1
69,7
44$1
74,8
36$1
80,0
81$1
85,4
84$1
91,0
48$9
8,39
0
Oth
er
Tot
al$5
24,6
44$1
64,8
00$1
69,7
44$1
74,8
36$1
80,0
81$1
85,4
84$1
91,0
48$9
8,39
0$0
$0$0
CU
RR
EN
T C
OS
TS
:M
ater
ial
Labo
r38
%X
Lab
orR
elat
ed B
enef
its$0
$0$0
$0$0
$0$0
$0$0
$0$0
Res
tora
tion
Cos
ts$1
60,0
00$3
29,6
00$3
39,4
88$3
49,6
73$3
60,1
63$3
70,9
68$3
82,0
97$1
96,7
80
Oth
er
Tot
al$1
60,0
00$3
29,6
00$3
39,4
88$3
49,6
73$3
60,1
63$3
70,9
68$3
82,0
97$1
96,7
80$0
$0$0
Net
Cas
hfl
ow
/Sav
ing
sP
osi
tive
sig
n in
dic
ates
net
sav
ing
s
Cur
rent
Les
s P
ropo
sed
Cos
ts($
364,
644)
$164
,800
$169
,744
$174
,836
$180
,081
$185
,484
$191
,048
$98,
390
$0$0
$0
Cum
ulat
ive
($36
4,64
4)($
199,
844)
($30
,100
)$1
44,7
36$3
24,8
17$5
10,3
01$7
01,3
50$7
99,7
40$7
99,7
40$7
99,7
40$7
99,7
40
Pay
bac
k Y
ears
:
2.
17
P
B+
PB
+
PB
+
P
B+
PB
+
PB
+
PB
+
Ben
efit
An
alys
is A
ssu
mp
tio
ns:
Ass
umes
a 7
yea
r lif
e w
hile
man
ufac
ture
r ex
pect
s a
10 y
ear
life
unde
r no
rmal
ope
ratin
g co
nditi
ons.
Ass
umes
8,0
00 fe
et o
f pip
e pe
r ye
ar.
Apr
il -
Nov
embe
r (8
mon
ths)
x 1
,000
ft p
er m
onth
Ass
umes
ope
n cu
t cos
t of $
40/ft
for
rest
orat
ion
cost
s.A
ssum
es p
ipe
burs
ting
cost
of $
20/ft
for
rest
orat
ion.
Ass
umes
a 3
% in
flatio
n ra
te fo
r re
stor
atio
n co
sts
(top
soil,
gra
vel,
sod,
see
d, fl
owab
le fi
ll, c
oncr
ete,
asp
halt)
.N
o so
ft do
llar
time
savi
ngs
assu
med
, and
no
soft
dolla
r m
aint
enan
ce c
osts
ass
umed
. R
outin
e re
pairs
and
mai
nten
ance
will
be
perf
orm
ed b
y W
ater
One
per
sonn
el.
\\wat
eron
e.or
g\df
s2\F
inan
ce\F
INS
HA
RE
\1B
UD
GE
T\2
015
Bud
get\C
IP\[A
C-1
5101
-Pip
eBur
stin
g-P
ayba
ck.x
lsx]
PA
YB
AC
K_1
0_Y
EA
R8/
28/1
4 11
:15
AM
- 177 -

CAPITAL PROJECT COST BENEFIT ANALYSISBUDGET YEAR 2015
Capital Number: AC-15180 Originator: Greg Johnson Capital Item Requested: Auger Machine
Cost: $83,371 Estimated Life: 5 Years Date: July 15, 2014
PAYBACK PERIOD
End of Year 0 1 2 3 4 52015 2016 2017 2018 2019 2020
PROPOSED COSTS:Equipment $83,371 MaterialLabor
38% X Labor Related Benefits $0 $0 $0 $0 $0 $0Operating ExpMaintenanceOther
Total $83,371 $0 $0 $0 $0 $0
CURRENT COSTS:MaterialLabor
38% X Labor Related Benefits $0 $0 $0 $0 $0 $0Restoration Costs $37,500 $77,250 $79,568 $81,955 $84,413 $43,473
Other Total $37,500 $77,250 $79,568 $81,955 $84,413 $43,473
Net Cashflow/Savings Positive sign indicates net savings
Current Less Proposed Costs ($45,871) $77,250 $79,568 $81,955 $84,413 $43,473
Cumulative ($45,871) $31,379 $110,946 $192,901 $277,314 $320,787
Payback Years: Payback first year Add'l PB+ PB+ PB+ PB+
Benefit Analysis Assumptions:Assumes 15 driveways per project.Assumes one project per month for 10 months a year. Too cold in Jan and Feb.Assumes driveway restoration at $500 per. $6.25 per sqr ft x 80 sqr feet per driveway.Assumes 1/2 year utilization in the first and last year of the assets life.Assumes a 3% inflation rate.No soft dollar time savings assumed, and no soft dollar maintenance costs assumed.
Routine repairs and maintenance will be performed by WaterOne personnel.
\\waterone.org\dfs2\Finance\FINSHARE\1BUDGET\2015 Budget\CIP\[AC-15180-AugerPayback.xlsx]PAYBACK_5_YEAR 8/28/14 11:16 AM
- 178 -

WATERONE 2015 BUDGET FISCAL POLICIES & PROCEDURES
2/24/2015 9:47:00 AM H:\Finance\FINSHARE\1BUDGET\2015 Budget\FINAL Budget Book\19-Fiscal Policies\Water One Fiscal Policies 2015 Budget Book FINAL.docx
WATER ONE FISCAL POLICIES AND PROCEDURES
Introduction These formal Fiscal Policies of Water District No. 1 of Johnson County (WaterOne) are a combination of Kansas Statutes, Board Policy, Rules and Regulations and Bond Covenants (the “Source Documents”), Board action or resolution, and internal procedures and practices. In the event the content of these Fiscal Policies conflict with a Source Document, the Source Document shall take precedence. Where applicable, the Source Documents are referenced in italics. Informal practices and procedures supporting the formal Fiscal Policies have evolved through day-to-day operations associated with annual budgeting, capital improvement programs, debt issuance, and debt management. This document lists WaterOne’s Fiscal Policies and explains the practices and procedures that support these formal policies. In developing formal versus informal policies, accountability to WaterOne’s stakeholders has been carefully balanced with management flexibility. These written formal and informal Fiscal Policies and procedures are reviewed as part of WaterOne’s annual budget process. I. OVERVIEW ..................................................................................................................................... 182
101. FORMATION OF WATERONE ................................................................................................................ 182 102. REASONABLE AND PRUDENT PERSON STANDARD ..................................................................................... 182 103. ETHICAL STANDARDS .......................................................................................................................... 182 104. FISCAL YEAR ..................................................................................................................................... 183 105. GENERALLY ACCEPTED ACCOUNTING PRINCIPLES ..................................................................................... 183 106. FINANCIAL REPORTING ....................................................................................................................... 183 107. FINANCIAL ADVISORS ........................................................................................................................... 183
II. FINANCIAL PLANNING POLICIES .................................................................................................... 184
201. RESPONSIBILITIES ............................................................................................................................... 184 202. ANNUAL BUDGETING ......................................................................................................................... 184 203. FIVE YEAR BUDGET ............................................................................................................................ 185 204. MULTI‐YEAR FORECASTING ................................................................................................................. 185
III. REVENUE POLICIES ....................................................................................................................... 187
301. DEVELOPING WATER RATES ................................................................................................................. 187 302. RATE CLASSIFICATIONS ........................................................................................................................ 187 303. PEAK MANAGEMENT STRUCTURE .......................................................................................................... 188 304. SYSTEM DEVELOPMENT CHARGES (SDCS) ............................................................................................... 188 305. WATER SYSTEM GENERAL FUND ........................................................................................................... 189
- 179 -
WATERONE 2015 BUDGET FISCAL POLICIES & PROCEDURES
2/24/2015 9:47:00 AM H:\Finance\FINSHARE\1BUDGET\2015 Budget\FINAL Budget Book\19-Fiscal Policies\Water One Fiscal Policies 2015 Budget Book FINAL.docx
IV. EXPENDITURE POLICIES (OPERATION & MAINTENANCE EXPENSE) ................................................ 190
401. EXPENDITURES ‐ GENERAL ................................................................................................................... 190 402. PENSION .......................................................................................................................................... 190 403. INSURANCE ....................................................................................................................................... 190 404. PURCHASING CONTRACTS .................................................................................................................... 191 405. CHANGE ORDERS ................................................................................................................................ 191 406. EXPENSE REIMBURSEMENT POLICY ........................................................................................................ 191
V. DEBT MANAGEMENT POLICIES ..................................................................................................... 192
501. DEBT ISSUANCE POLICY ....................................................................................................................... 192 502. DEBT STRUCTURE ............................................................................................................................... 192 503. FUNDING MAJOR CAPITAL PROJECTS WITH DEBT...................................................................................... 193 504. REFUNDING / REFINANCING ................................................................................................................. 193
VI. BONDS & OPERATING FUND INVESTMENT POLICY ....................................................................... 194
601.1 INVESTMENT AUTHORITY ................................................................................................................... 194 601.2 POLICY STATEMENT .......................................................................................................................... 194
601.2.1 Safety ................................................................................................................................... 194 [60‐] 1.2.1a Credit Risk ..................................................................................................................... 194 601.2.1b Interest Rate Risk .............................................................................................................. 194 601.2.2 Liquidity ............................................................................................................................... 195 601.2.3 Yield ..................................................................................................................................... 195
601.3 ADOPTION OF POLICY ........................................................................................................................ 195 601.4 SCOPE ............................................................................................................................................ 195 601.5 POOLING OF FUNDS .......................................................................................................................... 195 601.6 SUITABLE AND AUTHORIZED INVESTMENT PARAMETERS .......................................................................... 196
601.6.2 Authorized Investments for Operating Funds and Bond / Construction Funds ................. 196 601.7 COLLATERALIZATION ......................................................................................................................... 197 601.8 DIVERSIFICATION .............................................................................................................................. 198 601.9 MAXIMUM MATURITIES .................................................................................................................... 198 601.10 INTENT TO HOLD TO MATURITY ........................................................................................................ 198 601.11 INVESTMENTS MATURITY MANAGEMENT ........................................................................................... 199 601.12 PORTFOLIO MANAGEMENT .............................................................................................................. 199 601.13 CASH MANAGEMENT & INVESTMENT PRACTICES ................................................................................. 199 601.14 TRADING AUTHORIZATION ............................................................................................................... 199 601.15 BOND AND OPERATING FUND INVESTMENT POLICY REVIEW AND REVISIONS .............................................. 199 601.16 ARBITRAGE ................................................................................................................................... 199 601.17 REASONABLE AND PRUDENT PERSON STANDARD .................................................................................. 199 601.18 ETHICS AND CONFLICTS OF INTEREST .................................................................................................. 200 601.19 DELEGATION OF AUTHORITY ............................................................................................................. 200 601.20 AUTHORIZED FINANCIAL DEALERS AND INSTITUTIONS ............................................................................ 200 601.21 COMPETITIVE PLACEMENT ................................................................................................................ 200 601.22 DELIVERY VS. PAYMENT ................................................................................................................... 201 601.23 SAFEKEEPING AND CUSTODY ............................................................................................................. 201 601.24 INTERNAL CONTROLS ...................................................................................................................... 201 601.25 REPORTING ................................................................................................................................... 201
601.25.1 Report Contents ................................................................................................................ 201 601.26 PERFORMANCE STANDARDS / BENCHMARKING .................................................................................... 201 601.27 MARKING TO MARKET .................................................................................................................... 202 601.28 USE OF EXTERNAL CONSULTANTS / ADVISERS ...................................................................................... 202 601.29 POLICY EXEMPTIONS ....................................................................................................................... 202 601.30 PERSONNEL AUTHORIZED TO SECURE INVESTMENTS FOR WATERONE ...................................................... 202
- 180 -

WATERONE 2015 BUDGET FISCAL POLICIES & PROCEDURES
2/24/2015 9:47:00 AM H:\Finance\FINSHARE\1BUDGET\2015 Budget\FINAL Budget Book\19-Fiscal Policies\Water One Fiscal Policies 2015 Budget Book FINAL.docx
VII. RESERVE POLICIES ...................................................................................................................... 203
701. PURPOSE .......................................................................................................................................... 203 702. FUNDING ORDER ................................................................................................................................ 203 703. FUND BALANCE .................................................................................................................................. 204 704. RESERVES ......................................................................................................................................... 204
704.1 Bond Resolution Section 703 Operating Contingency ............................................................ 204 704.2 Negative Cash Flow Reserves ................................................................................................. 205 704.3 Rate Stabilization Reserve ...................................................................................................... 206
VIII. CAPITAL ..................................................................................................................................... 208
801. ANNUAL CAPITAL .............................................................................................................................. 208 802. MASTER PLAN ................................................................................................................................... 208
802.1 Annual Designation of Water Sales Revenue to Master Plan ................................................ 209 803. TRANSMISSION AND DISTRIBUTION ........................................................................................................ 210
IX. POST BOND ISSUANCE COMPLIANCE ............................................................................................ 213
901. TRANSCRIPTS ............................................................................................................................... 213 901.1. Provision by Bond Counsel and Content ......................................................................... 213 901.2. Retention ........................................................................................................................ 213
902. FEDERAL TAX LAW REQUIREMENTS .................................................................................................. 213 902.1. Use of Proceeds ............................................................................................................. 213 902.2. Arbitrage Rebate ............................................................................................................ 214 902.3. Unused Proceeds Following Completion of the Project ................................................. 216 902.4. Facilities and Use of the Facilities Financed with Proceeds, Private Use....................... 216 902.5. Records Retention .......................................................................................................... 217
903. ONGOING DISCLOSURE .................................................................................................................. 218
- 181 -
WATERONE 2015 BUDGET FISCAL POLICIES & PROCEDURES
2/24/2015 9:47:00 AM H:\Finance\FINSHARE\1BUDGET\2015 Budget\FINAL Budget Book\19-Fiscal Policies\Water One Fiscal Policies 2015 Budget Book FINAL.docx
I. OVERVIEW
WaterOne is a quasi-municipal entity. It was created under Kansas Statutes Annotated (K.S.A.) 19-3501 to 19-3521a. with all of its powers and subject to all of its provisions.
101. Formation of WaterOne The governing body of WaterOne (the Board) is comprised of seven
members, each serving a four-year term. Elections are held in odd-numbered years with four members elected at one time, and then the other three members are elected the next odd-numbered year.
The Board approves water rates, system development charges, revenue
bonds and all other incidental charges and fees as deemed necessary in the operation of WaterOne.
Bond Covenants – Section 902. Rate Covenant K.S.A. 19-3502
The Board selects a General Manager who is responsible for bringing
issues to the Board in a prudent manner. K.S.A. 19-3510 Board Policy No. 11
102. Reasonable and Prudent Person Standard The standard of care to be used by elected officials and management staff
shall be the “reasonable and prudent person” standard and shall be applied in the context of managing the overall operations of WaterOne and its policies and procedures.
103. Ethical Standards WaterOne is committed to the highest legal, ethical, and moral standards
in the conduct of WaterOne business. Every employee of WaterOne is expected to maintain and foster such standards.
It is the firm policy of WaterOne that all employees shall avoid any
situation or activity that involves or may involve an abuse of funds, abuse of equipment or property, or a conflict between WaterOne and the individual’s personal interest – financial or otherwise.
WaterOne Personnel Policy Manual
- 182 -
WATERONE 2015 BUDGET FISCAL POLICIES & PROCEDURES
2/24/2015 9:47:00 AM H:\Finance\FINSHARE\1BUDGET\2015 Budget\FINAL Budget Book\19-Fiscal Policies\Water One Fiscal Policies 2015 Budget Book FINAL.docx
104. Fiscal Year WaterOne’s fiscal year is from January 1 to December 31.
K.S.A. 19-3521
105. Generally Accepted Accounting Principles WaterOne follows Generally Accepted Accounting Principles (GAAP) on
the modified accrual basis of accounting when preparing financial reports. Revenues are recognized when they become measurable and available. Expenditures are recognized when the liability is incurred.
106. Financial Reporting WaterOne has installed and maintained proper books, records and
accounts for the correct entry and presentation of all financial transactions.
WaterOne follows the Government Finance Officers Association (GFOA) recommended Financial Reporting Practices in publishing timely (monthly) interim Financial Statements.
WaterOne’s Board shall select an outside auditor for WaterOne’s yearly audit and shall approve the award of contract to the auditor. All external audits, normal or special, require approval of WaterOne’s Board.
Board Policy #13 – Audit Policy K.S.A. 19-3516 (c)
Annual Audits are performed.
K.S.A. 19-3516 (c) Bond Covenants – Section 907. Annual Audit
Audit Reports must be published within 90 days of year-end.
K.S.A. 19-3521
107. Financial Advisors Certain consultants, including Financial Advisors, are retained by the
Board because their services are enhanced by continuity and an in-depth knowledge of WaterOne. In order to assure the quality of service, these consultants are subject to evaluations by appropriate staff and the Board on an annual basis. The firm’s fee schedule and rates will be evaluated at least every three years.
Board Policy #27 – Consultant Review
- 183 -
WATERONE 2015 BUDGET FISCAL POLICIES & PROCEDURES
2/24/2015 9:47:00 AM H:\Finance\FINSHARE\1BUDGET\2015 Budget\FINAL Budget Book\19-Fiscal Policies\Water One Fiscal Policies 2015 Budget Book FINAL.docx
II. FINANCIAL PLANNING POLICIES
201. Responsibilities Unless otherwise specifically delegated or assigned by resolution or other
Board Policy, WaterOne’s Board reserves final approval of all decisions relating to the Budget including limits on the number of employees.
Board Policy #11 – Subjects Requiring Board Authorization
The Board of WaterOne is responsible for adopting a prudent, balanced annual budget.
The General Manager of WaterOne is responsible for recommending the
annual budget to the Board for approval. Directors and Managers are responsible for developing and justifying a
budget that allows for operation of WaterOne in a responsible, cost-effective manner.
202. Annual Budgeting WaterOne’s budget is prepared on the modified accrual basis. Revenues
are budgeted based on projections of income to be earned in the year being budgeted and expenditures are based on the assumption liabilities will be incurred in the year being budgeted.
Funding, designated for capital spending that is not complete at the end of
the budget year, may be set aside for use in future years to complete authorized capital projects.
Funding associated with operating and maintenance expense may not be
used in future years.
Year-end general fund balance, in excess of reserve requirements, is designated by the Board for future use.
WaterOne annually adopts a balanced budget where Total Revenues
Provided equals Total Revenue Requirements including designations to reserve funds.
The current year budget is projected based on a “normal” year. Historical
revenue and expenditure trends are analyzed to define “normal”.
- 184 -

WATERONE 2015 BUDGET FISCAL POLICIES & PROCEDURES
2/24/2015 9:47:00 AM H:\Finance\FINSHARE\1BUDGET\2015 Budget\FINAL Budget Book\19-Fiscal Policies\Water One Fiscal Policies 2015 Budget Book FINAL.docx
WaterOne’s annual operating budget is developed using a line item format and includes: a. Revenues b. Operating Expenditures c. Debt Service d. Annual Capital e. Designated Reserves f. Staffing Levels
Water rate increases are “smoothed” over a period of years to avoid rate
spikes. WaterOne’s objective is to structure composite debt service to be approximately level on a year-to-year basis where appropriate, which avoids significant roller-coaster types of increases and decreases in debt service and enables water rates to remain relatively stable (smoothed) over time.
Should revenues not materialize in a given year, expenditures and/or
reserves are adjusted to meet the shortfall.
A Budget Calendar is prepared with the following timelines: March Budgeting Materials Distributed to Staff April Initial Budgets Completed by Management Staff July General Manager Reviews Division/Departmental
Budgets October Balanced Budget Recommended to Board October Board Review with WaterOne staff November Public Hearing December Final Board Approval
203. Five Year Budget Each year, in conjunction with the annual budget, detailed rolling 5-year
annual capital and new personnel budgets are projected. Last year’s projection becomes this year’s guideline. Deviations from projections are analyzed, documented, and adjustments are made as appropriate.
204. Multi-Year Forecasting To aid in financial planning, a 20-year financial simulation model is used
as a guideline for current year budgeting and rate setting. Projections include revenues, operating expenditures, total capital improvement project (CIP) costs, debt service requirements, rate increases, bond sizing, and debt service coverage. Together these are used to: a. Project long-term sustainability of core services within projected
revenue sources.
- 185 -
WATERONE 2015 BUDGET FISCAL POLICIES & PROCEDURES
2/24/2015 9:47:00 AM H:\Finance\FINSHARE\1BUDGET\2015 Budget\FINAL Budget Book\19-Fiscal Policies\Water One Fiscal Policies 2015 Budget Book FINAL.docx
b. Project operating revenues and capital reserves available for direct funding of capital projects.
c. Project debt financing for capital projects within targeted debt coverage ratios.
The 20-year model is updated annually to reflect emerging issues to
ensure that it reflects the current environment.
- 186 -

WATERONE 2015 BUDGET FISCAL POLICIES & PROCEDURES
2/24/2015 9:47:00 AM H:\Finance\FINSHARE\1BUDGET\2015 Budget\FINAL Budget Book\19-Fiscal Policies\Water One Fiscal Policies 2015 Budget Book FINAL.docx
III. REVENUE POLICIES
301. Developing Water Rates WaterOne will establish, maintain and collect rates, fees, and charges
sufficient to pay all obligations as defined in the Water Rate Covenant. Bond Covenants – Section 902. Rate Covenant K.S.A. 19-3502
WaterOne will not provide water or any of its tools that produce water
without a reasonable charge with the exception of fire suppression. Projections for Water Sales Revenues are developed using customer
growth and customer class water usage standards. Standards are developed by using historical trends to define “normal”, which prevents fluctuations based on weather or economic conditions. These standards are reviewed annually for reasonableness.
Once normal gallons are computed, consumption is reduced to recognize
the potential effects of conservation and peak management pricing (Section 303. Peak Management Structure).
Interest income is developed based on current market conditions, advice
of financial advisors, and trending for future years. One-time revenues should not be used to fund normal, ongoing operations
and consequently are not included as a revenue source in the development of the annual budget.
302. Rate Classifications Water rates are established using a Cost of Service (COS) recovery
method for volume and service charges. Cost of Service Studies are conducted by outside financial consultants at a minimum of every five years. Staff updates a COS model in the interim years for reasonableness and trend analysis.
Rules & Regulations Rule II. Definitions Rules & Regulations Rule VII. Water Rates
Wholesale Rates are also COS based.
Rules & Regulations Rule II. Definitions Rules & Regulations Rule VII. Water Rates
- 187 -
WATERONE 2015 BUDGET FISCAL POLICIES & PROCEDURES
2/24/2015 9:47:00 AM H:\Finance\FINSHARE\1BUDGET\2015 Budget\FINAL Budget Book\19-Fiscal Policies\Water One Fiscal Policies 2015 Budget Book FINAL.docx
303. Peak Management Structure Effective in 1994, the Board approved using Peak Management Rates
(PMR) as the fee structure for water rates. PMR is an inclining rate structure. Its goal is to shave usage peaks. Shaving peak usage allows investment in additional capacity to be delayed. It also promotes equity among rate payers as “peakers” pay for the additional capacity they use.
Rules & Regulations Rule II. Definitions Rules & Regulations Rule VII. Water Rates
The PMR structure differs from the traditional inclining block structure in
that each customer’s block charges are individualized based on their personal average winter consumption (AWC).
Rules & Regulations, Rule II
Block I equals 125% of AWC, Block II is usage in excess of 125%. Default AWCs are used for each class so small users will not be penalized.
Rules & Regulations, Rule VII
For rate stability, Block I recovers base costs and some maximum day costs, causing less revenue to be at risk during wet weather related sales deficit or economic downturns.
304. System Development Charges (SDCs) Water One has a philosophy of “growth pays for growth”.
System Development Charges (SDCs) are impact fees charged to new
customers who connect onto the Water System. SDC Revenues are NOT part of the annual budget. Funds generated are used for the building or replacement of major infrastructures (capacity and distribution) or for the retirement of debt.
Rules & Regulations, Rule II
For every new retail Service Connection Application such new service connection shall be subject (in addition to the service connection charge) to a System Development Charge to compensate for the applicable costs of investment required for existing and future water supply, treatment, transmission and distribution facilities.
Rules and Regulations Rule XI. Retail System Development Charge, Purpose and Amount
SDC rates are developed for a determined period of time and may be
“phased-in” year-by-year at the discretion of the Board. Rules and Regulations Rule XI.
- 188 -
WATERONE 2015 BUDGET FISCAL POLICIES & PROCEDURES
2/24/2015 9:47:00 AM H:\Finance\FINSHARE\1BUDGET\2015 Budget\FINAL Budget Book\19-Fiscal Policies\Water One Fiscal Policies 2015 Budget Book FINAL.docx
SDCs are Cost of Service based using the “buy-in method”. This
calculation methodology uses the integrated transmission and major distribution system in the system development charge calculations and also considers all supply and treatment facilities, regardless of whether or not they add additional capacity to the system. Under this methodology, a new customer is required to “buy-in” to the existing system so that they are on an equal equity basis with all other customers having similar service requirements.
Rules and Regulations Rule XI.
Cost of Service Studies are conducted by outside financial consultants at a minimum of every five years. Staff updates a COS model in the interim years for reasonableness.
To be conservative in revenue projections, SDC revenue is forecast as if
all services sold were at 5/8” connection size, even though the larger sizes are more expensive.
Wholesale SDCs are computed based on Max Day and Max Hour
requirements.
305. Water System General Fund All revenues derived and collected by WaterOne from the operation of the
Water System will be paid and deposited into the Water System General Fund.
Bond Covenants – Section 702. Water System General Fund
The manner in which WaterOne may administer and deposit moneys from the General Fund is outlined in the Kansas Statutes and bond covenants.
K.S.A. 19-3516(a) Bond Covenants – Section 703. Application of Moneys in Funds
- 189 -

WATERONE 2015 BUDGET FISCAL POLICIES & PROCEDURES
2/24/2015 9:47:00 AM H:\Finance\FINSHARE\1BUDGET\2015 Budget\FINAL Budget Book\19-Fiscal Policies\Water One Fiscal Policies 2015 Budget Book FINAL.docx
IV. EXPENDITURE POLICIES (Operation & Maintenance Expense)
401. Expenditures - General Operating expenses include personnel costs, benefits, supplies, services
and maintenance materials.
The Board may approve expenditures in excess of the budget if funds are available.
Funding is provided for the adequate maintenance of equipment, facilities
and infrastructure. Appropriate costs are capitalized in order to match the cost of the asset
with its useful life. Capitalization thresholds are reviewed annually.
Cost standards and overhead calculations are utilized as a method for standardizing cost transference from Operation and Maintenance expense accounts to capital projects or for charging to a third party. They are reviewed and updated annually.
Personnel costs are budgeted at 99% to recognize the “slippage” factor.
Slippage accounts for such things as turnover in positions, vacancy rates and attrition.
402. Pension Pension costs are fully funded as determined by annual actuarial studies. Pension gains and losses are recognized and amortized per actuarial
formulas.
403. Insurance WaterOne will carry and maintain a reasonable amount of fire, public
liability, workmen’s compensation, and fidelity insurance in amounts comparable to those held by similar municipalities in the State of Kansas and costs of insurance shall be paid as an operating cost out of the revenues of the Water System.
Bond Covenants – Section 905. Insurance
- 190 -
WATERONE 2015 BUDGET FISCAL POLICIES & PROCEDURES
2/24/2015 9:47:00 AM H:\Finance\FINSHARE\1BUDGET\2015 Budget\FINAL Budget Book\19-Fiscal Policies\Water One Fiscal Policies 2015 Budget Book FINAL.docx
404. Purchasing Contracts WaterOne’s capital and operating budgets are reviewed by the respective
Directors and submitted to the General Manager who reviews them and makes a recommendation to the Board for approval. Therefore, staff approval will be given for disbursements for items included in the budget up to the following aggregate amounts:
Manager $0 to $ 5,000 Director $0 to $10,000 General Manager: $100,000 (See Limitations to the authority of the General Manager – Board Policy #11 Cited Above and WaterOne Purchasing Policy)
Purchasing contracts for aggregate expenditures up to $50,000 can be
approved by the General Manager, purchasing contracts for aggregate expenditures from $50,000 to $100,000 require notification of the Board Chairman or Vice Chairman, and purchasing contracts for aggregate expenditures over $100,000 require Board approval.
Board Policy #11 – Subjects Requiring Board Authorization
405. Change Orders Change Orders for increases on construction projects in excess of
$25,000 for any one increase must be approved by the Board. Board Policy #11 – Subject Requiring Board Authorization.
406. Expense Reimbursement Policy Reimbursements to employees and officials for expenditures made on
behalf of WaterOne may be made providing such expenses were: a. Incurred in performing officially assigned duties b. Necessary and reasonable c. For the direct benefit of WaterOne d. Properly submitted and documented e. Approved in advance, if required f. Within budget g. Lawful
Board Policy #18 - Expense Reimbursement Policy
- 191 -

WATERONE 2015 BUDGET FISCAL POLICIES & PROCEDURES
2/24/2015 9:47:00 AM H:\Finance\FINSHARE\1BUDGET\2015 Budget\FINAL Budget Book\19-Fiscal Policies\Water One Fiscal Policies 2015 Budget Book FINAL.docx
V. DEBT MANAGEMENT POLICIES
501. Debt Issuance Policy Maintain WaterOne’s current Bond ratings for senior debt of AAA from
S&P and Aaa from Moody’s.
WaterOne does not have a legal debt limit.
Revenue Bonds are issued with debt repayment from Water Rates, SDCs, or in the case of capitalized interest, from bond proceeds.
Whenever possible, debt is marketed using the competitive bid process.
WaterOne covenants to provide continuing disclosure as required by the
SEC Rule and as set forth in the Continuing Disclosure Letter of Instructions as attached to the Preliminary Official Statement and made a part thereof in each bond issuance.
Bond Covenants – Section 1401. Disclosure 502. Debt Structure Debt financing is not used to finance current operating expenditures.
Key debt ratios should be evaluated against industry standards or
averages. Composite debt service is structured to be approximately level on a year-
to-year basis where appropriate. This avoids spikes, while allowing structuring for the future.
WaterOne will fix, establish, maintain and collect rates, fees and charges for water or water service furnished by or through the Water System. Such rates, fees and charges shall at all times be sufficient so that the Net Revenues of the Water System shall be not less than 125% of the Annual Debt Service.
Bond Covenants – Section 902. Rate Covenant.
Though Bond Covenants only require the above referenced 125%, it is the intent of the Board to maintain water rates at a level which will provide Net Revenues from Operations sufficient to produce annually coverage of at least two hundred percent (200%) of the current Annual Debt Service to be funded in any year. Board Policy #16
Debt principal and interest payments are budgeted as an expenditure.
- 192 -
WATERONE 2015 BUDGET FISCAL POLICIES & PROCEDURES
2/24/2015 9:47:00 AM H:\Finance\FINSHARE\1BUDGET\2015 Budget\FINAL Budget Book\19-Fiscal Policies\Water One Fiscal Policies 2015 Budget Book FINAL.docx
503. Funding Major Capital Projects with Debt Long-term borrowing is used to fund major capital improvement projects
and to refund outstanding debt obligations on a current or advanced basis.
The term of the debt issued for capital expenditures will not exceed the projects’ useful lives. The standard term for WaterOne debt is twenty to twenty-five years.
At least once every three years, the Consulting Engineer will examine and report on the condition and operation of the Water System, including recommendations and reports of extraordinary items of maintenance. This report will be filed with the Secretary of the Board.
Bond Covenants – Section 908. Consulting Engineer Report
504. Refunding / Refinancing Refunding of outstanding debt is done to take advantage of the
opportunity to achieve debt service savings due to lower interest rates, or to restructure the debt, or to make room for future borrowings.
Refinancing or restructuring will not extend the final maturity of the original
debt.
WaterOne uses the guideline of a targeted savings of 3% of par refunded on a net present value (NPV) basis to determine cost effectiveness of doing a refunding.
- 193 -
WATERONE 2015 BUDGET FISCAL POLICIES & PROCEDURES
2/24/2015 9:47:00 AM H:\Finance\FINSHARE\1BUDGET\2015 Budget\FINAL Budget Book\19-Fiscal Policies\Water One Fiscal Policies 2015 Budget Book FINAL.docx
VI. BONDS & OPERATING FUND INVESTMENT POLICY The following section VI is a complete excerpt from the ‘Bond and Operating Fund Investment Policy’ document. The only differences being the numbering below is prefixed by “[60-]” in order to differentiate the numbering from Section 1 of these Fiscal Policies & Procedures and some formatting variance.
Water District No. 1 of Johnson County Bond and Operating Fund
Investment Policy February 14, 2007
(as revised November 11, 2014)
[60-] 1.1 Investment Authority Water District No. 1 of Johnson County (WaterOne) has authority granted in K.S.A. 12-1675 to invest all funds held by, or belonging to WaterOne. WaterOne bond covenants further define suitable and authorized investment parameters. [60-] 1.2 Policy Statement The primary objectives, in priority order, of investment activities shall be safety, liquidity, and yield. All available funds, including bond / construction funds and operating funds, shall be invested in conformance with the Water District No. 1 of Johnson County Bond and Operating Fund Investment Policy (the Policy) and with applicable legal and administrative guidelines and all investments made by, or on behalf of, WaterOne shall seek to adhere to the following objectives. [60-] 1.2.1 Safety Safety of principal is the foremost objective of the investment program. Investments shall be undertaken in a manner that seeks to ensure the preservation of capital in the overall portfolio and to mitigate credit risk and interest rate risk. [60-] 1.2.1a Credit Risk WaterOne will minimize credit risk, the risk of loss due to the failure of the security issuer or backer, by: Limiting investments to those in Sections 1.6.1 and 1.6.2 of this Policy. Pre-qualifying the financial institutions, brokers / dealers, intermediaries,
and advisers with which WaterOne will do business (Reference Section 1.20).
[60-] 1.2.1b Interest Rate Risk WaterOne will minimize interest rate risk, the risk that the market value at redemption of securities in the portfolio will fall due to a significant change in general interest rates, by:
- 194 -

WATERONE 2015 BUDGET FISCAL POLICIES & PROCEDURES
2/24/2015 9:47:00 AM H:\Finance\FINSHARE\1BUDGET\2015 Budget\FINAL Budget Book\19-Fiscal Policies\Water One Fiscal Policies 2015 Budget Book FINAL.docx
Structuring the investment portfolio so that securities mature to meet cash requirements for ongoing operations, thereby avoiding the need to sell securities on the open market prior to maturity.
Investing operating funds primarily in shorter-term, fixed rate securities. Maintaining an overall average portfolio maturity of less than 1.5 years.
[60-] 1.2.2 Liquidity The investment portfolio shall remain sufficiently liquid to meet all operating requirements that may be reasonably anticipated. This is accomplished by structuring the portfolio so that securities mature concurrent with cash needs to meet anticipated demands. Furthermore, since all possible cash demands cannot be anticipated, the portfolio should consist largely of securities with active secondary or resale markets. A portion of the portfolio may also be placed in an interest bearing checking account in order to meet ongoing obligations. [60-] 1.2.3 Yield The investment portfolio shall be designed with the objective of attaining a market rate of return throughout budgetary and economic cycles, taking into account the investment risk constraints and liquidity needs. Return on investment is of secondary importance compared to the safety and liquidity objectives described above. Investments are limited to relatively low risk securities in anticipation of earning a fair return relative to the risk being assumed. Securities shall not be sold prior to maturity with the following exceptions: A security with declining credit may be sold early to minimize loss of
principal. Liquidity needs of the portfolio may require that the security be sold.
[60-] 1.3 Adoption of Policy Any revisions to the Policy must be approved by the Board per Board Policy # 11. [60-] 1.4 Scope This Policy applies to all available funds, including bond / construction funds and operating funds of WaterOne, but not to the investment of Defined Benefit Retirement Plan funds. Investment of these funds is governed by The Master Statement of Investment Policies and Objectives of The Water District #1 of Johnson County Fifth Revised Retirement Plan. Investment of both bond / construction funds and operating funds is also governed by bond covenants which may be more restrictive than Policy requirements. [60-] 1.5 Pooling of Funds Except for cash in certain restricted and special funds, WaterOne will consolidate cash balances from all funds to maximize investment earnings. Investment income will be allocated to the various funds based on their respective ownership and in accordance with generally accepted accounting principles.
- 195 -
WATERONE 2015 BUDGET FISCAL POLICIES & PROCEDURES
2/24/2015 9:47:00 AM H:\Finance\FINSHARE\1BUDGET\2015 Budget\FINAL Budget Book\19-Fiscal Policies\Water One Fiscal Policies 2015 Budget Book FINAL.docx
[60-] 1.6 Suitable and Authorized Investment Parameters The following policies will assist WaterOne with attaining the objectives stated in Section 1.2. In accordance with, and subject to restrictions imposed by, current statutes and bond covenants applicable to both bond funds and operating funds, the following list represents the entire range of investments that WaterOne will consider and which shall be authorized for the investment, by WaterOne, of aforementioned funds. [60-] 1.6.1 Authorized Investments for Operating Funds and Bond / Construction Funds Investment of operating funds, and investment of all bond / construction funds is limited to the following list of authorized investments: Funds needed for ongoing daily operations are to be held in a fully
collateralized interest bearing Time Deposit Account or Demand Deposit Account.
Direct obligations of the United States of America or any agency thereof, or obligations the principal of and interest on which are unconditionally guaranteed by, the United States of America.
o US Treasuries o Debt obligations of Government National Mortgage Association
(Ginnie Mae)
Debt obligations of the following United States Government Sponsored Enterprises (GSE):
o Federal Home Loan Mortgage Company (Freddie Mac) o Federal National Mortgage Association (Fannie Mae) o Federal Home Loan Bank (FHLB)
Mortgage Backed Securities (MBS) the principal of and interest on which are unconditionally guaranteed by the United States of America.
Collateralized Repurchase Agreements backed at 100% by acceptable
collateral limited to the following: o Direct obligations of the United States of America or any agency
thereof, or obligations the principal of and interest on which are unconditionally guaranteed by, the United State of America. US Treasuries Debt obligations of Government National Mortgage
Association (Ginnie Mae) o Debt obligations of the following United States Government
Sponsored Enterprises (GSE): Federal Home Loan Mortgage Company (Freddie Mac) Federal National Mortgage Association (Fannie Mae) Federal Home Loan Bank (FHLB)
- 196 -
WATERONE 2015 BUDGET FISCAL POLICIES & PROCEDURES
2/24/2015 9:47:00 AM H:\Finance\FINSHARE\1BUDGET\2015 Budget\FINAL Budget Book\19-Fiscal Policies\Water One Fiscal Policies 2015 Budget Book FINAL.docx
Guaranteed Investment Contracts (GIC) with any bank, non-bank financial
institution or insurance company that has long-term debt (or claims paying ability for insurance companies) rated at least “A“ or “A2” by Standard & Poor’s or Moody’s respectively. In the case of a guaranteed corporation, the long–term debt (or claims paying ability for insurance companies) of the guarantor must be rated at least “A“ or “A2” by Standard & Poor’s and Moody’s respectively. Upon downgrade below these ratings, the GIC provider must either post collateral or assign the agreement to a provider meeting the rating qualifications above. Acceptable collateral and margin requirements, if any, are to be specified in the GIC agreement.
Kansas Municipal Investment Pool (KMIP) – Reference KSA 12-1677b Funds needed for ongoing daily operations are to be held in a fully
collateralized interest bearing Time Deposit Account or Demand Deposit Account.
[60-] 1.7 Collateralization Funds needed for ongoing daily operations and kept in an interest bearing checking account at WaterOne’s primary banking institution, are to be collateralized in an amount equal to a minimum of 100% of the account balance on deposit, less the amount insured by the FDIC. A pledged security report will be provided to WaterOne by the Federal Reserve on a monthly basis and will provide the following details regarding the collateral: Pledgee Name and ID Number Pledgor Name and ID or ABA Number Cusip Par Amount Description and Maturity Date of Collateral
Acceptable collateral includes: Direct obligations of the United States of America or any agency thereof,
or obligations the principal of and interest on which are unconditionally guaranteed by, the United States of America.
o US Treasuries o Debt obligations of Government National Mortgage Association
(Ginnie Mae)
Debt obligations of the following United States Government Sponsored Enterprises (GSE):
o Federal Home Loan Mortgage Company (Freddie Mac) o Federal National Mortgage Association (Fannie Mae) o Federal Home Loan Bank (FHLB)
- 197 -
WATERONE 2015 BUDGET FISCAL POLICIES & PROCEDURES
2/24/2015 9:47:00 AM H:\Finance\FINSHARE\1BUDGET\2015 Budget\FINAL Budget Book\19-Fiscal Policies\Water One Fiscal Policies 2015 Budget Book FINAL.docx
Mortgage Backed Securities (MBS) the principal of and interest on which are unconditionally guaranteed by the United States of America.
[60-] 1.8 Diversification The investment portfolio shall be diversified by investing in securities with varying maturities and in varying types of securities with the following maximum portfolio limits as a percentage of the par value of WaterOne’s total investment portfolio (all funds combined with the exception noted below for investment in GICs).
o Collateralized Time Deposit or Demand Deposit Account 100% o U.S. Treasuries and U.S. Agencies 100% o Government Sponsored Enterprises (GSE) 80% o Repurchase Agreements 30% o Guaranteed Investment Contracts 100%/25%* o Kansas Municipal Investment Pool (KMIP) 25%
*Up to 100% of Bond / Construction Funds may be invested in GICs. Up to 25% of Operating Funds may be invested in GICs.
Investments should be made as to avoid over-concentration in securities from any one specific issuer, with the exception of U.S. Treasuries. [60-] 1.9 Maximum Maturities To the extent possible, WaterOne shall attempt to match its investments with anticipated cash flow requirements. WaterOne shall adopt a balanced portfolio approach structuring the core portfolio (maturities over one year) with a weighted average maturity range of 1 – 2 years. The maximum investment portfolio maturity shall be two years, with the exception of funds invested in KMIP, which may be invested up to the pool’s maximum maturity. Reserve funds and other funds with longer-term investment horizons may be invested in longer maturities if these maturities coincide as nearly as practicable with the expected use of funds. A portion of the portfolio shall be invested in an authorized investment providing readily available funds such as Time Deposit or Demand Deposit accounts, KMIP and Overnight Repurchase Agreements to insure that appropriate liquidity is maintained to meet ongoing obligations. The maximum average maturity of the total portfolio, including construction / bond funds shall not exceed 1.5 years. [60-] 1.10 Intent to Hold to Maturity It is the intent of WaterOne to hold all securities to maturity unless liquidation of invested funds is required for liquidity needs or for necessary portfolio
- 198 -

WATERONE 2015 BUDGET FISCAL POLICIES & PROCEDURES
2/24/2015 9:47:00 AM H:\Finance\FINSHARE\1BUDGET\2015 Budget\FINAL Budget Book\19-Fiscal Policies\Water One Fiscal Policies 2015 Budget Book FINAL.docx
adjustments. The sale of securities prior to maturity shall require the prior approval of the Director of Finance. [60-] 1.11 Investments Maturity Management When structuring the maturity composition of the investments, the Cash & Investment Manager shall evaluate current and expected interest rate yields in consultation with the Investment Adviser.
[60-] 1.12 Portfolio Management All investments of WaterOne funds shall be managed through the office of the Director of Finance consistent with this Policy. The Cash & Investments Manager will provide reports on a monthly basis for review by the Director of Finance. [60-] 1.13 Cash Management & Investment Practices WaterOne’s cash management practices shall ensure that funds held by, and belonging to, WaterOne are managed in compliance with this Policy and in a manner that provides for adequate funds to be available to meet all disbursement requirements and obligations of WaterOne in a timely manner. [60-] 1.14 Trading Authorization All trading accounts will be held in the name of “Water District No. 1 of Johnson County, Kansas”. The General Manager shall have all trading authority for the investment of WaterOne funds and that trading authority shall be exercised by the Director of Finance, the Cash & Investments Manager and the Investment Analyst. [60-] 1.15 Bond and Operating Fund Investment Policy Review and Revisions This Policy shall be reviewed by the Cash & Investments Manager and any revisions to the Policy must be approved by the WaterOne’s Board as specified in Board Policy No. 11. [60-] 1.16 Arbitrage WaterOne’s investment position relative to arbitrage restrictions is to continue pursuing the maximum yield on applicable investments while ensuring the safety of capital and liquidity and to rebate excessive earnings if necessary. [60-] 1.17 Reasonable and Prudent Person Standard The standard of care to be used by the investment officials shall be the “reasonable and prudent person” standard and shall be applied in the context of managing an overall portfolio. Investment officers acting in accordance with written procedures and this Policy and exercising due diligence shall be relieved of personal responsibility for an individual security’s credit risk or market price changes, provided deviations from expectations are reported in a timely fashion
- 199 -
WATERONE 2015 BUDGET FISCAL POLICIES & PROCEDURES
2/24/2015 9:47:00 AM H:\Finance\FINSHARE\1BUDGET\2015 Budget\FINAL Budget Book\19-Fiscal Policies\Water One Fiscal Policies 2015 Budget Book FINAL.docx
and the liquidity and the sale of securities are carried out in accordance with the terms of this Policy. [60-] 1.18 Ethics and Conflicts of Interest Officers and employees involved in the investment process shall refrain from personal business activity that could conflict with the proper execution and management of the investment program, or that could impair their ability to make impartial decisions. Employees and investment officials shall disclose any material interests in financial institutions with which they conduct business. They shall further disclose any personal financial / investment positions that could be related to the performance of the investment portfolio. Employees and officers shall refrain from undertaking personal investment transactions with the same individual with whom business is conducted on behalf of WaterOne. [60-] 1.19 Delegation of Authority Authority to manage the investment program is granted to the Director of Finance. Responsibility for the operation of the investment program is hereby delegated to the Cash and Investments Manager, who shall act in accordance with established written procedures and internal controls for the operation of the investment program consistent with this Policy. The Cash and Investments Manager may delegate any tasks to the Investment Analyst. No person may engage in an investment transaction except as provided under the terms of this Policy. [60-] 1.20 Authorized Financial Dealers and Institutions A list will be maintained of financial institutions and broker/ dealers authorized to provide investment services to WaterOne. All financial institutions and broker / dealers who desire to become qualified for investment transactions must supply the following as appropriate: Audited financial statements Proof of Financial Industry Regulatory Authority (FINRA) certification Proof of state registration Certification of having read and understood the Policy
[60-] 1.21 Competitive Placement All investment purchase transactions are to be awarded on a competitive bid basis, however WaterOne reserves the right to accept offerings which do not represent the lowest cost if other considerations are relevant, such as settlement date restrictions or failure of the financial institution / broker / dealer to provide a timely response. At least two quotations must be solicited. Solicitations for offerings are documented and filed for auditing purposes. Ties are given to the bank/ broker holding the main banking relationship with WaterOne. Offerings received after a reasonable response time may not be considered at WaterOne’s discretion.
- 200 -
WATERONE 2015 BUDGET FISCAL POLICIES & PROCEDURES
2/24/2015 9:47:00 AM H:\Finance\FINSHARE\1BUDGET\2015 Budget\FINAL Budget Book\19-Fiscal Policies\Water One Fiscal Policies 2015 Budget Book FINAL.docx
[60-] 1.22 Delivery vs. Payment All trades will be executed with the Fed Wire Book Entry system of Delivery vs. Payment (DVP) to ensure that securities are deposited in an eligible financial institution prior to the release of funds. [60-] 1.23 Safekeeping and Custody All securities are to be perfected in the name of “Water District No. 1 of Johnson County, Kansas” and held in safekeeping under the custody of a financial institution, such as a bank or brokerage firm, with legal responsibility for the securities. For each security held, the custodian will issue a safekeeping receipt indicating ownership by WaterOne. The safekeeping agent shall prepare and deliver to WaterOne a holdings report and a transaction summary report monthly. [60-] 1.24 Internal Controls The investment program will operate under an internal control structure designed to ensure that the assets of WaterOne are protected from loss, theft or misuse. The internal control structure shall be designed to provide reasonable assurance that these objectives are met. The concept of reasonable assurance recognizes that (1) the cost of a control should not exceed the benefits likely to be derived and (2) the valuation of costs and benefits requires estimates and judgments by management. The internal controls shall address the following points: Separation of transaction authority from accounting and record keeping Custodial safekeeping Avoidance of physical delivery securities Clear delegation of authority to subordinate staff members Written confirmation of transactions for investments, wire and ACH
transfers [60-] 1.25 Reporting The Cash & Investment Manager shall prepare investment portfolio reports on a monthly basis. [60-] 1.25.1 Report Contents The Cash & Investments Manager shall prepare investment reports on a monthly basis showing the investment activity (purchases and maturities) over the prior month, average daily investments, accrued monthly investment income and the annualized yield on investments. Any variance of the portfolio with the Policy will also be reported. [60-] 1.26 Performance Standards / Benchmarking The investment portfolio will be managed in accordance with the parameters specified in this Policy. The portfolio should obtain a market average rate of return during a market economic environment of stable interest rates. The short term portion of the portfolio (less than one year maturity) should exceed the 91
- 201 -
WATERONE 2015 BUDGET FISCAL POLICIES & PROCEDURES
2/24/2015 9:47:00 AM H:\Finance\FINSHARE\1BUDGET\2015 Budget\FINAL Budget Book\19-Fiscal Policies\Water One Fiscal Policies 2015 Budget Book FINAL.docx
day U.S. Treasury Bill rate. An appropriate benchmark, such as the 1-2 Year Treasury Index, shall be established for the long term portion of the portfolio (maturity one year and greater) against which portfolio performance and duration shall be compared on a regular basis. [60-] 1.27 Marking to Market The market value of the portfolio shall be calculated, in accordance with GASB Statement 31, on a monthly basis and reflected on the applicable Fund Analysis report each month. Market values of all portfolio holdings will be obtained from a reputable and independent source. [60-] 1.28 Use of External Consultants / Advisers External investment consultants and/or advisers may be engaged to assist with the management of all or part of the total portfolio. [60-] 1.29 Policy Exemptions Any investment held as of the first date of approval of any revision to this Policy that does not meet the revised guidelines of the Policy, shall be exempted from the Policy requirements until maturity or liquidation of the investment, at which time monies shall be reinvested as provided by the revised Policy. [60-] 1.30 Personnel Authorized to Secure Investments for WaterOne The following staff positions are authorized to secure investments for WaterOne in accordance with WaterOne policies and controls:
General Manager Director of Finance Cash & Investments Manager
Investment Analyst
- 202 -
WATERONE 2015 BUDGET FISCAL POLICIES & PROCEDURES
2/24/2015 9:47:00 AM H:\Finance\FINSHARE\1BUDGET\2015 Budget\FINAL Budget Book\19-Fiscal Policies\Water One Fiscal Policies 2015 Budget Book FINAL.docx
VII. RESERVE POLICIES
701. Purpose The purpose of WaterOne’s reserves is to ensure that sufficient funding is
available at all times to meet operating, capital, and debt service obligations. Reserves are managed in a manner that allows WaterOne to meet unforeseeable events while avoiding significant water rate fluctuations due to unavoidable changes in cash flow requirements.
Board Policy #33
Adequate reserves and the financial policies governing them are multi-purpose: a. They can provide rate stabilization after all other measures have been
evaluated to meet unexpected fluctuations in either revenue or service demands.
b. They can smooth cash flow drains in cyclical low revenue months. c. They can provide financing flexibility. d. They can support bond ratings in the capital markets.
Properly managed reserves insure uninterrupted business operations from
cycle to cycle and in extraordinary circumstances.
702. Funding Order WaterOne’s reserves are each designed to meet specific purposes and
defined with specific rules. In order of priority funding they are: a. Bond Reserve Fund - Defined by Bond Covenants – Section 703.
Funded by cash and/or equivalent security. b. Operating Contingency - Defined by Bond Covenants – Section 703.
Increases are funded as a revenue requirement in the annual budget. c. Negative Cash Flow Reserve – Defined by Board Policy # 34,
increased as recommended by staff on an as-needed basis when year-end funds are available.
d. Rate Stabilization Reserve – Defined by Board Policy #33, funded as needed when year-end funds are available or from other sources as approved by the Board.
Reserve policies and reserve levels are reviewed annually as part of the
budget process and policies and procedures are updated accordingly.
- 203 -
WATERONE 2015 BUDGET FISCAL POLICIES & PROCEDURES
2/24/2015 9:47:00 AM H:\Finance\FINSHARE\1BUDGET\2015 Budget\FINAL Budget Book\19-Fiscal Policies\Water One Fiscal Policies 2015 Budget Book FINAL.docx
703. Fund Balance The use of reserves is meant as a temporary supplement to annually
augment planned cash flow activities (Negative Cash Flow Reserve, Board Policy #34) and to provide flexibility in extenuating circumstances.
(Bond Covenant Reserves - Section 703, Rate Stabilization Reserves – Board Policy #33, Negative Cash Flow Reserve – Board Policy #34).
Staff must evaluate the length and severity of any economic condition and
its impact on future revenue and expenditure assumptions to determine what must be done to achieve a balanced budget.
Regardless of what may be causing the problem, the reserves will be used
only after other remedies such as expenditure reductions have been evaluated.
It is critical that the issues that are causing the imbalance be identified and
addressed. Then, if a problem still exists, funds from the reserves can be utilized to maintain liquidity and rate stability.
704. Reserves 704.1 Bond Resolution Section 703 Operating Contingency The required purpose and balances of this reserve are defined by Section
703 of the Bond Covenants (Applications of Moneys in Funds). They are calculated monthly and treated as a set-aside to insure a measure of liquidity and safety of investment for the bondholders and are generally considered the last resort available for anything other than very temporary cash spending.
Section 703 of the Bond Covenants (Applications of Moneys in Funds)
By bond covenant, WaterOne covenants and agrees that as long as any
senior parity debt remains outstanding that it will administer and deposit all of the moneys held in the Water System General Fund as described below.
a. There shall first be paid all amounts due for Operation and
Maintenance Expenses. Thereafter, Section 703 Bond Covenant Reserves are to be set aside in the following manner.
- 204 -

WATERONE 2015 BUDGET FISCAL POLICIES & PROCEDURES
2/24/2015 9:47:00 AM H:\Finance\FINSHARE\1BUDGET\2015 Budget\FINAL Budget Book\19-Fiscal Policies\Water One Fiscal Policies 2015 Budget Book FINAL.docx
b. Debt Service (Variable Requirement) – There shall be deposited on the first day of each month a pro rata amount set aside to the Principal and Interest Fund. 1. An amount equal to not less than the pro rata amount of principal
and interest of debt service funding that will become due on the next succeeding payment date.
2. The bond covenants state that, “all amounts deposited to the Principal and Interest Fund…shall be expended and used…for the sole purpose of paying the principal of and interest…when the same become due.”
3. Any amount due for replenishment of the Bond Reserve Funds in the event of a draw or other shortfall.
c. Extraordinary Contingency (Non-Variable Requirement) – An adequate
reserve for operating and extraordinary renewal and replacement cost contingencies of not less than $2,000,000.
d. 60 Day Reserves (Variable Requirement)
1. The payment of Operation and Maintenance Expenses for the ensuing 60 days
2. The necessary material purchase requirements for the ensuing 60 days.
e. Obligated Reserves (Variable Requirement) – Reasonable reserves for
contracts and commitments. Included are payables, line extension advances, capital carryovers from a previous budget year, and benefit area refunds.
An increase to the 703 Reserve is budgeted annually as an expense to
recognize the increased costs of the variable portions of the reserve. The 703 Reserve will always be funded first before any allocation is made
to WaterOne’s Negative Cash Flow Reserve or the Rate Stabilization Reserve.
704.2 Negative Cash Flow Reserves The purpose of Negative Cash Flow Reserve is to insure financial stability
during the months when cash receipts are cyclically low, normally during the months of January through June each year. Though receipts during these months are generally lower, WaterOne’s funding obligations such as payroll, debt service, insurance premiums, and retirement plan contributions occur throughout the year at relatively fixed levels.
Board Policy #34
- 205 -
WATERONE 2015 BUDGET FISCAL POLICIES & PROCEDURES
2/24/2015 9:47:00 AM H:\Finance\FINSHARE\1BUDGET\2015 Budget\FINAL Budget Book\19-Fiscal Policies\Water One Fiscal Policies 2015 Budget Book FINAL.docx
This reserve, during the low cash flow months, is used as an extension to
water sales revenue. It can be used to keep the Section 703 Reserve intact, pay for normal operation and maintenance expenses and/or cover any shortfalls in annual capital requirements.
This is a revolving reserve used during the annual low revenue cycle. This reserve was originally established in January 1996. Since then, the
reserve has been increased as operation and maintenance, annual capital, and debt service expenses have increased due to inflation or expanded programs. As these and fixed costs continue their natural escalation, the funding level for this reserve will continue to grow on an incremental basis.
Each year when the budget is prepared, a cash flow needs analysis will be
completed based on input from department heads. The timing of annual capital purchases, capital carryovers, infrastructure replacements, and ongoing operating needs will be used to determine the amount of negative cash flow reserve requirements for the coming year and the subsequent reserve funding level.
The Negative Cash Flow Reserve cannot be replenished until after the
Section 703 Reserves are fully funded. Once this occurs, and current monthly cash flow needs are satisfied, then the Negative Cash Flow Reserve can be replenished up to the current Board approved funding level.
Rebuilding the reserve usually begins early in the third quarter as actual
summer water sales begin to materialize as cash. 704.3 Rate Stabilization Reserve The Rate Stabilization Reserve was established to address unforeseen
revenue shortfalls such as: a. Weather related water sales deficits b. Economic downturns c. Unexpected disaster or accident d. Unanticipated, but necessary emergency repairs and/or e. An unanticipated mid-year increase in such fixed costs as power, fuel,
or materials. Board Policy #27 & #33
The Rate Stabilization Reserve is the most flexible of the reserves and
can be used to meet a variety of needs.
- 206 -
WATERONE 2015 BUDGET FISCAL POLICIES & PROCEDURES
2/24/2015 9:47:00 AM H:\Finance\FINSHARE\1BUDGET\2015 Budget\FINAL Budget Book\19-Fiscal Policies\Water One Fiscal Policies 2015 Budget Book FINAL.docx
This fund is used for extraordinary circumstances after all other funding avenues have been evaluated.
Should any unanticipated shortages in revenues be deemed to be
recurring, such as a permanent power rate increase, adjustments will be made in the following budget year to reflect revised revenue or expenditure expectations.
Formal Board approval is required prior to fund usage. Budgeted operating expenditures are funded with budgeted revenues,
both of which are planned on a “normal year” basis. A “normal year” being defined as a year in which weather conditions are neither wet nor dry and expenditures are not intended to cover catastrophic conditions.
The level of this fund should be such that if conditions outside the “norm”
as described above do occur, then a source of funding will be available. Funding levels for this reserve will be set by the Board.
The appropriate level of this reserve will be analyzed on an annual basis
as part of the operating budget development cycle and the year-end uncommitted funds evaluation.
The Board will be notified when the reserve reaches a minimum level as
determined by the Board. Replenishment of this fund is defined by Board Policy and will be funded
as-needed when year-end funds are available or from other sources as approved by the Board.
Annually, the Rate Stabilization Reserve is the last reserve funded and
may take several years to replenish depending on the level of depletion.
- 207 -

WATERONE 2015 BUDGET FISCAL POLICIES & PROCEDURES
2/24/2015 9:47:00 AM H:\Finance\FINSHARE\1BUDGET\2015 Budget\FINAL Budget Book\19-Fiscal Policies\Water One Fiscal Policies 2015 Budget Book FINAL.docx
VIII. CAPITAL
WaterOne differentiates between three types of capital improvements: Annual Capital, Master Plan, and Transmission & Distribution. 801. Annual Capital Annual Capital funding is for the replacement of fleet, major equipment,
and for the capitalized repair, replacement and relocation of existing mains, services and hydrants.
Annual Capital combined with the annual contribution to Transmission &
Distribution is defined as Total Annual Capital and is set at least equal to depreciation.
WaterOne’s capitalization threshold is $5,000.
Depreciation is not budgeted but used only as a funding guideline. Capital expenditures are budgeted in the year the item is to be purchased
or constructed. Carryover of annual capital funds is allowed for items not purchased or
completed in the current year with appropriate review. Fleet requests are evaluated against standards developed for both age
and miles. New projects identified during a budget year not funded in the approved
budget can with the approval of the General Manager and the Director of Finance be funded from the Omission & Contingency (O&C) Budget.
802. Master Plan Master Plan capital projects are generally for new major facilities or
systems having a long-term life of benefit to WaterOne or for major replacements. These projects can benefit current customers as well as new customers.
Master Plan projects consist of three types of facilities:
a. Production – water source and treatment equipment and structures including river intakes, collector wells, a river jetty, reservoirs, residual monofills, supply mains, and treatment plants.
- 208 -
WATERONE 2015 BUDGET FISCAL POLICIES & PROCEDURES
2/24/2015 9:47:00 AM H:\Finance\FINSHARE\1BUDGET\2015 Budget\FINAL Budget Book\19-Fiscal Policies\Water One Fiscal Policies 2015 Budget Book FINAL.docx
b. Pumping & Storage – equipment and structures including pumps, pump stations, underground and ground level reservoirs as well as elevated storage in water towers.
c. Transmission & Distribution – water mains, isolation valves, pressure reducing valves, and tunnels for mains.
The current Master Plan is based on the latest Water Supply Master Plan
developed by WaterOne’s consulting engineers, Black & Veatch. Recommendations developed for water supply and treatment facilities are designed to meet projected demands for forty years. The Transmission and Distribution recommendations will meet projected demands for twenty years.
Current year projects are reviewed no less than quarterly by staff and the
consulting engineers to reaffirm timelines, costs in relationship to current economic conditions and to ensure available revenue resources.
The Master Plan is divided into phases. These phases are designed to
allow for flexibility and to ensure that capital investment is made at the correct time to provide an adequate supply of water without building capacity in excess of what will be needed.
Funding for Master Plan projects come from three sources which are
expended in the following priority order: 1) proceeds from revenue bonds; 2) System Development Charges; and 3) water sales revenue.
Funds are set aside within the Master Plan Fund as “committed” when the
project is awarded. Although it is the practice to keep the balance no lower than $5,000,000 in
the Master Plan Fund, the objective is to accumulate a larger fund balance in order to reduce the size of future bond issues.
802.1 Annual Designation of Water Sales Revenue to Master Plan
Each year a designation of water sales revenue is budgeted to the
Master Plan Fund in the annual Board adopted budget.
The annual designation of water sales revenue to the Master Plan Fund is analyzed each year as part of the budget process. The target is to designate a minimum of 5% of revenue to the Master Plan Fund in each annual budget; however, the percent designation is reviewed and updated annually based on the current economic conditions and the Master Plan Fund balance.
- 209 -
WATERONE 2015 BUDGET FISCAL POLICIES & PROCEDURES
2/24/2015 9:47:00 AM H:\Finance\FINSHARE\1BUDGET\2015 Budget\FINAL Budget Book\19-Fiscal Policies\Water One Fiscal Policies 2015 Budget Book FINAL.docx
The goal of designating a minimum of 5% of revenue to the Master Plan Fund is to reduce the size of future bond issues and provide some budget stability. In deficit years, the funding can be reduced which provides budget stability by offsetting water revenue shortfalls.
803. Transmission and Distribution Transmission and Distribution projects are for the repair and maintenance
of existing infrastructure and are funded by water rates on a pay-as-you-go basis.
Funding is budgeted as a component of the Total Annual Capital Budget.
The combined budget for Annual Capital and Transmission and
Distribution is set to equal or exceed WaterOne’s depreciation of all assets.
Transmission and Distribution consists of four types of projects: main
replacements, relocation projects, general improvements, and capital main breaks.
Main Replacements a. Main replacements are budgeted based on the results of a water main
asset management program.
b. The goal is to replace all assets, including mains, at the time which produces the lowest life-cycle cost of that particular asset while continuing to accomplish WaterOne’s mission of providing a reliable water supply. Modeling is used to determine the optimum time for replacements.
c. The decision as to which main replacement projects are the highest
priority is determined by a decision matrix that includes many factors, some of which are: 1. the number of main breaks per mile per year 2. condition assessment 3. a risk analysis of the consequence of failure 4. cost reduction by timing replacements in conjunction with street
improvement projects.
- 210 -
WATERONE 2015 BUDGET FISCAL POLICIES & PROCEDURES
2/24/2015 9:47:00 AM H:\Finance\FINSHARE\1BUDGET\2015 Budget\FINAL Budget Book\19-Fiscal Policies\Water One Fiscal Policies 2015 Budget Book FINAL.docx
Relocation Projects a. These projects are constructed in coordination with street improvement
projects planned by the governmental entities in areas that WaterOne serves.
b. The General Manager has the authority to approve and sign water
facility Relocation Agreements with cities, counties, and other political subdivisions of the state expanding or improving street right-of-way under the following conditions: 1. Where WaterOne retains its private easement and relocation is
requested, the requesting political subdivision will fully indemnify it for the cost of the adjustment within its retained easement.
2. Any disclaimer of WaterOne’s private easements is compensated by a substituted cost reimbursement for all immediate and future relocations within the street right-of-way.
3. Any expense borne by WaterOne will be only for relocation of its facilities that were originally located in street right-of-way.
Board Policy #31 – Relocation Agreements
General Improvements a. General system improvements include normal service connection
rehabilitation, main upsizing, and installing new mains and fire hydrants. K.S.A. 19-3514
b. WaterOne’s service connections are the pipe and related material that connect the water main to the meter. These service connections require ongoing replacement and rehabilitation in order to maintain a reliable water supply.
c. Main upsizing occurs when a main is replaced with a larger diameter
main to allow for increased capacity or water flow. Most upsizing is paid for by WaterOne and is done in conjunction with relocation projects to improve water flow throughout the system. Some upsizing is done when new housing and commercial development occurs and is paid for by the developer.
d. New mains are occasionally installed to extend the system, but
primarily to provide redundant supply or improve fire protection water flow in a particular area.
- 211 -

WATERONE 2015 BUDGET FISCAL POLICIES & PROCEDURES
2/24/2015 9:47:00 AM H:\Finance\FINSHARE\1BUDGET\2015 Budget\FINAL Budget Book\19-Fiscal Policies\Water One Fiscal Policies 2015 Budget Book FINAL.docx
Capital Main Breaks a. Main breaks are unplanned construction to replace sections of water
main or an entire fire hydrant that is broken and / or leaking.
b. If the nature of the leak is such that a clamp or component part can be used to make the repair, it is considered to be an operational maintenance cost. If a section of main, two feet or greater in length, is taken out and replaced with new main, it is considered to be a capital improvement.
- 212 -

WATERONE 2015 BUDGET FISCAL POLICIES & PROCEDURES
2/24/2015 9:47:00 AM H:\Finance\FINSHARE\1BUDGET\2015 Budget\FINAL Budget Book\19-Fiscal Policies\Water One Fiscal Policies 2015 Budget Book FINAL.docx
IX. POST BOND ISSUANCE COMPLIANCE
This section IX of WaterOne’s Fiscal Policies and Procedures (the “Compliance Policy”) is intended to guide WaterOne in meeting its obligations under applicable statutes, regulations and documentation associated with WaterOne’s publicly offered and privately placed bonds, notes and other obligations (collectively “bonds”). This Compliance Policy addresses ongoing obligations following the issuance of bonds. These obligations may arise as a result of federal tax law (with respect to tax-exempt securities) and securities laws (with respect to ongoing disclosure) or as a result of contractual commitments made by the Issuer.
This Compliance Policy outlines obligations that may be applicable to each issue of bonds and identifies the party responsible for monitoring compliance. At WaterOne, the Director of Finance (the “Compliance Officer”) is responsible for ensuring that the Compliance Policy is followed and checklists and records are maintained. The Compliance Officer may delegate responsibility to employees and outside agents for developing and maintaining records and checklists. WaterOne will provide educational opportunities (opportunities to attend educational programs/seminars on the topic) for the parties identified in this policy with responsibilities for post-issuance compliance in order to facilitate their performance of these obligations.
901. Transcripts
901.1. Provision by Bond Counsel and Content
WaterOne’s bond counsel shall (for each issue) provide WaterOne with a transcript related to the issuance of bonds. It is expected that the transcript will include a full record of the proceedings related to the issuance of bonds, including proof of filing of I.R.S. Form 8038-G or 8038-GC, if applicable.
901.2. Retention Bond transcripts will be retained in the Records Center at WaterOne’s administrative offices located at 10747 Renner Boulevard, Lenexa, Kansas, or other authorized storage facility.
902. Federal Tax Law Requirements Applicable only if the bonds are issued as tax-exempt securities (or those securities treated under federal tax law as tax-advantaged securities such as Build America Bonds).
902.1. Use of Proceeds a. If the project(s) to be financed with the proceeds of the bonds will be
funded with multiple sources of funds, WaterOne will adopt an
- 213 -

WATERONE 2015 BUDGET FISCAL POLICIES & PROCEDURES
2/24/2015 9:47:00 AM H:\Finance\FINSHARE\1BUDGET\2015 Budget\FINAL Budget Book\19-Fiscal Policies\Water One Fiscal Policies 2015 Budget Book FINAL.docx
accounting methodology that maintains each source of funding separately and monitors the actual expenditure of proceeds of the bonds.
b. Records of expenditures (timing, amount, and account code of expenditure) of the proceeds of bonds will be maintained by the Compliance Officer.
c. Records of interest earnings on the proceeds of bonds will be maintained by the Compliance Officer. Interest earnings on proceeds will be deposited in the fund in which the proceeds of the bonds were deposited. If for any reason interest earnings will not remain in the fund in which the proceeds of bonds were deposited, then the plan for use of interest earnings will be discussed with WaterOne’s bond counsel.
d. Records of interest earnings on bond reserve funds will be maintained for the bonds (unless the original principal amount of the bond issue, including other issues during the same calendar year, was $5,000,000 or less).
e. Records of Declaration(s) of Intent to Reimburse will be maintained by
the Compliance Officer.
902.2. Arbitrage Rebate a. Rebate Monitor. The Compliance Officer will oversee the Rebate
Monitor. The Cash & Investments Manager, or other person designated by the Compliance Officer, will serve as Rebate Monitor and will monitor compliance with the arbitrage rebate obligations of WaterOne for each bond issue. WaterOne will provide educational opportunities, through attendance at educational programs/seminars on the topic of arbitrage regulations, to support the Rebate Monitor and facilitate his/her performance of these obligations.
b. Small Issuer Exception. When WaterOne issues bonds, if the Rebate
Monitor determines that the total principal amount of governmental obligations (including all-tax-exempt leases, etc.) of WaterOne issued or incurred will be greater than $5,000,000, the Rebate Monitor will monitor arbitrage rebate compliance.
c. Funds Subject to Rebate. In addition to funds expended for capital
project costs from the Construction Fund, when a bond reserve fund is established those proceeds are subject to arbitrage rebate as well. The Rebate Monitor will consult with bond counsel when bonds are issued to determine which funds are subject to arbitrage rebate. The Rebate Monitor will report to the Compliance Officer if any current “bona fide
- 214 -

WATERONE 2015 BUDGET FISCAL POLICIES & PROCEDURES
2/24/2015 9:47:00 AM H:\Finance\FINSHARE\1BUDGET\2015 Budget\FINAL Budget Book\19-Fiscal Policies\Water One Fiscal Policies 2015 Budget Book FINAL.docx
debt service fund” fails to meet requirements which allow exemption, such as the Principal and Interest Fund failing to zero out within the required period. The Rebate Monitor will evaluate, with the assistance of bond counsel or arbitrage rebate consultant if necessary, any new fund created outside the bond resolutions to determine if it is subject to rebate, and; any change of the use of an existing fund which could cause the fund to contain gross proceeds of a bond issue, such as the fund being used exclusively to pay debt service.
d. Rebate Exceptions. The Rebate Monitor will review the closing
certificate, arbitrage letter of instructions, tax certificate, tax agreement or other transcript documents relating to the instructions for compliance with federal tax law (the “tax certificate”) in the transcript in order to determine whether WaterOne is expected to comply with a spending exception that would exempt WaterOne from arbitrage rebate liability. If the tax certificate identifies this spending exception, then the Rebate Monitor will monitor the records of expenditures (described in 902.1. above) to determine whether WaterOne met the spending exception. The Rebate Monitor may engage the services of an arbitrage rebate compliance consultant to verify the spend down exception, if necessary. If no other funds are subject to arbitrage rebate and WaterOne has met the relevant spending exception, the Rebate Monitor will retain documentation demonstrating timing of expenditures, and will not need to perform arbitrage rebate calculations or pay an arbitrage rebate to the federal government.
e. Construction Fund Negative Arbitrage. If WaterOne did not meet or
does not expect to meet the spending exception described in (i) above, and no other funds are subject to arbitrage rebate, WaterOne will review the investment earnings records retained as described in 902.1.(c) above. If the investment earnings records clearly and definitively demonstrate that the average rate of return on investments of all proceeds of the issue was lower than the “arbitrage yield” on the issue then the Rebate Monitor will retain documentation describing the basis for such determination.
f. Bond Reserve Fund. The Rebate Monitor will monitor investment
earnings on the bond reserve fund for each bond issue, including allocating earnings by bond issue in any pooled reserve funds and retain such records for performance of the arbitrage rebate calculation.
g. Consultant Services. If the spending exception is not met and if
records do not clearly demonstrate negative arbitrage, or if other funds such as a bond reserve fund must be included in the arbitrage rebate calculation, WaterOne will retain the services of an arbitrage rebate consultant in order to calculate any potential arbitrage rebate liability.
- 215 -

WATERONE 2015 BUDGET FISCAL POLICIES & PROCEDURES
2/24/2015 9:47:00 AM H:\Finance\FINSHARE\1BUDGET\2015 Budget\FINAL Budget Book\19-Fiscal Policies\Water One Fiscal Policies 2015 Budget Book FINAL.docx
Calculations will be performed no later than 60 days after the fifth anniversary of the date of each issue, every five years thereafter, and no later than 60 days following the retirement of the last obligation of the issue. The selected rebate consultant shall provide a written report in each instance to the Compliance Officer with respect to the issue and with respect to any arbitrage rebate owed, if any.
h. Rebate Reporting and Payment. If, based on the report of the rebate
consultant, WaterOne has an arbitrage rebate liability, WaterOne will file reports with the Internal Revenue Service. WaterOne will remit arbitrage rebate to the federal government no later than 60 days following the retirement of the last obligation of the issue.
902.3. Unused Proceeds Following Completion of the Project Following completion of the project(s), financed with the issue proceeds (or three years from the date of issuance if this occurs first), the Compliance Officer will:
a. review the expenditure records to determine whether the proceeds
have been allocated to the project(s) intended and if any questions arise, consult with bond counsel in order to determine the method of re-allocation of proceeds.
b. direct the use of remaining unspent proceeds in accordance with the
limitations set forth in the authorizing proceedings (e.g., bond resolution, bond ordinance, trust indenture, etc.) and if no provision is otherwise made for the use of unspent proceeds, to the redemption or defeasance of outstanding bonds of the issue.
c. consult with bond counsel, if after three years unused proceeds
remain, regarding potential yield restriction or yield reduction payments relating to the unspent bond proceeds.
902.4. Facilities and Use of the Facilities Financed with Proceeds, Private Use WaterOne’s Compliance Officer will monitor and confirm that WaterOne maintains an asset list or other record regarding all facilities and equipment that are bond-financed, and depreciation schedules for such facilities and equipment. In order to maintain tax-exemption of securities issued on a tax-exempt basis, the financed facilities (projects) are required to be used for governmental purposes during the life of the issue. The Compliance Officer will coordinate with WaterOne staff to monitor and maintain records regarding any private use of the projects financed with tax-exempt proceeds. The IRS Treasury Regulations prohibit private business use (use by private parties including nonprofit organizations and the federal
- 216 -

WATERONE 2015 BUDGET FISCAL POLICIES & PROCEDURES
2/24/2015 9:47:00 AM H:\Finance\FINSHARE\1BUDGET\2015 Budget\FINAL Budget Book\19-Fiscal Policies\Water One Fiscal Policies 2015 Budget Book FINAL.docx
government) of tax-exempt financed facilities beyond permitted de minimus amounts unless cured by a prescribed remedial action. Private use may arise as a result of activities such as the following:
a. Sale of the facilities; b. Lease or sub-lease of the facilities (including leases, easements or use
arrangements for areas outside the four walls, e.g., hosting of cell phone towers) or leasehold improvement contracts;
c. Management contracts (in which WaterOne authorizes a third party to
operate a facility, e.g., cafeteria), research contracts and naming rights contracts;
d. Preference arrangements (in which WaterOne permits a third party
preference, such as parking in a public parking lot); and. e. Joint-ventures, limited liability companies or partnership arrangements.
If the Compliance Officer identifies private use of tax-exempt debt financed facilities, the Compliance Officer will consult with WaterOne’s bond counsel to determine whether private use will adversely affect the tax-exempt status of the issue and if so, what remedial action is appropriate. The Compliance Officer should retain all documents related to any of the above potential private uses.
902.5. Records Retention The Compliance Officer will maintain records in WaterOne’s Records Center for each issue (the “Post Issuance Compliance and Disclosure Record”). Records will be retained by WaterOne for the life of the bond issue (and any issue that refunds the bond issue) and for a period of six years thereafter. Records will include:
a. Records with respect to matters described in section 901 and subsections 902.1 through 902.4
b. Copies of all certificates and returns filed with the IRS (e.g., for
payment of arbitrage rebate) and all reports regarding IRS examinations of Issuer or its bond financings.
c. Copies of all documents related to potential private use as set forth in
902.4. above, including leases, user agreements for use of the financed property (agreements that provide for use of the property for periods longer than 30 days), whether or not the use was within the four walls, e.g., use of the roof of the facility for a cell phone tower.
- 217 -

WATERONE 2015 BUDGET FISCAL POLICIES & PROCEDURES
2/24/2015 9:47:00 AM H:\Finance\FINSHARE\1BUDGET\2015 Budget\FINAL Budget Book\19-Fiscal Policies\Water One Fiscal Policies 2015 Budget Book FINAL.docx
d. Any other documentation necessary to establish the qualification for tax-exemption of the bonds.
903. Ongoing Disclosure Under the provisions of SEC Rule 15c2-12 (the “Rule”), underwriters are required to obtain an agreement for ongoing disclosure in connection with the public offering of bonds. Unless WaterOne is exempt from compliance with the Rule as a result of certain permitted exemptions, the transcript for each issue will include an undertaking by WaterOne to comply with the Rule.
a. The Compliance Officer will monitor compliance by WaterOne with its undertakings including an annual filing of operating and financial information.
b. The Compliance Officer will monitor events which might require
WaterOne to file notice of a listed “material event” in the Rule. The Compliance Officer will consult WaterOne’s bond counsel if a “material event” is identified, will cause to be filed any required disclosure, and will timely notify the Board of such disclosure.
c. The Compliance Officer will maintain as part of the issue’s Post
Issuance Compliance and Disclosure Record:
i. An annual disclosure monitoring and compliance checklist,
ii. A record of the annual filing of operating and financial information,
iii. A record of any material event disclosures, and
iv. A record of any voluntary continuing disclosures.
- 218 -
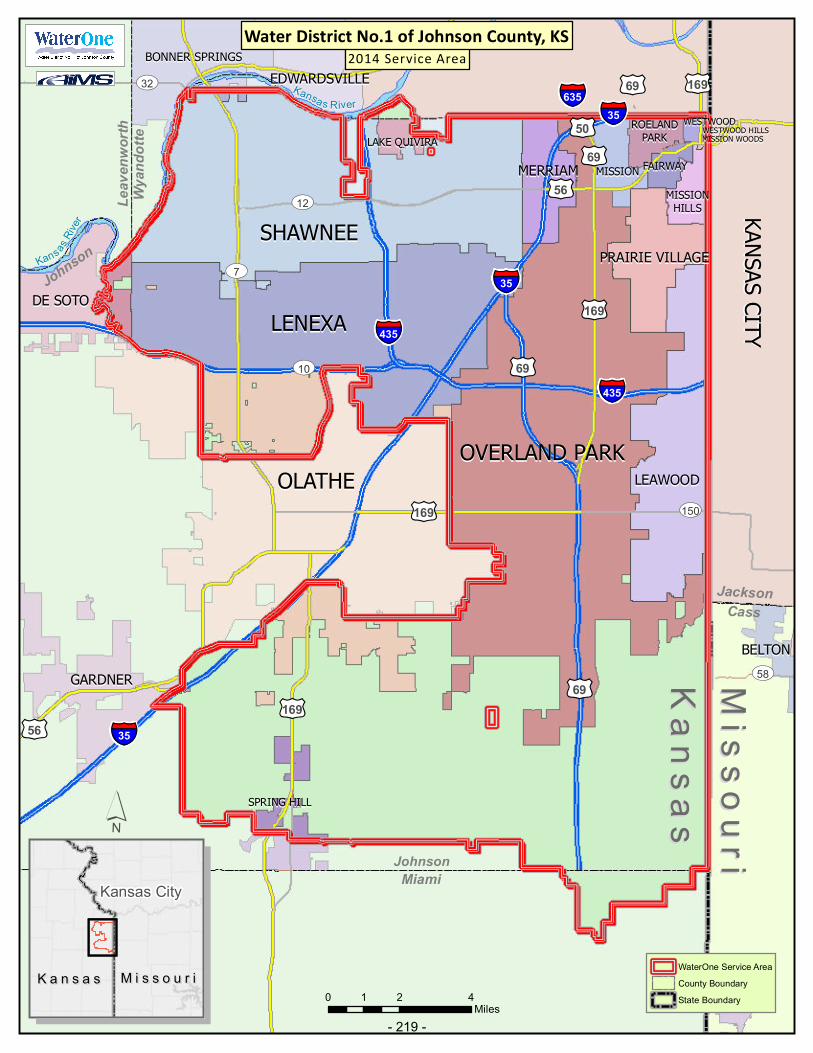
KansasKansasM
issouriM
issouri
Johnson
Miami
JacksonCass
Wyan
dotte
Leav
enwo
rth
Johnson
§̈¦435
§̈¦35
§̈¦635
§̈¦35
§̈¦35
§̈¦435
£¤69
£¤56
£¤50
£¤56
£¤169
£¤69
£¤69
£¤69
£¤169
£¤169
£¤169
UV10
UV12
UV32
UV150
UV58
UV7
UV10
£¤71
MISSION WOODSMISSION WOODSWESTWOOD HILLSWESTWOOD HILLS
MISSIONMISSION
SPRING HILLSPRING HILL
MISSIONMISSIONHILLSHILLS
FAIRWAYFAIRWAY
ROELANDROELANDPARKPARKLAKE QUIVIRALAKE QUIVIRA
LEAWOODLEAWOOD
DE SOTODE SOTO
GARDNERGARDNER
MERRIAMMERRIAM
PRAIRIE VILLAGEPRAIRIE VILLAGE
EDWARDSVILLEEDWARDSVILLE
BELTONBELTON
OLATHEOLATHE
LENEXALENEXA
SHAWNEESHAWNEE
OVERLAND PARKOVERLAND PARK
KANSAS CITYKANSAS CITY
WESTWOODWESTWOOD
KKaann ss aa ss RRii vv ee
rrBONNER SPRINGSBONNER SPRINGS
KKaannssaass RRiivveerr
0 2 41Miles
´
2014 Service AreaWater District No.1 of Johnson County, KS
Kansas City
K a n s a sK a n s a s M i s s o u r iM i s s o u r iState Boundary
WaterOne Service AreaCounty Boundary
- 219 -

POPULATION GROWTH 2002 to 2012 (1)
Between 2002 and 2012, Johnson County’s population grew by 83,377 (17.5%). Johnson County accounted for49% of the total population growth in the entire State of Kansas and 48% of the Kansas City MSA (2).
Kansas Population Growth: 2002 to 2012
JOHNSON COUNTY DEMOGRAPHICS POPULATION
Johnson Co.= 49%Balance of KS = 51%
Johnson Co. = 48%Balance of Kansas City MSA (2) = 52%
1. Source: County Economic Research Institute, 2014 Economic Primer 2. MSA is Metropolitan Statistical Area of Kansas City.3. Source: U.S. Census Bureau, 2010 Census 4. Source: 2013 Johnson County CAFR
Kansas City MSA (2) Population Growth: 2002 to 2012
Johnson County Population
2000 (3) ……………………………………................................. 451,086
2010 (3) ……………………………………................................. 544,179
2013 (4) ……………………………………................................. 567,132
WaterOne 2015 BudgetDEMOGRAPHICS
12/16/2014 ...\FINSHARE\1BUDGET\2015 Budget\Final Budget Book\20 Demographics\2015 BB DEMOGRAPHICS.ppt
- 220 -

JOHNSON COUNTY DEMOGRAPHICS EMPLOYMENT AND JOB GROWTH
JOB GROWTH 2003 TO 2013 (2)
The number of jobs in Johnson County grew from 286,654 in 2003 to 316,702 in 2013, an increase of 30,047jobs or 10%. Over the decade, Johnson County accounted for 65% of the total net increase in jobs in the Stateof Kansas and 111% of the job growth in the Kansas City MSA(3).
1. Source: County Economic Research Institute, December 2013 Johnson County Indicators
2. Source: County Economic Research Institute, 2014 Economic Primer
3. MSA is Metropolitan Statistical Area of Kansas City.
WaterOne 2015 BudgetDEMOGRAPHICS
12/16/2014 ...\FINSHARE\1BUDGET\2015 Budget\Final Budget Book\20 Demographics\2015 BB DEMOGRAPHICS.ppt
0 10,000 20,000 30,000 40,000 50,000
State of KS
Johnson Co.
KC MSA
- 221 -
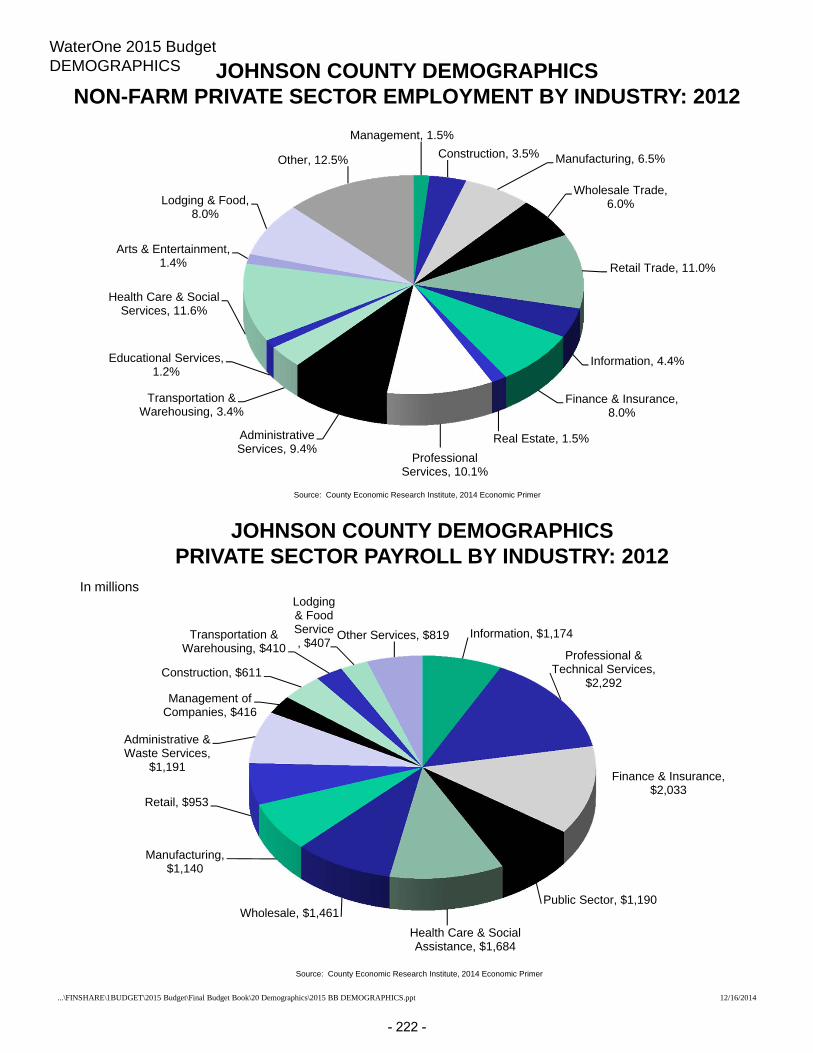
JOHNSON COUNTY DEMOGRAPHICSNON-FARM PRIVATE SECTOR EMPLOYMENT BY INDUSTRY: 2012
Source: County Economic Research Institute, 2014 Economic Primer
WaterOne 2015 BudgetDEMOGRAPHICS
12/16/2014...\FINSHARE\1BUDGET\2015 Budget\Final Budget Book\20 Demographics\2015 BB DEMOGRAPHICS.ppt
JOHNSON COUNTY DEMOGRAPHICSPRIVATE SECTOR PAYROLL BY INDUSTRY: 2012
Source: County Economic Research Institute, 2014 Economic Primer
In millions
Information, $1,174
Professional & Technical Services,
$2,292
Finance & Insurance, $2,033
Public Sector, $1,190
Health Care & Social Assistance, $1,684
Wholesale, $1,461
Manufacturing, $1,140
Retail, $953
Administrative & Waste Services,
$1,191
Management of Companies, $416
Construction, $611
Transportation & Warehousing, $410
Lodging & Food Service, $407 Other Services, $819
Management, 1.5%Construction, 3.5% Manufacturing, 6.5%
Wholesale Trade, 6.0%
Retail Trade, 11.0%
Information, 4.4%
Finance & Insurance, 8.0%
Real Estate, 1.5%Professional
Services, 10.1%
Administrative Services, 9.4%
Transportation & Warehousing, 3.4%
Educational Services, 1.2%
Health Care & Social Services, 11.6%
Arts & Entertainment, 1.4%
Lodging & Food, 8.0%
Other, 12.5%
- 222 -

JOHNSON COUNTY DEMOGRAPHICS QUALITY OF LIFE
$42,693
$59,524
$0 $10,000 $20,000 $30,000 $40,000 $50,000 $60,000 $70,000
2012 Per Capita Personal Income
Johnson County
United States
100%
98.5%
0% 10% 20% 30% 40% 50% 60% 70% 80% 90% 100% 110% 120% 130% 140% 150%
Cost of Living Index
Kansas City, MO-KS
United States
WaterOne 2015 BudgetDEMOGRAPHICS
12/16/2015...\FINSHARE\1BUDGET\2015 Budget\Final Budget Book\20 Demographics\2015 BB DEMOGRAPHICS.ppt
Source: 2013 Johnson County CAFR, Bureau of Business and Economic Research for U.S.
Source: Missouri Economic Research and Information Center
- 223 -
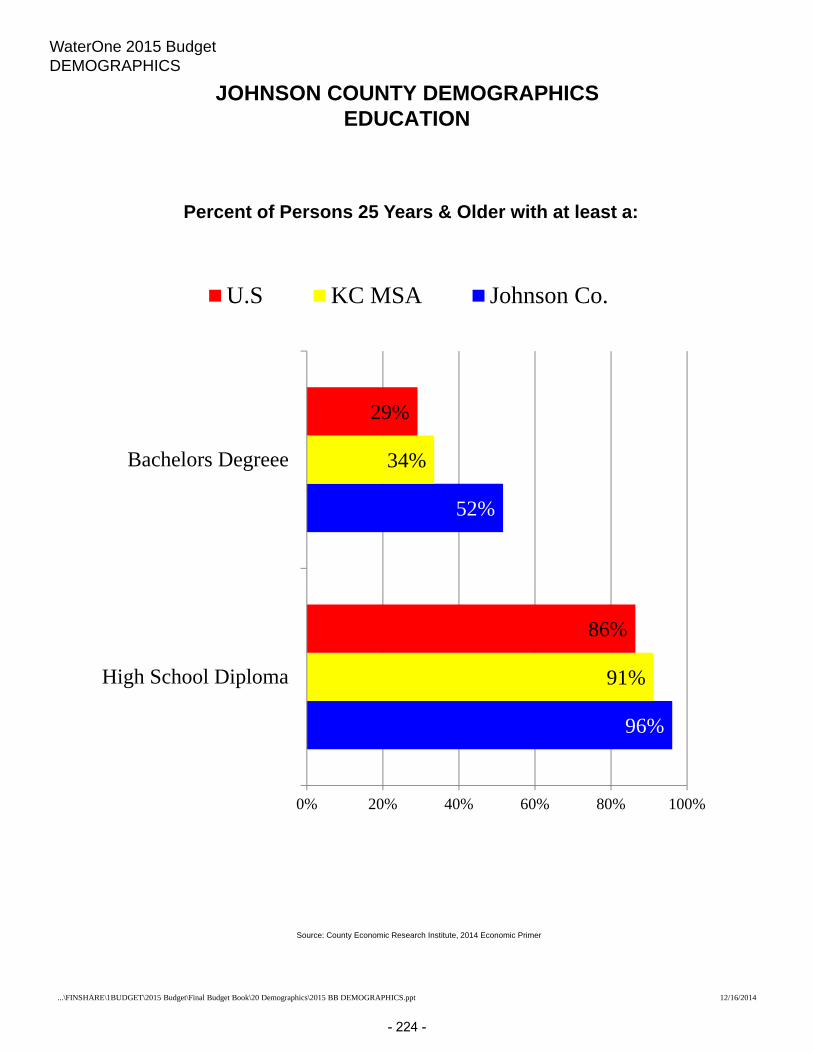
JOHNSON COUNTY DEMOGRAPHICS EDUCATION
Source: County Economic Research Institute, 2014 Economic Primer
Percent of Persons 25 Years & Older with at least a:
WaterOne 2015 BudgetDEMOGRAPHICS
12/16/2014 ...\FINSHARE\1BUDGET\2015 Budget\Final Budget Book\20 Demographics\2015 BB DEMOGRAPHICS.ppt
96%
52%
91%
34%
86%
29%
0% 20% 40% 60% 80% 100%
High School Diploma
Bachelors Degreee
U.S KC MSA Johnson Co.
- 224 -

CUSTOMER BASE INFORMATION (2014)
9%
91%
0% 10% 20% 30% 40% 50% 60% 70% 80% 90% 100%
Customer Base
Residential
Commercial
WaterOne’s customer base is very stable. Approximately 91% of the customer accounts aresingle family residential and make up 65% of revenue. Commercial customers make up 35% ofwater sales revenue, and consist of a wide variety of light industrial, office building, entertainment,retail shop, service oriented businesses, and multi-family units.
WaterOne 2015 BudgetDEMOGRAPHICS
3/10/2014...\FINSHARE\1BUDGET\2014 Budget\Final Budget Book\20 Demographics\2014 BB DEMOGRAPHICS.ppt
Top 15 Customers1 COCA COLA BOTTLING
2 SHAWNEE MISSION MEDICAL CENTER
3 CITY OF OVERLAND PARK
4 BLUE VALLEY SCHOOL DISTRICT
5 SHAWNEE MISSION SCHOOL DISTRICT
6 CORPORATE WOODS
7 JOHNSON COUNTY WASTEWATER
8 SPRINT WORLD HEADQUARTERS
9 SHASTA BEVERAGES
10 CITY OF LENEXA
11 BAYER HEALTHCARE
12 INDIAN HILLS COUNTRY CLUB
13 J A PETERSON REALTY
14 KANSAS CITY COUNTRY CLUB
15 MISSION HILLS COUNTRY CLUB
Top 15 accounts make up 4.1% of revenue
- 225 -

Typical Bill as a % of Median Monthly Household Income
Typical Customer Bill (TCB) and Median Monthly Household Income (MMHI)
Source: Median household income comes from the Census Bureau
WaterOne 2015 BudgetDEMOGRAPHICS
JOHNSON COUNTY DEMOGRAPHICS10 YEAR HISTORY
12/17/2014...\FINSHARE\1BUDGET\2015 Budget\Final Budget Book\20 Demographics\2015 BB DEMOGRAPHICS.ppt
0.25%
0.50%
0.75%
1.00%
1.25%
2004 2005 2006 2007 2008 2009 2010 2011 2012 2013
Fitch Benchmark WaterOne
$25
$30
$35
$40
$45
$50
$4,500
$5,000
$5,500
$6,000
$6,500
$7,000
$7,500
2004 2005 2006 2007 2008 2009 2010 2011 2012 2013
MMHI TCB
- 226 -