
2015 Biotechnology - Fort Dodge
3
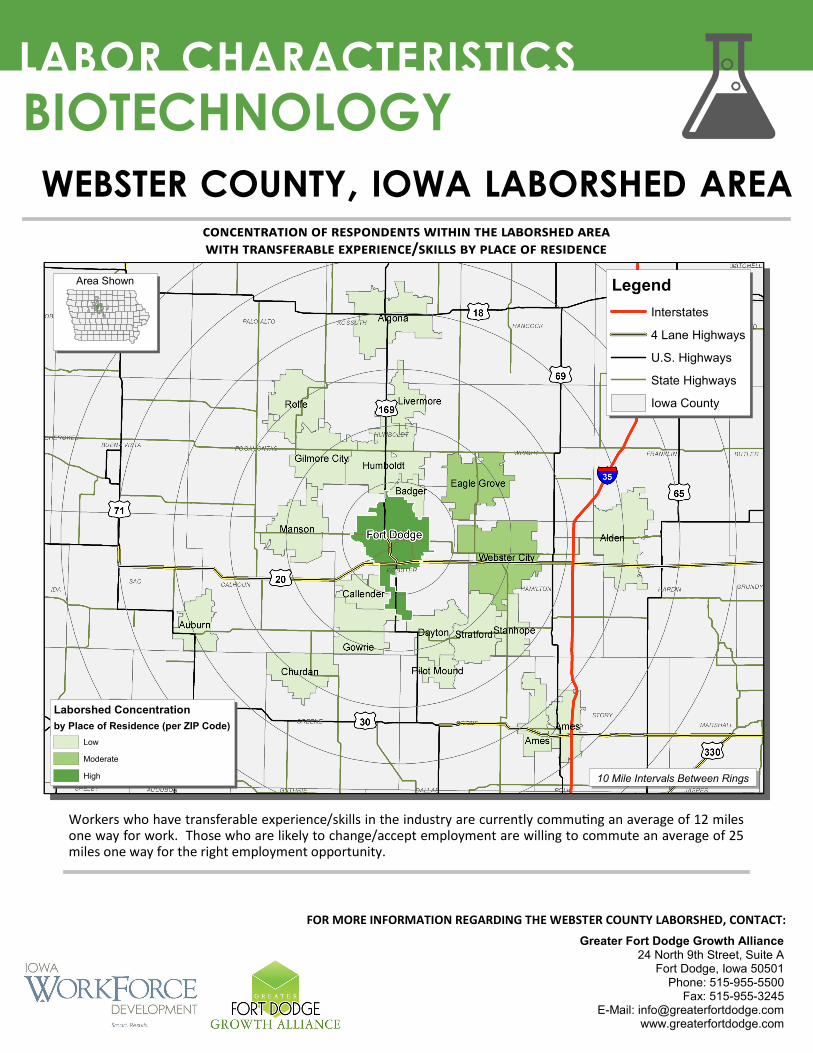
BIOTECHNOLOGY WEBSTER COUNTY, IOWA LABORSHED AREA Workers who have transferable experience/skills in the industry are currently commung an average of 12 miles one way for work. Those who are likely to change/accept employment are willing to commute an average of 25 miles one way for the right employment opportunity. Area Shown 10 Mile Intervals Between Rings Legend Interstates 4 Lane Highways U.S. Highways State Highways Iowa County Laborshed Concentration by Place of Residence (per ZIP Code) Low Moderate High concentration of respondents within the laborshed area with transferable experience/skills by place of residence FOR MORE INFORMATION REGARDING THE WEBSTER COUNTY LABORSHED, CONTACT: LABOR CHARACTERISTICS Greater Fort Dodge Growth Alliance 24 North 9th Street, Suite A Fort Dodge, Iowa 50501 Phone: 515-955-5500 Fax: 515-955-3245 E-Mail: [email protected] www.greaterfortdodge.com
-
Upload
greater-fort-dodge-growth-alliance -
Category
Documents
-
view
216 -
download
1
description
Â
Transcript of 2015 Biotechnology - Fort Dodge
BIOTECHNOLOGY WEBSTER COUNTY, IOWA LABORSHED AREA
Workers who have transferable experience/skills in the industry are currently commuting an average of 12 miles one way for work. Those who are likely to change/accept employment are willing to commute an average of 25 miles one way for the right employment opportunity.
Area Shown
10 Mile Intervals Between Rings
Legend
Interstates
4 Lane Highways
U.S. Highways
State Highways
Iowa County
Laborshed Concentration
by Place of Residence (per ZIP Code)
Low
Moderate
High
concentration of respondents within the laborshed area with transferable experience/skills by place of residence
FOR MORE INFORMATION REGARDING THE WEBSTER COUNTY LABORSHED, CONTACT:
LABOR CHARACTERISTICS
Greater Fort Dodge Growth Alliance 24 North 9th Street, Suite A
Fort Dodge, Iowa 50501 Phone: 515-955-5500
Fax: 515-955-3245 E-Mail: [email protected]
www.greaterfortdodge.com

BIOTECHNOLOGY
He
alth
/Me
dic
al I
nsu
ran
ce
, 90.9
%
Pe
nsi
on
/Re
tire
me
nt/
401k,
87.9
%
De
nta
l C
ove
rag
e,
69.7
%
Vis
ion
Co
ve
rag
e,
54.5
%
Pa
id V
ac
atio
n,
51.5
%
Life
In
sura
nc
e, 36.4
%
Dis
ab
ility
In
sura
nc
e, 30.3
%
Pa
id H
olid
ays,
27.3
%
Pa
id S
ick L
ea
ve
, 27.3
%
Pa
id T
ime
Off
, 18.2
%
current benefits:
He
alth
/Me
dic
al I
nsu
ran
ce
, 93.3
%
Pe
nsi
on
/Re
tire
me
nt/
401k,
73.3
%
De
nta
l C
ove
rag
e,
53.3
%
Pa
id V
ac
atio
n,
53.3
%
Vis
ion
Co
ve
rag
e,
53.3
%
Pa
id S
ick L
ea
ve
, 20.0
%
Pa
id H
olid
ays,
13.3
%
Life
In
sura
nc
e, 6.7
%
Tuitio
n A
ssis
tan
ce
/Re
imb
urs
em
en
t, 6
.7%
desired benefits:
estimated potential available labor per occupational category:
business operations: Computer & Information Systems Managers - 1,013 Compliance Officers - 338 Paralegals & Legal Assistants - 339 production: Supervisors - 672 Agricultural Inspectors - 341 Bakers - 330 Biological Techs - 337 Butchers & Meat Cutters - 1,021 Conservation Scientists - 340 Dietetic Techs - 333 Engineering Techs - 338 Engineers - 2,025 Installation, Maintenance & Repair Workers - 670 Laborers & Material Movers, Hand - 1,350 Life Scientists - 336 Meat, Poultry & Fish Cutters & Trimmers - 334 Medical & Clinical Laboratory Technologists &
Technicians - 1,688 Pharmacy Techs - 343 Plant & System Operators, All Other - 342 Production Workers, All Other - 3,709 Water & Wastewater Treatment Plant & System
Operators - 679
An estimated total of
16,878 people in the Laborshed area
estimated total by employment status (percentage):
Degree/
Certification
Not Obtained,
6.2%
Trade Certified,
8.2%
Vocational
Training, 6.1%
Associate
Degree, 6.1%
Undergraduate
Degree, 24.4%
Postgraduate
Degree, 4.1%
12,152 (72.0%)
2,363 (14.0%)
1,013 (6.0%) 1,350 (8.0%)
36.1%
42.9%
Employed *Unemployed Homemakers Retired
0
2,000
4,000
6,000
8,000
10,000
12,000
14,000% Likely to Change/Accept Employment
top job search resources: (For those seeking employment opportunities, by use.)
Internet - 67.5% www.indeed.com www.linkedin.com www.monster.com Local/Regional Newspapers - 42.5% The Messenger - Fort Dodge The Des Moines Register IowaWORKS Centers - 35.0% Networking through friends, family
or acquaintances - 22.5%
underemployment (estimated): (Individuals counted only once when estimating Total Underemployment.)
Total Underemployment - 2.0% (40) Low hours - 2.0% (40) Mismatch of skills - 0.0% Low income - 0.0%
workplace flexibility: (by percent of interest)
Cross-training - 87.5% Job teams - 87.5% Job sharing - 50.0% Varied shifts - 31.3% Seasonal work - 37.5% Temporary work - 31.3%
employment stats:
81.3% paid an hourly wage 87.8% are/were employed full-time 8.2% are/were employed part-time
5.6% hold two or more jobs Currently working an average of
43 hours/week
educational level: (55.1% have an education beyond high school)
*Employment status is self-identified by the survey respondent. The unemployment percentage does not reflect the unemployment rate published by the U.S. Bureau of Labor Statistics, which applies a stricter definition.
LABOR CHARACTERISTICS

Occupation
Occupatio
nal
Code
Mean W
age
Entry W
age
Experienced
Wage
Median
Wage
Mean A
nnual
Salary
Agricultural and Food Science Technicians 19-4011 $ 16.75 $ 12.25 $ 19.00 $ 16.29 $ 34,832
Agricultural Engineers 17-2021 $ 38.22 $ 28.20 $ 43.24 $ 37.24 $ 79,506
Agricultural Equipment Operators 45-2091 $ 16.07 $ 12.12 $ 18.05 $ 14.80 $ 33,426
Agricultural Inspectors 45-2011 $ 22.01 $ 17.57 $ 24.23 $ 21.75 $ 45,784
Bakers 51-3011 $ 10.39 $ 8.08 $ 11.54 $ 10.01 $ 21,602
Biochemists and Biophysicists 19-1021 $ 35.92 $ 22.76 $ 42.50 $ 29.43 $ 74,714
Biological Technicians 19-4021 $ 20.63 $ 12.82 $ 24.54 $ 21.75 $ 42,909
Business Operations Specialists, All Other 13-1199 $ 26.77 $ 18.03 $ 31.15 $ 26.29 $ 55,690
Butchers and Meat Cutters 51-3021 $ 12.12 $ 8.37 $ 14.00 $ 11.31 $ 25,211
Buyers and Purchasing Agents, Farm Products 13-1021 $ 23.80 $ 15.42 $ 27.98 $ 18.62 $ 49,495
Chemical Technicians 19-4031 $ 19.68 $ 13.58 $ 22.74 $ 18.18 $ 40,942
Chemists 19-2031 $ 35.59 $ 24.99 $ 40.89 $ 33.56 $ 74,025
Compliance Officers, Except Agriculture, Construction, Health and Safety,
and Transportation13-1041 $ 29.27 $ 23.31 $ 32.25 $ 27.47 $ 60,880
Computer and Information Systems Managers 11-3021 $ 44.39 $ 32.67 $ 50.25 $ 43.45 $ 92,328
Conservation Scientists 19-1031 $ 29.21 $ 16.75 $ 35.44 $ 30.36 $ 60,756
Crushing, Grinding, and Polishing Machine Setters, Operators, and Tenders 51-9021 $ 16.09 $ 12.62 $ 17.83 $ 16.15 $ 33,471
Cutting and Slicing Machine Setters, Operators, and Tenders 51-9032 $ 18.05 $ 13.77 $ 20.19 $ 18.90 $ 37,548
Dietitians and Nutritionists 29-1031 $ 24.80 $ 18.77 $ 27.81 $ 24.71 $ 51,578
Engineering Technicians, Except Drafters, All Other 17-3029 $ 23.43 $ 16.09 $ 27.10 $ 22.29 $ 48,728
Engineers, All Other 17-2199 $ 36.55 $ 25.68 $ 41.98 $ 34.96 $ 76,016
Environmental Engineers 17-2081 $ 46.28 $ 27.86 $ 55.49 $ 43.12 $ 96,260
Environmental Science and Protection Technicians, Including Health 19-4091 $ 18.86 $ 14.82 $ 20.87 $ 17.71 $ 39,222
Environmental Scientists and Specialists, Including Health 19-2041 $ 29.56 $ 20.94 $ 33.87 $ 29.27 $ 61,489
Farmers, Ranchers, and Other Agricultural Managers 11-9013 $ 29.94 $ 22.49 $ 33.66 $ 26.73 $ 62,267
Farmworkers and Laborers, Crop, Nursery, and Greenhouse 45-2092 $ 15.11 $ 9.02 $ 18.16 $ 13.54 $ 31,437
Farmworkers, Farm, Ranch, and Aquacultural Animals 45-2093 $ 13.72 $ 9.52 $ 15.82 $ 12.64 $ 28,536
First-Line Supervisors of Farming, Fishing, and Forestry Workers 45-1011 $ 23.88 $ 15.75 $ 27.95 $ 24.52 $ 49,677
First-Line Supervisors of Helpers, Laborers, and Material Movers, Hand 53-1021 $ 23.29 $ 15.55 $ 27.16 $ 22.17 $ 48,438
First-Line Supervisors of Production and Operating Workers 51-1011 $ 23.76 $ 16.68 $ 27.30 $ 22.08 $ 49,416
First-Line Supervisors of Transportation and Material-Moving Machinery 53-1031 $ 24.22 $ 14.74 $ 28.96 $ 22.88 $ 50,385
Food and Tobacco Roasting, Baking, and Drying Machine Operators and
Tenders51-3091 $ 13.56 $ 10.00 $ 15.34 $ 13.25 $ 28,208
Food Batchmakers 51-3092 $ 14.04 $ 11.47 $ 15.32 $ 13.73 $ 29,201
Food Cooking Machine Operators and Tenders 51-3093 $ 11.98 $ 8.82 $ 13.57 $ 12.38 $ 24,928
Food Processing Workers, All Other 51-3099 $ 10.88 $ 7.97 $ 12.34 $ 9.11 $ 22,633
Food Scientists and Technologists 19-1012 $ 31.57 $ 19.71 $ 37.50 $ 35.75 $ 65,670
Forest and Conservation Technicians 19-4093 $ 20.71 $ 14.65 $ 23.73 $ 21.63 $ 43,068
Forest and Conservation Workers 45-4011 $ 13.40 $ 9.04 $ 15.59 $ 13.19 $ 27,880
Heavy and Tractor-Trailer Truck Drivers 53-3032 $ 19.49 $ 12.04 $ 23.22 $ 18.99 $ 40,548 Helpers--Production Workers 51-9198 $ 11.64 $ 9.97 $ 12.48 $ 11.22 $ 24,215 Industrial Engineering Technicians 17-3026 $ 22.49 $ 17.40 $ 25.03 $ 22.04 $ 46,775 Industrial Engineers 17-2112 $ 34.81 $ 26.27 $ 39.08 $ 34.65 $ 72,404 Industrial Production Managers 11-3051 $ 38.82 $ 26.70 $ 44.87 $ 38.15 $ 80,737 Industrial Truck and Tractor Operators 53-7051 $ 15.46 $ 11.15 $ 17.62 $ 15.16 $ 32,167 Inspectors, Testers, Sorters, Samplers, and Weighers 51-9061 $ 15.03 $ 10.62 $ 17.24 $ 13.88 $ 31,271 Laborers and Freight, Stock, and Material Movers, Hand 53-7062 $ 12.77 $ 9.49 $ 14.40 $ 12.66 $ 26,552 Life, Physical, and Social Science Technicians, All Other 19-4099 $ 21.47 $ 11.53 $ 26.44 $ 20.91 $ 44,664 Light Truck or Delivery Services Drivers 53-3033 $ 13.08 $ 8.66 $ 15.29 $ 12.50 $ 27,203 Maintenance and Repair Workers, General 49-9071 $ 17.11 $ 11.43 $ 19.95 $ 16.50 $ 35,589 Market Research Analysts and Marketing Specialists 13-1161 $ 26.08 $ 15.97 $ 31.13 $ 24.46 $ 54,240 Medical and Clinical Laboratory Technicians 29-2012 $ 19.50 $ 14.46 $ 22.01 $ 19.13 $ 40,550 Medical and Clinical Laboratory Technologists 29-2011 $ 25.33 $ 20.15 $ 27.93 $ 25.29 $ 52,696 Medical Scientists, Except Epidemiologists 19-1042 $ 30.16 $ 15.56 $ 37.45 $ 22.40 $ 62,726 Mixing and Blending Machine Setters, Operators, and Tenders 51-9023 $ 16.36 $ 13.06 $ 18.01 $ 15.00 $ 34,036 Paralegals and Legal Assistants 23-2011 $ 19.28 $ 14.61 $ 21.62 $ 19.49 $ 40,104 Pharmacists 29-1051 $ 54.86 $ 44.93 $ 59.83 $ 56.13 $ 114,114 Production Workers, All Other 51-9199 $ 15.42 $ 9.76 $ 18.25 $ 15.78 $ 32,066 Sales Representatives, Wholesale and Manufacturing, Technical and 41-4011 $ 36.93 $ 15.98 $ 47.40 $ 28.67 $ 76,809 Separating, Filtering, Clarifying, Precipitating, and Stil l Machine Setters,
Operators, and Tenders51-9012 $ 19.11 $ 15.20 $ 21.07 $ 20.30 $ 39,756
Soil and Plant Scientists 19-1013 $ 28.40 $ 20.05 $ 32.58 $ 26.65 $ 59,082 Transportation, Storage, and Distribution Managers 11-3071 $ 35.40 $ 21.70 $ 42.25 $ 34.08 $ 73,634 Water and Wastewater Treatment Plant and System Operators 51-8031 $ 16.73 $ 9.51 $ 20.34 $ 16.65 $ 34,803
OccupationOccupational
Code
Mean
Wage
Entry
Wage
Experienced
Wage
Median
Wage
Mean Annual
Salary
The 2014 Iowa Wage data for the Webster County Laborshed area was produced by the Labor Force & Occupational Analysis Bureau to provide communities local information on wages by occupation. The source of the wage and employment data is based on the May 2013 OES estimates. Additional occupational wage and employment data can be found at http://iwin.iwd.state.ia.us/iowa/OlmisZine.
Balance of data compiled by Iowa Workforce Development using Laborshed data released in 2015.
LABOR CHARACTERISTICS - WAGES BIOTECHNOLOGY