2015 Australian Energy Statistics
27
2015 WWW.INDUSTRY.GOV.AU/OCE Australian Energy Update
-
Upload
turlough-guerin-phd-gaicd -
Category
Business
-
view
75 -
download
0
Transcript of 2015 Australian Energy Statistics
2015
WWW.INDUSTRY.GOV.AU/OCE
Australian Energy Update
Australian Energy Update
2015
www.industry.gov.au
Department of Industry and Science (2015), 2015 Australian energy update, Canberra, August. Further information For more information or to comment on this publication please contact: Allison Ball Manager, Energy Program Office of the Chief Economist Department of Industry and Science GPO Box 9839 CANBERRA ACT 2601 Email: [email protected]; [email protected] Web: www.industry.gov.au/oce Project Team Allison Ball Shamim Ahmad Kieran Bernie Caitlin McCluskey Pam Pham Christian Tisdell Thomas Willcock Alex Feng Acknowledgements The authors would like to express their appreciation for the assistance and support provided by colleagues in the Department of Industry and Science, the Department of Environment, the Clean Energy Regulator, the Australian Bureau of Statistics, the Bureau of Infrastructure, Transport and Regional Economics, the Australian Energy Market Operator, and various state government agencies. The views expressed in this publication are those of the authors and do not necessarily reflect those of the Australian Government or the Department of Industry and Science. © Commonwealth of Australia 2015 ISSN (Online): 2203-8337 This work is copyright. Apart from use under Copyright Act 1968, no part may be reproduced or altered by any process without prior written permission from the Australian Government. Requests and inquiries concerning reproduction and rights should be addressed to [email protected]. For more information on Office of the Chief Economist publications please access the Department’s website at: www.industry.gov.au/OCE Creative Commons Licence
With the exception of the Coat of Arms, this publication is licensed under a Creative Commons Attribution 3.0 Australia Licence. Creative Commons Attribution 3.0 Australia Licence is a standard form license agreement that allows you to copy, distribute, transmit
and adapt this publication provided that you attribute the work. A summary of the licence terms is available from http://creativecommons.org/licenses/by/3.0/au/deed.en. The full licence terms are available from http://creativecommons.org/licenses/by/3.0/au/legalcode. The Commonwealth’s preference is that you attribute this publication (and any material sourced from it) using the following wording: Source: Licensed from the Commonwealth of Australia under a Creative Commons Attribution 3.0 Australia Licence. The Commonwealth of Australia does not necessarily endorse the content of this publication.
Australian Energy Update 2
Foreword Energy supply and use in Australia is changing. Australians are using energy more productively, as energy prices rise, as new technologies are adopted, and as our economy changes. Our production patterns are shifting too, as the fuel mix changes, distributed generation expands, and our importance as a global energy supplier continues to grow.
To help understand these and other changes, to plan for Australia’s energy future and to make sound policy and investment decisions, we need accurate, comprehensive and readily-accessible energy data.
The Australian Energy Statistics is the authoritative and official source of energy data for Australia and forms the basis of Australia’s international energy reporting obligations. It is updated each year and consists of detailed historical energy consumption, production and trade statistics. This edition contains the latest data for 2013–14. I encourage you to use the dataset, this report and guide that are available at www.industry.gov.au/oce.
The latest set of statistics shows that energy consumption in Australia fell in 2013–14 for the second year in a row. While energy consumption in the mining and transport sectors rose, it was outweighed by declining energy use for electricity generation and manufacturing. Coal production and exports continued to grow strongly, in contrast to a further decline in our domestic use of coal. Our use of gas, wind and solar energy continued to rise.
We have made a number of improvements to the dataset this year, including publishing a greater level of detail in the mining sector, which continues to be the fastest growing energy user in Australia. We welcome any feedback and suggestions for further improvement, which can be provided to [email protected].
Mark Cully Chief Economist Department of Industry and Science August 2015
Australian Energy Update 3
Contents Foreword 3
1. Summary 6 1.1 Energy consumption 6 1.2 Energy production 6 1.3 Electricity generation 6 1.4 Energy trade 7
2. About the Australian Energy Statistics 8
3. Energy consumption 10 3.1 By fuel type 10 3.2 By industry 12 3.3 By region 16
4. Energy production 18 4.1 Primary production 18 4.2 Electricity generation 19
5. Energy trade 23 5.1 Exports 23 5.2 Imports 24
6. References 26
Figures Figure 3.1: Australian energy intensity and energy productivity 10
Figure 3.2: Australian energy consumption, by fuel type 11
Figure 3.3: Australian net energy consumption, by industry 13
Figure 4.1: Australian energy production, by fuel type 18
Figure 4.2: Australian electricity generation, by fuel type 20
Figure 5.1: Australian energy exports, by fuel type 23
Figure 5.2: Australian energy imports, by fuel type 25
Australian Energy Update 4
Tables Table 2.1: 2015 Australian Energy Statistics tables 9
Table 3.1: Australian energy consumption, by fuel type 11
Table 3.2: Australian renewable energy consumption, by fuel type 12
Table 3.3: Australian net energy consumption, by industry 13
Table 3.4: Australian transport energy consumption, by subsector 14
Table 3.5: Australian manufacturing energy consumption, by subsector 14
Table 3.6: Australian mining energy consumption, by subsector 15
Table 3.7: Australian total final energy consumption, by industry 16
Table 3.8: Australian energy consumption, by state and territory 16
Table 4.1: Australian energy production, by fuel type 19
Table 4.2: Australian electricity generation, by fuel type 21
Table 5.1: Australian energy exports, by fuel type 24
Table 5.2: Australian energy imports, by fuel type 25
Abbreviations and acronyms AES Australian Energy Statistics
BREE Bureau of Resources and Energy Economics (former)
GWh Gigawatt hours
IEA International Energy Agency
LNG Liquefied natural gas
LPG Liquefied petroleum gas
NEM National electricity market
NGERS National Greenhouse and Energy Reporting Scheme
NGL Natural gas liquids
ORF Other refinery feedstock
OCE Office of the Chief Economist
PJ Petajoules
PV Photovoltaic
Australian Energy Update 5

1. Summary
1.1 Energy consumption
Australian energy consumption fell by 1 per cent in 2013–14 to around 5 831 petajoules, despite continued growth in the Australian economy. Energy productivity (gross domestic product/energy consumption) rose by 4 per cent.
Growth in energy consumption in the mining, transport and services sectors was offset by a continued fall in energy use for electricity generation and manufacturing, as well as by households. Transport overtook the electricity supply sector as the largest energy user in 2013–14.
Final energy consumption (excludes energy used in energy conversion activities) rose by 1 per cent in 2013–14.
Oil remained the largest primary energy source in Australia, at 38 per cent in 2013–14, followed by coal (32 per cent) and natural gas (24 per cent). Renewables accounted for 6 per cent of Australia’s energy mix.
Use of gas and renewables grew by 2 per cent and 4 per cent respectively in 2013–14. In contrast, oil consumption fell by 1 per cent and coal by 5 per cent.
Energy consumption fell in most states and territories in 2013–14.
1.2 Energy production
Energy production fell by 4 per cent in 2013–14 to 18 715 petajoules, as lower uranium and oil production outweighed growth in black coal.
Uranium production fell by 38 per cent, with disruptions at the Ranger mine and the closure of the Honeymoon mine. Oil production fell by 5 per cent as declining production at aging fields outweighed new supply.
Black coal production rose by 8 per cent in 2013–14 to 11 807 petajoules, supported by new capacity for export markets. Natural gas production increased by 2 per cent.
1.3 Electricity generation
Electricity generation in Australia continued to decline in 2013–14, by 1 per cent to 248 terawatt hours (894 petajoules). The continued fall in industrial and residential electricity demand in the National Electricity Market has been largely responsible for this decline. It has been partially offset by continued growth in off-grid generation.
Coal-fired generation declined by 5 per cent in 2013–14. Despite this, coal remained the largest source of electricity generation in Australia at 61 per cent. Natural gas constituted 22 per cent of total electricity generation in 2013–14.
Renewable generation rose by 12 per cent in 2013–14, comprising 15 per cent of total generation in Australia. Most growth continued to
Australian Energy Update 6
occur in wind and solar energy, with the share of hydro in total renewable generation falling below 50 per cent for the first time.
1.4 Energy trade
Energy exports grew by 2 per cent in 2013–14 to 15 658 petajoules. The modest growth was due to a fall in uranium and crude oil exports, which weighed against higher coal exports. LNG exports also fell marginally.
Energy imports were relatively flat, falling by less than 1 per cent to 2 275 petajoules. A decline in crude oil imports was largely offset by a rise in imports of refined products, reflecting reduced domestic refining capacity.
Australian Energy Update 7
2. About the Australian Energy Statistics The Australian Energy Statistics (AES) is the authoritative and official source of annual energy data for Australia. It provides information designed to increase the understanding of energy supply and use in Australia, to support decision making in government and industry, and to meet Australia’s annual international energy reporting obligations. This official energy dataset also underpins the calculation of Australia’s greenhouse gas emissions from energy supply and use by the Department of Environment.
The AES provides detailed energy consumption, production and trade statistics, by state and territory, by energy type, and by industry, in energy content and physical units. The most detailed sub-sectoral coverage is provided in the energy-intensive manufacturing sectors. Where possible, the data is compiled and presented using concepts and definitions intended to align the AES with the framework used by the International Energy Agency (IEA).
Key data sources include facility level reporting from the National Greenhouse and Energy Reporting Scheme (NGERS), the Australian Petroleum Statistics (APS), internal databases, estimates using statistical techniques, datasets from other Australian and state government agencies, and public company reporting. Some datasets from private subscription services and industry associations are also used to benchmark these estimates and sources.
The AES has been published by the Department of Industry and Science (2015), the Bureau of Resources and Energy Economics (BREE) (2012 to 2014), the Australian Bureau of Agricultural and Resources Economics and Sciences (ABARES) (1989 to 2011), and various Australian government agencies, since the mid-1970s.
The AES dataset is made available through a series of tables in Excel format at www.industry.gov.au/oce. A list of the AES tables available on the Department of Industry and Science website is provided in Table 2.1.
The AES is accompanied by this report, the Australian Energy Update, a short article highlighting recent trends in Australian energy consumption, production and trade.
In 2014, the Guide to the Australian Energy Statistics was released for the first time, to assist users in better understanding the AES and to increase the transparency of the dataset. It contains information on the publication tables, definitions and concepts, data sources and methodology, conversion factors, confidentiality and historical revisions. An updated version has been released in 2015.
Australian Energy Update 8
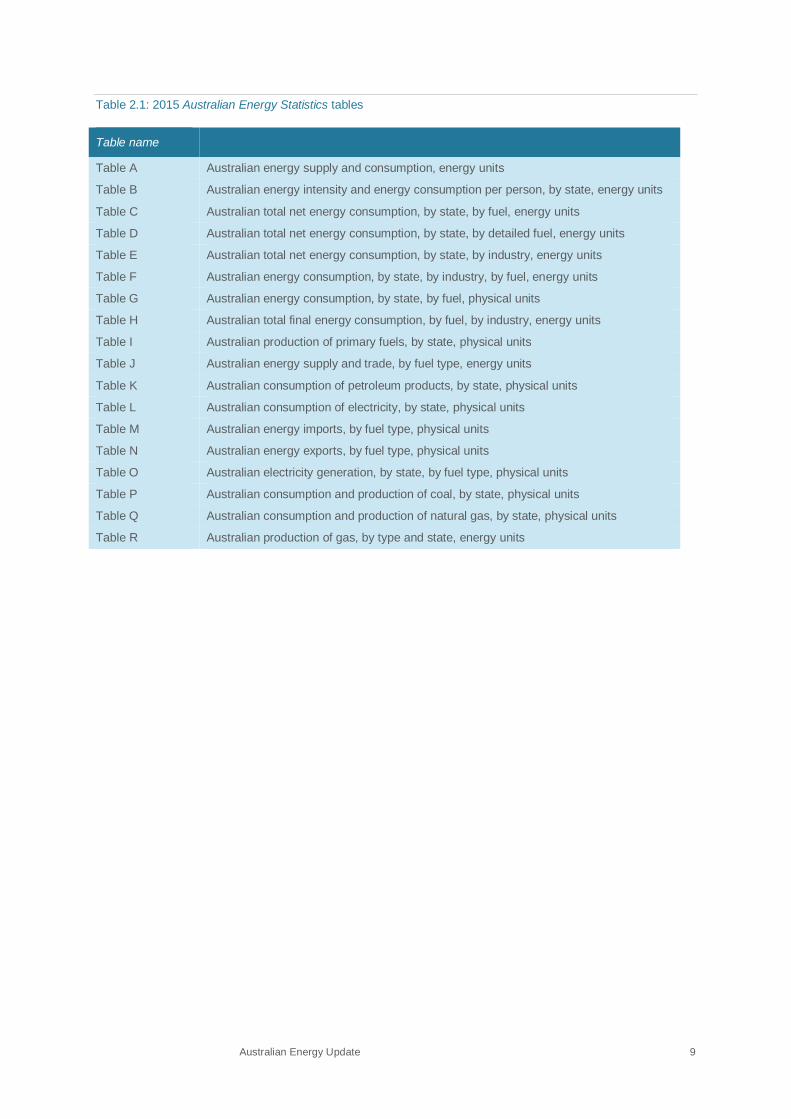
Table 2.1: 2015 Australian Energy Statistics tables
Table name
Table A Australian energy supply and consumption, energy units
Table B Australian energy intensity and energy consumption per person, by state, energy units
Table C Australian total net energy consumption, by state, by fuel, energy units
Table D Australian total net energy consumption, by state, by detailed fuel, energy units
Table E Australian total net energy consumption, by state, by industry, energy units
Table F Australian energy consumption, by state, by industry, by fuel, energy units
Table G Australian energy consumption, by state, by fuel, physical units
Table H Australian total final energy consumption, by fuel, by industry, energy units
Table I Australian production of primary fuels, by state, physical units
Table J Australian energy supply and trade, by fuel type, energy units
Table K Australian consumption of petroleum products, by state, physical units
Table L Australian consumption of electricity, by state, physical units
Table M Australian energy imports, by fuel type, physical units
Table N Australian energy exports, by fuel type, physical units
Table O Australian electricity generation, by state, by fuel type, physical units
Table P Australian consumption and production of coal, by state, physical units
Table Q Australian consumption and production of natural gas, by state, physical units
Table R Australian production of gas, by type and state, energy units
Australian Energy Update 9
3. Energy consumption Energy consumption measures the total amount of energy used within the Australian economy. It is equal to indigenous production plus imports minus exports (and changes in stocks). It includes energy consumed in energy conversion activities, such as electricity generation and petroleum refining, but excludes derived fuels produced domestically to avoid double counting. It can be referred to as total net energy consumption and is also equal to total primary energy supply. Further detail is provided in the Department of Industry and Science (2015) Guide to the Australian Energy Statistics.
Australian energy consumption has been falling since 2011–12. In 2013–14, energy consumption fell by a further 1 per cent to 5 831 petajoules, similar to 2009–10 levels. In contrast, the Australian economy grew by more than 2 per cent in 2013–14.
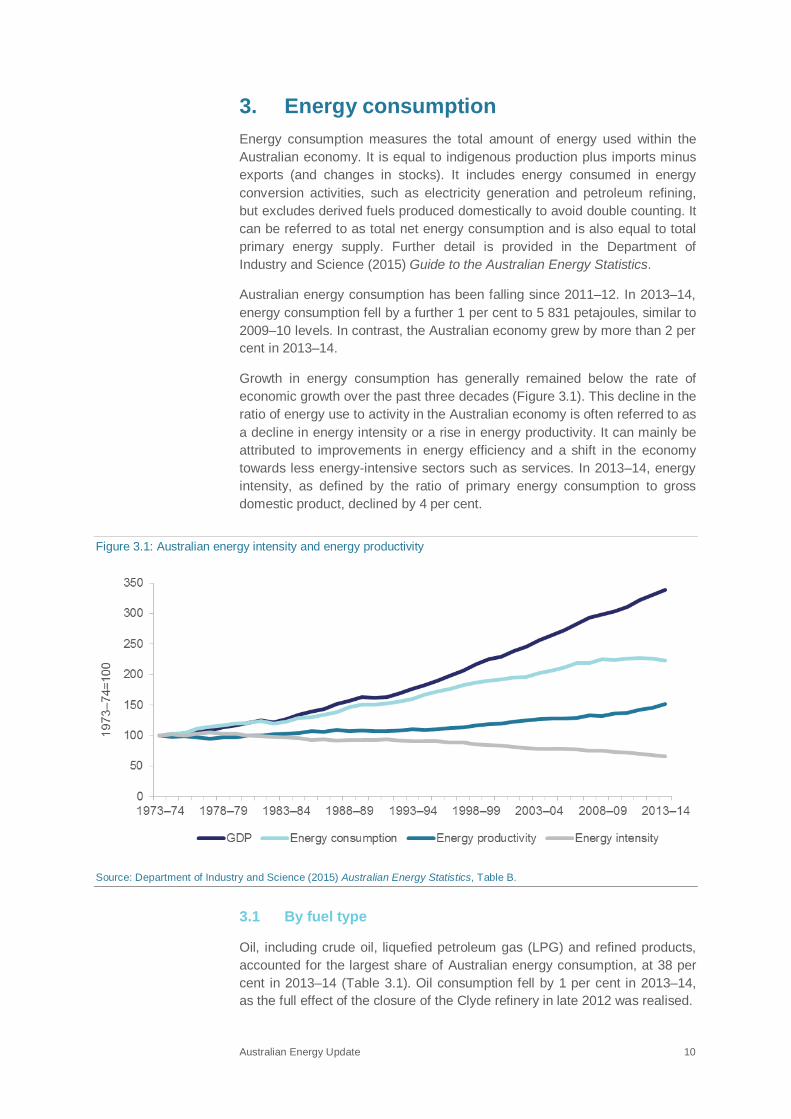
Growth in energy consumption has generally remained below the rate of economic growth over the past three decades (Figure 3.1). This decline in the ratio of energy use to activity in the Australian economy is often referred to as a decline in energy intensity or a rise in energy productivity. It can mainly be attributed to improvements in energy efficiency and a shift in the economy towards less energy-intensive sectors such as services. In 2013–14, energy intensity, as defined by the ratio of primary energy consumption to gross domestic product, declined by 4 per cent.
Figure 3.1: Australian energy intensity and energy productivity
Source: Department of Industry and Science (2015) Australian Energy Statistics, Table B.
3.1 By fuel type
Oil, including crude oil, liquefied petroleum gas (LPG) and refined products, accounted for the largest share of Australian energy consumption, at 38 per cent in 2013–14 (Table 3.1). Oil consumption fell by 1 per cent in 2013–14, as the full effect of the closure of the Clyde refinery in late 2012 was realised.
Australian Energy Update 10
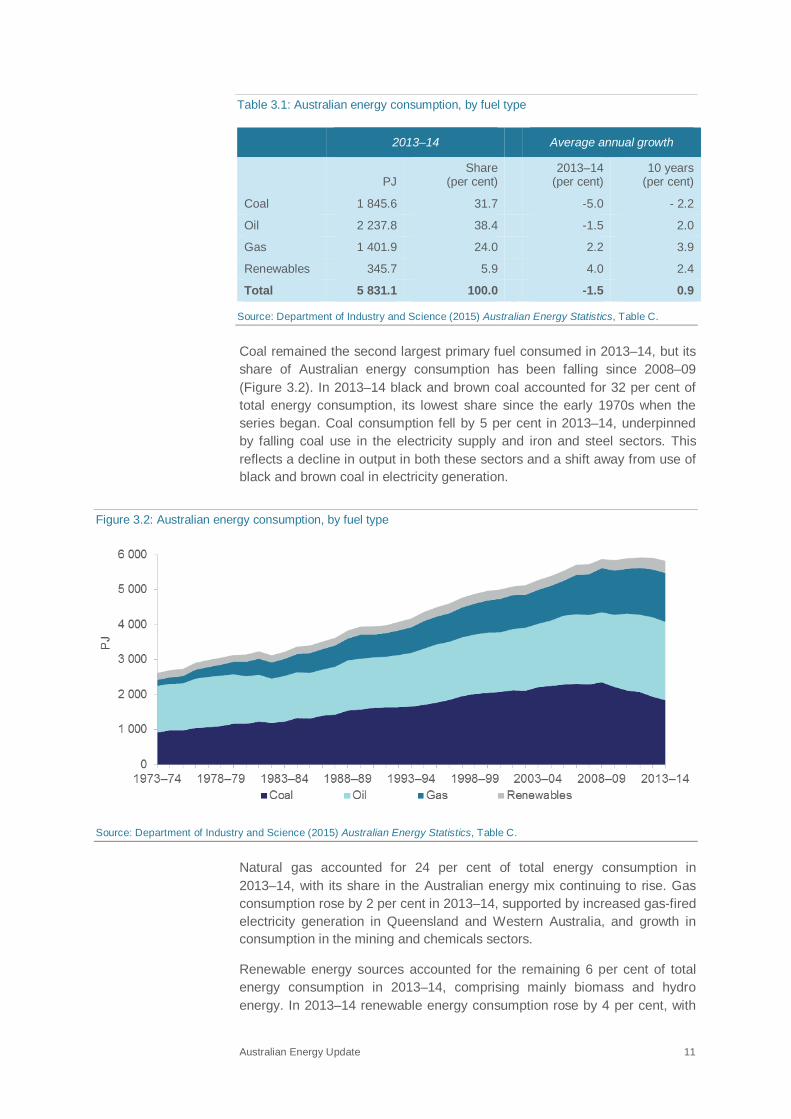
Table 3.1: Australian energy consumption, by fuel type
2013–14
Average annual growth
PJ Share
(per cent)
2013–14 (per cent)
10 years (per cent)
Coal 1 845.6 31.7
-5.0 - 2.2
Oil 2 237.8 38.4
-1.5 2.0
Gas 1 401.9 24.0
2.2 3.9
Renewables 345.7 5.9
4.0 2.4
Total 5 831.1 100.0 -1.5 0.9
Source: Department of Industry and Science (2015) Australian Energy Statistics, Table C.
Coal remained the second largest primary fuel consumed in 2013–14, but its share of Australian energy consumption has been falling since 2008–09 (Figure 3.2). In 2013–14 black and brown coal accounted for 32 per cent of total energy consumption, its lowest share since the early 1970s when the series began. Coal consumption fell by 5 per cent in 2013–14, underpinned by falling coal use in the electricity supply and iron and steel sectors. This reflects a decline in output in both these sectors and a shift away from use of black and brown coal in electricity generation.
Figure 3.2: Australian energy consumption, by fuel type
Source: Department of Industry and Science (2015) Australian Energy Statistics, Table C.
Natural gas accounted for 24 per cent of total energy consumption in 2013–14, with its share in the Australian energy mix continuing to rise. Gas consumption rose by 2 per cent in 2013–14, supported by increased gas-fired electricity generation in Queensland and Western Australia, and growth in consumption in the mining and chemicals sectors.
Renewable energy sources accounted for the remaining 6 per cent of total energy consumption in 2013–14, comprising mainly biomass and hydro energy. In 2013–14 renewable energy consumption rose by 4 per cent, with
Australian Energy Update 11
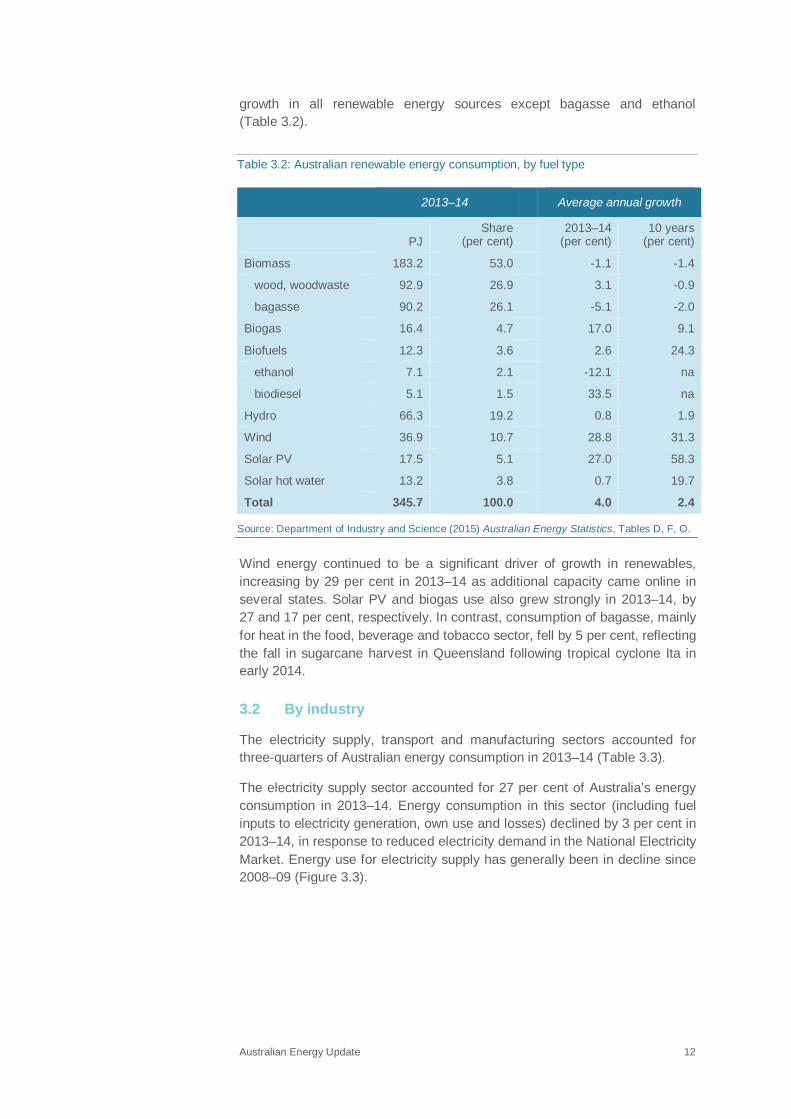
growth in all renewable energy sources except bagasse and ethanol (Table 3.2).
Table 3.2: Australian renewable energy consumption, by fuel type
2013–14
Average annual growth
PJ Share
(per cent)
2013–14 (per cent)
10 years (per cent)
Biomass 183.2 53.0
-1.1 -1.4
wood, woodwaste 92.9 26.9
3.1 -0.9
bagasse 90.2 26.1
-5.1 -2.0
Biogas 16.4 4.7
17.0 9.1
Biofuels 12.3 3.6
2.6 24.3
ethanol 7.1 2.1
-12.1 na
biodiesel 5.1 1.5
33.5 na
Hydro 66.3 19.2
0.8 1.9
Wind 36.9 10.7
28.8 31.3
Solar PV 17.5 5.1
27.0 58.3
Solar hot water 13.2 3.8
0.7 19.7
Total 345.7 100.0 4.0 2.4
Source: Department of Industry and Science (2015) Australian Energy Statistics, Tables D, F, O.
Wind energy continued to be a significant driver of growth in renewables, increasing by 29 per cent in 2013–14 as additional capacity came online in several states. Solar PV and biogas use also grew strongly in 2013–14, by 27 and 17 per cent, respectively. In contrast, consumption of bagasse, mainly for heat in the food, beverage and tobacco sector, fell by 5 per cent, reflecting the fall in sugarcane harvest in Queensland following tropical cyclone Ita in early 2014.
3.2 By industry
The electricity supply, transport and manufacturing sectors accounted for three-quarters of Australian energy consumption in 2013–14 (Table 3.3).
The electricity supply sector accounted for 27 per cent of Australia’s energy consumption in 2013–14. Energy consumption in this sector (including fuel inputs to electricity generation, own use and losses) declined by 3 per cent in 2013–14, in response to reduced electricity demand in the National Electricity Market. Energy use for electricity supply has generally been in decline since 2008–09 (Figure 3.3).
Australian Energy Update 12
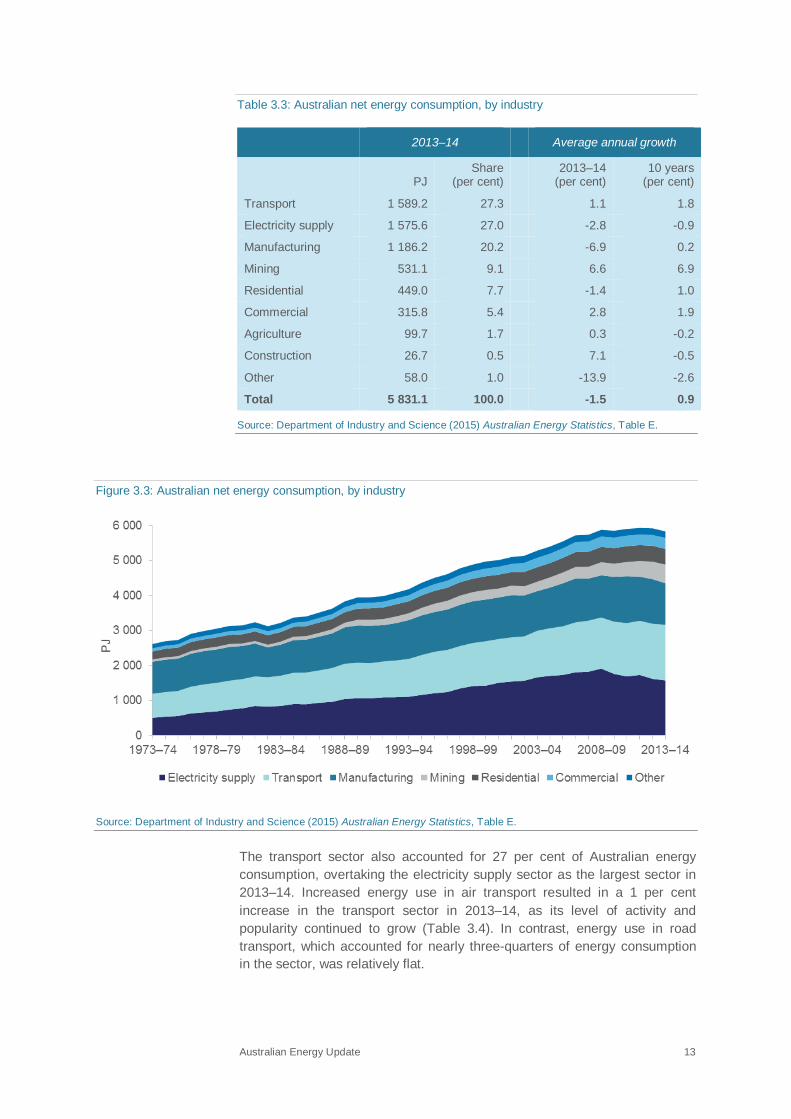
Table 3.3: Australian net energy consumption, by industry
2013–14
Average annual growth
PJ Share
(per cent)
2013–14 (per cent)
10 years (per cent)
Transport 1 589.2 27.3
1.1 1.8
Electricity supply 1 575.6 27.0
-2.8 -0.9
Manufacturing 1 186.2 20.2
-6.9 0.2
Mining 531.1 9.1
6.6 6.9
Residential 449.0 7.7
-1.4 1.0
Commercial 315.8 5.4
2.8 1.9
Agriculture 99.7 1.7
0.3 -0.2
Construction 26.7 0.5
7.1 -0.5
Other 58.0 1.0
-13.9 -2.6
Total 5 831.1 100.0 -1.5 0.9
Source: Department of Industry and Science (2015) Australian Energy Statistics, Table E.
Figure 3.3: Australian net energy consumption, by industry
Source: Department of Industry and Science (2015) Australian Energy Statistics, Table E.
The transport sector also accounted for 27 per cent of Australian energy consumption, overtaking the electricity supply sector as the largest sector in 2013–14. Increased energy use in air transport resulted in a 1 per cent increase in the transport sector in 2013–14, as its level of activity and popularity continued to grow (Table 3.4). In contrast, energy use in road transport, which accounted for nearly three-quarters of energy consumption in the sector, was relatively flat.
Australian Energy Update 13
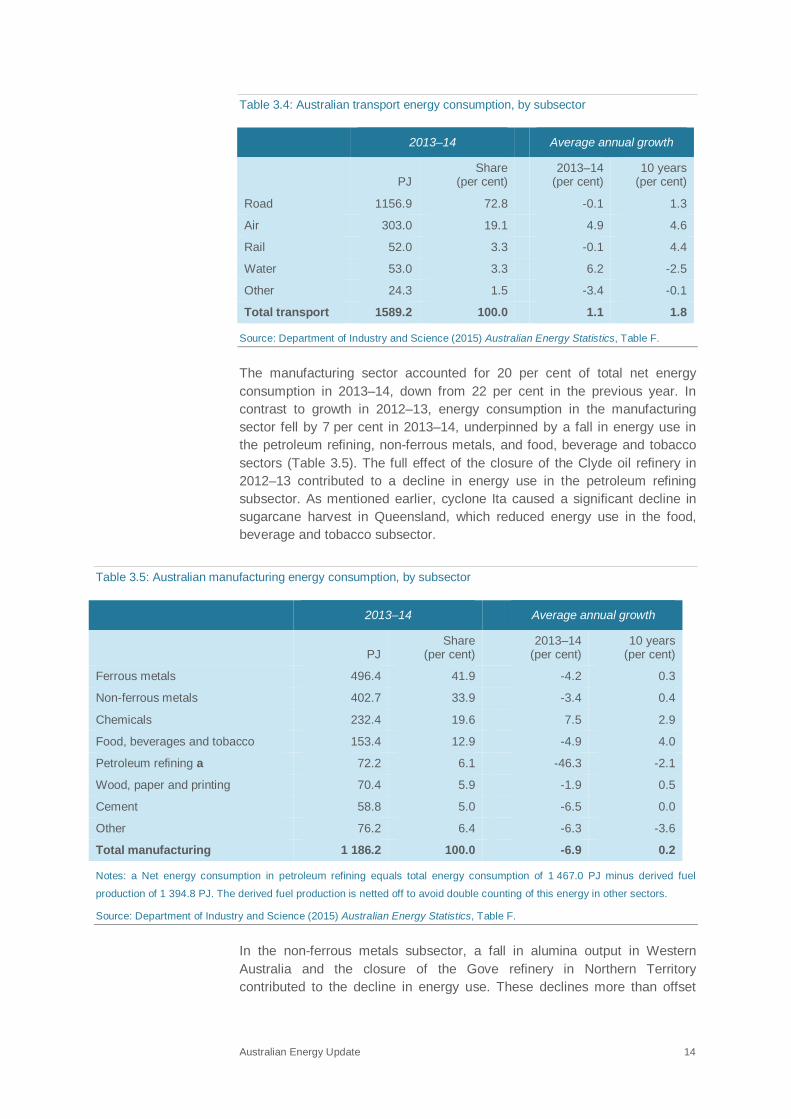
Table 3.4: Australian transport energy consumption, by subsector
2013–14
Average annual growth
PJ Share
(per cent)
2013–14 (per cent)
10 years (per cent)
Road 1156.9 72.8
-0.1 1.3
Air 303.0 19.1
4.9 4.6
Rail 52.0 3.3
-0.1 4.4
Water 53.0 3.3
6.2 -2.5
Other 24.3 1.5
-3.4 -0.1
Total transport 1589.2 100.0
1.1 1.8
Source: Department of Industry and Science (2015) Australian Energy Statistics, Table F.
The manufacturing sector accounted for 20 per cent of total net energy consumption in 2013–14, down from 22 per cent in the previous year. In contrast to growth in 2012–13, energy consumption in the manufacturing sector fell by 7 per cent in 2013–14, underpinned by a fall in energy use in the petroleum refining, non-ferrous metals, and food, beverage and tobacco sectors (Table 3.5). The full effect of the closure of the Clyde oil refinery in 2012–13 contributed to a decline in energy use in the petroleum refining subsector. As mentioned earlier, cyclone Ita caused a significant decline in sugarcane harvest in Queensland, which reduced energy use in the food, beverage and tobacco subsector.
Table 3.5: Australian manufacturing energy consumption, by subsector
2013–14
Average annual growth
PJ Share
(per cent)
2013–14 (per cent)
10 years (per cent)
Ferrous metals 496.4 41.9
-4.2 0.3
Non-ferrous metals 402.7 33.9
-3.4 0.4
Chemicals 232.4 19.6
7.5 2.9
Food, beverages and tobacco 153.4 12.9
-4.9 4.0
Petroleum refining a 72.2 6.1
-46.3 -2.1
Wood, paper and printing 70.4 5.9
-1.9 0.5
Cement 58.8 5.0
-6.5 0.0
Other 76.2 6.4
-6.3 -3.6
Total manufacturing 1 186.2 100.0 -6.9 0.2
Notes: a Net energy consumption in petroleum refining equals total energy consumption of 1 467.0 PJ minus derived fuel
production of 1 394.8 PJ. The derived fuel production is netted off to avoid double counting of this energy in other sectors.
Source: Department of Industry and Science (2015) Australian Energy Statistics, Table F.
In the non-ferrous metals subsector, a fall in alumina output in Western Australia and the closure of the Gove refinery in Northern Territory contributed to the decline in energy use. These declines more than offset
Australian Energy Update 14
growth in energy use in the chemicals sector, partially supported by an expansion in ammonium nitrate capacity.
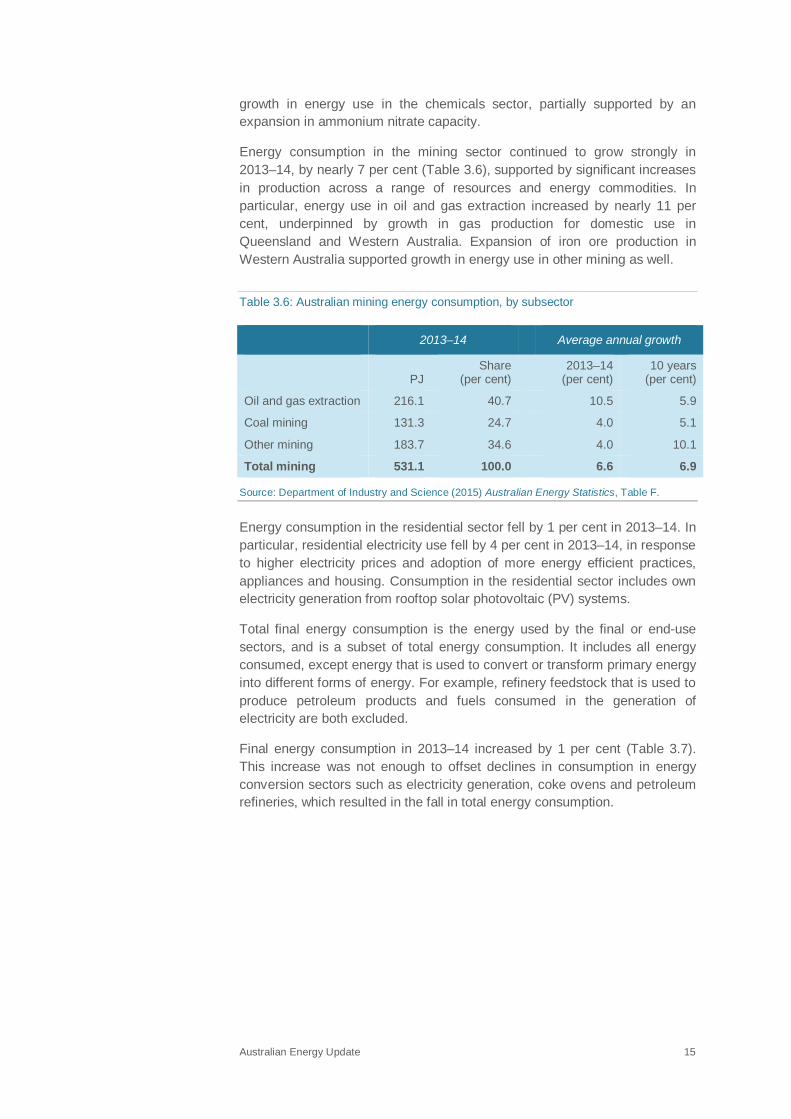
Energy consumption in the mining sector continued to grow strongly in 2013–14, by nearly 7 per cent (Table 3.6), supported by significant increases in production across a range of resources and energy commodities. In particular, energy use in oil and gas extraction increased by nearly 11 per cent, underpinned by growth in gas production for domestic use in Queensland and Western Australia. Expansion of iron ore production in Western Australia supported growth in energy use in other mining as well.
Table 3.6: Australian mining energy consumption, by subsector
2013–14
Average annual growth
PJ Share
(per cent)
2013–14 (per cent)
10 years (per cent)
Oil and gas extraction 216.1 40.7 10.5 5.9
Coal mining 131.3 24.7 4.0 5.1
Other mining 183.7 34.6 4.0 10.1
Total mining 531.1 100.0 6.6 6.9
Source: Department of Industry and Science (2015) Australian Energy Statistics, Table F.
Energy consumption in the residential sector fell by 1 per cent in 2013–14. In particular, residential electricity use fell by 4 per cent in 2013–14, in response to higher electricity prices and adoption of more energy efficient practices, appliances and housing. Consumption in the residential sector includes own electricity generation from rooftop solar photovoltaic (PV) systems.
Total final energy consumption is the energy used by the final or end-use sectors, and is a subset of total energy consumption. It includes all energy consumed, except energy that is used to convert or transform primary energy into different forms of energy. For example, refinery feedstock that is used to produce petroleum products and fuels consumed in the generation of electricity are both excluded.
Final energy consumption in 2013–14 increased by 1 per cent (Table 3.7). This increase was not enough to offset declines in consumption in energy conversion sectors such as electricity generation, coke ovens and petroleum refineries, which resulted in the fall in total energy consumption.
Australian Energy Update 15
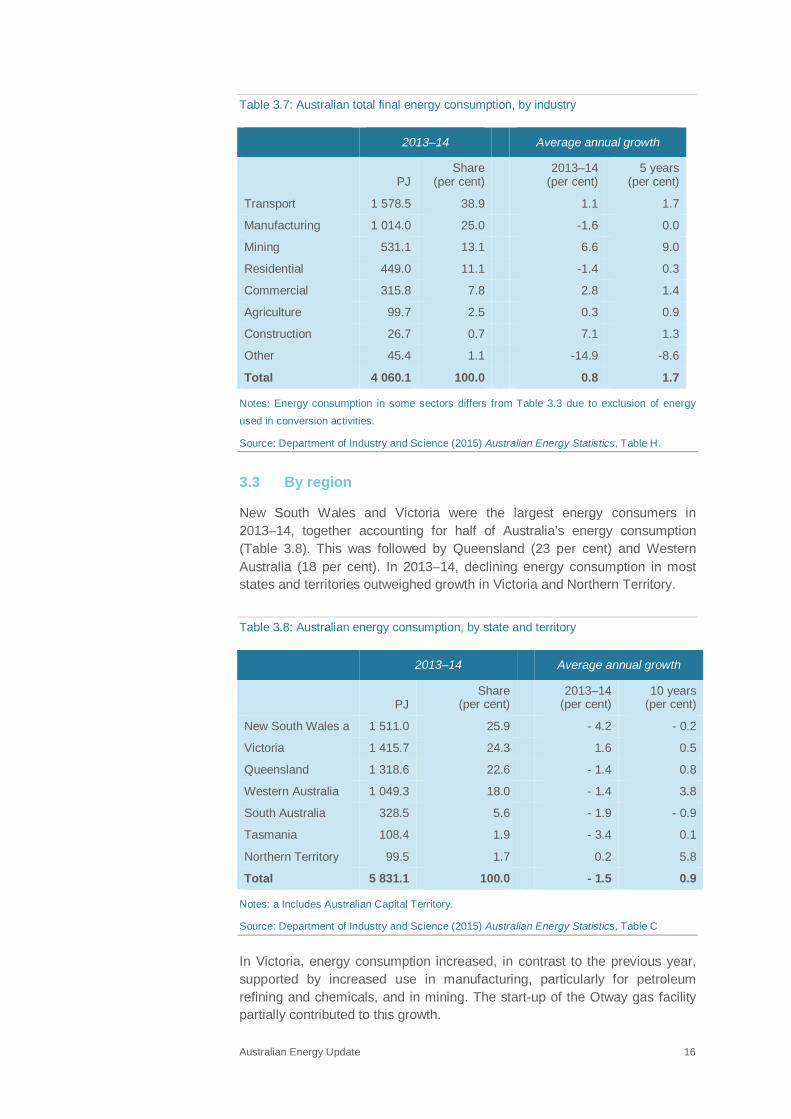
Table 3.7: Australian total final energy consumption, by industry
2013–14
Average annual growth
PJ Share
(per cent)
2013–14 (per cent)
5 years (per cent)
Transport 1 578.5 38.9 1.1 1.7
Manufacturing 1 014.0 25.0 -1.6 0.0
Mining 531.1 13.1 6.6 9.0
Residential 449.0 11.1 -1.4 0.3
Commercial 315.8 7.8 2.8 1.4
Agriculture 99.7 2.5 0.3 0.9
Construction 26.7 0.7 7.1 1.3
Other 45.4 1.1 -14.9 -8.6
Total 4 060.1 100.0 0.8 1.7
Notes: Energy consumption in some sectors differs from Table 3.3 due to exclusion of energy
used in conversion activities.
Source: Department of Industry and Science (2015) Australian Energy Statistics, Table H.
3.3 By region
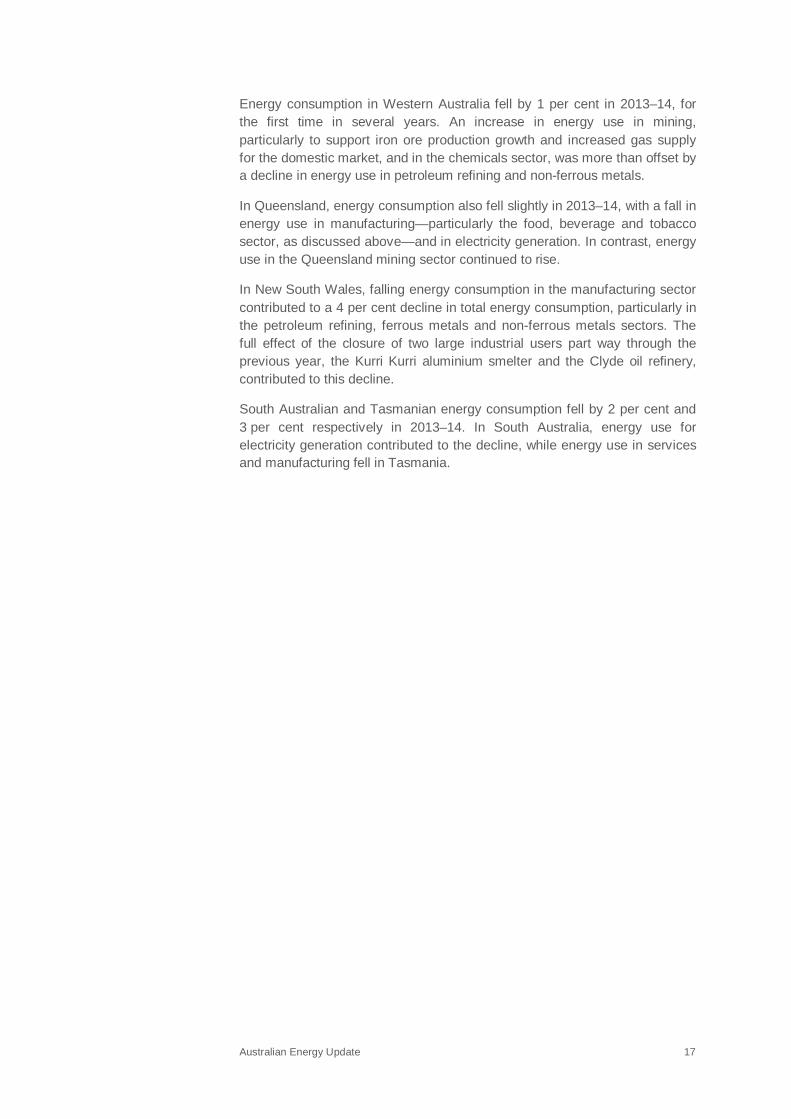
New South Wales and Victoria were the largest energy consumers in 2013–14, together accounting for half of Australia’s energy consumption (Table 3.8). This was followed by Queensland (23 per cent) and Western Australia (18 per cent). In 2013–14, declining energy consumption in most states and territories outweighed growth in Victoria and Northern Territory.
Table 3.8: Australian energy consumption, by state and territory
2013–14
Average annual growth
PJ Share
(per cent)
2013–14 (per cent)
10 years (per cent)
New South Wales a 1 511.0 25.9 - 4.2 - 0.2
Victoria 1 415.7 24.3 1.6 0.5
Queensland 1 318.6 22.6 - 1.4 0.8
Western Australia 1 049.3 18.0 - 1.4 3.8
South Australia 328.5 5.6 - 1.9 - 0.9
Tasmania 108.4 1.9 - 3.4 0.1
Northern Territory 99.5 1.7 0.2 5.8
Total 5 831.1 100.0 - 1.5 0.9
Notes: a Includes Australian Capital Territory.
Source: Department of Industry and Science (2015) Australian Energy Statistics, Table C
In Victoria, energy consumption increased, in contrast to the previous year, supported by increased use in manufacturing, particularly for petroleum refining and chemicals, and in mining. The start-up of the Otway gas facility partially contributed to this growth.
Australian Energy Update 16
Energy consumption in Western Australia fell by 1 per cent in 2013–14, for the first time in several years. An increase in energy use in mining, particularly to support iron ore production growth and increased gas supply for the domestic market, and in the chemicals sector, was more than offset by a decline in energy use in petroleum refining and non-ferrous metals.
In Queensland, energy consumption also fell slightly in 2013–14, with a fall in energy use in manufacturing—particularly the food, beverage and tobacco sector, as discussed above—and in electricity generation. In contrast, energy use in the Queensland mining sector continued to rise.
In New South Wales, falling energy consumption in the manufacturing sector contributed to a 4 per cent decline in total energy consumption, particularly in the petroleum refining, ferrous metals and non-ferrous metals sectors. The full effect of the closure of two large industrial users part way through the previous year, the Kurri Kurri aluminium smelter and the Clyde oil refinery, contributed to this decline.
South Australian and Tasmanian energy consumption fell by 2 per cent and 3 per cent respectively in 2013–14. In South Australia, energy use for electricity generation contributed to the decline, while energy use in services and manufacturing fell in Tasmania.
Australian Energy Update 17
4. Energy production
4.1 Primary production
Energy production is defined as the total amount of primary energy produced in the Australian economy, as measured before consumption or transformation. Forms of renewable energy that produce electricity directly without a thermal component, such as wind, hydro and solar PV, are considered primary energy sources. Coal-fired electricity generation is considered secondary energy production as the coal is already accounted for when mined.
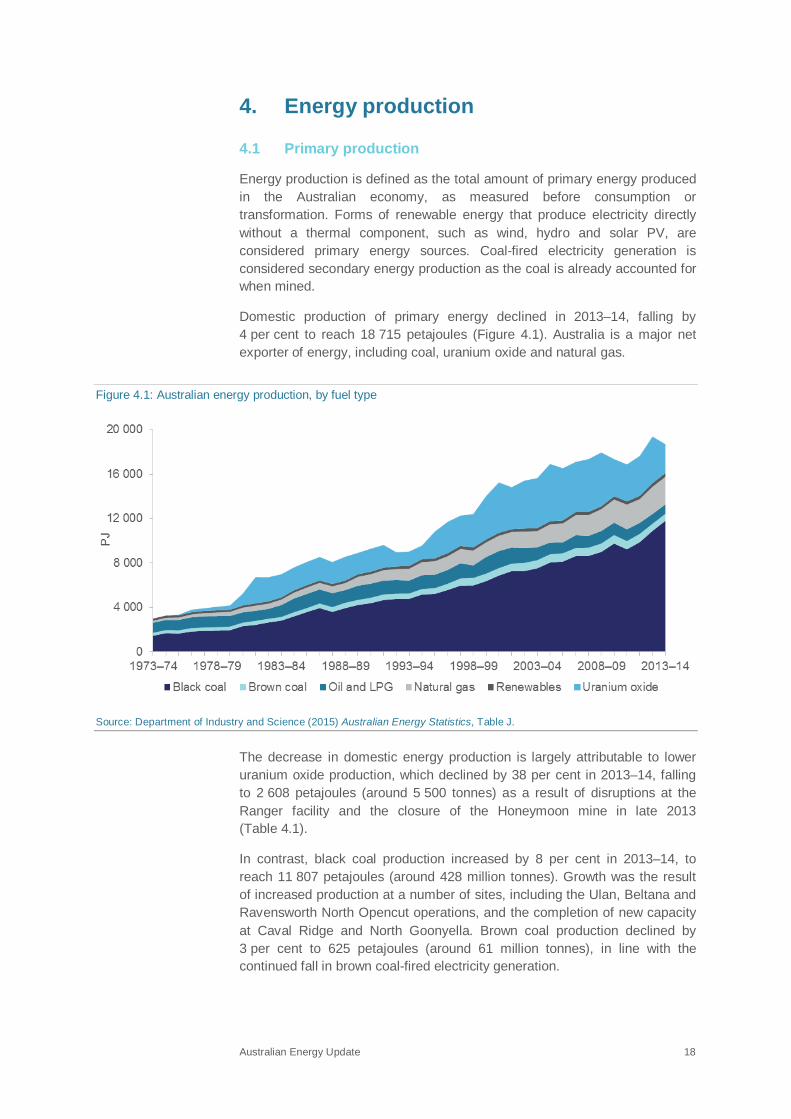
Domestic production of primary energy declined in 2013–14, falling by 4 per cent to reach 18 715 petajoules (Figure 4.1). Australia is a major net exporter of energy, including coal, uranium oxide and natural gas.
Figure 4.1: Australian energy production, by fuel type
Source: Department of Industry and Science (2015) Australian Energy Statistics, Table J.
The decrease in domestic energy production is largely attributable to lower uranium oxide production, which declined by 38 per cent in 2013–14, falling to 2 608 petajoules (around 5 500 tonnes) as a result of disruptions at the Ranger facility and the closure of the Honeymoon mine in late 2013 (Table 4.1).
In contrast, black coal production increased by 8 per cent in 2013–14, to reach 11 807 petajoules (around 428 million tonnes). Growth was the result of increased production at a number of sites, including the Ulan, Beltana and Ravensworth North Opencut operations, and the completion of new capacity at Caval Ridge and North Goonyella. Brown coal production declined by 3 per cent to 625 petajoules (around 61 million tonnes), in line with the continued fall in brown coal-fired electricity generation.
Australian Energy Update 18
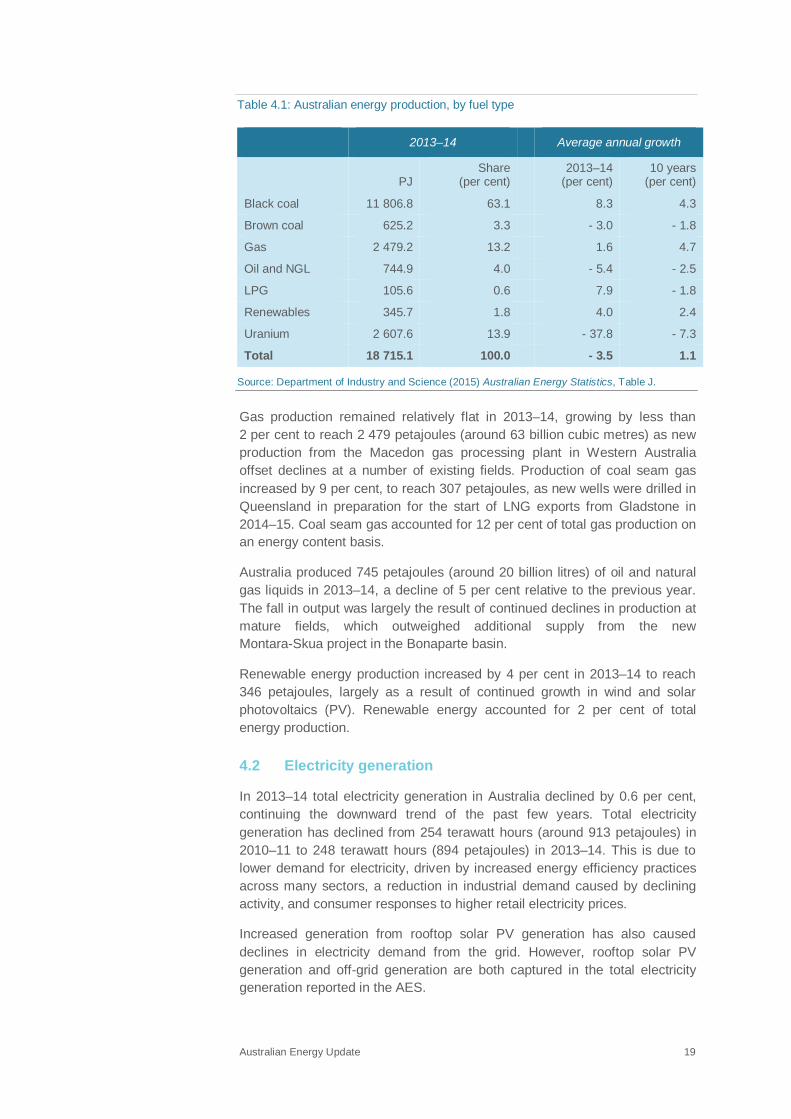
Table 4.1: Australian energy production, by fuel type
2013–14
Average annual growth
PJ Share
(per cent)
2013–14 (per cent)
10 years (per cent)
Black coal 11 806.8 63.1 8.3 4.3
Brown coal 625.2 3.3 - 3.0 - 1.8
Gas 2 479.2 13.2 1.6 4.7
Oil and NGL 744.9 4.0 - 5.4 - 2.5
LPG 105.6 0.6 7.9 - 1.8
Renewables 345.7 1.8 4.0 2.4
Uranium 2 607.6 13.9 - 37.8 - 7.3
Total 18 715.1 100.0 - 3.5 1.1
Source: Department of Industry and Science (2015) Australian Energy Statistics, Table J.
Gas production remained relatively flat in 2013–14, growing by less than 2 per cent to reach 2 479 petajoules (around 63 billion cubic metres) as new production from the Macedon gas processing plant in Western Australia offset declines at a number of existing fields. Production of coal seam gas increased by 9 per cent, to reach 307 petajoules, as new wells were drilled in Queensland in preparation for the start of LNG exports from Gladstone in 2014–15. Coal seam gas accounted for 12 per cent of total gas production on an energy content basis.
Australia produced 745 petajoules (around 20 billion litres) of oil and natural gas liquids in 2013–14, a decline of 5 per cent relative to the previous year. The fall in output was largely the result of continued declines in production at mature fields, which outweighed additional supply from the new Montara-Skua project in the Bonaparte basin.
Renewable energy production increased by 4 per cent in 2013–14 to reach 346 petajoules, largely as a result of continued growth in wind and solar photovoltaics (PV). Renewable energy accounted for 2 per cent of total energy production.
4.2 Electricity generation
In 2013–14 total electricity generation in Australia declined by 0.6 per cent, continuing the downward trend of the past few years. Total electricity generation has declined from 254 terawatt hours (around 913 petajoules) in 2010–11 to 248 terawatt hours (894 petajoules) in 2013–14. This is due to lower demand for electricity, driven by increased energy efficiency practices across many sectors, a reduction in industrial demand caused by declining activity, and consumer responses to higher retail electricity prices.
Increased generation from rooftop solar PV generation has also caused declines in electricity demand from the grid. However, rooftop solar PV generation and off-grid generation are both captured in the total electricity generation reported in the AES.
Australian Energy Update 19
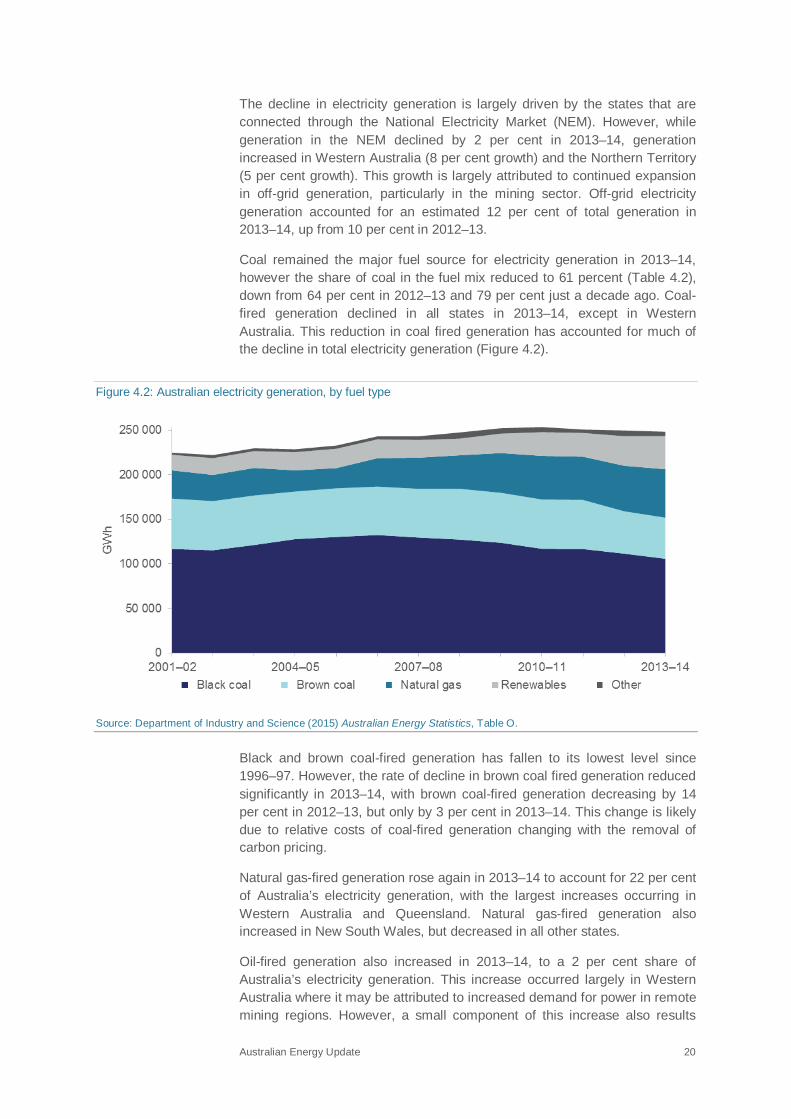
The decline in electricity generation is largely driven by the states that are connected through the National Electricity Market (NEM). However, while generation in the NEM declined by 2 per cent in 2013–14, generation increased in Western Australia (8 per cent growth) and the Northern Territory (5 per cent growth). This growth is largely attributed to continued expansion in off-grid generation, particularly in the mining sector. Off-grid electricity generation accounted for an estimated 12 per cent of total generation in 2013–14, up from 10 per cent in 2012–13.
Coal remained the major fuel source for electricity generation in 2013–14, however the share of coal in the fuel mix reduced to 61 percent (Table 4.2), down from 64 per cent in 2012–13 and 79 per cent just a decade ago. Coal-fired generation declined in all states in 2013–14, except in Western Australia. This reduction in coal fired generation has accounted for much of the decline in total electricity generation (Figure 4.2).
Figure 4.2: Australian electricity generation, by fuel type
Source: Department of Industry and Science (2015) Australian Energy Statistics, Table O.
Black and brown coal-fired generation has fallen to its lowest level since 1996–97. However, the rate of decline in brown coal fired generation reduced significantly in 2013–14, with brown coal-fired generation decreasing by 14 per cent in 2012–13, but only by 3 per cent in 2013–14. This change is likely due to relative costs of coal-fired generation changing with the removal of carbon pricing.
Natural gas-fired generation rose again in 2013–14 to account for 22 per cent of Australia’s electricity generation, with the largest increases occurring in Western Australia and Queensland. Natural gas-fired generation also increased in New South Wales, but decreased in all other states.
Oil-fired generation also increased in 2013–14, to a 2 per cent share of Australia’s electricity generation. This increase occurred largely in Western Australia where it may be attributed to increased demand for power in remote mining regions. However, a small component of this increase also results
Australian Energy Update 20
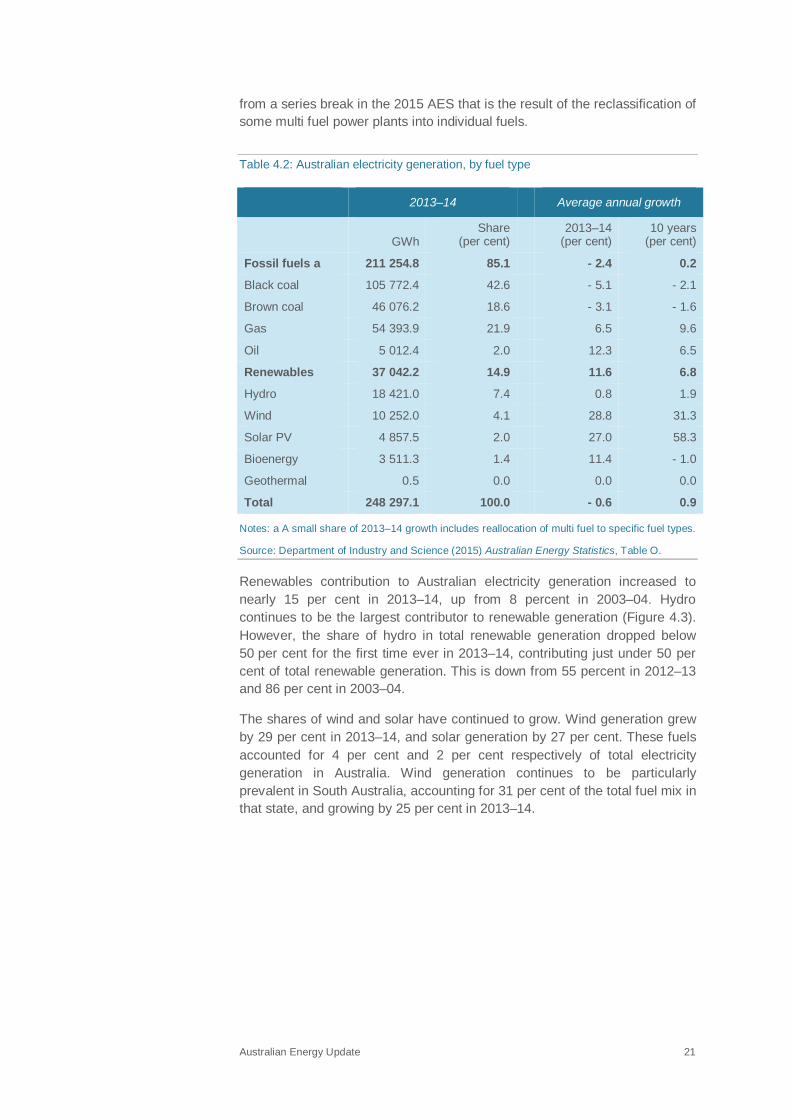
from a series break in the 2015 AES that is the result of the reclassification of some multi fuel power plants into individual fuels.
Table 4.2: Australian electricity generation, by fuel type
2013–14
Average annual growth
GWh Share
(per cent)
2013–14 (per cent)
10 years (per cent)
Fossil fuels a 211 254.8 85.1 - 2.4 0.2
Black coal 105 772.4 42.6 - 5.1 - 2.1
Brown coal 46 076.2 18.6 - 3.1 - 1.6
Gas 54 393.9 21.9 6.5 9.6
Oil 5 012.4 2.0 12.3 6.5
Renewables 37 042.2 14.9 11.6 6.8
Hydro 18 421.0 7.4 0.8 1.9
Wind 10 252.0 4.1 28.8 31.3
Solar PV 4 857.5 2.0 27.0 58.3
Bioenergy 3 511.3 1.4 11.4 - 1.0
Geothermal 0.5 0.0 0.0 0.0
Total 248 297.1 100.0 - 0.6 0.9
Notes: a A small share of 2013–14 growth includes reallocation of multi fuel to specific fuel types.
Source: Department of Industry and Science (2015) Australian Energy Statistics, Table O.
Renewables contribution to Australian electricity generation increased to nearly 15 per cent in 2013–14, up from 8 percent in 2003–04. Hydro continues to be the largest contributor to renewable generation (Figure 4.3). However, the share of hydro in total renewable generation dropped below 50 per cent for the first time ever in 2013–14, contributing just under 50 per cent of total renewable generation. This is down from 55 percent in 2012–13 and 86 per cent in 2003–04.
The shares of wind and solar have continued to grow. Wind generation grew by 29 per cent in 2013–14, and solar generation by 27 per cent. These fuels accounted for 4 per cent and 2 per cent respectively of total electricity generation in Australia. Wind generation continues to be particularly prevalent in South Australia, accounting for 31 per cent of the total fuel mix in that state, and growing by 25 per cent in 2013–14.
Australian Energy Update 21
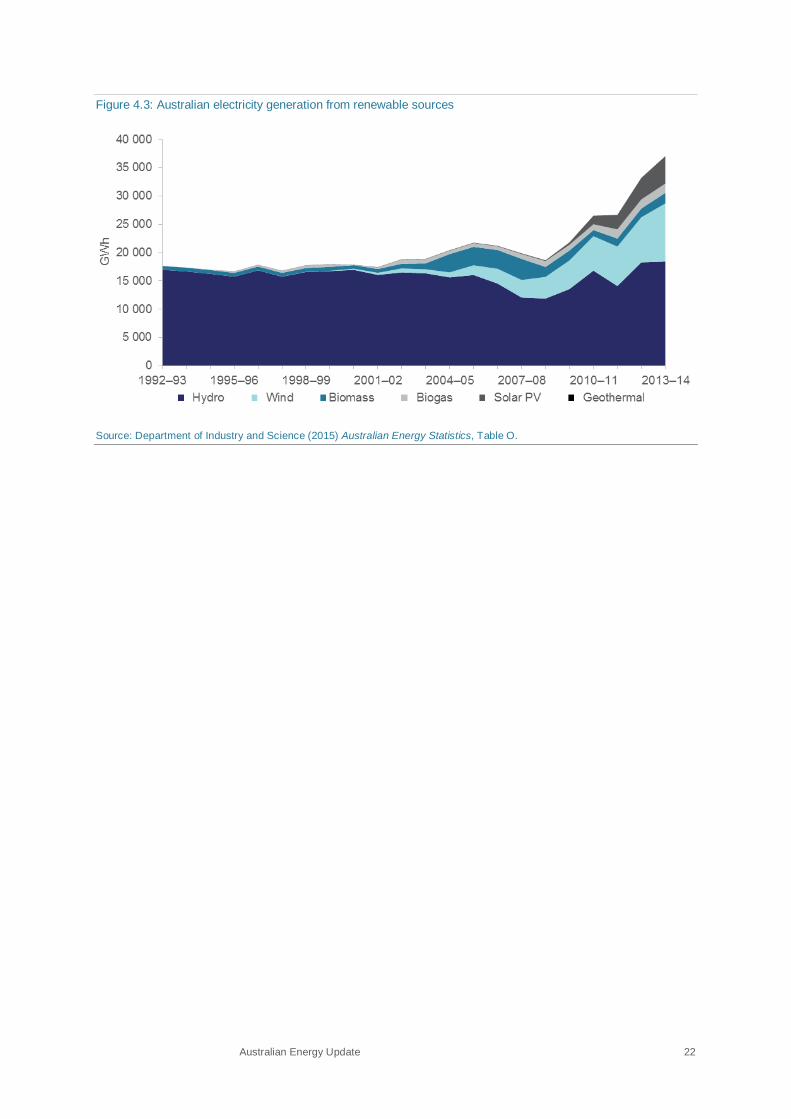
Figure 4.3: Australian electricity generation from renewable sources
Source: Department of Industry and Science (2015) Australian Energy Statistics, Table O.
Australian Energy Update 22
5. Energy trade
5.1 Exports
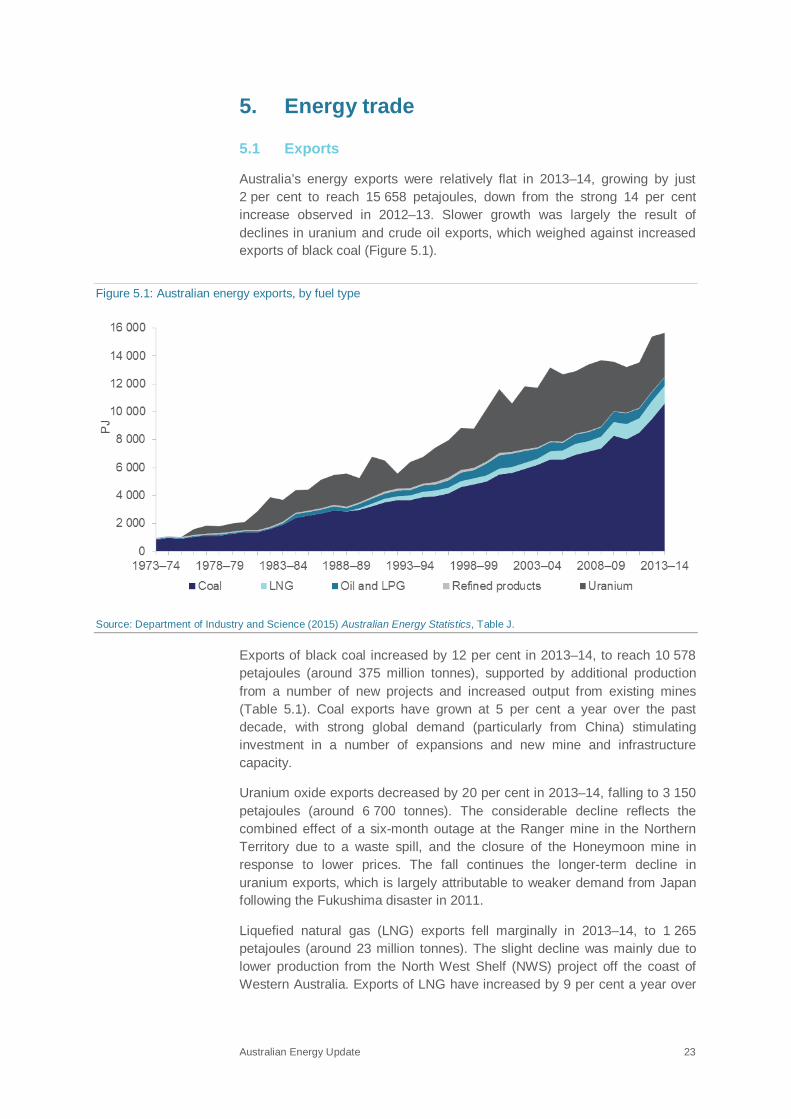
Australia’s energy exports were relatively flat in 2013–14, growing by just 2 per cent to reach 15 658 petajoules, down from the strong 14 per cent increase observed in 2012–13. Slower growth was largely the result of declines in uranium and crude oil exports, which weighed against increased exports of black coal (Figure 5.1).
Figure 5.1: Australian energy exports, by fuel type
Source: Department of Industry and Science (2015) Australian Energy Statistics, Table J.
Exports of black coal increased by 12 per cent in 2013–14, to reach 10 578 petajoules (around 375 million tonnes), supported by additional production from a number of new projects and increased output from existing mines (Table 5.1). Coal exports have grown at 5 per cent a year over the past decade, with strong global demand (particularly from China) stimulating investment in a number of expansions and new mine and infrastructure capacity.
Uranium oxide exports decreased by 20 per cent in 2013–14, falling to 3 150 petajoules (around 6 700 tonnes). The considerable decline reflects the combined effect of a six-month outage at the Ranger mine in the Northern Territory due to a waste spill, and the closure of the Honeymoon mine in response to lower prices. The fall continues the longer-term decline in uranium exports, which is largely attributable to weaker demand from Japan following the Fukushima disaster in 2011.
Liquefied natural gas (LNG) exports fell marginally in 2013–14, to 1 265 petajoules (around 23 million tonnes). The slight decline was mainly due to lower production from the North West Shelf (NWS) project off the coast of Western Australia. Exports of LNG have increased by 9 per cent a year over
Australian Energy Update 23
the last decade, supported by two new LNG trains built at NWS (in 2004 and 2008), and the start-up of Darwin LNG in 2006 and Pluto in 2012.
Table 5.1: Australian energy exports, by fuel type
2013–14
Average annual growth
PJ Share
(per cent)
2013–14 (per cent)
10 years (per cent)
Black coal 10 577.5 67.6
11.7 5.4
Coal by-products 27.3 0.2
- 12.3 na
LNG 1 264.6 8.1
- 1.1 9.1
Crude oil 548.2 3.5
- 6.0 - 0.7
LPG 66.4 0.4
3.1 - 1.6
Refined products 24.6 0.2
- 29.7 - 10.5
Uranium 3 149.5 20.1
- 20.1 - 5.6
Total 15 658.2 100.0 1.7 1.9
Source: Department of Industry and Science (2015) Australian Energy Statistics, Table J.
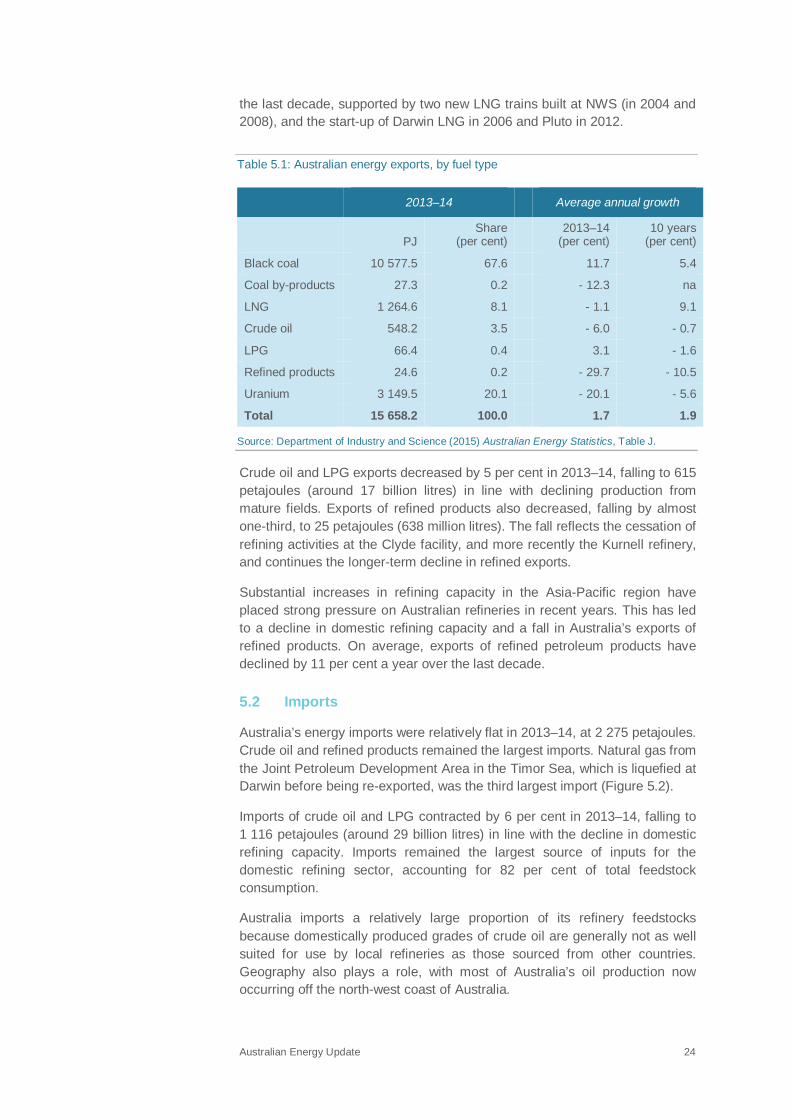
Crude oil and LPG exports decreased by 5 per cent in 2013–14, falling to 615 petajoules (around 17 billion litres) in line with declining production from mature fields. Exports of refined products also decreased, falling by almost one-third, to 25 petajoules (638 million litres). The fall reflects the cessation of refining activities at the Clyde facility, and more recently the Kurnell refinery, and continues the longer-term decline in refined exports.
Substantial increases in refining capacity in the Asia-Pacific region have placed strong pressure on Australian refineries in recent years. This has led to a decline in domestic refining capacity and a fall in Australia’s exports of refined products. On average, exports of refined petroleum products have declined by 11 per cent a year over the last decade.
5.2 Imports
Australia’s energy imports were relatively flat in 2013–14, at 2 275 petajoules. Crude oil and refined products remained the largest imports. Natural gas from the Joint Petroleum Development Area in the Timor Sea, which is liquefied at Darwin before being re-exported, was the third largest import (Figure 5.2).
Imports of crude oil and LPG contracted by 6 per cent in 2013–14, falling to 1 116 petajoules (around 29 billion litres) in line with the decline in domestic refining capacity. Imports remained the largest source of inputs for the domestic refining sector, accounting for 82 per cent of total feedstock consumption.
Australia imports a relatively large proportion of its refinery feedstocks because domestically produced grades of crude oil are generally not as well suited for use by local refineries as those sourced from other countries. Geography also plays a role, with most of Australia’s oil production now occurring off the north-west coast of Australia.
Australian Energy Update 24
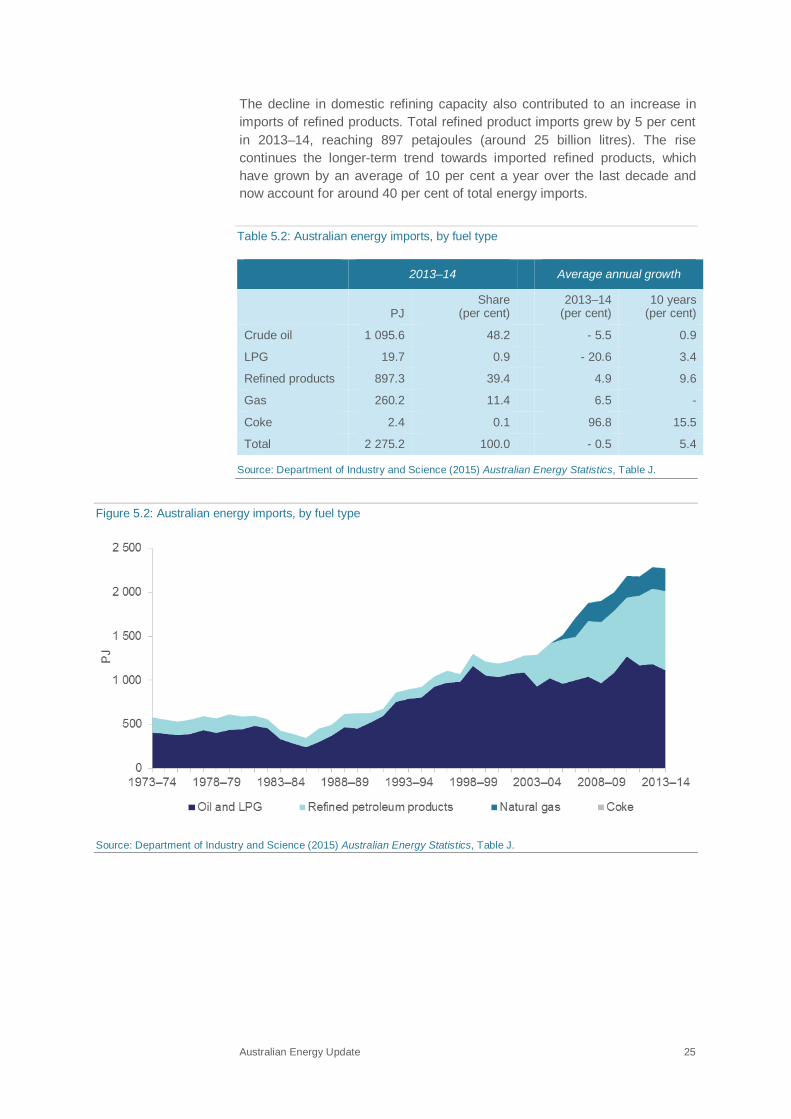
The decline in domestic refining capacity also contributed to an increase in imports of refined products. Total refined product imports grew by 5 per cent in 2013–14, reaching 897 petajoules (around 25 billion litres). The rise continues the longer-term trend towards imported refined products, which have grown by an average of 10 per cent a year over the last decade and now account for around 40 per cent of total energy imports.
Table 5.2: Australian energy imports, by fuel type
2013–14
Average annual growth
PJ Share
(per cent)
2013–14 (per cent)
10 years (per cent)
Crude oil 1 095.6 48.2 - 5.5 0.9
LPG 19.7 0.9 - 20.6 3.4
Refined products 897.3 39.4 4.9 9.6
Gas 260.2 11.4 6.5 -
Coke 2.4 0.1 96.8 15.5
Total 2 275.2 100.0 - 0.5 5.4
Source: Department of Industry and Science (2015) Australian Energy Statistics, Table J.
Figure 5.2: Australian energy imports, by fuel type
Source: Department of Industry and Science (2015) Australian Energy Statistics, Table J.
Australian Energy Update 25
6. References Department of Industry and Science (2015) Australian Energy Statistics, Canberra, August.
Department of Industry and Science (2015) Guide to the Australian Energy Statistics, Canberra, August.
Australian Energy Update 26