2015 Attitudes and Perceptions - michigan.gov · Familiar with MDOT Are Much Less Willing to State...
80
Prepared by: Attitudes & Perceptions of Transportation in Michigan: A 2015 Survey of Michigan Adults September 30, 2015 Prepared for The Michigan Department of Transportation
Transcript of 2015 Attitudes and Perceptions - michigan.gov · Familiar with MDOT Are Much Less Willing to State...

Prepared by:
Attitudes & Perceptions
of Transportation in Michigan:
A 2015 Survey
of Michigan Adults
September 30, 2015
Prepared for
The Michigan Department
of Transportation

MDOT State Long Range Transportation Plan Attitudes & Perceptions Of Transportation
_____________________________________________________________________________________
Page i
Table of Contents
Chapter 1. Purpose and Methods .......................................................................................................... 11
Purpose ............................................................................................................................................ 11
Interviewing ................................................................................................................................... 11
Quotas, Oversampling, and Weighting ...................................................................................... 11
Margin of Error .............................................................................................................................. 13
Figures and Tables ......................................................................................................................... 13
Chapter 2. Familiarity with MDOT ....................................................................................................... 13
Familiarity with MDOT ................................................................................................................ 13
Chapter 3. Satisfaction with MDOT and Its Activities ....................................................................... 17
Satisfaction with MDOT ............................................................................................................... 17
Comparing Levels of Satisfaction with Various MDOT Activities ......................................... 24
Change in Levels of Satisfaction for Certain MDOT Activities............................................... 34
Chapter 4. Perceptions of MDOT ........................................................................................................... 36
That MDOT Is Moving in the Right Direction ........................................................................... 36
That MDOT Adequately Supports Local Transportation Projects ......................................... 39
That MDOT Officials Make Good Decisions ............................................................................. 41
That MDOT Is Responsive to Local Communities ................................................................... 43
That of Having More Confidence in MDOT .............................................................................. 45
That MDOT Does a Good Job in Prioritizing Highway Improvements ................................ 47
Chapter 5. Quality of Transportation in Michigan .............................................................................. 49
Quality of Transportation in the Past Five Years ...................................................................... 49
Chapter 6. Support for the State's Long Range Vision for an Integrated Transportation System 51
Appendix A. Results by MDOT Regions .............................................................................................. 56
A.1 Familiarity and Satisfaction with MDOT by MDOT Region ................................................. 58
A.2 Perception of MDOT by MDOT Region ................................................................................... 64
A.3 Direction of Transportation in Michigan by MDOT Region ................................................. 70
Appendix B. Survey Marginals .............................................................................................................. 71

MDOT State Long Range Transportation Plan Attitudes & Perceptions Of Transportation
_____________________________________________________________________________________
Page ii
List of Tables
Table 1. Sample and Population Breakdown by Region .................................................................... 12
Table 2. Satisfaction Mean Score, Rank, and Category for MDOT & Other Transportation
Activities ................................................................................................................................................. 28
Table 3. Satisfaction Mean Scores For MDOT Activities By Michigan Prosperity Region ............ 31
Table 4. Satisfaction Rankings For MDOT Activities By Michigan Prosperity Region.................. 32
Table A-1. Satisfaction Mean Scores For MDOT Activities By MDOT Region ............................... 61
Table A-2. Satisfaction Rankings For MDOT Activities By MDOT Region ..................................... 62
List of Figures
Figure 1. Michigan Prosperity Regions ................................................................................................ 12
Figure 2. Familiarity with MDOT Greatly Increased among Michigan Residents after Years of
Slowly Declining (Question 1) ............................................................................................................. 13
Figure 3. Residents in the Upper Peninsula Say They Are the Most Familiar with MDOT, but
Regional Differences Are Not Large (Question 1) ............................................................................ 15
Figure 4. Women, Especially Younger Women, Are the Least Familiar with MDO (Question 1)16
Figure 5. Michigan Is Satisfied with the Job Being Done by the Michigan Department of
Transportation (Question 2) ................................................................................................................. 17
Figure 6. With "Not Sures" Included, Public Level of Satisfaction Is Down from Previous Years
(Question 2) ............................................................................................................................................ 18
Figure 7. When "Not Sures" Are Removed, Satisfaction with MDOT Is Remarkably Stable Over
the Nine Years (Question 2) ................................................................................................................. 19
Figure 8. Metro Residents Are the Least Satisfied with MDOT; Residents in the Western Half of
the State Are the Most Satisfied (Question 2) .................................................................................... 20
Figure 9. Women are More Satisfied with MDOT than Men and Residents Who Are Less
Familiar with MDOT Are Much Less Willing to State Their Level of Satisfaction (Question 2) 22
Figure 10. Residents Who Are Dissatisfied Are Overwhelmingly Most Likely to Cite the
Conditions of Michigan State Roads (Question 2a) .......................................................................... 23
Figure 11. MDOT Activities That Rank the Highest in Satisfaction Ratings among Michigan
Residents (Question 8 series, Questions 10 and 12) .......................................................................... 25
Figure 12. MDOT Activities That Rank in the Middle in Satisfaction Ratings among Michigan
Residents (Question 8 series) ............................................................................................................... 26
Figure 13. MDOT Activities That Rank the Lowest in Satisfaction Ratings among Michigan
Residents (Question 8 series) ............................................................................................................... 27
Figure 14. MDOT Activities Where Public Satisfaction Has Improved over the Years (mean
scores of select activities from the Question 8 series) ....................................................................... 34
Figure 15. MDOT Activities Where Public Satisfaction Has Declined over the Years (mean
scores of select activities from the Question 8 series) ....................................................................... 35

MDOT State Long Range Transportation Plan Attitudes & Perceptions Of Transportation
_____________________________________________________________________________________
Page iii
Figure 16. By A Ratio of 2-to-1 Michigan Residents Think MDOT Is Headed in the Right
Direction, Though Agreement on That Has Declined Since 2013 (Question 4b) ......................... 37
Figure 17. West Residents Are the Most Likely and Upper Peninsula Residents Are the Least
Likely to Think MDOT Is Headed in the Right Direction (Question 4b) ...................................... 38
Figure 18. One-half of Michigan Agree That MDOT Adequately Supports Local Transportation
Projects for City and County Governments, A Decline Since 2013 (Question 4e) .................. 39
Figure 19. Detroit Metro Least Likely and West Residents Most Likely to Believe MDOT
Adequately Supports Local Transportation Projects for the City and County Governments
(Question 4e) .......................................................................................................................................... 40
Figure 20. Just over One-Half Agree That They Trust MDOT Officials to Make Good Decisions
about the State's Future Transportation System (Question 4a) ...................................................... 41
Figure 21. Detroit Metro Residents Are the Least Likely and West and Northwest Residents Are
the Most Likely to Trust MDOT Officials Make Good Decisions about the State's Future
Transportation System; (Question 4a) ................................................................................................ 42
Figure 22. Agreement That MDOT Is Responsive to the Concerns of Local Communities Has
Declined since 2013 (Question 4f) ....................................................................................................... 43
Figure 23. Southeast Residents Are the Least Likely and East Residents Are the Most Likely to
Believe MDOT Is Responsive to the Concerns of Local Communities (Question 4f) .................. 44
Figure 24. More Agree than Disagree That They Have More Confidence in MDOT decisions
than 3 Years Ago (Question 4c) ........................................................................................................... 45
Figure 25. Residents in the Westernmost Regions Are Most Likely to Agree That They Have
More Confidence in MDOT Today than They Did Three Years Ago, While Residents in South-
Central Are the Least Likely to Agree (Question 4c) ........................................................................ 46
Figure 26. Michigan Residents Are Fairly Evenly Divided Over Whether MDOT Does a Good
Job Prioritizing Highway Improvements, Which Represents Big Decline in Agreement from
2013 (Question 4d) ................................................................................................................................. 47
Figure 27. Southeast and Detroit-Metro Are Least Likely to Agree that MDOT Does a Good Job
in Prioritizing Highway Improvements (Question 4d) .................................................................... 48
Figure 28. In Comparing the Quality of Michigan Transportation to What It Was 5 years Ago,
More Michigan Residents Say It Is Worse than Say It Is Better (Question 3) ............................... 49
Figure 29. West Michigan Is the Only Region Where More Residents Say the Quality of
Transportation Is Better Than Say It Is Worse. (Question 3) ........................................................... 50
Figure 30. Michigan Residents Still Believe the State Needs to Improve on Various Elements of
the Long Range Plan (Question 5 series, top ranked items) ............................................................ 52
Figure 31. Michigan Residents Still Believe the State Needs to Improve on Various Elements of
the Long Range Plan (Question 5 series, bottom ranked items) ..................................................... 53
Figure 32. Respondents Are Quite Divided over Which Goal in the Preferred Vision Is Most in
Need of Improvement (Question 6) .................................................................................................... 54
Figure 33. Respondents Believe the Preferred Vision Is Very Important to the Future of
Transportation in Michigan (Question 7)........................................................................................... 55
Figure A-1. New MDOT Regions as They Correspond with Michigan Prosperity Regions ....... 57
Figure A-2. MDOT Regions: Not a Big Difference in Familiarity with MDOT by Region
(Question 1) ............................................................................................................................................ 58

MDOT State Long Range Transportation Plan Attitudes & Perceptions Of Transportation
_____________________________________________________________________________________
Page iv
Figure A-3. MDOT Regions: Satisfaction Highest in Western Half of State and Lowest in the
Southeastern corner—especially in Metro (Question 2) .................................................................. 59
Figure A-4. MDOT Regions: Grand Residents Are the Most Likely and Superior Residents Are
the Least Likely to Think MDOT Is Headed in the Right Direction (Question 4b) ..................... 64
Figure A-5. MDOT Regions: Grand Residents Most Likely to Believe MDOT Adequately
Supports Local Transportation Projects for the City and County Governments (Question 4e) 65
Figure A-6. MDOT Regions: Metro Residents Are the Least Likely and Grand Residents Are the
most Likely to Trust MDOT Officials Make Good Decisions about the State's Future
Transportation System; (Question 4a) ................................................................................................ 66
Figure A-7. MDOT Regions: North, Grand, and Bay Residents Are Most Likely to Believe
MDOT Is Responsive to the Concerns of Local Communities (Question 4f) ................................ 67
Figure A-8. MDOT Regions: Residents in the Westernmost Regions Are Most Likely to Agree
That They Have More Confidence in MDOT Today than They Did Three Years Ago (Question
4c) ............................................................................................................................................................. 68
Figure A-9. MDOT Regions: University and Metro Are Least Likely to Agree that MDOT Does
a Good Job in Prioritizing Highway Improvements (Question 4d) ............................................... 69
Figure A-10. MDOT Regions: Grand Is the Only Region Where More Residents Say the Quality
of Transportation Is Better Than Say It Is Worse; Sense of Transportation Getting Worse Is
Much Higher In Metro (Question 3) ................................................................................................... 70

MDOT State Long Range Transportation Plan Attitudes & Perceptions Of Transportation
_____________________________________________________________________________________
Page v
Executive Summary
In general, the Michigan public remains fairly satisfied with the Michigan Department of
Transportation (MDOT) and that satisfaction continues to be remarkably stable since the first
time this question was asked in 2006. Familiarity with MDOT had been slowly declining, but
has made a big rebound this year, likely a result of the communications and information around
the unsuccessful 2015 ballot proposal to fund highway spending.
As has steadily been the case since 2006, public satisfaction is the lowest regarding maintenance
of pavement on state highways and the highest on the safety of state highways.
When respondents are given six positive statements about MDOT, the level of agreement with
all of the statements has dropped from 2011 and 2013 when they were last asked. Of the six,
perceptions are highest that MDOT is moving in the right direction and adequately supports
local transportation projects. Perceptions are the lowest—with as many disagreeing as
agreeing—with the statements that they have more confidence with MDOT than they did three
years ago, and that MDOT is doing a good job prioritizing highway improvements. It is this
latter statement that Michigan residents have changed the most on. In 2011 and 2013, it was
ranked 2nd highest, but this time it ranks last.
In this survey, we outline the various goals in MDOT's long range vision for an integrated
transportation system in Michigan. Residents were asked about these goals in 2011, and at that
time reaffirmed the need for the long range vision that had been developed five years earlier.
This survey does the same thing. Although the importance assigned to each of the eight goals is
a little less than it was in 2011, very solid majorities continue to see a need for improvement for
the goals individually and as a group. In addition, Michigan residents are quite divided over
which goal is the most important, suggesting that the variety of goals are necessary for a
comprehensive vision for the entire state.

MDOT State Long Range Transportation Plan Attitudes & Perceptions Of Transportation
_____________________________________________________________________________________
Page vi
Evaluations of MDOT and Michigan Transportation
Dissatisfaction remains at its lowest, when those saying “not sure”
are excluded (25% in 2015 and 2014, versus 26% in 2013; 27% in
2011, 31% in 2009, and 29% in 2006).
MDOT satisfaction ratings have been fairly stable over time—just
a tiny dip in the recession year of 2009.
o When "not sures" and other non-responses are excluded,
the percent satisfied with MDOT is exactly the same as
2014 and 2013 (74%) and better than 2011 (73%), 2009
(68%), and 2006 (71%)
o The margin of satisfied residents over dissatisfied
residents for 2015 is 2.9-to-1, which is comparable to 2014
(3.0-to-1) and 2013 (2.9-to-1), slightly higher than 2011 (2.7-
to-1) and considerably better than 2009 (2.1-to-1) and 2006
(2.4-to-1).
Those who are more familiar with MDOT are less positive toward
MDOT than those unfamiliar.
Detroit Metro residents have consistently been among the least
satisfied toward MDOT in the previous surveys, which is again
the case this year. Satisfaction tends to be higher in the western
regions (Southwest, Northwest, and West).
Satisfaction with MDOT Activities
Those who were dissatisfied with MDOT were asked why and all respondents were given a
list of 15 MDOT activities and asked how satisfied they were with each.
When we ask residents who are dissatisfied with MDOT an open-
ended question of why, a solid majority mention road conditions
(58%), and a quarter (24%) also mention the lack of funding or
poor funding decisions.
o In 2014, slightly fewer mentioned road conditions (53%
and much fewer had mentioned funding or poor funding
decisions.
Comparable to the findings in the open-ended question of those
who were dissatisfied, when we gave a list of transportation
activities to all respondents, one activity stands out as having the
lowest level of satisfaction is: maintaining the pavement on state
highways to keep them smooth & free of potholes.
Michigan adults
are generally
satisfied with
MDOT.
Satisfaction
ratings have been
very stable
overtime.
Dissatisfaction
with MDOT is
heavily driven by
the perception of
poor highway
conditions in the
state.

MDOT State Long Range Transportation Plan Attitudes & Perceptions Of Transportation
_____________________________________________________________________________________
Page vii
o This has consistently been the activity Michigan residents
are least satisfied with in previous surveys, and
satisfaction with pavement of highways has declined over
time.
Although they have considerably higher satisfaction ratings than
the maintenance of highway pavement, four other MDOT
activities have relatively low levels of satisfaction:
o Making certain sufficient alternatives to driving for long
distance trips are available, such as intercity passenger
rail or intercity bus services.
o Quickly & efficiently completing state highway
construction projects.
o Making certain bridges along Michigan state highways are
in good condition.
o Providing a sufficient number of bike lanes and pathways
for bicycles.
MDOT activities with relatively high levels of satisfaction include:
o Making Michigan state highways and interstates as safe
as possible in their design and construction, and with
clear markings and signage.
o Providing clear information and warnings to the public on
road closures, work zones, and potential traffic delays,
through electronic signs, smartphone apps, and online
tools.
o Quickly and efficiently removing snow and ice from
Michigan state highways.
There are two transportation activities that were more user-based
and asked only of those who had used the service. Both of these
are not directly MDOT activities, but rather activities that MDOT
supports or provides some funding and services. Nonetheless
satisfaction is high among those who used them:
o The quality of the public transportation you have
experienced.
o The quality of the long distance bus or rail transportation
you have experienced.
Dissatisfaction
with highway
conditions is the
lowest every year
and has declined
over time since
2006.
Residents are most
satisfied with the
level of highway
safety and
information
provided to warn
about traffic
delays.

MDOT State Long Range Transportation Plan Attitudes & Perceptions Of Transportation
_____________________________________________________________________________________
Page viii
Perceptions of MDOT
We gave respondents six positive statements about MDOT and asked if they agreed or
disagreed with the statement. This was done previously in the 2011 and 2013 surveys.
Overall agreement declined with all six statements in 2015.
Highest level of agreement.
o I think MDOT is moving in the right direction (52% agree;
26% disagree).
o I think MDOT adequately supports local transportation
projects for city and county governments. (50% agree; 27%
disagree)
o I trust MDOT officials to make good decisions about the
state’s future transportation system (52% agree; 29%
disagree)
Middle level of agreement:
o I think MDOT is responsive to the concerns of local
communities (47% agree; 32% disagree)
Lowest levels of agreement:
o I have more confidence in MDOT today than I did three
years ago (37% agree; 37% disagree)
o MDOT does a good job prioritizing highway
improvements in Michigan (44% agree; 42% disagree)—
ranked the lowest because of the proportion who agree
and disagree strongly. This statement was ranked 2nd in
2011 and 2013, so it is with this concept that the biggest
change occurred.
Michigan Prosperity Regional Summaries
While regional differences are not dramatic, they do exist. The following is a summary of
how each region distinguishes itself when it comes to public attitudes toward transportation
in Michigan.
Detroit Metro
People in this region are the least satisfied with MDOT, and the low satisfaction in this region
has been a consistent pattern over all polls. In addition, when the average of all 15 satisfaction
mean scores for individual MDOT activities are calculated, Detroit Metro also has the lowest
satisfaction, with satisfaction scores that are lower than the statewide measure on every item.
Agreement with
six positive
statements about
MDOT has
declined since 2011
and 2013.
Biggest change
since 2011 and
2013 is the decline
in those who say
MDOT does a
good job
prioritizing
highway
improvements in
Michigan

MDOT State Long Range Transportation Plan Attitudes & Perceptions of Transportation
_____________________________________________________________________________________
Page ix
This pattern can be seen in other measures as well. These residents are the least likely to believe
that the quality of transportation has improved over the past 5 years, are the least likely to trust
that MDOT officials will make good decisions, and among least likely to think MDOT is
responsive to local communities, or doing a good job in prioritizing highway improvements.
Detroit Metro residents are the most likely to see the long range vision as being very important.
Southeast Michigan
Southeast Michigan is also among the least satisfied with MDOT overall, and least satisfied on
the average of all specific activities. They are relatively less satisfied with MDOT making
certain sufficient public transportation services are available for the elderly and persons with
disabilities, and are among the least likely to believe that MDOT is responsive to local
communities or does a good job in prioritizing highway improvements. Southeast residents are
relatively more satisfied that MDOT is making certain bridges are in good condition.
Southwest
Although the make-up of the region is slightly different from surveys conducted prior to 2013,
this region has shifted pretty dramatically from being among the most to among the least
satisfied—and in this year’s poll it is the most satisfied with MDOT. Residents in this region
are also the most likely to say they have more confidence in MDOT than they did three years
ago.
South Central
Residents in this region have fairly low levels of satisfaction compared to other regions. They
are less satisfied with the availability of passenger air service, with public transportation for the
elderly and disabled, and with oversight and protection of for-hire transportation services.
South Central residents are less willing to say that they have more confidence in MDOT than
they did 3 years ago or that MDOT is responsive to the concerns of local communities.
However, South Central residents report high levels of satisfaction with the removal of debris
on highways and the flow of traffic during construction and with bike lanes and long distance
alternatives to driving. Furthermore, they are more willing to say MDOT officials make good
decisions and do a good job in prioritizing highway improvements.
East Michigan
East Michigan residents are more willing to say that MDOT is moving in the right direction,
that MDOT supports local transportation projects for the city and county governments, and that
MDOT is responsive to the concerns of local communities.
East Central Michigan
East Michigan residents have the highest level of satisfaction on the average of all activities
MDOT performs. They are among the least willing to say MDOT does a good job prioritizing
highway improvements, and are among the most likely to say the long range vision is
important.

MDOT State Long Range Transportation Plan Attitudes & Perceptions of Transportation
_____________________________________________________________________________________
Page x
West Michigan
West residents are among the most satisfied with MDOT, and among the highest in level of
satisfaction on average of all activities MDOT performs. West Michigan is the only region
where residents are more likely to say the quality of transportation in Michigan is getting better
than say it is getting worse. West residents are relatively more satisfied with the conditions of
bridges, and are more willing than in other regions to say MDOT supports local transportation
projects and does a good job in prioritizing highway improvements in Michigan. Residents in
this region are among the least likely to find the long range vision important.
Northeast
Residents in this region are among the most likely to say transportation in Michigan has gotten
worse instead of better. Despite that, they are also among the most likely to agree that MDOT is
moving in the right direction and that they have more confidence in MDOT than they did 3
years ago. They are also among the least likely to find the long range vision important.
Northwest
These residents report the highest level of satisfaction with MDOT, and are the most likely to
think MDOT is headed in the right direction. They are among the most likely to agree that
MDOT is responsive to local communities and among the most likely to find the long range
vision important to the future of transportation in Michigan.
Upper Peninsula
Residents in this region give MDOT among the highest average of satisfaction mean scores for
all MDOT activities. They are relatively more satisfied with the condition of bridges on state
highways. However, despite the highest activity satisfaction rating, they are the least likely to
think MDOT is moving in the right direction.

MDOT State Long Range Transportation Plan Attitudes & Perceptions of Transportation
_____________________________________________________________________________________
Page 11
Chapter 1. Purpose and Methods
Purpose
This study explores the opinions of adult residents of the state of Michigan toward Michigan
Department of Transportation (MDOT) and the state of transportation in Michigan. This is the
sixth in a series since 2006, so part of this analysis is to see what might have changed over time
and how well MDOT is improving public satisfaction with its job performance. The
recommendations in this report are intended to provide the public voice for MDOT's long-range
transportation planning.
Interviewing
Professional interviewers, working from a central, monitored location, between August 4 and
August 18, 2015, interviewed a random sample of 1400 adult Michigan residents. The average
interview was 16 minutes long. Potential respondents were contacted through random digit
dialing (RDD). Attempts were made each night to reach people who were not at home the
previous night, before moving on to new telephone numbers. This emphasis on callback
improves accuracy by including hard-to-reach respondents.
A dual frame sample was utilized to include landline and phone cell samples. Two hundred and
thirty completes (230) came from a cell phone sample and the remainder came from a landline
sample.
Quotas, Oversampling, and Weighting
The state is divided into the ten Michigan Prosperity Region regions (see Figure 1 below). In
order to get enough interviews in each of these regions, a quota is set and the less populated
regions are oversampled. All regions had between 100 and 300 randomly drawn interviews. Data
was then weighted proportionally, based on the size of the adult population determined in the
2010 Census and estimated growth from the 2014 Census estimates (see Table 1 for actual and
weighted sample size).

MDOT State Long Range Transportation Plan Attitudes & Perceptions of Transportation
_____________________________________________________________________________________
Page 12
Figure 1. Michigan Prosperity Regions
Table 1. Sample and Population Breakdown by Region Regions Adult Population Actual Weighted
Sample Size Sample Size
Upper Peninsula 4% 100 53
Northwest 3% 100 43
Northeast 2% 100 30
West Michigan 15% 175 214
East Central Michigan 6% 100 82
East Michigan 8% 150 112
South Central 5% 100 67
Southwest 8% 125 112
Southeast Michigan 10% 150 143
Detroit Metro 39% 300 542
TOTAL 100% 1400 1400
Quotas were also set for age and gender to match the known proportion of age groups and men
and women in the adult population within each region. After the data was collected, the data
was also weighted by gender, age, and race to match the known proportion within each region's
adult population.

MDOT State Long Range Transportation Plan Attitudes & Perceptions of Transportation
_____________________________________________________________________________________
Page 13
Finally, as noted earlier, this survey included both a cell phone and a landline sample. When
calling both samples, cell phone usage was measured and the data weighted to approximate the
current balance of cell-phone-only and cell-phone-mostly households in Michigan, as determined
by the National Center for Health Statistics annual Wireless Substitution Reports.1
Margin of Error
The margin of error at the 95% confidence level is about +/-2.6% for a sample of 1400. However,
due to the geographic oversampling and other weighting, the true margin of random error for
the entire sample after taking into consideration design effects is closer to +/-4.06%. The margin
of error is larger for subgroups, depending on subgroup size. (See Volume Two for a more
detailed explanation of sampling and the margin of error.)
Figures and Tables
Figures are integrated into the text. Top-line results (i.e., Marginals) can be found in the
Appendix of this report. Banners or cross-tabulated tables can be found in the second volume of
this report.
Chapter 2. Familiarity with MDOT
Since 2011, the MDOT Attitude and Perceptions Survey has started with a question of familiarity
with MDOT.
Familiarity with MDOT
From 2011 to 2014, there was a slow but steady increase in the percentage who say they are not
familiar with MDOT, from 16% to 25%, but that has changed this year with not familiar dropping
to 19% (Figure 2). The percentage of Michigan residents who are very familiar is now 22%, and
the percentage who are at least somewhat familiar jumped from 51% in 2014 to 61% in 2015. We
suspect this change is a result of the 2015 ballot proposal (Proposal 1) to generate revenue for
state highways, which brought MDOT and transportation funding into the public and media
discourse in ways it had not been in prior years.
Figure 2. Familiarity with MDOT Greatly Increased among Michigan Residents after Years
of Slowly Declining (Question 1)
1Blumberg SJ, Ganesh N, Luke JV, et al. Wireless substitution: State-level estimates from the National Health Interview Survey, 2012.
National health statistics reports; no 61. Hyattsville, MD: National Center for Health Statistics. December, 2013.

MDOT State Long Range Transportation Plan Attitudes & Perceptions of Transportation
_____________________________________________________________________________________
Page 14
The remainder, not shown in this figure but part of the overall 100%, is made up of
respondents saying "not sure" or some similar type of non-response.

MDOT State Long Range Transportation Plan Attitudes & Perceptions of Transportation
_____________________________________________________________________________________
Page 15
Regionally, there is less variation in familiarity with MDOT than there was in 2014, which may
be a result of the increased attention from the ballot campaign. Familiarity is highest in the
Upper Peninsula and lowest in three regions in the South and in the Northeast, but the
differences between the lowest and highest regions are not large (11%). (Figure 3).
Figure 3. Residents in the Upper Peninsula Say They Are the Most Familiar with MDOT, but
Regional Differences Are Not Large (Question 1)
Numbers are percent who are "very familiar" or "somewhat familiar." "Not sure" and similar
non-responses are excluded from regional analyses and are not part of the overall 100% total.
Q1. How familiar are you with the
Michigan Department of
Transportation, or MDOT?
Question

MDOT State Long Range Transportation Plan Attitudes & Perceptions of Transportation
_____________________________________________________________________________________
Page 16
The jump in familiarity in 2015 does not erase the strong relationship between familiarity with
MDOT and gender and age, with women, especially women under 45 years of age, being much
less familiar with MDOT, while men—especially older men—are much more familiar (Figure 4).
The gender aspect of this gap is a little more attenuated this year, although the pattern is still
there.
Figure 4. Women, Especially Younger Women, Are the Least Familiar with MDO (Question
1)
The remainder, not shown in figure but part of the overall 100%, is made up of respondents
saying "not sure" or some similar type of non-response.

MDOT State Long Range Transportation Plan Attitudes & Perceptions of Transportation
_____________________________________________________________________________________
Page 17
Chapter 3. Satisfaction with MDOT and Its Activities
To some degree, nearly all of the attitudinal questions in this survey evaluate some aspect of
MDOT, but 16 questions specifically address satisfaction with the Department. These measures
are tools to assess how well MDOT delivers services and products to its customers. The key
measure is satisfaction with MDOT. This question has been asked since 2006. In addition to that,
satisfaction was measured for 15 different MDOT activities.
Satisfaction with MDOT
Our evaluative measure asks respondents how satisfied they are with the job MDOT is doing—
very satisfied, somewhat satisfied, somewhat dissatisfied, or very dissatisfied. This is a forced-
choice measure, with no middle or neutral category. Two-thirds (67%) of the public is satisfied
with MDOT and 23% is dissatisfied (Figure 5). Overall, feelings in a positive or negative direction
are not strong, with only 14% very satisfied and 9% very dissatisfied.
Figure 5. Michigan Is Satisfied with the Job Being Done by the Michigan Department of
Transportation (Question 2)
The remainder, not shown in figure but part of the overall 100%, is made up of respondents
saying "not sure" or some similar type of non-response.

MDOT State Long Range Transportation Plan Attitudes & Perceptions of Transportation
_____________________________________________________________________________________
Page 18
There is a confounding result when reviewing these numbers over the course of the six surveys.
In the 2011 survey, the satisfaction question excluded "not sure" and any other non-response
options. However, "not sure" or some sort of non-response was recorded in every other year
(Figure 6). Indeed, in 2013 and 2014, the proportion of "not sures" was more than double the
percentages measured in the first two surveys. This year, with familiarity with MDOT higher,
the percentage of "not sures" has declined. Thus, the results appear to significantly fluctuate.
Figure 6. With "Not Sures" Included, Public Level of Satisfaction Is Down from Previous
Years (Question 2)
Another way to think of this is to consider the ratio of the proportion of Michigan residents
satisfied with MDOT to the proportion of dissatisfied Michigan residents. This year that ratio is
2.9 satisfied residents for every one dissatisfied resident, which is just a bit higher than the ratio
in 2011 (2.7-to-1). The ratio was much lower in 2009 (2.1-to-1), when the level of satisfaction was
at its nadir, and was 2.4-to-1 in 2006. The high was in 2014, when it was 3.0-to-1. Thus the ratio
today is just below its highest point, though not significantly different than it was in 2011, 2013,
or 2014.

MDOT State Long Range Transportation Plan Attitudes & Perceptions of Transportation
_____________________________________________________________________________________
Page 19
The unfortunate exclusion of "not sures" in 2011 can leave us with the impression that there was
a spike in satisfaction that year, which subsided in 2013. However, in reality, all of the variation
comes from the disappearance of non-response in 2011 and the larger resurgence of "not sures"
in 2013. Indeed, if "not sures" are treated as missing data and excluded from the analysis, what
is revealed is a remarkably stable measure over time. There is a very marginal, very statistically
insignificant increase in satisfaction with MDOT since 2011. Only 2009 represented a significant
change, with a slight dip in satisfaction (Figure 7).
Figure 7. When "Not Sures" Are Removed, Satisfaction with MDOT Is Remarkably Stable
Over the Nine Years (Question 2)
"Not sure" and similar non-responses are excluded from this analysis and are not part of the
overall 100% total.
Given the potential variation of "not sures" along with their exclusion in 2011, the appropriate
way to compare MDOT's satisfaction measure over time is to either 1) exclude "not sures" from
the analysis; or 2) compare the ratio of those who are satisfied with MDOT to those who are not.
By either of these two measures, satisfaction with MDOT has been consistent since 2011 and is up
slightly from 2006 and, especially, from 2009.

MDOT State Long Range Transportation Plan Attitudes & Perceptions of Transportation
_____________________________________________________________________________________
Page 20
Regionally, satisfaction is greatest in the Western region of the Lower Peninsula—Northwest,
West, and Southwest—and lowest among residents in the Southeastern corner—South Central,
Southeast, and, especially Detroit Metro (Figure 8). That Detroit Metro is the least satisfied
should not come as a surprise. It has reported the lowest level of satisfaction in every survey
except in 2014, when it was the second lowest. Satisfaction in Detroit Metro has been slowly and
surely increasing ever since the first survey in 2006, from 62% in 2006 to 71% in 2014. This
represents the first time satisfaction had not held steady or increased in this region.
Satisfaction in the Southwest, on the other hand, has fluctuated between extreme highs
and lows over the years. While again, this analysis is not using the exact same set of regions this
year, the previous version of Southwest was the most satisfied in the 2013 survey, the least in
2014, and once again the most in 2015.
Figure 8. Metro Residents Are the Least Satisfied with MDOT; Residents in the Western
Half of the State Are the Most Satisfied (Question 2)
"Not sure" and similar non-responses are excluded from regional analyses and are not part of
the overall 100% total.
Q2. How satisfied are you with
the job the Michigan Department
of Transportation is doing?
Question

MDOT State Long Range Transportation Plan Attitudes & Perceptions of Transportation
_____________________________________________________________________________________
Page 21
(Please note: in this map and in all maps to follow, one part of a bifurcated response is presented.
In this case, the numbers shown are the percentage of respondents who are satisfied. Not shown
is the percentage of respondents who are dissatisfied. To make this map presentation of data
work, respondents who say they are "not sure" are excluded. Thus, when the map shows 75%
satisfied in the Northeast, that means 75% of those who expressed an opinion are satisfied, and
25% of those who expressed an opinion are dissatisfied. Because those who are "not sure" are
excluded in the maps (not just for this satisfaction measure, but for all measures in this report),
these numbers will be higher on average than those reported in the bar graphs.)

MDOT State Long Range Transportation Plan Attitudes & Perceptions of Transportation
_____________________________________________________________________________________
Page 22
This year, the age/gender gap in familiarity with MDOT does not translate into similar difference
in satisfaction. When it comes to satisfaction, women are more satisfied, with big gender gaps for
those under 45 years of age. (Figure 9). As we have in previous years, we find that those who are
less familiar with MDOT are much less likely to be able to say how satisfied they are, with 18%
of these respondents being "not sure." However, for those who reply, those less familiar are more
likely to say they are satisfied than dissatisfied.
Figure 9. Women are More Satisfied with MDOT than Men and Residents Who Are Less
Familiar with MDOT Are Much Less Willing to State Their Level of Satisfaction (Question 2)
Numbers in any one bar may not add up to 100% because of rounding.

MDOT State Long Range Transportation Plan Attitudes & Perceptions of Transportation
_____________________________________________________________________________________
Page 23
For those 23% of Michigan residents who said they were dissatisfied, the satisfaction question
was followed up by asking "is there anything specific about MDOT or the job that it is doing
that leads you to be dissatisfied?" Figure 10 shows that, overwhelmingly (58%), those who are
dissatisfied with MDOT cite road and pavement conditions as the source of their dissatisfaction.
This is up from 53% in 2014. The next most frequently cited reason for dissatisfaction was
funding, either in terms of not enough spent or that the way it is spent is wasteful, frequently
cited in conjunction with road conditions and perceptions of shoddy repairs that don't last.
There is a big growth in the percentage of dissatisfied public who gave this response, from 8%
in 2014 to 24% this year.
Figure 10. Residents Who Are Dissatisfied Are Overwhelmingly Most Likely to Cite the
Conditions of Michigan State Roads (Question 2a)
Although most people gave one response, Figure 10 allows for multiple responses. Other
responses, not included in this figure, were voiced by less than 2% of those who were
dissatisfied.
MDOT State Long Range Transportation Plan Attitudes & Perceptions of Transportation
_____________________________________________________________________________________
Page 24
Comparing Levels of Satisfaction with Various MDOT Activities
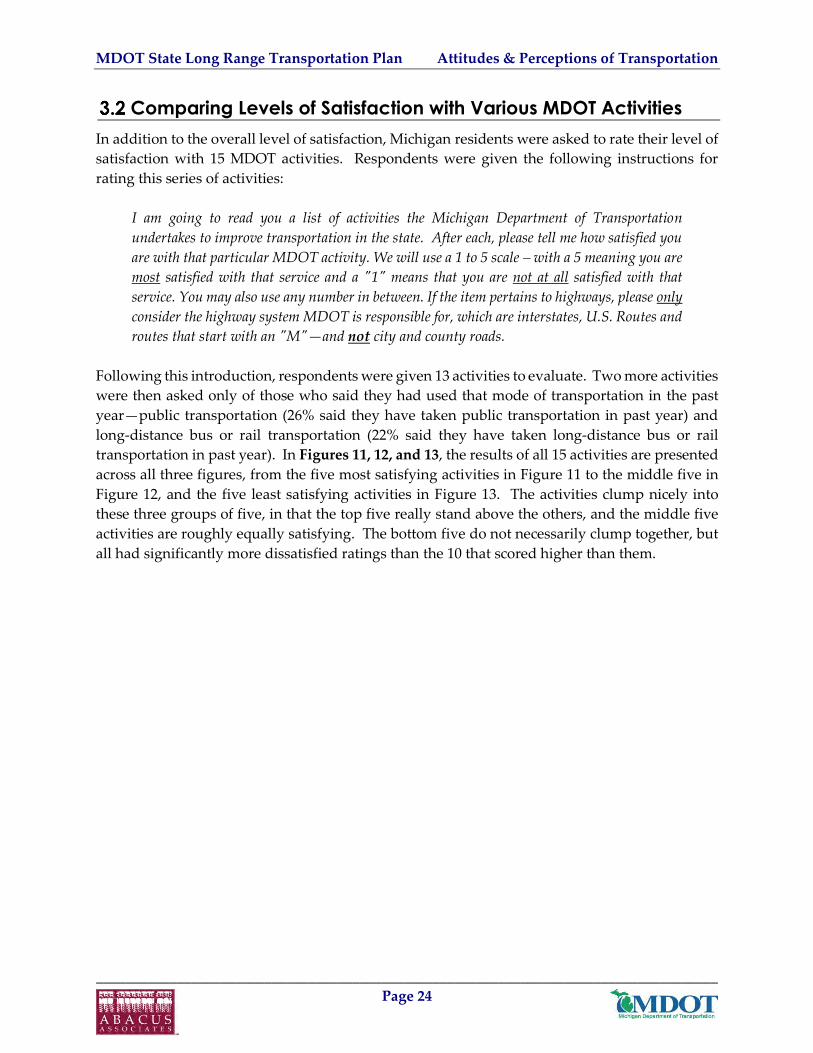
In addition to the overall level of satisfaction, Michigan residents were asked to rate their level of
satisfaction with 15 MDOT activities. Respondents were given the following instructions for
rating this series of activities:
I am going to read you a list of activities the Michigan Department of Transportation
undertakes to improve transportation in the state. After each, please tell me how satisfied you
are with that particular MDOT activity. We will use a 1 to 5 scale – with a 5 meaning you are
most satisfied with that service and a "1" means that you are not at all satisfied with that
service. You may also use any number in between. If the item pertains to highways, please only
consider the highway system MDOT is responsible for, which are interstates, U.S. Routes and
routes that start with an "M"—and not city and county roads.
Following this introduction, respondents were given 13 activities to evaluate. Two more activities
were then asked only of those who said they had used that mode of transportation in the past
year—public transportation (26% said they have taken public transportation in past year) and
long-distance bus or rail transportation (22% said they have taken long-distance bus or rail
transportation in past year). In Figures 11, 12, and 13, the results of all 15 activities are presented
across all three figures, from the five most satisfying activities in Figure 11 to the middle five in
Figure 12, and the five least satisfying activities in Figure 13. The activities clump nicely into
these three groups of five, in that the top five really stand above the others, and the middle five
activities are roughly equally satisfying. The bottom five do not necessarily clump together, but
all had significantly more dissatisfied ratings than the 10 that scored higher than them.

MDOT State Long Range Transportation Plan Attitudes & Perceptions of Transportation
_____________________________________________________________________________________
Page 25
Figure 11. MDOT Activities That Rank the Highest in Satisfaction Ratings among Michigan
Residents (Question 8 series, Questions 10 and 12)
The remainder, not shown in the figure but part of the overall 100%, is made up of
respondents saying "not sure" or some similar type of non-response.
*Sample size is smaller for this item, as it was only asked of those who used such modes of
transportation in the past year.

MDOT State Long Range Transportation Plan Attitudes & Perceptions of Transportation
_____________________________________________________________________________________
Page 26
Figure 12. MDOT Activities That Rank in the Middle in Satisfaction Ratings among
Michigan Residents (Question 8 series)
The remainder, not shown in figure but part of the overall 100%, is made up of respondents
saying "not sure" or some similar type of non-response.

MDOT State Long Range Transportation Plan Attitudes & Perceptions of Transportation
_____________________________________________________________________________________
Page 27
Figure 13. MDOT Activities That Rank the Lowest in Satisfaction Ratings among Michigan
Residents (Question 8 series)
The remainder, not shown in figure but part of the overall 100%, is made up of respondents
saying "not sure" or some similar type of non-response.

MDOT State Long Range Transportation Plan Attitudes & Perceptions of Transportation
_____________________________________________________________________________________
Page 28
Table 2 reports the mean scores for all fifteen measures—the thirteen MDOT activities and two
more experiential-based evaluations—all in the same rank order as in Figures 11-13.
Table 2. Satisfaction Mean Score, Rank, and Category for MDOT & Other Transportation
Activities
Activity Rank Mean
score Category
Making Michigan state highways and interstates as safe as possible in their
design and construction, and with clear markings and signage. (Q8d) 1 3.7 Design & Build
The quality of the public transportation you have experienced. (Q12)* 2 3.64 Alt. to privately
owned cars
Providing clear information and warnings to the public on road closures,
work zones, and potential traffic delays, through electronic signs,
smartphone apps, and online tools. (Q8g)
3 3.63 Traffic flow
Quickly and efficiently removing snow and ice from Michigan state
highways. (Q8c) 4 3.6 Maintenance
The quality of the long distance bus or rail transportation you have
experienced. (Q10)* 4 3.6
Alt. to privately
owned cars
Ensuring sufficient availability of passenger air services. (Q8m) 6 3.31 Alt. to privately
owned cars
Making certain sufficient public transportation services are available for the
elderly and persons with disabilities. (Q8i) 7 3.23
Alt. to privately
owned cars
Making certain sufficient public transportation services for local trips are
available, such as public bus or "Dial-A-Ride" transportation services. (Q8j) 8 3.2
Alt. to privately
owned cars
Making certain traffic flows as efficiently and smoothly as possible during
rush hour, highway construction, and after traffic accidents. (Q8f) 9 3.19 Traffic flow
Making certain for-hire transportation services, such as taxis and limousines,
charter buses and app-based transportation services—such as UBER and
LYFT—have sufficient government oversight and protection for consumers.
(Q8l)
10 3.16 Alt. to privately
owned cars
Providing a sufficient number of bike lanes and pathways for bicycles. (Q8h) 11 3.07 Alt. to privately
owned cars
Making certain bridges along Michigan state highways are in good condition.
(Q8a) 12 3.05 Maintenance
Quickly and efficiently completing Michigan state highway construction
projects. (Q8e) 13 3.01 Design & Build
Making certain sufficient alternatives to driving for long distance trips are
available, such as intercity passenger rail or intercity bus services. (Q8k) 14 2.89
Alt. to privately
owned cars
Maintaining the pavement on Michigan state highways to keep them smooth
and free of potholes. (Q8b) 15 2.6 Maintenance
*Asked of only those who used or experienced this item and more of a satisfaction of the quality of that activity than of MDOT
itself. In some previous MDOT Attitude and Perception surveys—such as in 2014—the number of
MDOT activities for which public satisfaction was measured was larger. We scaled back the list
and combined items this year to make room for other questions. Many of the questions dropped
related to MDOT communication activities, which as group, polled the highest in public
satisfaction. Items related to traffic flow activities were combined to create two from what had
been four in 2014 and maintenance activities moved from five to three items. The one exception

MDOT State Long Range Transportation Plan Attitudes & Perceptions of Transportation
_____________________________________________________________________________________
Page 29
to this was activities touching on means of transportation that are alternatives to diving cars,
which now makes up eight items in Table 2, up from seven in 2014. One thing that is clear from
Table 2 is that once communication activities are removed, no category of activities clearly ranks
high or low in satisfaction. Each of the categories are well represented on the top and bottom half
of this list.
When it comes to Traffic flow the highest ranking item is communication related—providing clear
information and warnings to the public on road closures, work zones, and potential traffic delays, through
electronic signs, smartphone apps, and online tools (3rd). Lower in satisfaction, although far from the
lowest, is the effort outside of communication to improve traffic flow—making certain traffic flows
as efficiently and smoothly as possible during rush hour, highway construction, and after traffic accidents
(9th).
The category of Design and build includes the activity that received the highest satisfaction
ratings—making Michigan state highways and interstates as safe as possible in their design and
construction, and with clear markings and signage (1st). However, ranking among the lowest is the
speed in which projects get built—quickly and efficiently completing Michigan state highway
construction projects (13th).
The highest ranking item in the Maintenance category is MDOT's ability to quickly & efficiently
remove snow and ice from state highways and interstates (tied 4th). However ranked among the least
satisfied is: making certain bridges along Michigan state highways are in good condition (12th) and
maintaining the pavement on Michigan state highways to keep them smooth and free of potholes (15th).
This latter item has always ranked the lowest in satisfaction in every one of the Attitude and
Perceptions surveys MDOT has conducted.
There are many more items in the category of alternatives to privately owned motor vehicles.
The highest ranked of these is the quality of public transportation (2nd). Satisfaction with public
transportation is asked only of those who have taken public transportation in the past year, which
is only 26% of Michigan residents. The lowest level of satisfaction with activities in this category
is making certain sufficient alternatives to driving for long distance trips are available, such as intercity
passenger rail or intercity bus services (14th). All of the other six activities in this category are
clumped together in the middle in terms of ranking levels of satisfaction. It should be noted that
items related to the quality of long distance bus and rail service, were also only asked only of
those who used those services, which was 22% of Michigan residents. In addition the question
on the quality of public transportation and long distance transportation did not specifically
mention MDOT, in part because MDOT is not solely responsible for that quality and because the
respondent would likely have little idea what contribution MDOT makes in those areas to
improve the quality.
Table 3 reverts back to the 13 satisfaction measures of MDOT activities asked in the question 3
series. It again has the relative statewide ranking (among the 13) and the statewide mean score,
but it also includes the mean scores for activities within each of the 10 Michigan Prosperity

MDOT State Long Range Transportation Plan Attitudes & Perceptions of Transportation
_____________________________________________________________________________________
Page 30
Regions.2 Comparing the regions with each other is less interesting, for there is a typical pattern
that tends to mirror the overall state satisfaction. For example, if one compares the regional mean
scores with the state mean scores, residents in Detroit Metro and Southeast are less satisfied on
average than residents across the state for all 13 measures. Western, East Central, and Upper
Peninsula residents tend to be the most positive. For that reason, it does not tell us much to go
through each activity and see which region has the highest and lowest score. More interesting
and more revealing is comparing the relative rank order of the activity within each region, to see
if there is an activity that does especially well or especially poorly compared to its relative ranking
among all residents.
Table 4 shows the relative ranking of all 13 activities across the state and within each region. It
also notes when that regional ranking differed from the state by more than four places. If the
regional rank is at least 4 places higher than the state rank, it is noted with a blue box and blue
font. If the regional ranking is lower by more than at least 4 places from the state ranking, then
it is noted by a red box and red font.
2 One of the reasons this report goes back to just the 13 activities asked in Q8 in Table 3 and not all 15
satisfaction measures shown in Table 2, is that the other 2 were not asked of everyone—just those who
used or experienced them. Thus the sample size in many regions is just too small to analyze with any
accuracy.

MDOT State Long Range Transportation Plan Attitudes & Perceptions of Transportation
_____________________________________________________________________________________
Page 31
Table 3. Satisfaction Mean Scores For MDOT Activities By Michigan Prosperity Region
Michigan Prosperity Regions
MDOT Activity
state state UP NW NE W EC E SC SW SE DM
rank score 1 2 3 4 5 6 7 8 9 10
Making Michigan state highways and interstates as
safe as possible in their design and construction, and
with clear markings and signage
1 3.7 3.88 3.7 3.88 3.82 3.92 3.9 3.67 3.58 3.53 3.63
Providing clear information and warnings to the
public on road closures, work zones, and potential
traffic delays, through electronic signs, smartphone
apps, and online tools
2 3.63 4.51 3.55 4.03 3.82 3.57 3.73 3.7 3.56 3.6 3.51
Quickly and efficiently removing snow and ice from
Michigan state highways 3 3.6 3.75 3.72 3.89 3.68 3.82 3.62 3.82 3.76 3.62 3.5
Ensuring sufficient availability of passenger air
services 4 3.31 3.78 3.65 3.8 3.92 3.84 3.7 3.58 3.6 3.48 3.42
Making certain sufficient public transportation
services are available for the elderly and persons with
disabilities
5 3.23 3.37 3.34 3.87 3.77 3.37 3.93 3.77 3.55 3.75 3.45
Making certain sufficient public transportation
services for local trips are available, such as public
bus or "Dial-A-Ride" transportation services.
6 3.2 3.44 3.23 3.3 3.36 3.53 3.46 3.21 3.45 3.08 3.25
Making certain traffic flows as efficiently and
smoothly as possible during rush hour, highway
construction, and after traffic accidents
7 3.19 3.47 3.21 3.32 3.39 3.5 3.32 3.07 3.34 2.88 3.17
Making certain for-hire transportation services, such
as taxis and limousines, charter buses and app-based
transportation services—such as UBER and LYFT—
have sufficient government oversight and protection
for consumers.
8 3.16 3.12 3.25 3.4 3.51 3.44 3.24 3.38 3.45 2.99 3.02
Providing a sufficient number of bike lanes and
pathways for bicycles 9 3.07 3.65 3.29 3.27 3.31 3.45 3.34 3.26 3.12 3.04 3.07
Making certain bridges along Michigan state
highways are in good condition 10 3.05 3.17 3.18 2.99 3.32 3.37 3.29 2.99 3.23 3.03 3.08
Quickly and efficiently completing Michigan state
highway construction projects 11 3.01 3.18 3.09 2.89 3.23 3.39 3.22 3.37 3.34 2.92 2.86
Making certain sufficient alternatives to driving for
long distance trips are available, such as intercity
passenger rail or intercity bus services
12 2.89 3.57 3.12 3.2 3.48 3.1 3.09 3 3.1 3.04 2.79
Maintaining the pavement on Michigan state
highways to keep them smooth and free of potholes 13 2.6 3.42 3.06 3.15 3.25 3.33 2.89 3.18 3.08 2.99 2.81

MDOT State Long Range Transportation Plan Attitudes & Perceptions of Transportation
_____________________________________________________________________________________
Page 32
Table 4. Satisfaction Rankings For MDOT Activities By Michigan Prosperity Region
Michigan Prosperity Regions
MDOT Activity state state UP NW NE W EC E SC SW SE DM
rank score 1 2 3 4 5 6 7 8 9 10
Making Michigan state highways and interstates as
safe as possible in their design and construction, and
with clear markings and signage
1 3.7 1 2 2 2 1 1 2 3 2 1
Providing clear information and warnings to the
public on road closures, work zones, and potential
traffic delays, through electronic signs, smartphone
apps, and online tools
2 3.63 3 1 1 3 3 3 1 1 1 2
Quickly and efficiently removing snow and ice from
Michigan state highways 3 3.6 2 3 3 1 2 2 3 2 3 3
Ensuring sufficient availability of passenger air
services 4 3.31 7 6 6 7 4 4 8 4 4 4
Making certain sufficient public transportation
services are available for the elderly and persons with
disabilities
5 3.23 6 7 5 6 5 6 10 6 11 5
Making certain sufficient public transportation
services for local trips are available, such as public
bus or "Dial-A-Ride" transportation services.
6 3.2 12 5 4 4 7 8 4 4 8 8
Making certain traffic flows as efficiently and
smoothly as possible during rush hour, highway
construction, and after traffic accidents
7 3.19 4 4 7 9 6 5 7 10 5 7
Making certain for-hire transportation services, such
as taxis and limousines, charter buses and app-based
transportation services—such as UBER and LYFT—
have sufficient government oversight and protection
for consumers.
8 3.16 10 8 10 8 9 7 12 8 7 6
Providing a sufficient number of bike lanes and
pathways for bicycles 9 3.07 9 10 11 12 8 9 5 6 10 9
Making certain bridges along Michigan state
highways are in good condition 10 3.05 5 9 8 5 12 11 11 11 5 11
Quickly and efficiently completing Michigan state
highway construction projects 11 3.01 8 11 9 11 10 12 9 12 8 10
Making certain sufficient alternatives to driving for
long distance trips are available, such as intercity
passenger rail or intercity bus services
12 2.89 13 12 12 10 11 10 6 9 12 12
Maintaining the pavement on Michigan state
highways to keep them smooth and free of potholes 13 2.6 11 13 13 13 13 13 13 13 13 13

MDOT State Long Range Transportation Plan Attitudes & Perceptions of Transportation
_____________________________________________________________________________________
Page 33
There really is not much that stands out in terms of regional difference. The only results that
exceed our requirement of a ranking difference of more than 4 places are the following:
In the Upper Peninsula, West, Southeast, there is more satisfaction with the activity of
making certain bridges along Michigan state highways are in good condition compared to the
other regions.
In South-Central, there is relatively greater satisfaction with making certain sufficient
alternatives to driving for long distance trips are available, such as intercity passenger rail or
intercity bus services.
Also in South-Central, there is relatively greater satisfaction with providing a sufficient
number of bike lanes and pathways for bicycles.
In the Upper Peninsula, there is considerably less satisfaction with making certain
sufficient public transportation services for local trips are available, such as public bus or "Dial-
A-Ride" transportation services.
In South-Central, there is relatively less satisfaction with:
o Ensuring sufficient availability of passenger air services.
o Making certain sufficient public transportation services are available for the elderly and
persons with disabilities
o Making certain for-hire transportation services, such as taxis and limousines, charter
buses and app-based transportation services—such as UBER and LYFT—have sufficient
government oversight and protection for consumers.
In Southeast, residents are less satisfied relative to other regions in MDOT making certain
sufficient public transportation services are available for the elderly and persons with disabilities.
In Detroit Metro the ranking of the activities does not greatly differ (i.e. by as little as two
places or more) from the statewide ranking. This is in part because Detroit Metro is so much
more populated that its results have a much bigger impact on the state results.

MDOT State Long Range Transportation Plan Attitudes & Perceptions of Transportation
_____________________________________________________________________________________
Page 34
Change in Levels of Satisfaction for Certain MDOT Activities
For the most part, reported satisfaction for these activities have improved. We have tweaked the
language for some of the items over the years, which makes some of them difficult to analyze
over time because change in satisfaction could well have been the result of wording change.
However, there are some activities that we have asked about with enough consistency since either
the 2006 or the 2009 survey that, on the whole, have also increased in the average level of
satisfaction over the course of the time they have been asked (Figure 14). The increases are not
tremendous and there are some years where satisfaction levels have ebbed and flowed, but on
the whole we see a clear pattern of increase in satisfaction over time.
Figure 14. MDOT Activities Where Public Satisfaction Has Improved over the Years (mean
scores of select activities from the Question 8 series)
*Wording changed in 2015 to include "marking and signage."

MDOT State Long Range Transportation Plan Attitudes & Perceptions of Transportation
_____________________________________________________________________________________
Page 35
However, there have been two MDOT activities where we have seen a general decrease in
satisfaction over time (Figure 15). These two activities—making certain bridges along Michigan
state highways are in good condition and maintaining the pavement on Michigan state highways
to keep them smooth and free of potholes—rank among the lowest in satisfaction and in early
surveys were found to be considered among the most important of MDOT activities, so it is
especially troubling to see their decline.
Figure 15. MDOT Activities Where Public Satisfaction Has Declined over the Years (mean
scores of select activities from the Question 8 series)

MDOT State Long Range Transportation Plan Attitudes & Perceptions of Transportation
_____________________________________________________________________________________
Page 36
Chapter 4. Perceptions of MDOT
In this survey, we returned to a series of six statements that give positive descriptions of MDOT
and ask respondents to agree and disagree. These questions had also been asked in 2011 and
2013.3 In this report, we will discuss these statements in the order of those that receive the highest
level of agreement and lowest disagreement to those who received the lowest level of agreement
and highest disagreement. We will also show how much the public agreed with these statements
overtime. In each case, the level of agreement has declined since both 2011 and 2013.
That MDOT Is Moving in the Right Direction
The highest level of agreement is for the statement I think MDOT is moving in the right direction.
By a ratio of 2-to-1, more agree (52%) than disagree (26%) with the statement (Figure 16).
However, this represents a significant drop in agreement (down from 60% in 2013) and increase
in disagreement (up from 17% in 2013).
3These six statements were also asked in surveys conducted prior to 2011, but in 2011 the scale was
changed slightly, adding a neither "agree-disagree" option into what had previously been a forced choice
agree-disagree scale. This means we are unable to compare results on this series of questions with any
survey prior to 2011.

MDOT State Long Range Transportation Plan Attitudes & Perceptions of Transportation
_____________________________________________________________________________________
Page 37
Figure 16. By A Ratio of 2-to-1 Michigan Residents Think MDOT Is Headed in the Right
Direction, Though Agreement on That Has Declined Since 2013 (Question 4b)
The remainder, not shown in this figure but part of the overall 100%, is made up of
respondents saying "not sure" or some similar type of non-response.

MDOT State Long Range Transportation Plan Attitudes & Perceptions of Transportation
_____________________________________________________________________________________
Page 38
Residents in the West Region are the most likely to say MDOT is moving in the right direction,
while residents in the Upper Peninsula are the least likely (Figure 17).4 The variation between
regions is not great and only falls just outside the margin of error when comparing the very
highest and lowest results.
Figure 17. West Residents Are the Most Likely and Upper Peninsula Residents Are the Least
Likely to Think MDOT Is Headed in the Right Direction (Question 4b)
"Not sure" and "Neither" are excluded for regional analyses. In other words, the percentages
shown in this figure represent the percent who agree over those who either agree or disagree.
4In the regional maps for the Q4 series, the percentage shown is the portion who agree of only those who
express an opinion. Because there is a large neutral category—those who neither agree nor disagree—it,
along with "unsures," is removed from this analysis. For that reason the percentage who agree will
appear larger than it does in the overall bar graphs where "unsure" and "neither" are included in the
numbers.
Q4b. Percent agree: I think
MDOT is moving in the right
direction
Question

MDOT State Long Range Transportation Plan Attitudes & Perceptions of Transportation
_____________________________________________________________________________________
Page 39
That MDOT Adequately Supports Local Transportation Projects
The second highest level of agreement is for the statement, I think MDOT adequately supports
local transportation projects for city and county governments. Exactly one-half (50%) of
Michigan residents agree with this statement, while 27% disagree (Figure 18). Agreement with
this statement has declined since 2013, but the change is a little less pronounced compared to the
previous statement on MDOT moving in the right direction. The drop of 9% in the percentage
who agree, from 59% in 2011, is much larger.
Figure 18. One-half of Michigan Agree That MDOT Adequately Supports Local
Transportation Projects for City and County Governments, A Decline Since 2013
(Question 4e)
The remainder, not shown in this figure but part of the overall 100%, is made up of
respondents saying "not sure" or some similar type of non-response.

MDOT State Long Range Transportation Plan Attitudes & Perceptions of Transportation
_____________________________________________________________________________________
Page 40
West residents are the most likely to agree that MDOT adequately supports local transportation
projects for city and county governments, while Detroit Metro residents are the least likely
(Figure 19). However, again the variation among regions is not especially pronounced and just
barely exceeds the margin of error.
Figure 19. Detroit Metro Least Likely and West Residents Most Likely to Believe MDOT
Adequately Supports Local Transportation Projects for the City and County Governments
(Question 4e)
"Not sure" and "Neither" are excluded for regional analyses. In other words, the percentages
shown in this figure represent the percent who agree over those who either agree or disagree.
Q4e. Percent agree: I think
MDOT adequately supports local
transportation projects for city
and county governments
Question

MDOT State Long Range Transportation Plan Attitudes & Perceptions of Transportation
_____________________________________________________________________________________
Page 41
That MDOT Officials Make Good Decisions
The third in our series of statements, I trust MDOT officials to make good decisions about the
state's future transportation system, has slightly more who agree (52%), but even more who
disagree (29%—Figure 20). Here the change from 2013 is considerably less pronounced.
Agreement is basically the same as it was in 2013, although strong agreement increased slightly—
albeit insignificantly. However, disagreement is up from 24% in 2013. The opposite was the case
in 2011, with more disagreeing (29%) but also much more (58%) agreeing with the statement.
Figure 20. Just over One-Half Agree That They Trust MDOT Officials to Make Good
Decisions about the State's Future Transportation System (Question 4a)
The remainder, not shown in this figure but part of the overall 100%, is made up of
respondents saying "not sure" or some similar type of non-response.

MDOT State Long Range Transportation Plan Attitudes & Perceptions of Transportation
_____________________________________________________________________________________
Page 42
When it comes to trusting MDOT officials to make good decisions about the state's future
transportation system, West and Northwest residents are the most likely to agree, whereas
Detroit Metro Residents are the most likely to disagree (Figure 21). In general the regional
variation is not great, but the map does show a bit of a divide down the middle of the state,
with trust higher on the Western side and lower on the Eastern side.
Figure 21. Detroit Metro Residents Are the Least Likely and West and Northwest Residents
Are the Most Likely to Trust MDOT Officials Make Good Decisions about the State's Future
Transportation System; (Question 4a)
"Not sure" and "Neither" are excluded for regional analyses. In other words, the percentages
shown in this figure represent the percent who agree over those who either agree or disagree.
Q4a. Percent agree: I trust MDOT
officials to make good decisions
about the State's future
transportation system
Question

MDOT State Long Range Transportation Plan Attitudes & Perceptions of Transportation
_____________________________________________________________________________________
Page 43
That MDOT Is Responsive to Local Communities
The fourth in the ranked series, I think MDOT is responsive to the concerns of local communities,
does not differ dramatically from the previous in the number who agree with the statement,
although this is the first statement that less than one-half agree with (47%—Figure 22). Nearly
one-third disagree (32%). This again represents a big drop in agreement from 2013, when it was
55% and a big increase in disagreement (23% in 2013).
Figure 22. Agreement That MDOT Is Responsive to the Concerns of Local Communities Has
Declined since 2013 (Question 4f)
The remainder, not shown in this figure but part of the overall 100%, is made up of
respondents saying "not sure" or some similar type of non-response.

MDOT State Long Range Transportation Plan Attitudes & Perceptions of Transportation
_____________________________________________________________________________________
Page 44
Southeast residents are the least likely to believe that MDOT is responsive to local communities,
while East Residents are the most likely to believe that (Figure 23). But the picture is more
interesting if we take a broader look at how the four southernmost regions, along with the Upper
Peninsula, are the least likely to agree with the statement, while the more northern regions
(excluding the Upper Peninsula) are the most likely.
Figure 23. Southeast Residents Are the Least Likely and East Residents Are the Most Likely
to Believe MDOT Is Responsive to the Concerns of Local Communities (Question 4f)
"Not sure" and "Neither" are excluded for regional analyses. In other words, the percentages
shown in this figure represent the percent who agree over those who either agree or disagree.
Q4f. Percent agree: I think MDOT
is responsive to the concerns of
local communities
Question

MDOT State Long Range Transportation Plan Attitudes & Perceptions of Transportation
_____________________________________________________________________________________
Page 45
That of Having More Confidence in MDOT
Michigan residents are evenly split over the statement, I have more confidence in MDOT today
than I did three years ago. Thirty-seven percent (37%) agree and 37% disagree with the
statement, although those who disagree are more likely to feel strongly about it (Figure 24). There
is a big gap compared to the first four statements discussed above, with agreement steeply
dropping by 10% and disagreement rising by 5%.
Figure 24. More Agree than Disagree That They Have More Confidence in MDOT decisions
than 3 Years Ago (Question 4c)
The remainder, not shown in this figure but part of the overall 100%, is made up of
respondents saying "not sure" or some similar type of non-response.

MDOT State Long Range Transportation Plan Attitudes & Perceptions of Transportation
_____________________________________________________________________________________
Page 46
This statement produces the sharpest regional differences. Confidence is highest among the
three westernmost regions, while it is the lowest in the region of the State Capital: South-Central
Michigan (Figure 25).
Figure 25. Residents in the Westernmost Regions Are Most Likely to Agree That They Have
More Confidence in MDOT Today than They Did Three Years Ago, While Residents in
South-Central Are the Least Likely to Agree (Question 4c)
"Not sure" and "Neither" are excluded for regional analyses. In other words, the percentages
shown in this figure represent the percent who agree over those who either agree or disagree.
Q4c. Percent agree: I have more
confidence in MDOT today than I
did three years ago
Question

MDOT State Long Range Transportation Plan Attitudes & Perceptions of Transportation
_____________________________________________________________________________________
Page 47
That MDOT Does a Good Job in Prioritizing Highway
Improvements
Residents are also evenly divided over the statement MDOT does a good job prioritizing
highway improvements in Michigan. Forty-four percent (44%) agree with the statement, while
42% disagree (Figure 26). This is ranked the lowest of the six because of the intensity of those
who disagree, with 19% disagreeing strongly. Of the six statements, this one used to rank 2nd in
2011 and 2013, so the decline in agreement that we see since 2013—a decline that exists for all
statements—is far worse for this statement. And this is the case after relative stability in this
measure from 2011 and 2013. The decline in agreement since 2013 is from 58% to 44%, while
disagreement with the statement jumped from 23% to 42%.
Figure 26. Michigan Residents Are Fairly Evenly Divided Over Whether MDOT Does a
Good Job Prioritizing Highway Improvements, Which Represents Big Decline in Agreement
from 2013 (Question 4d)
The remainder, not shown in this figure but part of the overall 100%, is made up of
respondents saying "not sure" or some similar type of non-response.

MDOT State Long Range Transportation Plan Attitudes & Perceptions of Transportation
_____________________________________________________________________________________
Page 48
The Southeastern corner of the state—that is the Southeast and Detroit-Metro regions—stand out
as the least likely to agree that MDOT does a good job prioritizing highway improvements in
Michigan (Figure 27).
Figure 27. Southeast and Detroit-Metro Are Least Likely to Agree that MDOT Does a Good
Job in Prioritizing Highway Improvements (Question 4d)
"Not sure" and "Neither" are excluded for regional analyses. In other words, the percentages
shown in this figure represent the percent who agree over those who either agree or disagree.
Q4d. Percent agree: I think
MDOT does a good job
prioritizing highway
improvements in Michigan
Question

MDOT State Long Range Transportation Plan Attitudes & Perceptions of Transportation
_____________________________________________________________________________________
Page 49
Chapter 5. Quality of Transportation in Michigan
We asked one question whose purpose was less to evaluate MDOT directly and more to measure
the public’s general perception of the present state of transportation and the way it is funded.
Quality of Transportation in the Past Five Years
To get a sense of whether the public thinks transportation quality is changing, we asked
respondents whether the quality of transportation in Michigan is better, the same, or worse than
it was five years ago. This is a question that has been asked in each of the previous surveys with
the exception of last year (2014). Here, unlike the satisfaction measure of MDOT, we see a big
change (Figure 28), which suggests that residents may not hold MDOT responsible for the decline
in transportation quality they are perceiving. In 2006, 2011, 2013, more residents said
transportation was better than said it was worse. This year is more like 2009, where the percent
saying transportation is worse outflanks those who say it is better.
Figure 28. In Comparing the Quality of Michigan Transportation to What It Was 5 years Ago,
More Michigan Residents Say It Is Worse than Say It Is Better (Question 3)
The remainder, not shown in this figure but part of the overall 100%, is made up of
respondents saying "not sure" or some similar type of non-response.

MDOT State Long Range Transportation Plan Attitudes & Perceptions of Transportation
_____________________________________________________________________________________
Page 50
To show regional differences with this question, we subtracted the percent who say it the quality
of transportation is worse than it was 5 years ago from the percent who say it is better. In every
region but one, the percent saying it is worse is larger than the percent saying it is better, thus the
results shown in Figure 29 are mostly negative numbers. The one exception to this is in the West,
where 5% more say the quality of transportation is better than say it is worse. The regions where
residents are the most likely to say the quality of transportation is worse as opposed to better, are
Northeast Michigan and Detroit Metro.
Figure 29. West Michigan Is the Only Region Where More Residents Say the Quality of
Transportation Is Better Than Say It Is Worse. (Question 3)
Number represents percent better minus percent worse. "Not sure" and "Same" are excluded
from the analysis in this figure.
Q3. Is the quality of
transportation in Michigan better,
the same, or worse than it was
five years ago?
Question

MDOT State Long Range Transportation Plan Attitudes & Perceptions of Transportation
_____________________________________________________________________________________
Page 51
Chapter 6. Support for the State's Long Range Vision for an
Integrated Transportation System
The final section of this report addresses the preferred vision for an integrated transportation
system in the state that was originally affirmed in the 2006 and was a part of MDOT's Long Range
Plan. This vision was reaffirmed five years later in the 2011 survey. Now nearly another five
years has passed and MDOT is once again asking if Michigan residents will reaffirm the preferred
vision as the right one for Michigan.
We started this by giving respondents some background and context;
In 2012, the Michigan Department of Transportation reaffirmed the state's long-range vision for
an Integrated Transportation System in the state. To do this, the Department held webinars, public
meetings, and surveyed public opinion to get a sense of what the public wants and will need from
the state's transportation system. Now, I am going to read you a series of transportation goals that
make up the strategic vision they came up with.
We then asked the respondents how much the Michigan transportation system needed to
improve on each of the goals. The eight goals were:
Preserve the physical quality and condition of the present transportation system.
Ensure that the environment is protected and public resources are used in a responsible
manner.
Continue to build, maintain, and operate the safest transportation system possible
Reduce the vulnerability of transportation facilities and their users to terrorist attacks,
natural disasters and other risks.
Modernize, expand, and connect the system to support economic growth and better
facilitate the movement of goods, people, and services.
Make the transportation system physically and economically accessible to all residents of
Michigan.
Make the transportation system and its services more efficient and effective to get the
greatest possible performance from Michigan's existing transportation assets and future
system improvements .
Expand MDOT's coordination and collaboration with both the public and private sector.
Figures 30 and 31 show how the public response has changed between this year and in 2011 when
the question was originally asked regarding how much each goal needs to improve. The goals
are again presented in these figures in rank order from those with the greatest need for
improvement in this year's results to the least need of improvement. In every instance, the
percent saying the goal needs to improve "some" or a "great deal" has declined slightly since 2011.
Nonetheless, a very solid majority reconfirm the importance of these goals, with 74% to 79% of
respondents saying 7 of the 8 goals need to improve a great deal or some. The 8th goal (reducing
the vulnerability of the transportation facilities and their users to terrorist attacks, natural disasters

MDOT State Long Range Transportation Plan Attitudes & Perceptions of Transportation
_____________________________________________________________________________________
Page 52
and other risks) had nearly two-thirds (65%) of Michigan residents saying the Michigan
transportation system needs to improve a great deal or some.
Figure 30. Michigan Residents Still Believe the State Needs to Improve on Various Elements
of the Long Range Plan (Question 5 series, top ranked items)
The remainder, not shown in this figure but part of the overall 100%, is made up of
respondents saying "not sure" or some similar type of non-response.

MDOT State Long Range Transportation Plan Attitudes & Perceptions of Transportation
_____________________________________________________________________________________
Page 53
Figure 31. Michigan Residents Still Believe the State Needs to Improve on Various Elements
of the Long Range Plan (Question 5 series, bottom ranked items)
The remainder, not shown in this figure but part of the overall 100%, is made up of
respondents saying "not sure" or some similar type of non-response.

MDOT State Long Range Transportation Plan Attitudes & Perceptions of Transportation
_____________________________________________________________________________________
Page 54
We followed up this series of goal ratings with a question that asks which of the goals needs the
most improvement. What's impressive about the responses is how fractured they are, with no
one goal dominating. Six of the goals have between 12% and 17% of the respondents saying it is
the most in need of improvement (Figure 32). A similar result was found in in 2011. This suggests
that the vision encompasses the full range of goals—that it is not really driven by one or by just a
few particular goals—it is important for all or, at the very least, nearly all of the goals to be
included.
Figure 32. Respondents Are Quite Divided over Which Goal in the Preferred Vision Is Most
in Need of Improvement (Question 6)
The remainder, not shown in this figure but part of the overall 100%, is made up of
respondents saying "not sure" or some similar type of non-response.

MDOT State Long Range Transportation Plan Attitudes & Perceptions of Transportation
_____________________________________________________________________________________
Page 55
The strength of the preferred vision is underscored by a follow up question on how important,
when taken all together, are the eight goals to the future of transportation in Michigan. Seventy-
four percent (74%) say the preferred vision is very important and 94% say it is at least somewhat
important (Figure 33).
Figure 33. Respondents Believe the Preferred Vision Is Very Important to the Future of
Transportation in Michigan (Question 7)
The remainder, not shown in this figure but part of the overall 100%, is made up of
respondents saying "not sure" or some similar type of non-response.
74%
71%
78%
77%
69%
74%
76%
20%
24%
16%
18%
22%
21%
15%
4 %
3 %
5%
2%
6%
3 %
6%
2%
2%
2%
2%
2%
2%
All
18-34 years
35-49 years
50-64 years
65+ years
Satisfied
Not satisfied
Very
important
Somewhat
important
Only a little
important
Not at all
important
Q7. Taken a ll together, how important do you think this vision is to the future of
transportation in Michigan?

MDOT State Long Range Transportation Plan Attitudes & Perceptions of Transportation
_____________________________________________________________________________________
Page 56
Appendix A.
Results by MDOT Region

MDOT State Long Range Transportation Plan Attitudes & Perceptions of Transportation
_____________________________________________________________________________________
Page 57
Results by MDOT Region
Starting this fall of 2015, MDOT has new MDOT regions that are based on the relatively new
Michigan Prosperity Regions (Figure A-1). We were tasked to show results by Prosperity
Regions, but in order to establish a regional baseline for the new MDOT regions and to provide
regional definitions that can be more helpful to MDOT employees in those regions, we provide
in this section the results broken down by MDOT Regions. There are seven MDOT regions as
opposed to 10 Michigan Prosperity Regions. Four of the MDOT Regions are the exact same as
four of the Michigan Prosperity Regions. The other three MDOT Regions are the combination of
two Michigan prosperity regions. So the results here will not look much different from the results
for the ten regions in the main body of the report.
Figure A-1. New MDOT Regions as They Correspond with Michigan Prosperity Regions

MDOT State Long Range Transportation Plan Attitudes & Perceptions of Transportation
_____________________________________________________________________________________
Page 58
A.1 Familiarity and Satisfaction with MDOT by MDOT Region
Regionally, there is not a tremendous variation in familiarity with MDOT. It may be slightly
lower in the two southernmost MDOT regions and slightly higher in Grand and Superior, but
not by much. (Figure A-2).
Figure A-2. MDOT Regions: Not a Big Difference in Familiarity with MDOT by Region
(Question 1)
Numbers are percent who are "very familiar" or "somewhat familiar." "Not sure" and similar
non-responses are excluded from regional analyses and are not part of the overall 100% total.
Q1. How familiar are you with the
Michigan Department of
Transportation, or MDOT?
Question

MDOT State Long Range Transportation Plan Attitudes & Perceptions of Transportation
_____________________________________________________________________________________
Page 59
Regionally, satisfaction is greatest in the western regions of Grand and Southwest and lowest
among residents in the southeastern corner—University and, especially Metro (Figure A-3).
Figure A-3. MDOT Regions: Satisfaction Highest in Western Half of State and Lowest in the
Southeastern corner—especially in Metro (Question 2)
"Not sure" and similar non-responses are excluded from regional analyses and are not part of
the overall 100% total.
Q2. How satisfied are you with
the job the Michigan Department
of Transportation is doing?
Question

MDOT State Long Range Transportation Plan Attitudes & Perceptions of Transportation
_____________________________________________________________________________________
Page 60
Table A-1 reports the 13 satisfaction measures of MDOT activities asked in the Question 3 series.
It has the relative statewide ranking (among the 13) and the statewide mean score, but it also
includes the mean scores for activities within each of the 7 MDOT Regions.
Table A-2 shows the relative ranking of all 13 activities across the state and within each MDOT
Region. It also notes when that regional ranking differed from the state by more than four places.
If the regional rank is at least four places higher than the state rank, it is noted with a blue box
and blue font. If the regional ranking is lower by more than at least 4 places from the state
ranking, then it is noted by a red box and red font.

MDOT State Long Range Transportation Plan Attitudes & Perceptions of Transportation
_____________________________________________________________________________________
Page 61
Table A-1. Satisfaction Mean Scores For MDOT Activities By MDOT Region
Michigan DOT Regions
MDOT Activity
state state Super North Grand Bay SWest Univ Metro
rank score 1 2 3 4 5 6 7
Making Michigan state highways and interstates as
safe as possible in their design and construction, and
with clear markings and signage
1 3.7 3.88 3.78 3.82 3.91 3.58 3.58 3.63
Providing clear information and warnings to the
public on road closures, work zones, and potential
traffic delays, through electronic signs, smartphone
apps, and online tools
2 3.63 3.75 3.79 3.68 3.70 3.76 3.69 3.50
Quickly and efficiently removing snow and ice from
Michigan state highways 3 3.6 3.78 3.71 3.92 3.76 3.60 3.51 3.42
Ensuring sufficient availability of passenger air
services 4 3.31 3.44 3.26 3.36 3.49 3.44 3.12 3.25
Making certain sufficient public transportation
services are available for the elderly and persons with
disabilities
5 3.23 3.47 3.25 3.39 3.40 3.34 2.94 3.17
Making certain sufficient public transportation
services for local trips are available, such as public
bus or "Dial-A-Ride" transportation services.
6 3.2 3.12 3.31 3.51 3.32 3.45 3.11 3.02
Making certain traffic flows as efficiently and
smoothly as possible during rush hour, highway
construction, and after traffic accidents
7 3.19 3.65 3.28 3.31 3.39 3.12 3.11 3.07
Making certain for-hire transportation services, such
as taxis and limousines, charter buses and app-based
transportation services—such as UBER and LYFT—
have sufficient government oversight and protection
for consumers.
8 3.16 3.17 3.10 3.32 3.32 3.23 3.02 3.08
Providing a sufficient number of bike lanes and
pathways for bicycles 9 3.07 3.18 3.01 3.22 3.30 3.34 3.06 2.86
Making certain bridges along Michigan state
highways are in good condition 10 3.05 3.57 3.15 3.48 3.09 3.10 3.03 2.79
Quickly and efficiently completing Michigan state
highway construction projects 11 3.01 3.42 3.10 3.25 3.07 3.08 3.05 2.81
Making certain sufficient alternatives to driving for
long distance trips are available, such as intercity
passenger rail or intercity bus services
12 2.89 2.98 2.86 3.27 3.13 3.13 3.01 2.56
Maintaining the pavement on Michigan state
highways to keep them smooth and free of potholes 13 2.6 3.14 2.68 2.92 2.82 2.80 2.49 2.32

MDOT State Long Range Transportation Plan Attitudes & Perceptions of Transportation
_____________________________________________________________________________________
Page 62
Table A-2. Satisfaction Rankings For MDOT Activities By MDOT Region
Michigan DOT Regions
MDOT Activity
state Super North Grand Bay SWest Univ Metro
rank 1 2 3 4 5 6 7
Making Michigan state highways and interstates as
safe as possible in their design and construction, and
with clear markings and signage 1 1 2 2 1 3 2 1
Providing clear information and warnings to the
public on road closures, work zones, and potential
traffic delays, through electronic signs, smartphone
apps, and online tools
2 3 1 3 3 1 1 2
Quickly and efficiently removing snow and ice from
Michigan state highways 3 2 3 1 2 2 3 3
Ensuring sufficient availability of passenger air
services 4 7 6 7 4 5 4 4
Making certain sufficient public transportation
services are available for the elderly and persons with
disabilities 5 6 7 6 5 6 12 5
Making certain sufficient public transportation
services for local trips are available, such as public
bus or "Dial-A-Ride" transportation services. 6 12 4 4 7 4 5 8
Making certain traffic flows as efficiently and
smoothly as possible during rush hour, highway
construction, and after traffic accidents 7 4 5 9 6 10 6 7
Making certain for-hire transportation services, such
as taxis and limousines, charter buses and app-based
transportation services—such as UBER and LYFT—
have sufficient government oversight and protection
for consumers.
8 10 9 8 8 8 10 6
Providing a sufficient number of bike lanes and
pathways for bicycles 9 9 11 12 9 7 7 9
Making certain bridges along Michigan state
highways are in good condition 10 5 8 5 11 11 9 11
Quickly and efficiently completing Michigan state
highway construction projects 11 8 10 11 12 12 8 10
Making certain sufficient alternatives to driving for
long distance trips are available, such as intercity
passenger rail or intercity bus services 12 13 12 10 10 9 11 12
Maintaining the pavement on Michigan state
highways to keep them smooth and free of potholes 13 11 13 13 13 13 13 13

MDOT State Long Range Transportation Plan Attitudes & Perceptions of Transportation
_____________________________________________________________________________________
Page 63
When it comes to Michigan Prosperity Regions, we report little in the way of regional variation
in the ranking of satisfaction—meaning that there were only a few activities which any
particular regions ranked 4 places higher or lower than the statewide ranking. This is even
more the case, once we have narrowed things down to the 7 MDOT Regions. There are only a
few instances where a region's ranking is significantly different from the statewide ranking:
In the Superior and Grand regions, there is more satisfaction with the activity of making
certain bridges along Michigan state highways are in good condition than there is in other
regions.
In Superior, there is considerably less satisfaction with making certain sufficient public
transportation services for local trips are available, such as public bus or "Dial-A-Ride"
transportation services.
In University, residents are less satisfied relative to other regions with MDOT making
certain sufficient public transportation services are available for the elderly and persons with
disabilities.

MDOT State Long Range Transportation Plan Attitudes & Perceptions of Transportation
_____________________________________________________________________________________
Page 64
A.2 Perception of MDOT by MDOT Region
Residents in Grand are the most likely to say MDOT is moving in the right direction, while
residents in Superior are the least likely (Figure A-4).5
Figure A-4. MDOT Regions: Grand Residents Are the Most Likely and Superior Residents
Are the Least Likely to Think MDOT Is Headed in the Right Direction (Question 4b)
"Not sure" and "Neither" are excluded for regional analyses. In other words, the percentages
shown in this figure represent the percent who agree over those who either agree or disagree.
5In the regional maps for the Q4 series, the percentage shown is the portion who agree of only those who
express an opinion. Because there is a large neutral category—those who neither agree nor disagree—it,
along with "unsures," is removed from this analysis. For that reason the percentage who agree will
appear larger than it does in the overall bar graphs where "unsure" and "neither" are included in the
numbers.
Q4b. Percent agree: I think
MDOT is moving in the right
direction
Question

MDOT State Long Range Transportation Plan Attitudes & Perceptions of Transportation
_____________________________________________________________________________________
Page 65
Grand residents are the most likely to agree that MDOT adequately supports local transportation
projects for city and county governments. Metro residents are the least likely, but their results
are very close to a number of other regions (Figure A-5).
Figure A-5. MDOT Regions: Grand Residents Most Likely to Believe MDOT Adequately
Supports Local Transportation Projects for the City and County Governments (Question 4e)
"Not sure" and "Neither" are excluded for regional analyses. In other words, the percentages
shown in this figure represent the percent who agree over those who either agree or disagree.
Q4e. Percent agree: I think
MDOT adequately supports local
transportation projects for city
and county governments
Question

MDOT State Long Range Transportation Plan Attitudes & Perceptions of Transportation
_____________________________________________________________________________________
Page 66
When it comes to trusting MDOT officials to make good decisions about the state's future
transportation system, Grand residents are the most likely to agree, whereas Metro residents are
the most likely to disagree (Figure A-6). Again, the regional variation is not great, and the only
statistically significant difference is between these two regions.
Figure A-6. MDOT Regions: Metro Residents Are the Least Likely and Grand Residents Are
the most Likely to Trust MDOT Officials Make Good Decisions about the State's Future
Transportation System; (Question 4a)
"Not sure" and "Neither" are excluded for regional analyses. In other words, the percentages
shown in this figure represent the percent who agree over those who either agree or disagree.
Q4a. Percent agree: I trust MDOT
officials to make good decisions
about the State's future
transportation system
Question

MDOT State Long Range Transportation Plan Attitudes & Perceptions of Transportation
_____________________________________________________________________________________
Page 67
North, Grand, and Bay residents are the most likely to believe that MDOT is responsive to local
communities (Figure A-7).
Figure A-7. MDOT Regions: North, Grand, and Bay Residents Are Most Likely to Believe
MDOT Is Responsive to the Concerns of Local Communities (Question 4f)
"Not sure" and "Neither" are excluded for regional analyses. In other words, the percentages
shown in this figure represent the percent who agree over those who either agree or disagree.
Q4f. Percent agree: I think MDOT
is responsive to the concerns of
local communities
Question

MDOT State Long Range Transportation Plan Attitudes & Perceptions of Transportation
_____________________________________________________________________________________
Page 68
This statement produces the sharpest regional differences. Confidence is highest among the
three westernmost regions (Grand, Southwest, and North), while it is the lowest in the
southeast corner (Metro and University) and in Superior (Figure A-8).
Figure A-8. MDOT Regions: Residents in the Westernmost Regions Are Most Likely to
Agree That They Have More Confidence in MDOT Today than They Did Three Years Ago
(Question 4c)
"Not sure" and "Neither" are excluded for regional analyses. In other words, the percentages
shown in this figure represent the percent who agree over those who either agree or disagree.
Q4c. Percent agree: I have more
confidence in MDOT today than I
did three years ago
Question

MDOT State Long Range Transportation Plan Attitudes & Perceptions of Transportation
_____________________________________________________________________________________
Page 69
The Southeastern corner of the state—that is the University and Metro regions—stand out as the
least likely to agree that MDOT does a good job prioritizing highway improvements in Michigan
(Figure A-9).
Figure A-9. MDOT Regions: University and Metro Are Least Likely to Agree that MDOT
Does a Good Job in Prioritizing Highway Improvements (Question 4d)
"Not sure" and "Neither" are excluded for regional analyses. In other words, the percentages
shown in this figure represent the percent who agree over those who either agree or disagree.
Q4d. Percent agree: I think
MDOT does a good job
prioritizing highway
improvements in Michigan
Question

MDOT State Long Range Transportation Plan Attitudes & Perceptions of Transportation
_____________________________________________________________________________________
Page 70
A.3 Direction of Transportation in Michigan by MDOT Region
To show regional differences with the question on the change in the quality of transportation, we
subtracted the percentage who say the quality of transportation is worse than it was 5 years ago
from the percentage who say it is better. In every region but one, the percentage saying it is worse
is larger than the percentage saying it is better, thus the results shown in Figure A-10 are mostly
negative numbers. The one exception to this is in Grand, where 5% more say the quality of
transportation is better than say it is worse. The region where residents are the most likely to say
the quality of transportation is worse as opposed to better is Metro.
Figure A-10. MDOT Regions: Grand Is the Only Region Where More Residents Say the
Quality of Transportation Is Better Than Say It Is Worse; Sense of Transportation Getting
Worse Is Much Higher In Metro (Question 3)
Number represents percent better minus percent worse. "Not sure" and "Same" are excluded
from the analysis used for this figure.
Q3. Is the quality of
transportation in Michigan better,
the same, or worse than it was
five years ago?
Question

MDOT State Long Range Transportation Plan Attitudes & Perceptions of Transportation
_____________________________________________________________________________________
Page 71
Appendix B.
Survey Marginals

MDOT State Long Range Transportation Plan Attitudes & Perceptions of Transportation
_____________________________________________________________________________________
Page 72
Marginals*
Sample Size=1400
August 4-18, 2015 Gender: [RECORD FROM OBSERVATION]
Men ........................................ 49% Women .................................. 51%
PROSPERITY REGIONS: Upper Peninsula [100 interviews] ..................................... 4% Northwest [100 interviews] ............................................... 3% Northeast [100 interviews] ................................................ 2% West MI [175 interviews] ................................................ 15% East Central MI [100 interviews] ...................................... 6% East MI [150 interviews] ................................................... 8% South Central [100 interviews] .......................................... 5% Southwest [125 interviews] ............................................... 8% Southeast MI [150 interviews] ........................................ 10% Detroit Metro [300 interviews] ........................................ 39%
MDOT REGIONS: Superior ................................... 4% North ........................................ 5% Grand ..................................... 15% Bay ......................................... 14% Southwest ................................ 8% University .............................. 15% Metro ..................................... 39%
*Percentages may not add to 100% due to rounding. Quotas were set for geographic area. Data are weighted
by region and for age, gender, and race within each region to reflect Michigan's true population distribution
as found in the 2010 Census and the 2014Census population estimations. Two hundred and thirty (230) of the
1400 interviews were conducted by cell phone. Data was also weighted by cell phone usage to match CDC
estimations for Michigan.

MDOT State Long Range Transportation Plan Attitudes & Perceptions of Transportation
_____________________________________________________________________________________
Page 73
[LANDLINE CALL] Hello. Is ________________ there? My name is ____________ and I am calling from a data collection company. We are conducting a brief survey about transportation issues facing people in Michigan. We are not selling anything, and this number was selected at random. [CELL PHONE CALL] Hello. Is ________________ there? My name is ____________ and I am calling from Mountain West, a national public opinion firm. We are not selling anything. We are conducting a brief survey about issues people are facing in Michigan, and this number was selected at random. Is now a good time to talk and are you in a safe place to continue with this phone call? Q1. First of all, how familiar are you with the Michigan Department of Transportation, or MDOT [PRONOUNCED EM-dot]? Would you say you are very familiar, somewhat familiar, a little familiar, or not at all familiar with MDOT?
Very familiar ......................... 22% Somewhat familiar ................. 39% A little familiar ...................... 20% Not at all familiar ................... 19% [NOT SURE] .............................. 1%
Q2. MDOT is the state agency responsible for the routes designated by the letters M, US, and I, the border crossings, buses, freight trains, and airports. Overall how satisfied are you with the job MDOT is doing?—would you say you are very satisfied, somewhat satisfied, somewhat dissatisfied, or very dissatisfied with the job MDOT is doing?
Very satisfied ......................... 14% Somewhat satisfied ................ 53% Somewhat dissatisfied ........... 14% Very dissatisfied ...................... 9% [NOT SURE] ............................ 10%
[ASK ONLY IF Q2=3 or 4] Q2a [If "very or somewhat dissatisfied"] Is there anything specific about MDOT or the job that it is doing that leads you to be dissatisfied? [SEE OPEN-ENDED RESPONSES] Q3. Is the quality of transportation in Michigan better, the same, or worse than it was five years ago?
Better ..................................... 22% The same ................................ 37% Worse ..................................... 31% [NOT SURE/DON'T KNOW] ...... 10%

MDOT State Long Range Transportation Plan Attitudes & Perceptions of Transportation
_____________________________________________________________________________________
Page 74
Q4. Now I am going to read you a series of short statements about MDOT. For each statement, please tell me whether you agree strongly, agree somewhat, neither agree nor disagree, disagree somewhat, or disagree strongly. [RANDOMIZE. DO NOT READ 'DON'T KNOW'.] The first/next is: Strongly Smwht Smwht Strongly agree agree Neutral disagree disagree DK
a. I trust MDOT officials to make good decisions about the State's future transportation system ..... 16% 36% 17% 14% 15% 2%
b. I think MDOT is moving in the right direction ... 15% 37% 19% 15% 11% 3% c. I have more confidence in MDOT today than I
did three years ago ............................................... 12% 25% 23% 20% 17% 5% d. MDOT does a good job prioritizing highway
improvements in Michigan .................................. 11% 33% 12% 23% 19% 3% e. I think MDOT adequately supports local
transportation projects for the city and county governments ........................................................ 14% 36% 16% 15% 12% 7%
f. I think MDOT is responsive to the concerns of local communities ................................................ 12% 35% 17% 18% 14% 5%

MDOT State Long Range Transportation Plan Attitudes & Perceptions of Transportation
_____________________________________________________________________________________
Page 75
Q5. In 2012, the Michigan Department of Transportation reaffirmed the state's long-range vision for an Integrated Transportation System in the state. To do this, the Department held webinars, public meetings, and surveyed public opinion to get a sense of what the public wants and will need from the state's transportation system. Now, I am going to read you a series of transportation goals that make up the strategic vision they came up with. After each, please tell me how much does the Michigan transportation system need to improve on each goal—a great deal, some, only a little or not at all. [RANDOM START] Great Only a Not at [NOT TOPMOST deal Some little all SURE] GOAL
a. Preserve the physical quality and condition of the present transportation system ............ 40% 34% 16% 7% 3% 13%
b. Ensure that the environment is protected and public resources are used in a responsible manner ..................................................... 42% 35% 11% 10% 3% 12%
c. Continue to build, maintain, and operate the safest transportation system possible ...... 45% 34% 12% 6% 2% 12%
d. Reduce the vulnerability of transportation facilities and their users to terrorist attacks, natural disasters and other risks ........... 30% 35% 16% 12% 6% 5%
e. Modernize, expand, and connect the system to support economic growth and better facilitate the movement of goods, people, and services .................................................... 42% 35% 13% 8% 2% 14%
f. Make the transportation system physically and economically accessible to all residents of Michigan .................................................. 45% 32% 13% 9% 2% 17%
g. Make the transportation system and its services more efficient and effective to get the greatest possible performance from Michigan's existing transportation assets and future system improvements ................... 43% 36% 14% 4% 3% 12%
h. Expand MDOT's coordination and collaboration with both the public and private sector ....................................................... 35% 39% 16% 7% 3% 9%
[ASK ONLY IF MORE THAN ONE ITEM ABOVE WAS SCORED AS A "1", OR IF NO ITEM WAS SCORED "1" AND MORE THAN ONE ITEM WAS SCORED A "2"] Q6. Of the following goals, which one do you think needs the most improvement? See results above. [READ ONLY THOSE GOALS THAT SCORED "1" IN THE Q5 SERIES (OR ONLY THOSE THAT SCORED "2" IF NONE SCORED "1"); CODE AS a=1, b=2, c=3, ETC, DK=9]

MDOT State Long Range Transportation Plan Attitudes & Perceptions of Transportation
_____________________________________________________________________________________
Page 76
Q7. Taken all together, how important do you think this vision is to the future of transportation in Michigan—would you say it is very important, somewhat important, only a little important, or not at all important?
Very important ................................................................. 74% Somewhat important ........................................................ 20% Only a little important ....................................................... 4% Not at all important ............................................................ 2% [NOT SURE] ........................................................................ 0%
Q8. I am going to read you a list of activities the Michigan Department of Transportation undertakes to improve transportation in the state. After each, please tell me how satisfied you are with that particular MDOT activity. We will use a 1 to 5 scale – with a 5 meaning you are most satisfied with that service and a "1" means that you are not at all satisfied with that service. You may also use any number in between. If the item pertains to highways, please only consider the highway system MDOT is responsible for, which are interstate highways, U.S. Routes and routes that start with an "M"—and not city and county roads. The first item is: [RANDOMIZE] Not Most satisfied 2 3 4 satisfied DK
a. Making certain bridges along Michigan state highways are in good condition .......................... 15% 19% 28% 21% 17% 1%
b. Maintaining the pavement on Michigan state highways to keep them smooth and free of potholes ............................................................... 29% 21% 24% 11% 14% 0%
c. Quickly and efficiently removing snow and ice from Michigan state highways ............................. 7% 11% 23% 32% 26% 1%
d. Making Michigan state highways and interstates as safe as possible in their design and construction, and with clear markings and signage .................................................................. 5% 7% 26% 35% 26% 0%
e. Quickly and efficiently completing Michigan state highway construction projects .................... 16% 17% 31% 21% 14% 1%
f. Making certain traffic flows as efficiently and smoothly as possible during rush hour, highway construction, and after traffic accidents .............. 11% 17% 32% 23% 17% 1%
g. Providing clear information and warnings to the public on road closures, work zones, and potential traffic delays, through electronic signs, smartphone apps, and online tools ....................... 6% 9% 27% 30% 27% 1%
h. Providing a sufficient number of bike lanes and pathways for bicycles .......................................... 15% 17% 27% 21% 16% 2%

MDOT State Long Range Transportation Plan Attitudes & Perceptions of Transportation
_____________________________________________________________________________________
Page 77
Not Most satisfied 2 3 4 satisfied DK
i. Making certain sufficient public transportation services are available for the elderly and persons with disabilities .................................................... 10% 16% 31% 19% 20% 4%
j. Making certain sufficient public transportation services for local trips are available, such as public bus or "Dial-A-Ride" transportation services. ............................................................... 11% 14% 32% 25% 16% 3%
k. Making certain sufficient alternatives to driving for long distance trips are available, such as intercity passenger rail or intercity bus services . 18% 17% 31% 19% 12% 3%
l. Making certain for-hire transportation services, such as taxis and limousines, charter buses and app-based transportation services—such as UBER [PRON: EW-ber] and LYFT [PRON: LIFT] —have sufficient government oversight and protection for consumers. ..................................... 9% 14% 39% 22% 12% 4%
m. Ensuring sufficient availability of passenger air services ................................................................. 8% 10% 36% 23% 15% 9%
Q9. In the past year, have you used bus or rail for long distance transportation trips that involved at least one stop in Michigan?
Yes ......................................... 22% No .......................................... 78% [SKIP TO Q11] [NOT SURE] .............................. 1% [SKIP TO Q11]
[ASK ONLY IF Q9=1] Q10. Using the same 5 point scale, please rate your satisfaction with the quality of the long distance bus or rail transportation you have experienced– with a "5" meaning you are most satisfied with it and a "1" means that you are not at all satisfied with that it.
1 (least) ................................... 4% 2 .............................................. 6% 3 ............................................ 35% 4 ............................................ 30% 5 (most) ................................. 22% [NOT SURE/DON'T KNOW] ........ 2%
Q11. In the past year, have you ever taken public transportation in the state of Michigan for a local trip such as your local bus route or dial-a-ride service?
Yes ......................................... 26% No .......................................... 74% [SKIP TO D1/D2] [NOT SURE] .............................. 0% [SKIP TO D1/D2]

MDOT State Long Range Transportation Plan Attitudes & Perceptions of Transportation
_____________________________________________________________________________________
Page 78
[ASK ONLY IF Q11=1] Q12. Using the same 5 point scale, please rate your satisfaction with the quality of the public transportation you have experienced—with a "5" meaning you are most satisfied with it and a "1" means that you are not at all satisfied with that it.
1 (least) ................................... 8% 2 .............................................. 8% 3 ............................................ 25% 4 ............................................ 29% 5 (most) ................................. 29% [NOT SURE/DON'T KNOW] ........ 1%
My last questions are so that we can group your answers with those in similar groups. D1. Can you please tell me your age? [CODE ACTUAL AGE.]
18-34 years ............................ 25% 35-49 years ............................ 20% 50-64years ............................. 32% 65+ years ............................... 20% [REFUSED] ................................ 2%
[IF REACHED VIA LANDLINE] D2. Do you have a working cell phone? [IF NO/DK] Does anyone in your household have a working cell phone? Among landline
sample only
Yes, working cell phone .................................................. 81% [SKIP TO D4] No personal phone, but yes someone in house .................. 6% [SKIP TO D4] No, no cell phone in house .............................................. 11% [SKIP TO D5] [NOT SURE] ........................................................................ 2% [SKIP TO D5]
[IF REACHED VIA CELL PHONE] D3. Is there at least one telephone INSIDE your home that is currently working and is not a cell phone? Among cell phone
sample only
Yes, working landline phone in house ............................ 13% No, no landline ................................................................ 85% [SKIP TO D5] [NOT SURE] ........................................................................ 2% [SKIP TO D5]
D4. Now thinking about all the people in your household, including yourself, of all the telephone calls that your household receives, are all or almost all calls received on cell phones, some received on cell phones and some on regular home phones, or very few or none on cell phones Among cell phone
sample only
All/almost all cell phones ...... 30% Some cell phone .................... 39% Few cell phone ....................... 27% [DON'T KNOW/REFUSED] ......... 5%

MDOT State Long Range Transportation Plan Attitudes & Perceptions of Transportation
_____________________________________________________________________________________
Page 79
D5. Do you have a paid job where you work outside the home?
Yes ......................................... 51% [CONTINUE] No .......................................... 46% [SKIP TO D7] [REFUSED/NOT SURE] .............. 3% [SKIP TO D7]
D6. Which of the following best describes how you get to work now? [READ EACH ITEM]
Walk ........................................ 3% Bicycle ..................................... 1% Drive to work by yourself...... 86% Use a car pool .......................... 6% Ride a bus or other public
transport ................................ 4% [REFUSED/NOT SURE] .............. 1%
D7. Do you consider yourself Hispanic, Latino; or of Caribbean, Mexican, Central or South American origin? Yes ........................................... 6% No .......................................... 94% [NOT SURE/REFUSED] .............. 0%
D8. Could you please tell me your race? [DO NOT READ OPTIONS; ASK REGARDLESS OF RESPONSE ABOVE]
White/Caucasian .................... 80% Black/African-American ....... 13% Hispanic/Latino ....................... 2% Asian/Pacific Islander .............. 2% Native American ...................... 1% Other (SPECIFY) ....................... 2% [DON'T KNOW/REFUSED] ......... 0%