2015 ASCO Genitourinary Cancers Update
109
2015 ASCO Genitourinary Cancers Update June 13, 2015 Amir Mortazavi, MD Clinical Assistant Professor of Internal Medicine
-
Upload
osuccc-james -
Category
Health & Medicine
-
view
83 -
download
4
Transcript of 2015 ASCO Genitourinary Cancers Update

2015 ASCO Genitourinary Cancers Update
June 13, 2015
Amir Mortazavi, MD
Clinical Assistant Professor of Internal Medicine

Prostate Cancer
E3805 CHAARTED: ChemoHormonal Therapy
versus Androgen Ablation Randomized Trial for Extensive Disease in Prostate Cancer
3
ASCO 2014
Christopher Sweeney, MBBS, et al.

E3805 – CHAARTED Treatment
STRATIFICATION Extent of Mets -High vs. Low Age ≥70 vs < 70yo ECOG PS - 0-1 vs 2 CAB> 30 days -Yes vs. No SRE Prevention -Yes vs. No Prior Adjuvant ADT ≤12 vs. > 12 months
RANDOMIZE
ARM A: ADT + Docetaxel 75mg/m2 every 21 days for maximum 6 cycles
ARM B: ADT (androgen deprivation therapy alone)
Evaluate every 3 weeks while receiving docetaxel and at week 24 then every 12 weeks
Evaluate every 12 weeks
Follow for time to progression and overall survival Chemotherapy at investigator’s discretion at progression
Presented by: Christopher J. Sweeney, MBBS
• ADT allowed up to 120 days prior to randomization. • Intermittent ADT dosing was not allowed • Standard dexamethasone premedication but no daily prednisone
(N = 790)

Primary endpoint: Overall survival
0.0
0.1
0.2
0.3
0.4
0.5
0.6
0.7
0.8
0.9
1.0
OS (Months)0 12 24 36 48 60 72 84
Pro
babi
lity
HR=0.61 (0.47-0.80) p=0.0003 Median OS: ADT + D: 57.6 months ADT alone: 44.0 months
Presented by: Christopher J. Sweeney, MBBS

Causes of Death
Presented by: Christopher J. Sweeney, MBBS
ADT + Doc (N=397)
ADT alone (N=393)
N % N %
Due to prostate cancer 84 83.2 112 82.6 Due to protocol Rx 1 1.0 0 0.0 Other cause 8 7.9 11 8.2 Unknown 8 7.9 11 8.2 Missing 0 2 Total 101 136

0.0
0.1
0.2
0.3
0.4
0.5
0.6
0.7
0.8
0.9
1.0
OS (Months)0 12 24 36 48 60 72 84
Pro
babi
lity
0.0
0.1
0.2
0.3
0.4
0.5
0.6
0.7
0.8
0.9
1.0
OS (Months)0 12 24 36 48 60 72 84
Pro
ba
bili
ty
In patients with high volume metastatic disease, there is a 17 month improvement in median overall survival from 32.2 months to 49.2 months
OS by extent of metastatic disease at start of ADT High volume Low volume
p=0.0006 HR=0.60 (0.45-0.81) Median OS: ADT + D: 49.2 months ADT alone: 32.2 months
p=0.1398 HR=0.63 (0.34-1.17) Median OS: ADT + D: Not reached ADT alone: Not reached
Presented by: Christopher J. Sweeney, MBBS

ADT + Docetaxel benefited all subgroups
Presented by: Christopher J. Sweeney, MBBS
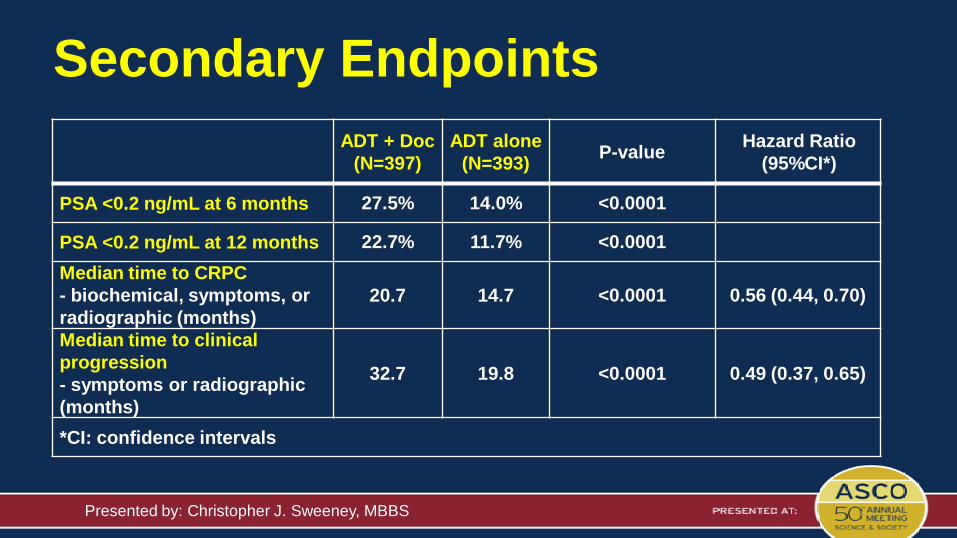
Secondary Endpoints ADT + Doc
(N=397) ADT alone
(N=393) P-value Hazard Ratio (95%CI*)
PSA <0.2 ng/mL at 6 months 27.5% 14.0% <0.0001
PSA <0.2 ng/mL at 12 months 22.7% 11.7% <0.0001 Median time to CRPC - biochemical, symptoms, or radiographic (months)
20.7 14.7 <0.0001 0.56 (0.44, 0.70)
Median time to clinical progression - symptoms or radiographic (months)
32.7 19.8 <0.0001 0.49 (0.37, 0.65)
*CI: confidence intervals
Presented by: Christopher J. Sweeney, MBBS

Conclusion • The combination of standard ADT and 6 cycles of
docetaxel significantly improved overall survival compared to standard ADT alone in men with hormone sensitive prostate cancer
• The benefit in patients with a high volume of metastases is clear and justifies the treatment burden – longer follow-up is required for patients with low volume
metastatic disease Presented by: Christopher J. Sweeney, MBBS


Docetaxel and/or zoledronic acid for hormone-naïve prostate cancer:
First survival results from STAMPEDE
12
Abstract # 5001
Nicholas James, MD, PhD, et al.

• Setting Hormone therapy the mainstay of treatment since 1940s Addition of radiotherapy to N0M0 disease improves
outcomes
• Hypothesis Early use of active therapies (e.g. docetaxel, zoledronic
acid, abiraterone, enzalutamide, etc.) may give a larger absolute benefit in overall survival
Setting and hypothesis

Inclusion criteria
Newly-diagnosed Any of: • Metastatic • Node-Positive • ≥2 of: Stage T3/4
PSA≥40ng/ml Gleason 8-10
Relapsing after previous RP or RT with ≥1 of: • PSA ≥4ng/ml and rising with
doubling time <6m • PSA ≥20ng/ml • Node-positive • Metastatic
All patients
WHO performance status 0-2

Outcome measures
Primary outcome measure Overall survival
Secondary outcome measures Failure-free survival (FFS) Toxicity Quality of life Skeletal-related events Cost effectiveness
FFS definition First of: PSA failure Local failure Lymph node failure Distant metastases Prostate cancer death
PSA failure definition PSA fall >= 50% 24wk nadir + 50% and >4ng/ml PSA fall of <50% failure at t=0

Multi-arm multi-stage (MAMS) design For each research comparison • Allocation ratio of 2 control to 1 research • Target 25% relative improvement in overall survival
HR=0.75
• Interim analysis 3 lack-of-benefit analyses on failure-free survival
• Main analysis on primary outcome measure Requires ~400 control arm deaths Power and alpha 90% and 0.025, 1-sided
Over all original comparisons Power and alpha 83% and 0.013, 1-sided Familywise error rate ~5%

Docetaxel & ZA comparisons: patients

Accrual
Comparison Open: Oct-2005 Closed: Mar-2013 Accrual: 2962 Number of patients 1184 A Standard-of-care (SOC) 593 B SOC + zoledronic acid 592 C SOC + docetaxel 593 E SOC + zoledronic acid + docetaxel

Patient characteristics 1% WHO PS 2 [s] 21% WHO PS 1 [s]
65yr Median age [s] (min 40, max 84)
61% Metastatic [s] (85% Bony mets)
15% N+M0 24% N0M0
98% LHRH analogues [s]
29% Planned for RT [s] (72% of N0M0 pts)
6% Previous local therapy Balanced by arm [s] Stratification factors + hospital + NSAID/aspirin
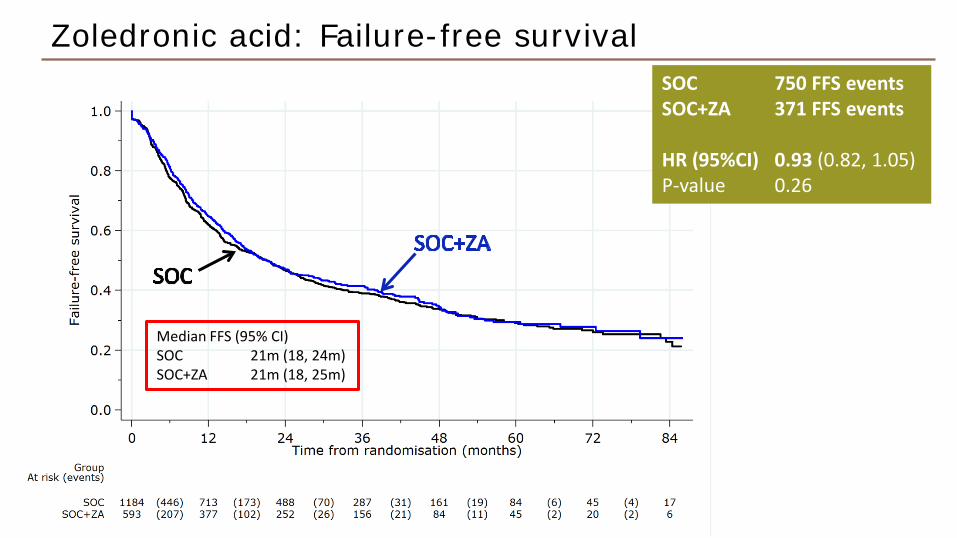
SOC 750 FFS events SOC+ZA 371 FFS events HR (95%CI) 0.93 (0.82, 1.05) P-value 0.26
Zoledronic acid: Failure-free survival
Median FFS (95% CI) SOC 21m (18, 24m) SOC+ZA 21m (18, 25m)

Zoledronic acid: Survival SOC 405 deaths SOC+ZA 197 deaths HR (95%CI) 0.93 (0.79, 1.11) P-value 0.44
Median OS (95% CI) SOC 67m (60, 91m) SOC+ZA 80m (70, NR)

Docetaxel: Failure-free survival SOC 750 FFS events SOC+Doc 371 FFS events HR (95%CI) 0.62 (0.54, 0.70) P-value <0.0000000001*
Median FFS (95% CI) SOC 21m (18, 24m) SOC+Doc 37m (33, 42m)
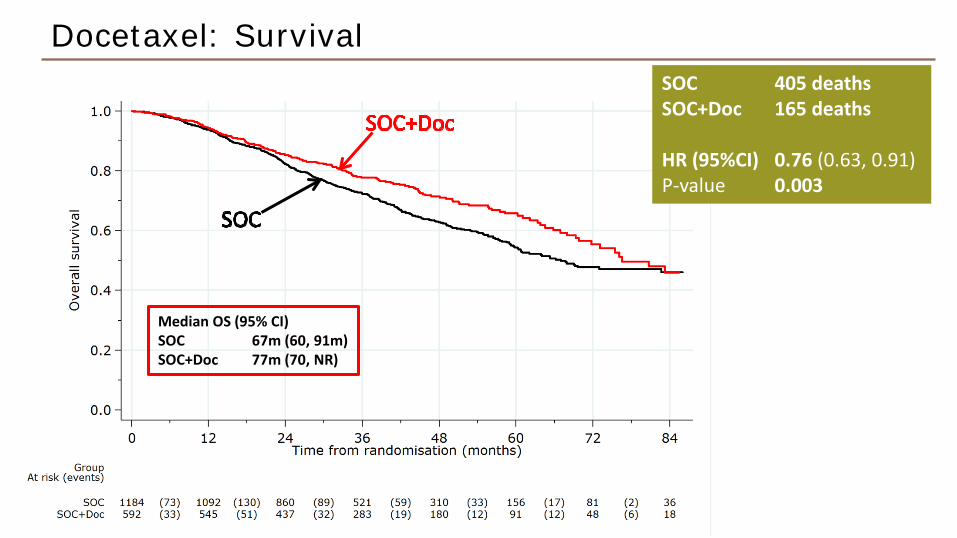
Docetaxel: Survival SOC 405 deaths SOC+Doc 165 deaths HR (95%CI) 0.76 (0.63, 0.91) P-value 0.003
Median OS (95% CI) SOC 67m (60, 91m) SOC+Doc 77m (70, NR)

Zoledronic acid + docetaxel: Failure-free survival SOC 750 FFS events SOC+ZA+Doc 371 FFS events HR (95%CI) 0.62 (0.54, 0.71) P-value <0.0000000001*a
Median FFS (95% CI) SOC 21m (18, 24m) SOC+ZA+Doc 37m (31, 42m)

Zoledronic acid + docetaxel: Survival SOC 405 deaths SOC+ZA+Doc 181 deaths HR (95%CI) 0.81 (0.68, 0.97) P-value 0.02
Median OS (95% CI) SOC 67m (60, 91m) SOC+ZA+Doc 72m (63, 90m)

Consistency of treatment effect
• Subgroups included: Metastatic status (M0, M1)
Nodal status (N0, N+, NX)
Gleason sum score (≤7, 8+, unknown)
PSA pre-hormone therapy (0-20ng/ml, 20-40, 40-100, 100+)
Age at randomisation (under 70, 70 or over)
WHO PS (0, 1-2)
NSAID/Aspirin use (no use, uses either)
• No good evidence of heterogeneity

Treatment effect by metastatic status: FFS
+ZA
+Doc
+ZA+Doc
Pre-planned analysis

+ZA
+Doc
+ZA+Doc
Pre-planned analysis Treatment effect by metastatic status: Overall survival

Docetaxel: Survival – M1 Patients SOC 343 deaths SOC+Doc 134 deaths HR (95%CI) 0.73 (0.59, 0.89) P-value 0.002
Median OS (95% CI) SOC 43m (24, 88m) SOC+Doc 65m (27, NR)

Target Dose: 75mg/m2, every 3 weeks for 6 cycles (+prednisolone 10mg daily)
Doc ZA+Doc Report receiving 6 cycles 76% 69% Report receiving ≥5 cycles 80% 74%
Docetaxel treatment

Grade 3+ adverse events ever reported A
SOC B
SOC+ZA C
SOC+Doc E
SOC+ZA+Doc
Patients randomised 1184 593 592 593
Patients with adverse event data 1174 587 579 564
Grade 3-5 AE (G5) N 363 (3) 185 (1) 291 (3) 294 (7)
% 31% 31% 51% 52%
Endocrine disorder 12% 12% 10% 12%
Blood and lymphatic (febrile neutropenia) 1% 2% 12% 12%
Blood/bone marrow (neutrophils) 1% 1% 12% 11%
General disorder 4% 5% 8% 11%
Musculo-skeletal 5% 5% 6% 8%
Gastrointestinal disorder 3% 3% 7% 7%
Renal 5% 4% 4% 6%
- Early peak in toxicity during chemotherapy seems to settle by 1 year

• Docetaxel improves survival for hormone-naive prostate cancer
• Zoledronic acid does not improve survival
• Adding both improves survival but offers no obvious benefit over adding just docetaxel
• Multi-arm, multi-stage trials are practicable and efficient
• Docetaxel should be:
Considered for routine practice in suitable men with newly-diagnosed metastatic disease
Considered for selected men with high-risk non-metastatic disease in view of substantial prolongation of failure-free survival
Conclusions

A phase III protocol of androgen suppression and radiotherapy vs AS and RT followed by
chemotherapy with docetaxel and prednisone for localized, high-risk prostate cancer
(NRG Oncology/RTOG 0521)
33
Abstract # LBA 5002
Howard Sandler, MD, et al.
Background
• Locally advanced or high-risk localized prostate cancer has a relatively poor prognosis.
• Standard management often uses radiotherapy and long term (2-3 years) hormonal treatment.
• Improvements in local and systemic treatment are likely to beneficial.
• Hypothesis: chemotherapy (docetaxel) known to be beneficial in metastatic, hormone-resistant cancer would improve outcome in non-metastatic, hormone-sensitive prostate cancer

RTOG 0521
Stage Gleason score PSA
Any T stage
≥9 <150
7-8 ≥20-150
≥T2 8 <20
Arm 1 Androgen
Suppression (24 mos) +
External RT (8 wks)
High Risk
R a n d o m i z e
Arm 2 Androgen
Suppression (24 mos) +
External RT (8 wks) +
Docetaxel beginning 4 wks after RT (6 cycles)

Characteristic Arm 1 and Arm 2
(N=563)
Risk Category (stratification) (%)
Gleason ≥9, PSA ≤150, Any T-stage 53
Gleason 8, PSA <20, ≥T2 21
Gleason 8, PSA≥20-150, Any T-stage 10
Gleason 7, PSA≥20-150, Any T-stage
16
Gleason score, no. (%) 7 16
8 31
9-10 53
Serum PSA, ng/mL, Median (Q1-Q3) 15 (7-34)
Age, Median 66
cT3-T4 27%
pN0 33%

Overall Survival
4 yr OS 93% vs. 89% HR 0.70 (90%CI: 0.51-0.98)

Biochemical Failure
6 yr BF 74% vs. 66% HR 0.81 (95%CI: 0.58-1.11)

Disease-Free Survival
6 yr DFS 65% vs. 55% HR 0.76 (95%CI: 0.58-0.99)

Distant Metastasis at Any Time
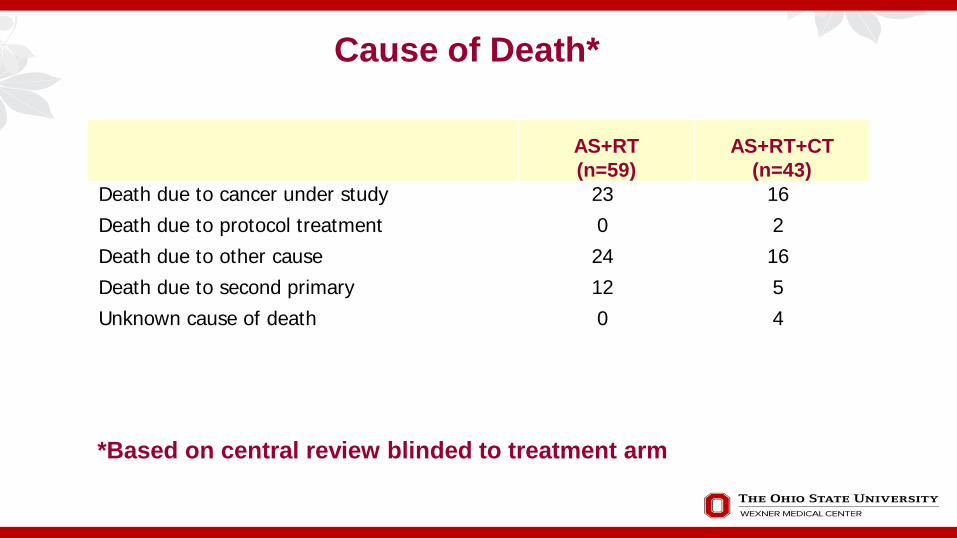
Cause of Death*
AS+RT (n=59)
AS+RT+CT (n=43)
Death due to cancer under study 23 16 Death due to protocol treatment 0 2 Death due to other cause 24 16 Death due to second primary 12 5 Unknown cause of death 0 4
*Based on central review blinded to treatment arm

Adverse Events Definitely, Probably, or Possibly Related to Treatment
Grade AS+RT
(%) AS+RT+CT
(%) Worst overall 1 17 3 2 53 29 3 21 38 4 1 26 5 0 1

Conclusions
• For the first time, improvement in overall survival observed with (tolerable) adjuvant chemotherapy for localized, high-risk, hormone-sensitive prostate cancer.
• Cumulative incidence of distant metastasis was reduced
• The potential role of docetaxel in hormone-sensitive prostate cancer is consistent with and supported by our data and other studies, such as STAMPEDE and CHAARTED.
• This analysis is relatively early and additional follow-up will likely be enlightening.

Interest of short hormonotherapy (HT) associated with radiotherapy (RT) as salvage treatment for
biological relapse (BR) after radical prostatectomy (RP): Results of the GETUG-AFU 16 phase III
randomized trial
44
Abstract # 5006
Christian Carrie, MD, et al.


N = 742


Urothelial Carcinomas

A Phase Ia Study of Atezolizumab (MPDL3280A/Anti-PDL1):
Updated Response and Survival Data in Urothelial Bladder Cancer (UBC)
52
Abstract # 4501
Daniel Petrylak, MD, et al.

Petrylak DP, et al., Atezolizumab (MPDL3280A) in UBC 53
References: 1. Bellmunt et al. J Clin Oncol. 2009. 2. The Cancer Genome Atlas Research Network. Nature. 2014. 3. Kandoth C, et al. Nature. 2013. 4. Lawrence MS, et al. Nature. 2013. 5. Rizvi et al. Science. 2015.
• Metastatic UBC is associated with poor outcomes
• There are no FDA-approved therapies for patients who relapse after platinum-based therapy
– OS ≈ 5-7 months in the second-line setting1
• UBC has a high mutational load due to tobacco/environmental carcinogen exposure2-4 – In other cancers,4,5 high somatic non-synonomous mutational burden has been associated with
durable clinical benefit of PD-L1/PD-1–directed therapy5
Metastatic UBC: Unmet Need and Potential for Cancer Immunotherapy

Petrylak DP, et al., Atezolizumab (MPDL3280A) in UBC 54
Atezolizumab (MPDL3280A) Is a Humanized Anti-PDL1 Anti-body That Inhibits the Binding of PD-L1 to PD-1 and B7.1
• Inhibiting PD-L1/PD-1 and PD-L1/B7.1
interactions can restore antitumor T-cell activity and enhance T-cell priming
• Targeting PD-L1 leaves the PD-L2/PD-1 interaction intact, thereby potentially preserving peripheral immune homeostasis1,2
• PD-L1 is expressed in many cancers3,4
References: 1. Akbari et al. Mucosal Immunol. 2010; 2. Matsumoto et al. Biochem Biophys Res Commun. 2008. 3. Brown et al. J Immunol. 2003. 4. Latchman et al. Nat Immunol. 2001.

Petrylak DP, et al., Atezolizumab (MPDL3280A) in UBC 55
a Safety-evaluable UBC population. b The UBC cohort originally enrolled patients with PD-L1 IC2/3 but was then expanded to include all-comers, primarily recruiting PD-L1 IC0/1 patients. References: Powles et al. ASCO, 2014; Powles et al. Nature, 2014; Bellmunt et al. ESMO, 2014; Xiao et al. SITC, 2014; Kim et al. ASCO-GU, 2015.
• Atezolizumab (MPDL3280A) administered IV Q3W 15 mg/kg or 1200 mg flat dose
Atezolizumab (MPDL3280A): Phase Ia Study
Ongoing dose-expansion phase
RCC
1. All- comers
2. PD-L1 selected
Melanoma
All-comers
NSCLC
1. All- comers
2. PD-L1 selected
Other Tumor Types
1. PD-L1 selected
2. All- comers
UBC N = 92a
1. PD-L1 selected
2. All- comersb
TNBC
1. PD-L1 selected
2. All- comers
Key Eligibility Criteria: • Measurable disease per RECIST v1.1 • ECOG PS 0 or 1

Petrylak DP, et al., Atezolizumab (MPDL3280A) in UBC 56
a Safety-evaluable patients received at least 1 dose of atezolizumab. b Includes lung, liver, non-lymph or soft tissue. c n = 89. Data cutoff, Dec 2, 2014. References: 1. Bellmunt et al J Clin Oncol. 2010. 2. Pond et al BJU Int. 2014.
Atezolizumab (MPDL3280A): Baseline Characteristics in UBC (safety evaluable)
Characteristic Patients
N = 92a
Median age, y (range) 66 (36-89) Male, n (%) 69 (75%) ECOG PS, n (%)
0 37 (40%) 1 55 (60%)
Site of primary tumor Bladder 73 (79%) Renal pelvis 5 (5%) Ureter 9 (10%) Urethra 5 (5%)
Site of metastases at baseline, n (%) Visceralb 73 (79%) Liver 34 (37%)
Characteristic Patients
N = 92a
Prior treatments, n (%) Cystectomy or nephroureterectomy 56 (61%)
Platinum-based chemotherapy 86 (94%) Cisplatin-based 69 (75%) Carboplatin-based 35 (38%) ≥ 2 prior systemic therapies (metastatic 66 (72%)
≤ 3 months from last chemotherapy 37 (42%)c
Hemoglobin levels < 10 g/dL 16 (17%) GFR < 60 mL/min 38 (41%)
• Poor prognostic factors included visceral mets, low hemoglobin levels, ECOG PS 1 and short time (≤ 3 months) from prior chemo1,2

Petrylak DP, et al., Atezolizumab (MPDL3280A) in UBC 57
Atezolizumab (MPDL3280A): Treatment-Related AEs in UBC
• Atezolizumab was generally well tolerated – Median safety follow-up was 16+ wk (range, 3
to 86+ wk) • Median duration of treatment was 3 mo
(range, 0 to 19 mo) – No treatment-related deaths – 1 discontinuation due to a treatment-related AE – 5% of patients had a Grade 3-4 immune-
mediated AE per investigator assessment • Grade 3 AEs: increased AST (n = 3);
increased ALT (n = 2); increased blood bilirubin (n = 1); hypophysitis (n = 1)
– 37 patients (40%) had a Grade 3-4 AE of any causec
a Safety-evaluable patients received at least 1 dose of atezolizumab. b Additional Gr 3-4 AEs (1% each) included anemia, confusional state, decreased blood phosphorus, hypophysitis, increased ALT, increased GGT and thrombocytopenia. c In addition, 2 Grade 5 AEs not related to treatment were seen (acute respiratory failure and alcohol overdose). Data cutoff, Dec 2, 2014.
Treatment-Related AEs Occurring in ≥ 5% of Patients (All Grade)
or in ≥ 2 Patients (Grade 3-4) N = 92a All Grade Grade 3-4b
Any AE 60 (65%) 7 (8%) Fatigue 15 (16%) 0 Asthenia 12 (13%) 1 (1%) Nausea 10 (11%) 0 Decreased appetite 9 (10%) 0 Pruritus 9 (10%) 0 Pyrexia 6 (7%) 0 Rash 7 (8%) 0 Diarrhea 5 (5%) 0 Increased AST 2 (2%) 2 (2%)

Petrylak DP, et al., Atezolizumab (MPDL3280A) in UBC 58
PD-L1 IHC n = 87b
ORR (95% CI), %a
IC3 (n = 12) 67% (35%-90%) 50% (35, 65)
IC2 (n = 34) 44% (27%-62%)
IC1 (n = 26) 19% (7%-39%) 17% (7, 32)
IC0 (n = 15) 13% (2%-40%)
a Efficacy-evaluable patients with measurable disease at baseline per RECIST v1.1. Responses are investigator assessed (unconfirmed); of 30 unconfirmed responses, 24 have been confirmed by the cutoff date. b 4 IC2/3 patients and 7 IC0/1 patients missing or unevaluable. Data cutoff, Dec 2, 2014.
• Responses were observed all PD-L1 subgroups, with higher ORRs associated with higher PD-L1 expression in IC
• Responders also included patients with visceral metastases at baseline: 38% ORR (95% CI, 21%-56%) in 32 IC2/3 patients and 14% (95% CI, 5%-30%) ORR in 36 IC0/1 patients
Atezolizumab (MPDL3280A): ORR in UBC by IC Status
CR, n (%)
PR, n (%)
4 (33%) 9 (20%)
4 (33%) 14 (30%)
5 (15%) 10 (29%)
- -
5 (19%) 7 (17%)
- 2 (13%)

Petrylak DP, et al., Atezolizumab (MPDL3280A) in UBC 59
a Change in SLD > 100%. b Seven patients without post-baseline tumor assessments not included. Asterisks denote 9 CR patients, 6 of whom have been confirmed by data cutoff date (Dec 2, 2014) and 7 of whom had < 100% reduction due to lymph node target lesions. All lymph nodes returned to normal size per RECIST v1.1.
• Forty-four of 80 patients (55%) with post-baseline tumor assessments experienced a reduction in tumor burden
• Decreased circulating inflammatory marker (CRP) and tumor markers (CEA, CA-19-9) were also observed in patients responding to atezolizumab
Atezolizumab (MPDL3280A): Response in UBC by IC status
a
* * * *
* * * * *
IC0
IC1 IC2 IC3
Max
imum
SLD
Red
uctio
n
From
Bas
elin
e, %
b
Petrylak DP, et al., Atezolizumab (MPDL3280A) in UBC 60
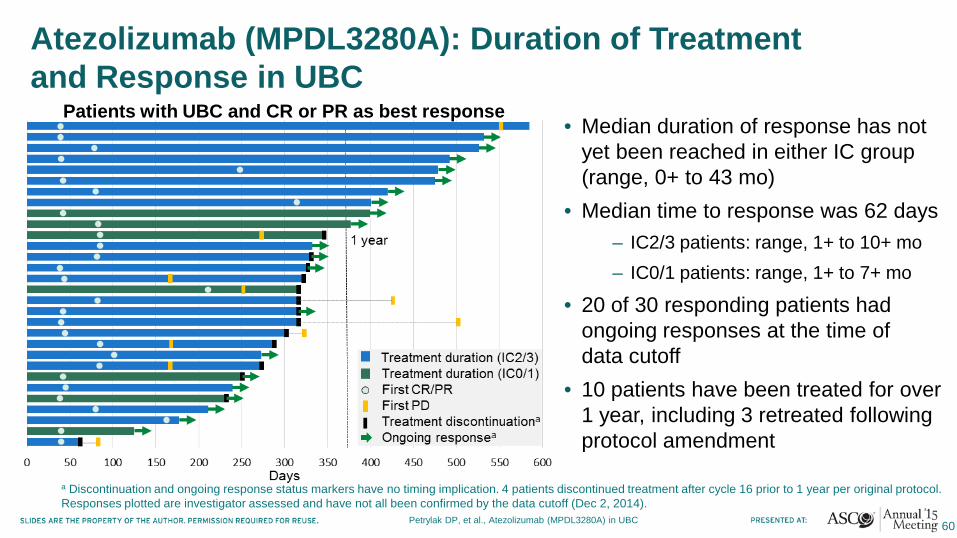
Atezolizumab (MPDL3280A): Duration of Treatment and Response in UBC
• Median duration of response has not yet been reached in either IC group (range, 0+ to 43 mo)
• Median time to response was 62 days – IC2/3 patients: range, 1+ to 10+ mo – IC0/1 patients: range, 1+ to 7+ mo
• 20 of 30 responding patients had ongoing responses at the time of data cutoff
• 10 patients have been treated for over 1 year, including 3 retreated following protocol amendment
a Discontinuation and ongoing response status markers have no timing implication. 4 patients discontinued treatment after cycle 16 prior to 1 year per original protocol. Responses plotted are investigator assessed and have not all been confirmed by the data cutoff (Dec 2, 2014).
Patients with UBC and CR or PR as best response
Petrylak DP, et al., Atezolizumab (MPDL3280A) in UBC 61
Median OS 7.6 mo (95% CI, 4.7 mo-NE)
Median OS Not Reached (95% CI, 9.0 mo-NE)
___ IC2/3
___ IC0/1
+ Censored
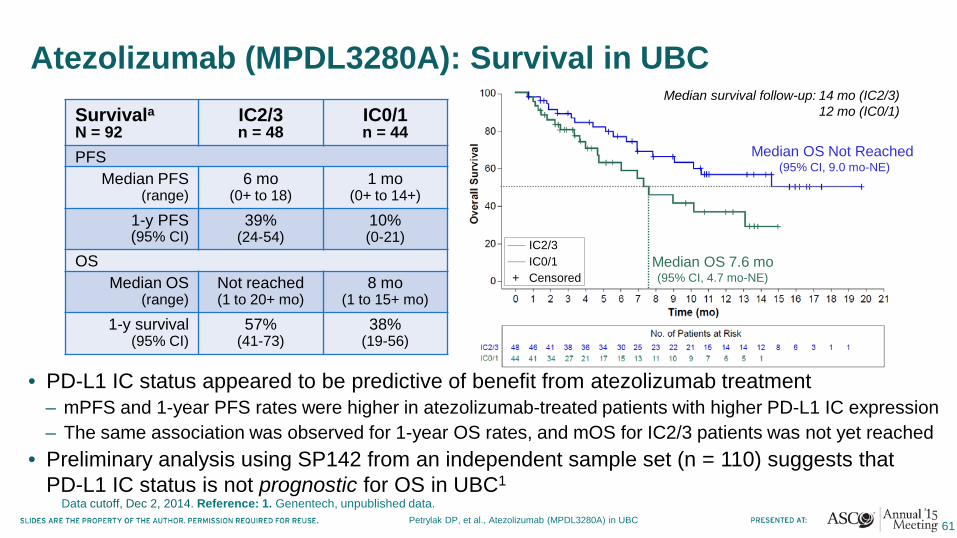
• PD-L1 IC status appeared to be predictive of benefit from atezolizumab treatment – mPFS and 1-year PFS rates were higher in atezolizumab-treated patients with higher PD-L1 IC expression – The same association was observed for 1-year OS rates, and mOS for IC2/3 patients was not yet reached
• Preliminary analysis using SP142 from an independent sample set (n = 110) suggests that PD-L1 IC status is not prognostic for OS in UBC1
Data cutoff, Dec 2, 2014. Reference: 1. Genentech, unpublished data.
Atezolizumab (MPDL3280A): Survival in UBC Survivala
N = 92 IC2/3 n = 48
IC0/1 n = 44
PFS Median PFS
(range) 6 mo
(0+ to 18) 1 mo
(0+ to 14+)
1-y PFS (95% CI)
39% (24-54)
10% (0-21)
OS Median OS
(range) Not reached (1 to 20+ mo)
8 mo (1 to 15+ mo)
1-y survival (95% CI)
57% (41-73)
38% (19-56)
Median survival follow-up: 14 mo (IC2/3) 12 mo (IC0/1)

Petrylak DP, et al., Atezolizumab (MPDL3280A) in UBC 62
• Atezolizumab has demonstrated promising clinical activity in a heavily pre-treated metastatic UBC cohort with encouraging survival and clinically meaningful response data
– 1-year OS rates were 57% and 38% for IC2/3 and 0/1 patients, respectively – ORRs were 50% and 17% in IC2/3 and 0/1 patients, respectively – Median time to response was 62 days, and median DOR was not reached
• Atezolizumab has been well tolerated with manageable side effects – No treatment-related deaths – Grade 3-4 immune-mediated AE rate was 5%
• The highly sensitive and specific SP142 IHC assay measures PD-L1 expression on IC, which may be a predictive biomarker for atezolizumab response
• Phase II and III studies in UBC are ongoing (NCT02108652 [IMvigor 210] and NCT02302807 [IMvigor 211]), with Phase II data expected later this year
Atezolizumab (MPDL3280A): Phase Ia UBC Summary
Pembrolizumab (MK-3475) for advanced urothelial cancer: Updated results and
biomarker analysis from KEYNOTE-012.
63
Abstract # 4502
Elizabeth Plimack, MD, et al.


Kidney Cancer

Randomized phase 2 three-arm trial of lenvatinib (LEN), everolimus (EVE), and
LEN+EVE in patients with metastatic renal cell carcinoma
76
Abstract # 4506
Robert Motzer, MD, et al.

Introduction
There is an unmet need for improved treatment outcome of metastatic RCC patients to standard VEGF-targeted therapies and mTOR inhibitors
Fibroblast Growth Factor (FGF) pathway activation has been proposed as a mechanism of escape from VEGF-targeted therapies1
Lenvatinib is a highly potent tyrosine kinase inhibitor of VEGFR1–3 and FGFR1–42-4
Kinase inhibitory profile of lenvatinib5
1. Casanovas O, Cancer Cell. 2005; 2. Matsui J, Int J Cancer 2008; 3. Matsui J, Clin Cancer Res 2008; 4. Okamoto K, Cancer Lett 2013; 5. Eisai data on file.

Study Design
Stratification factors: • Hemoglobin (normal vs low) • Corrected serum calcium
(≥ vs < 10 mg/dL)
Key eligibility criteria: •Advanced or metastatic RCC •Measurable disease •Progression on/after 1 prior VEGF-targeted therapy •Progression within 9 mos of stopping prior treatment •ECOG PS ≤1 Everolimus
10 mg PO qd
Lenvatinib 18 mg PO qd
+ Everolimus 5 mg PO qd
Lenvatinib 24 mg PO qd
Patients were treated until: • Disease progression • Unacceptable toxicity
R A N D OM I Z E
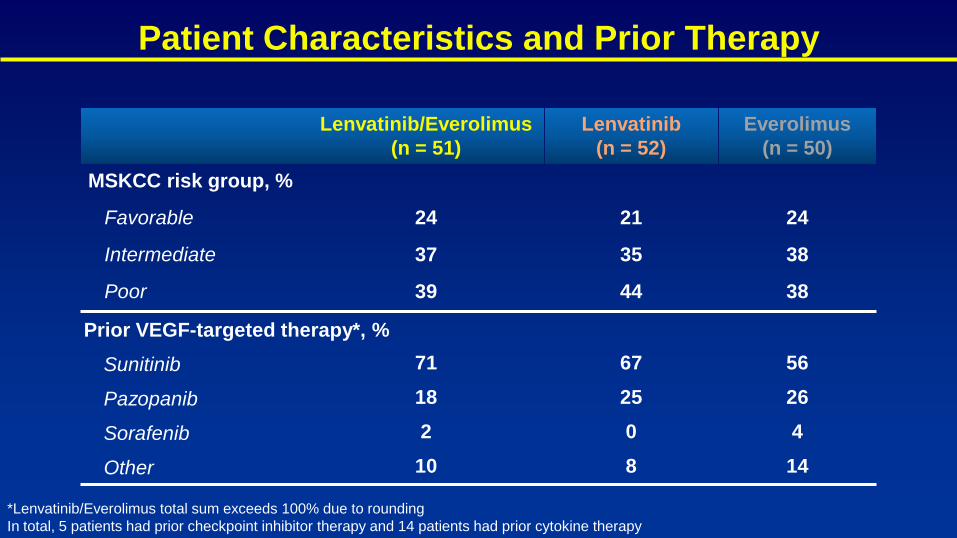
Patient Characteristics and Prior Therapy
Lenvatinib/Everolimus (n = 51)
Lenvatinib (n = 52)
Everolimus (n = 50)
MSKCC risk group, %
Favorable 24 21 24
Intermediate 37 35 38
Poor 39 44 38
Prior VEGF-targeted therapy*, % Sunitinib 71 67 56
Pazopanib 18 25 26
Sorafenib 2 0 4
Other 10 8 14
*Lenvatinib/Everolimus total sum exceeds 100% due to rounding In total, 5 patients had prior checkpoint inhibitor therapy and 14 patients had prior cytokine therapy

Treatment Administration
Lenvatinib/Everolimus Lenvatinib Everolimus Patients Treated, n 51 52 50 Treatment Ongoing at Data Cut-off* 13 7 3 Duration of treatment, mos
Median 7.6 7.4 4.1 Range 0.7–22.6 0.1–23.0 0.3–20.1 Dose reductions, %
Lenvatinib 71 62 - Everolimus 2 - 26
Primary Reason for Discontinuation, n
Adverse Events 9 11 5 Patient Choice 3 0 0 Progression 19 29 35 Other 7 5 7
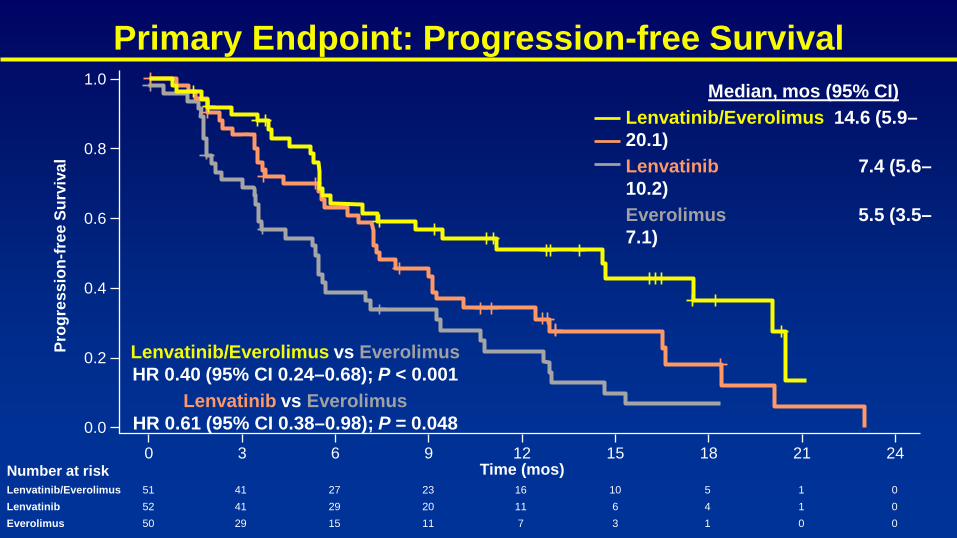
Primary Endpoint: Progression-free Survival
Number at risk Lenvatinib/Everolimus 51 41 27 23 16 10 5 1 0 Lenvatinib 52 41 29 20 11 6 4 1 0 Everolimus 50 29 15 11 7 3 1 0 0
Median, mos (95% CI) Lenvatinib/Everolimus 14.6 (5.9–20.1) Lenvatinib 7.4 (5.6–10.2) Everolimus 5.5 (3.5–7.1)
0.8
1.0
0.6
0.4
0.2
0.0
Time (mos)
Prog
ress
ion-
free
Sur
viva
l
0 3 6 9 12 15 18 21 24
Lenvatinib/Everolimus vs Everolimus HR 0.40 (95% CI 0.24–0.68); P < 0.001
Lenvatinib vs Everolimus HR 0.61 (95% CI 0.38–0.98); P = 0.048

Objective Response
Lenvatinib/Everolimus (n = 51)
Lenvatinib (n = 52)
Everolimus (n = 50)
Objective response rate, % 43 27 6 95% CI 29–58 16–41 1–17
Best overall response, % Complete 2 0 0 Partial 41 27 6 Stable disease 41 52 62 Progression 4 6 24 Not evaluated 12 15 8
Median duration of objective response, (months) 13.0 7.5 8.5
95% CI 3.7–NE 3.8–NE 7.5–9.4
NE, not estimable.

Overall Survival (Updated Analysis)
0.8
1.0
0.6
0.4
0.2
0.0
Time (mos)
Ove
rall
Surv
ival
0 3 6 9 12 15 18 21 24 27
Median, mos (95% CI) Lenvatinib/Everolimus 25.5 (16.4–NE) Lenvatinib 19.1 (13.6–26.2) Everolimus 15.4 (11.8–19.6)
Lenvatinib/Everolimus vs Everolimus HR 0.51 (95% CI 0.30–0.88); P = 0.024
Lenvatinib vs Everolimus
HR 0.68 (95% CI 0.41–1.14); P = 0.118
Number at risk: Lenvatinib/Everolimus 51 48 46 44 38 35 29 21 14 6 Lenvatinib 52 50 45 42 37 31 26 16 7 4 Everolimus 50 46 42 38 30 27 20 14 8 2
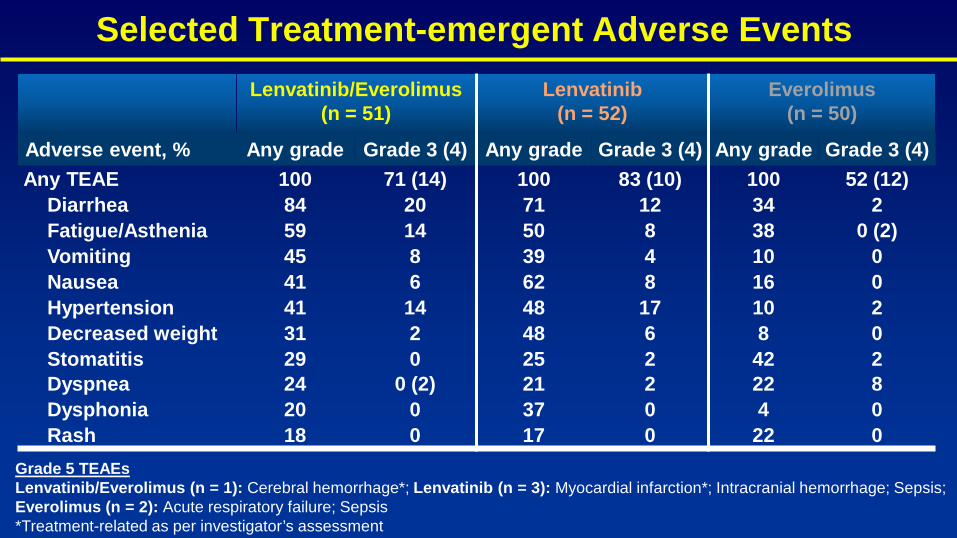
Selected Treatment-emergent Adverse Events Lenvatinib/Everolimus
(n = 51) Lenvatinib
(n = 52) Everolimus
(n = 50)
Adverse event, % Any grade Grade 3 (4) Any grade Grade 3 (4) Any grade Grade 3 (4) Any TEAE 100 71 (14) 100 83 (10) 100 52 (12)
Diarrhea 84 20 71 12 34 2 Fatigue/Asthenia 59 14 50 8 38 0 (2) Vomiting 45 8 39 4 10 0 Nausea 41 6 62 8 16 0 Hypertension 41 14 48 17 10 2 Decreased weight 31 2 48 6 8 0 Stomatitis 29 0 25 2 42 2 Dyspnea 24 0 (2) 21 2 22 8 Dysphonia 20 0 37 0 4 0 Rash 18 0 17 0 22 0
Grade 5 TEAEs Lenvatinib/Everolimus (n = 1): Cerebral hemorrhage*; Lenvatinib (n = 3): Myocardial infarction*; Intracranial hemorrhage; Sepsis; Everolimus (n = 2): Acute respiratory failure; Sepsis *Treatment-related as per investigator’s assessment

Summary of Efficacy
Lenvatinib/Everolimus (n = 51)
Lenvatinib (n = 52)
Everolimus (n = 50)
Progression-free survival Median (mo) 14.6 7.4 5.5 95% CI 5.9–20.1 5.6–10.2 3.5–7.1 Benefit vs everolimus P < 0.001 P = 0.048 NA
Objective response rate, % 43 27 6 95% CI 29–58 16–41 1–17 Benefit vs everolimus P < 0.001 P = 0.007 NA
Overall survival (updated) Median (mo) 25.5 19.1 15.4 95% CI 16.4–NE 13.6–26.2 11.8–19.6 Benefit vs everolimus P = 0.024 P = 0.118 NA
NA, not applicable; NE, not estimable.

Conclusions
Progression-free survival was longer for lenvatinib/everolimus and lenvatinib compared with everolimus
Response rate was higher in both lenvatinib-containing arms The highest rate and longest duration of response was observed with
the combination
Study results suggest an overall survival benefit for
lenvatinib/everolimus over everolimus

Conclusions
Adverse events were generally higher for the lenvatinib-containing arms compared with everolimus Adverse events were predictable, and generally managed with
dose modifications
Further study of lenvatinib therapy is warranted in RCC

Final clinical results of a randomized phase 2 international trial of everolimus vs.
sunitinib in patients with metastatic non-clear cell renal cell carcinoma (ASPEN)
88
Abstract # 4507
Andrew Armstrong, MD, MSc, et al.

Rationale for the ASPEN Trial • Current NCCN guidelines
provide little clinical guidance around the optimal front line therapy for non-clear cell RCC
• ASPEN is the largest
randomized trial conducted to date in non-clear cell RCC and is intended to inform on clinical practice and to develop predictive biomarkers NCCN RCC guidelines version 2015

ASPEN Trial Schema
Metastatic RCC
• Non-clear cell pathology: papillary, chromophobe, unclassified
• No prior therapy • Measurable disease Stratified by Histology, MSKCC
Risk Group
Everolimus 10 mg orally once daily
Days 1-42 Cycle = 6 weeks
Sunitinib 50 mg orally Days 1-28
Cycle = 6 weeks
n=108
R A N D O M I Z E
RadiographicPFS Primary
Endpoint
NCT01108445
18 global sites: 10
USA, 5 UK, 3 in Canada
Duke Cancer Institute was coordinating center and central biorepository for this multinational randomized open label trial, monitoring by inVentiv Health clinical
No planned crossover

Baseline Characteristics Characteristic
Sunitinib (n=51)
Everolimus (n=57)
Years of age, median (range) 59 (24-100) 64 (29-90) Gender (male %) 73 77
Race, Caucasian [white/black %] 82/14 91/9 Papillary histology, n (%)
type 1 papillary, n (%) 65 8
65 4
Chromophobe, n (%) Unclassified histology, n (%)
Translocation carcinoma, n (%)
20 16 12
11 23 4
Sarcomatoid differentiation (%) 11 27
Prior nephrectomy (%) 80 79
Elevated LDH (%) 27 25 Liver/lung/bone metastases, (%) 31 / 59 / 24 26 / 44 / 26
MSKCC Risk Group (%) 0
1-2 ≥ 3
29 63 8
25 56 19

Primary Endpoint: PFS
0 6 12 18 24 30 36
Time since randomization (months)
0.0
0.2
0.4
0.6
0.8
1.0
Prog
ress
ion-
Free
Sur
viva
l (p
roba
bilit
y)
Sunitinib, median PFS 8.3 months
Everolimus, median PFS 5.6 months
51 26 17 10 8 4 1 57 21 8 4 3 2 1
Sunitinib Everolimus
Number of Patients at Risk
Stratified log-rank HR 1.41, p=0.16* <0.20 boundary p-value level

PFS According to Pre-specified Subgroups
favors sunitinib favors everolimus
Median PFS (S vs. E, months)
Hazard Ratio (80% CI)
8.3 vs. 5.6 1.41 (1.03-1.92) 14 vs. 5.7 3.07 (1.51-6.28) 6.5 vs. 4.9 1.38 (0.96-2.00) 4.0 vs. 6.1 0.21 (0.06-0.69) 8.1 vs. 5.5 1.52 (1.05-2.20) 5.5 vs. 11.4 0.71 (0.31-1.65) 11.5 vs. 5.6 2.55 (1.01-6.45)
Category Overall
Good risk Int. Risk
Poor Risk Papillary
Chromophobe Unclassified
Hazard Ratio and 80% CI 0 0.5 1.0 1.5 2.0 2.5 3.0 3.5 4.0

Key Secondary Endpoint: Overall Survival
0 6 12 18 24 30 36
Time since randomization (months)
0.0
0.2
0.4
0.6
0.8
1.0
Ove
rall
Surv
ival
(p
roba
bilit
y)
Sunitinib: 32 months (95% CI 15-NR) Everolimus: 13 months (95% CI 10-38)
51 40 34 19 14 10 4 57 44 27 15 9 6 2
Sunitinib Everolimus
Number of Patients at Risk
Stratified log-rank HR 1.12, p=0.60 Pre-specified two
sided alpha of 0.05

PFS by MSKCC Risk Group and Histologic Subtype
Time since randomization (months)
Prog
ress
ion-
Free
Sur
viva
l pr
obab
ility
0 1-2 3+
MSKCC Risk Criteria
0 6 12 18 24 30 36
0.0
0.2
0.4
0.6
0.8
1.0
29 16 11 6 5 0 0 64 25 14 8 6 6 2 15 6 0 0 0 0 0
0 1-2 3+
Number of Patients at Risk Time since randomization (months)
Prog
ress
ion-
Free
Sur
viva
l pr
obab
ility
Papillary Chromophobe Unclassified
Histology
0 6 12 18 24 30 36
0.0
0.2
0.4
0.6
0.8
1.0
70 29 15 9 8 6 2 16 8 6 4 2 0 0 22 10 4 1 1 0 0
Papillary Chromophobe Unclassified
Number of Patients at Risk
Motzer Sunitinib PFS (95% CI)
Everolimus PFS (95% CI)
0 14.0 (2.9, 25.9) 5.7 (5.5, 11.0) 1-2 6.5 (5.3, 11.1) 4.9 (2.7, 6.1) 3+ 4.0 (0.9, 5.8) 6.1 (2.7, 7.6)
Pathology subtype Sunitinib PFS (95% CI)
Everolimus PFS (95% CI)
Papillary 8.1 (5.6, 13.0) 5.5 (3.0, 6.9) Chromophobe 5.5 (1.7, 19.7) 11.4 (4.2, NA) Unclassified 11.5 (2.7, NA) 5.6 (1.2, 7.3)

RECIST 1.1 Responses
Sunitinib
Everolimus
Endpoint Sunitinib (n=51)
Everolimus (n=57)
RECIST 1.1 Best Overall Response (%)
CR/PR SD PD NE
Clinical Benefit Response: CR+PR+SD>24 weeks
18 59 19 4
22
9 53 23 15
11
Best tumor change by RECIST (median %)
+10.7 +2.1
Median duration of response in months
5.5 3.3

Summary and Conclusions • Patients with metastatic NC-RCC treated with sunitinib had
a statistically significantly prolonged PFS duration than patients treated with everolimus – Sunitinib resulted in improved PFS in good/intermediate risk,
papillary, and unclassified subtypes – Everolimus resulted in improved PFS in poor risk and
chromophobe subtypes • Both agents resulted in short PFS times and low response
rates • Sunitinib and everolimus resulted in different rates of
expected toxicities; more severe toxicities with sunitinib, but more discontinuations due to toxicity from everolimus.
Initial results from ASSURE (E2805): Adjuvant sorafenib or sunitinib for
unfavorable renal carcinoma, an ECOG-ACRIN-led, NCTN phase III trial
98
ASCO GU 2015
Naomi Haas, MD, et al.
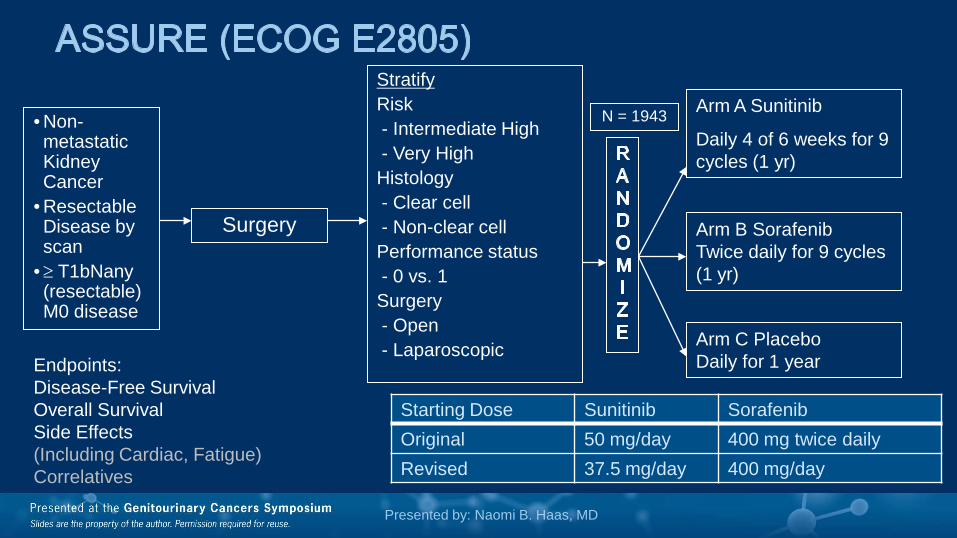
Stratify Risk - Intermediate High - Very High Histology - Clear cell - Non-clear cell Performance status - 0 vs. 1 Surgery - Open - Laparoscopic
Arm B Sorafenib Twice daily for 9 cycles (1 yr)
Arm C Placebo Daily for 1 year
• Non-metastatic Kidney Cancer
• Resectable Disease by scan
•≥ T1bNany (resectable) M0 disease
Arm A Sunitinib
Daily 4 of 6 weeks for 9 cycles (1 yr)
Surgery
Endpoints: Disease-Free Survival Overall Survival Side Effects (Including Cardiac, Fatigue) Correlatives
Starting Dose Sunitinib Sorafenib Original 50 mg/day 400 mg twice daily Revised 37.5 mg/day 400 mg/day
Presented by: Naomi B. Haas, MD
N = 1943
Toxicity Sunitinib Sorafenib Placebo
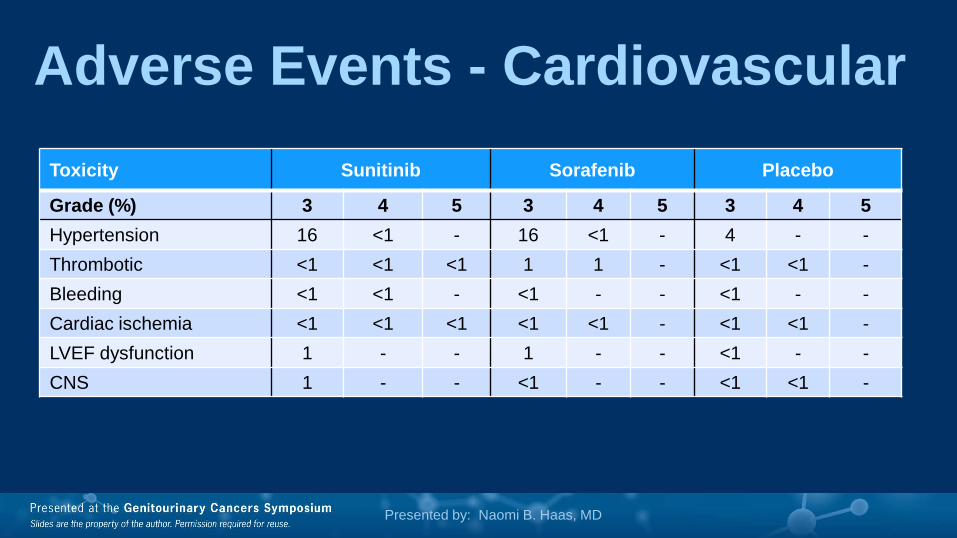
Grade (%) 3 4 5 3 4 5 3 4 5 Hypertension 16 <1 - 16 <1 - 4 - - Thrombotic <1 <1 <1 1 1 - <1 <1 - Bleeding <1 <1 - <1 - - <1 - - Cardiac ischemia <1 <1 <1 <1 <1 - <1 <1 - LVEF dysfunction 1 - - 1 - - <1 - - CNS 1 - - <1 - - <1 <1 -
Presented by: Naomi B. Haas, MD
Adverse Events - Cardiovascular

Sunitinib Sorafenib Placebo Grade (%) 3 4 5 3 4 5 3 4 5 Fatigue 17 1 - 7 - - 3 - - Rash 2 - - 15 <1 - <1 - - Hand-foot 15 - - 33 - - 1 - - Diarrhea 10 - - 9 - - - - - Anorexia 2 - - 1 - - - - - Stomatitis 4 <1 - 2 - - <1 - - Nausea/vomiting 6 - - 2 - - <1 - - Neuropathy 1 - - 2 <1 - <1 - - Pain 7 <1 - 9 <1 - 3 <1 - Renal failure 1 - <1 1 <1 - - - - Infection/febrile neutropenia 3 - <` 4 <1 <1 2 - -
Presented by: Naomi B. Haas, MD
Adverse Events - Clinical

Hematologic Adverse Events Sunitinib Sorafenib Placebo
Grade (%) 4 5 4 5 4 5 Thrombocytopenia 1 - <1 - - - Myelosuppression <1 - - - - - Anemia <1 <1 - - -
Presented by: Naomi B. Haas, MD
Sunitinib Sorafenib Placebo Grade 3 4 5 3 4 5 3 4 5 Percent 57 5 1 67 3 <1 20 4 <1
Worst Degree - All Event Types

Disease-Free Survival
Presented by: Naomi B. Haas, MD
Events Patients 5-yr DFS 97.5% CI HR 97.5% CI
Sunitinib 265 647 53.8% 49.0 – 59.1% 1.01 0.83 – 1.23
Sorafenib 272 649 52.8% 48.0 – 58.0% 0.98 0.81 – 1.19
Placebo 270 647 55.8% 51.2 – 60.9%
Median 5.8 yrs Median 5.8 yrs Median 6.0 yrs

DFS for Clear Cell Population
Presented by: Naomi B. Haas, MD
Events
Patients
5-yr DFS 97.5% CI HR 97.5% CI
Sunitinib 214 513 52.4% 47.0 – 58.4% 1.01 0.81 – 1.26
Sorafenib 224 519 50.7% 45.4 – 56.7% 1.00 0.81 – 1.24
Placebo 216 509 54.9% 49.7 – 60.6%
Median 5.6 yrs Median 5.1 yrs Median 5.7 yrs
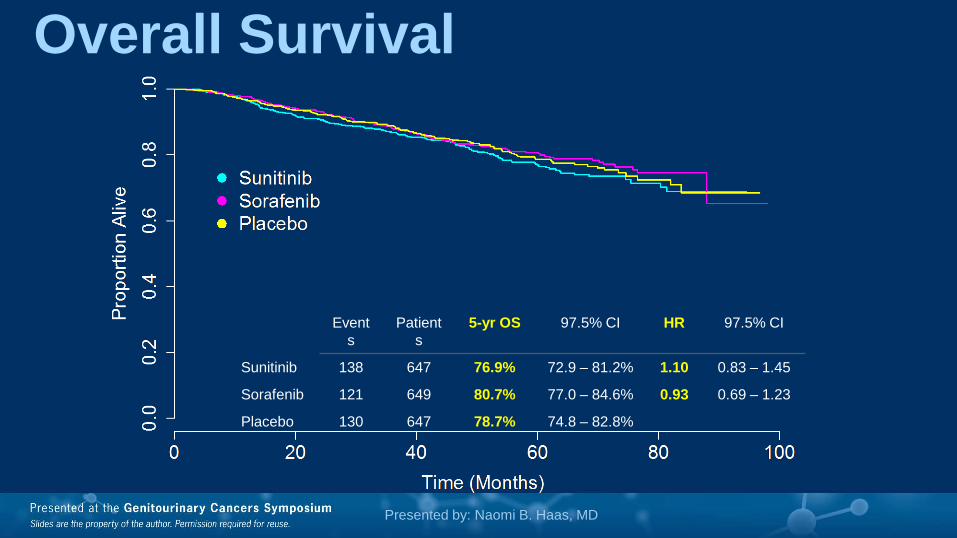
Overall Survival
Presented by: Naomi B. Haas, MD
Events
Patients
5-yr OS 97.5% CI HR 97.5% CI
Sunitinib 138 647 76.9% 72.9 – 81.2% 1.10 0.83 – 1.45
Sorafenib 121 649 80.7% 77.0 – 84.6% 0.93 0.69 – 1.23
Placebo 130 647 78.7% 74.8 – 82.8%

Presented by: Naomi B. Haas, MD
Sunitinib vs. Placebo
Presented by: Naomi B. Haas, MD
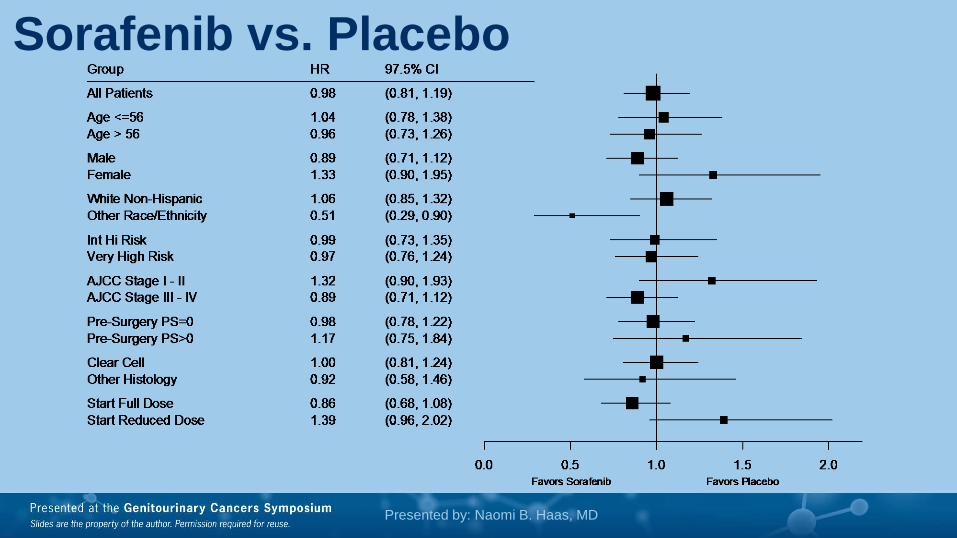
Sorafenib vs. Placebo

Conclusions • First and largest trial reporting on efficacy of VEGF inhibitors
as adjuvant therapy for patients with locally advanced kidney cancer who are at high risk of recurrence
• Median time to disease recurrence did not differ between those who received sorafenib or sunitinib after surgery (median 5.8 years) and those treated with placebo (median 6 years)
• Findings from this study suggest that patients with locally advanced kidney cancer should not be treated with either adjuvant sorafenib or sunitinib
Presented by: Naomi B. Haas, MD

Thank You
109