2015 Annual Results - China · PDF fileNotes: Unless otherwise ... 3G/4G Handset Data Traffic...
30
2015 Annual Results China Telecom Corporation Limited 23 March 2016 | www.chinatelecom-h.com
Transcript of 2015 Annual Results - China · PDF fileNotes: Unless otherwise ... 3G/4G Handset Data Traffic...

2015 Annual Results
China Telecom Corporation Limited23 March 2016 | www.chinatelecom-h.com
Forward-Looking Statements
2015 Annual Results2
Certain statements contained in this document may be viewed as “forward-lookingstatements” within the meaning of Section 27A of the U.S. Securities Act of 1933 (asamended) and Section 21E of the U.S. Securities Exchange Act of 1934 (as amended).Such forward-looking statements are subject to known and unknown risks, uncertaintiesand other factors, which may cause the actual performance, financial condition or results ofoperations of China Telecom Corporation Limited (the “Company”) to be materially differentfrom any future performance, financial condition or results of operations implied by suchforward-looking statements. In addition, we do not intend to update these forward-lookingstatements. Further information regarding these risks, uncertainties and other factors isincluded in the Company’s most recent Annual Report on Form 20-F filed with the U.S.Securities and Exchange Commission (the “SEC”) and in the Company’s other filings withthe SEC.

Presented by
President & COO
Executive Vice President
Executive Vice President
Mr. Yang Jie
Mr. Yang Xiaowei
Mr. Ke Ruiwen
2015 Annual Results3
2.
Overview1.
Business Review & Financial Performance

Highlights
1
2015 Annual Results5
4
1
2
3
5
Implement effective initiatives … Mitigate impact from “Speed Upgrade and Tariff Reduction”
Tower asset disposal increased 2015 profit… Tower sharing to enhance long-term value
Speed up core network upgrade leveraging policy support… Robust 4G and fibre broadband growth momentum
Solid fundamental amid various regulatory challenges… Market position strengthened
Create shareholders’ value … Seize strategic opportunities and vitalize by reform and innovations

Solid Fundamentals
2015 Annual Results6
2014 2015 Change
Operating Revenue (RMB Mil) 324,394 331,202 2.1%
Service Revenue (RMB Mil) 287,379 293,266 2.0%
EBITDA (RMB Mil) 94,853 94,106 -0.8%
EBITDA Margin 33.0% 32.1% -0.9pp
Net Profit (RMB Mil) 17,680 20,054 13.4%
EPS (RMB) 0.218 0.248 13.4%
Notes: Unless otherwise stated in this presentation1. Service Revenue = Operating Revenue – Sales of Mobile Terminals (2014: RMB31,343 mil; 2015: RMB32,026 mil) – Sales of Wireline Equipments
(2014: RMB3,956 mil; 2015: RMB4,430 mil) – Other Non-service Revenue (2014: RMB1,716 mil; 2015: RMB1,480 mil)2. EBITDA = Operating Revenue – Operating Expenses + Depreciation & Amortization; EBITDA Margin = EBITDA / Service Revenue3. Net Profit represented profit attributable to equity holders of the Company; 2015 net profit included an one-off tower asset disposal gain of RMB3,937 mil

2015 Annual Results7
2014 2015
83,742
100,908
Industry-leading Growth in Service Revenue and Net Profit
2.0%
-1.0%
0.1%
China Telecom Industry
Service Revenue Net Profit
Source: Industry growth is calculated based on figures reported by the three listed Chinese telcos
Note: Emerging business included Data Traffic Operation, ICT and Internet Applications
29.1%
34.4%
Emerging Business Revenue as a % of Service Revenue
Growth Rate in 2015Emerging Business Fueled Revenue GrowthRMB Mil
13.4%
2015 Annual Results8
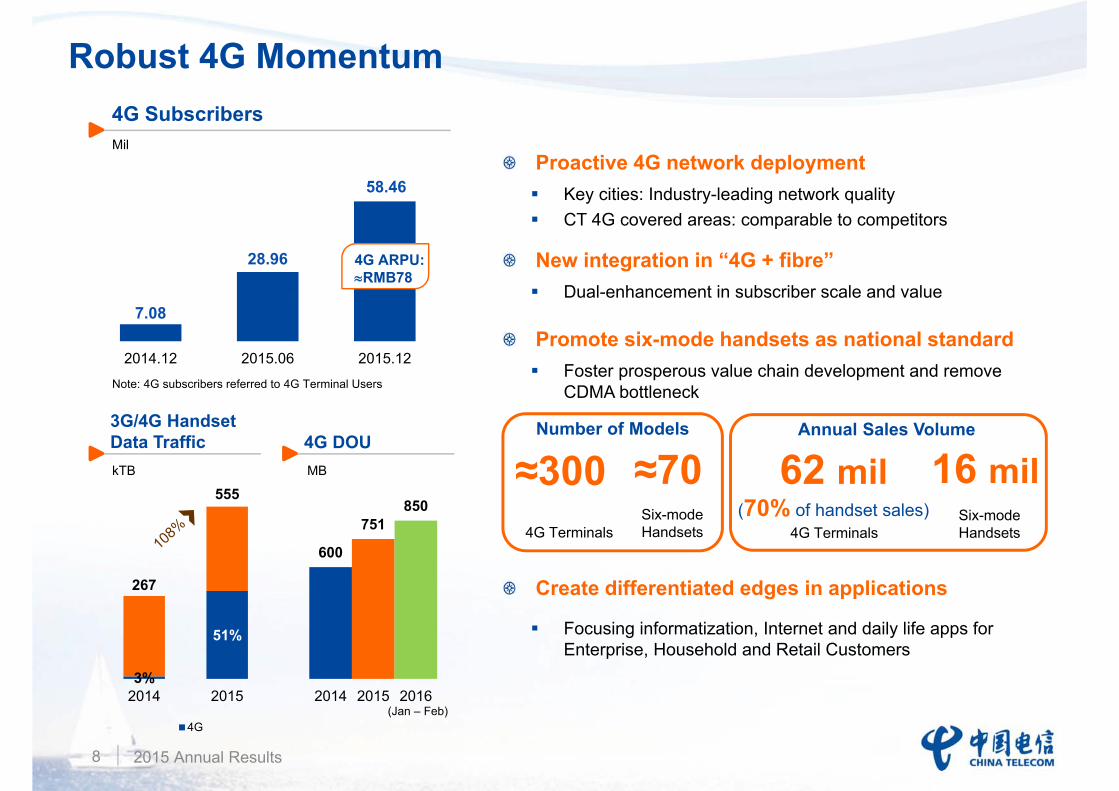
Robust 4G Momentum
3%
51%
267
555
2014 2015
4G
7.08
28.96
58.46
2014.12 2015.06 2015.12
600
751850
2014 2015 2016
3G/4G Handset Data Traffic
4G Subscribers Mil
4G ARPU:≈RMB78
Proactive 4G network deploymentKey cities: Industry-leading network qualityCT 4G covered areas: comparable to competitors
New integration in “4G + fibre”Dual-enhancement in subscriber scale and value
Promote six-mode handsets as national standardFoster prosperous value chain development and remove CDMA bottleneck
Create differentiated edges in applications
Focusing informatization, Internet and daily life apps for Enterprise, Household and Retail Customers
4G DOUkTB MB
(Jan – Feb)
Note: 4G subscribers referred to 4G Terminal Users
Number of Models
≈300 ≈704G Terminals
Six-mode Handsets
Annual Sales Volume
62 mil(70% of handset sales)
4G TerminalsSix-mode Handsets
16 mil

73,485 74,285
2014 2015
59.1 56.3
Wireline Broadband ARPU (RMB)
2015 Annual Results9
42.61 70.99
2014.12 2015.12FTTH Subs
106.95 113.06
Fibre Broadband Creates New Competitive Edge
Accelerated end-to-end speed upgrade
Quality 100Mbps network provide industry-leading user experience
100Mbps as mainstream product
2015 FTTH subs
• 28.38 mil (vs 2014: 15.74 mil)
• 63% of total broadband subs
Solid subscriber growth supported revenue growth amid intensified competition
Feed in value-added services such as IPTV (e-Surfing HD) to enhance user experience, customer loyalty and network value
Tapped private capital RMB4 bil
Accelerated access network deployment and market expansion for win-win cooperation
Wireline Broadband SubscribersMil
Wireline Broadband RevenueRMB Mil

2015 Annual Results10
VAT ReformBenefit Long-term Sustainable Development
With nationwide implementation of VAT Reform from 1 May 2016, future profitability will be enhanced as more operating costs &
investments will be entitled to input VAT credits
The above pro forma impacts are only intended to indicate the impact of incremental output VAT, authenticated incremental input VAT credits from operating expenses, savings ofbusiness tax and income tax in the periods arising from the implementation of VAT Reform effective 1 Jun 2014. They do not include other impact arising from VAT Reform such asoptimized business development model, sales & marketing etc. Hence the above pro forma financials do not reflect the actual operating performance of the Company as if the VATReform were not implemented. The above pro forma financials are for illustration purpose only, which include estimates and are unaudited. Investors are cautioned not to rely on theabove pro forma data.
Pro formaVAT Reform Impact
RMB Bil 2014(Jun – Dec)
2015(Jan – Dec)
Reported Operating Revenue -9.3 -15.4
Operating Expenses +4.3 +9.7
Operating Profit -5.0 -5.7
Net Profit -3.8 -4.3
Major initiativesOptimize development and sales models, implement stringent costs control measures and enhance control on purchasing
Proportion of revenues generated from value-added telecommunications services increases gradually, resulting in a lower average tax rate of output VAT
Moderating monthly average negative impact on net profit from VAT Reform
Monthly average pro forma impact on net profit:2014: RMB540 mil 2015: RMB360 mil

2015 Annual Results11
Speed Upgrade and Tariff Reduction
Effective measures to stimulate usage
Pressure on revenue and profit
Strive to Mitigate Regulatory Impact
Wireline broadband unit price 55%
Mobile data unit price33%
1-month handset data carried forward with effect from 1 Oct 2015
Delay in mobile Internet access revenue recognition
Revenue lost on over data usage and change in consumer behaviour
Closely follow up and strive to accommodate regulatory changes
Wireline broadband
FTTH subs 28 mil+ Average access bandwidth 2x
Mobile
4G subs 51 mil+3G/4G handset data traffic:
• Monthly average 70% • Total 108%
2015 Annual Results12
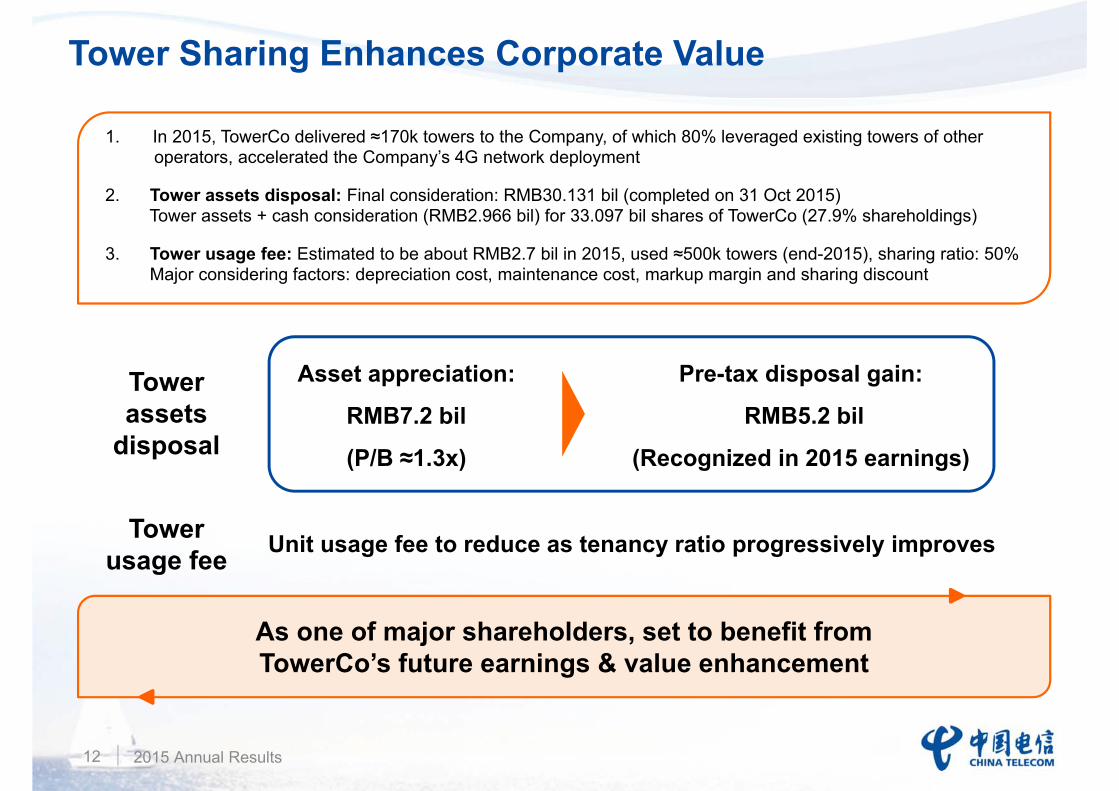
1. In 2015, TowerCo delivered ≈170k towers to the Company, of which 80% leveraged existing towers of other operators, accelerated the Company’s 4G network deployment
2. Tower assets disposal: Final consideration: RMB30.131 bil (completed on 31 Oct 2015)Tower assets + cash consideration (RMB2.966 bil) for 33.097 bil shares of TowerCo (27.9% shareholdings)
3. Tower usage fee: Estimated to be about RMB2.7 bil in 2015, used ≈500k towers (end-2015), sharing ratio: 50%Major considering factors: depreciation cost, maintenance cost, markup margin and sharing discount
Tower assets
disposal
Pre-tax disposal gain:
RMB5.2 bil
(Recognized in 2015 earnings)
Asset appreciation:
RMB7.2 bil
(P/B ≈1.3x)
As one of major shareholders, set to benefit from TowerCo’s future earnings & value enhancement
Tower Sharing Enhances Corporate Value
Unit usage fee to reduce as tenancy ratio progressively improvesTower usage fee
2015 Annual Results13
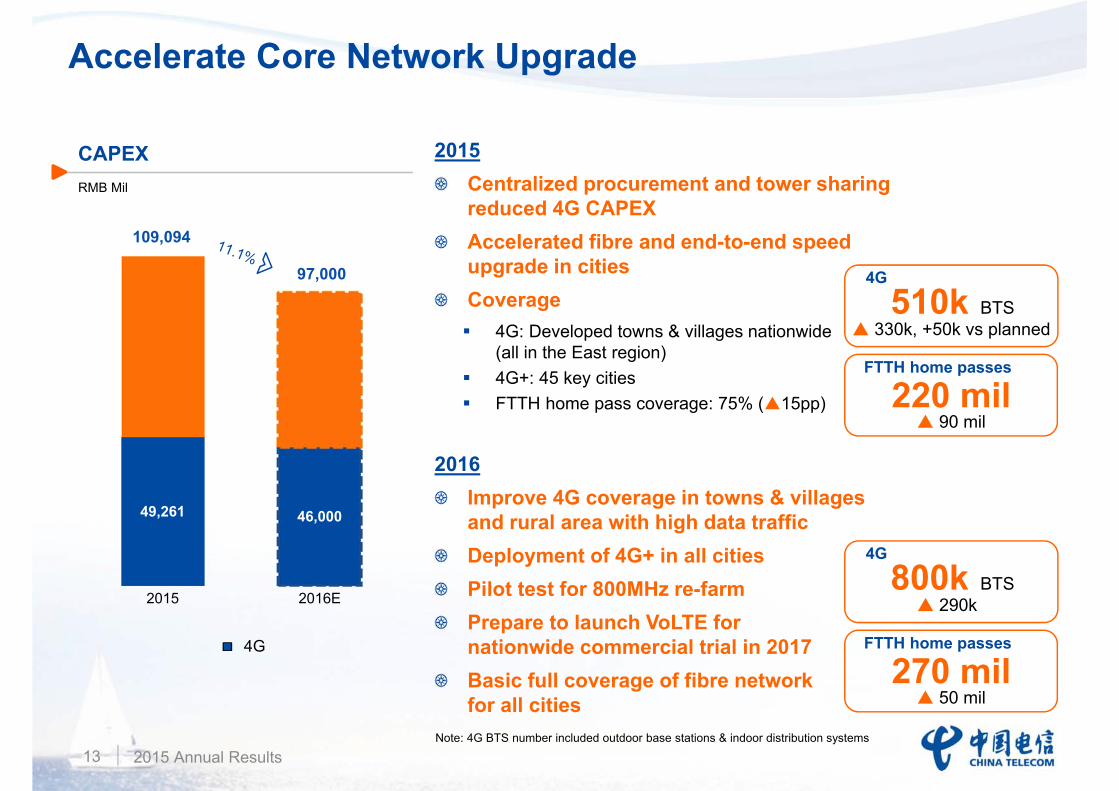
Accelerate Core Network Upgrade
49,261 46,000
2015 2016E
4G
97,000
109,094
CAPEXRMB Mil
2015Centralized procurement and tower sharing reduced 4G CAPEXAccelerated fibre and end-to-end speed upgrade in citiesCoverage
4G: Developed towns & villages nationwide(all in the East region)4G+: 45 key citiesFTTH home pass coverage: 75% ( 15pp)
2016Improve 4G coverage in towns & villages and rural area with high data trafficDeployment of 4G+ in all citiesPilot test for 800MHz re-farmPrepare to launch VoLTE for nationwide commercial trial in 2017Basic full coverage of fibre network for all cities
220 mil90 mil
FTTH home passes
510k BTS330k, +50k vs planned
4G
Note: 4G BTS number included outdoor base stations & indoor distribution systems
270 mil50 mil
FTTH home passes
800k BTS290k
4G

Dividend
2015 Annual Results14
Recommend a stable dividend for 2015 with due regards to shareholders’ return, profitability, cash flow & capital requirement for future development
Maintain appropriate funding position to answer the capital requirement of long-term sustainable growth
Strive to enhance future profit while paving the way for future dividend increase
The Board of Directors recommends to the shareholders a final dividend of
HK$0.095 per share for 2015
2014 2015
0.0950.095
Dividend per shareHKD

2015 Annual Results15
Near-term Priorities
Upgrade products and services
Enhance operating efficiency
Strengthen open cooperation to build competitive edge around the ecosphere
Strategic cooperation with China Unicom in market-oriented approach for win-win
Promote sub-dividing performance evaluation units, strengthen “top-down” service support system
Promote innovation in structure and mechanism in emerging areas
Unlock corporate vitality and internal momentum
Breakthrough in FIVEEmerging Areas
Build Up SIXKey Capabilities
Deepening Internet-oriented Transformation Open Cooperation
In-depthComprehensive Reform
Smart Family Mobile Payment
Internet+ Internet of Things
Cloud Computing & Big Data
Network fundamental
Channel sales
Networkoperation
Customer service
Data mining Human resourcesmanagement
4G
Fibre broadband
Strengthen TWOFundamental Businesses
Reform and Innovations to Promote Sustainable Development

Enterprise Value
Core Competence
2015 Annual Results16
Prospect: Leveraging Opportunities for Value Creation
Supply-side Structural Reform
“Cyberpower”
“Internet+”
Industrial Internet, Sharing Economy
“Made-in-China 2025”
Maturing SDN/NFV Technologies
Shareholders’ Value
“Big Data”
…
Deepen transformation; Promote business,
network, operations and management restructuring
Upgrade products & services to enhance
user experience; Vitalize corporate and
employee momentum to enhance return
Facilitate “Cyberpower”, leading in digital ecosphere
to provide integrated smart services

2.
Overview1.
Business Review & Financial Performance

Revenue Breakdown
2015 Annual Results18
RMB Mil 2014 2015 Change
Mobile 151,611 156,529 3.2%
Service Revenue 120,268 124,503 3.5%
Incl.: Voice 54,673 48,983 -10.4%
Data 65,583 75,424 15.0%
Sales of Terminals 31,343 32,026 2.2%
Wireline 172,783 174,673 1.1%
Service Revenue 167,111 168,763 1.0%
Voice 33,587 29,610 -11.8%
Data 129,538 135,100 4.3%
Internet Access 74,622 75,852 1.6%
VAS & Integrated Information Services 38,047 42,035 10.5%
Lease of Telecommunications Network Resources 16,869 17,213 2.0%
Others 3,986 4,053 1.7%
Sales of Equipment & Other Non-service Revenue 5,672 5,910 4.2%
Total 324,394 331,202 2.1%
Service revenue growth despite impact from “VAT Reform” & “1-month Handset Data Carried Forward” and change in sales model
Notes: 1. Mobile service revenue included revenues from voice, data and MVNOs2. 2015 Wireline Internet Access Revenue included wireline broadband revenue of RMB74,285 mil (2014: RMB73,485 mil)

2014 2015Handset Internet Access
Solid Mobile Growth Fueled by Data Operation
2015 Annual Results19
118.63143.13
2014.12 2015.12
3G/4G Subs
185.62 197.90
Mobile SubscribersMil
Key initiatives
Promote 3G subscribers upgrade to 4G
Enrich data application offerings
Strengthen data traffic backward monetization among enterprises
ARPU (RMB)
54.1 65.9Mobile 3G/4G
Mobile Data Revenue (% of mobile service revenue)
60.6% ( 6.1pp)
3G/4G Handset DOU
386 MB ( 70%)
65,583 75,424
54,685 49,079
2014 2015
Mobile Data Other Mobile Service Revenue
120,268 124,503
Mobile Service RevenueRMB Mil
34,086
47,770
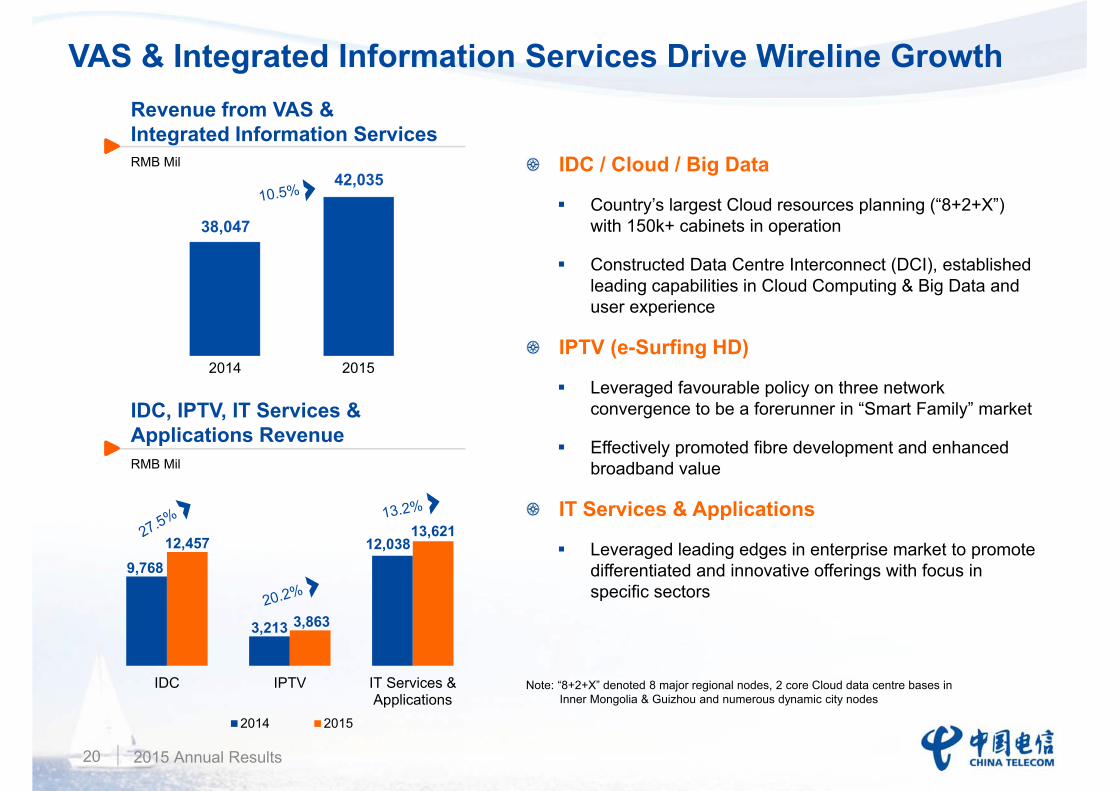
VAS & Integrated Information Services Drive Wireline Growth
2015 Annual Results20
2014 2015
9,768
3,213
12,03812,457
3,863
13,621
IDC IPTV IT Services &Applications
2014 2015
42,035
38,047
Revenue from VAS & Integrated Information ServicesRMB Mil
IDC, IPTV, IT Services & Applications RevenueRMB Mil
IDC / Cloud / Big Data
Country’s largest Cloud resources planning (“8+2+X”) with 150k+ cabinets in operation
Constructed Data Centre Interconnect (DCI), established leading capabilities in Cloud Computing & Big Data and user experience
IPTV (e-Surfing HD)
Leveraged favourable policy on three network convergence to be a forerunner in “Smart Family” market
Effectively promoted fibre development and enhanced broadband value
IT Services & Applications
Leveraged leading edges in enterprise market to promote differentiated and innovative offerings with focus in specific sectors
Note: “8+2+X” denoted 8 major regional nodes, 2 core Cloud data centre bases inInner Mongolia & Guizhou and numerous dynamic city nodes

Smart Family
2015: IPTV (e-Surfing HD) subscribers
40 mil ( 9 mil)
“Fibre broadband + TV”Be the forerunner in “Smart Family”
Fostering New Growth Drivers
2015 Annual Results21
BestPay
2015: GMV RMB770 bil+Registered users 200 mil+
“4G + Mobile Payment”To increase customer loyalty and expand towards Internet finance
Expansion in new ICT services to create new growth potential
Internet+
Internet of Things
Competitive edge of cloud-network integration to enhance core competence and
value contribution
Cloud Computing & Big Data
Consolidated efficiently-centralized operations
Develop scale in connections
Enrich application services
Note: GMV denoted Gross Merchandise Value

Key Financial Information
2015 Annual Results22
RMB Mil 2014 2015 Change
Operating Revenue 324,394 331,202 2.1%
Operating Expenses 295,886 304,760 3.0%
Depreciation & Amortization 66,345 67,664 2.0%
Network Operation & Support 68,651 81,240 18.3%
Personnel 50,653 52,541 3.7%
SG&A 62,719 54,472 -13.1%
Incl.: Mobile Handset Subsidies 15,340 11,620 -24.3%
General & Administration 8,230 8,529 3.6%
Interconnection & Others 47,518 48,843 2.8%
Incl.: Interconnection 12,483 12,329 -1.2%
Cost of Wireline Equipment Sold 3,854 4,096 6.3%
Cost of Mobile Terminals Sold 29,982 30,867 3.0%
Operating Profit 28,508 26,442 -7.2%
Gain from Tower Assets Disposal - 5,214 N/A
Net Profit 17,680 20,054 13.4%
Free Cash Flow 12,466 (21,539) N/A
Note: Free Cash Flow = EBITDA – CAPEX – Income Tax Expenses

Stringent Cost Control
2015 Annual Results23
2014 2015 Change
Operating Expenses as a % of Operating Revenue 91.2% 92.0% 0.8pp
Depreciation & Amortization 20.5% 20.4% 0.1pp 2015 D&A RMB67.7 bil, increased 2.0%yoy mainly due to higher CAPEX
Network Operations & Support 21.2% 24.5% 3.3pp Mainly due to newly added tower usage fee in 2015, appropriately increase in costs for network quality enhancement with an expanded network scale
Personnel 15.6% 15.9% 0.3pp
SG&A 19.3% 16.4% 2.9pp Mainly benefitting from change in sales model for improved sales efficiency
Interconnection 3.8% 3.7% 0.1pp
Cost of Terminals Sold & Others 10.8% 11.1% 0.3pp

Stringent CAPEX Control
2015 Annual Results24
14.6% 9.8%
4.5%3.3%
8.3%
5.7%
34.2%
34.3%
38.4%46.9%
2014 2015
Infrastructure & Others
Mobile Network
Broadband & Internet
CAPEX Structure
IT Support
VAS & Integrated
Information
Optimized CAPEX structure
Strengthened investment in key areas
• Mobile Network and Broadband & Internet: 8.6pp • Infrastructure & others: 4.8pp
Enhanced CAPEX efficiency
Promoted sub-division of performance units, resources allocation driven by value enhancement and market demand
Effective use of network resources with precision investment management
Introduced private capital to commence cooperation to achieve win-win
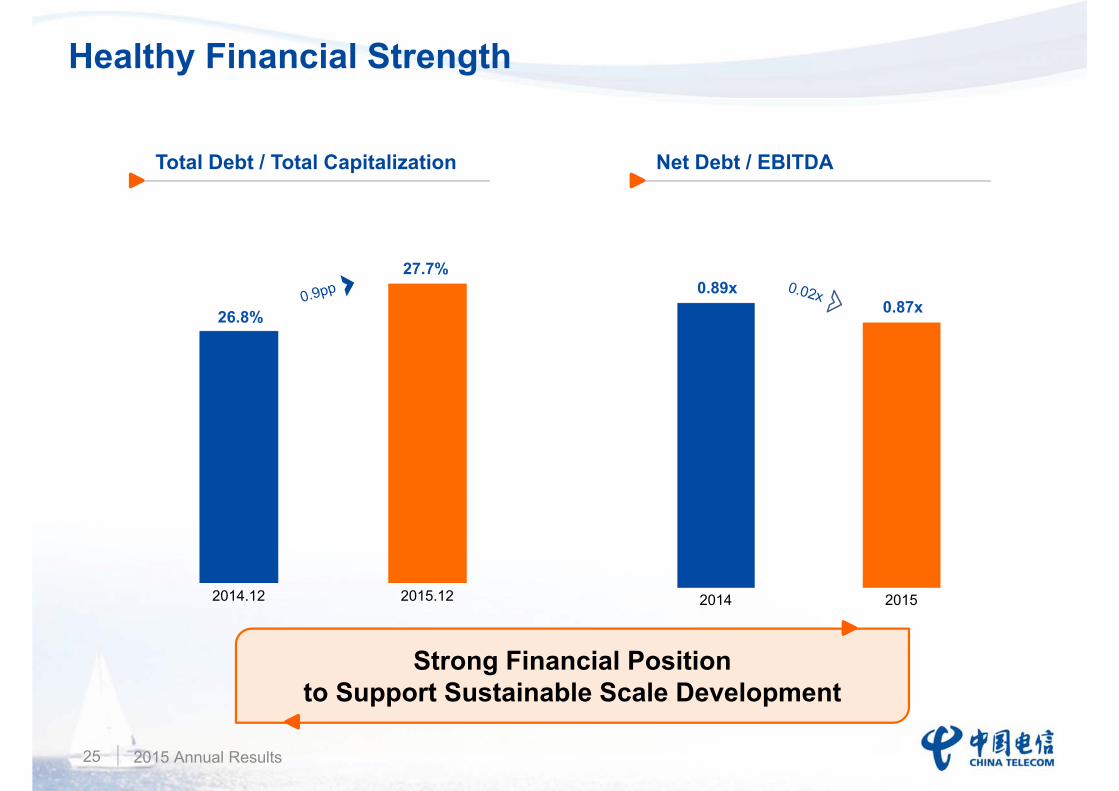
Healthy Financial Strength
2015 Annual Results25
0.89x0.87x
2014 2015
26.8%
27.7%
2014.12 2015.12
Total Debt / Total Capitalization Net Debt / EBITDA
Strong Financial Position to Support Sustainable Scale Development

2015 Annual Results26
Strengthen Value Management
Promote product
sub-division, focus on
core products, projects
and users to evaluate
performance and return
Enhance financial
risk management by
strengthening
internal control
Promote asset sub-division, achieve
precision investments; Strengthen existing assets utilization for value enhancement
Support
Corporate
Development
to Enhance Value
Enhance capability of
financial platform to
improve service
support performance
Enhance precision management of resources allocation by improving “4-in-1” management system –planning, budgeting, resources allocation and performance evaluation

Thank You!
“Asia’s Most Honored
Company”
“No. 1 Best Managed Company in Asia”
For further information & enquiries, please contact our Investor Relations Department at [email protected] or visit www.chinatelecom-h.com
“Overall Best Managed Company in Asia”

Appendix 1
2015 Annual Results28
RMB Mil 2014 2015
Operating Revenue 324,394 331,202
Operating Expenses (295,886) (304,760)
Gain from Tower Assets Disposal - 5,214
Net Finance Costs (5,291) (4,273)
Investment Income, Share of Profit / (Loss) from Associates 40 (690)
Profit Before Taxation 23,257 26,693
Income Tax (5,498) (6,551)
Profit for the Year 17,759 20,142
Equity Holders of the Company 17,680 20,054
Non-controlling Interests 79 88
Extracted from Audited Consolidated Statement of Comprehensive Income for Year Ended 31 Dec 2015
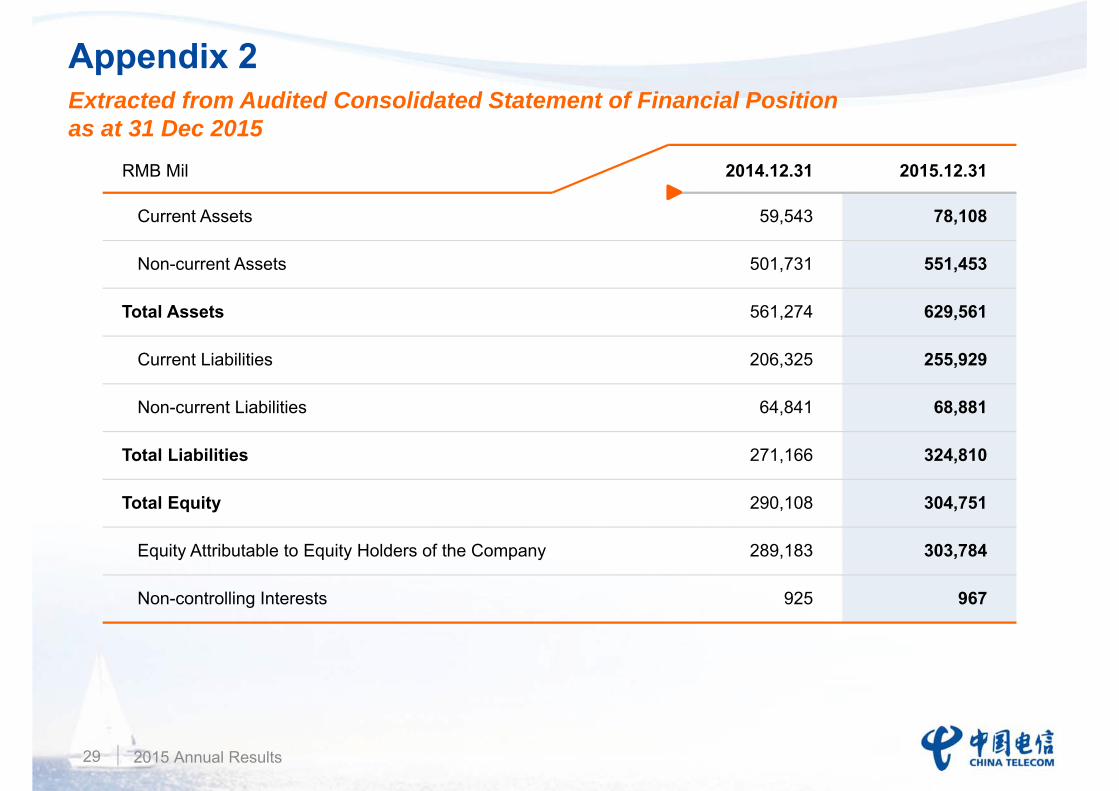
Appendix 2
2015 Annual Results29
RMB Mil 2014.12.31 2015.12.31
Current Assets 59,543 78,108
Non-current Assets 501,731 551,453
Total Assets 561,274 629,561
Current Liabilities 206,325 255,929
Non-current Liabilities 64,841 68,881
Total Liabilities 271,166 324,810
Total Equity 290,108 304,751
Equity Attributable to Equity Holders of the Company 289,183 303,784
Non-controlling Interests 925 967
Extracted from Audited Consolidated Statement of Financial Position as at 31 Dec 2015

Appendix 3
2015 Annual Results30
Selected Operating Metrics for the Year Ended 31 Dec 2015Subscriber (Mil) 2014.12 2015.12 Change
Mobile 185.62 197.90 12.28
Incl.: 3G/4G 118.63 143.13 24.50
of which: 4G 7.08 58.46 51.38
Wireline Broadband 106.95 113.06 6.11
Incl.: FTTH 42.61 70.99 28.38
Access Lines in Services 143.56 134.32 -9.24
Incl.: Household 90.87 84.17 -6.70
Government & Enterprise 40.88 40.80 -0.08
Public Telephone 11.41 9.35 -2.06
2014 2015 Change
Wireline Voice Usage
Local Usage (Pulses Mil) 130,439 110,935 -15.0%
Long Distance Usage (Minutes Mil) 30,066 26,503 -11.9%
Mobile Voice Usage (Minutes Mil) 655,939 667,535 1.8%
Mobile Handset Data Unit Price (RMB) 0.122 0.082 -32.6%