
2015 ANNUAL REPORTs1.q4cdn.com/535492436/files/doc_financials/2015/Textron-2015AR.pdf · TEXTRON...
88
2015 ANNUAL REPORT
Transcript of 2015 ANNUAL REPORTs1.q4cdn.com/535492436/files/doc_financials/2015/Textron-2015AR.pdf · TEXTRON...

2015 ANNUAL REPORT
20
15
AN
NU
AL R
EP
OR
T

Textron’s Diverse Product PortfolioTextron is known around the world for its powerful brands of aircraft, defense and industrial products that provide customers with groundbreaking technologies, innovative solutions and first-class service.
Bell Boeing V-22 OspreyCitation® Longitude® Sherman + ReillyTM P2000X Puller
Bell 429WLGCitation® M2® E-Z-GO Freedom® RXV
Bell 525 RelentlessTMBeechcraft® King Air® 350i Greenlee® DataScout® 10Gx
Bell 407GXPCessna® TTx® Kautex NGFS® Fuel Tank
Bell 412EPIBeechcraft® T-6 Military Trainer Dixie Chopper® Stryker Stand-on
Lycoming Race Engines
TRU Level D Full Flight Simulator
Ship to Shore Connector (SSC)
FuryTM Precision Guided Weapon
COMMANDOTM EliteBell 505 Jet Ranger XTMCessna® Grand Caravan® EX TUGTM MA Tow Tractor
Shadow® M2
TEXTRON AVIATION BELL HELICOPTER INDUSTRIAL TEXTRON SYSTEMS
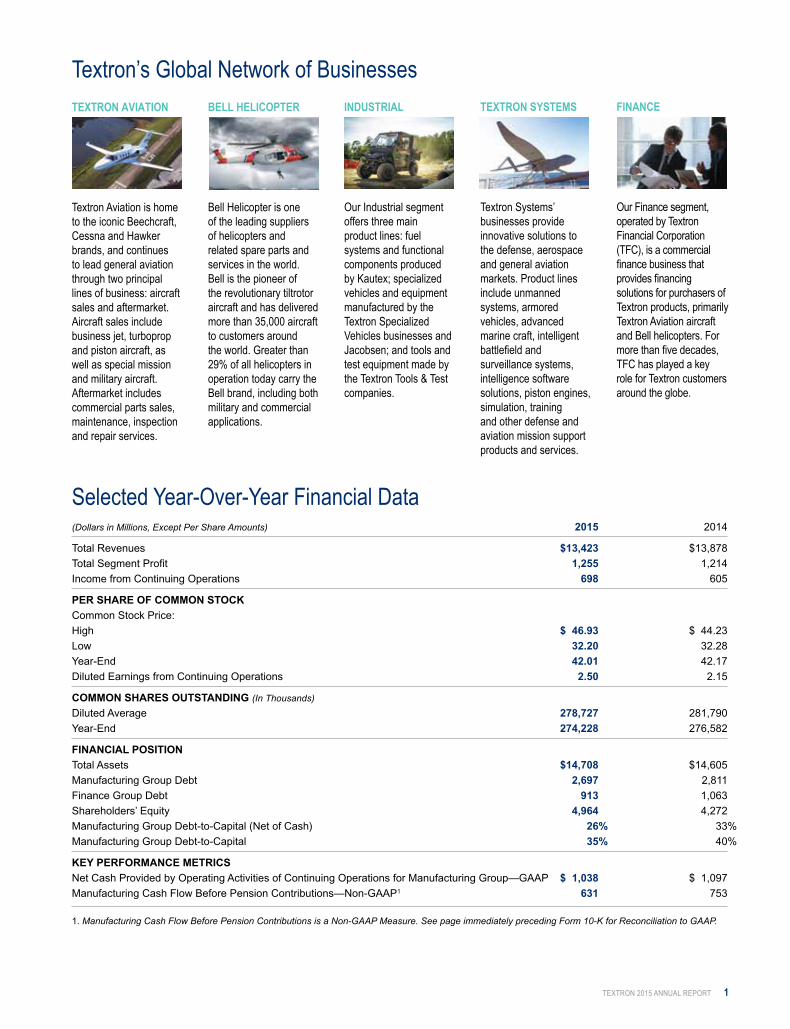
TEXTRON AVIATION
Textron Aviation is home to the iconic Beechcraft, Cessna and Hawker brands, and continues to lead general aviation through two principal lines of business: aircraft sales and aftermarket. Aircraft sales include business jet, turboprop and piston aircraft, as well as special mission and military aircraft. Aftermarket includes commercial parts sales, maintenance, inspection and repair services.
BELL HELICOPTER
Bell Helicopter is one of the leading suppliers of helicopters and related spare parts and services in the world. Bell is the pioneer of the revolutionary tiltrotor aircraft and has delivered more than 35,000 aircraft to customers around the world. Greater than 29% of all helicopters in operation today carry the Bell brand, including both military and commercial applications.
INDUSTRIAL
Our Industrial segment offers three main product lines: fuel systems and functional components produced by Kautex; specialized vehicles and equipment manufactured by the Textron Specialized Vehicles businesses and Jacobsen; and tools and test equipment made by the Textron Tools & Test companies.
TEXTRON SYSTEMS
Textron Systems’ businesses provide innovative solutions to the defense, aerospace and general aviation markets. Product lines include unmanned systems, armored vehicles, advanced marine craft, intelligent battlefield and surveillance systems, intelligence software solutions, piston engines, simulation, training and other defense and aviation mission support products and services.
FINANCE
Our Finance segment, operated by Textron Financial Corporation (TFC), is a commercial finance business that provides financing solutions for purchasers of Textron products, primarily Textron Aviation aircraft and Bell helicopters. For more than five decades, TFC has played a key role for Textron customers around the globe.
(Dollars in Millions, Except Per Share Amounts) 2015 2014
Total Revenues $13,423 $13,878
Total Segment Profit 1,255 1,214
Income from Continuing Operations 698 605
PER SHARE OF COMMON STOCK
Common Stock Price:
High $ 46.93 $ 44.23
Low 32.20 32.28
Year-End 42.01 42.17
Diluted Earnings from Continuing Operations 2.50 2.15
COMMON SHARES OUTSTANDING (In Thousands)Diluted Average 278,727 281,790
Year-End 274,228 276,582
FINANCIAL POSITION
Total Assets $14,708 $14,605
Manufacturing Group Debt 2,697 2,811
Finance Group Debt 913 1,063
Shareholders’ Equity 4,964 4,272
Manufacturing Group Debt-to-Capital (Net of Cash) 26% 33%
Manufacturing Group Debt-to-Capital 35% 40%
KEY PERFORMANCE METRICS
Net Cash Provided by Operating Activities of Continuing Operations for Manufacturing Group—GAAP $ 1,038 $ 1,097
Manufacturing Cash Flow Before Pension Contributions—Non-GAAP1 631 753
1. Manufacturing Cash Flow Before Pension Contributions is a Non-GAAP Measure. See page immediately preceding Form 10-K for Reconciliation to GAAP.
Textron’s Global Network of Businesses
Selected Year-Over-Year Financial Data
TEXTRON 2015 ANNUAL REPORT 1

Fellow Shareholders, 2015 was a year of strong execution for our company as we recorded a segment profit of $1.3 billion and a profit margin of 9.3 percent. With revenues of $13.4 billion for the year, we positioned ourselves for continued long-term growth by achieving significant milestones on a number of important programs, introducing new products and enhancing our sales channels, actions that will enable us to expand our markets and align with the needs of our customers.
Successfully executing on our commitmentsOur financial results reflect the successful execution of our efforts to realize new opportunities for growth, improve our operational efficiency and fulfill our commitments to customers, despite continued challenges in a number of the markets in which we compete. At Textron Aviation, higher jet deliveries helped to lift revenues to $4.8 billion in 2015 from $4.6 billion in 2014, while the continued successful integration of our Beechcraft and Cessna businesses helped to drive profits to $400 million, a 71 percent increase over the previous year. The business celebrated Federal Aviation Administration (FAA) certification and subsequent first deliveries of the Citation Latitude and the new Pro Line Fusion-equipped Beechcraft King Air 350i and 250 turboprop aircraft.
While the commercial helicopter market continued to be challenging for Bell Helicopter, its long-term growth outlook remains strong with new commercial products and upgrades on the horizon to be
supported by expanded global sales efforts. Successful first flight of the new Bell 525 Relentless —the first-ever commercial fly-by-wire helicopter— was a major milestone for the business in 2015. On the military side, Bell Helicopter secured several notable contracts, both domestically and internationally, for the H-1 and V-22 programs.
Our Textron Systems segment won a number of U.S. and international military contracts, including additional craft for the U.S. Navy’s Ship to Shore Connector program and a contract for 55 COMMANDO Select vehicles to the Afghan National Army that were delivered in 2015.
Our Industrial segment delivered solid financial performance with continued expansion of our margin rates. By introducing new products and leveraging the strength of our recent acquisitions, our businesses grew and extended their product reach into new markets.
In our Finance segment, Textron Financial completed another successful year of responding to our customers’ needs with attractive financing options in support of Textron aircraft product sales.
Successfully launching new products and winning customersBringing new products to our markets creates excitement among customers, which results in new orders and sales. A prime example was Bell Helicopter’s introduction of the Bell 407GXP long light single aircraft at Heli-Expo in March, which resulted in the largest single order—up to 200 from one customer—in Bell’s history and one of the largest in the rotorcraft industry. Similarly, Bell Helicopter continued to collect customer letters of intent to purchase two new products under development: the Bell 505 Jet Ranger X short light single
Scott C. Donnelly Chairman and Chief Executive Officer
2 TEXTRON 2015 ANNUAL REPORT
TOTAL REVENUES BY SEGMENT
Textron Aviation $4.8BBell Helicopter $3.5BIndustrial $3.5B Textron Systems $1.5B Finance $0.1B

helicopter, scheduled to be certified and delivered in 2016, and the Bell 525 Relentless super-medium commercial helicopter, expected to achieve certification in 2017.
The success of the V-22 Osprey tiltrotor, which has amassed more than 300,000 flight hours, continues to drive new orders. Japan became the V-22’s first international customer with an agreement to purchase five aircraft, while the U.S. Navy announced its plans to procure 44 V-22s for its Carrier Onboard Delivery program. Building on the success of the V-22, our V-280 development program continues to make progress. In addition to starting initial assembly of the aircraft, our teams developed a simulator that allows potential customers to experience this next-generation tiltrotor at military tradeshows and other venues. The V-280 demonstrator aircraft is preparing for first flight in 2017 as part of the U.S. Department of Defense’s Future Vertical Lift/Joint Multi-Role technology demonstration program.
In August, customers began taking delivery of the new Citation Latitude. This is the fifth Citation jet to be certified during an 18-month period, demonstrating the rapid pace of Textron Aviation’s product development program. Textron Aviation continues to invest in larger business jets as the Citation Longitude prepares for its first flight in 2016 and is expected to enter into service in 2017. Rounding out the Citation family of jets in the large-cabin segment is the Hemisphere, targeting first flight in 2019. Textron Aviation also announced the development of a new, clean-sheet single engine turboprop aircraft that is expected to have a range of more than 1,500 nautical miles and speeds higher than 280 knots.
As production continued on the first two craft as part of the Ship to Shore Connector program at Textron Systems Marine & Land Systems, the U.S. Navy ordered an additional two units as part of an $84 million contract option. The first two units are scheduled for completion in 2017 and 2018. Our Aerosond Small Unmanned Aircraft System fee-for-service program performed well and continued to grow. Four new sites were added to our U.S. Department of Defense contract, while flight hours per month increased at all of our sites around the world and surpassed a total of 120,000 flight hours.
TRU Simulation + Training won significant new contracts and regulatory approvals as it continued to establish strong relationships with customers and grow its business globally. Among the notable successes was a contract with Lufthansa Flight Training for an Airbus A350 FFS X Level D full motion flight simulator, representing TRU’s first venture to meet the flight training solution needs for this new generation of wide body aircraft. Also, TRU Flight Training Iceland, a joint venture with Icelandair, earned FAA qualification of its Boeing 757 Level D Full Flight Simulator, the first with regulatory approval from the FAA and the European Aviation Safety Agency.
Building on the technology of its Dixie Chopper business, Jacobsen launched a new line of zero-turn mowers to expand its business beyond golf to reach professional landscapers. Textron Specialized Vehicles updated its popular E-Z-GO RXV golf car to include new styling and greater comfort and amenities, and introduced a new Cushman Hauler 72-volt electric utility vehicle and the Gasoline Hauler 4x4. Greenlee Communications launched its AirScout for technicians to more easily survey a home or business for Wi-Fi
2015 MilestonesMoving with great speed, we brought a number of new products to market in 2015 so our customers can accomplish great things—in the air, on the ground and on the battlefield— and backed it up with outstanding sales support and service.
Certification and first deliveries of Citation Latitude
Introduction of 407GXP First international customer for the V-22
Introduction of Jacobsen ProSeriesTM
Completion of COMMANDO vehicles for Afghan National Army
First dual FAA and EASA qualification for TRU’s B757 Full Flight Simulator
TEXTRON 2015 ANNUAL REPORT 3

Looking ForwardWe have many exciting milestones ahead. Having a continuous pipeline of new products means there are always a number of “firsts”— from first flights to first deliveries. Rapidly developing new products is central to our growth strategy.
First deliveries of Canadian TAPV (targeted for 2016)
Certification and first deliveries of the 505 Jet Ranger X (targeted for 2016)
First flight of Citation Longitude (targeted for 2016)
First craft completed for Ship to Shore Connector program (targeted for 2017)
Certification and first deliveries of the 525 Relentless (targeted for 2017)
First flight of Citation Hemisphere (targeted for 2019)
4 TEXTRON 2015 ANNUAL REPORT
performance. In June, Kautex began production of the first all-plastic pressurized fuel tank for hybrid vehicles. These tanks use patented plastic reinforcements between the tank’s bottom and top, as opposed to metal straps, to reduce weight and costs. The design is a first in the industry.
Building on our acquisitionsIn 2015, we made strategic acquisitions to continue expanding our businesses’ range of products and services. In January, Textron Specialized Vehicles acquired Douglas Equipment, an aviation ground support equipment (GSE) business in the United Kingdom. This acquisition built on the acquisition in the previous year of TUG Technologies, strengthening our presence in this industry and complementing our aviation businesses. In February, Textron Aviation acquired an aircraft interiors business, giving us the capabilities to design and build interior components for our Citation and King Air aircraft to ensure that we’re giving our customers the highest quality features and to improve on-time manufacturing performance. 2015 marked the first full year of the Beechcraft and Cessna integration, and the business continued to successfully generate operational efficiencies that benefit our company as well as our customers.
Growing our presence around the world to serve customersAs we grow globally, we’ve enhanced our capacity to engage with customers before, during and after the sale. Over the past year, we’ve opened sales offices and training facilities in new locations and enhanced our service to customers where we already have a
presence. Bell Helicopter opened regional sales offices in Tokyo and Mexico City and partnered with Textron Systems to open an office in Abu Dhabi. Our ProFlight business, acquired in 2014 by TRU Simulation + Training to meet the needs of our customers for advanced pilot and maintenance training, opened a second training facility in Tampa. Meanwhile, TRU is better serving the needs of avionics technicians and aircraft mechanics with the opening in October of a new Aviation Maintenance Training Academy on Textron Aviation’s Mid-Continent campus in Wichita. Over the past year, Textron Aviation’s 21 company-operated service centers have received certifications to expand their capabilities and service Beechcraft, Cessna and Hawker customers. This represents another way we are building and growing our relationships with customers. In addition, the company tripled the size of its Paris Service Center at Paris-Le Bourget Airport.
On course for profitable growth Our solid financial results in 2015 were based on following through on our strategy: developing new products, expanding our markets, enhancing our sales channels and strategically acquiring new businesses. As we enter 2016, we are continuing to make the investments in our products, processes and people that will drive growth for the year ahead and beyond.
Scott C. Donnelly Chairman and Chief Executive Officer

Scott C. Donnelly (1) Chairman, President and CEO Textron Inc.
Kathleen M. Bader (1) (3) President and CEO (Retired) NatureWorks LLC
R. Kerry Clark (1) (2) (5) Chairman and CEO (Retired) Cardinal Health, Inc.
James T. Conway (2) (3) General (Retired) U.S. Marine Corps
Ivor J. Evans (2) (3) Executive Chairman Meritor, Inc.
Lawrence K. Fish (3) (4) Chairman and CEO (Retired) Citizens Financial Group, Inc.
Paul E. Gagné (2) (4) Chairman Wajax Corporation
Dain M. Hancock (2) (4) Executive Vice President (Retired) Lockheed Martin Corporation
Lord Powell of BayswaterKCMG (3) (4) Former Private Secretary and Advisor on Foreign Affairs and Defense to Prime Ministers Margaret Thatcher and John Major
Lloyd G. Trotter (1) (4) Managing Partner GenNx 360 Capital Partners
James L. Ziemer (2) (4)
President and CEO (Retired) Harley-Davidson, Inc.
Numbers Indicate Committee Memberships:
(1) Executive Committee: Chair, Scott C. Donnelly
(2) Audit Committee: Chair, R. Kerry Clark
(3) Nominating and Corporate Governance Committee: Chair, Kathleen M. Bader
(4) Organization and Compensation Committee: Chair, Lloyd G. Trotter
(5) Lead Director: R. Kerry Clark
Scott C. Donnelly Chairman, President and CEO Textron Inc.
Frank T. Connor Executive Vice President and Chief Financial Officer Textron Inc.
Cheryl H. Johnson Executive Vice President, Human Resources Textron Inc.
E. Robert Lupone Executive Vice President, General Counsel and Secretary Textron Inc.
Scott A. Ernest President and CEO Textron Aviation
J. Scott Hall President and CEO Industrial Segment and Greenlee
Kevin P. Holleran President and CEO Textron Specialized Vehicles
Ellen M. Lord President and CEO Textron Systems Segment
R. Danny Maldonado President and CEO Textron Financial Corporation
Vicente Perez President and CEO Kautex
Mitch Snyder President and CEO Bell Helicopter
Ian K. Walsh President and CEO TRU Simulation + Training Inc.
David Withers President and CEO Jacobsen
Mark S. Bamford Vice President and Corporate Controller Textron Inc.
Julie G. Duffy Vice President and Deputy General Counsel – Litigation Textron Inc.
Dana L. Goldberg Vice President – Tax Textron Inc.
Scott P. Hegstrom Vice President – Mergers & Acquisitions Textron Inc.
Mary F. Lovejoy Vice President and Treasurer Textron Inc.
Paul Mc Gartoll Vice President – Strategy and Business Development Textron Inc.
.
Thomas N. Nichipor Vice President – Textron Audit Services Textron Inc.
Elizabeth C. Perkins Vice President and Deputy General Counsel Textron Inc.
Robert O. Rowland Senior Vice President – Washington Operations Textron Inc.
Diane K. Schwarz Vice President and Chief Information Officer Textron Inc.
Cathy A. Streker Vice President – Human Resources Textron Inc.
Douglas R. Wilburne Vice President – Investor Relations Textron Inc.
LeadershipBoard of Directors
Executive Officers
Segment and Business Unit Presidents Corporate Officers
TEXTRON 2015 ANNUAL REPORT 5

FOOTNOTE TO SELECTED YEAR-OVER-YEAR FINANCIAL DATA1 We use Manufacturing Cash Flow Before Pension Contributions as our measure of free cash flow. This measure is not a financial measure under generally accepted accounting principles (GAAP) and should be used in conjunction with GAAP cash measures provided in our Consolidated Statements of Cash Flows. Free cash flow is a measure generally used by investors, analysts and management to gauge a company’s ability to generate cash from operations in excess of that necessary to be reinvested to sustain and grow the business and fund its obligations.
Our definition of Manufacturing Cash Flow Before Pension Contributions adjusts net cash from operating activities of continuing operations for the Manufacturing group for dividends received from TFC, capital contributions provided under the Support Agreement and debt agreements, capital expenditures, proceeds from the sale of property, plant and equipment and contributions to our pension plans. We believe that our calculation provides a relevant measure of liquidity and is a useful basis for assessing our ability to fund operations and obligations. This measure may not be comparable with similarly titled measures reported by other companies, as there is no definitive accounting standard on how the measure should be calculated. A reconciliation of net cash from operating activities of continuing operations for the Manufacturing group as presented in our Consolidated Statement of Cash Flows to Manufacturing Cash Flow Before Pension Contributions is provided below:
(In Millions) 2015 2014
Net cash provided by operating activities of continuing operations for the Manufacturing group—GAAP $1,038 $1,097
Less: Capital expenditures (420) (429)
Dividends received from TFC (63) —
Plus: Total pension contributions 68 76
Proceeds from the sale of property, plant and equipment 8 9
Manufacturing Cash Flow Before Pension Contributions—Non-GAAP $ 631 $ 753
6 TEXTRON 2015 ANNUAL REPORT

UNITED STATES SECURITIES AND EXCHANGE COMMISSION Washington, D.C. 20549
Form 10-K ANNUAL REPORT PURSUANT TO SECTION 13 OR 15(d) OF THE SECURITIES EXCHANGE ACT OF 1934
For the fiscal year ended January 2, 2016
TRANSITION REPORT PURSUANT TO SECTION 13 OR 15(d) OF THE SECURITIES EXCHANGE ACT OF 1934
For the transition period from to .
Commission File Number 1-5480
Textron Inc.
Delaware 05-0315468
40 Westminster Street, Providence, RI 02903
(401) 421-2800
Title of Each Class Name of Each Exchange on Which Registered
Documents Incorporated by Reference
This proof is printed at 94% of original size
This line represents final trim and will not print

Textron Inc. Index to Annual Report on Form 10-K
For the Fiscal Year Ended January 2, 2016
PART I Page
PART II
PART III
PART IV
This proof is printed at 94% of original size
This line represents final trim and will not print

PART I
Item 1. Business
Textron Aviation Segment
(In millions) 2015 2014 2013
This proof is printed at 94% of original size
This line represents final trim and will not print

Bell Segment
(In millions) 2015 2014 2013
Textron Systems Segment
(In millions) 2015 2014 2013
This proof is printed at 94% of original size
This line represents final trim and will not print

Unmanned Systems
Weapons and Sensors
Marine and Land Systems
Simulation, Training and Other
Industrial Segment
(In millions) 2015 2014 2013
Fuel Systems and Functional Components
Specialized Vehicles and Equipment
This proof is printed at 94% of original size
This line represents final trim and will not print

Tools and Test Equipment
Finance Segment
This proof is printed at 94% of original size
This line represents final trim and will not print

Backlog
(In millions) January 2,
2016 January 3,
2015
U.S. Government Contracts
Research and Development
Patents and Trademarks
This proof is printed at 94% of original size
This line represents final trim and will not print

Environmental Considerations
Employees
Executive Officers of the Registrant
Name Age Current Position with Textron Inc.
This proof is printed at 94% of original size
This line represents final trim and will not print

Available Information
Forward-Looking Information
••
••
•
•
••
•••••
••
•••
This proof is printed at 94% of original size
This line represents final trim and will not print

Item 1A. Risk Factors
We have customer concentration with the U.S. Government; reduction in U.S. Government defense spending may adversely affect our results of operations and financial condition.
U.S. Government contracts may be terminated at any time and may contain other unfavorable provisions.
As a U.S. Government contractor, we are subject to procurement rules and regulations.
This proof is printed at 94% of original size
This line represents final trim and will not print

As a U.S. Government contractor, our businesses and systems are subject to audit and review by the Defense Contract Audit Agency (DCAA) and the Defense Contract Management Agency (DCMA).
Cost overruns on U.S. Government contracts could subject us to losses or adversely affect our future business.
Demand for our aircraft products is cyclical and could adversely affect our financial results.
We may make acquisitions that increase the risks of our business.
If our Finance segment is unable to maintain portfolio credit quality, our financial performance could be adversely affected.
This proof is printed at 94% of original size
This line represents final trim and will not print

We may need to obtain financing in the future; such financing may not be available to us on satisfactory terms, if at all.
Failure to perform by our subcontractors or suppliers could adversely affect our performance.
Our business could be negatively impacted by information technology disruptions and security threats.
Developing new products and technologies entails significant risks and uncertainties.
This proof is printed at 94% of original size
This line represents final trim and will not print

We are subject to the risks of doing business in foreign countries.
We are subject to increasing compliance risks that could adversely affect our operating results.
This proof is printed at 94% of original size
This line represents final trim and will not print

We are subject to legal proceedings and other claims.
Intellectual property infringement claims of others and the inability to protect our intellectual property rights could harm our business and our customers.
Certain of our products are subject to laws regulating consumer products and could be subject to repurchase or recall as a result of safety issues.
The increasing costs of certain employee and retiree benefits could adversely affect our results.
Our business could be adversely affected by strikes or work stoppages and other labor issues.
Currency, raw material price and interest rate fluctuations may adversely affect our results.
This proof is printed at 94% of original size
This line represents final trim and will not print

We may be unable to effectively mitigate pricing pressures.
Unanticipated changes in our tax rates or exposure to additional income tax liabilities could affect our profitability.
Item 1B. Unresolved Staff Comments
Item 2. Properties
Item 3. Legal Proceedings
Item 4. Mine Safety Disclosures
This proof is printed at 94% of original size
This line represents final trim and will not print

PART II
Item 5. Market for Registrant’s Common Equity, Related Stockholder Matters and Issuer Purchases of Equity Securities
The principal market on which our common stock is traded is the New York Stock Exchange under the symbol “TXT.” At January 2, 2016, there were approximately 10,000 record holders of Textron common stock. The high and low sales prices per share of our common stock as reported on the New York Stock Exchange and the dividends paid per share are provided in the following table:
2015 2014
High Low Dividends per Share High Low
Dividends per Share
First quarter $ 45.61 $ 40.95 $ 0.02 $ 40.18 $ 34.28 $ 0.02 Second quarter 46.93 42.97 0.02 40.93 36.96 0.02 Third quarter 44.98 32.20 0.02 39.03 35.54 0.02 Fourth quarter 43.93 38.18 0.02 44.23 32.28 0.02
Issuer Repurchases of Equity Securities The following provides information about our fourth quarter 2015 repurchases of equity securities that are registered pursuant to Section 12 of the Securities Exchange Act of 1934, as amended:
Period (shares in thousands)
Total Number of
Shares Purchased (1)
Average Price Paid per Share
(excluding commissions)
Total Number of Shares Purchased as
part of Publicly Announced Plan (1)
Maximum Number of Shares
that may yet be Purchased under
the Plan October 4, 2015 – November 7, 2015 208 $ 37.63 208 10,882 November 8, 2015 – December 5, 2015 — — — 10,882 December 6, 2015 – January 2, 2016 — — — 10,882 Total 208 $ 37.63 208 (1) These shares were purchased pursuant to a plan authorizing the repurchase of up to 25 million shares of Textron common stock that had
been announced on January 23, 2013. This plan has no expiration date.
Stock Performance Graph The following graph compares the total return on a cumulative basis at the end of each year of $100 invested in our common stock on December 31, 2010 with the Standard & Poor’s (S&P) 500 Stock Index, the S&P 500 Aerospace & Defense (A&D) Index and the S&P 500 Industrials Index, all of which include Textron. The values calculated assume dividend reinvestment.
2010 2011 2012 2013 2014 2015
Textron Inc. $ 100.00 $ 78.53 $ 105.62 $ 157.05 $ 180.27 $ 180.18 S&P 500 100.00 102.11 118.45 156.82 178.29 180.75 S&P 500 A&D 100.00 105.28 120.61 186.85 208.21 219.52 S&P 500 Industrials 100.00 105.43 120.98 159.26 178.94 184.13
This proof is printed at 94% of original size
This line represents final trim and will not print

Item 6. Selected Financial Data
Dollars in millions, except per share amounts 2015 2014 2013 2012 2011 Revenues
Total revenues Segment profit
Total segment profit
Income from continuing operations Per share of common stock
Common shares outstanding (In thousands)
Financial position
Investment data
(a) Segment profit includes amortization of $12 million and $63 million in 2015 and 2014, respectively, related to fair value step-up adjustments of Beechcraftacquired inventories sold during the period.
(b) For 2011, segment profit includes a $186 million initial mark-to-market adjustment for finance receivables in the Golf Mortgage portfolio that weretransferred to the held for sale classification.
(c) Acquisition and restructuring costs are related to the acquisition of Beech Holdings, LLC, the parent of Beechcraft Corporation, which was completed onMarch 14, 2014.
This proof is printed at 94% of original size
This line represents final trim and will not print

Item 7. Management’s Discussion and Analysis of Financial Condition and Results of Operations
Overview and Consolidated Results of Operations
••••••••
Revenues % Change
(Dollars in millions) 2015 2014 2013 2015 2014
•
•
•
•
•
•
•
•
•
This proof is printed at 94% of original size
This line represents final trim and will not print

Cost of Sales and Selling and Administrative Expense
% Change (Dollars in millions) 2015 2014 2013 2015 2014
Acquisition and Restructuring Costs
Interest Expense
% Change (Dollars in millions) 2015 2014 2013 2015 2014
Income Tax Expense
This proof is printed at 94% of original size
This line represents final trim and will not print

Segment Analysis
Textron Aviation % Change
(Dollars in millions) 2015 2014 2013 2015 2014
Textron Aviation Revenues and Operating Expenses
(In millions) 2015 versus
2014
This proof is printed at 94% of original size
This line represents final trim and will not print

(In millions) 2014 versus
2013
Textron Aviation Segment Profit (Loss)
(In millions) 2015 versus
2014
(In millions) 2014 versus
2013
This proof is printed at 94% of original size
This line represents final trim and will not print

Textron Aviation Backlog
Bell % Change
(Dollars in millions) 2015 2014 2013 2015 2014
Bell Revenues and Operating Expenses
(In millions) 2015 versus
2014
•
•
•
(In millions) 2014 versus
2013
This proof is printed at 94% of original size
This line represents final trim and will not print

•
•
•
Bell Segment Profit
(In millions) 2015 versus
2014
(In millions) 2014 versus
2013
Bell Backlog
This proof is printed at 94% of original size
This line represents final trim and will not print

Textron Systems % Change
(Dollars in millions) 2015 2014 2013 2015 2014
Textron Systems Revenues and Operating Expenses
(In millions) 2015 versus
2014
(In millions) 2014 versus
2013
Textron Systems Segment Profit
(In millions) 2015 versus
2014
This proof is printed at 94% of original size
This line represents final trim and will not print

(In millions) 2014 versus
2013
Systems Backlog
Industrial% Change
(Dollars in millions) 2015 2014 2013 2015 2014
Industrial Revenues and Operating Expenses
(In millions) 2015 versus
2014
This proof is printed at 94% of original size
This line represents final trim and will not print

(In millions) 2014 versus
2013
Industrial Segment Profit
(In millions) 2015 versus
2014
(In millions) 2014 versus
2013
Finance
(In millions) 2015 2014 2013
Finance Revenues
This proof is printed at 94% of original size
This line represents final trim and will not print

Finance Segment Profit
Finance Portfolio Quality
(Dollars in millions) January 2,
2016 January 3,
2015
* Excludes finance receivables held for sale.
Liquidity and Capital Resources
(Dollars in millions) January 2,
2016 January 3,
2015 Manufacturing group
Finance group
This proof is printed at 94% of original size
This line represents final trim and will not print

Manufacturing Group Cash Flows
(In millions) 2015 2014 2013
Share Repurchases
Dividends
Finance Group Cash Flows
(In millions) 2015 2014 2013
This proof is printed at 94% of original size
This line represents final trim and will not print

Consolidated Cash Flows
(In millions) 2015 2014 2013
Captive Financing and Other Intercompany Transactions
This proof is printed at 94% of original size
This line represents final trim and will not print

(In millions) 2015 2014 2013
Contractual Obligations
Manufacturing Group
Payments Due by Period
(In millions) Total Year 1 Years 2-3 Years 4-5 More Than 5
Years
Pension and Postretirement Benefits
Other Long-Term Liabilities
This proof is printed at 94% of original size
This line represents final trim and will not print

Purchase Obligations
Finance Group
Payments Due by Period
(In millions) Total Year 1 Years 2-3 Years 4-5 More Than 5
Years
Critical Accounting Estimates
Long-Term Contracts
This proof is printed at 94% of original size
This line represents final trim and will not print

(In millions) 2015 2014 2013
Goodwill
Retirement Benefits
This proof is printed at 94% of original size
This line represents final trim and will not print

Income Taxes
Item 7A. Quantitative and Qualitative Disclosures About Market Risk
Foreign Currency Exchange Risks
This proof is printed at 94% of original size
This line represents final trim and will not print

Interest Rate Risks
Quantitative Risk Measures
2015 2014
In millionsCarrying
Value* Fair
Value*
Sensitivity of Fair Value
to a 10% Change
Carrying Value*
Fair Value*
Sensitivity of Fair Value
to a 10% Change
Manufacturing group Foreign exchange rate risk
Interest rate risk
Finance group Interest rate risk
* The value represents an asset or (liability).
This proof is printed at 94% of original size
This line represents final trim and will not print

Item 8. Financial Statements and Supplementary Data
Page
This proof is printed at 94% of original size
This line represents final trim and will not print

Consolidated Statements of Operations
(In millions, except per share data) 2015 2014 2013 Revenues
Costs and expenses
Income from continuing operations
Net income Basic earnings per share
Basic earnings per share Diluted earnings per share
Diluted earnings per share
See Notes to the Consolidated Financial Statements.
This proof is printed at 94% of original size
This line represents final trim and will not print

Consolidated Statements of Comprehensive Income
(In millions) 2015 2014 2013
Net income
Comprehensive income
See Notes to the Consolidated Financial Statements.
This proof is printed at 94% of original size
This line represents final trim and will not print

Consolidated Balance Sheets
(In millions, except share data) January 2,
2016 January 3,
2015 Assets Manufacturing group
Total current assets
Total Manufacturing group assets Finance group
Total Finance group assets Total assets Liabilities and shareholders’ equity Liabilities Manufacturing group
Total current liabilities
Total Manufacturing group liabilities Finance group
Total Finance group liabilities Total liabilities Shareholders’ equity
Total shareholders’ equity Total liabilities and shareholders’ equity
See Notes to the Consolidated Financial Statements.
This proof is printed at 94% of original size
This line represents final trim and will not print

Consolidated Statements of Shareholders’ Equity
(In millions, except per share data) Common
Stock Capital Surplus
Treasury Stock
Retained Earnings
Accumulated Other
Comprehensive Loss
Total Shareholders’
Equity
See Notes to the Consolidated Financial Statements.
This proof is printed at 94% of original size
This line represents final trim and will not print

Consolidated Statements of Cash Flows
For each of the years in the three-year period ended January 2, 2016
Consolidated
(In millions) 2015 2014 2013 Cash flows from operating activities Net income $ 697 $ 600 $ 498 Less: Loss from discontinued operations (1) (5) —Income from continuing operations 698 605 498 Adjustments to reconcile income from continuing operations to net cash
provided by operating activities: Non-cash items:
Depreciation and amortization 461 459 389 Deferred income taxes 4 (19) 86Other, net 106 100 61
Changes in assets and liabilities: Accounts receivable, net (14) 56 (118) Inventories (239) (209) (118)Other assets (36) (33) (42)Accounts payable 43 (228) 65Accrued and other liabilities (155) 311 (182) Pension, net 69 46 17 Income taxes, net 71 (22) (84)Captive finance receivables, net 90 150 237
Other operating activities, net (4) (5) 4Net cash provided by operating activities of continuing operations 1,094 1,211 813 Net cash used in operating activities of discontinued operations (4) (3) (3)Net cash provided by operating activities 1,090 1,208 810 Cash flows from investing activities Capital expenditures (420) (429) (444)Net cash used in acquisitions (81) (1,628) (196)Finance receivables repaid 67 91 190Proceeds from sales of receivables and other finance assets 38 43 178Other investing activities, net 8 4 8 Net cash used in investing activities (388) (1,919) (264) Cash flows from financing activities Principal payments on long-term debt and nonrecourse debt (356) (904) (1,056)Proceeds from long-term debt 61 1,567 448Purchases of Textron common stock (219) (340) —Settlement of convertible notes — — (215) Proceeds from settlement of capped call — — 75 Proceeds from exercise of stock options 32 50 31 Dividends paid (22) (28) (22)Other financing activities, net — (10) (3)Net cash provided by (used in) financing activities (504) 335 (742) Effect of exchange rate changes on cash and equivalents (15) (13) (6)Net increase (decrease) in cash and equivalents 183 (389) (202)Cash and equivalents at beginning of year 822 1,211 1,413Cash and equivalents at end of year $ 1,005 $ 822 $ 1,211
See Notes to the Consolidated Financial Statements.
This proof is printed at 94% of original size
This line represents final trim and will not print

Consolidated Statements of Cash Flows continued
For each of the years in the three-year period ended January 2, 2016
Manufacturing Group Finance Group (In millions) 2015 2014 2013 2015 2014 2013 Cash flows from operating activities Net income $ 683 $ 585 $ 470 $ 14 $ 15 $ 28 Less: Loss from discontinued operations (1) (5) — — — — Income from continuing operations 684 590 470 14 15 28 Adjustments to reconcile income from continuing operations to net cash
provided by operating activities: Non-cash items:
Depreciation and amortization 449 446 371 12 13 18 Deferred income taxes 14 (7) 51 (10) (12) 35Other, net 97 86 86 9 14 (25)
Changes in assets and liabilities: Accounts receivable, net (14) 56 (118) — — — Inventories (241) (168) (135) — — — Other assets (40) (18) (41) 4 (15) —Accounts payable 43 (228) 65 — — —Accrued and other liabilities (144) 316 (171) (8) (5) (21)Pension, net 69 46 21 — — (4) Income taxes, net 62 (17) (119) 9 (5) 35
Dividends received from Finance group 63 — 175 — — — Other operating activities, net (4) (5) 3 — — —
Net cash provided by operating activities of continuing operations 1,038 1,097 658 30 5 66 Net cash used in operating activities of discontinued operations (4) (3) (3) — — — Net cash provided by operating activities 1,034 1,094 655 30 5 66 Cash flows from investing activities Capital expenditures (420) (429) (444) — — — Net cash used in acquisitions (81) (1,628) (196) — — — Finance receivables repaid — — — 351 456 675 Finance receivables originated — — — (194) (215) (271)Proceeds from sales of receivables and other finance assets — — — 38 43 178Other investing activities, net 5 (8) 16 2 (29) 42Net cash provided by (used in) investing activities (496) (2,065) (624) 197 255 624Cash flows from financing activities Principal payments on long-term and nonrecourse debt (100) (559) (313) (256) (345) (743)Proceeds from long-term debt — 1,439 150 61 128 298 Purchases of Textron common stock (219) (340) — — — — Settlement of convertible notes — — (215) — — — Proceeds from settlement of capped call — — 75 — — — Proceeds from exercise of stock options 32 50 31 — — — Dividends paid (22) (28) (22) (63) — (175) Intergroup financing — — 57 — — (57) Other financing activities, net 1 (10) (3) (1) — — Net cash provided by (used in) financing activities (308) 552 (240) (259) (217) (677)Effect of exchange rate changes on cash and equivalents (15) (13) (6) — — — Net increase (decrease) in cash and equivalents 215 (432) (215) (32) 43 13 Cash and equivalents at beginning of year 731 1,163 1,378 91 48 35 Cash and equivalents at end of year $ 946 $ 731 $ 1,163 $ 59 $ 91 $ 48
See Notes to the Consolidated Financial Statements.
This proof is printed at 94% of original size
This line represents final trim and will not print

Notes to the Consolidated Financial Statements
Note 1. Summary of Significant Accounting Policies
Principles of Consolidation and Financial Statement Presentation
Collaborative Arrangements
Use of Estimates
This proof is printed at 94% of original size
This line represents final trim and will not print

Revenue Recognition
Long-Term Contracts
Finance Revenues —
Cash and Equivalents
Inventories
This proof is printed at 94% of original size
This line represents final trim and will not print

Property, Plant and Equipment
Goodwill and Intangible Assets
Finance Receivables
This proof is printed at 94% of original size
This line represents final trim and will not print

Pension and Postretirement Benefit Obligations
Derivatives and Hedging Activities
Product Liabilities
Environmental Liabilities and Asset Retirement Obligations
Warranty and Product Maintenance Liabilities
This proof is printed at 94% of original size
This line represents final trim and will not print

Research and Development Costs
Income Taxes
New Accounting Pronouncements
Note 2. Business Acquisitions, Goodwill and Intangible Assets
2015 Acquisitions
2014 Beechcraft Acquisition
This proof is printed at 94% of original size
This line represents final trim and will not print

(In millions)
Other 2014 Acquisitions
Actual and Pro-Forma Impact from 2014 Acquisitions
(In millions, except per share amounts) 2014 2013
Certain pro-forma adjustments were made including depreciation and intangible amortization expense resulting from the valuation of tangible and intangible assets, amortization of related tax effects.
This proof is printed at 94% of original size
This line represents final trim and will not print

Goodwill
(In millions) Textron Aviation Bell
Textron Systems Industrial Total
Intangible Assets
January 2, 2016 January 3, 2015
(Dollars in millions)
Weighted-Average Amortization
Period (in years)
Gross Carrying Amount
Accumulated Amortization Net
Gross Carrying Amount
Accumulated Amortization Net
Note 3. Accounts Receivable and Finance Receivables
Accounts Receivable
(In millions) January 2,
2016 January 3,
2015
This proof is printed at 94% of original size
This line represents final trim and will not print

Finance Receivables
(In millions) January 2,
2016 January 3,
2015
* Includes finance receivables held for sale of $30 million and $35 million at January 2, 2016 and January 3, 2015, respectively.
Finance Receivable Portfolio Quality Credit Quality Indicators and Nonaccrual Finance Receivables
Delinquency
(In millions) January 2,
2016 January 3,
2015
This proof is printed at 94% of original size
This line represents final trim and will not print

Impaired Loans
(In millions) January 2,
2016 January 3,
2015
Allowance for Losses
(In millions) January 2,
2016January 3,
2015
Note 4. Inventories
(In millions) January 2,
2016 January 3,
2015
This proof is printed at 94% of original size
This line represents final trim and will not print

Note 5. Property, Plant and Equipment, Net
(Dollars in millions) Useful Lives
(in years)January 2,
2016 January 3,
2015
Note 6. Accrued Liabilities
(In millions) January 2,
2016 January 3,
2015
(In millions) 2015 2014 2013
* Adjustments include changes to prior year estimates, new issues on prior year sales and currency translation adjustments.
This proof is printed at 94% of original size
This line represents final trim and will not print

Note 7. Debt and Credit Facilities
(In millions) January 2,
2016 January 3,
2015 Manufacturing group
Finance group
(a) Notes amortize on a quarterly or semi-annual basis.(b) Notes are secured by finance receivables as described in Note 3.
(In millions) 2016 2017 2018 2019 2020
6% Fixed-to-Floating Rate Junior Subordinated Notes
Support Agreement
This proof is printed at 94% of original size
This line represents final trim and will not print

Note 8. Derivative Instruments and Fair Value Measurements
Assets and Liabilities Recorded at Fair Value on a Recurring Basis
Assets Recorded at Fair Value on a Nonrecurring Basis
This proof is printed at 94% of original size
This line represents final trim and will not print

Assets and Liabilities Not Recorded at Fair Value
January 2, 2016 January 3, 2015
(In millions) Carrying
Value Estimated
Fair Value Carrying
Value Estimated
Fair Value Manufacturing group
Finance group
Note 9. Shareholders’ Equity
Capital Stock
(In thousands) 2015 2014 2013
Earnings Per Share
(In thousands) 2015 2014 2013
This proof is printed at 94% of original size
This line represents final trim and will not print

Accumulated Other Comprehensive Loss
(In millions)
Pension and Postretirement
Benefits Adjustments
Foreign Currency
Translation Adjustments
Deferred Losses
on Hedge Contracts
Accumulated Other
Comprehensive Loss
Other Comprehensive Income (Loss)
2015 2014 2013
(In millions) Pre-Tax Amount
Tax (Expense)
Benefit After-Tax
Amount Pre-Tax Amount
Tax (Expense)
Benefit After-Tax
Amount Pre-Tax Amount
Tax (Expense)
Benefit After-Tax
Amount
*These components of other comprehensive income (loss) are included in the computation of net periodic pension cost. See Note 11 foradditional information.
This proof is printed at 94% of original size
This line represents final trim and will not print

Note 10. Share-Based Compensation
(In millions) 2015 2014 2013
Stock Options
2015 2014 2013
This proof is printed at 94% of original size
This line represents final trim and will not print

(Options in thousands) Number of
Options
Weighted-Average Exercise
Price
Restricted Stock Units
Units Payable in Stock Units Payable in Cash
(Shares/Units in thousands) Number of
Shares
Weighted-Average Grant
Date Fair Value
Number of
Units
Weighted-Average Grant
Date Fair Value
(In millions) 2015 2014 2013
Performance Share Units
(Units in thousands) Number of
Units
Weighted- Average
Grant Date Fair Value
This proof is printed at 94% of original size
This line represents final trim and will not print

(In millions) 2015 2014 2013
Note 11. Retirement Plans
Periodic Benefit Cost
Pension Benefits Postretirement Benefits
Other than Pensions (In millions) 2015 2014 2013 2015 2014 2013 Net periodic benefit cost
Other changes in plan assets and benefit obligations recognized in OCI
(In millions) Pension Benefits
Postretirement Benefits
Other than Pensions
This proof is printed at 94% of original size
This line represents final trim and will not print

Obligations and Funded Status
Pension Benefits Postretirement Benefits
Other than Pensions (In millions) 2015 2014 2015 2014 Change in benefit obligation
Change in fair value of plan assets
Pension Benefits Postretirement Benefits
Other than Pensions (In millions) 2015 2014 2015 2014
(In millions) 2015 2014
This proof is printed at 94% of original size
This line represents final trim and will not print

Assumptions
Pension Benefits Postretirement Benefits
Other than Pensions 2015 2014 2013 2015 2014 2013
Net periodic benefit cost
Benefit obligations at year-end
(In millions)
One-Percentage-
Point Increase
One- Percentage-
Point Decrease
Pension Assets
U.S. Plan Assets
Non-U.S. Plan Assets
This proof is printed at 94% of original size
This line represents final trim and will not print

January 2, 2016 January 3, 2015 (In millions) Level 1 Level 2 Level 3 Level 1 Level 2 Level 3
(In millions) Real
Estate
Private Investment
Partnerships Hedge Funds
This proof is printed at 94% of original size
This line represents final trim and will not print

Estimated Future Cash Flow Impact
(In millions) 2016 2017 2018 2019 2020 2021-2025
Note 12. Income Taxes
(In millions) 2015 2014 2013
(In millions) 2015 2014 2013
2015 2014 2013
(a) Includes a favorable impact of (0.7)% in 2015 and (0.2)% in 2014 related to valuation allowance releases. (b) Includes a favorable impact of (1.4)% in 2015, (0.6)% in 2014 and (2.0)% in 2013 related to a net change in valuation allowances.
This proof is printed at 94% of original size
This line represents final trim and will not print

(In millions) January 2,
2016 January 3,
2015 December 28,
2013
This proof is printed at 94% of original size
This line represents final trim and will not print

(In millions) January 2,
2016 January 3,
2015
Accrued expenses includes warranty reserves, self-insured liabilities and interest.
(In millions) January 2,
2016 January 3,
2015
(In millions)
This proof is printed at 94% of original size
This line represents final trim and will not print

Note 13. Commitments and Contingencies
Environmental Remediation
Leases
Note 14. Supplemental Cash Flow Information
(In millions) 2015 2014 2013
This proof is printed at 94% of original size
This line represents final trim and will not print

Note 15. Segment and Geographic Data
•
•
•
Revenues Segment Profit (Loss) (In millions) 2015 2014 2013 2015 2014 2013
This proof is printed at 94% of original size
This line represents final trim and will not print

(In millions) 2015 2014 2013
Assets Capital Expenditures Depreciation and Amortization
(In millions) January 2,
2016January 3,
2015 2015 2014 2013 2015 2014 2013
Geographic Data
Revenues* Property, Plant
and Equipment, net**
(In millions) 2015 2014 2013 January 2,
2016 January 3,
2015
* Revenues are attributed to countries based on the location of the customer.** Property, plant and equipment, net are based on the location of the asset.
This proof is printed at 94% of original size
This line represents final trim and will not print

Report of Independent Registered Public Accounting Firm
This proof is printed at 94% of original size
This line represents final trim and will not print

Quarterly Data
2015 2014 (Dollars in millions, except per share amounts) Q1 Q2 Q3 Q4 Q1 Q2 Q3 Q4 Revenues
Segment profit
Net income
Basic earnings per share
(In thousands)
Diluted earnings per share
(In thousands)
Segment profit margins
Common stock information
(a) Includes amortization of $5 million, $6 million and $1 million for the first, second, and third quarters of 2015, respectively, and $12 million, $33 million, $10million and $8 million for the first, second, third and fourth quarters of 2014, respectively, related to fair value step-up adjustments of Beechcraft acquiredinventories sold during the periods.
(b) Acquisition and restructuring costs include restructuring costs of $5 million, $20 million, $3 million and $13 million for the first, second, third and fourthquarters of 2014, respectively, related to the acquisition of Beech Holdings, LLC, the parent of Beechcraft Corporation, which was completed on March 14,2014. Transaction costs of $11 million related to the Beechcraft acquisition are also included in the first quarter of 2014.
This proof is printed at 94% of original size
This line represents final trim and will not print

Schedule II — Valuation and Qualifying Accounts
(In millions) 2015 2014 2013 Allowance for doubtful accounts
Inventory FIFO reserves
*Deductions primarily include amounts written off on uncollectable accounts (less recoveries), inventory disposals and currency translation adjustments.
Item 9. Changes In and Disagreements With Accountants on Accounting and Financial Disclosure
Item 9A. Controls and Procedures
Disclosure Controls and Procedures
Changes in Internal Controls Over Financial Reporting
Management’s Report on Internal Control Over Financial Reporting
This proof is printed at 94% of original size
This line represents final trim and will not print

Report of Independent Registered Public Accounting Firm on Internal Control over Financial Reporting
This proof is printed at 94% of original size
This line represents final trim and will not print

PART III
Item 10. Directors, Executive Officers and Corporate Governance
Audit Committee
Item 11. Executive Compensation
Item 12. Security Ownership of Certain Beneficial Owners and Management and Related Stockholder Matters
Item 13. Certain Relationships and Related Transactions and Director Independence
Item 14. Principal Accountant Fees and Services
PART IV
Item 15. Exhibits and Financial Statement Schedules
Exhibits
This proof is printed at 94% of original size
This line represents final trim and will not print

This proof is printed at 94% of original size
This line represents final trim and will not print
This proof is printed at 94% of original size
This line represents final trim and will not print

This proof is printed at 94% of original size
This line represents final trim and will not print

This proof is printed at 94% of original size
This line represents final trim and will not print

This proof is printed at 94% of original size
This line represents final trim and will not print

Name Title
This proof is printed at 94% of original size
This line represents final trim and will not print

CORPORATE HEADQUARTERS Textron Inc. 40 Westminster Street Providence, RI 02903 (401) 421-2800www.textron.com
ANNUAL MEETINGTextron’s annual meeting of shareholders will be held on Wednesday, April 27, 2016, at 11 a.m. at Textron Inc., 40 Westminster Street, 18th Floor, Providence, RI 02903.
TRANSFER AGENT, REGISTRAR AND DIVIDEND PAYING AGENTFor shareholder services such as change of address, lost certificates or dividend checks, change in registered ownership or the Dividend Reinvestment Plan, write or call: American Stock Transfer & Trust Company, LLC Operations Center 6201 15th Avenue Brooklyn, NY 11219 phone: (866) 621-2790 email: [email protected]
STOCK EXCHANGE INFORMATION(Symbol: TXT)Textron common stock is listed on the New York Stock Exchange.
INVESTOR RELATIONSTextron Inc. Investor Relations 40 Westminster Street Providence, RI 02903
Investor Relations phone line: (401) 457-2288
News media phone line: (401) 457-2362
For more information, visit our website at www.textron.com.
COMPANY PUBLICATIONS AND GENERAL INFORMATIONTo receive a copy of Textron’s Forms 10-K and 10-Q, Proxy Statement or Annual Report without charge, visit our website at www.textron.com or send a written request to Textron Investor Relations at the address listed above. For the most recent company news and earnings press releases, visit our website at www.textron.com.
Textron is an Equal Opportunity Employer.
TEXTRON BOARD OF DIRECTORSTo contact the Textron Board of Directors or to report concerns or complaints about accounting, internal accounting controls or auditing matters, you may write to Board of Directors, Textron Inc., 40 Westminster Street, Providence, RI 02903; call (866) 698-6655 or (401) 457-2269; or send an email to [email protected].
Corporate Information

40 Westminster StreetProvidence, RI 02903(401) 421-2800www.textron.com
© 2016 TEXTRON INC.
20
15
AN
NU
AL R
EP
OR
T


![[Confidential] Textron - PatentStatus Demo](https://static.fdocuments.us/doc/165x107/55c32f35bb61ebd4488b4682/confidential-textron-patentstatus-demo.jpg)


