2015-2016 Revised Budget Estimates Reports/2015-2016... · 2015-2016 Revised Budget Estimates Page...
24
2015-2016 Revised Budget Estimates Page 1 of 7 Regular Board Meeting Tuesday, December 15, 2015 ACTION REPORT ITEM 8.4 2015-2016 REVISED BUDGET ESTIMATES (INCLUDING SEPTEMBER 1, 2015 TO NOVEMBER 30, 2015 ACTUALS) PURPOSE: To provide the Board with the 2015-2016 Revised Budget Estimates for approval. BACKGROUND INFORMATION: The following information regarding the Board’s 2015-16 budget process was previously provided to Trustees: 1. Action Report 8.7 – June 16, 2015 Regular Board Meeting – 2015-16 Budget Estimates – Final. 2. Staff Report 9.2 – June 2, 2015 Regular Board Meeting – 2015-16 Budget Estimates Update (#3). 3. Staff Report 9.1 – May 19, 2015 Regular Board Meeting – 2015-16 Budget Estimates Update (#2). 4. Staff Report 9.1 – May 5, 2015 Regular Board Meeting – 2015-16 Budget Estimates Update (#1). 5. Budget Presentation – April 21, 2015 - Trustee / Senior Staff 2015-16 Budget Information Session. 6. Information Report 10.3 – April 7, 2015 Regular Board Meeting – Release of 2015-16 Grants for Student Needs (GSN). 7. Staff Report 9.1 – February 17, 2015 Regular Board Meeting – 2015-16 Budget Estimates Schedule and Objectives. COMMENTS: 1. GENERAL (APPENDICES A-1, A-2, E, F, AND G) At the June 16, 2015 Regular Board meeting, the Board approved the 2015-2016 Budget of $361,667,264.
-
Upload
truongtruc -
Category
Documents
-
view
218 -
download
3
Transcript of 2015-2016 Revised Budget Estimates Reports/2015-2016... · 2015-2016 Revised Budget Estimates Page...
2015-2016 Revised Budget Estimates Page 1 of 7
Regular Board Meeting Tuesday, December 15, 2015
ACTION REPORT ITEM 8.4
2015-2016 REVISED BUDGET ESTIMATES
(INCLUDING SEPTEMBER 1, 2015 TO NOVEMBER 30, 2015 ACTUALS)
PURPOSE: To provide the Board with the 2015-2016 Revised Budget Estimates for approval. BACKGROUND INFORMATION: The following information regarding the Board’s 2015-16 budget process was previously provided to Trustees:
1. Action Report 8.7 – June 16, 2015 Regular Board Meeting – 2015-16 Budget Estimates – Final.
2. Staff Report 9.2 – June 2, 2015 Regular Board Meeting – 2015-16 Budget Estimates Update (#3).
3. Staff Report 9.1 – May 19, 2015 Regular Board Meeting – 2015-16 Budget Estimates Update (#2).
4. Staff Report 9.1 – May 5, 2015 Regular Board Meeting – 2015-16 Budget Estimates Update (#1).
5. Budget Presentation – April 21, 2015 - Trustee / Senior Staff 2015-16 Budget Information Session.
6. Information Report 10.3 – April 7, 2015 Regular Board Meeting – Release of 2015-16 Grants for Student Needs (GSN).
7. Staff Report 9.1 – February 17, 2015 Regular Board Meeting – 2015-16 Budget Estimates Schedule and Objectives.
COMMENTS: 1. GENERAL (APPENDICES A-1, A-2, E, F, AND G)
At the June 16, 2015 Regular Board meeting, the Board approved the 2015-2016 Budget of $361,667,264.

2015-2016 Revised Budget Estimates Page 2 of 7
The Revised Budget Estimates are due to the Ministry on December 15, 2015. As the attached Revised Budget Estimates Schedule (Appendix G) indicates, the Revised Budget Estimates will be submitted to the Ministry on December 16, 2015, after their approval by the Board. This has been communicated to the Ministry.
The following table illustrates the high level changes between revenues and expenditures between Original Budget Estimates and Revised Budget Estimates: 2015-2016
Original Budget Estimates
2015-2016 Revised Budget
Estimates Revenues $361.7 million $368.2 million Expenditures $361.7 million $373.2 million Operating Surplus / (Deficit) $76,000 ($5.0) million Net Transfer to / (from) Student Success Reserve and School Activities Reserve
$0 ($0.4) million
Net Transfer to School Renewal (Old) Reserve $0.7 million ($0.2) million Net Transfer to Working Funds Reserve $0.6 million $0 Net Transfer from Committed Capital Projects ($0.2) million ($59,000) Net Transfer from Committed Sinking Fund ($0.1) million ($0.1) million Total Accumulated Surplus/(Deficit) Available for Compliance (In-Year)
$1.04 million ($5.75) million
Estimated additional Ministry Revenue to Offset Memorandum of Settlement Expenses
$3.8 million
Final Total Accumulated Surplus/(Deficit) Available for Compliance (In-Year)
($1.95) million
Appendices A-1, A-2 and F outline a summary of changes from the 2015-2016 Original Budget Estimates to the 2015-2016 Revised Budget Estimates. As outlined in the table above, the Total Accumulated (Deficit) Available for Compliance in the 2015-2016 Revised Budget Estimates is ($1.95) million, mainly as a result of increased salary and benefit expenses and lower enrolment.
Total revenues are estimated to increase further by approximately $3.8 million, to cover for additional costs included as a result of the 2014-2017 Memorandum of Settlement with Ontario English Catholic Teacher Association (OECTA). As requested by the Ministry, any resulting increase in expenses have been included in the 2015-2016 Revised Budget Estimates, however the corresponding increase in grant has not been included. The Ministry will revise the Education Finance Information System (EFIS) forms to include the additional revenue, decreasing the Total Accumulated (Deficit) Available for Compliance (In-Year) to ($1.95) million, which represents 0.6% of our provincial allocation. As the central bargaining for the Canadian Union of Public Employees (CUPE) and Association of Professional Student Services Personnel (APSSP) was still underway at the time the Revised
2015-2016 Revised Budget Estimates Page 3 of 7
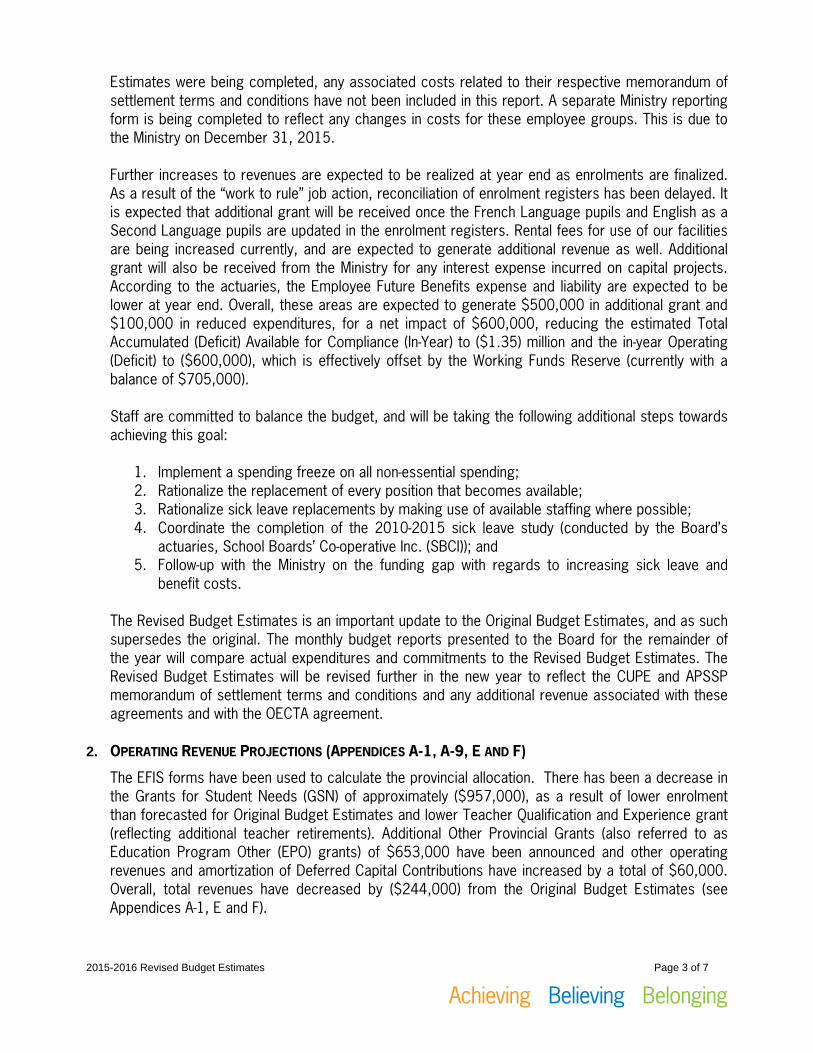
Estimates were being completed, any associated costs related to their respective memorandum of settlement terms and conditions have not been included in this report. A separate Ministry reporting form is being completed to reflect any changes in costs for these employee groups. This is due to the Ministry on December 31, 2015. Further increases to revenues are expected to be realized at year end as enrolments are finalized. As a result of the “work to rule” job action, reconciliation of enrolment registers has been delayed. It is expected that additional grant will be received once the French Language pupils and English as a Second Language pupils are updated in the enrolment registers. Rental fees for use of our facilities are being increased currently, and are expected to generate additional revenue as well. Additional grant will also be received from the Ministry for any interest expense incurred on capital projects. According to the actuaries, the Employee Future Benefits expense and liability are expected to be lower at year end. Overall, these areas are expected to generate $500,000 in additional grant and $100,000 in reduced expenditures, for a net impact of $600,000, reducing the estimated Total Accumulated (Deficit) Available for Compliance (In-Year) to ($1.35) million and the in-year Operating (Deficit) to ($600,000), which is effectively offset by the Working Funds Reserve (currently with a balance of $705,000). Staff are committed to balance the budget, and will be taking the following additional steps towards achieving this goal:
1. Implement a spending freeze on all non-essential spending; 2. Rationalize the replacement of every position that becomes available; 3. Rationalize sick leave replacements by making use of available staffing where possible; 4. Coordinate the completion of the 2010-2015 sick leave study (conducted by the Board’s
actuaries, School Boards’ Co-operative Inc. (SBCI)); and 5. Follow-up with the Ministry on the funding gap with regards to increasing sick leave and
benefit costs.
The Revised Budget Estimates is an important update to the Original Budget Estimates, and as such supersedes the original. The monthly budget reports presented to the Board for the remainder of the year will compare actual expenditures and commitments to the Revised Budget Estimates. The Revised Budget Estimates will be revised further in the new year to reflect the CUPE and APSSP memorandum of settlement terms and conditions and any additional revenue associated with these agreements and with the OECTA agreement.
2. OPERATING REVENUE PROJECTIONS (APPENDICES A-1, A-9, E AND F)
The EFIS forms have been used to calculate the provincial allocation. There has been a decrease in the Grants for Student Needs (GSN) of approximately ($957,000), as a result of lower enrolment than forecasted for Original Budget Estimates and lower Teacher Qualification and Experience grant (reflecting additional teacher retirements). Additional Other Provincial Grants (also referred to as Education Program Other (EPO) grants) of $653,000 have been announced and other operating revenues and amortization of Deferred Capital Contributions have increased by a total of $60,000. Overall, total revenues have decreased by ($244,000) from the Original Budget Estimates (see Appendices A-1, E and F).
2015-2016 Revised Budget Estimates Page 4 of 7
Other Provincial Grants have increased by approximately $653,000 due to grants received subsequent to preparing the Original Budget Estimates. These other provincial grants result in corresponding increases in expenditures. See Appendix A-9 for a list of Other Provincial Grants. Other operating revenue, excluding Education Development Charges (EDC), has increased by $22,500, which represents the net effect of a decrease in Language Instruction for Newcomers to Canada (LINC) and increase in interest revenue, international student fees and Council of Directors of Education (CODE) funding. Refer to Appendix F for a summary of changes from the 2015-2016 Original Budget Estimates to the 2015-2016 Revised Budget Estimates. As presented in the 2014-2015 Audited Financial Statements report at the November 17, 2015 Regular Board Meeting, the Board had an Operating Accumulated Surplus of 76,022 for 2014-2015. Appendices A-1 and F show an estimated in-year Operating Deficit of ($5.0) million for 2015-2016 or ($1.2) million when considering the additional grant for the OECTA Memorandum of Settlement associated costs. In addition, the Available for Compliance – Internally Appropriated (Deficit) is expected to be ($778,000), for an estimated Total Available for Compliance (Deficit) of ($5.75) million, or ($1.95) million after the additional grant is received.
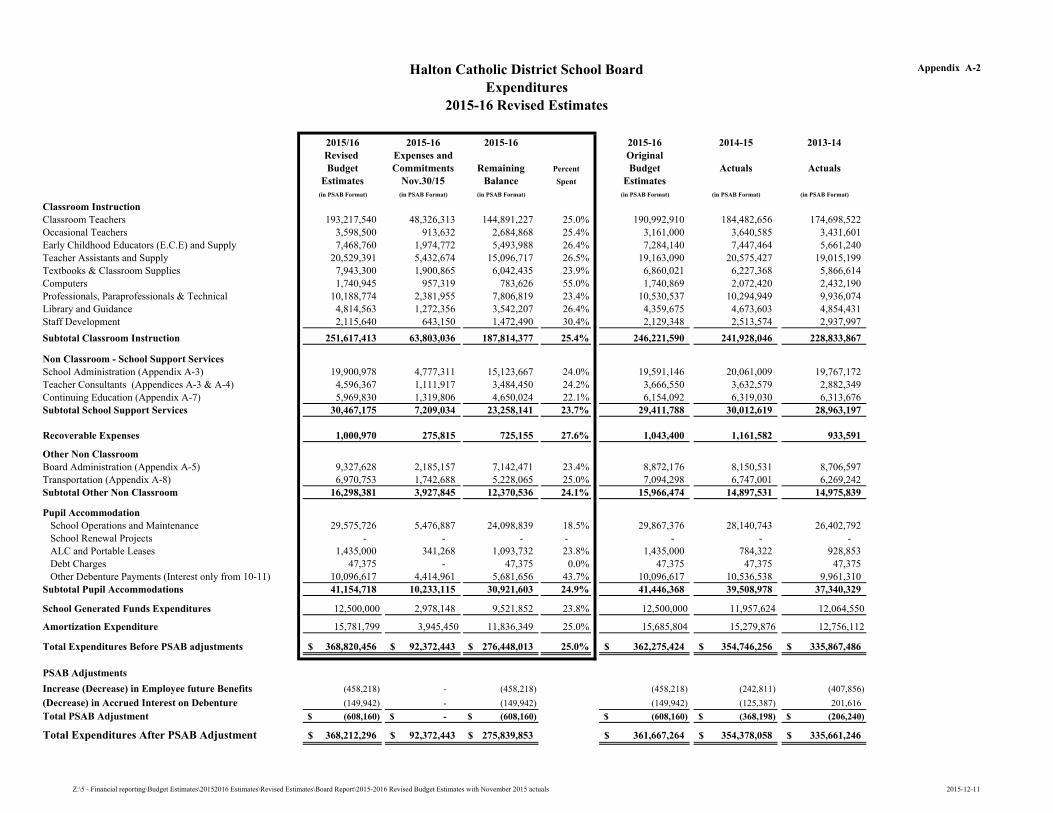
3. OPERATING EXPENDITURE PROJECTIONS (APPENDICES A-2 TO A-8, B, B-1 AND B-2)
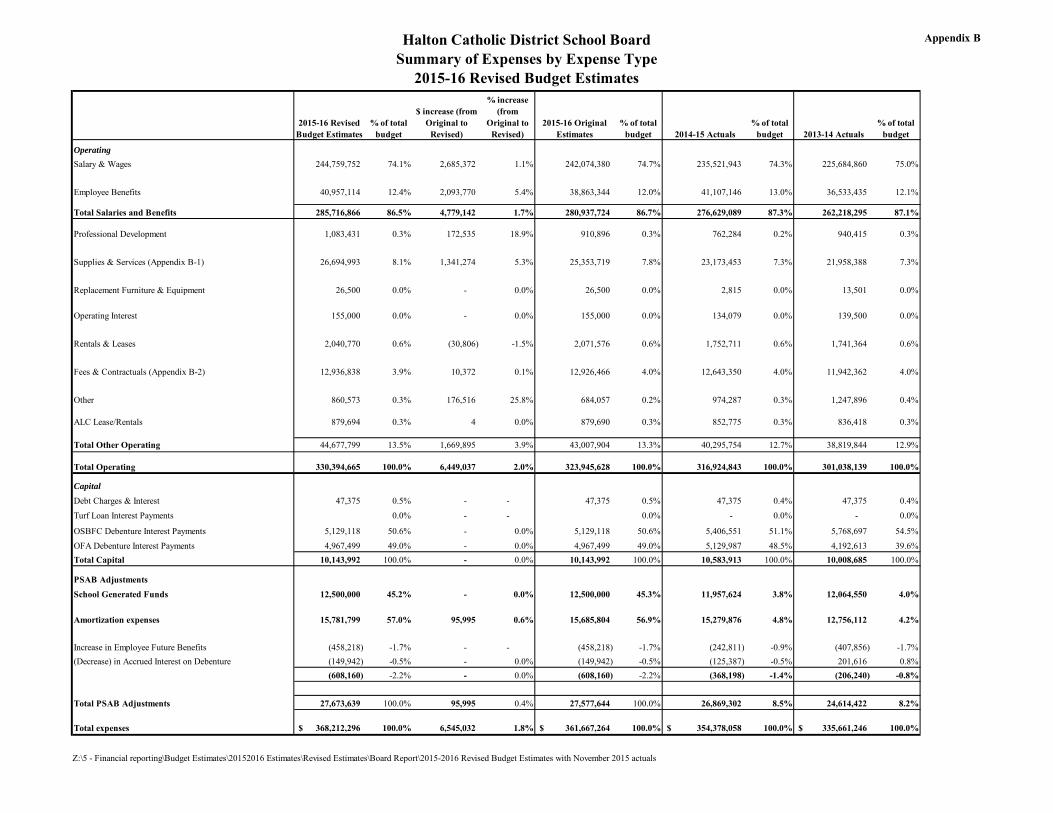
The operating expenditure projections have increased approximately $6.5 million from the 2015-2016 Original Budget Estimates. In part, this was due an increase of $4.8 million in salaries and benefits, which have been adjusted based on 2014-2015 actual expenditures incurred. These reflect projected grid movements, higher sick leave and maternity leave costs, and increased benefit costs, particularly insured benefit costs. The salary component was estimated using the staffing complement at October 31, 2015, while the benefit costs have been increased to reflect actual costs incurred in the 2014-2015 year. In addition, there are $653,000 in additional provincial grants which have an offsetting expenditure. School budget roll overs of $365,000 are also captured in the operating expenditures, as are other additional offsetting expenditures for increases in a few GSN areas, including New Teacher Induction Program (NTIP) and Council of Directors of Education (CODE) funding (See Appendix F for details). School Boards’ Co-operative Inc. (SBCI) is conducting a five year sick leave study with member boards, covering 2010-2011 to 2014-2015. The Board is participating in this study, which may result in additional funding provided to school boards by the Ministry if absenteeism rates increased over past experience prior to the labour enhancements identified in the Memorandum of Understanding (MOU) covering the 2012-2013 and 2013-2014 years. The trends to date do indicate an increase in absenteeism in 2013-2014 and 2014-2015; the study is currently being finalized. Operating expenditures include a salary component (approximately 86.5%) and a non-salary component (approximately 13.5%), as indicated in Appendix B. The operating expenditure projections total $330.4 million, comprised of $251.6 million for classroom expenditures, $47.8 million for non-classroom and $31.0 million for school operations and maintenance, as indicated in Appendix A-2. For the non-salary and benefit component, expenses have increased by $1.7 million from the 2015-2016 Original Budget Estimates, mainly due to $1.4 million increase in Supplies and Services expenditures (partly related to additional EPOs, school budget roll overs and community use of

2015-2016 Revised Budget Estimates Page 5 of 7
schools adjustments), $172,000 increase in Professional Development (EPO related) and $177,000 in other EPO related expenditures. These expenditure increases are in part offset by a corresponding increase in revenue of $653,000 million in other provincial grants, and various GSN allocation increases, as outlined in Section 2. Operating Revenue Projections.
4. CAPITAL BUDGET (APPENDIX D)
Appendix D shows the estimated capital spending in 2015-2016 for approved projects and the funding sources for these projects. The estimated expenditures are $9.6 million (mainly due to FDK additions and school condition improvement projects). The projected capital expenditures on the new North Oakville Preserve Catholic Elementary School have not been included in the 2015-2016 Revised Estimates, as the EFIS forms were not updated by the Ministry to include the additional funding sources approved. These will be reflected in the 2015-2016 Financial Statements.
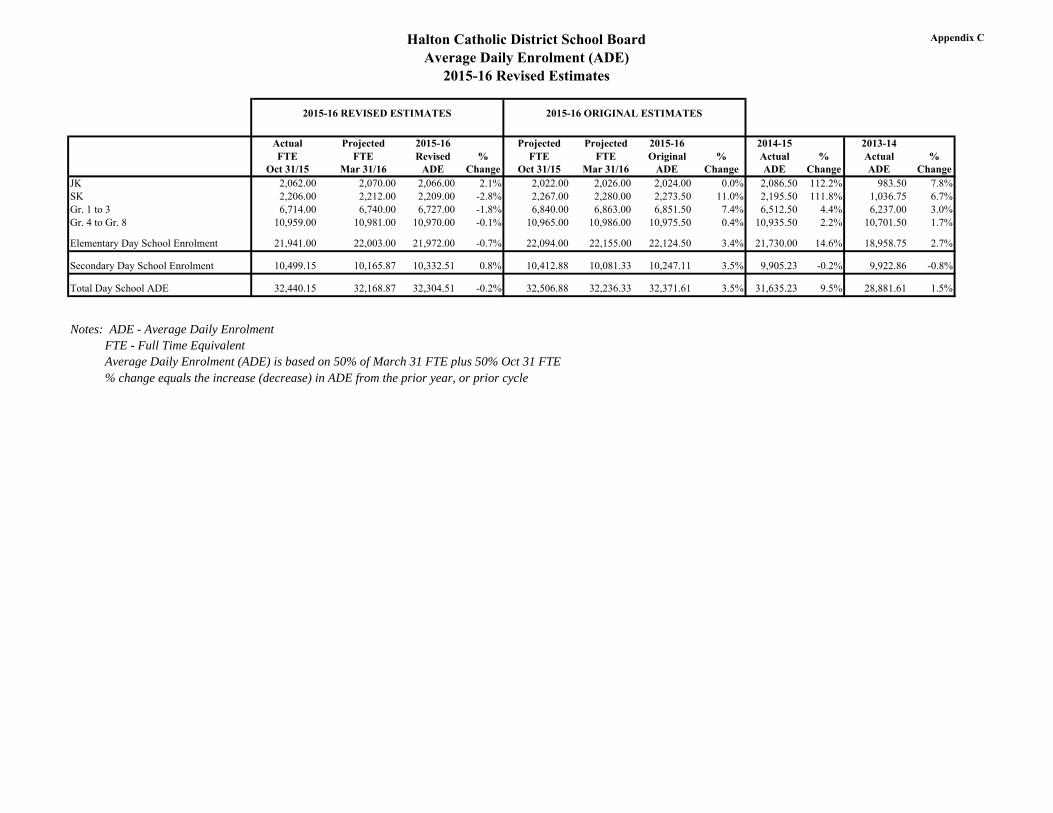
5. ENROLMENT (APPENDIX C)
The provincial funding allocation is based on estimated enrolment. Elementary and secondary enrolment is based on Full-Time Equivalent (FTE) enrolment for October 31st and March 31st. These two fixed-in-time FTE enrolment values are combined to produce the annualized Average Daily Enrolment (ADE). The enrolment used in the Revised Budget Estimates has been updated to reflect the actual enrolment on October 31, 2015. As a result, the revised projected ADE of 21,972.00 elementary students is (0.7%) lower than the elementary enrolment of 22,124.50 projected in the Original Budget Estimates. An ADE of 10,332.51 has been estimated for secondary students, which is a 0.8% increase from the 10,247.11 projected in the Original Budget Estimates. This results in an overall enrolment of 32,304.51 which is a decrease of (0.2%) over the Original Budget Estimates and a 2.1% increase over the 2014-2015 Actual ADE.
6. ENVELOPING AND FLEXIBILITY
Education funding recognizes that school boards need flexibility to decide how to best allocate resources within their budgets. At the same time, there are restrictions on how school boards may use certain components of their allocation. Limitations include: 1. Budgets must be balanced.
2. Class-size targets are to be met.
3. The Special Education Grant is limited to special education expenditures.
4. The School Renewal Allocation is primarily limited to capital renewal expenditures.
5. Capital funding is to be used for approved capital projects.
6. The Temporary Accommodation Allocation is to be used for portable moves, leases, and purchases,
as well as lease costs for permanent instructional space.
7. The School Condition Improvement Allocation is to be used for renewal expenditures that are capitalized.
2015-2016 Revised Budget Estimates Page 6 of 7
8. School Board Administration and Governance spending shall not exceed the grant allocation
(excluding internal audit).
9. A portion of GSN funding is to be used first for minor tangible capital assets (furniture and equipment that is capitalized).
10. The Mental Health Leader Allocation is to be used to ensure that each board has at least one Mental Health Leader.
11. New Teacher Induction Program (NTIP) funding is to be used for eligible NTIP expenditures which are required to meet NTIP program requirements.
12. Six allocations within the Learning Opportunities Grant are limited for use collectively on their respective programs.
School boards continue to be accountable for how they use all the revenue that they receive from education funding grants, including the revenue that they can use flexibly. The Original Budget Estimates report outlined that the 2015-2016 expenditures for Special Education are expected to be within the Special Education Allocation. The Revised Estimates Special Education expenditures have been updated to reflect the increase in salary and benefit costs, based on actual costs incurred in 2014-2015 Financial Statements. As a result, the Special Education expenditures exceed the Special Education Allocation by $1.4 million.
The Board Administration and Governance expenditures are expected to be compliant with the Board Administration and Governance Grant (BAGG) enveloping requirements.
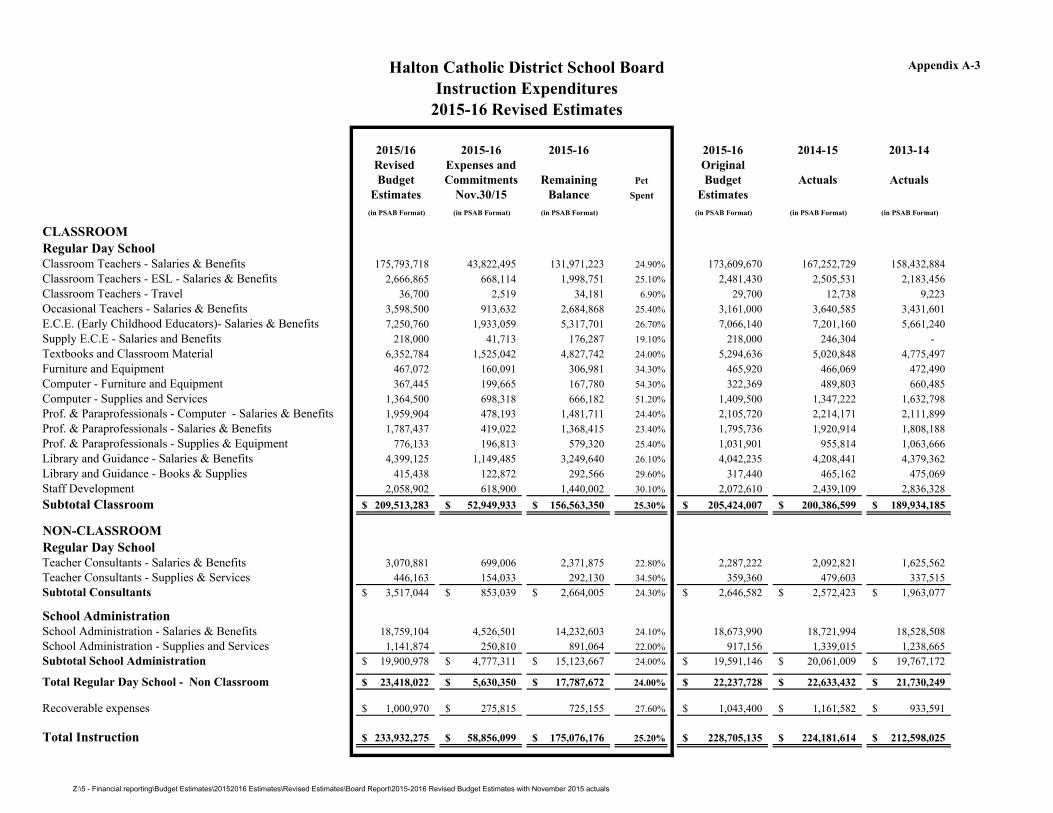
7. MONTHLY BUDGET REPORTS (APPENDICES A-1 TO A-8)
The “Revenue – Operating Fund” (Appendix A-1) and “Expenditures – Operating Fund” (Appendix A-2) schedules have a column showing the 2015-2016 received/spent to November 30, 2015. The amounts to November 30, 2015 are compared to the Revised Budget Estimates to show the percentage received/spent to date. At November 30, 2015, we are a quarter of the way through the fiscal year or three-tenths of the way through the academic year. Therefore, we would expect the percentage received/spent to be between 25% and 30%. This is the case for both revenues and expenditures, therefore the 2015-2016 year-to-date figures appear reasonable. Additional breakdowns of the expenditures are provided in Appendices A-3 to A-8. Board staff will continue to produce this report on a quarterly basis, in March 2016 and in June 2016 and show comparative year-to-date percentage received/spent in 2014-2015, as a guide.
CONCLUSION:
The Revised Budget Estimates reflect the projected funding and proposed expenditure needs for 2015-2016 based on the best information currently available. The 2015-2016 Revised Budget Estimates show an in-year Operating (Deficit) of ($1.2) million (after considering the additional Ministry grant to be received for costs already included as a result of current OECTA labour negotiations), and an estimated Total (Deficit) Available for Compliance of ($1.95) million. Additional costs and corresponding revenues will be reflected in the Revised Budget Estimates to capture the terms and conditions of the memorandum of settlement with CUPE and APSSP employee groups.

2015-2016 Revised Budget Estimates Page 7 of 7
RECOMMENDATION:
RESOLUTION Moved by: Seconded by:
RESOLVED, that the Halton Catholic District School Board approve the 2015-2016 Revised Budget Estimates in the amount of $368,212,296.
REPORT PREPARED BY: J. CHANTHAVONG ACTING MANAGER, BUDGET AND ACCOUNTING SERVICES REPORT REVIEWED BY: R. NEGOI SENIOR ADMINISTRATOR, FINANCIAL SERVICES REPORT SUBMITTED BY: P. MCMAHON SUPERINTENDENT OF BUSINESS AND TREASURER OF THE BOARD REPORT APPROVED BY: P. DAWSON DIRECTOR OF EDUCATION AND SECRETARY OF THE BOARD

Halton Catholic District School Board
Revenue
2015-16 Revised Estimates
Appendix A-1
2015/16 2015-16 2015-16 2015-16 2014-15 2013-14
Revised Revenues and Original
Budget Receipts Remaining Percent Budget Actuals Actuals
Estimates Nov.30/15 Balance Received Estimates
(in PSAB Format) (in PSAB Format) (in PSAB Format) (in PSAB Format) (in PSAB Format) (in PSAB Format)
OPERATING REVENUE
Province of Ontario
Legislative Grants 241,688,285 75,873,944 165,814,341 31.4% 244,625,612 237,867,168 204,670,240
Transfer from Classroom Reserve - - - - - - -
Municipal Taxes 85,895,608 21,502,685 64,392,923 25.0% 83,915,130 84,272,864 83,739,903
327,583,893 97,376,629 230,207,264 29.7% 328,540,742 322,140,032 288,410,143
Other Provincial Grants
Prior Year Grant Adjustment - Operating - 66,844 (66,844) - - 3,059 (8,016)
Other Provincial Grants (Appendix A-9) 3,721,235 1,593,669 2,127,566 42.8% 3,068,326 3,738,150 17,391,517
3,721,235 1,660,513 2,060,722 44.6% 3,068,326 3,741,209 17,383,501
Other Revenue
Government of Canada 1,637,621 124,495 1,513,126 7.6% 1,722,289 1,797,910 1,892,303
Tuition Fees 1,325,600 1,296,834 28,766 97.8% 1,309,900 785,630 691,308
Use of Schools/Rentals 756,520 839,796 (83,276) 111.0% 756,520 822,465 598,275
Cafeteria, Vending, Uniform and OCAS Revenue - 38,207 (38,207) - - 35,405 47,905
Interest Revenue 41,000 18,040 22,960 44.0% 25,000 40,499 198
Interest Revenue on Capital - - - - - - 25,999
Donation Revenue 1,000 1,000 - - - 11,987 12,815
Miscellaneous Recoveries - 16,653 (16,653) - - 108,796 267,723
Recoveries - Secondments 1,000,970 111,409 889,561 11.1% 1,043,400 1,161,582 933,591
Miscellaneous Revenue 376,341 493,868 (117,527) 131.2% 259,440 1,018,277 1,184,764
EDC Revenue 7,000,000 2,274,770 4,725,230 32.5% 7,000,000 8,664,543 4,624,475
12,139,052 5,215,072 6,923,980 43.0% 12,116,549 14,447,094 10,279,356
School Generated Funds Revenue 12,500,000 4,010,360 8,489,640 32.1% 12,500,000 11,913,498 12,085,367
Amortization of Deferred Capital Contribution 14,130,784 3,532,696 10,598,088 25.0% 14,093,304 13,616,163 11,086,231
Total Operating Revenue 370,074,964 111,795,270 258,279,694 30.2% 370,318,921 365,857,996 339,244,598
Available for Compliance
(Surplus) Deficit - Operating 4,967,519 - 4,967,519 0.0% (76,022) (804,226) 1,851,080
Available for Compliance - Transfer from (to) Internally Restricted Reserve (net) Note #1 777,973 910,038 (132,065) 117.0% (967,475) (1,687,097) (582,899)
Total Available for Compliance (Surplus) Deficit 5,745,492 910,038 4,835,454 15.8% (1,043,497) (2,491,323) 1,268,180
Unavailable for Compliance
Unavailable for Compliance (PSAB Adjustments) (149,942) - (149,942) 0.0% (149,942) (125,387) 201,616
Amortization of EFB - Retirement Gratuity & ERIP Liability (458,218) - (458,218) 0.0% (110,617) (242,811) (407,856)
Amortization of EFB - Retirement/Health/Dental/Life Insurance - - - (347,601) - -
Unavailable for Compliance (Increase) Decrease in School Generated Funds - - - - 44,126 (20,817)
Revenues Recognized for Land (7,000,000) (2,274,770) (4,725,230) 32.5% (7,000,000) (8,664,543) (4,624,475)
Total Unavailable for Compliance (Surplus) (7,608,160) (2,274,770) (5,333,390) 29.9% (7,608,160) (8,988,615) (4,851,532)
Total Annual (Surplus) Deficit (1,862,668) (1,364,732) (497,936) 73.3% (8,651,657) (11,479,938) (3,583,351)
Total Revenue After PSAB Adjustments 368,212,296$ 110,430,538$ 257,781,758$ 30.0% 361,667,264$ 354,378,058$ 335,661,246$
Note #1
Transfer (to) from Working Funds Reserve - (600,000) (600,000) -
Net Transfer (to) from Student Success, P.D.S.S. and School Activities Reserve 386,538 910,038 (523,500) 386,420 (31,889)
Net Transfer (to) from School Renewal Reserve 187,682 187,682 (700,000) (778,108) (699,390)
Net Transfer (to) from Committed Capital Projects 59,146 59,146 187,918 (840,016) 3,773
Net Transfer (to) from Committed Sinking Fund 144,607 144,607 144,607 144,607 144,607
777,973$ 910,038$ (132,065)$ (967,475)$ (1,687,097)$ (582,899)$
Z:\5 - Financial reporting\Budget Estimates\20152016 Estimates\Revised Estimates\Board Report\2015-2016 Revised Budget Estimates with November 2015 actuals 2015-12-11 1:27 PM
Halton Catholic District School BoardExpenditures
2015-16 Revised Estimates
Appendix A-2
2015/16 2015-16 2015-16 2015-16 2014-15 2013-14Revised Expenses and OriginalBudget Commitments Remaining Percent Budget Actuals Actuals
Estimates Nov.30/15 Balance Spent Estimates(in PSAB Format) (in PSAB Format) (in PSAB Format) (in PSAB Format) (in PSAB Format) (in PSAB Format)
Classroom Instruction Classroom Teachers 193,217,540 48,326,313 144,891,227 25.0% 190,992,910 184,482,656 174,698,522 Occasional Teachers 3,598,500 913,632 2,684,868 25.4% 3,161,000 3,640,585 3,431,601 Early Childhood Educators (E.C.E) and Supply 7,468,760 1,974,772 5,493,988 26.4% 7,284,140 7,447,464 5,661,240 Teacher Assistants and Supply 20,529,391 5,432,674 15,096,717 26.5% 19,163,090 20,575,427 19,015,199 Textbooks & Classroom Supplies 7,943,300 1,900,865 6,042,435 23.9% 6,860,021 6,227,368 5,866,614 Computers 1,740,945 957,319 783,626 55.0% 1,740,869 2,072,420 2,432,190 Professionals, Paraprofessionals & Technical 10,188,774 2,381,955 7,806,819 23.4% 10,530,537 10,294,949 9,936,074 Library and Guidance 4,814,563 1,272,356 3,542,207 26.4% 4,359,675 4,673,603 4,854,431 Staff Development 2,115,640 643,150 1,472,490 30.4% 2,129,348 2,513,574 2,937,997 Subtotal Classroom Instruction 251,617,413 63,803,036 187,814,377 25.4% 246,221,590 241,928,046 228,833,867
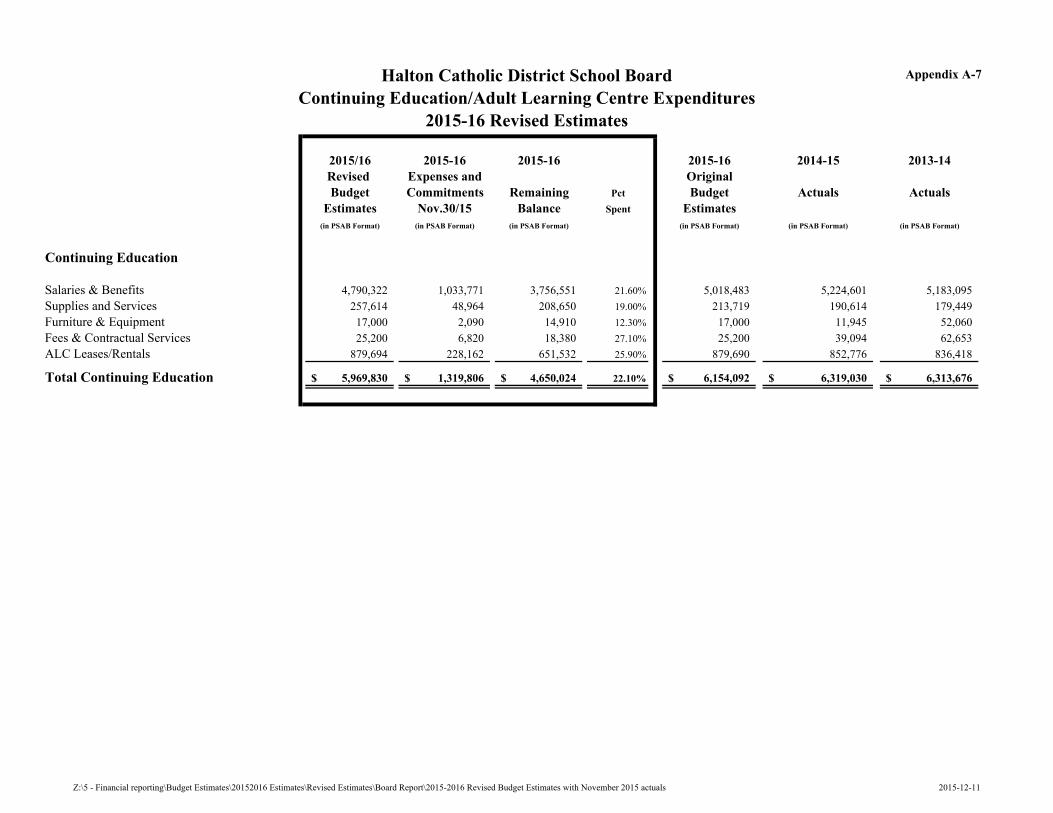
Non Classroom - School Support ServicesSchool Administration (Appendix A-3) 19,900,978 4,777,311 15,123,667 24.0% 19,591,146 20,061,009 19,767,172 Teacher Consultants (Appendices A-3 & A-4) 4,596,367 1,111,917 3,484,450 24.2% 3,666,550 3,632,579 2,882,349 Continuing Education (Appendix A-7) 5,969,830 1,319,806 4,650,024 22.1% 6,154,092 6,319,030 6,313,676 Subtotal School Support Services 30,467,175 7,209,034 23,258,141 23.7% 29,411,788 30,012,619 28,963,197
Recoverable Expenses 1,000,970 275,815 725,155 27.6% 1,043,400 1,161,582 933,591
Other Non ClassroomBoard Administration (Appendix A-5) 9,327,628 2,185,157 7,142,471 23.4% 8,872,176 8,150,531 8,706,597 Transportation (Appendix A-8) 6,970,753 1,742,688 5,228,065 25.0% 7,094,298 6,747,001 6,269,242 Subtotal Other Non Classroom 16,298,381 3,927,845 12,370,536 24.1% 15,966,474 14,897,531 14,975,839
Pupil Accommodation School Operations and Maintenance 29,575,726 5,476,887 24,098,839 18.5% 29,867,376 28,140,743 26,402,792 School Renewal Projects - - - - - - - ALC and Portable Leases 1,435,000 341,268 1,093,732 23.8% 1,435,000 784,322 928,853 Debt Charges 47,375 - 47,375 0.0% 47,375 47,375 47,375 Other Debenture Payments (Interest only from 10-11) 10,096,617 4,414,961 5,681,656 43.7% 10,096,617 10,536,538 9,961,310 Subtotal Pupil Accommodations 41,154,718 10,233,115 30,921,603 24.9% 41,446,368 39,508,978 37,340,329
School Generated Funds Expenditures 12,500,000 2,978,148 9,521,852 23.8% 12,500,000 11,957,624 12,064,550
Amortization Expenditure 15,781,799 3,945,450 11,836,349 25.0% 15,685,804 15,279,876 12,756,112
Total Expenditures Before PSAB adjustments 368,820,456$ 92,372,443$ 276,448,013$ 25.0% 362,275,424$ 354,746,256$ 335,867,486$
PSAB AdjustmentsIncrease (Decrease) in Employee future Benefits (458,218) - (458,218) (458,218) (242,811) (407,856) (Decrease) in Accrued Interest on Debenture (149,942) - (149,942) (149,942) (125,387) 201,616 Total PSAB Adjustment (608,160)$ -$ (608,160)$ (608,160)$ (368,198)$ (206,240)$
Total Expenditures After PSAB Adjustment 368,212,296$ 92,372,443$ 275,839,853$ 361,667,264$ 354,378,058$ 335,661,246$
Z:\5 - Financial reporting\Budget Estimates\20152016 Estimates\Revised Estimates\Board Report\2015-2016 Revised Budget Estimates with November 2015 actuals 2015-12-11
Halton Catholic District School BoardInstruction Expenditures
2015-16 Revised Estimates
Appendix A-3
2015/16 2015-16 2015-16 2015-16 2014-15 2013-14Revised Expenses and OriginalBudget Commitments Remaining Pct Budget Actuals Actuals
Estimates Nov.30/15 Balance Spent Estimates(in PSAB Format) (in PSAB Format) (in PSAB Format) (in PSAB Format) (in PSAB Format) (in PSAB Format)
CLASSROOMRegular Day SchoolClassroom Teachers - Salaries & Benefits 175,793,718 43,822,495 131,971,223 24.90% 173,609,670 167,252,729 158,432,884 Classroom Teachers - ESL - Salaries & Benefits 2,666,865 668,114 1,998,751 25.10% 2,481,430 2,505,531 2,183,456 Classroom Teachers - Travel 36,700 2,519 34,181 6.90% 29,700 12,738 9,223 Occasional Teachers - Salaries & Benefits 3,598,500 913,632 2,684,868 25.40% 3,161,000 3,640,585 3,431,601 E.C.E. (Early Childhood Educators)- Salaries & Benefits 7,250,760 1,933,059 5,317,701 26.70% 7,066,140 7,201,160 5,661,240 Supply E.C.E - Salaries and Benefits 218,000 41,713 176,287 19.10% 218,000 246,304 - Textbooks and Classroom Material 6,352,784 1,525,042 4,827,742 24.00% 5,294,636 5,020,848 4,775,497 Furniture and Equipment 467,072 160,091 306,981 34.30% 465,920 466,069 472,490 Computer - Furniture and Equipment 367,445 199,665 167,780 54.30% 322,369 489,803 660,485 Computer - Supplies and Services 1,364,500 698,318 666,182 51.20% 1,409,500 1,347,222 1,632,798 Prof. & Paraprofessionals - Computer - Salaries & Benefits 1,959,904 478,193 1,481,711 24.40% 2,105,720 2,214,171 2,111,899 Prof. & Paraprofessionals - Salaries & Benefits 1,787,437 419,022 1,368,415 23.40% 1,795,736 1,920,914 1,808,188 Prof. & Paraprofessionals - Supplies & Equipment 776,133 196,813 579,320 25.40% 1,031,901 955,814 1,063,666 Library and Guidance - Salaries & Benefits 4,399,125 1,149,485 3,249,640 26.10% 4,042,235 4,208,441 4,379,362 Library and Guidance - Books & Supplies 415,438 122,872 292,566 29.60% 317,440 465,162 475,069 Staff Development 2,058,902 618,900 1,440,002 30.10% 2,072,610 2,439,109 2,836,328 Subtotal Classroom 209,513,283$ 52,949,933$ 156,563,350$ 25.30% 205,424,007$ 200,386,599$ 189,934,185$
NON-CLASSROOM Regular Day SchoolTeacher Consultants - Salaries & Benefits 3,070,881 699,006 2,371,875 22.80% 2,287,222 2,092,821 1,625,562 Teacher Consultants - Supplies & Services 446,163 154,033 292,130 34.50% 359,360 479,603 337,515 Subtotal Consultants 3,517,044$ 853,039$ 2,664,005$ 24.30% 2,646,582$ 2,572,423$ 1,963,077$
School AdministrationSchool Administration - Salaries & Benefits 18,759,104 4,526,501 14,232,603 24.10% 18,673,990 18,721,994 18,528,508 School Administration - Supplies and Services 1,141,874 250,810 891,064 22.00% 917,156 1,339,015 1,238,665 Subtotal School Administration 19,900,978$ 4,777,311$ 15,123,667$ 24.00% 19,591,146$ 20,061,009$ 19,767,172$
Total Regular Day School - Non Classroom 23,418,022$ 5,630,350$ 17,787,672$ 24.00% 22,237,728$ 22,633,432$ 21,730,249$
Recoverable expenses 1,000,970$ 275,815$ 725,155 27.60% 1,043,400$ 1,161,582$ 933,591$
Total Instruction 233,932,275$ 58,856,099$ 175,076,176$ 25.20% 228,705,135$ 224,181,614$ 212,598,025$
Z:\5 - Financial reporting\Budget Estimates\20152016 Estimates\Revised Estimates\Board Report\2015-2016 Revised Budget Estimates with November 2015 actuals

Halton Catholic District School BoardSpecial Education Expenditures
2015-16 Revised Estimates
Appendix A-4
2015/16 2015-16 2015-16 2015-16 2014-15 2013-14Revised Expenses and OriginalBudget Commitments Remaining Pct Budget Actuals Actuals
Estimates Nov.30/15 Balance Spent Estimates(in PSAB Format) (in PSAB Format) (in PSAB Format) (in PSAB Format) (in PSAB Format) (in PSAB Format)
CLASSROOMClassroom Teachers - Salaries & Benefits 14,659,657 3,828,480 10,831,177 26.10% 14,811,510 14,662,313 14,015,435
Classroom Teachers - Travel 60,600 4,704 55,896 7.80% 60,600 49,345 57,524
Teacher Assistants - Salaries & Benefits 19,622,641 5,225,253 14,397,388 26.60% 18,256,340 19,669,325 18,262,345
Supply Teacher Assistants - Salaries & Benefits 906,750 207,421 699,329 22.90% 906,750 906,102 752,854
Textbooks and Classroom Material 330,399 85,183 245,216 25.80% 306,420 363,802 255,054
Furniture and Equipment 793,045 130,548 662,497 16.50% 793,045 376,648 363,573
Computer Equipment 9,000 59,336 (50,336) 659.30% 9,000 235,395 138,908
Prof. & Paraprofessionals - Salaries & Benefits 5,571,300 1,242,437 4,328,863 22.30% 5,503,180 5,129,279 4,852,468
Prof. & Paraprofessionals - Supplies & Equipment 94,000 45,490 48,510 48.40% 94,000 74,771 99,853
Library and Guidance - - - - - - -
Workshops 56,738 24,250 32,488 42.70% 56,738 74,466 101,669
Subtotal Classroom 42,104,130$ 10,853,103$ 31,251,027$ 25.80% 40,797,583$ 41,541,446$ 38,899,682$
NON CLASSROOM
Consultants - Salaries & Benefits 1,030,990 248,315 782,675 24.10% 971,635 1,008,226 857,104
Consultants - Supplies & Services 48,333 10,563 37,770 21.90% 48,333 51,930 62,168
Subtotal Consultants 1,079,323$ 258,878$ 820,445$ 24.00% 1,019,968$ 1,060,156$ 919,272$
Total Special Education 43,183,453$ 11,111,981$ 32,071,472$ 25.70% 41,817,551$ 42,601,602$ 39,818,955$
Z:\5 - Financial reporting\Budget Estimates\20152016 Estimates\Revised Estimates\Board Report\2015-2016 Revised Budget Estimates with November 2015 actuals 2015-12-11

Halton Catholic District School BoardBoard Administration Expenditures
2015-16 Revised Estimates
Appendix A-5
2015/16 2015-16 2015-16 2015-16 2014-15 2013-14Revised Expenses and OriginalBudget Commitments Remaining Pct Budget Actuals Actuals
Estimates Nov.30/15 Balance Spent Estimates(in PSAB Format) (in PSAB Format) (in PSAB Format) (in PSAB Format) (in PSAB Format) (in PSAB Format)
Governance /Trustees 216,280$ 34,391$ 181,889$ 15.90% 216,280$ 168,765$ 166,303$
Directors and Supervisory Officers Salaries & Benefits 1,615,640 393,672 1,221,968 24.40% 1,608,710 1,620,499 1,926,697 Supplies and Services 121,200 39,304 81,896 32.40% 129,200 117,196 116,170 Furniture & Equipment 12,700 1,375 11,325 10.80% 13,700 1,154 14,628 Other Expenditures 19,000 1,091 17,909 5.70% 19,000 14,603 13,399 Subtotal Directors and Supervisory Officers 1,768,540$ 435,441$ 1,333,099$ 24.60% 1,770,610$ 1,753,451$ 2,070,895$
Business and General Administration Salaries & Benefits 3,155,530 713,777 2,441,753 22.60% 3,051,205 2,849,263 3,074,495 Supplies and Services 396,529 128,312 268,217 32.40% 277,900 149,458 153,668 Furniture & Equipment 79,452 58,331 21,121 73.40% 32,700 16,561 4,314 Fees & Contractual Services 510,300 70,948 439,352 13.90% 431,800 459,562 424,181 Other Expenditures 215,447 157,924 57,523 73.30% 173,350 167,165 249,239 Parent Engagement Expenses 37,992 2,521 35,471 6.60% 38,003 37,022 - Subtotal Business and General Administration 4,395,250$ 1,131,814$ 3,263,436$ 25.80% 4,004,958$ 3,679,030$ 3,905,898$
Human Resources Salaries & Benefits 1,455,370 311,072 1,144,298 21.40% 1,388,140 1,358,935 1,260,354 Supplies and Services 85,009 9,009 76,000 10.60% 85,009 68,799 78,438 Furniture & Equipment 9,500 - 9,500 0.00% 9,500 5,583 1,853 Fees & Contractual Services 265,919 84,841 181,078 31.90% 265,919 205,782 370,528 Other Expenditures 11,600 4,765 6,835 41.10% 11,600 3,539 4,313 Subtotal Human Resources 1,827,398$ 409,687$ 1,417,711$ 22.40% 1,760,168$ 1,642,639$ 1,715,487$
Information Technology Salaries & Benefits 577,660 79,742 497,918 13.80% 577,660 367,569 359,163 Supplies and Services 23,000 8,403 14,597 36.50% 23,000 29,635 23,116 Furniture & Equipment 15,500 3,450 12,050 22.30% 15,500 20,759 15,694 Other Expenditures 5,000 3,332 1,668 66.60% 5,000 4,444 2,615 Subtotal Information Technology 621,160$ 94,927$ 526,233$ 15.30% 621,160$ 422,407$ 400,589$
Bank Financing ChargesOperating interest and bank charges 155,000 15,835 139,165 10.20% 155,000 134,079 139,501 Subtotal Bank Financing Charges 155,000$ 15,835$ 139,165$ 10.20% 155,000$ 134,079$ 139,501$
Operations & MaintenanceUtilities 140,000 23,698 116,302 16.90% 140,000 135,052 130,121 Building repairs and maintenance 98,000 20,331 77,669 20.70% 98,000 120,536 86,535 Landscape and snow removal 35,000 4,468 30,532 12.80% 35,000 24,918 35,191 Fire/Security/Monitoring 3,000 112 2,888 3.70% 3,000 5,078 - Waste Disposal 3,000 - 3,000 0.00% 3,000 - - Contractual Services 65,000 14,311 50,689 22.00% 65,000 62,255 56,078 Subtotal Operations & Maintenance 344,000$ 63,062$ 280,938$ 18.30% 344,000$ 350,160$ 307,925$
Total Board Administration 9,327,628$ 2,185,157$ 7,142,471$ 23.40% 8,872,176$ 8,150,531$ 8,706,597$
Z:\5 - Financial reporting\Budget Estimates\20152016 Estimates\Revised Estimates\Board Report\2015-2016 Revised Budget Estimates with November 2015 actuals 2015-12-11

Halton Catholic District School BoardPupil Accommodations Expenditures
2015-16 Revised Estimates
Appendix A-6
2015/16 2015-16 2015-16 2015-16 2014-15 2013-14Revised Expenses and OriginalBudget Commitments Remaining Pct Budget Actuals Actuals
Estimates Nov.30/15 Balance Spent Estimates(in PSAB Format) (in PSAB Format) (in PSAB Format) (in PSAB Format) (in PSAB Format) (in PSAB Format)
School OperationsSalaries & Benefits 9,928,560 2,233,667 7,694,893 22.50% 10,364,200 10,068,356 10,006,952 Professional Development 10,400 2,897 7,503 27.90% 10,400 22,967 13,906 Community Use of Schools 408,367 36,541 371,826 8.90% 408,367 349,479 8,784 Utilities - Hydro 5,071,000 833,809 4,237,191 16.40% 5,071,000 4,507,695 4,315,619 Utilities - Natural Gas 840,000 74,652 765,348 8.90% 840,000 754,874 753,057 Utilities - Water & Sewer 660,000 110,327 549,673 16.70% 660,000 600,906 544,465 Maintenance - Supplies and Materials 985,000 224,338 760,662 22.80% 985,000 809,061 758,458 Travel and Mileage 89,000 13,165 75,835 14.80% 89,000 64,837 73,233 Custodial equipment repairs 125,000 45,136 79,864 36.10% 125,000 119,751 122,720 Creative playground equipment 30,000 2,350 27,650 7.80% 30,000 10,218 10,574 Telephone 19,500 3,454 16,046 17.70% 19,500 14,055 12,209 Plant Office 19,700 2,690 17,010 13.70% 19,700 10,518 7,404 School Maintenance Services 7,283,390 1,266,566 6,016,824 17.40% 7,054,000 6,707,975 6,473,833 Furniture & Equipment 157,000 470 156,530 0.30% 157,000 23,470 46,739 Professional Fees 461,000 78,348 382,652 17.00% 461,000 539,000 471,979 Contractual Services - Security, Fire, etc. 2,644,100 572,552 2,071,548 21.70% 2,644,100 2,326,931 1,759,043 Insurance 616,850 (95,070) 711,920 -15.40% 616,850 606,443 547,573 Portables Set-ups/Moving expenses 46,500 32,582 13,918 70.10% 46,500 395,932 210,109 Continuing Education/ALC operating costs 180,359 38,413 141,946 21.30% 265,759 208,275 266,136
Subtotal School Operations 29,575,726$ 5,476,887$ 24,098,839$ 18.50% 29,867,376$ 28,140,743$ 26,402,792$
New Pupil PlacesPortable Leases & Moving expenses 1,435,000 341,268 1,093,732 23.80% 1,435,000 784,322 928,853 Subtotal New Pupil Places 1,435,000$ 341,268$ 1,093,732$ 23.80% 1,435,000$ 784,322$ 928,853$
Debt ChargesDebt Charges-Permanent financing of NPF 47,375 - 47,375 0.00% 47,375 47,375 47,375 Subtotal Debt Charges 47,375$ -$ 47,375$ 0.00% 47,375$ 47,375$ 47,375$
Other Debenture PaymentsLEIP - Debenture Interest 245,770 - 245,770 0.00% 245,770 265,246 283,976 Turf Loan Interest - - - - - - - OSBFC Debenture Interest 5,129,118 1,904,542 3,224,576 37.10% 5,129,118 5,406,551 5,768,697 OFA Debenture Interest 4,721,729 2,510,419 2,211,310 53.20% 4,721,729 4,864,741 3,908,636 Subtotal Other Debenture Payments 10,096,617$ 4,414,961$ 5,681,656$ 43.70% 10,096,617$ 10,536,538$ 9,961,310$
Total Pupil Accommodations 41,154,718$ 10,233,115$ 30,921,603$ 24.90% 41,446,368$ 39,508,978$ 37,340,329$
Z:\5 - Financial reporting\Budget Estimates\20152016 Estimates\Revised Estimates\Board Report\2015-2016 Revised Budget Estimates with November 2015 actuals 2015-12-11
Halton Catholic District School BoardContinuing Education/Adult Learning Centre Expenditures
2015-16 Revised Estimates
Appendix A-7
2015/16 2015-16 2015-16 2015-16 2014-15 2013-14Revised Expenses and OriginalBudget Commitments Remaining Pct Budget Actuals Actuals
Estimates Nov.30/15 Balance Spent Estimates(in PSAB Format) (in PSAB Format) (in PSAB Format) (in PSAB Format) (in PSAB Format) (in PSAB Format)
Continuing Education
Salaries & Benefits 4,790,322 1,033,771 3,756,551 21.60% 5,018,483 5,224,601 5,183,095 Supplies and Services 257,614 48,964 208,650 19.00% 213,719 190,614 179,449 Furniture & Equipment 17,000 2,090 14,910 12.30% 17,000 11,945 52,060 Fees & Contractual Services 25,200 6,820 18,380 27.10% 25,200 39,094 62,653 ALC Leases/Rentals 879,694 228,162 651,532 25.90% 879,690 852,776 836,418
Total Continuing Education 5,969,830$ 1,319,806$ 4,650,024$ 22.10% 6,154,092$ 6,319,030$ 6,313,676$
Z:\5 - Financial reporting\Budget Estimates\20152016 Estimates\Revised Estimates\Board Report\2015-2016 Revised Budget Estimates with November 2015 actuals 2015-12-11

Halton Catholic District School BoardTransportation Expenditures
2015-16 Revised Estimates
Appendix A-8
2015/16 2015-16 2015-16 2015-16 2014-15 2013-14Revised Expenses and OriginalBudget Commitments Remaining Pct Budget Actuals Actuals
Estimates Nov.30/15 Balance Spent Estimates(in PSAB Format) (in PSAB Format) (in PSAB Format) (in PSAB Format) (in PSAB Format) (in PSAB Format)
Transportation - General
Salaries & Benefits 379,665 94,916 284,749 25.00% 376,474 360,708 301,870 Supplies and Services 58,286 14,572 43,715 25.00% 57,241 26,613 29,599 Furniture & Equipment 8,153 2,038 6,115 25.00% 8,084 10,668 4,807 Fees & Contractual Services 129,538 32,385 97,154 25.00% 124,611 104,869 97,761
Subtotal Transportation - General 575,642 143,911 431,732 25.00% 566,410 502,858 434,037
Transportation - Home to School 6,395,111 1,598,778 4,796,333 25.00% 6,527,888 6,244,143 5,835,205
Total Transportation 6,970,753$ 1,742,688$ 5,228,065$ 25.00% 7,094,298$ 6,747,001$ 6,269,242$
Z:\5 - Financial reporting\Budget Estimates\20152016 Estimates\Revised Estimates\Board Report\2015-2016 Revised Budget Estimates with November 2015 actuals 2015-12-11

Halton Catholic District School BoardOther Provincial Grants
2015-16 Revised Estimates
Appendix A-9
Grant Description 2015/16 2015-16 2015-16Revised Actual OriginalBudget Nov.30/15 Budget
Estimates EstimatesA.Prkacin - EPOLibrary Staffing Grant 124,925 87,448 124,925 Physical Activity - Christ The King 1,717 Outdoor Education 309,594 French As A Second Language 96,913 58,148 First Nation/Metis/Inuit Education 63,268 Early Leadership Strategy 95,130 47,540 95,130 E-Learning 105,000 105,000 Student Work Study 120,000 84,000 120,000 Collaborative Inquiry In Math 90,000 63,000 90,000 Network-School In The Middle 25,000 25,000 25,000 Network-Schools Helping Schl 130,500 96,350 130,500
1,162,047 461,486 690,555 B. Browne - EPOAutism Support And Training 49,333 34,533 49,333 Learning For All 41,513 34,017 24,988 Board Leadership Development Strategy (BLDS) 51,789
142,635 68,550 74,321 C. McGillicuddy - EPOSpecialist Highskills Major (SHSM) Special Funding 63,696 63,696 Collaborative Inquiry For Instructional Impact 29,414 20,590 Math And Literacy (Gains) 58,829 41,180 Differentiated Instruction (D.I) 29,414 20,590 117,657 S.S.Schls & Cross Panel Teams 27,647 19,353 27,647 Re-Engagement 12 & 12+ 4,479 4,479 Enrolment Reporting Initiative 62,656 27,201
276,135 133,393 209,000 L.Naar-EPOTeacher Learning & Leadership Program-Mahler 43,883 31,316 Teacher Learning & Leadership Program-Ramirez 19,228 12,105
63,111 43,421 - T. Pinelli - EPOSafe, Equitable And Inclusive Schools 89,981 62,986 89,981
89,981 62,986 89,981 P. McMahon - EPOTechnology And Learning Fund (CODE) 563,369 563,369 563,369
563,369 563,369 563,369 T. Overholt - EPOParents Reaching Out (PRO) 36,379 36,378 Parents Reaching Out - Regional 15,000
51,379 36,378 - J. OHara - EPOTransitional Support-MOU 80,473 80,473
80,473 80,473 - G. Corbaccio - EPOOutreach Coordinator 73,600 46,000 73,600
73,600 46,000 73,600 P.Dawson - EPOM.I.S.A - P.N.C. 230,000 M.I.S.A - LOCAL 46,071 32,250 46,071
46,071 32,250 276,071
Sub-total 2,548,801$ 1,528,306$ 1,976,897$
O.Y.A.P GRANT 107,056 92,529 LBS Grants 98,900 32,965 98,900 Province Of Ontario-Citizenship-Estimated 934,080 900,000 PBLA 1X FUNDING 21,186 21,186 Province Of Ontario-Citizenship-One Time Funding 11,212 11,212 Sub-total 1,172,434$ 65,363$ 1,091,429$
Total Other Provincial Grants per A-1 3,721,235$ 1,593,669$ 3,068,326$
Z:\5 - Financial reporting\Budget Estimates\20152016 Estimates\Revised Estimates\Board Report\2015-2016 Revised Budget Estimates with November 2015 actuals
Halton Catholic District School BoardSummary of Expenses by Expense Type
2015-16 Revised Budget Estimates
Appendix B
2015-16 Revised Budget Estimates
% of total budget
$ increase (from Original to
Revised)
% increase (from
Original to Revised)
2015-16 Original Estimates
% of total budget 2014-15 Actuals
% of total budget 2013-14 Actuals
% of total budget
244,759,752 74.1% 2,685,372 1.1% 242,074,380 74.7% 235,521,943 74.3% 225,684,860 75.0%
40,957,114 12.4% 2,093,770 5.4% 38,863,344 12.0% 41,107,146 13.0% 36,533,435 12.1%
285,716,866 86.5% 4,779,142 1.7% 280,937,724 86.7% 276,629,089 87.3% 262,218,295 87.1%
1,083,431 0.3% 172,535 18.9% 910,896 0.3% 762,284 0.2% 940,415 0.3%
26,694,993 8.1% 1,341,274 5.3% 25,353,719 7.8% 23,173,453 7.3% 21,958,388 7.3%
26,500 0.0% - 0.0% 26,500 0.0% 2,815 0.0% 13,501 0.0%
155,000 0.0% - 0.0% 155,000 0.0% 134,079 0.0% 139,500 0.0%
2,040,770 0.6% (30,806) -1.5% 2,071,576 0.6% 1,752,711 0.6% 1,741,364 0.6%
12,936,838 3.9% 10,372 0.1% 12,926,466 4.0% 12,643,350 4.0% 11,942,362 4.0%
860,573 0.3% 176,516 25.8% 684,057 0.2% 974,287 0.3% 1,247,896 0.4%
ALC Lease/Rentals 879,694 0.3% 4 0.0% 879,690 0.3% 852,775 0.3% 836,418 0.3%
Total Other Operating 44,677,799 13.5% 1,669,895 3.9% 43,007,904 13.3% 40,295,754 12.7% 38,819,844 12.9%
330,394,665 100.0% 6,449,037 2.0% 323,945,628 100.0% 316,924,843 100.0% 301,038,139 100.0%
47,375 0.5% - - 47,375 0.5% 47,375 0.4% 47,375 0.4%
Turf Loan Interest Payments 0.0% - - 0.0% - 0.0% - 0.0%
5,129,118 50.6% - 0.0% 5,129,118 50.6% 5,406,551 51.1% 5,768,697 54.5%
4,967,499 49.0% - 0.0% 4,967,499 49.0% 5,129,987 48.5% 4,192,613 39.6%10,143,992 100.0% - 0.0% 10,143,992 100.0% 10,583,913 100.0% 10,008,685 100.0%
PSAB Adjustments
12,500,000 45.2% - 0.0% 12,500,000 45.3% 11,957,624 3.8% 12,064,550 4.0%
15,781,799 57.0% 95,995 0.6% 15,685,804 56.9% 15,279,876 4.8% 12,756,112 4.2%
Increase in Employee Future Benefits (458,218) -1.7% - - (458,218) -1.7% (242,811) -0.9% (407,856) -1.7%(Decrease) in Accrued Interest on Debenture (149,942) -0.5% - 0.0% (149,942) -0.5% (125,387) -0.5% 201,616 0.8%
(608,160) -2.2% - 0.0% (608,160) -2.2% (368,198) -1.4% (206,240) -0.8%
Total PSAB Adjustments 27,673,639 100.0% 95,995 0.4% 27,577,644 100.0% 26,869,302 8.5% 24,614,422 8.2%
368,212,296$ 100.0% 6,545,032 1.8% 361,667,264$ 100.0% 354,378,058$ 100.0% 335,661,246$ 100.0%Total expenses
OSBFC Debenture Interest Payments
OFA Debenture Interest PaymentsTotal Capital
School Generated Funds
Amortization expenses
Debt Charges & Interest
Operating Interest
Rentals & Leases Fees & Contractuals (Appendix B-2) Other
Total Operating
Capital
OperatingSalary & Wages
Employee Benefits
Total Salaries and Benefits
Professional Development
Supplies & Services (Appendix B-1)
Replacement Furniture & Equipment
Z:\5 - Financial reporting\Budget Estimates\20152016 Estimates\Revised Estimates\Board Report\2015-2016 Revised Budget Estimates with November 2015 actuals

Halton Catholic District School Board Supplies and Services
2015-16 Revised Budget Estimates
Appendix B-1
2015-16 2015-16 2014-15 2013-14Revised Budget Budget Actual Actual
Description Estimates Estimates
Advertising 83,235$ 77,919$ 102,861$ 66,411$ Application Software 68,909 71,908 151,959 175,568 Asphalt/Concrete 300,000 300,000 170,993 168,723 Assoc. & Membership Fees-Board 5,000 5,000 3,672 3,536 Audio Visual Materials 100,500 113,900 102,008 135,248 Automobile Reimbursement 444,224 439,137 387,778 410,273 Copying Instructional 368,700 372,000 282,397 261,751 Convention/Conferences 15,000 - 1,295 Field Trips 1,012,956 315,462 757,998 638,435 Instructional Materials 2,337,590 2,252,872 1,493,650 1,299,682 Instructional Supplies 2,236,328 2,252,565 2,486,489 1,979,898 Library Books 314,061 230,070 300,114 314,704 Maintenance Supplies & Services * 7,561,225 7,372,177 7,035,141 6,526,087 Miscellaneous 59,839 44,920 74,645 74,472 Non-Capital Furniture & Equipment 1,703,186 1,578,939 2,607,579 2,294,369 Office Supplies & Services 260,685 129,917 273,342 251,512 Other Travel Expense 8,750 8,750 16,172 11,514 Other Strategic Communication 7,463 Periodicals 29,320 31,420 56,335 43,606 Plant Operations Supplies 995,000 995,000 824,895 769,081 Postage 24,300 19,447 38,796 42,182 Printing & Photocopying 308,279 349,734 317,034 456,301 Recruitment Of Staff 21,650 21,650 66,953 8,400 Repairs 306,025 285,774 306,632 250,780 SGF Reimbursements (1,983,375.0) (1,123,572.0) Telecommunications 453,087 453,558 550,167 505,000 Textbooks & Learning Materials 851,544 806,000 629,834 548,200 Utilities - Electricity 5,245,600 5,245,600 4,695,280 4,481,697 Utilities - Heating (Gas & Other) 870,000 870,000 774,064 772,572 Utilities - Water & Sewage 670,000 670,000 607,199 550,375 Vehicle Maintenance & Supplies 40,000 40,000 34,083 41,583
26,694,993$ 25,353,719$ 23,173,453$ 21,958,388$
*Including heating & cooling maintenance costs of $1.7M, snow removal costs of $1.3M, general & ground repairs of $1.5M, and electrical repairs and maintenance of $1.0M
Halton Catholic District School BoardFees and Contractual Expenses
2015-16 Revised Estimates
Appendix B-2
2015-16 2015-16 2014-15 2013-14Revised Budget Budget Actual Actual
Description Estimates Estimates
Audit Fees 70,541$ 65,487$ 97,330$ 67,130$ Legal Fees 249,279 249,234 282,001 231,325 Other Professional Fees* 611,324 581,734 679,264 609,560 Other Contractual Services** 1,427,553 1,303,782 1,355,698 1,514,426 Contractual Custodial Services 2,167,143 2,177,138 2,166,391 1,600,271 Contractual-Waste Disposal 270,000 270,000 145,196 194,033 Transportation 6,524,649 6,652,499 6,349,012 5,932,966 Temporary Assistance 49,550 34,950 118,014 94,748 Courier 139,300 131,300 102,401 101,512 Software Fees & Licenses 682,119 716,842 725,900 992,070 Hardware Maintenance 105,000 105,000 51,935 Insurance 640,380 638,500 622,143 552,386
12,936,838$ 12,926,466$ 12,643,350$ 11,942,362$
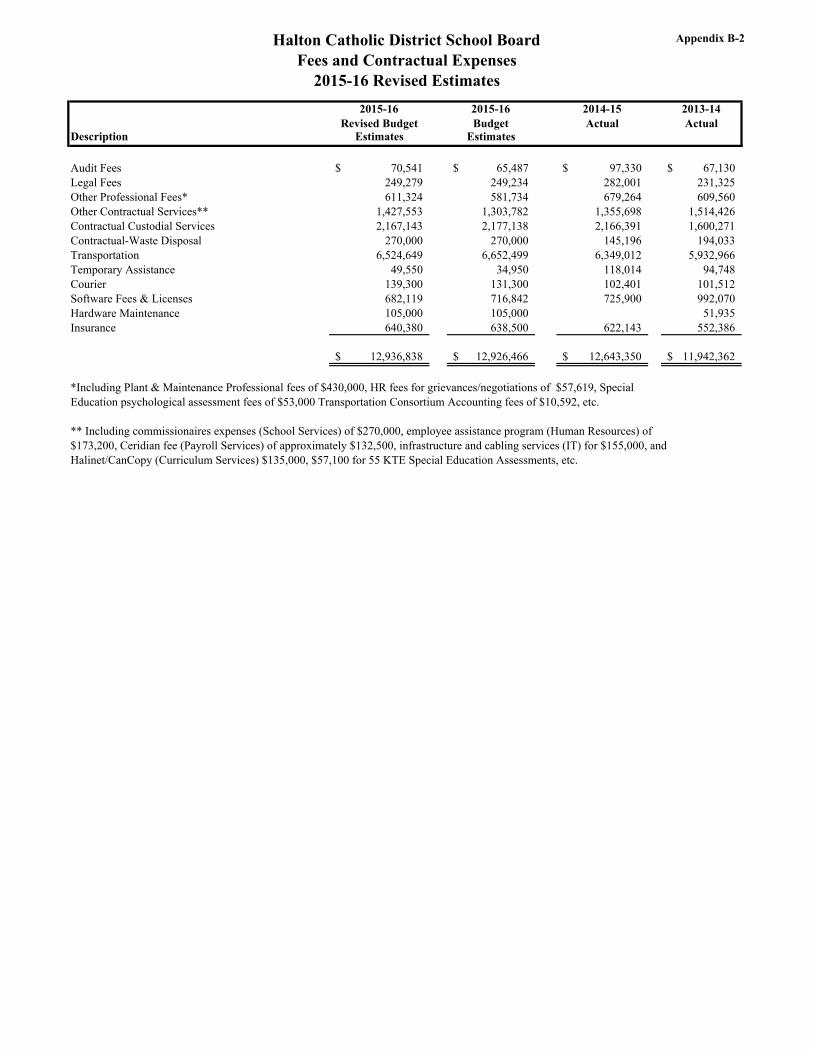
*Including Plant & Maintenance Professional fees of $430,000, HR fees for grievances/negotiations of $57,619, Special Education psychological assessment fees of $53,000 Transportation Consortium Accounting fees of $10,592, etc.
** Including commissionaires expenses (School Services) of $270,000, employee assistance program (Human Resources) of$173,200, Ceridian fee (Payroll Services) of approximately $132,500, infrastructure and cabling services (IT) for $155,000, andHalinet/CanCopy (Curriculum Services) $135,000, $57,100 for 55 KTE Special Education Assessments, etc.
Halton Catholic District School BoardAverage Daily Enrolment (ADE)
2015-16 Revised Estimates
Appendix C
Actual Projected 2015-16 Projected Projected 2015-16 2014-15 2013-14FTE FTE Revised % FTE FTE Original % Actual % Actual %
Oct 31/15 Mar 31/16 ADE Change Oct 31/15 Mar 31/16 ADE Change ADE Change ADE ChangeJK 2,062.00 2,070.00 2,066.00 2.1% 2,022.00 2,026.00 2,024.00 0.0% 2,086.50 112.2% 983.50 7.8%SK 2,206.00 2,212.00 2,209.00 -2.8% 2,267.00 2,280.00 2,273.50 11.0% 2,195.50 111.8% 1,036.75 6.7%Gr. 1 to 3 6,714.00 6,740.00 6,727.00 -1.8% 6,840.00 6,863.00 6,851.50 7.4% 6,512.50 4.4% 6,237.00 3.0%Gr. 4 to Gr. 8 10,959.00 10,981.00 10,970.00 -0.1% 10,965.00 10,986.00 10,975.50 0.4% 10,935.50 2.2% 10,701.50 1.7%
Elementary Day School Enrolment 21,941.00 22,003.00 21,972.00 -0.7% 22,094.00 22,155.00 22,124.50 3.4% 21,730.00 14.6% 18,958.75 2.7%
Secondary Day School Enrolment 10,499.15 10,165.87 10,332.51 0.8% 10,412.88 10,081.33 10,247.11 3.5% 9,905.23 -0.2% 9,922.86 -0.8%
Total Day School ADE 32,440.15 32,168.87 32,304.51 -0.2% 32,506.88 32,236.33 32,371.61 3.5% 31,635.23 9.5% 28,881.61 1.5%
Notes: ADE - Average Daily Enrolment FTE - Full Time Equivalent Average Daily Enrolment (ADE) is based on 50% of March 31 FTE plus 50% Oct 31 FTE % change equals the increase (decrease) in ADE from the prior year, or prior cycle
2015-16 REVISED ESTIMATES 2015-16 ORIGINAL ESTIMATES

Halton Catholic District School Board Capital Budget
2015-16 Revised Budget Estimates
Appendix D
TotalExpenses Estimated
Capital Budget
St. Francis FDK Addition 1,290,000 15,000 15,000
Holy Rosary (M) Addition 5,075,000 2,537,500 2,537,500
FDK Playground Equipment 750,000 750,000 750,000
Remaining FDK Projects 1,000,000 -
School Improvement Projects 6,126,000 6,126,000 6,126,000
Other capital projects / playgrounds 190,000 2,618 187,382 190,000
TOTAL 14,431,000 - 2,618 3,302,500 6,126,000 - 187,382 9,618,500
Funding Sources
Capital Priorities NPP
School Condition
ImprovementProceeds of Disposition Other
Total Funding
Full Day Kindergarte
n
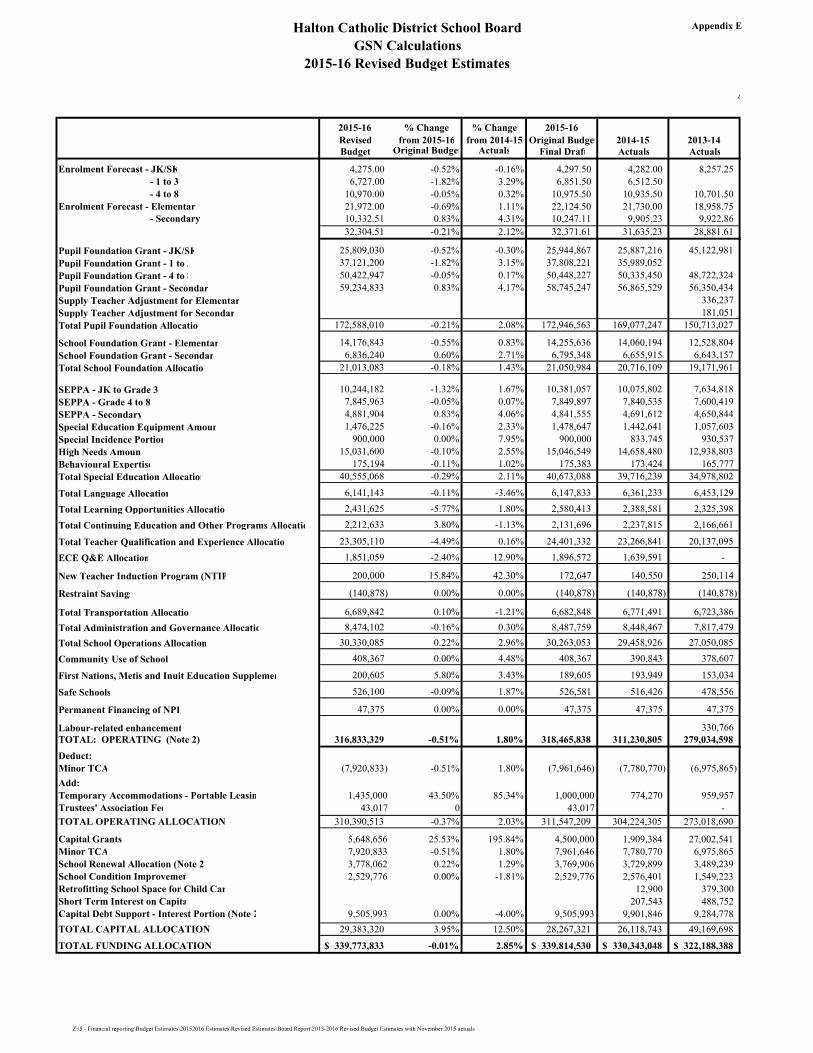
Halton Catholic District School BoardGSN Calculations
2015-16 Revised Budget Estimates
Appendix E
A
2015-16 % Change % Change 2015-16Revised from 2015-16 from 2014-15 Original Budget 2014-15 2013-14Budget Original Budget Actuals Final Draft Actuals Actuals
Enrolment Forecast - JK/SK 4,275.00 -0.52% -0.16% 4,297.50 4,282.00 8,257.25 - 1 to 3 6,727.00 -1.82% 3.29% 6,851.50 6,512.50 - 4 to 8 10,970.00 -0.05% 0.32% 10,975.50 10,935.50 10,701.50 Enrolment Forecast - Elementary 21,972.00 -0.69% 1.11% 22,124.50 21,730.00 18,958.75 - Secondary 10,332.51 0.83% 4.31% 10,247.11 9,905.23 9,922.86
32,304.51 -0.21% 2.12% 32,371.61 31,635.23 28,881.61
Pupil Foundation Grant - JK/SK 25,809,030 -0.52% -0.30% 25,944,867 25,887,216 45,122,981 Pupil Foundation Grant - 1 to 3 37,121,200 -1.82% 3.15% 37,808,221 35,989,052 Pupil Foundation Grant - 4 to 8 50,422,947 -0.05% 0.17% 50,448,227 50,335,450 48,722,324 Pupil Foundation Grant - Secondar 59,234,833 0.83% 4.17% 58,745,247 56,865,529 56,350,434 Supply Teacher Adjustment for Elementar 336,237 Supply Teacher Adjustment for Secondar 181,051 Total Pupil Foundation Allocation 172,588,010 -0.21% 2.08% 172,946,563 169,077,247 150,713,027
School Foundation Grant - Elementar 14,176,843 -0.55% 0.83% 14,255,636 14,060,194 12,528,804 School Foundation Grant - Secondar 6,836,240 0.60% 2.71% 6,795,348 6,655,915 6,643,157 Total School Foundation Allocation 21,013,083 -0.18% 1.43% 21,050,984 20,716,109 19,171,961
SEPPA - JK to Grade 3 10,244,182 -1.32% 1.67% 10,381,057 10,075,802 7,634,818 SEPPA - Grade 4 to 8 7,845,963 -0.05% 0.07% 7,849,897 7,840,535 7,600,419 SEPPA - Secondary 4,881,904 0.83% 4.06% 4,841,555 4,691,612 4,650,844 Special Education Equipment Amoun 1,476,225 -0.16% 2.33% 1,478,647 1,442,641 1,057,603 Special Incidence Portion 900,000 0.00% 7.95% 900,000 833,745 930,537 High Needs Amount 15,031,600 -0.10% 2.55% 15,046,549 14,658,480 12,938,803 Behavioural Expertise 175,194 -0.11% 1.02% 175,383 173,424 165,777 Total Special Education Allocation 40,555,068 -0.29% 2.11% 40,673,088 39,716,239 34,978,802
Total Language Allocation 6,141,143 -0.11% -3.46% 6,147,833 6,361,233 6,453,129
Total Learning Opportunities Allocatio 2,431,625 -5.77% 1.80% 2,580,413 2,388,581 2,325,398
Total Continuing Education and Other Programs Allocatio 2,212,633 3.80% -1.13% 2,131,696 2,237,815 2,166,661
Total Teacher Qualification and Experience Allocatio 23,305,110 -4.49% 0.16% 24,401,332 23,266,841 20,137,095
ECE Q&E Allocation 1,851,059 -2.40% 12.90% 1,896,572 1,639,591 -
New Teacher Induction Program (NTIP 200,000 15.84% 42.30% 172,647 140,550 250,114
Restraint Savings (140,878) 0.00% 0.00% (140,878) (140,878) (140,878)
Total Transportation Allocation 6,689,842 0.10% -1.21% 6,682,848 6,771,491 6,723,386 Total Administration and Governance Allocatio 8,474,102 -0.16% 0.30% 8,487,759 8,448,467 7,817,479 Total School Operations Allocation 30,330,085 0.22% 2.96% 30,263,053 29,458,926 27,050,085
Community Use of School 408,367 0.00% 4.48% 408,367 390,843 378,607
First Nations, Metis and Inuit Education Supplemen 200,605 5.80% 3.43% 189,605 193,949 153,034
Safe Schools 526,100 -0.09% 1.87% 526,581 516,426 478,556
Permanent Financing of NPF 47,375 0.00% 0.00% 47,375 47,375 47,375
Labour-related enhancement 330,766 TOTAL: OPERATING (Note 2) 316,833,329 -0.51% 1.80% 318,465,838 311,230,805 279,034,598
Deduct:Minor TCA (7,920,833) -0.51% 1.80% (7,961,646) (7,780,770) (6,975,865) Add:Temporary Accommodations - Portable Leasin 1,435,000 43.50% 85.34% 1,000,000 774,270 959,957 Trustees' Association Fee 43,017 0 43,017 - TOTAL OPERATING ALLOCATION 310,390,513 -0.37% 2.03% 311,547,209 304,224,305 273,018,690
Capital Grants 5,648,656 25.53% 195.84% 4,500,000 1,909,384 27,002,541 Minor TCA 7,920,833 -0.51% 1.80% 7,961,646 7,780,770 6,975,865 School Renewal Allocation (Note 2 3,778,062 0.22% 1.29% 3,769,906 3,729,899 3,489,239 School Condition Improvemen 2,529,776 0.00% -1.81% 2,529,776 2,576,401 1,549,223 Retrofitting School Space for Child Car 12,900 379,300 Short Term Interest on Capita 207,543 488,752 Capital Debt Support - Interest Portion (Note 2 9,505,993 0.00% -4.00% 9,505,993 9,901,846 9,284,778 TOTAL CAPITAL ALLOCATION 29,383,320 3.95% 12.50% 28,267,321 26,118,743 49,169,698
TOTAL FUNDING ALLOCATION 339,773,833$ -0.01% 2.85% 339,814,530$ 330,343,048$ 322,188,388$
Z:\5 - Financial reporting\Budget Estimates\20152016 Estimates\Revised Estimates\Board Report\2015-2016 Revised Budget Estimates with November 2015 actuals

Halton Catholic District School BoardOperating and Capital - Revenues and Expenditures
2015-16 Revised Budget Estimates
Appendix F
2015-16 Revised Budget
Estimates 2015-16 Budget
Estimates Changes RevenueProvince of Ontario- GSN & Municipal tax 327,583,893 328,540,742 (956,849) Other Provincial Grants 3,721,235 3,068,326 652,909 Other Operating (Note 1) 12,139,052 12,116,549 22,503 Amortization of Deferred Capital Contribution 14,130,784 14,093,304 37,480 School Generated Funds 12,500,000 12,500,000 -
Unavailable for Compliance Employee Future Benefits and Interest Accrual (608,160) (608,160) - Revenues Recognized for Land (7,000,000) (7,000,000) - Total Revenue 362,466,804$ 362,710,761$ (243,957)$ ExpendituresOperating Salary and Benefits (Note 2) 285,716,866 280,937,724 4,779,142 Other Operating Expenditures (Note 3) 44,677,799 43,007,904 1,669,895 Capital OSBFC Debenture Payments 5,176,493 5,176,493 - OFA Debenture Payments 4,967,499 4,967,499 -
PSAB Amortization Expense (Note 4) 15,781,799 15,685,804 95,995 School Generated Funds 12,500,000 12,500,000 - Employee Future Benefits and Interest Accrual (608,160) (608,160)
Total Expenses 368,212,296$ 361,667,264$ 6,545,032$
In-Year Surplus (Deficit) Available for Compliance - Unappropriated (4,967,519)$ 76,022$ (5,043,541)$
Surplus (Deficit) Available for Compliance (5,745,492)$ 1,043,497$ (6,788,989)$
Note 1. Represents changes in Other Revenues outlined in Appendix A-1 (decrease in Language Instruction for Newcomers to Canada (LINC) and increase in interest revenue, international students and Council of Directors of Education (CODE) funding.Note 2. Salary and benefits includes $3.8 million in OECTA memorandum of settlement changes to salaries, for which a corresponding revenue amount is expected from the Ministry, and has not been captured in Revised Estimates. The remaining portion relates mostly to increase in employee benefits, particularly insured benefit cost increase.
Note 3. Other operating expenditure includes mostly GSN & EPO related expenditure totaling $990K (including CODE, NTIP, central bargaining fee and enrolment reporting initiative), and 2014/15 school budget rollover of $365KNote 4. As we update the capital expenses, amortization expense is impacted. Higher capital expenses results in higher amortization expense.
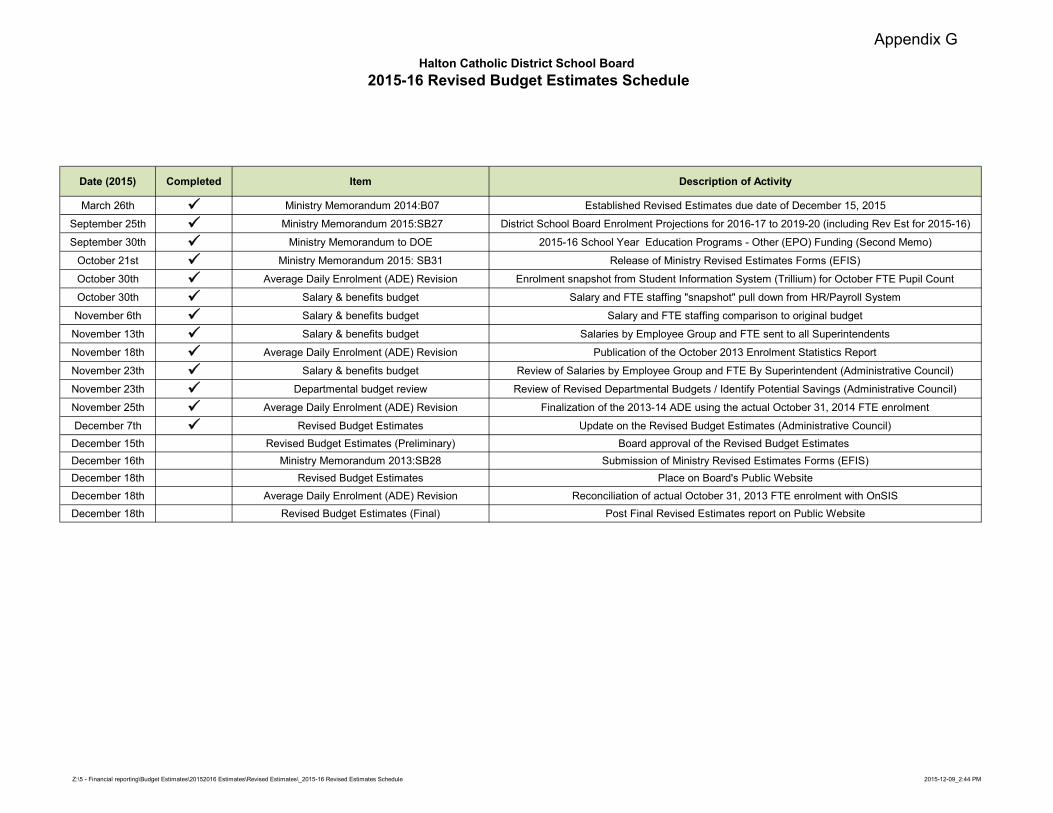
Halton Catholic District School Board 2015-16 Revised Budget Estimates Schedule
Date (2015) Completed Item Description of Activity
March 26th Ministry Memorandum 2014:B07 Established Revised Estimates due date of December 15, 2015
September 25th Ministry Memorandum 2015:SB27 District School Board Enrolment Projections for 2016-17 to 2019-20 (including Rev Est for 2015-16)
September 30th Ministry Memorandum to DOE 2015-16 School Year Education Programs - Other (EPO) Funding (Second Memo)
October 21st Ministry Memorandum 2015: SB31 Release of Ministry Revised Estimates Forms (EFIS)
October 30th Average Daily Enrolment (ADE) Revision Enrolment snapshot from Student Information System (Trillium) for October FTE Pupil Count
October 30th Salary & benefits budget Salary and FTE staffing "snapshot" pull down from HR/Payroll System
November 6th Salary & benefits budget Salary and FTE staffing comparison to original budget
November 13th Salary & benefits budget Salaries by Employee Group and FTE sent to all Superintendents
November 18th Average Daily Enrolment (ADE) Revision Publication of the October 2013 Enrolment Statistics Report
November 23th Salary & benefits budget Review of Salaries by Employee Group and FTE By Superintendent (Administrative Council)
November 23th Departmental budget review Review of Revised Departmental Budgets / Identify Potential Savings (Administrative Council)
November 25th Average Daily Enrolment (ADE) Revision Finalization of the 2013-14 ADE using the actual October 31, 2014 FTE enrolment
December 7th Revised Budget Estimates Update on the Revised Budget Estimates (Administrative Council)December 15th Revised Budget Estimates (Preliminary) Board approval of the Revised Budget Estimates December 16th Ministry Memorandum 2013:SB28 Submission of Ministry Revised Estimates Forms (EFIS)December 18th Revised Budget Estimates Place on Board's Public WebsiteDecember 18th Average Daily Enrolment (ADE) Revision Reconciliation of actual October 31, 2013 FTE enrolment with OnSIS December 18th Revised Budget Estimates (Final) Post Final Revised Estimates report on Public Website
Z:\5 - Financial reporting\Budget Estimates\20152016 Estimates\Revised Estimates\_2015-16 Revised Estimates Schedule 2015-12-09_2:44 PM
Appendix G