2015 1st Quarter Stats - Brian Buffini Real Estate Report
11
BRIAN BUFFINI’S REAL ESTATE REPORT 1ST QUARTER 2015
-
Upload
melissa-day -
Category
Real Estate
-
view
125 -
download
8
Transcript of 2015 1st Quarter Stats - Brian Buffini Real Estate Report
BRIAN BUFFINI’SREAL ESTATE REPORT
1ST QUARTER 2015
Melissa
Typewritten Text
Melissa
Typewritten Text
Provided by Melissa Day Helping clients stay educated about the current real estate market!
Melissa
Typewritten Text
Melissa
Typewritten Text
Melissa
Typewritten Text
Melissa
Typewritten Text
Melissa
Typewritten Text
Melissa
Typewritten Text
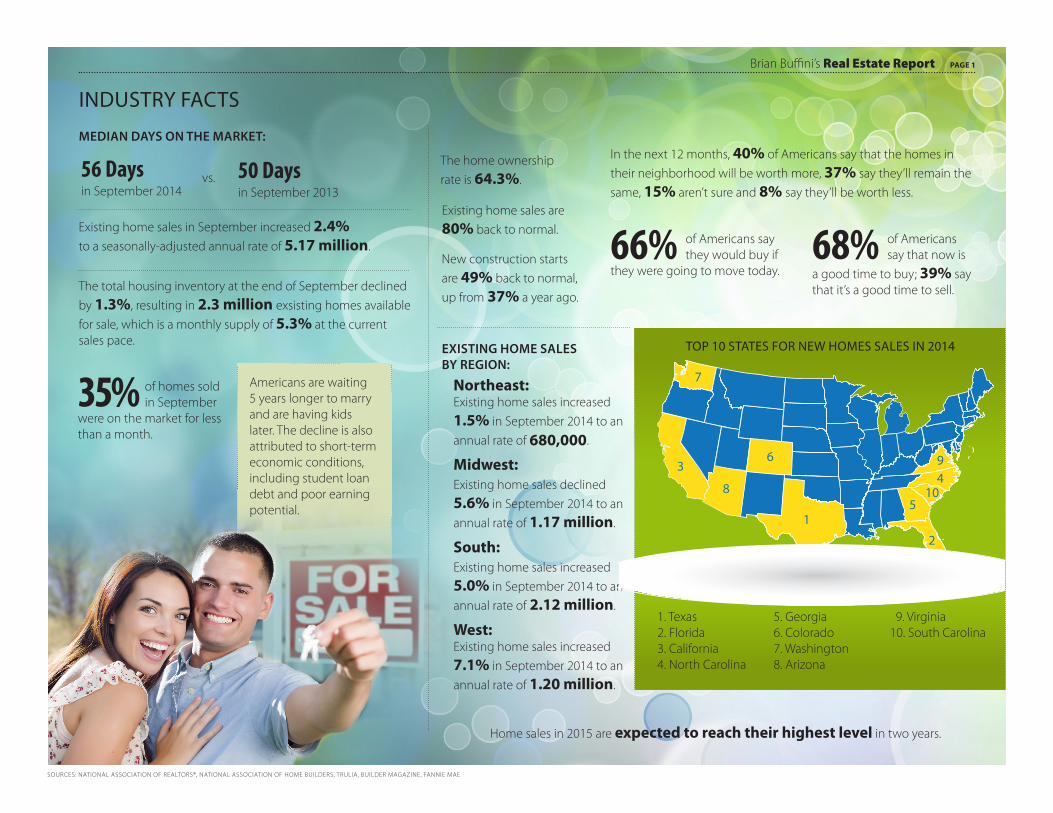
Existing home sales in September increased 2.4% to a seasonally-adjusted annual rate of 5.17 million.
Home sales in 2015 are expected to reach their highest level in two years.
The total housing inventory at the end of September declined by 1.3%, resulting in 2.3 million exsisting homes available for sale, which is a monthly supply of 5.3% at the current sales pace.
Existing home sales are 80% back to normal.
New construction starts are 49% back to normal, up from 37% a year ago.
In the next 12 months, 40% of Americans say that the homes in their neighborhood will be worth more, 37% say they’ll remain the same, 15% aren’t sure and 8% say they’ll be worth less.
66% of Americans say they would buy if
they were going to move today.68% of Americans
say that now is a good time to buy; 39% say that it’s a good time to sell.
Northeast: Existing home sales increased 1.5% in September 2014 to an annual rate of 680,000.
Midwest: Existing home sales declined 5.6% in September 2014 to an annual rate of 1.17 million.
South: Existing home sales increased 5.0% in September 2014 to an annual rate of 2.12 million.
West: Existing home sales increased 7.1% in September 2014 to an annual rate of 1.20 million.
1. Texas 2. Florida 3. California 4. North Carolina
5. Georgia 6. Colorado 7. Washington 8. Arizona
9. Virginia 10. South Carolina
SOURCES: NATIONAL ASSOCIATION OF REALTORS®, NATIONAL ASSOCIATION OF HOME BUILDERS, TRULIA, BUILDER MAGAZINE, FANNIE MAE
INDUSTRY FACTS
Brian Buffini’s Real Estate Report PAGE 1
MEDIAN DAYS ON THE MARKET:
EXISTING HOME SALES BY REGION:
56 Days in September 2014
50 Days in September 2013
35% of homes sold in September
were on the market for less than a month.
The home ownership rate is 64.3%.
7
3
8
6
15
2
1049
Americans are waiting 5 years longer to marry and are having kids later. The decline is also attributed to short-term economic conditions, including student loan debt and poor earning potential.
TOP 10 STATES FOR NEW HOMES SALES IN 2014
vs.
MORTGAGE STATS
Brian Buffini’s Real Estate Report PAGE 2
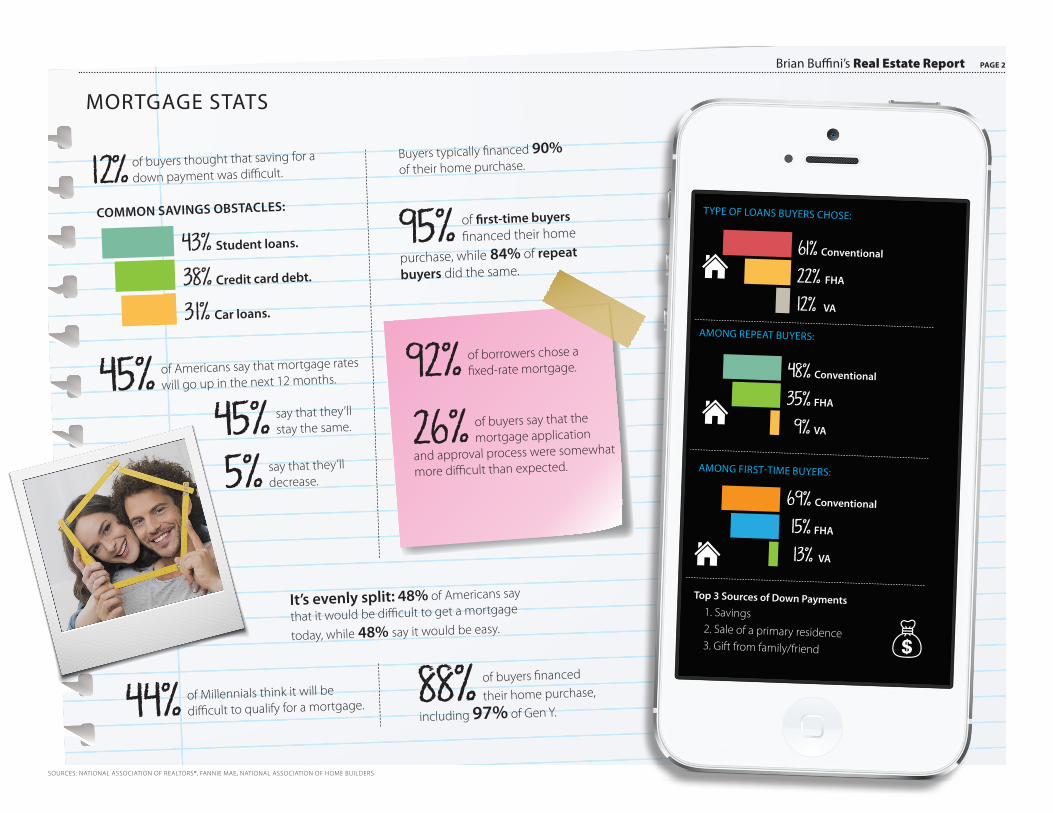
12% of buyers thought that saving for a
down payment was difficult.
95% of first-time buyers
financed their home
purchase, while 84% of repeat
buyers did the same.
Buyers typically financed 90% of their home purchase.
92% of borrowers chose a
fixed-rate mortgage.
43% Student loans.
38% Credit card debt.
31% Car loans.
26% of buyers say that the
mortgage application
and approval process were somewhat
more difficult than expected.
SOURCES: NATIONAL ASSOCIATION OF REALTORS®, FANNIE MAE, NATIONAL ASSOCIATION OF HOME BUILDERS
45% of Americans say that mortgage rates
will go up in the next 12 months.
45% say that they’ll stay the same.
5% say that they’ll decrease.
It’s evenly split: 48% of Americans say
that it would be difficult to get a mortgage
today, while 48% say it would be easy.
44% of Millennials think it will be
difficult to qualify for a mortgage. 88% of buyers financed
their home purchase,
including 97% of Gen Y.
TYPE OF LOANS BUYERS CHOSE:
61% Conventional
22% FHA
12% VA
AMONG FIRST-TIME BUYERS:
AMONG REPEAT BUYERS:
69% Conventional
15% FHA
13% VA
48% Conventional
35% FHA
9% VA
Top 3 Sources of Down Payments1. Savings2. Sale of a primary residence3. Gift from family/friend
COMMON SAVINGS OBSTACLES:
SOURCES: NATIONAL ASSOCIATION OF REALTORS®, BLOOMBERG, TRULIA, NATIONAL ASSOCIATION OF HOME BUILDERS, FANNIE MAE
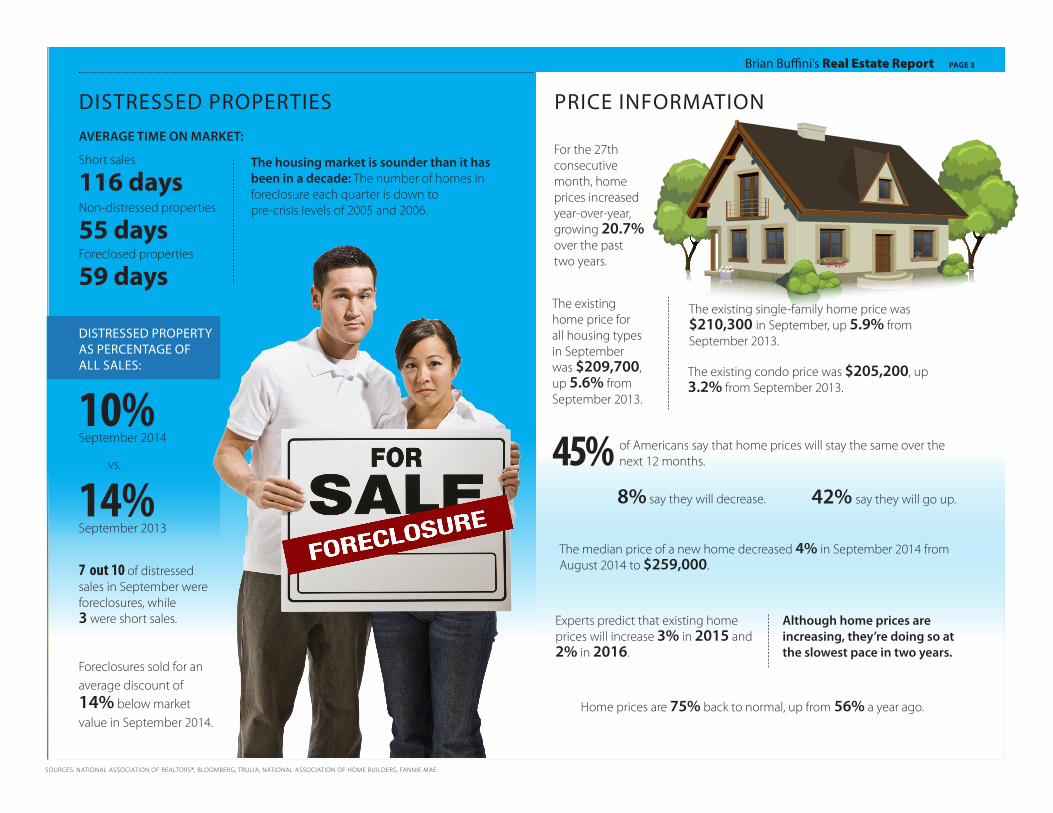
DISTRESSED PROPERTIESAVERAGE TIME ON MARKET:
Short sales
116 days
Foreclosed properties
59 days
Non-distressed properties
55 days
Foreclosures sold for an average discount of 14% below market value in September 2014.
The housing market is sounder than it has been in a decade: The number of homes in foreclosure each quarter is down to pre-crisis levels of 2005 and 2006.
DISTRESSED PROPERTY AS PERCENTAGE OF ALL SALES:
10% September 2014
vs.
14% September 2013
7 out 10 of distressed sales in September were foreclosures, while 3 were short sales.
For the 27th consecutive month, home prices increased year-over-year, growing 20.7% over the past two years.
The existing home price for all housing types in September was $209,700, up 5.6% from September 2013.
The existing condo price was $205,200, up 3.2% from September 2013.
45% of Americans say that home prices will stay the same over the next 12 months.
42% say they will go up. 8% say they will decrease.
The median price of a new home decreased 4% in September 2014 from August 2014 to $259,000.
Experts predict that existing home prices will increase 3% in 2015 and 2% in 2016.
Although home prices are increasing, they’re doing so at the slowest pace in two years.
Home prices are 75% back to normal, up from 56% a year ago.
PRICE INFORMATION
The existing single-family home price was $210,300 in September, up 5.9% from September 2013.
Brian Buffini’s Real Estate Report PAGE 3

SOURCE: NATIONAL ASSOCIATION OF REALTORS®, THINK WITH GOOGLE
TODAY’S BUYER
Brian Buffini’s Real Estate Report PAGE 4
GENERATIONAL TRENDS:
31% of buyers are Gen Y.
30% Gen X.
30% Baby Boomers.
9% Silent Generation.
All generations looked online for properties first before contacting a real estate agent; however, the younger the buyer, the more likely they were to look online.
Younger buyers are more likely to purchase an older or previously owned home, while Baby Boomers are more likely to buy a new home.
97% of buyers are satisfied
with their recent home purchase.
Half of buyers begin their formal home search 6 to 12 months before buying; 3/4 start a year ahead.
92% of buyers used the Internet in some
way during their home search, with 50% of buyers using a mobile website or application.
The median household income of buyers was $84,500. Among first-time buyers, it
was $68,300. Among repeat buyers, it
was $95,000.
24% of home buyers bought due to a desire to own a home.
9% purchased a home due to a job-related relocation.
8% purchased a home to be in a better area or due to a change in their family situation.
Buyers expect to live in their homes for 12 years.
Younger buyers prefer an agent to communicate via email and text, whereas older buyers prefer a phone call.
The typical buyer searched for 10 weeks and viewed 10 homes during their search.
26% of Gen Y and 22% of Gen X buyers
found the home they purchased through their mobile device.

SOURCES: NATIONAL ASSOCIATION OF REALTORS®, ZILLOW
FIRST-TIME HOME BUYER FACTS
Brian Buffini’s Real Estate Report PAGE 5
The median age of first-time buyers in 2013 was 31.
85% of experts predict, the median age of first-time home buyers will rise to 32 or older in the next decade.
76% of Gen Y are first-time home buyers.
41% Northeast
36% Midwest
29% of buyers in September 2014 were first-time
buyers. First-time buyers have made up less than 30% of all buyers in 17 of the past 18 months.
54% of first-time buyers were married.
18% were single females.
11% were single males.
15% were unmarried couples.
75% rented an apartment or house before buying a home.
19% lived with parents, relatives or friends.
FIRST-TIME HOME BUYERS (BY REGION):
30% South
32% West

SOURCES: NATIONAL ASSOCIATION OF REALTORS®
SELLER STATS & TRENDS
Brian Buffini’s Real Estate Report PAGE 6
Younger sellers are more likely to sell to upgrade to a larger home or for a job relocation. Older sellers want to downsize in retirement or to be closer to friends and family.
SELLERS UPGRADED:
13% of sellers wanted to sell their homes earlier but waited because their homes were worth less than the mortgage. This was most
common among 17% of Gen Y and 19% of Gen X sellers.
40% of sellers bought a home larger than their current one.
purchased a more expensive home.
47%
53% purchased a newer home.
Sellers lived in their homes for 10 years.This is up from 6 years in 2007.
36% of sellers offered incentives to attract
buyers, including home warranty policies and closing costs.
45% of sellers reduced
the initial asking price at least once.
Gen X comprised the largest share–29%–of home sellers, followed by older Baby Boomers (22%) and younger Baby Boomers (21%).
Sellers sold their homes for an average of 97% of the listing price.
SOURCES: BUILDER MAGAZINE, NATIONAL ASSOCIATION OF REALTORS®, NATIONAL ASSOCIATION OF HOME BUILDERS, U.S. CENSUS BUREAU, WALL STREET JOURNAL, FANNIE MAE
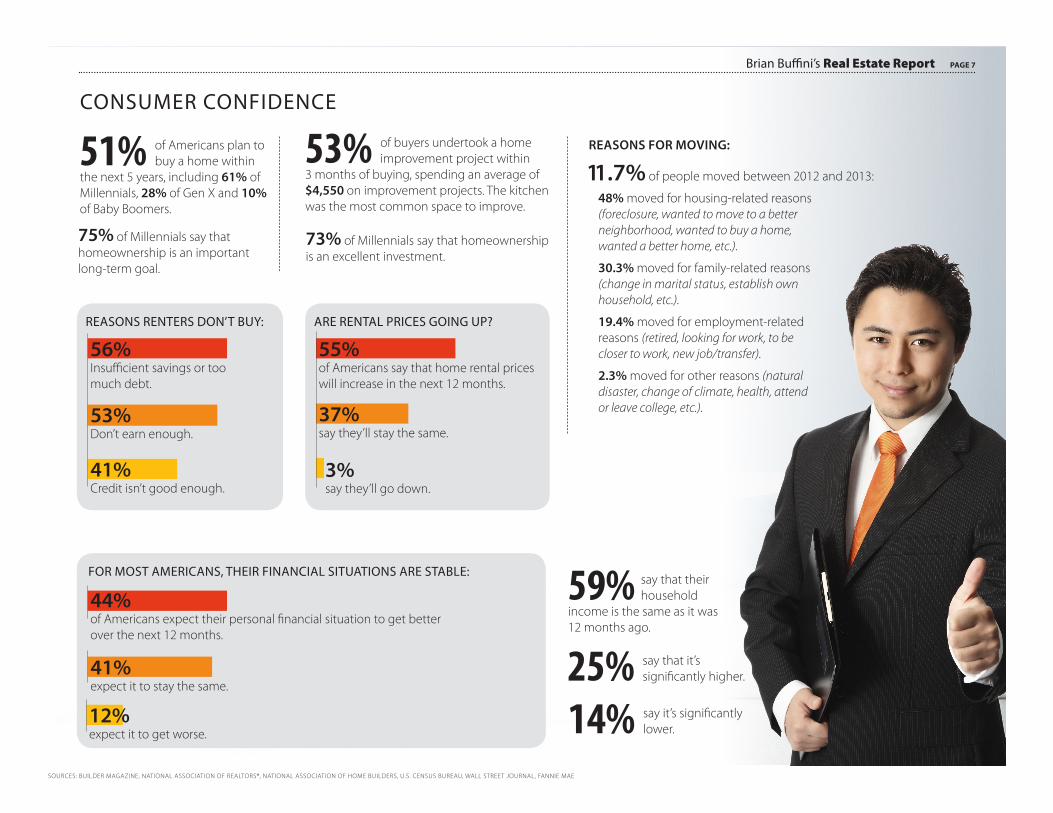
CONSUMER CONFIDENCE
Brian Buffini’s Real Estate Report PAGE 7
51% of Americans plan to buy a home within
the next 5 years, including 61% of Millennials, 28% of Gen X and 10% of Baby Boomers.
REASONS FOR MOVING:53% of buyers undertook a home improvement project within
3 months of buying, spending an average of $4,550 on improvement projects. The kitchen was the most common space to improve.
11.7% of people moved between 2012 and 2013:
48% moved for housing-related reasons (foreclosure, wanted to move to a better neighborhood, wanted to buy a home, wanted a better home, etc.).
30.3% moved for family-related reasons (change in marital status, establish own household, etc.).
19.4% moved for employment-related reasons (retired, looking for work, to be closer to work, new job/transfer).
2.3% moved for other reasons (natural disaster, change of climate, health, attend or leave college, etc.).
73% of Millennials say that homeownership is an excellent investment.
REASONS RENTERS DON’T BUY:
56% Insufficient savings or too much debt.
53% Don’t earn enough.
41% Credit isn’t good enough.
75% of Millennials say that homeownership is an important long-term goal.
ARE RENTAL PRICES GOING UP?
55% of Americans say that home rental prices will increase in the next 12 months.
37% say they’ll stay the same.
3% say they’ll go down.
FOR MOST AMERICANS, THEIR FINANCIAL SITUATIONS ARE STABLE:
44% of Americans expect their personal financial situation to get better over the next 12 months.
41% expect it to stay the same.
12% expect it to get worse.
59% say that their household
income is the same as it was 12 months ago.
25% say that it’s significantly higher.
14% say it’s significantly lower.

Brian Buffini’s Real Estate Report PAGE 10Brian Buffini’s Real Estate Report PAGE 8
BUYERS AND THE INTERNET
Google searches for real estate listings peak in July. This year, they reached their highest point since 2008.
People who search for real estate listings are 5 times more likely to search about planning for retirement and 4 times more likely to search about finding child care.
18-34 year olds were twice as likely as 35-54 year olds to say that they’re planning to buy a home in the next year.
83% of 18-34 year olds said that they would start their
formal home search more than 6 months in advance, compared to 73% of people older than 35.
Half of all Millennials visited real estate websites in July, 36% visited real estate websites or apps on mobile devices.
Millennials are twice as likely as the average person to look at real estate information on a mobile device.
House hunters used their mobile device most to search for listings and find directions while out looking for a home.
One-quarter of Google searches for mortgages have been on mobile devices, with “mortgage calculator” making up half of the searches.
SOURCE: THINK WITH GOOGLE
PEOPLE USE THEIR MOBILE DEVICE TO:
Search for listings.
Find directions to a home.
Look for more information on a listing.
Call or email an agent directly.
Watch video tours while out looking for a home.

TODAY’S REAL ESTATE PROFESSIONAL
Brian Buffini’s Real Estate Report PAGE 9
WHAT DO BUYERS WANT MOST FROM THEIR AGENTS?
53% Find the right home to purchase.
12% Negotiate the terms of sale.
11% Handle the price negotiations.
8% Determine what comparable homes were selling for.
6% Handle the paperwork.
WHAT DO SELLERS WANT MOST FROM THEIR AGENTS?
23% Market home to potential buyers.
20% Sell the home within specific time frame.
19% Price home competitively.
14% Find a buyer for home.
13% Find ways to fix up home to sell it for more.
THE MEDIAN NUMBER OF TRANSACTIONS BY EXPERIENCE:
2 years or less: 3 transactions.3 to 5 years: 10 transactions.6 to 15 years: 13 transactions.16 years or more: 15 transactions.
SOURCES: NATIONAL ASSOCIATION OF REALTORS®, BUFFINI & COMPANY, RISMEDIA
The average real estate professional has 12 years of experience.
61% of agents use social media or a professional
networking website.
82% of real estate professionals are “very certain” they’ll be
active in real estate in the next two years.
67% of agents have a website.
12% of agents have a real estate blog. Current Clients Past Clients Potential Clients
94% Email 68% Email 65% Email
90% Telephone 58% Telephone 58% Telephone
80% Text messaging 43% Postal mail 42% Postal mail
AGENT’S PREFERRED METHOD OF COMMUNICATION WITH:
AVERAGE TIME ON MARKET:
SOURCES: NATIONAL ASSOCIATION OF REALTORS®
WHY I WORK BY REFERRAL
Brian Buffini’s Real Estate Report PAGE 10
88% of buyers would use their agent
again or refer them to others.
Studies show that 82% of real estate sales are the result of agent contacts from previous clients, referrals, friends, family and personal clients.
RELATIONSHIPS ARE MORE IMPORTANT THAN TRANSACTIONS.
You may have noticed that many real estate agents take a transactional approach to sales—identifying clients, closing the deal, and then moving on to the next one. I choose not to work that way because I believe you deserve more from the professional you decide to work with. That’s why I work by referral.
Since my primary source of new business is referrals from people who know and trust me, I don’t have to spend time prospecting and promoting myself. I can dedicate myself fully to the activities that benefit you most and always deliver truly exceptional service.
Working by referral is all about trust. And, let’s face it, when we’re seeking a service, we look for someone we can trust – someone proven, who comes highly recommended and is already on our side.
YOU CONTROL MY BUSINESS.
I know that I must earn your future referrals, so I aim to exceed your expectations. I have a vested interest in making sure that you are completely satisfied at the end of our transaction together. I want you to be so “fired-up” that you can’t wait to tell your friends and family about me and the fantastic service you received!
When you come across an opportunity, I’d appreciate you referring me to great people like yourself, who would benefit from the excellent service and personal attention I provide.
SERVICE THAT CONTINUES AFTER THE SALE.
I devote myself to serving the needs of my clients before, during and after each sale. Instead of disappearing after the closing, you can expect me to keep in touch. I will send you valuable information each month, and will also call from time to time just to check in and see if you need anything.
Melissa
Typewritten Text
Melissa
Typewritten Text
I value my relationships and take my responsibility to helping my clients in this journey to home ownership seriously. Their trust is my gift! ~Melissa Day
Melissa
Typewritten Text