2015-16 FINANCIAL AUDITS - audit.act.gov.au · In 2015‐16, the Territory incurred a deficit in...
123
www.audit.act.gov.au ACT AUDITOR–GENERAL’S REPORT 2015-16 FINANCIAL AUDITS – FINANCIAL RESULTS AND AUDIT FINDINGS REPORT NO. 11 / 2016
Transcript of 2015-16 FINANCIAL AUDITS - audit.act.gov.au · In 2015‐16, the Territory incurred a deficit in...

www.audit.act.gov.au
ACT AUDITOR–GENERAL’S REPORT
2015-16 FINANCIAL AUDITS – FINANCIAL RESULTS AND AUDIT FINDINGS
REPORT NO. 11 / 2016

© Australian Capital Territory, Canberra 2016
ISSN 2204-700X (Print) ISSN 2204-7018 (Online)
This work is copyright. Apart from any use as permitted under the Copyright Act 1968, no part may be reproduced by any process without written permission from the Territory Records Office, Shared Services, Chief Minister, Treasury and Economic Development Directorate, ACT Government, GPO Box 158 Canberra City ACT 2601.
ACT Audit Office
The roles and responsibilities of the Auditor-General are set out in the Auditor-General Act 1996.
The Auditor-General is an Officer of the ACT Legislative Assembly.
ACT Audit Office undertakes audits on financial statements of Government agencies, and the Territory’s consolidated financial statements.
The Office also conducts performance audits, to examine whether a Government agency is carrying out its activities effectively and efficiently, and in compliance with relevant legislation.
ACT Audit Office acts independently of the Government, and reports the results of the audits directly to the ACT Legislative Assembly.
Accessibility Statement
ACT Audit Office is committed to making its information accessible to as many people as possible. If you have difficulty reading a standard printed document and would like to receive this publication in an alternative format, please telephone the Office on (02) 6207 0833.
If English is not your first language and you require the assistance of a Translating and Interpreting Service, please telephone Canberra Connect on 13 22 81.
If you are deaf or hearing impaired and require assistance, please telephone the National Relay Service on 13 36 77.
AUDIT TEAMAjay Sharma Amanda Kaur Bei Hu Benjamin Fradd Berk Canturk Bernie Sheville Chloe Woolf Chris Huang Christina Liang Connie Wong
David O’Toole Doug Johnson Ehmar Nazir Fran Djajaatmadja Hassan Abid James Ikuuro Jatin Singh Jingyue Zhong Khushmeet Suri Madara Kahawatta
Malcolm Prentice Michael De Souza Naveed Nisar Omer Farooq Pankaj Jain Philip Mini Rosario San Miguel Saidu Kamara Saman Mahaarachchi Samina Khatoon
Stephanie Croft Tim Larnach Vanessa Ramsamy Wenxin Zeng Xiaoping Zhu
The support of Axiom Associates Pty Ltd, Cumpston Sarjeant Pty Limited, Ernst & Young, KPMG and PricewaterhouseCoopers (PwC) is appreciated. Acknowledgement is also made to the Head of Service, Directors-General, Chief Executive Officers and all who provided assistance.
Produced for the ACT Audit Office by Publishing Services, Shared Services, Chief Minister, Treasury and Economic Development Directorate, ACT Government
Publication No. 16/1560
ACT Government Homepage address is: http://www.act.gov.au

PA 16/19
The Speaker
ACT Legislative Assembly
Civic Square, London Circuit
CANBERRA ACT 2601
Dear Madam Speaker
I am pleased to forward to you an audit report titled ‘2015‐16 Financial Audits ‐ Financial Results
and Audit Findings’ for tabling in the Legislative Assembly pursuant to Subsection 17(5) of the
Auditor‐General Act 1996.
Yours sincerely
Dr Maxine Cooper
Auditor‐General
21 December 2016

2015‐16 Financial Audits – Financial Results and Audit Findings Page i
CONTENTS
Summary ................................................................................................................................... 1
Conclusions ............................................................................................................................... 2
Key findings .............................................................................................................................. 3
1 The Territory’s financial statements ................................................................................. 7
Conclusion ................................................................................................................................ 7
Key findings .............................................................................................................................. 8
Operating results .................................................................................................................... 12
Long‐term financial position ................................................................................................... 16
2 Audit findings ..................................................................................................................23
Conclusion .............................................................................................................................. 23
Key findings ............................................................................................................................ 23
Status of audit findings ........................................................................................................... 24
3 Financial results and audit findings of selected reporting agencies ..................................25
ACT Insurance Authority ......................................................................................................... 25
ACT Local Hospital Network Directorate ................................................................................ 29
ActewAGL Joint Venture ......................................................................................................... 32
ACTION ................................................................................................................................... 38
Canberra Institute of Technology ........................................................................................... 41
Capital Metro Agency ............................................................................................................. 44
Chief Minister, Treasury and Economic Development Directorate ....................................... 46
Community Services Directorate ............................................................................................ 54
Education Directorate ............................................................................................................ 58
Environment and Planning Directorate .................................................................................. 63
Health Directorate .................................................................................................................. 67
Housing ACT ............................................................................................................................ 72
Icon Water Limited ................................................................................................................. 76
Justice and Community Safety Directorate ............................................................................ 80
Land Development Agency ..................................................................................................... 86
Superannuation Provision Account ........................................................................................ 90
Territory and Municipal Services Directorate ........................................................................ 97
University of Canberra .......................................................................................................... 103
Appendix A: Key terms ....................................................................................................... 111
Appendix B: Agencies included in the Territory’s financial statements ................................ 115

2015‐16 Financial Audits – Financial Results and Audit Findings Page 1
SUMMARY
Understanding the financial statements of the Australian Capital Territory Government
(the Territory) is important as these provide essential information to the ACT Legislative Assembly
and community about the Territory’s financial performance and the state of its finances.
The Territory’s financial statements can be used to provide an indication of the financial
sustainability of the ACT Government’s strategies and policies, particularly when assessed over
time as well as providing information about the Territory’s capacity to meet its financial
obligations.
The inclusion of current year, budget and prior year information in the Territory’s financial
statements shows whether budgeted estimates were achieved and whether the Territory’s
finances are improving or declining.
The ACT Government’s Budget Papers include the budget estimates for the period from 2016‐17
to 2019‐20 (the forward years). These provide an indication of the Territory’s estimated future
financial performance and the state of its finances.
This report contains a discussion of the Territory’s financial results for the year ended
30 June 2016. It also includes details on the progress made by reporting agencies in resolving
audit findings and an overview of the financial results and audit findings for selected reporting
agencies.
This is the second of three audit reports on the 2015‐16 financial audits. The first audit report
‘2015‐16 Financial Audits – Audit Reports’ (Report No. 10/2016) was tabled on 7 December 2016.
The third report will be on ‘Computer Information Systems’.
Appendix A contains explanations of key terms used in this report.
Summary
Page 2 2015‐16 Financial Audits – Financial Results and Audit Findings
Conclusions
THE TERRITORY’S FINANCIAL STATEMENTS
An unqualified audit report was issued on the Territory’s 2015‐16 Consolidated Annual Financial
Statements, indicating that the financial statements present a true and fair view of the Territory’s
financial position and results of operations.
The ACT Government achieved its budgeted operating results for 2015‐16 with the deficit in the
net operating balance and operating deficit being less than budgeted. However, as expenses
exceeded revenue, the Territory incurred an operating deficit as it has done in each of the
previous four years.
Deficits are budgeted for the next two years until 2018‐19 and 2019‐20, where a small surplus is
forecast. However, as expenses are estimated to exceed revenue in 2018‐19 and 2019‐20, the
projected surplus includes forecast gains from investments which depend on conditions in
investment markets.
Past deficits and estimated future deficits mean that the costs of providing public services exceed
revenue. These deficits will eventually have to be paid for in the future by higher revenue (for
example, by increases in Commonwealth Government grants, land sales and taxes) and/or
reductions in costs (for example, through efficiencies or reducing public services).
At 30 June 2016, the Territory had the capacity to meet its liabilities. However, net assets were
much lower than anticipated in the budget due to large increases in the unfunded
superannuation liability, which accounts for over half of the Territory’s total liabilities. While the
ACT Government predicts that its ability to cover its liabilities will increase from 2016‐17 to
2019‐20, this depends on a large decrease in the unfunded superannuation liability. The
ACT Government has advised that ‘for the expected reduction in the unfunded superannuation
liability to occur, interest rates would need to return to around their long‐term level with a
resultant decrease in the superannuation liability’.
At 30 June 2016, the Territory had a strong capacity to pay its liabilities that were due within
12 months. The Territory is expected to retain a strong capacity to pay its liabilities due within
12 months, although net short‐term assets of $1 147 million at 30 June 2016 are estimated to
reduce to $760 million by 30 June 2020.
AUDIT FINDINGS
As audit findings have decreased in the last four years, this indicates that governance
arrangements, internal controls and reporting practices of reporting agencies have steadily
improved with reporting agencies implementing effective arrangements for addressing audit
findings.

Summary
2015‐16 Financial Audits – Financial Results and Audit Findings Page 3
Key findings
THE TERRITORY’S FINANCIAL STATEMENTS Paragraph
In 2015‐16, the Territory incurred a deficit in its net operating balance of $373 million and an operating deficit of $371 million as the cost of services provided by the ACT Government ($5 486 million) exceeded revenue ($5 113 million) by $373 million (7.3 percent).
1.7
The deficit in the net operating balance ($373 million) in 2015‐16 was lower than the budgeted deficit ($649 million) by $276 million (42.5 percent) due largely to higher than anticipated revenue ($242 million or 5.0 percent) as land revenue exceeded the budget estimate by $93 million (30.0 percent), taxation revenue by $82 million (5.6 percent), revenue from joint ventures by $40 million (59.7 percent) and sales of goods and services by $28 million (3.4 percent).
1.8
The operating deficit ($371 million) was less than budgeted ($391 million) by $20 million (5.1 percent) as the lower than expected deficit in the net operating balance was largely countered by lower than estimated gains from investments (recorded in other economic flows) as conditions in investment markets resulted in a lower return than estimated in the budget.
1.9
The deficit in the net operating balance in 2015‐16 ($373 million) decreased from the deficit incurred in 2014‐15 ($646 million) by $273 million (42.3 percent) due to an increase in revenue of $270 million (5.6 percent).
1.10
The increase in revenue of $270 million (5.6 percent) resulted from higher:
taxation revenue of $197 million (14.7 percent) with significant increases in payroll tax ($65 million or 18.8 percent), duties mainly from residential and property sales ($57 million or 21.1 percent) and general rates ($45 million or 12.4 percent); and
land sales (value‐added component) of $157 million (64.9 percent) due to an increase in land settlements.
1.11
These were partially offset by a decrease in Commonwealth grants of $107 million (5.4 percent) as the Territory received:
a smaller share of the National GST revenue pool from the Commonwealth Government; and
funding from the Commonwealth Government early (in 2014‐15) for road infrastructure maintenance costs.
The operating deficit incurred in 2015‐16 ($371 million) decreased by $44 million (10.6 percent) from the deficit incurred in 2014‐15 ($415 million) due to increased revenue ($270 million or 5.6 percent). This was partially offset by a large reduction in other economic inflows ($229 million or 99.1 percent) as conditions in investment markets resulted in a lower return than estimated in the budget.
1.12

Summary
Page 4 2015‐16 Financial Audits – Financial Results and Audit Findings
The deficit in the operating balance ($373 million) and operating deficit ($371 million) incurred in 2015‐16 represents a continuation of:
deficits in the operating balance which have ranged from $97 million to $646 million from 2011‐12 to 2014‐15; and
operating deficits ranging from $26 million to $415 million from 2011‐12 to 2014‐15;
1.13
as the Territory’s costs have not been managed to within revenue streams.
The ACT Government estimates that deficits in the net operating balance will decrease over the forward years from the deficit of $373 million incurred in 2015‐16 to a deficit of $205 million in 2019‐20. Achievement of these lower deficits is dependent on higher revenue, in particular, increases in taxation (general rates and payroll tax) and the ACT’s share of the National GST revenue pool from the Commonwealth Government.
1.14
Deficits in the net operating balance have been incurred since 2011‐12. The ACT Government estimates that deficits will continue over the forward years from 2016‐17 to 2019‐20 as the costs of providing public services exceed revenue. These past deficits and estimated future deficits cover a nine‐year period.
1.15
The ACT Government estimates that operating deficits will decline from the deficit of $371 million incurred in 2015‐16 to a deficit of $33 million in 2017‐18 before achieving small surpluses of $25 million in 2018‐19 and $35 million in 2019‐20.
1.16
Achievement of these projected (estimated) lower deficits and small surpluses depends on continued growth in revenue, constraining expenses to forecasted amounts and the generation of sufficient gains from investments to offset the continued estimated deficits in the net operating balance. As investment markets are volatile, the Territory’s exposure to more deficits remains high.
1.17
The Territory’s net assets at 30 June 2016 were less than budgeted. Net assets ($12 882 million) at 30 June 2016 were less than budgeted ($16 489 million) by $3 607 million (21.9 percent) due mainly to higher than estimated unfunded superannuation liability.
1.21
The unfunded superannuation liability ($7 330 million) exceeded the budget estimate ($2 518 million) by $4 812 million (191.1 percent) due mainly to the use of a lower rate to estimate the present value of the superannuation liability at 30 June 2016 compared to the long‐term rate used to prepare the budget estimate. A lower discount rate increases the estimated present value of the superannuation liability and the related expense. The long‐term rate is used in budget estimates to reduce short‐term volatility in liabilities.
1.22
The Territory’s net assets at 30 June 2016 were less than that at 30 June 2015 and at 30 June 2012.
1.24

Summary
2015‐16 Financial Audits – Financial Results and Audit Findings Page 5
Net assets ($12 882 million) at 30 June 2016 decreased by $1 792 million (12.2 percent) from that at 30 June 2015 ($14 674 million) due mainly to an increase in the unfunded superannuation liability of $2 117 million (14.4 percent).
1.25
The Territory’s net assets have decreased since 30 June 2012. Net assets have decreased by $1 210 million (8.6 percent or an average decrease of 2.1 percent) since 30 June 2012.
1.26
The decrease in net assets is due to a significant increase in:
the unfunded superannuation liability of $2 088 million (39.8 percent or an average annual increase 10.0 percent); and
borrowings of $1 550 million (79.0 percent or an average annual increase of 19.8 percent) to fund property, plant and equipment purchases (including land, buildings and infrastructure assets) as well as properties acquired under the Loose‐Fill Asbestos Insulation Eradication Scheme.
1.27
These were partially offset by an increase in assets of $3 944 million (17.5 percent or an average annual increase of 4.4 percent) from $22 582 million at 30 June 2012 to $26 526 million at 30 June 2016 from upward revaluations of property, plant and equipment and capital expenditure on property, plant and equipment (in particular, land, buildings and infrastructure assets) as well as the acquisition of properties in 2015‐16 as part of the Loose‐Fill Asbestos Insulation Eradication Scheme.
The Territory’s unfunded liabilities at 30 June 2016 ($11 214 million) exceeded the budgeted unfunded liabilities ($7 472 million) by $3 742 million (50.1 percent) due mainly to higher than estimated unfunded superannuation liability.
1.31
The Territory’s unfunded liabilities at 30 June 2016 exceeded that at 30 June 2015 and that at 30 June 2012.
1.32
Unfunded liabilities at 30 June 2016 ($11 214 million) increased by $2 584 million (29.9 percent) from that at 30 June 2015 ($8 630 million) due mainly to a large increase in the unfunded superannuation liability.
1.33
Unfunded liabilities at 30 June 2016 ($11 214 million) have grown by $4 462 million (66.1 percent or an average annual increase of 16.6 percent) since 30 June 2012 ($6 752 million) due mainly to an increase in:
the unfunded superannuation liability of $2 088 million (39.8 percent or an average annual increase 10.0 percent); and
borrowings of $1 550 million (79.0 percent or an average annual increase of 19.8 percent).
1.34
The increase in the unfunded superannuation liability is mainly due to the use of a lower discount rate to estimate the present value of the superannuation liability at 30 June 2016 compared to the rate which was used to estimate the liability at
1.35
Summary
Page 6 2015‐16 Financial Audits – Financial Results and Audit Findings
30 June 2015.
The estimated reduction in the unfunded superannuation liability of $4 627 million (an average annual decrease of $1 157 million or 15.9 percent) from $7 330 million at 30 June 2016 to $2 703 million at 30 June 2020 is due to the use of a higher discount rate in estimating this liability in the forward estimates compared to the rate used to estimate the liability at 30 June 2016.
1.38
For the expected reduction in unfunded liabilities to occur, there would need to be a substantial decrease in the superannuation liability. This projected decrease will not occur while the interest rate used to estimate the present value of the superannuation liability remains lower than the rate used to prepare the budget estimate. The ACT Government has advised that:
1.40
For the expected reduction in the unfunded superannuation liability to occur, interest rates would need to return to around their long‐term level with a resultant decrease in the superannuation liability.
The net short‐term assets of the Territory at 30 June 2016 exceeded that anticipated in the budget. The Territory’s net short‐term assets at 30 June 2016 ($1 147 million) exceeded the budget estimate ($238 million) by $909 million (381.9 percent).
1.42
The short‐term assets of the Territory at 30 June 2016 exceeded that at 30 June 2015 and have increased since 30 June 2012.
1.43
The Territory’s net short‐term assets at 30 June 2016 ($1 147 million) exceeded that at 30 June 2015 ($850 million) by $297 million (34.9 percent) and have increased since 30 June 2012 ($845 million) by $302 million (35.7 percent or an average annual increase of 8.9 percent).
1.44
The ACT Government estimates that net short‐term assets of $1 147 million at 30 June 2016 will reduce to $760 million by 30 June 2020.
1.45
AUDIT FINDINGS Paragraph
Audit findings have decreased from 292 at 30 June 2012 to 100 at 30 June 2016 as the number of audit findings resolved by reporting agencies have exceeded new audit findings. This indicates that:
there has been a steady improvement in internal controls, governance arrangements and reporting practices; and
most reporting agencies have implemented effective arrangements for addressing audit findings.
2.4
In 2015‐16, the number of audit findings resolved (57) exceeded the number of
new audit findings (47).
2.5

2015‐16 Financial Audits – Financial Results and Audit Findings Page 7
1 THE TERRITORY’S FINANCIAL STATEMENTS
1.1 This chapter considers the Australian Capital Territory Government’s (the Territory’s)
consolidated financial statements and estimated future financial results over the period
from 2016‐17 to 2019‐20.
1.2 The Territory’s financial statements include the financial results of ACT Government
directorates, authorities and companies that are controlled by the Territory as well as the
Territory’s share of the financial results of joint ventures, such as the ActewAGL joint
venture and land joint ventures. These are listed in Appendix B.
1.3 This chapter provides a summary of the Territory’s:
key operating results, namely the net operating balance and operating surplus/deficit
because they provide an indication of the financial sustainability of the
ACT Government’s strategies and policies, particularly when assessed over time;
long‐term financial position as shown by net assets position and unfunded liabilities
position as these provide an indication of the Territory’s capacity to meet its financial
obligations over the long‐term; and
short‐term financial position, as represented by the net short‐term assets position as
this provides an indication of the Territory’s capacity to meet its financial obligations
over the short term.
Conclusion
An unqualified audit report was issued on the Territory’s 2015‐16 Consolidated Annual Financial
Statements, indicating that the financial statements present a true and fair view of the Territory’s
financial position and results of operations.
The ACT Government achieved its budgeted operating results for 2015‐16 with the deficit in the
net operating balance and operating deficit being less than budgeted. However, as expenses
exceeded revenue, the Territory incurred an operating deficit as it has done in each of the
previous four years.
Deficits are budgeted for the next two years until 2018‐19 and 2019‐20, where a small surplus is
forecast. However, as expenses are estimated to exceed revenue in 2018‐19 and 2019‐20, the
projected surplus includes forecast gains from investments which depend on conditions in
investment markets.
Past deficits and estimated future deficits mean that the costs of providing public services exceed
revenue. These deficits will eventually have to be paid for in the future by higher revenue (for
example, by increases in Commonwealth Government grants, land sales and taxes) and/or
reductions in costs (for example, through efficiencies or reducing public services).

1: The Territory’s financial statements
Page 8 2015‐16 Financial Audits – Financial Results and Audit Findings
At 30 June 2016, the Territory had the capacity to meet its liabilities. However, net assets were
much lower than anticipated in the budget due to large increases in the unfunded superannuation
liability, which accounts for over half of the Territory’s total liabilities. While the ACT Government
predicts that its ability to cover its liabilities will increase from 2016‐17 to 2019‐20, this depends
on a large decrease in the unfunded superannuation liability. The ACT Government has advised
that ‘for the expected reduction in the unfunded superannuation liability to occur, interest rates
would need to return to around their long‐term level with a resultant decrease in the
superannuation liability’.
At 30 June 2016, the Territory had a strong capacity to pay its liabilities that were due within
12 months. The Territory is expected to retain a strong capacity to pay its liabilities due within
12 months, although net short‐term assets of $1 147 million at 30 June 2016 are estimated to
reduce to $760 million by 30 June 2020.
Key findings Paragraph
In 2015‐16, the Territory incurred a deficit in its net operating balance of
$373 million and an operating deficit of $371 million as the cost of services
provided by the ACT Government ($5 486 million) exceeded revenue
($5 113 million) by $373 million (7.3 percent).
1.7
The deficit in the net operating balance ($373 million) in 2015‐16 was lower than
the budgeted deficit ($649 million) by $276 million (42.5 percent) due largely to
higher than anticipated revenue ($242 million or 5.0 percent) as land revenue
exceeded the budget estimate by $93 million (30.0 percent), taxation revenue by
$82 million (5.6 percent), revenue from joint ventures by $40 million (59.7 percent)
and sales of goods and services by $28 million (3.4 percent).
1.8
The operating deficit ($371 million) was less than budgeted ($391 million) by
$20 million (5.1 percent) as the lower than expected deficit in the net operating
balance was largely countered by lower than estimated gains from investments
(recorded in other economic flows) as conditions in investment markets resulted in
a lower return than estimated in the budget.
1.9
The deficit in the net operating balance in 2015‐16 ($373 million) decreased from
the deficit incurred in 2014‐15 ($646 million) by $273 million (42.3 percent) due to
an increase in revenue of $270 million (5.6 percent).
1.10
The increase in revenue of $270 million (5.6 percent) resulted from higher:
taxation revenue of $197 million (14.7 percent) with significant increases in payroll tax ($65 million or 18.8 percent), duties mainly from residential and property sales ($57 million or 21.1 percent) and
1.11

1: The Territory’s financial statements
2015‐16 Financial Audits – Financial Results and Audit Findings Page 9
general rates ($45 million or 12.4 percent); and
land sales (value‐added component) of $157 million (64.9 percent) due
to an increase in land settlements.
These were partially offset by a decrease in Commonwealth grants of $107 million (5.4 percent) as the Territory received:
a smaller share of the National GST revenue pool from the Commonwealth Government; and
funding from the Commonwealth Government early (in 2014‐15) for
road infrastructure maintenance costs.
The operating deficit incurred in 2015‐16 ($371 million) decreased by $44 million
(10.6 percent) from the deficit incurred in 2014‐15 ($415 million) due to increased
revenue ($270 million or 5.6 percent). This was partially offset by a large reduction
in other economic inflows ($229 million or 99.1 percent) as conditions in
investment markets resulted in a lower return than estimated in the budget.
1.12
The deficit in the operating balance ($373 million) and operating deficit ($371 million) incurred in 2015‐16 represents a continuation of:
deficits in the operating balance which have ranged from $97 million to $646 million from 2011‐12 to 2014‐15; and
operating deficits ranging from $26 million to $415 million from
2011‐12 to 2014‐15;
1.13
as the Territory’s costs have not been managed to within revenue streams.
The ACT Government estimates that deficits in the net operating balance will
decrease over the forward years from the deficit of $373 million incurred in
2015‐16 to a deficit of $205 million in 2019‐20. Achievement of these lower deficits
is dependent on higher revenue, in particular, increases in taxation (general rates
and payroll tax) and the ACT’s share of the National GST revenue pool from the
Commonwealth Government.
1.14
Deficits in the net operating balance have been incurred since 2011‐12. The
ACT Government estimates that deficits will continue over the forward years from
2016‐17 to 2019‐20 as the costs of providing public services exceed revenue. These
past deficits and estimated future deficits cover a nine‐year period.
1.15
The ACT Government estimates that operating deficits will decline from the deficit
of $371 million incurred in 2015‐16 to a deficit of $33 million in 2017‐18 before
achieving small surpluses of $25 million in 2018‐19 and $35 million in 2019‐20.
1.16
Achievement of these projected (estimated) lower deficits and small surpluses
depends on continued growth in revenue, constraining expenses to forecasted
1.17

1: The Territory’s financial statements
Page 10 2015‐16 Financial Audits – Financial Results and Audit Findings
amounts and the generation of sufficient gains from investments to offset the
continued estimated deficits in the net operating balance. As investment markets
are volatile, the Territory’s exposure to more deficits remains high.
The Territory’s net assets at 30 June 2016 were less than budgeted. Net assets
($12 882 million) at 30 June 2016 were less than budgeted ($16 489 million) by
$3 607 million (21.9 percent) due mainly to higher than estimated unfunded
superannuation liability.
1.21
The unfunded superannuation liability ($7 330 million) exceeded the budget
estimate ($2 518 million) by $4 812 million (191.1 percent) due mainly to the use of
a lower rate to estimate the present value of the superannuation liability at
30 June 2016 compared to the long‐term rate used to prepare the budget estimate.
A lower discount rate increases the estimated present value of the superannuation
liability and the related expense. The long‐term rate is used in budget estimates to
reduce short‐term volatility in liabilities.
1.22
The Territory’s net assets at 30 June 2016 were less than that at 30 June 2015 and
at 30 June 2012.
1.24
Net assets ($12 882 million) at 30 June 2016 decreased by $1 792 million
(12.2 percent) from that at 30 June 2015 ($14 674 million) due mainly to an
increase in the unfunded superannuation liability of $2 117 million (14.4 percent).
1.25
The Territory’s net assets have decreased since 30 June 2012. Net assets have
decreased by $1 210 million (8.6 percent or an average decrease of 2.1 percent)
since 30 June 2012.
1.26
The decrease in net assets is due to a significant increase in:
the unfunded superannuation liability of $2 088 million (39.8 percent or an average annual increase 10.0 percent); and
borrowings of $1 550 million (79.0 percent or an average annual
increase of 19.8 percent) to fund property, plant and equipment
purchases (including land, buildings and infrastructure assets) as well
as properties acquired under the Loose‐Fill Asbestos Insulation
Eradication Scheme.
1.27
These were partially offset by an increase in assets of $3 944 million (17.5 percent
or an average annual increase of 4.4 percent) from $22 582 million at 30 June 2012
to $26 526 million at 30 June 2016 from upward revaluations of property, plant and
equipment and capital expenditure on property, plant and equipment (in
particular, land, buildings and infrastructure assets) as well as the acquisition of
properties in 2015‐16 as part of the Loose‐Fill Asbestos Insulation Eradication

1: The Territory’s financial statements
2015‐16 Financial Audits – Financial Results and Audit Findings Page 11
Scheme.
The Territory’s unfunded liabilities at 30 June 2016 ($11 214 million) exceeded the
budgeted unfunded liabilities ($7 472 million) by $3 742 million (50.1 percent) due
mainly to higher than estimated unfunded superannuation liability.
1.31
The Territory’s unfunded liabilities at 30 June 2016 exceeded that at 30 June 2015
and that at 30 June 2012.
1.32
Unfunded liabilities at 30 June 2016 ($11 214 million) increased by $2 584 million
(29.9 percent) from that at 30 June 2015 ($8 630 million) due mainly to a large
increase in the unfunded superannuation liability.
1.33
Unfunded liabilities at 30 June 2016 ($11 214 million) have grown by $4 462 million (66.1 percent or an average annual increase of 16.6 percent) since 30 June 2012 ($6 752 million) due mainly to an increase in:
the unfunded superannuation liability of $2 088 million (39.8 percent or an average annual increase 10.0 percent); and
borrowings of $1 550 million (79.0 percent or an average annual
increase of 19.8 percent).
1.34
The increase in the unfunded superannuation liability is mainly due to the use of a
lower discount rate to estimate the present value of the superannuation liability at
30 June 2016 compared to the rate which was used to estimate the liability at
30 June 2015.
1.35
The estimated reduction in the unfunded superannuation liability of $4 627 million
(an average annual decrease of $1 157 million or 15.9 percent) from $7 330 million
at 30 June 2016 to $2 703 million at 30 June 2020 is due to the use of a higher
discount rate in estimating this liability in the forward estimates compared to the
rate used to estimate the liability at 30 June 2016.
1.38
For the expected reduction in unfunded liabilities to occur, there would need to be
a substantial decrease in the superannuation liability. This projected decrease will
not occur while the interest rate used to estimate the present value of the
superannuation liability remains lower than the rate used to prepare the budget
estimate. The ACT Government has advised that:
1.40
For the expected reduction in the unfunded superannuation liability to occur, interest rates would need to return to around their long‐term level with a resultant decrease in the superannuation liability.
The net short‐term assets of the Territory at 30 June 2016 exceeded that
anticipated in the budget. The Territory’s net short‐term assets at 30 June 2016
1.42

1: The Territory’s financial statements
Page 12 2015‐16 Financial Audits – Financial Results and Audit Findings
($1 147 million) exceeded the budget estimate ($238 million) by $909 million
(381.9 percent).
The short‐term assets of the Territory at 30 June 2016 exceeded that at
30 June 2015 and have increased since 30 June 2012.
1.43
The Territory’s net short‐term assets at 30 June 2016 ($1 147 million) exceeded
that at 30 June 2015 ($850 million) by $297 million (34.9 percent) and have
increased since 30 June 2012 ($845 million) by $302 million (35.7 percent or an
average annual increase of 8.9 percent).
1.44
The ACT Government estimates that net short‐term assets of $1 147 million at
30 June 2016 will reduce to $760 million by 30 June 2020.
1.45
Operating results
Table 1‐1 Operating results
Actual
2011‐12 $m
Actual 2012‐13
$m
Actual 2013‐14
$m
Actual 2014‐15
$m
Actual 2015‐16
$m
Budget 2015‐16
$m
Revenue 4 261 4 321 4 537 4 843 5 113 4 871
Expenses (4 358) (4 777) (4 846) (5 489) (5 486) (5 520)
Net operating balance (deficit) (97) (456) (309) (646) (373)
(649)
Other economic (outflows)/inflows
(58)
334
283
231
2
258
Operating deficit (155) (122) (26) (415) (371) (391)
1.4 The Territory’s main sources of revenue are Commonwealth Government grants, taxation,
sales of goods and services and land sales (value‐added component1). Its major expenses
include employee and operational costs, grants and depreciation.
1.5 The net operating balance is a key measure of the Territory’s financial performance and is
the difference between revenue and expenses.
1 The value‐added component of land sales is that part of land revenue attributed to development activity undertaken on the land that has contributed to an increase in the value of the land. In the Territory’s financial statements, the value‐added component is recorded in revenue.

1: The Territory’s financial statements
2015‐16 Financial Audits – Financial Results and Audit Findings Page 13
1.6 The operating surplus/deficit is the sum of the net operating balance and other economic
flows. Other economic flows mainly comprise gains/losses on investments and land
revenue2. These gains/losses mostly reflect changes in market conditions that affect the
value of investments and land.
2015‐16 operating results
1.7 In 2015‐16, the Territory incurred a deficit in its net operating balance of $373 million and
an operating deficit of $371 million as the cost of services provided by the
ACT Government ($5 486 million) exceeded revenue ($5 113 million) by $373 million
(7.3 percent).
2015‐16 operating results compared to budget estimates
Net operating balance
1.8 The deficit in the net operating balance ($373 million) in 2015‐16 was lower than the
budgeted deficit ($649 million) by $276 million (42.5 percent) due largely to higher than
anticipated revenue ($242 million or 5.0 percent) as land revenue exceeded the budget
estimate by $93 million (30.0 percent), taxation revenue by $82 million (5.6 percent),
revenue from joint ventures by $40 million (59.7 percent) and sales of goods and services
by $28 million (3.4 percent).
Operating deficit/surplus
1.9 The operating deficit ($371 million) was less than budgeted ($391 million) by $20 million
(5.1 percent) as the lower than expected deficit in the net operating balance was largely
countered by lower than estimated gains from investments (recorded in other economic
flows) as conditions in investment markets resulted in a lower return than estimated in
the budget.
2015‐16 operating results compared to prior year results
1.10 The deficit in the net operating balance in 2015‐16 ($373 million) decreased from the
deficit incurred in 2014‐15 ($646 million) by $273 million (42.3 percent) due to an increase
in revenue of $270 million (5.6 percent).
1.11 The increase in revenue of $270 million (5.6 percent) resulted from higher:
taxation revenue of $197 million (14.7 percent) with significant increases in payroll
tax ($65 million or 18.8 percent), duties mainly from residential and property sales
($57 million or 21.1 percent) and general rates ($45 million or 12.4 percent); and
land sales (value‐added component) of $157 million (64.9 percent) due to an increase
in land settlements.
2 Land revenue included in other economic flows is the combination of market gains on land sales and the undeveloped land value.

1: The Territory’s financial statements
Page 14 2015‐16 Financial Audits – Financial Results and Audit Findings
These were partially offset by a decrease in Commonwealth grants of $107 million
(5.4 percent) as the Territory received:
a smaller share of the National GST revenue pool from the Commonwealth
Government; and
funding from the Commonwealth Government early (in 2014‐15) for road
infrastructure maintenance costs.
1.12 The operating deficit incurred in 2015‐16 ($371 million) decreased by $44 million
(10.6 percent) from the deficit incurred in 2014‐15 ($415 million) due to increased
revenue ($270 million or 5.6 percent). This was partially offset by a large reduction in
other economic inflows ($229 million or 99.1 percent) as conditions in investment markets
resulted in a lower return than estimated in the budget.
1.13 The deficit in the operating balance ($373 million) and operating deficit ($371 million)
incurred in 2015‐16 represents a continuation of:
deficits in the operating balance which have ranged from $97 million to $646 million
from 2011‐12 to 2014‐15; and
operating deficits ranging from $26 million to $415 million from 2011‐12 to 2014‐15;
as the Territory’s costs have not been managed to within revenue streams.
Projected operating results
Table 1‐2 Projected operating results – Note 1
Actual
2015‐16 $m
Budget 2016‐17
$m
Estimate 2017‐18
$m
Estimate 2018‐19
$m
Estimate 2019‐20
$m
Revenue 5 113 5 384 5 527 5 750 6 030
Expenses (5 486) (5 756) (5 762) (5 930) (6 235)
Net operating balance ‐ (deficit) (373) (372) (235) (180) (205)
Other economic inflows 2 257 202 205 240
Operating (deficit)/surplus (371) (115) (33) 25 35
Note 1: Budget and forward estimates were obtained from the 2016‐17 Budget Papers.
1.14 The ACT Government estimates that deficits in the net operating balance will decrease
over the forward years from the deficit of $373 million incurred in 2015‐16 to a deficit of
$205 million in 2019‐20. Achievement of these lower deficits is dependent on higher
revenue, in particular, increases in taxation (general rates and payroll tax) and the ACT’s
share of the National GST revenue pool from the Commonwealth Government.

1: The Territory’s financial statements
2015‐16 Financial Audits – Financial Results and Audit Findings Page 15
1.15 Deficits in the net operating balance have been incurred since 2011‐12. The
ACT Government estimates that deficits will continue over the forward years from
2016‐17 to 2019‐20 as the costs of providing public services exceed revenue. These past
deficits and estimated future deficits cover a nine‐year period.
1.16 The ACT Government estimates that operating deficits will decline from the deficit of
$371 million incurred in 2015‐16 to a deficit of $33 million in 2017‐18 before achieving
small surpluses of $25 million in 2018‐19 and $35 million in 2019‐20.
1.17 Achievement of these projected (estimated) lower deficits and small surpluses depends on
continued growth in revenue, constraining expenses to forecasted amounts and the
generation of sufficient gains from investments to offset the continued estimated deficits
in the net operating balance. As investment markets are volatile, the Territory’s exposure
to more deficits remains high.
1.18 The ACT Government has advised that:
The Headline Net Operating Balance includes an adjustment for long‐term expected
superannuation investment earnings (consistent with the long‐term expected return objective
of the Consumer Price Index plus five percentage points). This adjustment is made because the
Government does not operate a superannuation fund for employees and, under the
Government Finance Statistics reporting framework, capital growth on financial assets is not
included as transactional revenue in the net operating balance. Applying the Government
Finance Statistics approach understates the expected investment revenue, which includes
interest, dividends, distributions and capital growth, and therefore overstates the net
superannuation expense related to the superannuation liability. The inclusion of the full
amount of the long‐term investment earnings provides an accurate assessment of the longer‐
term sustainability of the budget position.
The budget forward estimates do not attempt to forecast expected total portfolio investment
returns. Due to the volatile nature of global investment markets, investment earnings
recognised in any particular year will vary from the annual budget estimates.
Over the past twenty years the Superannuation Provision Account investment portfolio has
achieved an annualised investment return of Consumer Price Index plus five percent which is
in line with the long‐term target investment return objective.
1.19 The Headline Net Operating Balance is not disclosed in the Territory’s financial statements
and is therefore not discussed in this report. The above advice does not affect the analysis
of the Territory’s financial statements.

1: The Territory’s financial statements
Page 16 2015‐16 Financial Audits – Financial Results and Audit Findings
Long‐term financial position
Net assets
Table 1‐3 Net assets
At 30 June Actual 2012 $m
Actual 2013 $m
Actual 2014 $m
Actual 2015 $m
Actual 2016 $m
Budget 2016 $m
Assets
Financial assets ‐ Note 1 2 008 2 256 2 034 2 253 2 430 1 454
Property, plant and equipment 18 808 20 085 20 381 20 894 21 464 21 455
Other non‐financial assets ‐ Note 2 2 036 1 715 1 893 2 410 2 632 2 506
Total assets 22 582 24 056 24 308 25 557 26 526 25 415
Liabilities
Borrowings 1 961 2 744 3 085 3 148 3 511 3 827
Unfunded superannuation ‐ Note 3 5 242 4 276 4 471 5 213 7 330 2 518
Payables and finance leases 882 773 765 1 445 1 714 1 752
Employee benefits and other provisions 655 702 784 1 055 1 080 813
Other 20 10 10 22 9 16
Total liabilities 8 760 8 505 9 115 10 883 13 644 8 926
Net assets 14 092 15 550 15 193 14 674 12 882 16 489
Ratio of assets to liabilities 2.58:1 2.83:1 2.67:1 2.35:1 1.94:1 2.85:1
Note 1: Financial assets exclude the Territory’s investments in joint ventures and superannuation investments.
Note 2: Other non‐financial assets include the Territory’s investments in joint ventures which are classified as financial assets in the Territory’s financial statements.
Note 3: Unfunded superannuation is the amount by which the estimated superannuation liability exceeds superannuation investments.
Net assets at 30 June 2016 compared to budget estimate
1.20 The capacity of the Territory to meet its obligations over the long‐term can be assessed by
evaluating the Territory’s net asset position.
1.21 The Territory’s net assets at 30 June 2016 were less than budgeted. Net assets
($12 882 million) at 30 June 2016 were less than budgeted ($16 489 million) by
$3 607 million (21.9 percent) due mainly to higher than estimated unfunded
superannuation liability.

1: The Territory’s financial statements
2015‐16 Financial Audits – Financial Results and Audit Findings Page 17
1.22 The unfunded superannuation liability ($7 330 million) exceeded the budget estimate
($2 518 million) by $4 812 million (191.1 percent) due mainly to the use of a lower rate to
estimate the present value of the superannuation liability at 30 June 2016 compared to
the long‐term rate used to prepare the budget estimate. A lower discount rate increases
the estimated present value of the superannuation liability and the related expense. The
long‐term rate is used in budget estimates to reduce short‐term volatility in liabilities.
1.23 The ACT Government explained the significant impact of interest rates on the estimate of
the superannuation liability and expense as follows:
Australian Accounting Standards require the use of the yield (interest rate) on a suitable
Commonwealth Government bond as the discount rate to estimate the present value of the
future expected superannuation benefit payments (‘the superannuation liability’) at financial
year end.
The discount rate used to calculate the present value of the superannuation liability has a
significant financial impact on the estimated value of the superannuation liability and related
superannuation expense. A lower discount rate leads to a higher estimate of the
superannuation liability and related superannuation expense.
Net assets at 30 June 2016 compared to the prior years
1.24 The Territory’s net assets at 30 June 2016 were less than that at 30 June 2015 and at
30 June 2012.
1.25 Net assets ($12 882 million) at 30 June 2016 decreased by $1 792 million (12.2 percent)
from that at 30 June 2015 ($14 674 million) due mainly to an increase in the unfunded
superannuation liability of $2 117 million (14.4 percent).
1.26 The Territory’s net assets have decreased since 30 June 2012. Net assets have decreased
by $1 210 million (8.6 percent or an average decrease of 2.1 percent) since 30 June 2012.
1.27 The decrease in net assets is due to a significant increase in:
the unfunded superannuation liability of $2 088 million (39.8 percent or an average
annual increase 10.0 percent); and
borrowings of $1 550 million (79.0 percent or an average annual increase of
19.8 percent) to fund property, plant and equipment purchases (including land,
buildings and infrastructure assets) as well as properties acquired under the Loose‐Fill
Asbestos Insulation Eradication Scheme.
These were partially offset by an increase in assets of $3 944 million (17.5 percent or an
average annual increase of 4.4 percent) from $22 582 million at 30 June 2012 to
$26 526 million at 30 June 2016 from upward revaluations of property, plant and
equipment and capital expenditure on property, plant and equipment (in particular, land,
buildings and infrastructure assets) as well as the acquisition of properties in 2015‐16 as
part of the Loose‐Fill Asbestos Insulation Eradication Scheme.

1: The Territory’s financial statements
Page 18 2015‐16 Financial Audits – Financial Results and Audit Findings
Unfunded liabilities
Table 1‐4 Unfunded liabilities
At 30 June Actual 2012 $m
Actual 2013 $m
Actual 2014 $m
Actual 2015 $m
Actual 2016 $m
Budget 2016 $m
Financial assets 2 008 2 256 2 034 2 253 2 430 1 454
Liabilities
Unfunded superannuation – Note 1 5 242 4 276 4 471 5 213 7 330 2 518
Borrowings 1 961 2 744 3 085 3 148 3 511 3 827
Payables and finances leases 882 773 765 1 445 1 714 1 752
Other (including other employee benefits) 675 715 794 1 077 1 089 829
Total liabilities 8 760 8 508 9 115 10 883 13 644 8 926
Unfunded liabilities 6 752 6 252 7 081 8 630 11 214 7 472
Note 1: Unfunded superannuation is the amount by which estimated superannuation liabilities exceeds superannuation investments.
1.28 As discussed in paragraphs 1.20 to 1.27 (pages 16 and 17), the Territory’s financial
capacity to meet its obligations over the long‐term can be assessed by evaluating its net
asset position.
1.29 The Territory’s long‐term financial position can also be assessed by comparing financial
assets to total liabilities, as the Territory’s short and long‐term obligations are primarily
funded by its financial assets. This assessment is more conservative than an assessment of
the net asset position because it assumes that the Territory’s non‐financial assets are not
generally available to meet its liabilities. While the Territory could meet its liabilities by
selling non‐financial assets, most are required to provide essential public services, such as
schools and hospitals, and are therefore not readily available for sale.
1.30 As the Territory’s total liabilities exceed the financial assets, the Territory is in an
‘unfunded liability position’.

1: The Territory’s financial statements
2015‐16 Financial Audits – Financial Results and Audit Findings Page 19
Unfunded liabilities at 30 June 2016 compared to the budget estimate
1.31 The Territory’s unfunded liabilities at 30 June 2016 ($11 214 million) exceeded the
budgeted unfunded liabilities ($7 472 million) by $3 742 million (50.1 percent) due mainly
to higher than estimated unfunded superannuation liability.
Unfunded liabilities at 30 June 2016 compared to the prior years
1.32 The Territory’s unfunded liabilities at 30 June 2016 exceeded that at 30 June 2015 and
that at 30 June 2012.
1.33 Unfunded liabilities at 30 June 2016 ($11 214 million) increased by $2 584 million
(29.9 percent) from that at 30 June 2015 ($8 630 million) due mainly to a large increase in
the unfunded superannuation liability.
1.34 Unfunded liabilities at 30 June 2016 ($11 214 million) have grown by $4 462 million
(66.1 percent or an average annual increase of 16.6 percent) since 30 June 2012
($6 752 million) due mainly to an increase in:
the unfunded superannuation liability of $2 088 million (39.8 percent or an average
annual increase 10.0 percent); and
borrowings of $1 550 million (79.0 percent or an average annual increase of
19.8 percent).
1.35 The increase in the unfunded superannuation liability is mainly due to the use of a lower
discount rate to estimate the present value of the superannuation liability at 30 June 2016
compared to the rate which was used to estimate the liability at 30 June 2015.
1.36 The ACT Government has advised that:
The unfunded superannuation liability position has been increasing since 30 June 2013 due to
domestic interest rates falling to historic lows with the required use of lower discount rates to
estimate the superannuation liability at 30 June 2013 (4.29 percent), 30 June 2014
(4.08 percent), 30 June 2015 (3.66 percent) and 30 June 2016 (2.69 percent).
The superannuation liability valuation is sensitive to changes in the discount rate. For example,
if the relevant Commonwealth Government bond (discount) rate increases from 2.69 percent
to 3.69 percent, this would result in a significant decrease in the superannuation liability
valuation of $1.9 billion (17.9 percent), from $10.7 billion to $8.8 billion, and subsequently
result in a decrease in the unfunded position.
The level and volatility of domestic interest rates in the future will continue to significantly
impact the estimated superannuation liability valuations and the funding position.

1: The Territory’s financial statements
Page 20 2015‐16 Financial Audits – Financial Results and Audit Findings
Projected unfunded liabilities
Table 1‐5 Projected unfunded liabilities – Note 1
At 30 June Actual 2016 $m
Budget 2017 $m
Estimate 2018 $m
Estimate 2019 $m
Estimate 2020 $m
Financial assets 2 430 2 003 1 880 1 865 1 958
Liabilities
Unfunded superannuation – Note 2 7 330 2 657 2 722 2 765 2 703
Borrowings 3 511 3 607 3 684 4 221 4 056
Payables and finance leases 1 714 1 632 1 682 2 021 1 978
Other liabilities (including other employee benefits)
1 089
1 541
1 488
1 459
1 513
Total liabilities 13 644 9 437 9 576 10 466 10 250
Unfunded liabilities 11 214 7 434 7 697 8 601 8 292
Note 1: Budget and forward estimates were obtained from the 2016‐17 Budget Papers.
Note 2: The unfunded superannuation liability is the amount by which the estimated superannuation liability exceeds superannuation investments.
1.37 The ACT Government estimates that the Territory’s unfunded liabilities will decrease from
30 June 2016 to 30 June 2020. Unfunded liabilities at 30 June 2016 of $11 214 million are
estimated to decrease by $2 922 million (26.1 percent or an average annual decrease of
6.5 percent) to $8 292 million at 30 June 2020 due largely to a lower unfunded
superannuation liability.
1.38 The estimated reduction in the unfunded superannuation liability of $4 627 million (an
average annual decrease of $1 157 million or 15.9 percent) from $7 330 million at
30 June 2016 to $2 703 million at 30 June 2020 is due to the use of a higher discount rate
in estimating this liability in the forward estimates compared to the rate used to estimate
the liability at 30 June 2016.
1.39 The ACT Government has advised that:
The use of a long‐term discount rate for the budget and forward year estimates removes
significant valuation volatility, and presents a realistic estimate of the liability’s valuation and
associated expense. This is particularly relevant in the current environment of historically low
interest rates.
A long‐term average discount rate assumption of six percent is currently used to estimate the
superannuation liability valuation and superannuation expense projections over the Budget
and forward years.
1: The Territory’s financial statements
2015‐16 Financial Audits – Financial Results and Audit Findings Page 21
The superannuation liability is a long‐term liability and the use of an expected long‐term
discount rate assumption to estimate the liability valuation is appropriate. The 10‐year
Commonwealth Government bond interest rate has averaged approximately six percent over
the past 25 years.
If current interest rates on Commonwealth Government bonds remain below this estimated
long‐term average assumption, then the estimated superannuation liability (and the unfunded
superannuation liability) will be higher than the budget estimate.
1.40 For the expected reduction in unfunded liabilities to occur, there would need to be a
substantial decrease in the superannuation liability. This projected decrease will not occur
while the interest rate used to estimate the present value of the superannuation liability
remains lower than the rate used to prepare the budget estimate. The ACT Government
has advised that:
For the expected reduction in the unfunded superannuation liability to occur, interest rates
would need to return to around their long‐term level with a resultant decrease in the
superannuation liability.
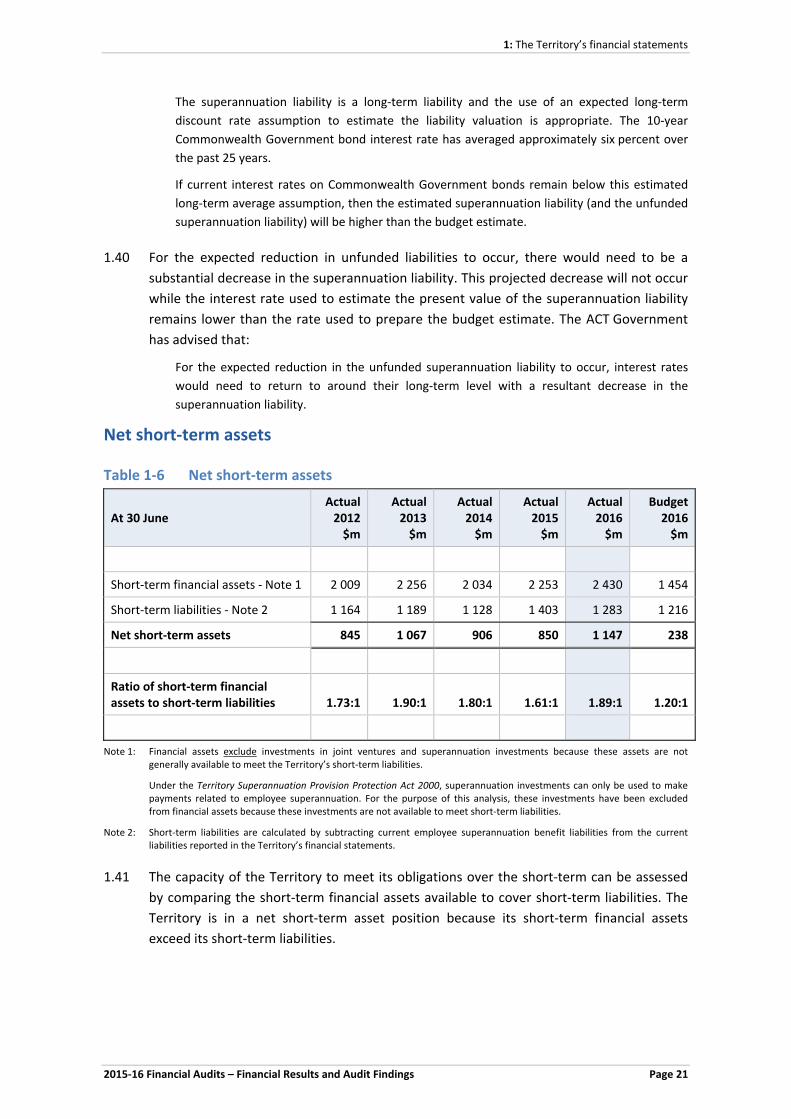
Net short‐term assets
Table 1‐6 Net short‐term assets
At 30 June Actual 2012 $m
Actual 2013 $m
Actual 2014 $m
Actual 2015 $m
Actual 2016 $m
Budget 2016 $m
Short‐term financial assets ‐ Note 1 2 009 2 256 2 034 2 253 2 430 1 454
Short‐term liabilities ‐ Note 2 1 164 1 189 1 128 1 403 1 283 1 216
Net short‐term assets 845 1 067 906 850 1 147 238
Ratio of short‐term financial assets to short‐term liabilities 1.73:1 1.90:1 1.80:1 1.61:1 1.89:1 1.20:1
Note 1: Financial assets exclude investments in joint ventures and superannuation investments because these assets are not generally available to meet the Territory’s short‐term liabilities.
Under the Territory Superannuation Provision Protection Act 2000, superannuation investments can only be used to make payments related to employee superannuation. For the purpose of this analysis, these investments have been excluded from financial assets because these investments are not available to meet short‐term liabilities.
Note 2: Short‐term liabilities are calculated by subtracting current employee superannuation benefit liabilities from the current liabilities reported in the Territory’s financial statements.
1.41 The capacity of the Territory to meet its obligations over the short‐term can be assessed
by comparing the short‐term financial assets available to cover short‐term liabilities. The
Territory is in a net short‐term asset position because its short‐term financial assets
exceed its short‐term liabilities.

1: The Territory’s financial statements
Page 22 2015‐16 Financial Audits – Financial Results and Audit Findings
Net short‐term assets at 30 June 2016 compared to the budget estimate
1.42 The net short‐term assets of the Territory at 30 June 2016 exceeded that anticipated in
the budget. The Territory’s net short‐term assets at 30 June 2016 ($1 147 million)
exceeded the budget estimate ($238 million) by $909 million (381.9 percent).
Net short‐term assets at 30 June 2016 compared to prior years
1.43 The short‐term assets of the Territory at 30 June 2016 exceeded that at 30 June 2015 and
have increased since 30 June 2012.
1.44 The Territory’s net short‐term assets at 30 June 2016 ($1 147 million) exceeded that at
30 June 2015 ($850 million) by $297 million (34.9 percent) and have increased since
30 June 2012 ($845 million) by $302 million (35.7 percent or an average annual increase of
8.9 percent).
Projected net short‐term assets
Table 1‐7 Projected net short‐term assets – Note 1
At 30 June Actual 2016 $m
Budget 2017 $m
Estimate 2018 $m
Estimate 2019 $m
Estimate 2020 $m
Short‐term financial assets – Note 2 2 430 2 003 1 880 1 865 1 958
Short‐term liabilities ‐ Note 3 1 283 1 644 1 105 1 690 1 198
Net short‐term assets 1 147 359 775 175 760
Ratio of short‐term assets to short‐term liabilities 1.89:1 1.22:1 1.70:1 1.10:1 1.63:1
Note 1: Budget and forward estimates were obtained from the 2016‐17 Budget Papers.
Note 2: Financial assets exclude investments in joint ventures because these assets are not generally available to meet the Territory’s immediate debts. Superannuation investments have also been excluded from financial assets because, under the Territory Superannuation Provision Protection Act 2000, the Territory can only use these assets to make payments related to employee superannuation and therefore the assets are also not available to cover short‐term liabilities.
Note 3: Short‐term liabilities are calculated by subtracting the current employee superannuation benefit liabilities from the current liabilities reported in the Territory’s financial statements.
1.45 The ACT Government estimates that net short‐term assets of $1 147 million at
30 June 2016 will reduce to $760 million by 30 June 2020.

2015‐16 Financial Audits – Financial Results and Audit Findings Page 23
2 AUDIT FINDINGS
2.1 This chapter provides an overview of the performance by reporting agencies in resolving
audit findings. Audit findings include weaknesses in governance arrangements,
breakdowns in internal controls and areas where reporting practices need improvement.
2.2 As required by Australian Auditing Standards3, the Audit Office reports audit findings to
agency heads or chairs and, where applicable, the relevant Minister. The Audit Office also
monitors and reports on progress made in addressing previously reported audit findings.
Conclusion
As audit findings have decreased in the last four years, this indicates that governance
arrangements, internal controls and reporting practices of reporting agencies have steadily
improved with reporting agencies implementing effective arrangements for addressing audit
findings.
Key findings Paragraph
Audit findings have decreased from 292 at 30 June 2012 to 100 at 30 June 2016 as the number of audit findings resolved by reporting agencies have exceeded new audit findings. This indicates that:
there has been a steady improvement in internal controls, governance arrangements and reporting practices; and
most reporting agencies have implemented effective arrangements for
addressing audit findings.
2.4
In 2015‐16, the number of audit findings resolved (57) exceeded the number of
new audit findings (47).
2.5
3 Australian Auditing Standards ASA 260: ‘Communication with Those Charged with Governance’ and ASA 265: ‘Communicating Deficiencies in Internal Control to Those Charged with Governance and Management’.
2: Audit fIndings
Page 24 2015‐16 Financial Audits – Financial Results and Audit Findings
Status of audit findings
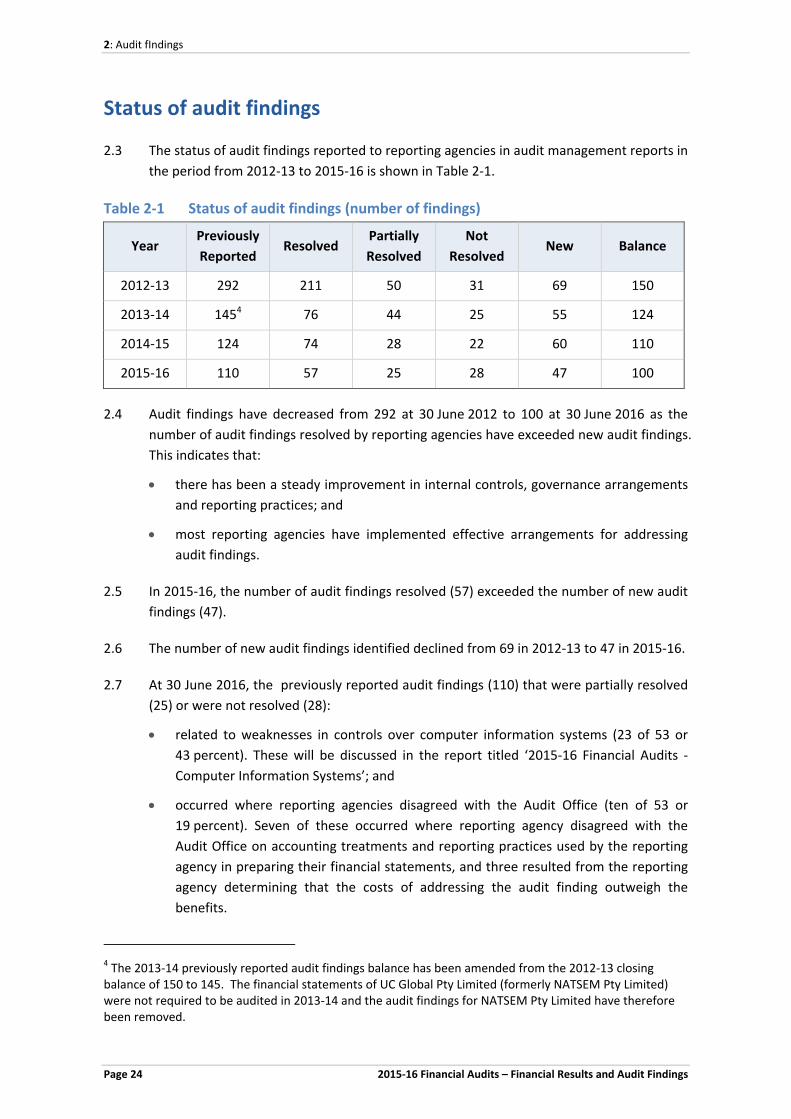
2.3 The status of audit findings reported to reporting agencies in audit management reports in
the period from 2012‐13 to 2015‐16 is shown in Table 2‐1.
Table 2‐1 Status of audit findings (number of findings)
Year Previously
Reported Resolved
Partially
Resolved
Not
Resolved New Balance
2012‐13 292 211 50 31 69 150
2013‐14 1454 76 44 25 55 124
2014‐15 124 74 28 22 60 110
2015‐16 110 57 25 28 47 100
2.4 Audit findings have decreased from 292 at 30 June 2012 to 100 at 30 June 2016 as the
number of audit findings resolved by reporting agencies have exceeded new audit findings.
This indicates that:
there has been a steady improvement in internal controls, governance arrangements
and reporting practices; and
most reporting agencies have implemented effective arrangements for addressing
audit findings.
2.5 In 2015‐16, the number of audit findings resolved (57) exceeded the number of new audit
findings (47).
2.6 The number of new audit findings identified declined from 69 in 2012‐13 to 47 in 2015‐16.
2.7 At 30 June 2016, the previously reported audit findings (110) that were partially resolved
(25) or were not resolved (28):
related to weaknesses in controls over computer information systems (23 of 53 or
43 percent). These will be discussed in the report titled ‘2015‐16 Financial Audits ‐
Computer Information Systems’; and
occurred where reporting agencies disagreed with the Audit Office (ten of 53 or
19 percent). Seven of these occurred where reporting agency disagreed with the
Audit Office on accounting treatments and reporting practices used by the reporting
agency in preparing their financial statements, and three resulted from the reporting
agency determining that the costs of addressing the audit finding outweigh the
benefits.
4 The 2013‐14 previously reported audit findings balance has been amended from the 2012‐13 closing balance of 150 to 145. The financial statements of UC Global Pty Limited (formerly NATSEM Pty Limited) were not required to be audited in 2013‐14 and the audit findings for NATSEM Pty Limited have therefore been removed.

2015‐16 Financial Audits – Financial Results and Audit Findings Page 25
3 FINANCIAL RESULTS AND AUDIT FINDINGS OF
SELECTED REPORTING AGENCIES
3.1 This chapter contains a discussion of the financial results of selected reporting agencies and,
where applicable, discusses their financial results compared to budget estimates. It also
provides details of audit findings reported in audit management reports provided to these
reporting agencies. Reporting agencies were selected on the basis of their financial
significance or where audit findings were considered to warrant public reporting.
ACT Insurance Authority
3.2 The ACT Insurance Authority (the Authority) operates under the Insurance Authority
Act 2005 and is the insurer of major risks faced by the Territory and ACT Government
agencies. It:
buys insurance from external insurance providers (reinsurance) to cover catastrophic
risks, including natural disasters and medical malpractice;
settles insurance claims on behalf of the Territory and ACT Government agencies;
promotes better practices on risk management to ACT Government agencies; and
provides guidance on insurance and management of the Territory’s risks.
Key Issues
The Audit Office issued an unqualified audit report on the Authority’s 2015‐16 financial
statements and an unqualified report of factual findings on its 2015‐16 statement of
performance.
The Authority achieved its budgeted operating result. It made an operating surplus of
$49.3 million compared to a budgeted operating deficit of $13.5 million as fewer than expected
large medical malpractice and public liability claims resulted in a much lower than anticipated
net insurance claims expense.
As expected in the budget, the Authority paid $60 million in capital distributions to the
ACT Government in 2015‐16.
The Authority continued to have sufficient assets to cover its liabilities at 30 June 2016 and its
net asset position was much stronger than anticipated in the budget. Its net asset position at 30
June 2016 ($119.6 million) exceeded the budgeted position at 30 June 2015 ($34.8 million) by
$84.8 million (243.7 percent).

3: Financial results and audit findings of selected reporting agencies
Page 26 2015‐16 Financial Audits – Financial Results and Audit Findings
The Authority expects to make a capital distribution of $50 million in 2016‐175.
The Authority resolved the one previously reported audit finding by providing:
– sufficient information in its statement of performance on how the targets (planned
performance) and results of accountability indicators were calculated; and
– more information on reasons for significant variances from planned performance targets.
One new audit finding was identified in 2015‐16. Two of the six insurance contract payments
examined by the Audit Office were authorised by a person who did not have the required
financial delegation. While the Authority has advised that these payments were properly
related to its operations, this control weakness increases the risk of payment errors and fraud.
Financial results
Table 3‐1 Key Results
Actual
2014‐15 $m
Actual 2015‐16
$m
Budget 2015‐16
$m
Gross premiums 56.5 57.0 57.0
Net returns from investments 13.7 16.1 8.2
Income 70.2 73.1 65.2
Reinsurance expenses (11.3) (8.2) (11.5)
Other (2.7) (2.7) (3.0)
Expenses (14.0) (10.9) (14.5)
Claims revenue/(expenses) 11.4 (13.7) (64.3)
Reinsurance (losses)/recoveries (5.0) 0.3 ‐
Other 1.1 0.5 0.1
Net insurance claims revenue/(expenses) 7.5 (12.9) (64.2)
Operating surplus/(deficit) 63.7 49.3 (13.5)
Capital distributions ‐ 60 60
5 Page 155 of 2016‐17 Budget Statements B, Table 9: ACT Insurance Authority: Statement of Changes in Equity.

3: Financial results and audit findings of selected reporting agencies
2015‐16 Financial Audits – Financial Results and Audit Findings Page 27
3.3 Income is mostly comprised of insurance premiums collected from ACT Government
agencies and net returns from investments.
3.4 Income ($73.1 million) exceeded the budgeted amount ($65.2 million) by $7.9 million
(12.1 percent) due to higher than estimated net returns from investments from better than
anticipated market conditions and a higher than expected investment balance.
3.5 Expenses mainly consist of reinsurance premiums paid to external insurance providers and
administration costs. Expenses ($10.9 million) were $3.6 million (24.8 percent) lower than
budgeted ($14.5 million) as amounts paid for reinsurance premiums were less than
anticipated.
3.6 Net insurance claims revenue/expenses consists of insurance claims settlement payments,
movements in the estimated insurance claims liabilities (explained in paragraph 3.6); minus
amounts recovered from insurance providers under reinsurance arrangements.
3.7 The estimate of insurance claims liabilities is significantly affected by the quantity and type
of insurance claims received, amounts historically paid to settle claims, and the discount
and inflation rates used to estimate the present value of future insurance claims payments.
3.8 The net insurance claims expense ($12.9 million) was much lower than the budget estimate
($64.2 million) by $51.3 million (79.9 percent) as there were fewer than expected large
medical malpractice and public liability claims.
3.9 The Authority achieved its budgeted operating result. It made an operating surplus of
$49.3 million compared to a budgeted operating deficit of $13.5 million as fewer than
expected large medical malpractice and public liability claims resulted in a much lower than
anticipated net insurance claims expense.
3.10 As expected in the budget, the Authority paid $60 million in capital distributions to the
ACT Government in 2015‐16.
Net assets
Table 3‐2 Net assets
At 30 June Actual 2015 $m
Actual 2016 $m
Budget 2016 $m
Total assets 389.4 377.4 354.4
Total liabilities (259.2) (257.8) (319.6)
Net assets 130.2 119.6 34.8
Ratio of total assets to total liabilities 1.5 to 1 1.5 to 1 1.1 to 1

3: Financial results and audit findings of selected reporting agencies
Page 28 2015‐16 Financial Audits – Financial Results and Audit Findings
3.11 The Authority aims to hold sufficient assets to meet its estimated claims liabilities.
3.12 The Authority continued to have sufficient assets to cover its liabilities at 30 June 2016 and
its net asset position was much stronger than anticipated in the budget. Its net asset
position at 30 June 2016 ($119.6 million) exceeded the budgeted position at 30 June 2016
($34.8 million) by $84.8 million (243.7 percent).
3.13 The Authority expects to make a capital distribution of $50 million in 2016‐176.
Audit findings
Table 3‐3 Status of audit findings (number of findings)
Previously Reported
Resolved Partially Resolved
Not Resolved New Balance
1 1 ‐ ‐ 1 1
3.14 The Authority resolved the one previously reported audit finding by providing:
sufficient information in its statement of performance on how the targets (planned
performance) and results of accountability indicators were calculated; and
more information on reasons for significant variances from planned performance
targets.
3.15 One new audit finding was identified in 2015‐16. Two of the six insurance contract
payments examined by the Audit Office were authorised by a person who did not have the
required financial delegation. While the Authority has advised that these payments were
properly related to its operations, this control weakness increases the risk of payment
errors and fraud.
3.16 The Authority has agreed to address this audit finding.
6 Page 155 of 2016‐17 Budget Statements B, Table 9: ACT Insurance Authority: Statement of Changes in Equity.
3: Financial results and audit findings of selected reporting agencies
2015‐16 Financial Audits – Financial Results and Audit Findings Page 29
ACT Local Hospital Network Directorate
3.17 The ACT Local Hospital Network Directorate (the Directorate) is administered by the
Director‐General of the Health Directorate. Information on the Health Directorate is
provided on pages 67 to 71.
3.18 Public hospital services are funded under arrangements between Australian states and
territories and the Commonwealth Government. These arrangements were settled under
the National Health Reform Agreement (the Agreement), signed in August 2011.
3.19 Under these arrangements, public hospital services are funded by the Australian states and
territories and the Commonwealth Government through the National Health Funding Pool.
3.20 In the ACT, activity‐based and block funding is paid from the National Health Funding Pool
to the Directorate. With this funding the Directorate purchases public hospital services from
four ACT public hospital providers (Canberra Hospital and Health Services, Calvary Public
Hospital, Clare Holland House and Queen Elizabeth II Family Centre).
Key Issues
The Audit Office issued an unqualified audit report on the Directorate's 2015‐16 financial
statements and an unqualified report of factual findings on its 2015‐16 statement of
performance.
The Directorate achieved its budgeted net cost of services. Its net cost of services
($928.5 million) was consistent with the budgeted cost ($926.6 million) and exceeded the prior
year's cost ($874.1 million) by $54.4 million (6.2 percent).
One new audit finding was identified in 2015‐16. Many explanations of major variances
between current year amounts and budgeted amounts and current year amounts and prior
year amounts included in the draft financial statements submitted for audit were not provided
or were not informative. Furthermore, some accounting policy disclosures included in the
previous year's financial statements were omitted from the current year's draft financial
statements. While the financial statements were improved during the audit, there is a higher
risk that the readers of the financial statements will not understand the Directorate's financial
results where explanatory information is not provided or is not informative and accounting
policies used to prepare the financial statements are incorrect or incomplete.

3: Financial results and audit findings of selected reporting agencies
Page 30 2015‐16 Financial Audits – Financial Results and Audit Findings
Financial results
Table 3‐4 Key results
Actual
2014‐15 $m
Actual 2015‐16
$m
Budget 2015‐16
$m
Expenses (966.0) (1 025.5) (1 019.6)
Cross‐border health revenue 91.9 97.0 93.0
Net cost of services (874.1) (928.5) (926.6)
Amounts received from the Commonwealth Government to fund public hospital services 310.9 324.7 321.4
Amounts received from the ACT Government to fund public hospital services 567.3 601.8 605.2
Operating surplus/(deficit) 4.1 (2.0) ‐
3.21 Expenses largely consist of payments to:
Canberra Hospital and Health Services, Calvary Public Hospital, Clare Holland House and
Queen Elizabeth II Family Centre for providing public hospital services; and
Australian states and the Northern Territory for providing hospital services to
ACT residents in their respective jurisdictions under cross‐border arrangements.
3.22 The Directorate earns cross‐border health revenue from providing health services to
residents of Australian states, the Northern Territory and under cross‐border arrangements.
3.23 The Directorate achieved its budgeted net cost of services. Its net cost of services
($928.5 million) was consistent with the budgeted cost ($926.6 million) and exceeded the
prior year's cost ($874.1 million) by $54.4 million (6.2 percent).
Table 3‐5 Status of audit findings (number of findings)
Previously Reported
Resolved Partially Resolved
Not Resolved New Balance
‐ ‐ ‐ ‐ 1 1
3.24 One new audit finding was identified in 2015‐16. Many explanations of major variances between current year amounts and budgeted amounts and current year amounts and prior year amounts included in the draft financial statements submitted for audit were not provided or were not informative. Furthermore, some accounting policy disclosures included in the previous year’s financial statements were omitted from the current year’s draft financial statements. While the financial statements were improved during the audit, there is a higher risk that the readers of the financial statements will not understand the

3: Financial results and audit findings of selected reporting agencies
2015‐16 Financial Audits – Financial Results and Audit Findings Page 31
Directorate’s financial results where explanatory information is not provided or is not informative and accounting policies used to prepare the financial statements are incorrect or incomplete.
3.25 The Directorate has agreed to address this audit finding.

3: Financial results and audit findings of selected reporting agencies
Page 32 2015‐16 Financial Audits – Financial Results and Audit Findings
ActewAGL Joint Venture
3.26 The ActewAGL Joint Venture (ActewAGL) sells energy and owns and operates the energy
networks which provide energy (electricity and gas) to customers in the ACT and
surrounding regions. It consists of the ActewAGL Retail Partnership and ActewAGL
Distribution Partnership.
3.27 Icon Water Limited (Icon Water) holds the Territory’s 50 percent interest in the ActewAGL
Retail Partnership and ActewAGL Distribution Partnership through its subsidiaries, Icon
Retail Investments Limited and Icon Distribution Investments Limited respectively. Icon
Water is discussed on pages 76 to 79.
Key Issues
The Audit Office issued an unqualified audit report on the 2015‐16 financial statements of the
ActewAGL Joint Venture, ActewAGL Retail Partnership and ActewAGL Distribution Partnership.
ActewAGL's profit in 2015‐16 ($199.2 million) was consistent with the profit generated in 2014‐
15 ($201.0 million).
Cash distributions paid by ActewAGL to Icon Water in 2015‐16 ($68.5 million) significantly
exceeded cash distributions paid in 2014‐15 ($56.5 million) by $12.0 million (21.2 percent).
ActewAGL had sufficient short‐term assets to cover its short‐term liabilities at 30 June 2016 and
its net short‐term assets position at 30 June 2016 was stronger than the position which existed
at 30 June 2015.
ActewAGL had sufficient total assets to cover its total liabilities at 30 June 2016 and its net
assets position at 30 June 2016 was stronger than the position which existed at 30 June 2015.
ActewAGL resolved all four previously reported audit findings by:
– removing unnecessary generic accounts (accounts shared between users) with privileged
access to the financial accounting system (Oracle). This reduces the risk of erroneous or
fraudulent access;
– increasing the complexity of passwords for privileged user accounts which provide access
to the payroll system (Aurion) so that they complied with ActewAGL's 'Information
Technology Security Policy'. This reduces the risk of unauthorised or fraudulent access;
– promptly reconciling items in the ActewAGL Distribution Partnership bank reconciliation.
This reduces the risk of material errors or fraudulent transactions not being promptly
detected; and

3: Financial results and audit findings of selected reporting agencies
2015‐16 Financial Audits – Financial Results and Audit Findings Page 33
– ceasing the use of 'manual fixes' to correct errors in collating and reporting of data after a
major upgrade to its financial systems. This reduces the risk of errors and fraud and
improves the efficiency and effectiveness of the financial systems.
Five new audit findings were identified in 2015‐16:
– Three former employees continued to have access to the ActewAGL Distribution billing
system after ceasing employment. Failure to promptly remove user accounts of former
employees increases the risk of fraudulent access.
– Password settings for the operating system, on which the financial accounting system
operates, were not as complex as required by ActewAGL's 'Information Technology
Security Policy'. This increases the risk of unauthorised or fraudulent access.
– There was no evidence that the appropriateness of user access to the ActewAGL
Distribution billing system was being periodically reviewed. Many users have privileged
access which should be tightly controlled to prevent changes being made to the billing
system and its data. Multiple accounts with privileged access increases the risk of
inappropriate or fraudulent access.
– Testing documentation could not be provided for three out of 24 application changes
reviewed during the audit. Untested changes increase the risk that systems will not
process transactions completely and accurately after being changed.
– The electronic funds transfer file generated from the financial accounting system (Oracle)
and payroll system (Aurion), for upload into ActewAGL's electronic banking platform
(Commbiz) to process supplier and payroll payments, was stored in a network directory
location which was accessible to employees who do not require access. There is a higher
risk of fraudulent payments when access to the electronic funds file is not adequately
restricted.

3: Financial results and audit findings of selected reporting agencies
Page 34 2015‐16 Financial Audits – Financial Results and Audit Findings
Financial results
Table 3‐6 Key results
Actual
2014‐15 $m
Actual 2015‐16
$m
Income 819.7 785.5
Expenses (618.7) (586.3)
Profit 201.0 199.2
Distributions paid to partners 113.0 137.0
Distributions paid to Icon Water (50 percent) 56.5 68.5
3.28 Income largely comes from the sale and distribution of energy (electricity and gas).
3.29 Expenses are mainly comprised of energy purchases, employment costs, payments to
subcontractors, leasing expenses and depreciation.
3.30 ActewAGL’s profit in 2015‐16 ($199.2 million) was consistent with the profit generated in
2014‐15 ($201.0 million).
3.31 Cash distributions paid by ActewAGL to Icon Water in 2015‐16 ($68.5 million) significantly
exceeded cash distributions paid in 2014‐15 ($56.5 million) by $12.0 million (21.2 percent).
Net short‐term assets
Table 3‐7 Net short‐term assets
At 30 June Actual 2015 $m
Actual 2016 $m
Short‐term assets 264.2 257.5
Short‐term liabilities (192.1) (175.8)
Net short‐term assets 72.1 81.7
Ratio of short‐term assets to short‐term liabilities 1.4 to 1 1.5 to 1
3.32 ActewAGL’s coverage of short‐term assets to short‐term liabilities can be assessed by
comparing the amount of short‐term assets available to cover short‐term liabilities.

3: Financial results and audit findings of selected reporting agencies
2015‐16 Financial Audits – Financial Results and Audit Findings Page 35
3.33 The short‐term assets position shown in Table 3‐7 (page 34) is the position after the
payment of cash distributions to the partners of ActewAGL.
3.34 ActewAGL had sufficient short‐term assets to cover its short‐term liabilities at 30 June 2016
and its net short‐term assets position at 30 June 2016 was stronger than the position which
existed at 30 June 2015.
Net assets
Table 3‐8 Net assets
At 30 June Actual 2015 $m
Actual 2016 $m
Total assets 1 490.7 1 537.5
Total liabilities (214.7) (199.2)
Net assets 1 276.0 1 338.3
Ratio of total assets to total liabilities 6.9 to 1 7.7 to 1
3.35 Total assets consist mainly of the electricity and gas network assets.
3.36 ActewAGL had sufficient total assets to cover its total liabilities at 30 June 2016 and its net
assets position at 30 June 2016 was stronger than the position which existed at
30 June 2015.
Audit findings
Table 3‐9 Status of audit findings (number of findings)
Previously Reported
Resolved Partially Resolved
Not Resolved New Balance
4 4 ‐ ‐ 5 5
3.37 ActewAGL resolved all four previously reported audit findings by:
removing unnecessary generic accounts (accounts shared between users) with
privileged access to the financial accounting system (Oracle). This reduces the risk of
erroneous or fraudulent access;
increasing the complexity of passwords for privileged user accounts which provide
access to the payroll system (Aurion) so that they complied with ActewAGL’s
‘Information Technology Security Policy’. This reduces the risk of unauthorised or
fraudulent access;

3: Financial results and audit findings of selected reporting agencies
Page 36 2015‐16 Financial Audits – Financial Results and Audit Findings
promptly reconciling items in the ActewAGL Distribution Partnership bank
reconciliation. This reduces the risk of material errors or fraudulent transactions not
being promptly detected; and
ceasing the use of ‘manual fixes’ to correct errors in collating and reporting of data
after a major upgrade to its financial systems. This reduces the risk of errors and fraud
and improves the efficiency and effectiveness of the financial systems.
3.38 Five new audit findings were identified in 2015‐16:
Three former employees continued to have access to the ActewAGL Distribution billing
system after ceasing employment. Failure to promptly remove user accounts of former
employees increases the risk of fraudulent access.
ActewAGL has advised that these user accounts have been removed and that
six‐monthly reviews of user access will be performed to identify and remove dormant
or inappropriate user accounts.
Password settings for the operating system, on which the financial accounting system
operates, were not as complex as required by ActewAGL’s ‘Information Technology
Security Policy’. This increases the risk of unauthorised or fraudulent access.
ActewAGL has advised that password settings have been ungraded to comply with its
‘Information Technology Security Policy’.
There was no evidence that the appropriateness of user access to the ActewAGL
Distribution billing system was being periodically reviewed. Many users have privileged
access which should be tightly controlled to prevent changes being made to the billing
system and its data. Multiple accounts with privileged access increases the risk of
inappropriate or fraudulent access.
ActewAGL has advised that:
- a review of user accounts has now been performed to ensure that access rights
given to users is limited to that needed for their role;
- the number of users with privileged access will be limited; and
- six‐monthly reviews of user access will be carried out.
Testing documentation could not be provided for three out of 24 application changes
reviewed during the audit. Untested changes increase the risk that systems will not
process transactions completely and accurately after being changed.
ActewAGL has advised that its ‘Change Management Policy’ will be updated to define
the testing requirements for changes and that relevant staff will be provided with
training on these new requirements.

3: Financial results and audit findings of selected reporting agencies
2015‐16 Financial Audits – Financial Results and Audit Findings Page 37
The electronic funds transfer file generated from the financial accounting system
(Oracle) and payroll system (Aurion), for upload into ActewAGL’s electronic banking
platform (Commbiz) to process supplier and payroll payments, was stored in a network
directory location which was accessible to employees who do not require access. There
is a higher risk of fraudulent payments when access to the electronic funds file is not
adequately restricted.
ActewAGL has advised that access rights to the network directory for these employees
who do not require access were removed after this was brought to their attention.
3.39 ActewAGL has agreed to address all audit findings.

3: Financial results and audit findings of selected reporting agencies
Page 38 2015‐16 Financial Audits – Financial Results and Audit Findings
ACTION
3.40 ACTION provides public bus services to the ACT community, including school and special
needs bus services as well as charter hire buses. In 2015‐16, ACTION was part of the
Territory and Municipal Services Directorate but was a separate entity for reporting
purposes.
Key Issues
The Audit Office issued an unqualified audit report on ACTION’s 2015‐16 financial statements
and an unqualified report of factual findings on its 2015‐16 statement of performance.
ACTION achieved its budgeted net cost of services. Its net cost of services ($118.4 million)
aligned with the budgeted cost ($118.9 million).
Government contributions ($103.6 million) were lower than the budgeted amount
($106.4 million) by $2.8 million (2.6 percent) due mainly to delays in implementing a new
weekday bus network.
One of the three previously reported audit findings was resolved, one partially resolved and
one not resolved.
ACTION resolved one audit finding by ensuring that reports of cash floats held by bus drivers
were promptly updated for changes in floats issued to, or returned by, bus drivers. This ensured
that cash float reports agreed to the cash floats balance reported in the financial statements.
ACTION partially resolved one audit finding by ensuring that reconciliations between cash fares
collected by bus drivers and cash fares recorded in ACTION’s ticketing system (MyWay) were
reviewed by an independent officer. However, at one depot, reconciliations were not being
signed by the responsible preparing officer.
One previously reported audit finding was not resolved as ACTION has not been able to
automate key controls in its human resources system (Aurion) due to system limitations.
ACTION commenced work to progressively transfer staff data from Aurion to another human
resources system which has automated controls (CHRIS21).
While compensating manual controls have been implemented, automated controls are more
effective because they are consistently applied and can prevent erroneous and fraudulent
salary payments instead of identifying them after they occur.
However, in 2015‐16, bus drivers and transport officers continued to be paid through Aurion
because of technical issues and delays in the transfer of staff data from Aurion to CHRIS21.

3: Financial results and audit findings of selected reporting agencies
2015‐16 Financial Audits – Financial Results and Audit Findings Page 39
One new audit finding was identified in 2015‐16. ACTION previously appointed transport
officers as ‘authorised persons’ to conduct ticket and compliance inspections on the proper use
of concession cards, including checking that concession cards were being used by eligible
persons. However, in 2015‐16 these officers no longer performed these inspections to minimise
the risk of incorrect and fraudulent use of concession cards.
Financial results
Table 3‐10 Key results
3.41 ACTION’s expenses mainly consist of employee and bus operating costs, including fuel and
maintenance costs.
3.42 Expenses ($144.8 million) aligned with the budgeted amount ($144.4 million).
3.43 ACTION’s income is mostly derived from fares charged for its bus services.
3.44 Income ($26.4 million) exceeded the budgeted amount ($25.5 million) by $0.9 million
(3.5 percent). This was mainly due to higher than expected fuel tax credits claimed from the
Commonwealth Government for fuel used to operate auxiliary electronic equipment on
buses, mainly the air conditioning system.
3.45 ACTION achieved its budgeted net cost of services. Its net cost of services ($118.4 million)
aligned with the budgeted cost ($118.9 million).
3.46 Government contributions ($103.6 million) were lower than the budgeted amount
($106.4 million) by $2.8 million (2.6 percent) due mainly to delays in implementing a new
weekday bus network.
Actual 2014‐15
$m
Actual 2015‐16
$m
Budget 2015‐16
$m
Expenses (144.5) (144.8) (144.4)
Income 26.5 26.4 25.5
Net cost of services (118.0) (118.4) (118.9)
Government contributions 106.6 103.6 106.4
Other gains on de‐recognition of finance leases 0.3 0.0 0.0
Operating deficit (11.1) (14.8) (12.5)

3: Financial results and audit findings of selected reporting agencies
Page 40 2015‐16 Financial Audits – Financial Results and Audit Findings
Audit findings
Table 3‐11 Status of audit findings (number of findings)
Previously Reported
Resolved Partially Resolved
Not Resolved New Balance
3 1 1 1 1 3
3.47 One of the three previously reported audit findings was resolved, one partially resolved and
one not resolved.
3.48 ACTION resolved one audit finding by ensuring that reports of cash floats held by bus
drivers were promptly updated for changes in floats issued to, or returned by, bus drivers.
This ensured that cash float reports agreed to the cash floats balance reported in the
financial statements.
3.49 ACTION partially resolved one audit finding by ensuring that reconciliations between cash
fares collected by bus drivers and cash fares recorded in ACTION’s ticketing system
(MyWay) were reviewed by an independent officer. However, at one depot, reconciliations
were not being signed by the responsible preparing officer.
3.50 One previously reported audit finding was not resolved as ACTION has not been able to
automate key controls in its human resources system (Aurion) due to system limitations.
ACTION commenced work to progressively transfer staff data from Aurion to another
human resources system which has automated controls (CHRIS21).
While compensating manual controls have been implemented, automated controls are
more effective because they are consistently applied and can prevent erroneous and
fraudulent salary payments instead of identifying them after they occur.
However, in 2015‐16, bus drivers and transport officers continued to be paid through
Aurion because of technical issues and delays in the transfer of staff data from Aurion to
CHRIS21.
3.51 One new audit finding was identified in 2015‐16. ACTION previously appointed transport
officers as ‘authorised persons’ to conduct ticket and compliance inspections on the proper
use of concession cards, including checking that concession cards were being used by
eligible persons. However, in 2015‐16 these officers no longer performed these inspections
to minimise the risk of incorrect and fraudulent use of concession cards.
3.52 ACTION has advised that all audit findings will be addressed.
3: Financial results and audit findings of selected reporting agencies
2015‐16 Financial Audits – Financial Results and Audit Findings Page 41
Canberra Institute of Technology
3.53 The Canberra Institute of Technology (the Institute) provides vocational education and
training services to students and public and private sector organisations.
Key Issues
The Audit Office issued an unqualified audit report on the 2015 financial statements of the
Institute and an unqualified report of factual findings on its 2015 statement of performance.
The Institute achieved its budgeted net cost of services. Its net cost of services ($77.6 million)
aligned with the budgeted cost ($76.9 million) and exceeded the prior year’s cost
($74.2 million) by $3.4 million (4.6 percent).
The Institute resolved one previously reported audit finding. It reduced the risk of undetected
errors and fraud in payments to employees by implementing the prompt review of salary
reports and retaining evidence of these reviews regardless of whether anomalies were
identified.
One previously reported audit finding was not resolved. The Institute did not sufficiently
improve the quality of the workpapers supporting its statement of performance. These
workpapers did not include sufficient information on the:
– definition and explanation of accountability indicators;
– basis of calculation of each accountability indicator's target and actual result; and
– details of the documentation available to support the reported results.
There was also insufficient evidence of the independent review of the reported results. This
increases the risk of erroneous or fraudulent reporting.
One new audit finding was identified in 2015. The Institute’s Chief Executive Financial
Instructions have not been reviewed and updated since 2008 and therefore do not reflect all of
the Institute’s financial management policies and procedures. This increases the risk that these
will not be correctly implemented.

3: Financial results and audit findings of selected reporting agencies
Page 42 2015‐16 Financial Audits – Financial Results and Audit Findings
Financial results
Table 3‐12 Key results (calendar years)
Actual 2014 $m
Actual 2015 $m
Budget 2015 $m
Expenses (110.9) (113.0) (109.8)
Income 36.7 35.4 32.9
Net cost of services (74.2) (77.6) (76.9)
Government contributions 67.2 66.4 66.4
Operating deficit (7.0) (11.2) (10.5)
3.54 Expenses mainly consist of employee costs, operating costs, depreciation and amortisation.
Operating costs include information and communication technology expenses, costs of
consultants and contractors engaged to provide courses, repairs and maintenance and
printing costs.
3.55 The Institute’s main source of income comes from providing vocational education and
training services to public and private sector organisations.
3.56 The Institute achieved its budgeted net cost of services. Its net cost of services
($77.6 million) aligned with the budgeted cost ($76.9 million) and exceeded the prior year’s
cost ($74.2 million) by $3.4 million (4.6 percent).
3.57 The increase in the Institute’s net cost of services from the prior year’s cost was due mainly
to a small increase in repairs and maintenance expenses and a decrease in revenue due
largely to the loss of the contract to deliver the Adult English Migrant Program.
Audit findings
Table 3‐13 Status of audit findings (number of findings)
Previously Reported
Resolved Not Resolved New Balance
2 1 1 1 2
3.58 The Institute resolved one previously reported audit finding. It reduced the risk of
undetected errors and fraud in payments to employees by implementing the prompt
review of salary reports and retaining evidence of these reviews regardless of whether
anomalies were identified.

3: Financial results and audit findings of selected reporting agencies
2015‐16 Financial Audits – Financial Results and Audit Findings Page 43
3.59 One previously reported audit finding was not resolved. The Institute did not sufficiently
improve the quality of the workpapers supporting its statement of performance. These
workpapers did not include sufficient information on the:
definition and explanation of accountability indicators;
basis of calculation of each accountability indicator’s target and actual result; and
details of the documentation available to support the reported results.
There was also insufficient evidence of the independent review of the reported results. This
increases the risk of erroneous or fraudulent reporting.
3.60 One new audit finding was identified in 2015. The Institute’s Chief Executive Financial
Instructions have not been reviewed and updated since 2008 and therefore do not reflect
all of the Institute’s financial management policies and procedures. This increases the risk
that these will not be correctly implemented.
3.61 The Institute has agreed to address all audit findings.

3: Financial results and audit findings of selected reporting agencies
Page 44 2015‐16 Financial Audits – Financial Results and Audit Findings
Capital Metro Agency
3.62 The Capital Metro Agency was set up to manage the planning, design, procurement and
delivery of the first stage of a light rail network in Canberra (the Light Rail Project).
3.63 In May 2016, the Capital Metro Agency, on behalf of the Territory, entered into a
public‐private partnership with a private sector consortium (Canberra Metro) to design,
construct, operate, maintain and finance the first stage of the light rail network.
Construction of the first stage is scheduled for completion in late 2018 with operations
commencing at that time.
3.64 Canberra Metro will operate and maintain the light rail system for 20 years. After this time,
the Territory will obtain ownership of light rail system assets such as light rail vehicles,
depots and tracks.
3.65 The Capital Metro Agency was abolished and its functions transferred to the new Transport
Canberra and City Services Directorate effective from 1 July 2016.
Key Issues
The Audit Office issued an unqualified audit report on the Capital Metro Agency's 2015‐16
financial statements and an unqualified report of factual findings on its 2015‐16 statement of
performance.
Note 17: 'Commitments' to the 2015‐16 financial statements of the Capital Metro Agency
discloses commitments of $1 649.3 million (excluding GST) for the design, construction,
operation, maintenance and financing of the first stage of the light rail network.
The one audit finding identified in 2015‐16 relates to accounting for the Light Rail Project in
future financial statements of the Transport Canberra and City Services Directorate.
Light Rail Project – Commitments
Table 3‐14 Light Rail Project – Commitments
Finance Lease Commitments
$m
Operating Commitments
$m
Total (excluding GST)
$m
Within one year ‐ ‐ ‐
Later than one year but not later than five years
446.9
73.1
520.0
Later than five years 490.1 639.2 1 129.3
Total public‐private partnership commitments
937.0
712.3
1 649.3

3: Financial results and audit findings of selected reporting agencies
2015‐16 Financial Audits – Financial Results and Audit Findings Page 45
3.66 Note 17: ‘Commitments’ to the 2015‐16 financial statements of the Capital Metro Agency
discloses commitments of $1 649.3 million (excluding GST) for the design, construction,
operation, maintenance and financing of the first stage of the light rail network.
3.67 The Territory will commence making monthly payments to Canberra Metro over the
20‐year term of the arrangement once the light rail system commences operations
(expected to be in August 2018).
3.68 Commitments consist of capital and operational commitments.
Finance lease commitments: These are payments for the design and construction of the
light rail asset and the right to use the asset. The Capital Metro Agency has advised
these costs will be accounted for as a finance lease under Australian Accounting
Standard AASB 117: ‘Leases’.
This will involve recording the constructed assets and corresponding finance lease
liabilities from the date the light rail system commences operations until ownership of
the assets reverts to the Territory.
Operational commitments: These are payments for the operation and ongoing
maintenance of the light rail system. These costs will be recorded as an expense when
payments are made.
Audit findings
Table 3‐15 Status of findings (number of findings)
Previously Reported
Resolved Partially Resolved
Not Resolved New Balance
‐ ‐ ‐ ‐ 1 1
3.69 The one audit finding identified in 2015‐16 relates to accounting for the Light Rail Project in
future financial statements of the Transport Canberra and City Services Directorate.
3.70 The Transport Canberra and City Services Directorate has agreed to account for all
transactions relating to the Light Rail Project in accordance with Australian Accounting
Standards.

3: Financial results and audit findings of selected reporting agencies
Page 46 2015‐16 Financial Audits – Financial Results and Audit Findings
Chief Minister, Treasury and Economic Development
Directorate
3.71 The Chief Minister, Treasury and Economic Development Directorate (the Directorate)
provides leadership, strategic advice and support on policy development to the ACT Public
Service. Other key functions include:
coordinating the Territory’s budget process and financial management;
administering ACT Government’s land release program and infrastructure projects;
providing information and communication technology, publishing and recordkeeping,
human resources, and finance services (shared services) across the ACT Government;
collecting and managing the Territory’s taxation revenue;
promoting tourism, managing ACT arts facilities, facilitating sporting and major events;
promoting business development and investment programs;
providing customer and regulatory services through Access Canberra;
overseeing the program involving the overhaul of public housing (Public Housing
Renewal Program); and
administering the Loose‐Fill Asbestos Eradication Scheme. Under the Scheme, the
Directorate purchases properties (land and homes) that are affected by loose‐fill
asbestos, demolishes and disposes of the homes, remediates the affected land and sells
the remediated land.
3.72 Under changes to administrative arrangements on 22 January 2016, the Directorate
received Vocational Education and Training functions from the former Education and
Training Directorate and the National Arboretum Canberra from the former Territory and
Municipal Services Directorate.
Key Issues
The Audit Office issued an unqualified audit report on the Directorate’s 2015‐16 financial
statements and an unqualified report of factual findings on its 2015‐16 statement of
performance.
The Directorate did not achieve its budgeted net cost of services excluding assets transferred to
other ACT Government agencies. Its net cost of services excluding assets transferred to other
ACT Government agencies ($422.2 million) exceeded the budgeted cost ($384.7 million) by
$37.5 million (9.7 percent) due to lower than anticipated income ($61.2 million); partially offset
by lower than expected expenses ($23.7 million).

3: Financial results and audit findings of selected reporting agencies
2015‐16 Financial Audits – Financial Results and Audit Findings Page 47
Seven of the 11 previously reported audit findings were resolved, one was partially resolved
and three were not resolved.
Seven previously reported audit findings were resolved as follows:
– An information management and information communications technology strategic plan
(‘Digital Strategy 2015‐2020’) was approved, thereby increasing assurance that
information technology systems will meet the needs of the Directorate.
– Meeting minutes of the Directorate’s Executive Management Group (a key decision‐
making group that meets on a monthly basis) were approved.
– There were no errors in the spreadsheet used to calculate revenue and receivables
relating to extension of time to build fees reported in the financial statements. This
reduces the risk of errors in the financial statements.
– Unidentified cash receipts recorded in a ‘suspense account’ in the accounting system
were resolved in a timely manner. This ensures that cash receipts are correctly recorded
in the financial statements.
– The Directorate’s assessment of property, plant and equipment and intangible assets for
impairment was documented as required by Australian Accounting Standard AASB 136:
‘Impairment of Assets’.
– The general ledger reconciled to the supporting asset registers. This reduces the risk of
errors in the financial statements.
– In 2014‐15, the report of factual findings on the statement of performance of the former
Economic Development Directorate for the period from 1 July 2014 to 6 July 2014 was
qualified because targets for accountability indicators were not established and reported
against, as required by Section 30(2) of the Financial Management Act 1996. This matter
was resolved in 2015‐16 as a statement of performance for the Economic Development
Directorate was not required as a result of the Economic Development Directorate
ceasing operations due to changed administrative arrangements.
One previously reported audit finding was partially resolved. The Directorate approved a
strategic asset management plan (‘Strategic Asset Management Plan ‐ Shared Services’) for
Shared Services, however, the Directorate does not have an approved Strategic Asset
Management Plan which encompasses each of the Strategic Asset Management Plans for the
Directorate’s key asset management areas. A Strategic Asset Management Plan is needed to
provide guidance on key areas of asset management, including the planning, acquisition,
disposal and maintenance of assets.

3: Financial results and audit findings of selected reporting agencies
Page 48 2015‐16 Financial Audits – Financial Results and Audit Findings
The Directorate did not resolve three previously reported audit findings:
– There was often no evidence that reviews of salary reports were being performed or
performed in a timely manner. This increases the risk that incorrect or fraudulent
employee payments will not be promptly detected and addressed.
– Some accountability indicators and related targets were not clearly explained in the
Directorate’s budget papers. This presents a risk of incorrect or fraudulent reporting as it
may be difficult to subsequently verify whether the actual results reported in the
statement of performance are consistent with planned performance targets disclosed in
the budget papers.
– Each year, the Chief Minister, Treasury and Economic Development Directorate issues a
whole‐of‐government reporting timetable. The 2015‐16 timetable7 included the dates by
which reporting agencies were to submit their financial statements to the Audit Office.
The Directorate did not submit their financial statements by the required due date.
Furthermore, explanatory information (in particular, explanations for major variances
between the current year’s results and budget estimates and the current year’s results
and prior year’s results) needs to be improved. For example, the variance information did
not always explain why a variance occurred or technical terms (jargon) were sometimes
used that would only likely be understood by staff of the Directorate. While these
explanations were improved during the audit, further work is needed. There is a higher
risk that the readers of the financial statements will not understand the financial results if
explanations of major variances are not presented in plain English or do not explain
underlying reasons.
One new audit finding was identified in 2015‐16. The draft statement of performance
submitted for review was late and incomplete. Furthermore, it was often not obvious from the
information provided in the statement of performance how the accountability indicators and
related targets provide a basis for a meaningful assessment of the Directorate’s performance.
While explanatory information was improved during the audit, there is a higher risk that the
readers of the statement of performance will not understand the performance of the
Directorate when accountability indicators and related targets do not provide a meaningful
assessment of the Directorate’s performance.
7 Budget Memorandum ‘2016/13 2015‐16 Agency Financial Statements and Consolidated Financial Statements for the Territory’.

3: Financial results and audit findings of selected reporting agencies
2015‐16 Financial Audits – Financial Results and Audit Findings Page 49
Financial results
Table 3‐16 Key results
Note 1: The 2015‐16 budget amount ($42.6 million) consists of Grants and Purchased Services ($1.4 million) and Other Expenses ($41.3 million) (Page 92 of the 2015‐16 Budget Statements).
3.73 Expenses, excluding Loose‐Fill Asbestos Eradication Scheme grants and assets transferred to
other ACT Government agencies, consist of employee expenses, contractors and
consultants costs, accommodation expenses, information and communication technology
expenses, repairs and maintenance costs, depreciation expenses and grants paid to major
sporting, business, industry, tourism and event organisations.
3.74 Loose‐Fill Asbestos Eradication Scheme grants are paid to buy properties affected by loose‐
fill asbestos.
3.75 Total expenses excluding assets transferred to other agencies ($701.4 million) were lower
than the budget estimate ($725.1 million) by $23.7 million (3.3 percent) as purchases of
information and communication technology assets by Shared Services on behalf of the
other ACT Government agencies, grant payments to major sporting, business, industry,
tourism and event organisations and services acquired from other ACT Government
agencies and external organisations were less than anticipated. These were partially offset
by higher than expected:
employee expenses as functions were transferred to the Directorate after the budget
was prepared; and
Actual 2014‐15
$m
Actual 2015‐16
$m
Budget 2015‐16
$m
Expenses excluding Loose‐Fill Asbestos Eradication Scheme grants and assets transferred to other ACT Government agencies
(572.8)
(652.6)
(682.5)
Loose‐Fill Asbestos Eradication Scheme grants – Note 1 (336.1) (48.8) (42.6)
Total expenses excluding assets transferred to other ACT Government agencies
(908.9)
(701.4)
(725.1)
Income 289.6 279.2 340.4
Net cost of services excluding assets transferred to other agencies (619.3) (422.2) (384.7)
Government contributions 482.5 410.8 411.7
Other gains 5.1 19.6 ‐
Assets transferred to other ACT Government agencies (3.1) (95.7) ‐
Operating (deficit)/surplus (134.8) (87.5) 27.0

3: Financial results and audit findings of selected reporting agencies
Page 50 2015‐16 Financial Audits – Financial Results and Audit Findings
Loose‐Fill Asbestos Eradication Scheme grants as more homeowners opted into the
Scheme than expected.
3.76 Income is obtained from:
other ACT Government agencies for the provision of property services, information
communication technology services, procurement support, publishing and records
management services, human resource and financial services;
extension of time to build fees; and
sporting and tourism events and activities.
3.77 Income ($279.2 million) was significantly lower than budgeted ($340.4 million) by
$61.2 million (18.0 percent). This was mainly due to lower than anticipated:
rent revenue after the transfer of the Magistrates Court to the Justice and Community
Safety Directorate;
recoveries from ACT Government agencies for information and communication
technology assets purchased on their behalf by Shared Services; and
recoveries of repairs and maintenance costs incurred by the ACT Property Group on
properties rented by other ACT Government agencies.
3.78 The Directorate did not achieve its budgeted net cost of services excluding assets
transferred to other ACT Government agencies. Its net cost of services excluding assets
transferred to other ACT Government agencies ($422.2 million) exceeded the budgeted cost
($384.7 million) by $37.5 million (9.7 percent) due to lower than anticipated income
($61.2 million); partially offset by lower than expected expenses ($23.7 million).
3.79 Assets transferred to other ACT Government agencies ($95.7 million) mainly consisted of
the transfer of:
completed road works and water quality ponds to the former Territory and Municipal
Services Directorate (renamed the Transport Canberra and City Services Directorate on
1 July 2016); and
the Magistrates Court land and buildings to the Justice and Community Safety
Directorate.
3.80 The Directorate’s territorial operations mainly consist of revenue from Commonwealth
grants, and the collection of taxes, fees and fines; including land tax, general rates, duties,
payroll tax and income tax equivalents. A discussion on the Directorate’s territorial revenue
is incorporated with the discussion on the Territory’s revenue in Chapter 1: ‘The Territory’s
financial statements’ (pages 12 to 15).

3: Financial results and audit findings of selected reporting agencies
2015‐16 Financial Audits – Financial Results and Audit Findings Page 51
Audit findings
Table 3‐17 Status of audit findings (number of findings)
Previously Reported
Resolved Partially Resolved
Not Resolved New Balance
11 7 1 3 1 5
3.81 Seven of the 11 previously reported audit findings were resolved, one was partially resolved
and three were not resolved.
3.82 Seven previously reported audit findings were resolved as follows:
An information management and information communications technology strategic
plan (‘Digital Strategy 2015‐2020’) was approved, thereby increasing assurance that
information technology systems will meet the needs of the Directorate.
Meeting minutes of the Directorate’s Executive Management Group (a key decision‐
making group that meets on a monthly basis) were approved.
There were no errors in the spreadsheet used to calculate revenue and receivables
relating to extension of time to build fees reported in the financial statements. This
reduces the risk of errors in the financial statements.
Unidentified cash receipts recorded in a ‘suspense account’ in the accounting system
were resolved in a timely manner. This ensures that cash receipts are correctly
recorded in the financial statements.
The Directorate’s assessment of property, plant and equipment and intangible assets
for impairment was documented as required by Australian Accounting Standard
AASB 136: ‘Impairment of Assets’.
The general ledger agreed to the supporting asset registers. This reduces the risk of
errors in the financial statements.
In 2014‐15, the report of factual findings on the statement of performance of the
former Economic Development Directorate for the period from 1 July 2014 to
6 July 2014 was qualified because targets for accountability indicators were not
established and reported against, as required by Section 30(2) of the Financial
Management Act 1996. This matter was resolved in 2015‐16 as a statement of
performance for the Economic Development Directorate was not required as a result of
the Economic Development Directorate ceasing operations due to changed
administrative arrangements.
3.83 One previously reported audit finding was partially resolved. The Directorate approved a
strategic asset management plan (‘Strategic Asset Management Plan ‐ Shared Services’) for
Shared Services, however, the Directorate does not have an approved Strategic Asset
Management Plan which encompasses each of the Strategic Asset Management Plans for
the Directorate’s key asset management areas. A Strategic Asset Management Plan is

3: Financial results and audit findings of selected reporting agencies
Page 52 2015‐16 Financial Audits – Financial Results and Audit Findings
needed to provide guidance on key areas of asset management, including the planning,
acquisition, disposal and maintenance of assets.
3.84 The Directorate agreed to address this audit finding and advised that:
A Strategic Asset Management Plan was provided to the Audit Office in early September 2016.
3.85 The Directorate did not resolve three previously reported audit findings:
There was often no evidence that reviews of salary reports were being performed or
performed in a timely manner. This increases the risk that incorrect or fraudulent
employee payments will not be promptly detected and addressed.
The Directorate agreed to address this audit finding and advised that:
An electronic salary reporting solution will be implemented during 2016‐17 to improve the
timeliness and consistency of salary report reviews.
Some accountability indicators and related targets were not clearly explained in the
Directorate’s budget papers. This presents a risk of incorrect or fraudulent reporting as
it may be difficult to subsequently verify whether the actual results reported in the
statement of performance are consistent with planned performance targets disclosed
in the budget papers.
The Directorate partially agreed with this audit finding and advised that:
The Directorate reviews its accountability indicators annually as part of the budget process
to ensure that the most useful, relevant and up to date information is being provided.
Internally, this review process is supported through the annual development of detailed
audit worksheets for each accountability indicator. These include a description of the
indicator, an explanation of what is being measured and how this is calculated, and the
documentation to be provided as evidence of the result.
Future review processes will continue to focus on providing clear explanatory descriptions
of accountability indicators and their targets in the budget papers.
Each year, the Chief Minister, Treasury and Economic Development Directorate issues a
whole‐of‐government reporting timetable. The 2015‐16 timetable8 included the dates
by which reporting agencies were to submit their financial statements to the Audit
Office. The Directorate did not submit their financial statements by the required due
date. Furthermore, explanatory information (in particular, explanations for major
variances between the current year’s results and budget estimates and the current
year’s results and prior year’s results) needs to be improved. For example, the variance
information did not always explain why a variance occurred or technical terms (jargon)
were sometimes used that would only likely be understood by staff of the Directorate.
While these explanations were improved during the audit, further work is needed.
There is a higher risk that the readers of the financial statements will not understand
the financial results if explanations of major variances are not presented in plain English
or do not explain underlying reasons.
8 Budget Memorandum ‘2016/13 2015‐16 Agency Financial Statements and Consolidated Financial Statements for the Territory’.

3: Financial results and audit findings of selected reporting agencies
2015‐16 Financial Audits – Financial Results and Audit Findings Page 53
The Directorate partially agreed with this audit finding and advised that:
The systems and processes used to prepare the Directorate’s annual financial statements
were updated during the year, and will continue to be revised and improved.
Although the Directorate as a whole remains complex, it is not expected similar delays will
recur in 2016‐17.
With respect to the clarity and usefulness of variance explanations, Strategic Finance will
continue to pay particular attention to the variance commentary provided in its annual
financial statements to ensure published information is readily understood by the target
audiences.
The Directorate will also review the materiality thresholds used to determine what variance
commentary must be provided as a minimum in future annual financial statements, and will
give consideration to prior experience regarding the nature and frequency of questions
asked in the absence of variance explanations for certain ‘immaterial items’ to determine
whether variance explanations continue to be provided for some financially immaterial
items.
3.86 One new audit finding was identified in 2015‐16. The draft statement of performance
submitted for review was late and incomplete. Furthermore, it was often not obvious from
the information provided in the statement of performance how the accountability
indicators and related targets provide a basis for a meaningful assessment of the
Directorate’s performance. While explanatory information was improved during the audit,
there is a higher risk that the readers of the statement of performance will not understand
the performance of the Directorate when accountability indicators and related targets do
not provide a meaningful assessment of the Directorate’s performance.
The Directorate partially agreed with this audit finding and advised that:
The internal processes used to prepare the statement of performance will continue to be
revised and improved.
As advised in prior years, the Directorate will also continue to comprehensively review its
accountability indicators annually as part of the budget process to ensure that the most useful,
relevant and up to date information is being provided, and that it is as clear as possible what is
being measured and how.

3: Financial results and audit findings of selected reporting agencies
Page 54 2015‐16 Financial Audits – Financial Results and Audit Findings
Community Services Directorate
3.87 The Community Services Directorate (the Directorate) provides services to children and
young people, families, people with disability, carers, women, Aboriginal and Torres Strait
Islander peoples, people from culturally and linguistically diverse background and people
who are ageing.
Key Issues
The Audit Office issued an unqualified audit report on the Directorate’s 2015‐16 financial
statements and an unqualified report of factual findings on its 2015‐16 statement of
performance.
The Directorate did not achieve its budgeted net cost of services. Its net cost of services
($246.3 million) exceeded the budgeted cost ($232.7 million) by $13.6 million (5.8 percent) as
the cost of transitioning the provision of therapy and disability services to non‐government
organisations under the Commonwealth Government’s National Disability Insurance Scheme
(NDIS) were higher than anticipated. These costs were only partially offset by income
associated with this transition.
Government contributions ($252.0 million) exceeded the budgeted amount ($230.4 million) by
$21.6 million (9.4 percent) as the Directorate received a Treasurer’s Advance mainly to meet
the higher than expected costs in transitioning the provision of therapy and disability services
to non‐government organisations.
The Directorate resolved all three previously reported audit findings by ensuring that:
– payments were authorised by an officer acting within the amount of their financial
delegation. This reduces the risk of payment errors and fraud;
– its statement of performance was submitted to the Audit Office in accordance with the
Chief Minister, Treasury and Economic Development Directorate’s whole‐of‐government
reporting timetable; and
– the statement of performance submitted to the Audit Office for review contained few
errors.
One new audit finding was identified in 2015‐16. Several explanations of major variances
between current year amounts and budgeted amounts and current year amounts and prior
year amounts, included in the draft financial statements submitted for audit, were not
informative. For example, terms and expressions (jargon) were used that would only likely be
understood by its authors or possibly staff in the Directorate. While these explanations were
improved during the audit, there is a higher risk that the readers of the financial statements will
not understand the Directorate’s financial results where explanatory information is not
informative.

3: Financial results and audit findings of selected reporting agencies
2015‐16 Financial Audits – Financial Results and Audit Findings Page 55
Financial results
Table 3‐18 Key results
3.88 Expenses are mainly comprised of employee expenses and grants and other payments to
non‐government organisations to fund various services including disability support services,
out‐of‐home care for children and child protection programs.
3.89 Income includes grants received from the Commonwealth Government, recoveries of
unspent grant funding from non‐government organisations and reimbursements from the
Chief Minister, Treasury and Economic Development Directorate’s ‘Restructure Fund’ to
assist in meeting the cost of voluntary employee redundancies and restructuring costs
associated with the transition of service provisions to non‐government organisations under
the Commonwealth Government’s National Disability Insurance Scheme (NDIS).
The ‘Restructure Fund’ is used to provide funds to ACT Government agencies to meet the
costs of restructuring which are expected to provide cost savings or long‐term budgetary
benefits.
3.90 Expenses ($271.6 million) exceeded the budgeted amount ($238.0 million) by $33.6 million
(14.1 percent). The costs incurred in transitioning the provision of therapy and disability
services to non‐government organisations under the NDIS were higher than anticipated.
These costs included:
voluntary redundancies paid to therapy and disability services staff; and
grants to non‐government organisations to provide disability support and therapy
services.
Actual 2014‐15
$m
Actual 2015‐16
$m
Budget 2015‐16
$m
Expenses (265.7) (271.6) (238.0)
Income 19.4 25.3 5.3
Net cost of services (246.3) (246.3) (232.7)
Government contributions 244.2 252.0 230.4
Asset transfers to other agencies ‐ (2.2) ‐
Operating (deficit)/surplus (2.1) 3.5 (2.3)

3: Financial results and audit findings of selected reporting agencies
Page 56 2015‐16 Financial Audits – Financial Results and Audit Findings
3.91 Income ($25.3 million) exceeded the budgeted amount ($5.3 million) by $20.0 million
(377.4 percent) due to higher than anticipated:
grants from the Commonwealth Government and recovery of costs from the Health
Directorate associated with NDIS disability initiatives;
recoveries of unspent grant funding from non‐government organisations that provide
disability and therapy services under the NDIS; and
reimbursements from the Chief Minister, Treasury and Economic Development
Directorate’s ‘Restructure Fund’.
3.92 The Directorate did not achieve its budgeted net cost of services. Its net cost of services
($246.3 million) exceeded the budgeted cost ($232.7 million) by $13.6 million (5.8 percent)
as the cost of transitioning the provision of therapy and disability services to
non‐government organisations under the Commonwealth Government’s National Disability
Insurance Scheme (NDIS) were higher than anticipated. These costs were only partially
offset by income associated with this transition.
3.93 Government contributions ($252.0 million) exceeded the budgeted amount ($230.4 million)
by $21.6 million (9.4 percent) as the Directorate received a Treasurer’s Advance mainly to
meet the higher than expected costs in transitioning the provision of therapy and disability
services to non‐government organisations.
Audit findings
Table 3‐19 Status of audit findings (number of findings)
Previously Reported
Resolved Partially Resolved
Not Resolved New Balance
3 3 ‐ ‐ 1 1
3.94 The Directorate resolved all three previously reported audit findings by ensuring that:
payments were authorised by an officer acting within the amount of their financial
delegation. This reduces the risk of payment errors and fraud;
its statement of performance was submitted to the Audit Office in accordance with the
Chief Minister, Treasury and Economic Development Directorate’s
whole‐of‐government reporting timetable; and
the statement of performance submitted to the Audit Office for review contained few
errors.

3: Financial results and audit findings of selected reporting agencies
2015‐16 Financial Audits – Financial Results and Audit Findings Page 57
3.95 One new audit finding was identified in 2015‐16. Several explanations of major variances
between current year amounts and budgeted amounts and current year amounts and prior
year amounts, included in the draft financial statements submitted for audit, were not
informative. For example, terms and expressions (jargon) were used that would only likely
be understood by its authors or possibly staff in the Directorate. While these explanations
were improved during the audit, there is a higher risk that the readers of the financial
statements will not understand the Directorate’s financial results where explanatory
information is not informative.
3.96 The Directorate agreed‐in‐principle with the audit finding and advised that:
As part of the process for the development of the Directorate’s financial statements the staff
involved review and discuss the key variance explanations to ensure that they outline the
significant reasons for the variances in a simple and transparent way.
The Directorate also seeks to comply with Australian Accounting Standards which require that
‘an essential quality of the information provided in financial statements is that it is readily
understandable by users where ‘users’ are assumed to have a reasonable knowledge of business
and economic activities and accounting and a willingness to study the information with
reasonable diligence’.
The Directorate seeks to tailor financial information to a broader audience of stakeholders and
are therefore open to taking advice on simplifying and reducing jargon to improve the standard
of this communication each year.

3: Financial results and audit findings of selected reporting agencies
Page 58 2015‐16 Financial Audits – Financial Results and Audit Findings
Education Directorate
3.97 The Education Directorate (the Directorate) provides public school and early childhood
education services, regulates education and care services, and registers non‐government
schools and home educators.
3.98 Under changed administrative arrangements which took effect on 22 January 2016, the
Directorate’s vocational education and training functions were transferred to the Chief
Minister, Treasury and Economic Development Directorate.
Key Issues
The Audit Office issued an unqualified audit report on the Directorate's 2015‐16 financial
statements and an unqualified report of factual findings on its 2015‐16 statement of
performance.
The Directorate achieved its budgeted net cost of services. The net cost of its services
($686.8 million) was $39.2 million (5.4 percent) below the budgeted cost ($726.0 million). This
was largely due to lower than expected:
– grant payments as the responsibility for payment of grants to registered training
organisations for vocational education services was transferred to the Chief Minister,
Treasury and Economic Development Directorate under changed administrative
arrangements in January 2016; and
– supplies and services expenses as expenditure on repairs and maintenance occurred
earlier than expected; in 2014‐15 rather than in 2015‐16.
The Directorate did not draw down $11.3 million (19.0 percent) of the budgeted capital
injections due mainly to lower than budgeted construction costs associated with the Charles
Weston School in Coombs.
Grants provided to non‐government schools ($259.3 million) exceeded the budgeted amount
($246.6 million) by $12.7 million (5.2 percent). This was largely due to the Goods and Services
Tax being incorrectly excluded from the budgeted amount for Commonwealth Government
grants. If the budget amount had included this Goods and Services Tax, then the grants expense
would have aligned with the budget estimate.
One of the three previously reported audit findings was resolved and two were unresolved.
The Directorate resolved a previously reported audit finding and reduced the risk of errors in
the financial statements by improving its processes for correctly classifying transactions as
expenses or assets.

3: Financial results and audit findings of selected reporting agencies
2015‐16 Financial Audits – Financial Results and Audit Findings Page 59
Two previously reported audit findings were not resolved as:
– salary reports distributed to schools and business units did not always have evidence of
review. This control weakness increases the risk of erroneous or fraudulent salary
payments not being promptly detected and corrected; and
– the Directorate's school administration system (Maze) does not have a capability to
generate audit logs on access to the system or its data. The Directorate also does not have
a documented policy for the review of audit logs.
Audit logs are system‐generated records of security events. They can include details of the
identities of users, dates, times and locations of access, or attempts to access the system
to make changes to applications and data stored in databases.
There is an increased risk that erroneous or fraudulent changes will not be promptly
detected and rectified when audit logs are unable to be generated and reviewed.
Two new audit findings were identified in 2015‐16:
– A review of the Directorate's 'Fraud and Corruption, Prevention and Response Plan
2013‐15' (the Plan) was due to be completed by July 2015. This did not occur, however,
the Directorate commenced a review of the Plan in 2015‐16. As the Plan has not been
reviewed and updated in a timely manner, the Directorate has less assurance that fraud
and corruption is reduced.
– The method used by the Directorate to measure a result for accountability indicator
'Investigations and complaints commenced within stated policy timeframes' (Output
Class 1 'Public School Education') was incorrect as the timeliness of action was not being
measured. This presents a risk of incorrect or fraudulent reporting. The Directorate has
deleted this accountability indicator for 2016‐17.

3: Financial results and audit findings of selected reporting agencies
Page 60 2015‐16 Financial Audits – Financial Results and Audit Findings
Financial results
Table 3‐20 Key results ‐ Directorate
Actual
2014‐15 $m
Actual 2015‐16
$m
Budget 2015‐16
$m
Expenses (698.8) (729.2) (766.2)
Income 41.7 42.4 40.2
Net cost of services (657.1) (686.8) (726.0)
Government contributions 591.0 626.6 656.2
Operating deficit (66.1) (60.2) (69.8)
Capital injections 90.3 48.3 59.6
3.99 Expenses mainly consist of employee expenses, school operating costs, supplies and
services expenses, depreciation costs and grant payments.
3.100 Income consists mainly of international student tuition fees, voluntary contributions by
parents to schools and hire of school facilities. The Directorate also receives funding from
the Commonwealth Government for various school programs.
3.101 The Directorate achieved its budgeted net cost of services. The net cost of its services
($686.8 million) was $39.2 million (5.4 percent) below the budgeted cost ($726.0 million).
This was largely due to lower than expected:
grant payments as the responsibility for payment of grants to registered training
organisations for vocational education services was transferred to the Chief Minister,
Treasury and Economic Development Directorate under changed administrative
arrangements in January 2016; and
supplies and services expenses as expenditure on repairs and maintenance occurred
earlier than expected; in 2014‐15 rather than in 2015‐16.
3.102 The Directorate did not draw down $11.3 million (19.0 percent) of the budgeted capital
injections due mainly to lower than budgeted construction costs associated with the
Charles Weston School in Coombs.
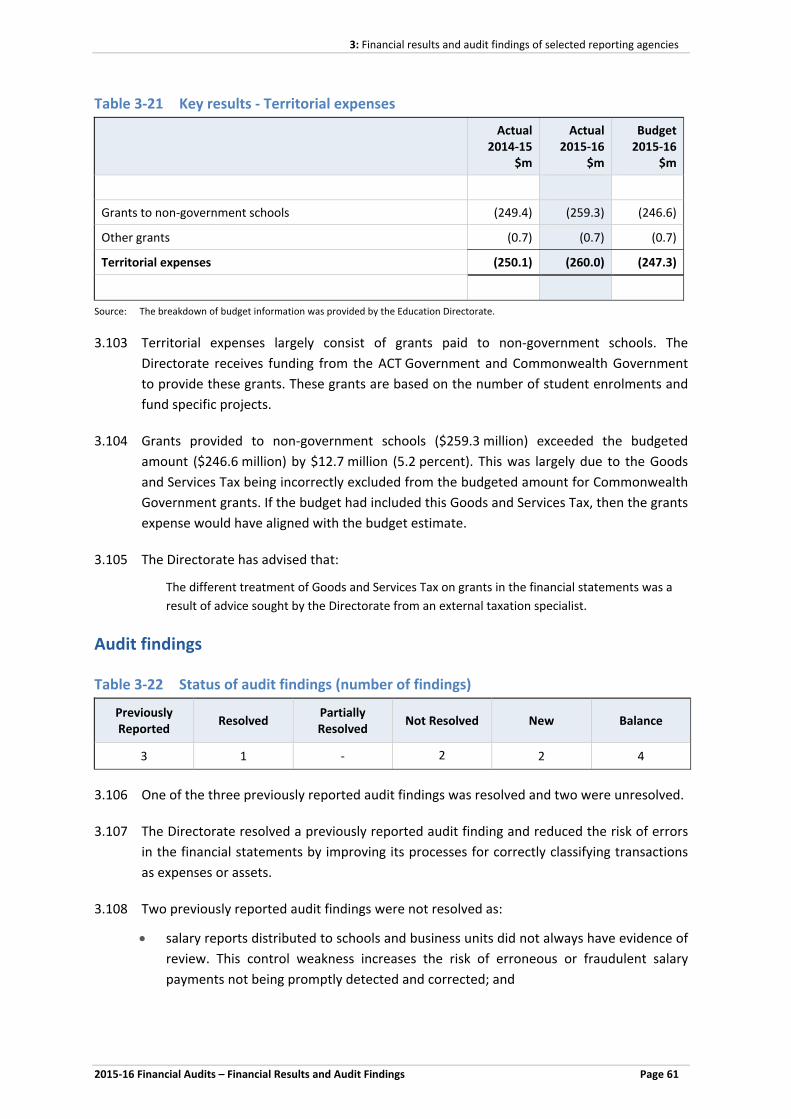
3: Financial results and audit findings of selected reporting agencies
2015‐16 Financial Audits – Financial Results and Audit Findings Page 61
Table 3‐21 Key results ‐ Territorial expenses
Actual
2014‐15 $m
Actual 2015‐16
$m
Budget 2015‐16
$m
Grants to non‐government schools (249.4) (259.3) (246.6)
Other grants (0.7) (0.7) (0.7)
Territorial expenses (250.1) (260.0) (247.3)
Source: The breakdown of budget information was provided by the Education Directorate.
3.103 Territorial expenses largely consist of grants paid to non‐government schools. The
Directorate receives funding from the ACT Government and Commonwealth Government
to provide these grants. These grants are based on the number of student enrolments and
fund specific projects.
3.104 Grants provided to non‐government schools ($259.3 million) exceeded the budgeted
amount ($246.6 million) by $12.7 million (5.2 percent). This was largely due to the Goods
and Services Tax being incorrectly excluded from the budgeted amount for Commonwealth
Government grants. If the budget had included this Goods and Services Tax, then the grants
expense would have aligned with the budget estimate.
3.105 The Directorate has advised that:
The different treatment of Goods and Services Tax on grants in the financial statements was a
result of advice sought by the Directorate from an external taxation specialist.
Audit findings
Table 3‐22 Status of audit findings (number of findings)
Previously Reported
Resolved Partially Resolved
Not Resolved New Balance
3 1 ‐ 2 2 4
3.106 One of the three previously reported audit findings was resolved and two were unresolved.
3.107 The Directorate resolved a previously reported audit finding and reduced the risk of errors
in the financial statements by improving its processes for correctly classifying transactions
as expenses or assets.
3.108 Two previously reported audit findings were not resolved as:
salary reports distributed to schools and business units did not always have evidence of
review. This control weakness increases the risk of erroneous or fraudulent salary
payments not being promptly detected and corrected; and

3: Financial results and audit findings of selected reporting agencies
Page 62 2015‐16 Financial Audits – Financial Results and Audit Findings
the Directorate’s school administration system (Maze) does not have a capability to
generate audit logs on access to the system or its data. The Directorate also does not
have a documented policy for the review of audit logs.
Audit logs are system‐generated records of security events. They can include details of
the identities of users, dates, times and locations of access, or attempts to access the
system to make changes to applications and data stored in databases.
There is an increased risk that erroneous or fraudulent changes will not be promptly
detected and rectified when audit logs are unable to be generated and reviewed.
3.109 The Directorate has advised that:
….it will address this control weakness as part of the replacement of the student administration
system. Replacement of this system is expected to commence in 2016‐17.
3.110 Two new audit findings were identified in 2015‐16.
A review of the Directorate’s ‘Fraud and Corruption, Prevention and Response Plan
2013‐15’ (the Plan) was due to be completed by July 2015. This did not occur, however,
the Directorate commenced a review of the Plan in 2015‐16. As the Plan has not been
reviewed and updated in a timely manner, the Directorate has less assurance that fraud
and corruption is reduced; and
The method used by the Directorate to measure a result for accountability indicator
‘Investigations and complaints commenced within stated policy timeframes’ (Output
Class 1 ‘Public School Education’) was incorrect as the timeliness of action was not
being measured. This presents a risk of incorrect or fraudulent reporting. The
Directorate has deleted this accountability indicator for 2016‐17.
3.111 The Directorate has agreed to address all audit findings.

3: Financial results and audit findings of selected reporting agencies
2015‐16 Financial Audits – Financial Results and Audit Findings Page 63
Environment and Planning Directorate
3.112 The Environment and Planning Directorate (the Directorate) is responsible for developing
and implementing policies and programs that address environment protection and
sustainability, nature conservation, heritage, water and energy security, sustainable urban
design, sustainable transport and spatial planning.
Key Issues
The Audit Office issued an unqualified audit report on the Directorate’s 2015‐16 financial
statements and an unqualified report of factual findings on its 2015‐16 statement of
performance.
The Directorate achieved its budgeted net cost of services. The net cost of its services
($52.2 million) was slightly below the budgeted cost ($54.7 million).
Government contributions ($49.8 million) were below the budgeted amount ($53.1 million) by
$3.3 million (6.2 percent) as the Directorate did not draw down planned contributions due
mainly to delays in climate change, environment and planning projects.
The Directorate did not draw down $3.7 million (32.2 percent) of the budgeted capital
injections due mainly to:
– delays in a planned upgrade of a development application computer information system
to allow more time for a better solution to be found; and
– fewer than anticipated loan applications being received from ACT Government agencies
to meet the cost of energy efficiency projects.
One previously reported audit finding did not recur. In 2014‐15, the statement of performance
submitted to the Audit Office did not include targets and results of the accountability indicators
for functions that were transferred to the Chief Minister, Treasury and Economic Development
Directorate. These targets and results should have been included in the statement of
performance for the period the Directorate was accountable for these functions.
One new audit finding was identified in 2015‐16. The Directorate’s accounting policy for
revenue received in advance (a liability) does not comply with Australian Accounting Standard
AASB 1004: ‘Contributions’. As a result, grant revenue of $3.1 million was incorrectly recorded
as revenue received in advance rather than revenue. The audit report on the 2015‐16 financial
statements was not qualified as this error was not material to the financial statements.

3: Financial results and audit findings of selected reporting agencies
Page 64 2015‐16 Financial Audits – Financial Results and Audit Findings
Financial results
Table 3‐23 Key results ‐ Directorate
Actual 2014‐15
$m
Actual 2015‐16
$m
Budget 2015‐16
$m
Expenses (78.5) (66.2) (62.3)
Income 10.1 14.0 7.6
Net cost of services (68.4) (52.2) (54.7)
Government contributions 63.2 49.8 53.1
Assets transferred to other agencies (34.5) ‐ ‐
Operating deficit (39.7) (2.4) (1.6)
Capital injections – Note 1 6.7 7.8 11.5
Note 1: Budgeted capital injections of $11.5 million consist of $5.5 million provided in the 2015‐16 budget and additional appropriation of $6.0 million provided in 2015‐16.
3.113 Expenses mainly consist of employee costs, costs of consultants and contractors used on
feasibility studies and planning projects, information technology and office equipment costs
and office accommodation costs. In addition, grants are paid to:
community groups to fund environmental projects; and
lower income households to improve their energy and water efficiency.
3.114 Expenses ($66.2 million) exceeded the budgeted cost ($62.3 million) by $3.9 million
(6.3 percent) due mainly to engaging a higher than anticipated number of:
staff to complete Commonwealth‐funded environment and climate change projects;
and
consultants and contractors for transport and climate change studies.
3.115 Income largely consists of:
funding received for energy efficiency programs in households and small to medium
enterprises; and
fees charged for conveyancing of land and public notification of development
applications.

3: Financial results and audit findings of selected reporting agencies
2015‐16 Financial Audits – Financial Results and Audit Findings Page 65
3.116 Income also includes revenue from receiving large scale energy generation certificates from
large scale renewable energy generators. Under the Electricity Feed‐in (Large‐scale
Renewable Energy Generation) Act 2011, large‐scale generators of electricity are required,
after generating a sufficient amount of renewable energy into the electricity network, to
create renewable energy certificates and surrender them to the Directorate at no cost. The
value of these certificates is recorded as income.
3.117 Income ($14.0 million) exceeded the budgeted amount ($7.6 million) by $6.4 million
(84.2 percent) as income from receiving large scale energy generation certificates was
higher than anticipated.
3.118 The Directorate achieved its budgeted net cost of services. The net cost of its services
($52.2 million) was slightly below the budgeted cost ($54.7 million).
3.119 Government contributions ($49.8 million) were below the budgeted amount ($53.1 million)
by $3.3 million (6.2 percent) as the Directorate did not draw down planned contributions
due mainly to delays in climate change, environment and planning projects.
3.120 In 2014‐15, assets transferred to other agencies ($34.5 million) related to the transfer of
Inner North Reticulation Network and Valley Ponds in Gungahlin to the Territory and
Municipal Services Directorate. There were no asset transfers in 2015‐16.
3.121 The Directorate did not draw down $3.7 million (32.2 percent) of the budgeted capital
injections due mainly to:
delays in a planned upgrade of a development application computer information
system to allow more time for a better solution to be found; and
fewer than anticipated loan applications being received from ACT Government agencies
to meet the cost of energy efficiency projects.
Table 3‐24 Key results – Territorial income
Actual 2014‐15
$m
Actual 2015‐16
$m
Budget 2015‐16
$m
Fees and fines 42.7 17.5 21.4
Land rent 4.4 4.9 4.0
Fees and fines and land rent revenue 47.1 22.4 25.4
3.122 The Directorate collects fees and fines revenue on behalf of the Territory. This mostly
consists of fees charged for development applications and lease variations. Land rent is
received from leasing Territorial land.

3: Financial results and audit findings of selected reporting agencies
Page 66 2015‐16 Financial Audits – Financial Results and Audit Findings
3.123 Fees and fines revenue ($17.5 million) was $3.9 million (18.2 percent) below the budgeted
amount ($21.4 million) as fewer than anticipated applications for lease variations were
received.
Audit findings
Table 3‐25 Status of audit findings (number of findings)
Previously Reported
Resolved Partially Resolved
Not Resolved New Balance
1 1 ‐ ‐ 1 1
3.124 One previously reported audit finding did not recur. In 2014‐15, the statement of
performance submitted to the Audit Office did not include targets and results of the
accountability indicators for functions that were transferred to the Chief Minister, Treasury
and Economic Development Directorate. These targets and results should have been
included in the statement of performance for the period the Directorate was accountable
for these functions.
3.125 One new audit finding was identified in 2015‐16. The Directorate’s accounting policy for
revenue received in advance (a liability) does not comply with Australian Accounting
Standard AASB 1004: ‘Contributions’. As a result, grant revenue of $3.1 million was
incorrectly recorded as revenue received in advance rather than revenue. The audit report
on the 2015‐16 financial statements was not qualified as this error was not material to the
financial statements.
3.126 The Directorate has ‘noted’ this audit finding and advised that:
The Directorate will seek further accounting advice before the financial statements are prepared
for 2016‐17.
3.127 The Audit Office will review the accounting advice obtained by the Directorate during the
audit of the 2016‐17 financial statements of the Directorate.

3: Financial results and audit findings of selected reporting agencies
2015‐16 Financial Audits – Financial Results and Audit Findings Page 67
Health Directorate
3.128 The Health Directorate (the Directorate) provides community based health services such as
public hospital and extended care services, managing public health risks and promotes
health and early care interventions.
3.129 Public hospital services provided by the Directorate are mostly funded by amounts received
from the ACT Local Hospital Network Directorate. Details of these funding arrangements are
explained on page 29 (ACT Local Hospital Network Directorate).
Key Issues
The Audit Office issued an unqualified audit report on the Directorate's 2015‐16 financial
statements and an unqualified report of factual findings on its 2015‐16 statement of
performance.
The Directorate did not achieve its budgeted net cost of services. Its net cost of services
($334.7 million) exceeded the budgeted cost ($311.1 million) by $23.6 million (7.6 percent) due
mainly to higher than expected employee and pharmaceutical costs from a higher than
expected growth in the demand for public hospital services. These higher costs were partly
offset by additional revenue from the Commonwealth.
The Directorate did not draw down $27.8 million (16.7 percent) of the budgeted capital
injections due mainly to delays in completing planned capital projects. In particular:
– the construction of a secure mental health unit was delayed due to adverse weather
conditions; and
– computer software developments were delayed due to protracted contract negotiations.
The Directorate resolved three of the four previously reported audit findings by:
– arranging an external review of its internal audit function. Implementation of the
recommendations from this review should help ensure that this function operates
effectively;
– testing the effectiveness of its business continuity plan for the residence billing system
(Room Master). This reduces the risk of the Directorate being unable to promptly resume
operations in the event of a major disruption or disaster; and
– promptly preparing and reviewing monthly bank reconciliations for the Canberra Hospital
and Health Services. This reduces the risk of undetected erroneous or fraudulent use of
these bank accounts.

3: Financial results and audit findings of selected reporting agencies
Page 68 2015‐16 Financial Audits – Financial Results and Audit Findings
The Directorate did not resolve one previously reported audit finding. Credit card acquittals
were not consistently performed in a timely manner to reduce the risk that any erroneous or
fraudulent use of credit cards will not be promptly detected.
Four new audit findings were identified in 2015‐16:
– The Directorate did not have evidence that goods or services were satisfactorily received
prior to payment for five (10.0 percent) of 50 payments reviewed by the Audit Office.
While the Directorate has advised that these goods or services were satisfactorily
received prior to payment, and the related payments were properly related to the
operations of the Directorate, this control weakness increases the risk of payment errors
and fraud.
– There were three instances (6.0 percent) from 50 payments reviewed by the Audit Office
where the officer authorising the payments did not have the required financial delegation.
While the Directorate has advised that these payments were properly related to the
operations of the Directorate, this control weakness increases the risk of payment errors
and fraud.
– The draft financial statements submitted for audit did not have explanations for all major
variances between current year and budgeted amounts. These explanations were
included in the financial statements before the audit was completed.
– Many explanations of major variances between current year amounts and budgeted
amounts, and current year amounts and prior year amounts, included in the draft
financial statements submitted for audit, needed improvement. For example, several
explanations of variances were poor and terms and expressions (jargon) were used that
would only likely be understood by its authors or possibly staff in the Directorate. While
these variance explanations were improved during the audit, there is a higher risk that the
readers of the financial statements will not understand the Directorate's financial results
where explanatory information is not clear and in plain English.

3: Financial results and audit findings of selected reporting agencies
2015‐16 Financial Audits – Financial Results and Audit Findings Page 69
Financial results
Table 3‐26 Key results
Actual
2014‐15 $m
Actual 2015‐16
$m
Budget 2015‐16
$m
Expenses (1 195.3) (1 295.0) (1 253.8)
Income 898.1 960.3 942.7
Net cost of services (297.2) (334.7) (311.1)
Government contributions 252.6 272.4 264.9
Operating deficit (44.6) (62.3) (46.2)
Other comprehensive income
Decrease in the asset revaluation surplus (0.1) 1.6 ‐
Total comprehensive deficit (44.7) (60.7) (46.2)
Capital injections 74.0 138.3 166.1
3.130 The Directorate’s income largely consists of:
amounts received from the ACT Local Hospital Network Directorate for providing public
hospital services in the ACT; and
fees and charges for providing other health services and selling medical supplies and
pharmaceuticals.
3.131 Income ($960.3 million) exceeded the budgeted amount ($942.7 million) by $17.6 million
(1.9 percent) as the Directorate received higher than anticipated revenue from the
Commonwealth due to the inclusion of additional high cost drugs to the Pharmaceutical Benefit
Scheme from 1 March 2016.
3.132 Expenses mainly consist of employee expenses, visiting medical officer expenses, pharmaceutical
costs and payments to non‐government health service providers.
3.133 Expenses ($1 295.0 million) exceeded the budgeted cost ($1 253.8 million) by $41.2 million
(3.3 percent) as the higher than expected demand for public hospital services resulted in
higher than expected employee expenses and pharmaceutical costs.
3.134 The Directorate did not achieve its budgeted net cost of services. Its net cost of services
($334.7 million) exceeded the budgeted cost ($311.1 million) by $23.6 million (7.6 percent)
due mainly to higher than expected employee and pharmaceutical costs from a higher than

3: Financial results and audit findings of selected reporting agencies
Page 70 2015‐16 Financial Audits – Financial Results and Audit Findings
expected growth in the demand for public hospital services. These higher costs were partly
offset by additional revenue from the Commonwealth.
3.135 The Directorate did not draw down $27.8 million (16.7 percent) of budgeted capital
injections due mainly to delays in completing planned capital projects. In particular:
the construction of a secure mental health unit was delayed due to adverse weather
conditions; and
computer software developments were delayed due to protracted contract
negotiations.
Table 3‐27 Status of audit findings (number of findings)
Previously Reported
Resolved Partially Resolved
Not Resolved New Balance
4 3 ‐ 1 4 5
3.136 The Directorate resolved three of the four previously reported audit findings by:
arranging an external review of its internal audit function. Implementation of the
recommendations from this review should help ensure that this function operates
effectively;
testing the effectiveness of its business continuity plan for the residence billing system
(Room Master). This reduces the risk of the Directorate being unable to promptly
resume operations in the event of a major disruption or disaster; and
promptly preparing and reviewing monthly bank reconciliations for the Canberra
Hospital and Health Services. This reduces the risk of undetected erroneous or
fraudulent use of these bank accounts.
3.137 The Directorate did not resolve one previously reported audit finding. Credit card acquittals
were not consistently performed in a timely manner to reduce the risk that any erroneous
or fraudulent use of credit cards will not be promptly detected.
3.138 Four new audit findings were identified in 2015‐16:
The Directorate did not have evidence that goods or services were satisfactorily
received prior to payment for five (10.0 percent) of 50 payments reviewed by the Audit
Office. While the Directorate has advised that these goods or services were
satisfactorily received prior to payment, and the related payments were properly
related to the operations of the Directorate, this control weakness increases the risk of
payment errors and fraud.

3: Financial results and audit findings of selected reporting agencies
2015‐16 Financial Audits – Financial Results and Audit Findings Page 71
There were three instances (6.0 percent) from 50 payments reviewed by the Audit
Office where the officer authorising the payments did not have the required financial
delegation. While the Directorate has advised that these payments were properly
related to the operations of the Directorate, this control weakness increases the risk of
payment errors and fraud.
The draft financial statements submitted for audit did not have explanations for all
major variances between current year and budgeted amounts. These explanations
were included in the financial statements before the audit was completed.
Many explanations of major variances between current year amounts and budgeted
amounts and current year amounts and prior year amounts, included in the draft
financial statements submitted for audit, needed improvement. For example, several
explanations of variances were poor and terms and expressions (jargon) were used that
would only likely be understood by its authors or possibly staff in the Directorate. While
these variance explanations were improved during the audit, there is a higher risk that
the readers of the financial statements will not understand the Directorate’s financial
results where explanatory information is not clear and in plain English.
3.139 The Directorate has agreed to address all audit findings.

3: Financial results and audit findings of selected reporting agencies
Page 72 2015‐16 Financial Audits – Financial Results and Audit Findings
Housing ACT
3.140 Housing ACT aims to provide secure and affordable housing that addresses the needs of
socially and financially disadvantaged families. It also manages arrangements with
organisations that provide services to people who have become or are at risk of becoming
homeless.
Key Issues
The Audit Office issued an unqualified audit report on Housing ACT’s 2015‐16 financial
statements and an unqualified report of factual findings on its 2015‐16 statement of
performance.
Housing ACT achieved its budgeted net cost of services. The net cost of its services
($65.1 million) was slightly below the budgeted cost ($67.5 million).
The value of Housing ACT’s property portfolio at 30 June 2016 ($4 680 million) exceeded the
value at 30 June 2015 ($4 495 million) by $185 million (4.1 percent) due largely to an upwards
revaluation of land in 2015‐16.
Housing ACT resolved three of the five previously reported audit findings by:
– promptly preparing and reviewing revenue reconciliations between the accounting
system (Oracle) and the system used to record rental revenue from public housing
tenants (Homenet). This reduces the risk that errors and fraud will not be promptly
detected and addressed;
– regularly testing the effectiveness of backup and restoration procedures for Homenet and
retaining evidence of test results. This reduces the risk that Homenet will not be
recovered in the event of a disaster, disruption or other adverse event; and
– submitting its statement of performance to the Audit Office for review in accordance with
the Chief Minister, Treasury and Economic Development Directorate’s whole‐of‐
government reporting timetable.
One previously reported audit finding was partially resolved. While Housing ACT documented
the results of its assessment of the impairment of properties, it did not address the potential
impairment of public housing properties identified for demolition and sale in the next four
years. This increases the risk that Housing ACT will not record impairment losses relating to
these properties in accordance with Australian Accounting Standard AASB 136: ‘Impairment of
Assets’.

3: Financial results and audit findings of selected reporting agencies
2015‐16 Financial Audits – Financial Results and Audit Findings Page 73
In 2015‐16, Housing ACT improved its management discussion and analysis of the financial
statements by including explanations for variances between current year and prior year results
for revenue and expenses. However, this explanatory information was poorly presented and
incomplete. In particular, explanations for variances between current and prior year results:
– were not presented separately from explanations of variances between current year and
budgeted results; and
– for assets and liabilities were not provided.
This increases the risk that the readers of the financial statements will not understand the
financial results of Housing ACT.
Financial results
Table 3‐28 Key results
3.141 Expenses mainly consist of employee and public housing property management costs.
Property management costs include repairs and maintenance costs, water and sewerage
charges, rates and depreciation of public housing properties. In addition, grants are paid to
organisations that provide services to people who have become or are at risk of becoming
homeless.
3.142 Income consists mainly of rent received from public housing tenants.
3.143 Housing ACT achieved its budgeted net cost of services. The net cost of its services
($65.1 million) was slightly below the budgeted cost ($67.5 million).
Actual
2014‐15 $m
Actual 2015‐16
$m
Budget 2015‐16
$m
Expenses (164.2) (162.1) (160.3)
Income 101.9 94.9 92.3
Gain from the sale of properties 2.4 2.1 0.5
Net cost of services (59.9) (65.1) (67.5)
Government contributions 43.4 43.5 43.5
Other gains 6.9 2.4 0.3
Losses from transferring assets to other entities (3.6) (2.8) ‐
Operating deficit (13.2) (22.0) (23.7)

3: Financial results and audit findings of selected reporting agencies
Page 74 2015‐16 Financial Audits – Financial Results and Audit Findings
3.144 The net cost of Housing ACT’s services ($65.1 million) exceeded the prior year’s cost
($59.9 million) by $5.2 million (8.7 percent) as a recovery of Good and Services input tax
credits from the Australian Taxation Office in 2014‐15 did not occur in 2015‐16.
Property portfolio
Table 3‐29 Number and value of land and dwellings
Note 1: The number of land parcels and dwellings excludes assets held for sale or distribution.
Source: Information on land and dwellings was provided by Housing ACT.
3.145 The value of Housing ACT’s property portfolio at 30 June 2016 ($4 680 million) exceeded
the value at 30 June 2015 ($4 495 million) by $185 million (4.1 percent) due largely to an
upwards revaluation of land in 2015‐16.
Audit findings
Table 3‐30 Status of audit findings (number of findings)
Previously Reported
Resolved Partially Resolved
Not Resolved New Balance
5 3 1 1 ‐ 2
3.146 Housing ACT resolved three of the five previously reported audit findings by:
promptly preparing and reviewing revenue reconciliations between the accounting
system (Oracle) and the system used to record rental revenue from public housing
tenants (Homenet). This reduces the risk that errors and fraud will not be promptly
detected and addressed;
regularly testing the effectiveness of backup and restoration procedures for Homenet
and retaining evidence of test results. This reduces the risk that Homenet will not be
recovered in the event of a disaster, disruption or other adverse event; and
At 30 June Actual 2014
Actual 2015
Actual 2016
Number of land parcels – Note 1 6 811 6 777 6 771
Land value ($m) $3 147 $3 182 $3 342
Number of dwellings – Note 1 11 773 11 585 11 658
Dwellings value ($m) $1 270 $1 312 $1 338
Total value of land and dwellings ($m) $4 417 $4 495 $4 680

3: Financial results and audit findings of selected reporting agencies
2015‐16 Financial Audits – Financial Results and Audit Findings Page 75
submitting its statement of performance to the Audit Office for review in accordance
with the Chief Minister, Treasury and Economic Development Directorate’s whole‐of‐
government reporting timetable.
3.147 One previously reported audit finding was partially resolved. While Housing ACT
documented the results of its assessment of the impairment of properties, it did not
address the potential impairment of public housing properties identified for demolition and
sale in the next four years. This increases the risk that Housing ACT will not record
impairment losses relating to these properties in accordance with Australian Accounting
Standard AASB 136: ‘Impairment of Assets’.
3.148 Housing ACT agreed to address this audit finding.
3.149 Housing ACT did not resolve one previously reported audit finding. In 2014‐15, the Audit
Office reported that the management discussion and analysis of Housing ACT’s financial
statements did not include explanations of variances between the current and prior year
results as required by the ‘Management Discussion and Analysis Better Practice Guideline’
issued by the former Treasury Directorate’s Accounting Branch.
3.150 In 2015‐16, Housing ACT improved its management discussion and analysis of the financial
statements by including explanations for variances between current year and prior year
results for revenue and expenses. However, this explanatory information was poorly
presented and incomplete. In particular, explanations for variances between current and
prior year results:
were not presented separately from explanations of variances between current year
and budgeted results; and
for assets and liabilities were not provided.
This increases the risk that the readers of the financial statements will not understand the
financial results of Housing ACT.
3.151 Housing ACT partially agreed with this audit finding and advised that:
Reporting in the management discussion and analysis will be further improved for the year
ended 30 June 2017. However, the report will also consider a more strategic focus on the public
housing operations, rather than contain a detailed analysis of variances, as there is considerable
variance analysis in the financial statements.
3.152 Housing ACT plans to improve its management discussion and analysis and correctly notes
that its financial statements include explanations for variances. If the management
discussion and analysis were presented in accordance with the ‘Management Discussion
and Analysis Better Practice Guideline’, then the analysis would have included variance
explanations for key financial results, including Housing ACT’s net cost of services, total
revenue, total expenses, total assets and total liabilities. This information was not provided
in the financial statements.

3: Financial results and audit findings of selected reporting agencies
Page 76 2015‐16 Financial Audits – Financial Results and Audit Findings
Icon Water Limited
3.153 The main activities of Icon Water Limited (Icon Water) are to provide water, sewerage and
related services and manage its 50 percent interest in the ActewAGL Joint Venture
(ActewAGL) energy business. ActewAGL is discussed on pages 32 to 37.
3.154 Icon Water’s two subsidiaries, Icon Retail Investments Limited and Icon Distribution
Investments Limited, hold a 50 percent interest in the ActewAGL Retail Partnership and
ActewAGL Distribution Partnership respectively.
Key Issues
The Audit Office issued an unqualified audit report on the 2015‐16 financial statements of Icon
Water Limited, Icon Distribution Investments Limited and Icon Retail Investments Limited.
Icon Water’s share of profit from ActewAGL in 2015‐16 ($100.2 million) was consistent with
2014‐15 ($101.1 million).
Icon Water’s operating profit ($122.4 million) significantly exceeded the previous year’s profit
($97.7 million) by $24.7 million (25.3 percent) due mainly to an increase in:
– water and sewerage revenue from higher customer numbers and consumption; and
– water and sewerage assets constructed by developers and contributed to Icon Water.
Dividends paid or payable to the ACT Government decreased significantly by $13.9 million
(14.8 percent) from $93.9 million in 2014‐15 to $80.0 million in 2015‐16.
Icon Water’s short‐term financial position at 30 June 2016 (net short‐term liabilities of
$12.9 million) is much stronger than the position which existed at 30 June 2015 (net short‐term
liabilities of $70.1 million). This stronger position was mainly due to the refinancing of
borrowings which resulted in borrowings being reclassified from a current liability to a non‐
current liability.
Icon Water continued to have sufficient assets to cover its liabilities at 30 June 2016. Its net
assets position increased by $51.2 million (4.2 percent) from $1 225.3 million at 30 June 2015
to $1 276.5 million at 30 June 2016.
Icon Water resolved the one previously reported audit finding by implementing processes
which ensure that all water and sewerage assets contributed from private developers are
recorded.
No new audit findings were identified in 2015‐16.

3: Financial results and audit findings of selected reporting agencies
2015‐16 Financial Audits – Financial Results and Audit Findings Page 77
Financial results
Table 3‐31 Key results
Actual
2014‐15 $m
Actual 2015‐16
$m
Revenue excluding share of profit from ActewAGL 320.7 350.1
Share of profit from ActewAGL 101.1 100.2
Revenue 421.8 450.3
Expenses (281.5) (277.3)
Operating profit before income tax expense 140.3 173.0
Income tax expense (42.6) (50.6)
Operating profit 97.7 122.4
Dividends paid or payable to the ACT Government 93.9 80.0
Note: The financial results shown above are the consolidated results of Icon Water group. This consists of Icon Water Limited, Icon Distribution Investments Limited and Icon Retail Investments Limited.
3.155 Revenue mostly consists of charges for water supply, sewerage services and share of profit
from ActewAGL.
3.156 Revenue excluding share of profit from ActewAGL ($350.1 million) exceeded the previous
year’s amount ($320.7 million) by $29.4 million (9.2 percent). This was due mainly to an
increase in:
water and sewerage revenue from higher customer numbers and consumption; and
water and sewerage assets constructed by developers and contributed to Icon Water.
3.157 Icon Water’s share of profit from ActewAGL in 2015‐16 ($100.2 million) was consistent with
2014‐15 ($101.1 million).
3.158 Expenses largely consist of operating costs for the business, interest costs incurred on
borrowings, depreciation and amortisation expenses and employee expenses.
3.159 Total expenses ($277.3 million) were slightly lower than the prior year’s amount
($281.5 million) by $4.2 million (1.5 percent).
3.160 Income tax expense ($50.6 million) exceeded the prior year’s expense ($42.6 million) by
$8.0 million (18.8 percent) due to higher taxable profits.

3: Financial results and audit findings of selected reporting agencies
Page 78 2015‐16 Financial Audits – Financial Results and Audit Findings
3.161 Icon Water’s operating profit ($122.4 million) significantly exceeded the previous year’s
profit ($97.7 million) by $24.7 million (25.3 percent) due mainly to an increase in:
water and sewerage revenue from higher customer numbers and consumption; and
water and sewerage assets constructed by developers and contributed to Icon Water.
3.162 Dividends paid or payable to the ACT Government decreased significantly by $13.9 million
(14.8 percent) from $93.9 million in 2014‐15 to $80.0 million in 2015‐16.
Net short‐term liabilities
Table 3‐32 Net short‐term liabilities
At 30 June Actual 2015 $m
Actual 2016 $m
Short‐term assets 133.2 122.2
Short‐term liabilities including dividend payable to the ACT Government (203.3) (135.1)
Net short‐term liabilities (70.1) (12.9)
Ratio of short‐term assets to short‐term liabilities including dividend payable to the ACT Government
0.7 to 1
0.9 to 1
3.163 Icon Water’s short‐term financial position at 30 June 2016 (net short‐term liabilities of
$12.9 million) is much stronger than the position which existed at 30 June 2015 (net
short‐term liabilities of $70.1 million). This stronger position was mainly due to the
refinancing of borrowings which resulted in borrowings being reclassified from a current
liability to a non‐current liability.

3: Financial results and audit findings of selected reporting agencies
2015‐16 Financial Audits – Financial Results and Audit Findings Page 79
Net assets
Table 3‐33 Net assets
At 30 June Actual 2015 $m
Actual 2016 $m
Assets 3 215.2 3 308.8
Liabilities (1 989.9) (2 032.3)
Net assets 1 225.3 1 276.5
Ratio of assets to liabilities 1.6 to 1 1.6 to 1
3.164 Icon Water continued to have sufficient assets to cover its liabilities at 30 June 2016. Its net
assets position increased by $51.2 million (4.2 percent) from $1 225.3 million at
30 June 2015 to $1 276.5 million at 30 June 2016.
Audit findings
Table 3‐34 Status of audit findings (number of findings)
Previously Reported
Resolved Partially Resolved
Not Resolved New Balance
1 1 ‐ ‐ ‐ ‐
3.165 Icon Water resolved the one previously reported audit finding by implementing processes
which ensure that all water and sewerage assets contributed from private developers are
recorded.
3.166 In 2014‐15, Icon Water identified that it has not been recording water and sewerage assets
constructed by private developers. Private developers perform site works, including placing
water and sewerage pipes at new developments. Once these are completed, the assets are
contributed to Icon Water and form part of the water and sewerage network maintained by
Icon Water. These errors were corrected in the 2014‐15 financial statements of Icon Water.
3.167 No new audit findings were identified in 2015‐16.

3: Financial results and audit findings of selected reporting agencies
Page 80 2015‐16 Financial Audits – Financial Results and Audit Findings
Justice and Community Safety Directorate
3.168 The Justice and Community Safety Directorate (the Directorate) provides courts, corrections,
justice, legal, emergency and policing services. It contains the Legislation, Policy and
Programs; ACT Law Courts and Tribunal; ACT Government Solicitor's Office;
ACT Parliamentary Counsel's Office; ACT Corrective Services; Security and Emergency
Management Branch and Emergency Services Agency. The Directorate’s operations include
services provided by the Director of Public Prosecutions and ACT Human Rights Commission.
3.169 Policing services provided by the Australian Federal Police are paid for from the
Directorate’s territorial operations.
Key Issues
The Audit Office issued an unqualified audit report on the Directorate’s 2015‐16 financial
statements and an unqualified report of factual findings on its 2015‐16 statement of
performance.
The Directorate achieved its budgeted net cost of services excluding the gain from assets
received as its net cost of services excluding the gain from assets received ($276.8 million) was
slightly below the budgeted cost ($280.9 million).
Capital injections received by the Directorate ($49.4 million) were significantly less than
planned ($83.9 million). The Directorate did not draw down $34.5 million (41.1 percent) of the
planned capital injections due to:
– delays in several capital projects, including the upgrade and relocation of emergency
services stations, and information and communication technology projects (e.g. a radio
transmission network) for the Emergency Services Agency; and replacement of the case
management system for the ACT Law Courts and Tribunal; and
– less than budgeted cost of constructing new facilities at the Alexander Maconochie Centre
and ACT Law Courts (temporary accommodation for judicial staff and court room).
Payments to the Australian Federal Police for policing services ($154.2 million) aligned with the
budgeted payments ($154.2 million).
Note 36: ‘Commitments’ to the 2015‐16 financial statements discloses $706.5 million (excluding
GST) in commitments relating to the Directorate’s public‐private partnership with a private
sector consortium (Juris Partnership) to design, construct, operate, maintain and finance new
ACT Law Courts. The Directorate has advised the ACT Law Courts project will be accounted for
as a finance lease under Australian Accounting Standard AASB 117: ‘Leases’. This will involve
recording of the constructed assets and corresponding finance lease liabilities from the
commencement date of each stage of the project (Stage 1 ‐ November 2017, Stage 2 –
August 2018).

3: Financial results and audit findings of selected reporting agencies
2015‐16 Financial Audits – Financial Results and Audit Findings Page 81
The Directorate resolved two of the four previously reported audit findings with the remaining
two being partially resolved.
The Directorate resolved two audit findings by ensuring that:
– the financial delegations register on the Directorate’s intranet was consistent with the
financial delegations approved by the Director‐General. This reduces the risk of payment
errors and fraud; and
– long outstanding unreconciled items in its bank accounts were investigated and resolved.
This reduces the risk of undetected errors and fraud.
The Directorate partially resolved two audit findings:
– The Directorate tested the effectiveness of the business continuity plans for the ACT Law
Courts and Tribunal and ACT Corrective Services. However, the Emergency Services
Agency’s business continuity plan was not tested. This increases the risk that critical
systems will not be promptly recovered and key operations resumed without the loss of
data, in the event of a disaster or other major disruption.
– While the Directorate approved an information technology strategic plan for 2016‐17
(‘Justice and Community Safety ICT Strategic Plan 2016‐17’), this did not include actions to
achieve the plan’s stated objectives. This increases the risk that information technology
systems may not meet emerging priorities and needs of the Directorate.
Two new audit findings were identified in 2015‐16:
– Salary reports were not always reviewed in a timely manner. This increases the risk of
erroneous or fraudulent payments to employees not being promptly detected and
addressed.
– The Directorate will need to ensure that transactions relating to the public‐private
partnership for the new ACT Law Courts continue to be accounted for, and disclosed, in
accordance with relevant accounting standards in its financial statements.
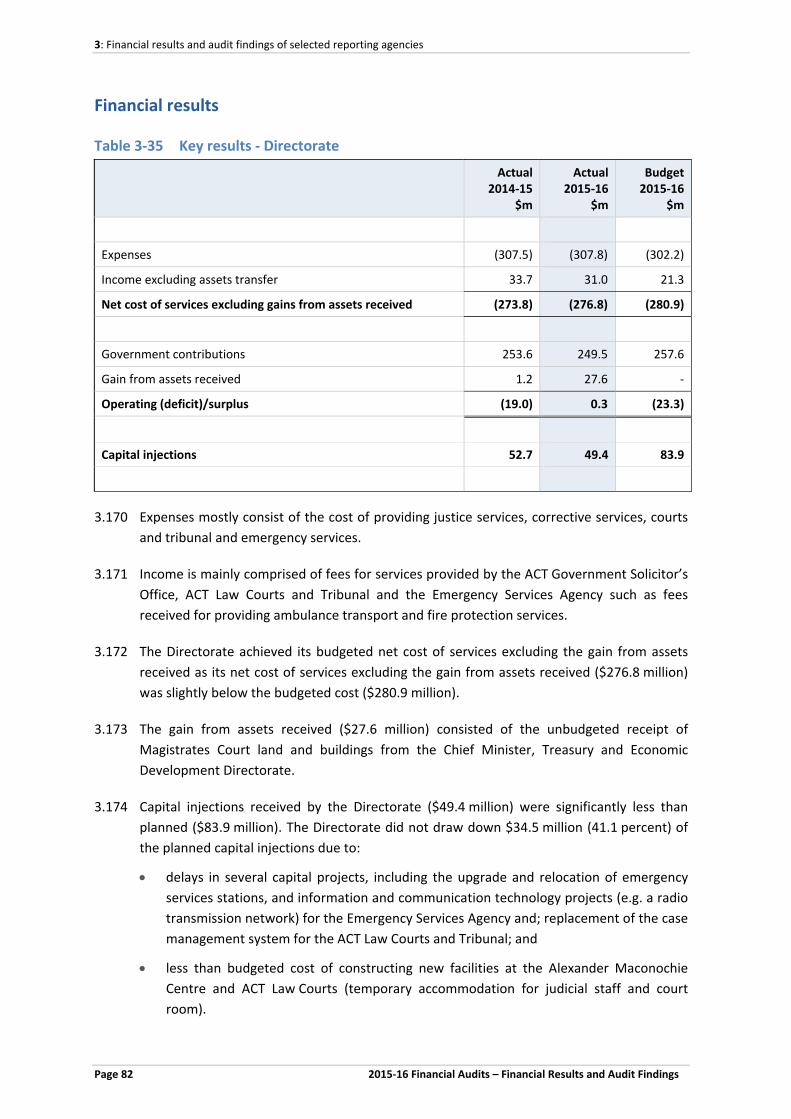
3: Financial results and audit findings of selected reporting agencies
Page 82 2015‐16 Financial Audits – Financial Results and Audit Findings
Financial results
Table 3‐35 Key results ‐ Directorate
Actual
2014‐15 $m
Actual 2015‐16
$m
Budget 2015‐16
$m
Expenses (307.5) (307.8) (302.2)
Income excluding assets transfer 33.7 31.0 21.3
Net cost of services excluding gains from assets received (273.8) (276.8) (280.9)
Government contributions 253.6 249.5 257.6
Gain from assets received 1.2 27.6 ‐
Operating (deficit)/surplus (19.0) 0.3 (23.3)
Capital injections 52.7 49.4 83.9
3.170 Expenses mostly consist of the cost of providing justice services, corrective services, courts
and tribunal and emergency services.
3.171 Income is mainly comprised of fees for services provided by the ACT Government Solicitor’s
Office, ACT Law Courts and Tribunal and the Emergency Services Agency such as fees
received for providing ambulance transport and fire protection services.
3.172 The Directorate achieved its budgeted net cost of services excluding the gain from assets
received as its net cost of services excluding the gain from assets received ($276.8 million)
was slightly below the budgeted cost ($280.9 million).
3.173 The gain from assets received ($27.6 million) consisted of the unbudgeted receipt of
Magistrates Court land and buildings from the Chief Minister, Treasury and Economic
Development Directorate.
3.174 Capital injections received by the Directorate ($49.4 million) were significantly less than
planned ($83.9 million). The Directorate did not draw down $34.5 million (41.1 percent) of
the planned capital injections due to:
delays in several capital projects, including the upgrade and relocation of emergency
services stations, and information and communication technology projects (e.g. a radio
transmission network) for the Emergency Services Agency and; replacement of the case
management system for the ACT Law Courts and Tribunal; and
less than budgeted cost of constructing new facilities at the Alexander Maconochie
Centre and ACT Law Courts (temporary accommodation for judicial staff and court
room).

3: Financial results and audit findings of selected reporting agencies
2015‐16 Financial Audits – Financial Results and Audit Findings Page 83
Table 3‐36 Key results ‐ Territorial expenses
Actual
2014‐15 $m
Actual 2015‐16
$m
Budget 2015‐16
$m
Payments to the Australian Federal Police 153.5 154.2 154.2
Other expenses 13.0 10.9 9.1
166.5 165.1 163.3
Source: The breakdown of budget information was provided by the Justice and Community Safety Directorate.
3.175 Territorial expenses consist mainly of payments to the Australian Federal Police to provide
policing services.
3.176 Payments to the Australian Federal Police for policing services ($154.2 million) aligned with
the budgeted payments ($154.2 million).
Table 3‐37 ACT Law Courts project – Public‐Private Partnership commitments
Finance Lease Commitments
$m
Capital Commitments
$m
Operating Commitments
$m
Total (excluding GST)
$m
Within one year ‐ ‐ ‐ ‐
Later than one year but not later than five years
49.9
‐
20.9
70.8
Later than five years 329.6 118.8 187.3 635.7
Total public‐private partnership commitments
379.5
118.8
208.2
706.5
3.177 Note 36: ‘Commitments’ to the 2015‐16 financial statements discloses $706.5 million
(excluding GST) in commitments relating to the Directorate’s public‐private partnership
with a private sector consortium (Juris Partnership) to design, construct, operate, maintain
and finance new ACT Law Courts. The Directorate has advised the ACT Law Courts project
will be accounted for as a finance lease under Australian Accounting Standard AASB 117:
‘Leases’. This will involve recording of the constructed assets and corresponding finance
lease liabilities from the commencement date of each stage of the project (Stage 1 ‐
November 2017, Stage 2 ‐ August 2018).

3: Financial results and audit findings of selected reporting agencies
Page 84 2015‐16 Financial Audits – Financial Results and Audit Findings
Audit findings
Table 3‐38 Status of findings (number of findings)
Previously Reported
Resolved Partially Resolved
Not Resolved New Balance
4 2 2 ‐ 2 4
3.178 The Directorate resolved two of the four previously reported audit findings with the
remaining two being partially resolved.
3.179 The Directorate resolved two audit findings by ensuring that:
the financial delegations register on the Directorate’s intranet was consistent with the
financial delegations approved by the Director‐General. This reduces the risk of
payment errors and fraud; and
long outstanding unreconciled items in its bank accounts were investigated and
resolved. This reduces the risk of undetected errors and fraud.
3.180 The Directorate partially resolved two audit findings:
The Directorate tested the effectiveness of the business continuity plans for the
ACT Law Courts and Tribunal and ACT Corrective Services. However, the Emergency
Services Agency’s business continuity plan was not tested. This increases the risk that
critical systems will not be promptly recovered and key operations resumed, without
the loss of data, in the event of a disaster or other major disruption.
The Directorate agreed with this audit finding and advised that it:
…. will ensure that business units test their business continuity plans and evaluate the
results of those tests to resolve any identified issues.
While the Directorate approved an information technology strategic plan for 2016‐17
(‘Justice and Community Safety ICT Strategic Plan 2016‐17’), this did not include actions
to achieve the plan’s stated objectives. This increases the risk that information
technology systems may not meet emerging priorities and needs of the Directorate.
The Directorate partially agreed with this audit finding and advised that:
A new information technology strategic plan will be developed to align to the new
Directorate strategic plan which covers the period from 2017 to 2021. The planned actions
to meet the objectives will be documented and tracked.

3: Financial results and audit findings of selected reporting agencies
2015‐16 Financial Audits – Financial Results and Audit Findings Page 85
3.181 Two new audit findings were identified in 2015‐16:
Salary reports were not always reviewed in a timely manner. This increases the risk of
erroneous or fraudulent payments to employees not being promptly detected and
addressed.
The Directorate has agreed to address this audit finding.
The Directorate will need to ensure that transactions relating to the public‐private
partnership for the new ACT Law Courts continue to be accounted for, and disclosed, in
its financial statements in accordance with relevant accounting standards.
The Directorate noted this audit finding and has advised that it:
… will continue to ensure that the ACT Law Courts Project is accounted for in accordance
with relevant accounting standards. Developments in accounting standards in this area will
be closely monitored and complied with. The Directorate will continue open and proactively
engage Chief Minister, Treasury and Economic Development Directorate and the Audit
Office on any accounting issues and treatments in relation to Public‐Private Partnerships
(PPP), with expert accounting advice sought where appropriate.
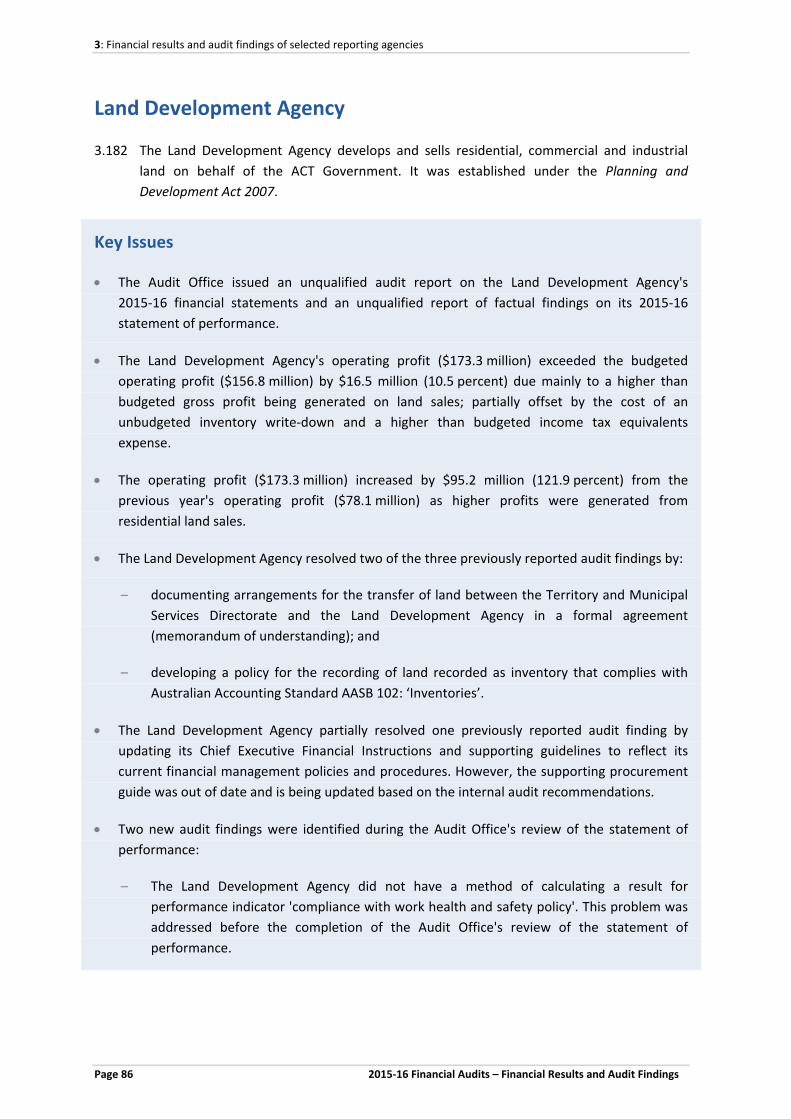
3: Financial results and audit findings of selected reporting agencies
Page 86 2015‐16 Financial Audits – Financial Results and Audit Findings
Land Development Agency
3.182 The Land Development Agency develops and sells residential, commercial and industrial
land on behalf of the ACT Government. It was established under the Planning and
Development Act 2007.
Key Issues
The Audit Office issued an unqualified audit report on the Land Development Agency's
2015‐16 financial statements and an unqualified report of factual findings on its 2015‐16
statement of performance.
The Land Development Agency's operating profit ($173.3 million) exceeded the budgeted
operating profit ($156.8 million) by $16.5 million (10.5 percent) due mainly to a higher than
budgeted gross profit being generated on land sales; partially offset by the cost of an
unbudgeted inventory write‐down and a higher than budgeted income tax equivalents
expense.
The operating profit ($173.3 million) increased by $95.2 million (121.9 percent) from the
previous year's operating profit ($78.1 million) as higher profits were generated from
residential land sales.
The Land Development Agency resolved two of the three previously reported audit findings by:
– documenting arrangements for the transfer of land between the Territory and Municipal
Services Directorate and the Land Development Agency in a formal agreement
(memorandum of understanding); and
– developing a policy for the recording of land recorded as inventory that complies with
Australian Accounting Standard AASB 102: ‘Inventories’.
The Land Development Agency partially resolved one previously reported audit finding by
updating its Chief Executive Financial Instructions and supporting guidelines to reflect its
current financial management policies and procedures. However, the supporting procurement
guide was out of date and is being updated based on the internal audit recommendations.
Two new audit findings were identified during the Audit Office's review of the statement of
performance:
– The Land Development Agency did not have a method of calculating a result for
performance indicator 'compliance with work health and safety policy'. This problem was
addressed before the completion of the Audit Office's review of the statement of
performance.
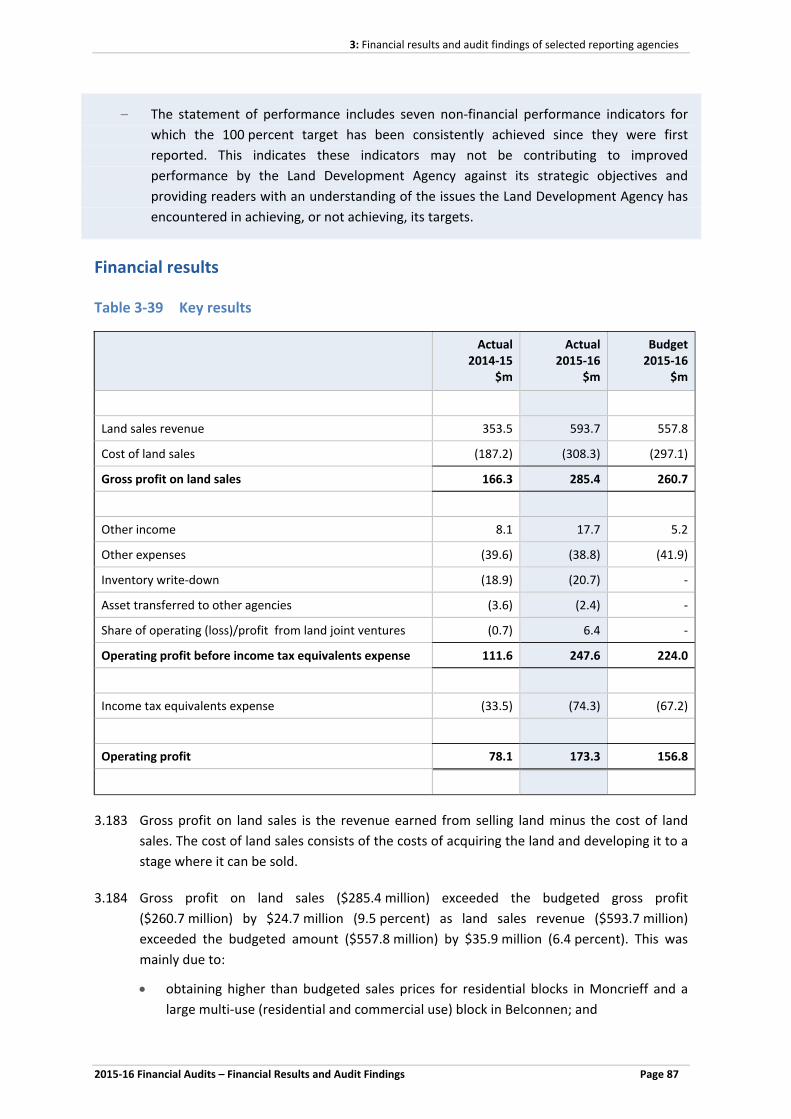
3: Financial results and audit findings of selected reporting agencies
2015‐16 Financial Audits – Financial Results and Audit Findings Page 87
– The statement of performance includes seven non‐financial performance indicators for
which the 100 percent target has been consistently achieved since they were first
reported. This indicates these indicators may not be contributing to improved
performance by the Land Development Agency against its strategic objectives and
providing readers with an understanding of the issues the Land Development Agency has
encountered in achieving, or not achieving, its targets.
Financial results
Table 3‐39 Key results
3.183 Gross profit on land sales is the revenue earned from selling land minus the cost of land
sales. The cost of land sales consists of the costs of acquiring the land and developing it to a
stage where it can be sold.
3.184 Gross profit on land sales ($285.4 million) exceeded the budgeted gross profit
($260.7 million) by $24.7 million (9.5 percent) as land sales revenue ($593.7 million)
exceeded the budgeted amount ($557.8 million) by $35.9 million (6.4 percent). This was
mainly due to:
obtaining higher than budgeted sales prices for residential blocks in Moncrieff and a
large multi‐use (residential and commercial use) block in Belconnen; and
Actual 2014‐15
$m
Actual 2015‐16
$m
Budget 2015‐16
$m
Land sales revenue 353.5 593.7 557.8
Cost of land sales (187.2) (308.3) (297.1)
Gross profit on land sales 166.3 285.4 260.7
Other income 8.1 17.7 5.2
Other expenses (39.6) (38.8) (41.9)
Inventory write‐down (18.9) (20.7) ‐
Asset transferred to other agencies (3.6) (2.4) ‐
Share of operating (loss)/profit from land joint ventures (0.7) 6.4 ‐
Operating profit before income tax equivalents expense 111.6 247.6 224.0
Income tax equivalents expense (33.5) (74.3) (67.2)
Operating profit 78.1 173.3 156.8

3: Financial results and audit findings of selected reporting agencies
Page 88 2015‐16 Financial Audits – Financial Results and Audit Findings
additional revenue from a variation to a sale agreement for a commercial block in
Canberra city.
These were partially offset by lower than budgeted sales of ACT Government assets (mainly
public housing and office buildings) as the anticipated transfer of assets from other
ACT Government agencies to the Land Development Agency for sale in 2015‐16 did not
occur.
3.185 The Land Development Agency incurred an unbudgeted cost of $20.7 million in 2015‐16
($18.9 million in 2014‐15) from writing down the value of land inventories received free of
charge from other ACT Government agencies to nil. Australian Accounting Standard
AASB 102: ‘Inventories’ requires inventories to be measured at the lower of their cost and
net realisable value. As the Land Development Agency received these land inventories at no
cost, their value was therefore written down to zero.
3.186 The income tax equivalents expense exceeded the budgeted cost by $7.1 million
(10.6 percent) due to the generation of a higher than budgeted gross profit from land sales.
3.187 The Land Development Agency’s operating profit ($173.3 million) exceeded the budgeted
operating profit ($156.8 million) by $16.5 million (10.5 percent) due mainly to a higher than
budgeted gross profit being generated on land sales; partially offset by the cost of an
unbudgeted inventory write‐down and a higher than budgeted income tax equivalents
expense.
3.188 The operating profit ($173.3 million) increased by $95.2 million (121.9 percent) from the
previous year’s operating profit ($78.1 million) due to higher profits being generated from
residential land sales.
Audit findings
Table 3‐40 Status of audit findings (number of findings)
Previously Reported
Resolved Partially Resolved
Not Resolved New Balance
3 2 1 ‐ 2 3
3.189 The Land Development Agency resolved two of the three previously reported audit findings
by:
documenting arrangements for the transfer of land between the Territory and
Municipal Services Directorate and the Land Development Agency in a formal
agreement (memorandum of understanding); and
developing a policy for the recording of land recorded as inventory that complies with
Australian Accounting Standard AASB 102: ‘Inventories’.

3: Financial results and audit findings of selected reporting agencies
2015‐16 Financial Audits – Financial Results and Audit Findings Page 89
3.190 The Land Development Agency partially resolved one previously reported audit finding by
updating its Chief Executive Financial Instructions and supporting guidelines to reflect its
current financial management policies and procedures. However, the supporting
procurement guide was out of date and is being updated based on the internal audit
recommendations.
3.191 Two new audit findings were identified during the Audit Office’s review of the statement of
performance:
The Land Development Agency did not have a method of calculating a result for
performance indicator ‘compliance with work health and safety policy’. This problem
was addressed before the completion of the Audit Office’s review of the statement of
performance.
The statement of performance includes seven non‐financial performance indicators for
which the 100 percent target has been consistently achieved since they were first
reported. Ongoing achievement of 100 percent targets indicates these indicators may
not be:
contributing to improved performance by the Land Development Agency against
its strategic objectives; and
providing readers with an understanding of the issues the Land Development
Agency has encountered in achieving, or not achieving, its targets.
The Land Development Agency has advised that it:
… will review the appropriateness of the performance indicators included in the statement
of intent and statement of performance.
3.192 The Land Development Agency has agreed to address all audit findings.

3: Financial results and audit findings of selected reporting agencies
Page 90 2015‐16 Financial Audits – Financial Results and Audit Findings
Superannuation Provision Account
3.193 The Superannuation Provision Account manages and records the superannuation
investment assets and the defined benefit employer superannuation liabilities of the
Territory. The defined benefit superannuation liabilities and expenses are for current and
former ACT Government employees who are members of Commonwealth Government
defined benefit superannuation schemes being the Commonwealth Superannuation
Scheme (CSS) and Public Sector Superannuation Scheme (PSS), as well as eligible Members
of the Legislative Assembly who are entitled to the Legislative Assembly Members’
Superannuation Scheme.
3.194 The Commonwealth Superannuation Corporation (CSC) administers the ACT Government’s
employee membership in the CSS and the PSS. The Territory reimburses CSC for the
employer‐financed share of superannuation benefits paid for current and former
ACT Government employees from 1 July 1989. The Commonwealth Government is liable for
superannuation liabilities incurred before this date.
3.195 The CSS and PSS were closed to new members from 1 July 1990 and 1 July 2005 respectively.
The Public Sector Superannuation Accumulation Plan (PSSap) was offered to employees
from 1 July 2005 until access to this scheme was closed to new members from 7 October
2006. Employees of the ACT Government are now offered superannuation accumulation
schemes of their choice.
3.196 The ACT Government aims to extinguish the Territory’s unfunded defined benefit
superannuation liability through a combination of budget appropriation and investment
earnings. The Budget Papers disclose that:
Fully funding the defined benefit superannuation liability over time is a key financial objective of
the Government. Unlike other jurisdictions, the Government does not operate a superannuation
fund for employees. The Government has established a Superannuation Provision Account (SPA)
for the purpose of recognising the defined benefit superannuation liabilities and holding and
investing the financial assets set aside to meet the Government’s ongoing employer
superannuation benefit obligations (emerging cost payments) to the Commonwealth
Government9.
Key Issues
The Audit Office issued an unqualified audit report on the Superannuation Provision Account's
2015‐16 financial statements and an unqualified report of factual findings on its 2015‐16
statement of performance.
9 Page 293 of 2016‐17 Budget Paper 3: Budget Outlook, Chapter 8 – Asset and Liability Management, 8.2 Unfunded Superannuation Liability.

3: Financial results and audit findings of selected reporting agencies
2015‐16 Financial Audits – Financial Results and Audit Findings Page 91
The Superannuation Provision Account did not achieve its budgeted operating result. Its
operating deficit ($458.1 million) exceeded the budgeted deficit ($242.4 million) by
$215.7 million (89.0 percent) due to the combined effects of higher than estimated
superannuation costs of $56.2 million (11.4 percent) and a net loss being incurred in the fair
value of investments of $10.6 million compared to the estimated gain of $131.4 million.
The Superannuation Provision Account has a substantial unfunded superannuation liability. This
unfunded superannuation liability means that the superannuation liability exceeds financial
assets set aside to meet this liability.
The unfunded superannuation liability at 30 June 2016 ($7 271.5 million) was substantially
higher than the:
– budgeted unfunded position ($2 485.3 million) by $4 786.2 million (192.6 percent); and
– unfunded position at 30 June 2015 ($5 147.6 million) by $2 123.9 million (41.3 percent).
The increase in the unfunded superannuation liability is mainly due to the use of a lower
discount rate to estimate the present value of the superannuation liability at 30 June 2016
compared to the rate which was used to prepare the budget estimate and the estimate of the
liability at 30 June 2015.
In recent years, the unfunded superannuation liability position has significantly increased from
an unfunded position of $4 165.6 million at 30 June 2013 to $7 271.5 million at 30 June 2016.
This represents an increase in the unfunded position over this period of $3 105.9 million (an
average annual increase of 24.9 percent).
The unfunded superannuation liability position is estimated to decrease substantially over the
forward years from the unfunded position at 30 June 2016 of $7 271.5 million to
$2 666.1 million by 30 June 2020.
For the large estimated decrease in the superannuation liability over the forward years to
occur, there would need to be a significant increase in the Commonwealth Government bond
(discount) rate used to estimate the superannuation liability.
Annual cash payments to meet superannuation obligations are projected to significantly
increase over the next three decades (2041), peaking at $672.3 million in 2043 and then
reducing until fully paid. This mainly reflects the age profile of the Territory's employees who
are members of the CSS and PSS. Most of these employees are expected to retire over the next
two decades. The Territory will be required to pay the superannuation benefit accrued over
these employees' years of service. For many members, the retirement benefits provided under
the defined benefit schemes will be taken as indexed pensions and will continue throughout
these employees' lives and that of their surviving spouses.

3: Financial results and audit findings of selected reporting agencies
Page 92 2015‐16 Financial Audits – Financial Results and Audit Findings
Financial results
Table 3‐41 Key results
Actual
2014‐15 $m
Actual 2015‐16
$m
Budget 2015‐16
$m
Income 129.6 112.9 129.7
Net gain/(loss) on the fair value of investments 182.5 (10.6) 131.4
Expenses (546.6) (560.5) (503.5)
Operating deficit (234.5) (458.1) (242.4)
3.197 Income consists mainly of distributions, dividends and interest from superannuation
investments. Income ($112.9 million) was $16.8 million (13.0 percent) lower than the
budget estimate ($129.7 million) as interest, dividends and distributions received on
investments were less than anticipated.
3.198 The Superannuation Provision Account incurred a net loss in the fair value of investments
($10.6 million) compared to the budgeted net gain ($131.4 million) as conditions in
investment markets resulted in a lower return than estimated in the budget.
3.199 Investments in Australian and global investment markets are subject to market risk and
fluctuate according to global economic and financial conditions.
3.200 The Superannuation Provision Account has advised that:
The budget estimates for investment earnings incorporate a long‐term portfolio target
investment return objective. The investment portfolio is targeting an average annual return that
is five per cent above consumer price index (CPI) increases. The budget forward estimates do
not attempt to forecast expected total portfolio investment returns. Due to the volatile nature
of global investment markets, investment earnings recognised in any particular year by the
Superannuation Provision Account will vary from the annual budget estimates.
Over the past twenty years the Superannuation Provision Account investment portfolio has
achieved an annualised investment return of CPI plus 5 percent which is in line with the long
term target investment return objective.
3.201 Expenses largely consist of superannuation costs associated with the estimated growth in
the superannuation liability.
3.202 Expenses ($560.5 million) exceeded the budget estimate ($503.5 million) by $57.0 million
(11.3 percent) due mainly to the use of a lower discount rate to estimate the present value
of the superannuation liability and expense (2.69 percent) compared to the rate used to
prepare the budget estimate (6.0 percent). A lower discount rate increases the estimated
present value of the superannuation liability and related expense.
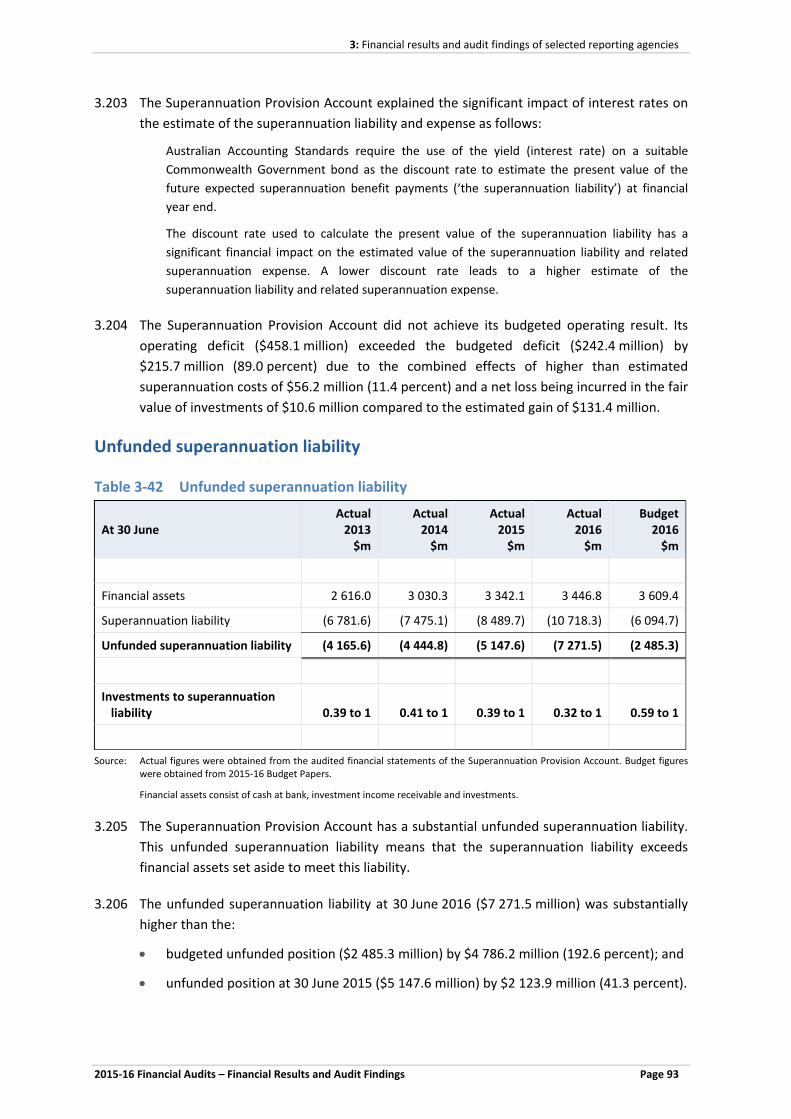
3: Financial results and audit findings of selected reporting agencies
2015‐16 Financial Audits – Financial Results and Audit Findings Page 93
3.203 The Superannuation Provision Account explained the significant impact of interest rates on
the estimate of the superannuation liability and expense as follows:
Australian Accounting Standards require the use of the yield (interest rate) on a suitable
Commonwealth Government bond as the discount rate to estimate the present value of the
future expected superannuation benefit payments (‘the superannuation liability’) at financial
year end.
The discount rate used to calculate the present value of the superannuation liability has a
significant financial impact on the estimated value of the superannuation liability and related
superannuation expense. A lower discount rate leads to a higher estimate of the
superannuation liability and related superannuation expense.
3.204 The Superannuation Provision Account did not achieve its budgeted operating result. Its
operating deficit ($458.1 million) exceeded the budgeted deficit ($242.4 million) by
$215.7 million (89.0 percent) due to the combined effects of higher than estimated
superannuation costs of $56.2 million (11.4 percent) and a net loss being incurred in the fair
value of investments of $10.6 million compared to the estimated gain of $131.4 million.
Unfunded superannuation liability
Table 3‐42 Unfunded superannuation liability
At 30 June Actual 2013 $m
Actual 2014 $m
Actual 2015 $m
Actual 2016 $m
Budget 2016 $m
Financial assets 2 616.0 3 030.3 3 342.1 3 446.8 3 609.4
Superannuation liability (6 781.6) (7 475.1) (8 489.7) (10 718.3) (6 094.7)
Unfunded superannuation liability (4 165.6) (4 444.8) (5 147.6) (7 271.5) (2 485.3)
Investments to superannuation liability 0.39 to 1 0.41 to 1 0.39 to 1 0.32 to 1 0.59 to 1
Source: Actual figures were obtained from the audited financial statements of the Superannuation Provision Account. Budget figures were obtained from 2015‐16 Budget Papers.
Financial assets consist of cash at bank, investment income receivable and investments.
3.205 The Superannuation Provision Account has a substantial unfunded superannuation liability.
This unfunded superannuation liability means that the superannuation liability exceeds
financial assets set aside to meet this liability.
3.206 The unfunded superannuation liability at 30 June 2016 ($7 271.5 million) was substantially
higher than the:
budgeted unfunded position ($2 485.3 million) by $4 786.2 million (192.6 percent); and
unfunded position at 30 June 2015 ($5 147.6 million) by $2 123.9 million (41.3 percent).

3: Financial results and audit findings of selected reporting agencies
Page 94 2015‐16 Financial Audits – Financial Results and Audit Findings
The increase in the unfunded superannuation liability is mainly due to the use of a lower
discount rate to estimate the present value of the superannuation liability at 30 June 2016
compared to the rate which was used to prepare the budget estimate and the estimate of
the liability at 30 June 2015.
3.207 In recent years, the unfunded superannuation liability has significantly increased from an
unfunded position of $4 165.6 million at 30 June 2013 to $7 271.5 million at 30 June 2016.
This represents an increase in the unfunded position over this period of $3 105.9 million (an
average annual increase of 24.9 percent).
3.208 The Superannuation Provision Account has advised that:
The unfunded superannuation liability position has been increasing since 30 June 2013 due to
domestic interest rates falling to historic lows with the required use of lower discount rates to
estimate the superannuation liability at 30 June 2013 (4.29 percent), 30 June 2014
(4.08 percent), 30 June 2015 (3.66 percent) and 30 June 2016 (2.69 percent).
The superannuation liability valuation is sensitive to changes in the discount rate. For example,
if the relevant Commonwealth Government bond (discount) rate increases from 2.69 percent to
3.69 percent, this would result in a significant decrease in the superannuation liability valuation
of $1.9 billion (17.9 percent), from $10.7 billion to $8.8 billion, and subsequently result in a
decrease in the unfunded position.
The level and volatility of domestic interest rates in the future will continue to significantly
impact the estimated superannuation liability valuations and the funding position.
3.209 It would take a significant increase in the Commonwealth Government bond (discount) rate
to bring the superannuation liability down from $10.7 billion (discount rate of 2.69 percent)
to the budget estimate of $6.1 billion (based on a discount rate of six percent).
Projected unfunded superannuation liability
Table 3‐43 Projected unfunded superannuation liability
At 30 June Actual 2016 $m
Budget 2017 $m
Budget 2018 $m
Budget 2019 $m
Budget 2020 $m
Financial assets 3 446.8 3 627.9 3 820.3 4 027.5 4 329.2
Superannuation liability (10 718.3) (6 247.8) (6 506.3) (6 756.3) (6 995.3)
Unfunded superannuation liability (7 271.5) (2 619.9) (2 686.0) (2 728.8) (2 666.1)
Investments to superannuation liability 0.32 to 1 0.58 to 1 0.59 to 1 0.60 to 1 0.62 to 1
Source: Actual figures were obtained from the audited financial statements of the Superannuation Provision Account. Budget figures were obtained from the 2016‐17 Budget Papers.
Financial assets consist of cash at bank, investment distributions receivable and investments.

3: Financial results and audit findings of selected reporting agencies
2015‐16 Financial Audits – Financial Results and Audit Findings Page 95
3.210 The unfunded superannuation liability position is estimated to decrease substantially over
the forward years from the unfunded position at 30 June 2016 of $7 271.5 million to
$2 666.1 million by 30 June 2020.
3.211 The Superannuation Provision Account advised that:
A long‐term average discount rate assumption of six percent is currently used to estimate the
superannuation liability valuation and superannuation expense projections over the Budget and
forward years.
The superannuation liability is a long‐term liability and the use of an expected long‐term
discount rate assumption to estimate the liability valuation is appropriate. The 10‐year
Commonwealth Government bond interest rate has averaged approximately six percent over
the past 25 years.
If current interest rates on Commonwealth Government bonds remain below this estimated
long‐term average assumption, then the estimated superannuation liability (and the unfunded
superannuation liability) will be higher than the budget estimate.
3.212 For the large estimated decrease in the superannuation liability over the forward years to
occur, there would need to be a significant increase in the Commonwealth Government
bond (discount) rate used to estimate the superannuation liability.
Table 3‐44 Future superannuation payments schedule
Year ended 30 June Nominal terms
$m
2017 230.5
2023 351.0
2029 481.2
2035 597.8
2041 666.1
2043 (peak) 672.3
2047 657.8
2053 573.0
2055 535.9
Source: Information on future superannuation payments in nominal terms was obtained from the ‘Report on the Actuarial Investigation as at 30 June 2015’ prepared by the Territory’s consulting actuary, Russell Investments.
The amounts shown above are actuarially assessed and are represented in nominal terms. The nominal value of the projected payments is not adjusted for inflation.
3.213 Annual cash payments to meet superannuation obligations are projected to significantly
increase over the next three decades (2041), peaking at $672.3 million in 2043 and then
reducing until fully paid. This mainly reflects the age profile of the Territory’s employees
who are members of the CSS and PSS. Most of these employees are expected to retire over
the next two decades. The Territory will be required to pay the superannuation benefit
accrued over these employees’ years of service. For many members, the retirement

3: Financial results and audit findings of selected reporting agencies
Page 96 2015‐16 Financial Audits – Financial Results and Audit Findings
benefits provided under the defined benefit schemes will be taken as indexed pensions and
will continue throughout these employees’ lives and that of their surviving spouses.

3: Financial results and audit findings of selected reporting agencies
2015‐16 Financial Audits – Financial Results and Audit Findings Page 97
Territory and Municipal Services Directorate
3.214 The Territory and Municipal Services Directorate (the Directorate) administers Canberra’s
municipal and public transport services. This includes recycling and household waste
collection, management of parks and nature reserves and building and maintenance of
infrastructure assets, including stormwater assets, bridges, roads, streetlights, car parks,
foot paths and cycle paths. The Directorate also operates public libraries, linen cleaning
services and Yarralumla Nursery.
3.215 Under changed administrative arrangements, the:
National Arboretum Canberra was transferred to the Chief Minister, Treasury and
Economic Development Directorate on 22 January 2016;
Directorate merged with the Capital Metro Agency to form the new Transport Canberra
and City Services Directorate effective from 1 July 2016; and
Parks and Conservation functions of the Directorate were transferred to the
Environment and Planning Directorate effective from 1 July 2016.
Key Issues
The Audit Office issued an unqualified audit report on the Directorate’s 2015‐16 financial
statements and an unqualified report of factual findings on its 2015‐16 statement of
performance.
The net cost of the Directorate’s services ($480.6 million) was slightly higher than the budgeted
cost ($475.9 million). While expenses exceeded the budgeted cost by $18.4 million
(3.6 percent), this was mostly offset by higher than expected income of $13.7 million
(45.2 percent).
Capital injections received by the Directorate ($128.3 million) were less than planned
($146.2 million). The Directorate did not draw down $17.9 million (12.2 percent) of the planned
capital injections due mainly to delays in the planning of capital projects.
The Directorate resolved two of the four previously reported audit findings, partially resolved
one audit finding and did not resolve one audit finding.
The Directorate resolved two audit findings by:
– performing quality assurance reviews of the work of internal audit contractors. This
should provide assurance that the internal audit function will be effective and value for
money obtained from these contractors; and
– performing monthly reconciliations between the waste management system (Newcastle
Weighbridge System) and the finance system (Oracle) and investigating variances

3: Financial results and audit findings of selected reporting agencies
Page 98 2015‐16 Financial Audits – Financial Results and Audit Findings
identified in the reconciliations. This reduces the risk of errors in the Directorate’s
accounting records and financial statements.
The Directorate partially resolved one audit finding. The capacity of an internal audit function
to be independent and report impartially depends, in part, on the extent to which this function
is free from the influences of operational management and responsibility.
In 2015‐16, the Audit Office considered changes made to internal audit arrangements and
assessed that these do not provide a safeguard that operational areas which come under the
responsibility of the Chief Audit Executive are reviewed objectively.
The Directorate did not resolve one audit finding as errors were again found in the valuations of
infrastructure assets. While these errors were corrected during the audit, there is a higher risk
of material reporting errors when the infrastructure asset valuations contain errors.
Three new audit findings were identified in 2015‐16:
– Weekly reconciliations of fees recorded in the waste management system (Newcastle
Weighbridge System) to the cash collected at the resource management centres and
banked were not always dated by the preparer and the reviewer. There is a higher risk
that errors or fraud will not be promptly identified, investigated and resolved when there
is no evidence that the reconciliations were prepared and reviewed in a timely manner.
– Some explanations of major variances between the current year amounts and budgeted
amounts and current year amounts and prior year amounts included in the draft financial
statements submitted for audit were not informative and did not disclose the main
reasons for major variances. While these explanations were improved during the audit,
there is a higher risk that the readers of the financial statements will not understand the
financial results if explanations are not informative.
– The statement of performance includes several accountability indicators which measure
customer satisfaction with various services provided by the Directorate. No information
was included in the statement of performance submitted to the Audit Office for review on
how customer satisfaction was measured. Information such as the method used to
measure ‘customer satisfaction’, number of customers surveyed, sampling methodology,
satisfaction rating scale, period over which results were measured, results against the
rating scale should have been provided to show how results were measured.
Furthermore, several explanations for variations from the planned (targeted) level of
performance included in the statement of performance submitted to the Audit Office for
review were not informative and did not disclose the main reasons for variances from the
planned (targeted) levels of performance.

3: Financial results and audit findings of selected reporting agencies
2015‐16 Financial Audits – Financial Results and Audit Findings Page 99
There is a higher risk that the readers of the statement of performance will not
understand the results of the Directorate’s performance if explanations of major
variances are not informative and do not disclose the main reasons for variances from the
planned (targeted) levels of performance.
Financial results
Table 3‐45 Key results
Actual
2014‐15 $m
Actual 2015‐16
$m
Budget 2015‐16
$m
Expenses (527.5) (524.6) (506.2)
Income 38.7 44.0 30.3
Net cost of services (488.8) (480.6) (475.9)
Government contributions 318.7 328.7 328.2
Other gains (including gains from infrastructure asset transfers)
115.5
130.3
107.7
Operating deficit (54.6) (21.6) (40.0)
Capital injections 175.2 128.3 146.2
3.216 Expenses mainly consist of repairs and maintenance costs for infrastructure assets,
contractors and consultant expenses, depreciation and amortisation, employee expenses
and payments to ACTION for bus services.
3.217 Expenses ($524.6 million) exceeded the budgeted cost ($506.2 million) by $18.4 million
(3.6 percent). This was due mainly to the unbudgeted expensing of the costs of utility
diversions and landscaping for the new Majura Parkway because these costs did not meet
the definition of an asset.
3.218 Income is mainly generated from providing laundry and linen cleaning services, collecting
fees and fines for disposing waste at the Territory’s landfill sites and the sale of plants at the
Yarralumla Nursery.
3.219 Income ($44.0 million) exceeded the budget estimate ($30.3 million) by $13.7 million
(45.2 percent) as the Directorate earned:
higher than anticipated fees from the disposal of asbestos‐contaminated demolition
waste from ‘Mr Fluffy’ properties; and

3: Financial results and audit findings of selected reporting agencies
Page 100 2015‐16 Financial Audits – Financial Results and Audit Findings
unbudgeted revenue for constructing a stormwater system on behalf of the Land
Development Agency.
3.220 The net cost of the Directorate’s services ($480.6 million) was slightly higher than the
budgeted cost ($475.9 million). While expenses exceeded the budgeted cost by
$18.4 million (3.6 percent), this was mostly offset by higher than expected income of
$13.7 million (45.2 percent).
3.221 Infrastructure assets transferred to the Directorate from other ACT Government agencies
and private land developers largely relate to roads, stormwater systems, footpaths and
cycle paths.
3.222 Other gains ($130.3 million), which mainly include gains from infrastructure and asset
transfers, exceeded the budget estimate ($107.7 million) by $22.6 million (21.0 percent)
due to the unexpected transfer of several roads and a water quality control pond from the
Chief Minister, Treasury and Economic Development Directorate.
3.223 Capital injections received by the Directorate ($128.3 million) were less than planned
($146.2 million). The Directorate did not draw down $17.9 million (12.2 percent) of the
planned capital injections due mainly to delays in planning capital projects.
Audit findings
Table 3‐46 Status of audit findings (number of findings)
Previously Reported
Resolved Partially Resolved
Not Resolved New Balance
4 2 1 1 3 5
3.224 The Directorate resolved two of the four previously reported audit findings, partially
resolved one audit finding and did not resolve one audit finding.
3.225 The Directorate resolved two audit findings by:
performing quality assurance reviews of the work of internal audit contractors. This
should provide assurance that the internal audit function will be effective and value for
money obtained from these contractors; and
performing monthly reconciliations between the waste management system
(Newcastle Weighbridge System) and the finance system (Oracle) and investigating
variances identified in the reconciliations. This reduces the risk of errors in the
Directorate’s accounting records and financial statements.
3.226 The Directorate partially resolved one audit finding. The capacity of an internal audit
function to be independent and report impartially depends, in part, on the extent to which
this function is free from the influences of operational management and responsibility.

3: Financial results and audit findings of selected reporting agencies
2015‐16 Financial Audits – Financial Results and Audit Findings Page 101
3.227 Since 2009‐10, the Audit Office has reported that the Directorate has implemented
measures which support the independence of the internal audit function. However, these
are not sufficient to provide assurance that the internal audit function is independent
because the Chief Audit Executive has significant areas of operational responsibility that are
subject to internal audits.
3.228 The Directorate previously advised that it disagreed with this audit finding and the related
audit recommendations.
3.229 In 2015‐16, the Audit Office considered changes made to internal audit arrangements and
assessed that these do not provide a safeguard that operational areas which come under
the responsibility of the Chief Audit Executive are reviewed objectively.
3.230 The Directorate has agreed to address this audit finding and advised that:
The Directorate acknowledges that the Chief Audit Executive also having operational responsibilities has the potential for some conflict within the audit function. The Directorate will revise its Internal Audit Charter to provide additional assurance that is acceptable to the ACT Audit Office.
3.231 The Directorate did not resolve one audit finding as errors were again found in the
valuations of infrastructure assets. While these errors were corrected during the audit,
there is a higher risk of material reporting errors when the infrastructure asset valuations
contain errors.
3.232 Three new audit findings were identified in 2015‐16:
Weekly reconciliations of fees recorded in the waste management system (Newcastle
Weighbridge System) to the cash collected at the resource management centres and
banked were not always dated by the preparer and the reviewer. There is a higher risk
that errors or fraud will not be promptly identified, investigated and resolved when
there is no evidence that the reconciliations were prepared and reviewed in a timely
manner.
Some explanations of major variances between the current year amounts and
budgeted amounts and current year amounts and prior year amounts included in the
draft financial statements submitted for audit were not informative and did not
disclose the main reasons for major variances. While these explanations were improved
during the audit, there is a higher risk that the readers of the financial statements will
not understand the financial results if explanations are not informative.
The statement of performance includes several accountability indicators which
measure customer satisfaction with various services provided by the Directorate. No
information was included in the statement of performance submitted to the Audit
Office for review on how customer satisfaction was measured. Information such as the
method used to measure ‘customer satisfaction’, number of customers surveyed,
sampling methodology, satisfaction rating scale, period over which results were
measured, results against the rating scale should have been provided to show how
results were measured.

3: Financial results and audit findings of selected reporting agencies
Page 102 2015‐16 Financial Audits – Financial Results and Audit Findings
Furthermore, several explanations for variations from the planned (targeted) level of
performance included in the statement of performance submitted to the Audit Office
for review were not informative and did not disclose the main reasons for variances
from the planned (targeted) levels of performance.
There is a higher risk that the readers of the statement of performance will not
understand the results of the Directorate’s performance if explanations of major
variances are not informative and do not disclose the main reasons for variances from
the planned (targeted) levels of performance.
3.233 The Directorate has agreed to address all audit findings.

3: Financial results and audit findings of selected reporting agencies
2015‐16 Financial Audits – Financial Results and Audit Findings Page 103
University of Canberra
3.234 The University of Canberra (the University) provides graduate and post‐graduate education
services to Australian and international students. The University also provides research,
consultancy and student accommodation services.
3.235 In 2015, the University controlled:
UCU Ltd which provides goods and services to the staff, students and visitors to the
campus;
UC Global Pty Limited which provides business services, including contract
management, market analysis and other specialist commercial management services to
the education industry;
WJ Weeden Post‐Graduate Scholarship Trust Fund which provides scholarships to
students enrolled at the University for post‐graduate studies; and
University of Canberra Royal Institute of Public Administration Research Fund which
provides funds to conduct research projects and the production of publications relating
to public administration studies.
3.236 The University also controlled the University of Canberra College Pty Limited (the College)
until 51 percent of the University’s shareholding in the College was sold to a listed company
on 29 May 2015. The Audit Office ceased being the statutory auditor of the College when
the University of Canberra sold 51 percent of its shareholding in the College in 2015.
3.237 The Audit Office audited the 2015 financial statements of:
the University under the Financial Management Act 1996 and University of Canberra
Act 1989; and
UCU Ltd under the Corporations Act 2001.
Key Issues
The Audit Office issued unqualified audit reports on the 2015 financial statements of the
University and UCU Ltd.
The University’s 2015 operating surplus, excluding non‐recurring income, capital grants
received and expenses on activities funded from the Structural Adjustment Fund ($5.7 million)
exceeded the 2014 operating surplus ($4.9 million) by $0.8 million (16.3 percent).
The University’s short‐term liabilities ($63.3 million) exceeded its short‐term assets
($47.5 million) by $15.8 million (33.3 percent) at 31 December 2015.

3: Financial results and audit findings of selected reporting agencies
Page 104 2015‐16 Financial Audits – Financial Results and Audit Findings
The University’s short‐term financial position has strengthened in recent years. The amount by
which short‐term liabilities exceeded short‐term assets significantly decreased from
$33.6 million at 31 December 2013 to $15.8 million at 31 December 2015. While its short‐term
financial position has strengthened, the University will need to carefully manage its finances to
continue meeting its short‐term liabilities.
Four of the 13 previously reported audit findings were resolved, five were partially resolved and
four were not resolved. No further action is expected to be taken on eight of the nine
remaining audit findings as the University has advised that it disagrees with them.
No new audit findings were identified during the audit of the 2015 financial statements.
Four previously reported audit findings were resolved by the University:
– reviewing its internal audit function and making improvements to its internal audit
charter and quality assurance processes;
– assigning responsibility for its internal audit function to someone who did not have
significant operational responsibilities;
– performing reviews of audit logs for key corporate systems (i.e. the accounting system
(Finance One), student fee management system (Callista) and payroll system (Alesco) and
retaining evidence of these reviews; and
– improving disclosures in the financial statements on the remuneration of key
management personnel which fully comply with Australian Accounting Standard
AASB 124: ‘Related Party Disclosures’.
The five previously reported audit findings that were partially resolved consist of two relating
to control weaknesses over key corporate systems, two referring to the quality of financial
reporting and one weakness in payment controls. The University has advised that no further
action will be taken in relation to these findings.
Of the four reported audit findings not resolved, three relate to non‐compliance with Australian
Accounting Standards and one to a weakness in payroll controls. The University advised that it
disagrees that it has not complied with the Australian Accounting Standards. However, it has
agreed to address the weakness in payroll controls.

3: Financial results and audit findings of selected reporting agencies
2015‐16 Financial Audits – Financial Results and Audit Findings Page 105
Financial Results
Table 3‐47 Key results (calendar years)
Actual 2014 $m
Note 1
Actual 2015 $m
Note 1
Income excluding non‐recurring income and capital grants received 270.8 276.4
Expenses excluding expenses on activities funded from the Structural Adjustment Fund (265.9) (270.7)
Operating surplus excluding non‐recurring income, capital grants received and expenses on activities funded from the Structural Adjustment Fund – Note 2 4.9 5.7
Non‐recurring income
Dividends received from the College ‐ 8.8
Gain from the sale of 51 percent of the College ‐ 4.8
Gain from a remeasurement of the University’s remaining 49% shareholding in the College ‐ 4.7
Total non‐recurring income ‐ 18.3
Capital grants received for the construction of buildings 2.8 2.4
Total non‐recurring income and capital grants received 2.8 20.7
Expenses on activities funded from the Structural Adjustment Fund – Note 3 (9.7) ‐
Reported operating (deficit)/surplus (2.0) 26.4
Note 1: The financial information is for the University and does not include the financial results of other entities that it controlled.
These other entities are UCU Ltd, UC Global Pty Limited, University of Canberra College Pty Limited up to 29 May 2015,
University of Canberra Royal Institute of Public Administration Research Fund and WJ Weeden Post‐Graduate Scholarship
Trust Fund.
Note 2: Once the financial effects of non‐recurring income and capital grants received for the construction of buildings and expenses
on activities funded from the Structural Adjustment Fund are removed the University’s underlying operating surplus is
$4.9 million in 2014 and $5.7 million in 2015.
Note 3: In 2014, the University spent $9.7 million of Structural Adjustment Fund grants which were received from the Commonwealth
Government in previous years. This funding was mainly spent on activities aimed at increasing student numbers. For example,
additional staff and consultants were employed to provide courses in regional south‐eastern New South Wales.
3.238 Income excluding non‐recurring income and capital grants received is mostly comprised of
financial assistance received from the Commonwealth Government, course fees from
domestic and international students, and revenue from providing student accommodation
services.
3.239 Financial assistance from the Commonwealth Government mainly comes from
Commonwealth Grants Scheme funding for student places, higher education loan programs
and funds to undertake research activities.

3: Financial results and audit findings of selected reporting agencies
Page 106 2015‐16 Financial Audits – Financial Results and Audit Findings
3.240 Income excluding non‐recurring income and capital grants received ($276.4 million)
exceeded the prior year amount ($270.8 million) by $5.6 million (2.1 percent) due mainly to
an increase in student fees as a result of higher international student enrolments.
3.241 Expenses excluding those on activities funded from the Structural Adjustment Fund
consisted mainly of employee costs; administration expenses, depreciation and
amortisation.
3.242 Expenses excluding those on activities funded from the Structural Adjustment Fund
($270.7 million) exceeded the prior year amount ($265.9 million) by $4.8 million
(1.8 percent). This was mainly due to higher:
employee‐related expenses mostly resulting from a staff pay rise under the University’s
Enterprise Agreement and an increase in staff bonus payments; and
depreciation and amortisation expenses, for building upgrades and information
technology assets.
3.243 The University’s 2015 operating surplus, excluding non‐recurring income, capital grants
received and expenses on activities funded from the Structural Adjustment Fund
($5.7 million) exceeded the 2014 operating surplus ($4.9 million) by $0.8 million
(16.3 percent).
Table 3‐48 Net short‐term liabilities
At 31 December
Actual 2013 $m
Note 1
Actual 2014 $m
Note 1
Actual 2015 $m
Note 1
Short‐term assets 32.1 28.6 47.5
Short‐term liabilities ‐ Note 2 (65.7) (63.0) (63.3)
Net short‐term liabilities (33.6) (34.4) (15.8)
Ratio of short‐term assets to short‐term liabilities 0.49 to 1 0.45 to 1 0.75 to 1
Note 1: The financial information is for the University and does not include the financial results of other entities that it controlled.
These other entities are UCU Ltd, UC Global Pty Limited, University of Canberra College Pty Limited up to 29 May 2015,
University of Canberra Royal Institute of Public Administration Research Fund and WJ Weeden Post‐Graduate Scholarship
Trust Fund.
Note 2: Short‐term liabilities do not equal the current liabilities presented in the Statement of Financial Position. For the purpose of
this analysis, the estimated amount of liabilities expected to be settled within 12 months has been used.
3.244 The University’s short‐term asset coverage is measured by comparing the amount of short‐
term assets available to cover short‐term liabilities.

3: Financial results and audit findings of selected reporting agencies
2015‐16 Financial Audits – Financial Results and Audit Findings Page 107
3.245 The University’s short‐term liabilities ($63.3 million) exceeded its short‐term assets
($47.5 million) by $15.8 million (33.3 percent) at 31 December 2015. The financial
statements of the University disclose that the short‐term liabilities can be met because the
University:
receives fortnightly funding from the Commonwealth Government; and
has borrowing facilities with banks which can be used to meet short‐term liabilities if
required.
3.246 The University’s short‐term financial position has strengthened in recent years. The amount
by which short‐term liabilities exceeded short‐term assets significantly decreased from
$33.6 million at 31 December 2013 to $15.8 million at 31 December 2015. While its short‐
term financial position has strengthened, the University will need to carefully manage its
finances to continue meeting its short‐term liabilities.
Audit findings
Table 3‐49 Status of audit findings (number of findings)
Previously Reported
Resolved Partially Resolved
Not Resolved New Balance
13 4 5 4 ‐ 9
Note 1: The information presented is for the University of Canberra and does not include audit findings reported to UCU Ltd.
3.247 Four of the 13 previously reported audit findings were resolved, five were partially resolved
and four were not resolved. No further action is expected to be taken on eight of the nine
remaining audit findings as the University has advised that it disagrees with them. Further
information on these is provided in the following paragraphs.
3.248 No new audit findings were identified during the audit of the 2015 financial statements.
3.249 Four previously reported audit findings were resolved by the University:
reviewing its internal audit function and making improvements to its internal audit
charter and quality assurance processes;
assigning responsibility for its internal audit function to someone who did not have
significant operational responsibilities;
performing reviews of audit logs for key corporate systems (i.e. the accounting system
(Finance One), student fee management system (Callista) and payroll system (Alesco)
and retaining evidence of these reviews; and
improving disclosures in the financial statements on the remuneration of key
management personnel which fully comply with the Australian Accounting Standard
AASB 124: ‘Related Party Disclosures’.

3: Financial results and audit findings of selected reporting agencies
Page 108 2015‐16 Financial Audits – Financial Results and Audit Findings
3.250 The five previously reported audit findings that were partially resolved consist of two
relating to control weaknesses over key corporate systems, two referring to the quality of
financial reporting and one weakness in payment controls. The University has advised that
no further action will be taken in relation to these findings.
3.251 The changes made to address the control weaknesses over key corporate systems included:
restricting the system administrators from installing changes to their desktop
computers. However, users other than these administrators can install changes to their
desktop computers where the University has assessed that this is consistent with their
roles and responsibilities. This presents a risk that other users could make unauthorised
and unintended changes.
The University has advised that it does not intend to make further changes as it
considers that the systems are not at any appreciable risk from allowing other users to
install changes to their desktop computers.
implementing automated system controls which ‘force’ system administrators to
regularly change their passwords. However, these automated system controls only
apply to administrators and not all users. Furthermore, the University has not
implemented a system for checking whether users other than administrators are
changing their passwords every eight weeks as required by the University’s policy for
passwords. The risk of unauthorised (including fraudulent) access increases if users do
not regularly change their passwords.
The University has advised that it does not intend to make further changes as it will
continue to rely on the use of strong passwords that are automatically enforced by the
computer system. This is not considered sufficient as the longer a password remains
unchanged, the greater the risk of it being discovered.
3.252 The changes made to address the quality of financial reporting included:
clearly disclosing material restrictions imposed by the ACT Treasurer on the use of debt
facilities to meet its short‐term liability obligations. However, the University did not
disclose the amount of its net short‐term liability position and net short‐term financial
liability position. While these figures can be derived from information provided in the
financial statements and Council Report, these amounts should be readily evident in
the financial statements.
The University has advised that it does not intend to disclose this information in the
financial statements.
providing information in the Council Report on the University’s financial performance,
financial position, cash flows, liquidity and other matters that would assist readers to
gain an understanding of the financial and operating results of the University. However,
this information could be further improved by providing more information on
‘challenges’ faced by the University in addition to its ‘achievements’.
The University has indicated that it does not intend to provide more information on
‘challenges’ in the Council Report.

3: Financial results and audit findings of selected reporting agencies
2015‐16 Financial Audits – Financial Results and Audit Findings Page 109
3.253 The University does not require documented evidence of the certification of the satisfactory
receipt of goods and services to be provided by someone other than the financial delegate
who approved the payment for amounts below $5 000. This does not sufficiently address
the risk of payment irregularities occurring through error or fraud.
The University advised that it does not agree and has assessed the risk of errors and fraud
to be low where payments below $5 000 have been authorised by a financial delegate.
3.254 Of the four reported audit findings not resolved, three relate to non‐compliance with
Australian Accounting Standards and one to a weakness in payroll controls. The University
advised that it disagrees that it has not complied with the Australian Accounting Standards.
However, it has agreed to address the weakness in payroll controls.
3.255 The Audit Office assessed that the University did not comply with the Australian Accounting
Standards in relation to the accounting for:
fees receivable from domestic and continuing international students.
The University obtained advice on the accounting treatment and accounted for fees
receivable from domestic and continuing international students in accordance with this
advice. The Audit Office reviewed this accounting treatment and the related advice and
concluded that the University’s accounting treatment is incorrect;
income relating to the transfer of the National Rental Affordability Scheme (NRAS)
entitlements to a third party.
The University is eligible to receive financial assistance from the Commonwealth
Government for participating in NRAS by providing affordable rental dwellings to
eligible low‐to‐moderate income tenants.
In 2014, the University entered into an arrangement with a third party to transfer its
utilised NRAS entitlements (i.e. an income stream) from the Commonwealth
Government to a third party, in exchange for an upfront payment (a financial liability).
Under the University’s accounting policy, which is supported by external accounting
advice, the University reduces the financial liability and progressively recognises
income under Australian Accounting Standard AASB 118: ‘Revenue’.
The Audit Office considers that the extinguishment of a financial liability and
recognition of associated income should be accounted for under the Australian
Accounting Standard which applies to financial instruments (AASB 139: ‘Financial
Instruments: Recognition and Measurement’) and not that which applies to revenue
(AASB 118: Revenue);
a grant receivable from the Commonwealth Government for the establishment and
operation of the Centre for Quality Teaching and Learning and related allowance for
impairment.
The Audit Office considers that the University’s treatment does not comply with
Australian Accounting Standard AASB 1004: ‘Contributions’.

3: Financial results and audit findings of selected reporting agencies
Page 110 2015‐16 Financial Audits – Financial Results and Audit Findings
The audit report on the financial statements was not qualified for these areas of non‐
compliance as they are not material.
3.256 Documented evidence of the review of fortnightly payroll reports was not retained when no
errors or anomalies were identified. This presents a risk of undetected irregular payments
to employees which may be due to errors or fraud. The University agreed to address this
audit finding.

2015‐16 Financial Audits – Financial Results and Audit Findings Page 111
APPENDIX A: KEY TERMS
This report contains terms which the reader may not be familiar with. These terms are explained
in the following extract from audit report ‘2015‐16 Financial Audits – Audit Reports’
(Report No. 10/2016).
Each year, the Audit Office provides independent:
audit reports on financial statements prepared by ACT Government directorates,
authorities and companies, and other entities in which the ACT Government has a
financial interest. (These entities are referred to as ‘reporting agencies’ in this report);
and
reports of factual findings on statements of performance prepared by
ACT Government directorates and authorities.
Audit reports on financial statements
Financial statements are a summary of transactions undertaken by reporting agencies. These
transactions are summarised from the accounting records maintained by the reporting agencies
to present the financial information in a meaningful way.
Financial statements show a reporting agency’s financial performance (revenue, expenses and
surpluses/deficits and cash flows) and financial position (assets, liabilities and net
assets/liabilities). The financial position shows the capacity of a reporting agency to meet its
financial obligations (liabilities).
Reporting agencies are required to prepare financial statements in accordance with reporting and
disclosure requirements (Australian Accounting Standards) set by the Australian Accounting
Standards Board.
Audit reports are issued on a reporting agency’s financial statements after the completion of an
audit.
Reports of factual findings on statements of performance
Statements of performance show the results of a reporting agency’s accountability indicators
(performance measures) and related performance targets. This facilitates an assessment of the
reporting agency’s performance in providing public services by enabling the actual performance
to be compared to planned (targeted) levels of performance. Statements of performance also
include explanations for material variances between actual and planned performance for each
accountability indicator.
Accountability indicators are set by the reporting agency during the budget process and provide
information on the number, quality and timeliness of services provided.

Appendix A: Key terms
Page 112 2015‐16 Financial Audits – Financial Results and Audit Findings
Reports of factual findings are issued on a reporting agency’s statement of performance after the
Audit Office has completed a review of the reported results. These reports inform the
ACT Legislative Assembly and community members as to whether the Audit Office has identified
any matters which indicate that the reported results of these accountability indicators have not
been accurately reported.
‘Not fairly presented’
Where the Auditor‐General concludes that the financial statements or statement of performance
are ‘not fairly presented’, the Auditor‐General’s reasons for this conclusion and, where possible,
the correct information will be disclosed in the audit report on the financial statements or report
of factual findings on the statement of performance.
In practice, very few audit reports or reports of factual findings are qualified (negative) as
reporting agencies usually agree to amend their financial statements or statements of
performance before the audit report or report of factual findings is issued.
Where required, the financial statements and audit reports, and statements of performance and
reports of factual findings, are included in the annual reports of reporting agencies.
Types of opinion
Audit reports on financial statements
An audit report with an unqualified (positive) audit opinion is issued where the Auditor‐General
concludes that the financial statements provide a fair representation of a reporting agency’s
financial performance and position in accordance with the relevant reporting and disclosure
requirements.
An audit report with a qualified (negative) audit opinion is issued where the Audit Office:
disagrees with management about the financial statements. This includes
disagreements in relation to the reported amounts or disclosures; or
has been unable to gain sufficient evidence, or perform sufficient work, to form an
opinion in relation to the information (amounts and disclosures) reported in the
financial statements.
An example of an unqualified (positive) audit opinion included in an audit report is presented
below:
Unqualified audit opinion
In my opinion, the financial statements of the [reporting agency] for the year ended [reporting date]:
(i) are presented in accordance with the Financial Management Act 1996, Australian Accounting Standards and other mandatory financial reporting requirements in Australia; and

Appendix A: Key terms
2015‐16 Financial Audits – Financial Results and Audit Findings Page 113
(ii) present fairly the financial position of the [reporting agency] at [reporting date] and the results of its operations and cash flows for the year then ended.
Few qualified (negative) audit opinions are issued because reporting agencies agree to amend
their financial statements before the audit is completed.
Reports of factual findings on statements of performance
An unqualified (positive) report of factual findings is issued where no matters have come to the
Audit Office’s attention which indicate that the results of the accountability indicators reported in
the statement of performance are not fairly presented.
An example of an unqualified (positive) review opinion included in a report of factual findings is
presented below:
Unqualified review opinion
Based on the review procedures, no matters have come to my attention which indicate that the
results of the accountability indicators, reported in the statement of performance of the [reporting
agency] for the year ended [reporting date], are not fairly presented in accordance with the
Financial Management Act 1996.
A qualified (negative) report of factual findings will be issued where a reported result of an
accountability indicator is not accurate, has not been measured, or cannot be independently
verified.
Materiality
Material information is information that affects decisions made by readers of the financial
statements or statements of performance. In assessing whether information included in financial
statements or statements of performance is fairly presented, the Audit Office assesses whether
any misstatements (whether caused by error or fraud) are material.
Where misstatements are identified but their combined effect is not material, the
Auditor‐General is required to provide an unqualified (positive) audit report or unqualified
(positive) report of factual findings.
The Audit Office focuses on information in financial statements and statements of performance
that is of higher risk of material misstatement to provide readers with assurance that they are
free of material misstatements.

Appendix A: Key terms
Page 114 2015‐16 Financial Audits – Financial Results and Audit Findings
In addition to the terms used audit report ‘2015‐16 Financial Audits – Audit Reports’
(Report No. 10/2016), the following terms are explained.
Misstatements
Misstatements are the amount by which the correct amount varies from the reported amounts.
Misstatement may be caused by errors or fraud (deliberate misreporting).
Net assets
Net assets are the amount by which total assets exceed total liabilities.
Net operating balance
Net operating balance is the difference between revenue and expenses. The net operating
balance is ‘in surplus’ where revenue exceeds expenses and is ‘in deficit’ where expenses exceed
revenue.
Operating results
The operating surplus/deficit is the sum of the net operating balance and other economic flows.
Other economic flows mainly comprise gains/losses on investments and land revenue10. These
gains/losses mostly reflect changes in market conditions that affect the value of investments and
land.
10 Land revenue included in other economic flows is the combination of market gains on land sales and the undeveloped land value.
2015‐16 Financial Audits – Financial Results and Audit Findings Page 115
APPENDIX B: AGENCIES INCLUDED IN THE
TERRITORY’S FINANCIAL STATEMENTS
The following agencies are included in the Territory’s financial statements11.
ACT Compulsory Third Party Insurance Regulator
ACT Executive
ACT Gambling and Racing Commission
ACT Insurance Authority
ACT Local Hospital Network Directorate
ACT Public Cemeteries Authority
ACTION
Auditor‐General
Canberra Institute of Technology
Capital Metro Agency
Chief Minister, Treasury and Economic Development Directorate
CIT Solutions Pty Limited
Community Services Directorate
Cultural Facilities Corporation
Education Directorate
Electoral Commissioner
Environment and Planning Directorate
Health Directorate
Housing ACT
Icon Water Limited
Independent Competition and Regulatory Commission
Justice and Community Safety Directorate
Land Development Agency
Legal Aid Commission (ACT)
Lifetime Care and Support Fund
Office of the Legislative Assembly
Public Trustee and Guardian
Superannuation Provision Account
Territory and Municipal Services Directorate
Territory Banking Account
11 Note 6 on pages 48 and 49 of the 2015‐16 Australian Capital Territory Government Consolidated Annual Financial Statements.


2015‐16 Financial Audits – Financial Results and Audit Findings Page 117
Audit reports
These and earlier reports can be obtained from the ACT Auditor‐General’s website at
http://www.audit.act.gov.au.
Reports Published in 2016‐17
Report No. 10 – 2016 2015‐16 Financial Audits – Audit Reports
Report No. 09 – 2016 Commissioner for International Engagement – Position Creation and Appointment Process
Report No. 08 – 2016 Annual Report 2015‐16
Report No. 07 – 2016 Certain Land Development Agency Acquisitions
Reports Published in 2015‐16
Report No. 06 – 2016 Management and Administration of Credit Cards by ACT Government Entities
Report No. 05 – 2016 Initiation of the Light Rail Project
Report No. 04 – 2016 The Management of the Financial Arrangements for the Delivery of the Loose‐fill Asbestos (Mr Fluffy) Insulation Eradication Scheme
Report No. 03 – 2016 ACT Policing Arrangement
Report No. 02 – 2016 Maintenance of Public Housing
Report No. 01 – 2016 Calvary Public Hospital Financial and Performance Reporting and Management
Report No. 10 – 2015 2014‐15 Financial Audits
Report No. 09 – 2015 Public Transport: The Frequent Network
Report No. 08 – 2015 Annual Report 2014‐15
Reports Published in 2014‐15
Report No. 07 – 2015 Sale of ACTTAB
Report No. 06 – 2015 Bulk Water Alliance
Report No. 05 – 2015 Integrity of Data in the Health Directorate
Report No. 04 – 2015 ACT Government Support to the University of Canberra for Affordable Student Accommodation
Report No. 03 – 2015 Restoration of the Lower Cotter Catchment
Report No. 02 – 2015 The Rehabilitation of Male Detainees at the Alexander Maconochie Centre
Report No. 01 – 2015 Debt Management
Report No. 07 – 2014 2013‐14 Financial Audits
Report No. 06 – 2014 Annual Report 2013‐14
Reports Published in 2013‐14
Report No. 05 – 2014 Capital Works Reporting
Report No. 04 – 2014 Gastroenterology & Hepatology Unit, Canberra Hospital
Report No. 03 – 2014 Single Dwelling Development Assessments
Report No. 02 – 2014 The Water and Sewerage Pricing Process
Report No. 01 – 2014 Speed Cameras in the ACT
Report No. 08 – 2013 Management of Funding for Community Services
Report No. 07 – 2013 2012‐13 Financial Audits
Report No. 06 – 2013 ACT Auditor‐General’s Office Annual Report 2012‐13
Report No. 05 – 2013 Bushfire Preparedness