2015-16 Business Plan - CalHFA
33
Fiscal Year 2019-20 Mid-Year Business Plan and Operating Budget Update March 17, 2020
Transcript of 2015-16 Business Plan - CalHFA

Fiscal Year 2019-20
Mid-Year Business Plan and
Operating Budget Update
March 17, 2020
Fiscal Year 2019-20
Approved Business Plan
• Promote state-wide affordable housing production and opportunities for homeownership while maintaining financial sustainability and independence
Goal #1
• Continue to improve operational efficiencies through the use of technology, workforce planning, and the implementation of best practicesGoal #2
• Collaborate with other housing entities, lenders (both public and private), and stakeholders who complement CalHFA’s lending objectives and policy priorities in order to deliver effective and innovative housing solutions
Goal #3
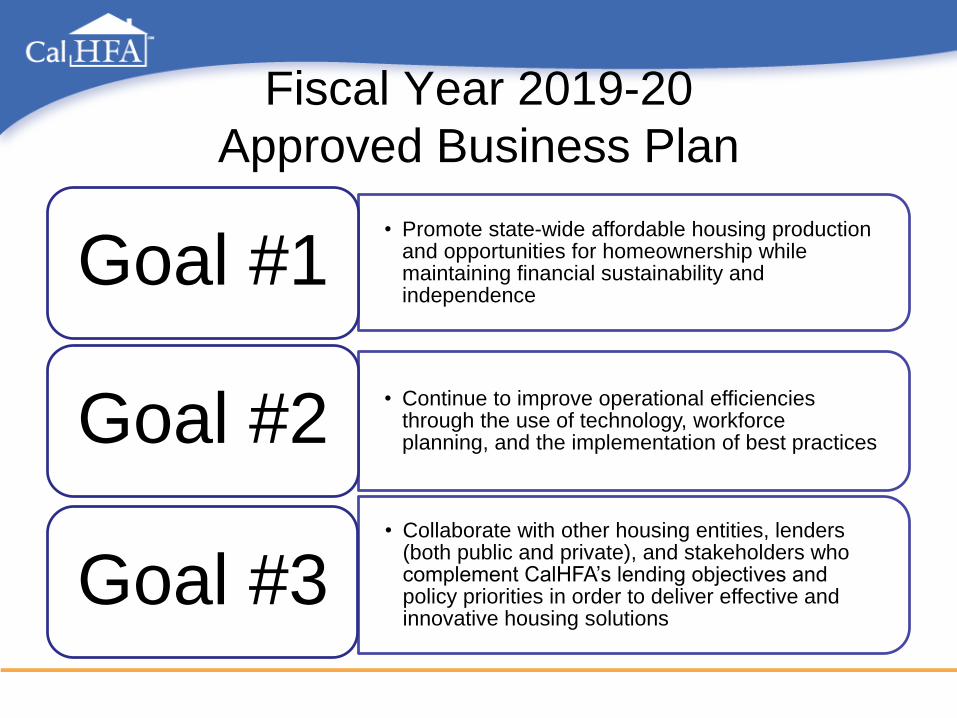
Single Family Historical Trends
2012/13 2013/14 2014/15 2015/16 2016/17 2017/18 2018/19 2019/20Projected
$0.0
$0.5
$1.0
$1.5
$2.0
$2.5
$3.0
$3.5
$4.0
$4.5
-
2,000
4,000
6,000
8,000
10,000
12,000
14,000
BIL
LIO
NS
FIR
ST
TIM
E H
OM
EB
UY
ER
S
Single Family Lending Volume
Lending volume Lending Goal Number of FTHB Loans
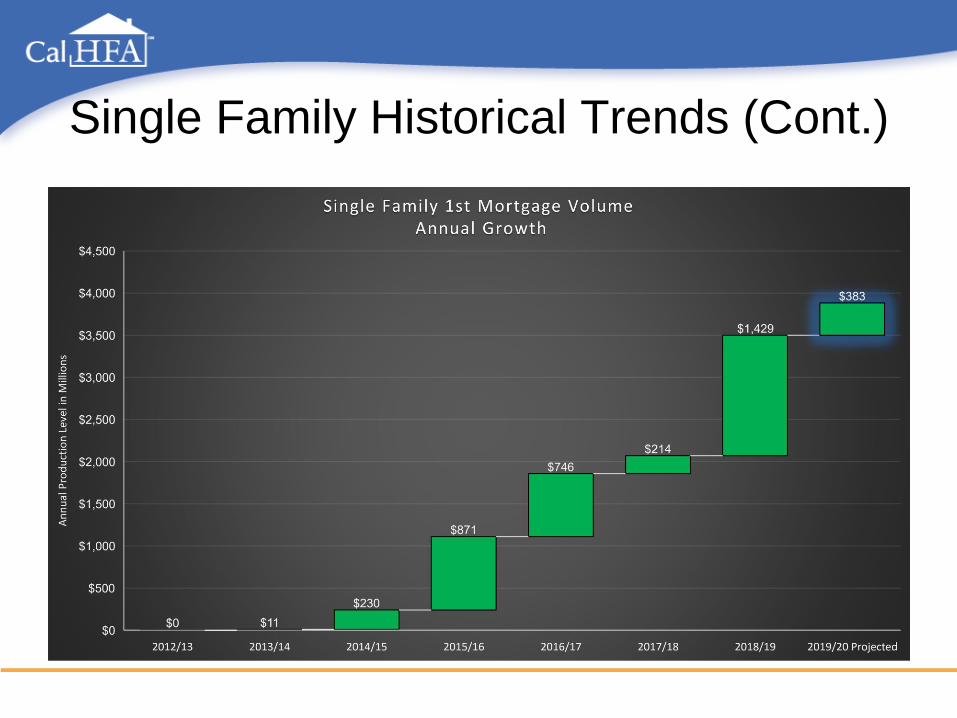
Single Family Historical Trends (Cont.)

Goal #1 Key Strategy
Promote sustainable
homeownership
opportunities by
expanding eligibility
requirements and product
offerings while serving a
broad range of income
and housing needs
$2.0
$2.5
$3.9
$0.0 $0.5 $1.0 $1.5 $2.0 $2.5 $3.0 $3.5 $4.0
Fiscal Year 2019-20 (Goal)
Mid-Year Actuals
Revised Projections
BILLIONS
Single Family(1st Mortgage Lending Volume)
$110
$137
$220
$- $50 $100 $150 $200 $250
Fiscal Year 2019-20 (Goal)
Mid-Year Actuals
Revised Projections
MILLIONS
Single Family (Subordinate Lending Volume)
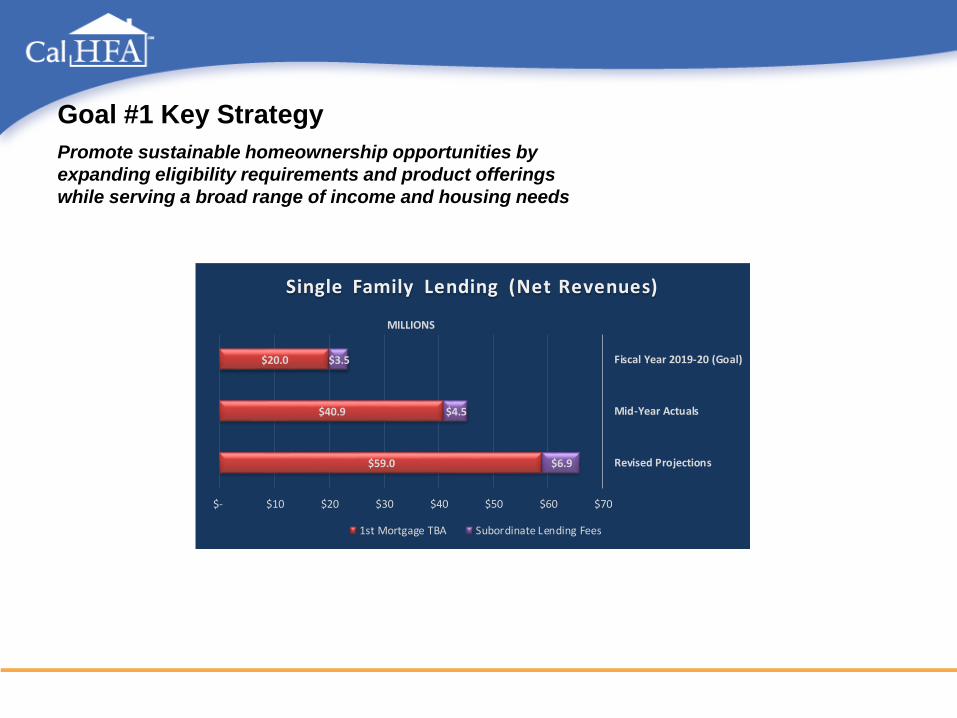
Goal #1 Key Strategy
Promote sustainable homeownership opportunities by
expanding eligibility requirements and product offerings
while serving a broad range of income and housing needs
$20.0
$40.9
$59.0
$3.5
$4.5
$6.9
$- $10 $20 $30 $40 $50 $60 $70
Fiscal Year 2019-20 (Goal)
Mid-Year Actuals
Revised Projections
MILLIONS
Single Family Lending (Net Revenues)
1st Mortgage TBA Subordinate Lending Fees

Goal #1 Key Strategy • Launched the HUD 184 Indian Home Loan
Guarantee Program
• Launched the USDA Homeownership Program
for rural communities
• Completed preparation for the rollout of the
Fannie Mae Homestyle Renovation program
which is expected to go live prior to end of fiscal
year
• Completed program changes that will incentivize
new construction homeownership opportunities
Promote sustainable
homeownership opportunities by
expanding eligibility
requirements and product
offerings while serving a broad
range of income and housing
needs
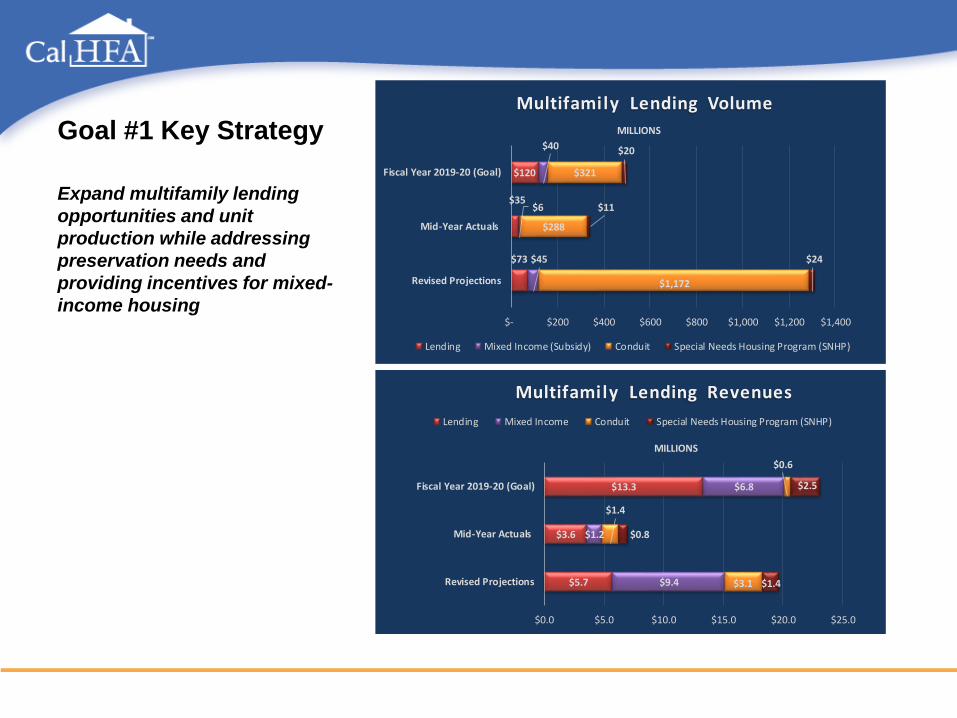
Goal #1 Key Strategy
Expand multifamily lending
opportunities and unit
production while addressing
preservation needs and
providing incentives for mixed-
income housing
$120
$35
$73
$40
$6
$45
$321
$288
$1,172
$20
$11
$24
$- $200 $400 $600 $800 $1,000 $1,200 $1,400
Fiscal Year 2019-20 (Goal)
Mid-Year Actuals
Revised Projections
MILLIONS
Multifamily Lending Volume
Lending Mixed Income (Subsidy) Conduit Special Needs Housing Program (SNHP)
$13.3
$3.6
$5.7
$6.8
$1.2
$9.4
$0.6
$1.4
$3.1
$2.5
$0.8
$1.4
$0.0 $5.0 $10.0 $15.0 $20.0 $25.0
Fiscal Year 2019-20 (Goal)
Mid-Year Actuals
Revised Projections
MILLIONS
Multifamily Lending Revenues
Lending Mixed Income Conduit Special Needs Housing Program (SNHP)

Goal #1 Key Strategy• Completed the research necessary to stand
up a bond recycling program
• Successfully renewed letters of credit
supporting variable rate demand
obligations
• Standard and Poor’s raised CalHFA’s
issuer credit rating, from 'A+' to 'AA-'
with a stable outlook. This returns
CalHFA’s Issuer Credit Rating to the
same level as it was prior to the collapse
of the housing market during the Great
Recession.
• Citibank Securitizations
Strengthen Agency financial
position by monetizing assets for
liquidity while maximizing return
on equity and investment
(FY 2019-20) S&P Moody's
Overall Issuer AA-, stable outlook ↑ A1, positive outlook ↑
Single Family Indenture (HMRB) AA, positive outlook ↑ A1, positive outlook
Multifamily Indenture (MHRBIII) AA+, stable outlook A1, positive outlook ↑
CalHFA Credit Ratings

Goal #2 Key Strategy
• Completed Request for Proposal (RFP) for a vendor to
provide Optical Character Recognition (OCR) software to
extract and compare data from Single Family lending
documents to streamline and automate manual
processes
• Agency received the second consecutive award for
Excellence in Financial reporting from the Government
Finance Officers Association (GFOA)
• Implemented Dynamics Budgets software to streamline
Agency budget preparation process
• Identified new multifamily software that will potentially
consolidated both the origination platform and the asset
management platform into a single system eliminating
manual processes and improve data collection and
reporting
• Developed and implemented a plan to transition residual
KYHC activities to Loan Administration, Fiscal Services
and IT
• Completed recruitments for key senior staff positions
Continue to improve operational
efficiencies through the use of
technology, workforce planning,
and the implementation of best
practices:
Goal #3 Key Strategy• Executive Director serves as Board Chair of the National Council of
State Housing Agencies
• Serves as a technical advisor to the Governor’s Office on housing
related matters
• Voting member of the State Tax Credit Allocation Committee
• Ex-officio member of the State Debt Limit Allocation Committee
• Serves on Freddie Mac Housing for Tomorrow Council
• Serves on BBVA Compass Community Advisory Board on housing
policy
• Collaborate with HCD, DGS and the Governor’s office on State Excess
Property
• Serves on the Homeless Coordinating and Financing Council
• Serves on the Fannie Mae Rural Duty to Serve Advisory Council
• Assists HCD with the Veterans Housing & Homelessness Prevention
Program and the HUD 811 Project Rental Assistance Program
Collaborate with other housing
entities, lenders (both public and
private), and stakeholders who
complement CalHFA’s lending
objectives and policy priorities in
order to deliver effective and
innovative housing solutions

FY 2019-20
Mid-Year Business Plan Update
Questions?

Mid-Year Update on the
FY 2019-20 Operating Budget
March 17, 2020

Approved Mid-Year Mid-Year Projected
Budget Budget Actuals Variance % 2019-20
Loan Servicing 1,500$ 750$ 875$ 125$ 16.7% 1,625$
Insurance Release 500$ 250$ 332$ 82$ 32.7% 582$
Loan Repayments 23,861$ 11,931$ 19,877$ 7,946$ 66.6% 37,331$
13,995$ 6,998$ 9,501$ 2,504$ 35.8% 12,510$
Fee Income 30,621$ 15,310$ 47,181$ 31,871$ 208.2% 68,081$
Extraordinary Items -$ -$ 3,322$ 3,322$ 0% 3,322$
70,477$ 35,238$ 81,088$ 45,850$ 130.1% 123,451$
Salaries and Wages 18,292$ 9,146$ 8,106$ 1,040$ 11.4% 16,000$
Reimbursements (324)$ (162)$ (219)$ 57$ -35.2% (350)$
Benefits 10,514$ 5,257$ 4,425$ 832$ 15.8% 9,250$
General Expense 775$ 388$ 320$ 68$ 17.4% 675$
Communications 407$ 204$ 205$ (2)$ -0.7% 400$
Travel 638$ 319$ 162$ 157$ 49.2% 500$
Training 270$ 135$ 47$ 88$ 65.2% 175$
Facilities Operation 3,115$ 1,558$ 1,440$ 118$ 7.5% 3,000$
Consulting & Professional Services 2,867$ 1,434$ 608$ 826$ 57.6% 1,500$
Central Administrative Services 2,699$ 1,350$ 1,768$ (419)$ -31.0% 2,690$
Information Technology 2,326$ 1,163$ 697$ 466$ 40.1% 2,200$
Equipment 180$ 90$ 42$ 48$ 53.3% 100$
41,759$ 20,880$ 17,601$ 3,279$ 15.7% 36,140$
NET SURPLUS/(EXPENDITURE) 28,718$ 14,358$ 63,487$ 49,129$ 342.2% 87,311$
TOTALS
Interest (mortgages/securities/cash)
CALIFORNIA HOUSING FINANCE AGENCY
OPERATING BUDGET
MID-YEAR 2019-20 BUDGET UPDATE
(DOLLARS IN THOUSANDS)
RESOURCES
TOTALS

Questions?
Homeownership
via CalHFA
March 17, 2020

17
CalHFA’s loan production numbers
• In 2019, helped 14,142 families achieve the dream of
homeownership.
Loan # Loan $ YoY
Total 14,142 $4,295 +4230/+$1503
-------- ----------
FHA 9,841 $2,953
Conventional 4,221 $1,315
VA 0,073 $0,026
USDA 0,007 $0,001
18
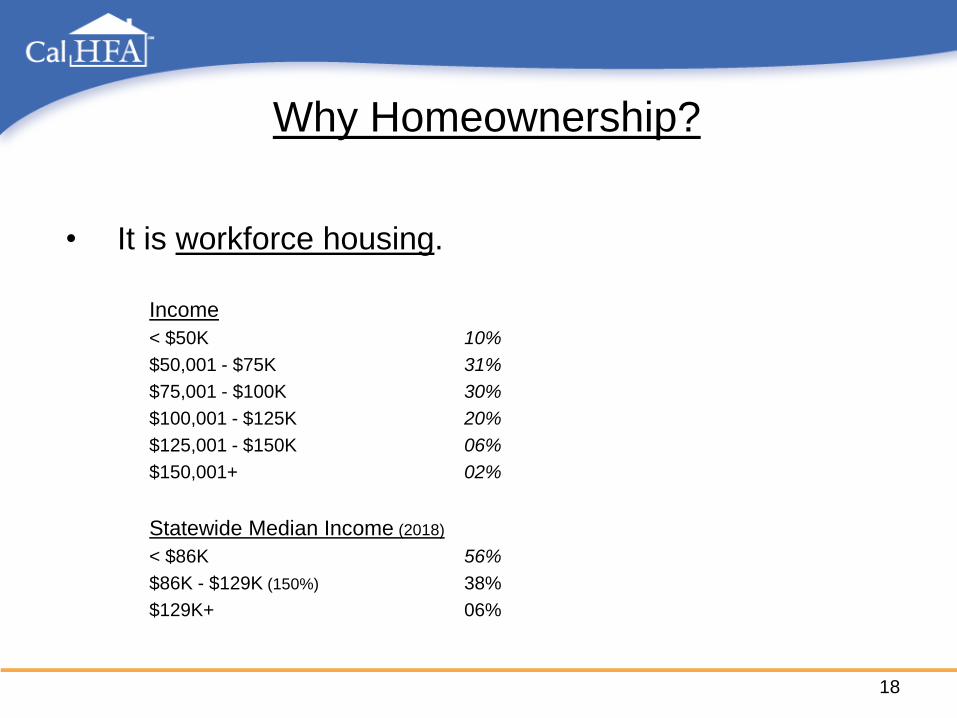
Why Homeownership?
• It is workforce housing.
Income
< $50K 10%
$50,001 - $75K 31%
$75,001 - $100K 30%
$100,001 - $125K 20%
$125,001 - $150K 06%
$150,001+ 02%
Statewide Median Income (2018)
< $86K 56%
$86K - $129K (150%) 38%
$129K+ 06%

19
Who are our borrowers?
• Reflect CA’s diversity.CalHFA
2019 State* +/-
Hispanics 52% 39% +13%
White 34% 37% -3%
African American 08% 5.5% +2.5%
Asian 04% 14% -10%
Pacific Islander 0.7% 0.4% +0.3%
American Indian 0.4% 0.4% ---
* 2018 US Census Bureau Estimates

20
Where are our borrowers?
• Top 5 counties produce 50%+ of our loans.
Riverside 13%
San Bernardino 13%
Sacramento 11%
Los Angeles 08%
Kern 07%
-----
52%
21
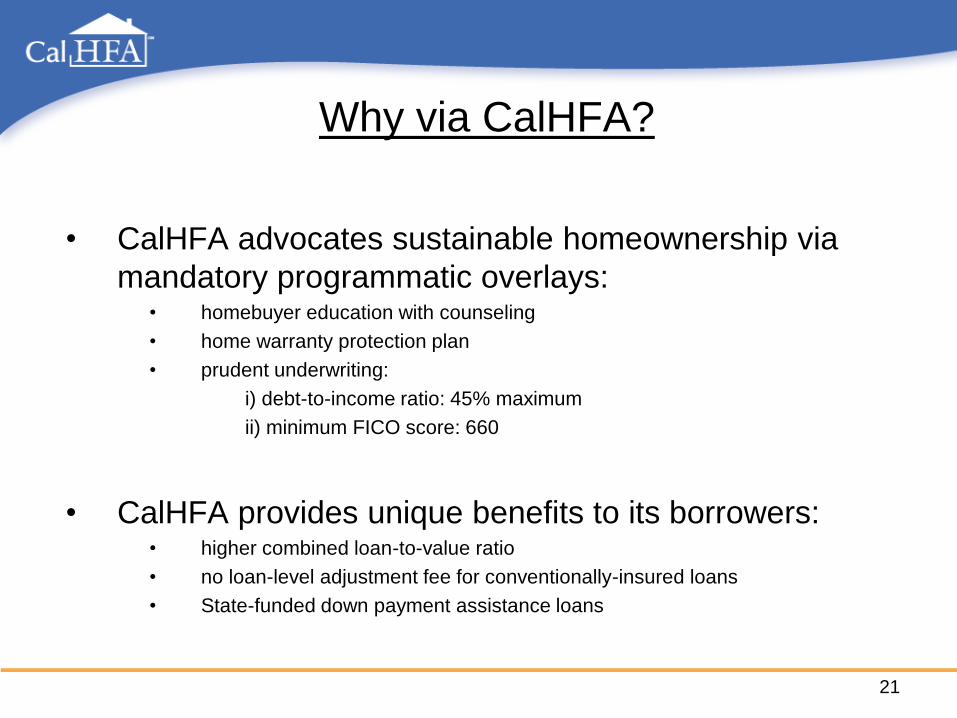
Why via CalHFA?
• CalHFA advocates sustainable homeownership via
mandatory programmatic overlays:• homebuyer education with counseling
• home warranty protection plan
• prudent underwriting:
i) debt-to-income ratio: 45% maximum
ii) minimum FICO score: 660
• CalHFA provides unique benefits to its borrowers:• higher combined loan-to-value ratio
• no loan-level adjustment fee for conventionally-insured loans
• State-funded down payment assistance loans
22
How the State of CA can help
• Provide a permanent, ongoing
source for down payment
assistance

23
FY 2019-20 Initiatives
July to December 2019
• Program and operational changes triggered by ML 19-06 July compliance
• Fannie Mae’ reformulation of HFA Preferred July/Sept restructure program
• USDA * Sept menu expansion
• HUD Section 184 Indian Loan Guarantee Program * Sept menu expansion
January to June 2020
• No Cap for Specialty Programs - $10K Cap for non-Specialty Mar conserve DPA
• Fannie Mae HomeStyle Energy Efficient * Mar menu expansion
• Partnership with Apple Mar new source of DPA
• Transition KYHC Servicing to Loan Admin * June restructure operations
• Revise Lender Scorecard to include loan performance June streamline
* Action items on the FY 2019-20 Strategic Business Plan
24
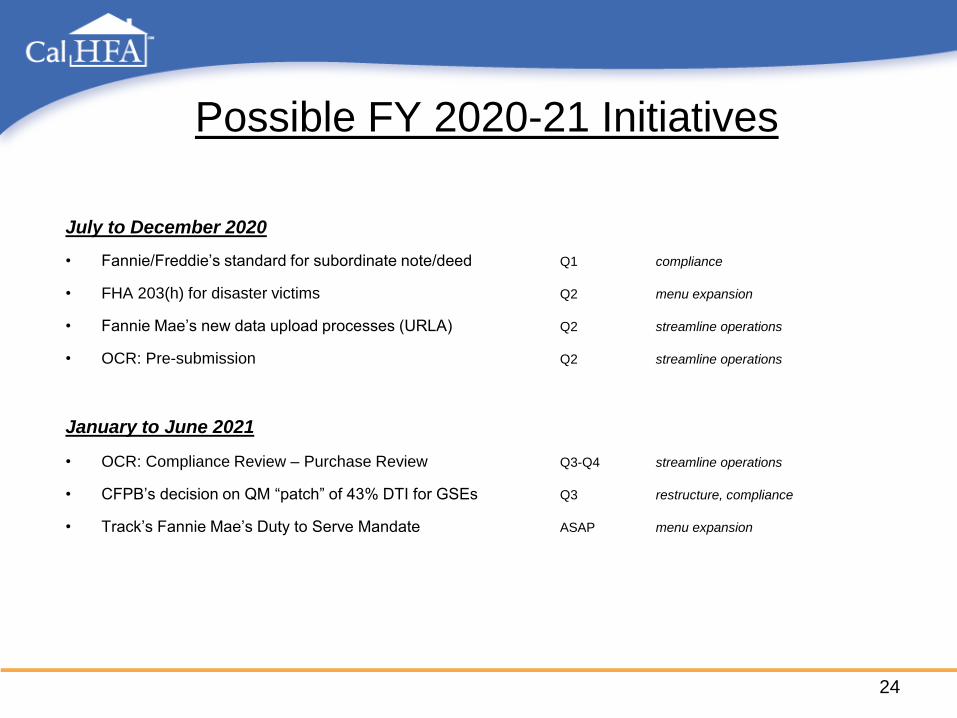
Possible FY 2020-21 Initiatives
July to December 2020
• Fannie/Freddie’s standard for subordinate note/deed Q1 compliance
• FHA 203(h) for disaster victims Q2 menu expansion
• Fannie Mae’s new data upload processes (URLA) Q2 streamline operations
• OCR: Pre-submission Q2 streamline operations
January to June 2021
• OCR: Compliance Review – Purchase Review Q3-Q4 streamline operations
• CFPB’s decision on QM “patch” of 43% DTI for GSEs Q3 restructure, compliance
• Track’s Fannie Mae’s Duty to Serve Mandate ASAP menu expansion
CalHFA Multifamily Programs
Board of Directors
March 17, 2020
Agenda
• Lending Projections
• Strategic Initiatives
• Challenges
• Looking Ahead
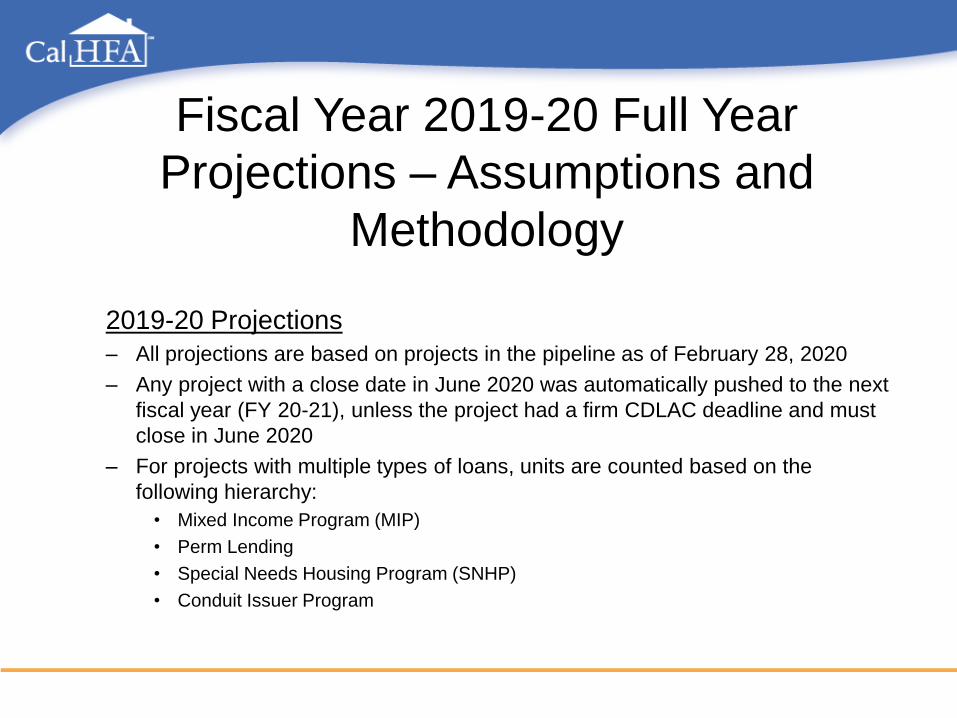
2019-20 Projections
– All projections are based on projects in the pipeline as of February 28, 2020
– Any project with a close date in June 2020 was automatically pushed to the next
fiscal year (FY 20-21), unless the project had a firm CDLAC deadline and must
close in June 2020
– For projects with multiple types of loans, units are counted based on the
following hierarchy:
• Mixed Income Program (MIP)
• Perm Lending
• Special Needs Housing Program (SNHP)
• Conduit Issuer Program
Fiscal Year 2019-20 Full Year
Projections – Assumptions and
Methodology
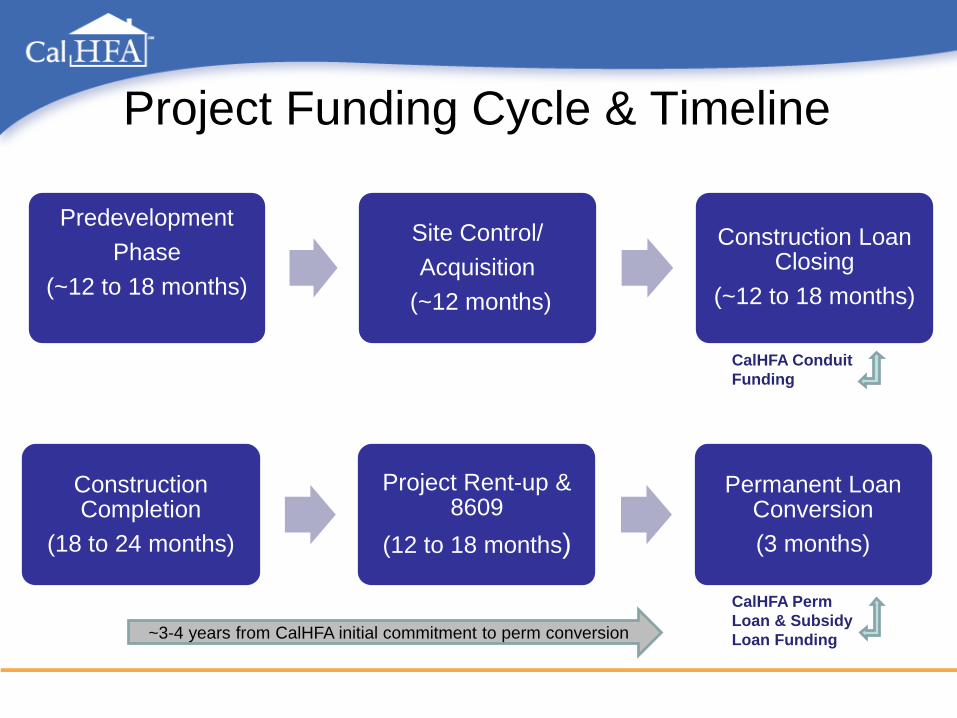
Project Funding Cycle & Timeline
Construction Completion
(18 to 24 months)
Project Rent-up & 8609
(12 to 18 months)
Permanent Loan Conversion
(3 months)
~3-4 years from CalHFA initial commitment to perm conversion
Predevelopment
Phase
(~12 to 18 months)
Site Control/
Acquisition
(~12 months)
Construction Loan Closing
(~12 to 18 months)
CalHFA Conduit
Funding
CalHFA Perm
Loan & Subsidy
Loan Funding

Fiscal Year 2019-20
$120
$35
$73
$40
$6
$45
$321
$288
$1,172
$20
$11
$24
$- $200 $400 $600 $800 $1,000 $1,200 $1,400
Fiscal Year 2019-20 (Goal)
Mid-Year Actuals
Revised Projections
MILLIONS
Multifamily Lending Volume
Lending Mixed Income (Subsidy) Conduit Special Needs Housing Program (SNHP)
Production Drivers:
• MIP Subsidy dollars and State Tax Credits
• Timing of Conduit vs. Perm and MIP Loans

Unit Production by Product Type & Affordability
550
1,287
1,769
773
510 126
1,381 1,750
144 150 318
- 500
1,000 1,500 2,000 2,500 3,000 3,500 4,000 4,500 5,000
TOTA
L U
NIT
S
AREA MEDIAN INCOME
Fiscal Year 2019-20 Est. Unit Production
Special NeedsHousingProgram(SNHP)
Conduit
Mixed Income(Subsidy)
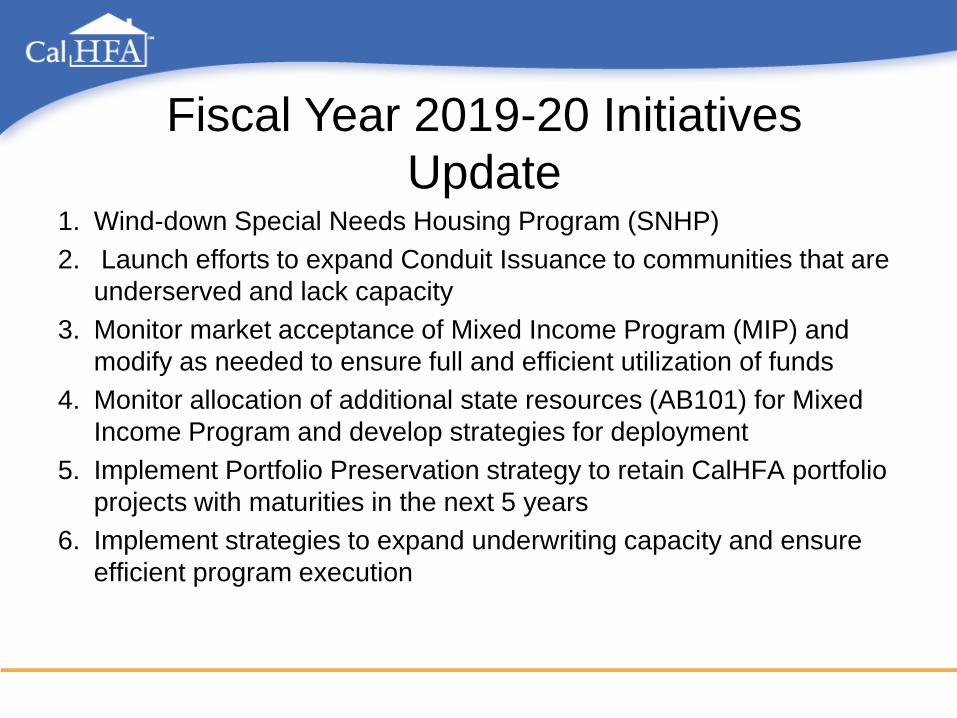
1. Wind-down Special Needs Housing Program (SNHP)
2. Launch efforts to expand Conduit Issuance to communities that are
underserved and lack capacity
3. Monitor market acceptance of Mixed Income Program (MIP) and
modify as needed to ensure full and efficient utilization of funds
4. Monitor allocation of additional state resources (AB101) for Mixed
Income Program and develop strategies for deployment
5. Implement Portfolio Preservation strategy to retain CalHFA portfolio
projects with maturities in the next 5 years
6. Implement strategies to expand underwriting capacity and ensure
efficient program execution
Fiscal Year 2019-20 Initiatives
Update

Challenges to Strategy and Production
• Uncertainty of Funding Resources could impact
strategy:
– State Tax Credits subject to appropriation
– Competitive Bond Cap
– Economic impact of COVID – 19
• Increased costs of raw materials and labor
• Stress on compliance dates for CDLAC/TCAC
• Interest Rate Fluctuations
• Pressures on State Budget due to COVID 19
• Affordable housing need remains unchanged

Looking Ahead• Ongoing Multi-Year Priorities (as outlined above) will continue:
• Wind-down SNHP Program – completion FY 2021-22
• Monitor market acceptance of MIP and modify as needed -
ongoing
• Monitor allocation of additional state resources for MIP and
develop strategies for deployment - ongoing
• New Priorities 2020-21
• Close out HUD TCA and 811 Activities
• Assess and develop new market strategies in light of
changing resources and market challenges
• Finalize transition to new AM system including training
• Initiate acquisition options for front-end Loan Information
System with a focus on improved data reporting