2015 10 23 manufacturing value chains launch
24
MANUFACTURING IN KENYA: APPAREL-TEXTILE, LEATHER, AND FURNITURE October 2015
-
Upload
kenya-association-of-manufactures -
Category
Documents
-
view
218 -
download
2
description
Â
Transcript of 2015 10 23 manufacturing value chains launch

MANUFACTURING IN KENYA:APPAREL-TEXTILE, LEATHER, AND
FURNITURE
October 2015

Table of contents
1. Mandate and methodology
2. Structural similarities across sectors
3. Kenya’s positioning and cross-cutting recommendations
4. Conclusion
4
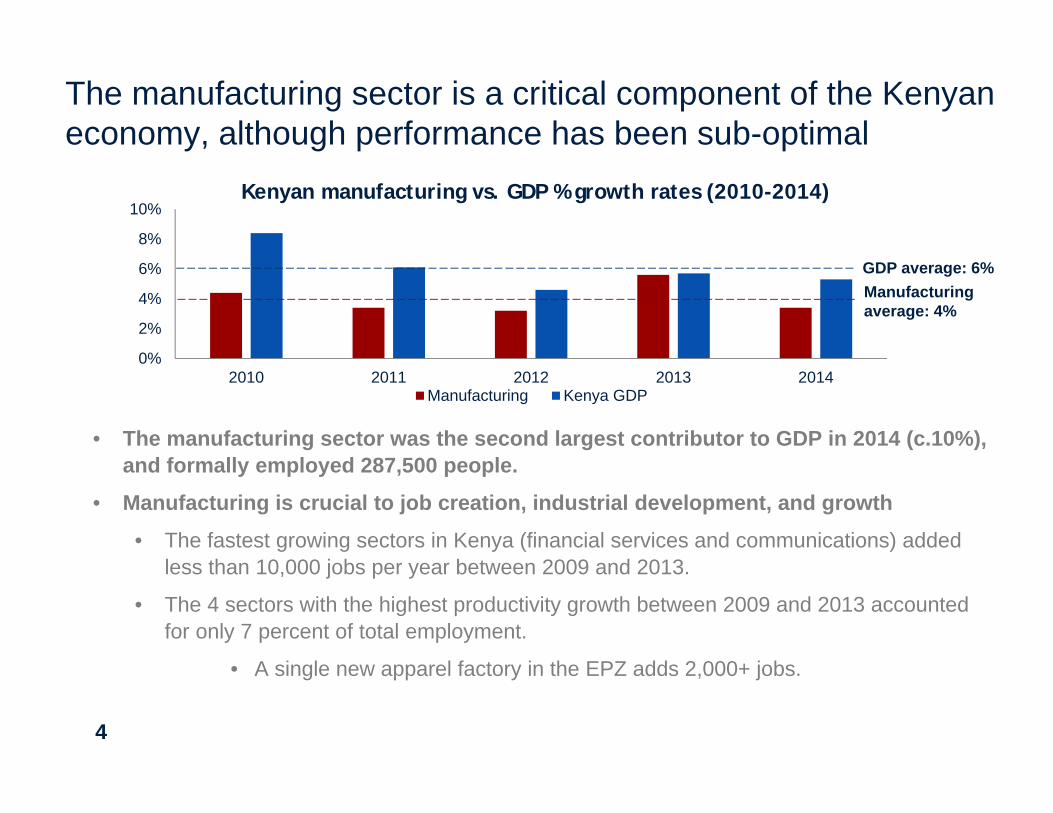
The manufacturing sector is a critical component of the Kenyan economy, although performance has been sub-optimal
0%
2%
4%
6%
8%
10%
2010 2011 2012 2013 2014Manufacturing Kenya GDP
Kenyan manufacturing vs. GDP % growth rates (2010-2014)
GDP average: 6%Manufacturing average: 4%
• The manufacturing sector was the second largest contributor to GDP in 2014 (c.10%), and formally employed 287,500 people.
• Manufacturing is crucial to job creation, industrial development, and growth
• The fastest growing sectors in Kenya (financial services and communications) added less than 10,000 jobs per year between 2009 and 2013.
• The 4 sectors with the highest productivity growth between 2009 and 2013 accounted for only 7 percent of total employment.
• A single new apparel factory in the EPZ adds 2,000+ jobs.

5
Rationale and mandate from Ministry of Industrialization
• MOIED requested WB assess the competitiveness of several
labor-intensive sectors: leather & leather goods, textile &
apparel, and furniture-timber
• Understand their current state of development and main
constraints
• Propose strategies and assess policy options
• Recommend interventions necessary to accelerate growth,
leveraging international experiences

6
Methodology: Limited data availability made for a challenging and time-consuming research process
• Gathered existing studies and policy documents
• Analysed official data:
• KNBS Economic Surveys & Census of Industrial Production
• WB 2013 Kenya Enterprise Survey
• Conducted surveys, field interviews, and in-depth conversations with industry
stakeholders and panels of experts
• In furniture, we surveyed 244 stakeholders across the country and across each
stage of the value chain
• Held public consultations
• Collaborated extensively with Ministry—at CS, PS, and technical levels—and
Kenya Association of Manufacturers (KAM)
Table of contents
1. Mandate and methodology
2. Structural similarities across sectors
3. Kenya’s positioning and cross-cutting recommendations
4. Conclusion
8
1. Limited official data = lots of professional guestimates!
• Official data was useful for apparel
where exports are significant and
firms are concentrated (and formal)
• Sample size was too small to draw
conclusions for leather and
furniture
• Only medium and large companies
represented in KNBS’ industrial
“census,” so only partially useful
for understanding industry size
9
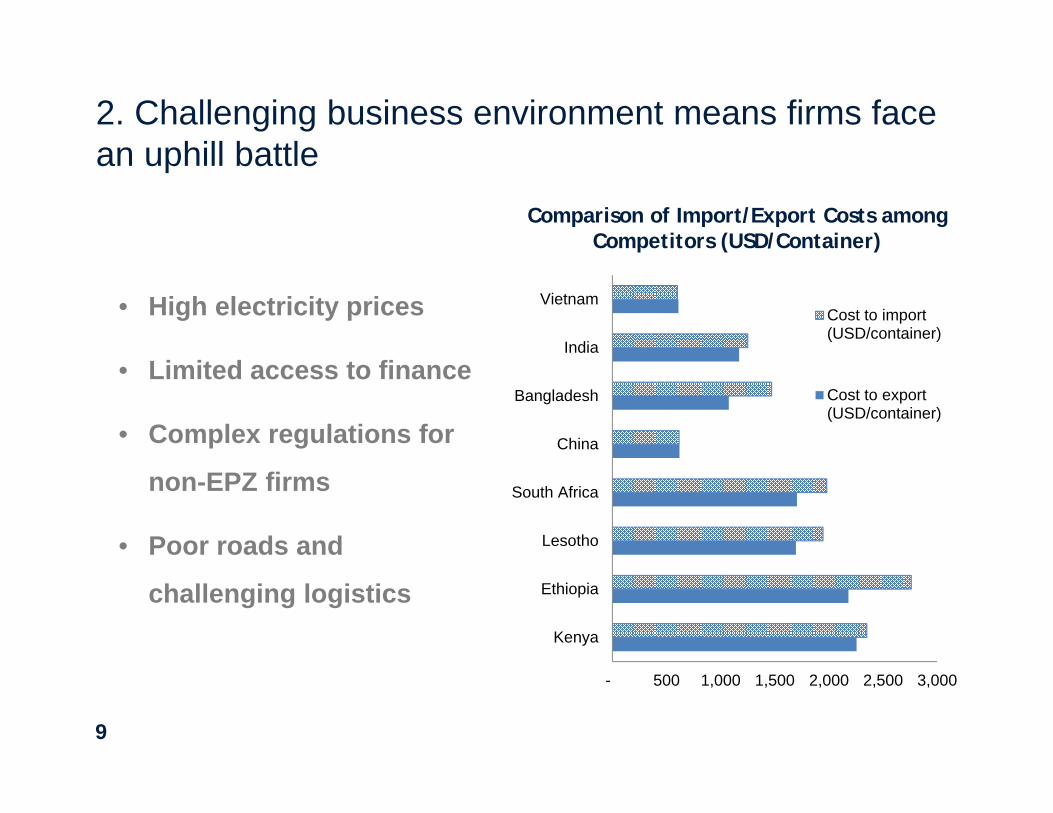
2. Challenging business environment means firms face an uphill battle
• High electricity prices
• Limited access to finance
• Complex regulations for
non-EPZ firms
• Poor roads and
challenging logistics
- 500 1,000 1,500 2,000 2,500 3,000
Kenya
Ethiopia
Lesotho
South Africa
China
Bangladesh
India
VietnamCost to import(USD/container)
Cost to export(USD/container)
Comparison of Import/Export Costs among Competitors (USD/Container)
10
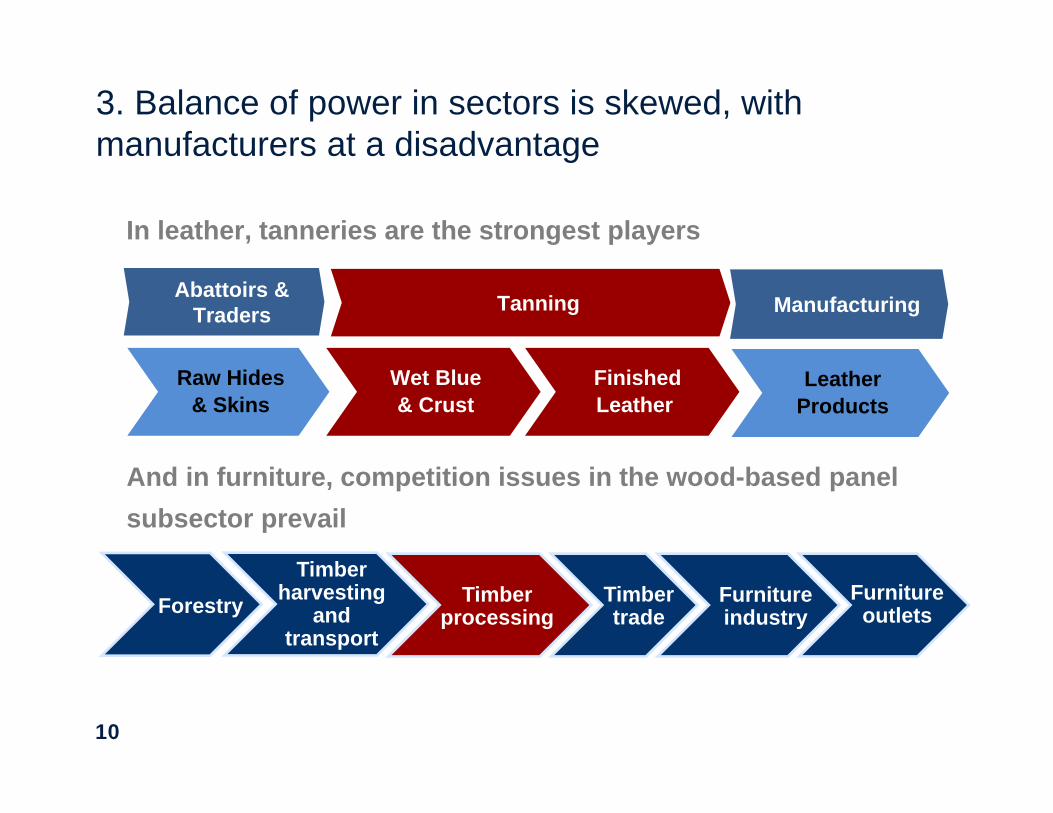
3. Balance of power in sectors is skewed, with manufacturers at a disadvantage
And in furniture, competition issues in the wood-based panel subsector prevail
In leather, tanneries are the strongest players
Raw Hides & Skins
Wet Blue & Crust
Finished Leather
Animal Husbandry and
Leather Products
Tanning ManufacturingAbattoirs &
Traders
Forestry Timber
harvesting and
transport
Timber processing
Timber trade
Furniture industry
Furniture outlets

11
4. Limited collaboration across value-chains and within sub-segments of each value-chain
• Very little outsourcing
between the formal and
informal sectors
• Limited specialization among
companies
• No voice vis-à-vis Government
• Limited leadership and
cooperation for sector-wide
improvements
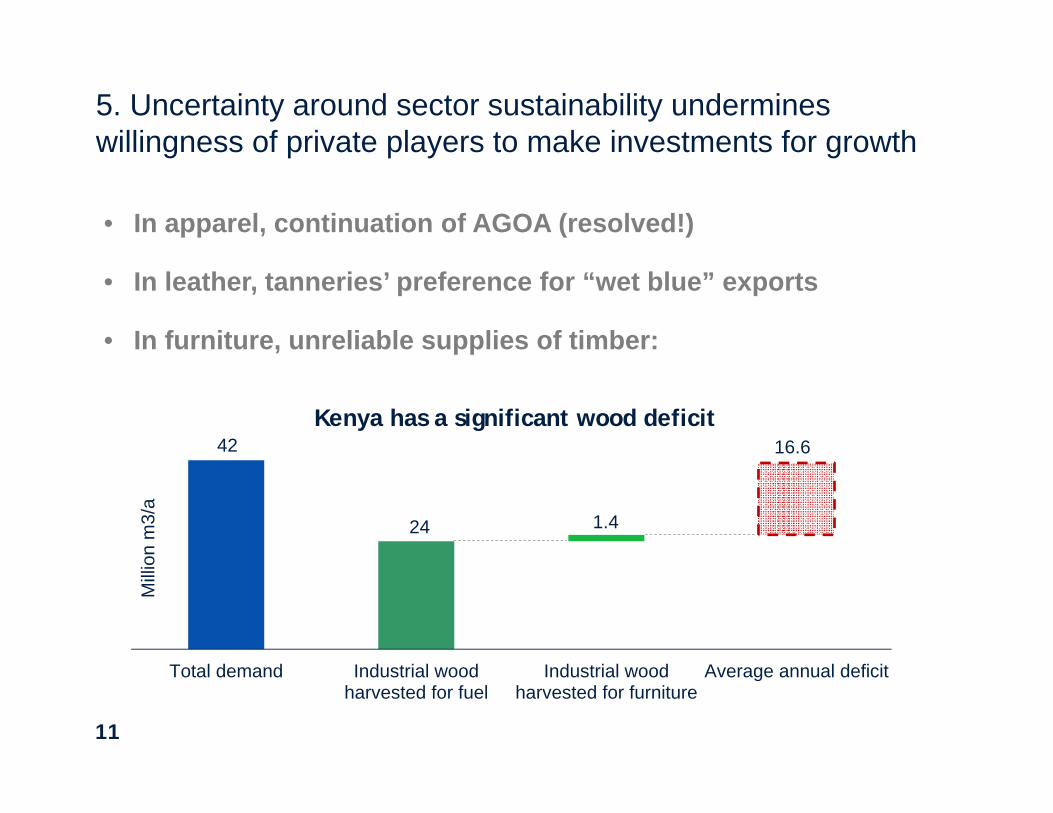
5. Uncertainty around sector sustainability undermines willingness of private players to make investments for growth
• In apparel, continuation of AGOA (resolved!)
• In leather, tanneries’ preference for “wet blue” exports
• In furniture, unreliable supplies of timber:
11
Total demand Industrial woodharvested for fuel
Industrial woodharvested for furniture
Average annual deficit
Mill
ion
m3/
a
42
24 1.4
16.6Kenya has a significant wood deficit

13
6. Low productivity is pervasive, given rudimentary technology and limited managerial and technical skills
• Technology is outdated and expensive to replace
• Skills are low, training is not readily available, and
the Training Levy is reportedly ineffective.
14
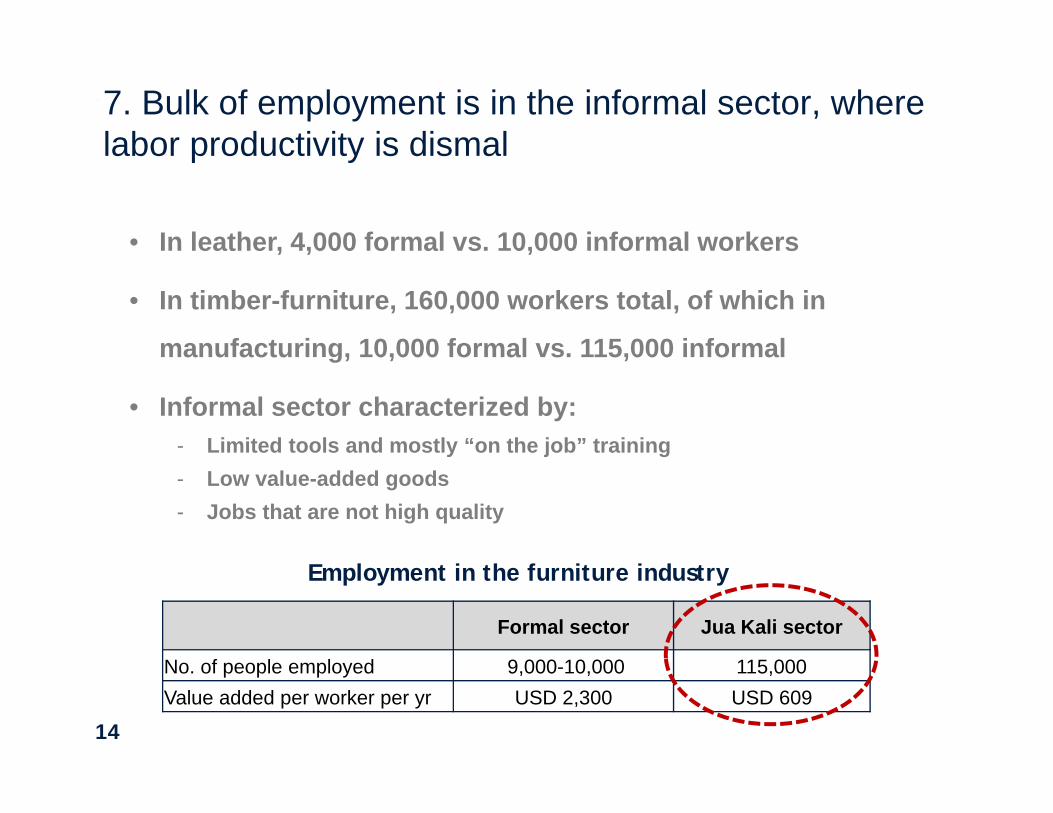
7. Bulk of employment is in the informal sector, where labor productivity is dismal
• In leather, 4,000 formal vs. 10,000 informal workers
• In timber-furniture, 160,000 workers total, of which in
manufacturing, 10,000 formal vs. 115,000 informal
• Informal sector characterized by: - Limited tools and mostly “on the job” training - Low value-added goods- Jobs that are not high quality
Formal sector Jua Kali sector
No. of people employed 9,000-10,000 115,000Value added per worker per yr USD 2,300 USD 609
Employment in the furniture industry
15
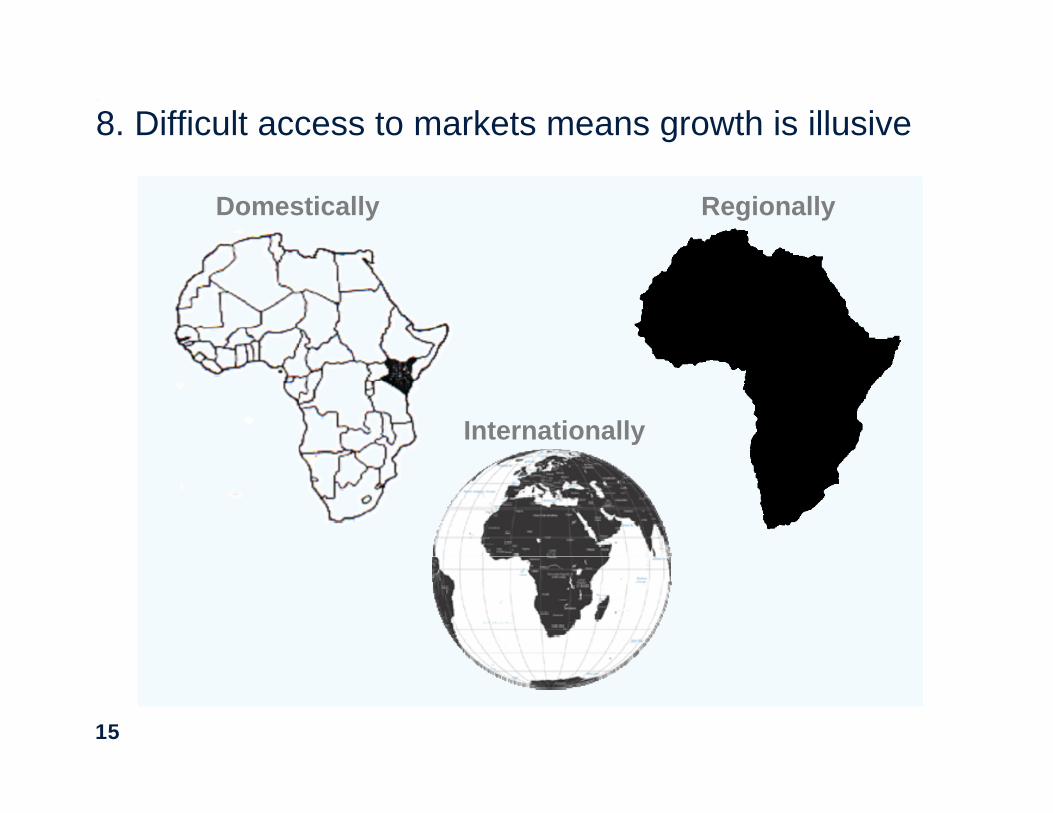
8. Difficult access to markets means growth is illusive
Domestically Regionally
Internationally
0
10
20
30
2nd Hand‐Mitumba
New‐Low Cost New‐Mid Cost New‐High Cost
Pairs
of sho
es so
ld
(millions) Non‐Leather
Leather‐importedLeather‐Kenyan
16
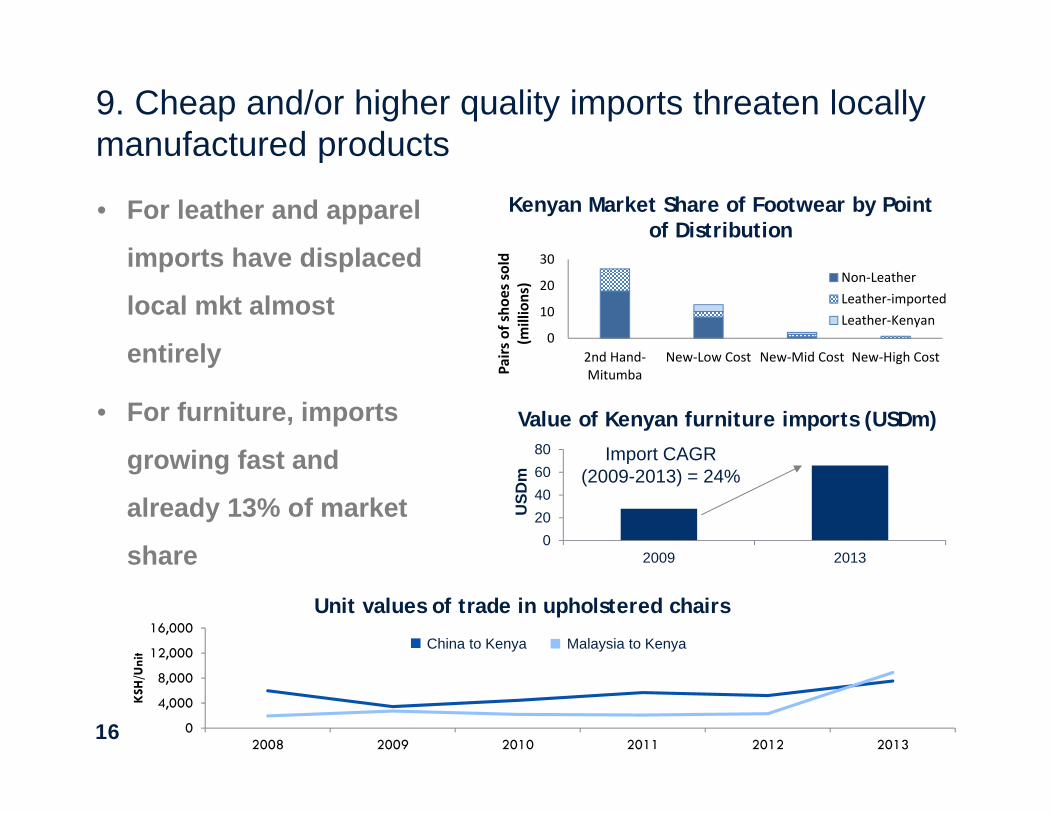
9. Cheap and/or higher quality imports threaten locally manufactured products
020406080
2009 2013
USD
m
Value of Kenyan furniture imports (USDm)
Import CAGR (2009-2013) = 24%
0
4,000
8,000
12,000
16,000
2008 2009 2010 2011 2012 2013
KSH/Unit
Unit values of trade in upholstered chairs
China to Kenya Malaysia to Kenya
Kenyan Market Share of Footwear by Point of Distribution
• For leather and apparel
imports have displaced
local mkt almost
entirely
• For furniture, imports
growing fast and
already 13% of market
share

Table of contents
1. Mandate and methodology
2. Structural similarities across sectors
3. Kenya’s positioning and cross-cutting recommendations
4. Conclusion
18
Business case for the Kenyan manufacturing sector - I
1. Strong local and regional demand fundamentals
2. Access to markets
1. Strategic location
2. AGOA
3. Regional power with sophisticated private sector
4. Growing services sectors that can support and strengthen manufacturing
1
2
3
4
19
Business case for the Kenyan manufacturing sector - II
1. Availability of raw materials mean possibility of integrating value chains
2. Large labor force with pool of skilled workers, relative to neighbouring countries
3. Unique African design
4. China is no longer low cost due to rising wages
5
6
7
8
20
Cross-sectoral recommendations
• Develop and deepen networks of regulation, facilitation, skills, and infrastructure
1
2
Improve the business environment
• Intervene in protective dynamics and legislation that distort power towards upstream stakeholders
Remove market distortions that undermine competition

21
Cross-sectoral recommendations
• Labour productivity- Enhance the quality &
availability of managerial and technical skills through more and better on the job training
- Rethink existing Training Levy
• Investment in technology, machinery and facilities: provide incentives for upgrading machinery and facilities at firm level
3 Improve productivity and innovation
22
Cross-sectoral recommendations
4 Increase access to markets and induce greater demand
• Promote exports in regional and international markets by increasing regional and international awareness and coordinating branding efforts
• Establish Jua Kali-focused marketing entities to facilitate access to formal markets
• Improve transparency and implementation of public procurement

23
• Establish new / strengthen existing industry associations to give sector a voice
• Enhance cooperation across and within each value chain
• Leverage association to facilitate data collection, training, and marketing initiatives
Enhance institutional collaboration and support at sector level05

Table of contents
1. Mandate and methodology
2. Structural similarities across sectors
3. Kenya’s positioning and cross-cutting recommendations
4. Conclusion
25
Conclusion
• Manufacturing has the potential to be a cornerstone
of the economy in terms of job and wealth creation,
but GoK and the private sector needs to take action
to ensure its growth and development
• Given commonality of challenges, it is best to
complement vertical interventions with horizontal
policy interventions to address cross-cutting
constraints