2015 04-27 - Yara International ASA Q1 2015 Presentation
37
Yara International ASA First quarter results 2015 24 April 2015
-
Upload
yara-international -
Category
Investor Relations
-
view
282 -
download
2
Transcript of 2015 04-27 - Yara International ASA Q1 2015 Presentation
Yara International ASA
First quarter results 2015
24 April 2015
1
IR – 24 April 2015
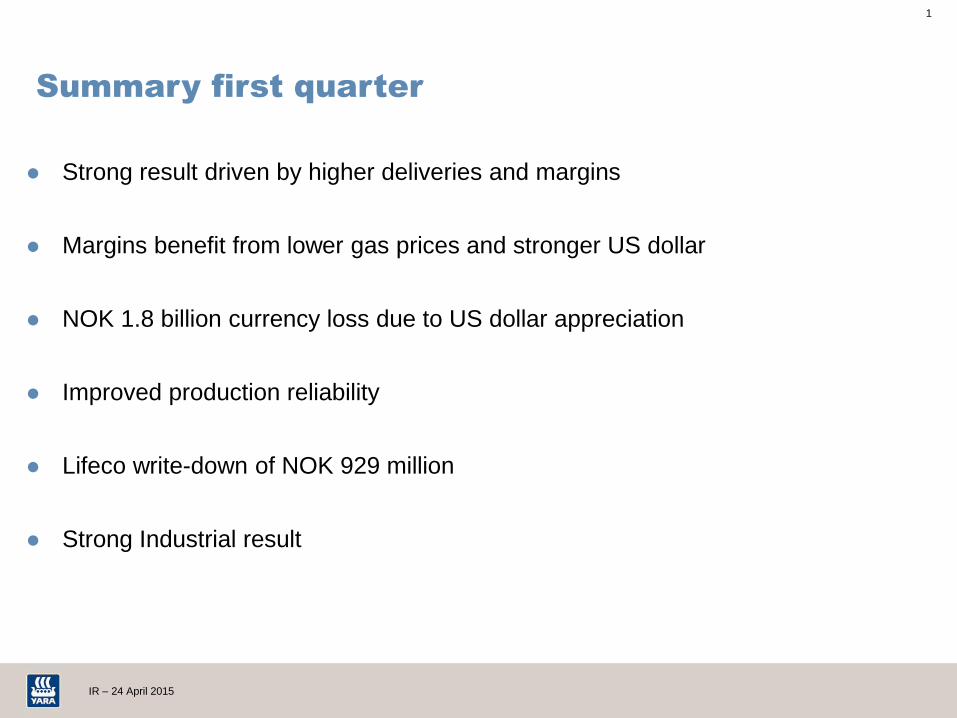
Strong result driven by higher deliveries and margins
Margins benefit from lower gas prices and stronger US dollar
NOK 1.8 billion currency loss due to US dollar appreciation
Improved production reliability
Lifeco write-down of NOK 929 million
Strong Industrial result
Summary first quarter
2
IR – 24 April 2015
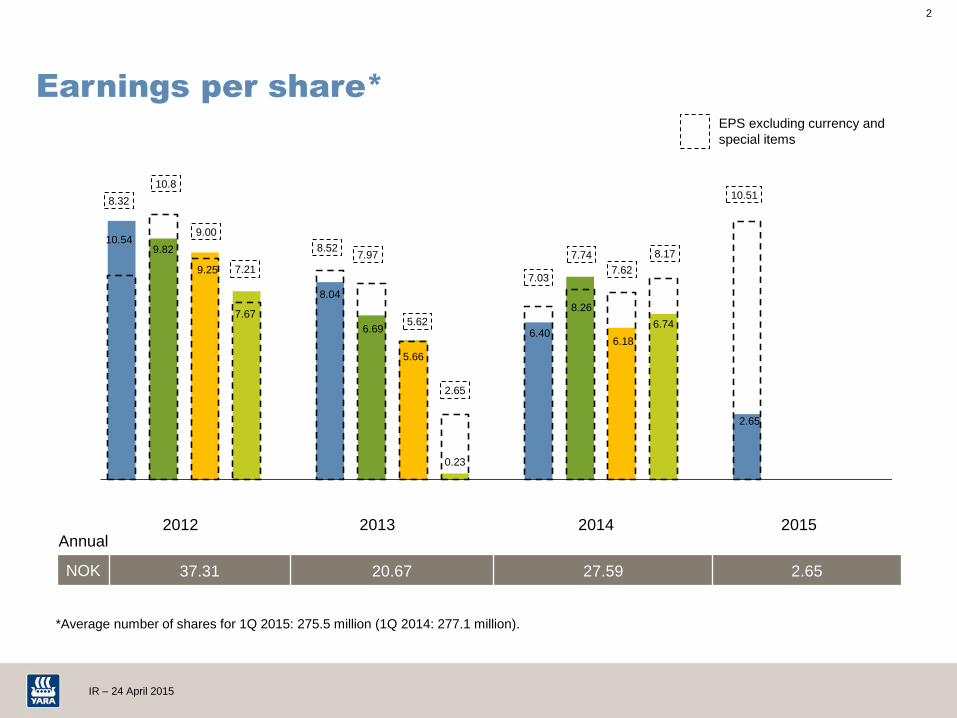
10.54 9.82
9.25
7.67
8.04
6.69
5.66
0.23
6.40
8.26
6.18
6.74
2.65
8.32
10.8
9.00
7.21
8.52 7.97
5.62
2.65
7.03
7.74
7.62
8.17
10.51
Earnings per share*
*Average number of shares for 1Q 2015: 275.5 million (1Q 2014: 277.1 million).
NOK 37.31 20.67 27.59 2.65
Annual 2012 2013 2014
EPS excluding currency and
special items
2015
3
IR – 24 April 2015
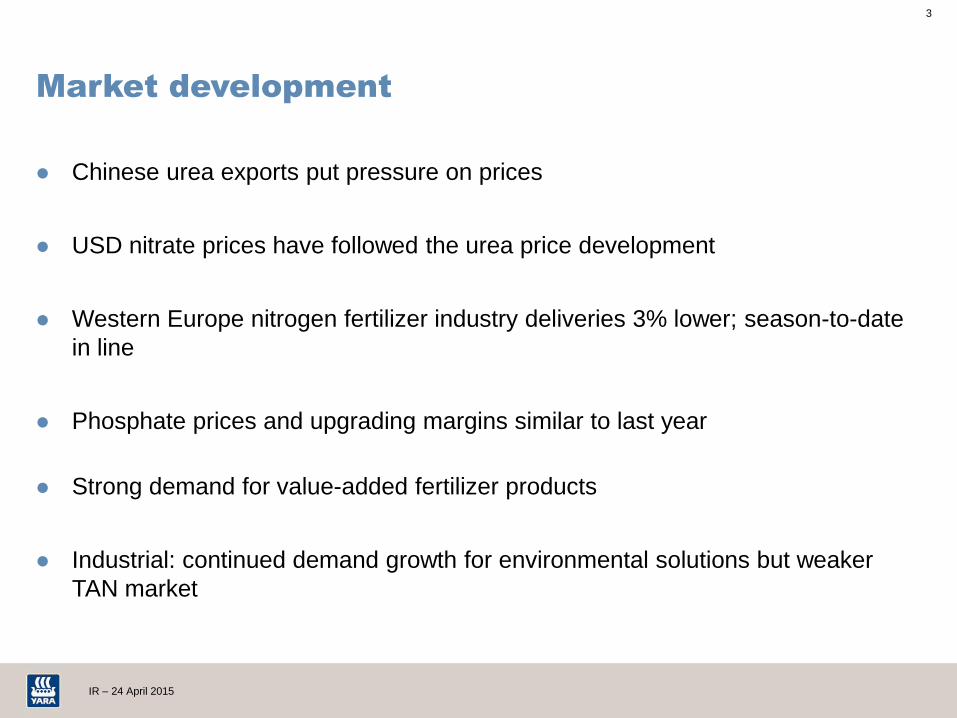
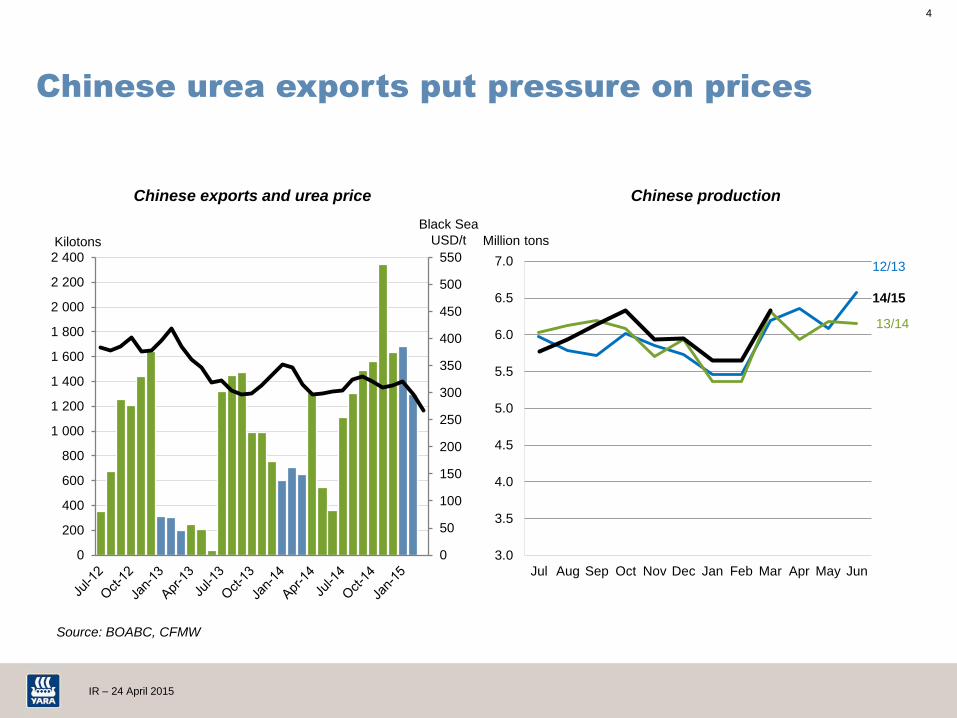
Chinese urea exports put pressure on prices
USD nitrate prices have followed the urea price development
Western Europe nitrogen fertilizer industry deliveries 3% lower; season-to-date
in line
Phosphate prices and upgrading margins similar to last year
Strong demand for value-added fertilizer products
Industrial: continued demand growth for environmental solutions but weaker
TAN market
Market development
4
IR – 24 April 2015
3.0
3.5
4.0
4.5
5.0
5.5
6.0
6.5
7.0
Jul Aug Sep Oct Nov Dec Jan Feb Mar Apr May Jun
Million tons
13/144
Source: BOABC, CFMW
12/13
Chinese urea exports put pressure on prices
14/15
0
50
100
150
200
250
300
350
400
450
500
550
0
200
400
600
800
1 000
1 200
1 400
1 600
1 800
2 000
2 200
2 400Kilotons
Black Sea
USD/t
Chinese exports and urea price Chinese production

5
IR – 24 April 2015
0.0
2.0
4.0
6.0
8.0
10.0
12.0
14.0
16.0
10/11 11/12 12/13 13/14 14/15
Production Net imports
0.0
1.0
2.0
3.0
4.0
5.0
6.0
7.0
10/11 11/12 12/13 13/14 14/15
Domestic Imports
European industry deliveries similar to last
season
Source: Yara estimate for fertilizer deliveries to selected West European countries.
Total nitrogen deliveries based on TFI, US Trade Commission, Blue-Johnson and Yara estimates
USA West Europe
+6%
Million tons N Million tons N
0%
6
IR – 24 April 2015
0
1 000
2 000
3 000
4 000
5 000
6 000
Kilotons
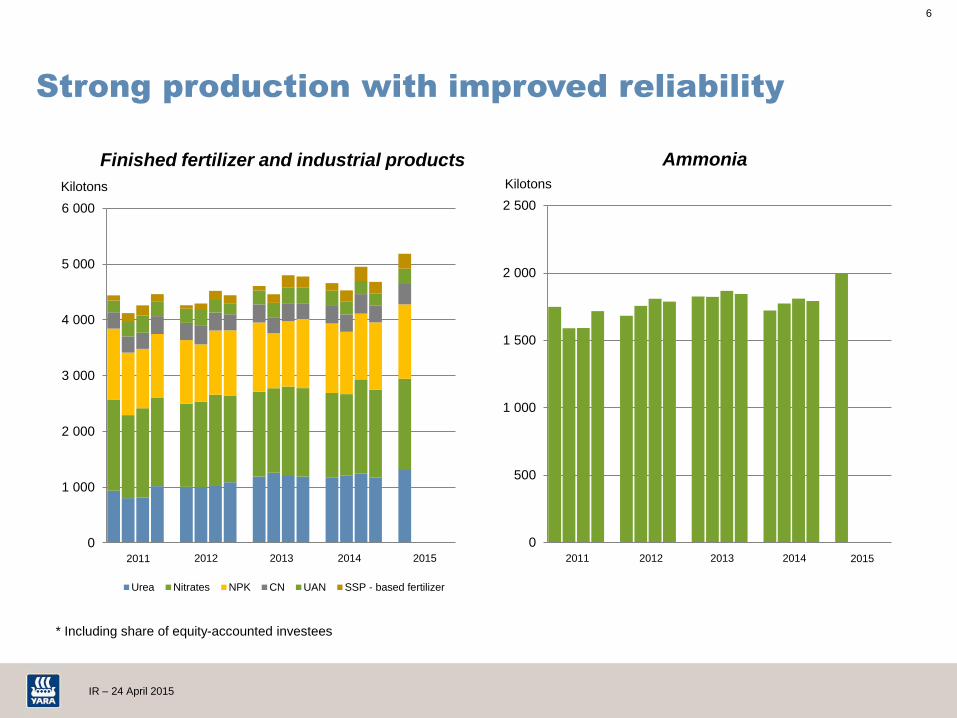
Urea Nitrates NPK CN UAN SSP - based fertilizer
2014 2011 2012 2013 2015
Strong production with improved reliability
0
500
1 000
1 500
2 000
2 500
Kilotons
2015
* Including share of equity-accounted investees
Finished fertilizer and industrial products Ammonia
2014 2011 2012 2013
7
IR – 24 April 2015
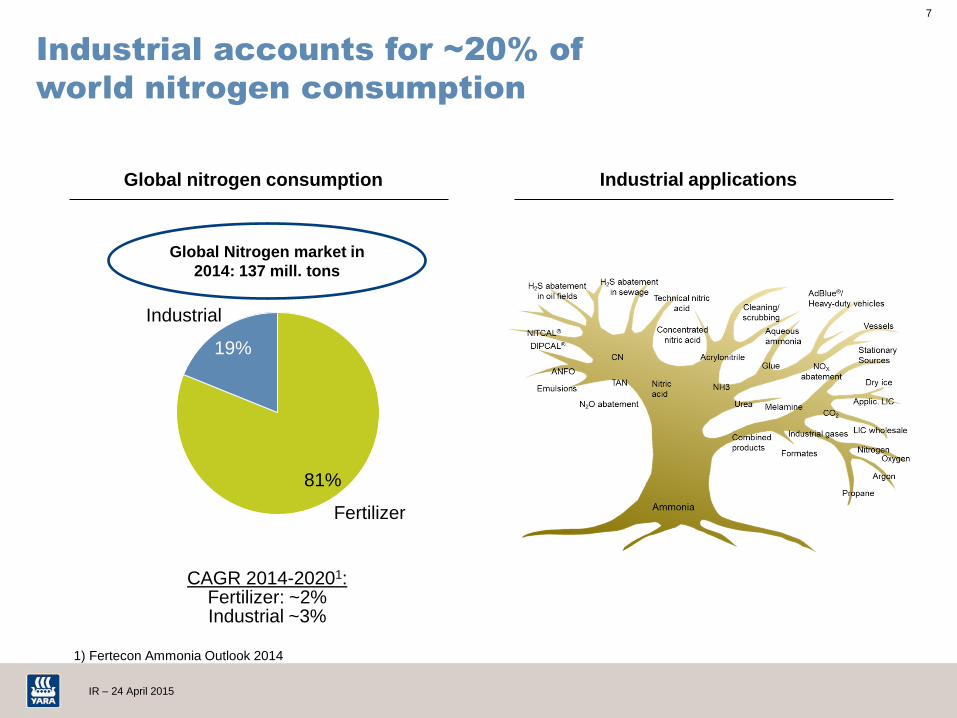
Industrial accounts for ~20% of
world nitrogen consumption
Global nitrogen consumption Industrial applications
19%
Industrial
Fertilizer
81%
Global Nitrogen market in
2014: 137 mill. tons
1) Fertecon Ammonia Outlook 2014
CAGR 2014-20201: Fertilizer: ~2% Industrial ~3%
8
IR – 24 April 2015
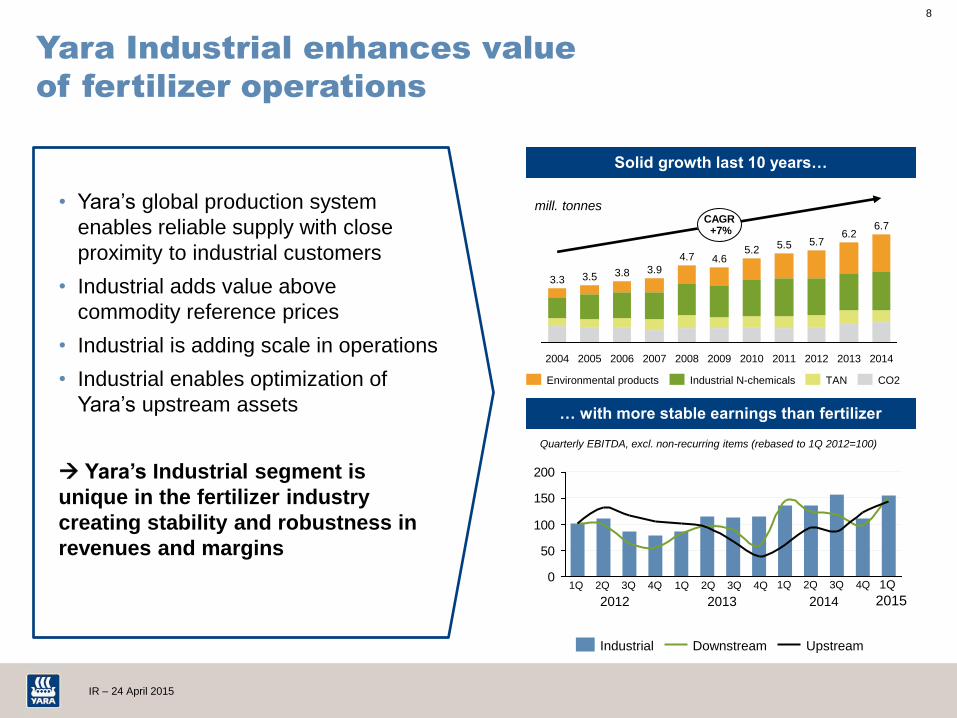
• Yara’s global production system
enables reliable supply with close
proximity to industrial customers
• Industrial adds value above
commodity reference prices
• Industrial is adding scale in operations
• Industrial enables optimization of
Yara’s upstream assets
Yara’s Industrial segment is
unique in the fertilizer industry
creating stability and robustness in
revenues and margins
Yara Industrial enhances value
of fertilizer operations
0
50
100
150
200
Quarterly EBITDA, excl. non-recurring items (rebased to 1Q 2012=100)
Downstream Industrial Upstream
2014
CAGR +7%
2013
6.2
2012
5.7
2011
5.5
2010
5.2
2009
4.6
2008
4.7
2007
3.9
2006
3.8
2005
3.5
2004
3.3
6.7
TAN CO2 Industrial N-chemicals Environmental products
mill. tonnes
1Q 2Q 3Q 4Q
2012 2013 2014
1Q
2015
Solid growth last 10 years…
… with more stable earnings than fertilizer
1Q 2Q 3Q 4Q 1Q 2Q 3Q 4Q
9
IR – 24 April 2015
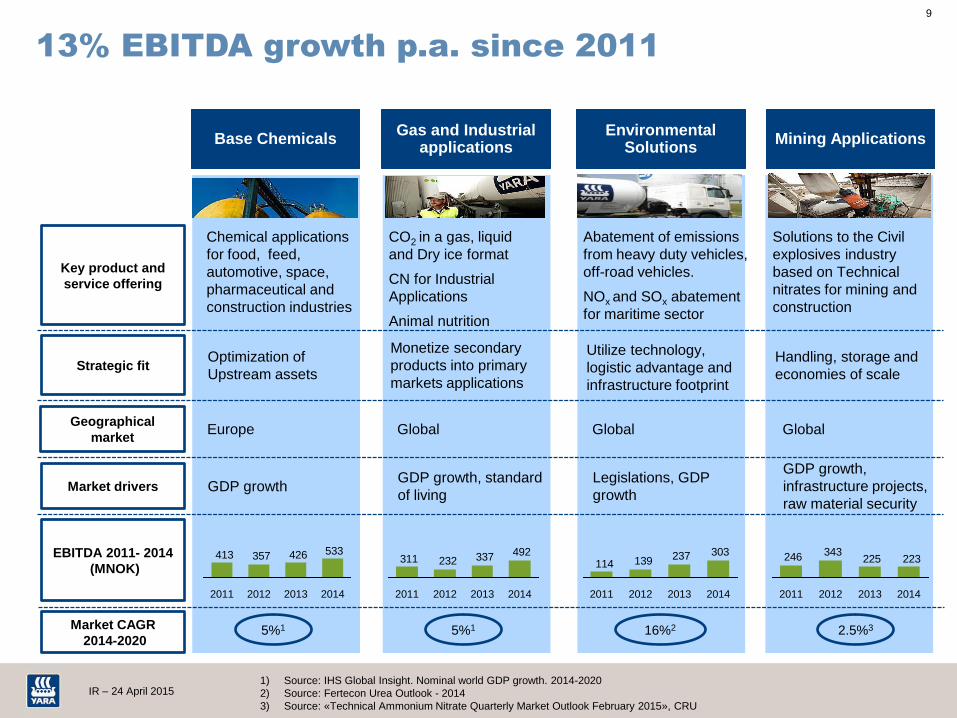
13% EBITDA growth p.a. since 2011
1) Source: IHS Global Insight. Nominal world GDP growth. 2014-2020
2) Source: Fertecon Urea Outlook - 2014
3) Source: «Technical Ammonium Nitrate Quarterly Market Outlook February 2015», CRU
Chemical applications
for food, feed,
automotive, space,
pharmaceutical and
construction industries
Base Chemicals
Abatement of emissions
from heavy duty vehicles,
off-road vehicles.
NOx and SOx abatement
for maritime sector
Environmental Solutions
Solutions to the Civil
explosives industry
based on Technical
nitrates for mining and
construction
Mining Applications
CO2 in a gas, liquid
and Dry ice format
CN for Industrial
Applications
Animal nutrition
Gas and Industrial applications
Key product and
service offering
EBITDA 2011- 2014
(MNOK)
Market drivers GDP growth Legislations, GDP
growth
GDP growth,
infrastructure projects,
raw material security
GDP growth, standard
of living
Strategic fit Optimization of
Upstream assets
Utilize technology,
logistic advantage and
infrastructure footprint
Handling, storage and
economies of scale
Monetize secondary
products into primary
markets applications
Geographical
market Europe Global Global Global
533426357413
2014 2013 2011 2012
492337232311
2014 2013 2011 2012
303237139114
2011 2013 2014 2012
223225343246
2014 2013 2012 2011
Market CAGR
2014-2020 16%2 2.5%3 5%1 5%1
10
IR – 24 April 2015
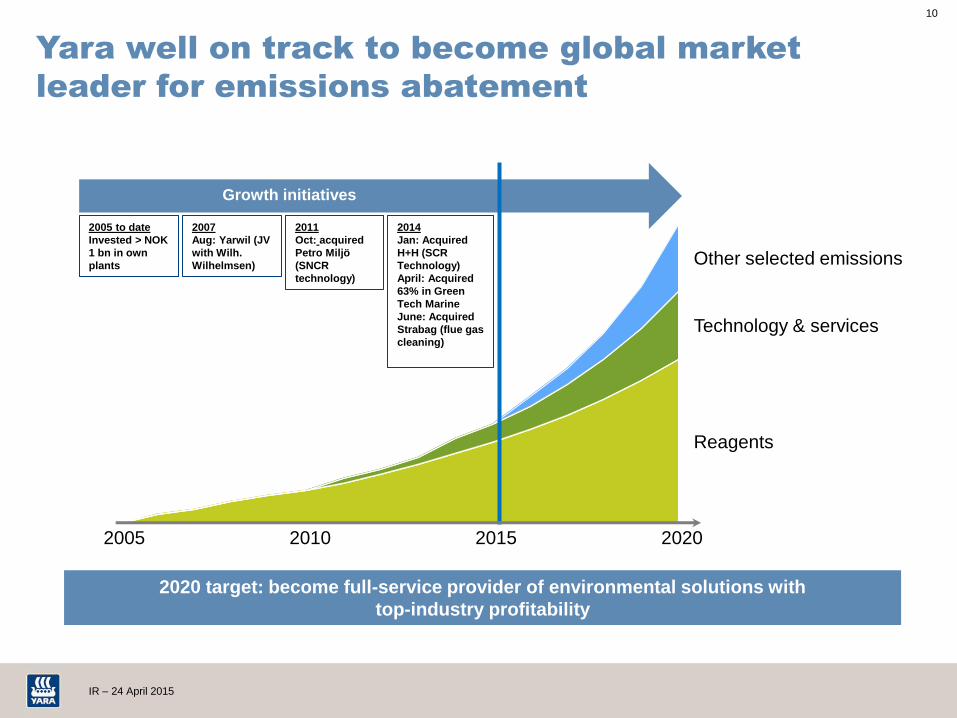
Yara well on track to become global market
leader for emissions abatement
2020 target: become full-service provider of environmental solutions with
top-industry profitability
2005
Other selected emissions
Technology & services
Reagents
2007
Aug: Yarwil (JV
with Wilh.
Wilhelmsen)
2005 to date
Invested > NOK
1 bn in own
plants
2015 2020
2011
Oct: acquired
Petro Miljö
(SNCR
technology)
2014
Jan: Acquired
H+H (SCR
Technology)
April: Acquired
63% in Green
Tech Marine
June: Acquired
Strabag (flue gas
cleaning)
2010
Growth initiatives
11
IR – 24 April 2015
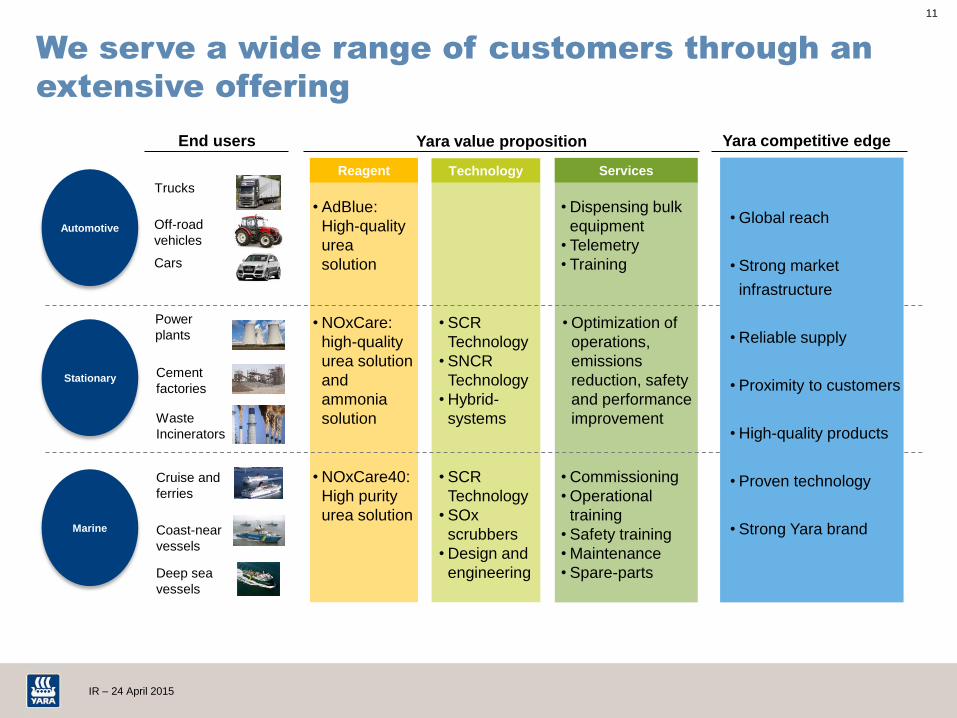
We serve a wide range of customers through an
extensive offering
Technology Services
Stationary
Marine
•Dispensing bulk
equipment
• Telemetry
• Training
• SCR
Technology
• SOx
scrubbers
•Design and
engineering
• SCR
Technology
• SNCR
Technology
•Hybrid-
systems
Automotive
•NOxCare40:
High purity
urea solution
•Optimization of
operations,
emissions
reduction, safety
and performance
improvement
•Commissioning
•Operational
training
• Safety training
•Maintenance
• Spare-parts
Cruise and
ferries
Coast-near
vessels
Deep sea
vessels
Off-road
vehicles
Cars
Trucks
• AdBlue:
High-quality
urea
solution
•NOxCare:
high-quality
urea solution
and
ammonia
solution
Yara value proposition Yara competitive edge End users
Reagent
Power
plants
Cement
factories
Waste
Incinerators
•Global reach
• Strong market
infrastructure
•Reliable supply
• Proximity to customers
•High-quality products
• Proven technology
• Strong Yara brand

12
IR – 24 April 2015
Yara Environmental Solutions grows rapidly
905
713
609619
604
2014
279
1,183
2013
NOxCare
EBITDA (MNOK)
AdBlue EBITDA (MNOK)
NOxCare volumes (kt)
AdBlue volumes (kt)
2012
245
139 4.93.2
8.3
2.2
2014
5.4
CAGR +16%1
2020
13.1
Reagent (AdBlue+NOxCare) Technology
Recent acquisitions have built Yara a solid position to capture the fast-growing Environmental
Solutions market
USDbn.
1) Per urea-equivalent (46% Nitrogen), excl. non-recurring items, source: Fertecon Urea Outlook - 2014
Yara performance Market growth 2014-2020
Yara ES 2014
sales was
USD540mill,
predominantly
reagents
13
IR – 24 April 2015
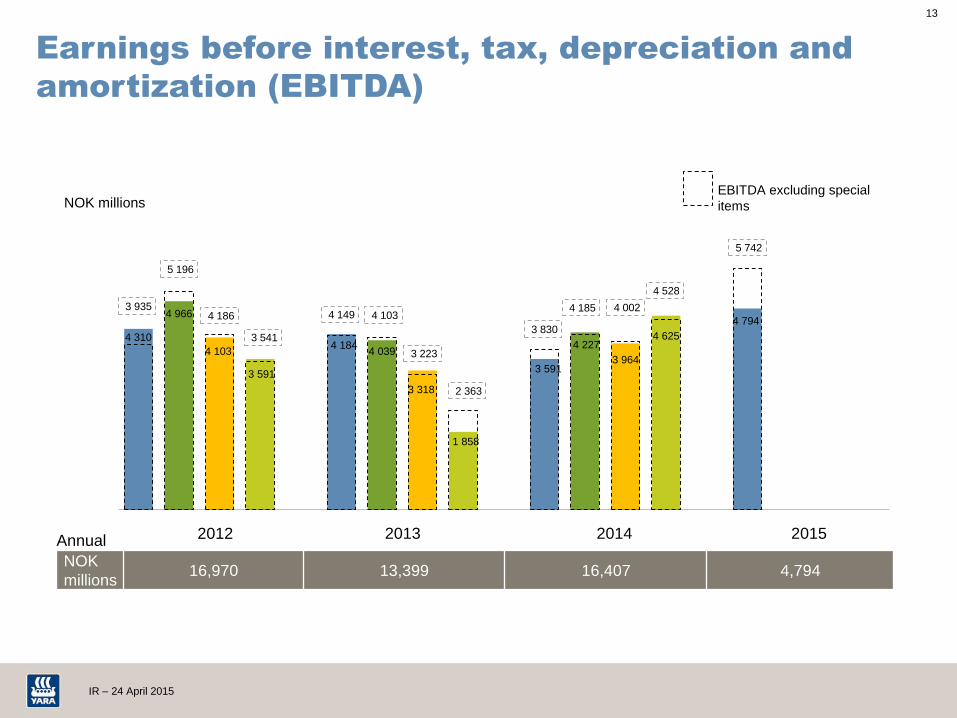
Earnings before interest, tax, depreciation and
amortization (EBITDA)
4 310
4 966
4 103
3 591
4 184 4 039
3 318
1 858
3 591
4 227
3 964
4 625
4 794
3 935
5 196
4 186
3 541
4 149 4 103
3 223
2 363
3 830
4 185 4 002
4 528
5 742
2012 2014 2013 2015
NOK
millions 16,970 13,399 16,407 4,794
Annual
EBITDA excluding special
items NOK millions
14
IR – 24 April 2015
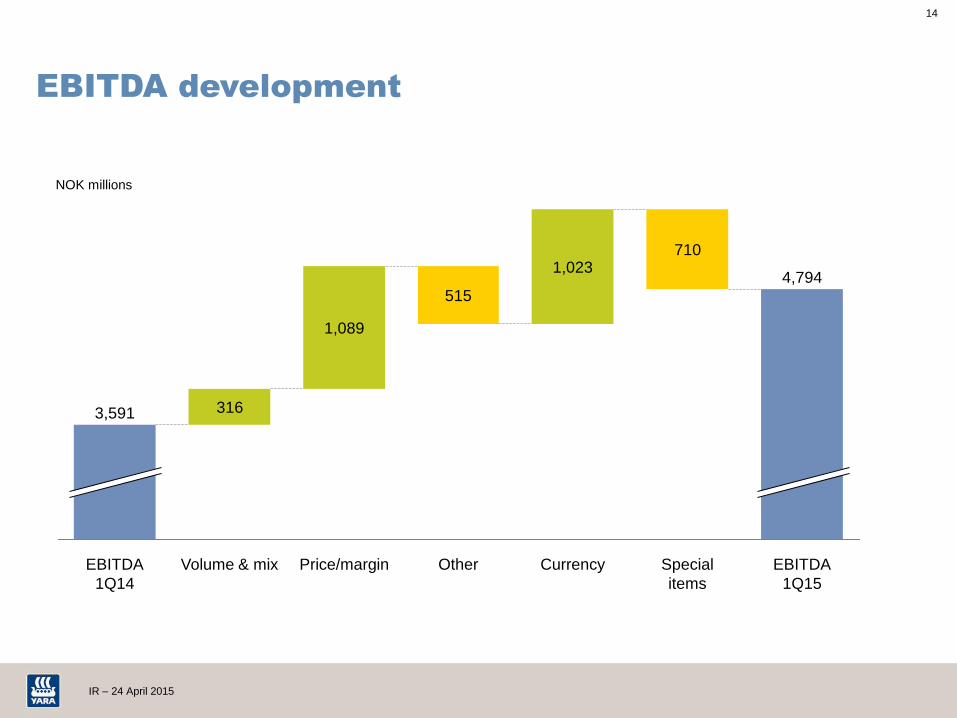
EBITDA development
316
515
710
4,794
EBITDA
1Q15
Special
items
Currency
1,023
Other Price/margin
1,089
Volume & mix EBITDA
1Q14
3,591
NOK millions
15
IR – 24 April 2015
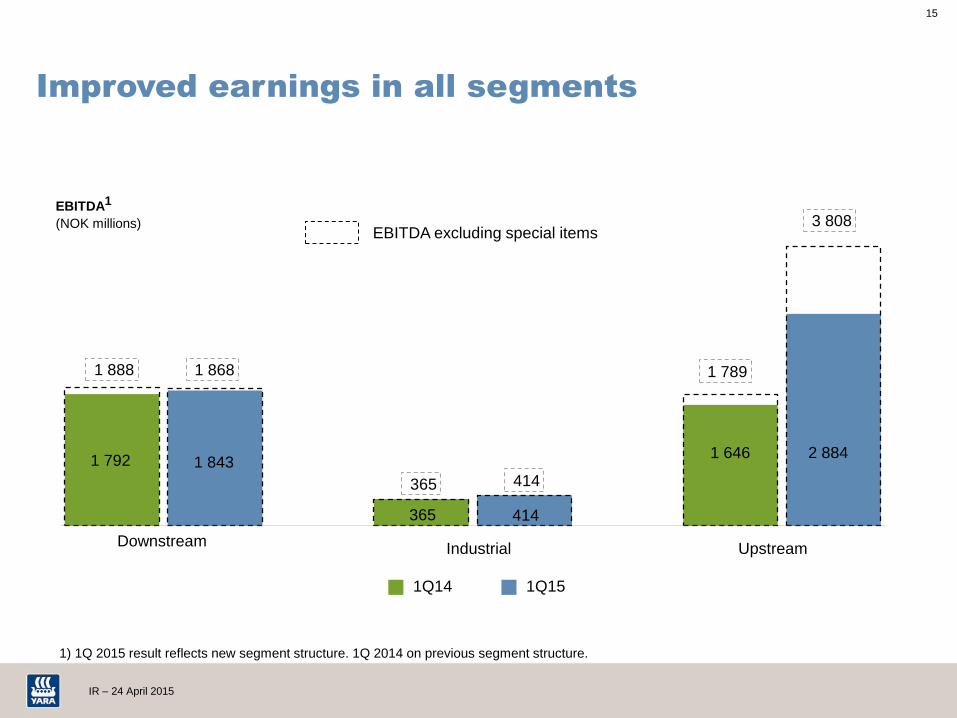
Improved earnings in all segments
1 792 1 843
365 414
1 646 2 884
1 888 1 868
365 414
1 789
3 808
Downstream Industrial Upstream
EBITDA excluding special items
1Q14 1Q15
EBITDA1 (NOK millions)
1) 1Q 2015 result reflects new segment structure. 1Q 2014 on previous segment structure.
16
IR – 24 April 2015
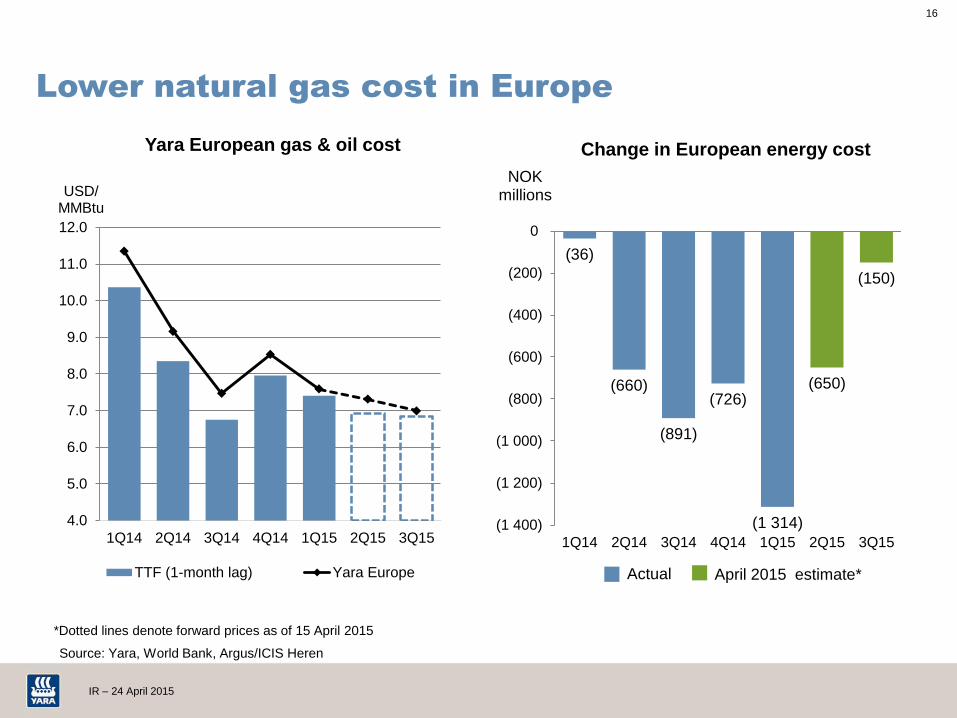
Lower natural gas cost in Europe
4.0
5.0
6.0
7.0
8.0
9.0
10.0
11.0
12.0
1Q14 2Q14 3Q14 4Q14 1Q15 2Q15 3Q15
USD/ MMBtu
TTF (1-month lag) Yara Europe
(36)
(660)
(891)
(726)
(1 314)
(650)
(150)
(1 400)
(1 200)
(1 000)
(800)
(600)
(400)
(200)
0
1Q14 2Q14 3Q14 4Q14 1Q15 2Q15 3Q15
NOK millions
April 2015 estimate*
Source: Yara, World Bank, Argus/ICIS Heren
*Dotted lines denote forward prices as of 15 April 2015
Yara European gas & oil cost
Actual
Change in European energy cost
17
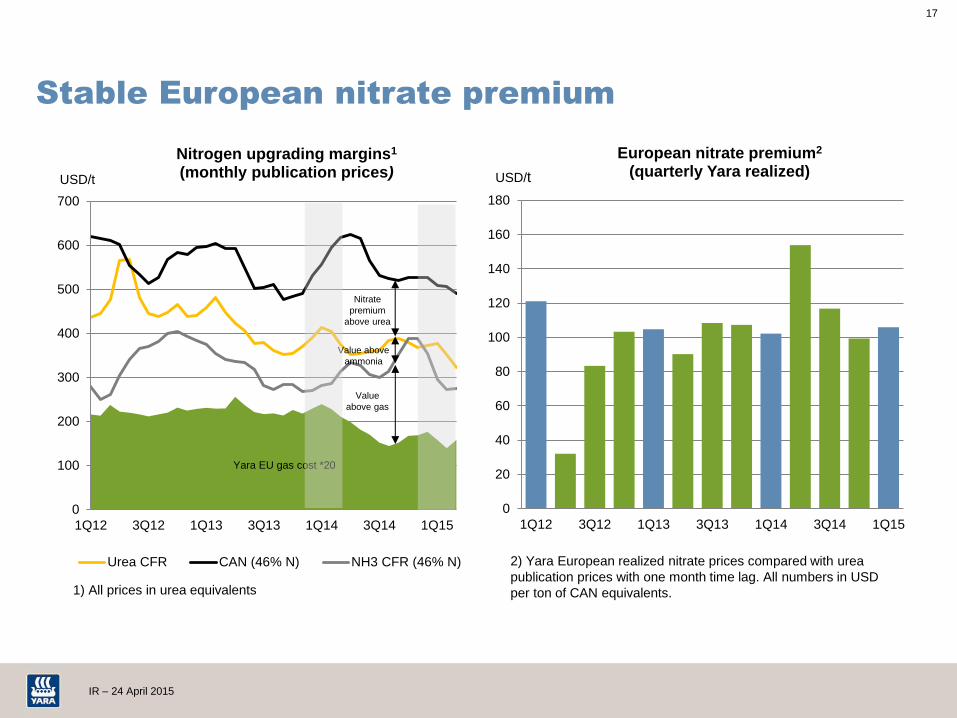
IR – 24 April 2015
Stable European nitrate premium
0
100
200
300
400
500
600
700
1Q12 3Q12 1Q13 3Q13 1Q14 3Q14 1Q15
USD/t
Nitrogen upgrading margins1 (monthly publication prices)
Urea CFR CAN (46% N) NH3 CFR (46% N)
Value
above gas
Value above
ammonia
Nitrate
premium
above urea
Yara EU gas cost *20
0
20
40
60
80
100
120
140
160
180
1Q12 3Q12 1Q13 3Q13 1Q14 3Q14 1Q15
European nitrate premium2 (quarterly Yara realized) USD/t
2) Yara European realized nitrate prices compared with urea
publication prices with one month time lag. All numbers in USD
per ton of CAN equivalents. 1) All prices in urea equivalents
18
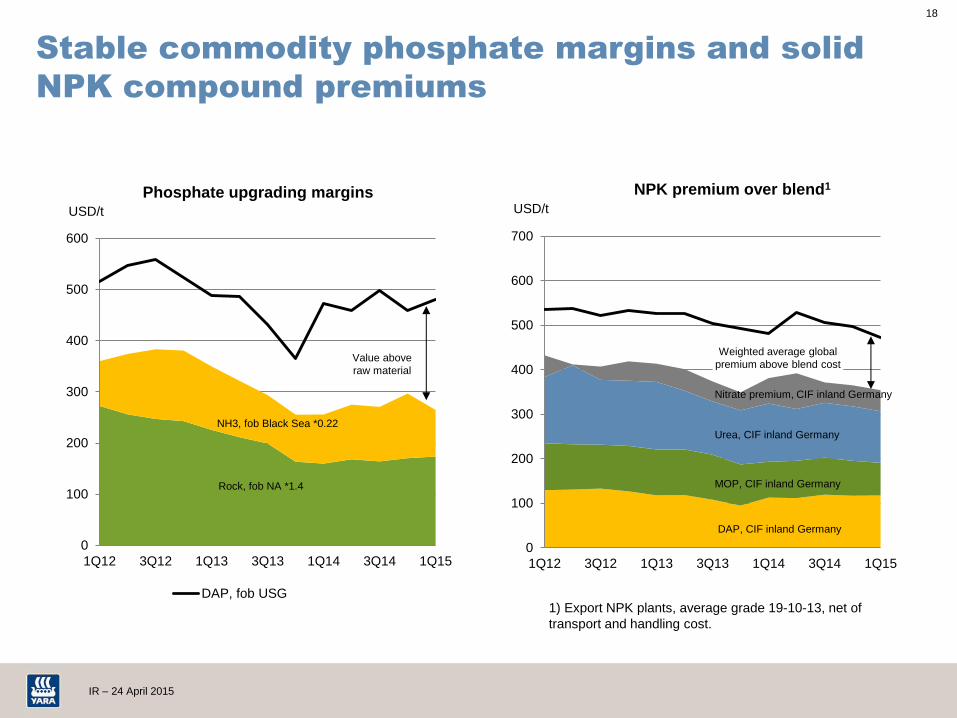
IR – 24 April 2015
Stable commodity phosphate margins and solid
NPK compound premiums
0
100
200
300
400
500
600
700
1Q12 3Q12 1Q13 3Q13 1Q14 3Q14 1Q15
USD/t
NPK premium over blend1
0
100
200
300
400
500
600
1Q12 3Q12 1Q13 3Q13 1Q14 3Q14 1Q15
USD/t
Phosphate upgrading margins
DAP, fob USG
Rock, fob NA *1.4
Value above
raw material
NH3, fob Black Sea *0.22
DAP, CIF inland Germany
MOP, CIF inland Germany
Urea, CIF inland Germany
Weighted average global
premium above blend cost
1) Export NPK plants, average grade 19-10-13, net of
transport and handling cost.
Nitrate premium, CIF inland Germany
19
IR – 24 April 2015
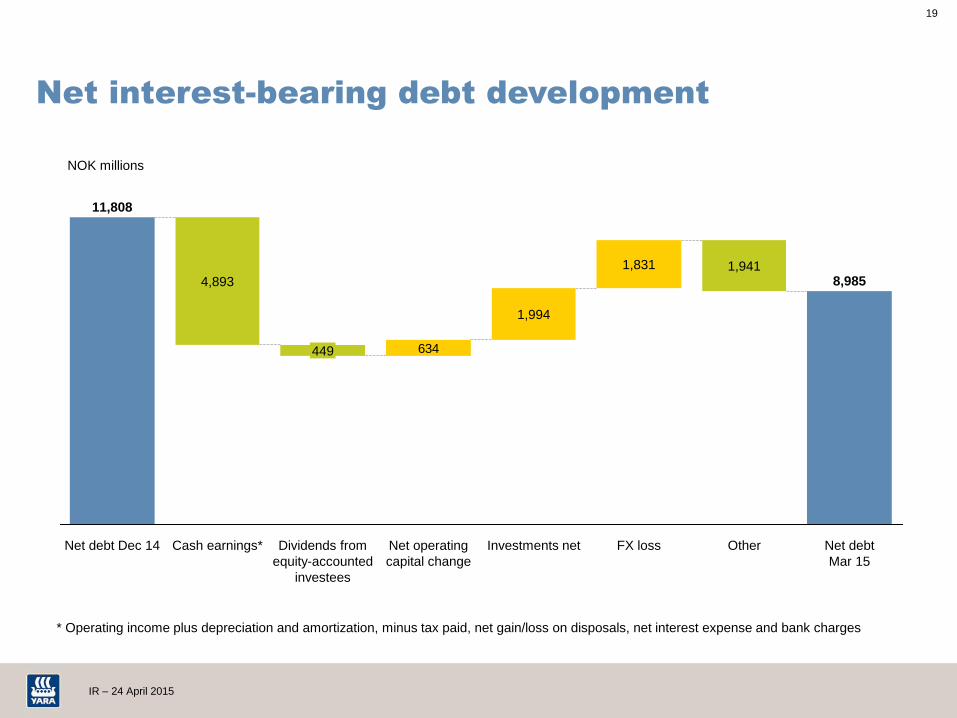
Net interest-bearing debt development
634
FX loss
1,831
Investments net
1,994
8,985
Net operating
capital change
Dividends from
equity-accounted
investees
449
Cash earnings*
4,893
Net debt Dec 14
11,808
Net debt
Mar 15
Other
1,941
* Operating income plus depreciation and amortization, minus tax paid, net gain/loss on disposals, net interest expense and bank charges
NOK millions
20
IR – 24 April 2015
Incentives for fertilizer application remain supportive
Strong US dollar improves competitiveness of European farmers and nitrogen
producers
Yara deliveries in Europe running well in April
Demand for nitrates and compound NPKs continues to grow outside Europe
China to remain swing producer – anthracite coal prices and RMB/USD
exchange rate are key for global nitrogen commodity prices
Expected further gas cost reduction of NOK 650 million in Europe in second
quarter and NOK 150 million in third quarter 2015
Prospects

Additional information
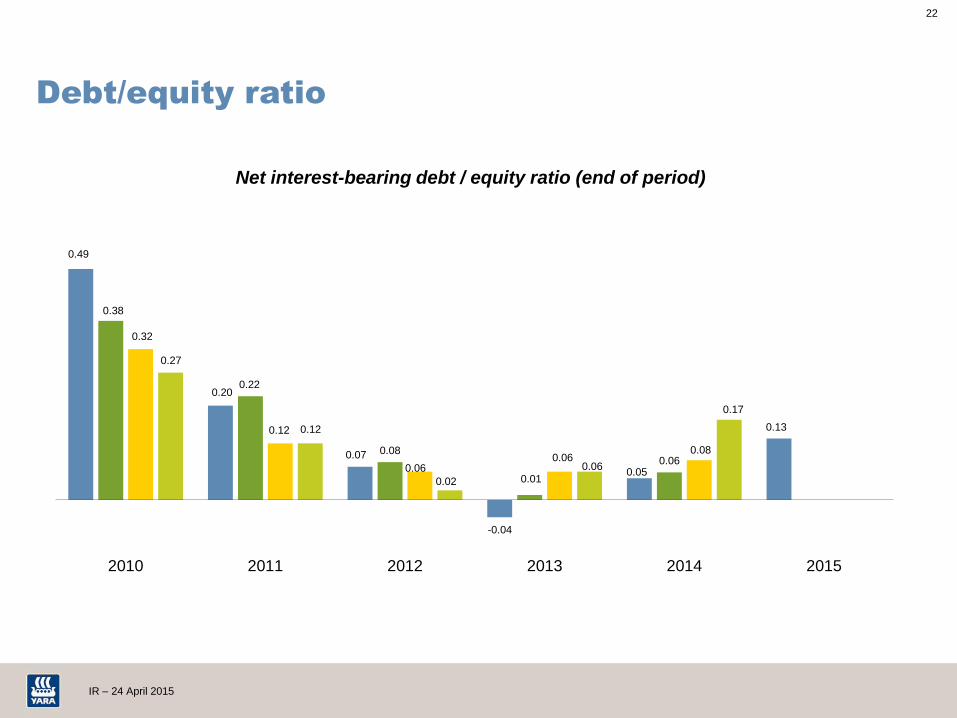
22
IR – 24 April 2015
0.49
0.20
0.07
-0.04
0.05
0.13
0.38
0.22
0.08
0.01
0.06
0.32
0.12
0.06 0.06
0.08
0.27
0.12
0.02
0.06
0.17
2010 2011 2012 2013 2014 2015
Debt/equity ratio
Net interest-bearing debt / equity ratio (end of period)

23
IR – 24 April 2015
0
500
1 000
1 500
2 000
2 500
3 000
3 500
4 000
4 500
5 000
5 500
6 000
6 500
7 000
Europe Outside Europe
Fertilizer deliveries
Kilotons
2011 2008 2009 2010 2012 2013 2014 2015

24
IR – 24 April 2015
Yara 1Q fertilizer sales by market and product
3 110
1 585
926
482 285
3 008
1 852
901
420 385
Europe Latin America North America Asia Africa
1Q14 1Q15
1 463
858
1 570
1 246
556 418
279
1 416
763
1 595 1 378
717
418 278
NPK compounds NPK blends Nitrate Urea Other products UAN CN
Kilotons
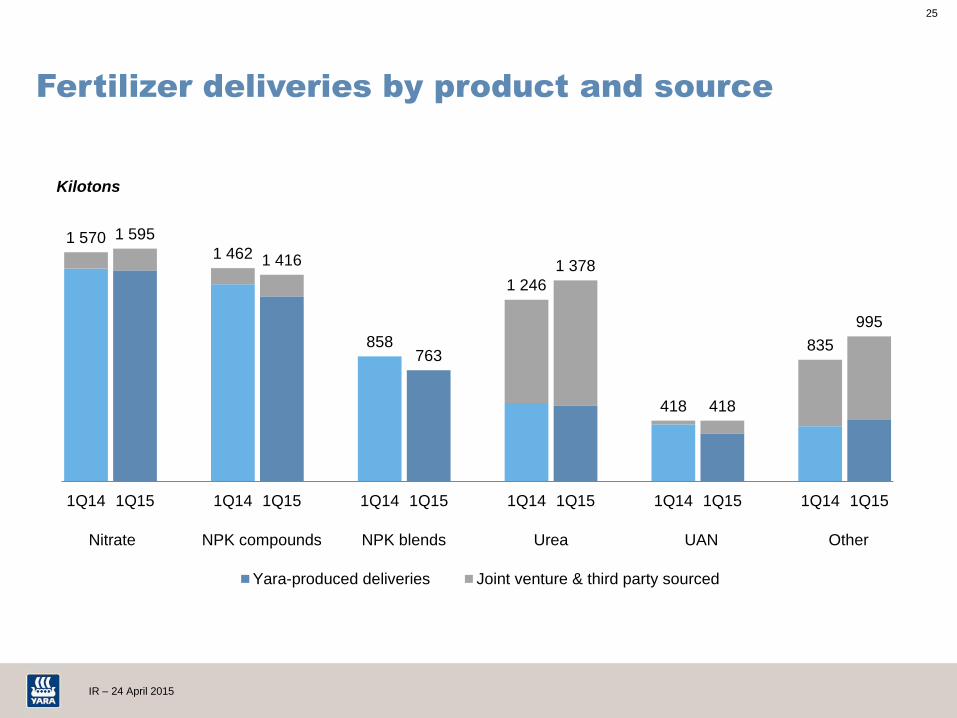
25
IR – 24 April 2015
1 570 1 595
1 462 1 416
858 763
1 246
1 378
418 418
835
995
1Q14 1Q15 1Q14 1Q15 1Q14 1Q15 1Q14 1Q15 1Q14 1Q15 1Q14 1Q15
Yara-produced deliveries Joint venture & third party sourced
Fertilizer deliveries by product and source
Nitrate NPK compounds NPK blends Urea UAN
Kilotons
Other
26
IR – 24 April 2015
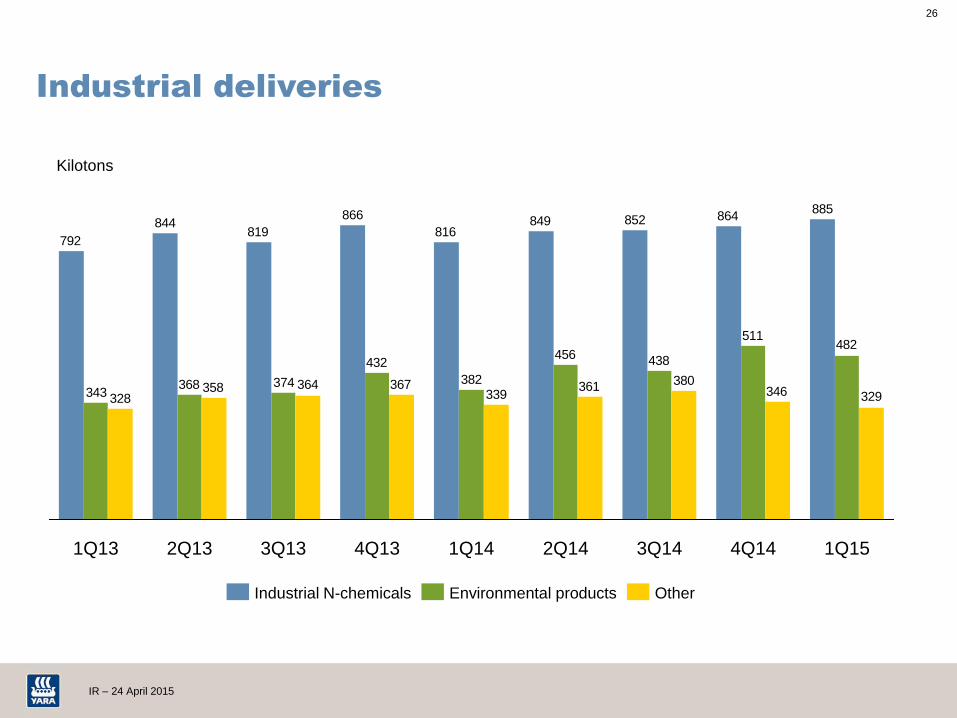
Industrial deliveries
885864852849
816
866
819844
792
482511
438456
382
432
374368343 329346
380361339
367364358328
1Q15 4Q14 3Q14 2Q14 1Q14 4Q13 3Q13 2Q13 1Q13
Industrial N-chemicals Environmental products Other
Kilotons
27
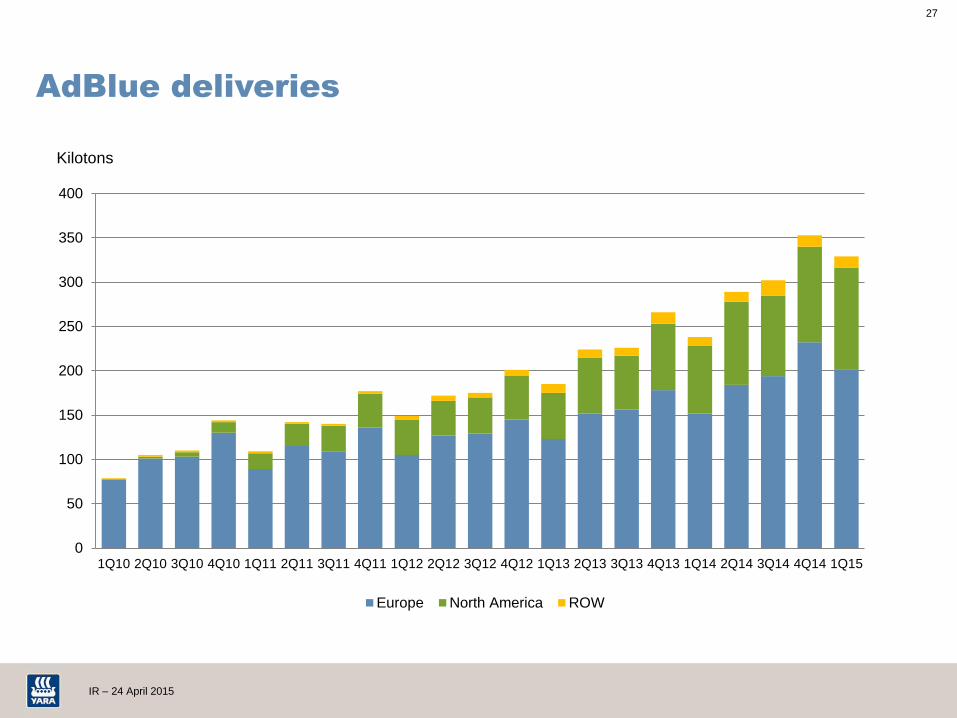
IR – 24 April 2015
0
50
100
150
200
250
300
350
400
1Q10 2Q10 3Q10 4Q10 1Q11 2Q11 3Q11 4Q11 1Q12 2Q12 3Q12 4Q12 1Q13 2Q13 3Q13 4Q13 1Q14 2Q14 3Q14 4Q14 1Q15
Europe North America ROW
AdBlue deliveries
Kilotons
28
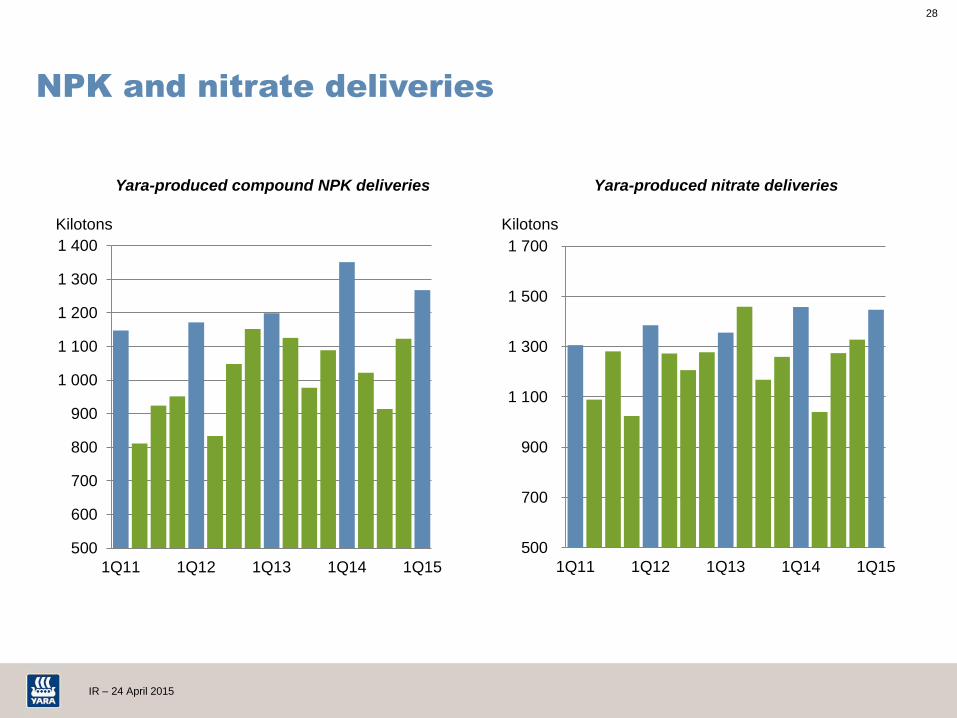
IR – 24 April 2015
500
600
700
800
900
1 000
1 100
1 200
1 300
1 400
1Q11 1Q12 1Q13 1Q14 1Q15
NPK and nitrate deliveries
Kilotons
500
700
900
1 100
1 300
1 500
1 700
1Q11 1Q12 1Q13 1Q14 1Q15
Yara-produced nitrate deliveries
Kilotons
Yara-produced compound NPK deliveries
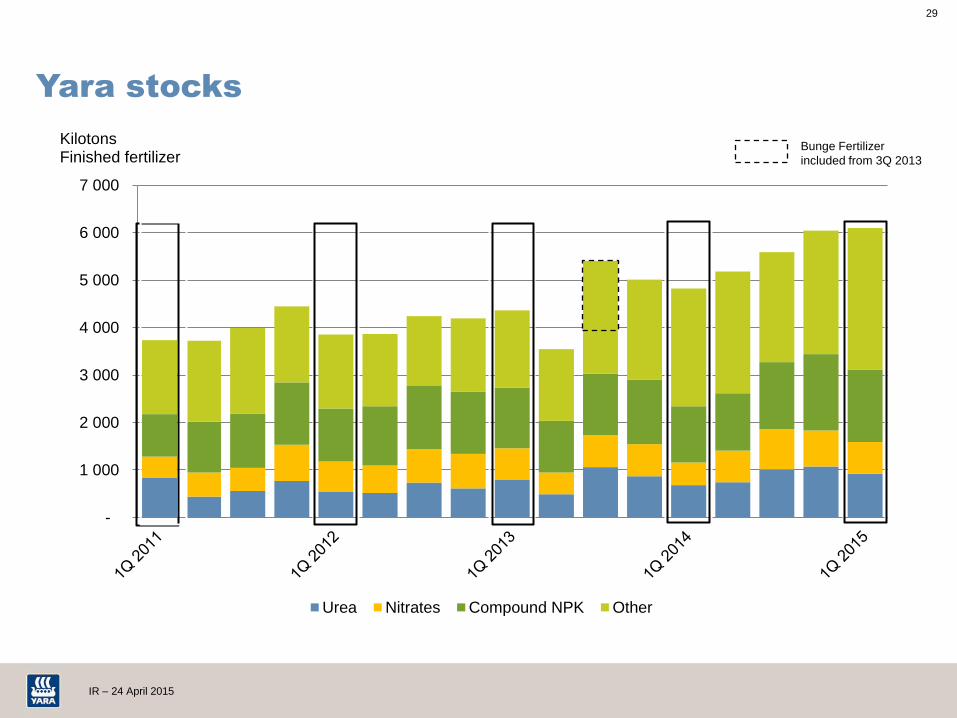
29
IR – 24 April 2015
-
1 000
2 000
3 000
4 000
5 000
6 000
7 000
Kilotons Finished fertilizer
Urea Nitrates Compound NPK Other
Yara stocks
Bunge Fertilizer
included from 3Q 2013

30
IR – 24 April 2015
4.0 4.4
4.0
2.8
3.7
5.2
4.6
3.9 3.8
2.9 2.9 2.6 2.7
4.8
5.7
8.2 8.0 8.0 8.1
6.9
6.1 6.5
6.0 6.0 5.7 5.5 4.7
6.6
9.2 9.4
10.5
9.8
7.6
7.0
8.1
7.0 6.9 6.8
6.6
7.6
10.7 11.0 11.4 11.3
9.2
7.5
8.5
7.6 7.3 7.0
2009 2010 2011 2012 2013 1Q14 2Q14 3Q14 4Q14 1Q15 2Q15 3Q15
US gas price (Henry Hub) Yara Global TTF day ahead (Zeebrugge 2009-2012) Yara Europe
Energy cost
USD per MMBtu
Source: Yara, World Bank, Platts/Argus/ICIS Heren
Yearly averages 2009 – 2013, quarterly averages for 2014-15 with forward prices* for 2Q15 and 3Q15.
*Dotted lines denote forward prices as of 15 April 2015

31
IR – 24 April 2015
Net income from equity-accounted investees
24
-90
53
204
17
-955
129169
Other Lifeco GrowHow UK Qafco
NOK millions
1Q15
1Q14
32
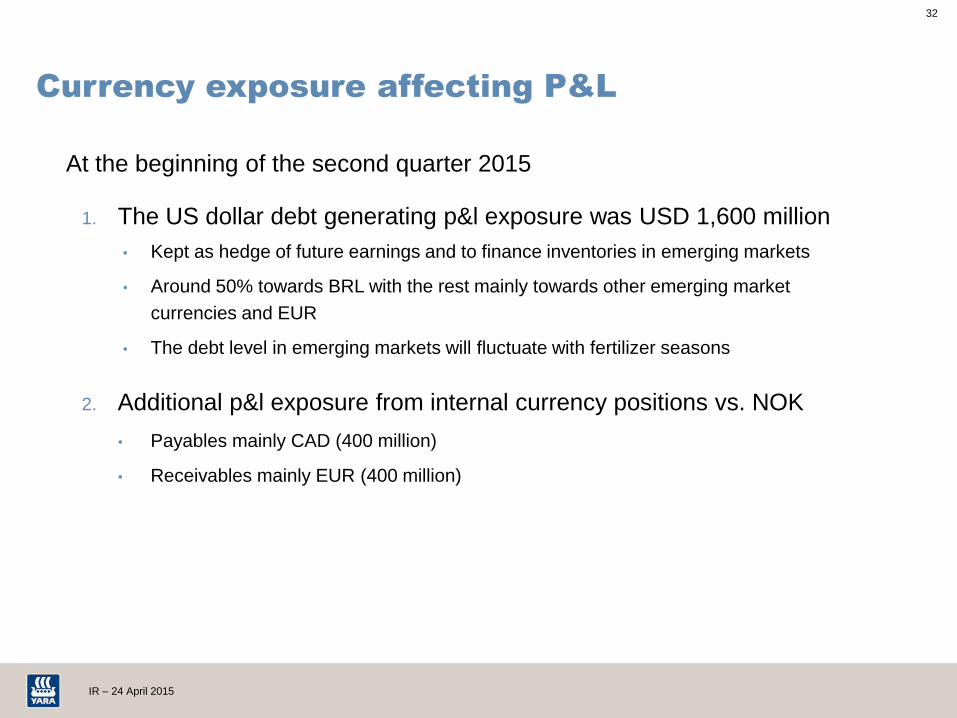
IR – 24 April 2015
Currency exposure affecting P&L
At the beginning of the second quarter 2015
1. The US dollar debt generating p&l exposure was USD 1,600 million
• Kept as hedge of future earnings and to finance inventories in emerging markets
• Around 50% towards BRL with the rest mainly towards other emerging market
currencies and EUR
• The debt level in emerging markets will fluctuate with fertilizer seasons
2. Additional p&l exposure from internal currency positions vs. NOK
• Payables mainly CAD (400 million)
• Receivables mainly EUR (400 million)
33
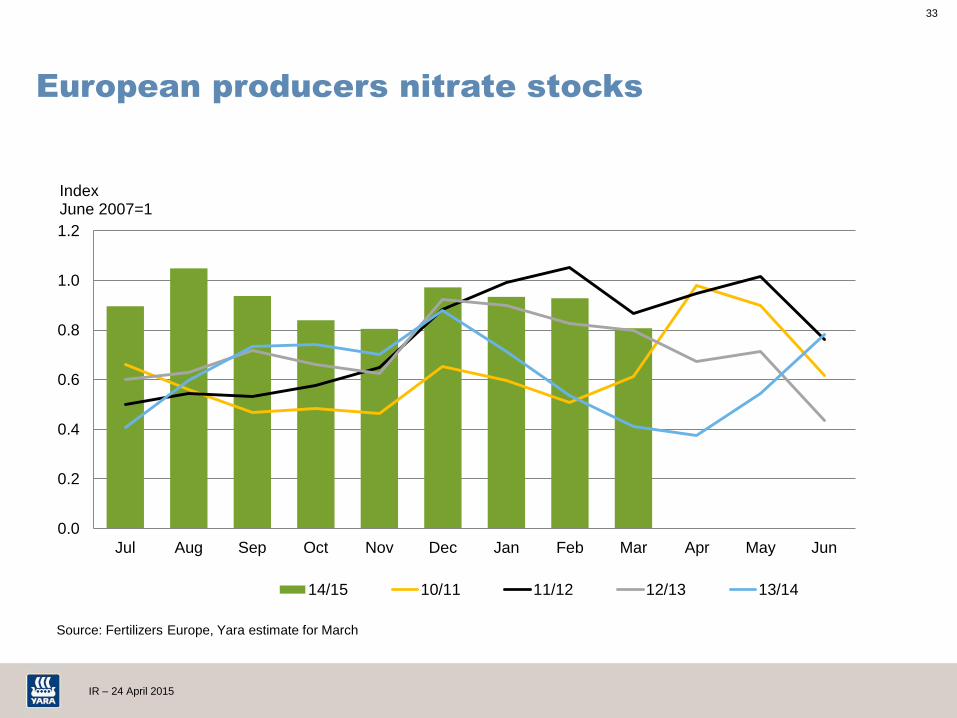
IR – 24 April 2015
0.0
0.2
0.4
0.6
0.8
1.0
1.2
Jul Aug Sep Oct Nov Dec Jan Feb Mar Apr May Jun
Index June 2007=1
14/15 10/11 11/12 12/13 13/14
Source: Fertilizers Europe, Yara estimate for March
European producers nitrate stocks
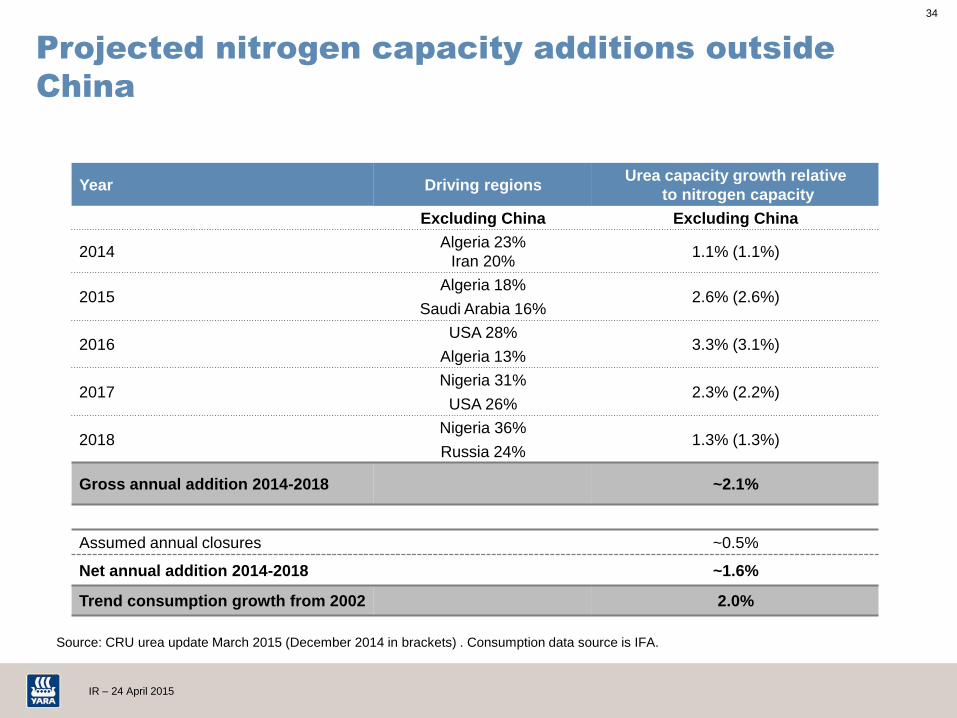
34
IR – 24 April 2015
Source: CRU urea update March 2015 (December 2014 in brackets) . Consumption data source is IFA.
Year Driving regions Urea capacity growth relative
to nitrogen capacity
Excluding China Excluding China
2014 Algeria 23%
Iran 20% 1.1% (1.1%)
2015 Algeria 18%
Saudi Arabia 16% 2.6% (2.6%)
2016 USA 28%
Algeria 13% 3.3% (3.1%)
2017 Nigeria 31%
USA 26% 2.3% (2.2%)
2018 Nigeria 36%
Russia 24% 1.3% (1.3%)
Gross annual addition 2014-2018 ~2.1%
Assumed annual closures ~0.5%
Net annual addition 2014-2018 ~1.6%
Trend consumption growth from 2002 2.0%
Projected nitrogen capacity additions outside
China

35
IR – 24 April 2015
Key value drivers – quarterly averages
338 299
320 315 295
414
358 358 355 337
1Q14 2Q14 3Q14 4Q14 1Q15
Urea prilled fob Black Sea (USD/t)/Urea granular fob Egypt (dotted line, USD/t)
345 354
309 310 295
1Q14 2Q14 3Q14 4Q14 1Q15
CAN cif Germany (USD/t)
5.2
4.6
3.9 3.8
2.9
1Q14 2Q14 3Q14 4Q14 1Q15
US gas price Henry Hub (USD/MMBtu)
9.8
7.6 7.0
8.1 7.0
1Q14 2Q14 3Q14 4Q14 1Q15
TTF day ahead (USD/MMBtu)
6.1 6.0 6.3 6.9
7.7
1Q14 2Q14 3Q14 4Q14 1Q15
NOK/USD exchange rate
438 485 488
572
413
1Q14 2Q14 3Q14 4Q14 1Q15
Ammonia fob Black Sea (USD/t)
Source: Fertilizer Market Publications, CERA, World Bank, Norges Bank
36
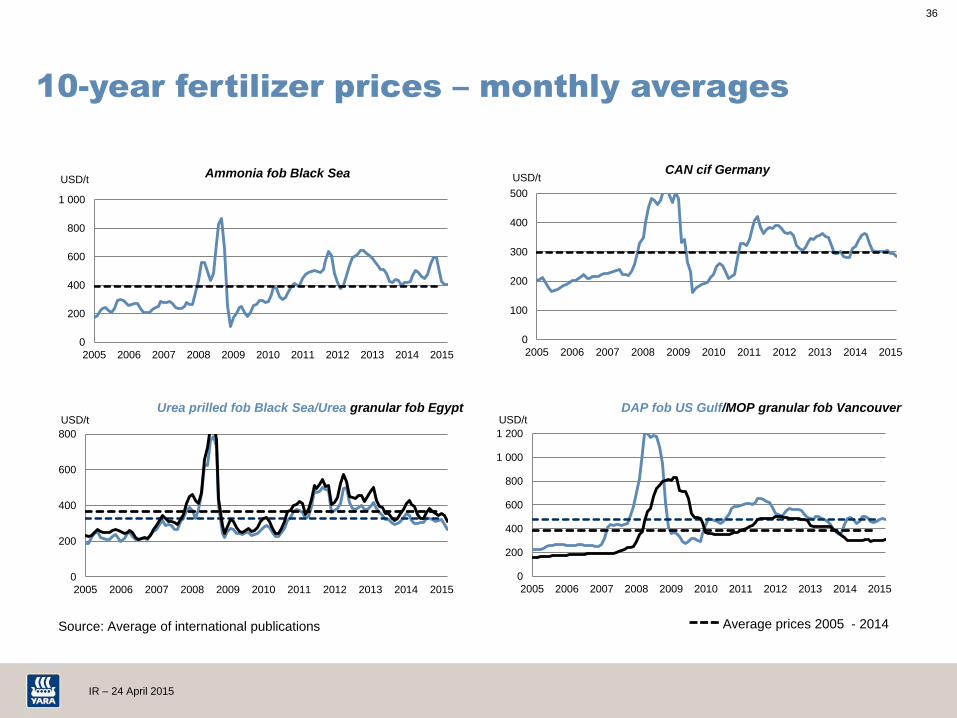
IR – 24 April 2015
10-year fertilizer prices – monthly averages
Source: Average of international publications
0
200
400
600
800
2005 2006 2007 2008 2009 2010 2011 2012 2013 2014 2015
USD/t Urea prilled fob Black Sea/Urea granular fob Egypt
Average prices 2005 - 2014
0
200
400
600
800
1 000
1 200
2005 2006 2007 2008 2009 2010 2011 2012 2013 2014 2015
USD/t DAP fob US Gulf/MOP granular fob Vancouver
0
100
200
300
400
500
2005 2006 2007 2008 2009 2010 2011 2012 2013 2014 2015
USD/t CAN cif Germany
0
200
400
600
800
1 000
2005 2006 2007 2008 2009 2010 2011 2012 2013 2014 2015
USD/t Ammonia fob Black Sea