2015 01 09 greater seattle eastside real estate market report
17
WEEKLY PROPERTY REPORT greater seattle-eastside | Jan 9, 2015 MERCER ISLAND 206.232.0446 weeklypropertyreport.com
-
Upload
windermere-mercer-island -
Category
Documents
-
view
216 -
download
0
description
Real estate market activity by price point in the Seattle and Eastside markets.
Transcript of 2015 01 09 greater seattle eastside real estate market report
WEEKLY PROPERTY REPORT greater seattle-eastside | Jan 9, 2015
MERCER ISLAND206.232.0446
weeklypropertyreport.com

This Week16 Week Average This Week
16 Week Average This Week
16 Week Average
$0-249,999 15 21 4 3 27% 15% 20%
$250,0000-399,999 46 78 10 12 22% 15% 9%
$400,000-499,999 22 31 7 6 32% 21% 23%
$500,0000-599,999 22 25 2 3 9% 13% 9%
$600,000-699,999 8 14 0 1 0% 11% -29%
$700,0000-799,999 7 7 0 1 0% 15% 0%
$800,000-899,999 9 8 2 1 22% 8% 22%
$900,0000-999,999 2 6 0 0 0% 10% 0%
$1,000,000-1,249,999 5 8 0 0 0% 5% 0%
$1,250,0000-1,499,999 4 6 0 0 0% 7% 0%
$1,500,000-1,999,999 1 4 0 0 0% 3% 0%
$2,000,0000 and above 1 2 0 0 0% 0% 0%
©2011-2014 Windermere Real Estate/Mercer Island. For questions or comments, email [email protected].
WeeklyPropertyReport.com │ Residential and condominium data for Greater Seattle and the Eastside
West Seattle - Area 140
Active Listings Pending Sales % Listings SoldPrice Range
Local Market Snapshot for the Week of : January 9, 2015
Sales Trend Change From
Last Week

This Week16 Week Average This Week
16 Week Average This Week
16 Week Average
$0-249,999 7 12 3 2 43% 19% 10%
$250,0000-399,999 34 50 5 6 15% 12% 9%
$400,000-499,999 25 30 3 3 12% 10% 8%
$500,0000-599,999 24 34 3 3 13% 9% 8%
$600,000-699,999 23 26 0 1 0% 4% -5%
$700,0000-799,999 5 8 1 1 20% 8% 20%
$800,000-899,999 3 2 0 0 0% 9% 0%
$900,0000-999,999 2 4 0 0 0% 0% 0%
$1,000,000-1,249,999 3 5 0 0 0% 0% 0%
$1,250,0000-1,499,999 1 1 0 0 0% 0% 0%
$1,500,000-1,999,999 0 0 0 0 0% 0% 0%
$2,000,0000 and above 1 1 0 0 0% 0% 0%
©2011-2014 Windermere Real Estate/Mercer Island. For questions or comments, email [email protected].
WeeklyPropertyReport.com │ Residential and condominium data for Greater Seattle and the Eastside
Renton Highlands - Area 350
Active Listings Pending Sales % Listings SoldPrice Range
Local Market Snapshot for Week of: January 9, 2015
Sales Trend Change From
Last Week

This Week16 Week Average This Week
16 Week Average This Week
16 Week Average
$0-249,999 8 17 2 3 25% 18% 14%
$250,0000-399,999 38 62 3 8 8% 12% -9%
$400,000-499,999 21 25 2 3 10% 14% -17%
$500,0000-599,999 7 10 1 2 14% 17% 0%
$600,000-699,999 7 8 0 1 0% 18% -20%
$700,0000-799,999 6 6 0 1 0% 10% 0%
$800,000-899,999 4 4 1 0 25% 4% 25%
$900,0000-999,999 4 5 0 0 0% 5% 0%
$1,000,000-1,249,999 1 3 0 0 0% 9% 0%
$1,250,0000-1,499,999 0 1 0 0 0% 0% 0%
$1,500,000-1,999,999 4 4 0 0 0% 3% 0%
$2,000,0000 and above 4 6 0 0 0% 2% 0%
©2011-2014 Windermere Real Estate/Mercer Island. For questions or comments, email [email protected].
WeeklyPropertyReport.com │ Residential and condominium data for Greater Seattle and the Eastside
South Seattle - Area 380/385
Active Listings Pending Sales % Listings SoldPrice Range
Local Market Snapshot for the Week of: January 9, 2015
Sales Trend Change From
Last Week
This Week16 Week Average This Week
16 Week Average This Week
16 Week Average
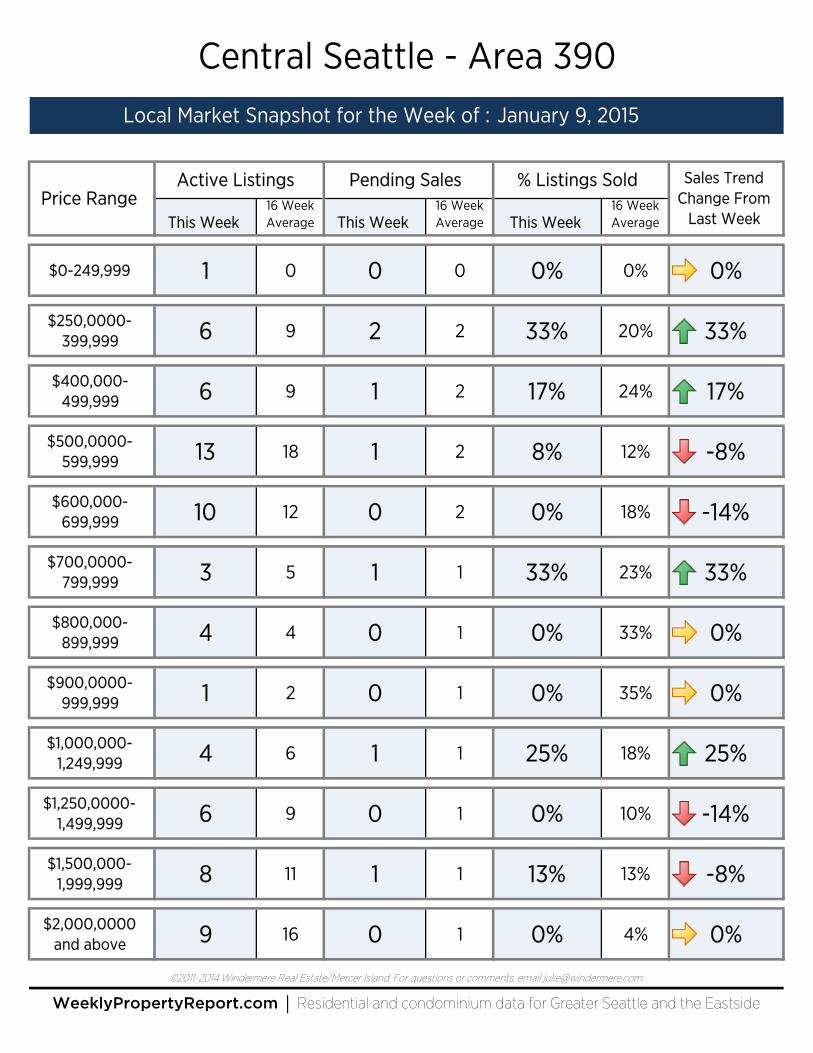
$0-249,999 1 0 0 0 0% 0% 0%
$250,0000-399,999 6 9 2 2 33% 20% 33%
$400,000-499,999 6 9 1 2 17% 24% 17%
$500,0000-599,999 13 18 1 2 8% 12% -8%
$600,000-699,999 10 12 0 2 0% 18% -14%
$700,0000-799,999 3 5 1 1 33% 23% 33%
$800,000-899,999 4 4 0 1 0% 33% 0%
$900,0000-999,999 1 2 0 1 0% 35% 0%
$1,000,000-1,249,999 4 6 1 1 25% 18% 25%
$1,250,0000-1,499,999 6 9 0 1 0% 10% -14%
$1,500,000-1,999,999 8 11 1 1 13% 13% -8%
$2,000,0000 and above 9 16 0 1 0% 4% 0%
Central Seattle - Area 390Local Market Snapshot for the Week of : January 9, 2015
WeeklyPropertyReport.com │ Residential and condominium data for Greater Seattle and the Eastside
Price RangeActive Listings Pending Sales % Listings Sold Sales Trend
Change From Last Week
©2011-2014 Windermere Real Estate/Mercer Island. For questions or comments, email [email protected].

This Week16 Week Average This Week
16 Week Average This Week
16 Week Average
$0-249,999 2 3 0 0 0% 6% 0%
$250,0000-399,999 8 12 0 2 0% 12% 0%
$400,000-499,999 8 19 1 2 13% 11% 13%
$500,0000-599,999 10 17 0 3 0% 16% -13%
$600,000-699,999 10 21 2 2 20% 12% 10%
$700,0000-799,999 21 27 2 3 10% 11% 0%
$800,000-899,999 15 17 0 2 0% 9% -15%
$900,0000-999,999 2 10 1 1 50% 14% 50%
$1,000,000-1,249,999 8 13 0 1 0% 6% -17%
$1,250,0000-1,499,999 8 11 0 0 0% 3% 0%
$1,500,000-1,999,999 5 8 3 1 60% 11% 60%
$2,000,0000 and above 4 5 0 0 0% 5% 0%
©2011-2014 Windermere Real Estate/Mercer Island. For questions or comments, email [email protected].
WeeklyPropertyReport.com │ Residential and condominium data for Greater Seattle and the Eastside
East Side South - Area 500
Active Listings Pending Sales % Listings SoldPrice Range
Local Market Snapshot for the Week of : January 9, 2015
Sales Trend Change From
Last Week

This Week16 Week Average This Week
16 Week Average This Week
16 Week Average
$0-249,999 0 0 0 0 0% 0% 0%
$250,0000-399,999 0 0 0 0 0% 0% 0%
$400,000-499,999 0 0 0 0 0% 0% 0%
$500,0000-599,999 0 0 0 0 0% 0% 0%
$600,000-699,999 0 2 2 2 0% 90% -100%
$700,0000-799,999 2 2 1 1 50% 91% 0%
$800,000-899,999 2 1 0 0 0% 13% -100%
$900,0000-999,999 0 2 0 1 0% 34% 0%
$1,000,000-1,249,999 4 6 2 3 50% 46% 0%
$1,250,0000-1,499,999 7 7 0 1 0% 8% 0%
$1,500,000-1,999,999 6 11 3 3 50% 28% 0%
$2,000,0000 and above 16 21 3 3 19% 13% 7%
Mercer Island - Area 510Local Market Snapshot for the Week of : January 9, 2015
WeeklyPropertyReport.com │ Residential and condominium data for Greater Seattle and the Eastside
Price RangeActive Listings Pending Sales % Listings Sold Sales Trend
Change From Last Week
©2011-2014 Windermere Real Estate/Mercer Island. For questions or comments, email [email protected].

This Week16 Week Average This Week
16 Week Average This Week
16 Week Average
$0-249,999 0 0 0 0 0% 0% 0%
$250,0000-399,999 0 0 0 0 0% 0% 0%
$400,000-499,999 0 0 0 0 0% 0% 0%
$500,0000-599,999 0 0 0 0 0% 0% 0%
$600,000-699,999 1 1 0 0 0% 6% 0%
$700,0000-799,999 1 1 0 0 0% 19% 0%
$800,000-899,999 0 3 1 1 0% 29% 0%
$900,0000-999,999 3 3 0 1 0% 41% 0%
$1,000,000-1,249,999 1 2 0 0 0% 16% 0%
$1,250,0000-1,499,999 1 5 0 1 0% 28% -100%
$1,500,000-1,999,999 16 16 0 2 0% 10% 0%
$2,000,0000 and above 33 42 0 2 0% 4% 0%
©2011-2014 Windermere Real Estate/Mercer Island. For questions or comments, email [email protected].
WeeklyPropertyReport.com │ Residential and condominium data for Greater Seattle and the Eastside
West Bellevue - Area 520
Active Listings Pending Sales % Listings SoldPrice Range
Local Market Snapshot for the Week of : January 9, 2015
Sales Trend Change From
Last Week

This Week16 Week Average This Week
16 Week Average This Week
16 Week Average
$0-249,999 1 0 0 0 0% 0% 0%
$250,0000-399,999 2 2 0 1 0% 41% 0%
$400,000-499,999 7 15 1 4 14% 29% -29%
$500,0000-599,999 10 15 4 4 40% 25% 40%
$600,000-699,999 7 12 0 2 0% 13% 0%
$700,0000-799,999 6 7 0 1 0% 18% 0%
$800,000-899,999 5 7 0 1 0% 7% 0%
$900,0000-999,999 3 3 0 0 0% 10% 0%
$1,000,000-1,249,999 5 6 0 1 0% 10% 0%
$1,250,0000-1,499,999 1 2 0 0 0% 21% 0%
$1,500,000-1,999,999 1 2 0 0 0% 17% -100%
$2,000,0000 and above 1 2 0 0 0% 15% 0%
©2011-2014 Windermere Real Estate/Mercer Island. For questions or comments, email [email protected].
WeeklyPropertyReport.com │ Residential and condominium data for Greater Seattle and the Eastside
East Bellevue - Area 530
Active Listings Pending Sales % Listings SoldPrice Range
Local Market Snapshot for the Week of : January 9, 2015
Sales Trend Change From
Last Week

This Week16 Week Average This Week
16 Week Average This Week
16 Week Average
$0-249,999 10 13 1 1 10% 11% -15%
$250,0000-399,999 27 38 4 4 15% 10% 11%
$400,000-499,999 24 34 3 5 13% 14% -1%
$500,0000-599,999 32 36 5 6 16% 17% 4%
$600,000-699,999 27 45 1 5 4% 11% -7%
$700,0000-799,999 17 41 2 4 12% 12% 2%
$800,000-899,999 34 49 3 4 9% 7% 6%
$900,0000-999,999 21 28 1 2 5% 5% 5%
$1,000,000-1,249,999 17 21 0 1 0% 5% -7%
$1,250,0000-1,499,999 8 11 1 1 13% 8% 13%
$1,500,000-1,999,999 7 11 0 0 0% 3% 0%
$2,000,0000 and above 5 9 0 0 0% 2% 0%
©2011-2014 Windermere Real Estate/Mercer Island. For questions or comments, email [email protected].
WeeklyPropertyReport.com │ Residential and condominium data for Greater Seattle and the Eastside
East Lake Sammamish - Area 540
Active Listings Pending Sales % Listings SoldPrice Range
Local Market Snapshot for the Week of : January 9, 2015
Sales Trend Change From
Last Week

This Week16 Week Average This Week
16 Week Average This Week
16 Week Average
$0-249,999 1 1 1 0 100% 25% 100%
$250,0000-399,999 16 21 4 3 25% 16% 8%
$400,000-499,999 11 16 0 2 0% 14% 0%
$500,0000-599,999 8 15 1 2 13% 18% 0%
$600,000-699,999 11 17 1 2 9% 11% 9%
$700,0000-799,999 7 12 0 2 0% 18% 0%
$800,000-899,999 17 22 0 1 0% 5% -7%
$900,0000-999,999 17 14 1 1 6% 8% -2%
$1,000,000-1,249,999 11 12 1 1 9% 4% 0%
$1,250,0000-1,499,999 4 5 0 0 0% 5% 0%
$1,500,000-1,999,999 6 8 0 0 0% 3% 0%
$2,000,0000 and above 0 1 0 0 0% 0% 0%
©2011-2014 Windermere Real Estate/Mercer Island. For questions or comments, email [email protected].
WeeklyPropertyReport.com │ Residential and condominium data for Greater Seattle and the Eastside
Redmond-Carnation - Area 550
Active Listings Pending Sales % Listings SoldPrice Range
Local Market Snapshot for the Week of : January 9, 2015
Sales Trend Change From
Last Week

This Week16 Week Average This Week
16 Week Average This Week
16 Week Average
$0-249,999 0 0 0 0 0% 0% 0%
$250,0000-399,999 1 4 2 2 200% 51% 200%
$400,000-499,999 3 5 1 2 33% 42% -33%
$500,0000-599,999 3 7 0 1 0% 27% -50%
$600,000-699,999 4 10 2 2 50% 23% 50%
$700,0000-799,999 2 11 0 1 0% 17% -100%
$800,000-899,999 8 14 1 2 13% 13% -16%
$900,0000-999,999 8 14 0 1 0% 8% 0%
$1,000,000-1,249,999 12 17 0 1 0% 7% 0%
$1,250,0000-1,499,999 5 10 0 1 0% 11% -20%
$1,500,000-1,999,999 4 8 1 1 25% 11% 5%
$2,000,0000 and above 1 6 0 1 0% 7% 0%
©2011-2014 Windermere Real Estate/Mercer Island. For questions or comments, email [email protected].
WeeklyPropertyReport.com │ Residential and condominium data for Greater Seattle and the Eastside
Kirkland-Bridle Trails - Area 560
Active Listings Pending Sales % Listings SoldPrice Range
Local Market Snapshot for the Week of : January 9, 2015
Sales Trend Change From
Last Week

This Week16 Week Average This Week
16 Week Average This Week
16 Week Average
$0-249,999 15 17 1 1 7% 6% 7%
$250,0000-399,999 29 46 5 8 17% 17% 9%
$400,000-499,999 34 63 4 9 12% 15% -12%
$500,0000-599,999 19 40 3 5 16% 14% -4%
$600,000-699,999 32 40 3 4 9% 9% -9%
$700,0000-799,999 22 32 1 2 5% 5% 5%
$800,000-899,999 21 33 3 2 14% 5% 14%
$900,0000-999,999 8 13 1 1 13% 6% -2%
$1,000,000-1,249,999 10 11 0 1 0% 5% 0%
$1,250,0000-1,499,999 5 7 0 0 0% 1% 0%
$1,500,000-1,999,999 7 11 0 0 0% 3% 0%
$2,000,0000 and above 5 6 0 0 0% 4% -25%
©2011-2014 Windermere Real Estate/Mercer Island. For questions or comments, email [email protected].
WeeklyPropertyReport.com │ Residential and condominium data for Greater Seattle and the Eastside
Juanita-Woodinville - Area 600
Active Listings Pending Sales % Listings SoldPrice Range
Local Market Snapshot for the Week of : January 9, 2015
Sales Trend Change From
Last Week

This Week16 Week Average This Week
16 Week Average This Week
16 Week Average
$0-249,999 0 0 0 0 0% 0% 0%
$250,0000-399,999 4 3 0 1 0% 21% 0%
$400,000-499,999 4 6 0 2 0% 33% -25%
$500,0000-599,999 5 9 0 2 0% 21% -20%
$600,000-699,999 8 13 0 2 0% 14% -11%
$700,0000-799,999 1 7 1 1 100% 22% 100%
$800,000-899,999 9 11 1 1 11% 12% 11%
$900,0000-999,999 3 7 0 1 0% 8% 0%
$1,000,000-1,249,999 8 9 1 1 13% 7% 13%
$1,250,0000-1,499,999 3 4 0 0 0% 8% 0%
$1,500,000-1,999,999 7 7 0 0 0% 5% 0%
$2,000,0000 and above 10 14 0 0 0% 3% 0%
©2011-2014 Windermere Real Estate/Mercer Island. For questions or comments, email [email protected].
WeeklyPropertyReport.com │ Residential and condominium data for Greater Seattle and the Eastside
Queen Anne-Magnolia - Area 700
Active Listings Pending Sales % Listings SoldPrice Range
Local Market Snapshot for the Week of : January 9, 2015
Sales Trend Change From
Last Week

This Week16 Week Average This Week
16 Week Average This Week
16 Week Average
$0-249,999 1 0 0 0 0% 6% 0%
$250,0000-399,999 21 31 5 6 24% 19% 19%
$400,000-499,999 18 31 3 8 17% 25% 17%
$500,0000-599,999 14 23 4 7 29% 29% 21%
$600,000-699,999 17 25 3 4 18% 18% 18%
$700,0000-799,999 4 9 2 2 50% 25% 50%
$800,000-899,999 1 7 0 1 0% 20% -50%
$900,0000-999,999 2 4 0 1 0% 15% 0%
$1,000,000-1,249,999 3 5 0 1 0% 12% 0%
$1,250,0000-1,499,999 3 4 0 1 0% 17% 0%
$1,500,000-1,999,999 3 4 1 0 33% 6% 33%
$2,000,0000 and above 7 7 1 0 14% 1% 14%
©2011-2014 Windermere Real Estate/Mercer Island. For questions or comments, email [email protected].
WeeklyPropertyReport.com │ Residential and condominium data for Greater Seattle and the Eastside
Ballard-Greenlake - Area 705
Active Listings Pending Sales % Listings SoldPrice Range
Local Market Snapshot for the Week of: January 9, 2015
Sales Trend Change From
Last Week

This Week16 Week Average This Week
16 Week Average This Week
16 Week Average
$0-249,999 0 0 0 0 0% 0% 0%
$250,0000-399,999 15 25 1 6 7% 22% -20%
$400,000-499,999 5 20 4 5 80% 28% 51%
$500,0000-599,999 8 22 1 5 13% 23% 13%
$600,000-699,999 11 11 0 3 0% 26% 0%
$700,0000-799,999 7 8 0 2 0% 25% -40%
$800,000-899,999 1 6 1 1 100% 21% 67%
$900,0000-999,999 1 3 0 0 0% 20% 0%
$1,000,000-1,249,999 3 5 1 1 33% 14% 33%
$1,250,0000-1,499,999 0 4 1 1 0% 24% -100%
$1,500,000-1,999,999 1 2 0 0 0% 11% 0%
$2,000,0000 and above 5 7 0 0 0% 1% 0%
©2011-2014 Windermere Real Estate/Mercer Island. For questions or comments, email [email protected].
WeeklyPropertyReport.com │ Residential and condominium data for Greater Seattle and the Eastside
North Seattle - Area 710
Active Listings Pending Sales % Listings SoldPrice Range
Local Market Snapshot for the Week of : January 9, 2015
Sales Trend Change From
Last Week

ABOUT | Windermere Mercer Island
In everything we do we put our clients first. We enable them to make sound real
estate decisions through professional representation, expert advice, and deep
neighborhood and community knowledge. Our clients enjoy a friendly, personalized
experience as we competently guide them through their real estate transaction to
achieve their hopes, dreams and goals.
Centrally located on Mercer Island, our team of talented Realtors® serves Seattle,
Mercer Island, and greater Eastside. Our neighborhood and community engagement
goes beyond being avid supporters of Island and regional organizations and events—
we are active neighbors and volunteers who enjoy making a difference in our world.
GREATER SEATTLE-EASTSIDE | Area Map
Data prepared and analyzed by Windermere Real Estate/Mercer Island from NWMLS provided data. For questions or comments, email Julie Barrows at [email protected]. Top cover photo courtesy of Walter Siegmund, http://commons.wikimedia.org ©2012-2014 Windermere Real Estate/Mercer Island