2014 TRUSTWAVE GLOBAL SECURITY REPORT...The 2014 Trustwave Global Security Report is back for...
123
2014 TRUSTWAVE GLOBAL SECURITY REPORT
Transcript of 2014 TRUSTWAVE GLOBAL SECURITY REPORT...The 2014 Trustwave Global Security Report is back for...
2014TRUSTWAVE GLOBALSECURITY REPORT
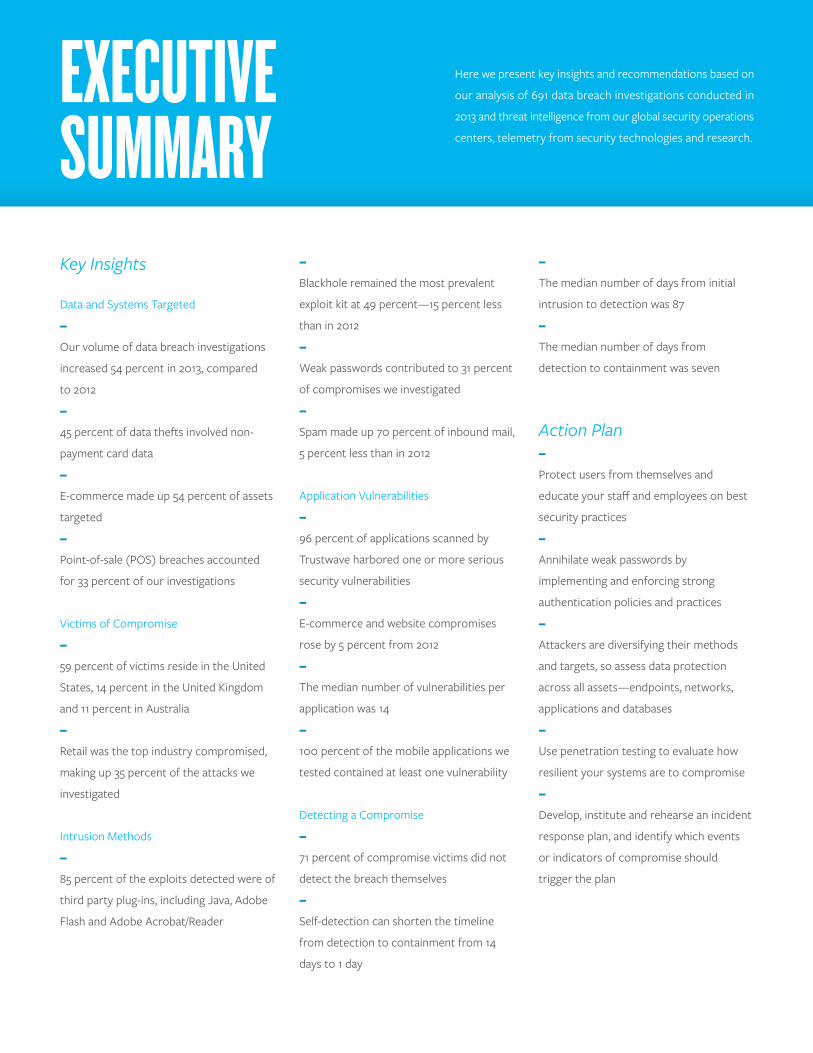
Here we present key insights and recommendations based on
our analysis of 691 data breach investigations conducted in
2013 and threat intelligence from our global security operations
centers, telemetry from security technologies and research.
ExECUTIVESUmmARYKey Insights
Data and Systems Targeted
–
Our volume of data breach investigations
increased 54 percent in 2013, compared
to 2012
–
45 percent of data thefts involved non-
payment card data
–
E-commerce made up 54 percent of assets
targeted
–
Point-of-sale (POS) breaches accounted
for 33 percent of our investigations
Victims of Compromise
–
59 percent of victims reside in the United
States, 14 percent in the United Kingdom
and 11 percent in Australia
–
Retail was the top industry compromised,
making up 35 percent of the attacks we
investigated
Intrusion Methods
–
85 percent of the exploits detected were of
third party plug-ins, including Java, Adobe
Flash and Adobe Acrobat/Reader
–
Blackhole remained the most prevalent
exploit kit at 49 percent—15 percent less
than in 2012
–
Weak passwords contributed to 31 percent
of compromises we investigated
–
Spam made up 70 percent of inbound mail,
5 percent less than in 2012
Application Vulnerabilities
–
96 percent of applications scanned by
Trustwave harbored one or more serious
security vulnerabilities
–
E-commerce and website compromises
rose by 5 percent from 2012
–
The median number of vulnerabilities per
application was 14
–
100 percent of the mobile applications we
tested contained at least one vulnerability
Detecting a Compromise
–
71 percent of compromise victims did not
detect the breach themselves
–
Self-detection can shorten the timeline
from detection to containment from 14
days to 1 day
–
The median number of days from initial
intrusion to detection was 87
–
The median number of days from
detection to containment was seven
Action Plan–
Protect users from themselves and
educate your staff and employees on best
security practices
–
Annihilate weak passwords by
implementing and enforcing strong
authentication policies and practices
–
Attackers are diversifying their methods
and targets, so assess data protection
across all assets—endpoints, networks,
applications and databases
–
Use penetration testing to evaluate how
resilient your systems are to compromise
–
Develop, institute and rehearse an incident
response plan, and identify which events
or indicators of compromise should
trigger the plan
CONTENTS
5
6
16
21
22
24
27
28
29
31
33
34
36
37
39
43
49
54
86
92
94
99
100
105
111
118
InTROdUCTIOn—
Key Insights
Action Plan
1. dATA COmPROmISE—
Locations
Industries
Assets Targeted
Types of Data
Detection
Duration
Method of Intrusion
Indicators of Compromise
2. ThREAT InTELLIGEnCE—
Attacker Motivations
Narrative of a Malicious Campaign
Web Threats
Top 10 Exploit Kits
Malware
Network Defense Failures
Application Defense Failures
Mobile Applications
3. REGIOnAL PERSPECTIVES—
North America
Europe. Middle East & Africa (EMEA)
Latin America & The Caribbean
Asia Pacific (APAC)

iNTrOduCTiON–
kEy iNSighTS& aCTiON plaN
2 0 1 4 T R U S T W A V E G L O B A L S E C U R I T Y R E P O R T
—
The 2014 Trustwave Global Security Report is back for
another year, and we couldn’t be prouder of this year’s
edition. We again lean on hard evidence gathered from
hundreds of data breach investigations conducted last
year – 691 to be exact, spread across industries and the
world – as well as threat intelligence gathered from our
products and security operations centers. Using that
evidence, we zero in on the critical components of a
compromise that matter to you, including attackers,
entry points, vulnerabilities and exploits, indicators of
compromise and targets.
Each reader will consume the data contained in this
report in different ways. Our hope is that you use
it to help accomplish security goals that will allow
your organization to stay better protected and
grow. Here is how we laid out this year’s report: This
introduction and summary provides an overview of our
key findings and then suggests a five-step action plan
for your organization. Section 1 focuses on the trends
surrounding victims, attackers and their locations.
Section 2 – the biggie – deconstructs and deciphers the
massive amount of threat intelligence we uncovered
in 2013. Section 3 details how cybercrime is uniquely
impacting different regions of the world.
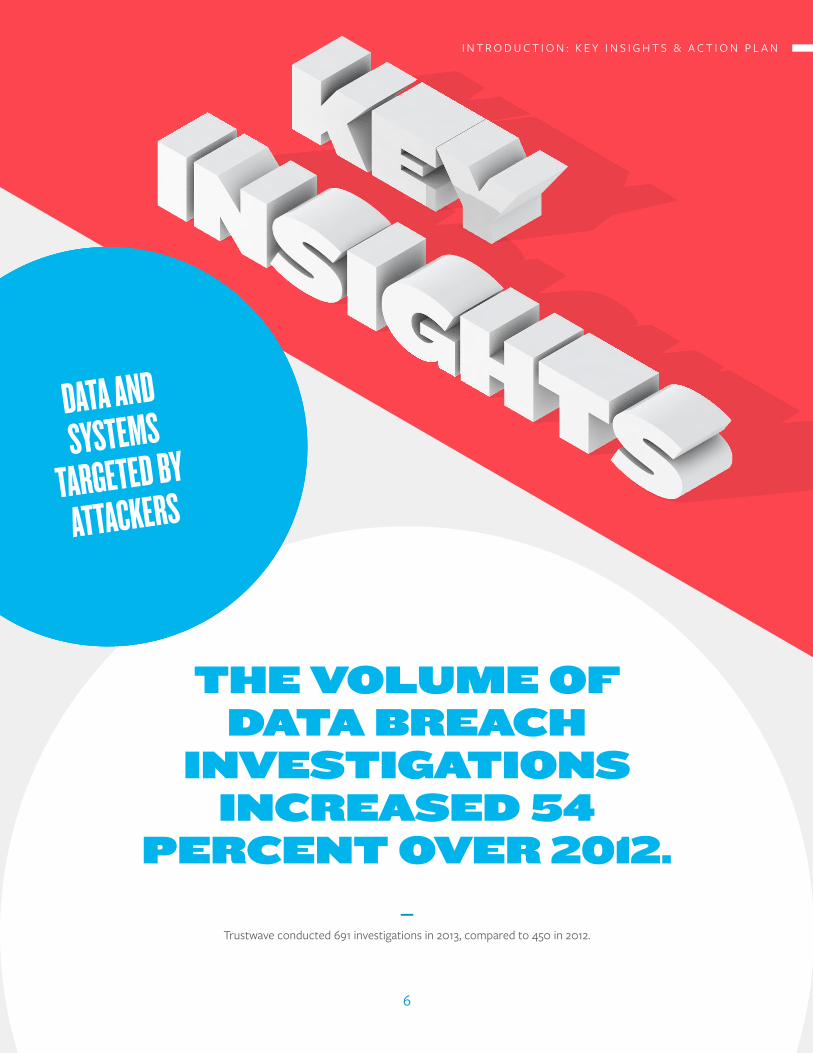
dATA And SYSTEmS
TARGETEd BY
ATTACkERS
ThE vOlumE Of daTa brEaCh
iNvESTigaTiONS iNCrEaSEd 54
pErCENT OvEr 2012. —
Trustwave conducted 691 investigations in 2013, compared to 450 in 2012.
I N T R O D U C T I O N : K E Y I N S I G H T S & A C T I O N P L A N
6
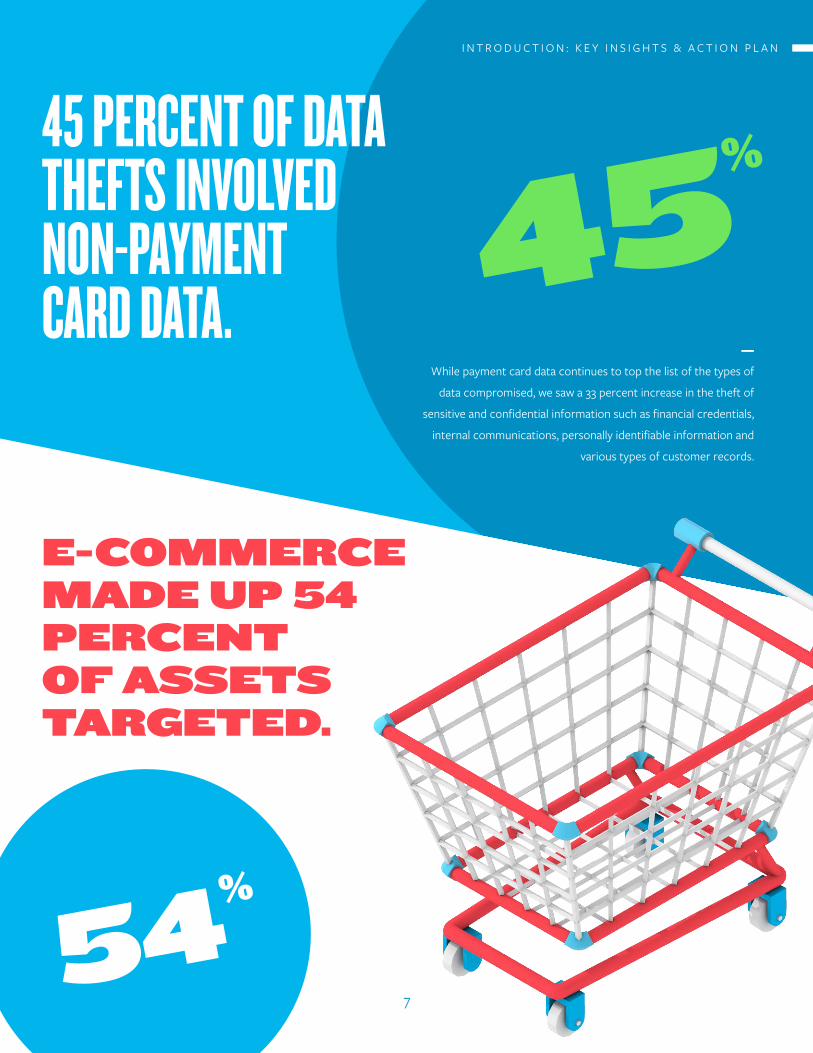
E-COmmErCE madE up 54 pErCENT Of aSSETS TargETEd.
54%
45%45 PERCEnT Of dATA
ThEfTS InVOLVEd nOn-PAYmEnT CARd dATA.
—
While payment card data continues to top the list of the types of
data compromised, we saw a 33 percent increase in the theft of
sensitive and confidential information such as financial credentials,
internal communications, personally identifiable information and
various types of customer records.
I N T R O D U C T I O N : K E Y I N S I G H T S & A C T I O N P L A N
7
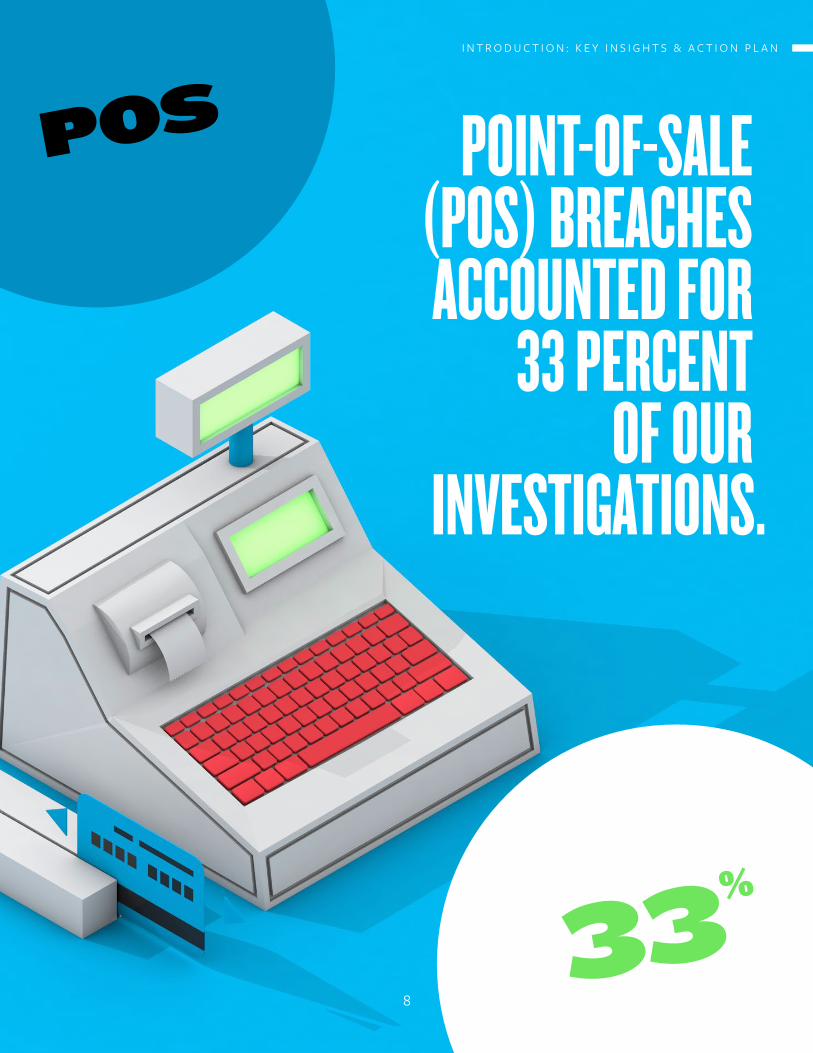
POInT-Of-SALE (POS) BREAChES ACCOUnTEd fOR
33 PERCEnT Of OUR
InVESTIGATIOnS.
33%
posI N T R O D U C T I O N : K E Y I N S I G H T S & A C T I O N P L A N
8
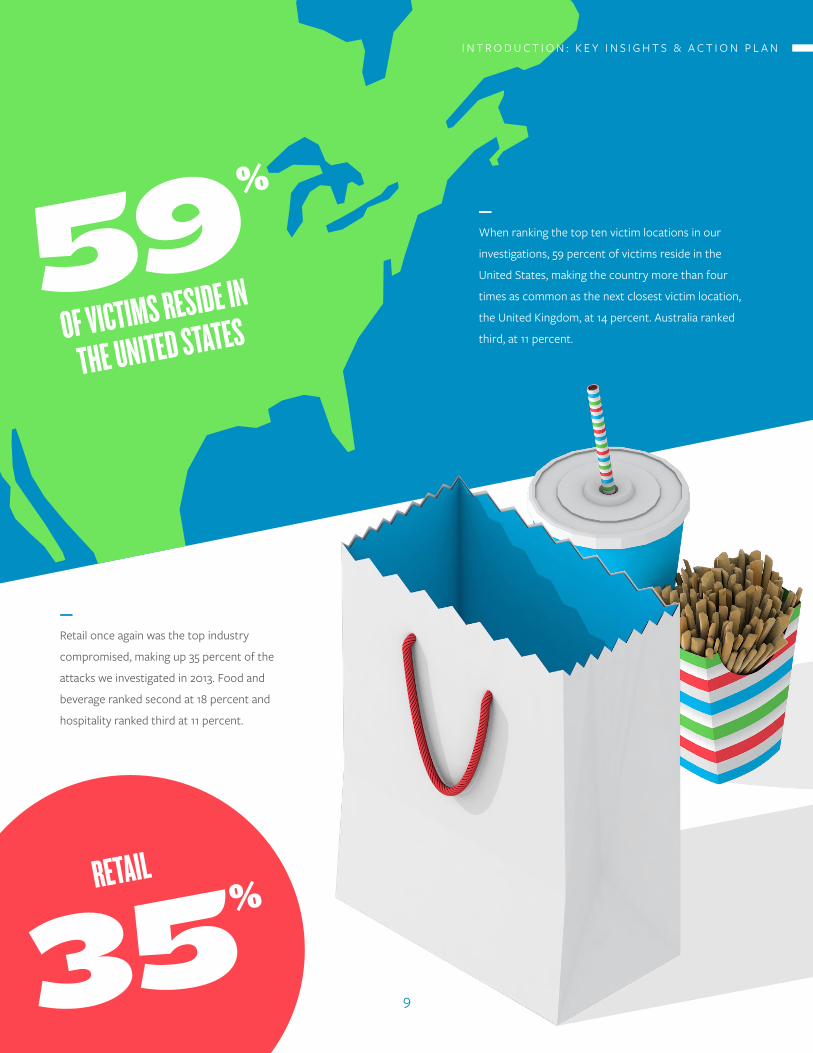
59%
Of VICTImS RESIdE In
ThE UnITEd STATES
—
When ranking the top ten victim locations in our
investigations, 59 percent of victims reside in the
United States, making the country more than four
times as common as the next closest victim location,
the United Kingdom, at 14 percent. Australia ranked
third, at 11 percent.
—
Retail once again was the top industry
compromised, making up 35 percent of the
attacks we investigated in 2013. Food and
beverage ranked second at 18 percent and
hospitality ranked third at 11 percent.
RETAIL
35%
I N T R O D U C T I O N : K E Y I N S I G H T S & A C T I O N P L A N
9
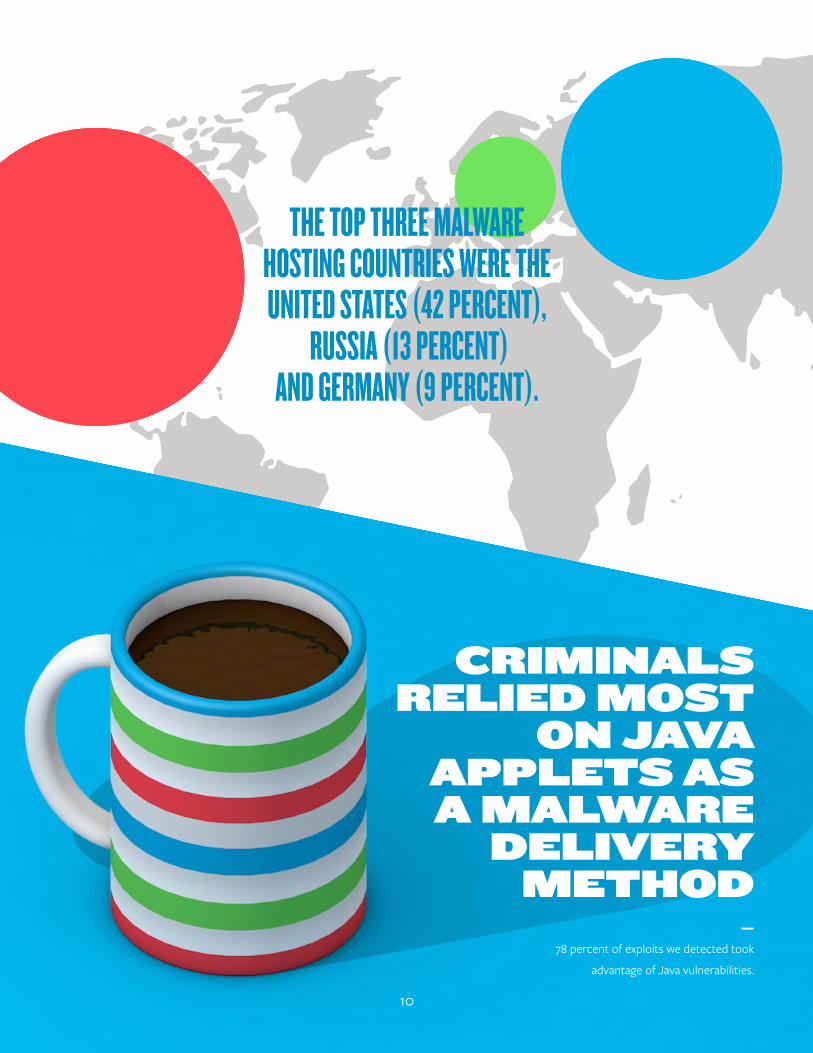
ThE TOP ThREE mALWARE hOSTInG COUnTRIES WERE ThE UnITEd STATES (42 PERCEnT),
RUSSIA (13 PERCEnT) And GERmAnY (9 PERCEnT).
CrimiNalS rEliEd mOST
ON Java applETS aS a malwarE
dElivEry mEThOd
—
78 percent of exploits we detected took
advantage of Java vulnerabilities.
I N T R O D U C T I O N : K E Y I N S I G H T S & A C T I O N P L A N
10
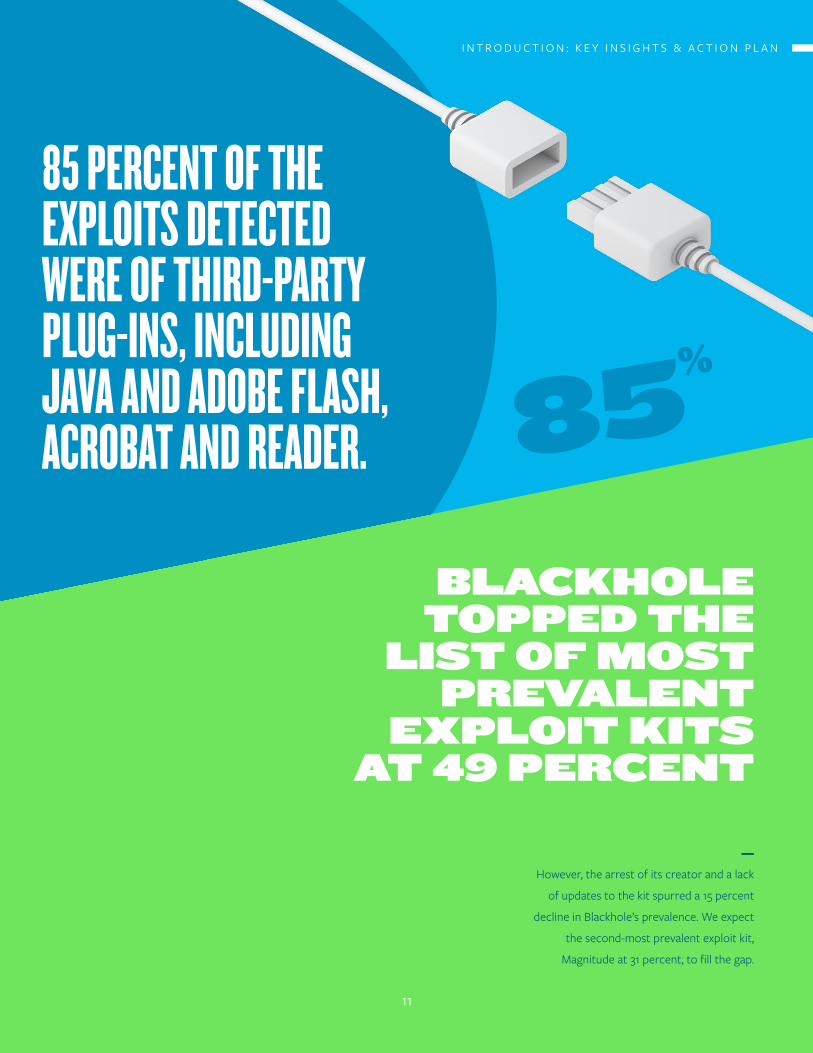
85 PERCEnT Of ThEExPLOITS dETECTEdWERE Of ThIRd-PARTY PLUG-InS, InCLUdInG JAVA And AdOBE fLASh, ACROBAT And REAdER. 85
%
blaCkhOlE TOppEd ThE
liST Of mOST prEvalENT
ExplOiT kiTS aT 49 pErCENT
—
However, the arrest of its creator and a lack
of updates to the kit spurred a 15 percent
decline in Blackhole’s prevalence. We expect
the second-most prevalent exploit kit,
Magnitude at 31 percent, to fill the gap.
I N T R O D U C T I O N : K E Y I N S I G H T S & A C T I O N P L A N
11
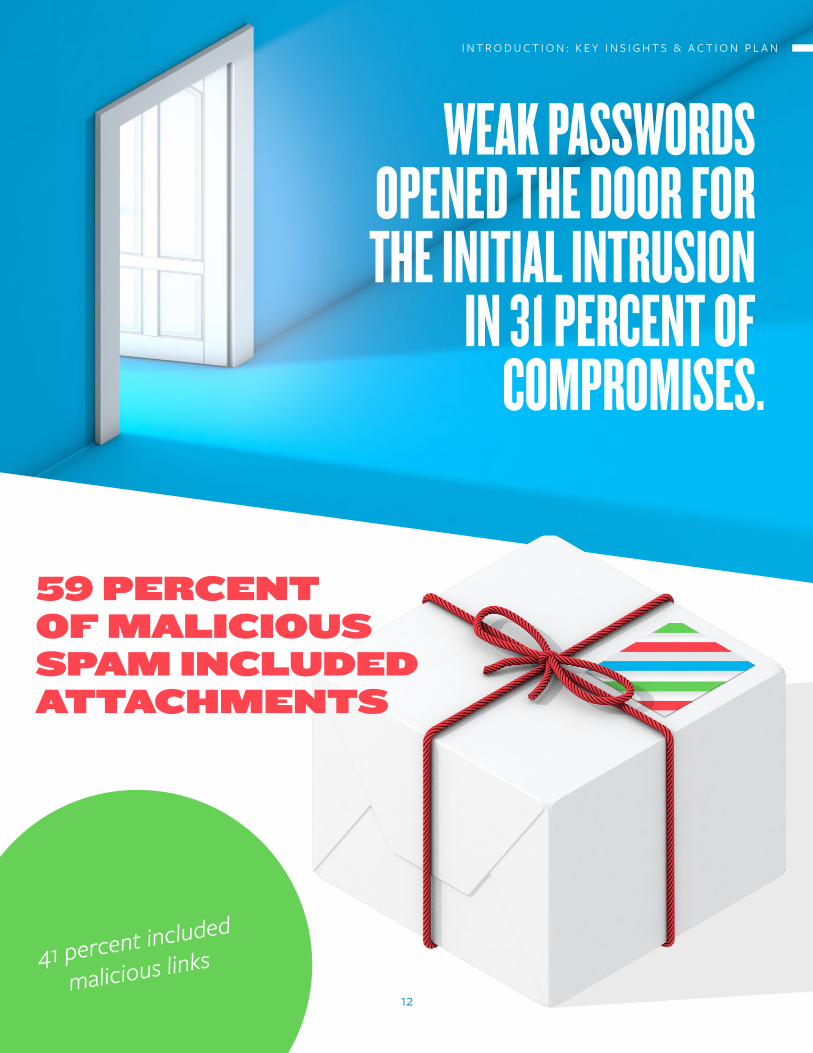
WEAk PASSWORdS OPEnEd ThE dOOR fOR ThE InITIAL InTRUSIOn
In 31 PERCEnT Of COmPROmISES.
41 percent included
malicious links
59 pErCENT Of maliCiOuS Spam iNCludEd aTTaChmENTS
I N T R O D U C T I O N : K E Y I N S I G H T S & A C T I O N P L A N
12
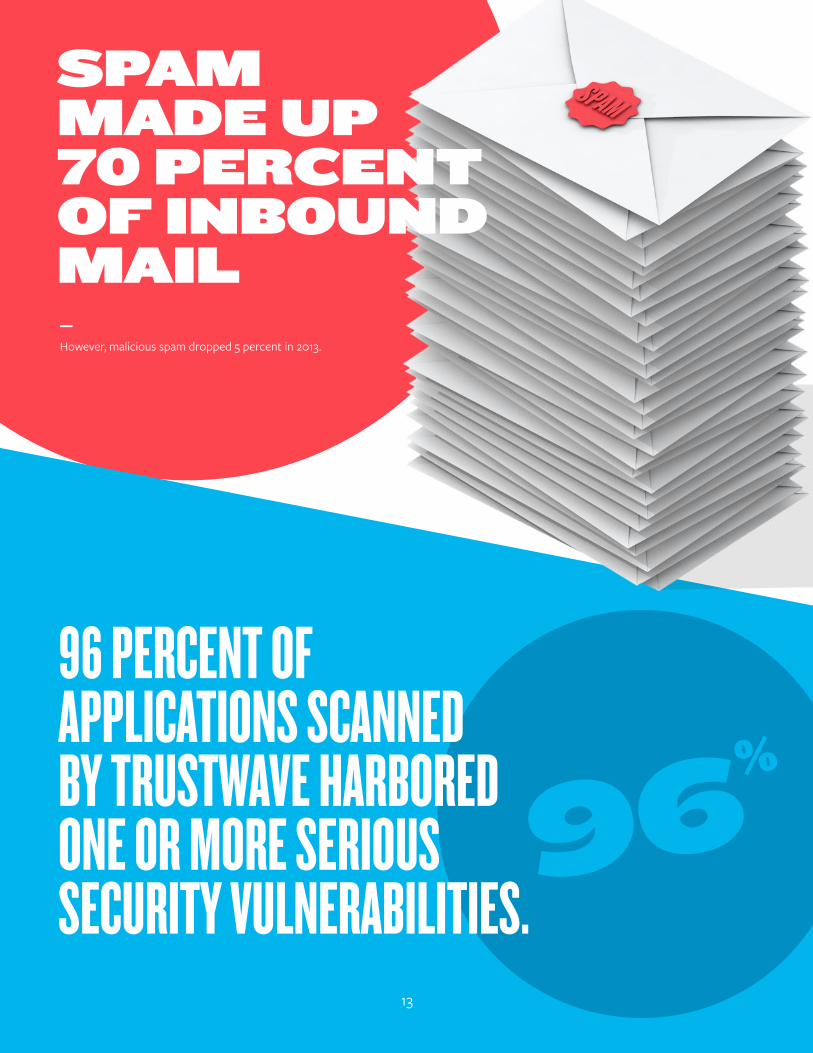
96%
96 PERCEnT Of APPLICATIOnS SCAnnEd BY TRUSTWAVE hARBOREd OnE OR mORE SERIOUS SECURITY VULnERABILITIES.
Spam madE up 70 pErCENT Of iNbOuNd mail—
However, malicious spam dropped 5 percent in 2013.
13
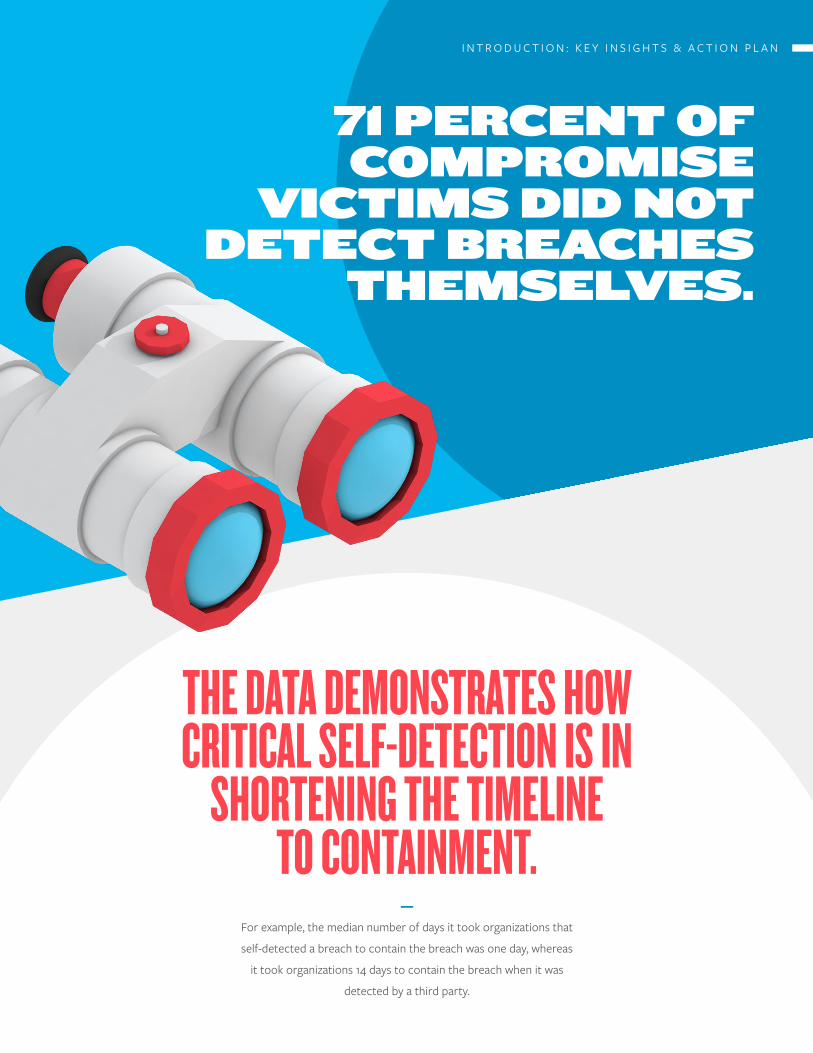
71 pErCENT Of COmprOmiSE
viCTimS did NOT dETECT brEaChES
ThEmSElvES.
ThE dATA dEmOnSTRATES hOW CRITICAL SELf-dETECTIOn IS In
ShORTEnInG ThE TImELInE TO COnTAInmEnT.
—
For example, the median number of days it took organizations that
self-detected a breach to contain the breach was one day, whereas
it took organizations 14 days to contain the breach when it was
detected by a third party.
I N T R O D U C T I O N : K E Y I N S I G H T S & A C T I O N P L A N
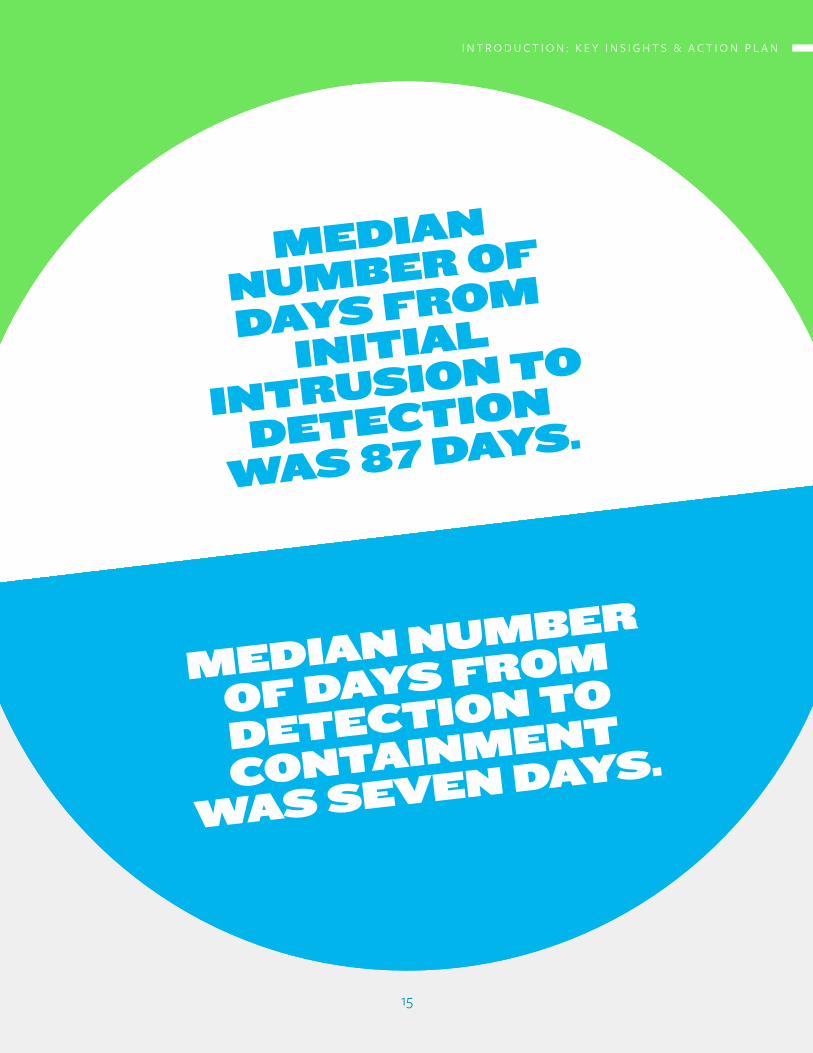
mEdiaN
NumbEr Of
dayS frOm
iNiTial
iNTruSiON TO
dETECTiON
waS 87 dayS.
mEdiaN NumbEr
Of dayS frOm
dETECTiON TO
CONTaiNmENT
waS SEvEN dayS.
I N T R O D U C T I O N : K E Y I N S I G H T S & A C T I O N P L A N
15
1
—
Attackers continue to use malicious links and attachments
as a method of entry into a business. Protect users from
themselves: Educate employees on best security practices,
including strong password creation and awareness of
social engineering techniques like phishing. Invest in
gateway security technologies as a fallback to automate
protection from threats such as zero-day vulnerabilities,
targeted malware and malicious email.
PROTECT USERS
fROm ThEmSELVES
I N T R O D U C T I O N : K E Y I N S I G H T S & A C T I O N P L A N
2
—
Weak or default passwords contributed to one third of
compromises investigated by Trustwave. Annihilate weak
passwords: Implement and enforce strong authentication policies.
Thirty percent of the time, an attacker gains access because of
a weak password. Strong passwords—consisting of a minimum
of seven characters and a combination of upper and lower case
letters, symbols and numbers—play a vital role in helping prevent a
breach. Even better are passphrases that include eight to 10 words
that are not published (such as well-known quotations). Businesses
should also deploy two-factor authentication for employees who
access the network. This forces users to verify their identity with
information other than simply their username and password, like a
unique code sent to a user’s mobile phone.
AnnIhILATE WEAk
PASSWORdS
I N T R O D U C T I O N : K E Y I N S I G H T S & A C T I O N P L A N
17

3
—
We saw attackers diversifying the types of data they target. It’s
not just about payment card data anymore. Protect the rest:
Secure all of your data, and don’t lull yourself into a false sense
of security just because you think your payment card data is
protected. Assess your entire set of assets—from endpoint
to network to application to database. Any vulnerability in any
asset could lead to the exposure of data. Combine ongoing
testing and scanning of these assets to identify and fix flaws
before an attacker can take advantage of them.
PROTECT
ThE REST
I N T R O D U C T I O N : K E Y I N S I G H T S & A C T I O N P L A N
18

4
—
Just about every single data point in this report can help
you understand the real threats against your organization.
Model the threat and test your systems’ resilience to it
with penetration testing. Pitting a security expert against
your network hosts, applications and databases applies a
real-world attacker’s perspective to your systems (a threat
model). A penetration test transcends merely identifying
vulnerabilities by demonstrating how an attacker can take
advantage of them and expose data.
mOdEL
ThE ThREAT
I N T R O D U C T I O N : K E Y I N S I G H T S & A C T I O N P L A N
19

5
—
Victims that identify a breach on their own detect it
sooner and reduce clean-up time by two weeks. Plan your
response: Develop, institute and rehearse an incident
response plan. Identify what sorts of events or indicators of
compromise will trigger your incident response plan. A plan
will help make your organization aware of a compromise
sooner, limit its repercussions and shorten its duration.
PLAnYOUR
RESPOnSE
I N T R O D U C T I O N : K E Y I N S I G H T S & A C T I O N P L A N
20
SECTiON 1–
daTa COmprOmiSE
2 0 1 4 T R U S T W A V E G L O B A L S E C U R I T Y R E P O R T
LOCATIOnS:VICTImS & ATTACkERS
—
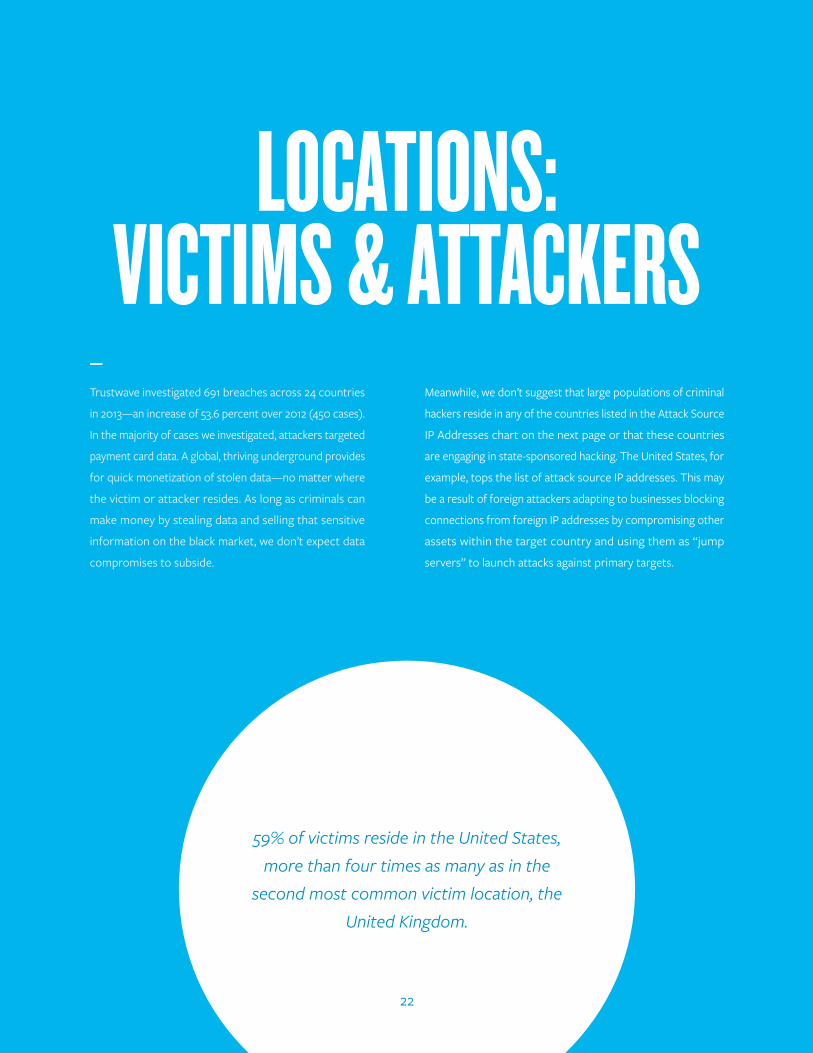
Trustwave investigated 691 breaches across 24 countries
in 2013—an increase of 53.6 percent over 2012 (450 cases).
In the majority of cases we investigated, attackers targeted
payment card data. A global, thriving underground provides
for quick monetization of stolen data —no matter where
the victim or attacker resides. As long as criminals can
make money by stealing data and selling that sensitive
information on the black market, we don’t expect data
compromises to subside.
Meanwhile, we don’t suggest that large populations of criminal
hackers reside in any of the countries listed in the Attack Source
IP Addresses chart on the next page or that these countries
are engaging in state-sponsored hacking. The United States, for
example, tops the list of attack source IP addresses. This may
be a result of foreign attackers adapting to businesses blocking
connections from foreign IP addresses by compromising other
assets within the target country and using them as “jump
servers” to launch attacks against primary targets.
59% of victims reside in the United States, more than four times as many as in the
second most common victim location, the United Kingdom.
22
S E C T I O N 1 : D A T A C O M P R O M I S E
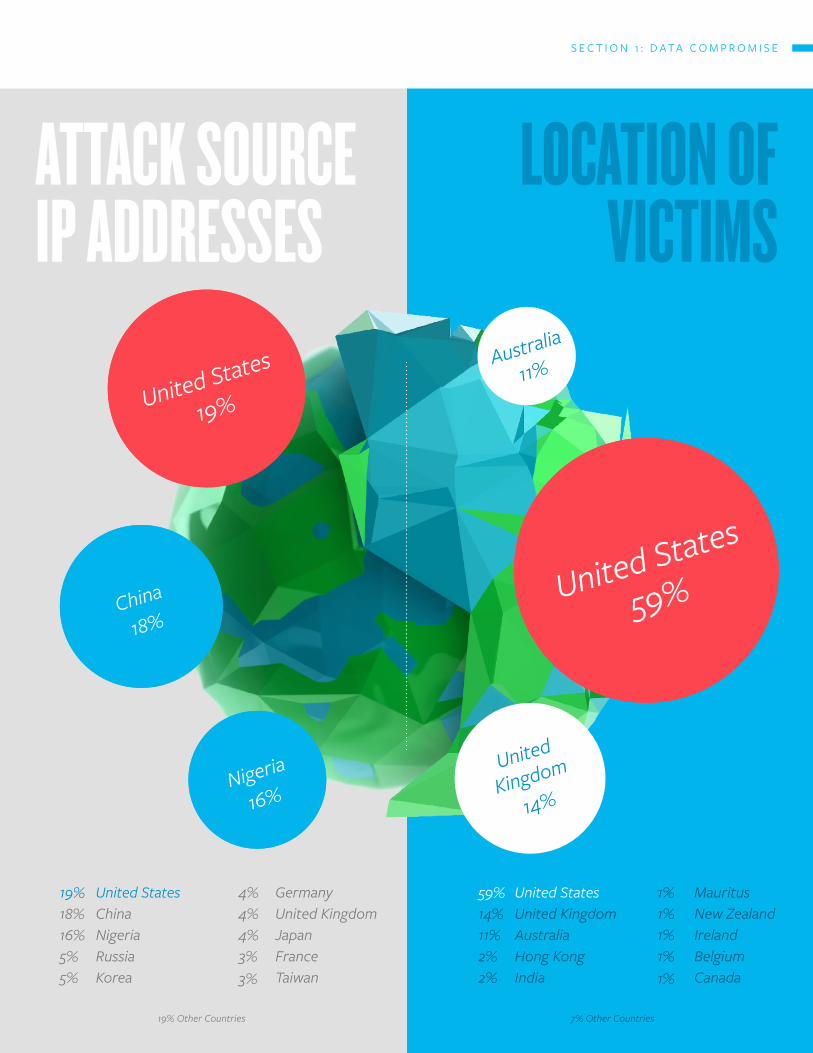
ATTACk SOURCEIP AddRESSES
LOCATIOn Of VICTImS
United States
19%
United States
59%China
18%
United
Kingdom
14%
Australia
11%
Nigeria
16%
19%18%16%5%5%
59%14%11%2%2%
United StatesChinaNigeriaRussiaKorea
United StatesUnited KingdomAustraliaHong KongIndia
GermanyUnited KingdomJapanFranceTaiwan
MauritusNew ZealandIrelandBelgiumCanada
4%4%4%3%3%
1%1%1%1%1%
19% Other Countries 7% Other Countries
S E C T I O N 1 : D A T A C O M P R O M I S E
35%
18%
11%
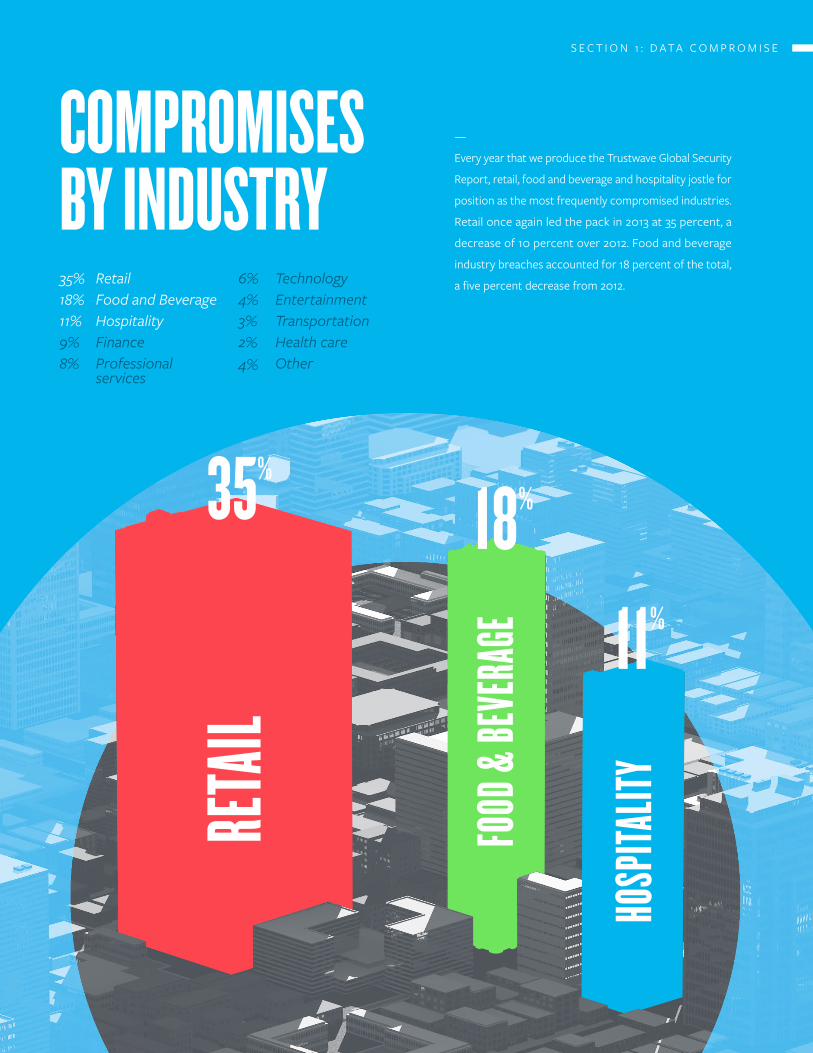
COmPROmISESBY IndUSTRY
RETA
IL
fOOd
& BE
VERA
GE
hOSP
ITALIT
Y
—
Every year that we produce the Trustwave Global Security
Report, retail, food and beverage and hospitality jostle for
position as the most frequently compromised industries.
Retail once again led the pack in 2013 at 35 percent, a
decrease of 10 percent over 2012. Food and beverage
industry breaches accounted for 18 percent of the total,
a five percent decrease from 2012.35%18%11%9%8%
RetailFood and BeverageHospitalityFinanceProfessionalservices
TechnologyEntertainmentTransportationHealth careOther
6%4%3%2%4%
S E C T I O N 1 : D A T A C O M P R O M I S E
Many multi-site breaches were oriented around franchise
business models. Franchisees are often required to deploy
information technology defined by the franchisor for
efficiency purposes and to simplify management of those
environments.
While a well-designed technology template can help to
improve security, a poor design can result in a vulnerability
present across potentially thousands of locations. If an
attacker discovers and takes advantage of a flaw at one
franchise, they can replicate the exploit at other locations.
25
S E C T I O N 1 : D A T A C O M P R O M I S E
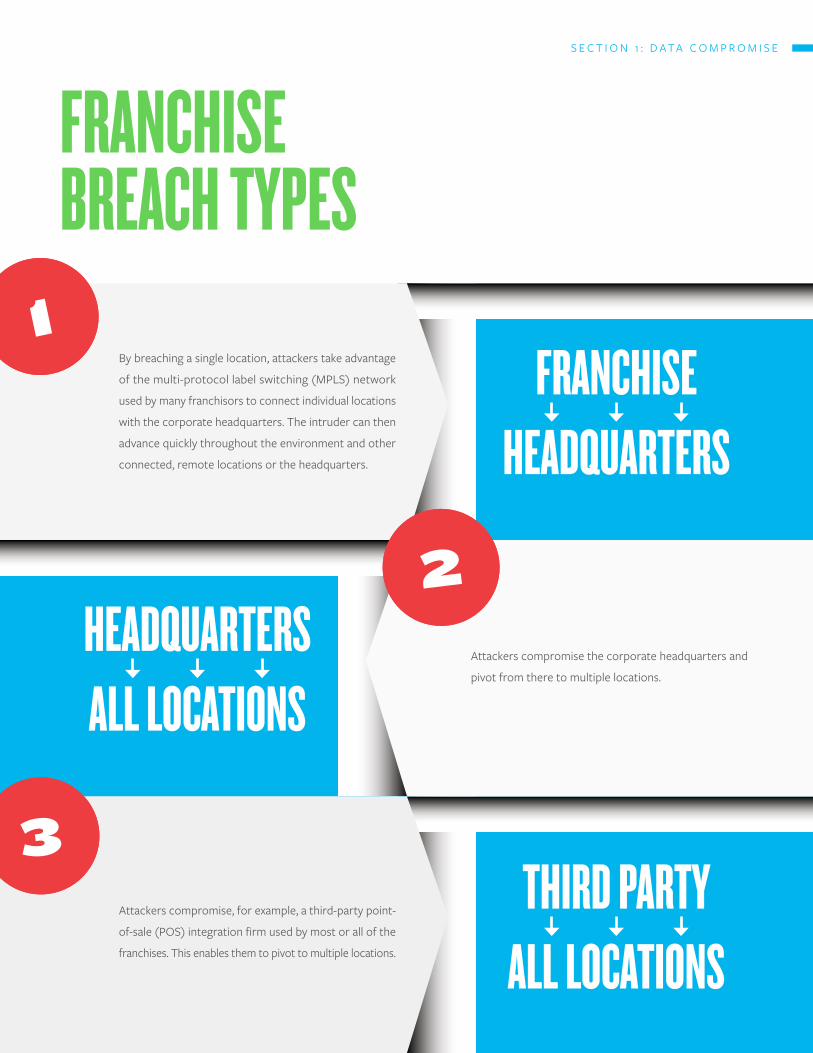
fRAnChISE BREACh TYPES
1
3
2
fRAnChISEhEAdqUARTERS
hEAdqUARTERSALL LOCATIOnS
ThIRd PARTYALL LOCATIOnS
By breaching a single location, attackers take advantage
of the multi-protocol label switching (MPLS) network
used by many franchisors to connect individual locations
with the corporate headquarters. The intruder can then
advance quickly throughout the environment and other
connected, remote locations or the headquarters.
Attackers compromise the corporate headquarters and
pivot from there to multiple locations.
Attackers compromise, for example, a third-party point-
of-sale (POS) integration firm used by most or all of the
franchises. This enables them to pivot to multiple locations.
S E C T I O N 1 : D A T A C O M P R O M I S E
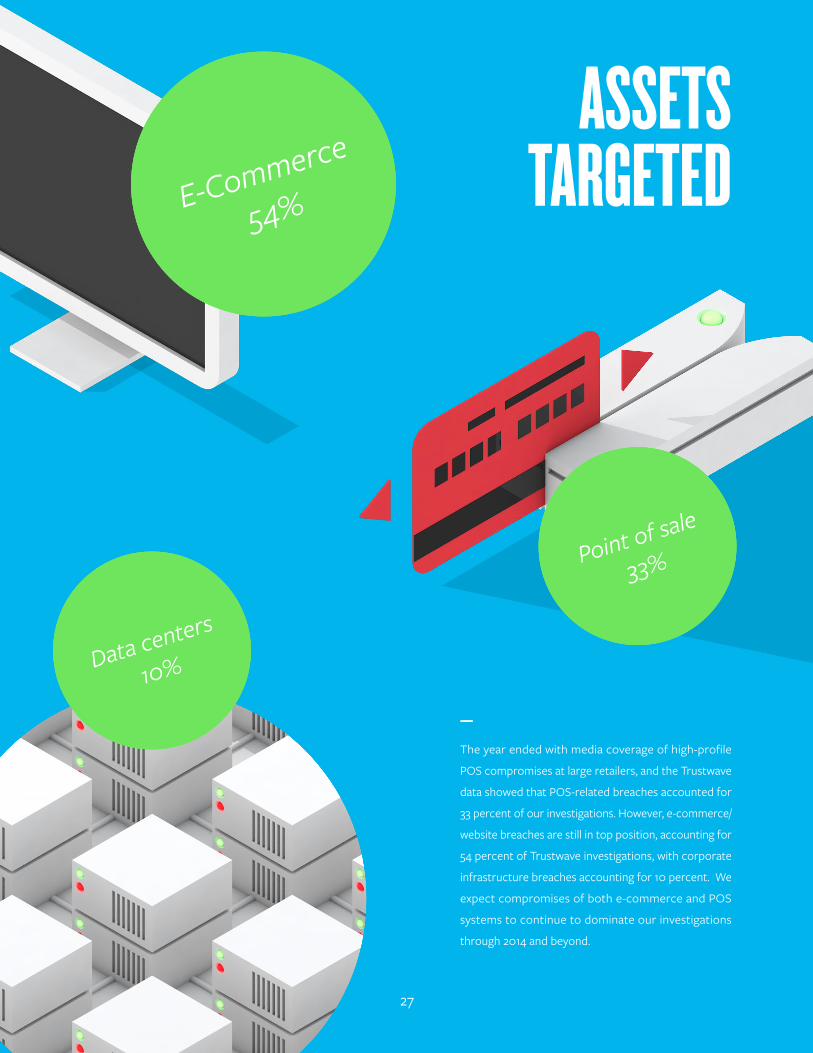
ASSETS TARGETEdE-Commerce
54%
Point of sale
33%
Data centers
10%
—
The year ended with media coverage of high-profile
POS compromises at large retailers, and the Trustwave
data showed that POS-related breaches accounted for
33 percent of our investigations. However, e-commerce/
website breaches are still in top position, accounting for
54 percent of Trustwave investigations, with corporate
infrastructure breaches accounting for 10 percent. We
expect compromises of both e-commerce and POS
systems to continue to dominate our investigations
through 2014 and beyond.
27
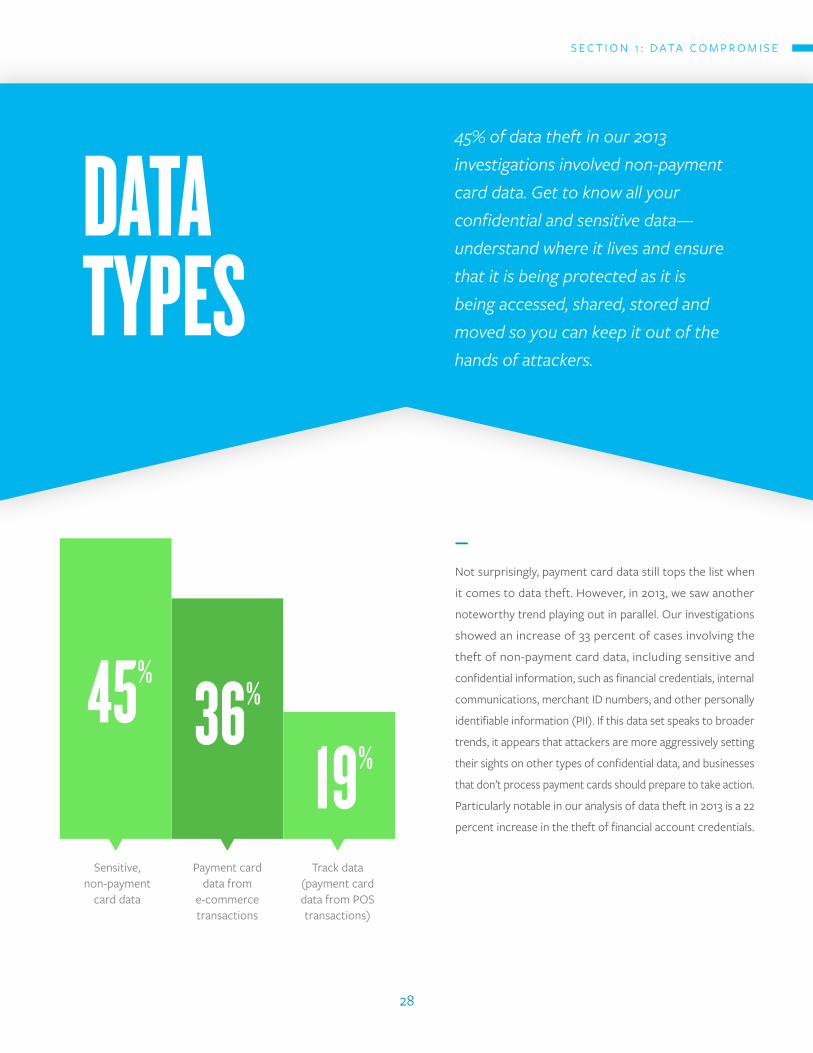
dATATYPES
45% of data theft in our 2013 investigations involved non-payment card data. Get to know all your confidential and sensitive data—understand where it lives and ensure that it is being protected as it is being accessed, shared, stored and moved so you can keep it out of the hands of attackers.
—
Not surprisingly, payment card data still tops the list when
it comes to data theft. However, in 2013, we saw another
noteworthy trend playing out in parallel. Our investigations
showed an increase of 33 percent of cases involving the
theft of non-payment card data, including sensitive and
confidential information, such as financial credentials, internal
communications, merchant ID numbers, and other personally
identifiable information (PII). If this data set speaks to broader
trends, it appears that attackers are more aggressively setting
their sights on other types of confidential data, and businesses
that don’t process payment cards should prepare to take action.
Particularly notable in our analysis of data theft in 2013 is a 22
percent increase in the theft of financial account credentials.
45%
36%
19%
Track data (payment card data from POS transactions)
Payment card data from
e-commerce transactions
Sensitive, non-payment
card data
28
S E C T I O N 1 : D A T A C O M P R O M I S E
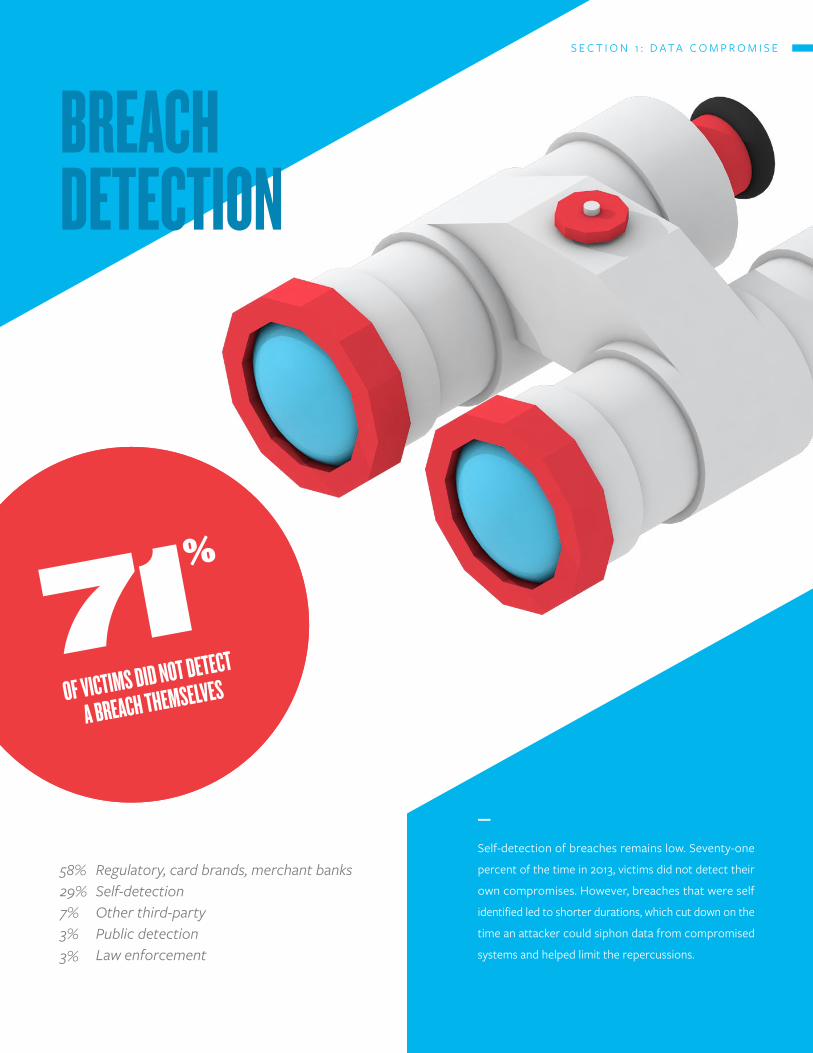
BREAChdETECTIOn
71%
Of VICTImS dId nOT dETECT
A BREACh ThEmSELVES
—
Self-detection of breaches remains low. Seventy-one
percent of the time in 2013, victims did not detect their
own compromises. However, breaches that were self
identified led to shorter durations, which cut down on the
time an attacker could siphon data from compromised
systems and helped limit the repercussions.
Regulatory, card brands, merchant banksSelf-detectionOther third-partyPublic detectionLaw enforcement
58%29%7%3%3%
S E C T I O N 1 : D A T A C O M P R O M I S E
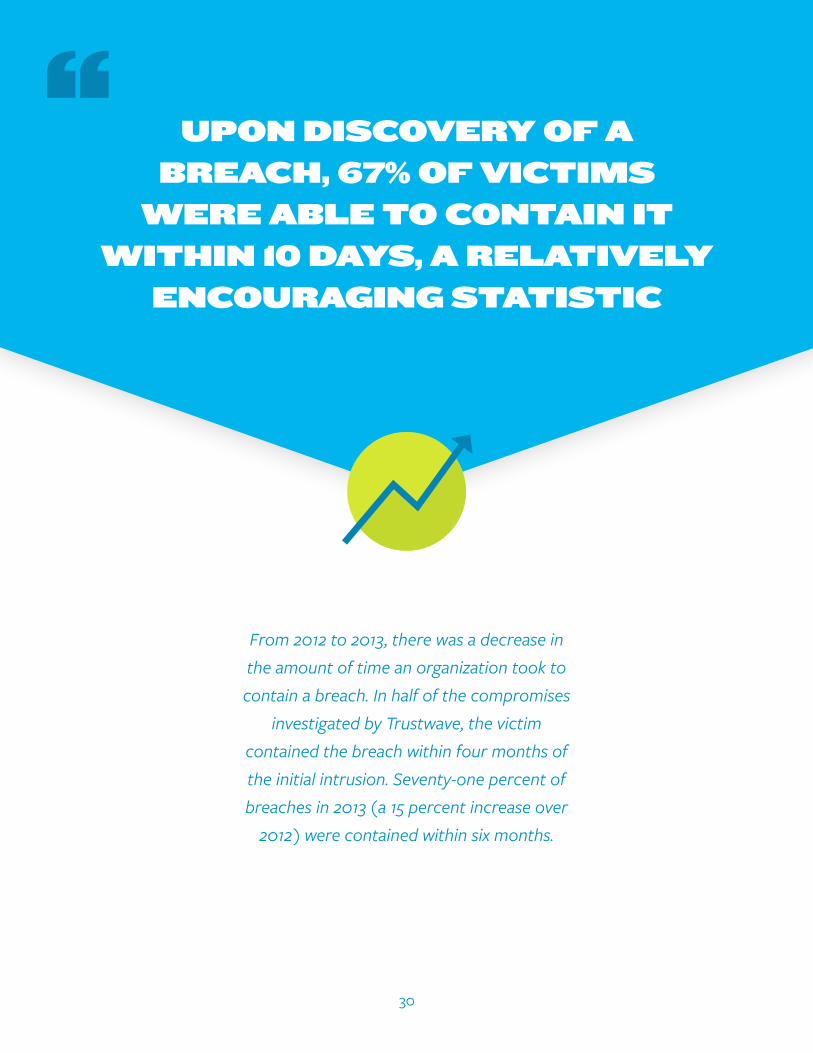
upON diSCOvEry Of a brEaCh, 67% Of viCTimS
wErE ablE TO CONTaiN iT wiThiN 10 dayS, a rElaTivEly
ENCOuragiNg STaTiSTiC
“
From 2012 to 2013, there was a decrease in the amount of time an organization took to contain a breach. In half of the compromises
investigated by Trustwave, the victim contained the breach within four months of the initial intrusion. Seventy-one percent of breaches in 2013 (a 15 percent increase over
2012) were contained within six months.
30
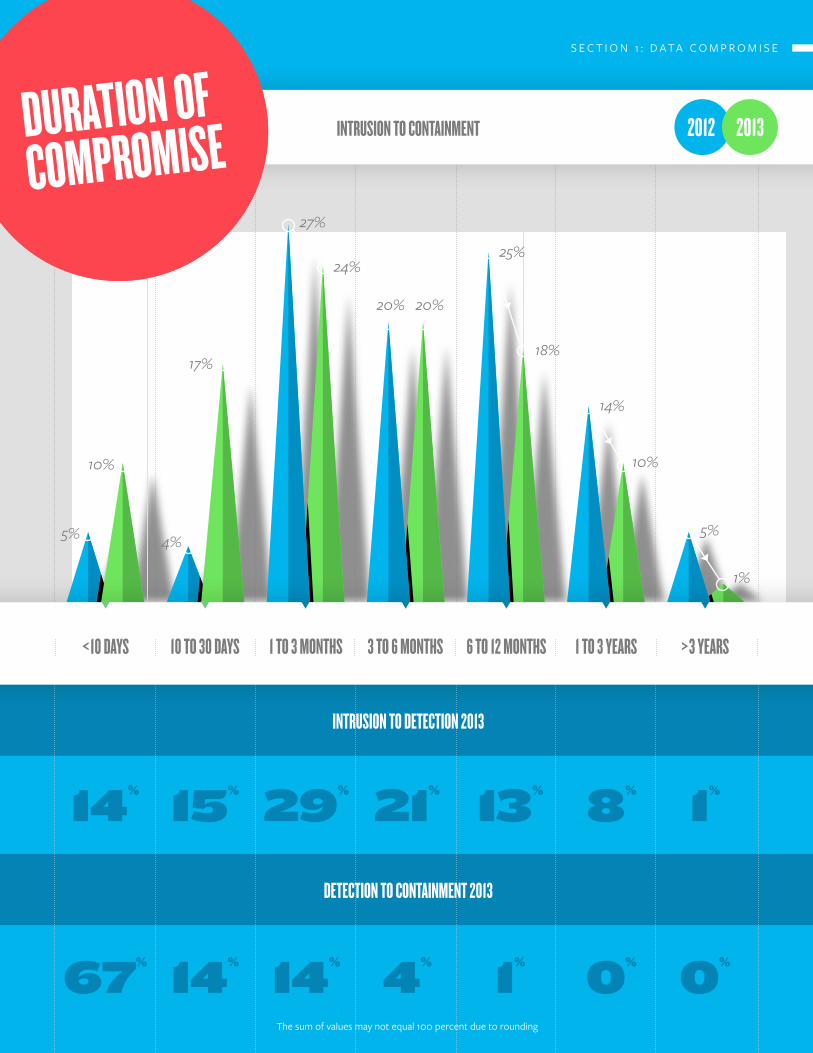
5% 4%
17%
27%
24%
20% 20%
25%
14%
10%
5%
1%
18%
10%
2012
<10 dAYS
14% 15% 29% 21% 13% 8% 1%
67% 14% 14% 4% 1% 0% 0%
InTRUSIOn TO COnTAInmEnT
InTRUSIOn TO dETECTIOn 2013
dETECTIOn TO COnTAInmEnT 2013
10 TO 30 dAYS 1 TO 3 mOnThS 3 TO 6 mOnThS 6 TO 12 mOnThS 1 TO 3 YEARS >3 YEARS
2013dURATIOn Of COmPROmISE
The sum of values may not equal 100 percent due to rounding
S E C T I O N 1 : D A T A C O M P R O M I S E
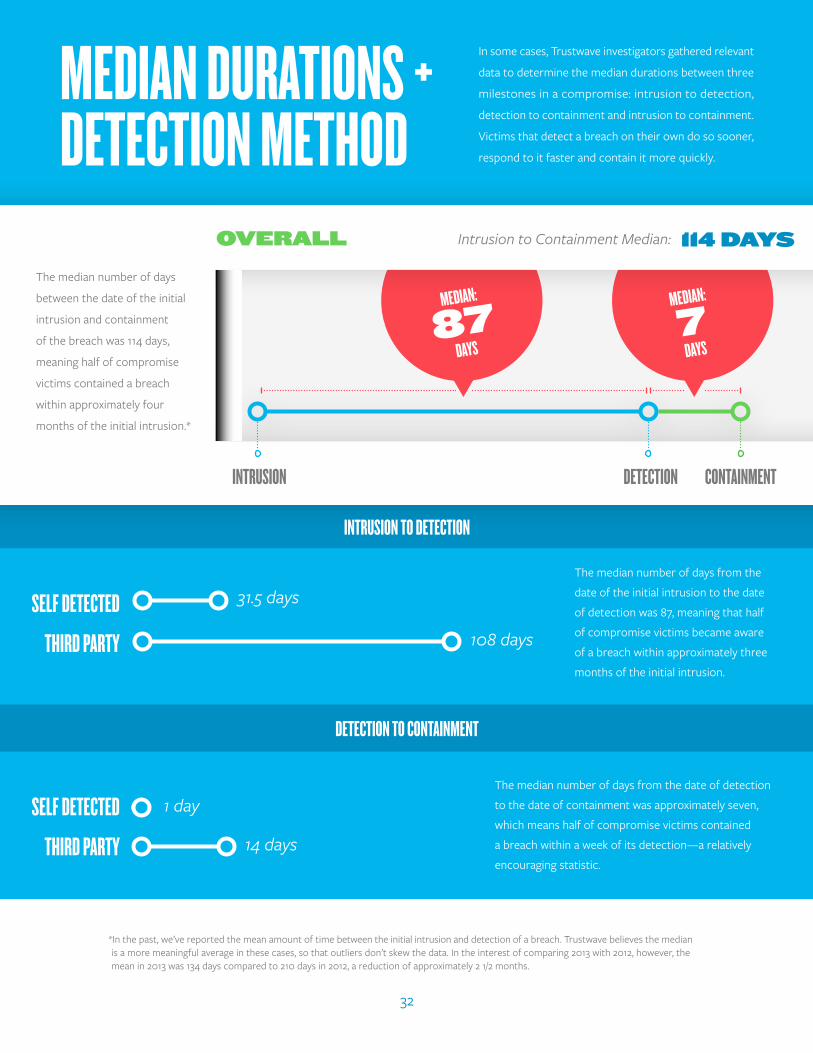
In some cases, Trustwave investigators gathered relevant
data to determine the median durations between three
milestones in a compromise: intrusion to detection,
detection to containment and intrusion to containment.
Victims that detect a breach on their own do so sooner,
respond to it faster and contain it more quickly.
mEdIAn dURATIOnS + dETECTIOn mEThOd
OvErall 114 dayS
mEdIAn:
87dAYS
mEdIAn:
7dAYS
Intrusion to Containment Median:
31.5 days
1 day
14 days
108 days
InTRUSIOn dETECTIOn COnTAInmEnT
The median number of days
between the date of the initial
intrusion and containment
of the breach was 114 days,
meaning half of compromise
victims contained a breach
within approximately four
months of the initial intrusion.*
The median number of days from the
date of the initial intrusion to the date
of detection was 87, meaning that half
of compromise victims became aware
of a breach within approximately three
months of the initial intrusion.
The median number of days from the date of detection
to the date of containment was approximately seven,
which means half of compromise victims contained
a breach within a week of its detection—a relatively
encouraging statistic.
*In the past, we’ve reported the mean amount of time between the initial intrusion and detection of a breach. Trustwave believes the median is a more meaningful average in these cases, so that outliers don’t skew the data. In the interest of comparing 2013 with 2012, however, the mean in 2013 was 134 days compared to 210 days in 2012, a reduction of approximately 2 1/2 months.
InTRUSIOn TO dETECTIOn
dETECTIOn TO COnTAInmEnT
SELf dETECTEd
ThIRd PARTY
SELf dETECTEd
ThIRd PARTY
32
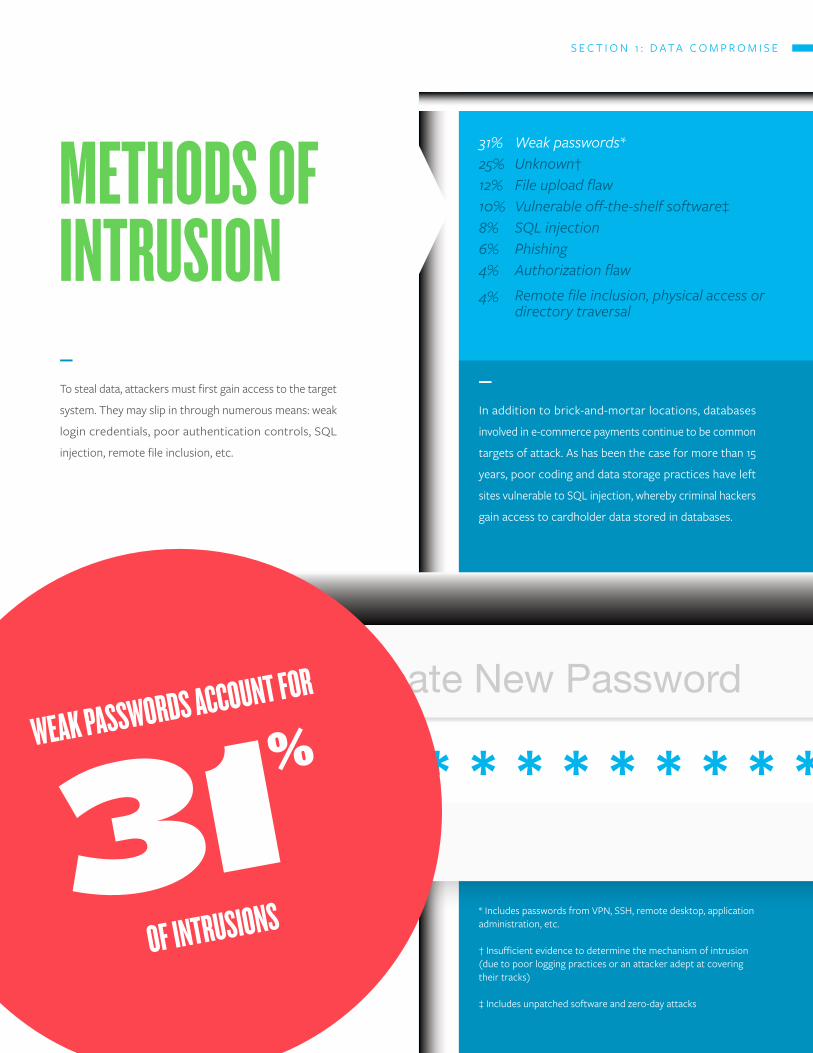
mEThOdS OfInTRUSIOn
Create New Password
* * * * * * * * * * * *WEAk PASSWORdS ACCOUnT fOR
31%
Of InTRUSIOnS
31%25%12%10%8%6%4%
4%
Weak passwords*Unknown†File upload flawVulnerable off-the-shelf software‡SQL injectionPhishingAuthorization flaw
Remote file inclusion, physical access or directory traversal
—
To steal data, attackers must first gain access to the target
system. They may slip in through numerous means: weak
login credentials, poor authentication controls, SQL
injection, remote file inclusion, etc.
—
In addition to brick-and-mortar locations, databases
involved in e-commerce payments continue to be common
targets of attack. As has been the case for more than 15
years, poor coding and data storage practices have left
sites vulnerable to SQL injection, whereby criminal hackers
gain access to cardholder data stored in databases.
* Includes passwords from VPN, SSH, remote desktop, application administration, etc.
† Insufficient evidence to determine the mechanism of intrusion (due to poor logging practices or an attacker adept at covering their tracks)
‡ Includes unpatched software and zero-day attacks
S E C T I O N 1 : D A T A C O M P R O M I S E
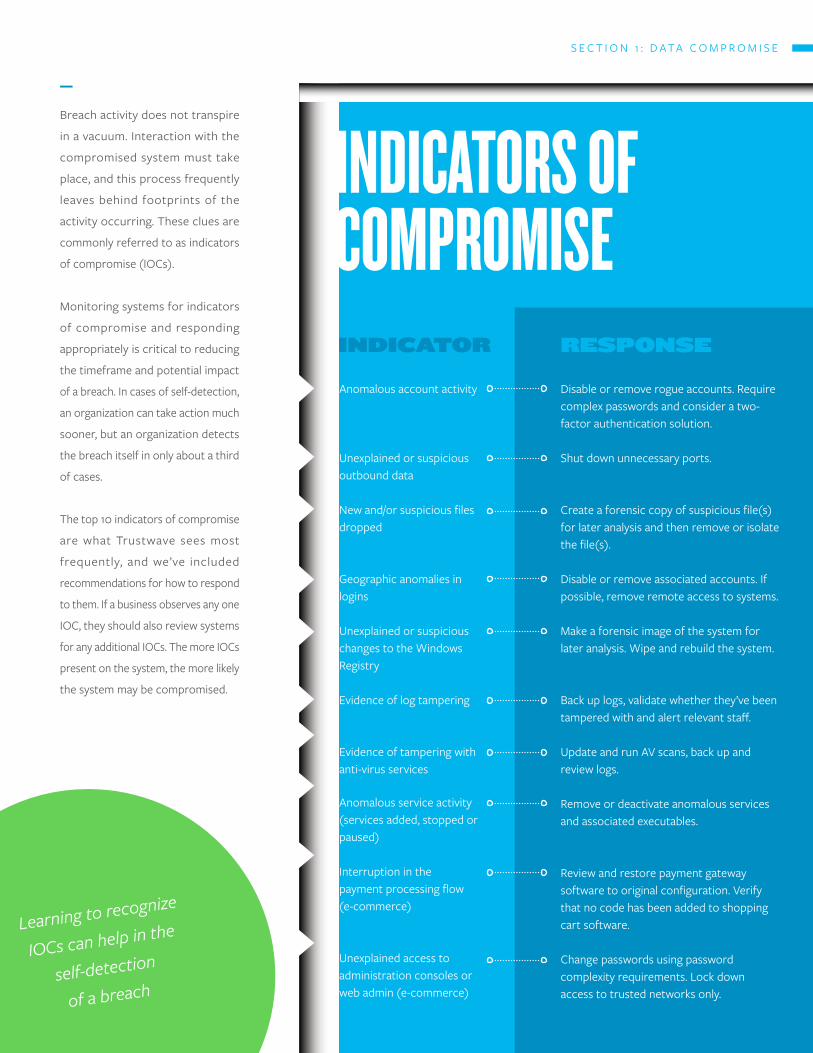
—
Breach activity does not transpire
in a vacuum. Interaction with the
compromised system must take
place, and this process frequently
leaves behind footprints of the
activity occurring. These clues are
commonly referred to as indicators
of compromise (IOCs).
Monitoring systems for indicators
of compromise and responding
appropriately is critical to reducing
the timeframe and potential impact
of a breach. In cases of self-detection,
an organization can take action much
sooner, but an organization detects
the breach itself in only about a third
of cases.
The top 10 indicators of compromise
are what Trustwave sees most
frequently, and we’ve included
recommendations for how to respond
to them. If a business observes any one
IOC, they should also review systems
for any additional IOCs. The more IOCs
present on the system, the more likely
the system may be compromised.
Disable or remove rogue accounts. Require complex passwords and consider a two-factor authentication solution.
Shut down unnecessary ports.
Create a forensic copy of suspicious file(s) for later analysis and then remove or isolate the file(s).
Disable or remove associated accounts. If possible, remove remote access to systems.
Make a forensic image of the system for later analysis. Wipe and rebuild the system.
Back up logs, validate whether they’ve been tampered with and alert relevant staff.
Update and run AV scans, back up and review logs.
Remove or deactivate anomalous services and associated executables.
Review and restore payment gateway software to original configuration. Verify that no code has been added to shopping cart software.
Change passwords using password complexity requirements. Lock down access to trusted networks only.
Anomalous account activity
Unexplained or suspicious outbound data
New and/or suspicious files dropped
Geographic anomalies in logins
Unexplained or suspicious changes to the Windows Registry
Evidence of log tampering
Evidence of tampering with anti-virus services
Anomalous service activity (services added, stopped or paused)
Interruption in the payment processing flow (e-commerce)
Unexplained access to administration consoles or web admin (e-commerce)
IndICATORS OfCOmPROmISEiNdiCaTOr rESpONSE
Learning to recognize
IOCs can help in the
self-detection
of a breach
S E C T I O N 1 : D A T A C O M P R O M I S E
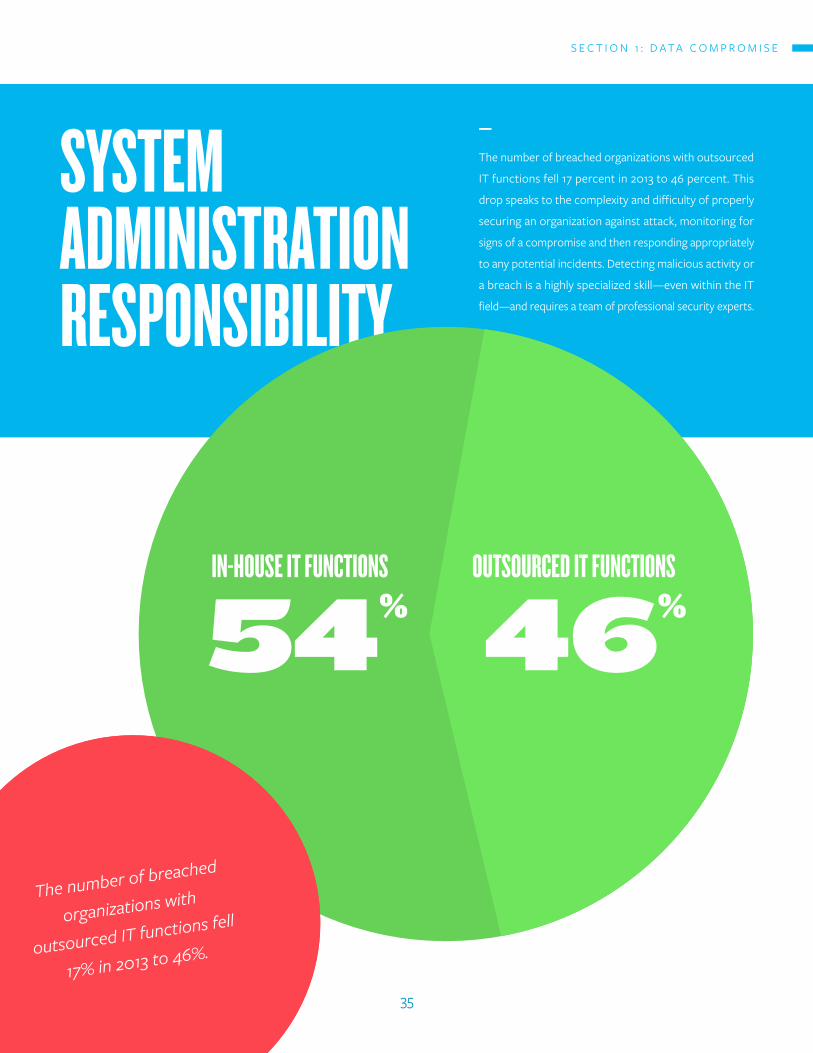
SYSTEm AdmInISTRATIOn RESPOnSIBILITY
—
The number of breached organizations with outsourced
IT functions fell 17 percent in 2013 to 46 percent. This
drop speaks to the complexity and difficulty of properly
securing an organization against attack, monitoring for
signs of a compromise and then responding appropriately
to any potential incidents. Detecting malicious activity or
a breach is a highly specialized skill—even within the IT
field—and requires a team of professional security experts.
In-hOUSE IT fUnCTIOnS
54%OUTSOURCEd IT fUnCTIOnS
46%
The number of breached
organizations with
outsourced IT functions fell
17% in 2013 to 46%.
35
S E C T I O N 1 : D A T A C O M P R O M I S E
SECTiON 2–
ThrEaTiNTElligENCE
2 0 1 4 T R U S T W A V E G L O B A L S E C U R I T Y R E P O R T
37
S E C T I O N 4 : T H R E A T I N T E L L I G E N C E
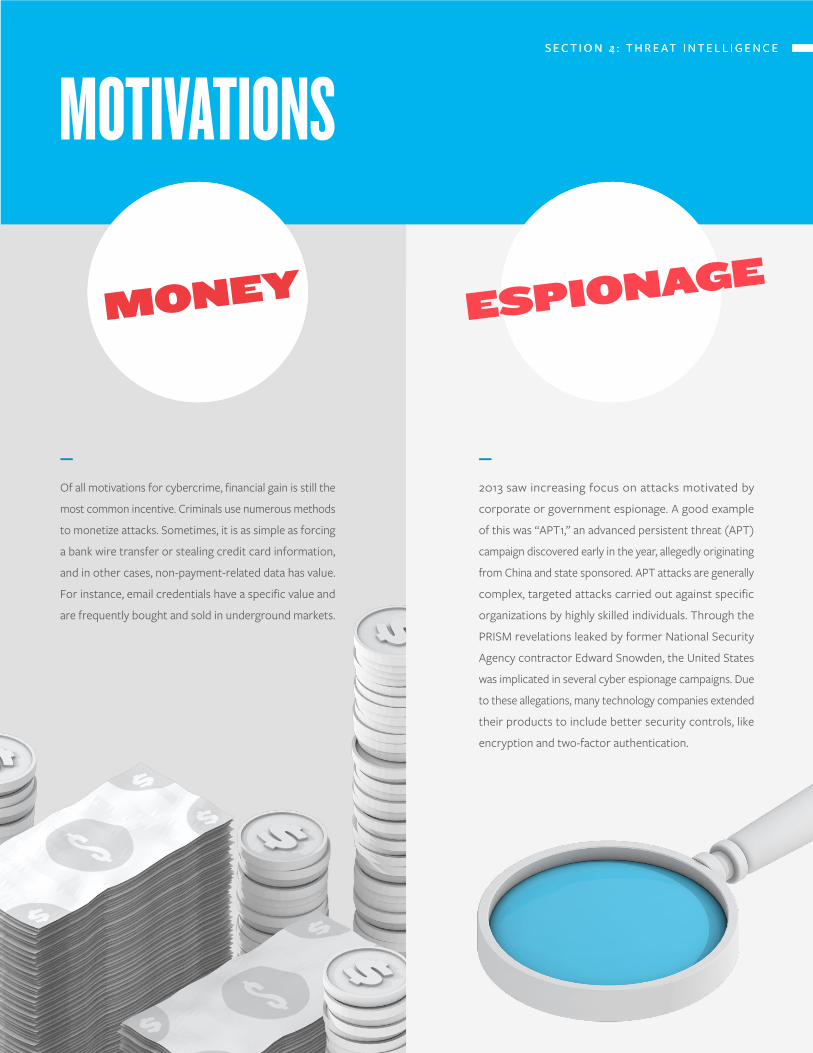
mOTIVATIOnS
mONEy ESpiONagE
—
Of all motivations for cybercrime, financial gain is still the
most common incentive. Criminals use numerous methods
to monetize attacks. Sometimes, it is as simple as forcing
a bank wire transfer or stealing credit card information,
and in other cases, non-payment-related data has value.
For instance, email credentials have a specific value and
are frequently bought and sold in underground markets.
—
2013 saw increasing focus on attacks motivated by
corporate or government espionage. A good example
of this was “APT1,” an advanced persistent threat (APT)
campaign discovered early in the year, allegedly originating
from China and state sponsored. APT attacks are generally
complex, targeted attacks carried out against specific
organizations by highly skilled individuals. Through the
PRISM revelations leaked by former National Security
Agency contractor Edward Snowden, the United States
was implicated in several cyber espionage campaigns. Due
to these allegations, many technology companies extended
their products to include better security controls, like
encryption and two-factor authentication.
S E C T I O N 2 : T H R E A T I N T E L L I G E N C E
38
S E C T I O N 4 : T H R E A T I N T E L L I G E N C E
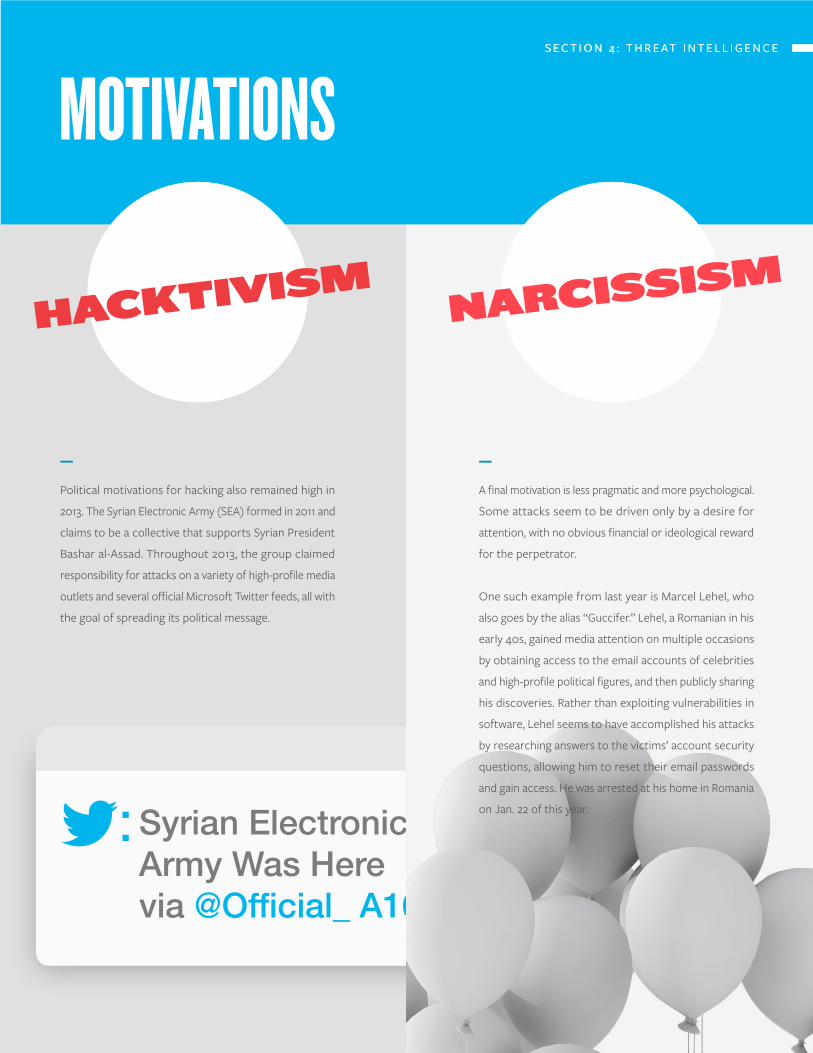
twitter:Syrian Electronic Army Was Herevia @Official_ A16
mOTIVATIOnS
haCkTiviSmNarCiSSiSm
—
Political motivations for hacking also remained high in
2013. The Syrian Electronic Army (SEA) formed in 2011 and
claims to be a collective that supports Syrian President
Bashar al-Assad. Throughout 2013, the group claimed
responsibility for attacks on a variety of high-profile media
outlets and several official Microsoft Twitter feeds, all with
the goal of spreading its political message.
—
A final motivation is less pragmatic and more psychological.
Some attacks seem to be driven only by a desire for
attention, with no obvious financial or ideological reward
for the perpetrator.
One such example from last year is Marcel Lehel, who
also goes by the alias “Guccifer.” Lehel, a Romanian in his
early 40s, gained media attention on multiple occasions
by obtaining access to the email accounts of celebrities
and high-profile political figures, and then publicly sharing
his discoveries. Rather than exploiting vulnerabilities in
software, Lehel seems to have accomplished his attacks
by researching answers to the victims’ account security
questions, allowing him to reset their email passwords
and gain access. He was arrested at his home in Romania
on Jan. 22 of this year.
S E C T I O N 2 : T H R E A T I N T E L L I G E N C E
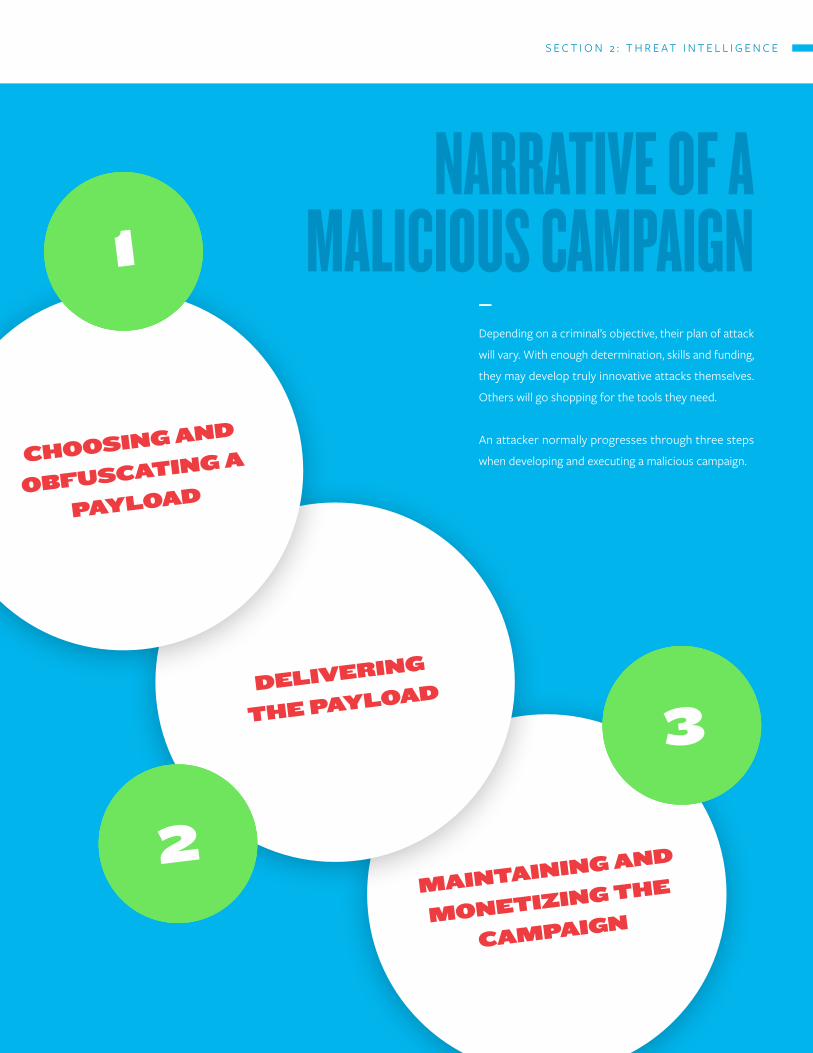
nARRATIVE Of A mALICIOUS CAmPAIGn
—
Depending on a criminal’s objective, their plan of attack
will vary. With enough determination, skills and funding,
they may develop truly innovative attacks themselves.
Others will go shopping for the tools they need.
An attacker normally progresses through three steps
when developing and executing a malicious campaign.
ChOOSiNg aNd
ObfuSCaTiNg a
paylOad
dElivEriNg
ThE paylOad
maiNTaiNiNg aNd
mONETiziNg ThE
CampaigN
1
2
3
S E C T I O N 2 : T H R E A T I N T E L L I G E N C E
S E C T I O N 4 : T H R E A T I N T E L L I G E N C E
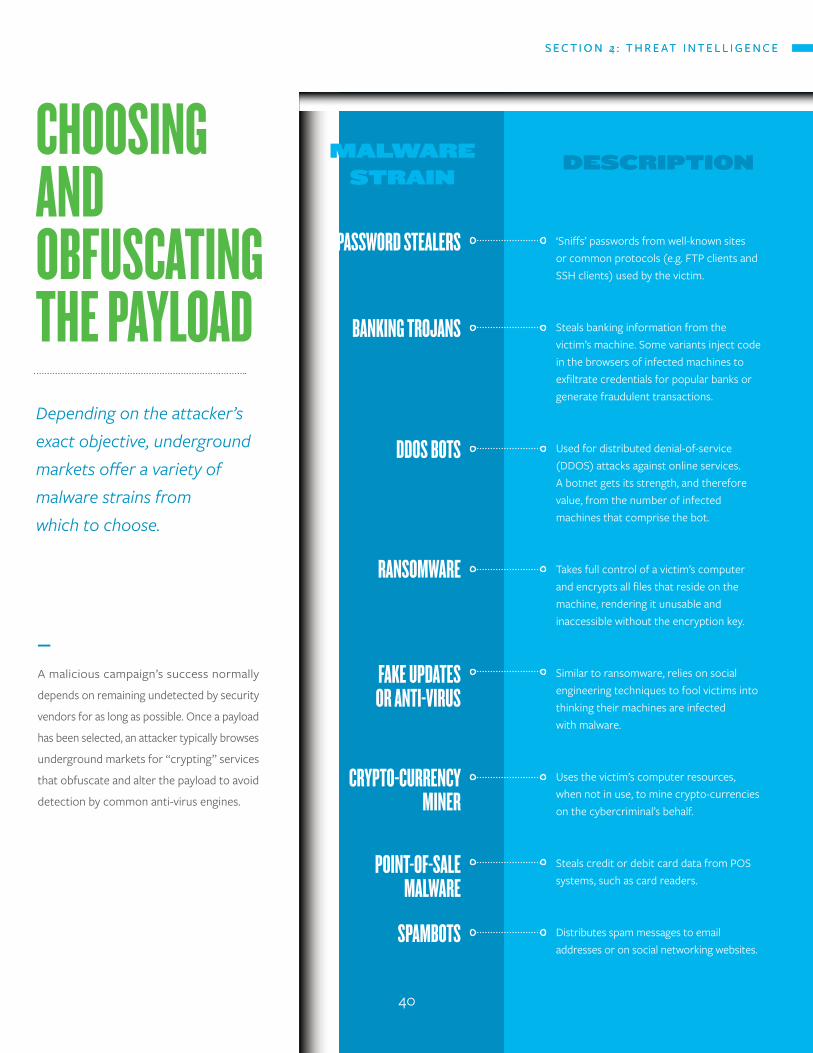
ChOOSInG And OBfUSCATInG ThE PAYLOAd
‘Sniffs’ passwords from well-known sites or common protocols (e.g. FTP clients and SSH clients) used by the victim.
Steals banking information from the victim’s machine. Some variants inject code in the browsers of infected machines to exfiltrate credentials for popular banks or generate fraudulent transactions.
Used for distributed denial-of-service (DDOS) attacks against online services. A botnet gets its strength, and therefore value, from the number of infected machines that comprise the bot.
Takes full control of a victim’s computer and encrypts all files that reside on the machine, rendering it unusable and inaccessible without the encryption key.
Similar to ransomware, relies on social engineering techniques to fool victims into thinking their machines are infected with malware.
Uses the victim’s computer resources, when not in use, to mine crypto-currencies on the cybercriminal’s behalf.
Steals credit or debit card data from POS systems, such as card readers.
Distributes spam messages to email addresses or on social networking websites.
Depending on the attacker’s exact objective, underground markets offer a variety of malware strains from which to choose.
PASSWORd STEALERS
BAnkInG TROJAnS
ddOS BOTS
RAnSOmWARE
fAkE UPdATES OR AnTI-VIRUS
CRYPTO-CURREnCY mInER
POInT-Of-SALE mALWARE
SPAmBOTS
dESCripTiONmalwarE STraiN
—
A malicious campaign’s success normally
depends on remaining undetected by security
vendors for as long as possible. Once a payload
has been selected, an attacker typically browses
underground markets for “crypting” services
that obfuscate and alter the payload to avoid
detection by common anti-virus engines.
S E C T I O N 2 : T H R E A T I N T E L L I G E N C E
40
dELIVERInG ThE PAYLOAd
(ExplOiT kiTS)
—
Exploit kits take advantage of the latest known
vulnerabilities in web browsers and third-party plug-ins
(e.g. Java, Flash and PDF readers) to deliver a malicious
payload. Once the campaign infrastructure is up and
running, the attacker needs victims. To infect as many
machines as possible, the attacker needs to redirect
traffic to the exploit kit landing page. This traffic can also
be bought on the underground market.
First, criminals must purchase traffic that is relevant
to the payload they’re delivering. Second, they need
to ensure the traffic comes from users that meet their
requirements, such as a particular socioeconomic status.
Banking trojans and ransomware campaigns, for example,
require targets from wealthier countries that can afford
to pay ransomware fees or are more likely to have bank
accounts with higher balances.
An exploit kit’s success depends upon the traffic being
redirected to its landing page by using relevant web
browsers or operating systems that are unpatched against
certain vulnerabilities. For example, only Windows machines
that use Internet Explorer or older versions of Firefox
may be redirected.
Most of these sellers use a traffic distribution system
(TDS) to receive the live traffic and distribute it to different
campaigns—mostly malicious landing pages or legitimate
web pages infected with malicious IFrames (code snippets
that redirect users elsewhere). Kits are also sold that scan
online hosts for vulnerabilities and then infect pages with
redirection scripts. Both of these methods are typically
used when the payload is DDOS or spambot malware,
where the traffic quantity outweighs quality.
41

mAInTAInInG And mOnETIzInG
ThE CAmPAIGn
—
The longer a campaign stays active, the more data a
criminal can collect and sell. Legitimate hosting services
will shut down a server that hosts malicious content as
soon as it is discovered. Instead, cybercriminals often
opt for ‘bulletproof hosting’ services, which place few
restrictions on hosted content. Reports of abuse or
offensive material to these services are mostly ignored.
Typically, bulletproof hosting services furnish secure,
physical locations for servers in lesser known countries—
and even inside bunkers.
Once the campaign is up and running and the attacker
succeeds in harvesting victims, the attention is then
focused on monetizing the campaign. This may include
leveraging a botnet to sell DDOS services, extorting a
business, stealing banking or credit card information
or disclosing proprietary information through the
use of backdoors.
42
WEB ThREATS
—
Zero-day vulnerabilities and corresponding exploits are
one of the most sought-after items in underground
markets. A stable zero-day exploit for a popular browser
or plug-in can easily fetch the equivalent of hundreds of
thousands of U.S. Dollars.
Attackers typically use either server-side zero-day or
client-side zero-day exploits. Criminals use server-side
zero-day vulnerabilities to infiltrate organizations by directly
attacking their servers. Client-side zero-day vulnerabilities
enable infection of end-user machines, and through those
compromised machines, an attacker can then pivot to
other areas of an organization’s systems.
Throughout the past year, we’ve seen a growing number of
“premium” exploit kit developers using zero-day exploits
to entice customers to pay monthly kit rental fees of up
to $10,000 USD. A premium exploit kit, however, can
attract a significant amount of exposure, which shortens
the amount of time it truly lives as a zero-day. A zero-day
exploit used on a single target can remain under the radar
and undetected for longer than one that is packaged in a
kit and rented by multiple attackers. The average lifespan
of a zero-day before it is discovered or disclosed is more
than 100 days.
zErO-dayS
S E C T I O N 2 : T H R E A T I N T E L L I G E N C E
43
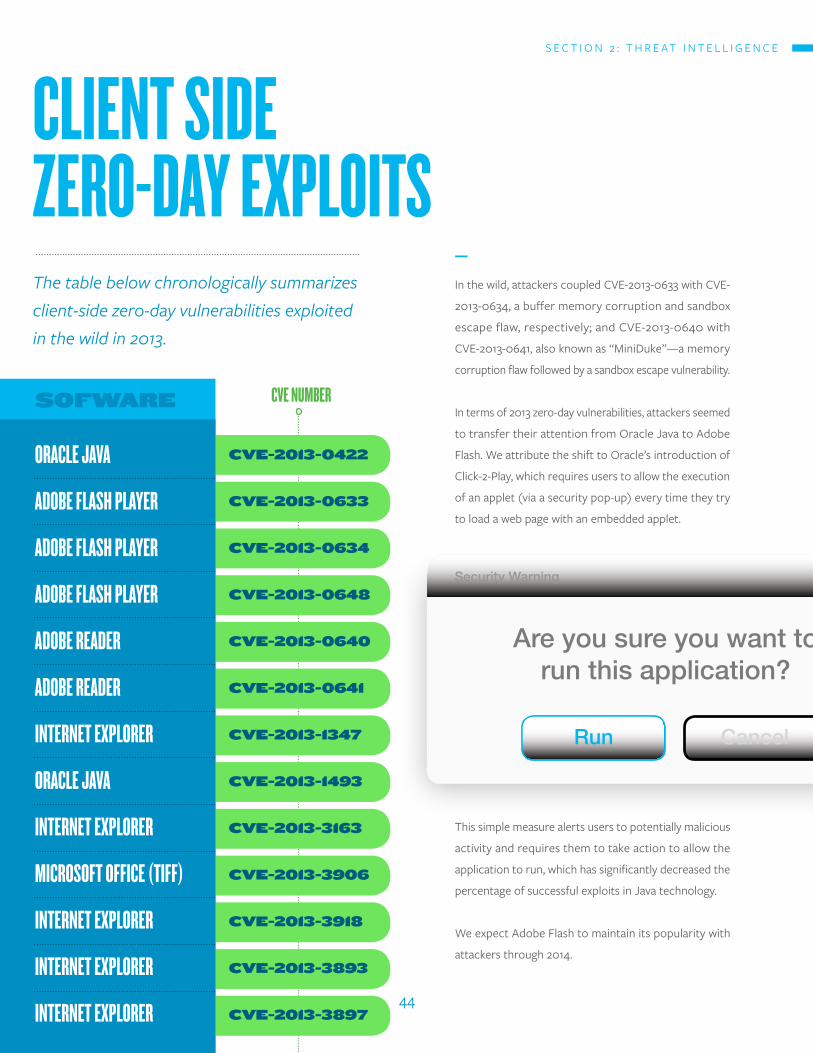
CLIEnT SIdE zERO-dAY ExPLOITS
ORACLE JAVA
AdOBE fLASh PLAYER
AdOBE fLASh PLAYER
AdOBE fLASh PLAYER
AdOBE REAdER
AdOBE REAdER
InTERnET ExPLORER
ORACLE JAVA
InTERnET ExPLORER
mICROSOfT OffICE (TIff)
InTERnET ExPLORER
InTERnET ExPLORER
InTERnET ExPLORER
SOfwarE CVE nUmBER
CvE-2013-0422
CvE-2013-0633
CvE-2013-0634
CvE-2013-0648
CvE-2013-0640
CvE-2013-0641
CvE-2013-1347
CvE-2013-1493
CvE-2013-3163
CvE-2013-3906
CvE-2013-3918
CvE-2013-3893
CvE-2013-3897
The table below chronologically summarizes client-side zero-day vulnerabilities exploited in the wild in 2013.
—
In the wild, attackers coupled CVE-2013-0633 with CVE-
2013-0634, a buffer memory corruption and sandbox
escape flaw, respectively; and CVE-2013-0640 with
CVE-2013-0641, also known as “MiniDuke”—a memory
corruption flaw followed by a sandbox escape vulnerability.
In terms of 2013 zero-day vulnerabilities, attackers seemed
to transfer their attention from Oracle Java to Adobe
Flash. We attribute the shift to Oracle’s introduction of
Click-2-Play, which requires users to allow the execution
of an applet (via a security pop-up) every time they try
to load a web page with an embedded applet.
This simple measure alerts users to potentially malicious
activity and requires them to take action to allow the
application to run, which has significantly decreased the
percentage of successful exploits in Java technology.
We expect Adobe Flash to maintain its popularity with
attackers through 2014.
Are you sure you want to run this application?
Security Warning
Run Cancel
S E C T I O N 2 : T H R E A T I N T E L L I G E N C E
44
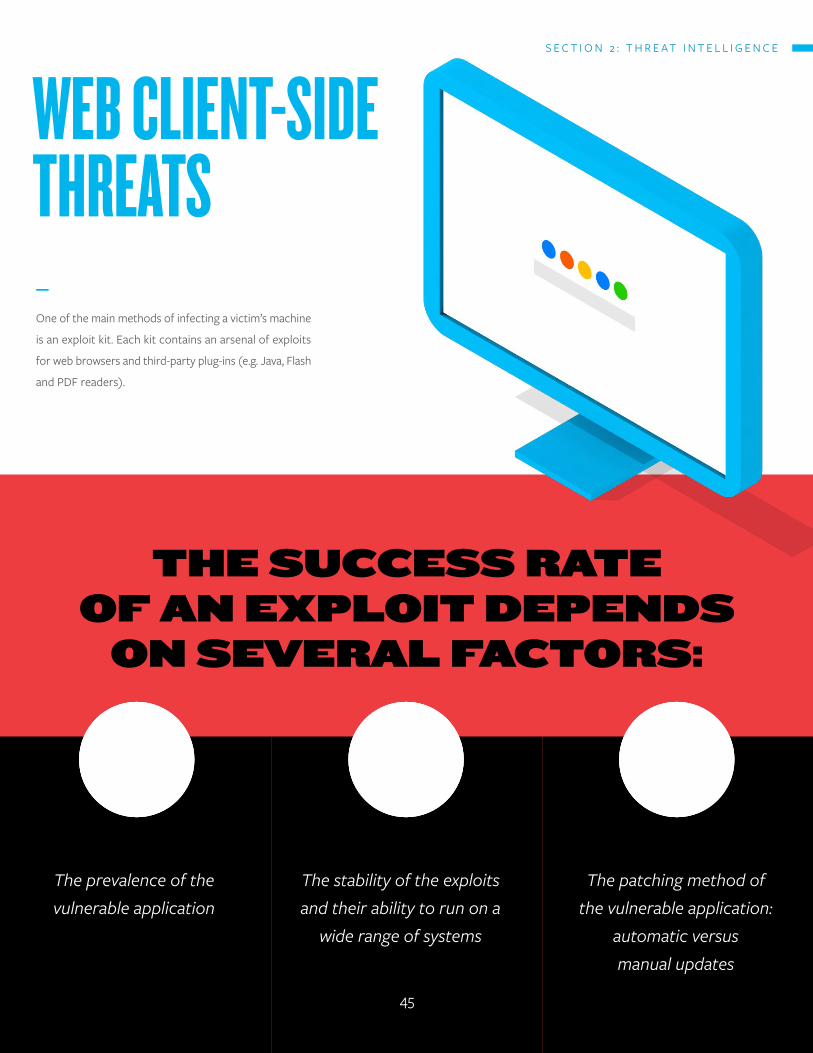
WEB CLIEnT-SIdE ThREATS—
One of the main methods of infecting a victim’s machine
is an exploit kit. Each kit contains an arsenal of exploits
for web browsers and third-party plug-ins (e.g. Java, Flash
and PDF readers).
The success raTe of an exploiT depends
on several facTors:
1 2 3
The prevalence of the vulnerable application
The stability of the exploits and their ability to run on a
wide range of systems
The patching method of the vulnerable application:
automatic versus manual updates
S E C T I O N 2 : T H R E A T I N T E L L I G E N C E
45
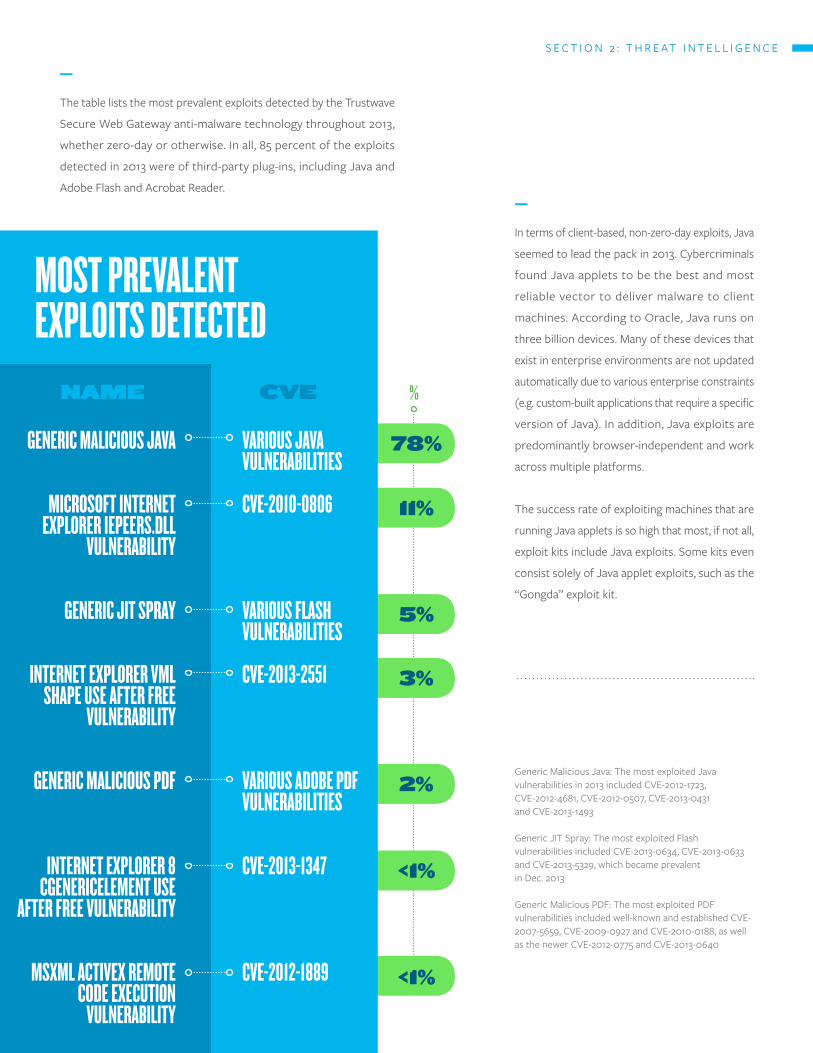
GEnERIC mALICIOUS JAVA
mICROSOfT InTERnET ExPLORER IEPEERS.dLL
VULnERABILITY
GEnERIC JIT SPRAY
InTERnET ExPLORER VmL ShAPE USE AfTER fREE
VULnERABILITY
GEnERIC mALICIOUS Pdf
InTERnET ExPLORER 8 CGEnERICELEmEnT USE
AfTER fREE VULnERABILITY
mSxmL ACTIVEx REmOTE COdE ExECUTIOn
VULnERABILITY
VARIOUS JAVA VULnERABILITIES
CVE-2010-0806
VARIOUS fLASh VULnERABILITIES
CVE-2013-2551
VARIOUS AdOBE Pdf VULnERABILITIES
CVE-2013-1347
CVE-2012-1889
CvE
78%
11%
5%
3%
2%
<1%
<1%
NamE
—
The table lists the most prevalent exploits detected by the Trustwave
Secure Web Gateway anti-malware technology throughout 2013,
whether zero-day or otherwise. In all, 85 percent of the exploits
detected in 2013 were of third-party plug-ins, including Java and
Adobe Flash and Acrobat Reader.—
In terms of client-based, non-zero-day exploits, Java
seemed to lead the pack in 2013. Cybercriminals
found Java applets to be the best and most
reliable vector to deliver malware to client
machines. According to Oracle, Java runs on
three billion devices. Many of these devices that
exist in enterprise environments are not updated
automatically due to various enterprise constraints
(e.g. custom-built applications that require a specific
version of Java). In addition, Java exploits are
predominantly browser-independent and work
across multiple platforms.
The success rate of exploiting machines that are
running Java applets is so high that most, if not all,
exploit kits include Java exploits. Some kits even
consist solely of Java applet exploits, such as the
“Gongda” exploit kit.
Generic Malicious Java: The most exploited Java vulnerabilities in 2013 included CVE-2012-1723, CVE-2012-4681, CVE-2012-0507, CVE-2013-0431 and CVE-2013-1493
Generic JIT Spray: The most exploited Flash vulnerabilities included CVE-2013-0634, CVE-2013-0633 and CVE-2013-5329, which became prevalent in Dec. 2013
Generic Malicious PDF: The most exploited PDF vulnerabilities included well-known and established CVE-2007-5659, CVE-2009-0927 and CVE-2010-0188, as well as the newer CVE-2012-0775 and CVE-2013-0640
mOST PREVALEnT ExPLOITS dETECTEd
%
S E C T I O N 2 : T H R E A T I N T E L L I G E N C E
46
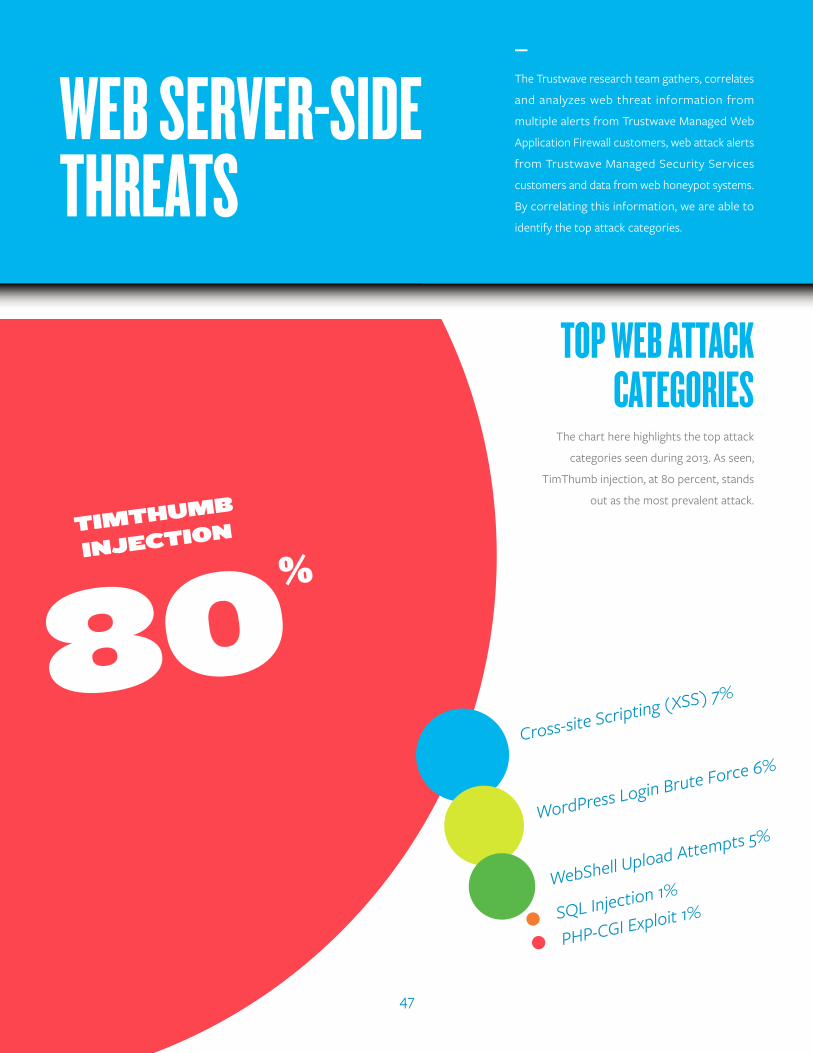
WEB SERVER-SIdE ThREATS
TOP WEB ATTACk CATEGORIES
—
The Trustwave research team gathers, correlates
and analyzes web threat information from
multiple alerts from Trustwave Managed Web
Application Firewall customers, web attack alerts
from Trustwave Managed Security Services
customers and data from web honeypot systems.
By correlating this information, we are able to
identify the top attack categories.
The chart here highlights the top attack
categories seen during 2013. As seen,
TimThumb injection, at 80 percent, stands
out as the most prevalent attack.
TimThumb
iNJECTiON
80%
Cross-site Scripting (XSS) 7%
WordPress Login Brute Force 6%
WebShell Upload Attempts 5%
SQL Injection 1%
PHP-CGI Exploit 1%
S E C T I O N 2 : T H R E A T I N T E L L I G E N C E
47
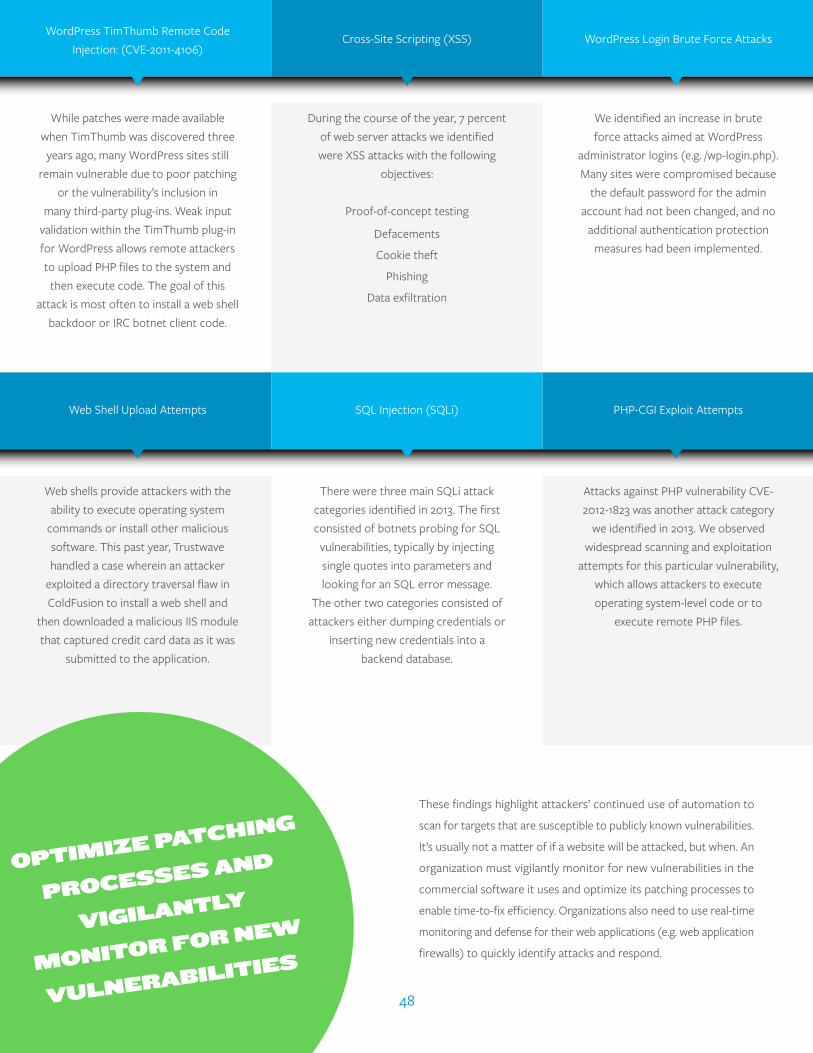
While patches were made available when TimThumb was discovered three
years ago, many WordPress sites still remain vulnerable due to poor patching
or the vulnerability’s inclusion in many third-party plug-ins. Weak input
validation within the TimThumb plug-in for WordPress allows remote attackers to upload PHP files to the system and
then execute code. The goal of this attack is most often to install a web shell
backdoor or IRC botnet client code.
Web shells provide attackers with the ability to execute operating system
commands or install other malicious software. This past year, Trustwave handled a case wherein an attacker
exploited a directory traversal flaw in ColdFusion to install a web shell and
then downloaded a malicious IIS module that captured credit card data as it was
submitted to the application.
During the course of the year, 7 percent of web server attacks we identified were XSS attacks with the following
objectives:
Proof-of-concept testing
Defacements
Cookie theft
Phishing
Data exfiltration
There were three main SQLi attack categories identified in 2013. The first consisted of botnets probing for SQL
vulnerabilities, typically by injecting single quotes into parameters and looking for an SQL error message.
The other two categories consisted of attackers either dumping credentials or
inserting new credentials into a backend database.
We identified an increase in brute force attacks aimed at WordPress
administrator logins (e.g. /wp-login.php). Many sites were compromised because
the default password for the admin account had not been changed, and no
additional authentication protection measures had been implemented.
Attacks against PHP vulnerability CVE-2012-1823 was another attack category
we identified in 2013. We observed widespread scanning and exploitation
attempts for this particular vulnerability, which allows attackers to execute operating system-level code or to
execute remote PHP files.
These findings highlight attackers’ continued use of automation to
scan for targets that are susceptible to publicly known vulnerabilities.
It’s usually not a matter of if a website will be attacked, but when. An
organization must vigilantly monitor for new vulnerabilities in the
commercial software it uses and optimize its patching processes to
enable time-to-fix efficiency. Organizations also need to use real-time
monitoring and defense for their web applications (e.g. web application
firewalls) to quickly identify attacks and respond.
WordPress TimThumb Remote Code Injection: (CVE-2011-4106)
Web Shell Upload Attempts
Cross-Site Scripting (XSS)
SQL Injection (SQLi)
WordPress Login Brute Force Attacks
PHP-CGI Exploit Attempts
OpTimizE paTChiNg
prOCESSES aNd
vigilaNTly
mONiTOr fOr NEw
vulNErabiliTiES
S E C T I O N 2 : T H R E A T I N T E L L I G E N C E
48
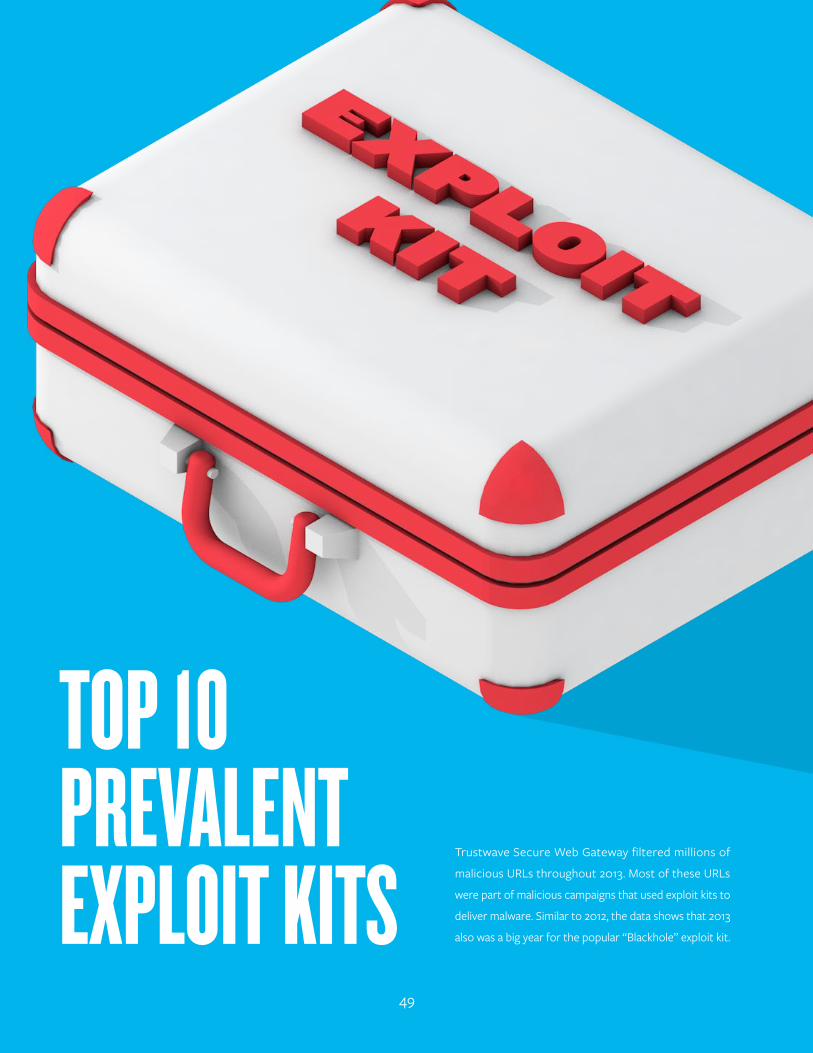
Trustwave Secure Web Gateway filtered millions of
malicious URLs throughout 2013. Most of these URLs
were part of malicious campaigns that used exploit kits to
deliver malware. Similar to 2012, the data shows that 2013
also was a big year for the popular “Blackhole” exploit kit.
TOP 10PREVALEnTExPLOIT kITS
49
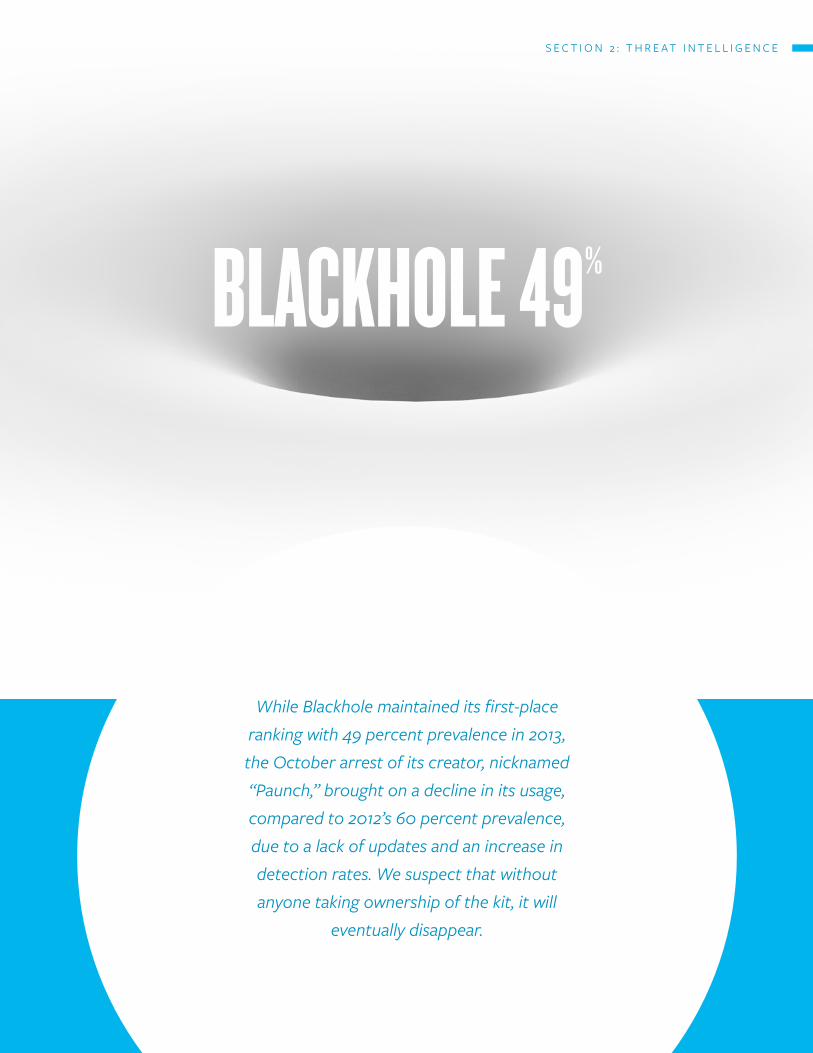
BLACkhOLE 49%
While Blackhole maintained its first-place ranking with 49 percent prevalence in 2013, the October arrest of its creator, nicknamed “Paunch,” brought on a decline in its usage, compared to 2012’s 60 percent prevalence, due to a lack of updates and an increase in detection rates. We suspect that without anyone taking ownership of the kit, it will
eventually disappear.
S E C T I O N 2 : T H R E A T I N T E L L I G E N C E
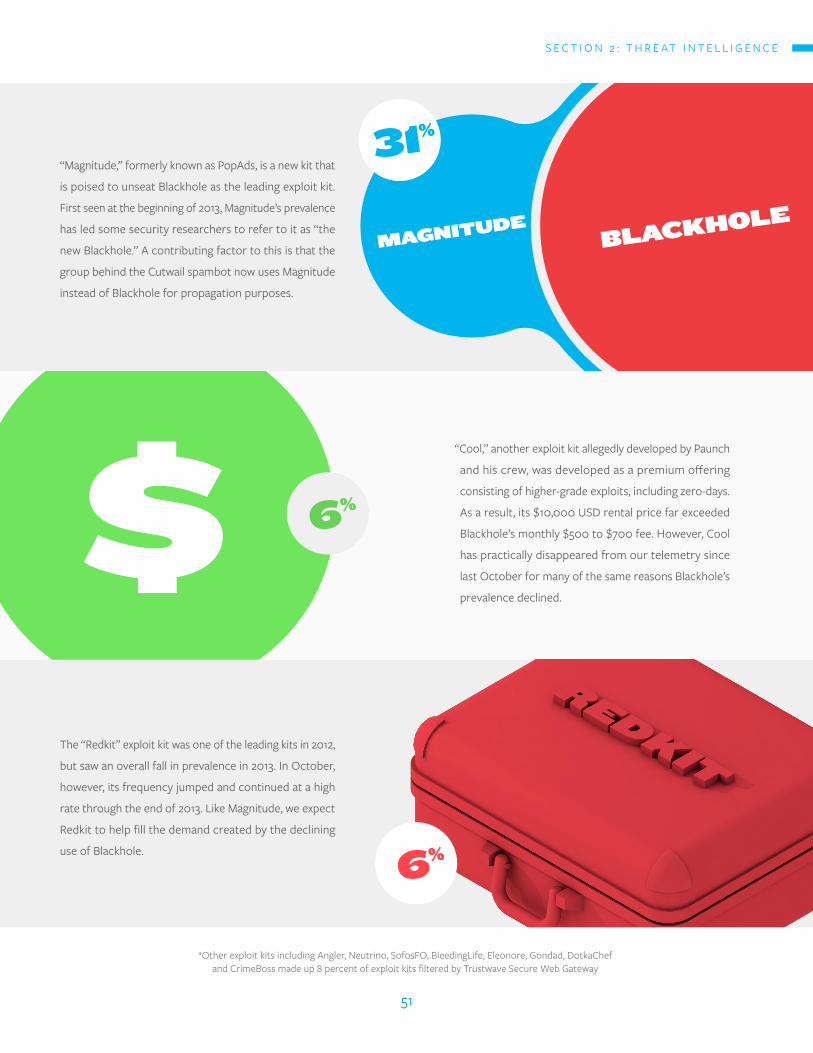
“Magnitude,” formerly known as PopAds, is a new kit that
is poised to unseat Blackhole as the leading exploit kit.
First seen at the beginning of 2013, Magnitude’s prevalence
has led some security researchers to refer to it as “the
new Blackhole.” A contributing factor to this is that the
group behind the Cutwail spambot now uses Magnitude
instead of Blackhole for propagation purposes.
blaCkhOlEmagNiTudE
“Cool,” another exploit kit allegedly developed by Paunch
and his crew, was developed as a premium offering
consisting of higher-grade exploits, including zero-days.
As a result, its $10,000 USD rental price far exceeded
Blackhole’s monthly $500 to $700 fee. However, Cool
has practically disappeared from our telemetry since
last October for many of the same reasons Blackhole’s
prevalence declined.
$The “Redkit” exploit kit was one of the leading kits in 2012,
but saw an overall fall in prevalence in 2013. In October,
however, its frequency jumped and continued at a high
rate through the end of 2013. Like Magnitude, we expect
Redkit to help fill the demand created by the declining
use of Blackhole.
31%
6%
6%
*Other exploit kits including Angler, Neutrino, SofosFO, BleedingLife, Eleonore, Gondad, DotkaChef and CrimeBoss made up 8 percent of exploit kits filtered by Trustwave Secure Web Gateway
S E C T I O N 2 : T H R E A T I N T E L L I G E N C E
51
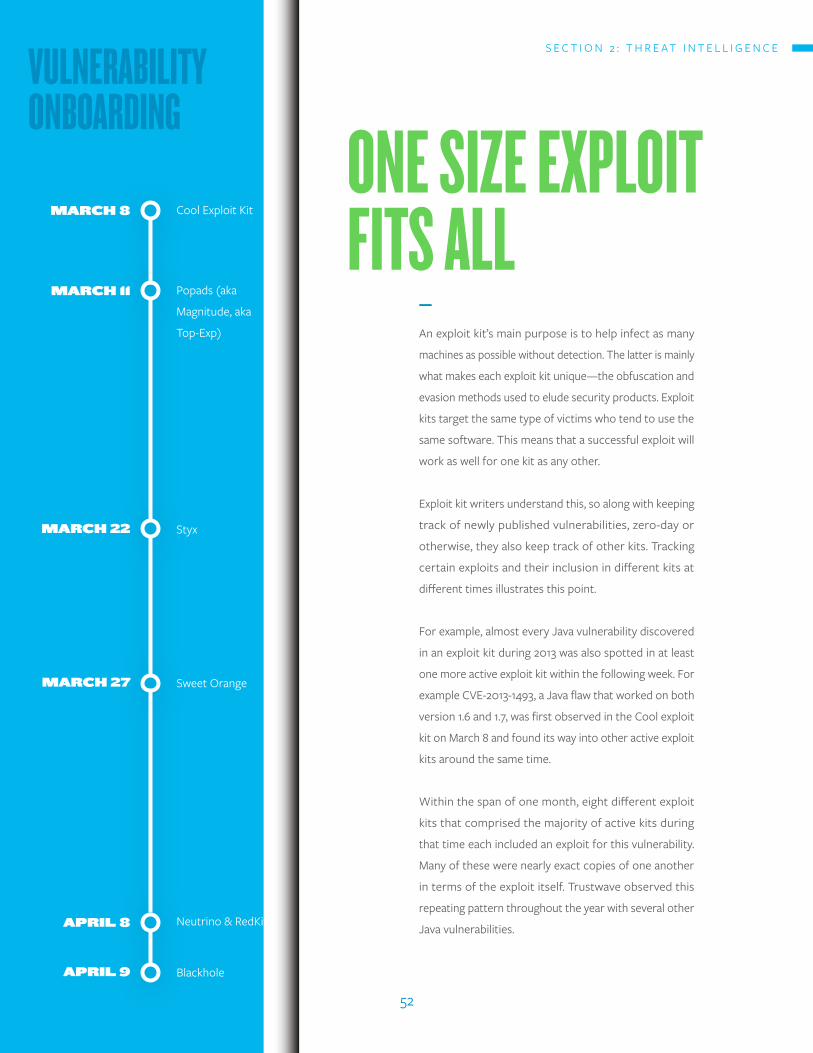
marCh 8
marCh 11
marCh 22
marCh 27
april 8
april 9
Cool Exploit Kit
Popads (aka
Magnitude, aka
Top-Exp)
Styx
Sweet Orange
Neutrino & RedKit
Blackhole
VULnERABILITYOnBOARdInG
OnE SIzE ExPLOIT fITS ALL
—
An exploit kit’s main purpose is to help infect as many
machines as possible without detection. The latter is mainly
what makes each exploit kit unique—the obfuscation and
evasion methods used to elude security products. Exploit
kits target the same type of victims who tend to use the
same software. This means that a successful exploit will
work as well for one kit as any other.
Exploit kit writers understand this, so along with keeping
track of newly published vulnerabilities, zero-day or
otherwise, they also keep track of other kits. Tracking
certain exploits and their inclusion in different kits at
different times illustrates this point.
For example, almost every Java vulnerability discovered
in an exploit kit during 2013 was also spotted in at least
one more active exploit kit within the following week. For
example CVE-2013-1493, a Java flaw that worked on both
version 1.6 and 1.7, was first observed in the Cool exploit
kit on March 8 and found its way into other active exploit
kits around the same time.
Within the span of one month, eight different exploit
kits that comprised the majority of active kits during
that time each included an exploit for this vulnerability.
Many of these were nearly exact copies of one another
in terms of the exploit itself. Trustwave observed this
repeating pattern throughout the year with several other
Java vulnerabilities.
S E C T I O N 2 : T H R E A T I N T E L L I G E N C E
52

miCrOSOfT SilvErlighT plug-iN
VULnERABILITY:
CvE-2013-0074
VULnERABILITY:
CvE-2013-3896
An intriguing exploit that shared a similar pattern
incorporated two, different vulnerabilities: CVE-2013-
0074 and CVE-2013-3896. Both vulnerabilities targeted
Microsoft’s Silverlight plug-in, previously ignored by
the exploit kit community. The Silverlight framework
was first introduced in 2007, but its first vulnerability
wasn’t reported until 2010. Still, Trustwave did not see
evidence of any Silverlight vulnerabilities in exploit
kits until these two flaws were coupled together
and integrated into virtually all active exploit kits in
2013. Within a month, Silverlight became the most
popular target for exploitation. To make matters
worse, integrating this exploit into a kit was so simple
that developers could use the same .dll file across all
versions. They merely added their own methods of
obfuscation and evasion to the code.
S E C T I O N 2 : T H R E A T I N T E L L I G E N C E
53
mALWAREDuring our data compromise investigations in 2013, Trustwave
encountered a large number of malicious files. These investigations
generally fell into one of two categories: POS and e-commerce.
While both types of data breaches target payment card data, each
uses different techniques. POS cases involve the targeting of specific
devices, such as cash registers and credit and debit card readers,
while e-commerce cases involve the targeting of servers and backend
databases that host the card data.
54
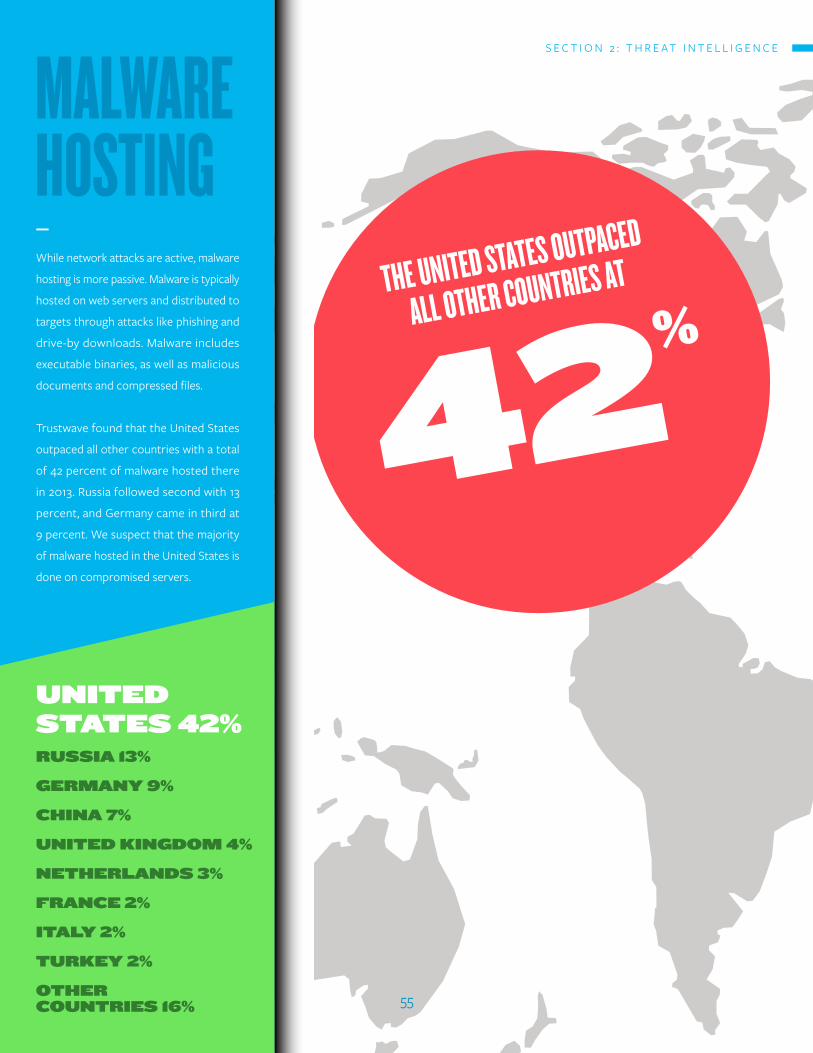
mALWAREhOSTInG—
While network attacks are active, malware
hosting is more passive. Malware is typically
hosted on web servers and distributed to
targets through attacks like phishing and
drive-by downloads. Malware includes
executable binaries, as well as malicious
documents and compressed files.
Trustwave found that the United States
outpaced all other countries with a total
of 42 percent of malware hosted there
in 2013. Russia followed second with 13
percent, and Germany came in third at
9 percent. We suspect that the majority
of malware hosted in the United States is
done on compromised servers.
uNiTEd STaTES 42%ruSSia 13%
gErmaNy 9%
ChiNa 7%
uNiTEd kiNgdOm 4%
NEThErlaNdS 3%
fraNCE 2%
iTaly 2%
TurkEy 2%
OThErCOuNTriES 16%
ThE UnITEd STATES OUTPACEd
ALL OThER COUnTRIES AT
42%
S E C T I O N 2 : T H R E A T I N T E L L I G E N C E
55
POInT-Of-SALEmALWARE
—
As a PCI Forensic Investigator (PFI), Trustwave examines
a substantial number of breaches involving payment
card data and examines a large amount of malware
that targets POS devices. POS malware is any malicious
file that is designed to steal track data (the sensitive
information stored in the magnetic stripe of a payment
card), either from memory or the physical disk of the
machine. Typically a malware sample will fit into a “family”
that shares certain characteristics and is likely authored
by the same individual(s). A malware family has a number
of commonalities that make it unique when compared
to other families.
As part of our investigations, Trustwave tracks the evolution
of these families over extended periods of time. In the
past year, POS malware evolved substantially compared
to previous years. While parsing track data from memory
and logging keystrokes on the victim’s machine is nothing
new, we noted new developments in data exfiltration
processes and command-and-control (C&C) functionality.
We also saw evidence of more authors automating the
installation and control of their malware in 2013. While
Trustwave discovered a number of new POS malware
families exhibiting botnet-like tendencies, a number of
well-known, older families also made an appearance.
56

whaT iS a mEmOry
dumpEr Or kEylOggEr?
A memory dumper is malware that can read the
memory of a chosen process on a victim’s computer
and parse sensitive information from it because that
data is often temporarily stored in memory in an
unencrypted state. Malicious files known as keyloggers
record what end-users type on their keyboard. Some
less advanced card-reader devices also appear to the
computer to be a keyboard and a keylogger records
the data inputted through those devices.
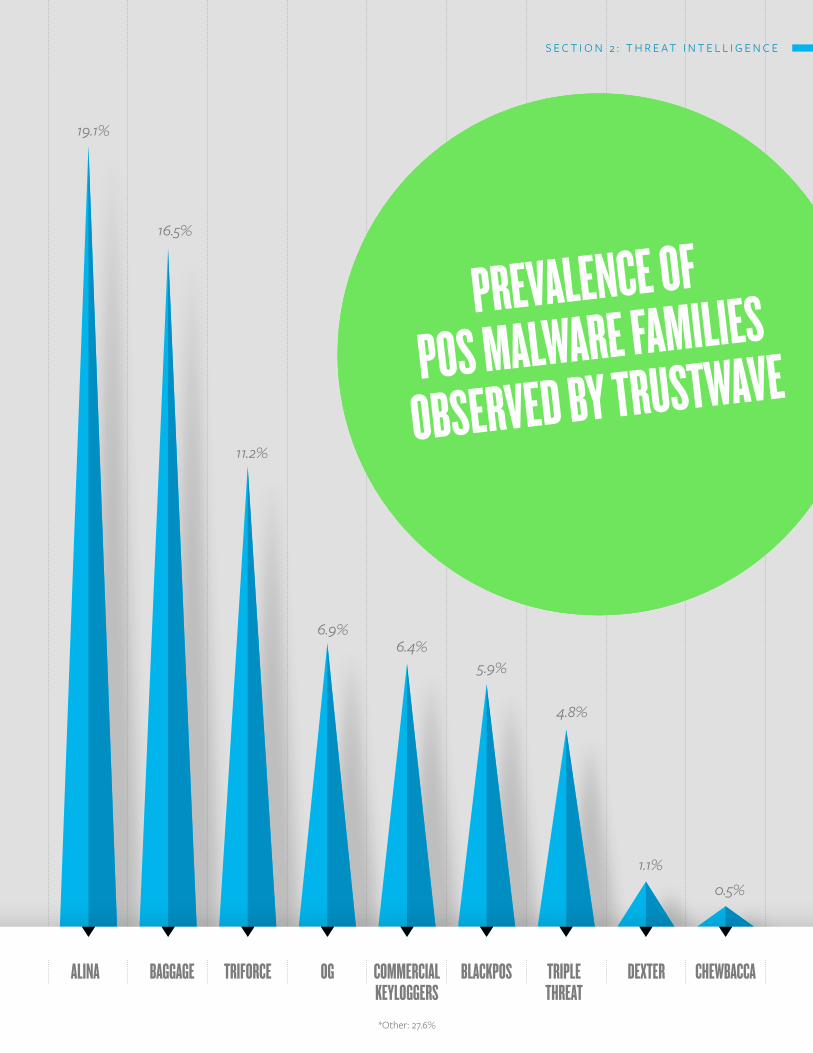
ALInA BAGGAGE TRIfORCE OG COmmERCIALkEYLOGGERS
BLACkPOS TRIPLEThREAT
dExTER ChEWBACCA
19.1%
16.5%
11.2%
6.9%6.4%
5.9%
4.8%
1.1%
0.5%
PREVALEnCE Of
POS mALWARE fAmILIES
OBSERVEd BY TRUSTWAVE
*Other: 27.6%
S E C T I O N 2 : T H R E A T I N T E L L I G E N C E
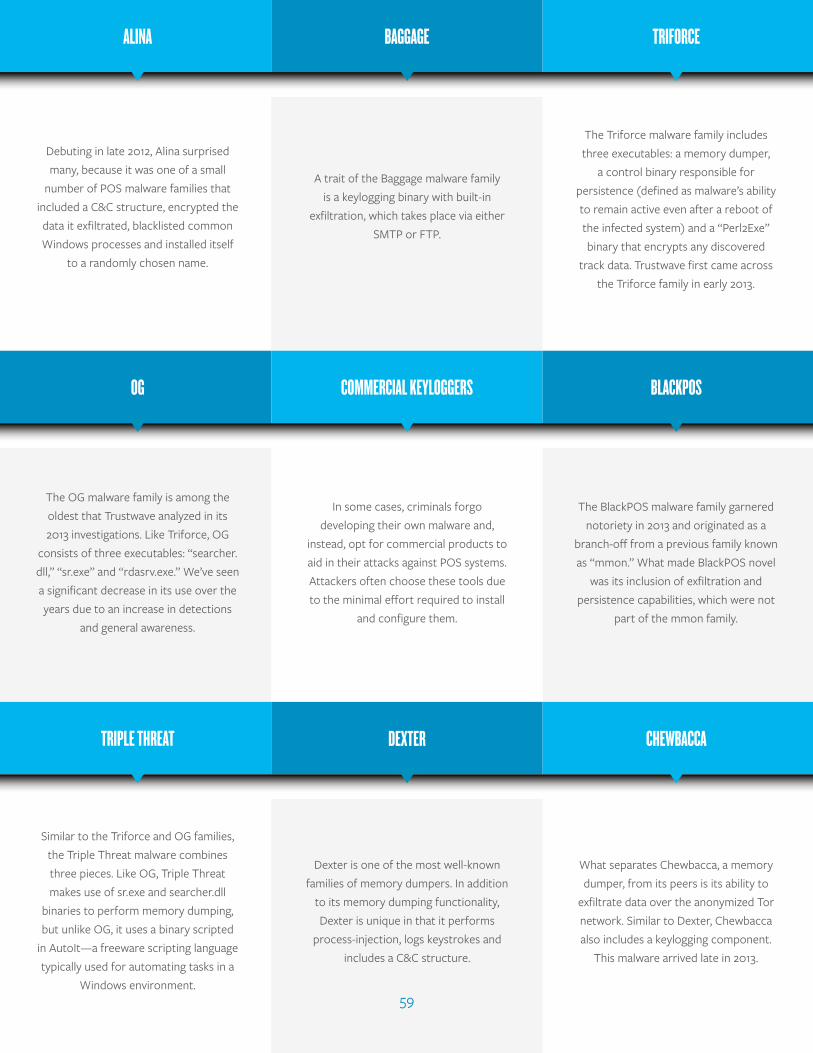
Debuting in late 2012, Alina surprised many, because it was one of a small
number of POS malware families that included a C&C structure, encrypted the data it exfiltrated, blacklisted common Windows processes and installed itself
to a randomly chosen name.
The OG malware family is among the oldest that Trustwave analyzed in its 2013 investigations. Like Triforce, OG
consists of three executables: “searcher.dll,” “sr.exe” and “rdasrv.exe.” We’ve seen a significant decrease in its use over the years due to an increase in detections
and general awareness.
Similar to the Triforce and OG families, the Triple Threat malware combines three pieces. Like OG, Triple Threat makes use of sr.exe and searcher.dll
binaries to perform memory dumping, but unlike OG, it uses a binary scripted
in AutoIt—a freeware scripting language typically used for automating tasks in a
Windows environment.
A trait of the Baggage malware family is a keylogging binary with built-in
exfiltration, which takes place via either SMTP or FTP.
In some cases, criminals forgo developing their own malware and,
instead, opt for commercial products to aid in their attacks against POS systems. Attackers often choose these tools due to the minimal effort required to install
and configure them.
Dexter is one of the most well-known families of memory dumpers. In addition
to its memory dumping functionality, Dexter is unique in that it performs
process-injection, logs keystrokes and includes a C&C structure.
The Triforce malware family includes three executables: a memory dumper,
a control binary responsible for persistence (defined as malware’s ability to remain active even after a reboot of the infected system) and a “Perl2Exe” binary that encrypts any discovered
track data. Trustwave first came across the Triforce family in early 2013.
The BlackPOS malware family garnered notoriety in 2013 and originated as a
branch-off from a previous family known as “mmon.” What made BlackPOS novel
was its inclusion of exfiltration and persistence capabilities, which were not
part of the mmon family.
What separates Chewbacca, a memory dumper, from its peers is its ability to
exfiltrate data over the anonymized Tor network. Similar to Dexter, Chewbacca also includes a keylogging component.
This malware arrived late in 2013.
ALInA
OG
TRIPLE ThREAT
BAGGAGE
COmmERCIAL kEYLOGGERS
dExTER
TRIfORCE
BLACkPOS
ChEWBACCA
S E C T I O N 2 : T H R E A T I N T E L L I G E N C E
59
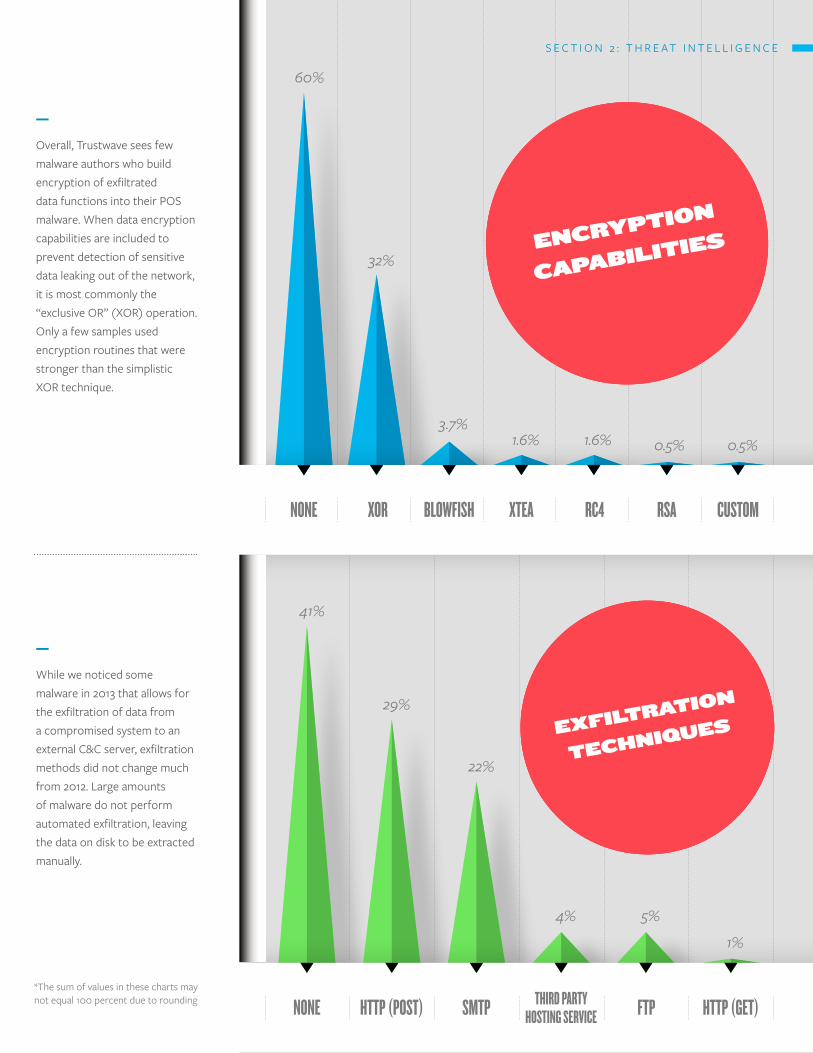
nOnE
nOnE
xOR
hTTP (POST)
BLOWfISh
SmTP
xTEA
ThIRd PARTYhOSTInG SERVICE
RC4
fTP
RSA
hTTP (GET)
CUSTOm
60%
41%
29%
22%
4% 5%
32%
3.7%1.6% 1.6% 0.5% 0.5%
1%
ENCrypTiON
CapabiliTiES
ExfilTraTiON
TEChNiquES
—
Overall, Trustwave sees few malware authors who build encryption of exfiltrated data functions into their POS malware. When data encryption capabilities are included to prevent detection of sensitive data leaking out of the network, it is most commonly the “exclusive OR” (XOR) operation. Only a few samples used encryption routines that were stronger than the simplistic XOR technique.
—
While we noticed some malware in 2013 that allows for the exfiltration of data from a compromised system to an external C&C server, exfiltration methods did not change much from 2012. Large amounts of malware do not perform automated exfiltration, leaving the data on disk to be extracted manually.
*The sum of values in these charts may not equal 100 percent due to rounding
S E C T I O N 2 : T H R E A T I N T E L L I G E N C E
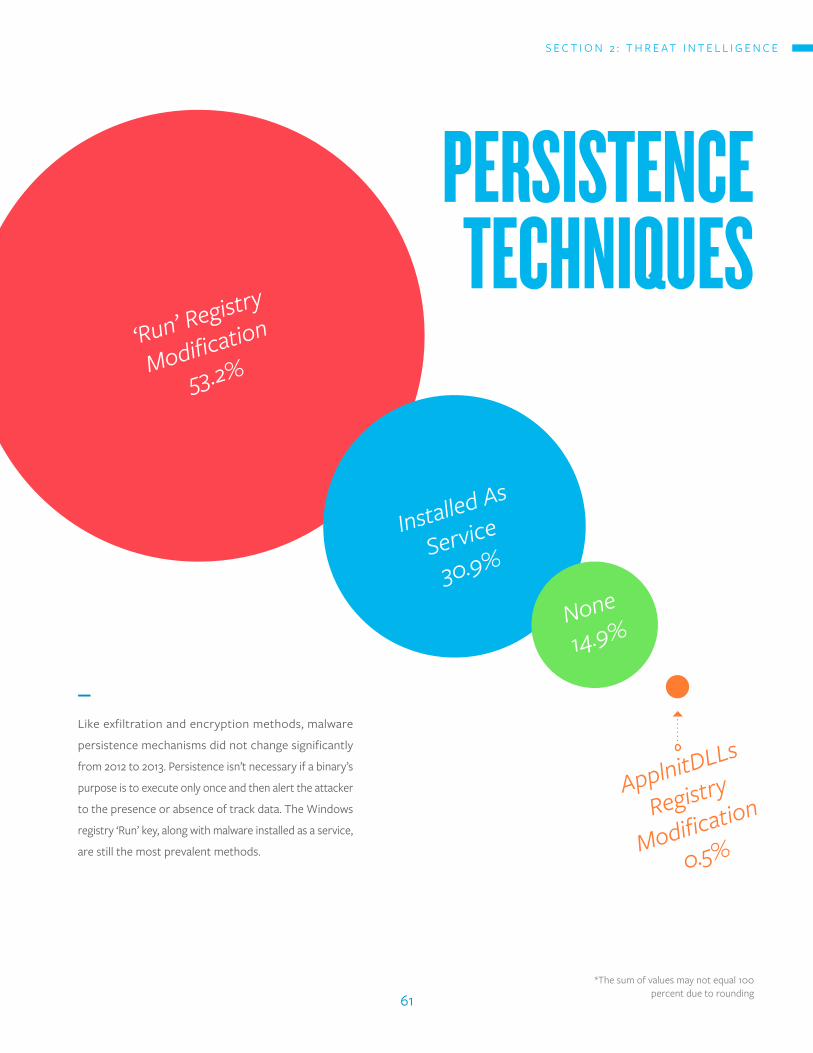
‘Run’ Registry
Modification
53.2%
Installed As
Service
30.9%
None
14.9%
ApplnitDLLs
Registry
Modification
0.5%
PERSISTEnCETEChnIqUES
—
Like exfiltration and encryption methods, malware
persistence mechanisms did not change significantly
from 2012 to 2013. Persistence isn’t necessary if a binary’s
purpose is to execute only once and then alert the attacker
to the presence or absence of track data. The Windows
registry ‘Run’ key, along with malware installed as a service,
are still the most prevalent methods.
*The sum of values may not equal 100 percent due to rounding
S E C T I O N 2 : T H R E A T I N T E L L I G E N C E
61
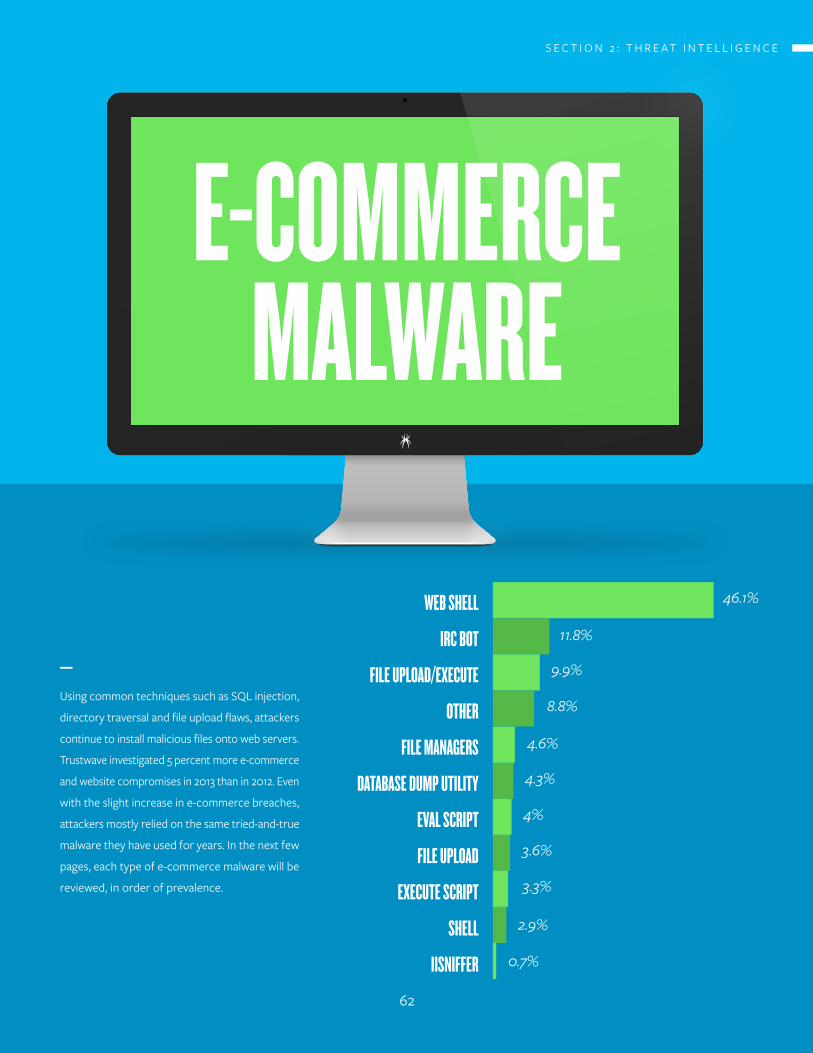
—
Using common techniques such as SQL injection,
directory traversal and file upload flaws, attackers
continue to install malicious files onto web servers.
Trustwave investigated 5 percent more e-commerce
and website compromises in 2013 than in 2012. Even
with the slight increase in e-commerce breaches,
attackers mostly relied on the same tried-and-true
malware they have used for years. In the next few
pages, each type of e-commerce malware will be
reviewed, in order of prevalence.
E-COmmERCEmALWARE
WEB ShELL
IRC BOT
fILE UPLOAd/ExECUTE
OThER
fILE mAnAGERS
dATABASE dUmP UTILITY
EVAL SCRIPT
fILE UPLOAd
ExECUTE SCRIPT
ShELL
IISnIffER
46.1%
8.8%
11.8%
9.9%
4.6%
4.3%
4%
3.6%
2.9%
0.7%
3.3%
S E C T I O N 2 : T H R E A T I N T E L L I G E N C E
62
e-commercemalware
WEB ShELL
IRC BOT
fILE UPLOAd/ExECUTE
fILE mAnAGERS
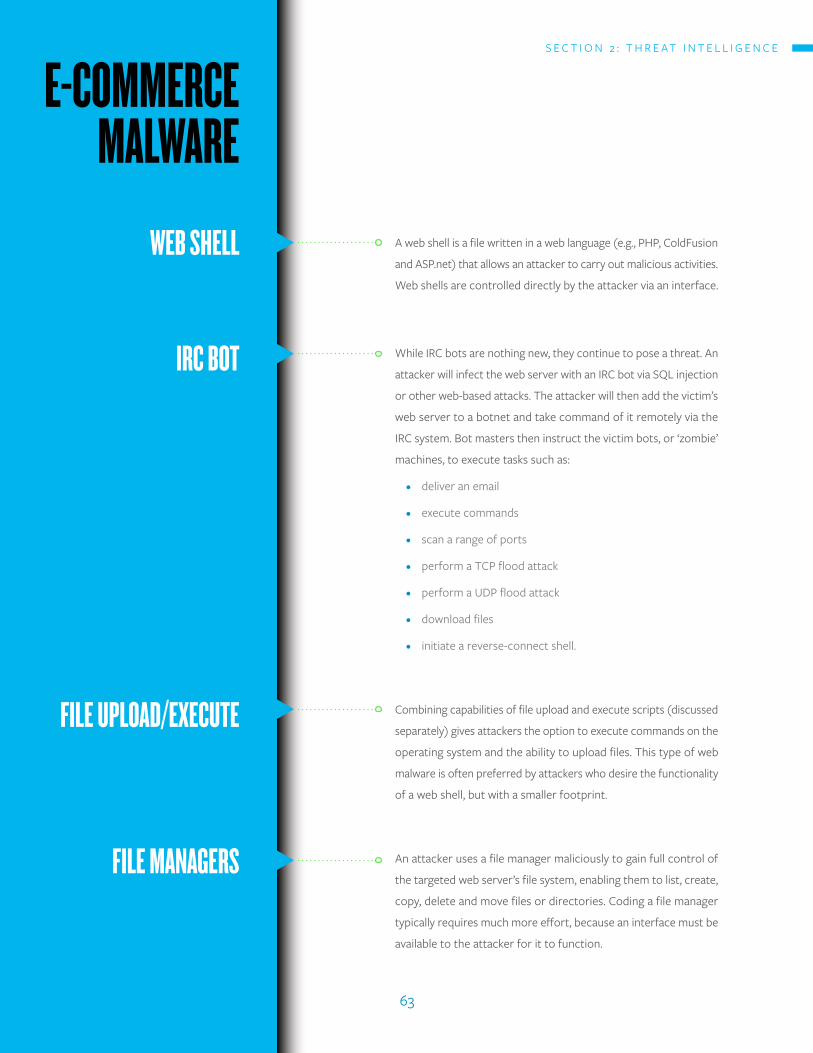
A web shell is a file written in a web language (e.g., PHP, ColdFusion
and ASP.net) that allows an attacker to carry out malicious activities.
Web shells are controlled directly by the attacker via an interface.
While IRC bots are nothing new, they continue to pose a threat. An
attacker will infect the web server with an IRC bot via SQL injection
or other web-based attacks. The attacker will then add the victim’s
web server to a botnet and take command of it remotely via the
IRC system. Bot masters then instruct the victim bots, or ‘zombie’
machines, to execute tasks such as:
deliver an email
execute commands
scan a range of ports
perform a TCP flood attack
perform a UDP flood attack
download files
initiate a reverse-connect shell.
Combining capabilities of file upload and execute scripts (discussed
separately) gives attackers the option to execute commands on the
operating system and the ability to upload files. This type of web
malware is often preferred by attackers who desire the functionality
of a web shell, but with a smaller footprint.
An attacker uses a file manager maliciously to gain full control of
the targeted web server’s file system, enabling them to list, create,
copy, delete and move files or directories. Coding a file manager
typically requires much more effort, because an interface must be
available to the attacker for it to function.
S E C T I O N 2 : T H R E A T I N T E L L I G E N C E
63
dATABASE dUmP UTILITY
EVAL SCRIPT
fILE UPLOAd
ExECUTE SCRIPT
ShELL
IISnIffER
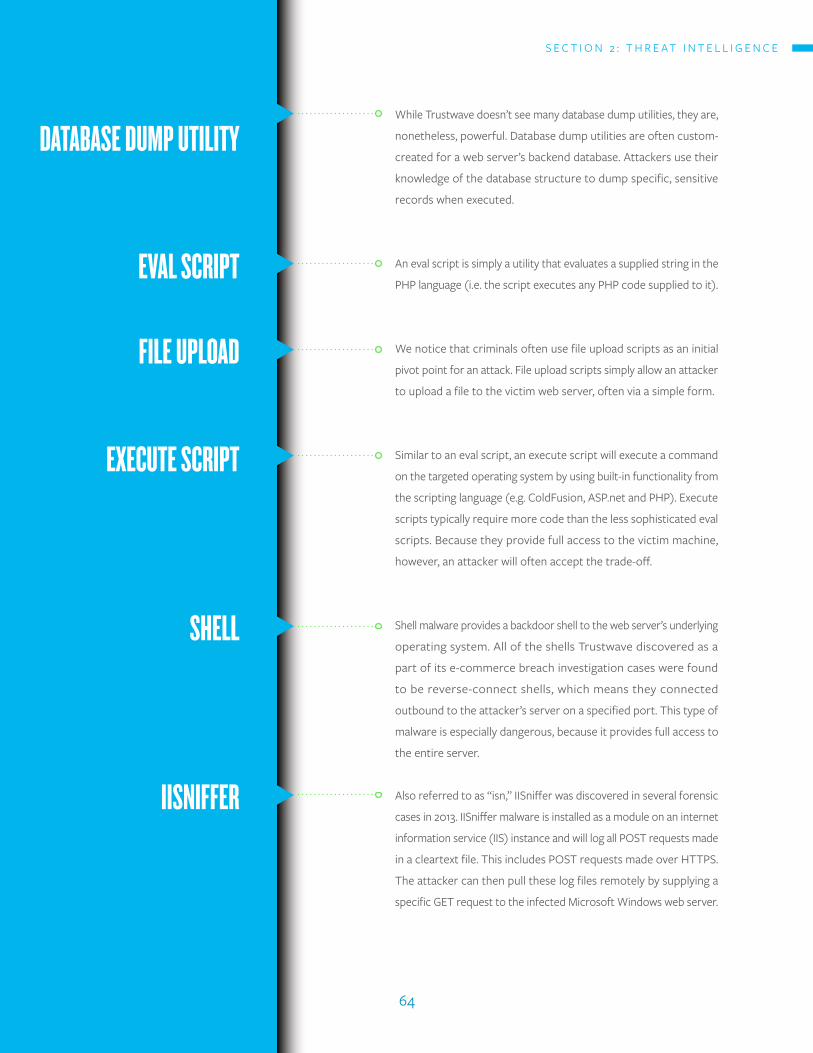
While Trustwave doesn’t see many database dump utilities, they are,
nonetheless, powerful. Database dump utilities are often custom-
created for a web server’s backend database. Attackers use their
knowledge of the database structure to dump specific, sensitive
records when executed.
An eval script is simply a utility that evaluates a supplied string in the
PHP language (i.e. the script executes any PHP code supplied to it).
We notice that criminals often use file upload scripts as an initial
pivot point for an attack. File upload scripts simply allow an attacker
to upload a file to the victim web server, often via a simple form.
Similar to an eval script, an execute script will execute a command
on the targeted operating system by using built-in functionality from
the scripting language (e.g. ColdFusion, ASP.net and PHP). Execute
scripts typically require more code than the less sophisticated eval
scripts. Because they provide full access to the victim machine,
however, an attacker will often accept the trade-off.
Shell malware provides a backdoor shell to the web server’s underlying
operating system. All of the shells Trustwave discovered as a
part of its e-commerce breach investigation cases were found
to be reverse-connect shells, which means they connected
outbound to the attacker’s server on a specified port. This type of
malware is especially dangerous, because it provides full access to
the entire server.
Also referred to as “isn,” IISniffer was discovered in several forensic
cases in 2013. IISniffer malware is installed as a module on an internet
information service (IIS) instance and will log all POST requests made
in a cleartext file. This includes POST requests made over HTTPS.
The attacker can then pull these log files remotely by supplying a
specific GET request to the infected Microsoft Windows web server.
S E C T I O N 2 : T H R E A T I N T E L L I G E N C E
64
—
We’ve seen a number of advances in the evolution of POS
malware this year with a greater emphasis on command and
control. With the prevalence of POS malware families, such
as Dexter and Alina, we expect such trends to continue.
By removing the burden of manual control for this type
of POS malware, attackers have significantly decreased
the cost of obtaining sensitive track data, and we expect
to see continued advances in malware automation. In
terms of malware that targets e-commerce systems,
the most notable development was IISniffer malware,
which evaded detection for a number of months due to
its targeted nature.
aTTaCkErS havE SigNifiCaNTly
dECrEaSEd ThE COST Of ObTaiNiNg SENSiTivE
TraCk daTa.
“
S E C T I O N 2 : T H R E A T I N T E L L I G E N C E
65
POnYBOTnET—
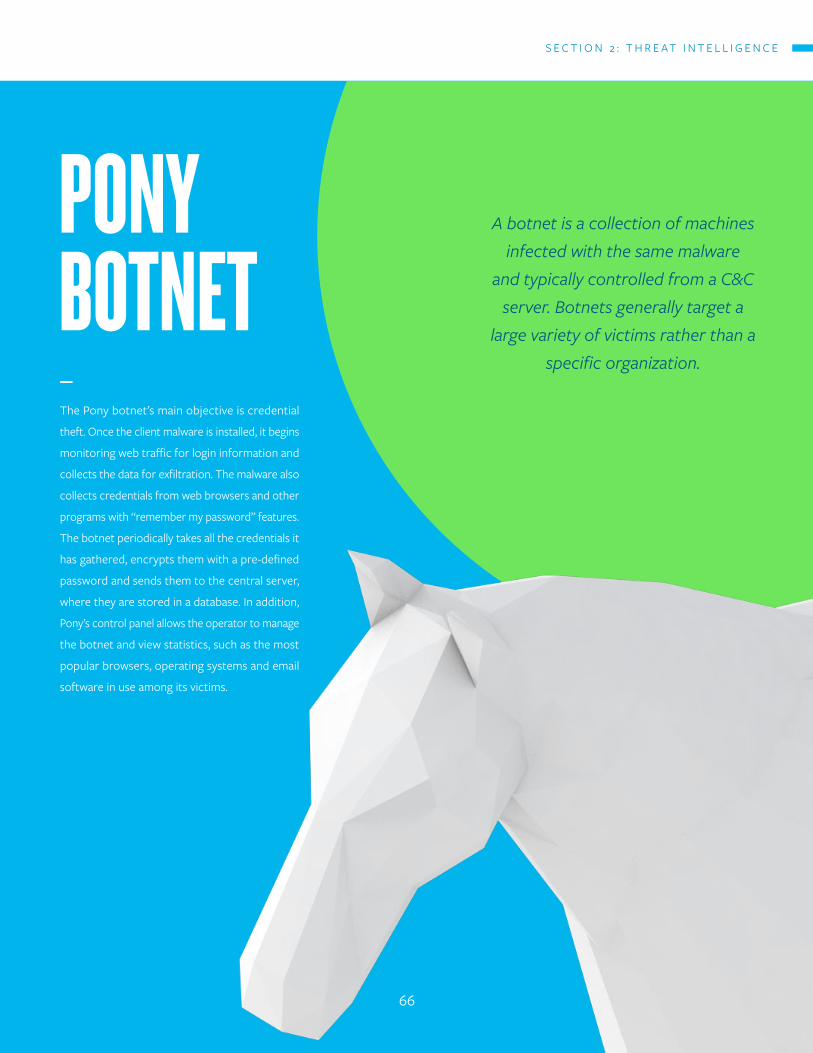
The Pony botnet’s main objective is credential
theft. Once the client malware is installed, it begins
monitoring web traffic for login information and
collects the data for exfiltration. The malware also
collects credentials from web browsers and other
programs with “remember my password” features.
The botnet periodically takes all the credentials it
has gathered, encrypts them with a pre-defined
password and sends them to the central server,
where they are stored in a database. In addition,
Pony’s control panel allows the operator to manage
the botnet and view statistics, such as the most
popular browsers, operating systems and email
software in use among its victims.
A botnet is a collection of machines infected with the same malware
and typically controlled from a C&C server. Botnets generally target a
large variety of victims rather than a specific organization.
S E C T I O N 2 : T H R E A T I N T E L L I G E N C E
66
pony through2013
POnYUPGRAdE
—
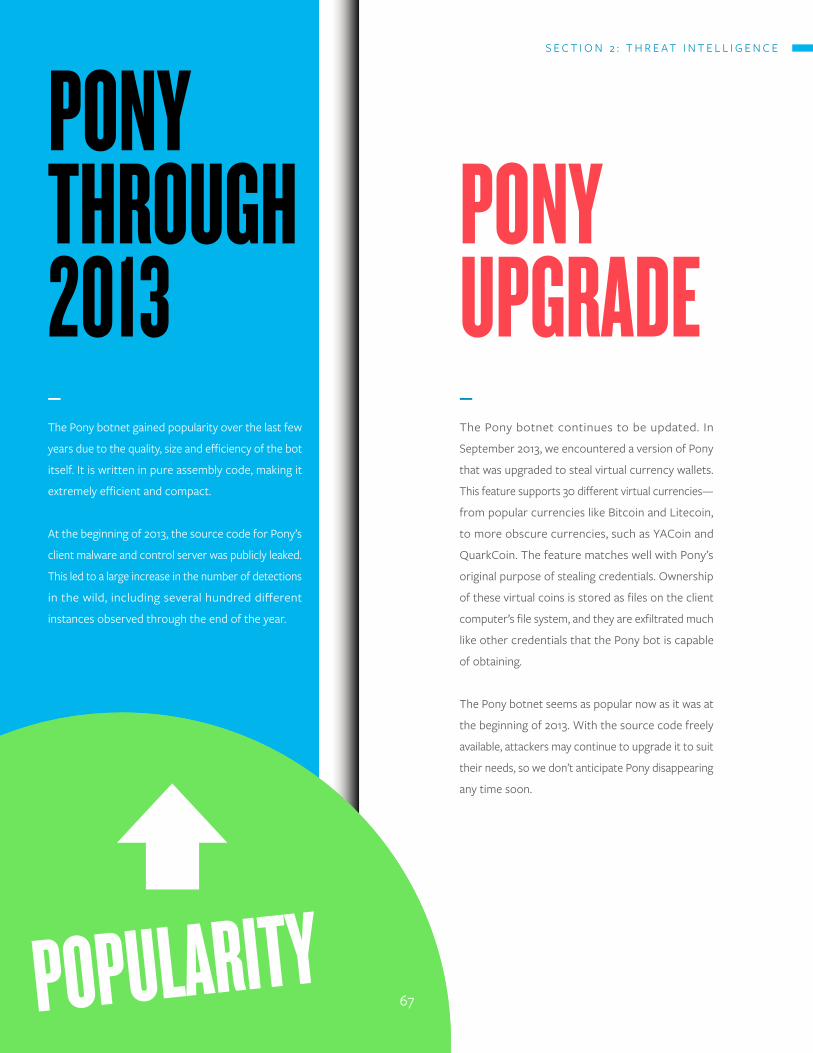
The Pony botnet gained popularity over the last few
years due to the quality, size and efficiency of the bot
itself. It is written in pure assembly code, making it
extremely efficient and compact.
At the beginning of 2013, the source code for Pony’s
client malware and control server was publicly leaked.
This led to a large increase in the number of detections
in the wild, including several hundred different
instances observed through the end of the year.
—
The Pony botnet continues to be updated. In
September 2013, we encountered a version of Pony
that was upgraded to steal virtual currency wallets.
This feature supports 30 different virtual currencies—
from popular currencies like Bitcoin and Litecoin,
to more obscure currencies, such as YACoin and
QuarkCoin. The feature matches well with Pony’s
original purpose of stealing credentials. Ownership
of these virtual coins is stored as files on the client
computer’s file system, and they are exfiltrated much
like other credentials that the Pony bot is capable
of obtaining.
The Pony botnet seems as popular now as it was at
the beginning of 2013. With the source code freely
available, attackers may continue to upgrade it to suit
their needs, so we don’t anticipate Pony disappearing
any time soon.
POPULARITY
S E C T I O N 2 : T H R E A T I N T E L L I G E N C E
67
POnY BOTnET PASSWORd AnALYSIS
TOp
15
paSSwOrdS
—
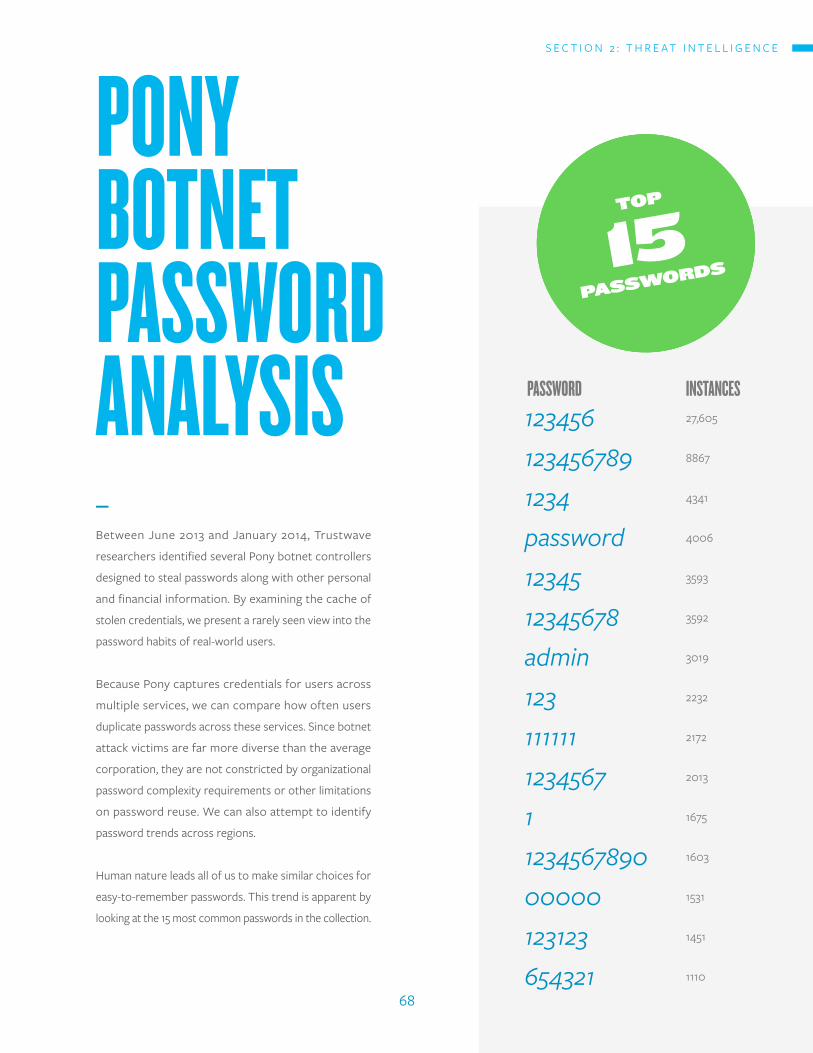
Between June 2013 and January 2014, Trustwave
researchers identified several Pony botnet controllers
designed to steal passwords along with other personal
and financial information. By examining the cache of
stolen credentials, we present a rarely seen view into the
password habits of real-world users.
Because Pony captures credentials for users across
multiple services, we can compare how often users
duplicate passwords across these services. Since botnet
attack victims are far more diverse than the average
corporation, they are not constricted by organizational
password complexity requirements or other limitations
on password reuse. We can also attempt to identify
password trends across regions.
Human nature leads all of us to make similar choices for
easy-to-remember passwords. This trend is apparent by
looking at the 15 most common passwords in the collection.
1234561234567891234password1234512345678admin12311111112345671123456789000000123123654321
27,605
8867
4341
4006
3593
3592
3019
2232
2172
2013
1675
1603
1531
1451
1110
password instances
S E C T I O N 2 : T H R E A T I N T E L L I G E N C E
68
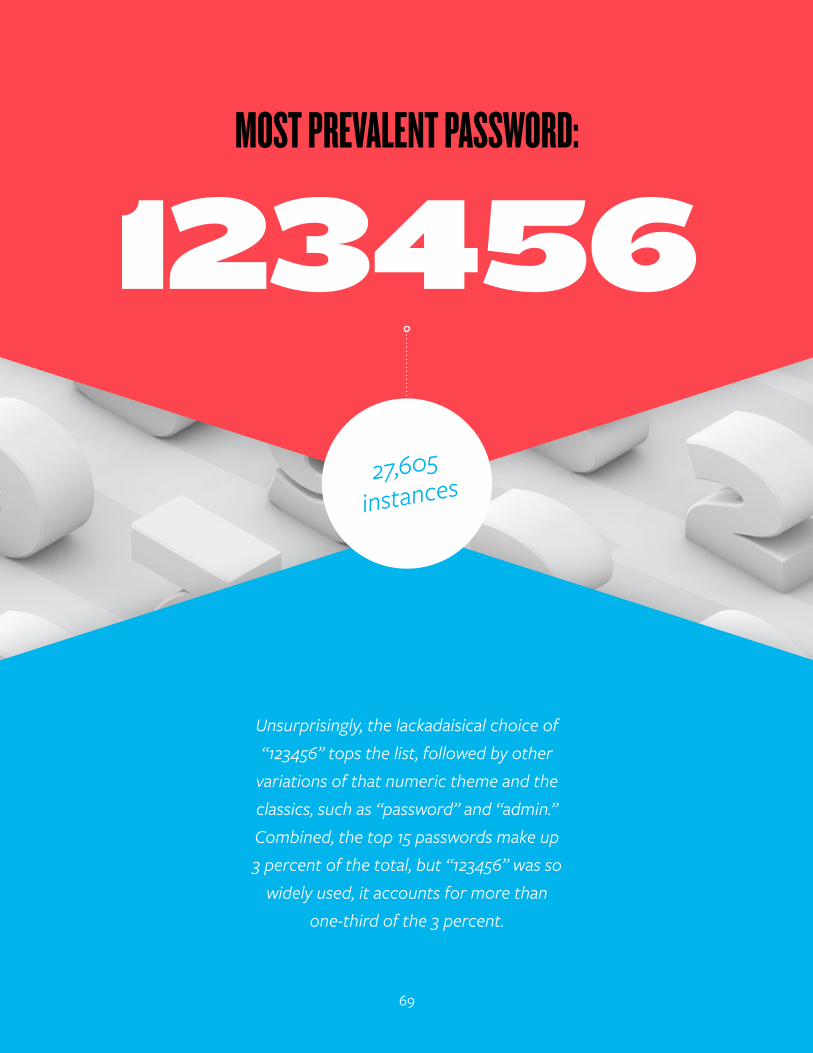
123456MOST PREVALENT PASSWORD:
27,605
instances
Unsurprisingly, the lackadaisical choice of “123456” tops the list, followed by other
variations of that numeric theme and the classics, such as “password” and “admin.” Combined, the top 15 passwords make up 3 percent of the total, but “123456” was so
widely used, it accounts for more than one-third of the 3 percent.
69
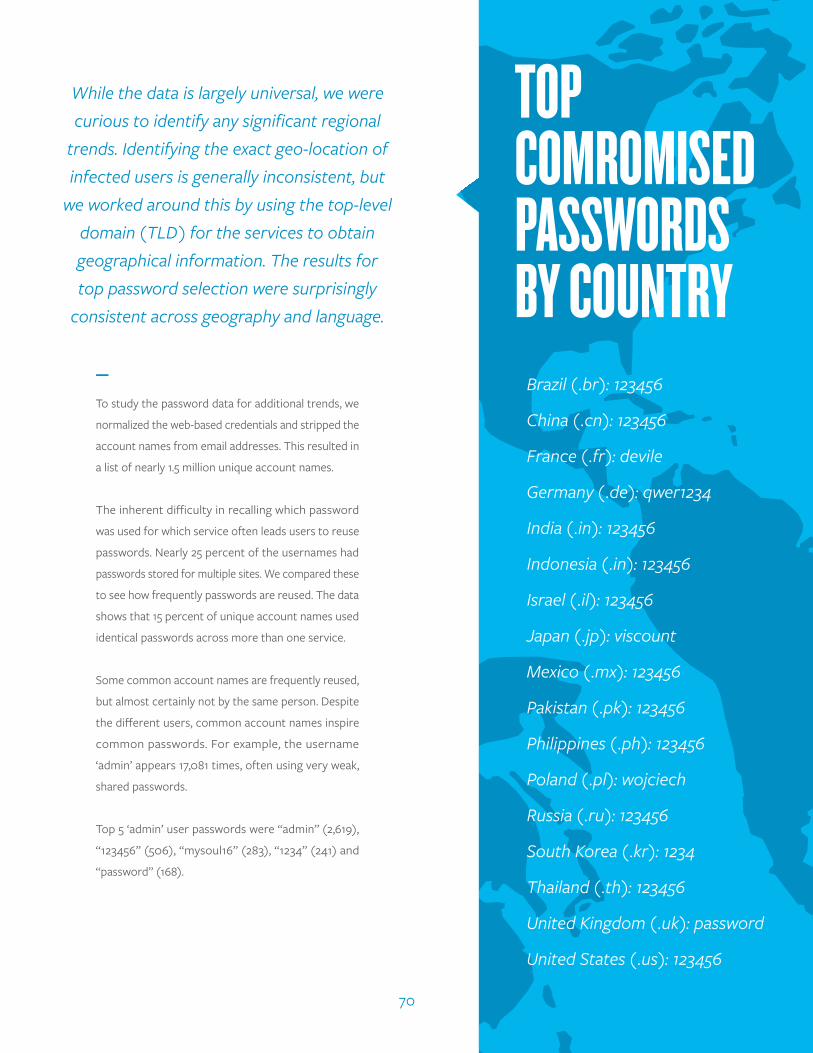
TOP COmROmISEdPASSWORdS BY COUnTRY
While the data is largely universal, we were curious to identify any significant regional
trends. Identifying the exact geo-location of infected users is generally inconsistent, but
we worked around this by using the top-level domain (TLD) for the services to obtain geographical information. The results for top password selection were surprisingly
consistent across geography and language.
—
To study the password data for additional trends, we
normalized the web-based credentials and stripped the
account names from email addresses. This resulted in
a list of nearly 1.5 million unique account names.
The inherent difficulty in recalling which password
was used for which service often leads users to reuse
passwords. Nearly 25 percent of the usernames had
passwords stored for multiple sites. We compared these
to see how frequently passwords are reused. The data
shows that 15 percent of unique account names used
identical passwords across more than one service.
Some common account names are frequently reused,
but almost certainly not by the same person. Despite
the different users, common account names inspire
common passwords. For example, the username
‘admin’ appears 17,081 times, often using very weak,
shared passwords.
Top 5 ‘admin’ user passwords were “admin” (2,619),
“123456” (506), “mysoul16” (283), “1234” (241) and
“password” (168).
Brazil ( .br): 123456
China ( .cn): 123456
France ( .fr): devile
Germany ( .de): qwer1234
India ( .in): 123456
Indonesia ( .in): 123456
Israel ( .il): 123456
Japan ( .jp): viscount
Mexico ( .mx): 123456
Pakistan ( .pk): 123456
Philippines ( .ph): 123456
Poland ( .pl): wojciech
Russia ( .ru): 123456
South Korea ( .kr): 1234
Thailand ( .th): 123456
United Kingdom ( .uk): password
United States ( .us): 123456
70
InTRUSIOn dETECTIOn SYSTEm ALERTS AnALYSIS
—
Active malware, exploit attempts and automated
vulnerability and port scanners generated many alerts
from Trustwave Managed IDS sensors in 2013. While
not every alert is an indication of a threat, an analysis
of these alerts provides insight into the types of threats
organizations see on a daily basis. The following analysis
is based on a sample of more than 10,000 IDS alerts
generated in the third quarter of 2013.
Typical attacks observed by IDS include exploit attempts
against common network-based services, such as File
Transfer Protocol (FTP), Remote Desktop Protocol
(RDP), Server Message Block Protocol (SMB) and Simple
Network Management Protocol (SNMP).
Web applications also serve as popular attack vectors
that are often exploited via web-based attacks, such as
SQL injection (SQLi), cross-site scripting (XSS), known
vulnerable web software components and sensitive
data disclosure.
71
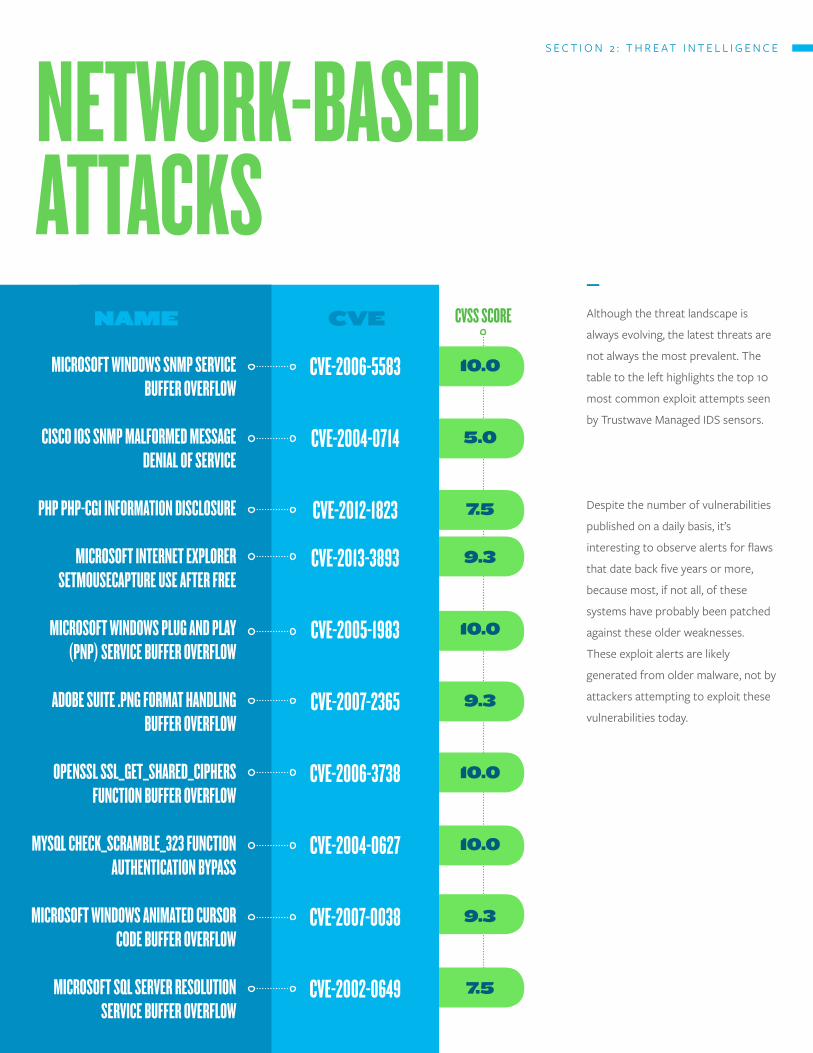
CVSS SCORE
mICROSOfT WIndOWS SnmP SERVICE BUffER OVERfLOW
CISCO IOS SnmP mALfORmEd mESSAGE dEnIAL Of SERVICE
PhP PhP-CGI InfORmATIOn dISCLOSURE
mICROSOfT InTERnET ExPLORER SETmOUSECAPTURE USE AfTER fREE
mICROSOfT WIndOWS PLUG And PLAY (PnP) SERVICE BUffER OVERfLOW
AdOBE SUITE .PnG fORmAT hAndLInG BUffER OVERfLOW
OPEnSSL SSL_GET_ShAREd_CIPhERS fUnCTIOn BUffER OVERfLOW
mYSqL ChECk_SCRAmBLE_323 fUnCTIOn AUThEnTICATIOn BYPASS
mICROSOfT WIndOWS AnImATEd CURSOR COdE BUffER OVERfLOW
mICROSOfT SqL SERVER RESOLUTIOn SERVICE BUffER OVERfLOW
CVE-2006-5583
CVE-2004-0714
CVE-2012-1823
CVE-2013-3893
CVE-2005-1983
CVE-2007-2365
CVE-2006-3738
CVE-2004-0627
CVE-2007-0038
CVE-2002-0649
10.0
5.0
7.5
9.3
10.0
9.3
10.0
10.0
9.3
7.5
CvENamE
nETWORk-BASEd ATTACkS
—
Although the threat landscape is
always evolving, the latest threats are
not always the most prevalent. The
table to the left highlights the top 10
most common exploit attempts seen
by Trustwave Managed IDS sensors.
Despite the number of vulnerabilities
published on a daily basis, it’s
interesting to observe alerts for flaws
that date back five years or more,
because most, if not all, of these
systems have probably been patched
against these older weaknesses.
These exploit alerts are likely
generated from older malware, not by
attackers attempting to exploit these
vulnerabilities today.
S E C T I O N 2 : T H R E A T I N T E L L I G E N C E
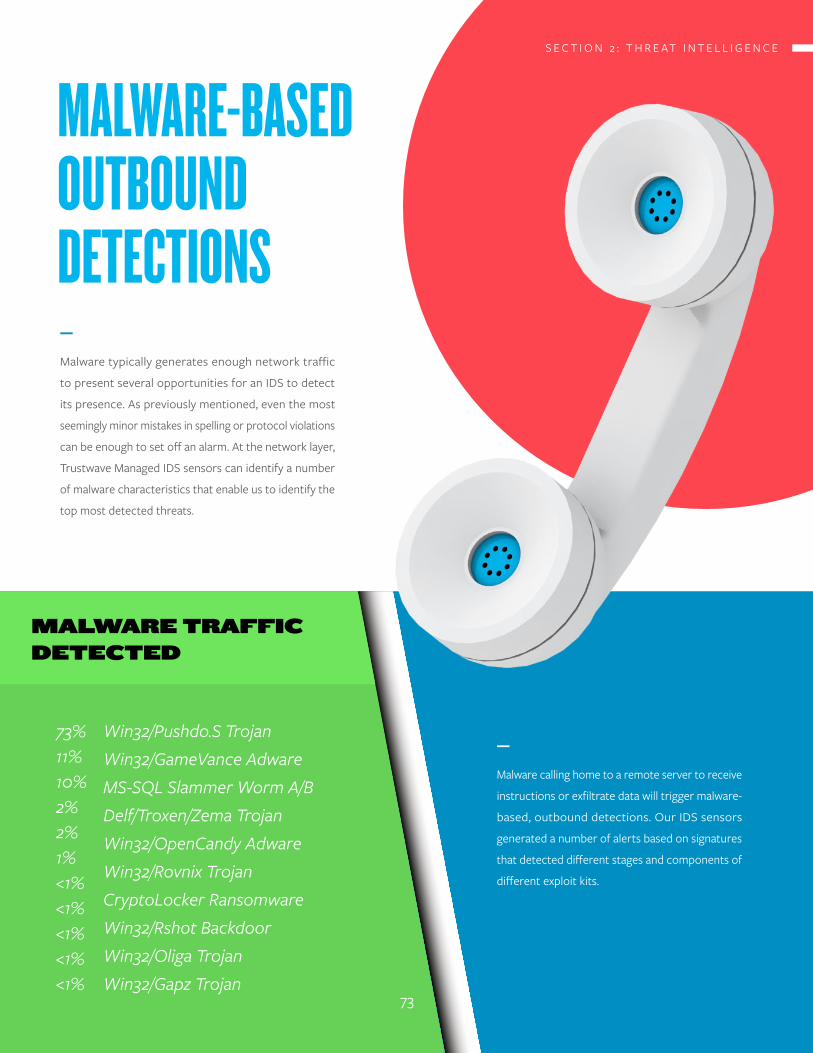
mALWARE-BASEd OUTBOUnd dETECTIOnS
—
Malware calling home to a remote server to receive
instructions or exfiltrate data will trigger malware-
based, outbound detections. Our IDS sensors
generated a number of alerts based on signatures
that detected different stages and components of
different exploit kits.
—
Malware typically generates enough network traffic
to present several opportunities for an IDS to detect
its presence. As previously mentioned, even the most
seemingly minor mistakes in spelling or protocol violations
can be enough to set off an alarm. At the network layer,
Trustwave Managed IDS sensors can identify a number
of malware characteristics that enable us to identify the
top most detected threats.
malware trafficdetected
Win32/Pushdo.S TrojanWin32/GameVance AdwareMS-SQL Slammer Worm A/BDelf/Troxen/Zema TrojanWin32/OpenCandy AdwareWin32/Rovnix TrojanCryptoLocker RansomwareWin32/Rshot BackdoorWin32/Oliga TrojanWin32/Gapz Trojan
73%11%10%2%2%1%<1%<1%<1%<1%<1%
S E C T I O N 2 : T H R E A T I N T E L L I G E N C E
73
SPAm & EmAIL ThREATSEmailEmail’s ubiquity ensures that it remains a perennial
favorite for attackers to distribute their wares. Last
year, we saw an ongoing range of both mass and
targeted attacks distributed via email.
Spam remains at relatively low levels, but still represents 70 percent of inbound email
One in 23 spam messages is malicious
One in 38 spam messages contains a malicious attachment
Mass-spammed data-stealing malware families were rampant in 2013
Email remains a popular way of infiltrating networks in targeted attacks
kEy
pOiNTS
S E C T I O N 2 : T H R E A T I N T E L L I G E N C E
74
JAn 2
009
APR 2
009
JUL 2
009
OCT 2
009
JAn 2
010
APR 2
010
JUL 2
01O
OCT 2
010
JAn 2
011
APR 2
011
JUL 2
011
OCT 2
011
JAn 2
012
APR 2
012
JUL 2
012
OCT 2
012
JAn 2
013
APR 2
013
JUL 2
013
OCT 2
013
2500
2000
1500
1000
500
0
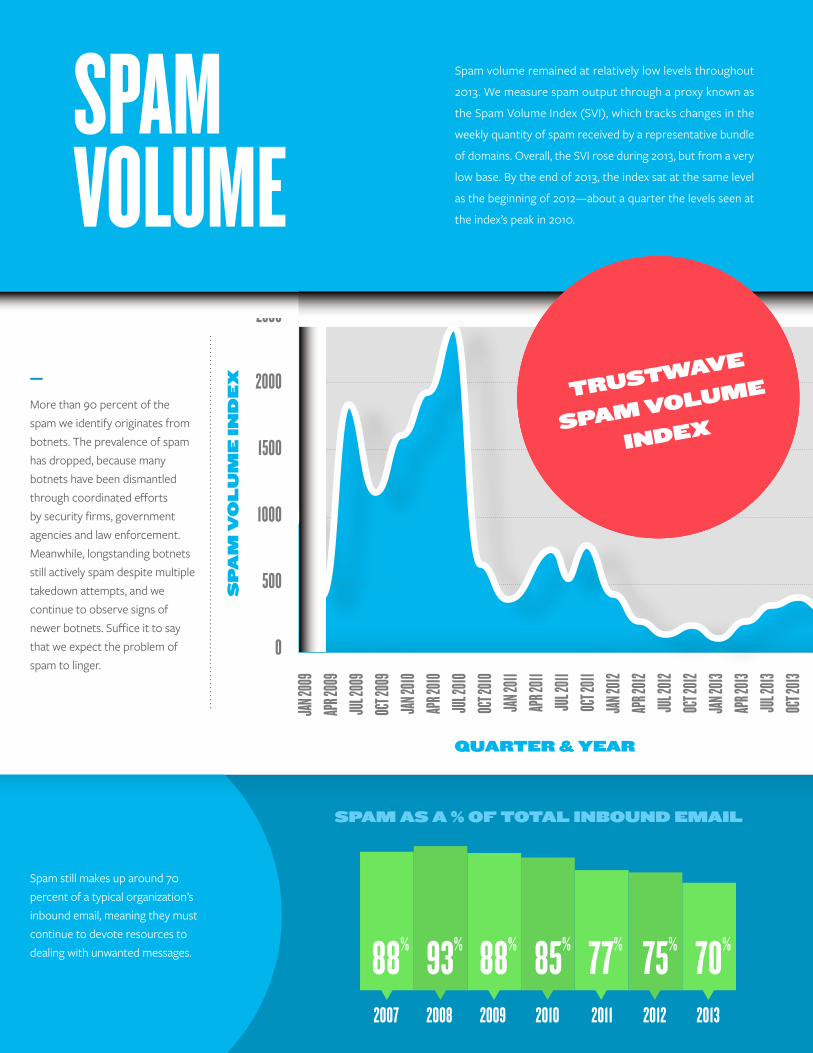
2007 2008 2009 2010 2011 2012 2013
quarTEr & yEar
Spam aS a % Of TOTal iNbOuNd Email
Sp
am
vO
lu
mE
iN
dE
x
SPAm VOLUmE
Spam volume remained at relatively low levels throughout
2013. We measure spam output through a proxy known as
the Spam Volume Index (SVI), which tracks changes in the
weekly quantity of spam received by a representative bundle
of domains. Overall, the SVI rose during 2013, but from a very
low base. By the end of 2013, the index sat at the same level
as the beginning of 2012—about a quarter the levels seen at
the index’s peak in 2010.
—
More than 90 percent of the spam we identify originates from botnets. The prevalence of spam has dropped, because many botnets have been dismantled through coordinated efforts by security firms, government agencies and law enforcement. Meanwhile, longstanding botnets still actively spam despite multiple takedown attempts, and we continue to observe signs of newer botnets. Suffice it to say that we expect the problem of spam to linger.
Spam still makes up around 70 percent of a typical organization’s inbound email, meaning they must continue to devote resources to dealing with unwanted messages.
TruSTwavE
Spam vOlumE
iNdEx
88% 93% 88% 85% 77% 75% 70%
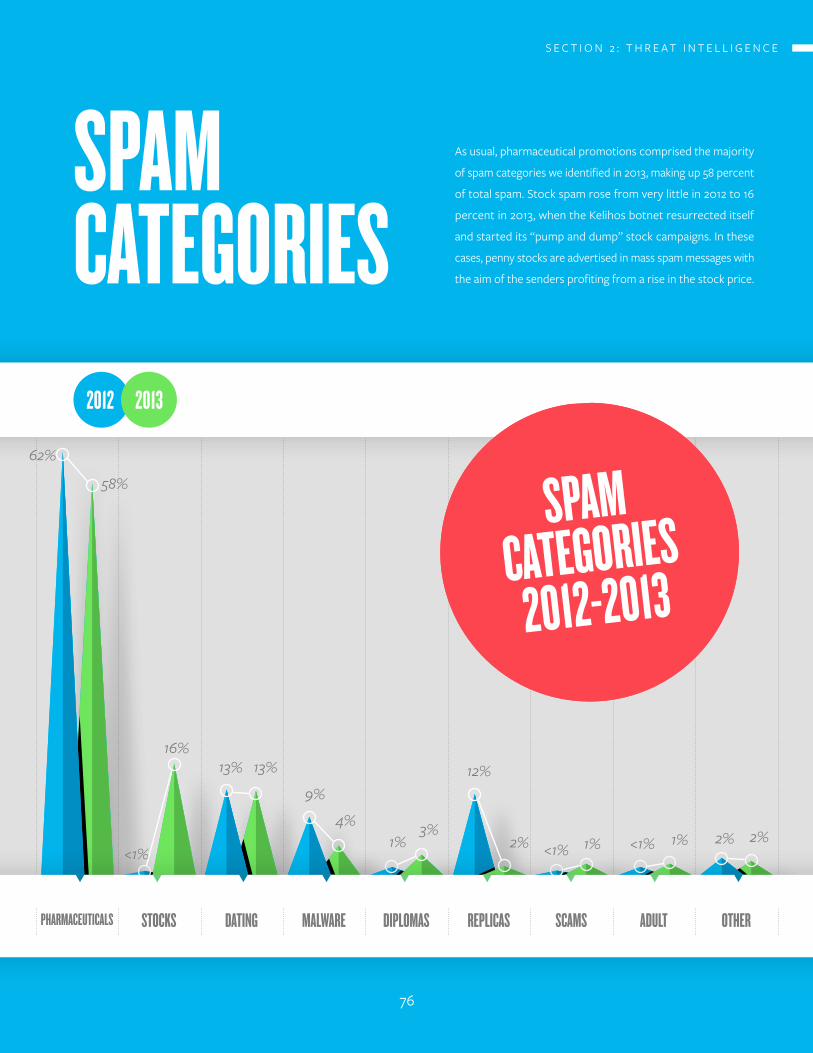
2012 2013
SPAm CATEGORIES
2012-2013
PhARmACEUTICALS STOCkS dATInG mALWARE dIPLOmAS REPLICAS SCAmS AdULT OThER
62%
58%
16%
<1%
13% 13%
9%
4%1%
3%
12%
2% 1%<1% <1% 1% 2% 2%
SPAm CATEGORIES
As usual, pharmaceutical promotions comprised the majority
of spam categories we identified in 2013, making up 58 percent
of total spam. Stock spam rose from very little in 2012 to 16
percent in 2013, when the Kelihos botnet resurrected itself
and started its “pump and dump” stock campaigns. In these
cases, penny stocks are advertised in mass spam messages with
the aim of the senders profiting from a rise in the stock price.
S E C T I O N 2 : T H R E A T I N T E L L I G E N C E
76
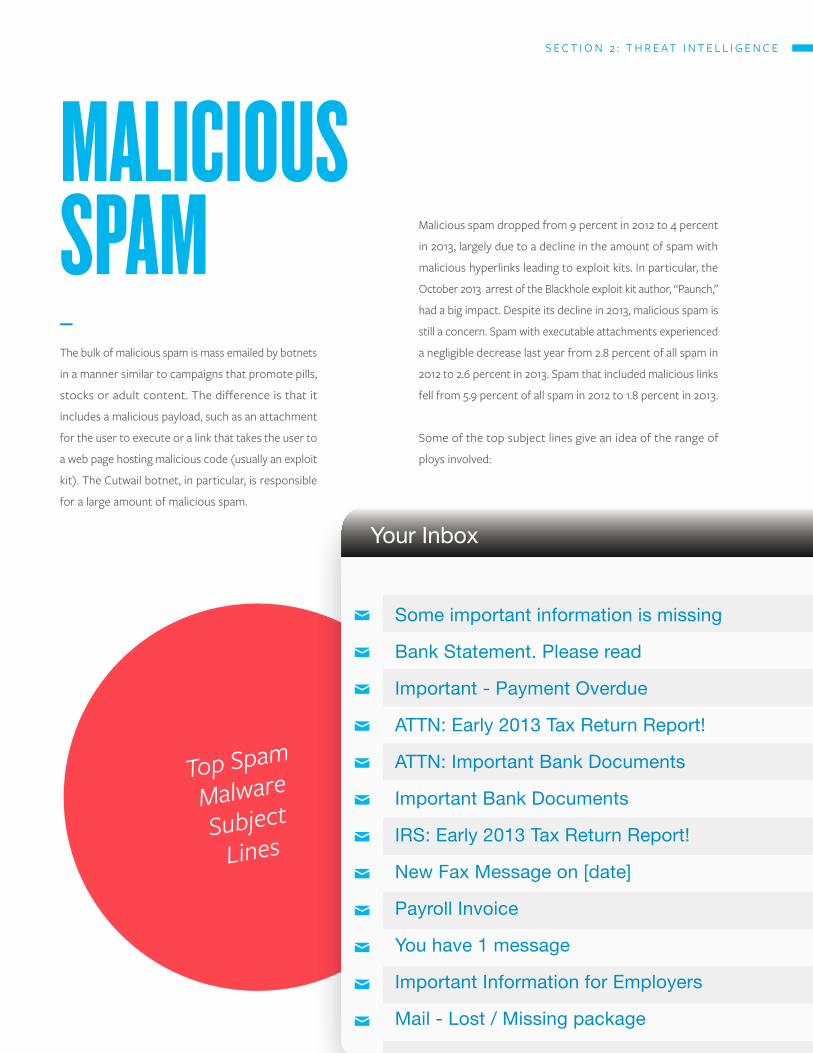
Top Spam
Malware
Subject
Lines
Your Inbox
Some important information is missing
Bank Statement. Please read
Important - Payment Overdue
ATTN: Early 2013 Tax Return Report!
ATTN: Important Bank Documents
Important Bank Documents
IRS: Early 2013 Tax Return Report!
New Fax Message on [date]
Payroll Invoice
You have 1 message
Important Information for Employers
Mail - Lost / Missing package
mALICIOUSSPAm Malicious spam dropped from 9 percent in 2012 to 4 percent
in 2013, largely due to a decline in the amount of spam with
malicious hyperlinks leading to exploit kits. In particular, the
October 2013 arrest of the Blackhole exploit kit author, “Paunch,”
had a big impact. Despite its decline in 2013, malicious spam is
still a concern. Spam with executable attachments experienced
a negligible decrease last year from 2.8 percent of all spam in
2012 to 2.6 percent in 2013. Spam that included malicious links
fell from 5.9 percent of all spam in 2012 to 1.8 percent in 2013.
Some of the top subject lines give an idea of the range of
ploys involved:
—
The bulk of malicious spam is mass emailed by botnets
in a manner similar to campaigns that promote pills,
stocks or adult content. The difference is that it
includes a malicious payload, such as an attachment
for the user to execute or a link that takes the user to
a web page hosting malicious code (usually an exploit
kit). The Cutwail botnet, in particular, is responsible
for a large amount of malicious spam.
S E C T I O N 2 : T H R E A T I N T E L L I G E N C E
In terms of malicious spam alone, 59 percent includes attachments and 41 percent includes links. Throughout 2013, Trustwave performed many mock spear phishing attacks for clients. These revealed that, on average, 33 percent of victims opened the email and clicked on the
targeted link. Of those that opened the email, 80 percent used their corporate credentials to
log in to the fraudulent site.
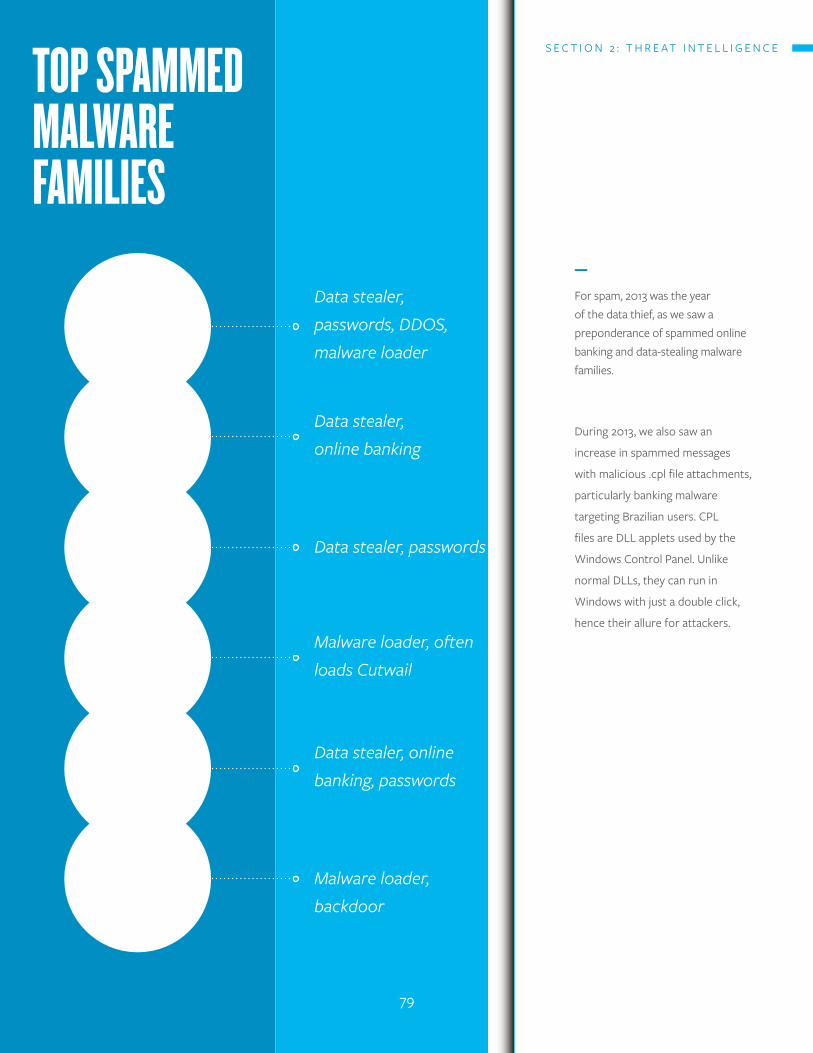
TOP SPAmmEd mALWARE fAmILIES
POnY
BUBLIk
TEPfER
PUShdO
zEUS/zBOT
AndROmEdA/GAmARUE
Data stealer, passwords, DDOS, malware loader
Data stealer, online banking
Data stealer, passwords
Malware loader, often loads Cutwail
Data stealer, online banking, passwords
Malware loader, backdoor
—
For spam, 2013 was the year of the data thief, as we saw a preponderance of spammed online banking and data-stealing malware families.
During 2013, we also saw an
increase in spammed messages
with malicious .cpl file attachments,
particularly banking malware
targeting Brazilian users. CPL
files are DLL applets used by the
Windows Control Panel. Unlike
normal DLLs, they can run in
Windows with just a double click,
hence their allure for attackers.
S E C T I O N 2 : T H R E A T I N T E L L I G E N C E
79
InTERnAL & ExTERnAL VULnERABILITY SCAn AnALYSIS
Based on a sample of scans conducted by the TrustKeeper Scan Engine, Trustwave
determined the top vulnerabilities by combining their risk with their frequency of
observation.
S E C T I O N 2 : T H R E A T I N T E L L I G E N C E
80
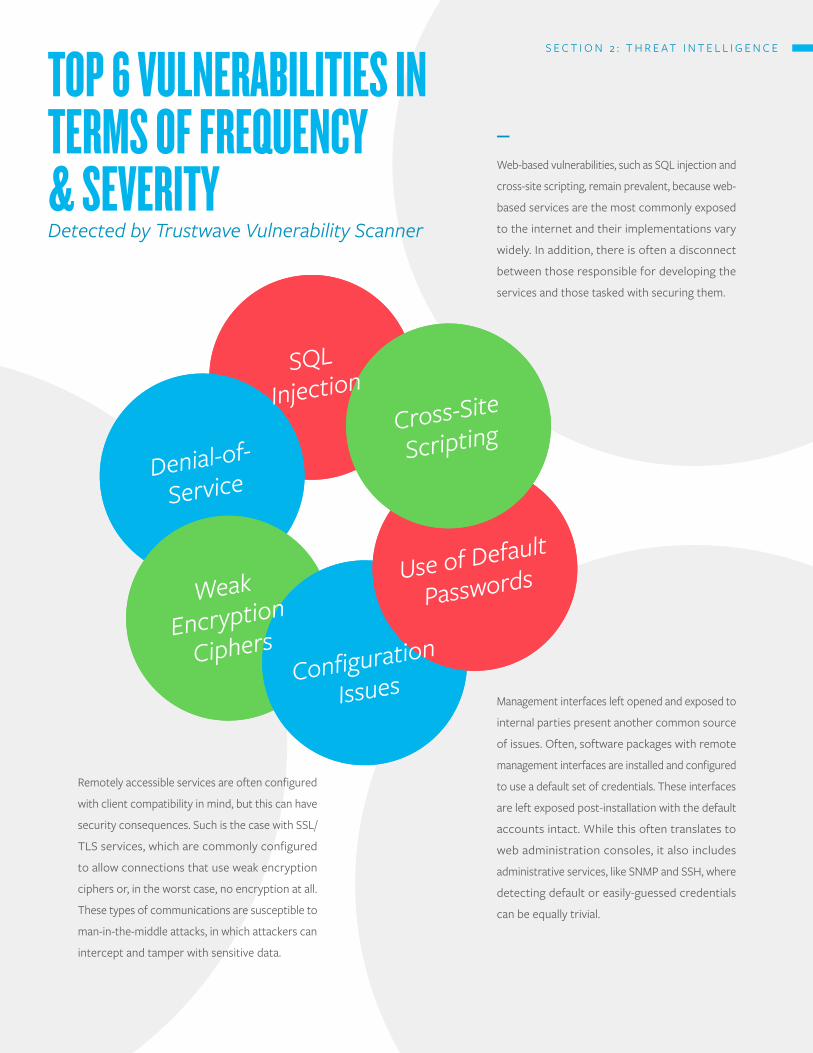
SQLInjection
Cross-Site
Scripting
Use of Default
Passwords
Configuration
Issues
Denial-of-
Service
Weak
Encryption
Ciphers
—
Web-based vulnerabilities, such as SQL injection and
cross-site scripting, remain prevalent, because web-
based services are the most commonly exposed
to the internet and their implementations vary
widely. In addition, there is often a disconnect
between those responsible for developing the
services and those tasked with securing them.
Management interfaces left opened and exposed to
internal parties present another common source
of issues. Often, software packages with remote
management interfaces are installed and configured
to use a default set of credentials. These interfaces
are left exposed post-installation with the default
accounts intact. While this often translates to
web administration consoles, it also includes
administrative services, like SNMP and SSH, where
detecting default or easily-guessed credentials
can be equally trivial.
Remotely accessible services are often configured
with client compatibility in mind, but this can have
security consequences. Such is the case with SSL/
TLS services, which are commonly configured
to allow connections that use weak encryption
ciphers or, in the worst case, no encryption at all.
These types of communications are susceptible to
man-in-the-middle attacks, in which attackers can
intercept and tamper with sensitive data.
TOP 6 VULnERABILITIES In TERmS Of fREqUEnCY & SEVERITYDetected by Trustwave Vulnerability Scanner
S E C T I O N 2 : T H R E A T I N T E L L I G E N C E
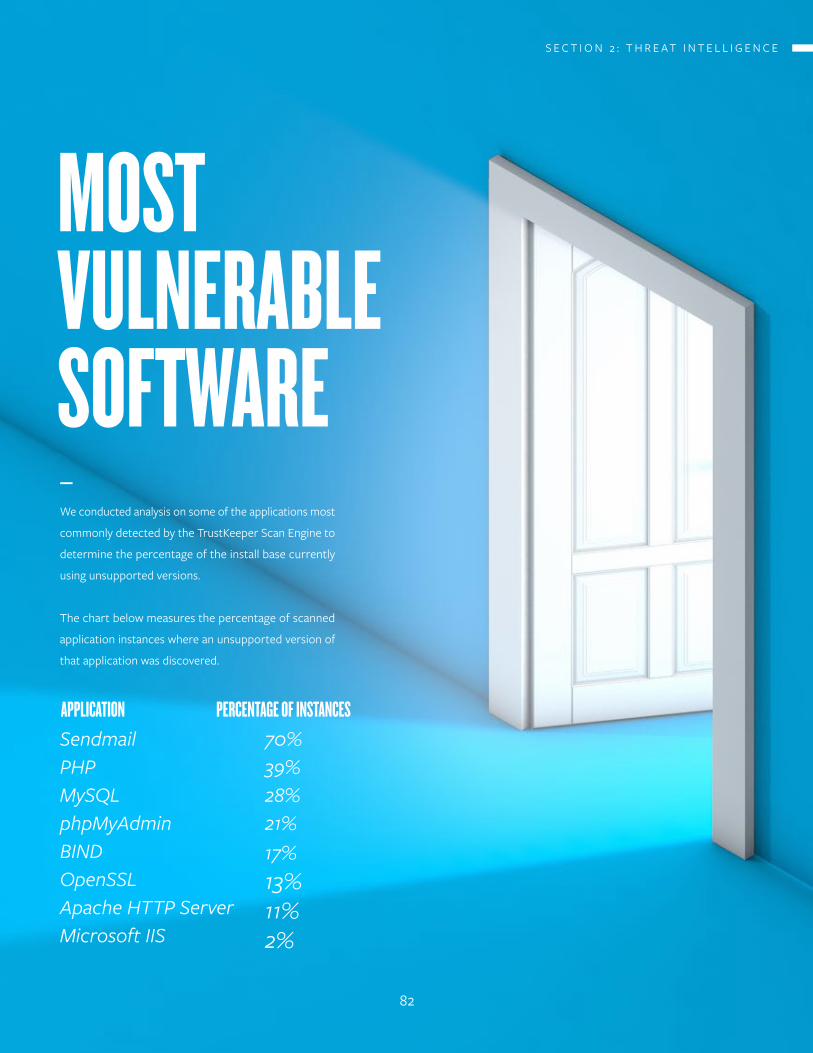
mOST VULnERABLE SOfTWARE—
We conducted analysis on some of the applications most
commonly detected by the TrustKeeper Scan Engine to
determine the percentage of the install base currently
using unsupported versions.
The chart below measures the percentage of scanned
application instances where an unsupported version of
that application was discovered.
SendmailPHPMySQLphpMyAdminBINDOpenSSLApache HTTP ServerMicrosoft IIS
70%39%28%21%17%13%11%2%
APPLICATIOn PERCEnTAGE Of InSTAnCES
S E C T I O N 2 : T H R E A T I N T E L L I G E N C E
82
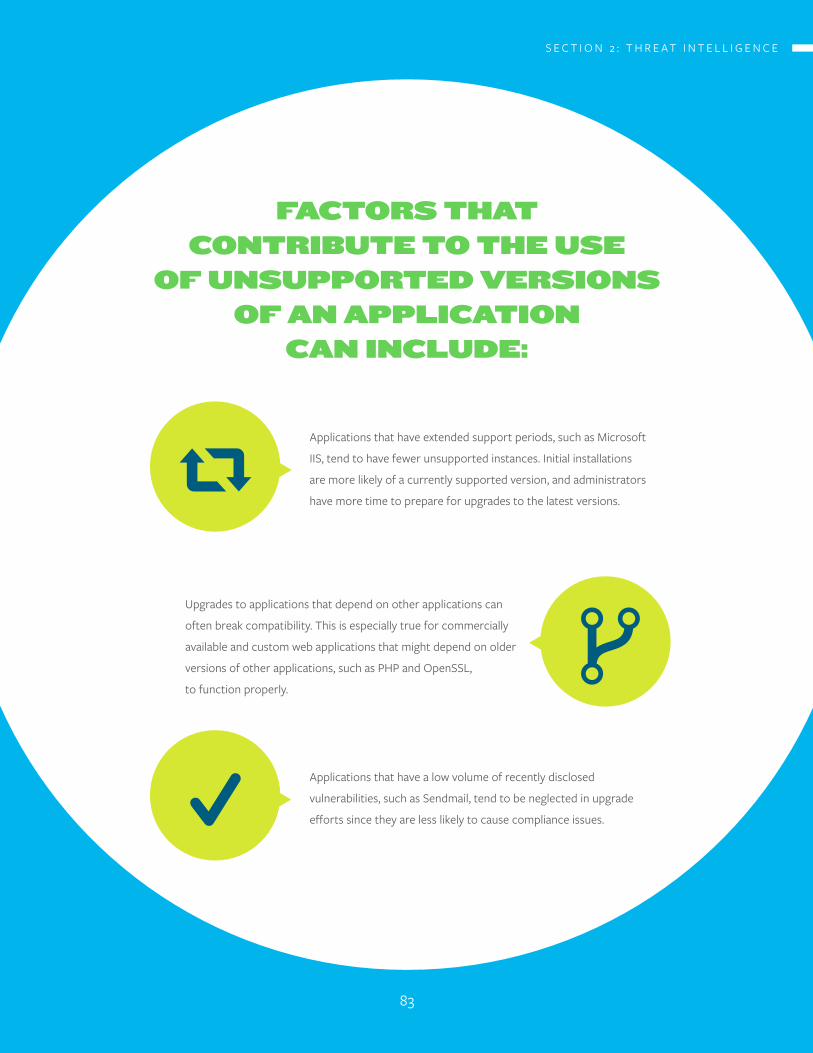
faCTOrS ThaT CONTribuTE TO ThE uSE
Of uNSuppOrTEd vErSiONS Of aN appliCaTiON
CaN iNCludE:
Applications that have extended support periods, such as Microsoft
IIS, tend to have fewer unsupported instances. Initial installations
are more likely of a currently supported version, and administrators
have more time to prepare for upgrades to the latest versions.
Upgrades to applications that depend on other applications can
often break compatibility. This is especially true for commercially
available and custom web applications that might depend on older
versions of other applications, such as PHP and OpenSSL,
to function properly.
Applications that have a low volume of recently disclosed
vulnerabilities, such as Sendmail, tend to be neglected in upgrade
efforts since they are less likely to cause compliance issues.
S E C T I O N 2 : T H R E A T I N T E L L I G E N C E
83
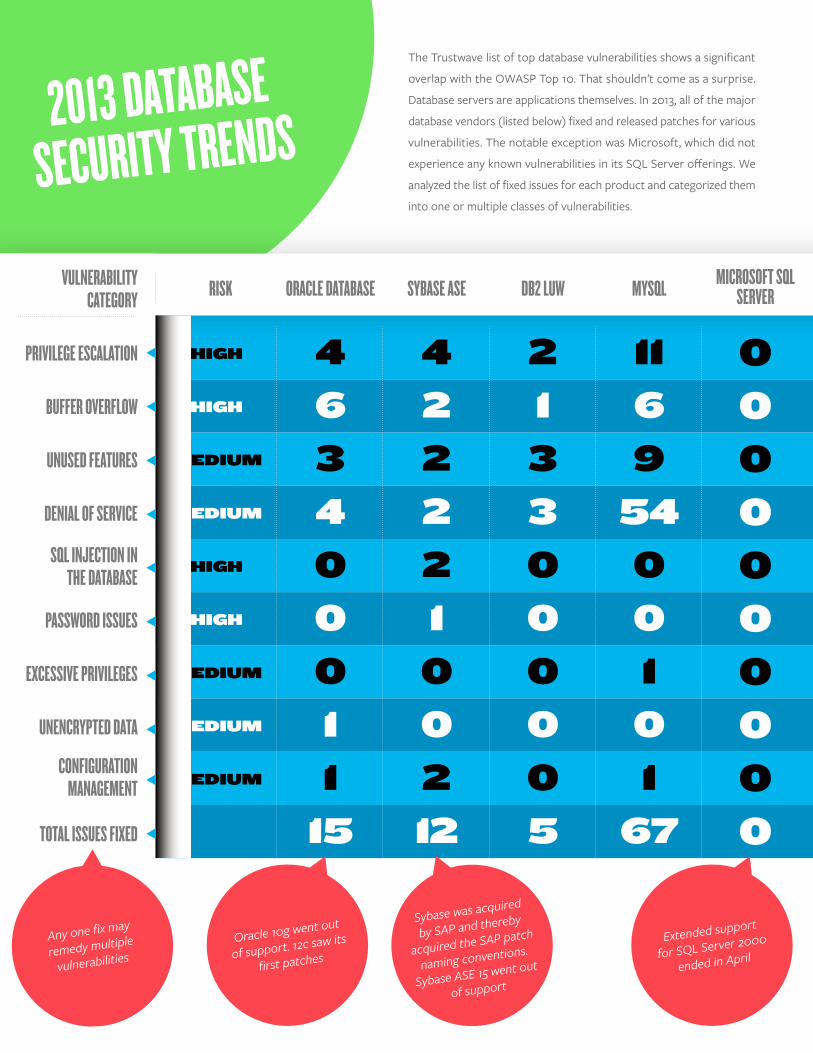
high
medium
high
medium
medium
high
medium
high
medium
4
3
0
0
1
6
4
0
1
15
4
2
2
0
2
2
2
1
0
12
2
3
0
0
0
1
3
0
0
5
11
9
0
1
1
6
54
0
0
67
0
0
0
0
0
0
0
0
0
0
RISk ORACLE dATABASE SYBASE ASE dB2 LUW mYSqLmICROSOfT SqL
SERVER
PRIVILEGE ESCALATIOn
VULNERABILITY CATEGORY
BUffER OVERfLOW
UnUSEd fEATURES
dEnIAL Of SERVICE
SqL InJECTIOn In ThE dATABASE
PASSWORd ISSUES
ExCESSIVE PRIVILEGES
UnEnCRYPTEd dATA
COnfIGURATIOn mAnAGEmEnT
TOTAL ISSUES fIxEd
Sybase was acquired
by SAP and thereby
acquired the SAP patch
naming conventions.
Sybase ASE 15 went out
of support
Oracle 10g went out
of support. 12c saw its
first patches
Any one fix may
remedy multiple
vulnerabilities
Extended support
for SQL Server 2000
ended in April
2013 dATABASE
SECURITY TREndS
The Trustwave list of top database vulnerabilities shows a significant
overlap with the OWASP Top 10. That shouldn’t come as a surprise.
Database servers are applications themselves. In 2013, all of the major
database vendors (listed below) fixed and released patches for various
vulnerabilities. The notable exception was Microsoft, which did not
experience any known vulnerabilities in its SQL Server offerings. We
analyzed the list of fixed issues for each product and categorized them
into one or multiple classes of vulnerabilities.
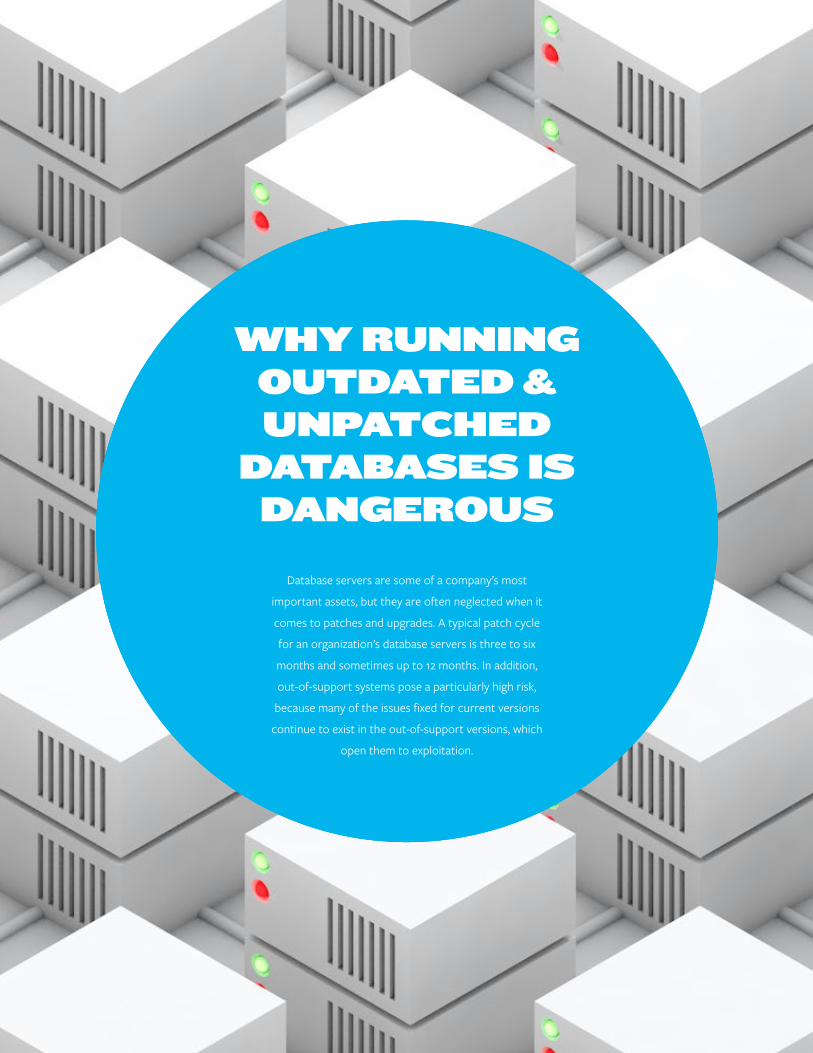
why ruNNiNg OuTdaTEd & uNpaTChEd
daTabaSES iS daNgErOuS
Database servers are some of a company’s most
important assets, but they are often neglected when it
comes to patches and upgrades. A typical patch cycle
for an organization’s database servers is three to six
months and sometimes up to 12 months. In addition,
out-of-support systems pose a particularly high risk,
because many of the issues fixed for current versions
continue to exist in the out-of-support versions, which
open them to exploitation.
nETWORk dEfEnSE fAILURES
—
Trustwave analyzed attack statistics from more than 2,300
manual network penetration tests and vulnerability statistics
from more than 1.2 million automated scans across thousands
of organizations. From this analysis, we were able to determine
the top trends from 2013, as well as the 10 highest impact
issues from the past year.
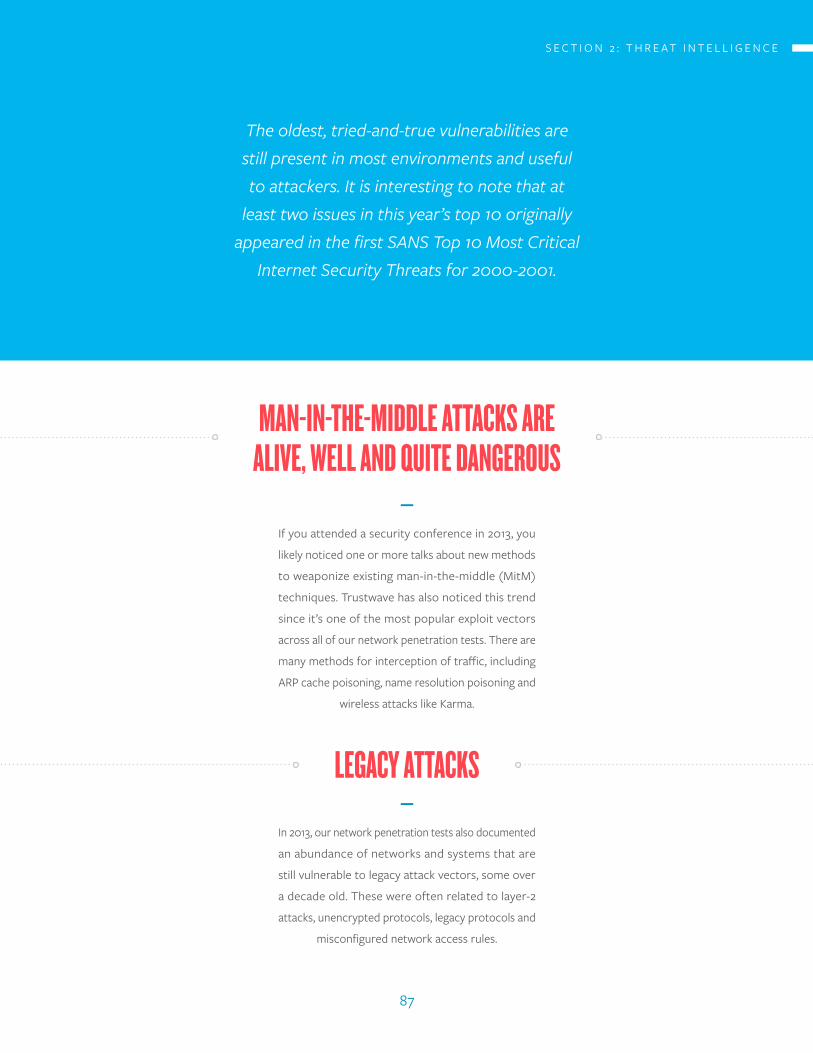
The oldest, tried-and-true vulnerabilities are still present in most environments and useful to attackers. It is interesting to note that at
least two issues in this year’s top 10 originally appeared in the first SANS Top 10 Most Critical
Internet Security Threats for 2000-2001.
mAn-In-ThE-mIddLE ATTACkS ARE ALIVE, WELL And qUITE dAnGEROUS
LEGACY ATTACkS
—
If you attended a security conference in 2013, you
likely noticed one or more talks about new methods
to weaponize existing man-in-the-middle (MitM)
techniques. Trustwave has also noticed this trend
since it’s one of the most popular exploit vectors
across all of our network penetration tests. There are
many methods for interception of traffic, including
ARP cache poisoning, name resolution poisoning and
wireless attacks like Karma.
—
In 2013, our network penetration tests also documented
an abundance of networks and systems that are
still vulnerable to legacy attack vectors, some over
a decade old. These were often related to layer-2
attacks, unencrypted protocols, legacy protocols and
misconfigured network access rules.
S E C T I O N 2 : T H R E A T I N T E L L I G E N C E
87
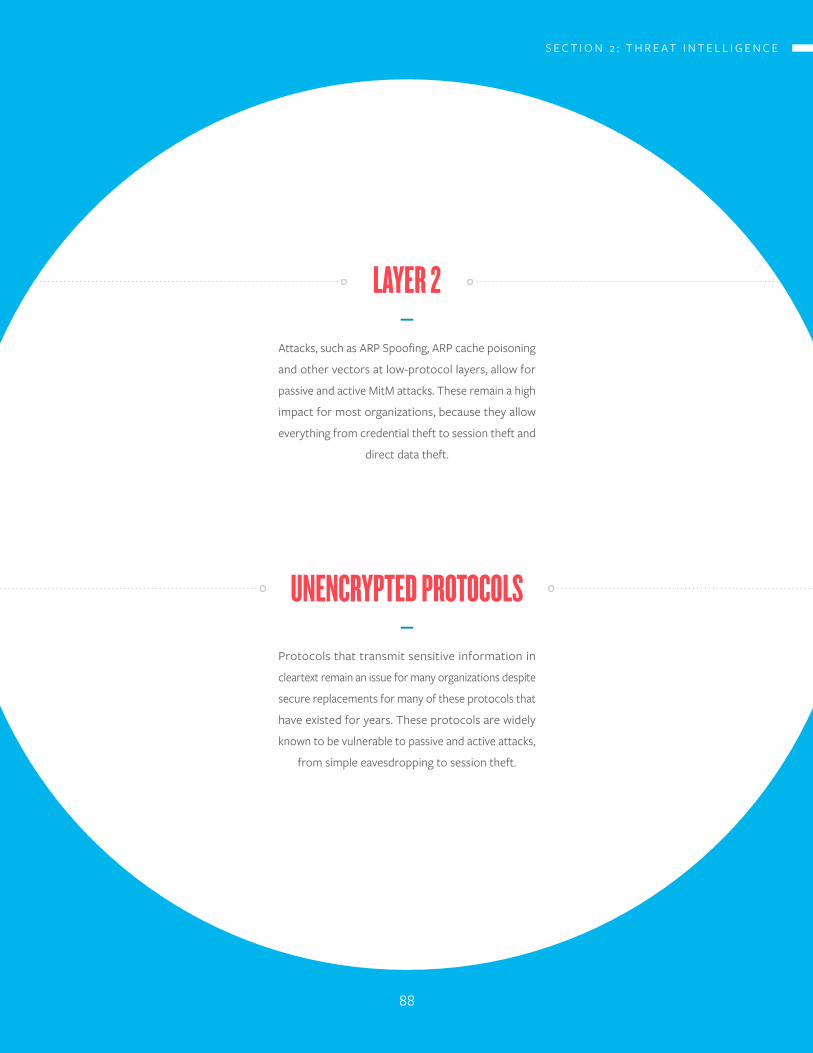
LAYER 2
UnEnCRYPTEd PROTOCOLS
—
Attacks, such as ARP Spoofing, ARP cache poisoning
and other vectors at low-protocol layers, allow for
passive and active MitM attacks. These remain a high
impact for most organizations, because they allow
everything from credential theft to session theft and
direct data theft.
—
Protocols that transmit sensitive information in
cleartext remain an issue for many organizations despite
secure replacements for many of these protocols that
have existed for years. These protocols are widely
known to be vulnerable to passive and active attacks,
from simple eavesdropping to session theft.
S E C T I O N 2 : T H R E A T I N T E L L I G E N C E
88
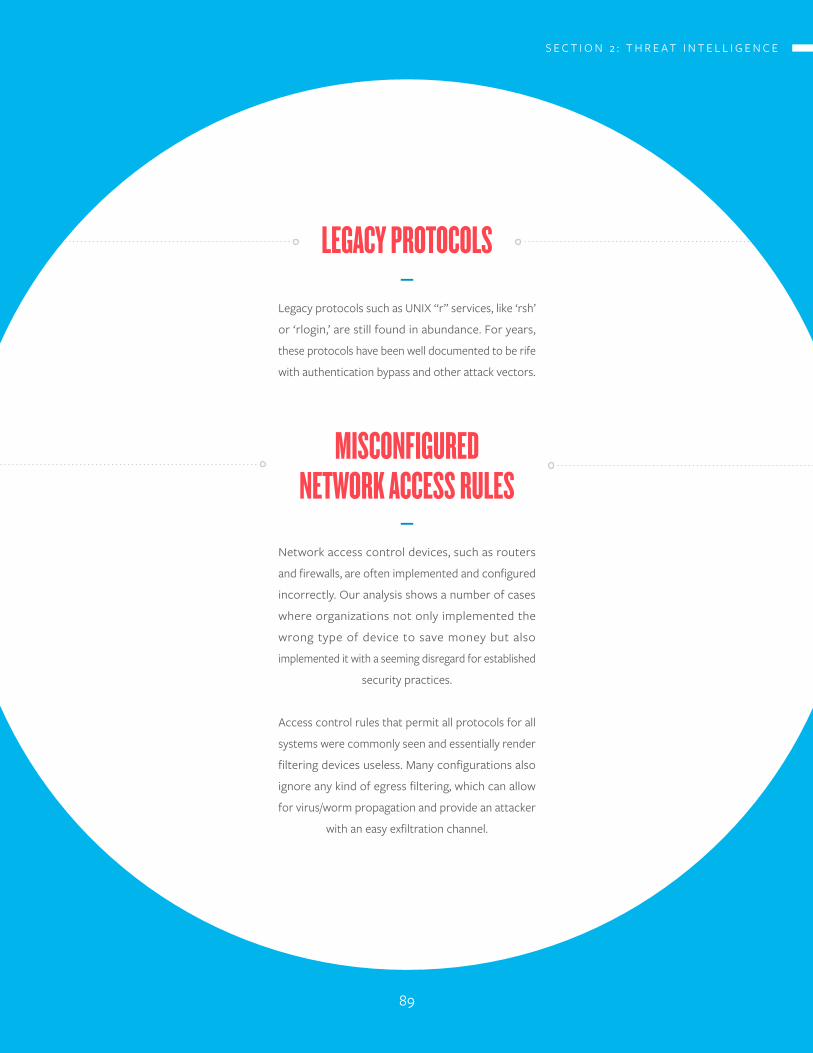
LEGACY PROTOCOLS
mISCOnfIGUREd nETWORk ACCESS RULES
—
Legacy protocols such as UNIX “r” services, like ‘rsh’
or ‘rlogin,’ are still found in abundance. For years,
these protocols have been well documented to be rife
with authentication bypass and other attack vectors.
—
Network access control devices, such as routers
and firewalls, are often implemented and configured
incorrectly. Our analysis shows a number of cases
where organizations not only implemented the
wrong type of device to save money but also
implemented it with a seeming disregard for established
security practices.
Access control rules that permit all protocols for all
systems were commonly seen and essentially render
filtering devices useless. Many configurations also
ignore any kind of egress filtering, which can allow
for virus/worm propagation and provide an attacker
with an easy exfiltration channel.
S E C T I O N 2 : T H R E A T I N T E L L I G E N C E
89
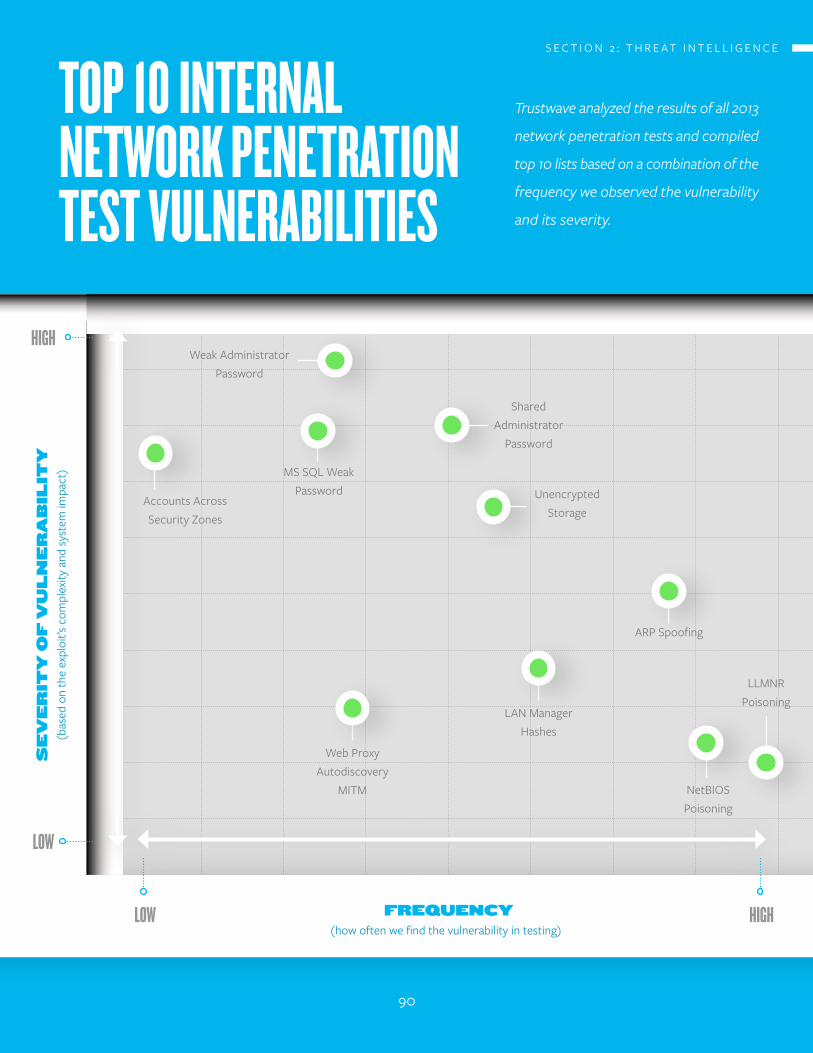
frEquENCy
SE
vE
riT
y O
f v
ul
NE
ra
bil
iTy
(how often we find the vulnerability in testing)
(bas
ed o
n th
e ex
ploi
t’s c
ompl
exity
and
syst
em im
pact
)
Accounts AcrossSecurity Zones
Weak AdministratorPassword
MS SQL Weak Password
Shared Administrator
Password
Unencrypted Storage
LAN Manager Hashes
NetBIOS Poisoning
Web Proxy Autodiscovery
MITM
LLMNR Poisoning
ARP Spoofing
LOW
LOW
hIGh
hIGh
Trustwave analyzed the results of all 2013
network penetration tests and compiled
top 10 lists based on a combination of the
frequency we observed the vulnerability
and its severity.
TOP 10 InTERnAL nETWORk PEnETRATIOn TEST VULnERABILITIES
S E C T I O N 2 : T H R E A T I N T E L L I G E N C E
90
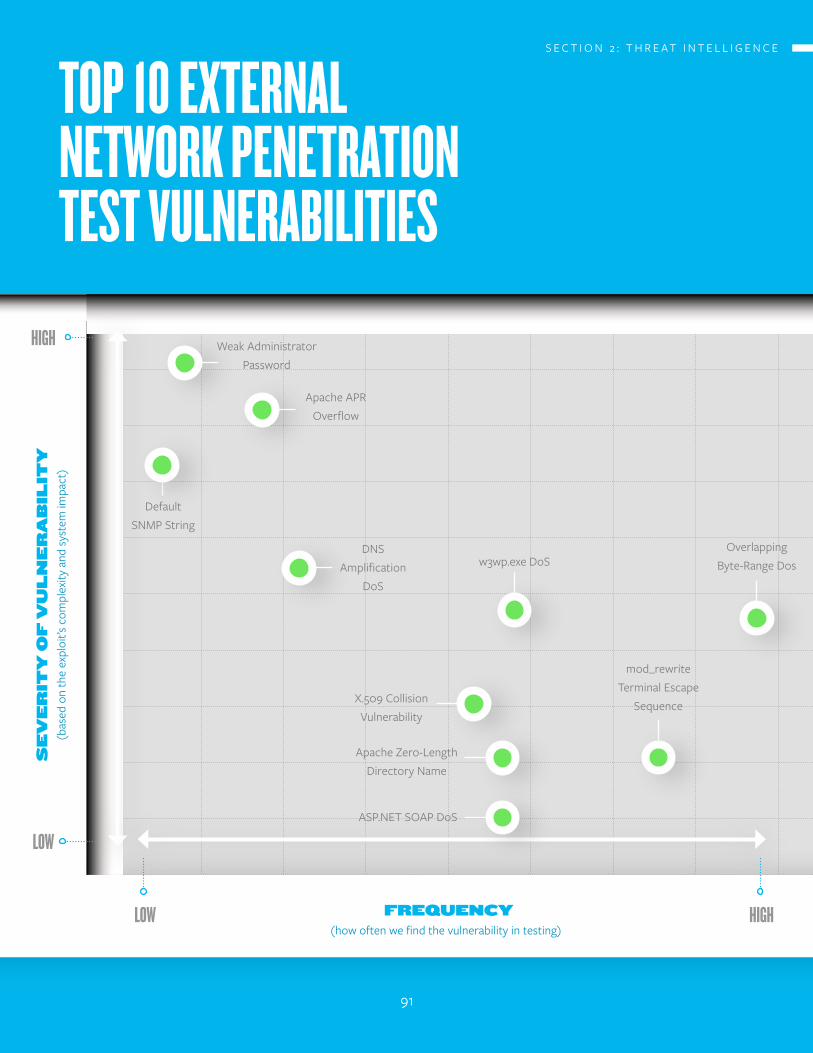
frEquENCy
SE
vE
riT
y O
f v
ul
NE
ra
bil
iTy
(how often we find the vulnerability in testing)LOW
LOW
hIGh
hIGh
Default SNMP String
mod_rewrite Terminal Escape
Sequence
Overlapping Byte-Range Dosw3wp.exe DoS
DNS Amplification
DoS
Weak Administrator Password
Apache APR Overflow
X.509 Collision Vulnerability
Apache Zero-Length Directory Name
ASP.NET SOAP DoS
(bas
ed o
n th
e ex
ploi
t’s c
ompl
exity
and
syst
em im
pact
)
TOP 10 ExTERnAL nETWORk PEnETRATIOn TEST VULnERABILITIES
S E C T I O N 2 : T H R E A T I N T E L L I G E N C E
91
APPLICATIOn dEfEnSE fAILURES
Often, the focus during the design process of an
application is on functionality and usability with the
expectation that users will only use the application as
intended. Developers often fail to realize that users
may, either inadvertently or intentionally, misuse the
functionality of the application. The consequences
can range from minor to severe, and sometimes even
seemingly small vulnerabilities can result in massive
security breaches.
96 percent of applications scanned by Trustwave in 2013
harbored one or more serious security vulnerabilities
(compared to 99% in 2012). The median number of
vulnerabilities per application increased from 13 in 2012
to 14 in 2013. Cross-site scripting (25%), information
leakage (23%), authentication and authorization (15%)
and session management (13%) vulnerabilities made up
three-fourths of security flaws most frequently found
in our security scanning.
!
92
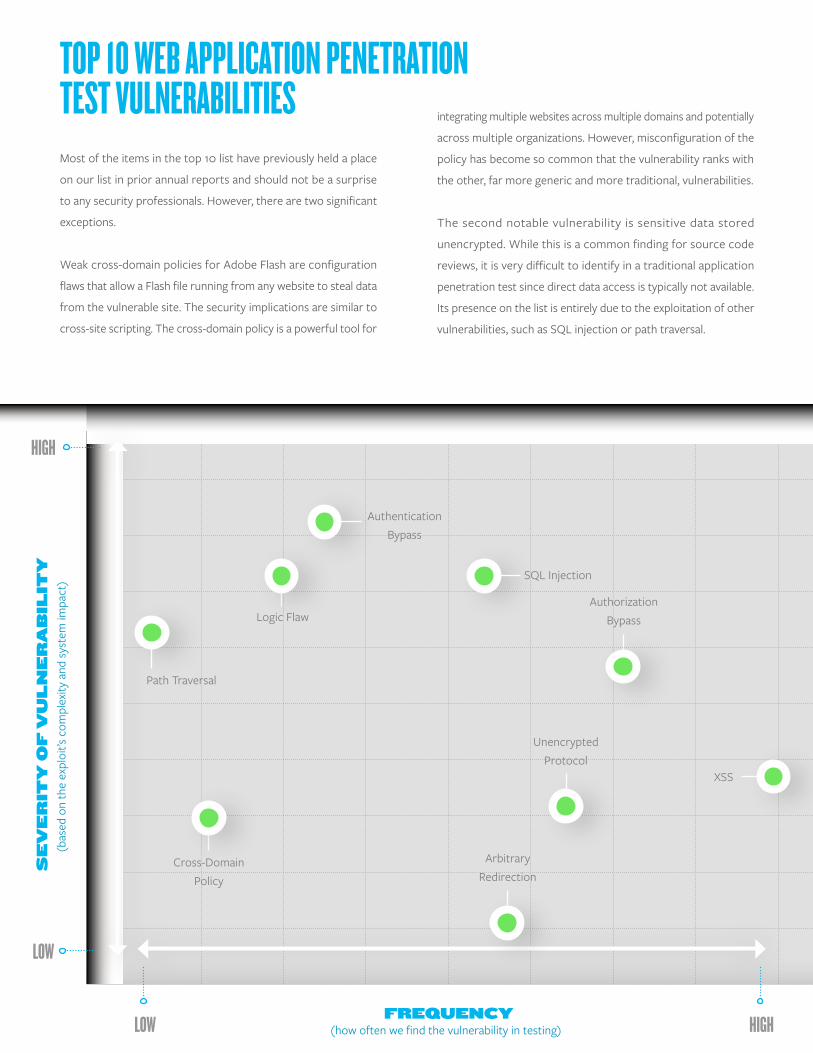
TOP 10 WEB APPLICATIOn PEnETRATIOn TEST VULnERABILITIES
frEquENCy
SE
vE
riT
y O
f v
ul
NE
ra
bil
iTy
(how often we find the vulnerability in testing)
ArbitraryRedirection
AuthorizationBypass
XSS
LOW
LOW
hIGh
hIGh
Logic Flaw
SQL Injection
Cross-DomainPolicy
UnencryptedProtocol
AuthenticationBypass
Path Traversal
Most of the items in the top 10 list have previously held a place
on our list in prior annual reports and should not be a surprise
to any security professionals. However, there are two significant
exceptions.
Weak cross-domain policies for Adobe Flash are configuration
flaws that allow a Flash file running from any website to steal data
from the vulnerable site. The security implications are similar to
cross-site scripting. The cross-domain policy is a powerful tool for
integrating multiple websites across multiple domains and potentially
across multiple organizations. However, misconfiguration of the
policy has become so common that the vulnerability ranks with
the other, far more generic and more traditional, vulnerabilities.
The second notable vulnerability is sensitive data stored
unencrypted. While this is a common finding for source code
reviews, it is very difficult to identify in a traditional application
penetration test since direct data access is typically not available.
Its presence on the list is entirely due to the exploitation of other
vulnerabilities, such as SQL injection or path traversal.
(bas
ed o
n th
e ex
ploi
t’s c
ompl
exity
and
syst
em im
pact
)

mOBILE APPLICATIOnS
Mobile applications are becoming the norm rather than the
exception. Not only are enterprises creating mobile versions
of their customer- and public-facing applications, they are
also moving their internal applications to support mobile
devices. With this trend, Trustwave has started conducting
two distinctive mobile security tests:
—
Applications – Testing individual applications, including
e-commerce, banking, games and point of sale
—
Platforms – Testing platforms, mobile device management
(MDM) and secure container solutions used to manage
and protect data on a mobile device
S E C T I O N 2 : T H R E A T I N T E L L I G E N C E
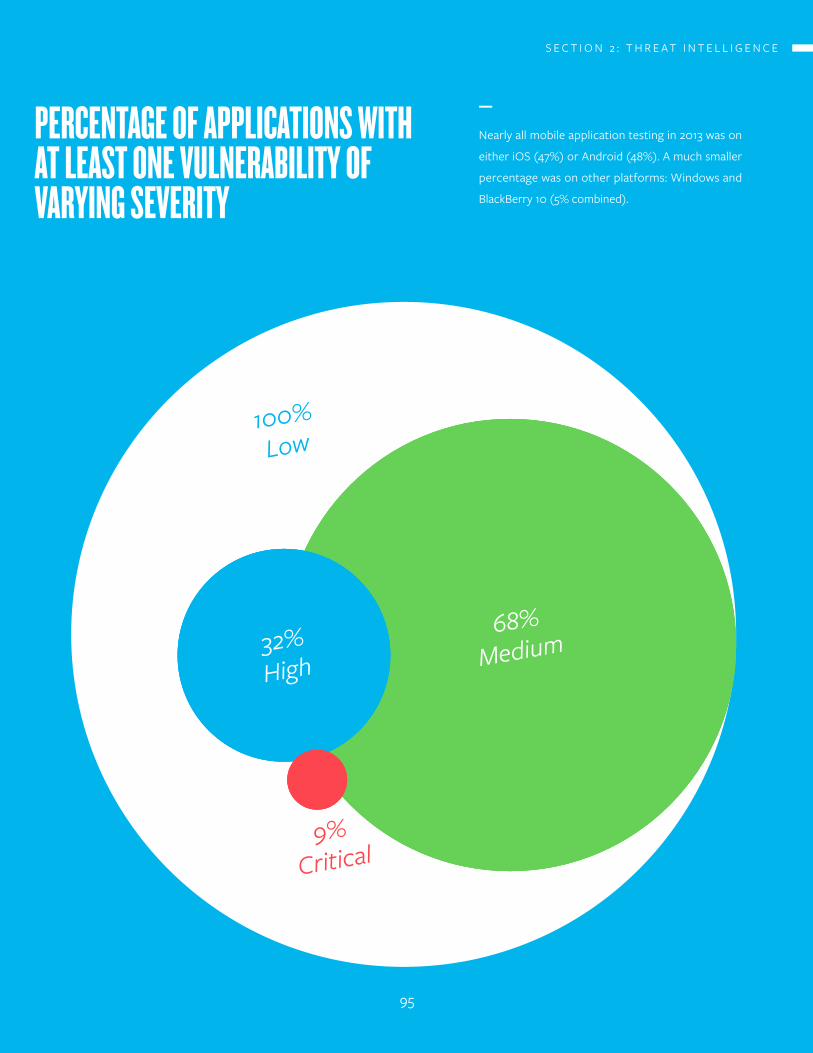
68%Medium32%
High
9%Critical
100%Low
PERCEnTAGE Of APPLICATIOnS WITh AT LEAST OnE VULnERABILITY Of VARYInG SEVERITY
—
Nearly all mobile application testing in 2013 was on
either iOS (47%) or Android (48%). A much smaller
percentage was on other platforms: Windows and
BlackBerry 10 (5% combined).
S E C T I O N 2 : T H R E A T I N T E L L I G E N C E
95
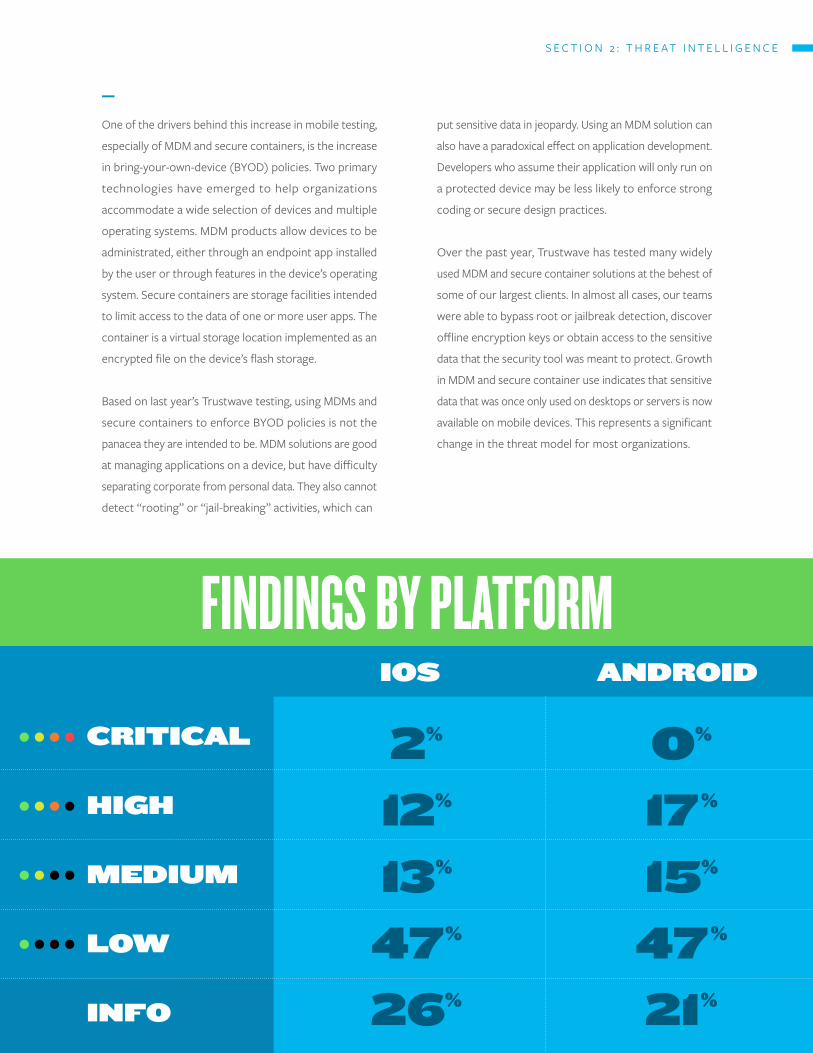
—
One of the drivers behind this increase in mobile testing,
especially of MDM and secure containers, is the increase
in bring-your-own-device (BYOD) policies. Two primary
technologies have emerged to help organizations
accommodate a wide selection of devices and multiple
operating systems. MDM products allow devices to be
administrated, either through an endpoint app installed
by the user or through features in the device’s operating
system. Secure containers are storage facilities intended
to limit access to the data of one or more user apps. The
container is a virtual storage location implemented as an
encrypted file on the device’s flash storage.
Based on last year’s Trustwave testing, using MDMs and
secure containers to enforce BYOD policies is not the
panacea they are intended to be. MDM solutions are good
at managing applications on a device, but have difficulty
separating corporate from personal data. They also cannot
detect “rooting” or “jail-breaking” activities, which can
CriTiCal
high
mEdium
lOw
iNfO
iOS aNdrOid
put sensitive data in jeopardy. Using an MDM solution can
also have a paradoxical effect on application development.
Developers who assume their application will only run on
a protected device may be less likely to enforce strong
coding or secure design practices.
Over the past year, Trustwave has tested many widely
used MDM and secure container solutions at the behest of
some of our largest clients. In almost all cases, our teams
were able to bypass root or jailbreak detection, discover
offline encryption keys or obtain access to the sensitive
data that the security tool was meant to protect. Growth
in MDM and secure container use indicates that sensitive
data that was once only used on desktops or servers is now
available on mobile devices. This represents a significant
change in the threat model for most organizations.
2%
12%
13%
47%
26%
O%
17%
15%
47%
21%
fIndInGS BY PLATfORm
S E C T I O N 2 : T H R E A T I N T E L L I G E N C E
—
Information Leakage
Vulnerabilities related to information leakage represent
68 percent of the findings in mobile application tests.
This includes simple caching issues that expose personally
identifiable information (PII) to insecure storage of
cryptographic materials (including private keys and offline
decryption keys), as well as cardholder data.
—
Integrity Flaws
Integrity flaws accounted for 21 percent of all mobile
findings. These include the ability to alter calls to backend
systems with techniques like user-defined prices or replay
attacks. Other integrity flaws were related to attacks on
session management.
—
Physical or Network Access
The most successful attack vector against mobile devices
is still surreptitious physical or network access that allows
malicious code to be installed and run on the device. As
of this writing, an iOS device requires physical access to
obtain information or install code, but with the increase
in malware, an Android device can be exploited remotely.
—
Insecure Storage and Transmission
For non-POS mobile applications, the biggest issues are
storage and transmission of critical information in a non-
secure manner. Banking, retail and even gaming applications
will accept and store PII in unsecured databases on the
device (often SQLite databases) or transmit the data
insecurely, either using a plaintext connection or with
improperly configured encryption. Data can also be stored
unencrypted in the device’s system caches, which can
be retrieved by an attacker who wouldn’t require more
than brief access to a device. Add to this any operating
system-level issues, such as the Apple SSL\TLS “Goto fail”
bug, and securing mobile communications on a potentially
hostile network becomes difficult.
mOST COmmOn mOBILE VULnERABILITIES
The root cause of most mobile vulnerabilities is the assumption that data is safe because an
internal application is being used on an internal network.
97
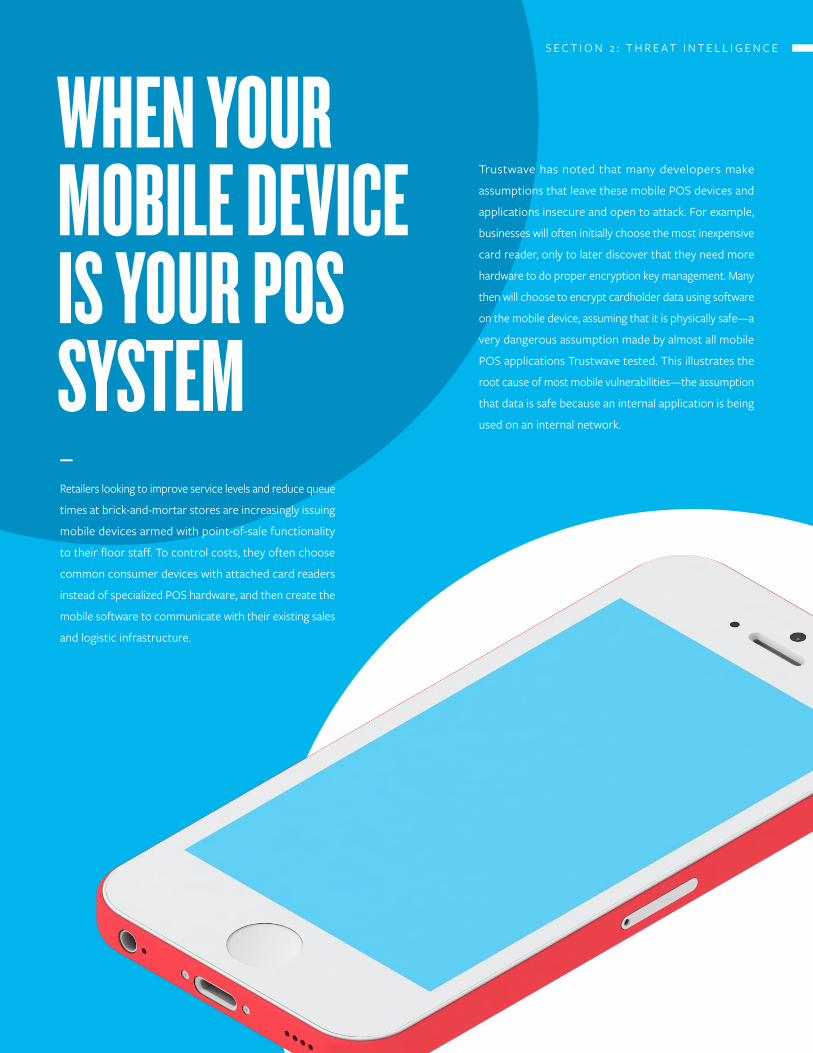
WhEn YOUR mOBILE dEVICE IS YOUR POS SYSTEm—
Retailers looking to improve service levels and reduce queue
times at brick-and-mortar stores are increasingly issuing
mobile devices armed with point-of-sale functionality
to their floor staff. To control costs, they often choose
common consumer devices with attached card readers
instead of specialized POS hardware, and then create the
mobile software to communicate with their existing sales
and logistic infrastructure.
Trustwave has noted that many developers make
assumptions that leave these mobile POS devices and
applications insecure and open to attack. For example,
businesses will often initially choose the most inexpensive
card reader, only to later discover that they need more
hardware to do proper encryption key management. Many
then will choose to encrypt cardholder data using software
on the mobile device, assuming that it is physically safe—a
very dangerous assumption made by almost all mobile
POS applications Trustwave tested. This illustrates the
root cause of most mobile vulnerabilities—the assumption
that data is safe because an internal application is being
used on an internal network.
S E C T I O N 2 : T H R E A T I N T E L L I G E N C E

SECTiON 3–
rEgiONalpErSpECTivES
2 0 1 4 T R U S T W A V E G L O B A L S E C U R I T Y R E P O R T

S E C T I O N 3 : R E G I O N A L P E R S P E C T I V E S — E M E A
100
nORThAmERICA
The majority of data breaches investigated by Trustwave, both in terms of the number
and magnitude, occured in the United States. The majority of U.S. breaches
involved brick-and-mortar hospitality and retail businesses with large, nationwide
payment networks.
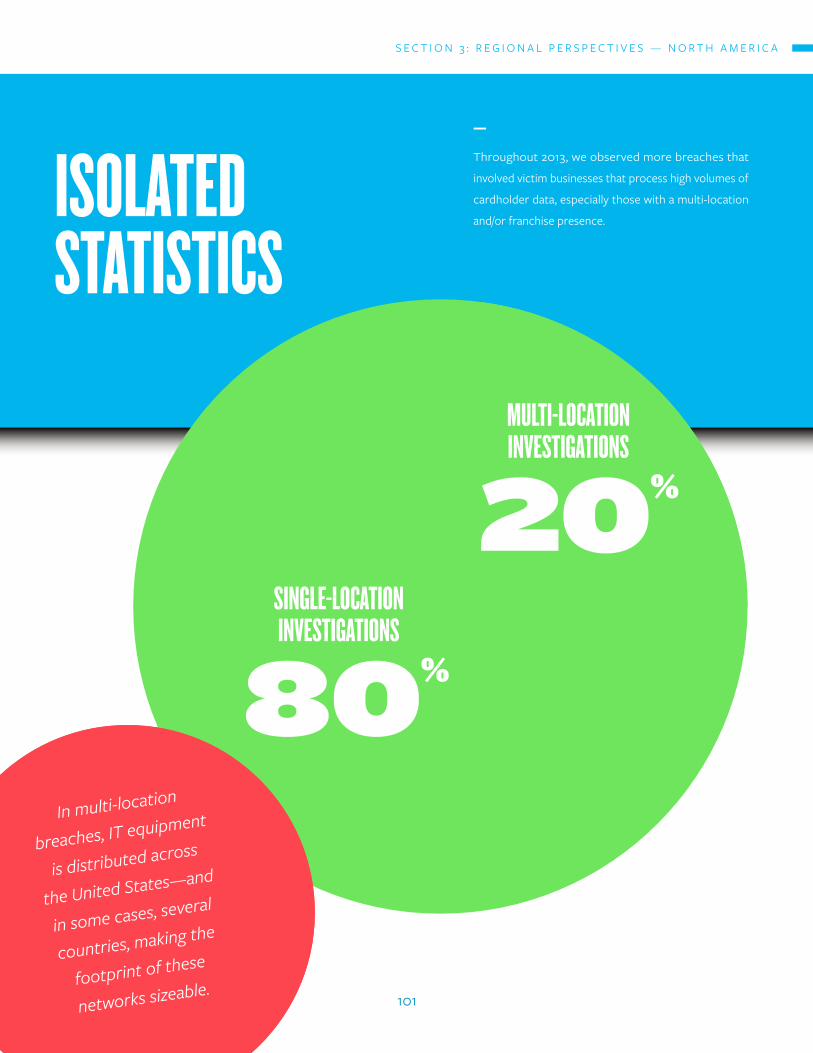
ISOLATEd STATISTICS
—
Throughout 2013, we observed more breaches that
involved victim businesses that process high volumes of
cardholder data, especially those with a multi-location
and/or franchise presence.
SInGLE-LOCATIOnInVESTIGATIOnS
80%
mULTI-LOCATIOn InVESTIGATIOnS
20%
In multi-location
breaches, IT equipment
is distributed across
the United States—and
in some cases, several
countries, making the
footprint of these
networks sizeable.
S E C T I O N 3 : R E G I O N A L P E R S P E C T I V E S — N O R T H A M E R I C A
101
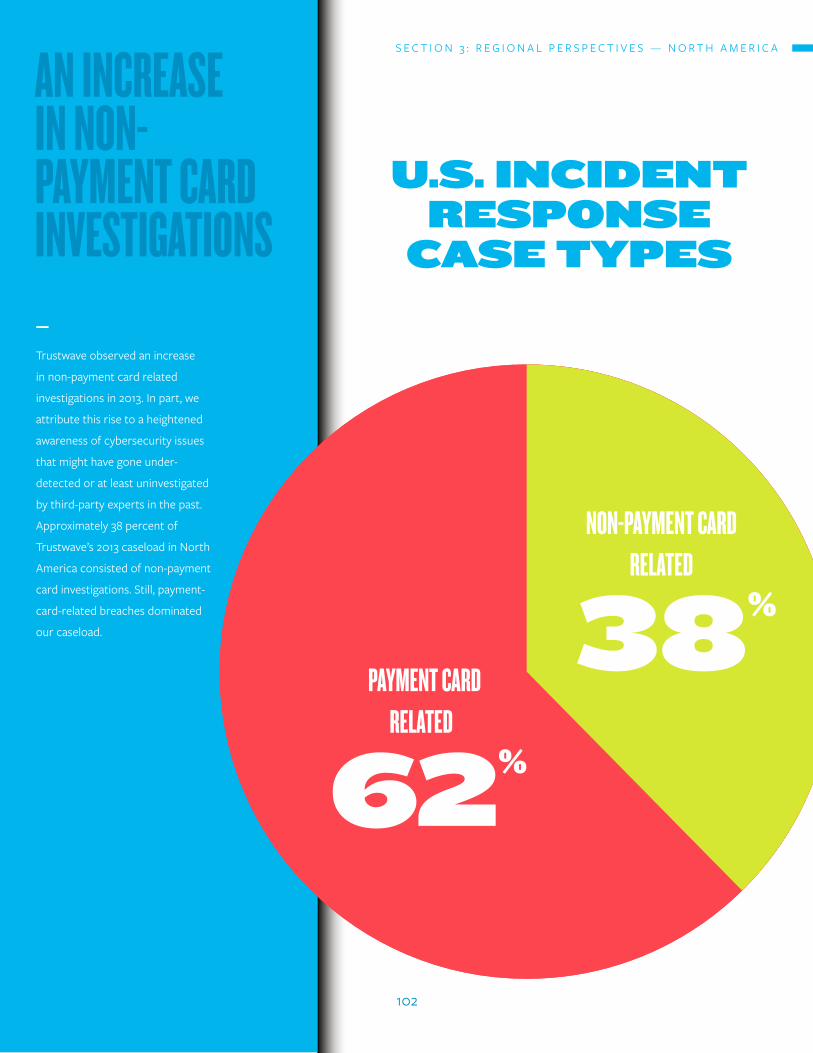
An InCREASE In nOn-PAYmEnT CARd InVESTIGATIOnS
u.S. iNCidENT rESpONSE
CaSE TypES
—
Trustwave observed an increase
in non-payment card related
investigations in 2013. In part, we
attribute this rise to a heightened
awareness of cybersecurity issues
that might have gone under-
detected or at least uninvestigated
by third-party experts in the past.
Approximately 38 percent of
Trustwave’s 2013 caseload in North
America consisted of non-payment
card investigations. Still, payment-
card-related breaches dominated
our caseload.
PAYmEnT CARdRELATEd
62%
nOn-PAYmEnT CARd RELATEd
38%
S E C T I O N 3 : R E G I O N A L P E R S P E C T I V E S — N O R T H A M E R I C A
102
dISPATCh fROm ThE fIELd:
UnITEd STATES
SECRET SERVICEu.s. secret service
—
north texas electronic
crimes task force
—
steven bullitt - assistant to the
special agent in charge
—
dallas field office
This year is the 30th anniversary of when the U.S. government first specifically
criminalized unauthorized access to computers and access device fraud, and
assigned the Secret Service authority to investigate these alleged crimes. Over
the past three decades, the Secret Service has continuously innovated in how
it investigates cybercrimes to keep pace with the changing use of information
technology and criminals’ efforts to exploit this technology. Fundamental to the
approach of the Secret Service is to maintain close and constant collaboration
with all potential stakeholders, not only in investigating, but also in detecting
and preventing crimes and minimizing fraud losses and associated damages.
In 1995, the Secret Service created the New York Electronic Crimes Task Force
(ECTF) to bring together law enforcement, private industry and academia to
share information, stop emerging threats and aggressively investigate incidents.
Recognizing the success of this model, in 2001, Public Law 107-56 directed
the Secret Service to establish a network of Electronic Crimes Task Forces
(ECTFs) for the purpose of preventing, detecting and investigating various
forms of electronic crimes, including potential terrorist attacks against critical
infrastructure and financial payment systems. Today the Secret Service operates
35 ECTFs throughout the United States, as well as London and Rome.
The Secret Service has investigated numerous and significant cyberintrusions,
including recent incidents affecting major U.S. retailers. From this experience,
S E C T I O N 3 : R E G I O N A L P E R S P E C T I V E S — N O R T H A M E R I C A
103
the Secret Service has witnessed the value of companies developing effective cyber incident response
plans. The North Texas Electronic Crimes Task Force has seen this firsthand while working with
local companies. The transnational criminals responsible for major data breaches are sophisticated
adversaries that carefully research their targets. An effective incident response plan not only assists
law enforcement in investigating and bringing to justice these criminals, but also may deter attackers
from targeting a particular business.
The importance of an incident response plan has long been recognized; however, many organizations
remain focused on trying to close vulnerabilities rather than detecting and deterring threats through
effective response planning. Businesses can reference numerous resources to guide incident response
planning, including the recently published NIST’s Improving Critical Infrastructure Cybersecurity
framework. Based on our experience investigating major intrusions, the essential element of incident
response planning is building the right team and developing the necessary relationships prior to a breach.
Critical to a company’s incident response team are third-party partners that have experience in
managing these events. These partners are essential to a victim company’s efforts to rapidly containing
the incident while conducting an investigation to determine the impact – and then reporting on these
results. Businesses always should create these relationships prior to an incident occurring. Organizations
should pay special attention to developing the following three relationships:
Outside Legal Counsel: Companies often hire outside legal counsel to assist with risk and remediation
procedures, such as compliance requirements, data breach disclosure laws, industry standards, regulations
and any other U.S. or foreign legal requirements.
Outside Cyber Incident Response and Forensic Company: Third-party forensic firms will contain the
breach and collect sensitive electronic data (evidence) in a forensically sound manner.
Law Enforcement: Unauthorized access to computers is a federal crime in the United States and in most
other countries. Individuals who are aware of crimes have a responsibility to report these incidents to
an appropriate law enforcement agency.
S E C T I O N 3 : R E G I O N A L P E R S P E C T I V E S — N O R T H A M E R I C A
104

S E C T I O N 3 : R E G I O N A L P E R S P E C T I V E S — E M E A
105
EUROPE, mIddLE EAST
& AfRICA (EmEA)
The EMEA region covers approximately 100 countries, two billion people and 50
million square kilometers. Trustwave’s first-hand experiences are concentrated within a subset of that, primarily the U.K. and Ireland,
Western Europe, Southern Africa, the Nordic countries and a handful of countries
in Eastern Europe and the Middle East.
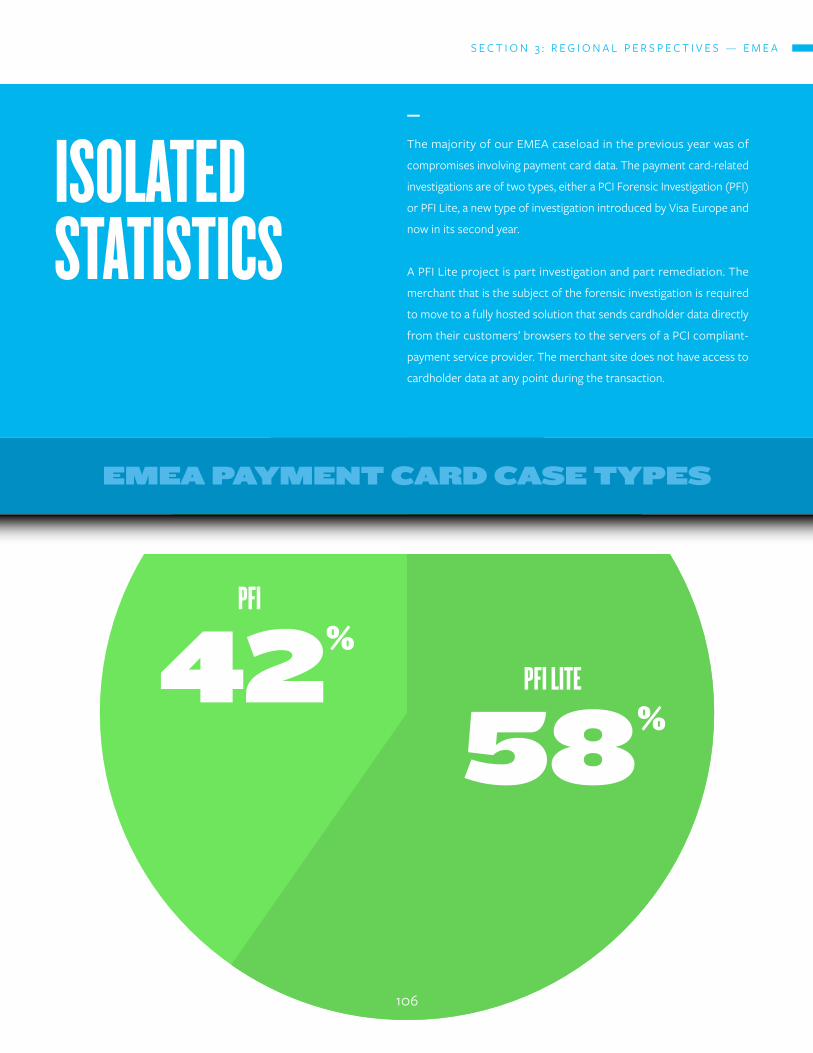
PfI
42%PfI LITE
58%
ISOLATEdSTATISTICS
EmEa paymENT Card CaSE TypES
—
The majority of our EMEA caseload in the previous year was of
compromises involving payment card data. The payment card-related
investigations are of two types, either a PCI Forensic Investigation (PFI)
or PFI Lite, a new type of investigation introduced by Visa Europe and
now in its second year.
A PFI Lite project is part investigation and part remediation. The
merchant that is the subject of the forensic investigation is required
to move to a fully hosted solution that sends cardholder data directly
from their customers’ browsers to the servers of a PCI compliant-
payment service provider. The merchant site does not have access to
cardholder data at any point during the transaction.
S E C T I O N 3 : R E G I O N A L P E R S P E C T I V E S — E M E A
106
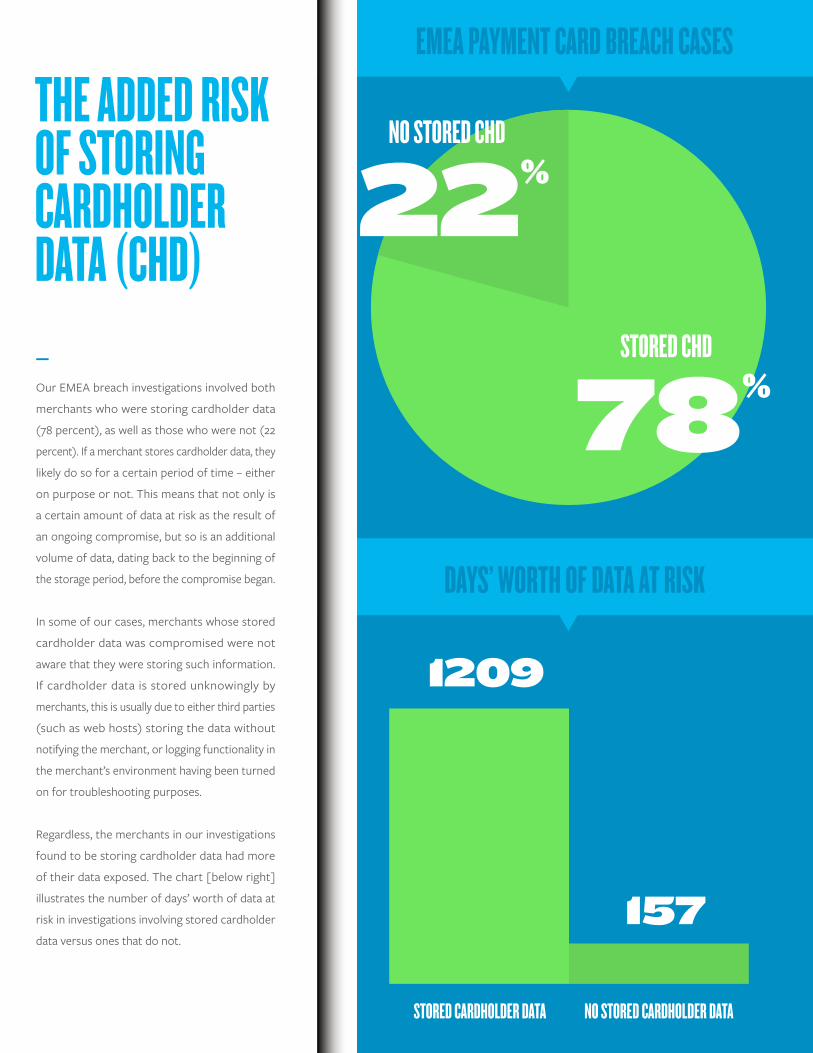
ThE AddEd RISk Of STORInG CARdhOLdER dATA (Chd)—
Our EMEA breach investigations involved both
merchants who were storing cardholder data
(78 percent), as well as those who were not (22
percent). If a merchant stores cardholder data, they
likely do so for a certain period of time – either
on purpose or not. This means that not only is
a certain amount of data at risk as the result of
an ongoing compromise, but so is an additional
volume of data, dating back to the beginning of
the storage period, before the compromise began.
In some of our cases, merchants whose stored
cardholder data was compromised were not
aware that they were storing such information.
If cardholder data is stored unknowingly by
merchants, this is usually due to either third parties
(such as web hosts) storing the data without
notifying the merchant, or logging functionality in
the merchant’s environment having been turned
on for troubleshooting purposes.
Regardless, the merchants in our investigations
found to be storing cardholder data had more
of their data exposed. The chart [below right]
illustrates the number of days’ worth of data at
risk in investigations involving stored cardholder
data versus ones that do not.
EmEA PAYmEnT CARd BREACh CASES
dAYS’ WORTh Of dATA AT RISk
nO STOREd Chd
22%
STOREd Chd
78%
1209
157
STOREd CARdhOLdER dATA nO STOREd CARdhOLdER dATA
nOTABLE EVEnTS& COmPROmISES In EmEA
Emv SmarT Card(ChIP-BASEd PAYmEnT CARd-RELATEd COmPROmISES)
—
There is a common misconception that chip-
based transactions on a PIN Transaction Security
(PTS)-compliant PIN Entry Device (PED) give little
opportunity for attackers to compromise data.
However, the security focus of PTS is only the
PIN, not other cardholder data, such as account
numbers or expiration dates.
Following the implementation of a 2008 Visa
Europe mandate requiring different security codes
on the magnetic stripe and on the chip, it is not
possible to clone a credit or debit card from chip
data. For example, if an attacker captures data from
the magnetic stripe, they will have the stripe’s CVV
code, but not the chip’s iCVV code. Writing the
data from a chip onto the magnetic stripe of a
forged card will result in any attempted purchases
with that card being declined. However, forgers
can extract the full card number and expiration
dates from chip data. This can allow attackers to
use stolen card numbers to make purchases from
e-commerce sites that do not require the CVV2
security code to authorize a transaction. Online
retailers requiring the CVV2 will limit the value
(to criminals) of standalone card numbers and
expiration dates.
The security focus of PTS is only the PIN, not the
cardholder data.
S E C T I O N 3 : R E G I O N A L P E R S P E C T I V E S — E M E A
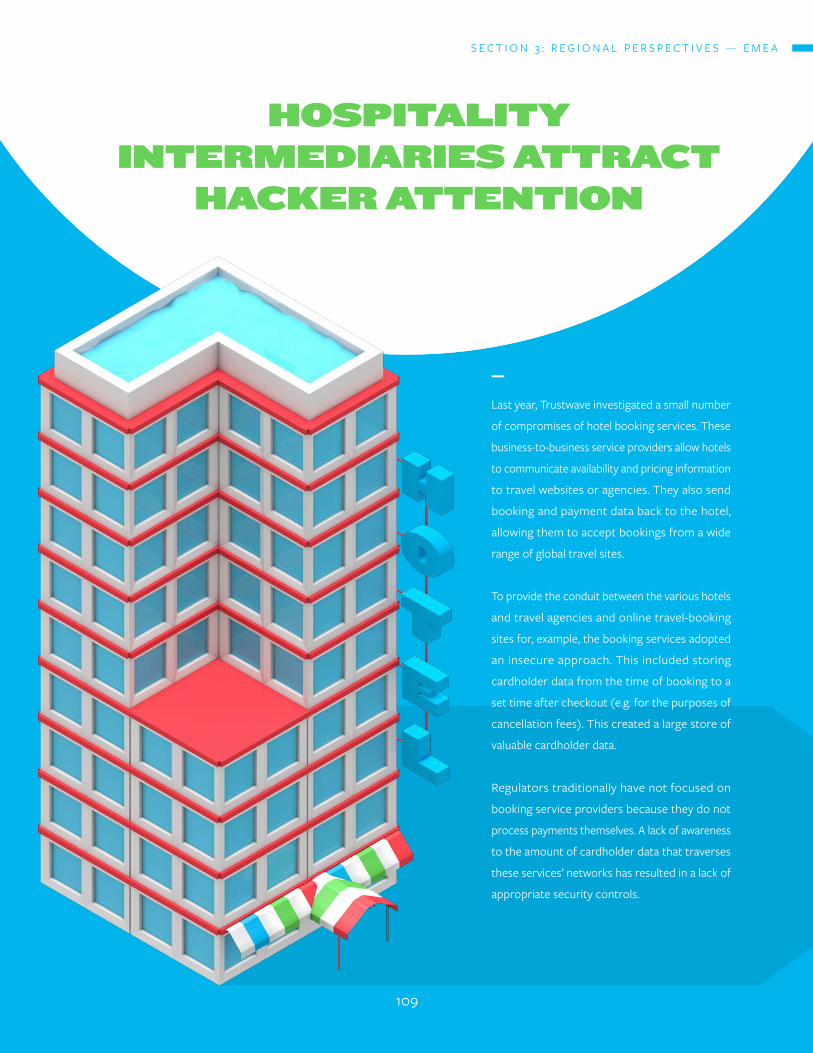
hOSpiTaliTy iNTErmEdiariES aTTraCT
haCkEr aTTENTiON
—
Last year, Trustwave investigated a small number
of compromises of hotel booking services. These
business-to-business service providers allow hotels
to communicate availability and pricing information
to travel websites or agencies. They also send
booking and payment data back to the hotel,
allowing them to accept bookings from a wide
range of global travel sites.
To provide the conduit between the various hotels
and travel agencies and online travel-booking
sites for, example, the booking services adopted
an insecure approach. This included storing
cardholder data from the time of booking to a
set time after checkout (e.g. for the purposes of
cancellation fees). This created a large store of
valuable cardholder data.
Regulators traditionally have not focused on
booking service providers because they do not
process payments themselves. A lack of awareness
to the amount of cardholder data that traverses
these services’ networks has resulted in a lack of
appropriate security controls.
S E C T I O N 3 : R E G I O N A L P E R S P E C T I V E S — E M E A
109
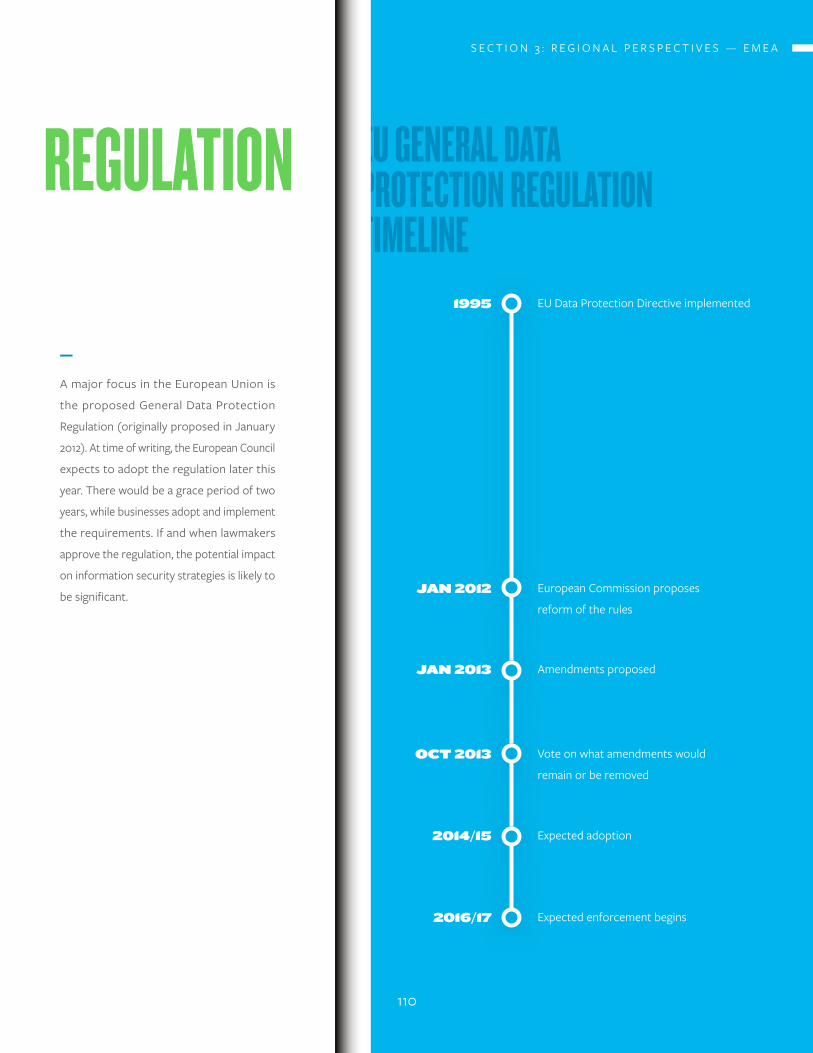
1995
JaN 2012
JaN 2013
OCT 2013
2014/15
2016/17
EU Data Protection Directive implemented
European Commission proposes
reform of the rules
Amendments proposed
Vote on what amendments would
remain or be removed
Expected adoption
Expected enforcement begins
EU GEnERAL dATA PROTECTIOn REGULATIOn TImELInE
REGULATIOn
—
A major focus in the European Union is
the proposed General Data Protection
Regulation (originally proposed in January
2012). At time of writing, the European Council
expects to adopt the regulation later this
year. There would be a grace period of two
years, while businesses adopt and implement
the requirements. If and when lawmakers
approve the regulation, the potential impact
on information security strategies is likely to
be significant.
S E C T I O N 3 : R E G I O N A L P E R S P E C T I V E S — E M E A
110
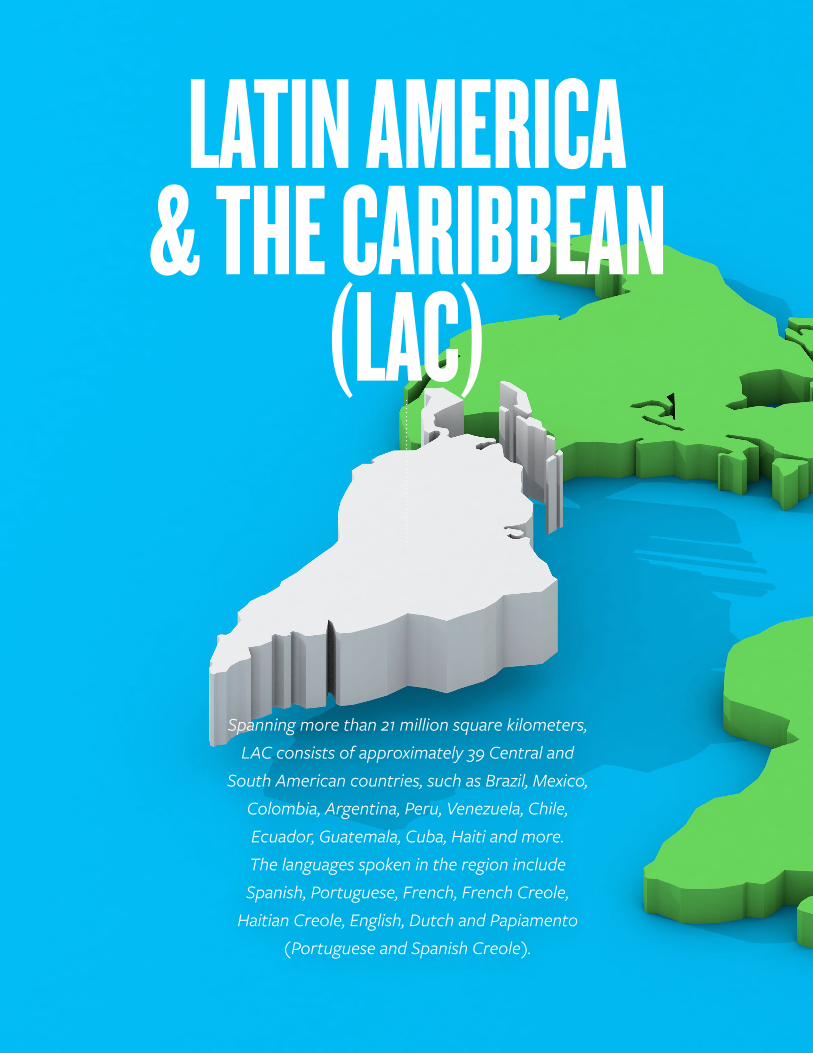
S E C T I O N 3 : R E G I O N A L P E R S P E C T I V E S — E M E A
111
LATIn AmERICA& ThE CARIBBEAn
(LAC)
Spanning more than 21 million square kilometers, LAC consists of approximately 39 Central and
South American countries, such as Brazil, Mexico, Colombia, Argentina, Peru, Venezuela, Chile, Ecuador, Guatemala, Cuba, Haiti and more. The languages spoken in the region include Spanish, Portuguese, French, French Creole,
Haitian Creole, English, Dutch and Papiamento (Portuguese and Spanish Creole).
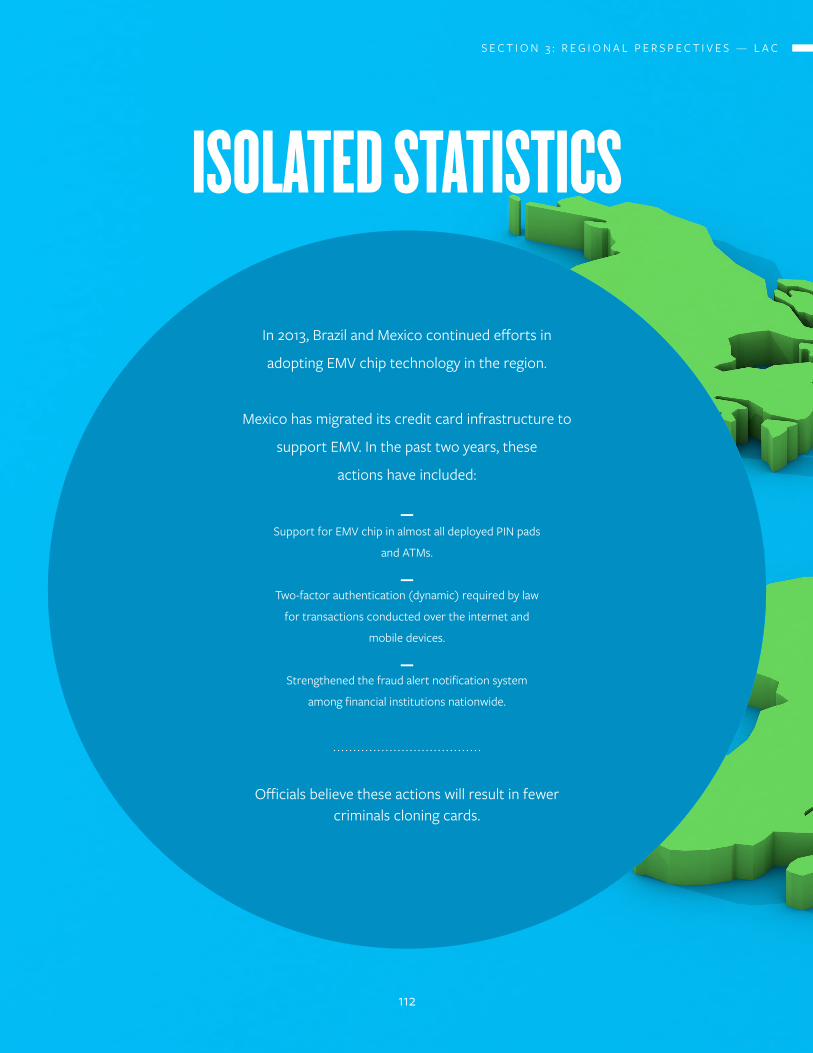
In 2013, Brazil and Mexico continued efforts in
adopting EMV chip technology in the region.
Mexico has migrated its credit card infrastructure to
support EMV. In the past two years, these
actions have included:
Officials believe these actions will result in fewer criminals cloning cards.
—Support for EMV chip in almost all deployed PIN pads
and ATMs.
—Two-factor authentication (dynamic) required by law
for transactions conducted over the internet and
mobile devices.
—Strengthened the fraud alert notification system
among financial institutions nationwide.
ISOLATEd STATISTICS
S E C T I O N 3 : R E G I O N A L P E R S P E C T I V E S — L A C
112
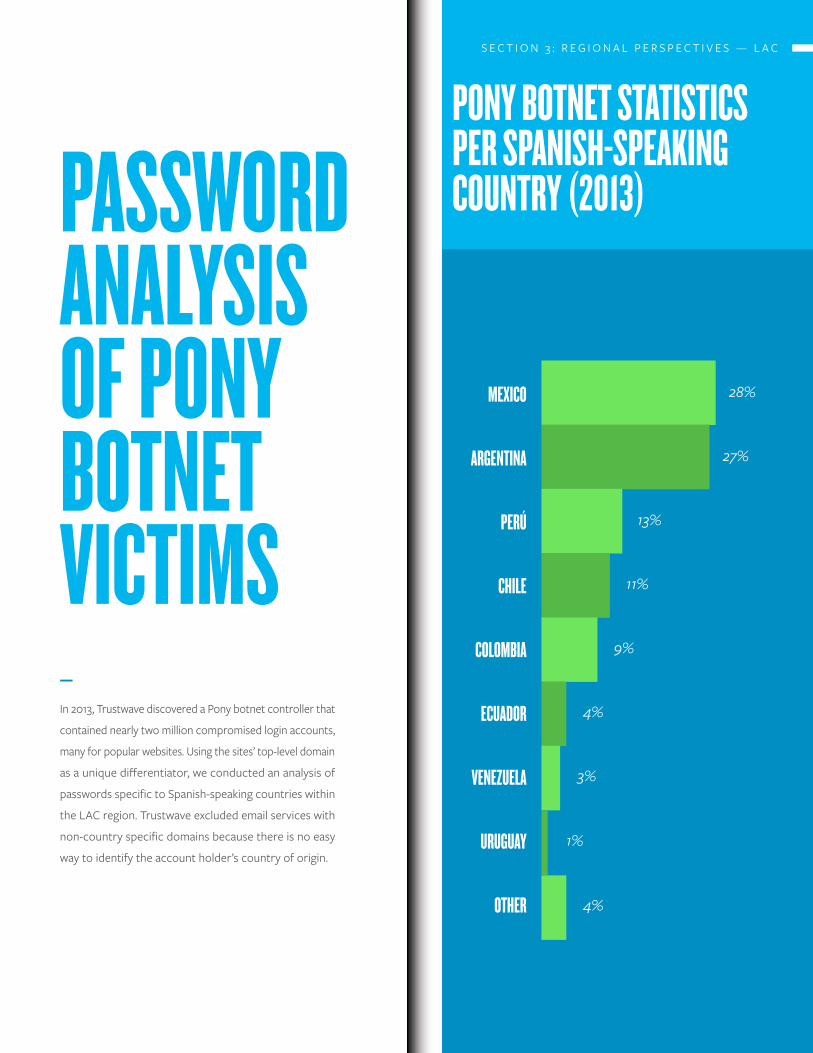
PASSWORd AnALYSIS Of POnY BOTnET VICTImS—
In 2013, Trustwave discovered a Pony botnet controller that
contained nearly two million compromised login accounts,
many for popular websites. Using the sites’ top-level domain
as a unique differentiator, we conducted an analysis of
passwords specific to Spanish-speaking countries within
the LAC region. Trustwave excluded email services with
non-country specific domains because there is no easy
way to identify the account holder’s country of origin.
POnY BOTnET STATISTICS PER SPAnISh-SPEAkInG COUnTRY (2013)
mExICO
ARGEnTInA
PERÚ
ChILE
COLOmBIA
ECUAdOR
VEnEzUELA
URUGUAY
OThER
28%
27%
13%
11%
9%
4%
3%
4%
1%
S E C T I O N 3 : R E G I O N A L P E R S P E C T I V E S — L A C
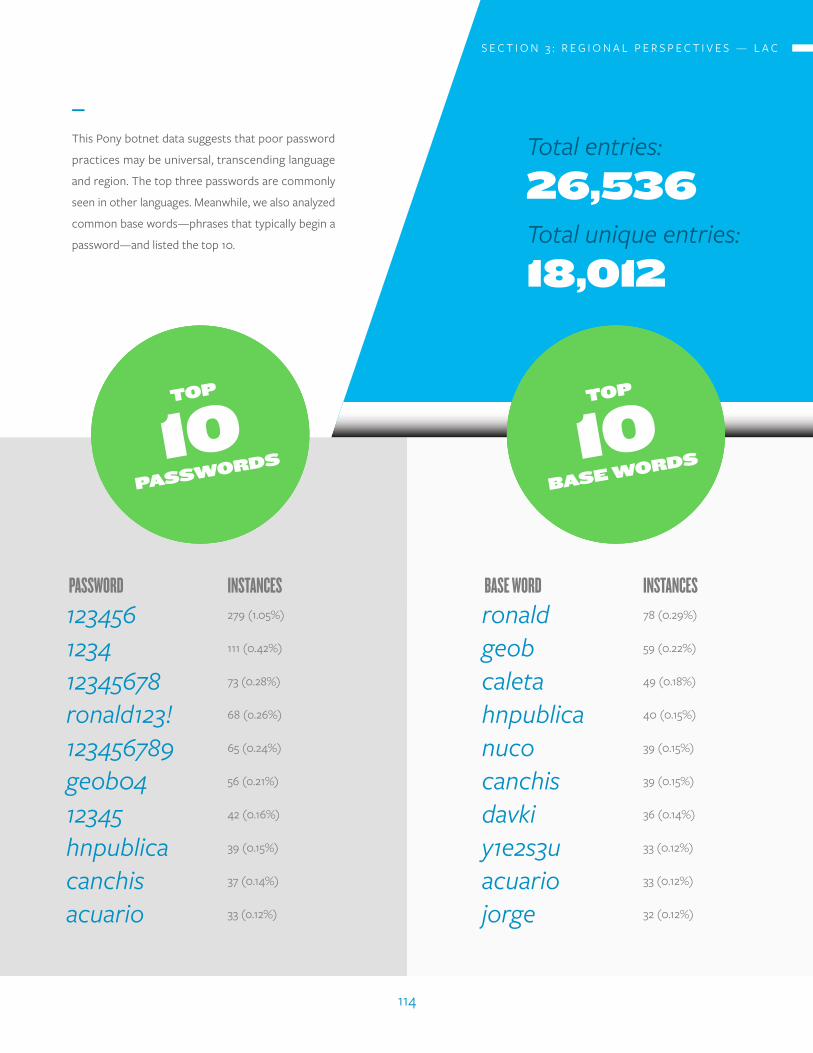
TOp
10
baSE wOrdS
ronaldgeobcaletahnpublicanucocanchisdavkiy1e2s3uacuariojorge
78 (0.29%)
59 (0.22%)
49 (0.18%)
40 (0.15%)
39 (0.15%)
39 (0.15%)
36 (0.14%)
33 (0.12%)
33 (0.12%)
32 (0.12%)
base word instances
TOp
10
paSSwOrdS
123456123412345678ronald123!123456789geob0412345hnpublicacanchisacuario
Total entries:
26,536Total unique entries:
18,012
279 (1.05%)
111 (0.42%)
73 (0.28%)
68 (o.26%)
65 (0.24%)
56 (o.21%)
42 (0.16%)
39 (0.15%)
37 (0.14%)
33 (o.12%)
password instances
—
This Pony botnet data suggests that poor password
practices may be universal, transcending language
and region. The top three passwords are commonly
seen in other languages. Meanwhile, we also analyzed
common base words—phrases that typically begin a
password—and listed the top 10.
S E C T I O N 3 : R E G I O N A L P E R S P E C T I V E S — L A C
114
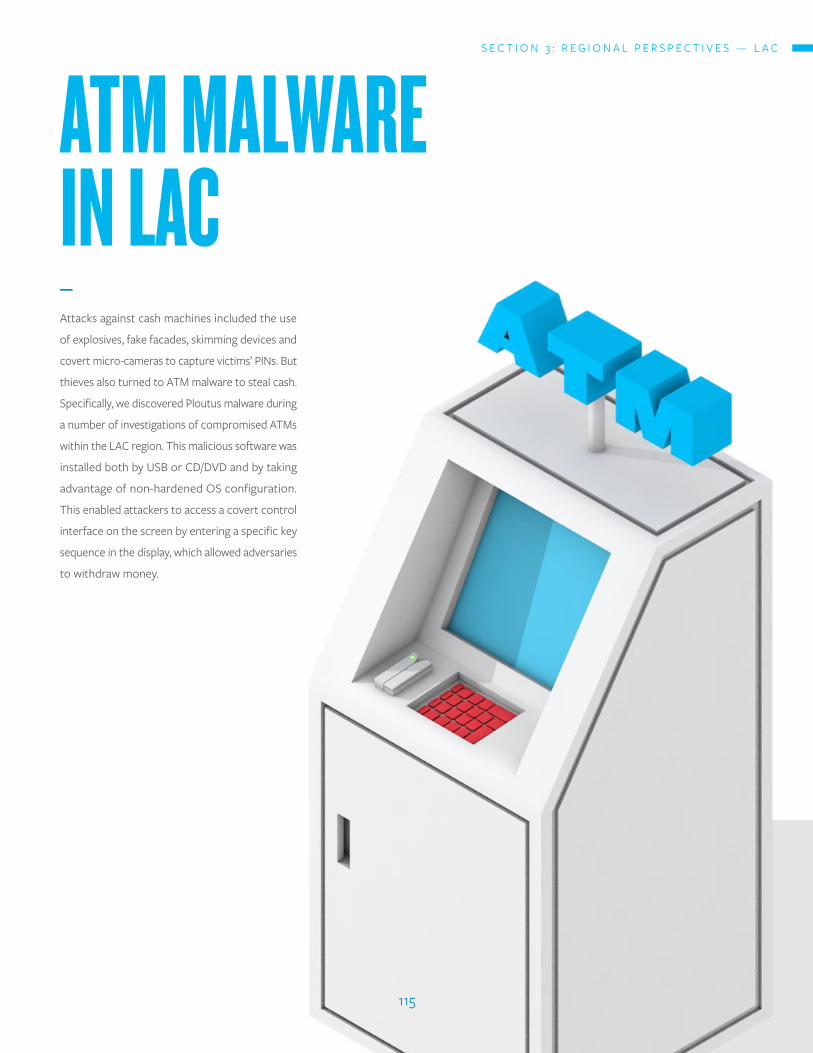
ATm mALWARE In LAC—
Attacks against cash machines included the use
of explosives, fake facades, skimming devices and
covert micro-cameras to capture victims’ PINs. But
thieves also turned to ATM malware to steal cash.
Specifically, we discovered Ploutus malware during
a number of investigations of compromised ATMs
within the LAC region. This malicious software was
installed both by USB or CD/DVD and by taking
advantage of non-hardened OS configuration.
This enabled attackers to access a covert control
interface on the screen by entering a specific key
sequence in the display, which allowed adversaries
to withdraw money.
S E C T I O N 3 : R E G I O N A L P E R S P E C T I V E S — L A C
115
dISPATCh fROm ThE fIELd:
UnAm CERT provided by the universidad
nacional autónoma de méxico cert
(unam-cert)
UNAM-CERT is responsible for providing incident detection and response
services for the last 21 years within the Universidad Nacional Autónoma de
México (National Autonomous University of Mexico, UNAM). Established in
2001, this agency has been internationally recognized as a member of FIRST
(Forum of Incident Response and Security Teams).
For the last four years, UNAM-CERT has maintained its incident response process
certification under the ISO/IEC 27001:2005 – Information Security Management
System (ISMS) standard. UNAM-CERT also provides other information security
services, such as penetration tests, vulnerabilities assessments, forensic analysis,
security audits, implementation of best practices, specialized training and
awareness promotion for “online safety” in general.
S E C T I O N 3 : R E G I O N A L P E R S P E C T I V E S — L A C
116
Incident Detection and Response
At the beginning of 2013, UNAM-CERT’s framework for threat, pattern and
trend detection was improved with deployment of one server (Darknet) with
8,970 public IP addresses, capturing malware and running tools that simulate
vulnerable services in order to detect attacks. This server simulates 26,910
running honeypots, and all the collected data is shared globally with members
of the Honeynet Project. UNAM-CERT also implemented new infrastructure,
based on 15 Raspberry Pi microcomputers, to detect attacks on malicious
websites and industrial control systems (ICS/SCADA).
During last year, UNAM-CERT worked with other CSIRTs in Latin America to
take down a C&C botnet server on a Mexican website and to report several
phishing incidents related to Mexican financial institutions.
Malware Analysis and Collaboration
UNAM-CERT collaborates with two anti-virus research laboratories, exchanging
the malware samples collected by the Darknet server on a daily basis. Dynamic
and static analyses of malware are performed to determine the potential impact
and risk, and test results are published on www.malware.unam.mx.
S E C T I O N 3 : R E G I O N A L P E R S P E C T I V E S — L A C
117
S E C T I O N 3 : R E G I O N A L P E R S P E C T I V E S — E M E A
118
ASIAPACIfIC(APAC)
The majority of the data collected from compromises
in the APAC region came from our investigations in Australia.
Throughout last year, as with the 2013 Trustwave Global Security
Report, compromise trends within the APAC region closely mirrored
those observed in EMEA.
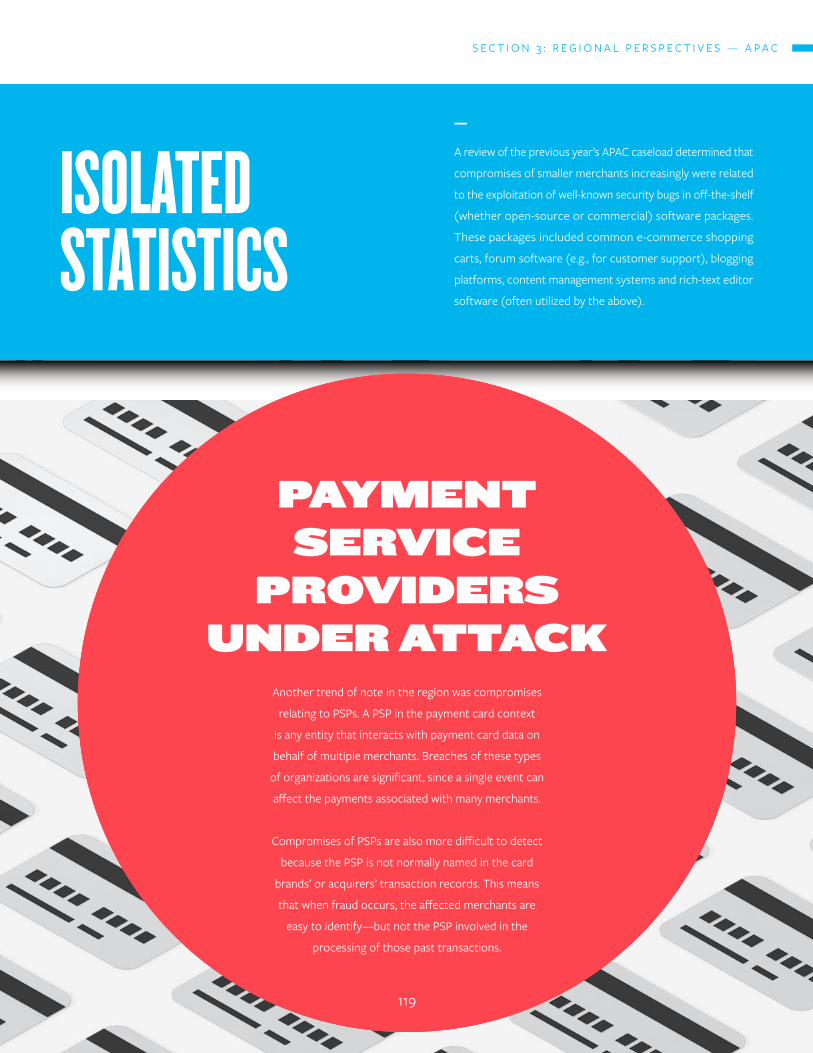
ISOLATEd STATISTICS
—
A review of the previous year’s APAC caseload determined that
compromises of smaller merchants increasingly were related
to the exploitation of well-known security bugs in off-the-shelf
(whether open-source or commercial) software packages.
These packages included common e-commerce shopping
carts, forum software (e.g., for customer support), blogging
platforms, content management systems and rich-text editor
software (often utilized by the above).
paymENT SErviCE
prOvidErS uNdEr aTTaCk
Another trend of note in the region was compromises
relating to PSPs. A PSP in the payment card context
is any entity that interacts with payment card data on
behalf of multiple merchants. Breaches of these types
of organizations are significant, since a single event can
affect the payments associated with many merchants.
Compromises of PSPs are also more difficult to detect
because the PSP is not normally named in the card
brands’ or acquirers’ transaction records. This means
that when fraud occurs, the affected merchants are
easy to identify—but not the PSP involved in the
processing of those past transactions.
S E C T I O N 3 : R E G I O N A L P E R S P E C T I V E S — A P A C
119
nOTABLE EVEnTS & COmPROmISES In APAC
—
During 2013 in APAC, more acquiring banks moved
their merchant portfolio to hosted and redirect-
style payment products, with the goal of simplifying
PCI DSS compliance by reducing the size and
complexity of the merchants’ compliance scope. As
we observed in Europe, we learned of an increase
in compromises of these hosted and redirect-style
environments in APAC. However, compromises of
this type are not yet frequent enough to discourage
acquirers’ efforts to move merchants to these
types of environments. However, attacks are on the
rise, and it is clear that these solutions are not the
cure merchants and acquirers originally thought.
We will continue to monitor how the card brands
and acquiring banks will choose to implement
version 3.0 of the PCI DSS in region, given it reduces
the extent to which these solutions can be used to
minimize merchants’ compliance efforts.
S E C T I O N 3 : R E G I O N A L P E R S P E C T I V E S — A P A C
120
OThEr COmprOmiSES
Outside of the payment card space, Trustwave also investigated a number of compromises of
corporate networks in 2013. These compromises often took a similar form—malware was
uncovered on the internal network when it attempted to ‘phone home’ to some type of botnet command-and-control infrastructure.
Trustwave was then engaged to investigate, and in each case found that systems had been
compromised in drive-by download attacks, usually via a vulnerability in Adobe Acrobat,
Adobe Reader, Adobe Flash or Java.
S E C T I O N 3 : R E G I O N A L P E R S P E C T I V E S — A P A C
121
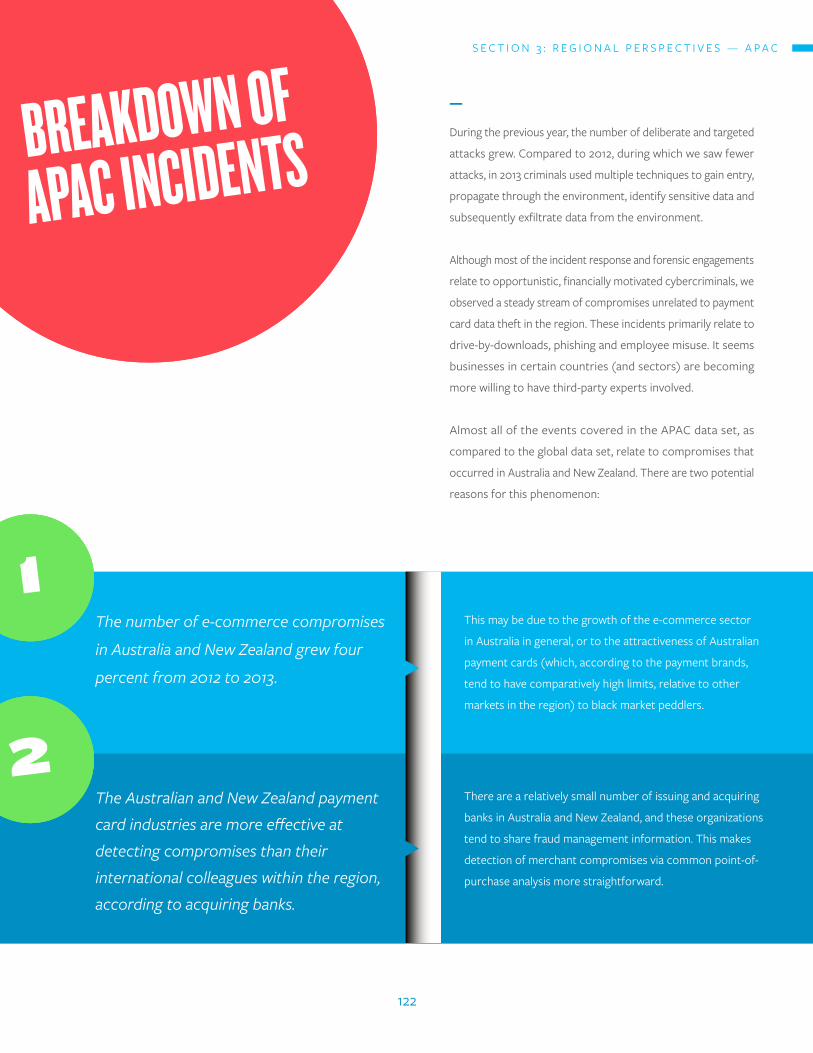
BREAkdOWn Of
APAC InCIdEnTS—
During the previous year, the number of deliberate and targeted
attacks grew. Compared to 2012, during which we saw fewer
attacks, in 2013 criminals used multiple techniques to gain entry,
propagate through the environment, identify sensitive data and
subsequently exfiltrate data from the environment.
Although most of the incident response and forensic engagements
relate to opportunistic, financially motivated cybercriminals, we
observed a steady stream of compromises unrelated to payment
card data theft in the region. These incidents primarily relate to
drive-by-downloads, phishing and employee misuse. It seems
businesses in certain countries (and sectors) are becoming
more willing to have third-party experts involved.
Almost all of the events covered in the APAC data set, as
compared to the global data set, relate to compromises that
occurred in Australia and New Zealand. There are two potential
reasons for this phenomenon:
1
2
The number of e-commerce compromises
in Australia and New Zealand grew four
percent from 2012 to 2013.
The Australian and New Zealand payment card industries are more effective at detecting compromises than their international colleagues within the region, according to acquiring banks.
This may be due to the growth of the e-commerce sector
in Australia in general, or to the attractiveness of Australian
payment cards (which, according to the payment brands,
tend to have comparatively high limits, relative to other
markets in the region) to black market peddlers.
There are a relatively small number of issuing and acquiring
banks in Australia and New Zealand, and these organizations
tend to share fraud management information. This makes
detection of merchant compromises via common point-of-
purchase analysis more straightforward.
S E C T I O N 3 : R E G I O N A L P E R S P E C T I V E S — A P A C
122
Copyright © 2014 Trustwave Holdings, Inc.
—
All rights reserved. This document is protected
by copyright and any distribution, reproduction,
copying or decompilation is strictly prohibited
without the prior written consent of Trustwave.
No part of this document may be reproduced in
any form or by any means without the prior written
consent of Trustwave. While every precaution has
been taken in the preparation of this document,
Trustwave assumes no responsibility for errors or
omissions. Trustwave and Trustwave’s SpiderLabs
names and logos are trademarks of Trustwave.
Such trademarks may not be used, copied or
disseminated in any manner without the prior
written permission of Trustwave.
Corporate Headquarters
—
70 West Madison St.
Suite 1050
Chicago, IL 60602
P: 312 873 7500
F: 312 443 8028
LAC Headquarters
—
Rua Cincinato Braga, 340 nº 71
Edificio Delta Plaza
Bairro Bela Vista - São Paulo - SP
CEP: 01333-010 - BRASIL
P: +55 (11) 4064-6101
EMEA Headquarters
—
Westminster Tower
3 Albert Embankment
London SE1 7SP
P: +44 (0) 845 456 9611
F: +44 (0) 845 456 9612
APAC Headquarters
—
48 Hunter St.
Level 2
Sydney, NSW 2000
P: +61 0 2 9466 5800
F: +61 0 2 9466 5899
—
www.trustwave.com