
2014 Trends in Public Service Announcements (PSAs)
13
-
Upload
julia-mcdowell -
Category
Marketing
-
view
48 -
download
0
Transcript of 2014 Trends in Public Service Announcements (PSAs)

Williams Whittle is focused on attaining superior results for nonprofits through creative
integrated marketing. We create relationships with new audiences for nonprofits through
national awareness campaigns., whether the goal is to raise volunteerism, funds or action.
With more than 10 years of experience in creating, producing, distributing, tracking and
promoting PSAs, we consider ourselves experts in this specialized media. Want to know
how they can work for your nonprofit? Contact us, we’re always happy to chat.
Rob Whittle
WilliamsWhittle.com 2
President & CEO
703-836-9222 x124

KEY FINDINGS
• We are continuing to see major steps in digital distribution with only 1 out of 5
stations preferring a tape. But, while 90% of PSA Directors said that a digital-only
campaign would not decrease the likelihood of a PSA getting on air, our digital-
only clients’ results are not as strong as our hard-copy clients’ resultsonly clients results are not as strong as our hard copy clients results.
• The number of PSAs being sent to stations has stayed steady over the past several
years. PSA Directors are still indicating that they (on average) receive 20 or fewer
PSAs per week, with radio on the higher side and TV on the lower end of that
amountamount.
• Stations are very open to promotional messages, such as holiday-specific PSAs.
But, keep in mind 57% of stations said they would like to receive the materials a
month before they should air. Planning is key if you want your timing-specific
message to make it on the airwavesmessage to make it on the airwaves.
• Stations are indicating, for the fourth year in a row, that PSA inventory is highest in
January, February, July and December.
• The two most important factors that affect whether a PSA will make it on air are:
1) the PSA having a local angle and 2) if a particular station has unsold airtime1) the PSA having a local angle and 2) if a particular station has unsold airtime.
• For the first time, we asked stations whether they would air accompanying PSA
materials and they overwhelmingly said “yes.” Check out page 13 for a list.
A note about our methodology: This annual PSA preferences survey was distributed to approximately
1,425 TV and radio stations nationwide in February 2014.
WilliamsWhittle.com 3

TV PREFERENCES
Only 20% of TV stations prefer tapes as the main method of PSA
delivery. A whopping 60% prefer digital downloads (up from 50%
last year and 35% in 2013) with more than 20% noting they’d like
TAPE PREFERENCE ON A DOWNWARD TREND
to preview the PSA first and then request materials.
51% 29% 20%
Stations that indicated “I prefer to receive a PSA on a tape (BetaSP or other)…”
2012 2013 2014
Most importantly, 9 out of 10 PSA Directors at TV stations said
that sending a PSA only by digital delivery would not decrease
the likelihood of a PSA getting on air.
WilliamsWhittle.com 4

TV PREFERENCES, CONT’D
More than 60% of the TV stations that participated in the survey
say that they receive 50% or more of their PSAs via digital
downloads (up from 50% last year) with 13% of stations receiving
all of their PSAs via digital. Not surprisingly, 85% of TV stations
prefer HD formats.
Th l TV SPOT LENGTH PREFERENCE The most popular spot
lengths are the :30,
:15, and :10, with the
longer spots at :60
:90 12%
TV SPOT LENGTH PREFERENCE
longer spots at :60
and :90 ranked 4th
and 7th, respectively.:20
:30
:60 48%
88%
40%
And while we’ve had
great success receiving
airings when we’ve :05
:10
:15 71%
50%
26%
distributed spots with :05 26%
a direct ask for donations, 69% of stations said they would not run them.
WilliamsWhittle.com 5

RADIO PREFERENCES
About 3 out of 4 PSA Directors at radio stations said that they
prefer digital downloads and sending by digital-only will not
decrease the likelihood of the PSA getting onto their airwaves.
:60 56%
RADIO SPOT LENGTH PREFERENCE The most popular spot
lengths are the :30
and :60. Short spots
:15
:20
:30 87%
11%
24%
like the :05 ad-let and
long spots like a :90
are not popular on
:10 8%radio, with 5% of
stations preferring them.
PSAs RECEIVED PER WEEK: TV VS. RADIOTV Radio TV Radio TV Radio
PSAs RECEIVED PER WEEK: TV VS. RADIO
While most TV stations run 10 or fewer PSAs a week (52%), 46%
Fewer than 10 PSAs per week
10-30 PSAs perweek
31-40+ PSAs perweek
WilliamsWhittle.com 6
( ),
of radio stations run 20 or more PSAs per week.

CAMPAIGN ACTIVITY
For yet another year, the number of PSA campaigns that stations
say they are receiving has stayed at the same level. Nine out of
10 stations say they receive 20 or fewer PSAs a week, with half
HOW MANY PSAS DO YOU RECEIVE PER WEEK?
saying they receive 10 or fewer a week.
54%
HOW MANY PSAS DO YOU RECEIVE PER WEEK?
14%
10 or fewer 10-20 21-40+
32%
Stations generally run fewer than 30 campaigns a week, with
25% running fewer than 10 per week and 31% running 10-20 per g p g p
week. Once a PSA is in rotation, 22% of stations say they will run
it indefinitely. But, half will run it from 1-6 months (compared to
51% last year and 59% in 2012.)
WilliamsWhittle.com 7

PSA LIFESPAN
Exactly half of the stations have no preference (50%) whether a
PSA has a long live period or a short one, but 40% prefer an
evergreen message. Only 10% prefer a timing specific message –
almost all of which are radio stations.
Those stations that will accept a PSA with specific airing
instructions, the majority (57%) would like to receive the materials
a month before they should air.
13% 57% 19%
DELIVERY OF TIME-SENSITIVE PSAsStations would prefer PSAs that have a specific time for airing this far in advance…
11%13% 57% 19%
A f
11%
It A week before
A month before
A few months before
It doesn’t matter
WilliamsWhittle.com 8

PROMOTIONAL MESSAGES
Stations are open to specific promotional PSAs, such as holiday-
specific messaging. Most of the stations were neutral (62.5%),
saying that holiday themed messaging doesn’t make a difference
to them (“A PSA is a PSA.”) and 28% of stations said “Yes, I prefer
a specific holiday message.”
HOLIDAY PSAs The majority of
28% 9%
HOLIDAY PSAs“I prefer PSAs that incorporate a holiday message…”
63%
The majority of
stations (85%, up
from 80% last year)
said they would
Yes No Doesn’t Matter
purposely place a
PSA on air based
on its relevancy in
flu-epidemic, a hurricane or other natural disaster. If your
organization can pre-produce these types of messages, you will
h ll d d b
the news, like a
get maximum airtime with a well-timed distribution.
WilliamsWhittle.com 9
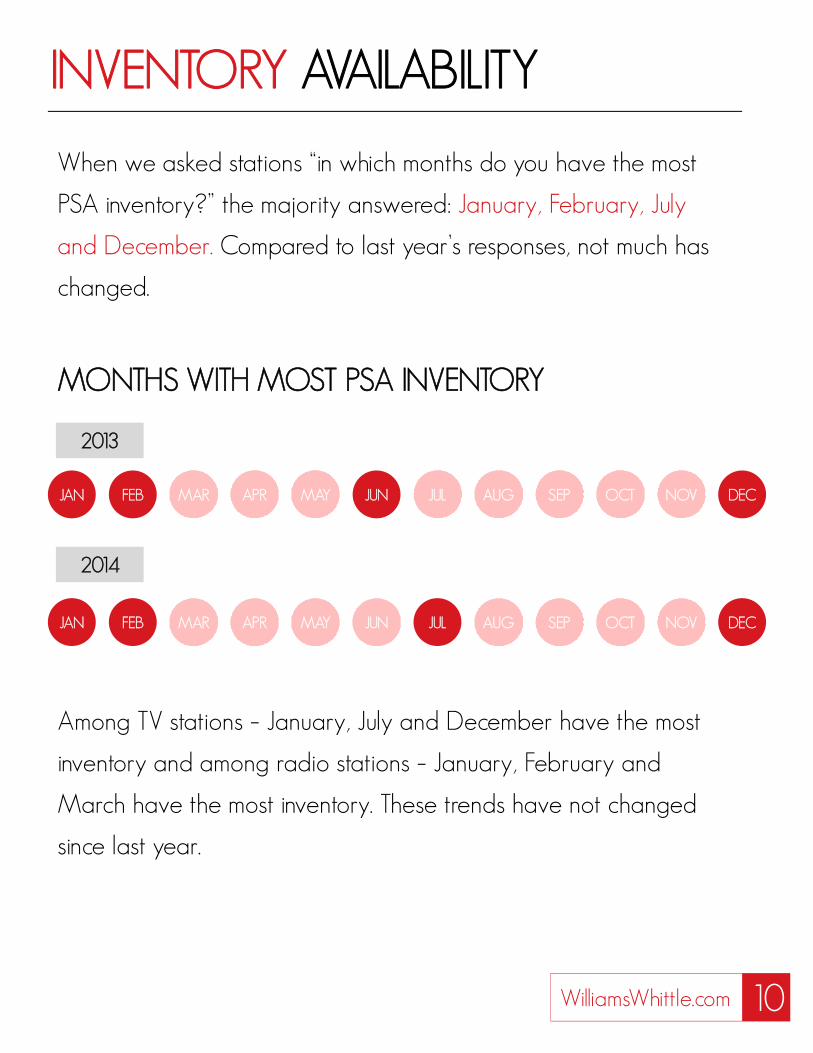
INVENTORY AVAILABILITY
When we asked stations “in which months do you have the most
PSA inventory?” the majority answered: January, February, July
and December. Compared to last year’s responses, not much has
changed.
MONTHS WITH MOST PSA INVENTORY
APR JUNMAYFEB MARJAN OCT DECNOVAUG SEPJUL
2013
2014
APR JUNMAYFEB MARJAN OCT DECNOVAUG SEPJUL
Among TV stations – January, July and December have the most
inventory and among radio stations – January, February and
March have the most inventory. These trends have not changed
since last year.
WilliamsWhittle.com 10

DETERMING FACTORS
Each station has their own unique set of qualifying factors that
affect whether a PSA will make it on air. The spot having a local
angle has been the top factor for three years now.
70% 62%
It appeals to our local audience
Availability ofairtime
52%42%
Creative qualityof the spot
Alignment with station policies/partners
35%
Well executed packaging
34%
Variety of lengths of
WilliamsWhittle.com 11
Well executed packaging and messaging
Variety of lengths of PSAs available

SUBJECT MATTER
Almost 70% of PSA directors say they have no favorite PSA
subject matter, but 30% had opinions (in order of popularity):
• Education#1• Education
• Children-focused
• Environmental
#1
#2
#3 Environmental
• Military
• Diseases/Health
3
#4
#5 seases ea h
• Poverty/Hunger
• Animals
5
#6
#7
Other categories that got preference, but less than 10%, are the
arts, disaster relief, elderly, financial, sports and diversity. But, it’s
l i t t t t PSA Di t k d l f “ b t also important to note many PSA Directors asked only for upbeat
messages.” Find a way to keep it positive!
WilliamsWhittle.com 12

NEW QUESTIONS
This year, we asked PSA directors two new questions.
Does the use of a celebrity in the PSA have an impact on your
decision to air?
Almost 80% says it doesn’t matter, while 11% say they prefer
messages without celebrities (17% of TV stations and 6% of radio
stations.) TV stations often have conflicts of interest running
celebrities that are stars in other networks’ shows, so it is not
surprising that radio stations are much more open to celebrity
messages.
Do you run other accompanying PSA materials?
A t d t ti t h l i fit i As expected, stations are open to helping a nonprofit message in
other ways, which reveals tremendous opportunities beyond PSAs:
Talk about Issues on air
Web banners on their news site
#1
#2 Web banners on their news site
Incorporate the message into news stories
Promote the message internally to their employees
2
#3
#4
WilliamsWhittle.com 13


