2014 TELL MNPS Survey School Improvement Guide Insert date here.
81
2014 TELL MNPS Survey School Improvement Guide Insert date here
-
Upload
maurice-harrington -
Category
Documents
-
view
216 -
download
1
Transcript of 2014 TELL MNPS Survey School Improvement Guide Insert date here.

2014 TELL MNPS Survey School Improvement Guide
Insert date here

Copyright © 2014 New Teacher Center. All Rights Reserved.
Welcome
• Insert your own welcome statement here

Copyright © 2014 New Teacher Center. All Rights Reserved.
Training Objectives
• Become familiar with your school’s data from the 2014 survey results and the website
• Understand the drill down process in order to
analyze the data • Be able to unpack, disseminate and discuss
teaching conditions data to create action items for school improvement

Copyright © 2014 New Teacher Center. All Rights Reserved.
Agenda• Connecting to the Data• Setting the Context• Drilling Down into the Data
• Understanding the Constructs• Examining Items• Analyzing and Discussing a specific Item
• Creating an Action Plan

Copyright © 2014 New Teacher Center. All Rights Reserved.
Norms for the Discussion
•Equity of Voice•Active Listening•Safety to Share Different Perspectives•Confidentiality•Other? ____________

Copyright © 2014 New Teacher Center. All Rights Reserved.
Day and Night Partners• Find a Day partner who has a very different job than
you. Write their name in your Day section and be sure they write your name in their Day section
• Move on and go to a new person who has a similar job or content area and write each others’ names in your Night sections
• Return to your seat

Copyright © 2014 New Teacher Center. All Rights Reserved.
Connector Directions
1. Read the rating system2. Reflect upon each Teaching Condition Construct and
rate them from 1 (low) – 4 (high)3. Reflect and write a few notes about each Teaching
Conditions Construct4. Find your Day partner and share out key points for 2
minutes each

Copyright © 2014 New Teacher Center. All Rights Reserved.
ConnectorCONSTRUCT #
RATIONALE
Positive Aspects Challenging Aspects
TIME
FACILITIES AND RESOURCES
COMMUNITY SUPPORT
MANAGING STUDENT CONDUCT
TEACHERLEADERSHIP
SCHOOLLEADERSHIP
PROFESSIONALDEVELOPMENT
INSTRUCTIONAL PRACTICES AND SUPPORT

Copyright © 2014 New Teacher Center. All Rights Reserved.
Setting the Context
CUSTOMIZE FOR YOUR PRESENTATION• Rationale for taking the survey• Information about the Survey

Copyright © 2014 New Teacher Center. All Rights Reserved.
What We Know about Teaching Conditions
•It matters for kids
•It matters for teacher retention
•Principals and teachers view teaching conditions differently

Copyright © 2014 New Teacher Center. All Rights Reserved.
Reform is a Long Term Process
According to new research by Linda Darling-
Hammond, it takes 30 – 100 hours of
professional development extended over a 6 –
12 month period to affect change in the
classroom
Copyright © 2014 New Teacher Center. All Rights Reserved.
Uses of the Data
•As a baseline for improvement
•As a metric (a way to measure) for improvement
•As a way to help us prioritize our needs to inform our school improvement plan

Copyright © 2014 New Teacher Center. All Rights Reserved.
“Using the Survey Results Effectively” Article
1. Read the article, taking notes on the Reflection work sheet
2. Respond to the prompts on the Reflection worksheet
3. Group Debrief

Copyright © 2014 New Teacher Center. All Rights Reserved.
Data Drill Down ProcessExamine the Construct Indicators
Determine a Construct of Focus
Examine Items Within the Construct
Determine an Item of Focus
Analyze Individual
ItemsDevelop
Plan

Copyright © 2014 New Teacher Center. All Rights Reserved.
Basic TELL Vocabulary
• TELL – Teaching, Empowering , Leading and Learning• Teaching Conditions – the systems, relationships, resources,
environments and people in your school that affect your ability to teach (or learn) at a high level
• Construct – a grouping of several specific questions, all dealing with the same topic
• Time, Facilities and Resources, Community Support and Involvement, Managing Student Conduct, Teacher Leadership, School Leadership, Professional Development, and Instructional Practices and Support
• Item – a specific individual question

Copyright © 2014 New Teacher Center. All Rights Reserved.
http://tellmnps.org

Copyright © 2014 New Teacher Center. All Rights Reserved.
Find your School
Example Screenshot

Copyright © 2014 New Teacher Center. All Rights Reserved.
What Do the Numbers Mean?
Example Screenshot

Copyright © 2014 New Teacher Center. All Rights Reserved.
Impact of % Completing the Survey
• Within schools in your district, there is a wide range of percentage of educators who completed the survey
• With an elbow partner, reflect upon what those varieties of percentages can mean for your school?
• Why are the percentages important to know?

Copyright © 2014 New Teacher Center. All Rights Reserved.
Access to the Detailed Results
Example Screenshot

Copyright © 2014 New Teacher Center. All Rights Reserved.
Detailed Results
Example Screenshot

Copyright © 2014 New Teacher Center. All Rights Reserved.
Access to the Summary Results
Example Screenshot

Copyright © 2014 New Teacher Center. All Rights Reserved.
Summary Results
Example Screenshot

Copyright © 2014 New Teacher Center. All Rights Reserved.
Access to the Comparison Results
Example Screenshot

Copyright © 2014 New Teacher Center. All Rights Reserved.
Comparison Report
Example Screenshot

Copyright © 2014 New Teacher Center. All Rights Reserved.
BREAK TIME !
Place this wherever needed.
Copyright © 2014 New Teacher Center. All Rights Reserved.
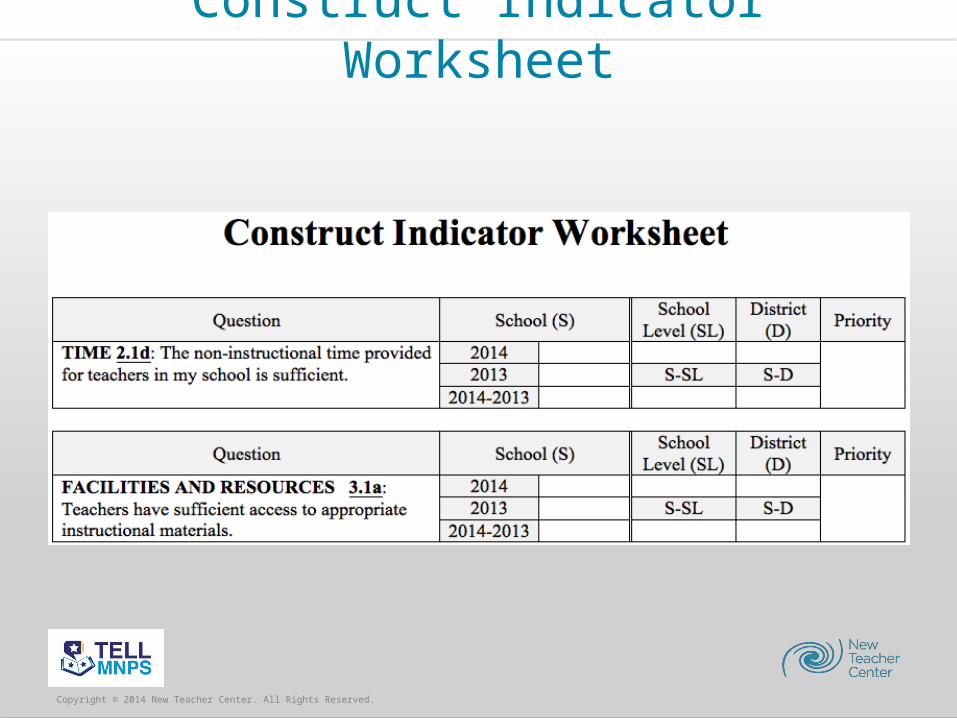
Construct Indicator Worksheet

Copyright © 2014 New Teacher Center. All Rights Reserved.
Summary Report – Finding Your School Data
District Level School
DistrictLevelSchool

Copyright © 2014 New Teacher Center. All Rights Reserved.
Construct Indicator WorksheetMarking Your School Data
55.2

Copyright © 2014 New Teacher Center. All Rights Reserved.
Summary Report – Finding Your School Level Data
District Level School
DistrictLevelSchool

Copyright © 2014 New Teacher Center. All Rights Reserved.
Construct Indicator WorksheetMarking Your School Data
55.2 67.3

Copyright © 2014 New Teacher Center. All Rights Reserved.
Summary Report – Finding Your District Data
District Level School
DistrictLevelSchool

Copyright © 2014 New Teacher Center. All Rights Reserved.
Construct Indicator WorksheetMarking Your District Data
55.2 67.3 66.9

Copyright © 2014 New Teacher Center. All Rights Reserved.
Summary Results Comparison Report – Results from 2013
School Name School2014
School2013

Copyright © 2014 New Teacher Center. All Rights Reserved.
Construct Indicator WorksheetMarking Your Data From 2013
55.2 67.3 66.935.8

Copyright © 2014 New Teacher Center. All Rights Reserved.
Construct Indicator WorksheetCalculate Growth from 2013 to 2014
55.2 67.3 66.935.819.4

Copyright © 2014 New Teacher Center. All Rights Reserved.
Compare Your School Data to the School Level Data
55.2 67.3 66.935.819.4 -12.1

Copyright © 2014 New Teacher Center. All Rights Reserved.
Compare Your School Data to the District Data
55.2 67.3 66.935.819.4 -12.1 -11.7

Copyright © 2014 New Teacher Center. All Rights Reserved.
Prioritize the Constructs
• Prioritize the Constructs on your own• “1” = highest priority; “8” = lowest priority
• Compare your list with your table group• Together decide upon a common list• Record your greatest STRENGTH on a yellow post-it
note• Record your greatest NEED on a blue post-it note

Copyright © 2014 New Teacher Center. All Rights Reserved.
Prioritize the Constructs
55.2 67.3 66.935.819.4 -12.1 -11.7
2
6xx.x xx.x xx.xxx.xxx.x xx.xxx.x

Copyright © 2014 New Teacher Center. All Rights Reserved.
Construct a Consensogram
• Have 1 person at your table place your yellow STRENGTH post-it above the appropriate construct on the poster
• Place your blue NEED post-it above its construct as well • If there is already a post-it at the bottom of the chart,
place your post-it above that one to make a bar chart

Copyright © 2014 New Teacher Center. All Rights Reserved.
Consensogram
2.1A 2.1B 2.1C 2.1D 2.1E

Copyright © 2014 New Teacher Center. All Rights Reserved.
Consensogram Findings
• Examine the consensogram findings• Are there any patterns?• Which Constructs stand out?• Which Constructs are sparsely posted?• What does this tell us about how we perceive our
school’s teaching conditions?

Copyright © 2014 New Teacher Center. All Rights Reserved.
It’s How You See Things

Copyright © 2014 New Teacher Center. All Rights Reserved.
Range of % Agreement
District Level School
DistrictLevelSchool

Copyright © 2014 New Teacher Center. All Rights Reserved.
Construct Item Work Sheet

Copyright © 2014 New Teacher Center. All Rights Reserved.
Choose an Item of interest
Narrow your focus even further by prioritizing your Items for this Construct
• Your item of focus does NOT have to be your lowest item score
• You and your faculty know the context of your school. Use that knowledge to choose an item of greatest impact to explore further

Copyright © 2014 New Teacher Center. All Rights Reserved.
Item Consensogram
•Have 1 person at your table place your yellow 1st choice post-it above the appropriate Item letter on the poster
•Place your blue 2nd choice post-it above its item letter as well
• If there is already a post-it at the bottom of the chart, place your post-it above that one to make a bar chart

Copyright © 2014 New Teacher Center. All Rights Reserved.
Item Consensogram Findings
• Examine the Consensogram findings• Are there any patterns?• Which Items are most populated?• Which Items can we rule out?• What does this tell us about our current needs?

Copyright © 2014 New Teacher Center. All Rights Reserved.
Detailed Report
•The Detailed Report gives more specific information about how strongly people feel about the teaching condition
•Notice the indicators range from Strongly Disagree, Disagree, Agree to Strongly Agree.
•N = number of people who responded•DK = People who answered, “Don’t Know”

Copyright © 2014 New Teacher Center. All Rights Reserved.
Detailed Report
District NameSchool LevelSchool Name
State
School Level
District
School
EXAMPLE SCREENSHOT

Copyright © 2014 New Teacher Center. All Rights Reserved.
Detailed Report Makes the data more Real
• In the example in item 2.1A, the equation would be: 41 (N) x .12 (strongly disagree) = 4.92. So about 5 of the 41 people strongly disagreed that they have time available to collaborate with their colleagues.
• Take 2 minutes now to review the Detailed Report data for our question
• What conclusions can your draw about our teaching conditions from this additional information?

Copyright © 2014 New Teacher Center. All Rights Reserved.
What about N ?
•Does N match the number of teachers at your school?
•What if N = 41, but there are 80 teachers at your school?
•What does that indicate?

Copyright © 2014 New Teacher Center. All Rights Reserved.
Two Methods for Examining Individual Items
•A linear process for Analyzing an Item
• Individual Item Prompts for guiding reflective conversations

Copyright © 2014 New Teacher Center. All Rights Reserved.
Process for Analyzing an Identified Item
What is working?
What is not working?
What would be ideal?
What are challenges
to achieving the ideal?

Copyright © 2014 New Teacher Center. All Rights Reserved.
Fill in your own “What’s Working”

Copyright © 2014 New Teacher Center. All Rights Reserved.
What’s Working? What’s Not?

Copyright © 2014 New Teacher Center. All Rights Reserved.
Where are we Going?

Copyright © 2014 New Teacher Center. All Rights Reserved.
Ideal Example
Copyright © 2014 New Teacher Center. All Rights Reserved.
Brainstorm Ideal Situations
•Find your Night Partner•Pair up with another set of Night Partners•Brainstorm a list of Ideal situations regarding
our item

Copyright © 2014 New Teacher Center. All Rights Reserved.
Graffiti Wall Directions
• Stand by your assigned poster• Record 3 or 4 Challenges to the Ideal• Brainstorm as many ways to overcome those challenges
as possible (8 minutes)• Rotate to next station Ideal at the signal (4 minutes per
station)• Return to your original poster and reflect upon ideas
added by your colleagues

Copyright © 2014 New Teacher Center. All Rights Reserved.
Graffiti Wall Ideals___________________
CHALLENGE #1 CHALLENGE # 2 CHALLENGE # 3
Ways to Overcome Ways to Overcome Ways to Overcome
Copyright © 2014 New Teacher Center. All Rights Reserved.
Individual Item Prompts
• Are used to guide reflective, collaborative conversations about specific school conditions
• Are a series of reflective prompts for nearly every question in the survey and are available on-line
• Are not the only questions to ask, but provide a starting point for dialogue

Copyright © 2014 New Teacher Center. All Rights Reserved.
Sample Item Prompt

Copyright © 2014 New Teacher Center. All Rights Reserved.
2.1D: Reflections

Copyright © 2014 New Teacher Center. All Rights Reserved.
Item Prompt Discussion
•Assign a Facilitator, Recorder and Reporter•Reflect upon these questions, or discuss any
other questions that arise ON TOPIC•Record the group’s thoughts•Pay attention to collaborative norms•Be ready to share key points

Copyright © 2014 New Teacher Center. All Rights Reserved.

Copyright © 2014 New Teacher Center. All Rights Reserved.
Creating an Action Plan

Copyright © 2014 New Teacher Center. All Rights Reserved.

Copyright © 2014 New Teacher Center. All Rights Reserved.

Copyright © 2014 New Teacher Center. All Rights Reserved.
SMART GOALS
•Specific•Measurable and Observable•Attainable•Realistic•Timely

Copyright © 2014 New Teacher Center. All Rights Reserved.

Copyright © 2014 New Teacher Center. All Rights Reserved.
Creating Objectives
•Come to consensus about a single objective by combining dominant ideas.
•Place a Check by key nouns that are repeated - Time, Planning, Meeting
•Underline key verbs/adverbs that are repeated – Meet Efficiently, Listen carefully,
Copyright © 2014 New Teacher Center. All Rights Reserved.
Spell Out Success
•What does your Objective look like specifically?•Turn to an elbow partner behind you, someone
NOT at your table, and describe your image of success with this objective (4 minutes)

Copyright © 2014 New Teacher Center. All Rights Reserved.

Copyright © 2014 New Teacher Center. All Rights Reserved.
2 + 2 = 4 Directions
•Write one step that is critical for meeting our objective in the first box.
•Share that idea with another person and write their idea in the second box.
•Go to another person, give her your 2 ideas and record her 2 ideas on your paper.

Copyright © 2014 New Teacher Center. All Rights Reserved.

Copyright © 2014 New Teacher Center. All Rights Reserved.
3 Finger Voting
• Each person is allowed 3 votes.• You can use all 3 fingers to vote for one
answer you feel strongly about, or use 1 vote to count for 3 different choices.
• Or you can vote two fingers for choice #1, and one finger for choice #2, etc…
• Count scores at the end to determine which Steps to use.

Copyright © 2014 New Teacher Center. All Rights Reserved.
Finish the Action Plan
• Fill in the assigned section of the Action Plan with your table group
• What must be included?• How will we know we succeeded?• What resources are needed?• By Whom? / By When?
• Report out• Commit to the goal

Copyright © 2014 New Teacher Center. All Rights Reserved.
Congratulations !! We DID IT !
• This is only the beginning!! • We’ve worked and identified an area for growth• We’ve made an action plan for HOW we’ll improve• Now we have to DO it

Copyright © 2014 New Teacher Center. All Rights Reserved.
Questions and Evaluation Sheet