2014 Survey of Travelers to Japan from Eight Asian …...respondents showed interest in ramen, udon,...
30
1. Japan is seeing a huge increase in tourists from overseas. According to the Japan National Tourist Organization, a total of 10,360,000 tourists visited Japan in 2013. This was a 24-percent rise over the previous year and the first time the number surpassed 10 million. Eighty percent of these were visitors from Asia, with Taiwan and Korea leading the way with more than two million visitors per year. Since the Japanese government relaxed its visa requirements for travelers from Asia in July 2013, the number of visitors from Thailand, Malaysia, Indonesia and elsewhere in Southeast Asia has risen markedly. Nonetheless, when viewed in terms of the number of foreign visitors per capita, Japan’s ratio of 8.1 percent is a mere one-third of that of Korea 1 , to say nothing of the figures for France (131.3 percent) and Italy (78.8 percent). Clearly, Japan still has some way to go. 2. Since 2012, DBJ has carried out an annual Survey of Travelers to Japan from Eight Asian Regions. This year’s survey was conducted in September in the form of an online questionnaire. As in previous years, the respondents were residents of eight regions in Asia 2 with experience of international travel. 3. The 2014 survey found Japan to be the most popular tourist destination among the whole eight-region group – even more popular this year than in the previous two. Some 70 percent of respondents from Taiwan and Hong Kong expressed the desire to visit Japan, as did some 60 percent of those from Malaysia, Thailand, and Singapore. Indonesian respondents wishing to travel to Japan increased by six percentage points over last year, suggesting that the easing of visa requirements is having an effect (p. 2, 3). 4. Continuing a trend observed in the previous two surveys, the current poll revealed that the areas enjoying greatest recognition were the “Golden Route,” stretching from Tokyo to Osaka, and Hokkaido. This was also where they most wanted to go (p. 17-19). Mt. Fuji showed conspicuous annual growth in the number of actual visits, at least partly as a result of its designation as a World Heritage Site in June of last year (p. 7). 5. Respondents who had been to Japan reported staying at traditional inns (ryokan), luxury hotels, and inexpensive hotels in approximately equal percentages. However, when asked where they would like to stay on a future trip to Japan, an overwhelming percentage of respondents from all regions said they hoped to stay at a traditional inn. The survey found that more respondents would be interested in bathing in hot springs or communal baths if they were able to wear bathing suits or other covering, pointing to latent demand for traditional inns, hot springs resorts, and communal bathing facilities (p. 6, 22). 6. Questions about dining drew diverse responses. In addition to such traditional Japanese foods as sushi and sashimi, respondents showed interest in ramen, udon, and other noodle dishes, as well as sake, seafood, fruit and a wide variety of other products of Japan’s farms and fisheries. Growing interest in traveling to Japan, and the national qualities represented by Japanese food, can translate into overseas business development for products such as sake, Japanese sweets, porcelain and ceramics, and stationery by providing them with added value (p.28). 7. Most respondents showed little interest in the upcoming Olympics, with the exception of those from China. Asked if they knew the location of the 2020 Olympics, over half replied that they did not know or did not care. This result suggests that greater publicity efforts are needed to spur interest in the Tokyo Olympics (p.26). 8. The easing of visa requirements implemented in July 2013 was well known in each of the regions surveyed. Moreover, extremely high percentages said they knew of the measures and had visited Japan, or knew of the measures and wanted to visit. Interest was particularly strong among those who had not yet traveled to Japan. The measures have clearly been effective in encouraging inbound tourism (p.27). 9. The greatest concerns among visitors were communication, cost, radioactivity, and earthquakes (p.24). People throughout East Asia remain highly concerned about issues deriving from the 2011 earthquake and tsunami. These worries have eased somewhat, however, since the previous survey. The provision of broad-ranging, accurate information continues to be of utmost importance (p.25). 10. Dissatisfaction with language, cost, and communication – the “travel environment” – was conspicuous in the answers to this survey. Respondents reported significant unhappiness with content, which differed according to nationality. Chinese respondents voiced dissatisfaction with shopping; those from Southeast Asia with gambling and nightlife (p.13, 14). Future inbound tourism initiatives will need careful marketing and must take into account the nationalities of those to whom they are aimed. A Destination Management Organization (DMO) should be created to manage the work of the entities involved. A more strategic approach, involving region-wide efforts to promote the branding of each area’s tourism resources, will go far to enhance future initiatives. 1 Calculated by DBJ based on the UN, World Population Prospects: The 2012 Revision and Japan National Tourist Organization materials. 2 The survey was aimed at nationals of eight regions: Korea, China, Taiwan, Hong Kong, Thailand, Singapore, Malaysia, and Indonesia. Takako Naito, Ryuichi Seto, Masataka Hokama November 4, 2014 Report of the Regional Planning Department Development Bank of Japan Inc. 2014 Survey of Travelers to Japan from Eight Asian Regions REGIONAL STRATEGIES INCLUDE SKILLFUL MARKETING, BRANDING OF TOURIST AREAS PRODUCTS SHOWCASING JAPAN’S CUISINE AND OTHER TRADITIONS PROMOTE BUSINESS DEVELOPMENT AND TIE-UPS OVERSEAS
Transcript of 2014 Survey of Travelers to Japan from Eight Asian …...respondents showed interest in ramen, udon,...

1. Japan is seeing a huge increase in tourists from overseas. According to the Japan National Tourist Organization, a total of 10,360,000 tourists visited Japan in 2013. This was a 24-percent rise over the previous year and the first time the number surpassed 10 million. Eighty percent of these were visitors from Asia, with Taiwan and Korea leading the way with more than two million visitors per year. Since the Japanese government relaxed its visa requirements for travelers from Asia in July 2013, the number of visitors from Thailand, Malaysia, Indonesia and elsewhere in Southeast Asia has risen markedly. Nonetheless, when viewed in terms of the number of foreign visitors per capita, Japan’s ratio of 8.1 percent is a mere one-third of that of Korea1, to say nothing of the figures for France (131.3 percent) and Italy (78.8 percent). Clearly, Japan still has some way to go.
2. Since 2012, DBJ has carried out an annual Survey of Travelers to Japan from Eight Asian Regions. This year’s survey was conducted in September in the form of an online questionnaire. As in previous years, the respondents were residents of eight regions in Asia2 with experience of international travel.
3. The 2014 survey found Japan to be the most popular tourist destination among the whole eight-region group – even more popular this year than in the previous two. Some 70 percent of respondents from Taiwan and Hong Kong expressed the desire to visit Japan, as did some 60 percent of those from Malaysia, Thailand, and Singapore. Indonesian respondents wishing to travel to Japan increased by six percentage points over last year, suggesting that the easing of visa requirements is having an effect (p. 2, 3).
4. Continuing a trend observed in the previous two surveys, the current poll revealed that the areas enjoying greatest recognition were the “Golden Route,” stretching from Tokyo to Osaka, and Hokkaido. This was also where they most wanted to go (p. 17-19). Mt. Fuji showed conspicuous annual growth in the number of actual visits, at least partly as a result of its designation as a World Heritage Site in June of last year (p. 7).
5. Respondents who had been to Japan reported staying at traditional inns (ryokan), luxury hotels, and inexpensive hotels in approximately equal percentages. However, when asked where they would like to stay on a future trip to Japan, an overwhelming percentage of respondents from all regions said they hoped to stay at a traditional inn. The survey found that more respondents would be interested in bathing in hot springs or communal baths if they were able to wear bathing suits or other covering, pointing to latent demand for traditional inns, hot springs resorts, and communal bathing facilities (p. 6, 22).
6. Questions about dining drew diverse responses. In addition to such traditional Japanese foods as sushi and sashimi, respondents showed interest in ramen, udon, and other noodle dishes, as well as sake, seafood, fruit and a wide variety of other products of Japan’s farms and fisheries. Growing interest in traveling to Japan, and the national qualities represented by Japanese food, can translate into overseas business development for products such as sake, Japanese sweets, porcelain and ceramics, and stationery by providing them with added value (p.28).
7. Most respondents showed little interest in the upcoming Olympics, with the exception of those from China. Asked if they knew the location of the 2020 Olympics, over half replied that they did not know or did not care. This result suggests that greater publicity efforts are needed to spur interest in the Tokyo Olympics (p.26).
8. The easing of visa requirements implemented in July 2013 was well known in each of the regions surveyed. Moreover, extremely high percentages said they knew of the measures and had visited Japan, or knew of the measures and wanted to visit. Interest was particularly strong among those who had not yet traveled to Japan. The measures have clearly been effective in encouraging inbound tourism (p.27).
9. The greatest concerns among visitors were communication, cost, radioactivity, and earthquakes (p.24). People throughout East Asia remain highly concerned about issues deriving from the 2011 earthquake and tsunami. These worries have eased somewhat, however, since the previous survey. The provision of broad-ranging, accurate information continues to be of utmost importance (p.25).
10. Dissatisfaction with language, cost, and communication – the “travel environment” – was conspicuous in the answers to this survey. Respondents reported significant unhappiness with content, which differed according to nationality. Chinese respondents voiced dissatisfaction with shopping; those from Southeast Asia with gambling and nightlife (p.13, 14). Future inbound tourism initiatives will need careful marketing and must take into account the nationalities of those to whom they are aimed. A Destination Management Organization (DMO) should be created to manage the work of the entities involved. A more strategic approach, involving region-wide efforts to promote the branding of each area’s tourism resources, will go far to enhance future initiatives.
1 Calculated by DBJ based on the UN, World Population Prospects: The 2012 Revision and Japan National Tourist Organization materials. 2 The survey was aimed at nationals of eight regions: Korea, China, Taiwan, Hong Kong, Thailand, Singapore, Malaysia, and Indonesia.
Takako Naito, Ryuichi Seto, Masataka Hokama
November 4, 2014 Report of the Regional Planning Department
Development Bank of Japan Inc.
2014 Survey of Travelers to Japan from Eight Asian Regions REGIONAL STRATEGIES INCLUDE SKILLFUL MARKETING, BRANDING OF TOURIST AREAS
PRODUCTS SHOWCASING JAPAN’S CUISINE AND OTHER TRADITIONS PROMOTE BUSINESS DEVELOPMENT AND TIE-UPS OVERSEAS

This work is protected under the Copyright Act. In accordance with the terms of the Copyright Act, we request that any quotes from this work clearly state “Source: Development Bank of Japan Inc.”
None of the material contained in this work may be quoted or reproduced, in whole or in part, without the consent of DBJ.
Please contact Development Bank of Japan Inc., Regional Planning Department.
Telephone: +81-3-3244-1100 Email: [email protected] Website: http://www.dbj.jp/
2 This survey had two new questions, regarding the type of lodgings used (p. 6) and the type of lodgings desired for a future trip (p. 22).
1 This questions and choices in this survey may differ from those in the previous survey. Some parts have been added or changed.
3. The previous survey had respondents rate each item on scale of 1 to 5. For this survey, they were asked to choose up to 5 items with which they were most (or least) satisfied.
This year's
survey
Last year's
survey
(reference)1
◆ Survey outline and respondent attributes p.1 (p.1)
◆Travel preferences by country/region: "Where would you like to go on a foreign
holiday?"p.2 (p.2)
◆Travel preferences compared with previous year: "Where would you like to go on a
foreign holiday?" (Interested respondents; comparison to previous year)p.3 (p.3)
◆ General thoughts on foreign travel: “What do you wish for in a foreign holiday?” p.4 (p.4)
◆ Your most recent trip to Japan: Purpose, companions and mode of travel p.5 (p.6-7)
◆ "How did you arrange for hotel/inn accommodations on your last trip to Japan?" p.6 (p.7)※2
◆ "Which areas of Japan have you visited up to now?" p.7 (p.8)
◆ When planning your trip to Japan, did you consider other countries or regions?" p.8 (p.9)
◆ "Why did You choose Japan as your destination?" p.9 (p.10)
◆ “What were your sources of information on Japan?” p.10 (p.11)
◆"Which aspects of your trip did you decide after arrival? Which did you perceive as
expensive?"p.11 (p.12)
◆ Shopping in Japan p.12 (p.13)
◆ "Which parts of your trip to Japan satisfied you the most? The least?" p.13-14 (p.14-15)※3
◆ Images of Japanese tourist areas: “What would you like to see and do?” p.15-16 (p.16-17)
◆ Japanese tourist areas: Traveler recognition and desire to visit p.17 (p.18)
◆Traveler recognition of Japanese tourist areas, by number of past visits: "Do you
know these tourist areas?"p.18 (p.19)
◆Desire to visit a Japanese tourist area, by number of past visits to Japan: "Where in
Japan would you like to go"p.19 (p.20)
◆ “What makes you want to visit Japan in future?” p.20 (p.21)
◆ “How would you like to travel on a future trip to Japan?” p.21 (p.22)
◆ Lodgings on a future trip to Japan, and bathing in hot springs p.22 (p.23)※2
◆ “What would you like to experience on a future trip to Japan?” p.23 (p.24)
◆ Concerns: “What concerns do you have about a future trip to Japan?” p.24 (p.25)
◆Concerns: “Did the March 2011 earthquake change your mind about traveling to
Japan?”p.25 (p.26)
◆ “Do you know which country and city will host upcoming Olympic Games?” p.26 (-)
◆“Are you aware of the measures implemented in July 2013 to make it easier to
obtain a Japanese visa or visa exemption?"p.27 (-)
◆ Free response: "What would you like to eat and drink in Japan?" p.28 (-)
Contents

1
• Survey method: Online questionnaire
• Period conducted: September 9 – 16, 2014.
• Regions covered: Korea, China, Taiwan, Hong Kong, Thailand, Singapore, Malaysia, Indonesia (eight regions).
* For China, the survey covered only the cities of Beijing and Shanghai.
• Target respondents: Men and women aged 20 to 59, with experience in foreign travel. * “Foreign travel” excludes travel between China, Hong Kong and Macao; Malaysia and Singapore; and Thailand and Malaysia.
• Valid responses: 500 people from each of the above regions, for a total of 4,000 people. * For China, 250 people each from Beijing and Shanghai.
• Survey conducted in cooperation with AIP Corporation.
1. Survey Outline and Respondents
Note: For the questions on the following pages, choices were given to each respondent in random order: p. 4, p. 12 (“Shopping in Japan”), p. 15, p. 16, p.23. For the questions on the following pages, the first choice given was different for each respondent: p. 6 (Types of lodgings), p. 7, p. 9 – 11, p. 13, p. 14, p. 17 – 20, p. 22 (“Thoughts about lodgings and hot springs bathing on a future trip to Japan”), p. 23, p 24.
◆Valid responses
Item All Korea China Taiwan Hong Kong Thailand Singapore Malaysia Indonesia
Male 2,002 251 234 275 229 256 251 248 258
Female 1,998 249 266 225 271 244 249 252 242
Total 4,000 500 500 500 500 500 500 500 500
◆Visits to Japan
Item All Korea China Taiwan Hong Kong Thailand Singapore Malaysia Indonesia
Never visited 2,133 223 220 156 142 275 318 393 406
Visited once 851 112 170 114 105 125 96 70 59
Visited 2 or
more times1,016 165 110 230 253 100 86 37 35
Total 4,000 500 500 500 500 500 500 500 500

2
Japan was a choice of a majority of respondents in all eight Asian regions.
• Japan topped the list of places respondents wanted to visit, drawing the highest percentages from all regions except Korea. Ratios of those thinking seriously about a Japan vacation were similarly high.
• Some 70 percent of respondents from Taiwan and Hong Kong expressed a desire to visit Japan, as did some 60 percent of those from Malaysia, Thailand and Singapore.
• The percentage of Korean respondents wishing to visit Japan was relatively small, despite its having among the largest numbers of travelers to Japan. Among those Koreans thinking seriously of a foreign vacation, however, Japan was the top prospective destination.
2. 国 “Where would you like to go on a foreign holiday?”
(Multiple responses)
Note: The top 5 items are highlighted in red or yellow. When a respondent’s home country or region is the same as the place they want to visit, that country or region is removed from the sample size.
All respondents
Respondents→
Sample size
Countries/regions
hoping to visit ↓Hope to visit
Specifically
consideringHope to visit
Specifically
consideringHope to visit
Specifically
consideringHope to visit
Specifically
consideringHope to visit
Specifically
consideringHope to visit
Specifically
consideringHope to visit
Specifically
consideringHope to visit
Specifically
consideringHope to visit
Specifically
considering
Japan 55% 35% 26% 15% 55% 39% 71% 35% 66% 50% 57% 46% 57% 37% 59% 33% 48% 24%
Korea 43% 25% - - 52% 31% 30% 8% 52% 35% 33% 20% 47% 30% 48% 32% 37% 16%
Australia 42% 17% 43% 14% 54% 24% 35% 2% 49% 27% 20% 7% 46% 25% 56% 25% 32% 11%
New Zealand 39% 13% 38% 9% 49% 17% 40% 2% 40% 19% 23% 7% 49% 21% 50% 20% 23% 9%
Switzerland 38% 11% 46% 11% 40% 9% 38% 2% 39% 18% 27% 12% 45% 18% 46% 17% 23% 3%
France 37% 12% 43% 13% 46% 14% 36% 4% 41% 20% 20% 6% 38% 14% 41% 17% 29% 9%
USA 37% 13% 32% 9% 50% 20% 41% 7% 33% 15% 19% 8% 50% 22% 38% 16% 29% 8%
United Kingdom 35% 12% 33% 6% 41% 12% 33% 2% 41% 22% 23% 8% 38% 17% 39% 18% 29% 7%
Italy 33% 10% 36% 10% 38% 12% 35% 2% 37% 17% 15% 5% 36% 14% 42% 14% 27% 7%
Hong Kong 32% 14% 28% 8% 52% 29% 34% 9% - - 19% 8% 33% 16% 32% 18% 25% 12%
Taiwan 31% 17% 16% 4% 44% 23% - - 52% 36% 12% 4% 40% 25% 41% 26% 11% 2%
Germany 30% 9% 32% 7% 39% 12% 32% 3% 36% 18% 13% 4% 35% 11% 34% 11% 21% 6%
Hawaii 29% 8% 41% 10% 46% 15% 32% 2% 27% 13% 10% 3% 31% 8% 31% 11% 16% 3%
Canada 29% 8% 34% 8% 39% 12% 36% 2% 28% 13% 11% 3% 40% 11% 29% 8% 18% 4%
Spain 29% 9% 39% 13% 31% 9% 30% 2% 34% 17% 10% 1% 33% 12% 34% 11% 19% 4%
Singapore 27% 12% 20% 6% 35% 16% 31% 4% 37% 21% 26% 14% - - 21% 12% 17% 10%
Mainland China 25% 12% 18% 8% - - 37% 12% 34% 21% 22% 12% 21% 10% 30% 16% 14% 5%
Thailand 25% 11% 15% 5% 31% 11% 23% 3% 34% 19% - - 26% 13% 26% 13% 19% 10%
Austria 23% 5% 28% 4% 29% 7% 28% 1% 25% 11% 12% 3% 22% 7% 23% 8% 14% 1%
Macao 22% 8% 15% 3% 38% 16% 28% 4% 33% 17% 8% 2% 19% 6% 24% 12% 9% 2%
Other Europe 22% 6% 22% 7% 21% 3% 24% 2% 23% 11% 14% 4% 26% 7% 25% 8% 17% 4%
Malaysia 17% 6% 7% 1% 21% 7% 20% 1% 27% 13% 10% 4% 19% 9% - - 12% 7%
Vietnam 15% 5% 15% 5% 11% 1% 13% 1% 17% 8% 16% 9% 20% 8% 22% 8% 8% 2%
Guam 14% 3% 22% 7% 17% 3% 28% 1% 26% 10% 1% 0% 8% 2% 10% 2% 2% 0%
Mideast (Dubai, etc.) 13% 4% 8% 1% 15% 3% 12% 1% 15% 8% 4% 1% 15% 5% 17% 8% 15% 6%
Indonesia 12% 3% 9% 2% 16% 3% 14% 1% 11% 3% 5% 2% 13% 4% 18% 7% - -
Central & South
America12% 3% 16% 3% 13% 1% 11% 1% 15% 6% 3% 0% 17% 4% 14% 4% 6% 1%
Philippines 10% 3% 13% 4% 10% 1% 11% 0% 6% 3% 3% 1% 14% 6% 17% 7% 7% 1%
India 9% 2% 11% 2% 13% 3% 8% 0% 10% 3% 6% 3% 8% 3% 11% 4% 7% 1%
Africa 7% 2% 6% 1% 12% 1% 5% 0% 9% 5% 3% 0% 11% 4% 6% 2% 4% 0%
Other areas 2% 1% 1% 0% 0% 0% 2% 1% 0% 0% 4% 2% 2% 1% 1% 1% 4% 3%
Not interested in
foreign travel1% 1% 0% 1% 0% 3% 1% 0% 1%
500 500 500 5004000 500 500 500 500
Thailand Singapore Malaysia IndonesiaAll Korea China Taiwan Hong Kong

3
Japan has gained in popularity since last year’s survey
• For the second year in a row, there was an increase in the percentage of respondents from all eight Asian regions who said they wanted to visit Japan (2012: 47% → 2013: 52% → 2014: 55%).
• The percentage of Indonesians who hoped to visit Japan increased by six percentage points since last year’s survey, suggesting that last July’s easing of visa requirements is having an effect (2012: 41% → 2013: 42% → 2014: 48%).
• China’s renewed interest in Japan travel can be seen in the 10-percent increase over the 2012 survey in the percentage of Chinese respondents indicating their desire to visit (2012: 45% → 2013: 53% →2014:55%).
3. Travel preferences compared with previous year: “Where would you like to go on a foreign holiday?” (Respondents wishing to travel; year-on-year comparison)
(Multiple responses)
Note: The top 5 items are highlighted in red or green. When a respondent’s home country or region was the same as the place they wanted to visit, that country or region was removed from the sample size.
All respondents
Respondents→
Number of samples 4000 4000 500 500 500 500 500 500 500 500 500 500 500 500 500 500 500 500
Countries/regions
hoping to visit ↓
2013Hope to visit
2014Hope to visit
2013Hope to visit
2014Hope to visit
2013Hope to visit
2014Hope to visit
2013Hope to visit
2014Hope to visit
2013Hope to visit
2014Hope to visit
2013Hope to visit
2014Hope to visit
2013Hope to visit
2014Hope to visit
2013Hope to visit
2014Hope to visit
2013Hope to visit
2014Hope to visit
Japan 52% 55% 20% 26% 53% 55% 68% 71% 62% 66% 55% 57% 57% 57% 56% 59% 42% 48%
Korea 41% 43% - - 46% 52% 30% 30% 50% 52% 27% 33% 47% 47% 51% 48% 32% 37%
Australia 42% 42% 46% 43% 54% 54% 32% 35% 51% 49% 20% 20% 46% 46% 52% 56% 33% 32%
New Zealand 37% 39% 44% 38% 44% 49% 38% 40% 36% 40% 18% 23% 52% 49% 43% 50% 17% 23%
Switzerland 37% 38% 49% 46% 42% 40% 37% 38% 37% 39% 20% 27% 47% 45% 39% 46% 23% 23%
France 36% 37% 45% 43% 45% 46% 39% 36% 39% 41% 16% 20% 37% 38% 38% 41% 31% 29%
USA 37% 37% 33% 32% 51% 50% 41% 41% 30% 33% 19% 19% 49% 50% 36% 38% 33% 29%
United Kingdom 35% 35% 38% 33% 39% 41% 35% 33% 39% 41% 19% 23% 40% 38% 38% 39% 35% 29%
Italy 32% 33% 36% 36% 39% 38% 35% 35% 36% 37% 15% 15% 34% 36% 33% 42% 27% 27%
Hong Kong 33% 32% 28% 28% 51% 52% 35% 34% - - 23% 19% 33% 33% 37% 32% 24% 25%
Taiwan 31% 31% 16% 16% 44% 44% - - 55% 52% 8% 12% 40% 40% 41% 41% 10% 11%
Germany 29% 30% 35% 32% 37% 39% 35% 32% 34% 36% 10% 13% 31% 35% 27% 34% 23% 21%
Hawaii 30% 29% 45% 41% 44% 46% 35% 32% 30% 27% 8% 10% 30% 31% 30% 31% 15% 16%
Canada 28% 29% 36% 34% 39% 39% 34% 36% 28% 28% 10% 11% 35% 40% 28% 29% 16% 18%
Spain 26% 29% 36% 39% 33% 31% 27% 30% 33% 34% 8% 10% 31% 33% 26% 34% 16% 19%
Singapore 28% 27% 24% 20% 36% 35% 30% 31% 39% 37% 21% 26% - - 26% 21% 21% 17%
Mainland China 26% 25% 16% 18% - - 38% 37% 32% 34% 21% 22% 26% 21% 30% 30% 16% 14%
Thailand 26% 25% 16% 15% 30% 31% 25% 23% 37% 34% - - 29% 26% 25% 26% 20% 19%
Austria 22% 23% 29% 28% 28% 29% 27% 28% 24% 25% 10% 12% 24% 22% 21% 23% 11% 14%
Macao 22% 22% 14% 15% 38% 38% 22% 28% 36% 33% 9% 8% 22% 19% 29% 24% 9% 9%
Other Europe 21% 22% 26% 22% 17% 21% 23% 24% 24% 23% 10% 14% 27% 26% 22% 25% 16% 17%
Malaysia 18% 17% 11% 7% 26% 21% 19% 20% 30% 27% 9% 10% 20% 19% - - 9% 12%
Vietnam 17% 15% 17% 15% 11% 11% 12% 13% 23% 17% 14% 16% 23% 20% 25% 22% 10% 8%
Guam 14% 14% 30% 22% 15% 17% 27% 28% 24% 26% 2% 1% 8% 8% 8% 10% 2% 2%
Mideast (Dubai, etc.) 13% 13% 9% 8% 14% 15% 14% 12% 17% 15% 4% 4% 16% 15% 17% 17% 15% 15%
Indonesia 12% 12% 12% 9% 16% 16% 10% 14% 14% 11% 6% 5% 14% 13% 16% 18% - -
Central & South
America12% 12% 17% 16% 13% 13% 10% 11% 14% 15% 5% 3% 18% 17% 10% 14% 6% 6%
Philippines 10% 10% 15% 13% 10% 10% 11% 11% 7% 6% 3% 3% 15% 14% 12% 17% 7% 7%
India 9% 9% 10% 11% 12% 13% 9% 8% 11% 10% 5% 6% 10% 8% 9% 11% 6% 7%
Africa 8% 7% 9% 6% 9% 12% 7% 5% 12% 9% 4% 3% 12% 11% 10% 6% 5% 4%
Other areas 2% 2% 1% 1% 0% 0% 1% 2% 1% 0% 3% 4% 2% 2% 2% 1% 3% 4%
Not interested in
foreign travel1% 1% 1% 1% 0% 0% 3% 1% 0% 0% 4% 3% 1% 1% 0% 0% 3% 1%
Thailand Singapore Malaysia IndonesiaAll Korea China Taiwan Hong Kong

4
4. General thoughts on foreign travel: “What do you wish for in a foreign holiday?”
A Somewhat A Neither Somewhat B B
Strong trend toward small-group travel and detailed planning in advance
• National preferences were diverse in this category, with Thai respondents looking for reasonably priced lodgings and those from Singapore and Hong Kong prioritizing time for free activity.
<全員> All
respondents
31
36
16
26
20
32
41
38
42
36
40
34
37
34
39
32
36
36
19
17
18
21
33
12
22
17
9
9
5
19
13
9
11
4
6
8
5
2
12
3
3
5
2
4
5
0% 20% 40% 60% 80% 100%
Al l
Korea
China
Taiwan
Hong Kong
Thailand
Singapore
Malaysia
Indonesia
(A)Want to travel in a small group
(B)Want to travel in a large group
29
21
25
22
28
37
26
34
35
36
39
41
33
38
37
32
37
32
16
20
10
21
23
10
26
14
7
13
15
16
18
7
10
11
10
17
6
4
9
6
3
6
5
4
10
0% 20% 40% 60% 80% 100%
Al l
Korea
China
Taiwan
Hong Kong
Thailand
Singapore
Malaysia
Indonesia
(A)Want to make detailed plans before leaving
(B)Want to use local information in planning itinerary
(A)Want to use the services of a tour guide
(B)Want to explore destinations on my own
10
7
11
13
3
14
6
12
18
20
21
23
25
13
25
12
19
23
21
24
18
20
29
17
27
20
13
26
28
30
25
28
24
21
24
25
23
19
18
15
27
21
33
26
21
0% 20% 40% 60% 80% 100%
Al l
Korea
China
Taiwan
Hong Kong
Thailand
Singapore
Malaysia
Indonesia
10
7
20
12
10
14
5
10
7
19
23
27
21
22
18
14
15
15
24
34
24
22
32
14
24
22
16
28
27
21
29
23
31
33
29
34
18
9
8
15
13
23
24
25
28
0% 20% 40% 60% 80% 100%
Al l
Korea
China
Taiwan
Hong Kong
Thailand
Singapore
Malaysia
Indonesia
(A)Want to enjoy gourmet meals at my destination
(B)Want to enjoy the same kinds of inexpensive foods that local people eat
16
13
9
12
10
32
13
24
18
26
28
16
22
19
41
26
29
31
28
32
24
33
39
13
35
27
24
22
22
34
26
25
11
20
16
20
7
4
17
8
7
4
6
4
7
0% 20% 40% 60% 80% 100%
Al l
Korea
China
Taiwan
Hong Kong
Thailand
Singapore
Malaysia
Indonesia
(A)Want to stay at places having basic, inexpensive facilities
(B)Want to stay in comfort at luxury hotels
27
17
27
31
24
35
30
29
20
32
33
39
39
37
29
29
29
24
16
20
13
15
23
12
21
16
9
16
23
14
11
12
14
13
15
25
9
8
8
5
4
9
7
11
22
0% 20% 40% 60% 80% 100%
Al l
Korea
China
Taiwan
Hong Kong
Thailand
Singapore
Malaysia
Indonesia
(A)Want to have a relaxing time at my destination
(B)Want to travel efficiently to a large number of countries/regions
(A)Want to buy expensive items at my destination
(B)Want to buy the same kinds of goods used by locals
5
4
10
5
2
6
4
4
6
11
10
20
14
10
9
9
11
8
30
35
27
33
37
21
34
28
25
34
36
29
32
33
36
31
34
37
20
15
14
15
18
27
21
24
24
0% 20% 40% 60% 80% 100%
Al l
Korea
China
Taiwan
Hong Kong
Thailand
Singapore
Malaysia
Indonesia
15
15
16
20
12
18
13
12
13
26
32
25
31
31
27
24
21
20
21
29
15
17
28
15
27
23
15
25
20
30
23
21
26
24
27
29
13
5
14
9
8
14
13
16
24
0% 20% 40% 60% 80% 100%
Al l
Korea
China
Taiwan
Hong Kong
Thailand
Singapore
Malaysia
Indonesia
(A)Want mainly to purchase items for my own use
(B)Want to buy souvenirs for family, co-workers, and friends as well as for myself

5
Travel agents remain popular choice, but many travelers reserving online
• High percentages of respondents from all regions cited “tourism” as the purpose of their most recent trip to Japan.
• Spouses or partners are the companions of choice for many respondents, but those from Indonesia, Thailand, Singapore and Malaysia are more likely than others to travel with their children or with relatives other than parents.
• While foreign independent travel (FIT) is seen as a growing trend, visitors to Japan choose varied modes of travel according to their nationality. Respondents from Taiwan and Thailand continue to prefer guided tours, while there is a clear tendency among those from Singapore, Hong Kong and Malaysia to make arrangements on their own.
5. Your most recent trip to Japan: Purpose, companions and mode of travel
Purpose of travel
Notes: 1 Questions on this page were directed at respondents who had been to Japan in the past, and asked about their mode of travel on their most recent trip. 2 Ranking is indicated by a color scale: Lowest Highest
(Single response)
Travel companion(s) (Multiple responses)
Previous visitors to Japan
Mode of travel (excluding business, international conference, training/incentives, study) (Single response)
Respondents→ All Korea China Taiwan Hong Kong Thailand Singapore Malaysia Indonesia
Sample size 1867 277 280 344 358 225 182 107 94
Traveled alone 9% 10% 11% 8% 6% 10% 8% 18% 9%
Spouse or partner 52% 44% 62% 47% 66% 44% 47% 47% 50%
Friend 32% 32% 29% 35% 26% 37% 24% 41% 36%
Children 18% 14% 21% 19% 18% 14% 20% 14% 26%
Parents 12% 5% 7% 17% 13% 14% 13% 12% 15%
Relatives (other than
children or parents)11% 10% 3% 11% 7% 19% 18% 16% 20%
Other 3% 8% 1% 2% 1% 2% 2% 2% 0%
Respondents→ All Korea China Taiwan Hong Kong Thailand Singapore Malaysia Indonesia
Sample size 1678 240 256 319 344 208 162 83 66
Guided package tour (no
free activity)35% 32% 40% 45% 23% 42% 27% 27% 38%
Guided package tour
(with free activity)17% 8% 21% 20% 17% 19% 14% 19% 17%
Package including
airfare and hotels only17% 23% 17% 12% 24% 11% 12% 18% 20%
Separate arrangements
for airfare and hotels26% 26% 18% 19% 32% 24% 45% 31% 18%
Purchased airline tickets
prior to trip; made hotel
arrangements at
destination
5% 12% 4% 3% 3% 4% 2% 5% 8%
Respondents→ All Korea China Taiwan Hong Kong Thailand Singapore Malaysia Indonesia
Sample size 1867 277 280 344 358 225 182 107 94
Tourism 87% 81% 91% 90% 94% 91% 86% 72% 67%
Business, international
conferences6% 7% 6% 6% 2% 3% 10% 13% 15%
Training, incentives 3% 4% 2% 1% 2% 4% 1% 7% 11%
Study 1% 2% 0% 0% 0% 0% 0% 2% 4%
See family or friends 2% 6% 0% 2% 1% 2% 2% 4% 1%
Other 0% 0% 0% 0% 1% 0% 1% 2% 2%
6
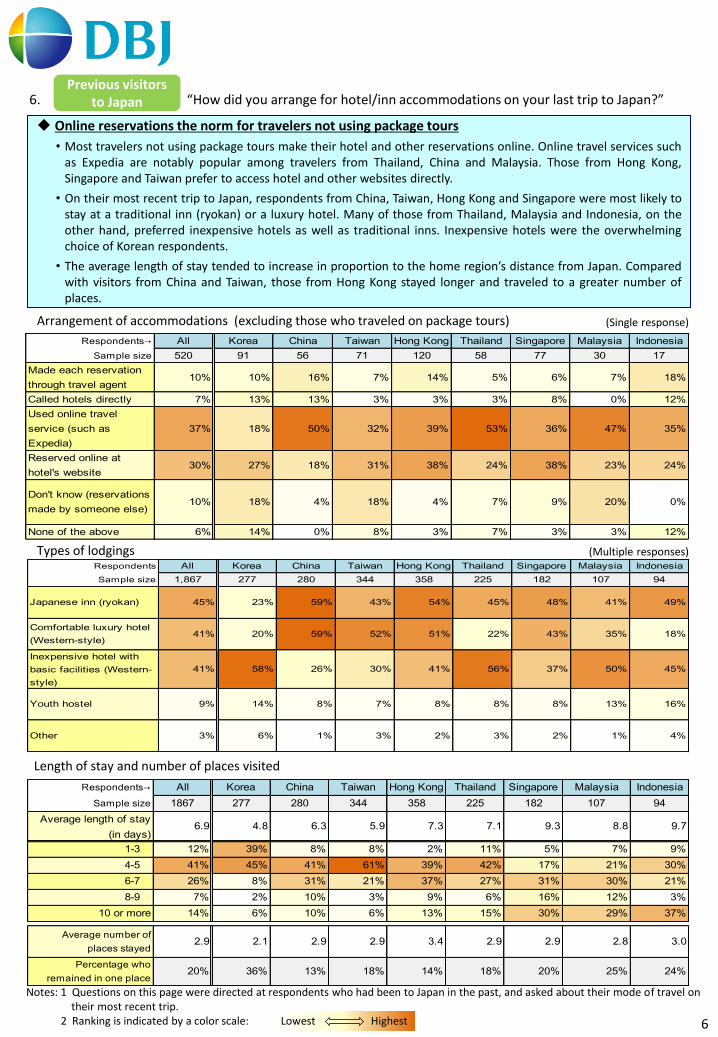
Online reservations the norm for travelers not using package tours
• Most travelers not using package tours make their hotel and other reservations online. Online travel services such as Expedia are notably popular among travelers from Thailand, China and Malaysia. Those from Hong Kong, Singapore and Taiwan prefer to access hotel and other websites directly.
• On their most recent trip to Japan, respondents from China, Taiwan, Hong Kong and Singapore were most likely to stay at a traditional inn (ryokan) or a luxury hotel. Many of those from Thailand, Malaysia and Indonesia, on the other hand, preferred inexpensive hotels as well as traditional inns. Inexpensive hotels were the overwhelming choice of Korean respondents.
• The average length of stay tended to increase in proportion to the home region’s distance from Japan. Compared with visitors from China and Taiwan, those from Hong Kong stayed longer and traveled to a greater number of places.
6. “How did you arrange for hotel/inn accommodations on your last trip to Japan?”
Length of stay and number of places visited
Arrangement of accommodations (excluding those who traveled on package tours) (Single response)
Types of lodgings (Multiple responses)
Previous visitors to Japan
Notes: 1 Questions on this page were directed at respondents who had been to Japan in the past, and asked about their mode of travel on their most recent trip. 2 Ranking is indicated by a color scale: Lowest Highest
Respondents→ All Korea China Taiwan Hong Kong Thailand Singapore Malaysia Indonesia
Sample size 520 91 56 71 120 58 77 30 17
Made each reservation
through travel agent10% 10% 16% 7% 14% 5% 6% 7% 18%
Called hotels directly 7% 13% 13% 3% 3% 3% 8% 0% 12%
Used online travel
service (such as
Expedia)
37% 18% 50% 32% 39% 53% 36% 47% 35%
Reserved online at
hotel's website30% 27% 18% 31% 38% 24% 38% 23% 24%
Don't know (reservations
made by someone else)10% 18% 4% 18% 4% 7% 9% 20% 0%
None of the above 6% 14% 0% 8% 3% 7% 3% 3% 12%
Respondents All Korea China Taiwan Hong Kong Thailand Singapore Malaysia Indonesia
Sample size 1,867 277 280 344 358 225 182 107 94
Japanese inn (ryokan) 45% 23% 59% 43% 54% 45% 48% 41% 49%
Comfortable luxury hotel
(Western-style)41% 20% 59% 52% 51% 22% 43% 35% 18%
Inexpensive hotel with
basic facilities (Western-
style)
41% 58% 26% 30% 41% 56% 37% 50% 45%
Youth hostel 9% 14% 8% 7% 8% 8% 8% 13% 16%
Other 3% 6% 1% 3% 2% 3% 2% 1% 4%
Respondents→ All Korea China Taiwan Hong Kong Thailand Singapore Malaysia Indonesia
Sample size 1867 277 280 344 358 225 182 107 94
Average length of stay
(in days)6.9 4.8 6.3 5.9 7.3 7.1 9.3 8.8 9.7
1-3日 12% 39% 8% 8% 2% 11% 5% 7% 9%
4-5日 41% 45% 41% 61% 39% 42% 17% 21% 30%
6-7日 26% 8% 31% 21% 37% 27% 31% 30% 21%
8-9日 7% 2% 10% 3% 9% 6% 16% 12% 3%
10 or more 14% 6% 10% 6% 13% 15% 30% 29% 37%
Average number of
places stayed2.9 2.1 2.9 2.9 3.4 2.9 2.9 2.8 3.0
Percentage who
remained in one place20% 36% 13% 18% 14% 18% 20% 25% 24%

7
Tokyo, “Golden Route”* and Hokkaido were favorite destinations on previous trips to Japan
• Kyushu has been a popular destination for visitors from Hong Kong, Indonesia and Korea.
• The survey revealed a notable increase in visitors to Mt. Fuji in comparison with last year (2013: 33% → 2014: 38%) – likely due to Mt. Fuji’s designation in June 2013 as a World Heritage Site.
7. “Which areas of Japan have you visited up to now?”
(Multiple responses) * The “Golden Route,” stretching from Tokyo to Osaka, has been the standard course for a Japan vacation.
Notes: 1 The question on this page was directed at respondents who had been to Japan in the past, and asked about their mode of travel on past trips. 2 The top 5 items are indicated in red; the 6th through 10th are indicated in pink.
Previous visitors to Japan
Respondents All Korea China Taiwan Hong Kong Thailand Singapore Malaysia Indonesia
Sample size 1867 277 280 344 358 225 182 107 94
Tokyo 68% 54% 68% 62% 75% 70% 83% 62% 70%
Mt. Fuji 38% 14% 53% 23% 45% 49% 45% 42% 57%
Hakone 18% 10% 15% 23% 27% 17% 18% 12% 9%
Nikko 6% 3% 6% 8% 6% 10% 6% 6% 6%
Matsumoto 2% 1% 5% 1% 1% 3% 1% 5% 7%
Karuizawa 5% 1% 3% 11% 9% 2% 1% 2% 4%
Hokkaido 30% 11% 34% 35% 39% 28% 27% 30% 35%
Sapporo 21% 12% 16% 26% 31% 18% 23% 12% 19%
Hakodate 11% 5% 3% 22% 20% 5% 9% 6% 5%
Obihiro, Tokachi 3% 0% 3% 5% 2% 2% 2% 3% 3%
Niseko 1% 1% 3% 1% 1% 3% 1% 3% 1%
Shiretoko 2% 0% 1% 2% 4% 2% 1% 5% 4%
Kushiro, Akan 3% 0% 3% 4% 4% 3% 3% 1% 2%
Tohoku 3% 1% 2% 4% 4% 4% 3% 5% 4%
Aomori 5% 4% 4% 8% 8% 4% 2% 7% 5%
Sendai 8% 3% 10% 7% 12% 13% 4% 7% 12%
Matsushima 4% 0% 8% 3% 8% 3% 0% 3% 4%
Hiraizumi 2% 1% 2% 1% 1% 2% 1% 5% 4%
Niigata 4% 1% 3% 3% 5% 4% 3% 9% 6%
Sado 1% 0% 2% 1% 1% 2% 1% 3% 3%
Hokuriku 3% 0% 4% 6% 2% 2% 2% 4% 2%
Kanazawa 4% 0% 1% 6% 6% 5% 2% 6% 5%
Tateyama, Kurobe 5% 1% 1% 13% 8% 4% 1% 4% 1%
Toyama 6% 0% 13% 6% 10% 5% 5% 3% 4%
Nagoya 24% 14% 32% 24% 30% 18% 16% 20% 44%
Ise, Shima 3% 1% 3% 3% 3% 4% 2% 3% 4%
Hida, Takayama 5% 1% 2% 10% 6% 4% 3% 7% 2%
Kansai 15% 9% 9% 24% 23% 15% 3% 18% 17%
Kyoto 42% 33% 45% 43% 48% 40% 34% 44% 45%
Nara 18% 16% 15% 24% 27% 17% 12% 15% 7%
Osaka 48% 45% 44% 47% 62% 39% 40% 46% 54%
Kobe 19% 11% 20% 25% 28% 11% 12% 18% 28%
Okayama 4% 2% 3% 6% 4% 5% 2% 6% 4%
Hiroshima 9% 3% 10% 8% 8% 12% 9% 13% 20%
Sannin 1% 0% 2% 1% 0% 2% 1% 2% 3%
Tottori 2% 3% 1% 1% 1% 0% 2% 1% 4%
Matsui, Izumo 2% 1% 3% 1% 1% 3% 2% 2% 2%
Shikoku 5% 1% 6% 5% 6% 7% 2% 8% 9%
Shimanami Kaido 2% 1% 3% 1% 0% 3% 2% 1% 5%
Takamatsu 2% 0% 3% 2% 2% 4% 1% 4% 4%
Matsuyama, Dogo 2% 1% 4% 1% 2% 4% 2% 3% 2%
Kyushu 17% 16% 12% 22% 30% 8% 9% 7% 11%
Fukuoku, Hakata 16% 23% 10% 20% 20% 13% 11% 9% 14%
Nagasaki 11% 6% 10% 12% 14% 12% 4% 14% 30%
Beppu, Yufuin 7% 11% 2% 6% 13% 4% 4% 2% 3%
Kumamoto, Aso 7% 8% 3% 8% 16% 3% 1% 3% 3%
Miyazaki 6% 1% 8% 6% 11% 6% 2% 1% 12%
Kagoshima 7% 3% 9% 7% 16% 4% 1% 5% 11%
Okinawa 16% 10% 13% 23% 24% 11% 8% 10% 22%
Don't remember /
not applicable2% 3% 0% 1% 1% 1% 3% 3% 4%

8
Korea was the destination most commonly considered as a possible alternative to Japan.
• Respondents who had visited Japan in the past were most likely to consider Korea as an alternative destination, followed by Hong Kong, Taiwan, Singapore, and mainland China – all regions in Asia, and relatively close to Japan. These findings were fundamentally unchanged from those of the last two surveys.
• A substantial proportion of the respondents did not consider any other destination besides Japan. About half of those from Korea and Singapore visit Japan without giving thought to other possible candidates.
8. “When planning your trip to Japan, did you consider other countries or regions?”
Notes: 1 The question on this page was directed at respondents who had been to Japan in the past, and asked about other destinations they may have considered when planning their most recent trip. When a respondent’s home country or region was the same as the alternate destination they were considering, that country or region was removed from the sample size. 2 The top 5 items are indicated in red or yellow.
(Multiple responses)
Previous visitors to Japan
Respondents
Other candidates /
Visits to Japan1
2 or
more1
2 or
more1
2 or
more1
2 or
more1
2 or
more1
2 or
more1
2 or
more1
2 or
more1
2 or
more
Sample size 851 1016 112 165 170 110 114 230 105 253 125 100 96 86 70 37 59 35
Korea 33% 37% - - 44% 49% 18% 24% 40% 47% 31% 33% 22% 26% 33% 41% 36% 40%
Hong Kong 21% 21% 20% 18% 26% 32% 29% 20% - - 21% 25% 7% 9% 16% 14% 19% 37%
Taiwan 17% 19% 7% 11% 22% 21% - - 27% 30% 9% 11% 14% 12% 20% 19% 20% 11%
Singapore 14% 15% 8% 11% 13% 22% 20% 19% 13% 11% 15% 14% - - 9% 8% 15% 17%
Mainland China 14% 16% 9% 18% - - 25% 25% 15% 8% 17% 18% 4% 7% 11% 22% 10% 17%
Australia 11% 14% 5% 5% 12% 16% 9% 16% 15% 15% 7% 11% 5% 10% 17% 22% 20% 34%
New Zealand 8% 12% 1% 5% 9% 12% 17% 19% 6% 11% 6% 9% 3% 8% 11% 19% 15% 23%
Macao 9% 10% 5% 8% 14% 19% 18% 15% 10% 5% 4% 6% 1% 3% 4% 8% 12% 11%
Thailand 8% 12% 4% 11% 11% 10% 11% 12% 10% 16% - - 1% 6% 6% 5% 14% 14%
France 7% 9% 3% 5% 6% 14% 11% 14% 10% 6% 2% 7% 2% 2% 10% 16% 17% 11%
Switzerland 6% 9% 3% 5% 4% 9% 7% 16% 9% 7% 6% 7% 2% 5% 7% 16% 19% 11%
Hawaii 7% 8% 3% 5% 8% 14% 12% 15% 9% 5% 1% 5% 3% 0% 9% 8% 10% 9%
Germany 5% 9% 1% 2% 4% 14% 6% 13% 7% 8% 4% 4% 2% 3% 6% 16% 22% 23%
United Kingdom 6% 8% 0% 2% 5% 14% 9% 9% 8% 7% 6% 8% 2% 1% 9% 14% 19% 17%
Italy 6% 7% 2% 3% 4% 7% 7% 11% 8% 6% 5% 5% 1% 2% 7% 11% 17% 11%
USA 5% 7% 2% 0% 4% 14% 11% 14% 2% 3% 4% 7% 0% 1% 6% 16% 14% 6%
Canada 4% 8% 1% 4% 3% 9% 5% 13% 7% 6% 1% 5% 3% 1% 6% 8% 5% 17%
Malaysia 5% 6% 2% 1% 6% 10% 7% 10% 8% 7% 3% 3% 0% 1% - - 14% 14%
Spain 3% 7% 0% 2% 2% 9% 4% 13% 7% 6% 1% 3% 0% 2% 6% 5% 10% 11%
Guam 2% 7% 4% 6% 1% 9% 8% 13% 1% 7% 0% 0% 0% 0% 3% 3% 3% 3%
Vietnam 4% 5% 7% 4% 3% 5% 4% 5% 5% 3% 6% 8% 0% 1% 1% 11% 10% 6%
Other Europe 2% 5% 0% 2% 1% 5% 4% 6% 3% 6% 2% 2% 0% 2% 3% 8% 12% 6%
Austria 2% 5% 0% 2% 2% 6% 4% 8% 3% 5% 2% 0% 0% 1% 1% 5% 7% 9%
Indonesia 2% 4% 1% 2% 2% 5% 4% 8% 1% 0% 2% 7% 0% 1% 4% 11% - -
Philippines 2% 3% 4% 5% 1% 3% 2% 4% 2% 0% 0% 2% 1% 0% 9% 8% 5% 6%
Mideast (Dubai,
etc.)3% 2% 0% 1% 2% 3% 2% 3% 3% 3% 0% 2% 0% 0% 1% 5% 20% 3%
India 2% 2% 0% 2% 1% 5% 0% 2% 4% 2% 1% 2% 1% 0% 1% 3% 10% 9%
Central & South
America1% 2% 0% 1% 1% 3% 1% 2% 0% 1% 0% 1% 0% 0% 1% 3% 2% 6%
Africa 1% 1% 0% 1% 1% 2% 1% 1% 1% 1% 0% 0% 1% 1% 1% 0% 3% 3%
Other 1% 1% 0% 1% 1% 1% 2% 0% 1% 0% 1% 3% 0% 0% 0% 0% 0% 0%
Didn't consider
other countries or
regions
34% 28% 58% 44% 26% 16% 30% 25% 28% 19% 29% 24% 57% 53% 33% 35% 5% 6%
IndonesiaKorea China Taiwan Hong Kong Thailand Singapore MalaysiaAll
9
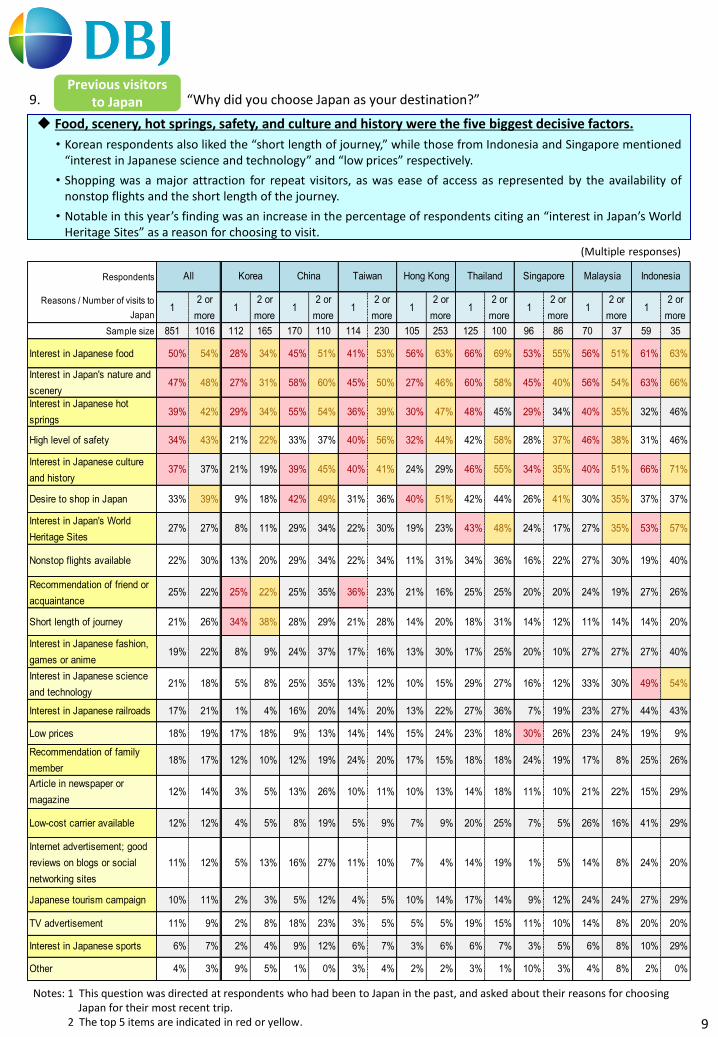
Food, scenery, hot springs, safety, and culture and history were the five biggest decisive factors.
• Korean respondents also liked the “short length of journey,” while those from Indonesia and Singapore mentioned “interest in Japanese science and technology” and “low prices” respectively.
• Shopping was a major attraction for repeat visitors, as was ease of access as represented by the availability of nonstop flights and the short length of the journey.
• Notable in this year’s finding was an increase in the percentage of respondents citing an “interest in Japan’s World Heritage Sites” as a reason for choosing to visit.
9. “Why did you choose Japan as your destination?”
Notes: 1 This question was directed at respondents who had been to Japan in the past, and asked about their reasons for choosing Japan for their most recent trip. 2 The top 5 items are indicated in red or yellow.
(Multiple responses)
Previous visitors to Japan
Respondents
Reasons / Number of visits to
Japan1
2 or
more1
2 or
more1
2 or
more1
2 or
more1
2 or
more1
2 or
more1
2 or
more1
2 or
more1
2 or
more
Sample size 851 1016 112 165 170 110 114 230 105 253 125 100 96 86 70 37 59 35
Interest in Japanese food 50% 54% 28% 34% 45% 51% 41% 53% 56% 63% 66% 69% 53% 55% 56% 51% 61% 63%
Interest in Japan's nature and
scenery47% 48% 27% 31% 58% 60% 45% 50% 27% 46% 60% 58% 45% 40% 56% 54% 63% 66%
Interest in Japanese hot
springs39% 42% 29% 34% 55% 54% 36% 39% 30% 47% 48% 45% 29% 34% 40% 35% 32% 46%
High level of safety 34% 43% 21% 22% 33% 37% 40% 56% 32% 44% 42% 58% 28% 37% 46% 38% 31% 46%
Interest in Japanese culture
and history37% 37% 21% 19% 39% 45% 40% 41% 24% 29% 46% 55% 34% 35% 40% 51% 66% 71%
Desire to shop in Japan 33% 39% 9% 18% 42% 49% 31% 36% 40% 51% 42% 44% 26% 41% 30% 35% 37% 37%
Interest in Japan's World
Heritage Sites27% 27% 8% 11% 29% 34% 22% 30% 19% 23% 43% 48% 24% 17% 27% 35% 53% 57%
Nonstop flights available 22% 30% 13% 20% 29% 34% 22% 34% 11% 31% 34% 36% 16% 22% 27% 30% 19% 40%
Recommendation of friend or
acquaintance25% 22% 25% 22% 25% 35% 36% 23% 21% 16% 25% 25% 20% 20% 24% 19% 27% 26%
Short length of journey 21% 26% 34% 38% 28% 29% 21% 28% 14% 20% 18% 31% 14% 12% 11% 14% 14% 20%
Interest in Japanese fashion,
games or anime19% 22% 8% 9% 24% 37% 17% 16% 13% 30% 17% 25% 20% 10% 27% 27% 27% 40%
Interest in Japanese science
and technology21% 18% 5% 8% 25% 35% 13% 12% 10% 15% 29% 27% 16% 12% 33% 30% 49% 54%
Interest in Japanese railroads 17% 21% 1% 4% 16% 20% 14% 20% 13% 22% 27% 36% 7% 19% 23% 27% 44% 43%
Low prices 18% 19% 17% 18% 9% 13% 14% 14% 15% 24% 23% 18% 30% 26% 23% 24% 19% 9%
Recommendation of family
member18% 17% 12% 10% 12% 19% 24% 20% 17% 15% 18% 18% 24% 19% 17% 8% 25% 26%
Article in newspaper or
magazine12% 14% 3% 5% 13% 26% 10% 11% 10% 13% 14% 18% 11% 10% 21% 22% 15% 29%
Low-cost carrier available 12% 12% 4% 5% 8% 19% 5% 9% 7% 9% 20% 25% 7% 5% 26% 16% 41% 29%
Internet advertisement; good
reviews on blogs or social
networking sites
11% 12% 5% 13% 16% 27% 11% 10% 7% 4% 14% 19% 1% 5% 14% 8% 24% 20%
Japanese tourism campaign 10% 11% 2% 3% 5% 12% 4% 5% 10% 14% 17% 14% 9% 12% 24% 24% 27% 29%
TV advertisement 11% 9% 2% 8% 18% 23% 3% 5% 5% 5% 19% 15% 11% 10% 14% 8% 20% 20%
Interest in Japanese sports 6% 7% 2% 4% 9% 12% 6% 7% 3% 6% 6% 7% 3% 5% 6% 8% 10% 29%
Other 4% 3% 9% 5% 1% 0% 3% 4% 2% 2% 3% 1% 10% 3% 4% 8% 2% 0%
Korea China Taiwan Hong Kong Thailand Singapore Malaysia IndonesiaAll

10
Travelers are using diverse sources of information, both before and during their visit.
• Before setting out, travelers gather information from print media, such as guidebooks, but augment this with information from friends, immediate family and other relatives. During their visit, they visit tourist information centers and enlist the help of lodgings staff and other local sources, as well as utilizing free travel guides or brochures.
10. “What were your sources of information on Japan?”
Sources of information after arriving in Japan
Sources of information before arriving in Japan
Notes: 1 This question was directed at respondents who had been to Japan in the past, and asked about their sources of information on Japan during their most recent trip. 2 The top 5 items are indicated in red or yellow.
(Multiple responses)
(Multiple responses)
Previous visitors to Japan
Respondents
Source of information /
Visits to Japan1
2 or
more1
2 or
more1
2 or
more1
2 or
more1
2 or
more1
2 or
more1
2 or
more1
2 or
more1
2 or
more
Sample size 851 1016 112 165 170 110 114 230 105 253 125 100 96 86 70 37 59 35
Travel guidebook 37% 41% 31% 30% 32% 38% 42% 38% 41% 51% 42% 45% 24% 36% 47% 30% 44% 49%
Friends 39% 37% 34% 28% 40% 47% 37% 38% 46% 38% 38% 32% 35% 35% 39% 41% 49% 46%
Travel magazine 31% 35% 16% 17% 39% 48% 32% 32% 36% 48% 32% 43% 11% 13% 31% 32% 46% 43%
Family, relatives 32% 32% 18% 24% 34% 44% 40% 37% 27% 31% 26% 31% 33% 26% 43% 24% 44% 26%
Website of the Japan
National Tourist
Organization or Japan
Tourism Agency
26% 35% 13% 13% 26% 41% 24% 33% 16% 44% 26% 39% 35% 35% 41% 54% 42% 51%
Travel agency website 26% 28% 25% 34% 29% 38% 19% 16% 19% 31% 30% 34% 23% 23% 29% 19% 36% 31%
Personal blog 22% 26% 29% 30% 17% 21% 31% 30% 19% 25% 30% 33% 5% 12% 23% 22% 27% 26%
TripAdvisor or similar site
with user-generated
content
23% 22% 7% 12% 39% 41% 10% 14% 16% 18% 29% 29% 21% 30% 21% 32% 32% 43%
TV program 21% 23% 4% 16% 20% 33% 26% 24% 21% 21% 27% 23% 18% 23% 23% 24% 32% 23%
Co-workers 22% 20% 14% 12% 27% 28% 14% 22% 20% 17% 26% 23% 17% 24% 29% 30% 32% 26%
Travel agency counter 21% 21% 13% 15% 30% 32% 23% 16% 21% 19% 23% 32% 13% 19% 17% 24% 19% 29%
Travel agency pamphlet 19% 19% 8% 15% 24% 27% 30% 21% 19% 19% 10% 8% 16% 22% 23% 16% 20% 20%
Official website of local
government, tourism
bureau, etc.
14% 18% 2% 3% 15% 21% 5% 11% 16% 27% 16% 19% 18% 21% 26% 38% 19% 37%
Social network, Twitter 13% 19% 6% 13% 29% 38% 1% 3% 18% 33% 5% 8% 3% 3% 6% 11% 36% 60%
Pamphlet or campaign 15% 14% 4% 6% 15% 18% 8% 15% 9% 12% 16% 17% 17% 16% 34% 27% 27% 29%
Family or friends in
Japan13% 14% 11% 15% 12% 20% 6% 10% 5% 9% 14% 22% 20% 13% 13% 22% 31% 37%
Newspaper 11% 13% 1% 4% 14% 21% 9% 10% 11% 18% 9% 14% 11% 16% 17% 14% 19% 17%
Other 1% 2% 4% 3% 1% 0% 1% 1% 0% 1% 1% 1% 1% 3% 1% 5% 2% 0%
Thailand Singapore Malaysia IndonesiaAll Korea China Taiwan Hong Kong
Respondents→
Source of information /
Visits to Japan1
2 or
more1
2 or
more1
2 or
more1
2 or
more1
2 or
more1
2 or
more1
2 or
more1
2 or
more1
2 or
more
Sample size 851 1016 112 165 170 110 114 230 105 253 125 100 96 86 70 37 59 35
Travel guidebook 33% 36% 27% 32% 30% 38% 38% 33% 28% 42% 36% 37% 28% 29% 40% 24% 46% 43%
Tourist information center 28% 31% 27% 22% 25% 35% 20% 20% 26% 40% 35% 48% 29% 35% 40% 32% 34% 20%
Free travel guide 27% 32% 21% 23% 26% 36% 23% 30% 23% 34% 30% 38% 25% 31% 39% 35% 36% 31%
Free pamphlet or
brochure24% 29% 20% 21% 29% 35% 27% 36% 16% 30% 9% 14% 26% 31% 41% 38% 39% 37%
Staff of hotel or inn 25% 29% 13% 15% 31% 44% 18% 30% 20% 27% 29% 35% 25% 29% 34% 32% 32% 37%
Travel magazine 21% 24% 9% 10% 26% 43% 22% 18% 22% 28% 24% 34% 8% 13% 29% 19% 29% 37%
Tour guide 24% 20% 21% 24% 26% 23% 27% 16% 14% 15% 26% 29% 11% 16% 31% 22% 41% 34%
Website of the Japan
National Tourist
Organization or Japan
Tourism Agency
19% 23% 5% 10% 26% 35% 12% 23% 15% 24% 23% 27% 18% 16% 26% 30% 34% 40%
Travel agency pamphlet 20% 19% 10% 17% 28% 35% 29% 18% 17% 15% 10% 11% 16% 12% 23% 22% 25% 37%
Travel agency website 18% 19% 12% 15% 25% 35% 10% 10% 17% 22% 17% 16% 10% 15% 29% 19% 34% 46%
TripAdvisor or similar site
with user-generated
content
15% 16% 3% 7% 18% 32% 2% 9% 12% 13% 22% 25% 17% 19% 24% 19% 25% 23%
Personal blog 14% 15% 16% 15% 12% 14% 15% 19% 10% 16% 18% 15% 3% 9% 20% 8% 22% 14%
Social network, Twitter 11% 15% 7% 8% 24% 35% 2% 5% 9% 23% 3% 11% 4% 5% 11% 5% 27% 40%
Family or friends in
Japan12% 14% 10% 16% 13% 19% 6% 11% 3% 8% 9% 24% 18% 13% 17% 22% 27% 29%
Employees of local 13% 13% 7% 8% 19% 28% 4% 12% 5% 8% 18% 18% 8% 8% 23% 11% 20% 20%
Official website of local
government, tourism
bureau, etc.
11% 14% 3% 6% 11% 25% 3% 6% 15% 19% 8% 15% 7% 15% 20% 16% 34% 29%
Station employees,
police box officers10% 12% 4% 6% 8% 16% 4% 6% 8% 15% 10% 7% 16% 22% 24% 22% 24% 29%
Passersby on street 11% 11% 8% 10% 8% 13% 5% 8% 9% 11% 14% 12% 13% 15% 23% 24% 15% 11%
Other 0% 1% 0% 1% 1% 0% 0% 1% 0% 0% 1% 1% 1% 3% 1% 0% 0% 0%
Didn't gather information
in Japan13% 10% 19% 13% 11% 5% 18% 15% 24% 7% 7% 3% 17% 13% 1% 8% 3% 0%
All Korea China Taiwan Hong Kong Thailand Singapore Malaysia Indonesia

Notes: 1 The questions on this page were directed at respondents who had been to Japan in the past, and asked what matter they decided after arrival on their most recent trip.
11
Relatively large percentage of travelers decided where to eat, where to shop after arrival.
• While many visitors decide all aspects of their trip before setting out for Japan, a relatively large proportion wait until arrival to choose dining spots and shopping locations. Dining and shopping promotions aimed at such travelers could prove effective.
• Travelers noted the high cost of dining, lodgings, and transportation in Japan. The expense involved in getting around Japan was particularly felt by respondents who enjoy traveling without a guide, such as those from Malaysia and Hong Kong.
11. “Which aspects of your trip did you decide after arrival? Which did you perceive as expensive?”
Things perceived as expensive in Japan
Matters decided after arrival in Japan (excluding visitors who had no free activity days)
(Multiple responses)
(Multiple responses)
Previous visitors to Japan
2 Ranking is indicated by a color scale: : Lowest Highest
Respondents→
Visits to Japan→ 12 or
more1
2 or
more1
2 or
more1
2 or
more1
2 or
more1
2 or
more1
2 or
more1
2 or
more1
2 or
more
Sample size 472 626 64 100 92 62 48 127 71 193 63 58 64 54 43 18 27 14
Restaurants, other
eating places42% 51% 45% 52% 57% 65% 23% 49% 39% 51% 41% 48% 36% 44% 44% 44% 37% 50%
Shopping destinations 34% 42% 33% 41% 43% 56% 17% 37% 38% 41% 32% 41% 31% 37% 42% 44% 30% 43%
Specific sites 24% 26% 20% 15% 24% 37% 21% 22% 27% 27% 29% 31% 22% 28% 26% 33% 26% 43%
Sightseeing areas 25% 24% 28% 22% 18% 27% 15% 13% 21% 25% 22% 31% 33% 28% 42% 56% 22% 29%
Optional tours 16% 15% 5% 8% 32% 42% 6% 16% 10% 8% 6% 12% 17% 19% 30% 39% 26% 14%
Lodgings 10% 12% 9% 13% 12% 21% 0% 2% 8% 8% 11% 16% 14% 11% 12% 28% 11% 50%
Other 1% 0% 0% 0% 0% 0% 0% 0% 0% 0% 3% 0% 2% 2% 5% 0% 4% 0%
Decided everything
before arriving in
Japan
35% 31% 28% 29% 21% 6% 58% 36% 48% 36% 33% 24% 41% 39% 33% 22% 26% 29%
Singapore Malaysia IndonesiaAll Korea China Taiwan Hong Kong Thailand
Respondents
Visits to Japan 12 or
more1
2 or
more1
2 or
more1
2 or
more1
2 or
more1
2 or
more1
2 or
more1
2 or
more1
2 or
more
Sample size 851 1016 112 165 170 110 114 230 105 253 125 100 96 86 70 37 59 35
Food and drink 50% 44% 46% 46% 47% 39% 46% 47% 42% 34% 54% 50% 54% 52% 67% 57% 47% 40%
Lodging 39% 39% 25% 25% 34% 38% 36% 38% 36% 38% 52% 56% 39% 48% 53% 51% 44% 37%
Transportation in
Japan32% 42% 29% 45% 21% 20% 19% 35% 41% 55% 34% 40% 44% 40% 41% 65% 37% 29%
Shopping 36% 32% 26% 33% 32% 30% 32% 30% 33% 24% 38% 41% 47% 42% 53% 35% 44% 51%
Entrance and usage
fees for tourism
facilities and theme
parks
24% 31% 19% 33% 14% 30% 29% 32% 20% 31% 31% 29% 22% 26% 36% 24% 41% 34%
Roundtrip airfare 21% 21% 9% 12% 14% 24% 25% 19% 10% 19% 34% 34% 20% 23% 29% 27% 41% 37%
Taxes 12% 15% 3% 7% 9% 16% 13% 10% 16% 21% 16% 14% 9% 19% 13% 19% 17% 23%
Don't know cost
breakdown because
trip was a tour or
package
13% 10% 14% 8% 12% 5% 25% 19% 11% 9% 10% 3% 8% 7% 11% 8% 10% 6%
Passport and visa
costs11% 9% 1% 2% 17% 18% 9% 5% 7% 7% 13% 15% 3% 5% 16% 8% 25% 37%
Other 0% 0% 1% 1% 0% 0% 0% 0% 1% 0% 0% 0% 1% 1% 0% 0% 0% 0%
Nothing in particular 5% 4% 8% 7% 9% 7% 6% 4% 3% 2% 0% 1% 6% 7% 3% 5% 3% 3%
Malaysia IndonesiaThailand SingaporeAll Korea China Taiwan Hong Kong

2 Ranking is indicated by a color scale: Lowest Highest 12
Ease of changing money, paying by credit card, and utilizing tax exemptions offers potential means of boosting domestic consumption.
12. Shopping in Japan
If there were more places in Japan to change money, use credit cards and cash cards...
Shopping spots in Japan
(Single response)
(Multiple responses)
Notes: 1 The questions on this page were directed at respondents who had been to Japan in the past, and asked about their shopping experience on their most recent trip.
If Japan's tax exemption system were clearer and easier to use... (Single response)
Previous visitors to Japan
Respondents
No. of visits to Japan 12 or
more1
2 or
more1
2 or
more1
2 or
more1
2 or
more1
2 or
more1
2 or
more1
2 or
more1
2 or
more
Sample size 851 1016 112 165 170 110 114 230 105 253 125 100 96 86 70 37 59 35
Shopping malls 53% 56% 30% 37% 62% 70% 37% 45% 65% 72% 48% 38% 74% 70% 60% 65% 51% 60%
Souvenir shops in
tourist areas53% 56% 51% 45% 46% 50% 49% 58% 47% 61% 63% 65% 46% 38% 51% 62% 85% 83%
Department stores 45% 55% 22% 33% 44% 42% 31% 48% 65% 77% 52% 58% 56% 69% 50% 65% 41% 29%
Supermarkets 43% 56% 21% 31% 36% 35% 37% 58% 63% 80% 39% 48% 64% 60% 49% 59% 47% 54%
Convenience stores 42% 53% 41% 42% 28% 28% 49% 56% 53% 76% 42% 50% 46% 43% 51% 54% 41% 40%
Airport shops 42% 54% 40% 56% 46% 49% 42% 55% 34% 57% 49% 48% 45% 59% 39% 54% 29% 29%
100-yen shops 35% 45% 30% 44% 14% 21% 22% 28% 36% 66% 54% 56% 44% 43% 44% 57% 54% 43%
Large discount
stores34% 38% 19% 36% 41% 44% 21% 30% 30% 42% 46% 38% 26% 34% 44% 46% 44% 49%
Drug stores 24% 44% 18% 25% 28% 31% 45% 68% 41% 68% 14% 15% 11% 23% 13% 16% 10% 11%
Specialty shops
(accessory shops,
jewelers, etc.)
32% 34% 12% 16% 44% 61% 19% 24% 24% 38% 44% 46% 30% 26% 41% 46% 42% 37%
Volume retailers of
home electric
appliances
20% 23% 5% 12% 27% 27% 11% 22% 10% 21% 29% 24% 20% 28% 27% 35% 41% 46%
Shops in hotels,
inns or other
lodging places
17% 25% 15% 17% 15% 33% 19% 23% 24% 32% 14% 22% 15% 8% 13% 30% 22% 40%
Other 1% 0% 2% 0% 0% 0% 4% 0% 0% 0% 1% 1% 2% 0% 0% 0% 0% 0%
Malaysia IndonesiaThailand SingaporeAll Korea China Taiwan Hong Kong
Respondents
Number of visits to
Japan1
2 or
more1
2 or
more1
2 or
more1
2 or
more1
2 or
more1
2 or
more1
2 or
more1
2 or
more1
2 or
more
Sample size 851 1016 112 165 170 110 114 230 105 253 125 100 96 86 70 37 59 35
I would have spent
more27% 29% 13% 12% 36% 46% 27% 29% 19% 26% 45% 41% 18% 23% 24% 43% 22% 40%
I probably would have
spent more39% 36% 27% 33% 51% 43% 28% 30% 33% 38% 46% 48% 33% 35% 46% 30% 54% 34%
I would have spent
the same amount28% 31% 52% 50% 11% 10% 40% 38% 36% 31% 7% 9% 45% 36% 19% 16% 22% 26%
Don't know 5% 4% 8% 5% 2% 1% 4% 3% 11% 5% 2% 2% 4% 6% 11% 11% 2% 0%
Malaysia IndonesiaThailand SingaporeAll Korea China Taiwan Hong Kong
Respondents→
Number of visits to
Japan→1
2 or
more1
2 or
more1
2 or
more1
2 or
more1
2 or
more1
2 or
more1
2 or
more1
2 or
more1
2 or
more
Sample size 851 1016 112 165 170 110 114 230 105 253 125 100 96 86 70 37 59 35
I would have bought
more34% 37% 17% 17% 46% 58% 32% 40% 25% 34% 54% 49% 21% 27% 34% 46% 34% 46%
I probably would
have bought more41% 42% 37% 48% 48% 35% 35% 42% 42% 45% 39% 47% 39% 31% 43% 30% 46% 29%
I would have bought
the same amount20% 18% 39% 31% 4% 5% 28% 17% 28% 16% 5% 3% 31% 34% 11% 14% 17% 26%
Don't know 5% 3% 7% 4% 1% 1% 4% 1% 6% 5% 2% 1% 9% 8% 11% 11% 3% 0%
Malaysia IndonesiaThailand SingaporeAll Korea China Taiwan Hong Kong

Notes: 1 This question was directed at respondents who had been to Japan in the past, and asked about the most satisfying aspects of their trip. Listed here are the top 22 of a total of 68 choices. 2 The top 5 items are indicated in red or yellow. 13
Japanese food, nature and scenery, hot springs, and other attractions cited as reasons for coming to Japan, were also rated the most satisfying.
• Japan’s cuisine, its nature and scenery, and its hot springs, which respondents to Question 9 mentioned as reasons for visiting Japan, appeared to meet travelers’ expectations as they also drew high ratings for satisfaction.
• Reactions varied according to nationality. Respondents from China and Malaysia expressed greatest satisfaction with “shopping” those from Indonesia with “staying in a traditional inn (ryokan)” and “buying goods related to anime and other aspects of pop culture.”
13. “Which parts of your trip to Japan satisfied you the most?”
(Up to 5 items each)
Previous visitors to Japan
Respondents→
Satisfying aspects / Number of
visits to Japan1
2 or
more1
2 or
more1
2 or
more1
2 or
more1
2 or
more1
2 or
more1
2 or
more1
2 or
more1
2 or
more
Sample size 851 1016 112 165 170 110 114 230 105 253 125 100 96 86 70 37 59 35
Japanese food 47% 46% 55% 54% 44% 38% 45% 40% 53% 50% 26% 24% 60% 65% 50% 59% 53% 40%
Nature and scenery 36% 32% 36% 38% 41% 31% 37% 33% 28% 32% 38% 29% 40% 35% 31% 22% 29% 26%
Bathing in hot springs 28% 33% 35% 37% 38% 33% 21% 34% 35% 36% 29% 29% 24% 31% 14% 22% 8% 17%
Enjoying favorite foods 21% 25% 13% 15% 25% 26% 25% 33% 33% 36% 28% 23% 14% 13% 11% 11% 3% 6%
Clean, reasonably priced lodgings 24% 20% 33% 30% 11% 11% 17% 17% 17% 19% 33% 18% 28% 12% 33% 30% 31% 31%
High level of public safety 19% 21% 19% 16% 15% 12% 24% 27% 15% 26% 15% 12% 24% 20% 27% 32% 14% 11%
Overall cleanliness 18% 20% 22% 22% 14% 9% 27% 24% 24% 29% 7% 11% 22% 10% 16% 14% 12% 3%
Historic landmarks and famous
buildings20% 16% 34% 21% 20% 15% 27% 20% 16% 12% 10% 16% 17% 9% 13% 11% 15% 9%
Good, inexpensive food 17% 18% 20% 22% 8% 7% 12% 20% 15% 10% 29% 30% 14% 28% 20% 16% 22% 14%
Cherry-blossom viewing 15% 18% 3% 5% 22% 26% 10% 15% 10% 17% 20% 30% 13% 22% 19% 24% 27% 29%
Shopping for clothes and other goods 16% 15% 9% 20% 22% 16% 9% 9% 19% 17% 17% 15% 14% 19% 24% 11% 7% 11%
Shopping for food and beverages 14% 15% 14% 19% 9% 10% 18% 14% 17% 18% 16% 14% 15% 15% 13% 14% 3% 3%
Staying in a traditional inn (ryokan) 15% 13% 13% 10% 13% 15% 11% 11% 17% 8% 10% 20% 21% 22% 19% 16% 31% 31%
Amusement parks; theme parks 14% 12% 14% 8% 12% 11% 22% 14% 15% 17% 13% 7% 14% 8% 14% 19% 10% 9%
Riding railroads 10% 11% 3% 5% 12% 8% 7% 7% 5% 15% 23% 19% 8% 8% 7% 11% 17% 17%
Snowy landscapes 10% 11% 4% 4% 6% 6% 4% 17% 11% 11% 16% 9% 15% 15% 17% 5% 8% 9%
Rest and relaxation 10% 10% 4% 7% 4% 5% 25% 13% 12% 11% 9% 6% 15% 14% 4% 3% 7% 11%
Visiting World Heritage Sites 9% 10% 4% 10% 9% 8% 8% 11% 9% 9% 12% 9% 9% 9% 10% 14% 8% 11%
Convenient, easy-to-use public
transport8% 9% 6% 6% 7% 2% 12% 15% 9% 8% 5% 11% 5% 10% 7% 5% 10% 3%
Japanese sake 8% 7% 12% 11% 14% 13% 3% 4% 6% 3% 6% 9% 5% 12% 9% 5% 12% 11%
Staying in comfort in luxury hotels 8% 7% 1% 4% 10% 16% 16% 9% 17% 5% 2% 6% 7% 6% 1% 5% 5% 11%
Buying goods related to anime and
other aspects of pop culture9% 6% 6% 6% 5% 5% 8% 7% 6% 3% 10% 9% 8% 5% 6% 11% 29% 26%
Singapore Malaysia IndonesiaAll Korea China Taiwan Hong Kong Thailand

Notes: 1 This question was directed at respondents who had been to Japan in the past, and asked about the least satisfying aspects of their trip. Listed here are the top 22 of a total of 68 choices. 2 The top 5 items are indicated in red or yellow. 14
Greatest dissatisfaction found with “travel environment”: language issues, costs, and communication.
• Respondents were unhappy with many of the elements needed to create a pleasant environment for travel, such as language, costs, and communication. Visitors from China, for whom shopping is an important part of a visit to Japan, had many complaints in regard to currency exchange.
• Dissatisfaction among travelers from Thailand, Indonesia and Malaysia tended to center on content: gambling, nightlife, Japanese saké, sports, and so on.
14. “Which parts of your trip to Japan satisfied you the least?”
(Up to 5 items each)
Previous visitors to Japan
Respondents
Cause of dissatisfaction /
Number of visits to Japan1 2 or more 1 2 or more 1 2 or more 1 2 or more 1 2 or more 1 2 or more 1 2 or more 1 2 or more 1 2 or more
Sample size 846 1014 112 165 169 110 114 230 105 253 124 99 96 85 69 37 57 35
Understanding of English 24% 28% 26% 24% 18% 15% 24% 33% 33% 38% 14% 16% 39% 34% 20% 32% 18% 0%
Understanding of own language 24% 25% 21% 24% 30% 19% 25% 26% 32% 31% 16% 16% 27% 27% 25% 30% 11% 3%
Travel costs 22% 25% 31% 28% 28% 15% 24% 30% 17% 28% 15% 11% 28% 29% 16% 24% 9% 9%
Gambling or show experience 14% 16% 7% 9% 14% 15% 13% 16% 10% 14% 19% 35% 17% 15% 14% 11% 18% 26%
Experience with night life (bars,
clubs, night markets, etc.)15% 14% 13% 11% 8% 8% 19% 19% 13% 13% 23% 21% 15% 9% 17% 8% 18% 23%
Ease of using mobile phones and
other communication devices (WiFi
reception, etc.)
12% 14% 10% 13% 14% 12% 20% 19% 11% 15% 5% 6% 16% 14% 9% 8% 4% 9%
Shopping for famous-brand goods
or jewelry13% 13% 14% 13% 7% 4% 22% 16% 7% 11% 19% 14% 11% 16% 12% 8% 12% 17%
Changing money 11% 13% 7% 10% 17% 10% 18% 16% 10% 17% 6% 7% 10% 13% 7% 14% 9% 3%
Tax-exemption system 10% 14% 5% 8% 16% 11% 17% 19% 11% 21% 6% 8% 7% 4% 6% 11% 7% 3%
Interacting with Japanese people 13% 9% 19% 14% 24% 13% 14% 7% 12% 10% 6% 7% 7% 6% 9% 5% 2% 9%
Japanese sake 12% 10% 12% 11% 8% 6% 6% 9% 10% 11% 19% 11% 10% 11% 13% 8% 23% 23%
Absorbing language or specialized
knowledge10% 10% 11% 11% 11% 17% 8% 6% 9% 12% 7% 8% 13% 9% 16% 16% 11% 6%
Staying at luxury hotels 12% 9% 13% 12% 8% 5% 9% 7% 4% 3% 21% 19% 10% 12% 13% 22% 21% 14%
Price and taste of food 11% 9% 21% 15% 13% 16% 9% 10% 12% 6% 9% 3% 7% 9% 6% 3% 7% 6%
Watching domestic professional
sports9% 11% 4% 5% 9% 10% 9% 14% 12% 13% 12% 9% 7% 12% 10% 3% 5% 9%
Watching traditional sports (sumo,
kendo, judo, etc.)10% 10% 13% 7% 11% 14% 11% 13% 10% 10% 7% 8% 8% 5% 9% 5% 7% 9%
Marine sports 9% 10% 6% 7% 7% 12% 11% 8% 11% 12% 9% 11% 5% 8% 7% 11% 16% 14%
Watching international sports
events9% 10% 2% 4% 9% 6% 10% 11% 13% 13% 9% 14% 5% 8% 9% 8% 14% 9%
Shopping for home electrical
appliances and audio-visual goods9% 9% 6% 10% 8% 6% 13% 8% 10% 7% 10% 12% 4% 13% 10% 14% 11% 9%
Shopping for books or DVDs 10% 8% 3% 7% 9% 10% 6% 4% 10% 10% 12% 8% 7% 13% 20% 16% 21% 3%
Tennis, golf, other sports 9% 8% 3% 4% 7% 7% 11% 8% 11% 12% 9% 7% 7% 7% 19% 5% 18% 11%
Winter sports 9% 9% 2% 1% 12% 15% 12% 5% 10% 11% 7% 15% 6% 4% 4% 16% 12% 17%
Singapore Malaysia IndonesiaAll Korea China Taiwan Hong Kong Thailand

53% (61%)
38% (51%) 41% (43%) 58% (62%) 52% (56%)
63% (69%) 58% (66%) 67% (75%) 49% (58%)
All
Korea China Hong Kong Taiwan
Thailand Singapore Malaysia Indonesia
55% (63%)
34% (48%) 41% (45%) 54% (60%) 48% (51%)
60% (66%) 62% (68%) 73% (79%) 72% (80%)
All
Thailand Singapore
Korea China Hong Kong Taiwan
Malaysia Indonesia
49% (56%)
33% (47%) 47% (53%) 48% (53%) 57% (60%)
50% (56%) 51% (56%) 56% (62%) 50% (58%)
All
Thailand Singapore Malaysia Indonesia
China Hong Kong TaiwanKorea
59% (66%)
49% (63%) 52% (55%) 60% (64%) 59% (62%)
59% (64%) 64% (72%) 65% (71%) 69% (78%)
All
Thailand Singapore
Korea China Hong Kong Taiwan
Malaysia Indonesia
47% (51%)
39% (43%) 42% (44%) 43% (47%) 33% (37%)
49% (52%) 45% (51%) 62% (66%) 61% (66%)
All
Thailand Singapore
Korea China Hong Kong Taiwan
Malaysia Indonesia
57% (63%)
46% (55%) 41% (43%) 52% (58%) 59% (64%)
59% (63%) 60% (68%) 73% (78%) 63% (71%)
All
Korea China Hong Kong Taiwan
Thailand Singapore Malaysia Indonesia
53% (61%)
17% (23%) 37% (38%) 45% (50%) 62% (66%)
61% (70%) 66% (73%) 76% (80%) 63% (71%)
All
Thailand Singapore Malaysia Indonesia
Korea China Hong Kong Taiwan
67% (73%)
48% (55%) 72% (77%) 60% (66%) 61% (65%)
73% (77%) 71% (77%) 77% (84%) 74% (77%)
All
Thailand Singapore
Korea China Hong Kong Taiwan
Malaysia Indonesia
66% (73%)
32% (41%) 63% (66%) 58% (64%) 65% (68%)
74% (79%) 72% (78%) 83% (88%) 78% (86%)
All
Korea China Hong Kong Taiwan
Thailand Singapore Malaysia Indonesia
66% (74%)
56% (76%) 55% (57%) 72% (78%) 67% (71%)
68% (77%) 70% (80%) 74% (81%) 64% (74%)
All
Indonesia
Hong Kong TaiwanKorea China
Thailand Singapore Malaysia
49% (57%)
31% (41%) 38% (41%) 62% (66%) 47% (51%)
58% (67%) 48% (55%) 50% (59%) 57% (68%)
All
Korea
Thailand Singapore Malaysia
China Hong Kong Taiwan
Indonesia
68% (73%)
67% (71%) 63% (65%) 65% (69%) 69% (73%)
73% (77%) 74% (80%) 73% (81%) 59% (66%)
All
Korea China Hong Kong Taiwan
Thailand Singapore Malaysia Indonesia
15
3. Traditional streetscapes
Hot springs, Mt. Fuji, traditional streetscapes, cherry blossoms, and Japanese inns: Travelers strongly drawn to Japan’s native scenery.
• As in the previous two surveys, respondents showed greater interest in Japan’s native scenery, than in shopping, urban landscapes, infrastructure or factories.*
• Seasonal attractions such as cherry blossoms, snowy landscapes, and autumn leaves were highly popular among respondents from Thailand, Singapore, Malaysia and elsewhere in Southeast Asia. Urban landscapes, dams and factories were of considerable interest to respondents from Malaysia and Indonesia.
15. Images of Japanese tourist areas: “What would you like to see and do?” (1)
1. Hot springs 2. Mt. Fuji
4. Cherry blossoms 5.Traditional inns 6. Snowy landscapes
7. Bullet train 8. Castles 9. Autumn leaves
10. Theme parks 11. Temples, shrines 12. Traditional gardens
* Numbers in parentheses are percentages for those who expressed a desire to travel to Japan in Question 2 (Travel preferences by country/region).
All respondents

39% (43%)
21% (24%) 43% (45%) 29% (31%) 30% (33%)
42% (46%) 46% (53%) 53% (60%) 44% (49%)
All
China Hong Kong TaiwanKorea
Thailand Singapore Malaysia Indonesia
26% (32%)
14% (20%) 30% (34%) 32% (35%) 18% (19%)
24% (28%) 21% (27%) 38% (44%) 36% (45%)
All
Thailand Singapore
Korea China Hong Kong Taiwan
Malaysia Indonesia
11% (13%)
2% (4%) 7% (8%) 8% (10%) 9% (9%)
11% (12%) 11% (14%) 18% (23%) 20% (22%)
All
China Hong Kong TaiwanKorea
Thailand Singapore Malaysia Indonesia
35% (41%)
22% (34%) 40% (45%) 29% (32%) 31% (33%)
30% (33%) 42% (46%) 47% (53%) 42% (49%)
All
Thailand Singapore Malaysia Indonesia
Korea China Hong Kong Taiwan
25% (29%)
17% (25%) 27% (36%) 35% (37%) 31% (33%)
17% (16%) 28% (33%) 24% (26%) 19% (18%)
All
Thailand Singapore
Korea China Hong Kong Taiwan
Malaysia Indonesia
36% (40%)
27% (34%) 42% (46%) 26% (27%) 33% (36%)
33% (34%) 42% (46%) 47% (54%) 38% (42%)
All
Korea China Hong Kong Taiwan
Thailand Singapore Malaysia Indonesia
45% (51%)
30% (35%) 52% (58%) 42% (45%) 49% (54%)
40% (45%) 51% (59%) 55% (60%) 39% (45%)
All
Malaysia Indonesia
China Hong Kong TaiwanKorea
SingaporeThailand
32% (36%)
9% (13%) 22% (23%) 23% (26%) 25% (25%)
36% (38%) 50% (58%) 43% (47%) 49% (53%)
All
Thailand Singapore Malaysia Indonesia
Korea China Hong Kong Taiwan
35% (43%)
14% (27%) 27% (28%) 42% (46%) 54% (60%)
28% (30%) 43% (52%) 46% (51%) 27% (33%)
All
Thailand Singapore Malaysia Indonesia
China Hong Kong TaiwanKorea
43% (50%)
19% (24%) 40% (47%) 43% (47%) 53% (59%)
43% (48%) 47% (54%) 53% (58%) 43% (51%)
All
Malaysia Indonesia
China Hong Kong TaiwanKorea
SingaporeThailand
16% (19%)
4% (8%) 8% (10%) 10% (11%) 12% (14%)
16% (17%) 21% (21%) 26% (30%) 32% (38%)
All
Thailand Singapore
Korea China Hong Kong Taiwan
Malaysia Indonesia
33% (38%)
12% (16%) 27% (28%) 25% (29%) 34% (36%)
30% (32%) 42% (49%) 48% (55%) 44% (51%)
All
Singapore Malaysia Indonesia
China Hong Kong TaiwanKorea
Thailand
16
15. Images of Japanese tourist areas: “What would you like to see and do?” (2)
25.None of the above
22. Luxury hotels 23. Dams (large-scale infrastructure) 24. Factories
13. Shopping malls 14.Department stores (basement food floors)
15. Island scenery
17. Ocean (seashore) 18. Supermarkets (convenience stores)
19.Countryside 21. Urban landscapes (skyscrapers, etc.)
16.Ocean (resort)
20.Mountains
All respondents
1% (0%) 2% (1%) 1% (0%) 1% (0%) 1% (0%)
0% (0%) 1% (0%) 0% (0%) 0% (0%)
Thailand Singapore Malaysia Indonesia
All Korea China Hong Kong Taiwan

17 Note: The top 5 items are indicated in red or yellow.
Broad recognition of “Golden Route” and Hokkaido; desire to visit Hokkaido especially strong
• Findings were roughly the same as in the previous survey in regard to the respondents’ recognition of Japan’s tourist areas and their desire to visit them.
• The choices included a mixture of the names of individual cities and those of wider regions. The regional names of Hokkaido, Shikoku, and Kyushu drew recognition, but for Kansai and Tohoku it was specific cities, such as Kyoto, Osaka and Sendai, that the respondents knew best.
• Hokkaido proved hugely popular, topping the list of desired destinations among respondents from Taiwan, Hong Kong and Singapore.
• Desire to visit Okinawa was strong among the Southeast Asian regions of China, Taiwan and Hong Kong.
17. Japanese tourist areas: Traveler recognition and desire to visit
(Multiple responses)
All respondents
Respondents
RecognitionDesire
to visitRecognition
Desire
to visitRecognition
Desire
to visitRecognition
Desire
to visitRecognition
Desire
to visitRecognition
Desire
to visitRecognition
Desire
to visitRecognition
Desire
to visitRecognition
Desire
to visit
Sample size 4000 3809 500 473 500 495 500 489 500 492 500 482 500 457 500 468 500 453
Tokyo 78% 47% 75% 35% 80% 53% 83% 47% 85% 36% 76% 50% 77% 52% 76% 54% 71% 51%
Mt. Fuji 75% 47% 64% 30% 80% 61% 80% 47% 80% 27% 77% 56% 75% 50% 74% 52% 67% 52%
Hakone 28% 10% 23% 7% 33% 13% 62% 27% 50% 12% 22% 7% 18% 5% 9% 2% 5% 2%
Nikko 14% 5% 8% 2% 21% 7% 27% 12% 17% 4% 15% 5% 6% 2% 9% 2% 6% 2%
Matsumoto 9% 2% 6% 1% 22% 4% 12% 3% 4% 1% 11% 3% 5% 1% 6% 2% 6% 1%
Karuizawa 14% 7% 3% 2% 13% 4% 55% 30% 30% 11% 6% 1% 3% 1% 3% 1% 3% 1%
Hokkaido 65% 43% 54% 25% 74% 51% 81% 60% 75% 45% 65% 43% 63% 52% 63% 43% 46% 21%
Sapporo 49% 22% 62% 32% 52% 21% 70% 30% 65% 24% 48% 24% 41% 18% 25% 11% 28% 11%
Hakodate 20% 8% 13% 4% 18% 5% 51% 24% 41% 16% 11% 3% 13% 5% 6% 3% 3% 1%
Obihiro / Tokachi 7% 2% 2% 1% 10% 2% 15% 6% 15% 5% 4% 1% 3% 1% 2% 0% 4% 1%
Niseko 5% 2% 2% 1% 14% 5% 4% 2% 5% 1% 4% 1% 4% 1% 5% 2% 2% 1%
Shiretoko 6% 2% 1% 0% 12% 2% 8% 3% 14% 7% 3% 1% 4% 2% 3% 1% 3% 1%
Kushiro / Akan 6% 2% 3% 0% 7% 1% 16% 7% 13% 7% 4% 1% 4% 1% 3% 1% 2% 1%
Tohoku 11% 3% 7% 2% 14% 2% 26% 9% 20% 4% 6% 1% 7% 2% 5% 1% 4% 1%
Aomori 19% 5% 20% 4% 20% 5% 49% 15% 38% 10% 9% 3% 6% 3% 4% 1% 6% 1%
Sendai 29% 8% 20% 5% 45% 15% 53% 14% 46% 11% 35% 11% 11% 4% 14% 3% 9% 3%
Matsushima 11% 3% 4% 1% 24% 6% 13% 4% 20% 4% 9% 2% 5% 1% 8% 1% 6% 2%
Hiraizumi 5% 1% 2% 0% 16% 4% 4% 1% 6% 1% 4% 1% 3% 1% 5% 2% 3% 1%
Niigata 18% 4% 5% 1% 24% 5% 44% 11% 28% 5% 13% 3% 11% 3% 8% 3% 8% 2%
Sado 5% 1% 2% 1% 10% 1% 5% 2% 5% 1% 5% 1% 3% 1% 4% 1% 3% 1%
Hokuriku 7% 2% 4% 1% 13% 3% 13% 5% 8% 3% 4% 1% 4% 2% 4% 1% 2% 1%
Kanazawa 12% 3% 4% 2% 15% 3% 26% 8% 19% 5% 9% 3% 5% 2% 6% 2% 8% 1%
Tateyama / Kurobe 12% 6% 3% 1% 10% 3% 41% 24% 26% 14% 5% 2% 4% 2% 2% 1% 2% 0%
Toyama 16% 5% 4% 1% 37% 15% 26% 8% 30% 7% 8% 2% 8% 3% 9% 3% 7% 2%
Nagoya 54% 21% 51% 12% 69% 38% 75% 35% 67% 22% 44% 13% 35% 11% 48% 20% 46% 16%
Ise / Shima 11% 3% 3% 1% 17% 3% 29% 8% 21% 5% 8% 2% 4% 2% 4% 1% 3% 0%
Hida / Takayama 9% 3% 4% 1% 9% 1% 30% 12% 15% 5% 5% 1% 4% 2% 5% 1% 3% 0%
Kansai 34% 10% 34% 6% 38% 11% 64% 25% 48% 12% 35% 12% 16% 4% 22% 5% 14% 4%
Kyoto 63% 32% 63% 23% 74% 49% 78% 43% 69% 26% 67% 37% 51% 24% 51% 27% 49% 25%
Nara 33% 12% 36% 9% 54% 25% 61% 24% 54% 15% 26% 10% 13% 5% 12% 3% 7% 2%
Osaka 69% 35% 66% 24% 75% 40% 80% 42% 79% 32% 67% 39% 61% 32% 65% 36% 59% 34%
Kobe 50% 16% 46% 12% 67% 28% 69% 26% 60% 15% 43% 12% 38% 11% 41% 12% 38% 11%
Okayama 16% 4% 13% 2% 22% 4% 30% 7% 16% 4% 12% 2% 9% 4% 9% 2% 13% 4%
Hiroshima 45% 12% 38% 5% 54% 16% 56% 16% 41% 7% 46% 14% 38% 12% 42% 10% 45% 16%
Sannin 5% 1% 1% 1% 11% 3% 11% 3% 5% 1% 2% 0% 2% 1% 2% 1% 2% 1%
Tottori 13% 3% 25% 6% 18% 4% 26% 5% 19% 4% 4% 1% 3% 1% 3% 0% 4% 1%
Matsue / Izumo 6% 2% 3% 0% 14% 2% 10% 3% 8% 2% 5% 1% 3% 1% 3% 1% 2% 1%
Shikoku 22% 6% 10% 2% 40% 12% 44% 15% 36% 10% 17% 4% 6% 2% 11% 3% 8% 3%
Shimanami Kaido 4% 1% 2% 0% 12% 3% 5% 2% 4% 1% 3% 0% 2% 1% 2% 0% 4% 1%
Takamatsu 7% 2% 3% 0% 14% 2% 11% 3% 10% 2% 6% 1% 3% 2% 5% 1% 4% 1%
Matsuyama / Dogo 7% 2% 4% 1% 16% 3% 10% 3% 12% 2% 7% 2% 2% 1% 3% 1% 4% 2%
Kyushu 42% 13% 54% 14% 53% 14% 67% 24% 66% 19% 33% 11% 23% 8% 20% 6% 16% 5%
Fukuoka / Hakata 37% 10% 52% 15% 43% 9% 57% 18% 51% 11% 33% 12% 19% 7% 22% 5% 18% 6%
Nagasaki 43% 12% 44% 11% 53% 14% 61% 21% 48% 10% 41% 13% 25% 9% 32% 7% 41% 12%
Beppu / Yufuin 15% 5% 32% 14% 13% 4% 21% 10% 34% 7% 7% 3% 6% 3% 1% 0% 2% 0%
Kumamoto / Aso 15% 4% 12% 3% 21% 5% 38% 11% 39% 11% 4% 1% 4% 2% 3% 1% 1% 0%
Miyazaki 24% 6% 18% 5% 40% 10% 47% 13% 44% 8% 16% 3% 8% 2% 10% 3% 7% 2%
Kagoshima 30% 10% 25% 5% 48% 17% 66% 29% 61% 20% 9% 4% 10% 3% 9% 3% 9% 2%
Okinawa 53% 24% 50% 23% 64% 31% 75% 39% 71% 34% 44% 19% 44% 19% 41% 16% 34% 12%
Know none of the
above5% 3% 5% 8% 1% 1% 2% 3% 2% 2% 4% 1% 9% 2% 6% 2% 9% 1%
Hong Kong Thailand Singapore Malaysia IndonesiaAll Korea China Taiwan

Note: The top 5 items are indicated in red, orange or yellow. 18
More visits to Japan means greater recognition of Japan’s tourist spots.
• Knowledge of Japanese tourist areas proved greatest among respondents who had visited most frequently, regardless of their nationality.
• Respondents showed high levels of recognition for the “Golden Route” and Hokkaido, whether they had been to Japan or not. Repeat visitors, however, were familiar with other areas as well: Tateyama and Kurobe were well known to those from Taiwan and Hong Kong, and Hiroshima to those from Indonesia.
18. Traveler recognition of Japanese tourist areas, by number of past visits: “Where would you like to visit in Japan?”
(Multiple responses)
All respondents
Respondents→
Number of visits to
Japan→0 1
2 or
more0 1
2 or
more0 1
2 or
more0 1
2 or
more0 1
2 or
more0 1
2 or
more0 1
2 or
more0 1
2 or
more0 1
2 or
more
Sample size 2133 851 1016 223 112 165 220 170 110 156 114 230 142 105 253 275 125 100 318 96 86 393 70 37 406 59 35
Tokyo 70% 84% 90% 66% 76% 87% 72% 88% 83% 73% 87% 89% 75% 83% 92% 67% 86% 91% 67% 93% 94% 74% 77% 92% 67% 78% 94%
Mt. Fuji 69% 78% 83% 59% 63% 72% 73% 85% 86% 76% 78% 83% 75% 74% 86% 70% 82% 88% 69% 81% 88% 72% 81% 81% 63% 81% 91%
Hakone 14% 31% 54% 14% 21% 38% 24% 38% 43% 51% 52% 75% 34% 35% 64% 13% 25% 44% 8% 28% 44% 6% 14% 35% 2% 20% 20%
Nikko 7% 14% 27% 4% 4% 17% 11% 19% 41% 16% 26% 34% 8% 9% 25% 9% 14% 33% 2% 10% 19% 7% 11% 19% 3% 17% 23%
Matsumoto 6% 10% 15% 3% 2% 12% 14% 25% 33% 10% 9% 14% 1% 5% 5% 8% 8% 22% 3% 4% 14% 5% 10% 14% 4% 12% 23%
Karuizawa 6% 14% 32% 0% 1% 8% 4% 18% 25% 45% 46% 65% 18% 17% 42% 3% 6% 11% 2% 2% 6% 1% 6% 14% 1% 5% 17%
Hokkaido 58% 69% 78% 50% 50% 62% 69% 77% 78% 75% 79% 87% 65% 70% 83% 60% 67% 79% 56% 73% 77% 61% 66% 73% 42% 61% 71%
Sapporo 38% 52% 70% 55% 59% 73% 48% 50% 63% 66% 58% 80% 58% 57% 72% 41% 53% 61% 31% 53% 65% 21% 31% 57% 23% 44% 49%
Hakodate 9% 19% 42% 6% 7% 25% 10% 21% 30% 37% 41% 64% 23% 28% 57% 6% 14% 18% 7% 18% 33% 4% 7% 24% 1% 5% 23%
Obihiro / Tokachi 3% 6% 16% 1% 0% 4% 3% 12% 23% 7% 9% 24% 12% 8% 21% 3% 3% 7% 2% 4% 6% 2% 4% 5% 2% 8% 14%
Niseko 2% 6% 9% 0% 0% 5% 8% 15% 24% 2% 2% 6% 4% 3% 6% 1% 6% 8% 2% 6% 10% 4% 6% 16% 0% 5% 17%
Shiretoko 2% 7% 14% 0% 1% 2% 6% 12% 23% 1% 5% 15% 5% 8% 23% 1% 4% 6% 3% 5% 7% 2% 9% 5% 2% 8% 14%
Kushiro / Akan 2% 4% 17% 0% 1% 7% 2% 6% 18% 7% 7% 27% 7% 5% 21% 2% 3% 12% 1% 5% 12% 2% 4% 5% 0% 3% 11%
Tohoku 5% 10% 24% 4% 3% 14% 8% 15% 24% 17% 20% 34% 13% 10% 28% 3% 5% 15% 3% 5% 20% 3% 10% 14% 1% 15% 14%
Aomori 9% 20% 39% 15% 14% 30% 11% 24% 31% 40% 41% 58% 24% 28% 51% 4% 13% 17% 2% 8% 20% 3% 6% 14% 3% 14% 26%
Sendai 19% 33% 46% 17% 12% 28% 40% 49% 51% 48% 52% 57% 36% 33% 56% 27% 40% 50% 7% 11% 27% 10% 24% 38% 5% 25% 20%
Matsushima 7% 12% 20% 2% 2% 8% 18% 24% 39% 9% 8% 19% 11% 12% 28% 6% 10% 17% 4% 4% 10% 7% 14% 8% 4% 15% 11%
Hiraizumi 3% 7% 10% 1% 0% 5% 10% 14% 31% 3% 4% 4% 4% 3% 8% 1% 4% 10% 1% 5% 7% 3% 13% 11% 2% 10% 9%
Niigata 11% 19% 30% 2% 2% 12% 16% 25% 38% 44% 41% 45% 23% 16% 36% 11% 15% 17% 8% 13% 19% 6% 14% 27% 5% 19% 17%
Sado 3% 5% 8% 2% 0% 4% 5% 13% 16% 3% 3% 8% 2% 2% 7% 3% 5% 12% 2% 2% 6% 3% 6% 11% 1% 5% 11%
Hokuriku 3% 7% 14% 3% 2% 6% 6% 12% 27% 3% 11% 21% 5% 2% 13% 2% 7% 5% 2% 4% 9% 3% 9% 11% 1% 5% 11%
Kanazawa 5% 10% 26% 2% 1% 9% 5% 18% 30% 12% 17% 39% 8% 10% 30% 5% 6% 24% 3% 5% 13% 5% 6% 22% 5% 17% 26%
Tateyama / Kurobe 4% 10% 29% 0% 2% 8% 5% 10% 18% 26% 27% 57% 8% 16% 40% 2% 3% 13% 2% 4% 13% 1% 6% 8% 0% 8% 9%
Toyama 10% 18% 28% 1% 2% 10% 28% 41% 46% 19% 25% 32% 25% 19% 38% 5% 6% 21% 4% 10% 16% 8% 10% 19% 5% 15% 20%
Nagoya 46% 58% 69% 46% 43% 64% 61% 79% 70% 71% 68% 82% 60% 62% 73% 40% 42% 56% 28% 40% 55% 47% 49% 57% 41% 68% 66%
Ise / Shima 6% 10% 21% 1% 1% 6% 11% 20% 23% 26% 18% 36% 15% 12% 27% 7% 6% 14% 3% 4% 10% 3% 4% 11% 2% 5% 9%
Hida / Takayama 4% 8% 22% 3% 1% 7% 3% 12% 15% 15% 18% 45% 6% 6% 24% 3% 4% 12% 2% 6% 13% 3% 10% 16% 2% 5% 14%
Kansai 24% 38% 51% 26% 35% 43% 28% 48% 45% 58% 62% 69% 42% 34% 56% 32% 30% 51% 12% 15% 31% 18% 39% 35% 10% 31% 23%
Kyoto 53% 71% 77% 54% 66% 73% 67% 82% 73% 70% 73% 86% 56% 64% 77% 62% 70% 78% 41% 71% 69% 47% 61% 76% 45% 73% 66%
Nara 19% 39% 56% 24% 40% 49% 46% 63% 54% 51% 53% 72% 42% 42% 65% 19% 26% 43% 5% 20% 37% 8% 20% 41% 4% 20% 26%
Osaka 59% 76% 82% 52% 71% 80% 68% 82% 76% 73% 75% 87% 72% 74% 86% 63% 69% 75% 50% 80% 80% 61% 74% 89% 53% 85% 77%
Kobe 41% 56% 64% 40% 36% 61% 59% 77% 68% 67% 63% 73% 56% 54% 65% 38% 44% 56% 30% 49% 53% 36% 56% 62% 33% 59% 57%
Okayama 11% 16% 26% 9% 13% 19% 15% 25% 33% 27% 22% 37% 13% 10% 21% 9% 10% 23% 7% 6% 19% 8% 10% 22% 10% 24% 29%
Hiroshima 43% 42% 52% 39% 28% 44% 53% 55% 57% 54% 49% 61% 42% 30% 45% 47% 37% 53% 32% 44% 51% 41% 37% 51% 42% 53% 74%
Sannin 2% 5% 10% 0% 0% 4% 5% 12% 23% 6% 8% 15% 4% 2% 8% 1% 4% 4% 1% 2% 5% 1% 7% 5% 0% 5% 11%
Tottori 7% 12% 25% 21% 16% 36% 10% 21% 27% 20% 22% 32% 12% 10% 26% 3% 2% 10% 3% 4% 6% 2% 4% 5% 2% 10% 14%
Matsue / Izumo 3% 7% 12% 1% 3% 5% 7% 15% 26% 7% 7% 14% 4% 4% 13% 3% 5% 11% 1% 4% 8% 2% 6% 8% 1% 5% 11%
Shikoku 14% 24% 35% 8% 8% 15% 34% 44% 46% 44% 41% 45% 27% 27% 45% 15% 13% 28% 5% 4% 14% 9% 23% 16% 4% 22% 31%
Shimanami Kaido 2% 5% 7% 0% 2% 3% 5% 14% 23% 3% 5% 6% 4% 1% 6% 1% 6% 3% 1% 2% 5% 2% 3% 0% 2% 3% 20%
Takamatsu 4% 6% 14% 2% 1% 7% 7% 14% 29% 8% 6% 15% 10% 3% 13% 3% 7% 14% 3% 3% 7% 4% 7% 11% 3% 5% 20%
Matsuyama / Dogo 4% 8% 14% 2% 1% 9% 7% 17% 32% 6% 11% 13% 13% 4% 15% 3% 9% 16% 1% 1% 6% 3% 6% 5% 3% 7% 14%
Kyushu 30% 45% 62% 48% 46% 68% 45% 56% 65% 62% 63% 72% 61% 60% 72% 32% 32% 36% 17% 27% 43% 19% 27% 24% 12% 32% 37%
Fukuoka / Hakata 27% 40% 55% 48% 47% 62% 35% 46% 52% 49% 50% 65% 43% 47% 58% 28% 33% 48% 14% 19% 42% 20% 29% 35% 14% 37% 31%
Nagasaki 37% 45% 54% 40% 38% 53% 46% 63% 50% 56% 59% 66% 44% 45% 51% 39% 33% 57% 21% 27% 36% 31% 33% 41% 38% 53% 54%
Beppu / Yufuin 6% 12% 35% 21% 29% 51% 4% 15% 30% 11% 13% 33% 26% 15% 45% 3% 4% 25% 3% 4% 19% 1% 3% 5% 1% 10% 9%
Kumamoto / Aso 7% 14% 34% 5% 7% 25% 12% 24% 34% 29% 28% 48% 30% 25% 50% 3% 2% 12% 2% 2% 10% 3% 6% 8% 0% 3% 11%
Miyazaki 16% 26% 39% 13% 18% 25% 34% 44% 47% 43% 42% 51% 40% 37% 48% 13% 13% 29% 5% 8% 19% 9% 7% 22% 4% 17% 31%
Kagoshima 19% 30% 50% 25% 18% 31% 40% 49% 63% 63% 55% 73% 56% 53% 68% 5% 8% 21% 9% 6% 19% 8% 11% 14% 5% 20% 29%
Okinawa 45% 57% 68% 48% 44% 57% 60% 66% 71% 71% 72% 80% 68% 68% 74% 37% 48% 59% 40% 51% 51% 39% 46% 62% 31% 46% 60%
Know none of the
above9% 0% 0% 12% 1% 0% 2% 0% 0% 7% 0% 0% 6% 0% 0% 7% 0% 0% 14% 0% 0% 8% 0% 0% 12% 0% 0%
All Korea China Taiwan Hong Kong Thailand Singapore Malaysia Indonesia

Notes: 1 This question asked the respondents which, of the tourist areas they said they “knew of” in response to the previous question, they would actually wish to visit. 2 The top 5 items are indicated in red, orange or yellow. 19
Repeat visitors want to travel extensively in Japan
• Repeat visitors to Japan are familiar with all of the nation’s tourist areas and are eager to visit them. Regional initiatives are needed to promote recognition of localities and their tourist resources and enhance their value to draw in repeat visitors.
• Of all areas which rose in ranking because of interest by repeat visitors, Hakone and Nara showed the greatest increases.
19. Desire to visit a Japanese tourist area, by number of visits to Japan: “Where in Japan would you like to go?”
(Multiple responses)
All respondents
Respondents
Number of visits to
Japan0 1
2 or
more0 1
2 or
more0 1
2 or
more0 1
2 or
more0 1
2 or
more0 1
2 or
more0 1
2 or
more0 1
2 or
more0 1
2 or
more
Sample size 1943 850 1016 197 111 165 215 170 110 145 114 230 134 105 253 257 125 100 275 96 86 361 70 37 359 59 35
Tokyo 50% 43% 44% 35% 37% 33% 52% 52% 55% 46% 46% 48% 38% 30% 37% 50% 41% 62% 56% 48% 45% 56% 49% 43% 53% 42% 46%
Mt. Fuji 50% 45% 42% 27% 26% 35% 64% 59% 57% 54% 39% 46% 26% 27% 27% 58% 53% 53% 50% 50% 51% 53% 53% 41% 51% 51% 66%
Hakone 4% 10% 20% 5% 5% 12% 7% 17% 18% 17% 22% 37% 4% 4% 19% 4% 10% 13% 2% 8% 13% 1% 3% 8% 0% 3% 11%
Nikko 2% 4% 11% 1% 1% 4% 3% 6% 15% 4% 6% 19% 1% 0% 8% 2% 4% 13% 1% 3% 7% 1% 6% 8% 1% 5% 9%
Matsumoto 1% 3% 4% 1% 0% 2% 0% 6% 6% 1% 2% 5% 0% 0% 1% 2% 2% 8% 0% 3% 2% 2% 4% 3% 1% 3% 6%
Karuizawa 2% 5% 16% 1% 1% 4% 1% 5% 9% 19% 24% 40% 5% 3% 18% 1% 2% 2% 1% 1% 1% 0% 1% 5% 1% 2% 6%
Hokkaido 40% 44% 47% 21% 25% 28% 52% 55% 45% 63% 53% 62% 43% 40% 49% 43% 40% 48% 51% 54% 55% 42% 43% 43% 20% 25% 23%
Sapporo 15% 22% 35% 25% 30% 40% 13% 24% 32% 23% 18% 41% 19% 19% 30% 20% 24% 35% 12% 27% 29% 9% 14% 30% 9% 14% 29%
Hakodate 2% 6% 19% 1% 3% 8% 2% 9% 5% 13% 14% 36% 7% 8% 24% 0% 4% 9% 1% 6% 13% 2% 3% 8% 0% 0% 14%
Obihiro / Tokachi 1% 1% 6% 0% 0% 2% 1% 1% 7% 1% 1% 10% 3% 2% 8% 0% 0% 2% 1% 0% 2% 0% 1% 3% 1% 0% 9%
Niseko 1% 2% 4% 0% 0% 3% 3% 5% 8% 1% 1% 2% 1% 0% 2% 0% 2% 3% 0% 1% 2% 1% 1% 11% 0% 2% 6%
Shiretoko 1% 1% 6% 0% 0% 1% 1% 2% 5% 1% 1% 7% 1% 1% 11% 0% 1% 3% 1% 2% 5% 1% 3% 3% 0% 2% 3%
Kushiro / Akan 1% 1% 7% 0% 0% 1% 0% 1% 4% 2% 0% 13% 3% 1% 11% 0% 1% 3% 1% 2% 2% 0% 4% 0% 0% 2% 6%
Tohoku 1% 2% 8% 1% 1% 5% 2% 2% 5% 6% 3% 13% 1% 0% 8% 0% 1% 3% 0% 2% 8% 0% 4% 8% 0% 2% 6%
Aomori 2% 4% 13% 4% 3% 6% 1% 5% 11% 8% 11% 22% 3% 4% 16% 1% 2% 8% 0% 3% 9% 1% 1% 8% 0% 2% 6%
Sendai 4% 8% 15% 4% 2% 8% 8% 15% 26% 11% 10% 18% 4% 6% 16% 6% 11% 22% 3% 1% 7% 2% 10% 5% 2% 7% 3%
Matsushima 2% 2% 6% 1% 0% 3% 4% 4% 13% 3% 1% 7% 2% 0% 8% 1% 1% 5% 1% 1% 2% 1% 3% 0% 2% 5% 3%
Hiraizumi 1% 2% 2% 1% 0% 1% 2% 3% 7% 1% 0% 1% 1% 0% 1% 0% 2% 5% 0% 2% 3% 1% 6% 5% 0% 5% 3%
Niigata 2% 5% 8% 0% 0% 4% 3% 6% 7% 8% 10% 14% 1% 2% 8% 2% 2% 6% 1% 5% 7% 1% 4% 11% 2% 7% 3%
Sado 1% 1% 2% 1% 0% 1% 1% 2% 1% 1% 0% 3% 0% 1% 2% 0% 2% 2% 0% 2% 1% 0% 3% 5% 1% 2% 0%
Hokuriku 1% 2% 5% 1% 0% 2% 2% 4% 4% 1% 3% 9% 0% 0% 5% 1% 1% 1% 1% 3% 6% 1% 3% 0% 1% 2% 3%
Kanazawa 1% 2% 8% 1% 1% 4% 0% 3% 8% 3% 4% 13% 1% 0% 8% 1% 3% 9% 1% 2% 3% 1% 3% 5% 1% 2% 3%
Tateyama / Kurobe 2% 4% 16% 0% 1% 2% 1% 2% 6% 12% 12% 37% 4% 9% 23% 0% 2% 6% 1% 3% 3% 0% 3% 3% 0% 0% 3%
Toyama 3% 6% 9% 0% 0% 4% 10% 17% 21% 3% 5% 12% 4% 2% 11% 1% 2% 5% 2% 5% 2% 3% 4% 5% 1% 3% 6%
Nagoya 18% 22% 26% 11% 8% 16% 31% 44% 40% 34% 27% 39% 24% 18% 22% 9% 12% 22% 8% 11% 20% 21% 20% 16% 14% 20% 26%
Ise / Shima 1% 2% 7% 0% 0% 2% 1% 5% 5% 3% 4% 12% 0% 3% 8% 2% 0% 5% 1% 2% 6% 0% 1% 3% 0% 0% 3%
Hida / Takayama 1% 2% 8% 1% 0% 2% 0% 2% 3% 3% 7% 20% 1% 0% 9% 1% 1% 2% 0% 2% 5% 0% 3% 3% 0% 0% 0%
Kansai 6% 12% 17% 2% 6% 10% 7% 16% 9% 22% 22% 29% 5% 10% 17% 8% 14% 22% 3% 4% 9% 4% 10% 14% 2% 10% 9%
Kyoto 28% 37% 36% 20% 23% 28% 41% 58% 52% 43% 36% 47% 26% 24% 26% 36% 38% 41% 18% 29% 35% 25% 37% 24% 22% 41% 31%
Nara 6% 14% 23% 5% 5% 18% 18% 31% 29% 14% 18% 33% 10% 10% 20% 7% 9% 20% 1% 6% 17% 1% 7% 16% 1% 7% 6%
Osaka 33% 38% 38% 20% 29% 27% 35% 44% 42% 43% 36% 45% 29% 29% 36% 36% 38% 46% 28% 43% 34% 36% 39% 30% 32% 44% 34%
Kobe 11% 16% 25% 6% 7% 21% 23% 27% 37% 18% 21% 33% 13% 6% 20% 9% 11% 23% 7% 15% 22% 10% 21% 16% 9% 20% 14%
Okayama 2% 3% 8% 1% 1% 5% 1% 5% 10% 5% 7% 9% 1% 0% 7% 0% 4% 6% 3% 1% 7% 2% 1% 8% 2% 3% 17%
Hiroshima 11% 10% 16% 4% 3% 8% 13% 13% 27% 11% 14% 20% 6% 4% 9% 13% 10% 21% 8% 15% 20% 10% 14% 11% 16% 12% 26%
Sannin 0% 1% 3% 0% 0% 2% 1% 2% 6% 1% 1% 5% 0% 0% 2% 0% 1% 1% 0% 1% 1% 0% 4% 3% 0% 3% 3%
Tottori 1% 2% 7% 4% 3% 10% 1% 4% 8% 1% 2% 9% 3% 1% 6% 0% 1% 5% 1% 2% 1% 0% 1% 0% 1% 0% 6%
Matsue / Izumo 1% 1% 3% 1% 0% 1% 1% 3% 4% 1% 1% 6% 1% 0% 3% 0% 0% 4% 0% 2% 3% 0% 1% 3% 1% 3% 3%
Shikoku 3% 7% 13% 2% 1% 3% 6% 12% 22% 10% 11% 21% 6% 7% 14% 2% 4% 10% 1% 3% 1% 2% 7% 3% 1% 7% 14%
Shimanami Kaido 0% 1% 2% 0% 0% 1% 1% 3% 5% 1% 2% 3% 1% 0% 2% 0% 1% 0% 1% 2% 2% 0% 1% 0% 1% 0% 6%
Takamatsu 1% 1% 4% 0% 0% 1% 0% 1% 5% 1% 2% 5% 0% 0% 5% 0% 2% 4% 1% 2% 2% 1% 4% 3% 1% 0% 9%
Matsuyama / Dogo 1% 2% 4% 1% 0% 2% 0% 5% 6% 1% 2% 5% 0% 0% 4% 0% 1% 8% 1% 1% 2% 1% 3% 3% 1% 2% 6%
Kyushu 8% 12% 22% 10% 7% 24% 7% 15% 26% 23% 18% 27% 15% 12% 23% 11% 10% 14% 5% 7% 19% 5% 10% 5% 3% 14% 11%
Fukuoka / Hakata 7% 11% 17% 14% 14% 16% 7% 10% 12% 13% 14% 24% 9% 7% 13% 7% 12% 23% 5% 5% 15% 4% 9% 14% 4% 15% 14%
Nagasaki 9% 11% 18% 9% 8% 15% 13% 12% 19% 14% 17% 27% 5% 9% 13% 12% 9% 23% 8% 9% 13% 6% 10% 11% 10% 20% 23%
Beppu / Yufuin 2% 5% 13% 9% 12% 22% 0% 4% 9% 4% 5% 15% 2% 3% 11% 0% 3% 12% 1% 3% 7% 0% 3% 0% 0% 2% 0%
Kumamoto / Aso 1% 3% 11% 2% 1% 5% 2% 5% 10% 4% 6% 17% 4% 7% 15% 0% 2% 4% 1% 1% 8% 1% 3% 0% 0% 0% 6%
Miyazaki 3% 4% 12% 4% 5% 7% 8% 7% 19% 9% 9% 17% 3% 5% 11% 2% 0% 10% 0% 2% 7% 2% 3% 8% 1% 3% 3%
Kagoshima 5% 10% 20% 3% 4% 7% 10% 18% 29% 22% 26% 34% 20% 10% 24% 2% 3% 8% 1% 3% 8% 2% 6% 8% 0% 3% 11%
Okinawa 20% 26% 32% 22% 19% 26% 27% 32% 37% 41% 34% 40% 32% 31% 35% 16% 19% 27% 16% 28% 20% 15% 14% 27% 10% 17% 20%
None of the above 3% 3% 2% 9% 8% 7% 2% 1% 0% 5% 4% 2% 5% 2% 1% 2% 1% 1% 2% 3% 2% 2% 1% 3% 1% 0% 3%
All Korea China Taiwan Hong Kong Thailand Singapore Malaysia Indonesia
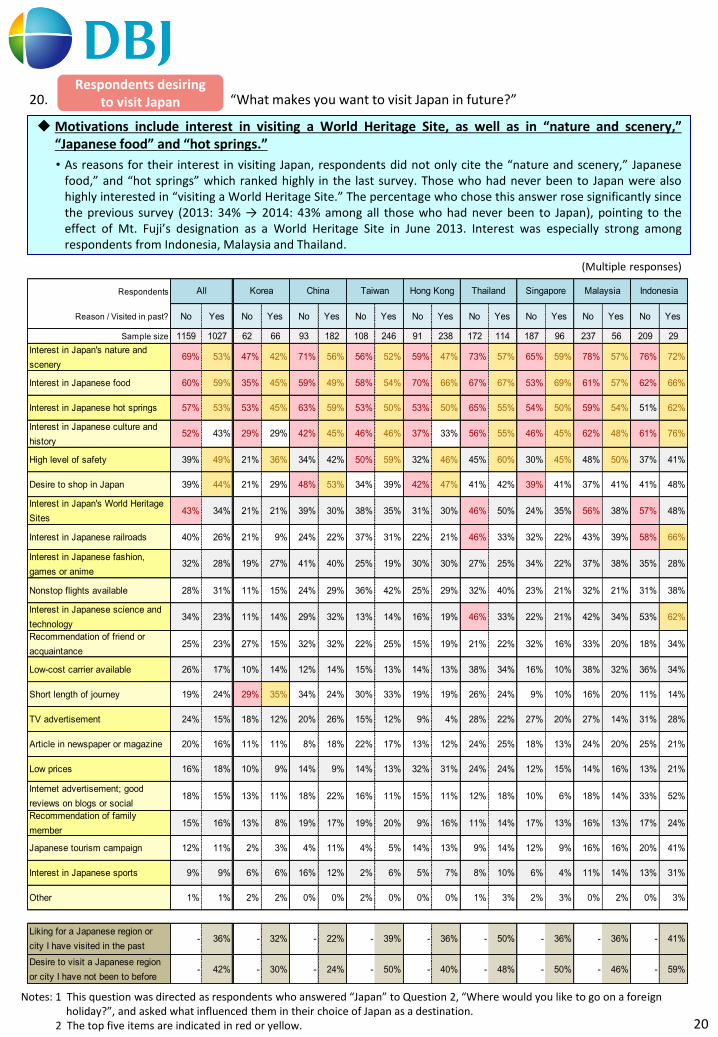
20
Motivations include interest in visiting a World Heritage Site, as well as in “nature and scenery,” “Japanese food” and “hot springs.”
• As reasons for their interest in visiting Japan, respondents did not only cite the “nature and scenery,” Japanese food,” and “hot springs” which ranked highly in the last survey. Those who had never been to Japan were also highly interested in “visiting a World Heritage Site.” The percentage who chose this answer rose significantly since the previous survey (2013: 34% → 2014: 43% among all those who had never been to Japan), pointing to the effect of Mt. Fuji’s designation as a World Heritage Site in June 2013. Interest was especially strong among respondents from Indonesia, Malaysia and Thailand.
20. “What makes you want to visit Japan in future?”
Notes: 1 This question was directed as respondents who answered “Japan” to Question 2, “Where would you like to go on a foreign holiday?”, and asked what influenced them in their choice of Japan as a destination. 2 The top five items are indicated in red or yellow.
(Multiple responses)
Respondents desiring to visit Japan
Respondents
Reason / Visited in past? No Yes No Yes No Yes No Yes No Yes No Yes No Yes No Yes No Yes
Sample size 1159 1027 62 66 93 182 108 246 91 238 172 114 187 96 237 56 209 29
Interest in Japan's nature and
scenery69% 53% 47% 42% 71% 56% 56% 52% 59% 47% 73% 57% 65% 59% 78% 57% 76% 72%
Interest in Japanese food 60% 59% 35% 45% 59% 49% 58% 54% 70% 66% 67% 67% 53% 69% 61% 57% 62% 66%
Interest in Japanese hot springs 57% 53% 53% 45% 63% 59% 53% 50% 53% 50% 65% 55% 54% 50% 59% 54% 51% 62%
Interest in Japanese culture and
history52% 43% 29% 29% 42% 45% 46% 46% 37% 33% 56% 55% 46% 45% 62% 48% 61% 76%
High level of safety 39% 49% 21% 36% 34% 42% 50% 59% 32% 46% 45% 60% 30% 45% 48% 50% 37% 41%
Desire to shop in Japan 39% 44% 21% 29% 48% 53% 34% 39% 42% 47% 41% 42% 39% 41% 37% 41% 41% 48%
Interest in Japan's World Heritage
Sites43% 34% 21% 21% 39% 30% 38% 35% 31% 30% 46% 50% 24% 35% 56% 38% 57% 48%
Interest in Japanese railroads 40% 26% 21% 9% 24% 22% 37% 31% 22% 21% 46% 33% 32% 22% 43% 39% 58% 66%
Interest in Japanese fashion,
games or anime32% 28% 19% 27% 41% 40% 25% 19% 30% 30% 27% 25% 34% 22% 37% 38% 35% 28%
Nonstop flights available 28% 31% 11% 15% 24% 29% 36% 42% 25% 29% 32% 40% 23% 21% 32% 21% 31% 38%
Interest in Japanese science and
technology34% 23% 11% 14% 29% 32% 13% 14% 16% 19% 46% 33% 22% 21% 42% 34% 53% 62%
Recommendation of friend or
acquaintance25% 23% 27% 15% 32% 32% 22% 25% 15% 19% 21% 22% 32% 16% 33% 20% 18% 34%
Low-cost carrier available 26% 17% 10% 14% 12% 14% 15% 13% 14% 13% 38% 34% 16% 10% 38% 32% 36% 34%
Short length of journey 19% 24% 29% 35% 34% 24% 30% 33% 19% 19% 26% 24% 9% 10% 16% 20% 11% 14%
TV advertisement 24% 15% 18% 12% 20% 26% 15% 12% 9% 4% 28% 22% 27% 20% 27% 14% 31% 28%
Article in newspaper or magazine 20% 16% 11% 11% 8% 18% 22% 17% 13% 12% 24% 25% 18% 13% 24% 20% 25% 21%
Low prices 16% 18% 10% 9% 14% 9% 14% 13% 32% 31% 24% 24% 12% 15% 14% 16% 13% 21%
Internet advertisement; good
reviews on blogs or social18% 15% 13% 11% 18% 22% 16% 11% 15% 11% 12% 18% 10% 6% 18% 14% 33% 52%
Recommendation of family
member15% 16% 13% 8% 19% 17% 19% 20% 9% 16% 11% 14% 17% 13% 16% 13% 17% 24%
Japanese tourism campaign 12% 11% 2% 3% 4% 11% 4% 5% 14% 13% 9% 14% 12% 9% 16% 16% 20% 41%
Interest in Japanese sports 9% 9% 6% 6% 16% 12% 2% 6% 5% 7% 8% 10% 6% 4% 11% 14% 13% 31%
Other 1% 1% 2% 2% 0% 0% 2% 0% 0% 0% 1% 3% 2% 3% 0% 2% 0% 3%
Liking for a Japanese region or
city I have visited in the past- 36% - 32% - 22% - 39% - 36% - 50% - 36% - 36% - 41%
Desire to visit a Japanese region
or city I have not been to before- 42% - 30% - 24% - 50% - 40% - 48% - 50% - 46% - 59%
Malaysia IndonesiaThailand SingaporeAll Korea China Taiwan Hong Kong

21
Respondents look for long stays and independent travel.
• Guided package tours remain popular, especially among those who have never been to Japan. However, repeat visitors from Singapore, Hong Kong, Thailand and elsewhere showed a preference for plenty of free activity on their trips.
• The answers to Question 6, ““How did you arrange for hotel/inn accommodations on your last trip to Japan?”, also point to a liking for longer stays in Japan. Measures are needed that will answer visitors’ desire for longer stays by opening up opportunities for travel, lodging and consumption throughout the country.
21. “How would you like to travel on a future trip to Japan?”
Desired length of stay on a future trip to Japan
Desired mode of travel on a future trip to Japan (Single response)
Respondents desiring to visit Japan
Notes: 1 This question was directed as respondents who answered “Japan” to Question 2, “Where would you like to go on a foreign holiday?”, and asked about their preferred mode of travel. 2 Ranking is indicated by a color scale: Lowest Highest
Respondents
Visited Japan in past? No Yes No Yes No Yes No Yes No Yes No Yes No Yes No Yes No Yes
Sample size 1159 1027 62 66 93 182 108 246 91 238 172 114 187 96 237 56 209 29
Guided package tour
(no free activity)24% 25% 26% 20% 19% 31% 31% 33% 14% 18% 27% 28% 17% 8% 20% 27% 33% 45%
Guided package tour
(with free activity)36% 22% 26% 17% 33% 24% 40% 27% 21% 16% 38% 23% 36% 22% 42% 20% 38% 28%
Package including
airfare and hotels
only
19% 24% 27% 27% 25% 21% 19% 21% 33% 33% 20% 14% 17% 22% 14% 25% 14% 21%
Separate
arrangements for
airfare and hotels
18% 26% 16% 26% 20% 20% 6% 18% 32% 32% 13% 31% 28% 47% 21% 29% 11% 3%
Purchased airline
tickets prior to trip;
made hotel
arrangements at
destination
3% 3% 5% 11% 2% 4% 5% 1% 0% 1% 2% 4% 2% 1% 4% 0% 3% 3%
Thailand SingaporeAll Korea China Taiwan Hong Kong Malaysia Indonesia
Respondents All Korea China Taiwan Hong Kong Thailand Sinapore Malaysia Indonesia
Sample size 2186 128 275 354 329 286 283 293 238
Average length of
stay (in days)8.0 5.7 7.7 6.4 8.5 7.4 9.5 9.0 8.4
1-3日 3% 26% 3% 3% 0% 3% 0% 1% 3%
4-5日 28% 50% 24% 48% 30% 34% 10% 13% 23%
6-7日 35% 15% 38% 35% 43% 40% 31% 33% 36%
8-9日 8% 1% 10% 5% 6% 4% 11% 16% 5%
10 or more 26% 9% 24% 9% 21% 20% 48% 37% 33%

22
Traditional inns rate high among respondents wanting to visit Japan.
• For Question 6, ““How did you arrange for hotel/inn accommodations on your last trip to Japan?”, respondents who said they had stayed at a traditional inn (ryokan) were roughly equal in number to those who reported staying at a luxury hotel or an inexpensive hotel. On a future trip, however, an overwhelming percentage said they hoped to stay at a ryokan.
• Over 50 percent of respondents desiring to visit Japan gave a positive answer (“definitely”) when asked if they would like to bathe in a communal bath. While the custom of communal bathing is uncommon in Asia, interest in Japanese hot springs is clearly strong (as indicated in the answers to Question 20), and many want to try it for themselves. A good number of these said they would be more willing if allowed to wear a bathing suit or other covering.
22. Thoughts about lodgings and hot springs bathing on a future trip to Japan
Lodgings on a future trip to Japan
Notes: 1 This question was directed as respondents who answered “Japan” to Question 2, “Where would you like to go on a foreign holiday?”, and asked about their desire to bathe in a hot springs or communal bath.
Baths in traditional Japanese inns are designed to be used by many people at once. How do you feel about bathing in a hot springs bath or other communal bathing facilities?
Notes: 1 This question was directed as respondents who answered “Japan” to Question 2, “Where would you like to go on a foreign holiday?”, and asked what kind of facilities they hoped to stay in on a future trip.
(Single response)
2 Ranking is indicated by a color scale: Lowest Highest
(Multiple responses)
Respondents desiring to visit Japan
Respondents desiring to visit Japan
2 Ranking is indicated by a color scale: Lowest Highest
Respondents
Visited Japan in past? No Yes No Yes No Yes No Yes No Yes No Yes No Yes No Yes No Yes
Sample size 1159 1027 62 66 93 182 108 246 91 238 172 114 187 96 237 56 209 29
Traditional inn (ryokan) 72% 67% 61% 55% 73% 70% 63% 63% 59% 64% 73% 74% 79% 72% 75% 64% 77% 76%
Comfortable luxury hotel 21% 46% 26% 35% 47% 74% 35% 48% 31% 48% 9% 15% 28% 42% 14% 30% 9% 24%
Inexpensive lodgings with
basic facilities (Western-
style)
47% 43% 52% 61% 37% 23% 44% 38% 43% 40% 51% 64% 50% 52% 53% 61% 39% 41%
Youth hostel 15% 11% 16% 17% 5% 7% 17% 10% 23% 6% 9% 13% 14% 13% 18% 18% 15% 28%
Other 0% 1% 0% 2% 0% 0% 0% 2% 1% 1% 0% 1% 1% 0% 1% 0% 0% 3%
All Malaysia IndonesiaKorea China Taiwan Hong Kong Thailand Singapore
Respondents
Sample size
Definitely want to bathe
in a hot springs or
communal bath
Would like to, but only if
wearing a bathing suit or
other covering
Interested, but not sure I
would actually go in
Resistant to the idea
Other
30%
0%
21%
23%
0%
2% 2%
21%
0%
29%
22%
0%
2% 5%
23%12%
0% 0%
25%
22%
0%
3% 9% 5%
22%
0%
36%
20%
0%
4% 5%
47% 44% 39% 55%
27% 25% 25% 30% 28%
47% 39% 60% 43% 47%
Indonesia
2186 128 275 354 329 286 283 293 238
Taiwan Hong Kong Thailand Singapore MalaysiaAll Korea China
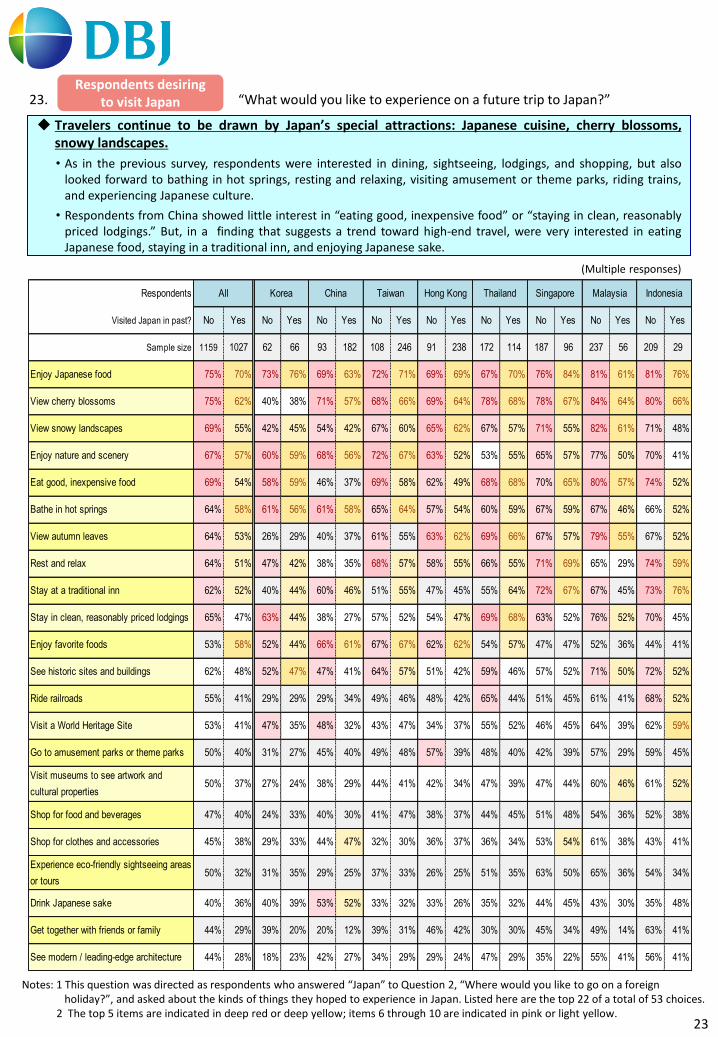
23
Travelers continue to be drawn by Japan’s special attractions: Japanese cuisine, cherry blossoms, snowy landscapes.
• As in the previous survey, respondents were interested in dining, sightseeing, lodgings, and shopping, but also looked forward to bathing in hot springs, resting and relaxing, visiting amusement or theme parks, riding trains, and experiencing Japanese culture.
• Respondents from China showed little interest in “eating good, inexpensive food” or “staying in clean, reasonably priced lodgings.” But, in a finding that suggests a trend toward high-end travel, were very interested in eating Japanese food, staying in a traditional inn, and enjoying Japanese sake.
23. “What would you like to experience on a future trip to Japan?”
(Multiple responses)
Respondents desiring to visit Japan
Notes: 1 This question was directed as respondents who answered “Japan” to Question 2, “Where would you like to go on a foreign holiday?”, and asked about the kinds of things they hoped to experience in Japan. Listed here are the top 22 of a total of 53 choices. 2 The top 5 items are indicated in deep red or deep yellow; items 6 through 10 are indicated in pink or light yellow.
Respondents
Visited Japan in past? No Yes No Yes No Yes No Yes No Yes No Yes No Yes No Yes No Yes
Sample size 1159 1027 62 66 93 182 108 246 91 238 172 114 187 96 237 56 209 29
Enjoy Japanese food 75% 70% 73% 76% 69% 63% 72% 71% 69% 69% 67% 70% 76% 84% 81% 61% 81% 76%
View cherry blossoms 75% 62% 40% 38% 71% 57% 68% 66% 69% 64% 78% 68% 78% 67% 84% 64% 80% 66%
View snowy landscapes 69% 55% 42% 45% 54% 42% 67% 60% 65% 62% 67% 57% 71% 55% 82% 61% 71% 48%
Enjoy nature and scenery 67% 57% 60% 59% 68% 56% 72% 67% 63% 52% 53% 55% 65% 57% 77% 50% 70% 41%
Eat good, inexpensive food 69% 54% 58% 59% 46% 37% 69% 58% 62% 49% 68% 68% 70% 65% 80% 57% 74% 52%
Bathe in hot springs 64% 58% 61% 56% 61% 58% 65% 64% 57% 54% 60% 59% 67% 59% 67% 46% 66% 52%
View autumn leaves 64% 53% 26% 29% 40% 37% 61% 55% 63% 62% 69% 66% 67% 57% 79% 55% 67% 52%
Rest and relax 64% 51% 47% 42% 38% 35% 68% 57% 58% 55% 66% 55% 71% 69% 65% 29% 74% 59%
Stay at a traditional inn 62% 52% 40% 44% 60% 46% 51% 55% 47% 45% 55% 64% 72% 67% 67% 45% 73% 76%
Stay in clean, reasonably priced lodgings 65% 47% 63% 44% 38% 27% 57% 52% 54% 47% 69% 68% 63% 52% 76% 52% 70% 45%
Enjoy favorite foods 53% 58% 52% 44% 66% 61% 67% 67% 62% 62% 54% 57% 47% 47% 52% 36% 44% 41%
See historic sites and buildings 62% 48% 52% 47% 47% 41% 64% 57% 51% 42% 59% 46% 57% 52% 71% 50% 72% 52%
Ride railroads 55% 41% 29% 29% 29% 34% 49% 46% 48% 42% 65% 44% 51% 45% 61% 41% 68% 52%
Visit a World Heritage Site 53% 41% 47% 35% 48% 32% 43% 47% 34% 37% 55% 52% 46% 45% 64% 39% 62% 59%
Go to amusement parks or theme parks 50% 40% 31% 27% 45% 40% 49% 48% 57% 39% 48% 40% 42% 39% 57% 29% 59% 45%
Visit museums to see artwork and
cultural properties50% 37% 27% 24% 38% 29% 44% 41% 42% 34% 47% 39% 47% 44% 60% 46% 61% 52%
Shop for food and beverages 47% 40% 24% 33% 40% 30% 41% 47% 38% 37% 44% 45% 51% 48% 54% 36% 52% 38%
Shop for clothes and accessories 45% 38% 29% 33% 44% 47% 32% 30% 36% 37% 36% 34% 53% 54% 61% 38% 43% 41%
Experience eco-friendly sightseeing areas
or tours50% 32% 31% 35% 29% 25% 37% 33% 26% 25% 51% 35% 63% 50% 65% 36% 54% 34%
Drink Japanese sake 40% 36% 40% 39% 53% 52% 33% 32% 33% 26% 35% 32% 44% 45% 43% 30% 35% 48%
Get together with friends or family 44% 29% 39% 20% 20% 12% 39% 31% 46% 42% 30% 30% 45% 34% 49% 14% 63% 41%
See modern / leading-edge architecture 44% 28% 18% 23% 42% 27% 34% 29% 29% 24% 47% 29% 35% 22% 55% 41% 56% 41%
Thailand Singapore Malaysia IndonesiaKorea China Taiwan Hong KongAll

24
In addition to language issues and costs (during stay and for travel to and from Japan), radioactivity and earthquakes are sources of concern.
• As more and more people travel to Japan, unease about language problems and costs is lessening. Concerns about radioactivity and earthquakes, however, remain very much in travelers’ minds.
• This year’s survey found fewer people anxious about language or prices, but little change from last year in the number of those concerned about radioactivity and earthquakes.
• A relatively large proportion of respondents from Malaysia and Indonesia, both Muslim countries, indicated concern over Japanese food.
• While the increase in inbound tourism has brought a decline in concern over transportation issues, communication concerns remain unchanged.
24. Concerns: “What concerns do you have about a future trip to Japan?”
(Multiple responses)
Notes: 1 The top 5 items are indicated in red, orange or yellow.
<全員>
2 To prevent bias, respondents were asked about the March 2011 earthquake in a subsequent question.
All respondents
Respondents→
Number of visits to Japan→ 0 12 or
more0 1
2 or
more0 1
2 or
more0 1
2 or
more0 1
2 or
more0 1
2 or
more0 1
2 or
more0 1
2 or
more0 1
2 or
more
Sample size 2133 851 1016 223 112 165 220 170 110 156 114 230 142 105 253 275 125 100 318 96 86 393 70 37 406 59 35
High cost of lodging and daily
needs52% 40% 34% 39% 32% 39% 25% 20% 14% 47% 39% 36% 38% 31% 27% 59% 54% 53% 58% 45% 49% 63% 57% 46% 59% 68% 17%
Difficulty in communicating 49% 42% 36% 27% 36% 25% 44% 37% 25% 53% 53% 46% 58% 46% 41% 49% 30% 31% 56% 48% 37% 53% 47% 38% 51% 49% 26%
Concerns about health damage
from radiation40% 43% 44% 72% 71% 70% 44% 45% 35% 35% 44% 39% 53% 47% 50% 23% 26% 22% 39% 43% 43% 43% 39% 24% 24% 22% 31%
Fear of an earthquake occurring
during stay38% 36% 38% 48% 38% 48% 36% 44% 34% 22% 21% 25% 44% 36% 46% 32% 30% 38% 36% 35% 36% 44% 37% 27% 39% 51% 54%
High cost of travel 44% 31% 27% 17% 11% 15% 21% 21% 14% 45% 36% 36% 39% 27% 25% 39% 26% 27% 53% 42% 43% 59% 53% 43% 54% 63% 26%
Don't understand information on
radiation safety31% 33% 33% 53% 62% 56% 31% 29% 29% 33% 34% 27% 33% 41% 34% 19% 18% 19% 30% 26% 30% 34% 31% 14% 23% 20% 26%
Unsure of extent of recovery from
earthquake and tsunami20% 22% 21% 27% 24% 22% 19% 24% 13% 22% 30% 25% 27% 24% 22% 14% 16% 24% 19% 15% 19% 25% 30% 19% 13% 14% 20%
Difficulty of using mobile phone
and other communication devices
(through WiFi, etc.)
20% 17% 18% 7% 9% 9% 21% 15% 20% 18% 20% 23% 21% 15% 19% 19% 18% 19% 18% 23% 19% 21% 20% 16% 31% 20% 11%
Possible illness or injury 19% 17% 20% 14% 13% 19% 13% 13% 13% 17% 19% 23% 14% 15% 20% 27% 14% 23% 14% 16% 13% 24% 36% 22% 19% 25% 29%
Difficulty of understanding public
transportation network and its use22% 16% 14% 11% 13% 12% 11% 5% 6% 24% 23% 14% 25% 15% 16% 21% 13% 18% 21% 26% 12% 26% 21% 14% 29% 29% 20%
Difficulty of coordinating vacation
time with traveling companions17% 14% 12% 9% 15% 12% 18% 8% 5% 14% 16% 14% 8% 6% 8% 27% 22% 22% 16% 15% 8% 14% 13% 14% 21% 17% 26%
Couldn't find tour offering suitable
departure date, course, price, etc.17% 12% 11% 6% 13% 11% 13% 11% 10% 22% 11% 12% 16% 10% 13% 19% 13% 8% 19% 11% 12% 21% 19% 8% 18% 10% 14%
Difficulty of making reservations /
applications16% 13% 8% 4% 4% 7% 25% 22% 19% 8% 10% 6% 7% 10% 4% 15% 6% 10% 7% 8% 2% 16% 19% 8% 32% 36% 26%
Lack of a traveling companion 14% 9% 9% 3% 2% 4% 9% 5% 5% 17% 15% 13% 18% 12% 13% 17% 10% 8% 12% 7% 6% 14% 14% 8% 19% 10% 9%
Personal safety 15% 8% 6% 14% 6% 8% 23% 10% 15% 6% 5% 3% 9% 8% 7% 16% 11% 5% 12% 5% 3% 14% 13% 0% 18% 10% 17%
May not like food 13% 10% 5% 4% 7% 3% 12% 11% 13% 8% 11% 4% 3% 6% 2% 12% 6% 8% 4% 3% 2% 15% 13% 8% 29% 27% 20%
Few places to use my credit cards 11% 8% 8% 5% 3% 12% 12% 8% 9% 12% 10% 7% 6% 4% 6% 9% 11% 9% 11% 7% 7% 10% 13% 11% 15% 19% 14%
Few places to change money 10% 10% 9% 3% 2% 4% 6% 8% 14% 8% 13% 7% 8% 7% 9% 8% 13% 14% 6% 11% 7% 11% 16% 11% 19% 15% 9%
Few places to use cash card from
my home bank10% 8% 8% 3% 4% 9% 9% 11% 9% 11% 8% 7% 6% 5% 5% 8% 9% 16% 10% 4% 2% 11% 11% 5% 17% 12% 17%
Persuaded by others not to go 9% 9% 8% 13% 18% 13% 12% 5% 8% 4% 6% 3% 11% 11% 9% 3% 6% 7% 7% 5% 5% 9% 7% 8% 12% 19% 11%
May not adjust to unfamiliar
customs9% 8% 6% 5% 2% 3% 16% 14% 11% 10% 11% 7% 5% 4% 3% 13% 9% 12% 6% 3% 2% 10% 14% 0% 8% 8% 11%
Lack of understanding or
consideration for my faith10% 7% 5% 3% 4% 4% 9% 10% 8% 1% 4% 3% 4% 3% 4% 8% 6% 10% 8% 0% 2% 15% 10% 5% 17% 22% 11%
Journey to Japan is too long 8% 4% 4% 1% 1% 2% 8% 6% 11% 3% 4% 2% 4% 1% 4% 7% 5% 7% 7% 1% 3% 8% 6% 3% 15% 5% 6%
Afraid to fly 4% 4% 2% 2% 1% 3% 5% 3% 3% 3% 7% 2% 4% 3% 1% 5% 3% 4% 3% 4% 2% 4% 4% 3% 2% 3% 6%
Other 2% 1% 1% 1% 1% 2% 2% 1% 0% 3% 1% 2% 1% 1% 1% 1% 1% 1% 3% 1% 3% 1% 1% 3% 1% 2% 0%
Thailand SingaporeAll Korea China Taiwan Hong Kong Malaysia Indonesia

25
25. Concerns: “Did the March 2011 earthquake change your mind about traveling to Japan?”
Impact of the 2011 earthquake on feelings about traveling to Japan (compared to previous year)
Feelings least affected in regions farthest from Japan.
• Respondents from Korea and Hong Kong indicated a reluctance to visit Japan since the earthquake. This sentiment was shared by only a small percentage of those from Thailand and Taiwan.
• The percentage of respondents from East Asia (Korea, China, Taiwan and Hong Kong) who said the earthquake had made them reluctant to visit Japan fell off somewhat since last year’s survey, although it did remain high. Among respondents from Southeast Asia (Thailand, Singapore, Malaysia and Indonesia), however, the percentage was essentially unchanged.
• The more distant a region is from Japan, the less it is likely to receive the most recent information on the earthquake’s aftermath. Thus it remains vital to send out accurate information as widely as possible, so that travelers can be assured of the safety of travel in Japan.
(Single response)
<全員>
Note: Ranking is indicated by a color scale: Lowest Highest
All respondents
Respondents→
Sample size 4000 4000 500 500 500 500 500 500 500 500 500 500 500 500 500 500 500 500
2013
survey
2014
survey
2013
survey
2014
survey
2013
survey
2014
survey
2013
survey
2014
survey
2013
survey
2014
survey
2013
survey
2014
survey
2013
survey
2014
survey
2013
survey
2014
survey
2013
survey
2014
survey
Have been reluctant
to visit Japan since
the 2011 earthquake
25% 23% 51% 45% 25% 17% 13% 8% 42% 40% 7% 8% 29% 32% 21% 21% 16% 16%
Was reluctant to visit
Japan immediately
after the earthquake,
but would be willing
to go now
32% 34% 23% 25% 45% 49% 27% 31% 30% 29% 30% 32% 29% 26% 27% 33% 42% 45%
Have no reluctance
to visit Japan,
regardless of the
earthquake
37% 39% 14% 23% 24% 29% 50% 53% 26% 28% 61% 58% 39% 39% 48% 44% 32% 34%
Have no desire to
visit Japan,
regardless of the
earthquake
6% 5% 13% 7% 6% 5% 10% 8% 2% 2% 2% 2% 4% 3% 3% 3% 10% 5%
Thailand SingaporeAll Korea China Taiwan Hong Kong Malaysia Indonesia

26
26. “Do you know which country and city will host upcoming Olympic Games?”
2016 Summer Olympics (Rio de Janeiro, Brazil)
Interest in upcoming Olympics is high in China, but low overall.
• With the 2016 Rio de Janeiro Olympics coming up in just two years, when asked about the location over half the respondents said they didn’t know or didn’t care. The results were the same for the 2018 games in Pyeongchang, Korea and the 2020 games in Tokyo.
• Chinese respondents showed the strongest interest in the Olympics overall, followed by Indonesia and Thailand.
(Single response)
<全員>
2018 Winter Olympics (Pyeongchang, Korea) (Single response)
2020 Summer Olympics (Tokyo, Japan) (Single response)
All respondents
Respondents
Gender→ Male Female Male Female Male Female Male Female Male Female Male Female Male Female Male Female Male Female
Sample size 2002 1998 251 249 234 266 275 225 229 271 256 244 251 249 248 252 258 242
Know both country and city 21% 14% 16% 8% 48% 47% 19% 6% 17% 12% 16% 9% 17% 7% 17% 8% 21% 12%
Know country 20% 18% 18% 17% 21% 19% 17% 11% 16% 14% 30% 24% 16% 16% 23% 21% 21% 22%
Know city 5% 5% 6% 3% 5% 5% 2% 2% 4% 2% 5% 4% 6% 5% 5% 6% 10% 9%
Don't know / not interested 53% 63% 59% 71% 26% 29% 61% 80% 63% 71% 49% 64% 62% 72% 55% 65% 48% 57%
SingaporeAll Korea China Taiwan Malaysia IndonesiaHong Kong Thailand
Respondents→
Gender→ Male Female Male Female Male Female Male Female Male Female Male Female Male Female Male Female Male Female
Sample size 2002 1998 251 249 234 266 275 225 229 271 256 244 251 249 248 252 258 242
Know both country and city 15% 13% 36% 30% 31% 35% 9% 5% 6% 5% 9% 7% 11% 6% 7% 6% 15% 10%
Know country 17% 15% 10% 14% 24% 20% 16% 8% 10% 8% 21% 20% 11% 14% 21% 13% 19% 20%
Know city 5% 4% 6% 2% 3% 4% 3% 1% 3% 4% 7% 5% 7% 4% 4% 5% 8% 10%
Don't know / not interested 63% 68% 48% 54% 42% 41% 73% 86% 81% 83% 63% 68% 71% 76% 68% 76% 58% 60%
Malaysia IndonesiaAll Korea China Taiwan Hong Kong Thailand Singapore
Respondents→
Gender→ Male Female Male Female Male Female Male Female Male Female Male Female Male Female Male Female Male Female
Sample size 2002 1998 251 249 234 266 275 225 229 271 256 244 251 249 248 252 258 242
Know both country and city 16% 12% 12% 9% 36% 36% 18% 9% 12% 9% 14% 9% 11% 6% 13% 8% 14% 9%
Know country 16% 13% 11% 9% 23% 16% 15% 8% 12% 10% 22% 18% 12% 11% 19% 11% 17% 18%
Know city 6% 5% 6% 3% 4% 5% 3% 1% 3% 4% 6% 4% 9% 6% 6% 6% 10% 9%
Don't know / not interested 62% 70% 72% 80% 37% 43% 64% 81% 72% 77% 58% 70% 68% 77% 62% 75% 58% 64%
IndonesiaAll Korea China Taiwan Hong Kong Thailand Singapore Malaysia
Note: Ranking is indicated by a color scale: Lowest Highest

27
27. “Are you aware of the measures implemented in July 2013 to make it easier to obtain a Japanese visa or visa exemption?”
Easing of visa requirements has led to new interest in visiting Japan.
• Respondents from all countries were highly aware of the easing of visa requirements. Only a few said that while they were aware of the changes, they still had no interest in visiting Japan. Some 80 percent of respondents from Thailand and Malaysia, for whom visa requirements were waived, and 86 percent of those from Indonesia, for whom regulations were eased, said they knew of the changes and had either been to Japan or wanted to go.
• Interest in visiting Japan was especially high among those who had not yet been there.
Selected countries
Visa waivers (Thailand, Malaysia) (Single response)
Easing of visa regulations (Indonesia) (Single response)
Reference: Easing of visa requirements
Source: Prepared by DBJ based on material from the Ministry of Foreign Affairs website and the Japan National Tourist Organization.
* Multiple entry visa: Traveler can enter Japan any number of times during the 3-year period of validity.
Respondents
Number of past visits to Japan 0 12 or
more
Sample size 406 59 35
Know of measures; visited Japan after regulations
were eased0% 34% 57%
Know of measures; hope to visit Japan in future 85% 59% 31%
Know of measures but not interested in visiting
Japan2% 0% 0%
Don't know / don't care 13% 7% 11% 12%
Indonesia
(Reference)
All respondents, regardless
of number of visits
500
86%
1%
2012 2013
Measures prior to July 1, 2013
Indonesia140,000
(100,000)Multiple entry visa
Visa waiver
Visa waiver
Extension of length of stay for
multiple entry visa (from 15
days to 30 days)
260,000
(200,000)
130,000
(100,000)
100,000
(70,000)
450,000
(400,000)Thailand
Approx. number of foreign visitors to Japan
(Of which, tourists)
Malaysia180,000
(140,000)
Multiple entry visa
Multiple entry visa
Traveler's nationalityEasing measures
(Implemented July 1, 2013)
Note: Ranking is indicated by a color scale: Lowest Highest
Respondents→
Number of past visits to Japan→ 0 12 or
more0 1
2 or
more0 1
2 or
more
Sample size 668 195 137 275 125 100 393 70 37
Know of measures; visited Japan after visa waivers
took effect0% 31% 45% 0% 33% 46% 0% 29% 41%
Know of measures; hope to visit Japan in future 72% 62% 51% 86% 64% 50% 63% 57% 54%
Know of measures but not interested in visiting
Japan6% 1% 2% 5% 1% 3% 6% 1% 0%
Don't know / don't care 22% 6% 2% 9% 2% 1% 31% 13% 5%
5%
80%
(Reference)
All respondents, regardless
of number of visits
1000
All
16%
MalaysiaThailand

28
28. Free answer: “What would you like to eat and drink in Japan?”
Sake joins sushi and ramen on list of popular food and drink.
• This year’s survey contained a new, free-response question asking what the respondents would like to eat and drink on a trip to Japan.
• In addition to such traditional Japanese foods as sushi, sashimi and tempura, the respondents showed a liking for ramen, udon, soba and other noodle dishes.
• Sake was also highly popular, as were crab and other seafood. Fruit came in high on the list as well. The results pointed to the popularity of a wide variety of Japanese food and the products of its farms and fisheries.
<全員>
Note: There were 500 responses per regions. Some responses included more than one word.
All respondents
Country Item 1 2 3 4 5 6
Word Sushi Ramen Udon Sake Beer Soba
Actual 213 107 91 45 22 15
% 42.6% 21.4% 18.2% 9.0% 4.4% 3.0%
Word Sushi Sake Sashimi Seafood Beef Ramen
Actual count 192 116 96 46 25 21
% 38.4% 23.2% 19.2% 9.2% 5.0% 4.2%
Word Ramen Sushi Sake Sashimi Seafood Crab
Actual count 148 94 83 72 36 24
% 29.6% 18.8% 16.6% 14.4% 7.2% 4.8%
Word Sushi Sashimi Ramen Sake Seafood Fruit
Actual count 138 115 64 42 26 17
% 27.6% 23.0% 12.8% 8.4% 5.2% 3.4%
Word Sushi Sake Ramen Sashimi Crab Seafood
Actual count 100 93 52 49 26 14
% 20.0% 18.6% 10.4% 9.8% 5.2% 2.8%
Word Sushi Sake Ramen Beef Seafood Udon
Actual count 178 91 93 20 20 15
% 35.6% 18.2% 18.6% 4.0% 4.0% 3.0%
Word Sushi Sake Sashimi Ramen Seafood Tempura
Actual count 223 73 55 43 12 10
% 44.6% 14.6% 11.0% 8.6% 2.4% 2.0%
Word Sushi Sake Ramen Udon Tempura Sashimi
Actual count 183 179 82 19 14 13
% 36.6% 35.8% 16.4% 3.8% 2.8% 2.6%
Singapore
Malaysia
Indonesia
Korea
China
Taiwan
Hong Kong
Thailand