2014 Strategy Report Bittersweet Symphony - global.com.tr · 2014 Strategy Report – Bittersweet...
30
2014 Strategy Report – Bittersweet Symphony 15 January 2014 strategic partner of Please see the last page for disclaimer Note that all data are per 9th January 2014 closing 1
Transcript of 2014 Strategy Report Bittersweet Symphony - global.com.tr · 2014 Strategy Report – Bittersweet...
2014 Strategy Report – Bittersweet Symphony
15 January 2014
strategic partner of
Please see the last page for disclaimer Note that all data are per 9th January 2014 closing
1
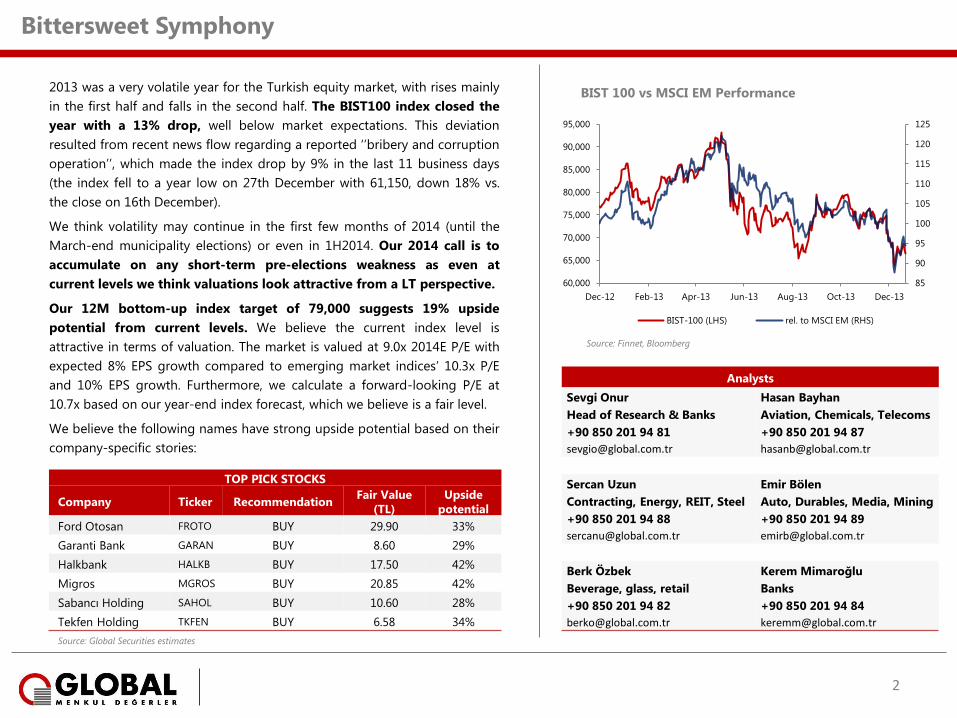
2013 was a very volatile year for the Turkish equity market, with rises mainly
in the first half and falls in the second half. The BIST100 index closed the
year with a 13% drop, well below market expectations. This deviation
resulted from recent news flow regarding a reported ‘’bribery and corruption
operation’’, which made the index drop by 9% in the last 11 business days
(the index fell to a year low on 27th December with 61,150, down 18% vs.
the close on 16th December).
We think volatility may continue in the first few months of 2014 (until the
March-end municipality elections) or even in 1H2014. Our 2014 call is to
accumulate on any short-term pre-elections weakness as even at
current levels we think valuations look attractive from a LT perspective.
Our 12M bottom-up index target of 79,000 suggests 19% upside
potential from current levels. We believe the current index level is
attractive in terms of valuation. The market is valued at 9.0x 2014E P/E with
expected 8% EPS growth compared to emerging market indices’ 10.3x P/E
and 10% EPS growth. Furthermore, we calculate a forward-looking P/E at
10.7x based on our year-end index forecast, which we believe is a fair level.
We believe the following names have strong upside potential based on their
company-specific stories:
Bittersweet Symphony
TOP PICK STOCKS
Company Ticker Recommendation Fair Value
(TL)
Upside
potential
Ford Otosan FROTO BUY 29.90 33%
Garanti Bank GARAN BUY 8.60 29%
Halkbank HALKB BUY 17.50 42%
Migros MGROS BUY 20.85 42%
Sabancı Holding SAHOL BUY 10.60 28%
Tekfen Holding TKFEN BUY 6.58 34%
Source: Global Securities estimates
Analysts
Sevgi Onur Hasan Bayhan
Head of Research & Banks Aviation, Chemicals, Telecoms
+90 850 201 94 81 +90 850 201 94 87
[email protected] [email protected]
Sercan Uzun Emir Bölen
Contracting, Energy, REIT, Steel Auto, Durables, Media, Mining
+90 850 201 94 88 +90 850 201 94 89
[email protected] [email protected]
Berk Özbek Kerem Mimaroğlu
Beverage, glass, retail Banks
+90 850 201 94 82 +90 850 201 94 84
[email protected] [email protected]
85
90
95
100
105
110
115
120
125
60,000
65,000
70,000
75,000
80,000
85,000
90,000
95,000
Dec-12 Feb-13 Apr-13 Jun-13 Aug-13 Oct-13 Dec-13
BIST 100 vs MSCI EM Performance
BIST-100 (LHS) rel. to MSCI EM (RHS)
Source: Finnet, Bloomberg
2
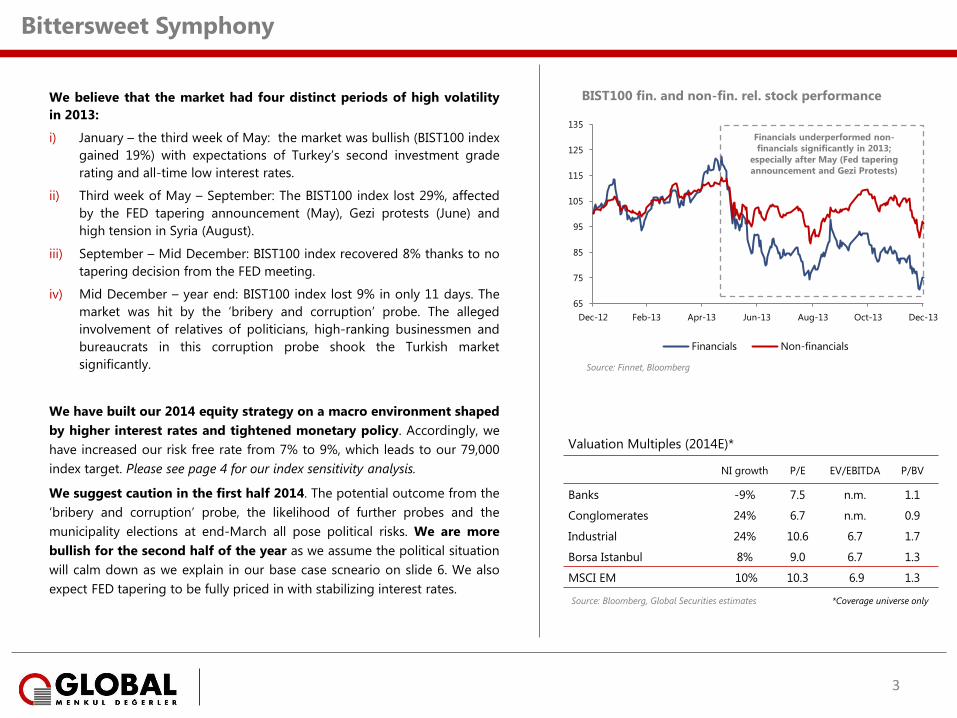
We believe that the market had four distinct periods of high volatility
in 2013:
i) January – the third week of May: the market was bullish (BIST100 index
gained 19%) with expectations of Turkey’s second investment grade
rating and all-time low interest rates.
ii) Third week of May – September: The BIST100 index lost 29%, affected
by the FED tapering announcement (May), Gezi protests (June) and
high tension in Syria (August).
iii) September – Mid December: BIST100 index recovered 8% thanks to no
tapering decision from the FED meeting.
iv) Mid December – year end: BIST100 index lost 9% in only 11 days. The
market was hit by the ‘bribery and corruption’ probe. The alleged
involvement of relatives of politicians, high-ranking businessmen and
bureaucrats in this corruption probe shook the Turkish market
significantly.
We have built our 2014 equity strategy on a macro environment shaped
by higher interest rates and tightened monetary policy. Accordingly, we
have increased our risk free rate from 7% to 9%, which leads to our 79,000
index target. Please see page 4 for our index sensitivity analysis.
We suggest caution in the first half 2014. The potential outcome from the
‘bribery and corruption’ probe, the likelihood of further probes and the
municipality elections at end-March all pose political risks. We are more
bullish for the second half of the year as we assume the political situation
will calm down as we explain in our base case scneario on slide 6. We also
expect FED tapering to be fully priced in with stabilizing interest rates.
Bittersweet Symphony
Valuation Multiples (2014E)*
NI growth P/E EV/EBITDA P/BV
Banks -9% 7.5 n.m. 1.1
Conglomerates 24% 6.7 n.m. 0.9
Industrial 24% 10.6 6.7 1.7
Borsa Istanbul 8% 9.0 6.7 1.3
MSCI EM 10% 10.3 6.9 1.3
65
75
85
95
105
115
125
135
Dec-12 Feb-13 Apr-13 Jun-13 Aug-13 Oct-13 Dec-13
BIST100 fin. and non-fin. rel. stock performance
Financials Non-financials
Financials underperformed non-
financials significantly in 2013;
especially after May (Fed tapering
announcement and Gezi Protests)
Source: Finnet, Bloomberg
3
Source: Bloomberg, Global Securities estimates *Coverage universe only
Sensitivity Analysis
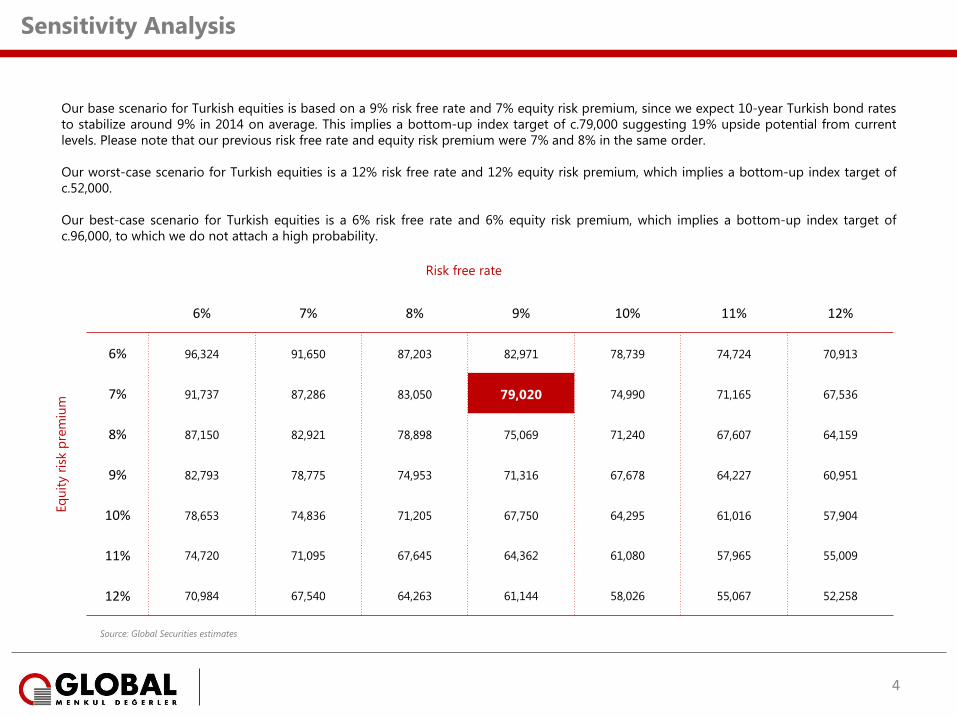
Our base scenario for Turkish equities is based on a 9% risk free rate and 7% equity risk premium, since we expect 10-year Turkish bond rates
to stabilize around 9% in 2014 on average. This implies a bottom-up index target of c.79,000 suggesting 19% upside potential from current
levels. Please note that our previous risk free rate and equity risk premium were 7% and 8% in the same order.
Our worst-case scenario for Turkish equities is a 12% risk free rate and 12% equity risk premium, which implies a bottom-up index target of
c.52,000.
Our best-case scenario for Turkish equities is a 6% risk free rate and 6% equity risk premium, which implies a bottom-up index target of
c.96,000, to which we do not attach a high probability.
Risk free rate
Eq
uit
y r
isk p
rem
ium
6% 7% 8% 9% 10% 11% 12%
6% 96,324 91,650 87,203 82,971 78,739 74,724 70,913
7% 91,737 87,286 83,050 79,020 74,990 71,165 67,536
8% 87,150 82,921 78,898 75,069 71,240 67,607 64,159
9% 82,793 78,775 74,953 71,316 67,678 64,227 60,951
10% 78,653 74,836 71,205 67,750 64,295 61,016 57,904
11% 74,720 71,095 67,645 64,362 61,080 57,965 55,009
12% 70,984 67,540 64,263 61,144 58,026 55,067 52,258
4
Source: Global Securities estimates
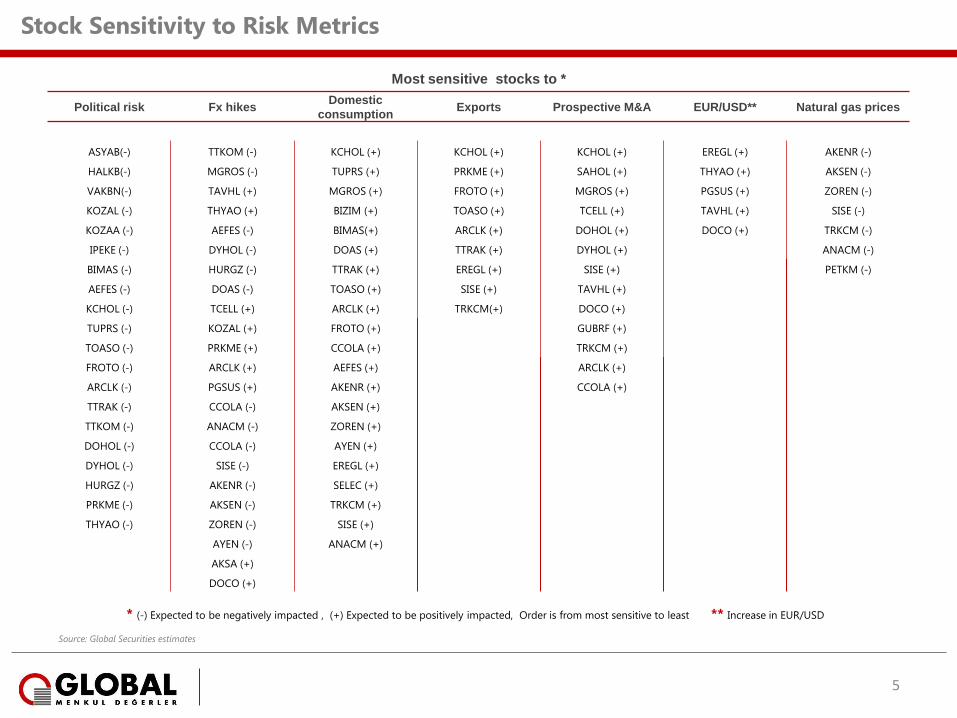
Stock Sensitivity to Risk Metrics
* (-) Expected to be negatively impacted , (+) Expected to be positively impacted, Order is from most sensitive to least
Most sensitive stocks to *
Political risk Fx hikes Domestic
consumption Exports Prospective M&A EUR/USD** Natural gas prices
ASYAB(-) TTKOM (-) KCHOL (+) KCHOL (+) KCHOL (+) EREGL (+) AKENR (-)
HALKB(-) MGROS (-) TUPRS (+) PRKME (+) SAHOL (+) THYAO (+) AKSEN (-)
VAKBN(-) TAVHL (+) MGROS (+) FROTO (+) MGROS (+) PGSUS (+) ZOREN (-)
KOZAL (-) THYAO (+) BIZIM (+) TOASO (+) TCELL (+) TAVHL (+) SISE (-)
KOZAA (-) AEFES (-) BIMAS(+) ARCLK (+) DOHOL (+) DOCO (+) TRKCM (-)
IPEKE (-) DYHOL (-) DOAS (+) TTRAK (+) DYHOL (+) ANACM (-)
BIMAS (-) HURGZ (-) TTRAK (+) EREGL (+) SISE (+) PETKM (-)
AEFES (-) DOAS (-) TOASO (+) SISE (+) TAVHL (+)
KCHOL (-) TCELL (+) ARCLK (+) TRKCM(+) DOCO (+)
TUPRS (-) KOZAL (+) FROTO (+) GUBRF (+)
TOASO (-) PRKME (+) CCOLA (+) TRKCM (+)
FROTO (-) ARCLK (+) AEFES (+) ARCLK (+)
ARCLK (-) PGSUS (+) AKENR (+) CCOLA (+)
TTRAK (-) CCOLA (-) AKSEN (+)
TTKOM (-) ANACM (-) ZOREN (+)
DOHOL (-) CCOLA (-) AYEN (+)
DYHOL (-) SISE (-) EREGL (+)
HURGZ (-) AKENR (-) SELEC (+)
PRKME (-) AKSEN (-) TRKCM (+)
THYAO (-) ZOREN (-) SISE (+)
AYEN (-) ANACM (+)
AKSA (+)
DOCO (+)
** Increase in EUR/USD
5
Source: Global Securities estimates
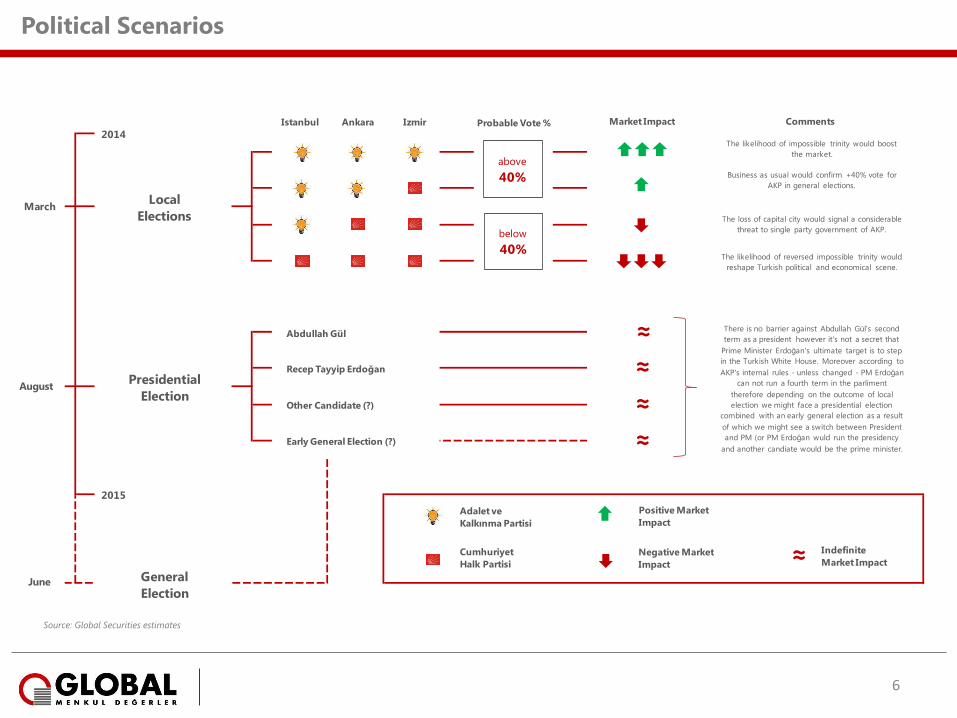
Political Scenarios
6
Presidential
Election
Local
ElectionsMarch
August
Istanbul Ankara Izmir
Abdullah Gül
Recep Tayyip Erdoğan
Other Candidate (?)
Early General Election (?)
2015
2014Probable Vote %
above
40%
below
40%
Market Impact
General
ElectionJune
Adalet ve
Kalkınma Partisi
Cumhuriyet
Halk Partisi
Positive Market
Impact
Negative Market
Impact
≈
≈
≈
Comments
The likelihood of impossible trinity would boost
the market.
Business as usual would confirm +40% vote for
AKP in general elections.
The loss of capital city would signal a considerable
threat to single party government of AKP.
The likelihood of reversed impossible trinity would
reshape Turkish political and economical scene.
There is no barrier against Abdullah Gül's second
term as a president however it's not a secret that
Prime Minister Erdoğan's ultimate target is to step
in the Turkish White House. Moreover according to
AKP's internal rules - unless changed - PM Erdoğan
can not run a fourth term in the parliment
therefore depending on the outcome of local
election we might face a presidential election
combined with an early general election as a result
of which we might see a switch between President
and PM (or PM Erdoğan wuld run the presidency
and another candiate would be the prime minister.
≈ Indefinite
Market Impact
≈
Source: Global Securities estimates
A summary of events since December 17
• On December 17, Turkey was shaken by news regarding the detention of the sons of three cabinet ministers, an AKP-affiliated mayor and several
businessmen including the CEO of Halkbank, Mr Suleyman Aslan, by the police.
• According to the various media sources, the allegations focused on illegal gold trade, money laundering, bribery and fraudulent tenders in the construction
sector. The government’s apparent response was to perceive these events as another foreign-led operation (just like the Gezi Park protests) to hurt PM
Erdogan and the ruling AKP. The tension is reported to arise from a political clash between the AKP and the Gulen Community with resultant
unsubstantiated reports of dissension within the government and with exposure of existing disagreements between both parties’ supporters.
• The Gulen Community is an Islamic Community led by Fethullah Gulen who lives in self-imposed exile in Pennsylvania. It is widely believed that the
Gulenists were natural allies of the AKP when it first came to power in 2002.
• Although initial signs of a dispute were reported in the press in early 2013, both parties rejected these allegations. However, the Gulen Community, which
has a number of representatives in parliament has aimed for more representation in both the political and economic scene. The government’s attempts to
shut down test preparation centers (dershane) in Turkey - where the Gülen Community’s centers are one of the sector drivers apparently increased the
tension between the AKP and Gulen Community.
• On December 25, the Minister of the Interior, Muammer Güler, and the Minister of the Economy, Zafer Çağlayan, whose sons had been detained, resigned
from their posts. Erdoğan Bayraktar, the Minister of Environment and Urbanization also resigned on the same day stating that PM Erdogan should also
resign for the sake of the wellbeing of the nation, as all the construction/zoning permits mentioned in the investigation were approved by PM Erdogan. He
not only resigned from his post, but also from the AKP and from his seat in parliament. Later in the day, Prime Minister Erdogan reshuffled his cabinet with
10 new faces - one of them from outside parliament.
• Following this the government reshuffled the positions of several police chief and government prosecutors as well.
Is the political situation likely to calm down?
• We think so. We believe the March 30 election results should be the key to the direction of the political tension. The AKP has a proven track record of
steering difficult situations to calmer waters. Hence our base case scenario is that the AKP should be capable of managing this situation, albeit with some
likely loss of votes at the local elections.
What happened since December 17 and what is next?
7
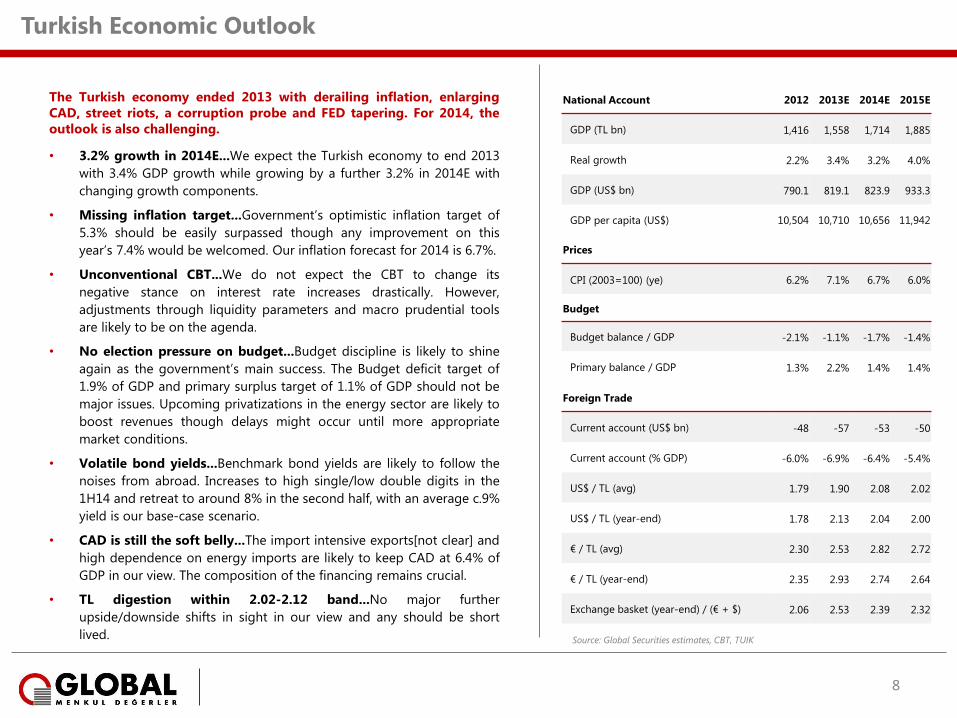
The Turkish economy ended 2013 with derailing inflation, enlarging
CAD, street riots, a corruption probe and FED tapering. For 2014, the
outlook is also challenging.
• 3.2% growth in 2014E...We expect the Turkish economy to end 2013
with 3.4% GDP growth while growing by a further 3.2% in 2014E with
changing growth components.
• Missing inflation target...Government’s optimistic inflation target of
5.3% should be easily surpassed though any improvement on this
year’s 7.4% would be welcomed. Our inflation forecast for 2014 is 6.7%.
• Unconventional CBT...We do not expect the CBT to change its
negative stance on interest rate increases drastically. However,
adjustments through liquidity parameters and macro prudential tools
are likely to be on the agenda.
• No election pressure on budget...Budget discipline is likely to shine
again as the government’s main success. The Budget deficit target of
1.9% of GDP and primary surplus target of 1.1% of GDP should not be
major issues. Upcoming privatizations in the energy sector are likely to
boost revenues though delays might occur until more appropriate
market conditions.
• Volatile bond yields...Benchmark bond yields are likely to follow the
noises from abroad. Increases to high single/low double digits in the
1H14 and retreat to around 8% in the second half, with an average c.9%
yield is our base-case scenario.
• CAD is still the soft belly...The import intensive exports[not clear] and
high dependence on energy imports are likely to keep CAD at 6.4% of
GDP in our view. The composition of the financing remains crucial.
• TL digestion within 2.02-2.12 band...No major further
upside/downside shifts in sight in our view and any should be short
lived.
Turkish Economic Outlook
National Account 2012 2013E 2014E 2015E
GDP (TL bn) 1,416 1,558 1,714 1,885
Real growth 2.2% 3.4% 3.2% 4.0%
GDP (US$ bn) 790.1 819.1 823.9 933.3
GDP per capita (US$) 10,504 10,710 10,656 11,942
Prices
CPI (2003=100) (ye) 6.2% 7.1% 6.7% 6.0%
Budget
Budget balance / GDP -2.1% -1.1% -1.7% -1.4%
Primary balance / GDP 1.3% 2.2% 1.4% 1.4%
Foreign Trade
Current account (US$ bn) -48 -57 -53 -50
Current account (% GDP) -6.0% -6.9% -6.4% -5.4%
US$ / TL (avg) 1.79 1.90 2.08 2.02
US$ / TL (year-end) 1.78 2.13 2.04 2.00
€ / TL (avg) 2.30 2.53 2.82 2.72
€ / TL (year-end) 2.35 2.93 2.74 2.64
Exchange basket (year-end) / (€ + $) 2.06 2.53 2.39 2.32
8
Source: Global Securities estimates, CBT, TUIK
Turkish Economic Outlook
-6%
-4%
-2%
0%
2%
4%
6%
8%
10%
-10%
-5%
0%
5%
10%
15%
2006 2007 2008 2009 2010 2011 2012 2013E 2014E
Growth components
Private consumption Public consumption
Gross fixed capital formation Change in inventories
Net export GDP growth (RHS)
Source: Turkstat, Global Securities
6.9%
4.7%
0.7%
-4.8%
9.2% 8.8%
2.2%
3.4% 3.2%
2006 2007 2008 2009 2010 2011 2012 2013E 2014E
Turkey GDP growth YoY
ESTIMATE
Source: Turkstat, Global Securities
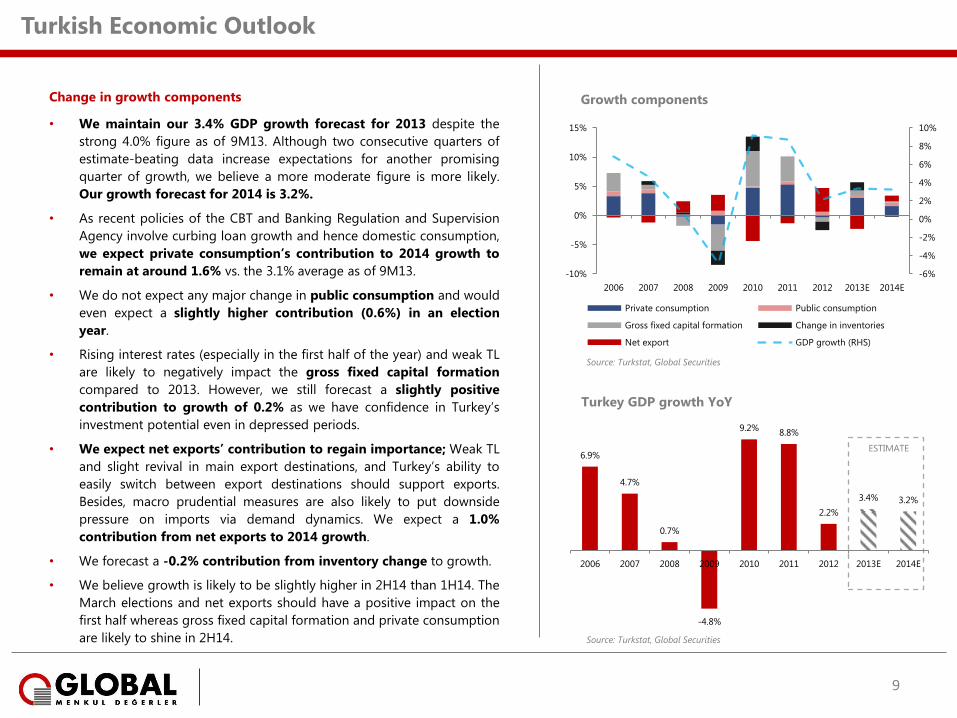
Change in growth components
• We maintain our 3.4% GDP growth forecast for 2013 despite the
strong 4.0% figure as of 9M13. Although two consecutive quarters of
estimate-beating data increase expectations for another promising
quarter of growth, we believe a more moderate figure is more likely.
Our growth forecast for 2014 is 3.2%.
• As recent policies of the CBT and Banking Regulation and Supervision
Agency involve curbing loan growth and hence domestic consumption,
we expect private consumption’s contribution to 2014 growth to
remain at around 1.6% vs. the 3.1% average as of 9M13.
• We do not expect any major change in public consumption and would
even expect a slightly higher contribution (0.6%) in an election
year.
• Rising interest rates (especially in the first half of the year) and weak TL
are likely to negatively impact the gross fixed capital formation
compared to 2013. However, we still forecast a slightly positive
contribution to growth of 0.2% as we have confidence in Turkey’s
investment potential even in depressed periods.
• We expect net exports’ contribution to regain importance; Weak TL
and slight revival in main export destinations, and Turkey’s ability to
easily switch between export destinations should support exports.
Besides, macro prudential measures are also likely to put downside
pressure on imports via demand dynamics. We expect a 1.0%
contribution from net exports to 2014 growth.
• We forecast a -0.2% contribution from inventory change to growth.
• We believe growth is likely to be slightly higher in 2H14 than 1H14. The
March elections and net exports should have a positive impact on the
first half whereas gross fixed capital formation and private consumption
are likely to shine in 2H14.
9
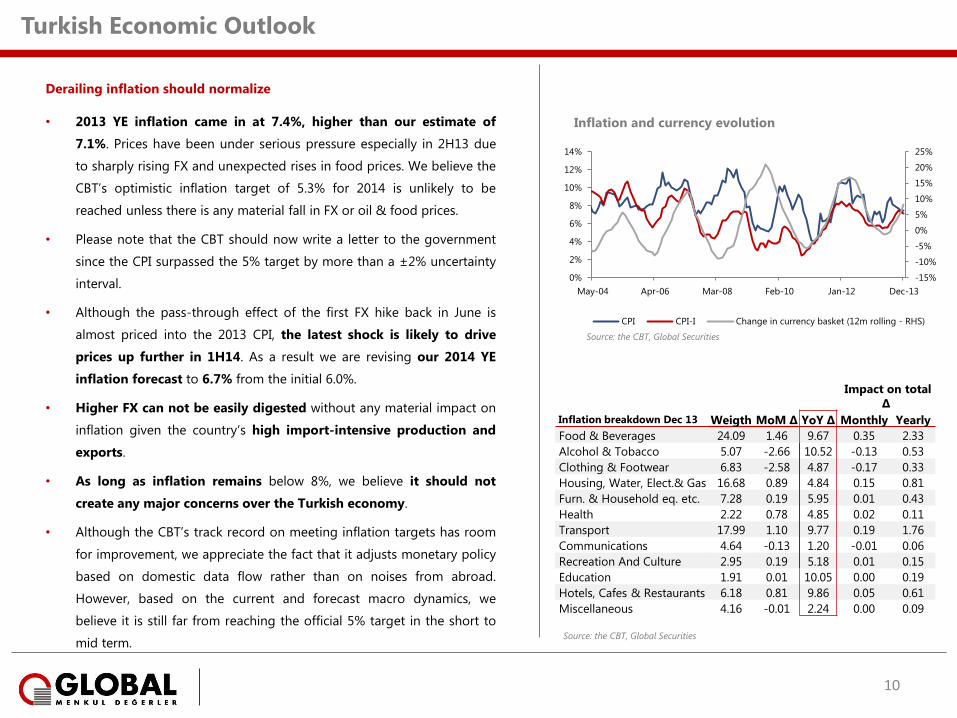
Derailing inflation should normalize
• 2013 YE inflation came in at 7.4%, higher than our estimate of
7.1%. Prices have been under serious pressure especially in 2H13 due
to sharply rising FX and unexpected rises in food prices. We believe the
CBT’s optimistic inflation target of 5.3% for 2014 is unlikely to be
reached unless there is any material fall in FX or oil & food prices.
• Please note that the CBT should now write a letter to the government
since the CPI surpassed the 5% target by more than a ±2% uncertainty
interval.
• Although the pass-through effect of the first FX hike back in June is
almost priced into the 2013 CPI, the latest shock is likely to drive
prices up further in 1H14. As a result we are revising our 2014 YE
inflation forecast to 6.7% from the initial 6.0%.
• Higher FX can not be easily digested without any material impact on
inflation given the country’s high import-intensive production and
exports.
• As long as inflation remains below 8%, we believe it should not
create any major concerns over the Turkish economy.
• Although the CBT’s track record on meeting inflation targets has room
for improvement, we appreciate the fact that it adjusts monetary policy
based on domestic data flow rather than on noises from abroad.
However, based on the current and forecast macro dynamics, we
believe it is still far from reaching the official 5% target in the short to
mid term.
Turkish Economic Outlook
Impact on total
∆
Inflation breakdown Dec 13 Weigth MoM ∆ YoY ∆ Monthly Yearly
Food & Beverages 24.09 1.46 9.67 0.35 2.33
Alcohol & Tobacco 5.07 -2.66 10.52 -0.13 0.53
Clothing & Footwear 6.83 -2.58 4.87 -0.17 0.33
Housing, Water, Elect.& Gas 16.68 0.89 4.84 0.15 0.81
Furn. & Household eq. etc. 7.28 0.19 5.95 0.01 0.43
Health 2.22 0.78 4.85 0.02 0.11
Transport 17.99 1.10 9.77 0.19 1.76
Communications 4.64 -0.13 1.20 -0.01 0.06
Recreation And Culture 2.95 0.19 5.18 0.01 0.15
Education 1.91 0.01 10.05 0.00 0.19
Hotels, Cafes & Restaurants 6.18 0.81 9.86 0.05 0.61
Miscellaneous 4.16 -0.01 2.24 0.00 0.09
-15%
-10%
-5%
0%
5%
10%
15%
20%
25%
0%
2%
4%
6%
8%
10%
12%
14%
May-04 Apr-06 Mar-08 Feb-10 Jan-12 Dec-13
Inflation and currency evolution
CPI CPI-I Change in currency basket (12m rolling - RHS)
Source: the CBT, Global Securities
10
Source: the CBT, Global Securities
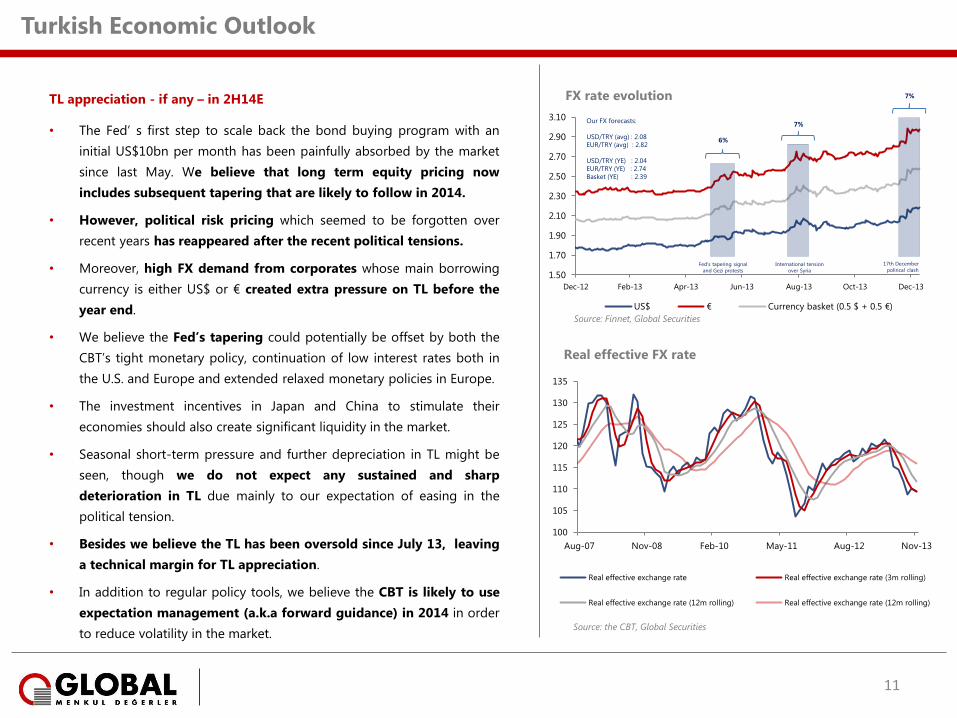
TL appreciation - if any – in 2H14E
• The Fed’ s first step to scale back the bond buying program with an
initial US$10bn per month has been painfully absorbed by the market
since last May. We believe that long term equity pricing now
includes subsequent tapering that are likely to follow in 2014.
• However, political risk pricing which seemed to be forgotten over
recent years has reappeared after the recent political tensions.
• Moreover, high FX demand from corporates whose main borrowing
currency is either US$ or € created extra pressure on TL before the
year end.
• We believe the Fed’s tapering could potentially be offset by both the
CBT’s tight monetary policy, continuation of low interest rates both in
the U.S. and Europe and extended relaxed monetary policies in Europe.
• The investment incentives in Japan and China to stimulate their
economies should also create significant liquidity in the market.
• Seasonal short-term pressure and further depreciation in TL might be
seen, though we do not expect any sustained and sharp
deterioration in TL due mainly to our expectation of easing in the
political tension.
• Besides we believe the TL has been oversold since July 13, leaving
a technical margin for TL appreciation.
• In addition to regular policy tools, we believe the CBT is likely to use
expectation management (a.k.a forward guidance) in 2014 in order
to reduce volatility in the market.
Turkish Economic Outlook
100
105
110
115
120
125
130
135
Aug-07 Nov-08 Feb-10 May-11 Aug-12 Nov-13
Real effective FX rate
Real effective exchange rate Real effective exchange rate (3m rolling)
Real effective exchange rate (12m rolling) Real effective exchange rate (12m rolling)
Source: the CBT, Global Securities
1.50
1.70
1.90
2.10
2.30
2.50
2.70
2.90
3.10
Dec-12 Feb-13 Apr-13 Jun-13 Aug-13 Oct-13 Dec-13
FX rate evolution
US$ € Currency basket (0.5 $ + 0.5 €)
6%
7%
7%
Fed's tapering signal
and Gezi protests
International tension
over Syria
17th December
polirical clash
Our FX forecasts:
USD/TRY (avg) : 2.08
EUR/TRY (avg) : 2.82
USD/TRY (YE) : 2.04
EUR/TRY (YE) : 2.74
Basket (YE) : 2.39
Source: Finnet, Global Securities
11
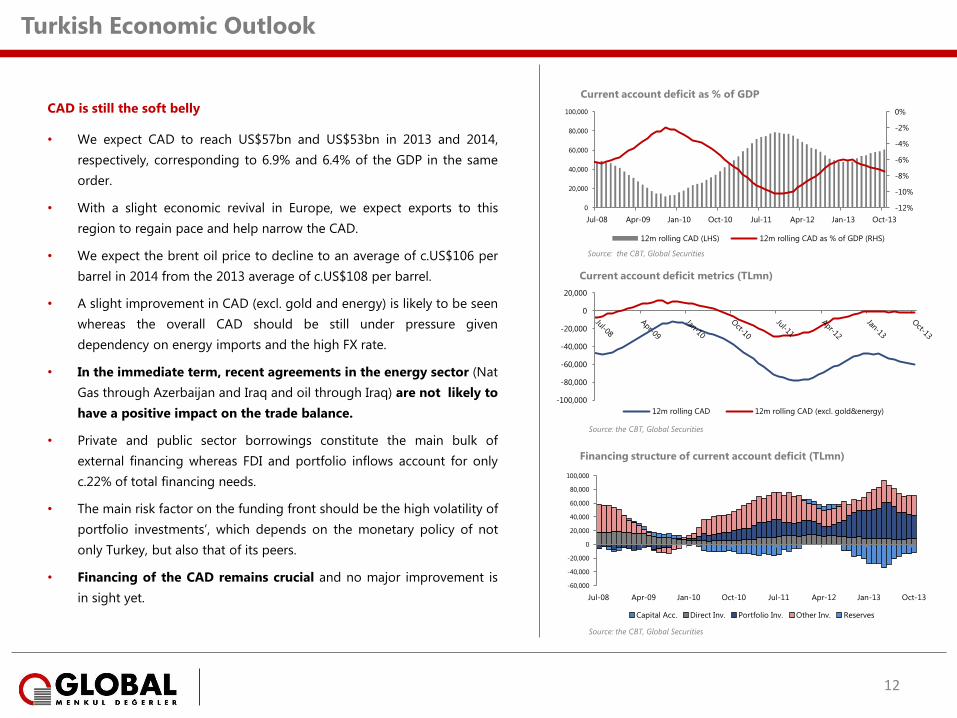
CAD is still the soft belly
• We expect CAD to reach US$57bn and US$53bn in 2013 and 2014,
respectively, corresponding to 6.9% and 6.4% of the GDP in the same
order.
• With a slight economic revival in Europe, we expect exports to this
region to regain pace and help narrow the CAD.
• We expect the brent oil price to decline to an average of c.US$106 per
barrel in 2014 from the 2013 average of c.US$108 per barrel.
• A slight improvement in CAD (excl. gold and energy) is likely to be seen
whereas the overall CAD should be still under pressure given
dependency on energy imports and the high FX rate.
• In the immediate term, recent agreements in the energy sector (Nat
Gas through Azerbaijan and Iraq and oil through Iraq) are not likely to
have a positive impact on the trade balance.
• Private and public sector borrowings constitute the main bulk of
external financing whereas FDI and portfolio inflows account for only
c.22% of total financing needs.
• The main risk factor on the funding front should be the high volatility of
portfolio investments’, which depends on the monetary policy of not
only Turkey, but also that of its peers.
• Financing of the CAD remains crucial and no major improvement is
in sight yet.
Turkish Economic Outlook
-12%
-10%
-8%
-6%
-4%
-2%
0%
0
20,000
40,000
60,000
80,000
100,000
Jul-08 Apr-09 Jan-10 Oct-10 Jul-11 Apr-12 Jan-13 Oct-13
Current account deficit as % of GDP
12m rolling CAD (LHS) 12m rolling CAD as % of GDP (RHS)
Source: the CBT, Global Securities
-100,000
-80,000
-60,000
-40,000
-20,000
0
20,000
Current account deficit metrics (TLmn)
12m rolling CAD 12m rolling CAD (excl. gold&energy)
Source: the CBT, Global Securities
-60,000
-40,000
-20,000
0
20,000
40,000
60,000
80,000
100,000
Jul-08 Apr-09 Jan-10 Oct-10 Jul-11 Apr-12 Jan-13 Oct-13
Financing structure of current account deficit (TLmn)
Capital Acc. Direct Inv. Portfolio Inv. Other Inv. Reserves
Source: the CBT, Global Securities
12
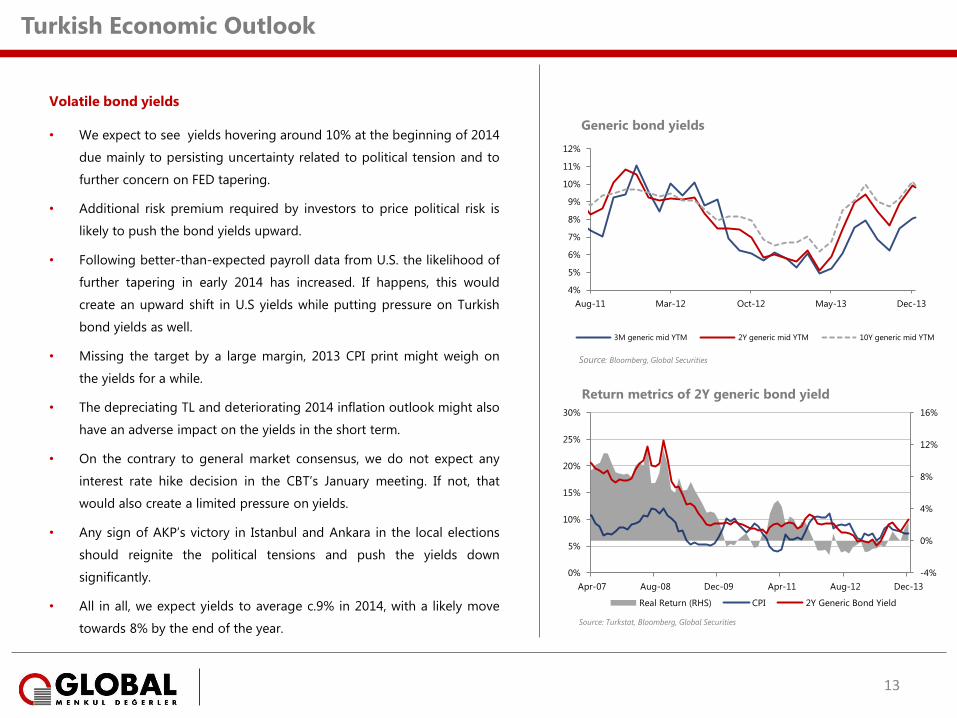
Volatile bond yields
• We expect to see yields hovering around 10% at the beginning of 2014
due mainly to persisting uncertainty related to political tension and to
further concern on FED tapering.
• Additional risk premium required by investors to price political risk is
likely to push the bond yields upward.
• Following better-than-expected payroll data from U.S. the likelihood of
further tapering in early 2014 has increased. If happens, this would
create an upward shift in U.S yields while putting pressure on Turkish
bond yields as well.
• Missing the target by a large margin, 2013 CPI print might weigh on
the yields for a while.
• The depreciating TL and deteriorating 2014 inflation outlook might also
have an adverse impact on the yields in the short term.
• On the contrary to general market consensus, we do not expect any
interest rate hike decision in the CBT’s January meeting. If not, that
would also create a limited pressure on yields.
• Any sign of AKP’s victory in Istanbul and Ankara in the local elections
should reignite the political tensions and push the yields down
significantly.
• All in all, we expect yields to average c.9% in 2014, with a likely move
towards 8% by the end of the year.
Turkish Economic Outlook
4%
5%
6%
7%
8%
9%
10%
11%
12%
Aug-11 Mar-12 Oct-12 May-13 Dec-13
Generic bond yields
3M generic mid YTM 2Y generic mid YTM 10Y generic mid YTM
Source: Bloomberg, Global Securities
-4%
0%
4%
8%
12%
16%
0%
5%
10%
15%
20%
25%
30%
Apr-07 Aug-08 Dec-09 Apr-11 Aug-12 Dec-13
Return metrics of 2Y generic bond yield
Real Return (RHS) CPI 2Y Generic Bond Yield
Source: Turkstat, Bloomberg, Global Securities
13
Banking Sector
TLmn 2012 2013E 2014E 2015E
Net interest income 52,254 56,701 61,521 68,596
Net fee income 15,921 18,035 20,019 22,954
Dividend income 1,260 1,228 1,289 1,354
Trading income 1,576 1,390 209 850
Other operating income 6,489 8,662 7,686 8,071
Total non-interest income 25,246 29,316 29,204 33,228
Loan loss provisions 15,894 17,189 20,283 22,312
Operating expenses 31,499 36,722 42,230 48,565
Net operating income 30,107 32,106 28,211 30,948
Taxes 6,585 7,123 5,642 6,190
Net income 23,522 24,922 22,569 24,758
Net int. income/op.income 67.4% 65.9% 67.8% 67.4%
Net fee income/op.income 20.5% 21.0% 22.1% 22.5%
Non-int. income/op.income 32.6% 34.1% 32.2% 32.6%
Trading income/op.income 2.0% 1.6% 0.2% 0.8%
Cost of risk 2.1% 1.8% 1.7% 1.6%
Cost/income 40.6% 42.7% 46.5% 47.7%
NIM 4.7% 4.4% 4.1% 4.1%
ROAE 14.4% 12.9% 10.5% 10.5%
ROAA 1.8% 1.6% 1.2% 1.2%
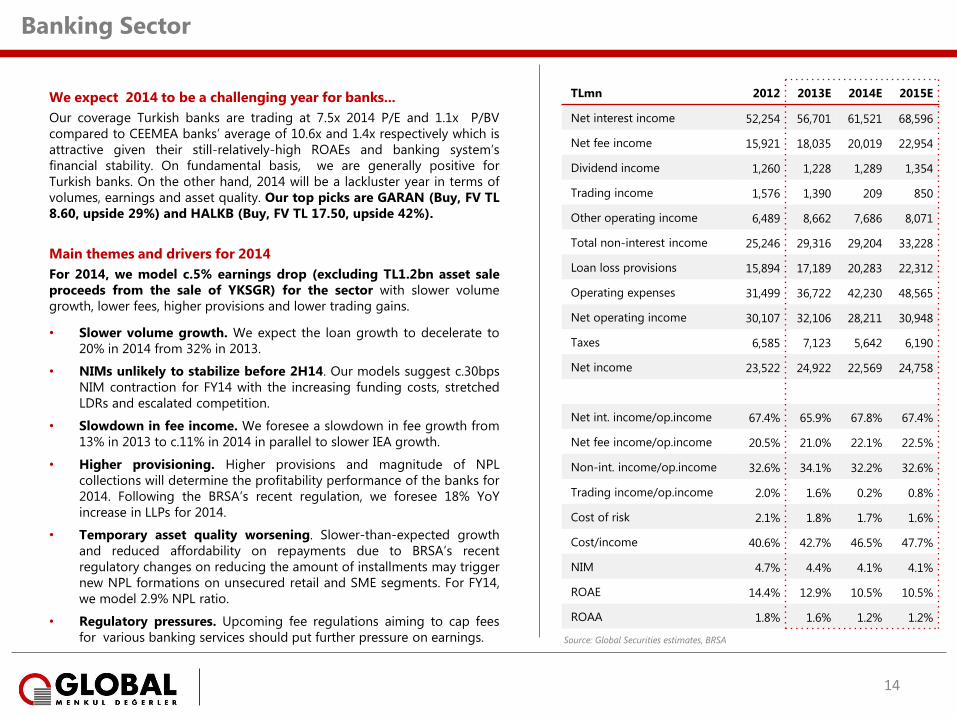
We expect 2014 to be a challenging year for banks...
Our coverage Turkish banks are trading at 7.5x 2014 P/E and 1.1x P/BV
compared to CEEMEA banks’ average of 10.6x and 1.4x respectively which is
attractive given their still-relatively-high ROAEs and banking system’s
financial stability. On fundamental basis, we are generally positive for
Turkish banks. On the other hand, 2014 will be a lackluster year in terms of
volumes, earnings and asset quality. Our top picks are GARAN (Buy, FV TL
8.60, upside 29%) and HALKB (Buy, FV TL 17.50, upside 42%).
Main themes and drivers for 2014
For 2014, we model c.5% earnings drop (excluding TL1.2bn asset sale
proceeds from the sale of YKSGR) for the sector with slower volume
growth, lower fees, higher provisions and lower trading gains.
• Slower volume growth. We expect the loan growth to decelerate to
20% in 2014 from 32% in 2013.
• NIMs unlikely to stabilize before 2H14. Our models suggest c.30bps
NIM contraction for FY14 with the increasing funding costs, stretched
LDRs and escalated competition.
• Slowdown in fee income. We foresee a slowdown in fee growth from
13% in 2013 to c.11% in 2014 in parallel to slower IEA growth.
• Higher provisioning. Higher provisions and magnitude of NPL
collections will determine the profitability performance of the banks for
2014. Following the BRSA’s recent regulation, we foresee 18% YoY
increase in LLPs for 2014.
• Temporary asset quality worsening. Slower-than-expected growth
and reduced affordability on repayments due to BRSA’s recent
regulatory changes on reducing the amount of installments may trigger
new NPL formations on unsecured retail and SME segments. For FY14,
we model 2.9% NPL ratio.
• Regulatory pressures. Upcoming fee regulations aiming to cap fees
for various banking services should put further pressure on earnings.
14
Source: Global Securities estimates, BRSA
Top Pick Stocks
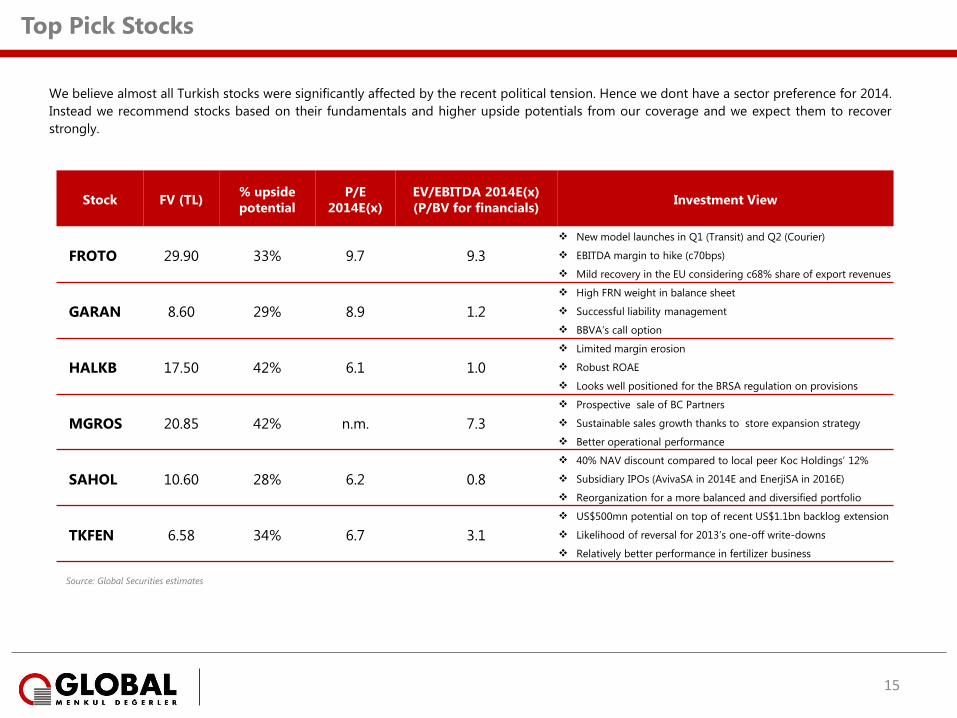
We believe almost all Turkish stocks were significantly affected by the recent political tension. Hence we dont have a sector preference for 2014.
Instead we recommend stocks based on their fundamentals and higher upside potentials from our coverage and we expect them to recover
strongly.
Stock FV (TL) % upside
potential
P/E
2014E(x)
EV/EBITDA 2014E(x)
(P/BV for financials) Investment View
FROTO 29.90 33% 9.7 9.3
New model launches in Q1 (Transit) and Q2 (Courier)
EBITDA margin to hike (c70bps)
Mild recovery in the EU considering c68% share of export revenues
GARAN 8.60 29% 8.9 1.2
High FRN weight in balance sheet
Successful liability management
BBVA’s call option
HALKB 17.50 42% 6.1 1.0
Limited margin erosion
Robust ROAE
Looks well positioned for the BRSA regulation on provisions
MGROS 20.85 42% n.m. 7.3
Prospective sale of BC Partners
Sustainable sales growth thanks to store expansion strategy
Better operational performance
SAHOL 10.60 28% 6.2 0.8
40% NAV discount compared to local peer Koc Holdings’ 12%
Subsidiary IPOs (AvivaSA in 2014E and EnerjiSA in 2016E)
Reorganization for a more balanced and diversified portfolio
TKFEN 6.58 34% 6.7 3.1
US$500mn potential on top of recent US$1.1bn backlog extension
Likelihood of reversal for 2013’s one-off write-downs
Relatively better performance in fertilizer business
15
Source: Global Securities estimates
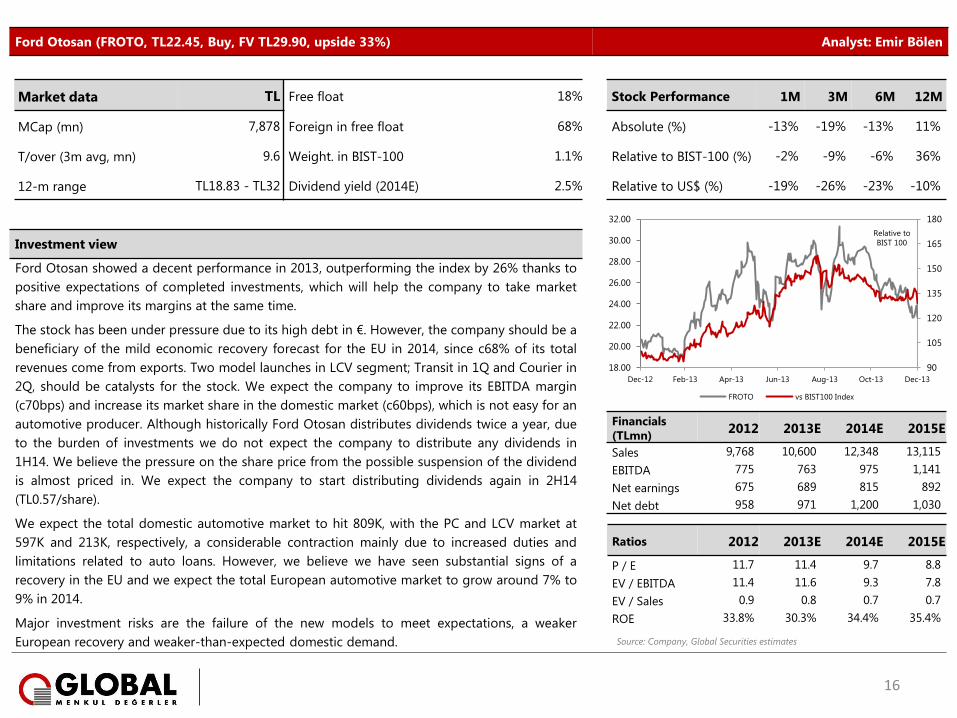
Ford Otosan (FROTO, TL22.45, Buy, FV TL29.90, upside 33%) Analyst: Emir Bölen
Investment view
Ford Otosan showed a decent performance in 2013, outperforming the index by 26% thanks to
positive expectations of completed investments, which will help the company to take market
share and improve its margins at the same time.
The stock has been under pressure due to its high debt in €. However, the company should be a
beneficiary of the mild economic recovery forecast for the EU in 2014, since c68% of its total
revenues come from exports. Two model launches in LCV segment; Transit in 1Q and Courier in
2Q, should be catalysts for the stock. We expect the company to improve its EBITDA margin
(c70bps) and increase its market share in the domestic market (c60bps), which is not easy for an
automotive producer. Although historically Ford Otosan distributes dividends twice a year, due
to the burden of investments we do not expect the company to distribute any dividends in
1H14. We believe the pressure on the share price from the possible suspension of the dividend
is almost priced in. We expect the company to start distributing dividends again in 2H14
(TL0.57/share).
We expect the total domestic automotive market to hit 809K, with the PC and LCV market at
597K and 213K, respectively, a considerable contraction mainly due to increased duties and
limitations related to auto loans. However, we believe we have seen substantial signs of a
recovery in the EU and we expect the total European automotive market to grow around 7% to
9% in 2014.
Major investment risks are the failure of the new models to meet expectations, a weaker
European recovery and weaker-than-expected domestic demand.
Financials
(TLmn) 2012 2013E 2014E 2015E
Sales 9,768 10,600 12,348 13,115
EBITDA 775 763 975 1,141
Net earnings 675 689 815 892
Net debt 958 971 1,200 1,030
Ratios 2012 2013E 2014E 2015E
P / E 11.7 11.4 9.7 8.8
EV / EBITDA 11.4 11.6 9.3 7.8
EV / Sales 0.9 0.8 0.7 0.7
ROE 33.8% 30.3% 34.4% 35.4%
Market data TL Free float 18%
Stock Performance 1M 3M 6M 12M
MCap (mn) 7,878 Foreign in free float 68% Absolute (%) -13% -19% -13% 11%
T/over (3m avg, mn) 9.6 Weight. in BIST-100 1.1% Relative to BIST-100 (%) -2% -9% -6% 36%
12-m range TL18.83 - TL32 Dividend yield (2014E) 2.5% Relative to US$ (%) -19% -26% -23% -10%
90
105
120
135
150
165
180
18.00
20.00
22.00
24.00
26.00
28.00
30.00
32.00
Dec-12 Feb-13 Apr-13 Jun-13 Aug-13 Oct-13 Dec-13
FROTO vs BIST100 Index
Relative to
BIST 100
16
Source: Company, Global Securities estimates
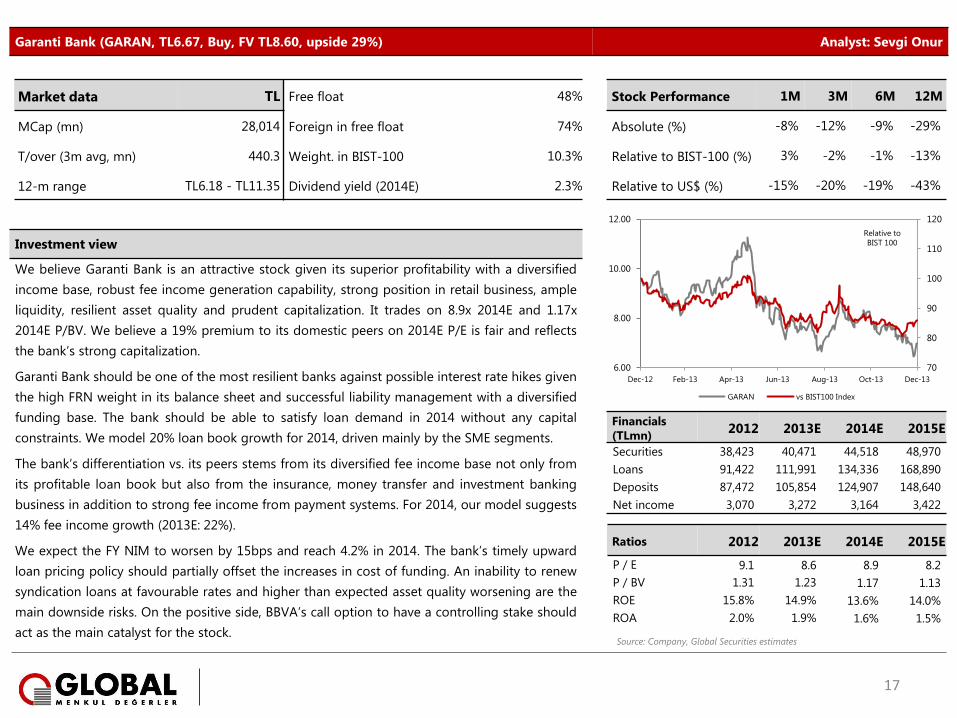
Garanti Bank (GARAN, TL6.67, Buy, FV TL8.60, upside 29%) Analyst: Sevgi Onur
Investment view
We believe Garanti Bank is an attractive stock given its superior profitability with a diversified
income base, robust fee income generation capability, strong position in retail business, ample
liquidity, resilient asset quality and prudent capitalization. It trades on 8.9x 2014E and 1.17x
2014E P/BV. We believe a 19% premium to its domestic peers on 2014E P/E is fair and reflects
the bank’s strong capitalization.
Garanti Bank should be one of the most resilient banks against possible interest rate hikes given
the high FRN weight in its balance sheet and successful liability management with a diversified
funding base. The bank should be able to satisfy loan demand in 2014 without any capital
constraints. We model 20% loan book growth for 2014, driven mainly by the SME segments.
The bank’s differentiation vs. its peers stems from its diversified fee income base not only from
its profitable loan book but also from the insurance, money transfer and investment banking
business in addition to strong fee income from payment systems. For 2014, our model suggests
14% fee income growth (2013E: 22%).
We expect the FY NIM to worsen by 15bps and reach 4.2% in 2014. The bank’s timely upward
loan pricing policy should partially offset the increases in cost of funding. An inability to renew
syndication loans at favourable rates and higher than expected asset quality worsening are the
main downside risks. On the positive side, BBVA’s call option to have a controlling stake should
act as the main catalyst for the stock.
Financials
(TLmn) 2012 2013E 2014E 2015E
Securities 38,423 40,471 44,518 48,970
Loans 91,422 111,991 134,336 168,890
Deposits 87,472 105,854 124,907 148,640
Net income 3,070 3,272 3,164 3,422
Ratios 2012 2013E 2014E 2015E
P / E 9.1 8.6 8.9 8.2
P / BV 1.31 1.23 1.17 1.13
ROE 15.8% 14.9% 13.6% 14.0%
ROA 2.0% 1.9% 1.6% 1.5%
Market data TL Free float 48% Stock Performance 1M 3M 6M 12M
MCap (mn) 28,014 Foreign in free float 74% Absolute (%) -8% -12% -9% -29%
T/over (3m avg, mn) 440.3 Weight. in BIST-100 10.3% Relative to BIST-100 (%) 3% -2% -1% -13%
12-m range TL6.18 - TL11.35 Dividend yield (2014E) 2.3% Relative to US$ (%) -15% -20% -19% -43%
70
80
90
100
110
120
6.00
8.00
10.00
12.00
Dec-12 Feb-13 Apr-13 Jun-13 Aug-13 Oct-13 Dec-13
GARAN vs BIST100 Index
Relative to
BIST 100
17
Source: Company, Global Securities estimates
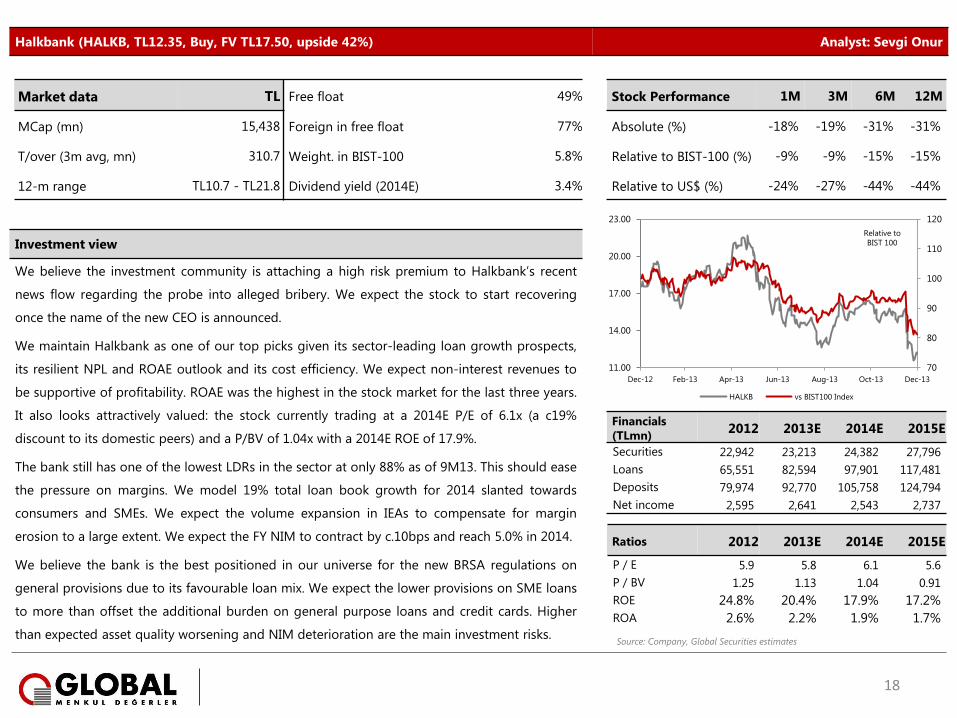
Halkbank (HALKB, TL12.35, Buy, FV TL17.50, upside 42%) Analyst: Sevgi Onur
Investment view
We believe the investment community is attaching a high risk premium to Halkbank’s recent
news flow regarding the probe into alleged bribery. We expect the stock to start recovering
once the name of the new CEO is announced.
We maintain Halkbank as one of our top picks given its sector-leading loan growth prospects,
its resilient NPL and ROAE outlook and its cost efficiency. We expect non-interest revenues to
be supportive of profitability. ROAE was the highest in the stock market for the last three years.
It also looks attractively valued: the stock currently trading at a 2014E P/E of 6.1x (a c19%
discount to its domestic peers) and a P/BV of 1.04x with a 2014E ROE of 17.9%.
The bank still has one of the lowest LDRs in the sector at only 88% as of 9M13. This should ease
the pressure on margins. We model 19% total loan book growth for 2014 slanted towards
consumers and SMEs. We expect the volume expansion in IEAs to compensate for margin
erosion to a large extent. We expect the FY NIM to contract by c.10bps and reach 5.0% in 2014.
We believe the bank is the best positioned in our universe for the new BRSA regulations on
general provisions due to its favourable loan mix. We expect the lower provisions on SME loans
to more than offset the additional burden on general purpose loans and credit cards. Higher
than expected asset quality worsening and NIM deterioration are the main investment risks.
Financials
(TLmn) 2012 2013E 2014E 2015E
Securities 22,942 23,213 24,382 27,796
Loans 65,551 82,594 97,901 117,481
Deposits 79,974 92,770 105,758 124,794
Net income 2,595 2,641 2,543 2,737
Ratios 2012 2013E 2014E 2015E
P / E 5.9 5.8 6.1 5.6
P / BV 1.25 1.13 1.04 0.91
ROE 24.8% 20.4% 17.9% 17.2%
ROA 2.6% 2.2% 1.9% 1.7%
Market data TL Free float 49% Stock Performance 1M 3M 6M 12M
MCap (mn) 15,438 Foreign in free float 77% Absolute (%) -18% -19% -31% -31%
T/over (3m avg, mn) 310.7 Weight. in BIST-100 5.8% Relative to BIST-100 (%) -9% -9% -15% -15%
12-m range TL10.7 - TL21.8 Dividend yield (2014E) 3.4% Relative to US$ (%) -24% -27% -44% -44%
70
80
90
100
110
120
11.00
14.00
17.00
20.00
23.00
Dec-12 Feb-13 Apr-13 Jun-13 Aug-13 Oct-13 Dec-13
HALKB vs BIST100 Index
Relative to
BIST 100
18
Source: Company, Global Securities estimates
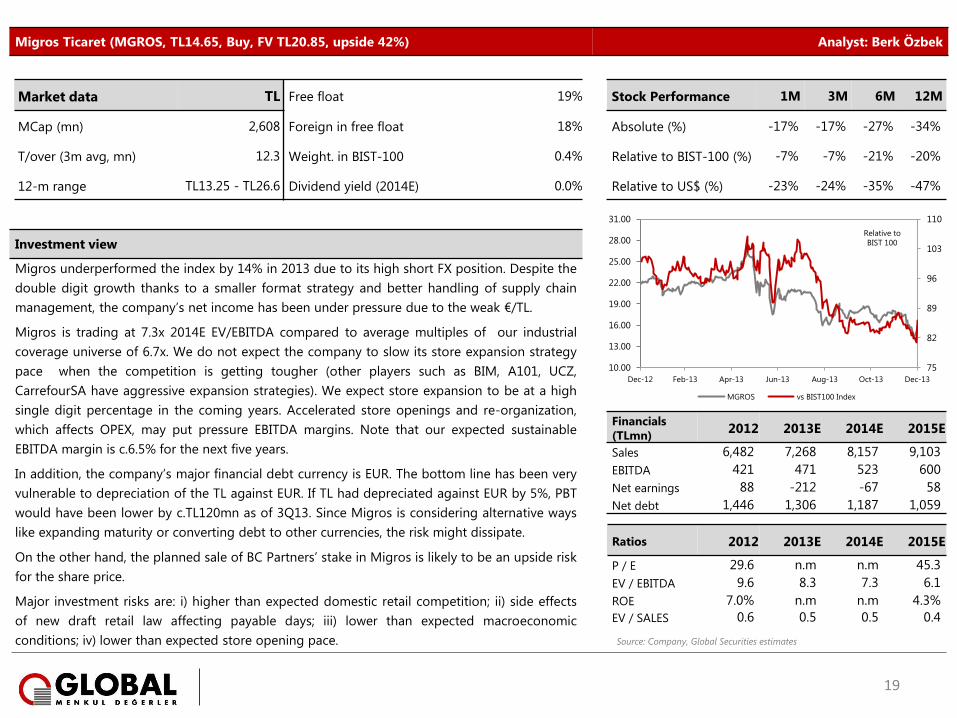
Migros Ticaret (MGROS, TL14.65, Buy, FV TL20.85, upside 42%) Analyst: Berk Özbek
Investment view
Migros underperformed the index by 14% in 2013 due to its high short FX position. Despite the
double digit growth thanks to a smaller format strategy and better handling of supply chain
management, the company’s net income has been under pressure due to the weak €/TL.
Migros is trading at 7.3x 2014E EV/EBITDA compared to average multiples of our industrial
coverage universe of 6.7x. We do not expect the company to slow its store expansion strategy
pace when the competition is getting tougher (other players such as BIM, A101, UCZ,
CarrefourSA have aggressive expansion strategies). We expect store expansion to be at a high
single digit percentage in the coming years. Accelerated store openings and re-organization,
which affects OPEX, may put pressure EBITDA margins. Note that our expected sustainable
EBITDA margin is c.6.5% for the next five years.
In addition, the company’s major financial debt currency is EUR. The bottom line has been very
vulnerable to depreciation of the TL against EUR. If TL had depreciated against EUR by 5%, PBT
would have been lower by c.TL120mn as of 3Q13. Since Migros is considering alternative ways
like expanding maturity or converting debt to other currencies, the risk might dissipate.
On the other hand, the planned sale of BC Partners’ stake in Migros is likely to be an upside risk
for the share price.
Major investment risks are: i) higher than expected domestic retail competition; ii) side effects
of new draft retail law affecting payable days; iii) lower than expected macroeconomic
conditions; iv) lower than expected store opening pace.
Financials
(TLmn) 2012 2013E 2014E 2015E
Sales 6,482 7,268 8,157 9,103
EBITDA 421 471 523 600
Net earnings 88 -212 -67 58
Net debt 1,446 1,306 1,187 1,059
Ratios 2012 2013E 2014E 2015E
P / E 29.6 n.m n.m 45.3
EV / EBITDA 9.6 8.3 7.3 6.1
ROE 7.0% n.m n.m 4.3%
EV / SALES 0.6 0.5 0.5 0.4
Market data TL Free float 19% Stock Performance 1M 3M 6M 12M
MCap (mn) 2,608 Foreign in free float 18% Absolute (%) -17% -17% -27% -34%
T/over (3m avg, mn) 12.3 Weight. in BIST-100 0.4% Relative to BIST-100 (%) -7% -7% -21% -20%
12-m range TL13.25 - TL26.6 Dividend yield (2014E) 0.0% Relative to US$ (%) -23% -24% -35% -47%
75
82
89
96
103
110
10.00
13.00
16.00
19.00
22.00
25.00
28.00
31.00
Dec-12 Feb-13 Apr-13 Jun-13 Aug-13 Oct-13 Dec-13
MGROS vs BIST100 Index
Relative to
BIST 100
19
Source: Company, Global Securities estimates
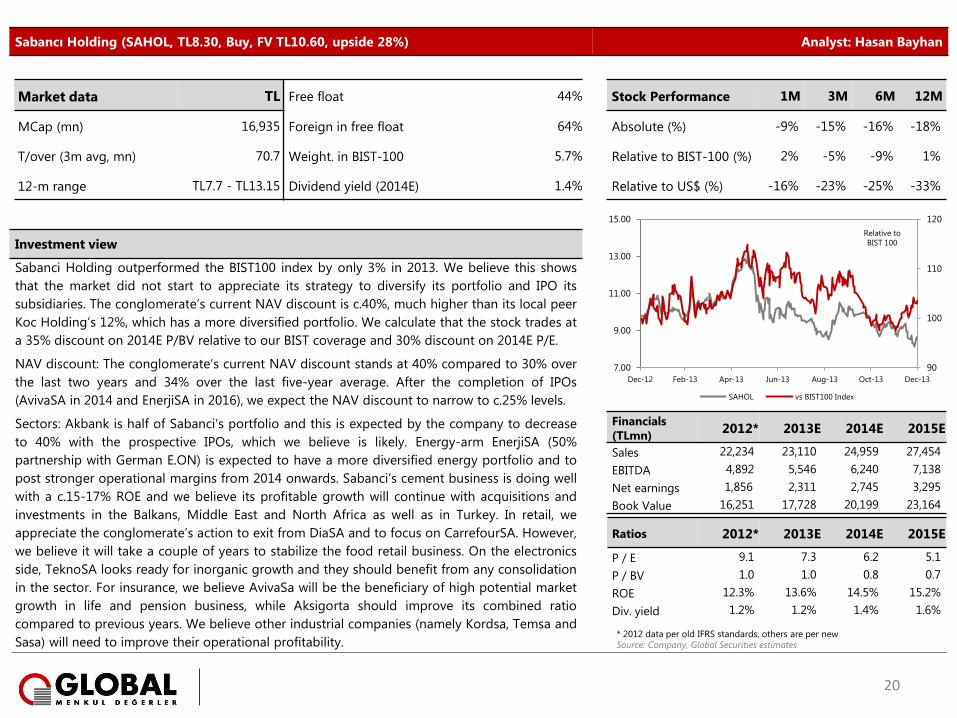
Sabancı Holding (SAHOL, TL8.30, Buy, FV TL10.60, upside 28%) Analyst: Hasan Bayhan
Investment view
Sabanci Holding outperformed the BIST100 index by only 3% in 2013. We believe this shows
that the market did not start to appreciate its strategy to diversify its portfolio and IPO its
subsidiaries. The conglomerate’s current NAV discount is c.40%, much higher than its local peer
Koc Holding’s 12%, which has a more diversified portfolio. We calculate that the stock trades at
a 35% discount on 2014E P/BV relative to our BIST coverage and 30% discount on 2014E P/E.
NAV discount: The conglomerate’s current NAV discount stands at 40% compared to 30% over
the last two years and 34% over the last five-year average. After the completion of IPOs
(AvivaSA in 2014 and EnerjiSA in 2016), we expect the NAV discount to narrow to c.25% levels.
Sectors: Akbank is half of Sabanci’s portfolio and this is expected by the company to decrease
to 40% with the prospective IPOs, which we believe is likely. Energy-arm EnerjiSA (50%
partnership with German E.ON) is expected to have a more diversified energy portfolio and to
post stronger operational margins from 2014 onwards. Sabanci’s cement business is doing well
with a c.15-17% ROE and we believe its profitable growth will continue with acquisitions and
investments in the Balkans, Middle East and North Africa as well as in Turkey. In retail, we
appreciate the conglomerate’s action to exit from DiaSA and to focus on CarrefourSA. However,
we believe it will take a couple of years to stabilize the food retail business. On the electronics
side, TeknoSA looks ready for inorganic growth and they should benefit from any consolidation
in the sector. For insurance, we believe AvivaSa will be the beneficiary of high potential market
growth in life and pension business, while Aksigorta should improve its combined ratio
compared to previous years. We believe other industrial companies (namely Kordsa, Temsa and
Sasa) will need to improve their operational profitability.
Financials
(TLmn) 2012* 2013E 2014E 2015E
Sales 22,234 23,110 24,959 27,454
EBITDA 4,892 5,546 6,240 7,138
Net earnings 1,856 2,311 2,745 3,295
Book Value 16,251 17,728 20,199 23,164
Ratios 2012* 2013E 2014E 2015E
P / E 9.1 7.3 6.2 5.1
P / BV 1.0 1.0 0.8 0.7
ROE 12.3% 13.6% 14.5% 15.2%
Div. yield 1.2% 1.2% 1.4% 1.6%
Market data TL Free float 44% Stock Performance 1M 3M 6M 12M
MCap (mn) 16,935 Foreign in free float 64% Absolute (%) -9% -15% -16% -18%
T/over (3m avg, mn) 70.7 Weight. in BIST-100 5.7% Relative to BIST-100 (%) 2% -5% -9% 1%
12-m range TL7.7 - TL13.15 Dividend yield (2014E) 1.4% Relative to US$ (%) -16% -23% -25% -33%
90
100
110
120
7.00
9.00
11.00
13.00
15.00
Dec-12 Feb-13 Apr-13 Jun-13 Aug-13 Oct-13 Dec-13
SAHOL vs BIST100 Index
Relative to
BIST 100
20
* 2012 data per old IFRS standards, others are per new Source: Company, Global Securities estimates
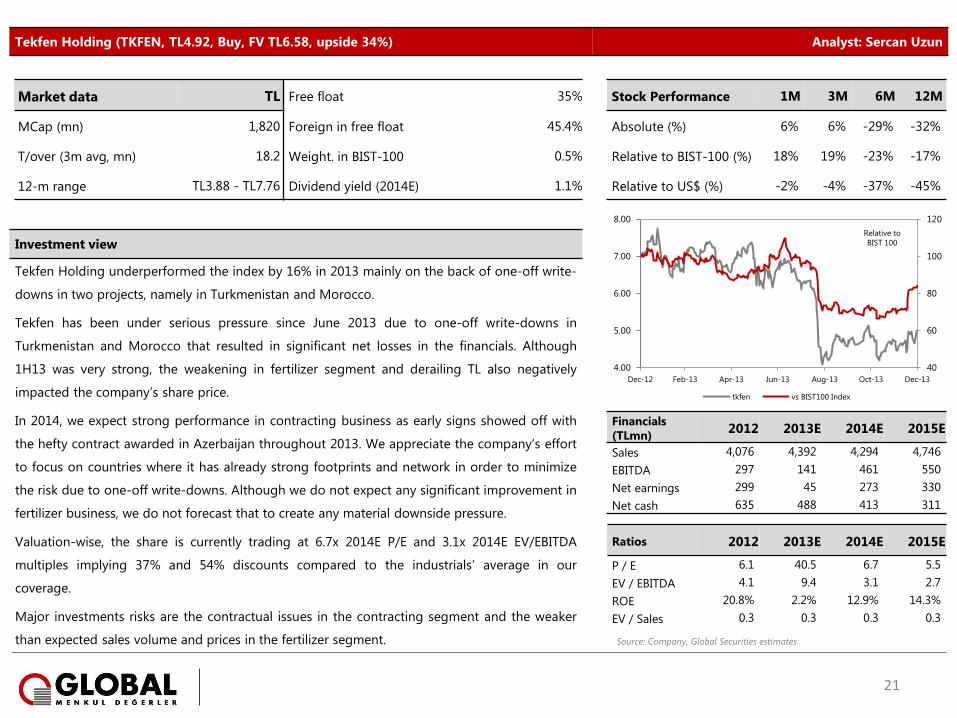
Tekfen Holding (TKFEN, TL4.92, Buy, FV TL6.58, upside 34%) Analyst: Sercan Uzun
Investment view
Tekfen Holding underperformed the index by 16% in 2013 mainly on the back of one-off write-
downs in two projects, namely in Turkmenistan and Morocco.
Tekfen has been under serious pressure since June 2013 due to one-off write-downs in
Turkmenistan and Morocco that resulted in significant net losses in the financials. Although
1H13 was very strong, the weakening in fertilizer segment and derailing TL also negatively
impacted the company’s share price.
In 2014, we expect strong performance in contracting business as early signs showed off with
the hefty contract awarded in Azerbaijan throughout 2013. We appreciate the company’s effort
to focus on countries where it has already strong footprints and network in order to minimize
the risk due to one-off write-downs. Although we do not expect any significant improvement in
fertilizer business, we do not forecast that to create any material downside pressure.
Valuation-wise, the share is currently trading at 6.7x 2014E P/E and 3.1x 2014E EV/EBITDA
multiples implying 37% and 54% discounts compared to the industrials’ average in our
coverage.
Major investments risks are the contractual issues in the contracting segment and the weaker
than expected sales volume and prices in the fertilizer segment.
Financials
(TLmn) 2012 2013E 2014E 2015E
Sales 4,076 4,392 4,294 4,746
EBITDA 297 141 461 550
Net earnings 299 45 273 330
Net cash 635 488 413 311
Ratios 2012 2013E 2014E 2015E
P / E 6.1 40.5 6.7 5.5
EV / EBITDA 4.1 9.4 3.1 2.7
ROE 20.8% 2.2% 12.9% 14.3%
EV / Sales 0.3 0.3 0.3 0.3
Market data TL Free float 35% Stock Performance 1M 3M 6M 12M
MCap (mn) 1,820 Foreign in free float 45.4% Absolute (%) 6% 6% -29% -32%
T/over (3m avg, mn) 18.2 Weight. in BIST-100 0.5% Relative to BIST-100 (%) 18% 19% -23% -17%
12-m range TL3.88 - TL7.76 Dividend yield (2014E) 1.1% Relative to US$ (%) -2% -4% -37% -45%
40
60
80
100
120
4.00
5.00
6.00
7.00
8.00
Dec-12 Feb-13 Apr-13 Jun-13 Aug-13 Oct-13 Dec-13
tkfen vs BIST100 Index
Relative to
BIST 100
21
Source: Company, Global Securities estimates
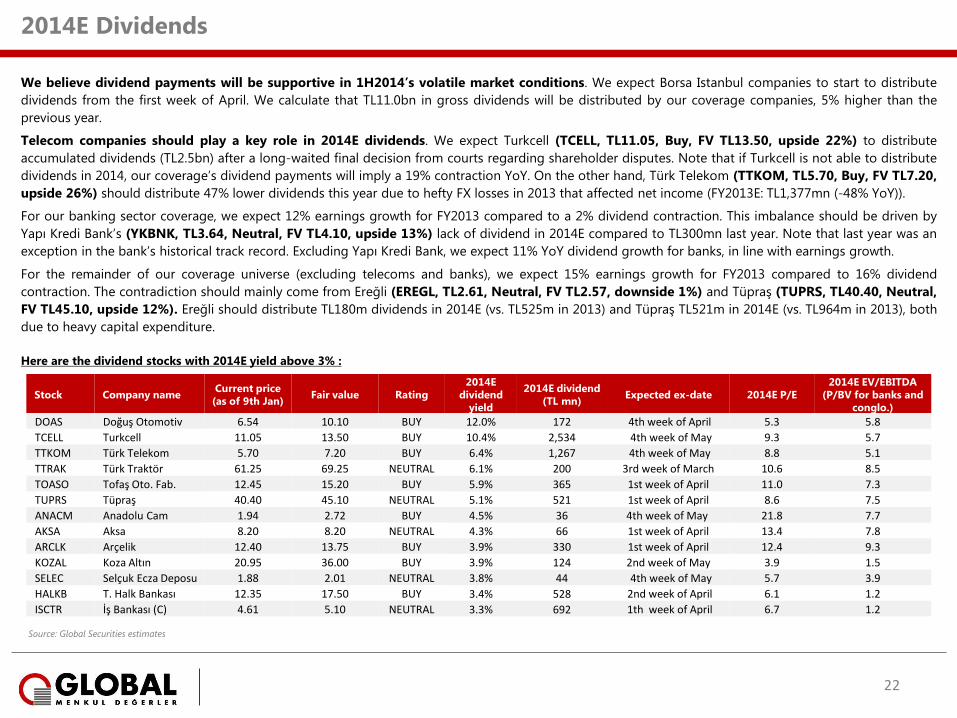
2014E Dividends
We believe dividend payments will be supportive in 1H2014’s volatile market conditions. We expect Borsa Istanbul companies to start to distribute
dividends from the first week of April. We calculate that TL11.0bn in gross dividends will be distributed by our coverage companies, 5% higher than the
previous year.
Telecom companies should play a key role in 2014E dividends. We expect Turkcell (TCELL, TL11.05, Buy, FV TL13.50, upside 22%) to distribute
accumulated dividends (TL2.5bn) after a long-waited final decision from courts regarding shareholder disputes. Note that if Turkcell is not able to distribute
dividends in 2014, our coverage’s dividend payments will imply a 19% contraction YoY. On the other hand, Türk Telekom (TTKOM, TL5.70, Buy, FV TL7.20,
upside 26%) should distribute 47% lower dividends this year due to hefty FX losses in 2013 that affected net income (FY2013E: TL1,377mn (-48% YoY)).
For our banking sector coverage, we expect 12% earnings growth for FY2013 compared to a 2% dividend contraction. This imbalance should be driven by
Yapı Kredi Bank’s (YKBNK, TL3.64, Neutral, FV TL4.10, upside 13%) lack of dividend in 2014E compared to TL300mn last year. Note that last year was an
exception in the bank’s historical track record. Excluding Yapı Kredi Bank, we expect 11% YoY dividend growth for banks, in line with earnings growth.
For the remainder of our coverage universe (excluding telecoms and banks), we expect 15% earnings growth for FY2013 compared to 16% dividend
contraction. The contradiction should mainly come from Ereğli (EREGL, TL2.61, Neutral, FV TL2.57, downside 1%) and Tüpraş (TUPRS, TL40.40, Neutral,
FV TL45.10, upside 12%). Ereğli should distribute TL180m dividends in 2014E (vs. TL525m in 2013) and Tüpraş TL521m in 2014E (vs. TL964m in 2013), both
due to heavy capital expenditure.
Here are the dividend stocks with 2014E yield above 3% :
Stock Company name Current price
(as of 9th Jan) Fair value Rating
2014E
dividend
yield
2014E dividend
(TL mn) Expected ex-date 2014E P/E
2014E EV/EBITDA
(P/BV for banks and
conglo.)
DOAS Doğuş Otomotiv 6.54 10.10 BUY 12.0% 172 4th week of April 5.3 5.8
TCELL Turkcell 11.05 13.50 BUY 10.4% 2,534 4th week of May 9.3 5.7
TTKOM Türk Telekom 5.70 7.20 BUY 6.4% 1,267 4th week of May 8.8 5.1
TTRAK Türk Traktör 61.25 69.25 NEUTRAL 6.1% 200 3rd week of March 10.6 8.5
TOASO Tofaş Oto. Fab. 12.45 15.20 BUY 5.9% 365 1st week of April 11.0 7.3
TUPRS Tüpraş 40.40 45.10 NEUTRAL 5.1% 521 1st week of April 8.6 7.5
ANACM Anadolu Cam 1.94 2.72 BUY 4.5% 36 4th week of May 21.8 7.7
AKSA Aksa 8.20 8.20 NEUTRAL 4.3% 66 1st week of April 13.4 7.8
ARCLK Arçelik 12.40 13.75 BUY 3.9% 330 1st week of April 12.4 9.3
KOZAL Koza Altın 20.95 36.00 BUY 3.9% 124 2nd week of May 3.9 1.5
SELEC Selçuk Ecza Deposu 1.88 2.01 NEUTRAL 3.8% 44 4th week of May 5.7 3.9
HALKB T. Halk Bankası 12.35 17.50 BUY 3.4% 528 2nd week of April 6.1 1.2
ISCTR İş Bankası (C) 4.61 5.10 NEUTRAL 3.3% 692 1th week of April 6.7 1.2
22
Source: Global Securities estimates
Leaders and Laggards of 2013
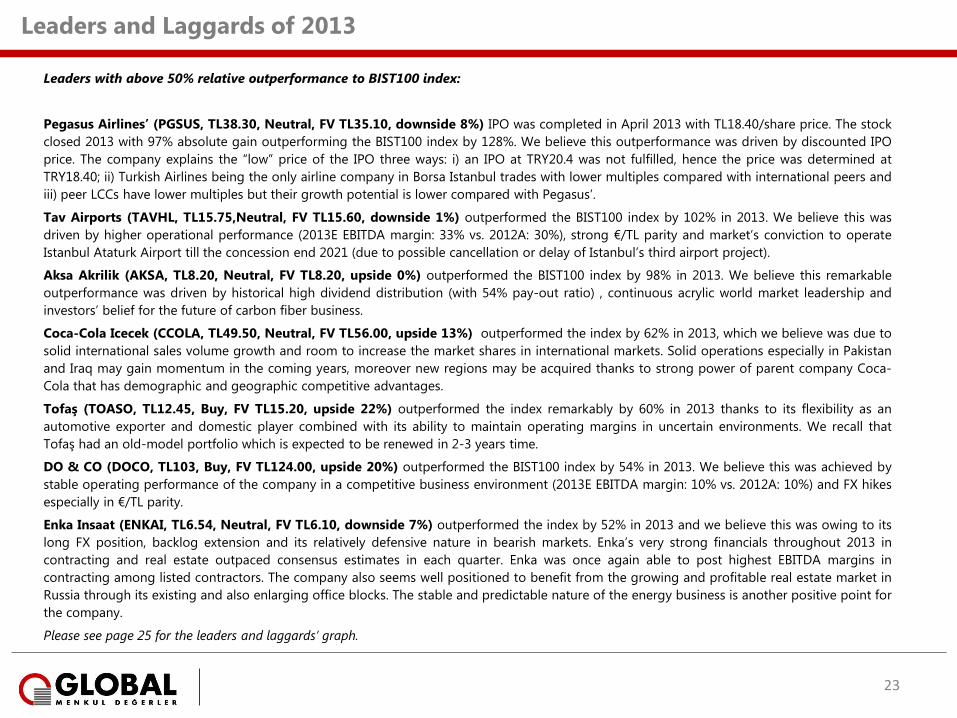
Leaders with above 50% relative outperformance to BIST100 index:
Pegasus Airlines’ (PGSUS, TL38.30, Neutral, FV TL35.10, downside 8%) IPO was completed in April 2013 with TL18.40/share price. The stock
closed 2013 with 97% absolute gain outperforming the BIST100 index by 128%. We believe this outperformance was driven by discounted IPO
price. The company explains the “low” price of the IPO three ways: i) an IPO at TRY20.4 was not fulfilled, hence the price was determined at
TRY18.40; ii) Turkish Airlines being the only airline company in Borsa Istanbul trades with lower multiples compared with international peers and
iii) peer LCCs have lower multiples but their growth potential is lower compared with Pegasus’.
Tav Airports (TAVHL, TL15.75,Neutral, FV TL15.60, downside 1%) outperformed the BIST100 index by 102% in 2013. We believe this was
driven by higher operational performance (2013E EBITDA margin: 33% vs. 2012A: 30%), strong €/TL parity and market’s conviction to operate
Istanbul Ataturk Airport till the concession end 2021 (due to possible cancellation or delay of Istanbul’s third airport project).
Aksa Akrilik (AKSA, TL8.20, Neutral, FV TL8.20, upside 0%) outperformed the BIST100 index by 98% in 2013. We believe this remarkable
outperformance was driven by historical high dividend distribution (with 54% pay-out ratio) , continuous acrylic world market leadership and
investors’ belief for the future of carbon fiber business.
Coca-Cola Icecek (CCOLA, TL49.50, Neutral, FV TL56.00, upside 13%) outperformed the index by 62% in 2013, which we believe was due to
solid international sales volume growth and room to increase the market shares in international markets. Solid operations especially in Pakistan
and Iraq may gain momentum in the coming years, moreover new regions may be acquired thanks to strong power of parent company Coca-
Cola that has demographic and geographic competitive advantages.
Tofaş (TOASO, TL12.45, Buy, FV TL15.20, upside 22%) outperformed the index remarkably by 60% in 2013 thanks to its flexibility as an
automotive exporter and domestic player combined with its ability to maintain operating margins in uncertain environments. We recall that
Tofaş had an old-model portfolio which is expected to be renewed in 2-3 years time.
DO & CO (DOCO, TL103, Buy, FV TL124.00, upside 20%) outperformed the BIST100 index by 54% in 2013. We believe this was achieved by
stable operating performance of the company in a competitive business environment (2013E EBITDA margin: 10% vs. 2012A: 10%) and FX hikes
especially in €/TL parity.
Enka Insaat (ENKAI, TL6.54, Neutral, FV TL6.10, downside 7%) outperformed the index by 52% in 2013 and we believe this was owing to its
long FX position, backlog extension and its relatively defensive nature in bearish markets. Enka’s very strong financials throughout 2013 in
contracting and real estate outpaced consensus estimates in each quarter. Enka was once again able to post highest EBITDA margins in
contracting among listed contractors. The company also seems well positioned to benefit from the growing and profitable real estate market in
Russia through its existing and also enlarging office blocks. The stable and predictable nature of the energy business is another positive point for
the company.
Please see page 25 for the leaders and laggards’ graph.
23
Leaders and Laggards of 2013
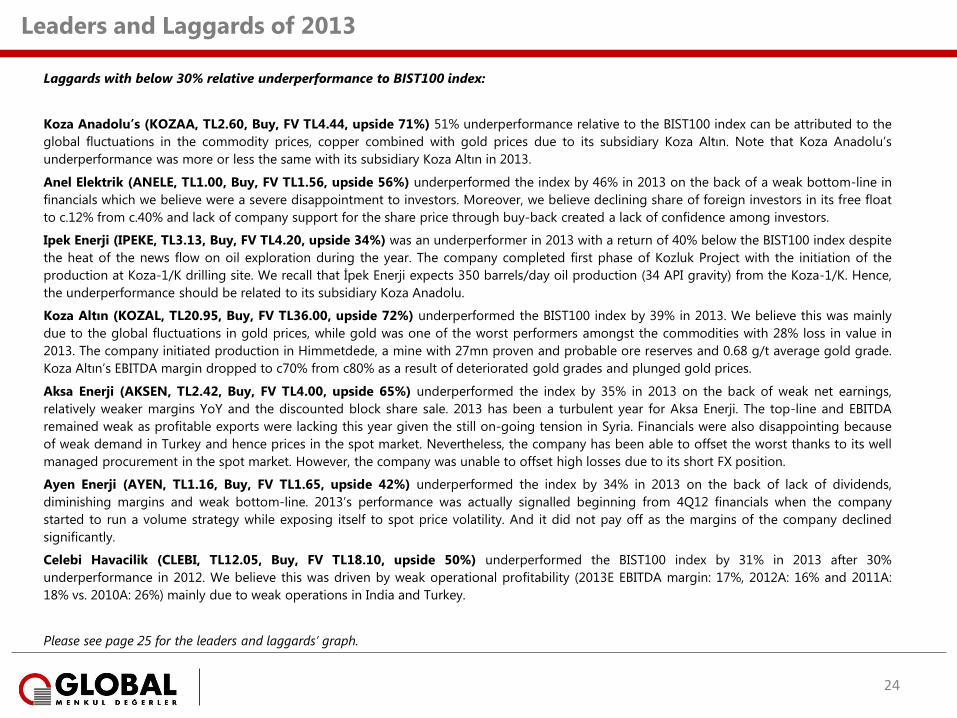
Laggards with below 30% relative underperformance to BIST100 index:
Koza Anadolu’s (KOZAA, TL2.60, Buy, FV TL4.44, upside 71%) 51% underperformance relative to the BIST100 index can be attributed to the
global fluctuations in the commodity prices, copper combined with gold prices due to its subsidiary Koza Altın. Note that Koza Anadolu’s
underperformance was more or less the same with its subsidiary Koza Altın in 2013.
Anel Elektrik (ANELE, TL1.00, Buy, FV TL1.56, upside 56%) underperformed the index by 46% in 2013 on the back of a weak bottom-line in
financials which we believe were a severe disappointment to investors. Moreover, we believe declining share of foreign investors in its free float
to c.12% from c.40% and lack of company support for the share price through buy-back created a lack of confidence among investors.
Ipek Enerji (IPEKE, TL3.13, Buy, FV TL4.20, upside 34%) was an underperformer in 2013 with a return of 40% below the BIST100 index despite
the heat of the news flow on oil exploration during the year. The company completed first phase of Kozluk Project with the initiation of the
production at Koza-1/K drilling site. We recall that İpek Enerji expects 350 barrels/day oil production (34 API gravity) from the Koza-1/K. Hence,
the underperformance should be related to its subsidiary Koza Anadolu.
Koza Altın (KOZAL, TL20.95, Buy, FV TL36.00, upside 72%) underperformed the BIST100 index by 39% in 2013. We believe this was mainly
due to the global fluctuations in gold prices, while gold was one of the worst performers amongst the commodities with 28% loss in value in
2013. The company initiated production in Himmetdede, a mine with 27mn proven and probable ore reserves and 0.68 g/t average gold grade.
Koza Altın’s EBITDA margin dropped to c70% from c80% as a result of deteriorated gold grades and plunged gold prices.
Aksa Enerji (AKSEN, TL2.42, Buy, FV TL4.00, upside 65%) underperformed the index by 35% in 2013 on the back of weak net earnings,
relatively weaker margins YoY and the discounted block share sale. 2013 has been a turbulent year for Aksa Enerji. The top-line and EBITDA
remained weak as profitable exports were lacking this year given the still on-going tension in Syria. Financials were also disappointing because
of weak demand in Turkey and hence prices in the spot market. Nevertheless, the company has been able to offset the worst thanks to its well
managed procurement in the spot market. However, the company was unable to offset high losses due to its short FX position.
Ayen Enerji (AYEN, TL1.16, Buy, FV TL1.65, upside 42%) underperformed the index by 34% in 2013 on the back of lack of dividends,
diminishing margins and weak bottom-line. 2013’s performance was actually signalled beginning from 4Q12 financials when the company
started to run a volume strategy while exposing itself to spot price volatility. And it did not pay off as the margins of the company declined
significantly.
Celebi Havacilik (CLEBI, TL12.05, Buy, FV TL18.10, upside 50%) underperformed the BIST100 index by 31% in 2013 after 30%
underperformance in 2012. We believe this was driven by weak operational profitability (2013E EBITDA margin: 17%, 2012A: 16% and 2011A:
18% vs. 2010A: 26%) mainly due to weak operations in India and Turkey.
Please see page 25 for the leaders and laggards’ graph.
24
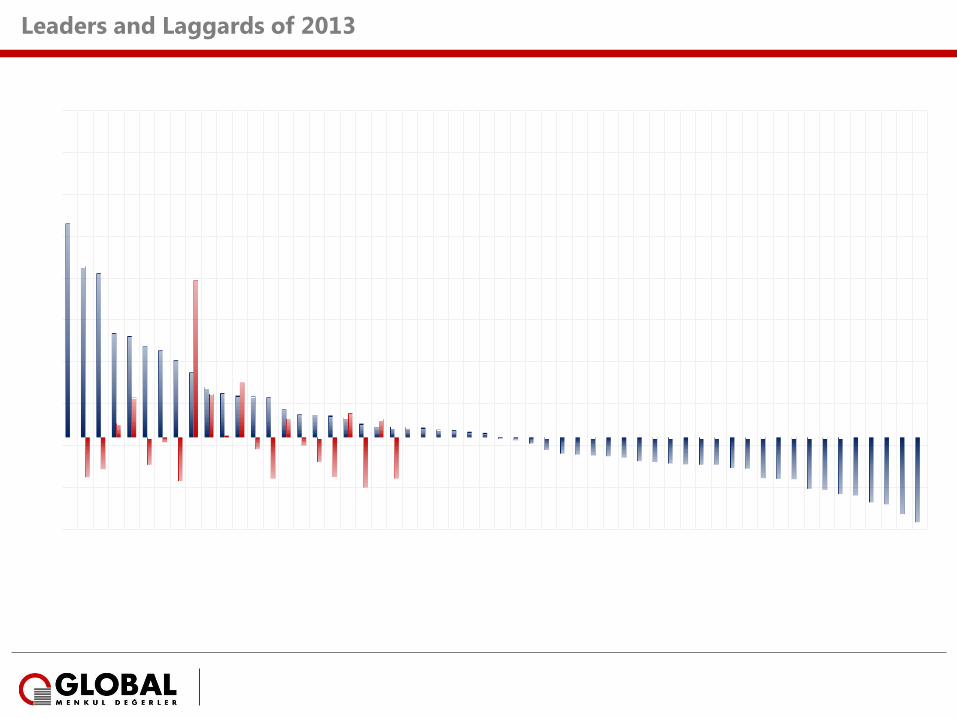
Leaders and Laggards of 2013
-55%
-30%
-05%
20%
45%
70%
95%
120%
145%
170%
195%
PG
SU
S
TA
VH
L
AK
SA
CC
OLA
TO
ASO
DO
CO
EN
KA
I
ER
EG
L
TH
YA
O
TTR
AK
FR
OTO
AR
CLK
TEB
NK
TR
KC
M
BIM
AS
PETK
M
TC
ELL
SIS
E
KC
HO
L
TTK
OM
ALA
RK
AEFES
SELEC
HLG
YO
ALB
RK
ZO
REN
TU
PR
S
SA
HO
L
BIZ
IM
DO
AS
VA
KB
N
PR
KM
E
DO
HO
L
GU
BR
F
AK
BN
K
ISC
TR
GA
RA
N
MG
RO
S
SA
SA
AK
EN
R
TK
FEN
AN
AC
M
YK
BN
K
HA
LK
B
DY
HO
L
ASY
AB
HU
RG
Z
BA
GFS
SN
GY
O
CLEB
I
AY
EN
AK
SEN
KO
ZA
L
IPEK
E
AN
ELE
KO
ZA
A
2013 Relative 2012 Relative Upside to TP
25
Source: Global Securities estimates, Finnet
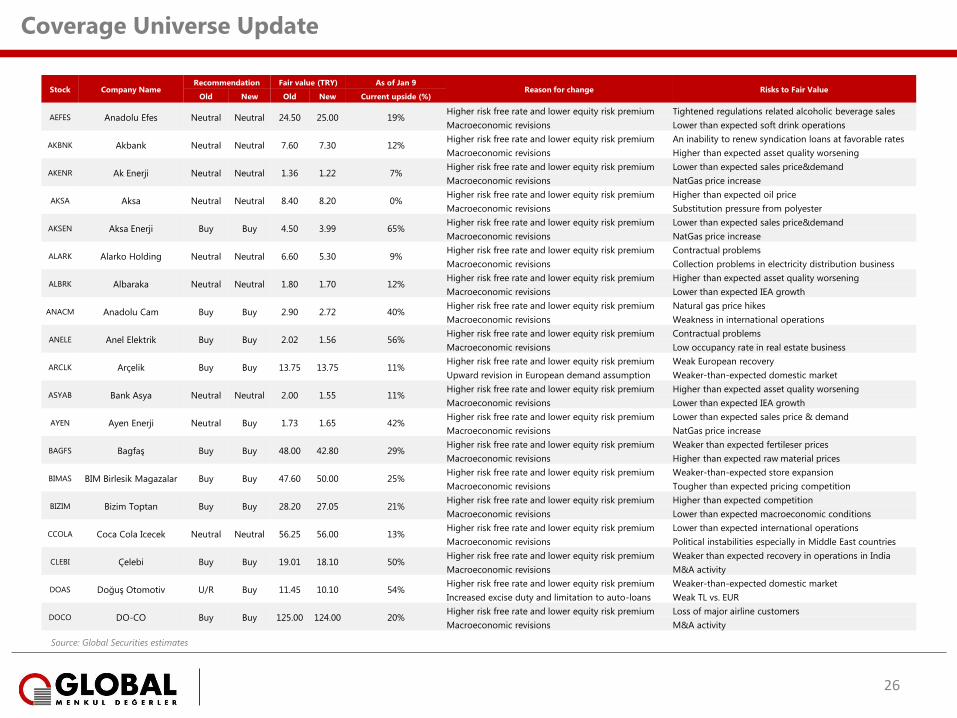
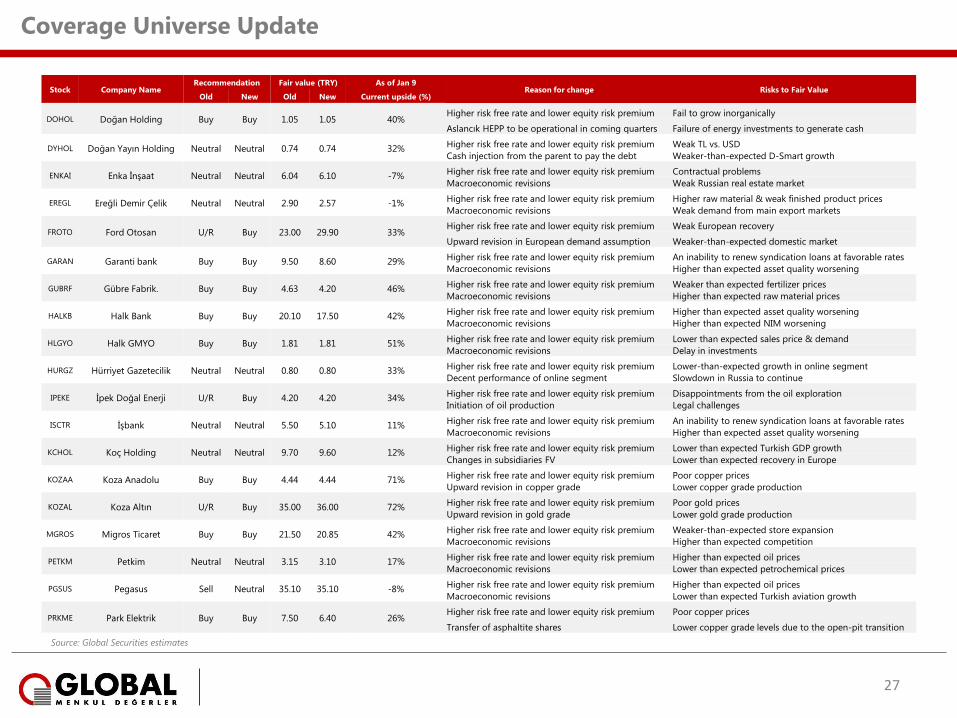
Coverage Universe Update
26
Stock Company Name Recommendation Fair value (TRY) As of Jan 9
Reason for change Risks to Fair Value Old New Old New Current upside (%)
AEFES Anadolu Efes Neutral Neutral 24.50 25.00 19% Higher risk free rate and lower equity risk premium Tightened regulations related alcoholic beverage sales
Macroeconomic revisions Lower than expected soft drink operations
AKBNK Akbank Neutral Neutral 7.60 7.30 12% Higher risk free rate and lower equity risk premium An inability to renew syndication loans at favorable rates
Macroeconomic revisions Higher than expected asset quality worsening
AKENR Ak Enerji Neutral Neutral 1.36 1.22 7% Higher risk free rate and lower equity risk premium Lower than expected sales price&demand
Macroeconomic revisions NatGas price increase
AKSA Aksa Neutral Neutral 8.40 8.20 0% Higher risk free rate and lower equity risk premium Higher than expected oil price
Macroeconomic revisions Substitution pressure from polyester
AKSEN Aksa Enerji Buy Buy 4.50 3.99 65% Higher risk free rate and lower equity risk premium Lower than expected sales price&demand
Macroeconomic revisions NatGas price increase
ALARK Alarko Holding Neutral Neutral 6.60 5.30 9% Higher risk free rate and lower equity risk premium Contractual problems
Macroeconomic revisions Collection problems in electricity distribution business
ALBRK Albaraka Neutral Neutral 1.80 1.70 12% Higher risk free rate and lower equity risk premium Higher than expected asset quality worsening
Macroeconomic revisions Lower than expected IEA growth
ANACM Anadolu Cam Buy Buy 2.90 2.72 40% Higher risk free rate and lower equity risk premium Natural gas price hikes
Macroeconomic revisions Weakness in international operations
ANELE Anel Elektrik Buy Buy 2.02 1.56 56% Higher risk free rate and lower equity risk premium Contractual problems
Macroeconomic revisions Low occupancy rate in real estate business
ARCLK Arçelik Buy Buy 13.75 13.75 11% Higher risk free rate and lower equity risk premium Weak European recovery
Upward revision in European demand assumption Weaker-than-expected domestic market
ASYAB Bank Asya Neutral Neutral 2.00 1.55 11% Higher risk free rate and lower equity risk premium Higher than expected asset quality worsening
Macroeconomic revisions Lower than expected IEA growth
AYEN Ayen Enerji Neutral Buy 1.73 1.65 42% Higher risk free rate and lower equity risk premium Lower than expected sales price & demand
Macroeconomic revisions NatGas price increase
BAGFS Bagfaş Buy Buy 48.00 42.80 29% Higher risk free rate and lower equity risk premium Weaker than expected fertileser prices
Macroeconomic revisions Higher than expected raw material prices
BIMAS BIM Birlesik Magazalar Buy Buy 47.60 50.00 25% Higher risk free rate and lower equity risk premium Weaker-than-expected store expansion
Macroeconomic revisions Tougher than expected pricing competition
BIZIM Bizim Toptan Buy Buy 28.20 27.05 21% Higher risk free rate and lower equity risk premium Higher than expected competition
Macroeconomic revisions Lower than expected macroeconomic conditions
CCOLA Coca Cola Icecek Neutral Neutral 56.25 56.00 13% Higher risk free rate and lower equity risk premium Lower than expected international operations
Macroeconomic revisions Political instabilities especially in Middle East countries
CLEBI Çelebi Buy Buy 19.01 18.10 50% Higher risk free rate and lower equity risk premium Weaker than expected recovery in operations in India
Macroeconomic revisions M&A activity
DOAS Doğuş Otomotiv U/R Buy 11.45 10.10 54% Higher risk free rate and lower equity risk premium Weaker-than-expected domestic market
Increased excise duty and limitation to auto-loans Weak TL vs. EUR
DOCO DO-CO Buy Buy 125.00 124.00 20% Higher risk free rate and lower equity risk premium Loss of major airline customers
Macroeconomic revisions M&A activity
Source: Global Securities estimates
Coverage Universe Update
27
Stock Company Name Recommendation Fair value (TRY) As of Jan 9
Reason for change Risks to Fair Value Old New Old New Current upside (%)
DOHOL Doğan Holding Buy Buy 1.05 1.05 40% Higher risk free rate and lower equity risk premium Fail to grow inorganically
Aslancık HEPP to be operational in coming quarters Failure of energy investments to generate cash
DYHOL Doğan Yayın Holding Neutral Neutral 0.74 0.74 32% Higher risk free rate and lower equity risk premium Weak TL vs. USD
Cash injection from the parent to pay the debt Weaker-than-expected D-Smart growth
ENKAI Enka İnşaat Neutral Neutral 6.04 6.10 -7% Higher risk free rate and lower equity risk premium Contractual problems
Macroeconomic revisions Weak Russian real estate market
EREGL Ereğli Demir Çelik Neutral Neutral 2.90 2.57 -1% Higher risk free rate and lower equity risk premium Higher raw material & weak finished product prices
Macroeconomic revisions Weak demand from main export markets
FROTO Ford Otosan U/R Buy 23.00 29.90 33% Higher risk free rate and lower equity risk premium Weak European recovery
Upward revision in European demand assumption Weaker-than-expected domestic market
GARAN Garanti bank Buy Buy 9.50 8.60 29% Higher risk free rate and lower equity risk premium An inability to renew syndication loans at favorable rates
Macroeconomic revisions Higher than expected asset quality worsening
GUBRF Gübre Fabrik. Buy Buy 4.63 4.20 46% Higher risk free rate and lower equity risk premium Weaker than expected fertilizer prices
Macroeconomic revisions Higher than expected raw material prices
HALKB Halk Bank Buy Buy 20.10 17.50 42% Higher risk free rate and lower equity risk premium Higher than expected asset quality worsening
Macroeconomic revisions Higher than expected NIM worsening
HLGYO Halk GMYO Buy Buy 1.81 1.81 51% Higher risk free rate and lower equity risk premium Lower than expected sales price & demand
Macroeconomic revisions Delay in investments
HURGZ Hürriyet Gazetecilik Neutral Neutral 0.80 0.80 33% Higher risk free rate and lower equity risk premium Lower-than-expected growth in online segment
Decent performance of online segment Slowdown in Russia to continue
IPEKE İpek Doğal Enerji U/R Buy 4.20 4.20 34% Higher risk free rate and lower equity risk premium Disappointments from the oil exploration
Initiation of oil production Legal challenges
ISCTR İşbank Neutral Neutral 5.50 5.10 11% Higher risk free rate and lower equity risk premium An inability to renew syndication loans at favorable rates
Macroeconomic revisions Higher than expected asset quality worsening
KCHOL Koç Holding Neutral Neutral 9.70 9.60 12% Higher risk free rate and lower equity risk premium Lower than expected Turkish GDP growth
Changes in subsidiaries FV Lower than expected recovery in Europe
KOZAA Koza Anadolu Buy Buy 4.44 4.44 71% Higher risk free rate and lower equity risk premium Poor copper prices
Upward revision in copper grade Lower copper grade production
KOZAL Koza Altın U/R Buy 35.00 36.00 72% Higher risk free rate and lower equity risk premium Poor gold prices
Upward revision in gold grade Lower gold grade production
MGROS Migros Ticaret Buy Buy 21.50 20.85 42% Higher risk free rate and lower equity risk premium Weaker-than-expected store expansion
Macroeconomic revisions Higher than expected competition
PETKM Petkim Neutral Neutral 3.15 3.10 17% Higher risk free rate and lower equity risk premium Higher than expected oil prices
Macroeconomic revisions Lower than expected petrochemical prices
PGSUS Pegasus Sell Neutral 35.10 35.10 -8% Higher risk free rate and lower equity risk premium Higher than expected oil prices
Macroeconomic revisions Lower than expected Turkish aviation growth
PRKME Park Elektrik Buy Buy 7.50 6.40 26% Higher risk free rate and lower equity risk premium Poor copper prices
Transfer of asphaltite shares Lower copper grade levels due to the open-pit transition
Source: Global Securities estimates
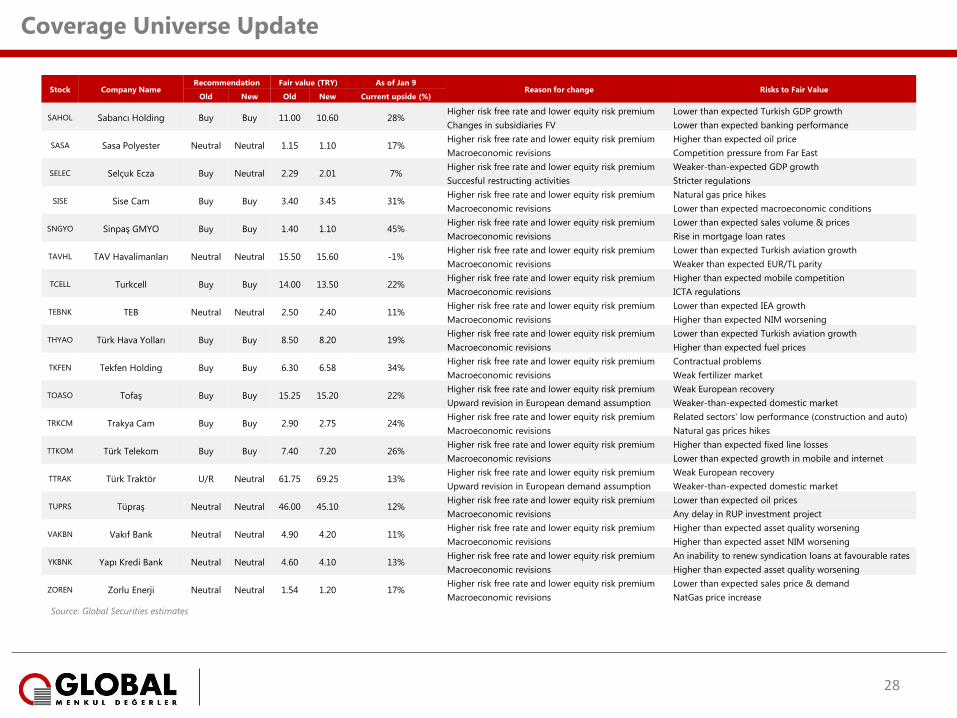
Coverage Universe Update
28
Stock Company Name Recommendation Fair value (TRY) As of Jan 9
Reason for change Risks to Fair Value Old New Old New Current upside (%)
SAHOL Sabancı Holding Buy Buy 11.00 10.60 28% Higher risk free rate and lower equity risk premium Lower than expected Turkish GDP growth
Changes in subsidiaries FV Lower than expected banking performance
SASA Sasa Polyester Neutral Neutral 1.15 1.10 17% Higher risk free rate and lower equity risk premium Higher than expected oil price
Macroeconomic revisions Competition pressure from Far East
SELEC Selçuk Ecza Buy Neutral 2.29 2.01 7% Higher risk free rate and lower equity risk premium Weaker-than-expected GDP growth
Succesful restructing activities Stricter regulations
SISE Sise Cam Buy Buy 3.40 3.45 31% Higher risk free rate and lower equity risk premium Natural gas price hikes
Macroeconomic revisions Lower than expected macroeconomic conditions
SNGYO Sinpaş GMYO Buy Buy 1.40 1.10 45% Higher risk free rate and lower equity risk premium Lower than expected sales volume & prices
Macroeconomic revisions Rise in mortgage loan rates
TAVHL TAV Havalimanları Neutral Neutral 15.50 15.60 -1% Higher risk free rate and lower equity risk premium Lower than expected Turkish aviation growth
Macroeconomic revisions Weaker than expected EUR/TL parity
TCELL Turkcell Buy Buy 14.00 13.50 22% Higher risk free rate and lower equity risk premium Higher than expected mobile competition
Macroeconomic revisions ICTA regulations
TEBNK TEB Neutral Neutral 2.50 2.40 11% Higher risk free rate and lower equity risk premium Lower than expected IEA growth
Macroeconomic revisions Higher than expected NIM worsening
THYAO Türk Hava Yolları Buy Buy 8.50 8.20 19% Higher risk free rate and lower equity risk premium Lower than expected Turkish aviation growth
Macroeconomic revisions Higher than expected fuel prices
TKFEN Tekfen Holding Buy Buy 6.30 6.58 34% Higher risk free rate and lower equity risk premium Contractual problems
Macroeconomic revisions Weak fertilizer market
TOASO Tofaş Buy Buy 15.25 15.20 22% Higher risk free rate and lower equity risk premium Weak European recovery
Upward revision in European demand assumption Weaker-than-expected domestic market
TRKCM Trakya Cam Buy Buy 2.90 2.75 24% Higher risk free rate and lower equity risk premium Related sectors' low performance (construction and auto)
Macroeconomic revisions Natural gas prices hikes
TTKOM Türk Telekom Buy Buy 7.40 7.20 26% Higher risk free rate and lower equity risk premium Higher than expected fixed line losses
Macroeconomic revisions Lower than expected growth in mobile and internet
TTRAK Türk Traktör U/R Neutral 61.75 69.25 13% Higher risk free rate and lower equity risk premium Weak European recovery
Upward revision in European demand assumption Weaker-than-expected domestic market
TUPRS Tüpraş Neutral Neutral 46.00 45.10 12% Higher risk free rate and lower equity risk premium Lower than expected oil prices
Macroeconomic revisions Any delay in RUP investment project
VAKBN Vakıf Bank Neutral Neutral 4.90 4.20 11% Higher risk free rate and lower equity risk premium Higher than expected asset quality worsening
Macroeconomic revisions Higher than expected asset NIM worsening
YKBNK Yapı Kredi Bank Neutral Neutral 4.60 4.10 13% Higher risk free rate and lower equity risk premium An inability to renew syndication loans at favourable rates
Macroeconomic revisions Higher than expected asset quality worsening
ZOREN Zorlu Enerji Neutral Neutral 1.54 1.20 17% Higher risk free rate and lower equity risk premium Lower than expected sales price & demand
Macroeconomic revisions NatGas price increase
Source: Global Securities estimates

BASIS FOR RECOMMENDATIONS
12-MONTH RATING DEFINITION
BUY: Analyst expects at least 10% upside potential to fair value, which should be realized in
the next 12 months
NEUTRAL: Analyst expects upside/downside potential of between +10% and -10% to fair
value, which should be realized in the next 12 months
SELL: Analyst expects at least 10% downside potential to fair value, which should be
realized in the next 12 months
TRADING RATING DEFINITION
TRADING BUY: Analyst expects a positive short-term movement in the share price (max
duration 2 months from the time Trading Buy is announced) and may move out of line with
the fair value estimate during that period.
TRADING SELL: Analyst expects a negative short-term movement in the share price (max
duration 2 months from time Trading Sell is announced) and may move out of line with the
fair value estimate during that period.
ANALYST CERTIFICATION
We, Global research team, hereby certify that the views expressed in this research report
accurately reflect my personal views about the subject securities and issuers. I also certify
that no part of my compensation was, is, or will be, directly or indirectly, related to the
specific recommendations or view expressed in this research report.
IMPORTANT DISCLOSURE INFORMATION
This material was produced by Global Menkul Değerler A.Ş. (“GMD”) or its Affiliates, solely
for information purposes and for the use of the recipient. It is not to be reproduced under
any circumstances and is not to be copied or made available to any person other than the
recipient. It is distributed in the world by GMD or an authorised affiliate of GMD (such
entities and any other entity, directly or indirectly, controlled by GMD, the “Affiliates”). This
document does not constitute an offer of, or an invitation by or on behalf of GMD or its
Affiliates or any other company to any person, to buy or sell any security. The information
contained herein has been obtained from published information and other sources which
GMD or its Affiliates consider to be reliable.
None of GMD or its Affiliates accepts any liability or responsibility whatsoever for the
accuracy or completeness of any such information. All estimates, expressions of opinion and
other subjective judgments contained herein are made as of the date of this document.
Emerging securities markets may be subject to risks significantly higher than more
established markets. In particular, the political and economic environment, company
practices and market prices and volumes may be subject to significant variations. The ability
to assess such risks may also be limited due to significantly lower information quantity and
quality. By accepting this document, you agree to be bound by all the foregoing provisions.
GMD or its Affiliates have not recently been the beneficial owners of 1% or more of the
securities mentioned in this report; GMD or its affiliates have not managed or co-managed a
public offering of these securities, or received compensation for investment banking services
from the issuer of these securities in the past 12 months and do not expect to receive
compensation for investment banking services from the issuer of these securities within the
next three months. However, one or more of GMD or its Affiliates may, from time to time,
have a long or short position in any of the securities mentioned herein and may buy or sell
those securities or options thereon either on their own account or on behalf of their clients.
GMD or its Affiliates may, to the extent permitted by law, act upon or use the above material
or the conclusions stated above or the research or analysis on which they are based before
the material is published to recipients and from time to time provide investment banking,
investment management or other services for or solicit to seek to obtain investment
banking, or other securities business from, any entity referred to in this report.
© 2014 Global Menkul Degerler A.Ş.
All rights reserved. No part of this publication may be reproduced, stored in a retrieval
system, or transmitted in any form or by any means, electronic, mechanical, photocopying,
recording, or otherwise, without the prior consent of Global Menkul Değerler A.Ş.

strategic partner of