2014 State of the Markets - Federal Energy Regulatory · PDF file · 2015-10-192014...
22
Page 1 of 22 Item No: A-3 March 19, 2015 2014 State of the Markets Good morning Chairman and Commissioners. The Office of Enforcement’s Division of Energy Market Oversight is pleased to present the 2014 State of the Markets Report. This report is staff’s annual opportunity to share our assessment on natural gas, electric, and other energy markets developments during the past year to better inform the Commission’s understanding of current and future trends.
Transcript of 2014 State of the Markets - Federal Energy Regulatory · PDF file · 2015-10-192014...

Page 1 of 22
Item No: A-3March 19, 2015
2014State of the Markets
Good morning Chairman and Commissioners. The Office of Enforcement’s Division of Energy Market Oversight is pleased to present the 2014 State of the Markets Report. This report is staff’s annual opportunity to share our assessment on natural gas, electric, and other energy markets developments during the past year to better inform the Commission’s understanding of current and future trends.

Page 2 of 22
Slide 2
State of the MarketsHighlights
Extreme temperatures early in 2014 had lasting impacts
Natural gas prices decline through the year, while oil prices plunge
Natural gas production reaches new records and storage recovers
Northeast natural gas prices disconnect from Henry Hub
Organized markets continue to evolve: California ISO launches
EIM, SPP begins DAY 2 Market, and Entergy joins MISO
RTOs and utilities adjust to changing resource mix
Markets performed well in early 2015 despite extreme weather
During the first quarter of 2014, extreme cold temperatures stressed the country’s natural gas infrastructure and power markets. U.S. natural gas prices reached record levels resulting in electricity price spikes. After a dramatic start to 2014, natural gas and electricity prices were relatively low and stable for the remainder of the year. Despite low prices throughout most of the year, natural gas production continued to break records. Oil prices plunged during the second half of 2014, which has implications for oil and gas industry activity in 2015 and beyond. In 2014, there were significant developments in the organized markets, with major changes in CAISO and SPP, and the expansion of MISO. Electricity markets continue to adjust to a change in generation mix, as coal plants retire and new natural gas and renewable generation enters service.
Page 3 of 22
Slide 3
Pricing PointBOLD – 2014 priceGreen – % increase from previous yearRed – % decrease from previous year
Source: Derived from ICE & Plattsdata
ColumbiaTCO
AlgonquinCitygateAECO
ChicagoCitygate
TranscoZ6-NYNGPL
Tex-Okla
El PasoPermian
SoCal Border
PG&ECitygate
CIG
NW Sumas
HSCHenry Hub
FGT-Z3
$4.8534%
$4.8322%
$4.2718%
$4.5017%
$4.2617%
$4.3016%
$4.0342%
$4.3118%
$4.3216%
$4.3415%
$4.3016%
$5.5243%
$7.9514%
$6.2222%
Average NG Spot Prices Higher in 2014
The spot natural gas price at Henry Hub averaged $4.32/MMBtu in 2014, 16 percent higher than in 2013. Prices were on average 14 to 43 percent higher at key hubs throughout the country, with the Chicago Citygate experiencing the highest increase. Price spikes during the Polar Vortex events early in the year drove many of the increases, with Transco Zone 6 Non-NY reaching $123/MMBtu in January. Although prices began to moderate in the spring, concerns about low storage inventories kept prices up until early summer. Prices fell in the fall as storage recovered, and by late December, the Henry Hub price was below $3.00. The 43 percent increase in the average price at the Chicago Citygate was a result of both the high price levels during the harsh winter, and of continued reliance on natural gas supplies from Canada. Canadian prices were 31 percent higher in 2014 than in 2013, as they recovered from an oversupply condition in 2013. In addition, natural gas demand in the Midwest in 2014 was the highest on record, up 3 percent from 2013. In contrast, the Northeast experienced some of the lowest year-on-year price increases, as the region benefitted from growing Marcellus Shale supplies.
Page 4 of 22
Slide 4
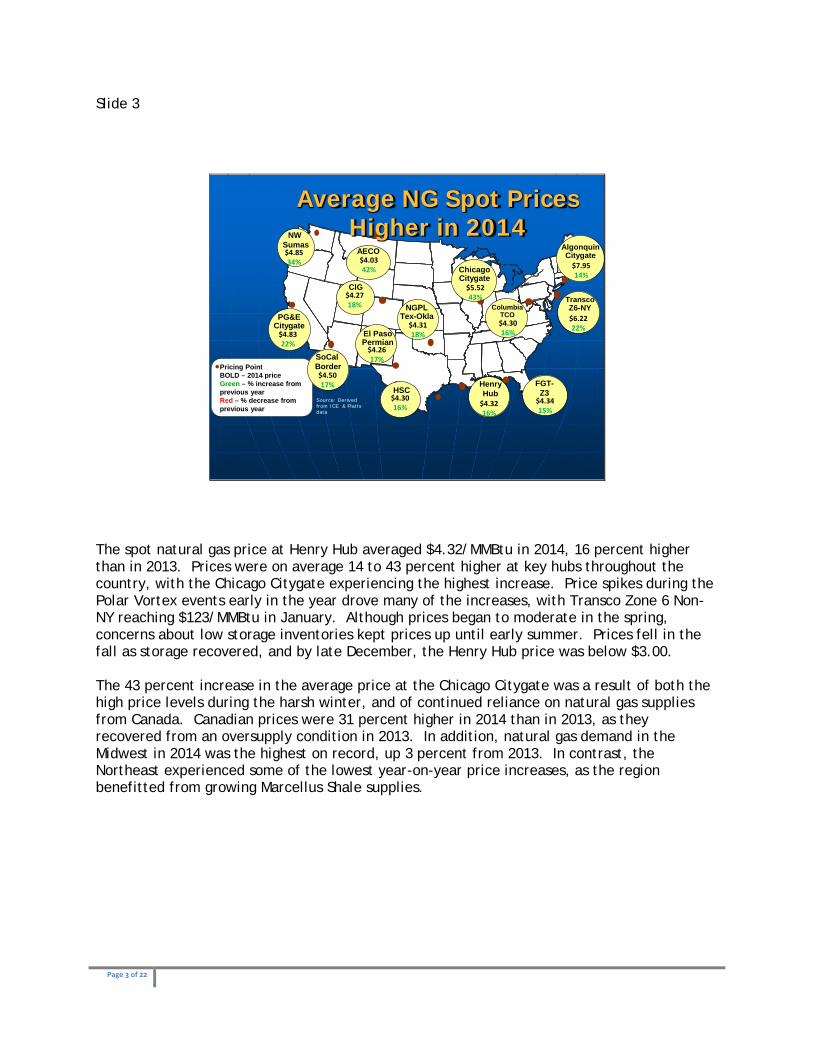
U.S. NG Demand Sets New Record
0
20
40
60
80
100
120
140
160
Jan Feb Mar Apr May Jun Jul Aug Sep Oct Nov Dec
Bcf
d2009-2013 Range 2014
Source: Derived from BentekEnergy data
On the back of the coldest winter in over a decade, average U.S. natural gas demand for 2014 reached a new record of 70.7 Bcfd. Residential and commercial natural gas demand grew 3 percent in 2014, while industrial natural gas demand grew 2 percent as low prices of natural gas and natural gas liquids continued to fuel a renaissance in U.S. industry. Despite the record-cold winter, however, natural gas demand for electricity generation decreased by 0.5 Bcfd, or 3 percent from 2013 levels as the result of a cooler-than-normal summer.

Page 5 of 22
Slide 5
Record Injections Replenished NG Storage
Source: Derived from Energy Information Administration data
0500
1,0001,5002,0002,5003,0003,5004,0004,500
2007 2008 2009 2010 2011 2012 2013 2014
Bcf
This chart shows the massive replenishment of natural gas inventories that took place in 2014. The injection season began in the spring with 822 Bcf of natural gas in storage, the lowest level since 2003. However, mild temperatures in the summer and fall, and steady increases in U.S. natural gas production resulted in market participants injecting almost 2.8 Tcf during the 2014 refill season, nearly 10 percent above the previous high. Inventories reached 3,611 Bcf by November 1, the traditional end of the injection season, only 5 percent below the five-year average. By the end of the year, inventories stood at 3,220 Bcf, 8 percent above 2013 levels. Despite strong natural gas withdrawals early in January and February of this year, inventories were 47 percent above 2014 levels by March 6. Assuming average withdrawals between now and the end of March, inventories are poised to enter the injection season over half a Bcf above the same time in 2014, putting downward pressure on prices going into the summer.
Page 6 of 22
Slide 6
Source: Derived from BentekEnergy data
- 10 20 30 40 50 60 70 80 90
Bcf
d
CONV9NTIONAL
SHALE
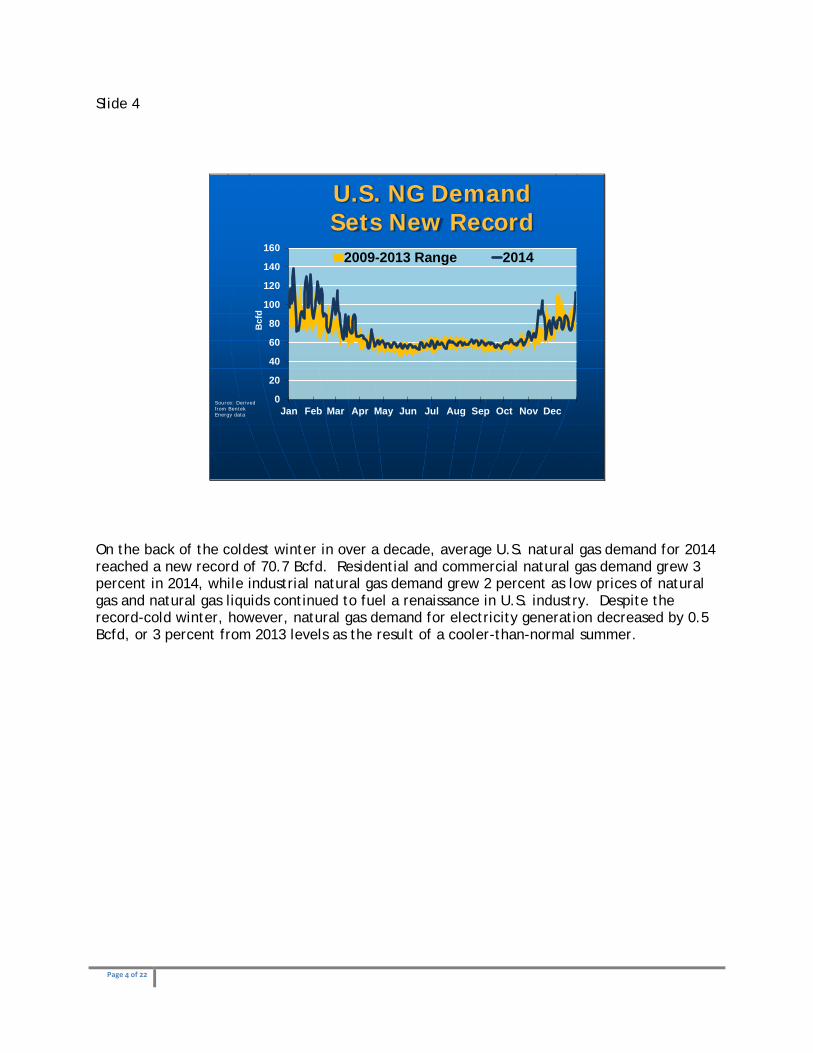
NG From Shale Drives 2014 Production Records
Natural gas production grew 5 percent in 2014, averaging 68.4 Bcfd and breaking the record set in 2013. Two shale formations, the Marcellus in Pennsylvania and the Eagle Ford in Texas, accounted for 34 percent of the production increase, averaging 14 and 4 Bcfd respectively. Crude oil prices fell from $115 per barrel in mid-June to $53 at the end of December, reducing drilling activity in the latter half of 2014. However, natural gas production continued to climb. There is concern that prolonged low crude oil and natural gas prices could result in slower growth or even a decline in natural gas production. However, year-to-date production has consistently remained above 71 Bcfd, and by the end of February, it was on average 6.4 percent higher than in the first 2-months of 2014. A backlog of uncompleted wells could help maintain production levels in the near future. As of the middle of January, there were approximately 1,100 uncompleted wells in Marcellus.
Page 7 of 22
Slide 7
Low NG Prices Continue Through 2015
Source: Derived from Bloomberg data
02468
10121416
$/M
MB
tu
ChicagoAlgonquin (Boston)Henry Hub (NYMEX)PG&ETZ6 NY (NYC)
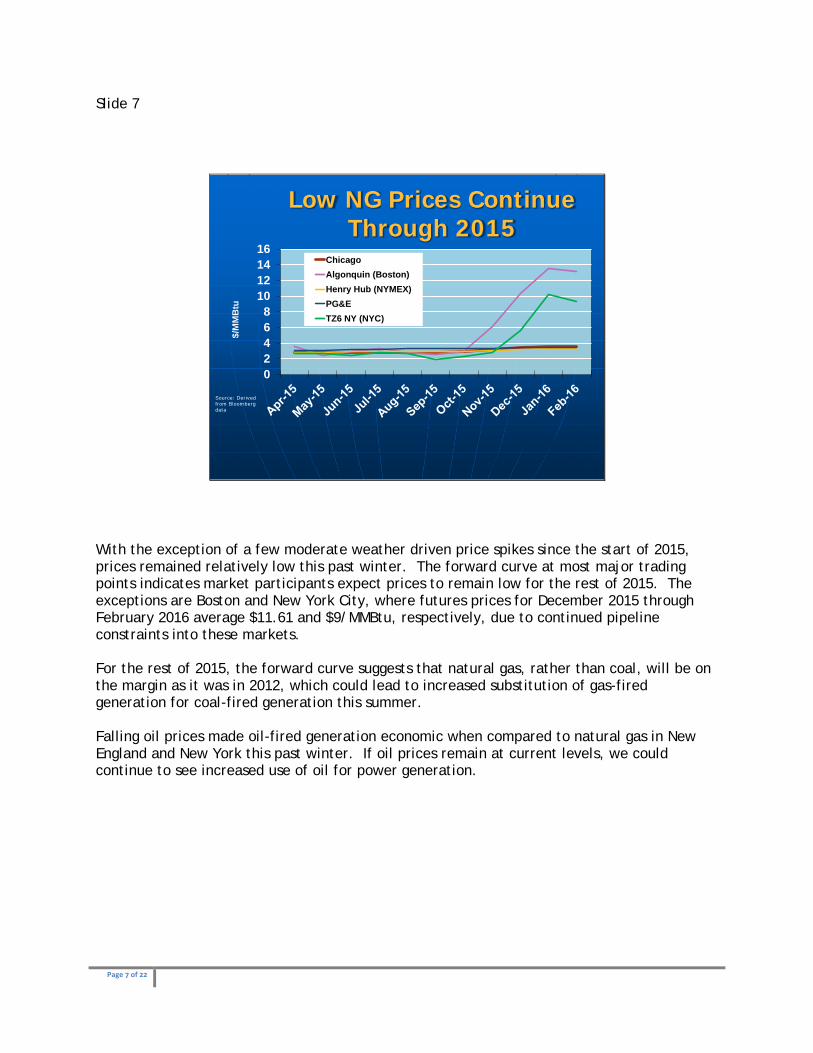
With the exception of a few moderate weather driven price spikes since the start of 2015, prices remained relatively low this past winter. The forward curve at most major trading points indicates market participants expect prices to remain low for the rest of 2015. The exceptions are Boston and New York City, where futures prices for December 2015 through February 2016 average $11.61 and $9/MMBtu, respectively, due to continued pipeline constraints into these markets. For the rest of 2015, the forward curve suggests that natural gas, rather than coal, will be on the margin as it was in 2012, which could lead to increased substitution of gas-fired generation for coal-fired generation this summer. Falling oil prices made oil-fired generation economic when compared to natural gas in New England and New York this past winter. If oil prices remain at current levels, we could continue to see increased use of oil for power generation.

Page 8 of 22
Slide 8
Marcellus Production Overwhelms Infrastructure
Source: Derived from Staff analysis of GPCM data
05
1015202530354045
2010 2011 2012 2013 2014 2015 2016 2017 2018 2019 2020
Bcf
d
OHWVPATotal ProposedLikely Pipeline Capacity
This slide projects growth in natural gas production in the Marcellus and Utica Shales in Pennsylvania, West Virginia, and Ohio. Total Northeast production reached over 19 Bcfd at the beginning of 2015, up 10 Bcfd since 2011. The two lines show the growth in proposed pipeline capacity. Pipeline expansions have not always kept pace with production growth leading to sub $2.00 prices in parts of the Marcellus region. Producers are responding to low prices by contracting for new pipeline capacity to carry incremental production to consuming markets. The Northeast became a net exporter of natural gas for the first time last summer and future pipeline expansions are targeting exports to eastern Canada, the Midwest, the Southeast, and the Gulf Coast. As Marcellus Shale gas makes its way into neighboring regions, its impact on markets and basis relationships will broaden. Last summer New York and Boston experienced prices below Henry Hub for the first time. Market Oversight expects that Marcellus exports will moderate prices in other regions over the next few years.

Page 9 of 22
Slide 9
U.S. Natural Gas Exports Continue to Rise
Source: Derived from EIA data
0
500
1,000
1,500
2,000
2,500
2010 2011 2012 2013 2014
MM
cfd
Pipeline Natural Gas Exports to Mexico
Exports to Mexico reached 2 Bcfd in 2014, up from 1.8 Bcfd in 2013 supported by the growth in Eagle Ford Shale production in South Texas and by new pipeline infrastructure across the border. Exports will likely continue to rise as Mexican power generation demand increases, and as more pipeline capacity goes into service, including the 2.1 Bcfd NET Midstream Rio Grande pipeline, scheduled to enter service in 2016. Plans to export LNG from the U.S. continue to move forward. As of the end of 2014, eight projects had been approved, with four under construction including those at Sabine Pass, expected to enter service in 2016, and at Freeport LNG, Cove Point LNG, and Cameron LNG. Meanwhile, reliance on LNG imports continued to decrease. Sendouts from U.S. LNG terminals averaged 100 MMcfd in 2014, 67% below the 2013 levels, while imports from Canaport LNG into New England averaged 49 MMcfd, 52% below 2013. Gross natural gas imports from Canada averaged 7.2 Bcfd. However, exports from the U.S. to Canada averaged 2.1 Bcfd. This makes net Canadian imports 5.2 Bcfd. Marcellus shale production continued to displace Canadian imports, with flows from the Northeast into Ontario reaching 350 MMcfd in August.

Page 10 of 22
Slide 10
Significant Changes in RTO Markets
SPP implements Day 2 Market and moves to increase its footprint
CAISO revamps real-time market
The CAISO Energy Imbalance Market launched on November 1
MISO sees first full year of Entergy integration
On March 1, Southwest Power Pool transitioned to its new, financially binding Day 2 Market. The Day 2 Market launch included new features for SPP such as a Day-Ahead (DA) Market, Transmission Congestion Rights, price-based Operating Reserves procurement, and the consolidation of 16 Balancing Authorities. In 2015, the RTO expects to expand its footprint with the addition of the WAPA-Great Plains, Basin Electric, and Heartland balancing areas. On May 1, CAISO revamped its real-time market, replacing the hour-ahead market used to schedule and price imports and exports, with a 15-minute market, which prices and schedules internal generation as well as interchange. This new construct provides more discrete price signals for generators. CAISO also revised the minimum price floor to encourage renewables to become more price sensitive – to decrease output when supply outstrips demand and prices become negative. Additionally on November 1, CAISO launched its Energy Imbalance Market (EIM). Finally, Entergy and five other balancing areas joined MISO at the end of 2013 and that new area now accounts for about 25 percent of MISO’s total load. The integration of Entergy adds a new dimension to the greater southeastern power market because of the way interchange is priced. Entities that ship power into, out of, or through the Entergy area are now assessed congestion charges for the MISO portion.
Page 11 of 22
Slide 11
On-Peak Day-Ahead 2014 Electric Spot Prices
Source: Derived from SNL and PLATTS data
NP 15$52
17% Palo Verde$42
13%
Mid-Columbia
$393%
Indiana Hub$48
26%SPP$40
18%
ERCOTNorth$4520%
PJM West$63
38%NYISO ZJ
$7319%
Mass Hub$76
18%
Into Southern
$4222%$ = Average 2014 Spot Price
% Increase from 2013
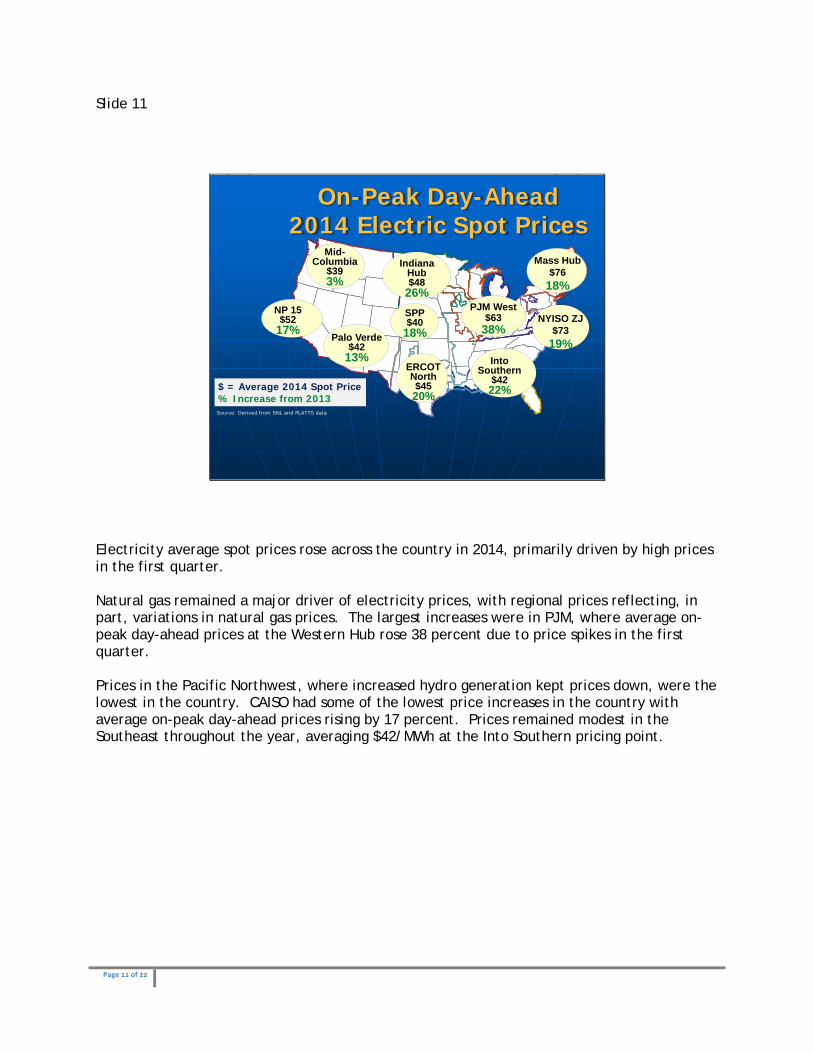
Electricity average spot prices rose across the country in 2014, primarily driven by high prices in the first quarter. Natural gas remained a major driver of electricity prices, with regional prices reflecting, in part, variations in natural gas prices. The largest increases were in PJM, where average on-peak day-ahead prices at the Western Hub rose 38 percent due to price spikes in the first quarter. Prices in the Pacific Northwest, where increased hydro generation kept prices down, were the lowest in the country. CAISO had some of the lowest price increases in the country with average on-peak day-ahead prices rising by 17 percent. Prices remained modest in the Southeast throughout the year, averaging $42/MWh at the Into Southern pricing point.

Page 12 of 22
Slide 12
NG and Renewables Continue to Displace Coal
Source: Derived from Energy Velocity data -10000
-5000
0
5000
10000
15000
20000
Nuclear Coal Gas Wind Solar Oil Total
Net
Cap
acity
Cha
nge
(MW
) 2011201220132014
Nationally, total generating capacity increased 10.8 GW in 2014, compared to a net loss of 3 GW of mostly coal and nuclear units in the year before. Substantial coal retirements began in 2012 and continued into 2014, however the 2014 decrease in net coal capacity was lower than that of the previous two years. Greater coal retirements are expected in 2015, largely due to the April effective date of the Mercury and Air Toxics Standards requirements, with natural gas providing the bulk of capacity replacements given its economic advantage. The largest year-on-year change came from natural gas capacity additions, which rose by 7.7 GW in 2014, compared to a gain of 1.9 GW in 2013. Net wind installed capacity increased by 5 GW in 2014, driven in part by the renewal of the Federal Production Tax Credit. Net utility scale solar capacity additions, which had grown dramatically from 2011-2013, plateaued in 2014 at nearly 4 GW.

Page 13 of 22
Slide 13
Electricity Demand Flat in 2014
Source: Derived from EIA data
800,000
900,000
1,000,000
1,100,000
1,200,000
1,300,000
1,400,000
1,500,000
Ann
ual E
lect
ricity
Sal
es
(Mill
ion
KW
h) ResidentialCommercialIndustrial
Nationally, electricity demand remained flat compared to 2013. Residential and commercial demand rose slightly driven in part by the extreme weather in the first quarter, while industrial demand declined. Energy efficiency measures and growth in behind-the-meter generation, such as rooftop solar, helped moderate the growth in electricity demand at utilities.

Page 14 of 22
Slide 14
2014 Financial Trading of Electricity Products Mixed
Source: Derived from Intercontinental Exchange data
PJMCAISONWISO-NEMISONYISOSWSPP
This pie chart shows all cleared futures traded on the Intercontinental Exchange for power outside ERCOT in 2014. Last year, 96 percent of the financial trading of U.S. electricity products outside ERCOT took place at an RTO hub, up from 92 percent in 2013. Most regions in the country experienced a slight decrease in financial trading volumes compared with 2013 with the exception of the NYISO and PJM. PJM’s financial products continue to be the most traded on ICE, with 73 percent of the total financial trades involving a PJM product, up from 68 percent of 2013.
Page 15 of 22
Slide 15
Financial Liquidity in NG Markets at 5-Year Low
Source: Derived from IntercontinentalExchange data
0
100,000
200,000
300,000
400,000
500,000
600,000
700,000
800,000
2008 2009 2010 2011 2012 2013 2014
Trad
ing
(Bcf
)
Physical Financial
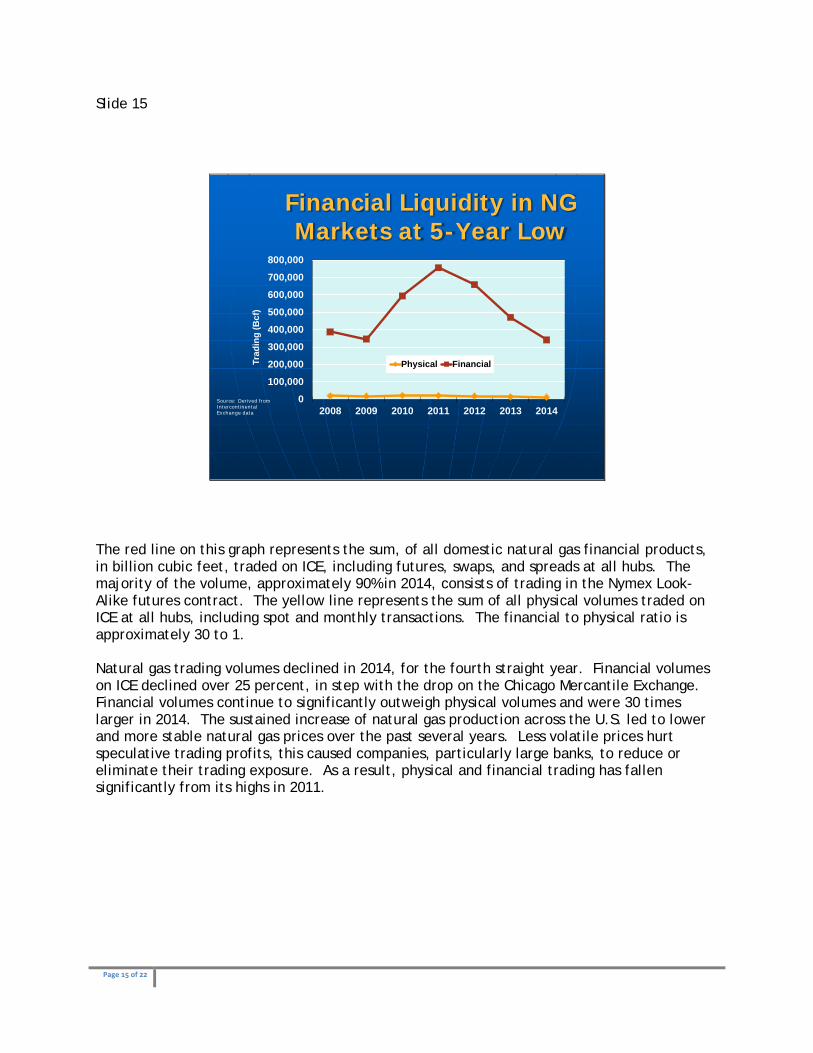
The red line on this graph represents the sum, of all domestic natural gas financial products, in billion cubic feet, traded on ICE, including futures, swaps, and spreads at all hubs. The majority of the volume, approximately 90% in 2014, consists of trading in the Nymex Look-Alike futures contract. The yellow line represents the sum of all physical volumes traded on ICE at all hubs, including spot and monthly transactions. The financial to physical ratio is approximately 30 to 1. Natural gas trading volumes declined in 2014, for the fourth straight year. Financial volumes on ICE declined over 25 percent, in step with the drop on the Chicago Mercantile Exchange. Financial volumes continue to significantly outweigh physical volumes and were 30 times larger in 2014. The sustained increase of natural gas production across the U.S. led to lower and more stable natural gas prices over the past several years. Less volatile prices hurt speculative trading profits, this caused companies, particularly large banks, to reduce or eliminate their trading exposure. As a result, physical and financial trading has fallen significantly from its highs in 2011.
Page 16 of 22
Slide 16
Extreme Weather Tests Energy Markets in 2015
Source: The University of Illinois WW2010 Project
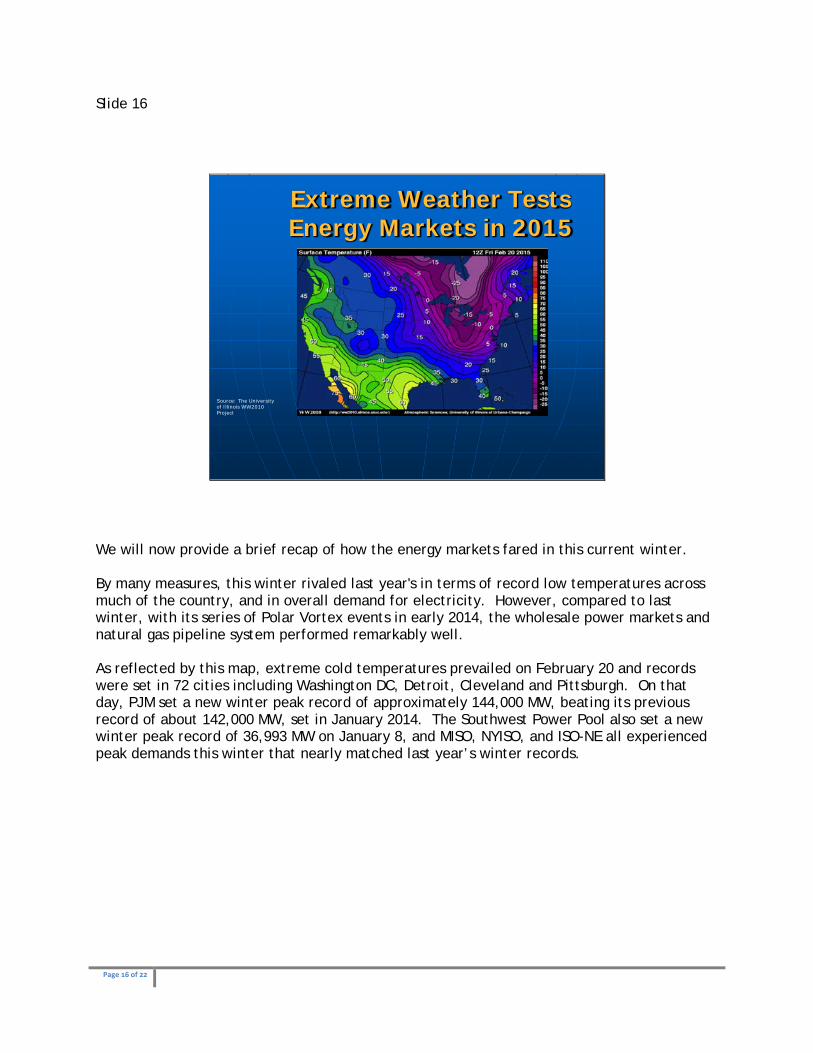
We will now provide a brief recap of how the energy markets fared in this current winter. By many measures, this winter rivaled last year's in terms of record low temperatures across much of the country, and in overall demand for electricity. However, compared to last winter, with its series of Polar Vortex events in early 2014, the wholesale power markets and natural gas pipeline system performed remarkably well. As reflected by this map, extreme cold temperatures prevailed on February 20 and records were set in 72 cities including Washington DC, Detroit, Cleveland and Pittsburgh. On that day, PJM set a new winter peak record of approximately 144,000 MW, beating its previous record of about 142,000 MW, set in January 2014. The Southwest Power Pool also set a new winter peak record of 36,993 MW on January 8, and MISO, NYISO, and ISO-NE all experienced peak demands this winter that nearly matched last year’s winter records.

Page 17 of 22
Slide 17
Market Readiness Moderates Weather Impact
Source: Derived from PJM data
0
5
10
15
20
25
05,000
10,00015,00020,00025,00030,00035,00040,00045,00050,000
1/7/2014 2/20/2015
Forced Outage R
ate (%)Fo
rced
Out
age
(MW
)Forced Outages in PWa
Forced Outage (MW)
Forced Outage Rate
Despite challenging winter conditions, prices in the electricity markets remained moderate, helped by stable natural gas prices and lower forced outage rates. This stands in contrast to last winter, when outage rates were high, price spikes were common, and PJM and NYISO both sought and received authority to waive their $1,000 MWh offer caps to ensure that generators would be able to recover their fuel costs. Last winter, many generators also complained that they were unable to secure sufficient natural gas supplies to operate their plants. Notably, actions taken since last winter by the RTOs and market participants, such as PJM's new Cold Weather Preparation Guidelines and the continuation of ISO-NE's Winter Reliability Program for a second winter, appear to have improved operational performance and the availability of units, which helped to moderate prices. For example, real-time prices at the PJM Western Hub were $400 MWh lower on PJM's peak day this winter, than on last winter's peak day. The drop in real-time prices can also be attributed to an improved forced outage rate, with PJM's outage rate dropping from 22% last winter to 12% this winter. Across the RTOs and ISOs, no significant outages or major operational issues were reported and the bulk electrical system performed well despite changes to the resource supply mix. In particular, ISO-NE, which found itself in a stressed operational state last year, did not experience any significant reliability issues this winter despite the retirement of the Vermont Yankee nuclear station in late December, which removed 615 MW of baseload capacity from the grid.
Page 18 of 22
Slide 18
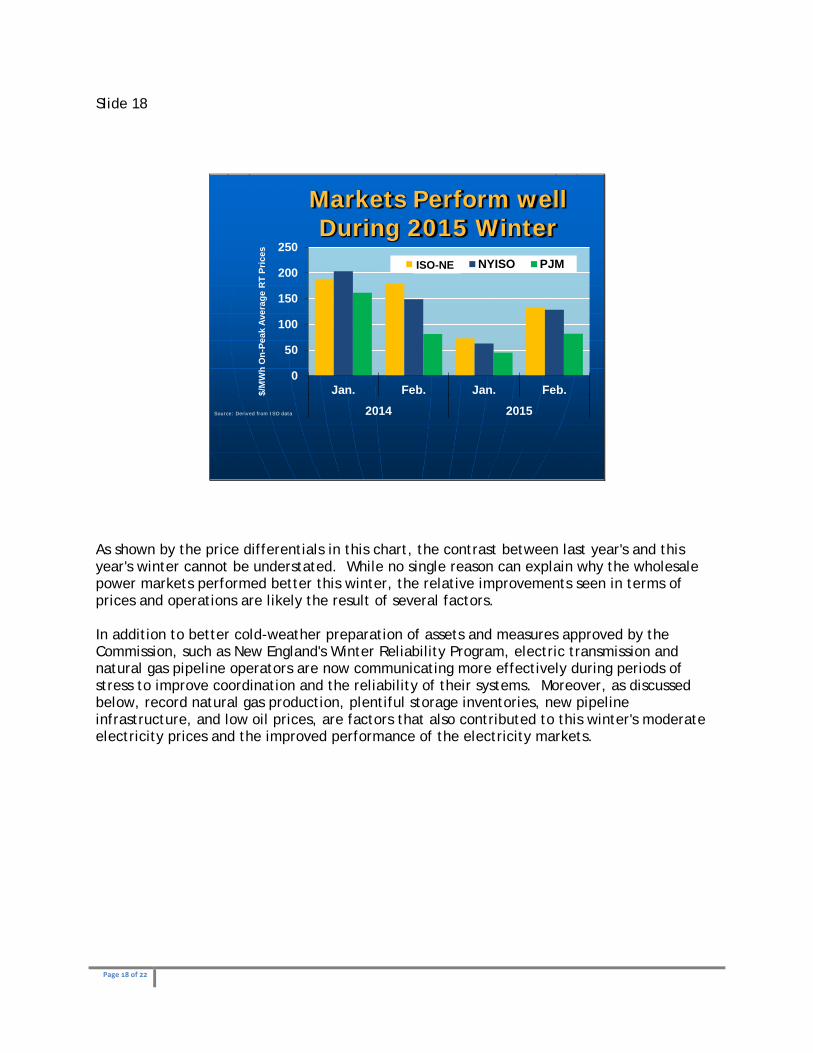
Markets Perform well During 2015 Winter
Source: Derived from ISO data
0
50
100
150
200
250
Jan. Feb. Jan. Feb.
2014 2015
$/M
Wh
On-
Peak
Ave
rage
RT
Pric
esIS0-NE NYISO PJMISO-NEISO-NE
As shown by the price differentials in this chart, the contrast between last year's and this year's winter cannot be understated. While no single reason can explain why the wholesale power markets performed better this winter, the relative improvements seen in terms of prices and operations are likely the result of several factors. In addition to better cold-weather preparation of assets and measures approved by the Commission, such as New England's Winter Reliability Program, electric transmission and natural gas pipeline operators are now communicating more effectively during periods of stress to improve coordination and the reliability of their systems. Moreover, as discussed below, record natural gas production, plentiful storage inventories, new pipeline infrastructure, and low oil prices, are factors that also contributed to this winter's moderate electricity prices and the improved performance of the electricity markets.

Page 19 of 22
Slide 19
2015 Energy Uplift Payments Fall Markedly
Source: Derived from PJM and ISO-NE data
0100200300400500600700800
2014 2015
Tota
l Upl
ift (M
illio
n $)
Uplift for Wanuary and February
PJM ISONEISO-NEISO-NE
This chart highlights the decline in uplift payments made to generators in PJM and ISO-New England between last winter and this winter. These “make whole” payments are made to generators to ensure that they are not running at a loss during critical periods. While uplift is a legitimate cost, this out-of-market compensation is often unpredictable for market participants, particularly load serving entities. In January and February of 2014, PJM collected a record $667 million in uplift charges, which is largely attributed to the high cost of fuel during the midst of the Polar Vortex. However, PJM Uplift charges during the same period in 2015 fell to $105 million, largely because of moderate fuel prices and fewer constraints on the natural gas pipeline system.
Page 20 of 22
Slide 20
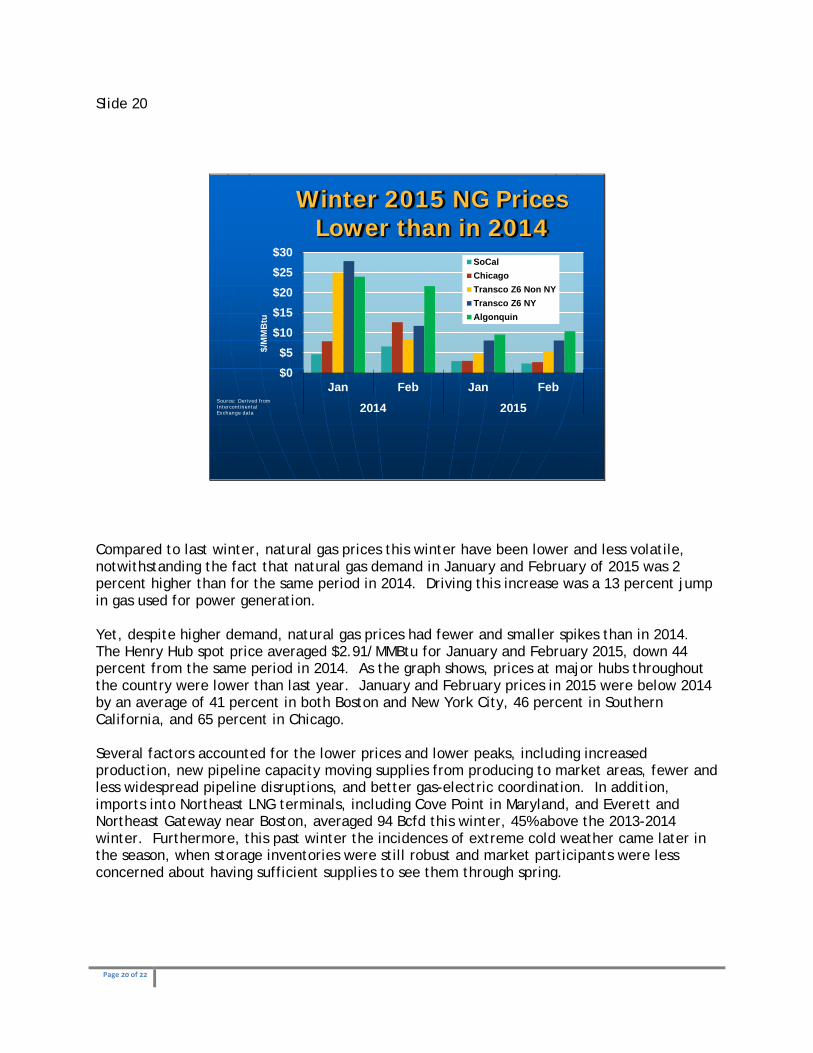
Winter 2015 NG Prices Lower than in 2014
Source: Derived from Intercontinental Exchange data
$0$5
$10$15$20$25$30
Jan Feb Jan Feb
2014 2015
$/M
MB
tuSoCalChicagoTransco Z6 Non NYTransco Z6 NYAlgonquin
Compared to last winter, natural gas prices this winter have been lower and less volatile, notwithstanding the fact that natural gas demand in January and February of 2015 was 2 percent higher than for the same period in 2014. Driving this increase was a 13 percent jump in gas used for power generation. Yet, despite higher demand, natural gas prices had fewer and smaller spikes than in 2014. The Henry Hub spot price averaged $2.91/MMBtu for January and February 2015, down 44 percent from the same period in 2014. As the graph shows, prices at major hubs throughout the country were lower than last year. January and February prices in 2015 were below 2014 by an average of 41 percent in both Boston and New York City, 46 percent in Southern California, and 65 percent in Chicago. Several factors accounted for the lower prices and lower peaks, including increased production, new pipeline capacity moving supplies from producing to market areas, fewer and less widespread pipeline disruptions, and better gas-electric coordination. In addition, imports into Northeast LNG terminals, including Cove Point in Maryland, and Everett and Northeast Gateway near Boston, averaged 94 Bcfd this winter, 45% above the 2013-2014 winter. Furthermore, this past winter the incidences of extreme cold weather came later in the season, when storage inventories were still robust and market participants were less concerned about having sufficient supplies to see them through spring.
Page 21 of 22
Slide 21
Added NG Infrastructure Curbed Winter 2015 Prices
Source: Staff research
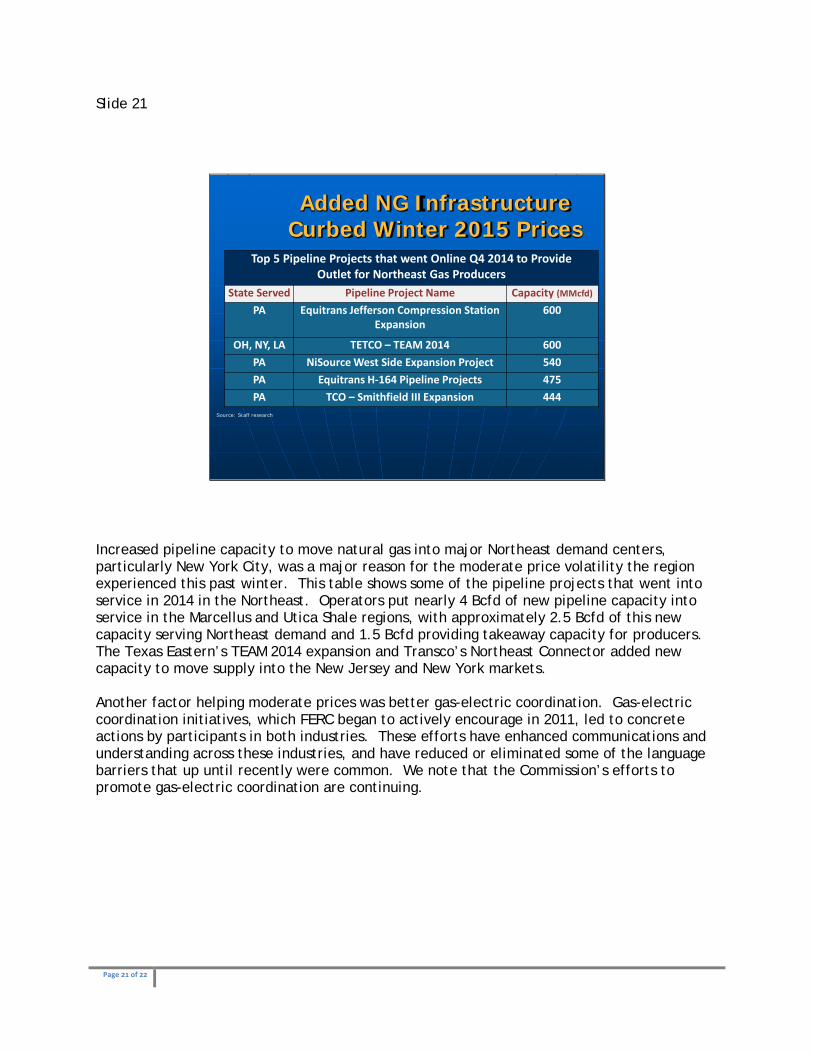
Top 5 Pipeline Projects that went Online Q4 2014 to Provide Outlet for Northeast Gas Producers
State Served Pipeline Project Name Capacity (aacfd)
PA 9quitrans Wefferson Compression Station 9xpansion
600
OI, NY, LA T9TCO – T9Aa 2014 600PA NiSource West Side 9xpansion Project 540PA 9quitrans I-164 Pipeline Projects 475PA TCO – Smithfield III 9xpansion 444
Increased pipeline capacity to move natural gas into major Northeast demand centers, particularly New York City, was a major reason for the moderate price volatility the region experienced this past winter. This table shows some of the pipeline projects that went into service in 2014 in the Northeast. Operators put nearly 4 Bcfd of new pipeline capacity into service in the Marcellus and Utica Shale regions, with approximately 2.5 Bcfd of this new capacity serving Northeast demand and 1.5 Bcfd providing takeaway capacity for producers. The Texas Eastern’s TEAM 2014 expansion and Transco’s Northeast Connector added new capacity to move supply into the New Jersey and New York markets. Another factor helping moderate prices was better gas-electric coordination. Gas-electric coordination initiatives, which FERC began to actively encourage in 2011, led to concrete actions by participants in both industries. These efforts have enhanced communications and understanding across these industries, and have reduced or eliminated some of the language barriers that up until recently were common. We note that the Commission’s efforts to promote gas-electric coordination are continuing.
Page 22 of 22
Slide 22
Item No: A-3March 19, 2015
2014State of the Markets
This concludes staff’s prepared comments. A copy of this presentation will be posted on the Commission’s website. Thank you.