2014 - s1.q4cdn.coms1.q4cdn.com/651804090/files/docs_financial/Annual Report Proxy... · In 2014,...
100
Annual Report 2014
Transcript of 2014 - s1.q4cdn.coms1.q4cdn.com/651804090/files/docs_financial/Annual Report Proxy... · In 2014,...

Annual Report
2014
SHAREHOLDER INFORMATION
ANNUAL GENERAL MEETINGThe annual general meeting of shareholders will be held at InterContinental London Park Lane, One Hamilton Place, Park Lane, London, W1J 7QY, United Kingdom at 8:00 a.m. London time on Monday, 18 May 2015.
TRANSFER AGENTRegistered holders of our shares may direct their questions to Computershare.
Computershare Trust Company, N.A.P.O. Box 43001 Providence, RI 02940-3001Within USA, US territories & Canada: +1 888-926-3470 Outside USA, US territories & Canada: +1 732-491-0636 Fax: +1 781-575-3605Email: [email protected]: Monday through Friday, 8:30 a.m. to 6 p.m. (ET)
CORPORATE GOVERNANCE, BOARD AND BOARD COMMITTEES The corporate governance section of our website, www.enscoplc.com, contains information regarding (i) the composition of our Board of Directors and board committees, (ii) corporate governance in general, (iii) shareholder communications with the Board, (iv) the Ensco Code of Business Conduct Policy, (v) the Ensco Corporate Governance Policy, (vi) Ethics Hotline reporting provisions, and (vii) the charters of the board committees. A direct link to the company’s SEC filings, including reports required under Section 16 of the Securities Exchange Act of 1934, is located in the Investors section. Copies of these documents
may be obtained without charge by contacting Ensco’s Investor
Relations Department. Reasonable expenses will be charged for
copies of exhibits listed in the back of SEC Forms 10-K and 10-Q.
Please list the exhibits you would like to receive and submit your
request in writing to Ensco’s Investor Relations Department at
the address below. We will notify you of the cost and furnish the
requested exhibits upon receipt of payment.
CEO AND CFO CERTIFICATIONSThe Annual CEO Certification pursuant to the New York Stock Exchange (NYSE) Listed Company Manual (Section 303A.12(a)) was filed with the NYSE on 21 May 2014. Additionally, certifications of the CEO and CFO pursuant to Rule 13a-14 or 15d-14 of the Securities Exchange Act of 1934, as adopted pursuant to Section 302 of the Sarbanes-Oxley Act of 2002, were filed with the SEC on 26 February 2015 as exhibits to the Company’s 2014 Form 10-K. All of the aforementioned certifications were fully compliant and without qualification.
ENSCO INVESTOR RELATIONS DEPARTMENT5847 San Felipe, Suite 3300Houston, Texas 77057-3008(713) 789-1400www.enscoplc.com
TABLE OF CONTENTS CEO LETTER TO SHAREHOLDERS CONTRACT DRILLING FLEET SELECTED FINANCIAL DATA MARKET PRICE OF AND DIVIDENDS ON THE REGISTRANT’S COMMON EQUITY AND RELATED SHAREHOLDER MATTERS MANAGEMENT’S DISCUSSION AND ANALYSIS OF FINANCIAL CONDITION AND RESULTS OF OPERATIONS INTRODUCTION BUSINESS ENVIRONMENT RESULTS OF OPERATIONS LIQUIDITY AND CAPITAL RESOURCES MARKET RISK CRITICAL ACCOUNTING POLICIES AND ESTIMATES NEW ACCOUNTING PRONOUNCEMENTS FINANCIAL STATEMENTS AND SUPPLEMENTARY DATA MANAGEMENT’S REPORT ON INTERNAL CONTROL OVER FINANCIAL REPORTING REPORTS OF INDEPENDENT REGISTERED PUBLIC ACCOUNTING FIRM CONSOLIDATED FINANCIAL STATEMENTS CONSOLIDATED STATEMENTS OF OPERATIONS CONSOLIDATED STATEMENTS OF COMPREHENSIVE (LOSS) INCOME CONSOLIDATED BALANCE SHEETS CONSOLIDATED STATEMENTS OF CASH FLOWS NOTES TO CONSOLIDATED FINANCIAL STATEMENTS CHANGES IN AND DISAGREEMENTS WITH ACCOUNTANTS ON ACCOUNTING AND FINANCIAL DISCLOSURE BOARD OF DIRECTORS AND OFFICERS
1
2
4
6
9
10
22
29
30
33
34
35
37
38
39
40
41
91

Dear Fellow Shareholders:
We are in a cyclical business, and this past year we experienced the negative effects of a significant downturn in the offshore drilling sector. Ensco’s loss per share for 2014 was $16.88 compared to earnings of $6.07 per share in 2013. Results for 2014 included non-cash goodwill and asset impairments totaling $5.5 billion, driven by a downcycle that is triggering a sharp falloff in rig utilization and day rates. Adjusted for these non-cash goodwill and asset impairments, Ensco earned $6.30 per diluted share in 2014, up 4% from $6.07 in 2013. Cash flow from operations was $2.1 billion in 2014, a 17% increase from $1.8 billion in 2013.
Challenging Market Conditions
In early 2014, customers began to pull back on capital expenditures in an effort to improve their financial returns. Then mid-year, commodity prices started to decline. Brent oil prices ultimately fell by more than half toward year end – just as customers were completing their annual budgets. This culminated in announcements of major spending cuts by most of our customers. Declining demand for offshore drilling services is being exacerbated by an oversupply of rigs as newbuilds continue to enter the market, although rig retirements are offsetting a portion of this new supply.
Decisive Actions
Given this challenging environment, we have taken decisive steps to improve capital management flexibility, restructure our fleet and reduce expenses. Together, these actions are designed to bolster our financial position and further improve our competitiveness as we navigate through this downturn and position Ensco for a future upcycle.
During 2014, we raised $1.25 billion of long-term debt and increased our revolving credit facility to $2.25 billion with a five-year term. The goal: increase liquidity and finance a portion of nearly $3 billion of scheduled capital expenditures over the next two years.
In early 2015, as market conditions further deteriorated, we raised $1.1 billion of long-term debt to retire a similar amount of mostly near-term maturities. We also reduced our quarterly dividend per share to $0.15 from the previous level of $0.75. While we are mindful that not all shareholders agree with this decision, we believe it is appropriate given current market realities. Both Moody’s Investors Service and Standard & Poor’s Rating Services reaffirmed Ensco’s investment-grade credit ratings following these prudent steps to further reinforce our financial position. At year-end 2014, Ensco had nearly $10 billion of contracted revenue backlog.
We have also taken steps to highgrade our fleet. Three new ENSCO 120 Series jackups commenced their initial drilling programs in the North Sea during 2014 with excellent uptime performance. Our latest-generation drillships, ENSCO DS-8 and ENSCO DS-9, were awarded initial multi-year contracts last year with major customers and are scheduled to commence operations in fourth quarter 2015. These dynamically-positioned drillships offer versatile and multi-functional capabilities designed to provide customers greater operating efficiencies. Major upgrades completed recently for three floaters also enhanced our fleet. All three have commenced contracts for work during 2015.
We also highgrade the fleet by divesting older assets. Eight rigs have been sold since the beginning of 2014, and a similar number are currently held for sale and included in discontinued operations. Retiring rigs not only high-grades our go-forward fleet but also significantly reduces operating costs. Certain uncontracted rigs in continuing operations are also being cold stacked to reduce expenses until conditions improve. Given the smaller number of rigs now in our marketed fleet, we also reduced our onshore workforce by approximately 15% in first quarter 2015, which will translate into annual savings of $27 million beginning in second quarter 2015. Discretionary compensation has also been reduced, and we expect that unit labor costs for offshore crews will decline approximately 9% compared to last year starting in second quarter 2015. We regret the need to lay off employees,

but we believe these actions are necessary given the realities of the current marketplace. Other cost-saving measures we are taking include negotiations with vendors and suppliers to reduce expenses and improve quality.
Despite market headwinds last year, we are proud of several key accomplishments. Namely, we improved our total recordable incident rate even further and increased rig uptime performance. This contributed to Ensco earning the #1 customer satisfaction rating for the fifth consecutive year in an independent survey conducted by EnergyPoint Research.
Safety
In 2014, we achieved our best ever total recordable incident rate (TRIR) – an industry safety metric. Our TRIR of 0.35 was a 10% improvement from our previous record and approximately 35% better than the industry average. In fact, several of our rigs achieved impressive safety milestones including ENSCO 94, which surpassed 10 years without a recordable incident.
Ensco is committed to achieving a zero-incident workplace, and we will continue to invest in systems and training programs to ensure a safe working environment for employees and customers. During 2014 alone, more than 1,200 employees completed advanced safety training including our Safety Leadership Development Program and Supervisory Safety Training Program. Additionally, all of our offshore employees are required to complete
IADC accredited Competency Assurance Program. Our pursuit of a zero-incident workplace resulted in a #1 rating for health, safety and environment in the EnergyPoint Research survey.
Operational Excellence
Despite challenging market conditions in 2014, we further improved our full-year operational utilization to 95%. Our jackups achieved 99% operational utilization while floaters increased to 93% from the prior year. Operational utilization adjusts for uncontracted rig days and planned downtime, such as rig upgrades and surveys that are included in reported utilization. As noted above, three ENSCO 120 jackups joined the active fleet during the past year, contributing to the outstanding uptime performance of our jackup fleet.
Strong operational performance led to several new multi-year contracts signed in 2014. New jackup contracts included a three-year term for ENSCO 109 in Angola; three-year extensions for four jackups in the Middle East; and a three-year extension for ENSCO 52 in the Asia Pacific region.
On the floater side, ENSCO 8503 was contracted for a multi-year program with a repeat customer in the U.S. Gulf of Mexico. The semisubmersible, which will have the ability to operate in a dynamically-positioned or moored capacity following an upgrade project in 2015, addresses the customer’s need to drill in both deep- and mid-water depths. ENSCO 8503 also holds the record for the deepest well ever drilled in this basin.
Service Quality and Customer Satisfaction
Success for customers is a core value for Ensco, and we are committed to delivering the highest levels of service quality and operational excellence. Therefore, we are pleased that for the fifth consecutive year, Ensco earned top honors among offshore drillers in terms of customer satisfaction in the annual survey by EnergyPoint Research. We ranked first place in 10 of 16 categories including total customer satisfaction; health, safety and environment; technology; deepwater drilling; harsh climate applications; shelf wells; horizontal and directional wells; and special applications. Ensco also rated first in the North Sea, Latin America and Mexico. This recognition is a reflection of our operating processes and the exceptional service our offshore crews and onshore personnel provide to customers.
Remembering Carl Thorne
Earlier this year, we received sad news that Carl Thorne, Ensco’s founding Chairman and CEO, passed away. More than 27 years ago, Carl took on the challenge of starting a new drilling company in the midst of a downturn, similar

to the one we are experiencing today. From just a handful of rigs, he grew Ensco into a multi-billion dollar S&P 500 company through his leadership, entrepreneurial spirit and commitment to our core values.
Mr. Thorne was proud of Ensco’s many achievements including our first-place award received during 2014 for leadership in corporate governance among international companies. The award is a positive reflection of how we live up to our core value of ethical behavior in all of our business practices – something Mr. Thorne advocated from day one.
Dan Rabun Retirement
Mr. Thorne was succeeded by Dan Rabun, who will be retiring as Chairman of the Board at the Annual Shareholders Meeting in May 2015. Paul Rowsey, a long-time board member and currently our lead director, is expected to succeed Dan as Chairman.
During Dan’s tenure, Ensco significantly improved its safety performance consistently outperforming industry averages. He reinforced Ensco’s vision and core values and oversaw billion dollar investments to renew our fleet and advance the skills of our people. We thank Dan for his diligent leadership over eight years as Chairman and CEO, and we wish him well in retirement.
Looking Ahead
When I joined Ensco in June of last year, the market was entering the current downturn, but I felt at the time, and continue to believe, that the company’s strong operating culture and steadfast commitment to its vision and core values will enable us to successfully navigate this market downcycle.
During 2014, we promoted several executives: Carey Lowe to Executive Vice President, David Hensel to Senior Vice President – Marketing, Gilles Luca to Senior Vice President – Western Hemisphere, Steve Brady to Senior Vice President – Eastern Hemisphere and Maria Clara Silva to Vice President – Human Resources. Ensco has a deep bench of talented senior managers, and these promotions enhance our leadership team that will guide us through this downturn. Most importantly, I want to acknowledge our dedicated employees who continue to go beyond expectations every day, even as we confront more challenging market conditions. I also thank our Board of Directors for their counsel and support.
We have much work ahead of us. Five of seven rigs now under construction must earn contracts, and all must be successfully delivered from their respective shipyards in Asia and the Middle East. Our marketing teams will be busy with customers to contract these rigs and identify new opportunities for rigs rolling off contract. This will be challenging, but the specification of these rigs and our operational leadership gives us an advantage over other drillers.
The current market downcycle will be difficult, but we have already taken major steps to position ourselves for the future. We are well prepared, and we are up to the challenge.
Sincerely,
Carl Trowell
CEO & President 19 March 2015
Forward-Looking Statements
Statements contained in this Annual Report that are not historical facts are forward-looking statements within the meaning of Section 27A of the Securities Act of 1933 and Section 21E of the Securities Exchange Act of 1934. Forward-looking statements include words or phrases such as “anticipate,” “believe,” “estimate,” “expect,” “intend,” “plan,” “project,” “could,” “may,” “might,” “should,” “will” and similar words and specifically include statements regarding expected financial performance and return of capital, effective tax rate, day rates and backlog; the timing of delivery, mobilization, contract commencement, relocation or other movement of rigs; and general market, business and industry conditions, trends and outlook. Such statements are subject to numerous risks, uncertainties and assumptions that may cause actual results to vary materially from those indicated, including commodity price fluctuations, customer demand, new rig supply, downtime and other risks associated with offshore rig operations, relocations, severe weather or hurricanes; changes in worldwide rig supply and demand, competition and technology; future levels of offshore drilling activity; governmental action, civil unrest and political and economic uncertainties; terrorism, piracy and military action; risks inherent to shipyard rig construction, repair, maintenance or enhancement; possible cancellation or suspension of drilling contracts as a result of mechanical difficulties, performance, customer finances, the decline or the perceived risk of a further decline in oil and/or natural gas prices, or other reasons; the outcome of litigation, legal proceedings, investigations or other claims or contract disputes; governmental regulatory, legislative and permitting requirements affecting drilling operations; our ability to attract and retain skilled personnel on commercially reasonable terms; environmental or other liabilities, risks or losses; debt restrictions that may limit our liquidity and flexibility; our ability to realize the expected benefits from our redomestication and actual contract commencement dates; cybersecurity risks and threats; and the occurrence or threat of epidemic or pandemic diseases or any governmental response to such occurrence or threat. In addition to the numerous factors described above, you should also carefully read and consider “Item 1A. Risk Factors” in Part I and “Item 7 and Management’s Discussion and Analysis of Financial Condition and Results of Operations” in Part II of our most recent annual report on Form 10-K, as updated in our subsequent quarterly reports on Form 10-Q, which are available on the SEC’s website at www.sec.gov or on the Investor Relations section of our website at www.enscoplc.com. Each forward-looking statement speaks only as of the date of the particular statement, and we undertake no obligation to publicly update or revise any forward-looking statements, except as required by law.
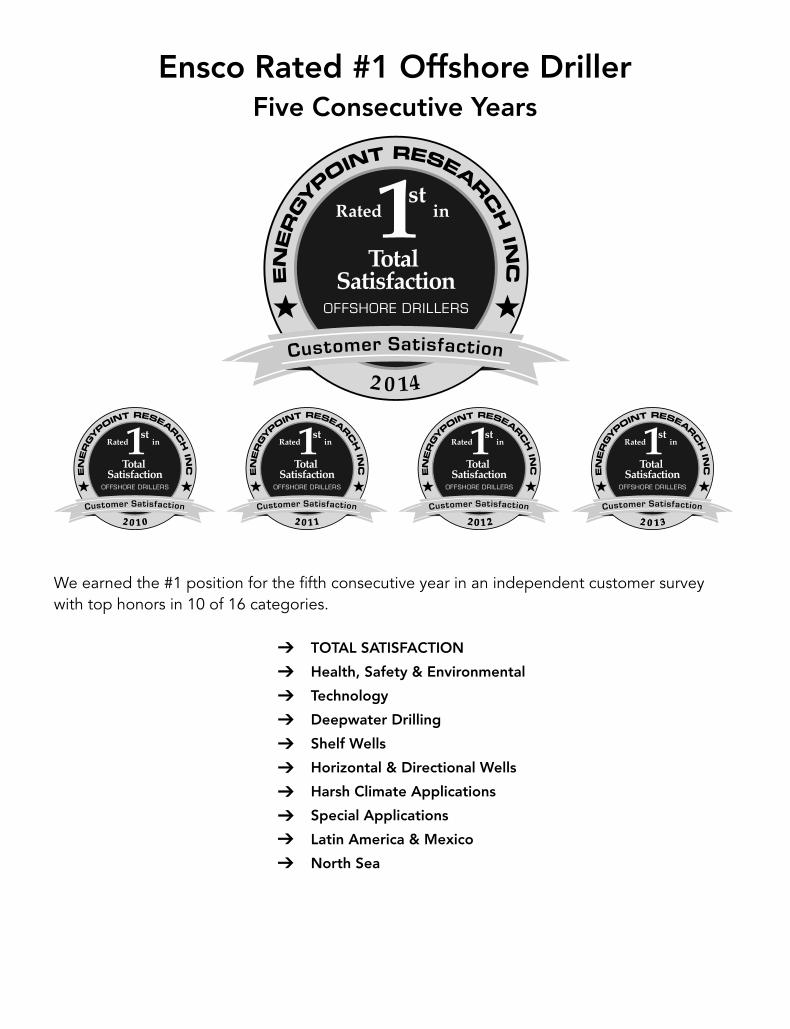
Ensco Rated #1 Offshore Driller Five Consecutive Years
TOTAL SATISFACTION
Health, Safety & Environmental
Technology
Deepwater Drilling
Shelf Wells
Horizontal & Directional Wells
Harsh Climate Applications
Special Applications
Latin America & Mexico
North Sea
We earned the #1 position for the fifth consecutive year in an independent customer survey with top honors in 10 of 16 categories.

1
The following table provides certain information about the rigs in our drilling fleet by reportable segment as of March 2, 2015:
Rig Name Rig Type Year Built/
Rebuilt Design
Maximum Water Depth/ Drilling Depth Location Customer
Floaters ENSCO DS-1 Drillship 1999/2012 Dynamically Positioned 6,000'/30,000' Angola TOTALENSCO DS-2 Drillship 1999 Dynamically Positioned 6,000'/30,000' Spain Stacking preparationsENSCO DS-3 Drillship 2010 Dynamically Positioned 10,000'/40,000' Gulf of Mexico BP ENSCO DS-4 Drillship 2010 Dynamically Positioned 10,000'/40,000' Gulf of Mexico BP ENSCO DS-5 Drillship 2011 Dynamically Positioned 10,000'/40,000' Gulf of Mexico Petrobras/Murphy ENSCO DS-6 Drillship 2012 Dynamically Positioned 10,000'/40,000' Angola BPENSCO DS-7 Drillship 2013 Dynamically Positioned 10,000'/40,000' Angola TOTALENSCO DS-8 Drillship(1) 2015 Dynamically Positioned 10,000'/40,000' South Korea Under construction(3) ENSCO DS-9 Drillship(1) 2015 Dynamically Positioned 10,000'/40,000' South Korea Under construction(3) ENSCO DS-10 Drillship(2) 2015 Dynamically Positioned 10,000'/40,000' South Korea Under construction(3) ENSCO 5001 Semisubmersible 1977/1999/2009 Sonat 5,000'/25,000' Malaysia Cold stackedENSCO 5002 Semisubmersible 1975/2001 Aker H-3 1,000'/25,000' Singapore Cold stacked ENSCO 5004 Semisubmersible 1982/2001/2014 F&G Enhanced Pacesetter 1,500'/25,000' Mediterranean Mellitah
ENSCO 5005 Semisubmersible 1982/2014 F&G Enhanced Pacesetter 1,500'/25,000' Myanmar PTTEP ENSCO 5006 Semisubmersible 1999/2014 Bingo 8000 6,200'/25,000' Australia Inpex
ENSCO 6000 Semisubmersible 1987/1996 Dynamically Positioned 3,400'/12,000' Spain Cold stackedENSCO 6001 Semisubmersible 2000/2010/2014 Megathyst 5,700'/25,000' Brazil PetrobrasENSCO 6002 Semisubmersible 2001/2009 Megathyst 5,700'/25,000' Brazil PetrobrasENSCO 6003 Semisubmersible 2004 Megathyst 5,700'/25,000' Brazil PetrobrasENSCO 6004 Semisubmersible 2004 Megathyst 5,700'/25,000' Brazil PetrobrasENSCO 7500 Semisubmersible 2000 Dynamically Positioned 8,000'/30,000' Spain Cold stackedENSCO 8500 Semisubmersible 2008 Dynamically Positioned 8,500'/35,000' Gulf of Mexico Anadarko/Eni ENSCO 8501 Semisubmersible 2009 Dynamically Positioned 8,500'/35,000' Gulf of Mexico Not contracted ENSCO 8502 Semisubmersible 2010/2012 Dynamically Positioned 8,500'/35,000' Gulf of Mexico Talos ENSCO 8503 Semisubmersible 2010 Dynamically Positioned 8,500'/35,000' Gulf of Mexico LLOG ENSCO 8504 Semisubmersible 2011 Dynamically Positioned 8,500'/35,000' Malaysia ShellENSCO 8505 Semisubmersible 2012 Dynamically Positioned 8,500'/35,000' Gulf of Mexico Deep Gulf Energy ENSCO 8506 Semisubmersible 2012 Dynamically Positioned 8,500'/35,000' Gulf of Mexico Anadarko
Jackups
ENSCO 52 Jackup 1983/1997/2013 F&G L-780 MOD II-C 300'/25,000' Malaysia MurphyENSCO 53 Jackup 1982/2009 F&G L-780 MOD II-C 300'/25,000' UAE NDCENSCO 54 Jackup 1982/1997/2014 F&G L-780 MOD II-C 300'/25,000' Saudi Arabia Saudi Aramco ENSCO 56 Jackup 1982/1997 F&G L-780 MOD II-C 300'/25,000' Indonesia Pertamina ENSCO 58 Jackup 1981/2002 F&G L-780 MOD II 250'/30,000' Saudi Arabia Stacking preparations ENSCO 67 Jackup 1976/2005 MLT 84-CE 400'/30,000' Indonesia Pertamina ENSCO 68 Jackup 1976/2004 MLT 84-CE 400'/30,000' Gulf of Mexico Chevron ENSCO 70 Jackup 1981/1996/2014 Hitachi K1032N 250'/30,000 United Kingdom Not contracted ENSCO 71 Jackup 1982/1995/2012 Hitachi K1032N 225'/25,000' Denmark Maersk ENSCO 72 Jackup 1981/1996 Hitachi K1025N 225'/25,000' Denmark Maersk

2
Rig Name Rig Type Year Built/
Rebuilt Design
Maximum Water Depth/ Drilling Depth Location Customer
Jackups ENSCO 75 Jackup 1999 MLT Super 116-C 400'/30,000' Gulf of Mexico Talos ENSCO 76 Jackup 2000 MLT Super 116-C 400'/30,000' Saudi Arabia Saudi Aramco ENSCO 80 Jackup 1978/1995 MLT 116-CE 225'/30,000' United Kingdom GDF ENSCO 81 Jackup 1979/2003 MLT 116-C 350'/30,000' Gulf of Mexico Stacking preparations ENSCO 82 Jackup 1979/2003 MLT 116-C 300'/30,000' Gulf of Mexico Stacking preparations ENSCO 84 Jackup 1981/2005/2012 MLT 82-SD-C 250'/25,000' Saudi Arabia Saudi Aramco ENSCO 86 Jackup 1981/2006 MLT 82-SD-C 250'/30,000' Gulf of Mexico Century ENSCO 87 Jackup 1982/2006 MLT 116-C 350'/25,000' Gulf of Mexico Fieldwood ENSCO 88 Jackup 1982/2004/2014 MLT 82-SD-C 250'/25,000' Saudi Arabia Saudi Aramco ENSCO 90 Jackup 1982/2002 MLT 82-SD-C 250'/25,000' Gulf of Mexico Cold stacked ENSCO 91 Jackup 1980/2001/2012 Hitachi Zosen 270'/20,000' Saudi Arabia Saudi Aramco ENSCO 92 Jackup 1982/1996 MLT 116-C 225'/25,000' United Kingdom ConocoPhillips ENSCO 94 Jackup 1981/2001/2013 Hitachi 250-C 250'/25,000' Saudi Arabia Saudi Aramco ENSCO 96 Jackup 1982/1997/2012 Hitachi 250-C 250'/25,000' Saudi Arabia Saudi Aramco ENSCO 97 Jackup 1980/1997/2012 MLT 82 SD-C 250'/25,000' Saudi Arabia Saudi Aramco ENSCO 99 Jackup 1985/2005 MLT 82 SD-C 250'/30,000' Gulf of Mexico Stacking preparations ENSCO 100 Jackup 1987/2009 MLT 150-88-C 350'/30,000 United Kingdom Ithaca ENSCO 101 Jackup 2000 KELFS MOD V-A 400'/30,000' United Kingdom Shipyard/BP ENSCO 102 Jackup 2002 KELFS MOD V-A 400'/30,000' United Kingdom ConocoPhillips ENSCO 104 Jackup 2002 KELFS MOD V-B 350'/30,000' Myanmar PVEP ENSCO 105 Jackup 2002 KELFS MOD V-B 400'/30,000' China ShellENSCO 106 Jackup 2005 KELFS MOD V-B 400'/30,000' Malaysia CPOCENSCO 107 Jackup 2006 KELFS MOD V-B 400'/30,000' New Zealand OMV ENSCO 108 Jackup 2007 KELFS MOD V-B 400'/30,000' Thailand PTTEPENSCO 109 Jackup 2008 KELFS MOD V-Super B 350'/35,000' Angola ChevronENSCO 110 Jackup(2) 2015 KELFS MOD V-B 400'/30,000' Singapore Under construction(3) ENSCO 120 Jackup 2013 KFELS Super A 400'/40,000' United Kingdom Nexen ENSCO 121 Jackup 2013 KFELS Super A 400'/40,000' Netherlands Wintershall ENSCO 122 Jackup 2014 KFELS Super A 400'/40,000' United Kingdom NAM ENSCO 123 Jackup(2) 2016 KFELS Super A 400'/40,000' Singapore Under construction(3) ENSCO 140 Jackup(2) 2016 Cameron Letourneau Super
116E 400'/30,000' Dubai Under construction(3)
ENSCO 141 Jackup(2) 2016 Cameron Letourneau Super 116E
400'/30,000' Dubai Under construction(3)
(1) ENSCO DS-9 is currently scheduled for delivery during the first quarter of 2015 and is committed under a long-term contract in the U.S. Gulf of Mexico. ENSCO DS-8 is currently scheduled for delivery during the second quarter of 2015 and is committed under a long-term contract in Angola.
(2) We currently are marketing ENSCO DS-10, ENSCO 110, ENSCO 123, ENSCO 140 and ENSCO 141. For additional information on our rigs under construction, see "Management's Discussion and Analysis of Financial Condition and Results of Operations."
(3) Rig currently is under construction. The "year built" provided is based on the current construction schedule.
Selected Financial Data
The financial data below should be read in conjunction with "Management's Discussion and Analysis of Financial Condition and Results of Operations" and our consolidated financial statements and notes thereto included in "Financial Statements and Supplementary Data."

3
Year Ended December 31, 2014 2013 2012 2011(1) 2010
(in millions, except per share amounts) Consolidated Statement of Operations Data Revenues $ 4,564.5 $ 4,323.4 $ 3,638.8 $ 2,443.2 $ 1,384.7Operating expenses
Contract drilling (exclusive of depreciation) 2,076.9 1,947.1 1,642.8 1,218.3 632.6Loss on impairment 4,218.7 — — — —Depreciation 537.9 496.2 443.8 334.9 189.5General and administrative 131.9 146.8 148.9 158.6 86.1
Operating (loss) income (2,400.9) 1,733.3 1,403.3 731.4 476.5Other (expense) income, net (147.9) (100.1) (98.6) (57.9) 18.2Provision for income taxes 140.5 203.1 228.6 105.6 93.9(Loss) income from continuing operations (2,689.3) 1,430.1 1,076.1 567.9 400.8(Loss) income from discontinued operations, net(2) (1,199.2) (2.2) 100.6 37.7 185.1Net (loss) income (3,888.5) 1,427.9 1,176.7 605.6 585.9Net income attributable to noncontrolling interests (14.1) (9.7) (7.0) (5.2) (6.4)Net (loss) income attributable to Ensco $ (3,902.6) $ 1,418.2 $ 1,169.7 $ 600.4 $ 579.5(Loss) earnings per share – basic
Continuing operations $ (11.70) $ 6.09 $ 4.62 $ 2.90 $ 2.76Discontinued operations (5.18) (0.01) 0.43 0.19 1.30
$ (16.88) $ 6.08 $ 5.05 $ 3.09 $ 4.06(Loss) earnings per share - diluted
Continuing operations $ (11.70) $ 6.08 $ 4.61 $ 2.89 $ 2.76Discontinued operations (5.18) (0.01) 0.43 0.19 1.30
$ (16.88) $ 6.07 $ 5.04 $ 3.08 $ 4.06Net (loss) income attributable to Ensco shares -Basic and Diluted $ (3,910.5) $ 1,403.1 $ 1,157.4 $ 593.5 $ 572.1Weighted-average shares outstanding
Basic 231.6 230.9 229.4 192.2 141.0Diluted 231.6 231.1 229.7 192.6 141.0
Cash dividends per share $ 3.00 $ 2.25 $ 1.50 $ 1.40 $ 1.08
Consolidated Balance Sheet (as of period end) and Cash Flow Statement Data Working capital $ 1,830.2 $ 487.9 $ 734.2 $ 348.7 $ 1,087.7Total assets 16,059.9 19,472.9 18,565.3 17,898.8 7,051.5Long-term debt, net of current portion 5,885.6 4,718.9 4,798.4 4,877.6 240.1Ensco shareholders' equity 8,215.0 12,791.6 11,846.4 10,879.3 5,959.5Cash flows from operating activities of continuing operations 2,057.9 1,811.2 1,954.6 659.8 637.1
(1) Includes the results of Pride International, Inc. ("Pride") from May 31, 2011, the date of the Pride acquisition.
(2) See Note 10 to our consolidated financial statements included in "Financial Statements and Supplementary Data" for information on discontinued operations.

4
Market Price of and Dividends on the Registrant's Common Equity and Related Shareholder Matters
Market Information
The following table provides the high and low sales price of our Class A ordinary share, par value U.S. $0.10 per share, for each period indicated during the last two fiscal years:
First
Quarter Second Quarter
Third Quarter
Fourth Quarter Year
2014 High $ 57.45 $ 55.89 $ 55.74 $ 41.99 $ 57.452014 Low $ 47.85 $ 48.53 $ 40.91 $ 25.88 $ 25.88
2013 High $ 65.82 $ 64.14 $ 61.96 $ 62.25 $ 65.822013 Low $ 56.78 $ 51.01 $ 53.64 $ 53.49 $ 51.01
Our Class A ordinary shares are traded on the NYSE under the ticker symbol "ESV." Many of our shareholders hold shares electronically, all of which are owned by a nominee of The Depository Trust Company. We had 75 shareholders of record on February 1, 2015.
Dividends
The following table provides the quarterly cash dividend per share declared and paid during the last two fiscal years:
First
Quarter Second Quarter
Third Quarter
Fourth Quarter Year
2014 $ .75 $ .75 $ .75 $ .75 $ 3.002013 $ .50 $ .50 $ .50 $ .75 $ 2.25
To improve capital management flexibility in light of market conditions, our Board of Directors declared a $0.15 quarterly cash dividend per Class A ordinary share for the first quarter of 2015, a $0.60 reduction from the prior level. Dividend payments are subject to approval by our Board of Directors and could change in future periods. When evaluating dividend payment timing and amounts, our Board of Directors considers several factors, including our profitability, liquidity, financial condition, reinvestment opportunities and capital requirements.
5
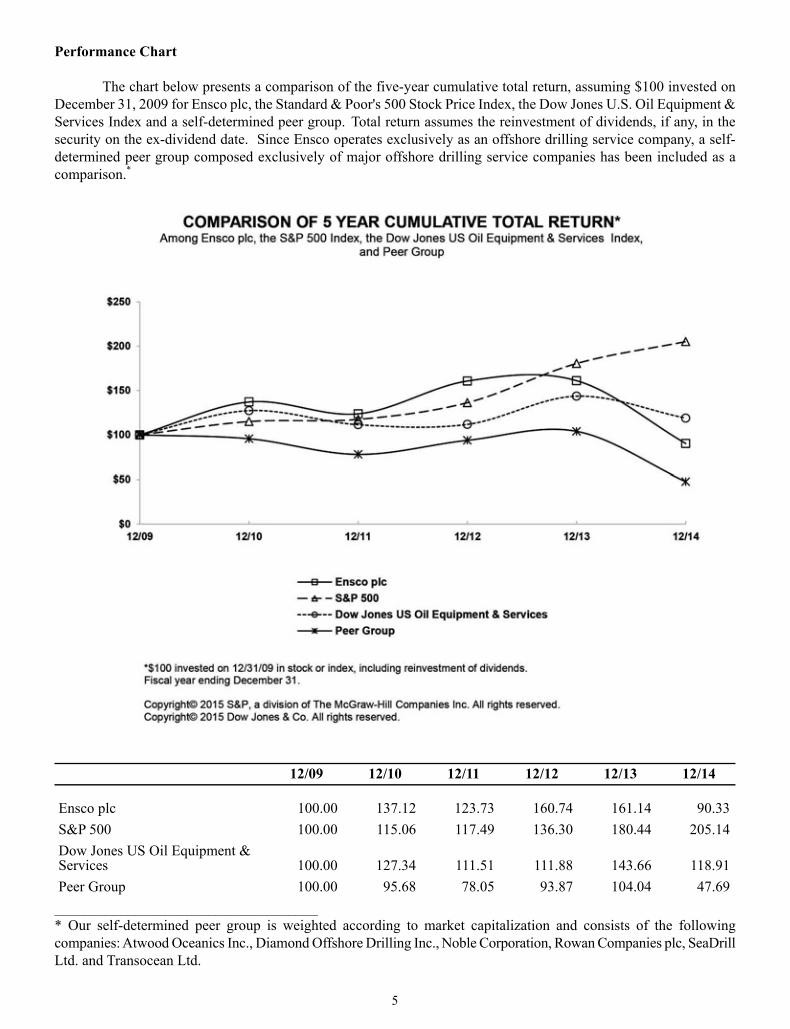
Performance Chart
The chart below presents a comparison of the five-year cumulative total return, assuming $100 invested on December 31, 2009 for Ensco plc, the Standard & Poor's 500 Stock Price Index, the Dow Jones U.S. Oil Equipment & Services Index and a self-determined peer group. Total return assumes the reinvestment of dividends, if any, in the security on the ex-dividend date. Since Ensco operates exclusively as an offshore drilling service company, a self-determined peer group composed exclusively of major offshore drilling service companies has been included as a comparison.*
12/09 12/10 12/11 12/12 12/13 12/14
Ensco plc 100.00 137.12 123.73 160.74 161.14 90.33S&P 500 100.00 115.06 117.49 136.30 180.44 205.14Dow Jones US Oil Equipment & Services 100.00 127.34 111.51 111.88 143.66 118.91Peer Group 100.00 95.68 78.05 93.87 104.04 47.69
____________________________________ * Our self-determined peer group is weighted according to market capitalization and consists of the followingcompanies: Atwood Oceanics Inc., Diamond Offshore Drilling Inc., Noble Corporation, Rowan Companies plc, SeaDrill Ltd. and Transocean Ltd.

6
Management's Discussion and Analysis of Financial Condition and Results of Operations
INTRODUCTION
Our Business
We are one of the leading providers of offshore contract drilling services to the international oil and gas industry. We currently own and operate an offshore drilling rig fleet of 70 rigs, including seven rigs currently under construction, with drilling operations in most of the strategic markets around the globe. Our rig fleet includes ten drillships, 13 dynamically positioned semisubmersible rigs, five moored semisubmersible rigs and 42 jackup rigs. Our fleet is the world's second largest amongst competitive rigs, our ultra-deepwater fleet is one of the newest in the industry, and our premium jackup fleet is the largest of any offshore drilling company.
Our customers include many of the leading national and international oil companies, in addition to many independent operators. We are among the most geographically diverse offshore drilling companies, with current operations and drilling contracts spanning approximately 20 countries on six continents in nearly every major offshore basin around the world. The markets in which we operate include Australia, Brazil, the Mediterranean, Mexico, the Middle East, the North Sea, Southeast Asia, the U.S. Gulf of Mexico and West Africa.
We provide drilling services on a "day rate" contract basis. Under day rate contracts, we provide a drilling rig and rig crews and receive a fixed amount per day for each day we are performing drilling or related services. Our customers bear substantially all of the ancillary costs of constructing the well and supporting drilling operations, as well as the economic risk relative to the success of the well. In addition, our customers may pay all or a portion of the cost of moving our equipment and personnel to and from the well site. We do not provide "turnkey" or other risk-based drilling services.
Our Industry
Operating results in the offshore contract drilling industry are cyclical and directly related to the demand for drilling rigs and the available supply of drilling rigs. While the cost of moving a rig and the availability of rig-moving vessels may cause the balance of supply and demand to vary somewhat between regions, significant variations between regions are generally of a short-term nature due to rig mobility.
Drilling Rig Demand
Demand for drilling rigs is directly related to the regional and worldwide levels of offshore exploration and development spending by oil and gas companies, which is beyond our control. The markets for our contract drilling services are cyclical. Offshore exploration and development spending may fluctuate substantially from year-to-year and from region-to-region. Such spending fluctuations result from many factors, including:
• oil and natural gas supply and demand,
• regional and global economic conditions and changes therein,
• political, social and legislative environments in major oil-producing countries,
• production and inventory levels and related activities of the Organization of Petroleum Exporting Countries ("OPEC") and other oil and natural gas producers,
• capital allocation decisions by our customers, including the relative economics of offshore developmentversus onshore prospects,
• technological advancements that impact the methods or cost of oil and natural gas exploration anddevelopment,

7
• disruption to exploration and development activities due to hurricanes and other severe weather conditions and the risk thereof, and
• the impact that these and other events, whether caused by economic conditions, international or nationalclimate change regulations or other factors, may have on current and expected future oil and natural gasprices.
Recent changes in the offshore drilling market have led to a highly competitive contracting environment. Since October 1, 2014, the Brent crude oil price has declined from approximately $95 per barrel to approximately $60 per barrel on February 23, 2015. Operators have announced significant declines in capital spending in their 2015 budgets, including the cancellation or deferral of existing programs. These declines in capital spending levels, coupled with additional newbuild supply, have put significant pressure on day rates and utilization.
We expect that 2015 will be a challenging year for drilling contractors as customers wait to gain additional clarity on commodity pricing and seek to reduce costs in the near-term by attempting to sub-let contracted rig time and re-negotiate existing contract terms. We believe the current market dynamics will create a challenging contracting environment into 2016.
Since most factors that affect offshore exploration and development spending are beyond our control and because rig demand can change quickly, it is difficult for us to predict future industry conditions, demand trends or future operating results. Periods of low rig demand often result in excess rig supply, which generally results in reductions in utilization and day rates; conversely, periods of high rig demand often result in a shortage of rigs, which generally results in increased utilization and day rates.
Drilling Rig Supply
During the current newbuild cycle, various industry participants ordered the construction of 360 new drillships, semisubmersible rigs and jackup rigs, approximately160 of which were delivered during the last three years.
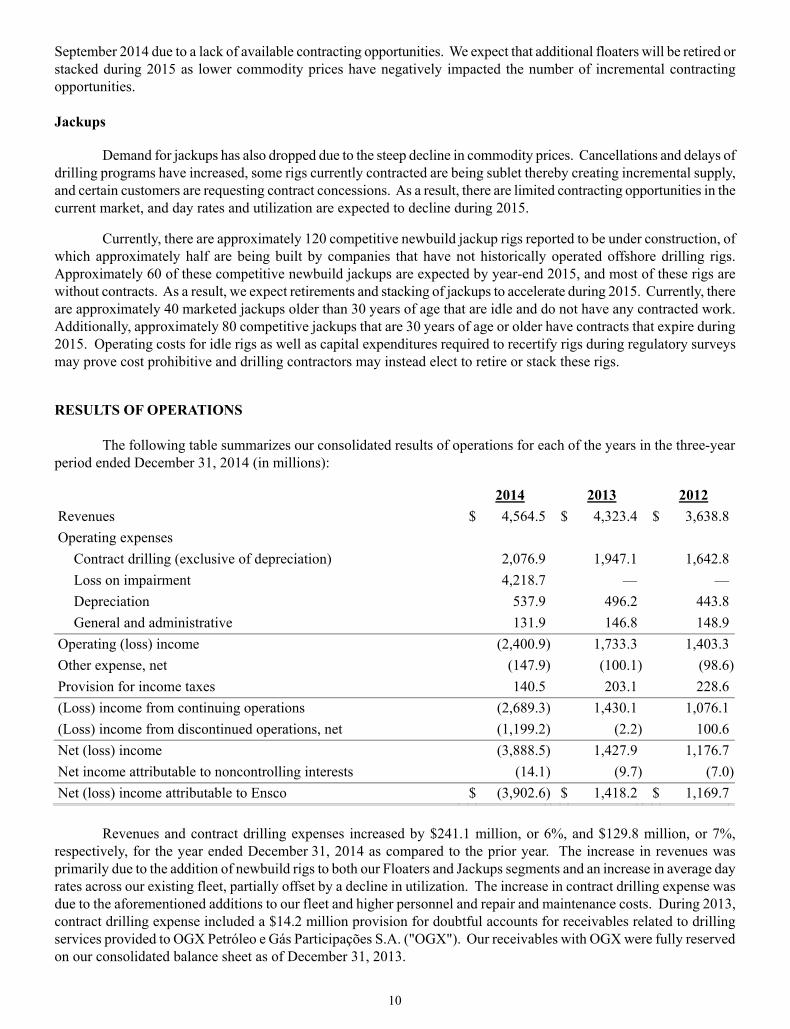
Currently, there are approximately 80 competitive newbuild drillships and semisubmersible rigs reported to be under construction, of which approximately 30 are expected to be delivered before the end of 2015. Roughly half of the anticipated 2015 deliveries are without contracts, leading drilling contractors to retire or stack 35 older floaters since September 2014 due to a lack of available contracting opportunities. We expect that additional floaters will be retired or stacked during 2015 as lower commodity prices have negatively impacted the number of incremental contracting opportunities.
Currently, there are approximately 120 competitive newbuild jackup rigs reported to be under construction, of which approximately half are being built by companies that have not historically operated offshore drilling rigs. Approximately 60 of these competitive newbuild jackups are expected before the end of 2015 and most of these rigs are without contracts. As a result, we expect retirements and stacking of jackups to accelerate during 2015. Currently, there are approximately 40 marketed jackups older than 30 years of age that are idle and do not have any contracted work. Additionally, approximately 80 competitive jackups that are 30 years of age or older have contracts that expire during 2015. Operating costs for idle rigs, as well as capital expenditures required to recertify rigs during regulatory surveys, may prove cost prohibitive, and drilling contractors may instead elect to retire or stack these rigs.
Rig loss or damage due to hurricanes, blowouts, craterings, punchthroughs and other operational events, and the limited availability of insurance for certain perils in some geographic regions, may impact the supply of offshore drilling rigs in a particular market and cause fluctuations in utilization and day rates.

8
Drilling Rig Construction and Delivery We remain focused on our long-established strategy of high-grading our fleet. We will continue to invest in the expansion of our fleet where we believe strategic opportunities exist. During the three-year period ended December 31, 2014, we invested $3.3 billion in the construction of new drilling rigs.
During the second quarter, we entered into an agreement with Lamprell Energy Limited to construct two premium jackup rigs (ENSCO 140 and ENSCO 141). ENSCO 140 and ENSCO 141 are significantly enhanced versions of the LeTorneau Super 116E jackup design and will incorporate Ensco's patented Canti-Leverage AdvantageSM technology. These rigs are scheduled for delivery during the second quarter and the third quarter of 2016, respectively. Both of these rigs are currently uncontracted.
During 2013, we entered into agreements with KFELS to construct a premium jackup rig (ENSCO 110) and an ultra-premium harsh environment jackup rig (ENSCO 123). These rigs are scheduled for delivery during the first quarter of 2015 and the second quarter of 2016, respectively. Both of these rigs are currently uncontracted.
We previously entered into agreements with KFELS to construct three ultra-premium harsh environment jackup rigs (ENSCO 120, ENSCO 121 and ENSCO 122). ENSCO 122 was delivered during the third quarter of 2014 and commenced drilling operations under a long-term contract in the North Sea during the fourth quarter of 2014. ENSCO 121 was delivered during the fourth quarter of 2013 and commenced drilling operations under a long-term contract in the North Sea during the second quarter of 2014. ENSCO 120 was delivered during the third quarter of 2013 and commenced drilling operations under a long-term contract in the North Sea during the first quarter of 2014.
We currently have three ultra-deepwater drillships under construction (ENSCO DS-8, ENSCO DS-9 and ENSCO DS-10). ENSCO DS-9 and ENSCO DS-8 are committed under long-term contracts and currently scheduled for delivery during the first quarter and second quarter of 2015, respectively. ENSCO DS-10 is currently uncontracted and scheduled for delivery during the third quarter of 2015.
The expected delivery dates of our rig construction projects are subject to risks and may be delayed due to shipyard or third-party equipment vendor delays or at our election.
We expect cash flow generated during 2015 will primarily be used to fund capital expenditures, most notably milestone payments for newbuild rigs. Based on our balance sheet and contractual backlog of $9.7 billion, we believe future capital projects, debt service and dividend payments will primarily be funded from cash and cash equivalents, future operating cash flows and borrowings under our commercial paper program and/or revolving credit facility. We may decide to access debt and/or equity markets to raise additional capital, refinance existing debt or increase liquidity as necessary.
Divestitures Our business strategy has been to focus on ultra-deepwater floater and premium jackup operations and de-emphasize other assets and operations considered to be non-core or that do not meet our standards for financial performance. Consistent with this strategy, we sold eleven jackup rigs, two moored semisubmersible rig and our last remaining barge rig during the three-year period ended December 31, 2014. We are currently marketing for sale an additional seven rigs, which were classified as held for sale in our financial statements as of December 31, 2014.

9
Segment Highlights
Floaters Operating results for our Floaters segment declined during 2014 due primarily to a $4.0 billion loss on impairment. Floater revenues grew slightly primarily due to the addition of ENSCO DS-7 to our fleet, but were more than offset by a $75.2 million, or 7%, increase in contract drilling expense. ENSCO DS-7 commenced drilling operations in Angola during the fourth quarter of 2013. In January 2014, ENSCO DS-9 was contracted and is expected to commence a long-term contract in the U.S. Gulf of Mexico during the fourth quarter of 2015. In June 2014, ENSCO DS-8 was contracted and is expected to commence a long-term contract in Angola during the fourth quarter of 2015. ENSCO 8503 executed a long-term contract in the U.S. Gulf of Mexico with a 2.5 year term commencing during the second quarter of 2015.
Jackups Operating results for our Jackups segment declined during 2014 due to a $236.4 million loss on impairment. Excluding this loss, operating results improved primarily due to an increase in average day rates. In particular, premium jackup rigs earned significantly higher day rates due to increasing customer demand for more technologically capable rigs. Ultra-premium harsh environment jackup rigs ENSCO 120 and ENSCO 122 commenced drilling operations under long-term contracts in the North Sea during the first and fourth quarters, respectively. Ultra-premium harsh environment jackup rig ENSCO 121 commenced drilling operations under a long-term contract in the Netherlands during the second quarter. In the Middle East, ENSCO 76 was recontracted through December 2018 and ENSCO 84, ENSCO 96 and ENSCO 97 were recontracted through 2019.
ENSCO 109 executed a long-term contract in Angola, and ENSCO 52 executed a long-term contract in Malaysia, both with an expected term of three years.
During the second quarter, we entered into an agreement with Lamprell Energy Limited to construct two premium jackup rigs (ENSCO 140 and ENSCO 141). ENSCO 140 and ENSCO 141 are significantly enhanced versions of the LeTorneau Super 116E jackup design and will incorporate Ensco's patented Canti-Leverage AdvantageSM technology. These rigs are scheduled for delivery during the second quarter and the third quarter of 2016, respectively. BUSINESS ENVIRONMENT Floaters
During the first half of 2014, the floater contracting environment was highly competitive due to a reduction in capital spending by operators, as well as an increase in global supply due to the delivery of newbuild floaters. More recently, these challenges were exacerbated by a steep decline in commodity prices during the fourth quarter that accelerated toward year-end, which led customers to significantly reduce capital budgets for 2015. Cancellations and delays of drilling programs have increased, many rigs currently contracted are being sublet thereby creating incremental supply, and certain customers are requesting contract concessions. There are limited contracting opportunities in the current market, and day rates and utilization are expected to decline during 2015.
Currently, there are approximately 80 competitive newbuild drillships and semisubmersible rigs reported to be under construction, of which approximately 30 are expected to be delivered before the end of 2015. Roughly half of the anticipated 2015 deliveries are without contracts, leading drilling contractors to retire or stack 35 older floaters since
10
September 2014 due to a lack of available contracting opportunities. We expect that additional floaters will be retired or stacked during 2015 as lower commodity prices have negatively impacted the number of incremental contracting opportunities.
Jackups
Demand for jackups has also dropped due to the steep decline in commodity prices. Cancellations and delays of drilling programs have increased, some rigs currently contracted are being sublet thereby creating incremental supply, and certain customers are requesting contract concessions. As a result, there are limited contracting opportunities in the current market, and day rates and utilization are expected to decline during 2015.
Currently, there are approximately 120 competitive newbuild jackup rigs reported to be under construction, of which approximately half are being built by companies that have not historically operated offshore drilling rigs. Approximately 60 of these competitive newbuild jackups are expected by year-end 2015, and most of these rigs are without contracts. As a result, we expect retirements and stacking of jackups to accelerate during 2015. Currently, there are approximately 40 marketed jackups older than 30 years of age that are idle and do not have any contracted work. Additionally, approximately 80 competitive jackups that are 30 years of age or older have contracts that expire during 2015. Operating costs for idle rigs as well as capital expenditures required to recertify rigs during regulatory surveys may prove cost prohibitive and drilling contractors may instead elect to retire or stack these rigs.
RESULTS OF OPERATIONS
The following table summarizes our consolidated results of operations for each of the years in the three-year period ended December 31, 2014 (in millions):
2014 2013 2012 Revenues $ 4,564.5 $ 4,323.4 $ 3,638.8Operating expenses
Contract drilling (exclusive of depreciation) 2,076.9 1,947.1 1,642.8Loss on impairment 4,218.7 — —Depreciation 537.9 496.2 443.8General and administrative 131.9 146.8 148.9
Operating (loss) income (2,400.9) 1,733.3 1,403.3Other expense, net (147.9) (100.1) (98.6)Provision for income taxes 140.5 203.1 228.6(Loss) income from continuing operations (2,689.3) 1,430.1 1,076.1(Loss) income from discontinued operations, net (1,199.2) (2.2) 100.6Net (loss) income (3,888.5) 1,427.9 1,176.7Net income attributable to noncontrolling interests (14.1) (9.7) (7.0)Net (loss) income attributable to Ensco $ (3,902.6) $ 1,418.2 $ 1,169.7
Revenues and contract drilling expenses increased by $241.1 million, or 6%, and $129.8 million, or 7%, respectively, for the year ended December 31, 2014 as compared to the prior year. The increase in revenues was primarily due to the addition of newbuild rigs to both our Floaters and Jackups segments and an increase in average day rates across our existing fleet, partially offset by a decline in utilization. The increase in contract drilling expense was due to the aforementioned additions to our fleet and higher personnel and repair and maintenance costs. During 2013, contract drilling expense included a $14.2 million provision for doubtful accounts for receivables related to drilling services provided to OGX Petróleo e Gás Participações S.A. ("OGX"). Our receivables with OGX were fully reserved on our consolidated balance sheet as of December 31, 2013.
11
During 2014, we recorded a non-cash loss on impairment totaling $4.2 billion, of which $3.0 billion related to impairment of our Floater goodwill and $1.2 billion related to impairment of three floaters and ten jackups.
During 2013, revenues and contract drilling expense increased by $684.6 million, or 19%, and $304.3 million, or 19%, respectively, as compared to the prior year. The increase in revenues was primarily due to the addition of newbuild rigs to our Floaters segment and an increase in average day rates across our existing fleet, partially offset by a decline in utilization. The increase in contract drilling expense was due the aforementioned additions to our fleet and higher personnel costs, as well as the aforementioned provision for doubtful accounts related to OGX receivables.
A significant number of our drilling contracts are of a long-term nature. Accordingly, an increase or decline in demand for contract drilling services generally affects our operating results and cash flows gradually over future periods as long-term contracts expire, and new contracts and/or options are priced at current market rates.
Rig Counts, Utilization and Average Day Rates
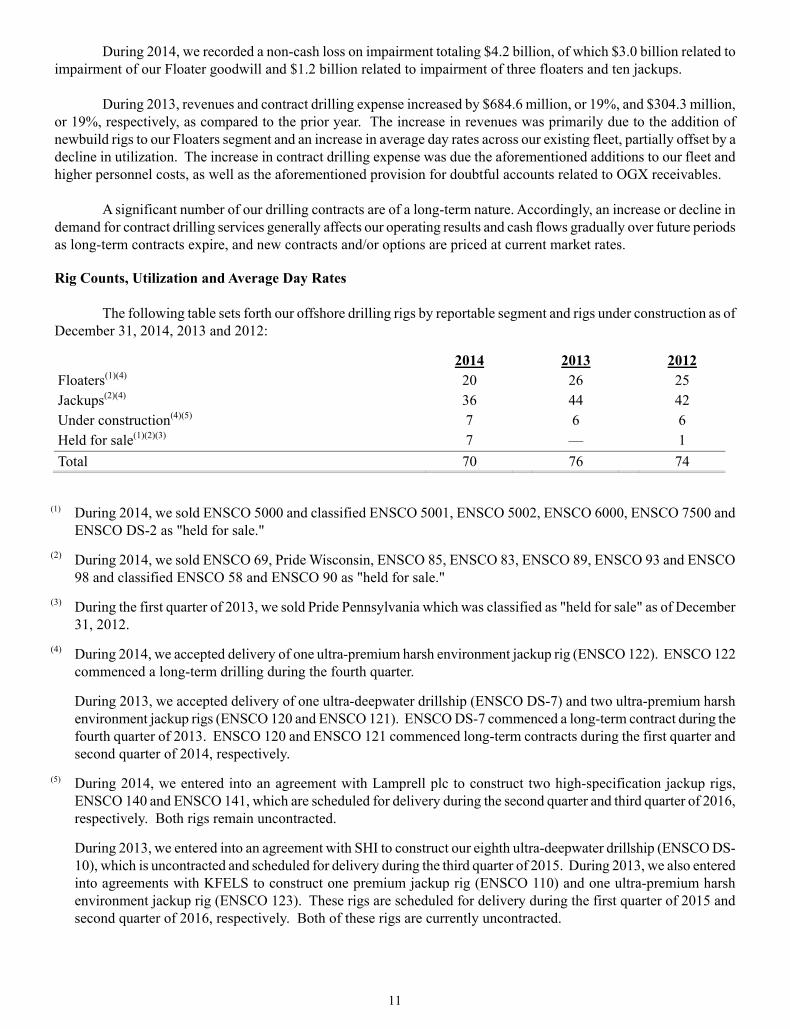
The following table sets forth our offshore drilling rigs by reportable segment and rigs under construction as of December 31, 2014, 2013 and 2012:
2014 2013 2012 Floaters(1)(4) 20 26 25 Jackups(2)(4) 36 44 42 Under construction(4)(5) 7 6 6 Held for sale(1)(2)(3) 7 — 1 Total 70 76 74
(1) During 2014, we sold ENSCO 5000 and classified ENSCO 5001, ENSCO 5002, ENSCO 6000, ENSCO 7500 and ENSCO DS-2 as "held for sale."
(2) During 2014, we sold ENSCO 69, Pride Wisconsin, ENSCO 85, ENSCO 83, ENSCO 89, ENSCO 93 and ENSCO 98 and classified ENSCO 58 and ENSCO 90 as "held for sale."
(3) During the first quarter of 2013, we sold Pride Pennsylvania which was classified as "held for sale" as of December 31, 2012.
(4) During 2014, we accepted delivery of one ultra-premium harsh environment jackup rig (ENSCO 122). ENSCO 122 commenced a long-term drilling during the fourth quarter.
During 2013, we accepted delivery of one ultra-deepwater drillship (ENSCO DS-7) and two ultra-premium harsh environment jackup rigs (ENSCO 120 and ENSCO 121). ENSCO DS-7 commenced a long-term contract during the fourth quarter of 2013. ENSCO 120 and ENSCO 121 commenced long-term contracts during the first quarter and second quarter of 2014, respectively.
(5) During 2014, we entered into an agreement with Lamprell plc to construct two high-specification jackup rigs, ENSCO 140 and ENSCO 141, which are scheduled for delivery during the second quarter and third quarter of 2016, respectively. Both rigs remain uncontracted.
During 2013, we entered into an agreement with SHI to construct our eighth ultra-deepwater drillship (ENSCO DS-10), which is uncontracted and scheduled for delivery during the third quarter of 2015. During 2013, we also entered into agreements with KFELS to construct one premium jackup rig (ENSCO 110) and one ultra-premium harsh environment jackup rig (ENSCO 123). These rigs are scheduled for delivery during the first quarter of 2015 and second quarter of 2016, respectively. Both of these rigs are currently uncontracted.

12
The following table summarizes our rig utilization and average day rates from continuing operations by reportable segment for each of the years in the three-year period ended December 31, 2014:
2014 2013 2012 Rig Utilization(1) Floaters 79% 84% 89% Jackups 89% 92% 94% Total 85% 89% 92%
Average Day Rates(2) Floaters $ 456,023 $ 435,526 $ 378,325Jackups 140,033 125,700 108,389Total $ 242,884 $ 226,703 $ 189,710
(1) Rig utilization is derived by dividing the number of days under contract by the number of days in the period. Days under contract equals the total number of days that rigs have earned and recognized day rate revenue, including days associated with compensated downtime and mobilizations. When revenue is earned but is deferred and amortized over a future period, for example when a rig earns revenue while mobilizing to commence a new contract or while being upgraded in a shipyard, the related days are excluded from days under contract.
For newly-constructed or acquired rigs, the number of days in the period begins upon commencement of drilling operations for rigs with a contract or when the rig becomes available for drilling operations for rigs without a contract.
(2) Average day rates are derived by dividing contract drilling revenues, adjusted to exclude certain types of non-recurring reimbursable revenues, lump sum revenues and revenues attributable to amortization of drilling contract intangibles, by the aggregate number of contract days, adjusted to exclude contract days associated with certain mobilizations, demobilizations, shipyard contracts and standby contracts.
Detailed explanations of our operating results, including discussions of revenues, contract drilling expense and depreciation expense by segment, are provided below.
Operating Income
Our business consists of three operating segments: (1) Floaters, which includes our drillships and semisubmersible rigs, (2) Jackups and (3) Other, which consists of management services on rigs owned by third-parties. Our two reportable segments, Floaters and Jackups, provide one service, contract drilling.
Segment information for each of the years in the three-year period ended December 31, 2014 is presented below (in millions). General and administrative expense and depreciation expense incurred by our corporate office are not allocated to our operating segments for purposes of measuring segment operating income (loss) and were included in "Reconciling Items." Prior year information has been reclassified to conform to the current year presentation.

13
Year Ended December 31, 2014
Floaters Jackups Other
Operating Segments
Total Reconciling
Items Consolidated
Total
Revenues $ 2,697.6 $ 1,774.6 $ 92.3 $ 4,564.5 $ — $ 4,564.5Operating expenses Contract drilling (exclusive of depreciation) 1,201.2
807.4 68.3 2,076.9 —
2,076.9
Loss on impairment 3,982.3 236.4 — 4,218.7 — 4,218.7 Depreciation 358.1 171.2 — 529.3 8.6 537.9 General and administrative — — — — 131.9 131.9Operating (loss) income $ (2,844.0) $ 559.6 $ 24.0 $ (2,260.4) $ (140.5) $ (2,400.9)
Year Ended December 31, 2013
Floaters Jackups Other
Operating Segments
Total Reconciling
Items Consolidated
Total
Revenues $ 2,659.6 $ 1,588.7 $ 75.1 $ 4,323.4 $ — $ 4,323.4Operating expenses Contract drilling (exclusive of depreciation) 1,126.0
762.6 58.5 1,947.1 —
1,947.1
Depreciation 342.2 147.5 — 489.7 6.5 496.2 General and administrative — — — — 146.8 146.8Operating income (loss) $ 1,191.4 $ 678.6 $ 16.6 $ 1,886.6 $ (153.3) $ 1,733.3
Year Ended December 31, 2012
Floaters Jackups Other
Operating Segments
Total Reconciling
Items Consolidated
Total
Revenues $ 2,149.1 $ 1,406.9 $ 82.8 $ 3,638.8 $ — $ 3,638.8Operating expenses Contract drilling (exclusive of depreciation) 894.5
687.2 61.1 1,642.8 —
1,642.8
Depreciation 283.3 151.6 — 434.9 8.9 443.8 General and administrative — — — — 148.9 148.9Operating income (loss) $ 971.3 $ 568.1 $ 21.7 $ 1,561.1 $ (157.8) $ 1,403.3
Floaters
During 2014, Floater revenues increased by $38.0 million, or 1%, as compared to the prior year. The increase in revenues was primarily due to commencement of the ENSCO DS-7 drilling contract during the fourth quarter of 2013 and an increase in average day rates across our Floater fleet. These increases were partially offset by a decline in utilization attributable to certain rigs. ENSCO 5004 and ENSCO 5006 were in the shipyard for capital enhancement projects during 2014, and ENSCO 8503 incurred several months of uncontracted downtime primarily during the first quarter. Contract drilling expense increased by $75.2 million, or 7%, as compared to the prior year, primarily due to the aforementioned addition of ENSCO DS-7 to our Floater fleet. To a lesser extent, higher personnel and repair and

14
maintenance costs also contributed to the increase in contract drilling expense. These increases were partially offset by lower contract drilling expense for ENSCO 5006 and lower windstorm insurance costs during 2014 following our decision to not renew our windstorm policy for floaters in the U.S. Gulf of Mexico. Contract drilling expense during 2013 also included the aforementioned provision for doubtful accounts related to OGX receivables.
We recognized a loss on impairment of $4.0 billion during the year ended December 31, 2014 related to goodwill and three older, less capable floaters. Detailed explanations of our loss on impairment are provided below. No impairments were recorded during the prior year period.
Depreciation expense increased by $15.9 million, or 5%, primarily due to the addition of ENSCO DS-7 to our Floater fleet, partially offset by lower depreciation as a result of the impairments recorded during the second quarter of 2014.
During 2013, Floater revenues increased by $510.5 million, or 24%, as compared to the prior year. The increase in revenues was primarily due to commencement of ENSCO 8506 and ENSCO DS-6 drilling operations during the first quarter of 2013 and commencement of ENSCO 8505 drilling operations during the second quarter of 2012. To a lesser extent, the increase in revenues was attributable to an increase in average day rates for various rigs in our Floater fleet. These increases were partially offset by a decline in utilization, primarily due to ENSCO 5005, which was in the shipyard for a capital enhancement project during 2013 and downtime prompted by a vendor notice regarding inspection and replacement of connector bolts on various rigs. ENSCO 5004 drilling services provided to OGX that were not recognized as revenue also adversely impacted utilization during 2013.
Contract drilling expense increased by $231.5 million, or 26%, as compared to the prior year, primarily due to the additions to our Floater fleet and increased personnel costs. These increases were partially offset by lower contract drilling expense for ENSCO 5005, which was in the shipyard for a capital enhancement project during 2013. The prior year also included the favorable settlement of third-party claims which reduced contract drilling expense by $63.3 million. Depreciation expense increased by $58.9 million, or 21%, primarily due to the aforementioned additions to our Floater fleet.
Jackups
During 2014, Jackup revenues increased by $185.9 million, or 12%, as compared to the prior year. The increase in revenues was primarily due to an increase in average day rates across our Jackup fleet and commencement of the ENSCO 120, ENSCO 121 and ENSCO 122 drilling contracts. These increases were partially offset by a decline in utilization for certain rigs in the Jackup fleet.
Contract drilling expense increased by $44.8 million, or 6%, as compared to the prior year, primarily due to the aforementioned additions to our Jackup fleet and an increase in personnel and repair and maintenance costs.
We recognized a loss on impairment of $236.4 million during the year ended December 31, 2014 related to ten jackups. Detailed explanations of our loss on impairment are provided below. No impairments were recorded during the prior year period.
Depreciation expense increased by $23.7 million, or 16%, primarily due to the additions to our Jackup fleet.
During 2013, Jackup revenues increased by $181.8 million, or 13%, as compared to the prior year. The increase in revenues was primarily due to an increase in average day rates, mostly attributable to the U.S. Gulf of Mexico, North Sea and Southeast Asia. Contract drilling expense increased by $75.4 million, or 11%, as compared to the prior year, primarily due to increased personnel costs.

15
Impairment of Long-Lived Assets
During 2014, we recorded a pre-tax, non cash loss on impairment of long-lived assets of $2,463.1 million, of which $1,220.8 million was included in (loss) income from continuing operations and $1,242.3 million was included in (loss) income from discontinued operations, net in our consolidated statement of operations. These losses were recorded during the second and fourth quarters.
During the second quarter, demand for floaters deteriorated as a result of continued reductions in capital spending by operators in addition to delays in operators’ drilling programs. The reduction in demand, combined with the increasing supply from newbuild floater deliveries, led to a very competitive market. In general, contracting activity declined significantly, and day rates and utilization came under pressure, especially for older, less capable floaters.
In response to the adverse change in the floaters business climate, management evaluated our older, less capable floaters and committed to a plan to sell five rigs. ENSCO 5000, ENSCO 5001, ENSCO 5002, ENSCO 6000 and ENSCO 7500 were removed from our portfolio of rigs marketed for contract drilling services and actively marketed for sale. These rigs were written down to fair value, less costs to sell. We completed the sale of ENSCO 5000 in December 2014. The remaining four floaters were classified as "held for sale" on our December 31, 2014 consolidated balance sheet.
We measured the fair value of the "held for sale" rigs by applying a market approach, which was based on unobservable third-party estimated prices that would be received in exchange for the assets in an orderly transaction between market participants. We recorded a pre-tax, non-cash loss on impairment totaling $546.4 million during the second quarter associated with our "held for sale" rigs. The impairment charge was included in (loss) income from discontinued operations, net in our consolidated statement of operations for the year ended December 31, 2014.
During the fourth quarter, Brent crude oil prices declined from approximately $95 per barrel to near $55 per barrel on December 31, 2014. These declines resulted in further reductions in capital spending by operators, including the cancellation or deferral of planned drilling programs. As a result, day rates and utilization came under further pressure, especially for older, less capable rigs. The significant supply and demand imbalance will continue to be adversely impacted by future newbuild deliveries, program delays and lower capital spending by operators.
In response to the adverse change in business climate, management evaluated our aged rigs and committed to a plan to sell one additional floater and two jackups. ENSCO DS-2, ENSCO 58 and ENSCO 90 were removed from our portfolio of rigs marketed for contract drilling services. These rigs were written down to fair value, less costs to sell, during the fourth quarter and classified as "held for sale" on our December 31, 2014 consolidated balance sheet.
As of December 31, 2014, we measured the fair value of our seven "held for sale" rigs by applying a market approach, which was based on unobservable third-party estimated prices that would be received in exchange for the assets in an orderly transaction between market participants. In addition to the asset impairment recorded during the second quarter, we recorded an additional pre-tax, non-cash loss on impairment totaling $407.9 million during the fourth quarter. The impairment charge was included in (loss) income from discontinued operations, net in our consolidated statement of operations for the year ended December 31, 2014. See "Note 10 - Discontinued Operations" for additional information on our "held for sale" rigs.
On a quarterly basis, we evaluate the carrying value of our property and equipment to identify events or changes in circumstances ("triggering events") that indicate the carrying value may not be recoverable. During the second quarter, as a result of the adverse change in the floater business climate, management's decision to sell five floaters and the impairment charge incurred on the "held for sale" floaters, management concluded that a triggering event had occurred and performed an asset impairment analysis on our remaining older, less capable floaters.
Based on the analysis performed as of May 31, 2014, we recorded an additional pre-tax, non-cash loss on impairment with respect to four other floaters totaling $991.5 million, of which $288.0 million related to ENSCO DS-2 which was removed from our portfolio of rigs marketed for contract drilling services during the fourth quarter. The ENSCO DS-2 impairment charge was reclassified to (loss) income from discontinued operations, net in our consolidated statement of operations for the year ended December 31, 2014. The remaining $703.5 million impairment charge was
16
included in loss on impairment in our consolidated statement of operations for the year ended December 31, 2014. We measured the fair value of these rigs by applying an income approach, using projected discounted cash flows. These valuations were based on unobservable inputs that require significant judgments for which there is limited information, including assumptions regarding future day rates, utilization, operating costs and capital requirements.
During the fourth quarter, as a result of the decline in commodity prices and adverse changes in the offshore drilling market, management's decision to sell an additional floater and two jackups and the impairment charge incurred on the "held for sale" rigs, management concluded that a triggering event had occurred and performed an asset impairment analysis for all floaters and jackups.
Based on the analysis performed as of December 31, 2014, we recorded an additional pre-tax, non-cash loss on impairment with respect to two older, less capable floaters and ten older, less capable jackups totaling $517.3 million. The impairment charge was included in loss on impairment in our consolidated statement of operations for the year ended December 31, 2014. We measured the fair value of these rigs by applying either an income approach, using projected discounted cash flows, or a market approach. These valuations were based on unobservable inputs that require significant judgments for which there is limited information, including assumptions regarding future day rates, utilization, operating costs and capital requirements.
Impairment of Goodwill
Our business consists of three operating segments: (1) Floaters, which includes our drillships and semisubmersible rigs, (2) Jackups and (3) Other, which consists of management services on rigs owned by third-parties. Our two reportable segments, Floaters and Jackups, provide one service, contract drilling.
We test goodwill for impairment on an annual basis or when events or changes in circumstances indicate that a potential impairment exists. During the second quarter, demand for floaters deteriorated as a result of a continued reduction in capital spending by operators in addition to announced delays in operators’ drilling programs. The reduction in demand, combined with increasing supply from newbuild floater deliveries, led to a very competitive market. In general, contracting activity for floaters declined significantly and day rates and utilization came under pressure, especially for older, less capable floaters.
Management considered the adverse change in the floater business climate, the commitment to a plan to sell five floaters in May 2014, and the impairment charge on the "held for sale" floaters during the second quarter and concluded that a triggering event had occurred. We performed an interim goodwill impairment test to evaluate the recoverability of the Floaters reporting unit goodwill balance of $3.1 billion as of May 31, 2014. Based on the valuation performed, the Floaters reporting unit estimated fair value exceeded the carrying value by approximately 7%; therefore, we concluded that the goodwill balance was not impaired.
As part of our annual goodwill impairment test as of December 31, 2014, we considered the significant decline in commodity prices during the fourth quarter of 2014. Specifically, Brent crude oil prices declined from approximately $95 per barrel at September 30, 2014 to near $55 per barrel at December 31, 2014. These declines resulted in further reductions in capital spending by operators, including the cancellation or deferral of planned drilling programs. We expect that this reduction in demand will cause further deterioration in day rates and utilization and that current market dynamics will create a challenging contracting environment into 2016.
Our stock price also declined significantly during the latter half of 2014, reaching a five-year low of $25.88 on December 16th. Our stock price traded between $25.88 and $41.99 during the fourth quarter of 2014 and averaged $35.23 during this period.
Management considered the adverse changes in the current floater business climate, the sustained decline in stock price and the impairment charge on older, less capable floaters during the fourth quarter and concluded it was more-likely-than-not that the fair value of the Floater reporting unit was less than its carrying amount. As a result, we estimated the fair value of the reporting unit using a blended income and market approach. Based on the valuation performed as of December 31, 2014, the reporting unit estimated fair value was less than the carrying value; therefore, we concluded that the Floater goodwill balance was impaired. We compared the estimated fair value of the reporting

17
unit to the fair value of all assets and liabilities of the reporting unit to calculate the implied fair value of goodwill. As a result, we recorded a non-cash loss on impairment totaling $3.0 billion which was included in loss on impairment in our consolidated statement of operations for the year ended December 31, 2014.
The income approach was based on a discounted cash flow model, which utilized present values of cash flows to estimate fair value. The future cash flows were projected based on our estimates of future day rates, utilization, operating costs, capital requirements, growth rates and terminal values. Forecasted day rates and utilization take into account current market conditions and our anticipated business outlook, both of which have been impacted by the adverse changes in the floater business environment during 2014. The day rates reflected contracted rates during the respective contracted periods and management's estimate of market day rates in uncontracted periods. The forecasted market day rates were held constant in the near-term but were forecasted to grow in the longer-term and terminal period.
Operating costs were forecasted using a combination of our historical average operating costs and expected future costs, adjusted for an estimated inflation factor. Capital requirements in the discounted cash flow model were based on management's estimates of future capital costs, taking into consideration our historical trends. The estimated capital requirements included cash outflows for new rig construction, rig enhancements and minor upgrades and improvements.
A terminal period was used to reflect our estimate of stable, perpetual growth. The terminal period reflects a terminal growth rate of 3.0%, which includes an estimated inflation factor. The future cash flows were discounted using a market-participant risk-adjusted weighted average cost of capital ("WACC") of 11.0%. These assumptions were derived from unobservable inputs and reflect management's judgments and assumptions.
The market approach was based upon the application of price-to-earnings multiples to management's estimates of future earnings adjusted for a control premium. The price-to-earnings multiples used in the market valuation ranged from 6.0x to 6.8x and were based on market participant multiples. Management's earnings estimates were derived from unobservable inputs that require significant estimates, judgments and assumptions as described in the income approach.
The estimated fair value of the Floaters reporting unit determined under the income approach was consistent with the estimated fair value determined under the market approach. For purposes of the goodwill impairment test, we calculated the Floaters reporting unit estimated fair value as the average of the values calculated under the income approach and the market approach.
We evaluated the estimated fair value of our reporting units compared to our market capitalization as of December 31, 2014. To perform this assessment, we used a market approach to estimate the fair value of the Jackups reporting unit. The aggregate fair values of our reporting units exceeded our market capitalization, and we believe the resulting implied control premium was reasonable based on recent market transactions within our industry or other relevant benchmark data.
We performed a qualitative assessment for our Jackup reporting unit as of December 31, 2014. Goodwill impairment tests performed during prior years indicated that the fair value of the Jackup reporting unit significantly exceeded its carrying amount. Despite the adverse changes in the offshore drilling climate, we concluded that the fair value remains substantially in excess of the carrying value of the reporting unit, as evidenced by the estimated fair value of the Jackup reporting unit calculated for the purpose of reconciling the fair value of our reporting units to our market capitalization. Therefore, we concluded that it remains more-likely-than-not that the Jackup reporting unit was not impaired.
The estimates used to determine the fair value of the Floaters reporting unit reflect management's best estimates, and we believe they are reasonable. Future declines in the Floaters reporting unit's operating performance or our anticipated business outlook may reduce the estimated fair value of our Floaters reporting unit and result in additional impairments. Factors that could have a negative impact on the fair value of the Floaters reporting unit include, but are not limited to:
• decreases in estimated market day rates and utilization due to greater-than-expected market pressures,downtime and other risks associated with offshore rig operations;
18
• sustained declines in our stock price;
• decreases in revenue due to our inability to attract and retain skilled personnel;
• changes in worldwide rig supply and demand, competition or technology, including changes as a result ofnewbuild rig deliveries;
• changes in future levels of drilling activity and expenditures, whether as a result of global capital markets andliquidity, prices of oil and natural gas or otherwise, which may cause us to idle or stack additional rigs;
• possible cancellation or suspension of drilling contracts as a result of mechanical difficulties, performance orother reasons;
• delays in contract commencement dates;
• the outcome of litigation, legal proceedings, investigations or other claims or contract disputes resulting insignificant cash outflows;
• governmental, regulatory, legislative and permitting requirements affecting drilling operations, includinglimitations on drilling locations (such as the Gulf of Mexico during hurricane season);
• increases in the market-participant risk-adjusted WACC;
• declines in anticipated growth rates.
Adverse changes in one or more of these factors could result in additional goodwill impairments in future periods. As of December 31, 2014, there was $192.6 million of goodwill associated with our Jackup reporting unit and $83.5 million of goodwill associated with our Floater reporting unit on our consolidated balance sheet.
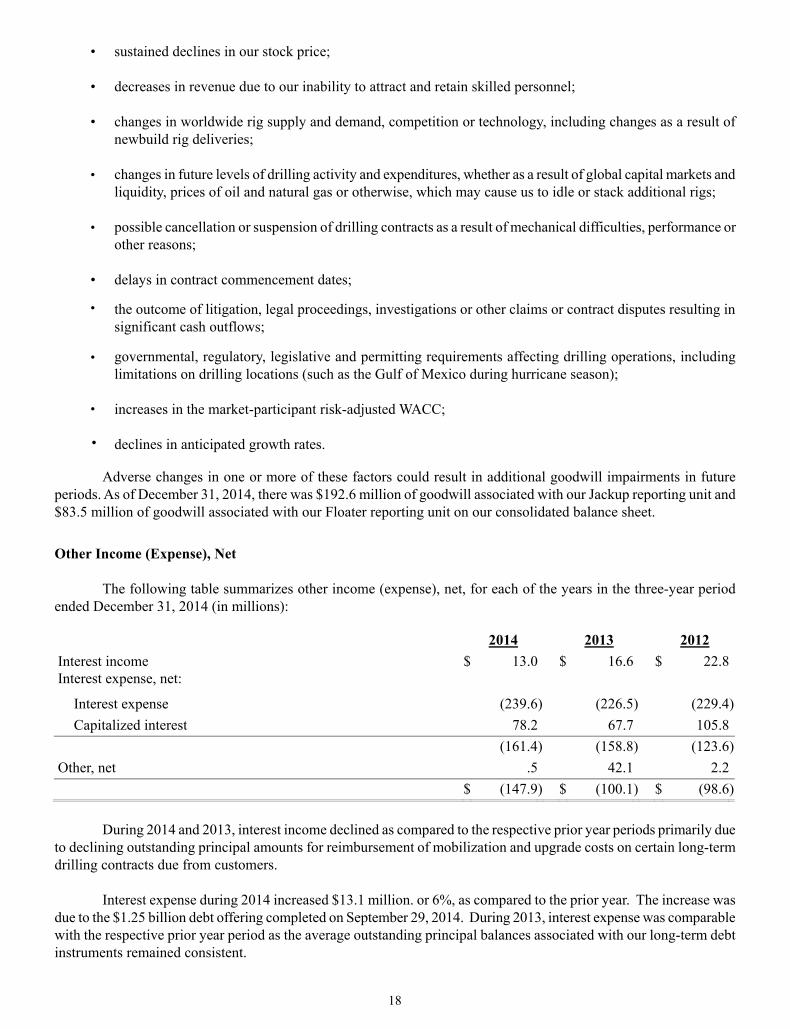
Other Income (Expense), Net
The following table summarizes other income (expense), net, for each of the years in the three-year period ended December 31, 2014 (in millions):
2014 2013 2012 Interest income $ 13.0 $ 16.6 $ 22.8Interest expense, net:
Interest expense (239.6) (226.5) (229.4)Capitalized interest 78.2 67.7 105.8
(161.4) (158.8) (123.6)Other, net .5 42.1 2.2
$ (147.9) $ (100.1) $ (98.6)
During 2014 and 2013, interest income declined as compared to the respective prior year periods primarily due to declining outstanding principal amounts for reimbursement of mobilization and upgrade costs on certain long-term drilling contracts due from customers.
Interest expense during 2014 increased $13.1 million. or 6%, as compared to the prior year. The increase was due to the $1.25 billion debt offering completed on September 29, 2014. During 2013, interest expense was comparable with the respective prior year period as the average outstanding principal balances associated with our long-term debt instruments remained consistent.

19
Interest expense capitalized during 2014 increased $10.5 million, or 16%, as compared to the prior year due to an increase in the average outstanding amount of capital invested in newbuild construction. During 2013, interest expense capitalized declined $38.1 million, or 36%, as compared to prior year due to a decline in the average outstanding amount of capital invested in newbuild construction. ENSCO 8506 and ENSCO DS-6 were placed into service during the first quarter of 2013, and ENSCO 8505 was placed into service during the second quarter of 2012.
During 2013, we received a $30.6 million reimbursement from the Mexican tax authority with respect to the tax authority's draw on letters of credit issued by an Ensco subsidiary for the benefit of Seahawk Drilling Inc. ("Seahawk") under a credit support agreement executed in connection with the 2009 spin-off of Seahawk. The reimbursement was included in other, net in our consolidated statement of operations for the year ended December 31, 2013.
Our functional currency is the U.S. dollar, and a portion of the revenues earned and expenses incurred by certain of our subsidiaries are denominated in currencies other than the U.S. dollar ("foreign currencies"). These transactions are remeasured in U.S. dollars based on a combination of both current and historical exchange rates. Net foreign currency exchange gains and losses, inclusive of offsetting fair value derivatives, were $2.6 million of losses, $6.4 million of gains and $3.5 million of losses, and were included in other, net, in our consolidated statements of operations for the years ended December 31, 2014, 2013 and 2012, respectively.
Net unrealized gains of $2.3 million, $6.2 million and $2.8 million from marketable securities held in our supplemental executive retirement plans ("SERP") were included in other, net, in our consolidated statements of operations for the years ended December 31, 2014, 2013 and 2012, respectively. The fair value measurement of our marketable securities held in the SERP is discussed in Note 2 to our consolidated financial statements.
Provision for Income Taxes
Ensco plc, our parent company, is domiciled and resident in the U.K. Our subsidiaries conduct operations and earn income in numerous countries and are subject to the laws of taxing jurisdictions within those countries. The income of our non-U.K. subsidiaries is not subject to U.K. taxation. Income tax rates imposed in the tax jurisdictions in which our subsidiaries conduct operations vary, as does the tax base to which the rates are applied. In some cases, tax rates may be applicable to gross revenues, statutory or negotiated deemed profits or other bases utilized under local tax laws, rather than to net income. Our drilling rigs frequently move from one taxing jurisdiction to another to perform contract drilling services. In some instances, the movement of drilling rigs among taxing jurisdictions will involve the transfer of ownership of the drilling rigs among our subsidiaries. As a result of frequent changes in the taxing jurisdictions in which our drilling rigs are operated and/or owned, changes in the overall level of our income and changes in tax laws, our consolidated effective income tax rate may vary substantially from one reporting period to another.
Income tax expense was $140.5 million, $203.1 million and $228.6 million, and our consolidated effective income tax rate was (5.5)%, 12.4% and 17.5% during the years ended December 31, 2014, 2013 and 2012, respectively. Our consolidated effective income tax rate for 2014 includes the impact of various discrete tax items, including the recognition of a net $18.4 million tax expense associated with liabilities for unrecognized tax benefits and other adjustments relating to prior years and a $16.4 million tax benefit associated with rig impairments. In addition, we recognized a net $41.4 million tax benefit in connection with the utilization of foreign tax credits that were previously subject to a valuation allowance.
The majority of discrete tax expense recognized during 2013 was attributable to the recognition of a $7.4 million liability for taxes associated with a $30.6 million reimbursement from the resolution of a dispute with the Mexican tax authority and a $7.0 million increase in the valuation allowance on U.S. foreign tax credits resulting from a restructuring transaction.
The majority of discrete tax expense recognized during 2012 was attributable to $51.2 million of income tax expense associated with the restructuring of certain subsidiaries of Pride, and tax expense associated with liabilities for unrecognized tax benefits and other adjustments relating to prior years.

20
Excluding the impact of the aforementioned tax items and goodwill and asset impairments, our consolidated effective income tax rates for the years ended December 31, 2014, 2013 and 2012 were 10.7%, 12.2% and 12.4%, respectively. The changes in our consolidated effective income tax rate excluding discrete tax items during the three years result primarily from changes in the relative components of our earnings from the various taxing jurisdictions in which our drilling rigs are operated and/or owned and differences in the tax rates in such jurisdictions.
Discontinued Operations
Our business strategy has been to focus on ultra-deepwater floater and premium jackup operations and de-emphasize other assets and operations considered to be non-core or that do not meet our standards for financial performance. Consistent with this strategy, we sold the following rigs during the three-year period ended December 31, 2014. These rigs are classified as discontinued operations (in millions):
Rig(3) Date of Rig Sale Segment(1) Net
Proceeds Net Book Value(2)
Pre-tax Gain/(Loss)
ENSCO 5000 December 2014 Floaters $ 1.3 $ .5 $ .8ENSCO 93 September 2014 Jackups 51.7 52.9 (1.2)ENSCO 85 April 2014 Jackups 64.4 54.1 10.3ENSCO 69 & Pride Wisconsin January 2014 Jackups 32.2 8.6 23.6Pride Pennsylvania March 2013 Jackups 15.5 15.7 (.2)ENSCO 5003 December 2012 Floaters 68.2 89.4 (21.2)Pride Hawaii October 2012 Jackups 18.8 16.8 2.0ENSCO I September 2012 Other 4.5 12.3 (7.8)ENSCO 61 June 2012 Jackups 31.7 19.6 12.1ENSCO 59 May 2012 Jackups 22.8 21.9 .9
$ 311.1 $ 291.8 $ 19.3
(1) The rigs' operating results were reclassified to discontinued operations in our consolidated statements of operations for each of the years in the three-year period ended December 31, 2014 and previously were included within the operating segment noted in the above table.
(2) Includes the rig's net book value as well as inventory and other assets on the date of the sale.(3) In September 2014, we sold jackup rigs ENSCO 83, ENSCO 89, ENSCO 93 and ENSCO 98, all of which are
contracted to Pemex. As described below, the loss on sale and operating results of ENSCO 93 were included in (loss) income from discontinued operations, net in our consolidated statement of operations for the three-year period ended December 31, 2014.
During 2014, management committed to a plan to sell six floaters and two jackups. ENSCO 5000, ENSCO 5001, ENSCO 5002, ENSCO 6000, ENSCO 7500, ENSCO DS-2, ENSCO 58 and ENSCO 90 were removed from our portfolio of rigs marketed for contract drilling services. These rigs were written down to fair value, less costs to sell. We recorded a non-cash loss on impairment totaling $1.2 billion, net of tax benefits of $83.5 million, during the year ended December 31, 2014. The impairment charge was included in (loss) income from discontinued operations, net in our consolidated statement of operations for the year ended December 31, 2014.

21
We completed the sale of ENSCO 5000 for net proceeds of $1.3 million in December 2014. The remaining five floaters and two jackups are being actively marketed for sale and were classified as "held for sale" on our December 31, 2014 consolidated balance sheet.
The operating results from these rigs were included in (loss) income from discontinued operations, net in our consolidated statement of operations for the three-year period ended December 31, 2014.
During 2014, we sold ENSCO 93, a jackup contracted to Pemex. In connection with this sale, we executed a charter agreement with the purchaser to continue operating the rig for the remainder of the Pemex contract, which had an anticipated completion date in late 2015. Based on market developments during the fourth quarter, we now expect that the ENSCO 93 charter agreement will terminate prior to September 30, 2015. As a result, the loss on sale of $1.2 million and ENSCO 93 operating results were reclassified to (loss) income from discontinued operations, net in our consolidated statement of operations for the three-year period ended December 31, 2014. Net proceeds from the sale of $51.7 million were included in investing activities of discontinued operations in our consolidated statement of cash flows for the year ended December 31, 2014. See "Note 12 - Sale-leaseback" for additional information.
During 2014, we sold ENSCO 85 for net proceeds of $64.4 million and ENSCO 69 and Pride Wisconsin for net proceeds of $32.2 million. The operating results of these rigs were included in (loss) income from discontinued operations, net in our consolidated statement of operations for the three-year period ended December 31, 2014. The net proceeds from the sale for ENSCO 69 and Pride Wisconsin were received in December 2013 and included in investing activities of discontinued operations in our consolidated statement of cash flows for the year ended December 31, 2013.
During 2012, we classified jackup rig Pride Pennsylvania as held for sale, and the rig was written down to fair value less estimated cost to sell. We recognized a $2.5 million loss for assets classified as held for sale during the year ended December 31, 2012.
The following table summarizes (loss) income from discontinued operations for each of the years in the three-year period ended December 31, 2014 (in millions):
2014 2013 2012 Revenues $ 325.0 $ 596.4 $ 668.6Operating expenses 372.0 577.6 544.3Operating (loss) income (47.0) 18.8 124.3Other income — .3 1.3Income tax expense (30.7) (20.2) (8.5)Loss on impairment, net (1,158.8) — —Gain (loss) on disposal of discontinued operations, net 37.3 (1.1) (16.5)(Loss) income from discontinued operations $ (1,199.2) $ (2.2) $ 100.6
Debt and interest expense are not allocated to our discontinued operations.
During 2008, ENSCO 74 was lost as a result of Hurricane Ike in the U.S. Gulf of Mexico. The owner of a pipeline filed claims alleging that ENSCO 74 caused the pipeline to rupture during Hurricane Ike. We incurred $3.6 million in professional fees in connection with this matter, which we applied against our $10.0 million per occurrence deductible under our liability insurance policy.
In February 2014, we reached an agreement with the owner of the pipeline to settle the claims for $9.6 million. Accordingly, we recorded a $6.4 million charge for our remaining obligation under our liability insurance policy in loss from discontinued operations in our consolidated statement of operations for the year ended December 31, 2013. The remaining $3.2 million was settled by our underwriters. See "Note 11 - Commitments and Contingencies" for additional information on the ENSCO 74 loss.

22
LIQUIDITY AND CAPITAL RESOURCES Although our business is cyclical, we have historically relied on our cash flow from continuing operations to meet liquidity needs and fund the majority of our cash requirements. We have maintained a strong financial position through the disciplined and conservative use of debt, which has provided us the ability to achieve future growth potential through acquisitions and newbuild rig construction. A substantial portion of our cash flow has been invested in the expansion and enhancement of our fleet of drilling rigs through newbuild construction and upgrade projects and the return of capital to shareholders through dividend payments. Given recent market conditions, our Board of Directors elected to reduce the quarterly dividend payment in order to increase the Company's capital flexibility. We expect cash flow generated during 2015 will primarily be used to fund capital expenditures, most notably milestone payments for newbuild rigs. Based on our balance sheet and contractual backlog of $9.7 billion, we believe future capital projects, debt service and dividend payments will primarily be funded from cash and cash equivalents, future operating cash flows and borrowings under our commercial paper program and/or revolving credit facility. We may decide to access debt and/or equity markets to raise additional capital, refinance existing debt or increase liquidity as necessary. During the three-year period ended December 31, 2014, our primary sources of cash were an aggregate $5.8 billion generated from operating activities of continuing operations, $1.2 billion in proceeds from the issuance of senior notes and $178.4 million in proceeds from rig sales. Our primary uses of cash during the same period included $5.0 billion for the construction, enhancement and other improvement of our drilling rigs, including $3.3 billion invested in newbuild construction, and $1.6 billion for dividend payments. Detailed explanations of our liquidity and capital resources for each of the years in the three-year period ended December 31, 2014 are set forth below. Cash Flows and Capital Expenditures Our cash flows from operating activities of continuing operations and capital expenditures on continuing operations for each of the years in the three-year period ended December 31, 2014 were as follows (in millions):
2014 2013 2012 Cash flows from operating activities of continuing operations $ 2,057.9 $ 1,811.2 $ 1,954.6Capital expenditures on continuing operations:
New rig construction $ 699.5 $ 1,282.5 $ 1,298.3Rig enhancements 537.4 239.0 216.5Minor upgrades and improvements 331.9 242.0 198.4
$ 1,568.8 $ 1,763.5 $ 1,713.2 During 2014, cash flows from continuing operations increased by $246.7 million, or 14%, as compared to the prior year. The increase primarily resulted from a $503.1 million increase in cash receipts from contract drilling services, partially offset by a $259.2 million increase in cash payments related to contract drilling expenses. Cash receipts from contract drilling services associated with customer reimbursed capital upgrades and mobilizations which are amortized to revenue over the term of the related contract totaled $267.0 million for the year ended December 31, 2014 as compared to $70.0 million for the year ended December 31, 2013. During 2013, cash flows from continuing operations declined by $143.4 million, or 7%, as compared to the prior year. The decrease primarily resulted from a $348.7 million increase in cash payments related to contract drilling expenses, a $117.5 million increase in cash payments for income taxes, a $40.2 million increase in cash payments for
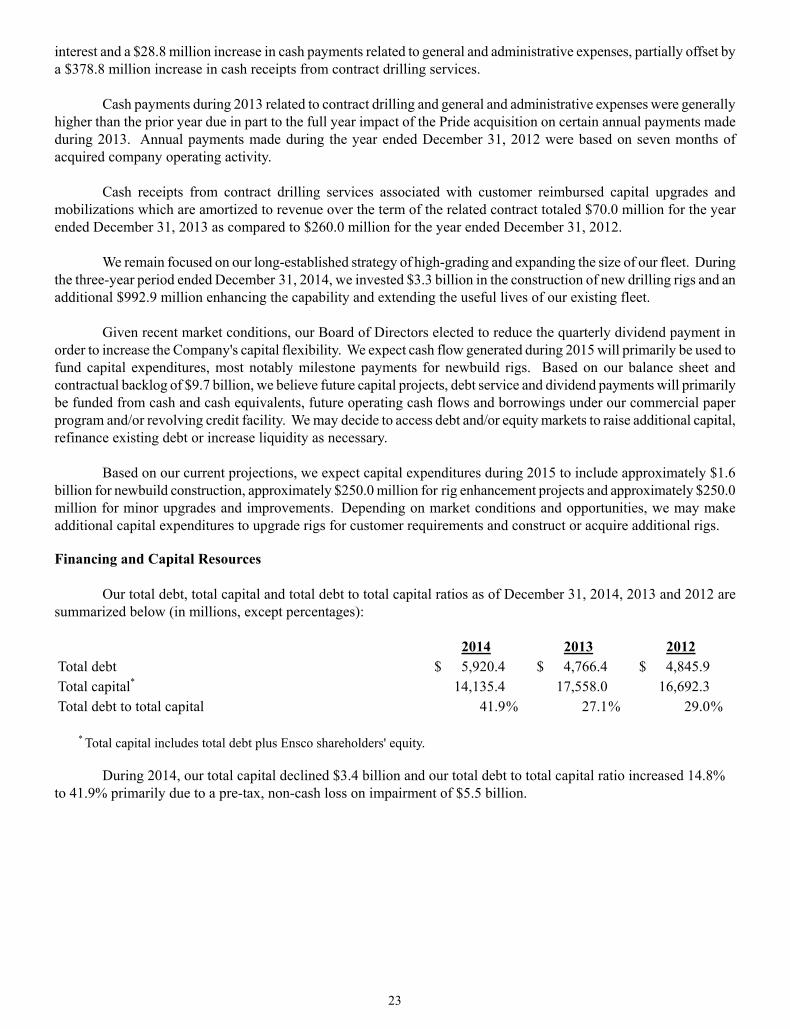
23
interest and a $28.8 million increase in cash payments related to general and administrative expenses, partially offset by a $378.8 million increase in cash receipts from contract drilling services.
Cash payments during 2013 related to contract drilling and general and administrative expenses were generally higher than the prior year due in part to the full year impact of the Pride acquisition on certain annual payments made during 2013. Annual payments made during the year ended December 31, 2012 were based on seven months of acquired company operating activity.
Cash receipts from contract drilling services associated with customer reimbursed capital upgrades and mobilizations which are amortized to revenue over the term of the related contract totaled $70.0 million for the year ended December 31, 2013 as compared to $260.0 million for the year ended December 31, 2012.
We remain focused on our long-established strategy of high-grading and expanding the size of our fleet. During the three-year period ended December 31, 2014, we invested $3.3 billion in the construction of new drilling rigs and an additional $992.9 million enhancing the capability and extending the useful lives of our existing fleet.
Given recent market conditions, our Board of Directors elected to reduce the quarterly dividend payment in order to increase the Company's capital flexibility. We expect cash flow generated during 2015 will primarily be used to fund capital expenditures, most notably milestone payments for newbuild rigs. Based on our balance sheet and contractual backlog of $9.7 billion, we believe future capital projects, debt service and dividend payments will primarily be funded from cash and cash equivalents, future operating cash flows and borrowings under our commercial paper program and/or revolving credit facility. We may decide to access debt and/or equity markets to raise additional capital, refinance existing debt or increase liquidity as necessary.
Based on our current projections, we expect capital expenditures during 2015 to include approximately $1.6 billion for newbuild construction, approximately $250.0 million for rig enhancement projects and approximately $250.0 million for minor upgrades and improvements. Depending on market conditions and opportunities, we may make additional capital expenditures to upgrade rigs for customer requirements and construct or acquire additional rigs.
Financing and Capital Resources
Our total debt, total capital and total debt to total capital ratios as of December 31, 2014, 2013 and 2012 are summarized below (in millions, except percentages):
2014 2013 2012 Total debt $ 5,920.4 $ 4,766.4 $ 4,845.9Total capital* 14,135.4 17,558.0 16,692.3Total debt to total capital 41.9% 27.1% 29.0%
* Total capital includes total debt plus Ensco shareholders' equity.
During 2014, our total capital declined $3.4 billion and our total debt to total capital ratio increased 14.8% to 41.9% primarily due to a pre-tax, non-cash loss on impairment of $5.5 billion.

24
Senior Notes
On September 29, 2014, we issued $625.0 million aggregate principal amount of unsecured 4.50% notes due 2024 at a discount of $850,000 and $625.0 million aggregate principal amount of unsecured 5.75% notes due 2044 (collectively the “2014 Notes”) at a discount of $2.8 million in a public offering. Interest on these notes is payable semiannually in April and October of each year commencing April 1, 2015. The 2014 Notes were issued pursuant to an Indenture between us and Deutsche Bank Trust Company Americas, as trustee (the “Trustee”), dated March 17, 2011 (the "Indenture") and a Second Supplemental Indenture between us and the Trustee, dated September 29, 2014. The net proceeds from the sale of the 2014 Notes are being used for general corporate purposes.
During 2011, we issued $1.0 billion aggregate principal amount of unsecured 3.25% notes due 2016 at a discount of $7.6 million and $1.5 billion aggregate principal amount of unsecured 4.70% notes due 2021 (collectively the “2011 Notes”) at a discount of $29.6 million in a public offering. Interest on these notes is payable semiannually in March and September of each year. The 2011 Notes were issued pursuant to the Indenture, and a supplemental indenture between us and the Trustee, dated March 17, 2011. The net proceeds from the sale of the 2011 Notes were used to fund a portion of the cash consideration payable in connection with the Pride acquisition.
Upon consummation of the Pride acquisition during 2011, we assumed the acquired company's outstanding debt comprised of $900.0 million aggregate principal amount of 6.875% senior notes due 2020, $500.0 million aggregate principal amount of 8.5% senior notes due 2019 and $300.0 million aggregate principal amount of 7.875% senior notes due 2040 (the "Acquired Notes"). Under a supplemental indenture, Ensco plc has fully and unconditionally guaranteed the performance of all Pride obligations with respect to the Acquired Notes. See "Note 15 - Guarantee of Registered Securities" for additional information on the guarantee of the Acquired Notes.
We may redeem each series of the 2014 Notes in whole, at any time or in part from time to time, prior to maturity. If we elect to redeem the 2014 Notes due 2024 before the date that is three months prior to the maturity date or the 2014 Notes due 2044 before the date that is six months prior to the maturity date, we will pay an amount equal to 100% of the principal amount of the notes redeemed plus accrued and unpaid interest and a "make-whole" premium. If we elect to redeem the 2014 Notes on or after the aforementioned dates, we will pay an amount equal to 100% of the principal amount of the notes redeemed plus accrued and unpaid interest but we are not required to pay a "make-whole" premium. We may redeem each series of the 2011 Notes and the Acquired Notes, in whole or in part, at any time, at a price equal to 100% of their principal amount, plus accrued and unpaid interest and a "make-whole" premium.
The indentures governing the 2014 Notes, the 2011 Notes and the Acquired Notes contain customary events of default, including failure to pay principal or interest on such Notes when due, among others. The indentures governing the 2014 Notes, the 2011 Notes and the Acquired Notes also contain certain restrictions, including, among others, restrictions on our ability and the ability of our subsidiaries to create or incur secured indebtedness, enter into certain sale/leaseback transactions and enter into certain merger or consolidation transactions.
Debentures Due 2027
During 1997, Ensco Delaware issued $150.0 million of unsecured 7.20% Debentures due November 15, 2027 (the "Debentures") in a public offering. Interest on the Debentures is payable semiannually in May and November. We may redeem the Debentures, in whole or in part, at any time prior to maturity, at a price equal to 100% of their principal amount, plus accrued and unpaid interest and a "make-whole" premium. The Debentures are not subject to any sinking fund requirements. During 2009, in connection with the redomestication, Ensco plc entered into a supplemental indenture to unconditionally guarantee the principal and interest payments on the Debentures.
The Debentures and the indenture and the supplemental indentures pursuant to which the Debentures were issued also contain customary events of default, including failure to pay principal or interest on the Debentures when due, among others. The indenture and the supplemental indentures contain certain restrictions, including, among others, restrictions on our ability and the ability of our subsidiaries to create or incur secured indebtedness, enter into certain sale/leaseback transactions and enter into certain merger or consolidation transactions.

25
MARAD Bonds Due 2016 and 2020
During 2001, a subsidiary of Ensco Delaware issued $190.0 million of 15-year bonds which are guaranteed by MARAD to provide long-term financing for ENSCO 7500. In December 2014, we fully redeemed the remaining outstanding principal of these bonds and incurred a "make-whole" payment of $600,000, and MARAD released its interests in ENSCO 7500.
During 2003, a subsidiary of Ensco Delaware issued $76.5 million of 17-year bonds which are guaranteed by MARAD to provide long-term financing for ENSCO 105. The bonds will be repaid in 34 equal semiannual principal installments of $2.3 million ending in October 2020. Interest on the bonds is payable semiannually, in April and October, at a fixed rate of 4.65%.
Ensco Delaware issued separate guaranties to MARAD, guaranteeing the performance of obligations under the bonds. During 2010, the documents governing MARAD's guarantee commitments were amended to address certain changes arising from the redomestication and to include Ensco plc as an additional guarantor of the debt obligations of Ensco Delaware and its subsidiaries.
Upon consummation of the Pride acquisition, we assumed $151.5 million of MARAD bonds issued to provide long-term financing for ENSCO 6003 and ENSCO 6004. The bonds are guaranteed by MARAD and will be repaid in semiannual principal installments ending in 2016. Interest on the bonds is payable semiannually at a weighted average fixed rate of 4.33%.
We may redeem each series of our outstanding MARAD bonds, in whole or in part, on any interest payment date, at a price equal to 100% of the their principal amount, plus accrued and unpaid interest and a “make-whole” premium.
Commercial Paper
We participate in a commercial paper program with four commercial paper dealers pursuant to which we may issue, on a private placement basis, unsecured commercial paper notes. During 2014, we increased the size of our program to permit the issuance of commercial paper notes in an aggregate principal amount not to exceed $2.25 billion at any time outstanding. Amounts issued under the commercial paper program are supported by the available and unused committed capacity under our credit facility. As a result, amounts issued under the commercial paper program are limited by the amount of our available and unused committed capacity under our credit facility. The proceeds of such financings may be used for capital expenditures and other general corporate purposes. The commercial paper bears interest at rates that vary based on market conditions and the ratings assigned by credit rating agencies at the time of issuance. The weighted-average interest rate on our commercial paper borrowings was 0.26% and 0.35% during 2014 and 2013, respectively. Commercial paper maturities will vary but may not exceed 364 days from the date of issue. The commercial paper is not redeemable or subject to voluntary prepayment by us prior to maturity. We had no amounts outstanding under our commercial paper program as of December 31, 2014 and 2013.
Revolving Credit Facility
On September 30, 2014, we entered into an amendment to the Fourth Amended and Restated Credit Agreement (the "Five-Year Credit Facility"), among Ensco, Citibank, N.A., as Administrative Agent, DNB Bank ASA, as Syndication Agent, and a syndicate of banks. This amendment extended the Five-Year Credit Facility maturity date from May 7, 2018 to September 30, 2019 and increased the total commitment of the lenders from $2.0 billion to $2.25 billion. As amended, the Five-Year Credit Facility provides for a $2.25 billion senior unsecured revolving credit facility to be used for general corporate purposes.
26
Advances under the Five-Year Credit Facility bear interest at Base Rate or LIBOR plus an applicable margin rate (currently 0.125% per annum for Base Rate advances and 1.125% per annum for LIBOR advances) depending on our credit rating. Amounts repaid may be re-borrowed during the term of the Five-Year Credit Facility. We are required to pay a quarterly commitment fee (currently 0.125% per annum) on the undrawn portion of the $2.25 billion commitment which is also based on our credit rating. In addition to other customary restrictive covenants, the Five-Year Credit Facility requires us to maintain a total debt to total capitalization ratio of less than or equal to 50%. We have the right, subject to receipt of commitments from new or existing lenders, to increase the commitments under the Five-Year Credit Facility to an aggregate amount of up to $2.75 billion. We had no amounts outstanding under the Five-Year Credit Facility as of December 31, 2014 and 2013.
Other Financing
We filed an automatically effective shelf registration statement on Form S-3 with the U.S. Securities and Exchange Commission ("SEC") on January 15, 2015, which provides us the ability to issue debt securities, equity securities, guarantees and/or units of securities in one or more offerings. The registration statement, as amended, expires in January 2018.
In May 2013, our shareholders approved a new share repurchase program. Subject to certain provisions under English law, including the requirement of Ensco plc to have sufficient distributable reserves, we may purchase shares up to a maximum of $2.0 billion in the aggregate under the program, but in no case more than 35.0 million shares. The program terminates in May 2018.
In June 2014, we completed a capital reorganization under UK law (the “Capital Reorganization”), that provides the Company with greater flexibility going forward to return capital to shareholders in the form of dividends and share repurchases. The Capital Reorganization, which was authorized by our Board of Directors and approved by our shareholders at the Annual General Meeting in May 2014, was achieved through the issuance and subsequent cancellation of $3.0 billion of a newly-created class of shares (the “Capital Reorganization Shares”).
The Capital Reorganization Shares had no substantive economic or voting rights and were issued to a subsidiary of the Company on June 17, 2014 for the benefit of existing shareholders solely for the purpose of the Capital Reorganization transaction. Upon cancellation of the shares on June 18, 2014, $3.0 billion of the shareholders' equity of Ensco plc that was previously deemed non-distributable under UK law is now included in distributable reserves.
The Capital Reorganization did not involve any distribution or repayment of capital nor did it have an impact on the underlying net assets of the Company. There was no net impact on our shareholders’ equity for any period as a result of the Capital Reorganization.

27
Contractual Obligations We have various contractual commitments related to our new rig construction and rig enhancement agreements, long-term debt and operating leases. We expect to fund these commitments from existing cash and short-term investments, future operating cash flows and borrowings under our commercial paper program and/or revolving credit facility. The actual timing of our new rig construction and rig enhancement payments may vary based on the completion of various milestones which are beyond our control. The following table summarizes our significant contractual obligations as of December 31, 2014 and the periods in which such obligations are due (in millions):
Payments due by period
2015
2016 and 2017
2018 and 2019 Thereafter Total
New rig construction agreements $ 1,353.5 $ 373.8 $ — $ — $ 1,727.3Principal payments on long-term debt 34.8 1,024.2 509.0 4,104.5 5,672.5Interest payments on long-term debt 309.1 565.1 526.4 1,771.1 3,171.7Operating leases 77.3 48.0 20.8 55.0 201.1Rig enhancement agreements 42.8 — — — 42.8Total contractual obligations(1) $ 1,817.5 $ 2,011.1 $ 1,056.2 $ 5,930.6 $ 10,815.4
(1) Contractual obligations do not include $160.9 million of unrecognized tax benefits, inclusive of interest and penalties, included on our consolidated balance sheet as of December 31, 2014. We are unable to specify with certainty the future periods in which we may be obligated to settle such amounts.
Contractual obligations do not include foreign currency forward contracts ("derivatives"). As of December 31, 2014, we had derivatives outstanding to exchange an aggregate $580.6 million U.S. dollars for various foreign currencies. As of December 31, 2014, our consolidated balance sheet included net derivative liabilities of $26.3 million. All of our outstanding derivatives mature during the next 18 months.
a
Other Commitments We have other commitments that we are contractually obligated to fulfill with cash under certain circumstances. These commitments include letters of credit to guarantee our performance as it relates to our drilling contracts, contract bidding, customs duties, tax appeals and other obligations in various jurisdictions. Obligations under these letters of credit are not normally called, as we typically comply with the underlying performance requirement. As of December 31, 2014, we had not been required to make collateral deposits with respect to these agreements. The following table summarizes our other commitments as of December 31, 2014 (in millions):
Commitment expiration by period
2015
2016 and 2017
2018 and 2019 Thereafter Total
Letters of Credit $ 80.5 $ 47.0 $ 136.2 $ .2 $ 263.9

28
Liquidity
Our liquidity position as of December 31, 2014, 2013 and 2012 is summarized below (in millions, except ratios):
2014 2013 2012 Cash and cash equivalents $ 664.8 $ 165.6 $ 487.1Short-term investments 757.3 50.0 50.0Working capital 1,830.2 487.9 734.2Current ratio 2.7 1.5 1.7
We expect to fund our short-term liquidity needs, including contractual obligations and anticipated capital expenditures, as well as dividends or working capital requirements, from our cash and cash equivalents, short-term investments, operating cash flows, funds borrowed under our commercial paper program and, if necessary, funds borrowed under our revolving credit facility.
We expect to fund our long-term liquidity needs, including contractual obligations, anticipated capital expenditures and dividends from our operating cash flows and, if necessary, funds borrowed under our revolving credit facility or other future financing arrangements.
We may decide to access debt and/or equity markets to raise additional capital or increase liquidity as necessary.
Effects of Climate Change and Climate Change Regulation
Greenhouse gas ("GHG") emissions have increasingly become the subject of international, national, regional, state and local attention. During 2009, the United States Environmental Protection Agency (the "EPA") officially published its findings that emissions of carbon dioxide, methane and other GHGs present an endangerment to human health and the environment because emissions of such gases are, according to the EPA, contributing to warming of the earth's atmosphere and other climatic changes. These EPA findings allowed the agency to proceed with the adoption and implementation of regulations to restrict GHG emissions under existing provisions of the Clean Air Act that establish Prevention of Significant Deterioration ("PSD") construction and Title V operating permit reviews for certain large stationary sources that are potential major sources of GHG emissions. Facilities required to obtain PSD permits for their GHG emissions also will be required to meet "best available control technology" standards to be established by the states or, in some cases, the EPA, on a case-by-case basis. The EPA has also adopted rules requiring annual monitoring and reporting of GHG emissions from specified sources in the United States, including, among others, certain onshore and offshore oil and natural gas production facilities.
The Companies Act 2006 (Strategic and Directors' Reports) Regulations 2013 now requires all quoted U.K. companies to report their annual GHG emissions in the company's directors' report. Additionally, in recent years, cap and trade initiatives to limit GHG emissions have been introduced in the European Union. Similarly, a number of bills related to climate change have been introduced in the U.S. Congress. If these or similar bills were to be adopted, such legislation could adversely impact many industries. However, it appears unlikely that comprehensive federal climate legislation will be passed by Congress in the foreseeable future. In the absence of federal legislation, almost half of the states have begun to address GHG emissions, primarily through the development or planned development of emission inventories or regional GHG cap and trade programs. Future regulation of GHG emissions could occur pursuant to future treaty obligations, statutory or regulatory changes or new climate change legislation in the jurisdictions in which we operate. If Congress undertakes comprehensive tax reform in the future, it is possible that such reform may include a carbon tax, which could impose additional direct costs on operations and reduce demand for refined products. Depending on the particular program, we, or our customers, could be required to control GHG emissions or to purchase and surrender allowances for GHG emissions resulting from our operations. It is uncertain whether any of these initiatives will be implemented. If such initiatives are implemented, we do not believe that such initiatives would have a

29
direct, material adverse effect on our financial condition, operating results or cash flows in a manner different than our competitors.
Restrictions on GHG emissions or other related legislative or regulatory enactments could have an indirect effect in those industries that use significant amounts of petroleum products, which could potentially result in a reduction in demand for petroleum products and, consequently, our offshore contract drilling services. We are currently unable to predict the manner or extent of any such effect. Furthermore, one of the long-term physical effects of climate change may be an increase in the severity and frequency of adverse weather conditions, such as hurricanes, which may increase our insurance costs or risk retention, limit insurance availability or reduce the areas in which, or the number of days during which, our customers would contract for our drilling rigs in general and in the Gulf of Mexico in particular. We are currently unable to predict the manner or extent of any such effect.
MARKET RISK
We use derivatives to reduce our exposure to foreign currency exchange rate risk. Our functional currency is the U.S. dollar. As is customary in the oil and gas industry, a majority of our revenues and expenses are denominated in U.S. dollars; however, a portion of the revenues earned and expenses incurred by certain of our subsidiaries are denominated in currencies other than the U.S. dollar. We maintain a foreign currency exchange rate risk management strategy that utilizes derivatives to reduce our exposure to unanticipated fluctuations in earnings and cash flows caused by changes in foreign currency exchange rates.
We utilize cash flow hedges to hedge forecasted foreign currency denominated transactions, primarily to reduce our exposure to foreign currency exchange rate risk on future expected contract drilling expenses and capital expenditures denominated in various foreign currencies. We predominantly structure our drilling contracts in U.S. dollars, which significantly reduces the portion of our cash flows and assets denominated in foreign currencies. As of December 31, 2014, we had cash flow hedges outstanding to exchange an aggregate $373.1 million for various foreign currencies.
We have net assets and liabilities denominated in numerous foreign currencies and use various strategies to manage our exposure to changes in foreign currency exchange rates. We occasionally enter into derivatives that hedge the fair value of recognized foreign currency denominated assets or liabilities, thereby reducing exposure to earnings fluctuations caused by changes in foreign currency exchange rates. We do not designate such derivatives as hedging instruments. In these situations, a natural hedging relationship generally exists whereby changes in the fair value of the derivatives offset changes in the fair value of the underlying hedged items. As of December 31, 2014, we held derivatives not designated as hedging instruments to exchange an aggregate $207.5 million for various foreign currencies.
If we were to incur a hypothetical 10% adverse change in foreign currency exchange rates, net unrealized losses associated with our foreign currency denominated assets and liabilities as of December 31, 2014 would approximate $21.7 million. Approximately $18.1 million of these unrealized losses would be offset by corresponding gains on the derivatives utilized to offset changes in the fair value of net assets and liabilities denominated in foreign currencies.
We utilize derivatives and undertake foreign currency exchange rate hedging activities in accordance with our established policies for the management of market risk. We mitigate our credit risk relating to counterparties of our derivatives through a variety of techniques, including transacting with multiple, high-quality financial institutions, thereby limiting our exposure to individual counterparties and by entering into International Swaps and Derivatives Association, Inc. (“ISDA”) Master Agreements, which include provisions for a legally enforceable master netting agreement, with almost all of our derivative counterparties. The terms of the ISDA agreements may also include credit support requirements, cross default provisions, termination events, or set-off provisions. Legally enforceable master netting agreements reduce credit risk by providing protection in bankruptcy in certain circumstances and generally permitting the closeout and netting of transactions with the same counterparty upon the occurrence of certain events.
30
We do not enter into derivatives for trading or other speculative purposes. We believe that our use of derivatives and related hedging activities reduces our exposure to foreign currency exchange rate risk and does not expose us to material credit risk or any other material market risk. All our derivatives mature during the next 18 months. See Note 5 to our consolidated financial statements for additional information on our derivative instruments.
CRITICAL ACCOUNTING POLICIES AND ESTIMATES
The preparation of financial statements and related disclosures in conformity with accounting principles generally accepted in the United States of America requires our management to make estimates, judgments and assumptions that affect the amounts reported in our consolidated financial statements and accompanying notes. Our significant accounting policies are included in Note 1 to our consolidated financial statements. These policies, along with our underlying judgments and assumptions made in their application, have a significant impact on our consolidated financial statements. We identify our critical accounting policies as those that are the most pervasive and important to the portrayal of our financial position and operating results and that require the most difficult, subjective and/or complex judgments by management regarding estimates in matters that are inherently uncertain. Our critical accounting policies are those related to property and equipment, impairment of long-lived assets and goodwill and income taxes.
Property and Equipment
As of December 31, 2014, the carrying value of our property and equipment totaled $12.5 billion, which represented 78% of total assets. This carrying value reflects the application of our property and equipment accounting policies, which incorporate management's estimates, judgments and assumptions relative to the capitalized costs, useful lives and salvage values of our rigs.
We develop and apply property and equipment accounting policies that are designed to appropriately and consistently capitalize those costs incurred to enhance, improve and extend the useful lives of our assets and expense those costs incurred to repair or maintain the existing condition or useful lives of our assets. The development and application of such policies requires estimates, judgments and assumptions by management relative to the nature of, and benefits from, expenditures on our assets. We establish property and equipment accounting policies that are designed to depreciate our assets over their estimated useful lives. The judgments and assumptions used by management in determining the useful lives of our property and equipment reflect both historical experience and expectations regarding future operations, utilization and performance of our assets. The use of different estimates, judgments and assumptions in the establishment of our property and equipment accounting policies, especially those involving the useful lives of our rigs, would likely result in materially different asset carrying values and operating results.
The useful lives of our drilling rigs are difficult to estimate due to a variety of factors, including technological advances that impact the methods or cost of oil and natural gas exploration and development, changes in market or economic conditions and changes in laws or regulations affecting the drilling industry. We evaluate the remaining useful lives of our rigs on a periodic basis, considering operating condition, functional capability and market and economic factors.
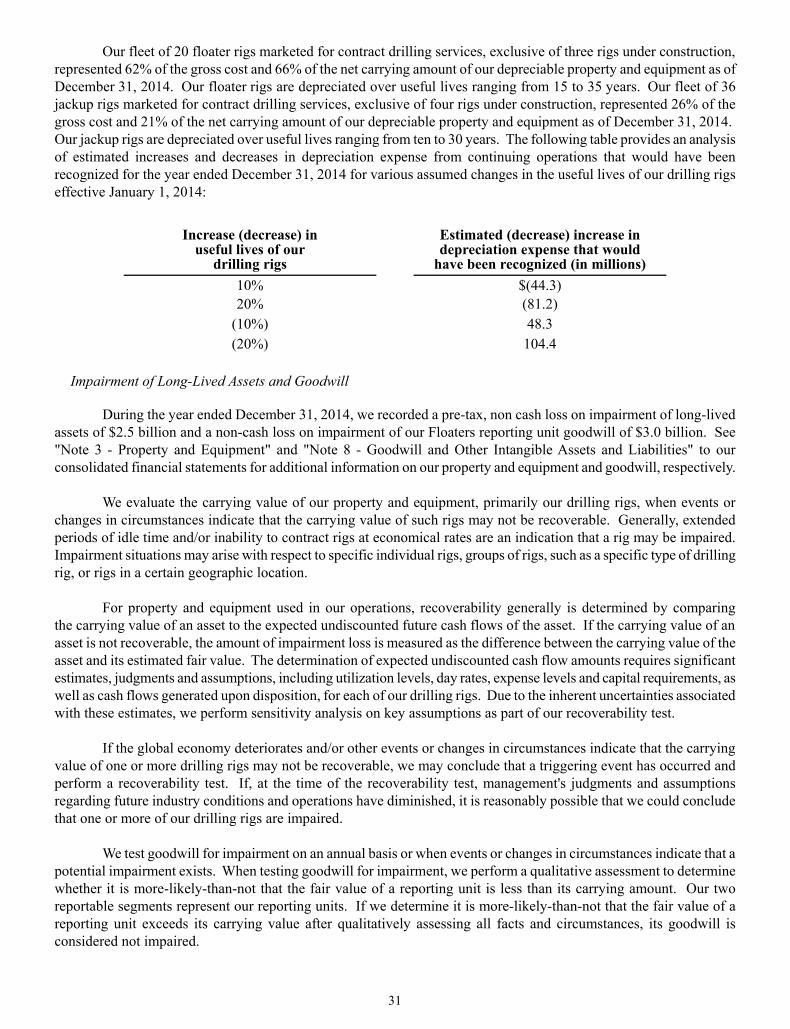
31
Our fleet of 20 floater rigs marketed for contract drilling services, exclusive of three rigs under construction, represented 62% of the gross cost and 66% of the net carrying amount of our depreciable property and equipment as of December 31, 2014. Our floater rigs are depreciated over useful lives ranging from 15 to 35 years. Our fleet of 36 jackup rigs marketed for contract drilling services, exclusive of four rigs under construction, represented 26% of the gross cost and 21% of the net carrying amount of our depreciable property and equipment as of December 31, 2014. Our jackup rigs are depreciated over useful lives ranging from ten to 30 years. The following table provides an analysis of estimated increases and decreases in depreciation expense from continuing operations that would have been recognized for the year ended December 31, 2014 for various assumed changes in the useful lives of our drilling rigs effective January 1, 2014:
Increase (decrease) in useful lives of our
drilling rigs
Estimated (decrease) increase in depreciation expense that would
have been recognized (in millions) 10% $(44.3) 20% (81.2)
(10%) 48.3 (20%) 104.4
Impairment of Long-Lived Assets and Goodwill
During the year ended December 31, 2014, we recorded a pre-tax, non cash loss on impairment of long-lived assets of $2.5 billion and a non-cash loss on impairment of our Floaters reporting unit goodwill of $3.0 billion. See "Note 3 - Property and Equipment" and "Note 8 - Goodwill and Other Intangible Assets and Liabilities" to our consolidated financial statements for additional information on our property and equipment and goodwill, respectively.
We evaluate the carrying value of our property and equipment, primarily our drilling rigs, when events or changes in circumstances indicate that the carrying value of such rigs may not be recoverable. Generally, extended periods of idle time and/or inability to contract rigs at economical rates are an indication that a rig may be impaired. Impairment situations may arise with respect to specific individual rigs, groups of rigs, such as a specific type of drilling rig, or rigs in a certain geographic location.
For property and equipment used in our operations, recoverability generally is determined by comparing the carrying value of an asset to the expected undiscounted future cash flows of the asset. If the carrying value of an asset is not recoverable, the amount of impairment loss is measured as the difference between the carrying value of the asset and its estimated fair value. The determination of expected undiscounted cash flow amounts requires significant estimates, judgments and assumptions, including utilization levels, day rates, expense levels and capital requirements, as well as cash flows generated upon disposition, for each of our drilling rigs. Due to the inherent uncertainties associated with these estimates, we perform sensitivity analysis on key assumptions as part of our recoverability test.
If the global economy deteriorates and/or other events or changes in circumstances indicate that the carrying value of one or more drilling rigs may not be recoverable, we may conclude that a triggering event has occurred and perform a recoverability test. If, at the time of the recoverability test, management's judgments and assumptions regarding future industry conditions and operations have diminished, it is reasonably possible that we could conclude that one or more of our drilling rigs are impaired.
We test goodwill for impairment on an annual basis or when events or changes in circumstances indicate that a potential impairment exists. When testing goodwill for impairment, we perform a qualitative assessment to determine whether it is more-likely-than-not that the fair value of a reporting unit is less than its carrying amount. Our two reportable segments represent our reporting units. If we determine it is more-likely-than-not that the fair value of a reporting unit exceeds its carrying value after qualitatively assessing all facts and circumstances, its goodwill is considered not impaired.

32
If the global economy deteriorates and/or our expectations relative to future offshore drilling industry conditions decline, we may conclude that the fair value of one or both of our reporting units has more-likely-than-not declined below its carrying amount and perform a quantitative assessment whereby we estimate the fair value of each reporting unit. If, at the time of the goodwill impairment test, management's judgments and assumptions regarding future industry conditions and operations have diminished, or if the market value of our shares has declined, we could conclude that the goodwill of one or both of our reporting units has been impaired. The calculation of fair values of our reporting units is based on a blended income and market approach. The income approach is based on estimates of future discounted cash flows to be generated by our drilling rigs, which reflect management's judgments and assumptions regarding the appropriate risk-adjusted discount rate, as well as future industry conditions and operations, including expected utilization levels, day rates, expense levels, capital requirements and terminal values for each of our rigs. Due to the inherent uncertainties associated with these estimates, we perform sensitivity analysis on key assumptions as part of our goodwill impairment test. It is reasonably possible that the judgments and assumptions inherent in our goodwill impairment test may change in response to future market conditions. If the aggregate fair value of our reporting units exceeds our market capitalization, we evaluate the reasonableness of the implied control premium which includes a comparison to implied control premiums from recent market transactions within our industry or other relevant benchmark data. To the extent that the implied control premium based on the aggregate fair value of our reporting units is not reasonable, we adjust the discount rate or other assumptions used in our discounted cash flow model and reduce the estimated fair values of our reporting units. If the estimated fair value of a reporting unit exceeds its carrying value, its goodwill is considered not impaired. If the estimated fair value of a reporting unit is less than its carrying value, we estimate the implied fair value of the reporting unit's goodwill. If the carrying amount of the reporting unit's goodwill exceeds the implied fair value of the goodwill, an impairment loss is recognized in an amount equal to such excess. In the event we dispose of drilling rig operations that constitute a business, goodwill would be allocated in the determination of gain or loss on disposal. Asset impairment evaluations are highly subjective. In most instances, they involve expectations of future cash flows to be generated by our drilling rigs, which reflect management's judgments and assumptions regarding future industry conditions and operations, as well as management's estimates of expected utilization levels, day rates, expense levels and capital requirements. The estimates, judgments and assumptions used by management in the application of our asset impairment policies reflect both historical experience and an assessment of current operational, industry, market, economic and political environments. The use of different estimates, judgments, assumptions and expectations regarding future industry conditions and operations would likely result in materially different asset carrying values and operating results.
Income Taxes We conduct operations and earn income in numerous countries and are subject to the laws of numerous tax jurisdictions. As of December 31, 2014, our consolidated balance sheet included an $81.3 million net deferred income tax liability, an $84.2 million liability for income taxes currently payable and a $160.9 million liability for unrecognized tax benefits, inclusive of interest and penalties. The carrying values of deferred income tax assets and liabilities reflect the application of our income tax accounting policies and are based on management's estimates, judgments and assumptions regarding future operating results and levels of taxable income. Carryforwards and tax credits are assessed for realization as a reduction of future taxable income by using a more-likely-than-not determination. We do not offset deferred tax assets and deferred tax liabilities attributable to different tax paying jurisdictions. We do not provide deferred taxes on the undistributed earnings of certain subsidiaries because our policy and intention is to reinvest such earnings indefinitely. Should we make a distribution from these subsidiaries in the form of dividends or otherwise, we would be subject to additional income taxes.

33
The carrying values of liabilities for income taxes currently payable and unrecognized tax benefits are based on management's interpretation of applicable tax laws and incorporate management's estimates, judgments and assumptions regarding the use of tax planning strategies in various taxing jurisdictions. The use of different estimates, judgments and assumptions in connection with accounting for income taxes, especially those involving the deployment of tax planning strategies, may result in materially different carrying values of income tax assets and liabilities and operating results.
We operate in several jurisdictions where tax laws relating to the offshore drilling industry are not well developed. In jurisdictions where available statutory law and regulations are incomplete or underdeveloped, we obtain professional guidance and consider existing industry practices before utilizing tax planning strategies and meeting our tax obligations.
Tax returns are routinely subject to audit in most jurisdictions and tax liabilities occasionally are finalized through a negotiation process. In some jurisdictions, income tax payments may be required before a final income tax obligation is determined in order to avoid significant penalties and/or interest. While we historically have not experienced significant adjustments to previously recognized tax assets and liabilities as a result of finalizing tax returns, there can be no assurance that significant adjustments will not arise in the future. In addition, there are several factors that could cause the future level of uncertainty relating to our tax liabilities to increase, including the following:
• During recent years, the number of tax jurisdictions in which we conduct operations has increased, and wecurrently anticipate that this trend will continue.
• In order to utilize tax planning strategies and conduct operations efficiently, our subsidiaries frequently enterinto transactions with affiliates that are generally subject to complex tax regulations and are frequently reviewed and challenged by tax authorities.
• We may conduct future operations in certain tax jurisdictions where tax laws are not well developed, and it may be difficult to secure adequate professional guidance.
• Tax laws, regulations, agreements, treaties and the administrative practices and precedents of tax authoritieschange frequently, requiring us to modify existing tax strategies to conform to such changes.
NEW ACCOUNTING PRONOUNCEMENTS
In April 2014, the Financial Accounting Standards Board issued Accounting Standards Update 2014-08, Presentation of Financial Statements (Topic 205) and Property, Plant, and Equipment (Topic 360): Reporting Discontinued Operations and Disclosures of Disposals of Components of an Entity ("Update 2014-08"). The new guidance changes the criteria for reporting discontinued operations and enhances disclosure requirements. Under the new guidance, only disposals representing a strategic shift in operations should be presented as discontinued operations. Update 2014-08 is effective for annual and interim periods for fiscal years beginning on or after December 15, 2014 and early adoption is permitted for disposals that have not been reported in financial statements previously issued or available for issuance. We will adopt the accounting standard on January 1, 2015. The adoption of ASU 2014-08 is expected to reduce the number of components reported as discontinued operations prospectively in our consolidated financial statements.
In May 2014, the Financial Accounting Standards Board issued Accounting Standards Update 2014-09, Revenue from Contracts with Customers (Topic 606) ("Update 2014-09"), which requires an entity to recognize the amount of revenue to which it expects to be entitled for the transfer of promised goods or services to customers. The ASU will replace most existing revenue recognition guidance in U.S. GAAP when it becomes effective on January 1, 2017. Early application is not permitted. We are currently evaluating the effect that ASU 2014-09 will have on our consolidated financial statements and related disclosures.

34
In June 2014, the Financial Accounting Standards Board issued Accounting Standards Update 2014-12, Compensation- Stock Compensation (Topic 718): Accounting for Share Payments When the Terms of an Award Provide That a Performance Target Could be Achieved After the Requisite Service Period ("Update 2014-12"). The new guidance clarifies that entities should treat performance targets that can be met after the requisite service period of a share-based payment award as performance conditions that affect vesting. Update 2014-12 is effective for annual and interim periods for fiscal years beginning after December 15, 2015 and early adoption is permitted. We will adopt the accounting standard on a prospective basis effective January 1, 2016. We do not expect the adoption to have a material effect on our consolidated financial statements.
In August 2014, the Financial Accounting Standards Board issued Accounting Standards Update 2014-15, Presentation of Financial Statements - Going Concern (Subtopic 205-40): Disclosure of Uncertainties about an Entity’s Ability to Continue as a Going Concern (“Update 2014-15”). The new guidance clarifies management’s responsibility to evaluate whether there is substantial doubt about an entity’s ability to continue as a going concern and to provide related footnote disclosures. Update 2014-15 is effective for annual periods ending after December 15, 2016 and for annual periods and interim periods thereafter. Early adoption is permitted. We will adopt the accounting standard on January 1, 2016. We do not expect the adoption to have a material effect on our consolidated financial statements.
Financial Statements and Supplementary Data
MANAGEMENT'S REPORT ON INTERNAL CONTROL OVER FINANCIAL REPORTING
Our management is responsible for establishing and maintaining adequate internal control over financial reporting, as such term is defined in Exchange Act Rules 13a-15(f) or 15d-15(f). Our internal control over financial reporting system is designed to provide reasonable assurance to our management and Board of Directors regarding the preparation and fair presentation of published financial statements. Because of its inherent limitations, internal control over financial reporting may not prevent or detect misstatements. Therefore, even those systems determined to be effective can provide only reasonable assurance with respect to financial statement preparation and presentation. Projections of any evaluation of effectiveness to future periods are subject to the risk that controls may become inadequate because of changes in conditions, or that the degree of compliance with the policies or procedures may deteriorate.
Under the supervision and with the participation of management, including the Chief Executive Officer and Chief Financial Officer, we have conducted an evaluation of the effectiveness of our internal control over financial reporting based on the framework in Internal Control - Integrated Framework (1992) issued by the Committee of Sponsoring Organizations of the Treadway Commission. Based on this evaluation, we have concluded that our internal control over financial reporting is effective as of December 31, 2014 to provide reasonable assurance regarding the reliability of financial reporting and the preparation of financial statements for external purposes in accordance with generally accepted accounting principles.
KPMG LLP, the independent registered public accounting firm who audited our consolidated financial statements, has issued an audit report on our internal control over financial reporting. KPMG LLP's audit report on our internal control over financial reporting is included herein.
March 2, 2015

35
REPORT OF INDEPENDENT REGISTERED PUBLIC ACCOUNTING FIRM
The Board of Directors and Shareholders Ensco plc:
We have audited the accompanying consolidated balance sheets of Ensco plc and subsidiaries (the Company) as of December 31, 2014 and 2013, and the related consolidated statements of operations, comprehensive (loss) income, and cash flows for each of the years in the three-year period ended December 31, 2014. These consolidated financial statements are the responsibility of the Company’s management. Our responsibility is to express an opinion on these consolidated financial statements based on our audits.
We conducted our audits in accordance with the standards of the Public Company Accounting Oversight Board (United States). Those standards require that we plan and perform the audit to obtain reasonable assurance about whether the financial statements are free of material misstatement. An audit includes examining, on a test basis, evidence supporting the amounts and disclosures in the financial statements. An audit also includes assessing the accounting principles used and significant estimates made by management, as well as evaluating the overall financial statement presentation. We believe that our audits provide a reasonable basis for our opinion.
In our opinion, the consolidated financial statements referred to above present fairly, in all material respects, the financial position of Ensco plc and subsidiaries as of December 31, 2014 and 2013, and the results of their operations and their cash flows for each of the years in the three-year period ended December 31, 2014, in conformity with U.S. generally accepted accounting principles.
We also have audited, in accordance with the standards of the Public Company Accounting Oversight Board (United States), Ensco plc’s internal control over financial reporting as of December 31, 2014, based on criteria established in Internal Control - Integrated Framework (1992) issued by the Committee of Sponsoring Organizations of the Treadway Commission (COSO), and our report dated March 2, 2015 expressed an unqualified opinion on the effectiveness of the Company’s internal control over financial reporting.
/s/ KPMG LLP
Houston, Texas March 2, 2015

36
REPORT OF INDEPENDENT REGISTERED PUBLIC ACCOUNTING FIRM
The Board of Directors and Shareholders Ensco plc:
We have audited Ensco plc’s (the Company) internal control over financial reporting as of December 31, 2014, based on criteria established in Internal Control - Integrated Framework (1992) issued by the Committee of Sponsoring Organizations of the Treadway Commission (COSO). The Company’s management is responsible for maintaining effective internal control over financial reporting and for its assessment of the effectiveness of internal control over financial reporting, included in the accompanying Management’s Report on Internal Control over Financial Reporting. Our responsibility is to express an opinion on the Company’s internal control over financial reporting based on our audit.
We conducted our audit in accordance with the standards of the Public Company Accounting Oversight Board (United States). Those standards require that we plan and perform the audit to obtain reasonable assurance about whether effective internal control over financial reporting was maintained in all material respects. Our audit included obtaining an understanding of internal control over financial reporting, assessing the risk that a material weakness exists, and testing and evaluating the design and operating effectiveness of internal control based on the assessed risk. Our audit also included performing such other procedures as we considered necessary in the circumstances. We believe that our audit provides a reasonable basis for our opinion.
A company’s internal control over financial reporting is a process designed to provide reasonable assurance regarding the reliability of financial reporting and the preparation of financial statements for external purposes in accordance with generally accepted accounting principles. A company’s internal control over financial reporting includes those policies and procedures that (1) pertain to the maintenance of records that, in reasonable detail, accurately and fairly reflect the transactions and dispositions of the assets of the company; (2) provide reasonable assurance that transactions are recorded as necessary to permit preparation of financial statements in accordance with generally accepted accounting principles, and that receipts and expenditures of the company are being made only in accordance with authorizations of management and directors of the company; and (3) provide reasonable assurance regarding prevention or timely detection of unauthorized acquisition, use, or disposition of the company’s assets that could have a material effect on the financial statements.
Because of its inherent limitations, internal control over financial reporting may not prevent or detect misstatements. Also, projections of any evaluation of effectiveness to future periods are subject to the risk that controls may become inadequate because of changes in conditions, or that the degree of compliance with the policies or procedures may deteriorate.
In our opinion, Ensco plc maintained, in all material respects, effective internal control over financial reporting as of December 31, 2014, based on criteria established in Internal Control - Integrated Framework (1992) issued by the Committee of Sponsoring Organizations of the Treadway Commission (COSO).
We also have audited, in accordance with the standards of the Public Company Accounting Oversight Board (United States), the consolidated balance sheets of Ensco plc and subsidiaries as of December 31, 2014 and 2013, and the related consolidated statements of operations, comprehensive (loss) income, and cash flows for each of the years in the three-year period ended December 31, 2014, and our report dated March 2, 2015 expressed an unqualified opinion on those consolidated financial statements.
/s/ KPMG LLP
Houston, Texas March 2, 2015
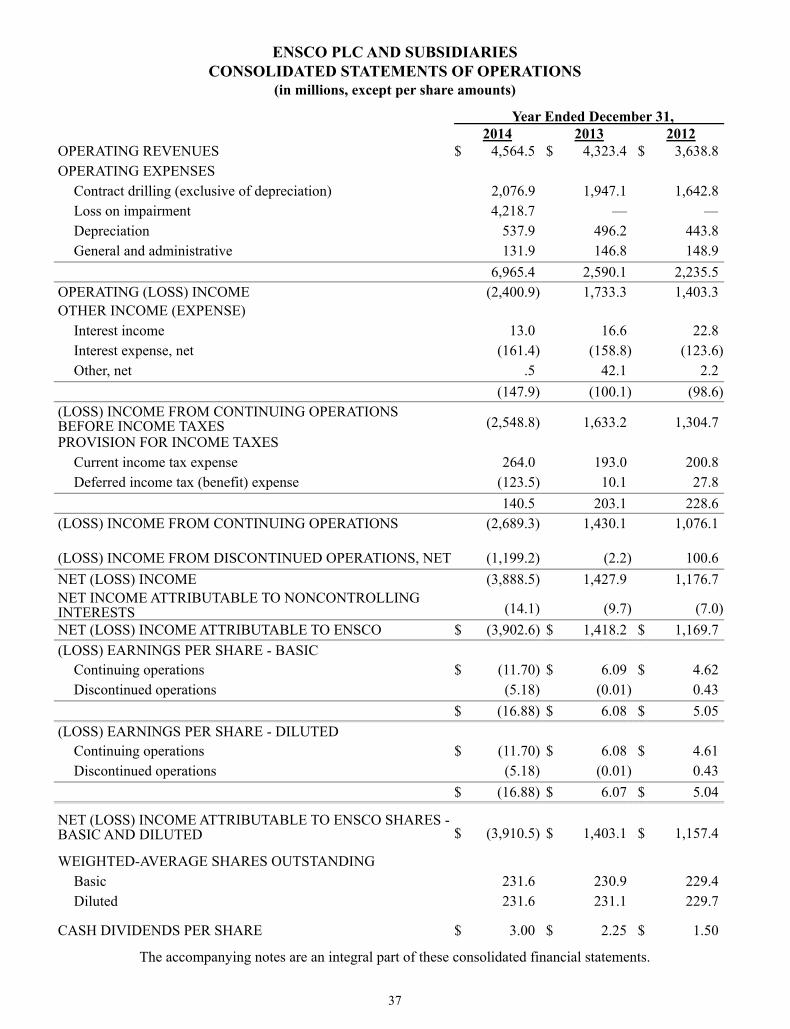
37
ENSCO PLC AND SUBSIDIARIES CONSOLIDATED STATEMENTS OF OPERATIONS
(in millions, except per share amounts)
Year Ended December 31,2014 2013 2012
OPERATING REVENUES $ 4,564.5 $ 4,323.4 $ 3,638.8OPERATING EXPENSES
Contract drilling (exclusive of depreciation) 2,076.9 1,947.1 1,642.8Loss on impairment 4,218.7 — —Depreciation 537.9 496.2 443.8General and administrative 131.9 146.8 148.9
6,965.4 2,590.1 2,235.5OPERATING (LOSS) INCOME (2,400.9) 1,733.3 1,403.3OTHER INCOME (EXPENSE)
Interest income 13.0 16.6 22.8Interest expense, net (161.4) (158.8) (123.6)Other, net .5 42.1 2.2
(147.9) (100.1) (98.6)(LOSS) INCOME FROM CONTINUING OPERATIONS BEFORE INCOME TAXES (2,548.8) 1,633.2 1,304.7PROVISION FOR INCOME TAXES
Current income tax expense 264.0 193.0 200.8Deferred income tax (benefit) expense (123.5) 10.1 27.8
140.5 203.1 228.6(LOSS) INCOME FROM CONTINUING OPERATIONS (2,689.3) 1,430.1 1,076.1
(LOSS) INCOME FROM DISCONTINUED OPERATIONS, NET (1,199.2) (2.2) 100.6NET (LOSS) INCOME (3,888.5) 1,427.9 1,176.7NET INCOME ATTRIBUTABLE TO NONCONTROLLING INTERESTS (14.1) (9.7) (7.0)NET (LOSS) INCOME ATTRIBUTABLE TO ENSCO $ (3,902.6) $ 1,418.2 $ 1,169.7(LOSS) EARNINGS PER SHARE - BASIC
Continuing operations $ (11.70) $ 6.09 $ 4.62Discontinued operations (5.18) (0.01) 0.43
$ (16.88) $ 6.08 $ 5.05(LOSS) EARNINGS PER SHARE - DILUTED
Continuing operations $ (11.70) $ 6.08 $ 4.61Discontinued operations (5.18) (0.01) 0.43
$ (16.88) $ 6.07 $ 5.04
NET (LOSS) INCOME ATTRIBUTABLE TO ENSCO SHARES -BASIC AND DILUTED $ (3,910.5) $ 1,403.1 $ 1,157.4
WEIGHTED-AVERAGE SHARES OUTSTANDING Basic 231.6 230.9 229.4Diluted 231.6 231.1 229.7
CASH DIVIDENDS PER SHARE $ 3.00 $ 2.25 $ 1.50
The accompanying notes are an integral part of these consolidated financial statements.

38
ENSCO PLC AND SUBSIDIARIES CONSOLIDATED STATEMENTS OF COMPREHENSIVE (LOSS) INCOME
(in millions)
Year Ended December 31, 2014 2013 2012 NET (LOSS) INCOME $ (3,888.5) $ 1,427.9 $ 1,176.7OTHER COMPREHENSIVE (LOSS) INCOME, NET
Net change in fair value of derivatives (11.7) (5.8) 8.7Reclassification of net (gains) losses on derivative instruments from
other comprehensive income into net income (.9) 2.0 —Other 6.3 1.9 2.8
NET OTHER COMPREHENSIVE (LOSS) INCOME (6.3) (1.9) 11.5
COMPREHENSIVE (LOSS) INCOME (3,894.8) 1,426.0 1,188.2COMPREHENSIVE INCOME ATTRIBUTABLE TO
NONCONTROLLING INTERESTS (14.1) (9.7) (7.0)COMPREHENSIVE (LOSS) INCOME ATTRIBUTABLE TO ENSCO $ (3,908.9) $ 1,416.3 $ 1,181.2
The accompanying notes are an integral part of these consolidated financial statements.

39
ENSCO PLC AND SUBSIDIARIES CONSOLIDATED BALANCE SHEETS
(in millions, except share and par value amounts)
December 31, ASSETS 2014 2013
CURRENT ASSETS Cash and cash equivalents $ 664.8 $ 165.6
Short-term investments 757.3 50.0Accounts receivable, net 883.3 855.7Other 629.4 463.9
Total current assets 2,934.8 1,535.2PROPERTY AND EQUIPMENT, AT COST 14,975.5 17,498.5
Less accumulated depreciation 2,440.7 3,187.5Property and equipment, net 12,534.8 14,311.0
GOODWILL 276.1 3,274.0OTHER ASSETS, NET 314.2 352.7
$ 16,059.9 $ 19,472.9
LIABILITIES AND SHAREHOLDERS' EQUITY
CURRENT LIABILITIES Accounts payable - trade $ 373.2 $ 341.1Accrued liabilities and other 696.6 658.7Current maturities of long-term debt 34.8 47.5
Total current liabilities 1,104.6 1,047.3LONG-TERM DEBT 5,885.6 4,718.9DEFERRED INCOME TAXES 179.5 362.1OTHER LIABILITIES 667.3 545.7COMMITMENTS AND CONTINGENCIES ENSCO SHAREHOLDERS' EQUITY Class A ordinary shares, U.S. $.10 par value, 450.0 million shares authorized, 240.7 million and 239.5 million shares issued as of December 31, 2014 and 2013 24.1 24.0 Class B ordinary shares, £1 par value, 50,000 shares authorized and issued as of December 31, 2014 and 2013 .1 .1
Additional paid-in capital 5,517.5 5,467.2Retained earnings 2,720.4 7,327.3Accumulated other comprehensive income 11.9 18.2Treasury shares, at cost, 6.5 million shares and 6.0 million shares (59.0) (45.2)
Total Ensco shareholders' equity 8,215.0 12,791.6NONCONTROLLING INTERESTS 7.9 7.3
Total equity 8,222.9 12,798.9$ 16,059.9 $ 19,472.9
The accompanying notes are an integral part of these consolidated financial statements.
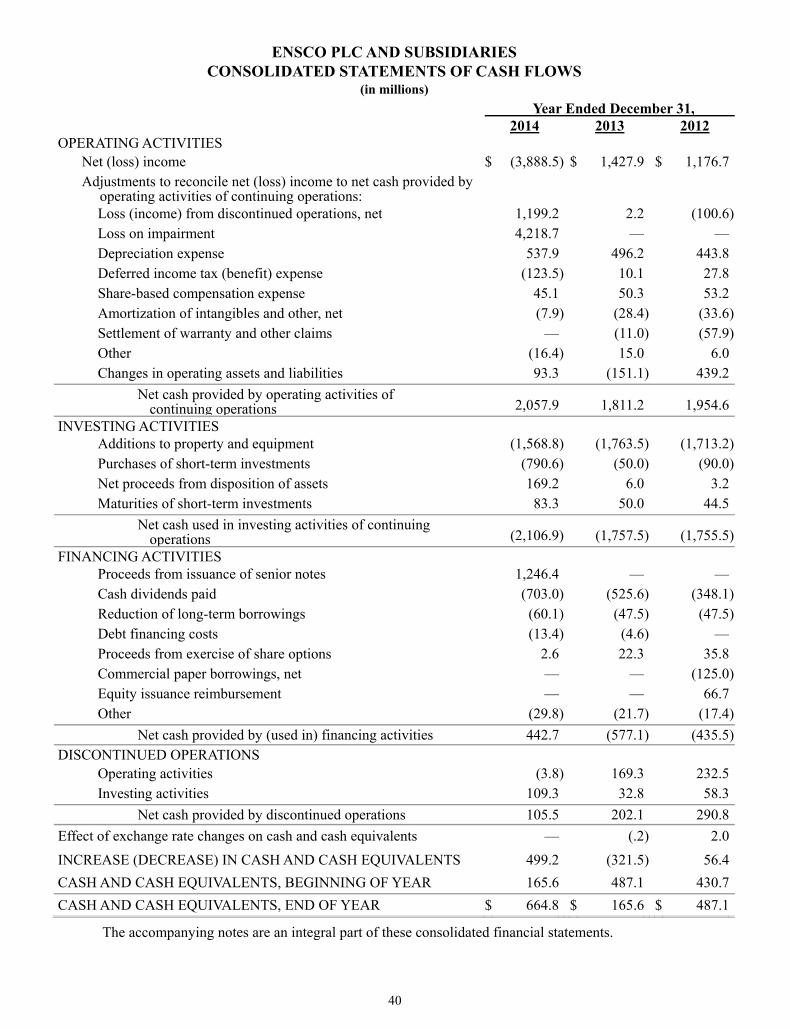
40
ENSCO PLC AND SUBSIDIARIESCONSOLIDATED STATEMENTS OF CASH FLOWS
(in millions) Year Ended December 31,
2014 2013 2012 OPERATING ACTIVITIES
Net (loss) income $ (3,888.5) $ 1,427.9 $ 1,176.7Adjustments to reconcile net (loss) income to net cash provided by
operating activities of continuing operations: Loss (income) from discontinued operations, net 1,199.2 2.2 (100.6)Loss on impairment 4,218.7 — —Depreciation expense 537.9 496.2 443.8Deferred income tax (benefit) expense (123.5) 10.1 27.8Share-based compensation expense 45.1 50.3 53.2Amortization of intangibles and other, net (7.9) (28.4) (33.6)Settlement of warranty and other claims — (11.0) (57.9)Other (16.4) 15.0 6.0Changes in operating assets and liabilities 93.3 (151.1) 439.2
Net cash provided by operating activities of continuing operations 2,057.9 1,811.2 1,954.6
INVESTING ACTIVITIES Additions to property and equipment (1,568.8) (1,763.5) (1,713.2)Purchases of short-term investments (790.6) (50.0) (90.0)Net proceeds from disposition of assets 169.2 6.0 3.2Maturities of short-term investments 83.3 50.0 44.5
Net cash used in investing activities of continuing operations (2,106.9) (1,757.5) (1,755.5)
FINANCING ACTIVITIES Proceeds from issuance of senior notes 1,246.4 — —Cash dividends paid (703.0) (525.6) (348.1)Reduction of long-term borrowings (60.1) (47.5) (47.5)Debt financing costs (13.4) (4.6) —Proceeds from exercise of share options 2.6 22.3 35.8Commercial paper borrowings, net — — (125.0)Equity issuance reimbursement — — 66.7Other (29.8) (21.7) (17.4)
Net cash provided by (used in) financing activities 442.7 (577.1) (435.5)DISCONTINUED OPERATIONS
Operating activities (3.8) 169.3 232.5Investing activities 109.3 32.8 58.3
Net cash provided by discontinued operations 105.5 202.1 290.8Effect of exchange rate changes on cash and cash equivalents — (.2) 2.0INCREASE (DECREASE) IN CASH AND CASH EQUIVALENTS 499.2 (321.5) 56.4CASH AND CASH EQUIVALENTS, BEGINNING OF YEAR 165.6 487.1 430.7CASH AND CASH EQUIVALENTS, END OF YEAR $ 664.8 $ 165.6 $ 487.1
The accompanying notes are an integral part of these consolidated financial statements.

41
ENSCO PLC AND SUBSIDIARIES NOTES TO CONSOLIDATED FINANCIAL STATEMENTS
1. DESCRIPTION OF THE BUSINESS AND SUMMARY OF SIGNIFICANT ACCOUNTING POLICIES Business We are one of the leading providers of offshore contract drilling services to the international oil and gas industry. We own an offshore drilling rig fleet of 70 rigs, including seven rigs under construction, spanning most of the strategic markets around the globe. Our rig fleet includes ten drillships, 13 dynamically positioned semisubmersible rigs, five moored semisubmersible rigs and 42 jackup rigs. Our fleet is the world's second largest amongst competitive rigs, our ultra-deepwater fleet is one of the newest in the industry, and our premium jackup fleet is the largest of any offshore drilling company. Our customers include many of the leading national and international oil companies, in addition to many independent operators. We are among the most geographically diverse offshore drilling companies, with current operations and drilling contracts spanning approximately 20 countries on six continents in nearly every major offshore basin around the world. The markets in which we operate include the U.S. Gulf of Mexico, Mexico, Brazil, the Mediterranean, the North Sea, the Middle East, West Africa, Australia and Southeast Asia. We provide drilling services on a "day rate" contract basis. Under day rate contracts, we provide a drilling rig and rig crews and receive a fixed amount per day for each day we are performing drilling or related services. Our customers bear substantially all of the ancillary costs of constructing the well and supporting drilling operations, as well as the economic risk relative to the success of the well. In addition, our customers may pay all or a portion of the cost of moving our equipment and personnel to and from the well site. We do not provide "turnkey" or other risk-based drilling services.
Redomestication During 2009, we completed a reorganization of the corporate structure of the group of companies controlled by our predecessor, ENSCO International Incorporated ("Ensco Delaware"), pursuant to which an indirect, wholly-owned subsidiary merged with Ensco Delaware, and Ensco plc became our publicly-held parent company incorporated under English law (the "redomestication"). We remain subject to the U.S. Securities and Exchange Commission (the "SEC") reporting requirements, the mandates of the Sarbanes-Oxley Act of 2002, as amended, and the applicable corporate governance rules of the New York Stock Exchange ("NYSE"), and we will continue to report our consolidated financial results in U.S. dollars and in accordance with U.S. generally accepted accounting principles ("U.S. GAAP"). We also must comply with additional reporting requirements of English law.
Basis of Presentation—U.K. Companies Act 2006 Section 435 Statement The accompanying consolidated financial statements have been prepared in accordance with U.S. GAAP, which the Board of Directors consider to be the most meaningful presentation of our results of operations and financial position. The accompanying consolidated financial statements do not constitute statutory accounts required by the U.K. Companies Act 2006, which for the year ended December 31, 2014 will be prepared in accordance with generally accepted accounting principles in the U.K. and delivered to the Registrar of Companies in the U.K. following the annual general meeting of shareholders. The U.K. statutory accounts are expected to include an unqualified auditor’s report, which is not expected to contain any references to matters on which the auditors drew attention by way of emphasis without qualifying the report or any statements under Sections 498(2) or 498(3) of the U.K. Companies Act 2006.

42
Principles of Consolidation The accompanying consolidated financial statements include the accounts of Ensco plc and its majority-owned subsidiaries. All significant intercompany accounts and transactions have been eliminated. Certain previously reported amounts have been reclassified to conform to the current year presentation.
Pervasiveness of Estimates The preparation of financial statements in conformity with U.S. GAAP requires management to make certain estimates, judgments and assumptions that affect the reported amounts of assets and liabilities, the related revenues and expenses and disclosures of gain and loss contingencies as of the date of the financial statements. Actual results could differ from those estimates.
Foreign Currency Remeasurement and Translation Our functional currency is the U.S. dollar. As is customary in the oil and gas industry, a majority of our revenues and expenses are denominated in U.S. dollars; however, a portion of the revenues earned and expenses incurred by certain of our subsidiaries are denominated in currencies other than the U.S. dollar ("foreign currencies"). These transactions are remeasured in U.S. dollars based on a combination of both current and historical exchange rates. Most transaction gains and losses, including certain gains and losses on our derivative instruments, are included in other, net, in our consolidated statement of operations. Certain gains and losses from the translation of foreign currency balances of our non-U.S. dollar functional currency subsidiaries are included in accumulated other comprehensive income on our consolidated balance sheet. Net foreign currency exchange gains and losses, inclusive of offsetting fair value derivatives, were $2.6 million of losses, $6.4 million of gains and $3.5 million of losses, and were included in other, net, in our consolidated statements of operations for the years ended December 31, 2014, 2013 and 2012, respectively.
Cash Equivalents and Short-Term Investments
Highly liquid investments with maturities of three months or less at the date of purchase are considered cash equivalents. Highly liquid investments with maturities of greater than three months but less than one year at the date of purchase are classified as short-term investments. Short-term investments, consisting of time deposits with initial maturities in excess of three months but less than one year, were included in other current assets on our consolidated balance sheets and totaled $757.3 million and $50.0 million as of December 31, 2014 and 2013, respectively. Cash flows from purchases and maturities of short-term investments were classified as investing activities in our consolidated statements of cash flows for the years ended December 31, 2014, 2013 and 2012.
Property and Equipment All costs incurred in connection with the acquisition, construction, major enhancement and improvement of assets are capitalized, including allocations of interest incurred during periods that our drilling rigs are under construction or undergoing major enhancements and improvements. Repair and maintenance costs are charged to contract drilling expense in the period in which they are incurred. Upon sale or retirement of assets, the related cost and accumulated depreciation are removed from the balance sheet, and the resulting gain or loss is included in contract drilling expense, unless reclassified to discontinued operations. Our property and equipment is depreciated on a straight-line basis, after allowing for salvage values, over the estimated useful lives of our assets. Drilling rigs and related equipment are depreciated over estimated useful lives ranging from four to 35 years. Buildings and improvements are depreciated over estimated useful lives ranging from two to 30 years. Other equipment, including computer and communications hardware and software costs, is depreciated over estimated useful lives ranging from two to six years.

43
We evaluate the carrying value of our property and equipment for impairment when events or changes in circumstances indicate that the carrying value of such assets may not be recoverable. For property and equipment used in our operations, recoverability generally is determined by comparing the carrying value of an asset to the expected undiscounted future cash flows of the asset. If the carrying value of an asset is not recoverable, the amount of impairment loss is measured as the difference between the carrying value of the asset and its estimated fair value. Property and equipment held for sale is recorded at the lower of net book value or net realizable value. During 2014, we recorded a pre-tax, non cash loss on impairment of long-lived assets of $2.5 billion. See "Note 3 - Property and Equipment" for additional information on these impairments. If the global economy deteriorates and/or our expectation relative to future offshore drilling industry conditions decline, it is reasonably possible that additional impairment charges may occur with respect to specific individual rigs, groups of rigs, such as a specific type of drilling rig, or rigs in a certain geographic location.
Goodwill
Our business consists of three operating segments: (1) Floaters, which includes our drillships and semisubmersible rigs, (2) Jackups and (3) Other, which consists of management services on rigs owned by third-parties. Our two reportable segments, Floaters and Jackups, provide one service, contract drilling. We test goodwill for impairment on an annual basis as of December 31 of each year or when events or changes in circumstances indicate that a potential impairment exists. When testing goodwill for impairment, we perform a qualitative assessment to determine whether it is more-likely-than-not that the fair value of a reporting unit is less than its carrying amount. If we conclude that the fair value of one or both of our reporting units has more-likely-than-not declined below its carrying amount after qualitatively assessing existing facts and circumstances, we perform a quantitative assessment whereby we estimate the fair value of each reporting unit. In most instances, our calculation of the fair value of our reporting units is based on estimates of future discounted cash flows to be generated by the drilling rigs in the reporting unit. Based on a qualitative assessment performed as of December 31, 2014, we concluded it was more-likely-than-not that the fair value of our Floater reporting unit was less than its carrying amount and performed a quantitative assessment. As a result, we concluded that our Floater reporting unit goodwill balance was impaired. See "Note 8 - Goodwill and Other Intangible Assets and Liabilities" for additional information on our goodwill. We concluded the fair value of our Jackup reporting more-likely-than-not exceeded its carrying amount, and there was no impairment of goodwill.
Operating Revenues and Expenses Substantially all of our drilling contracts ("contracts") are performed on a day rate basis, and the terms of such contracts are typically for a specific period of time or the period of time required to complete a specific task, such as drill a well. Contract revenues and expenses are recognized on a per day basis, as the work is performed. Day rate revenues are typically earned, and contract drilling expense is typically incurred, on a uniform basis over the terms of our contracts. In connection with some contracts, we receive lump-sum fees or similar compensation for the mobilization of equipment and personnel prior to the commencement of drilling services or the demobilization of equipment and personnel upon contract completion. Fees received for the mobilization or demobilization of equipment and personnel are included in operating revenues. The costs incurred in connection with the mobilization and demobilization of equipment and personnel are included in contract drilling expense.
44
Mobilization fees received and costs incurred prior to commencement of drilling operations are deferred and recognized on a straight-line basis over the period that the related drilling services are performed. Demobilization fees and related costs are recognized as incurred upon contract completion. Costs associated with the mobilization of equipment and personnel to more promising market areas without contracts are expensed as incurred.
Deferred mobilization costs were included in other current assets and other assets, net, on our consolidated balance sheets and totaled $95.7 million and $66.6 million as of December 31, 2014 and 2013, respectively. Deferred mobilization revenue was included in accrued liabilities and other, and other liabilities on our consolidated balance sheets and totaled $149.4 million and $76.8 million as of December 31, 2014 and 2013, respectively.
In connection with some contracts, we receive up-front lump-sum fees or similar compensation for capital improvements to our drilling rigs. Such compensation is deferred and recognized as revenue over the period that the related drilling services are performed. The cost of such capital improvements is capitalized and depreciated over the useful life of the asset. Deferred revenue associated with capital improvements was included in accrued liabilities and other, and other liabilities on our consolidated balance sheets and totaled $428.9 million and $273.6 million as of December 31, 2014 and 2013, respectively.
We must obtain certifications from various regulatory bodies in order to operate our drilling rigs and must maintain such certifications through periodic inspections and surveys. The costs incurred in connection with maintaining such certifications, including inspections, tests, surveys and drydock, as well as remedial structural work and other compliance costs, are deferred and amortized over the corresponding certification periods. Deferred regulatory certification and compliance costs were included in other current assets and other assets, net, on our consolidated balance sheets and totaled $20.0 million and $18.3 million as of December 31, 2014 and 2013, respectively.
In certain countries in which we operate, taxes such as sales, use, value-added, gross receipts and excise may be assessed by the local government on our revenues. We generally record our tax-assessed revenue transactions on a net basis in our consolidated statement of operations.
Derivative Instruments
We use derivatives to reduce our exposure to various market risks, primarily foreign currency exchange rate risk. See "Note 5 - Derivative Instruments" for additional information on how and why we use derivatives.
All derivatives are recorded on our consolidated balance sheet at fair value. Derivatives subject to legally enforceable master netting agreements are not offset on our consolidated balance sheet. Accounting for the gains and losses resulting from changes in the fair value of derivatives depends on the use of the derivative and whether it qualifies for hedge accounting. Derivatives qualify for hedge accounting when they are formally designated as hedges and are effective in reducing the risk exposure that they are designated to hedge. Our assessment of hedge effectiveness is formally documented at hedge inception, and we review hedge effectiveness and measure any ineffectiveness throughout the designated hedge period on at least a quarterly basis.
Changes in the fair value of derivatives that are designated as hedges of the variability in expected future cash flows associated with existing recognized assets or liabilities or forecasted transactions ("cash flow hedges") are recorded in accumulated other comprehensive income ("AOCI"). Amounts recorded in AOCI associated with cash flow hedges are subsequently reclassified into contract drilling, depreciation or interest expense as earnings are affected by the underlying hedged forecasted transactions.
Gains and losses on a cash flow hedge, or a portion of a cash flow hedge, that no longer qualifies as effective due to an unanticipated change in the forecasted transaction are recognized currently in earnings and included in other, net, in our consolidated statement of operations based on the change in the fair value of the derivative. When a forecasted transaction is probable of not occurring, gains and losses on the derivative previously recorded in AOCI are reclassified currently into earnings and included in other, net, in our consolidated statement of operations.
45
We occasionally enter into derivatives that hedge the fair value of recognized assets or liabilities, but do not designate such derivatives as hedges or the derivatives otherwise do not qualify for hedge accounting. In these situations, there generally is a natural hedging relationship where changes in the fair value of the derivatives offset changes in the fair value of the underlying hedged items. Changes in the fair value of these derivatives are recognized currently in earnings in other, net, in our consolidated statement of operations.
Derivatives with asset fair values are reported in other current assets or other assets, net, on our consolidated balance sheet depending on maturity date. Derivatives with liability fair values are reported in accrued liabilities and other, or other liabilities on our consolidated balance sheet depending on maturity date.
Income Taxes
We conduct operations and earn income in numerous countries. Current income taxes are recognized for the amount of taxes payable or refundable based on the laws and income tax rates in the taxing jurisdictions in which operations are conducted and income is earned.
Deferred tax assets and liabilities are recognized for the anticipated future tax effects of temporary differences between the financial statement basis and the tax basis of our assets and liabilities using the enacted tax rates in effect at year-end. A valuation allowance for deferred tax assets is recorded when it is more-likely-than-not that the benefit from the deferred tax asset will not be realized. We do not offset deferred tax assets and deferred tax liabilities attributable to different tax paying jurisdictions.
We operate in certain jurisdictions where tax laws relating to the offshore drilling industry are not well developed and change frequently. Furthermore, we may enter into transactions with affiliates or employ other tax planning strategies that generally are subject to complex tax regulations. As a result of the foregoing, the tax liabilities and assets we recognize in our financial statements may differ from the tax positions taken, or expected to be taken, in our tax returns. Our tax positions are evaluated for recognition using a more-likely-than-not threshold, and those tax positions requiring recognition are measured as the largest amount of tax benefit that is greater than 50% likely of being realized upon effective settlement with a taxing authority that has full knowledge of all relevant information. Interest and penalties relating to income taxes are included in current income tax expense in our consolidated statement of operations.
Our drilling rigs frequently move from one taxing jurisdiction to another based on where they are contracted to perform drilling services. The movement of drilling rigs among taxing jurisdictions may involve a transfer of drilling rig ownership among our subsidiaries (“intercompany rig sale”). The pre-tax profit resulting from an intercompany rig sale is eliminated from our consolidated financial statements, and the carrying value of a rig sold in an intercompany transaction remains at historical net depreciated cost prior to the transaction. Our consolidated financial statements do not reflect the asset disposition transaction of the selling subsidiary or the asset acquisition transaction of the acquiring subsidiary. Income taxes resulting from an intercompany rig sale, as well as the tax effect of any reversing temporary differences resulting from the sale, are deferred and amortized on a straight-line basis over the remaining useful life of the rig.
In some instances, we may determine that certain temporary differences will not result in a taxable or deductible amount in future years, as it is more-likely-than-not we will commence operations and depart from a given taxing jurisdiction without such temporary differences being recovered or settled. Under these circumstances, no future tax consequences are expected and no deferred taxes are recognized in connection with such operations. We evaluate these determinations on a periodic basis and, in the event our expectations relative to future tax consequences change, the applicable deferred taxes are recognized or derecognized.
We do not provide deferred taxes on the undistributed earnings of certain subsidiaries because our policy and intention is to reinvest such earnings indefinitely. See "Note 9 - Income Taxes" for additional information on our deferred taxes, unrecognized tax benefits, intercompany transfers of drilling rigs and undistributed earnings.

46
Share-Based Compensation
We sponsor share-based compensation plans that provide equity compensation to our key employees, officers and non-employee directors. Share-based compensation cost is measured at fair value on the date of grant and recognized on a straight-line basis over the requisite service period (usually the vesting period). The amount of compensation cost recognized in our consolidated statement of operations is based on the awards ultimately expected to vest and, therefore, reduced for estimated forfeitures. All changes in estimated forfeitures are based on historical experience and are recognized as a cumulative adjustment to compensation cost in the period in which they occur. See "Note 7 - Benefit Plans" for additional information on our share-based compensation.
Fair Value Measurements
We measure certain of our assets and liabilities based on a fair value hierarchy that prioritizes the inputs to valuation techniques used to measure fair value. The hierarchy assigns the highest priority to unadjusted quoted prices in active markets for identical assets or liabilities ("Level 1") and the lowest priority to unobservable inputs ("Level 3"). Level 2 measurements represent inputs that are observable for similar assets or liabilities, either directly or indirectly, other than quoted prices included within Level 1. See "Note 2 - Fair Value Measurements" for additional information on the fair value measurement of certain of our assets and liabilities.
Earnings Per Share
We compute basic and diluted earnings per share ("EPS") in accordance with the two-class method. Net (loss) income attributable to Ensco used in our computations of basic and diluted EPS is adjusted to exclude net income allocated to non-vested shares granted to our employees and non-employee directors. Weighted-average shares outstanding used in our computation of diluted EPS is calculated using the treasury stock method and excludes non-vested shares.
The following table is a reconciliation of (loss) income from continuing operations attributable to Ensco shares used in our basic and diluted EPS computations for each of the years in the three-year period ended December 31, 2014 (in millions):
2014 2013 2012
(Loss) income from continuing operations attributable to Ensco $ (2,703.1) $ 21.6 $ 1,069.6Income from continuing operations allocated to non-vested share awards (7.9) (15.1) (11.2)(Loss) income from continuing operations attributable to Ensco shares $ (2,711.0) $ 1,406.5 $ 1,058.4
The following table is a reconciliation of the weighted-average shares used in our basic and diluted earnings per share computations for each of the years in the three-year period ended December 31, 2014 (in millions):
2014 2013 2012
Weighted-average shares - basic 231.6 230.9 229.4Potentially dilutive shares — .2 .3Weighted-average shares - diluted 231.6 231.1 229.7
Antidilutive share options totaling 400,000, 300,000 and 400,000 for the years ended December 31, 2014, 2013 and 2012, respectively, were excluded from the computation of diluted EPS.

47
Noncontrolling Interests Third parties hold a noncontrolling ownership interest in certain of our non-U.S. subsidiaries. Noncontrolling interests are classified as equity on our consolidated balance sheet and net income attributable to noncontrolling interests is presented separately in our consolidated statement of operations. (Loss) income from continuing operations attributable to Ensco for each of the years in the three-year period ended December 31, 2014 was as follows (in millions):
2014 2013 2012
(Loss) income from continuing operations $ (2,689.3) $ 1,430.1 $ 1,076.1Income from continuing operations attributable to noncontrolling interests (13.8) (8.5) (6.5)(Loss) income from continuing operations attributable to Ensco $ (2,703.1) $ 1,421.6 $ 1,069.6 (Loss) income from discontinued operations attributable to Ensco for each of the years in the three-year period ended December 31, 2014 was as follows (in millions):
2014 2013 2012
(Loss) income from discontinued operations $ (1,199.2) $ (2.2) $ 100.6Income from discontinued operations attributable to noncontrolling interests (.3) (1.2) (.5)(Loss) income from discontinued operations attributable to Ensco $ (1,199.5) $ (3.4) $ 100.1
New Accounting Pronouncements
In May 2014, the Financial Accounting Standards Board issued Accounting Standards Update 2014-09, Revenue from Contracts with Customers (Topic 606) ("Update 2014-09"), which requires an entity to recognize the amount of revenue to which it expects to be entitled for the transfer of promised goods or services to customers. The ASU will replace most existing revenue recognition guidance in U.S. GAAP when it becomes effective on January 1, 2017. Early application is not permitted. We are currently evaluating the effect that ASU 2014-09 will have on our consolidated financial statements and related disclosures.

48
2. FAIR VALUE MEASUREMENTS The following fair value hierarchy table categorizes information regarding our net financial assets measured at fair value on a recurring basis as of December 31, 2014 and 2013 (in millions):
Quoted Prices inActive Markets
for Identical Assets
(Level 1)
Significant Other
Observable Inputs
(Level 2)
Significant Unobservable
Inputs (Level 3) Total
As of December 31, 2014 Supplemental executive retirement plan assets $ 43.2 $ — $ —
$ 43.2
Total financial assets $ 43.2 $ — $ — $ 43.2Derivatives, net — (26.3) — (26.3)Total financial liabilities $ — $ (26.3) $ — $ (26.3)As of December 31, 2013 Supplemental executive retirement plan assets $ 37.7 $ — $ —
$ 37.7
Derivatives, net — 1.8 — 1.8Total financial assets $ 37.7 $ 1.8 $ — $ 39.5
Supplemental Executive Retirement Plans
Our Ensco supplemental executive retirement plans (the "SERP") are non-qualified plans that provide for eligible employees to defer a portion of their compensation for use after retirement. Assets held in the SERP were marketable securities measured at fair value on a recurring basis using Level 1 inputs and were included in other assets, net, on our consolidated balance sheets as of December 31, 2014 and 2013. The fair value measurements of assets held in the SERP were based on quoted market prices. Net unrealized gains of $2.3 million, $6.2 million and $2.8 million from marketable securities held in our SERP were included in other, net, in our consolidated statements of operations for the years ended December 31, 2014, 2013 and 2012, respectively.
Derivatives Our derivatives were measured at fair value on a recurring basis using Level 2 inputs as of December 31, 2014 and 2013. See "Note 5 - Derivative Instruments" for additional information on our derivatives, including a description of our foreign currency hedging activities and related methodologies used to manage foreign currency exchange rate risk. The fair value measurements of our derivatives were based on market prices that are generally observable for similar assets or liabilities at commonly quoted intervals.
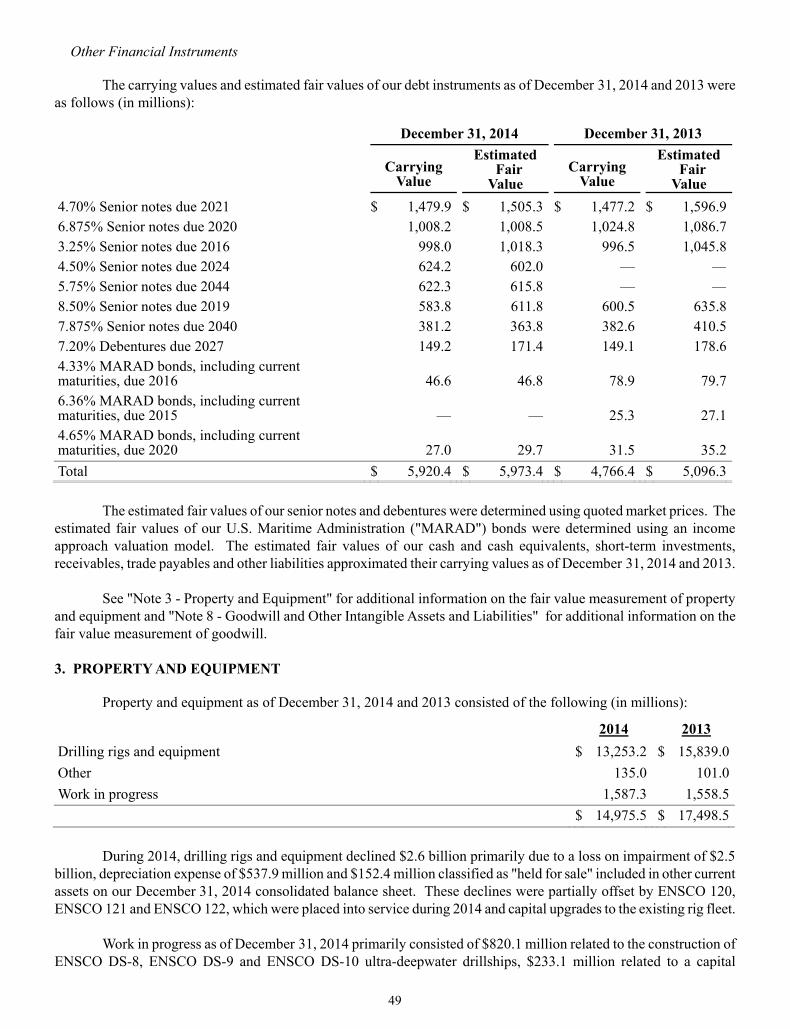
49
Other Financial Instruments The carrying values and estimated fair values of our debt instruments as of December 31, 2014 and 2013 were as follows (in millions):
December 31, 2014 December 31, 2013
Carrying
Value
Estimated Fair Value
Carrying Value
Estimated Fair Value
4.70% Senior notes due 2021 $ 1,479.9 $ 1,505.3 $ 1,477.2 $ 1,596.96.875% Senior notes due 2020 1,008.2 1,008.5 1,024.8 1,086.73.25% Senior notes due 2016 998.0 1,018.3 996.5 1,045.84.50% Senior notes due 2024 624.2 602.0 — —5.75% Senior notes due 2044 622.3 615.8 — —8.50% Senior notes due 2019 583.8 611.8 600.5 635.87.875% Senior notes due 2040 381.2 363.8 382.6 410.57.20% Debentures due 2027 149.2 171.4 149.1 178.64.33% MARAD bonds, including current maturities, due 2016 46.6 46.8 78.9
79.7
6.36% MARAD bonds, including current maturities, due 2015 — — 25.3
27.1
4.65% MARAD bonds, including current maturities, due 2020 27.0 29.7 31.5
35.2
Total $ 5,920.4 $ 5,973.4 $ 4,766.4 $ 5,096.3 The estimated fair values of our senior notes and debentures were determined using quoted market prices. The estimated fair values of our U.S. Maritime Administration ("MARAD") bonds were determined using an income approach valuation model. The estimated fair values of our cash and cash equivalents, short-term investments, receivables, trade payables and other liabilities approximated their carrying values as of December 31, 2014 and 2013. See "Note 3 - Property and Equipment" for additional information on the fair value measurement of property and equipment and "Note 8 - Goodwill and Other Intangible Assets and Liabilities" for additional information on the fair value measurement of goodwill. 3. PROPERTY AND EQUIPMENT Property and equipment as of December 31, 2014 and 2013 consisted of the following (in millions):
2014 2013 Drilling rigs and equipment $ 13,253.2 $ 15,839.0Other 135.0 101.0Work in progress 1,587.3 1,558.5 $ 14,975.5 $ 17,498.5 During 2014, drilling rigs and equipment declined $2.6 billion primarily due to a loss on impairment of $2.5 billion, depreciation expense of $537.9 million and $152.4 million classified as "held for sale" included in other current assets on our December 31, 2014 consolidated balance sheet. These declines were partially offset by ENSCO 120, ENSCO 121 and ENSCO 122, which were placed into service during 2014 and capital upgrades to the existing rig fleet. Work in progress as of December 31, 2014 primarily consisted of $820.1 million related to the construction of ENSCO DS-8, ENSCO DS-9 and ENSCO DS-10 ultra-deepwater drillships, $233.1 million related to a capital
50
enhancement project on ENSCO 5006, $179.3 million related to the construction of ENSCO 110, ENSCO 140 and ENSCO 141 premium jackup rigs, $59.2 million related to the construction of ENSCO 123 ultra-premium harsh environment jackup rig and costs associated with various modification and enhancement projects. Work in progress as of December 31, 2013 primarily consisted of $627.2 million related to the construction of ENSCO 120 Series ultra-premium harsh environment jackup rigs, $513.4 million related to the construction of ENSCO DS-8, ENSCO DS-9 and ENSCO D-S 10 ultra-deepwater drillships, $43.7 million related to the construction of ENSCO 110 premium jackup rig and costs associated with various modification and enhancement projects.
Impairment of Long-Lived Assets During 2014, we recorded a pre-tax, non cash loss on impairment of long-lived assets of $2,463.1 million, of which $1,220.8 million was included in (loss) income from continuing operations and $1,242.3 million was included in (loss) income from discontinued operations, net in our consolidated statement of operations. These losses were recorded during the second and fourth quarters.
During the second quarter, demand for floaters deteriorated as a result of continued reductions in capital spending by operators in addition to delays in operators’ drilling programs. The reduction in demand, combined with the increasing supply from newbuild floater deliveries, led to a very competitive market. In general, contracting activity declined significantly, and day rates and utilization came under pressure, especially for older, less capable floaters.
In response to the adverse change in the floaters business climate, management evaluated our older, less capable floaters and committed to a plan to sell five rigs. ENSCO 5000, ENSCO 5001, ENSCO 5002, ENSCO 6000 and ENSCO 7500 were removed from our portfolio of rigs marketed for contract drilling services and actively marketed for sale. These rigs were written down to fair value, less costs to sell. We completed the sale of ENSCO 5000 in December 2014. The remaining four floaters were classified as "held for sale" on our December 31, 2014 consolidated balance sheet.
We measured the fair value of the "held for sale" rigs by applying a market approach, which was based on unobservable third-party estimated prices that would be received in exchange for the assets in an orderly transaction between market participants. We recorded a pre-tax, non-cash loss on impairment totaling $546.4 million during the second quarter associated with our "held for sale" rigs. The impairment charge was included in (loss) income from discontinued operations, net in our consolidated statement of operations for the year ended December 31, 2014.
During the fourth quarter, Brent crude oil prices declined from approximately $95 per barrel to near $55 per barrel on December 31, 2014. These declines resulted in further reductions in capital spending by operators, including the cancellation or deferral of planned drilling programs. As a result, day rates and utilization came under further pressure, especially for older, less capable rigs. The significant supply and demand imbalance will continue to be adversely impacted by future newbuild deliveries, program delays and lower capital spending by operators.
In response to the adverse change in business climate, management evaluated our aged rigs and committed to a plan to sell one additional floater and two jackups. ENSCO DS-2, ENSCO 58 and ENSCO 90 were removed from our portfolio of rigs marketed for contract drilling services. These rigs were written down to fair value, less costs to sell, during the fourth quarter and classified as "held for sale" on our December 31, 2014 consolidated balance sheet.
As of December 31, 2014, we measured the fair value of our seven "held for sale" rigs by applying a market approach, which was based on unobservable third-party estimated prices that would be received in exchange for the assets in an orderly transaction between market participants. In addition to the asset impairment recorded during the second quarter, we recorded an additional pre-tax, non-cash loss on impairment totaling $407.9 million during the fourth quarter. The impairment charge was included in (loss) income from discontinued operations, net in our consolidated statement of operations for the year ended December 31, 2014. See "Note 10 - Discontinued Operations" for additional information on our "held for sale" rigs.
On a quarterly basis, we evaluate the carrying value of our property and equipment to identify events or changes in circumstances ("triggering events") that indicate the carrying value may not be recoverable. During the second

51
quarter, as a result of the adverse change in the floater business climate, management's decision to sell five floaters and the impairment charge incurred on the "held for sale" floaters, management concluded that a triggering event had occurred and performed an asset impairment analysis on our remaining older, less capable floaters.
Based on the analysis performed as of May 31, 2014, we recorded an additional pre-tax, non-cash loss on impairment with respect to four other floaters totaling $991.5 million, of which $288.0 million related to ENSCO DS-2 which was removed from our portfolio of rigs marketed for contract drilling services during the fourth quarter. The ENSCO DS-2 impairment charge was reclassified to (loss) income from discontinued operations, net in our consolidated statement of operations for the year ended December 31, 2014. The remaining $703.5 million impairment charge was included in loss on impairment in our consolidated statement of operations for the year ended December 31, 2014. We measured the fair value of these rigs by applying an income approach, using projected discounted cash flows. These valuations were based on unobservable inputs that require significant judgments for which there is limited information, including assumptions regarding future day rates, utilization, operating costs and capital requirements.
During the fourth quarter, as a result of the decline in commodity prices and adverse changes in the offshore drilling market, management's decision to sell an additional floater and two jackups and the impairment charge incurred on the "held for sale" rigs, management concluded that a triggering event had occurred and performed an asset impairment analysis for all floaters and jackups.
Based on the analysis performed as of December 31, 2014, we recorded an additional pre-tax, non-cash loss on impairment with respect to two older, less capable floaters and ten older, less capable jackups totaling $517.3 million. The impairment charge was included in loss on impairment in our consolidated statement of operations for the year ended December 31, 2014. We measured the fair value of these rigs by applying either an income approach, using projected discounted cash flows, or a market approach. These valuations were based on unobservable inputs that require significant judgments for which there is limited information, including assumptions regarding future day rates, utilization, operating costs and capital requirements. 4. DEBT The carrying value of long-term debt as of December 31, 2014 and 2013 consisted of the following (in millions):
2014 2013
4.70% Senior notes due 2021 $ 1,479.9 $ 1,477.26.875% Senior notes due 2020 1,008.2 1,024.83.25% Senior notes due 2016 998.0 996.54.50% Senior notes due 2024 624.2 —5.75% Senior notes due 2044 622.3 —8.50% Senior notes due 2019 583.8 600.57.875% Senior notes due 2040 381.2 382.67.20% Debentures due 2027 149.2 149.14.33% MARAD bonds due 2016 46.6 78.96.36% MARAD bonds due 2015 — 25.34.65% MARAD bonds due 2020 27.0 31.5Total debt 5,920.4 4,766.4Less current maturities (34.8) (47.5)Total long-term debt $ 5,885.6 $ 4,718.9
52
Senior Notes
On September 29, 2014, we issued $625.0 million aggregate principal amount of unsecured 4.50% notes due 2024 at a discount of $850,000 and $625.0 million aggregate principal amount of unsecured 5.75% notes due 2044 (collectively the “2014 Notes”) at a discount of $2.8 million in a public offering. Interest on these notes is payable semiannually in April and October of each year commencing April 1, 2015. The 2014 Notes were issued pursuant to an Indenture between us and Deutsche Bank Trust Company Americas, as trustee (the “Trustee”), dated March 17, 2011 (the "Indenture") and a Second Supplemental Indenture between us and the Trustee, dated September 29, 2014. The net proceeds from the sale of the 2014 Notes are being used for general corporate purposes. During 2011, we issued $1.0 billion aggregate principal amount of unsecured 3.25% notes due 2016 at a discount of $7.6 million and $1.5 billion aggregate principal amount of unsecured 4.70% notes due 2021 (collectively the “2011 Notes”) at a discount of $29.6 million in a public offering. Interest on these notes is payable semiannually in March and September of each year. The 2011 Notes were issued pursuant to the Indenture, and a supplemental indenture between us and the Trustee, dated March 17, 2011. The net proceeds from the sale of the 2011 Notes were used to fund a portion of the cash consideration payable in connection with the Pride acquisition. Upon consummation of the Pride acquisition during 2011, we assumed the acquired company's outstanding debt comprised of $900.0 million aggregate principal amount of 6.875% senior notes due 2020, $500.0 million aggregate principal amount of 8.5% senior notes due 2019 and $300.0 million aggregate principal amount of 7.875% senior notes due 2040 (the "Acquired Notes"). Under a supplemental indenture, Ensco plc has fully and unconditionally guaranteed the performance of all Pride obligations with respect to the Acquired Notes. See "Note 15 - Guarantee of Registered Securities" for additional information on the guarantee of the Acquired Notes. We may redeem each series of the 2014 Notes in whole, at any time or in part from time to time, prior to maturity. If we elect to redeem the 2014 Notes due 2024 before the date that is three months prior to the maturity date or the 2014 Notes due 2044 before the date that is six months prior to the maturity date, we will pay an amount equal to 100% of the principal amount of the notes redeemed plus accrued and unpaid interest and a "make-whole" premium. If we elect to redeem the 2014 Notes on or after the aforementioned dates, we will pay an amount equal to 100% of the principal amount of the notes redeemed plus accrued and unpaid interest but we are not required to pay a "make-whole" premium. We may redeem each series of the 2011 Notes and the Acquired Notes, in whole or in part, at any time, at a price equal to 100% of their principal amount, plus accrued and unpaid interest and a "make-whole" premium. The indentures governing the 2014 Notes, the 2011 Notes and the Acquired Notes contain customary events of default, including failure to pay principal or interest on such Notes when due, among others. The indentures governing the 2014 Notes, the 2011 Notes and the Acquired Notes also contain certain restrictions, including, among others, restrictions on our ability and the ability of our subsidiaries to create or incur secured indebtedness, enter into certain sale/leaseback transactions and enter into certain merger or consolidation transactions.
Debentures Due 2027 During 1997, Ensco Delaware issued $150.0 million of unsecured 7.20% Debentures due November 15, 2027 (the "Debentures") in a public offering. Interest on the Debentures is payable semiannually in May and November. We may redeem the Debentures, in whole or in part, at any time prior to maturity, at a price equal to 100% of their principal amount, plus accrued and unpaid interest and a "make-whole" premium. The Debentures are not subject to any sinking fund requirements. During 2009, in connection with the redomestication, Ensco plc entered into a supplemental indenture to unconditionally guarantee the principal and interest payments on the Debentures.
The Debentures and the indenture and the supplemental indentures pursuant to which the Debentures were issued, also contain customary events of default, including failure to pay principal or interest on the Debentures when due, among others. The indenture and the supplemental indentures contain certain restrictions, including, among others, restrictions on our ability and the ability of our subsidiaries to create or incur secured indebtedness, enter into certain sale/leaseback transactions and enter into certain merger or consolidation transactions.
53
MARAD Bonds Due 2016 and 2020 During 2001, a subsidiary of Ensco Delaware issued $190.0 million of 15-year bonds which are guaranteed by MARAD to provide long-term financing for ENSCO 7500. In December 2014, we fully redeemed the remaining outstanding principal of these bonds and incurred a "make-whole" payment of $600,000, and MARAD released all interests in ENSCO 7500. During 2003, a subsidiary of Ensco Delaware issued $76.5 million of 17-year bonds which are guaranteed by MARAD to provide long-term financing for ENSCO 105. The bonds will be repaid in 34 equal semiannual principal installments of $2.3 million ending in October 2020. Interest on the bonds is payable semiannually, in April and October, at a fixed rate of 4.65%.
Ensco Delaware issued separate guaranties to MARAD, guaranteeing the performance of obligations under the bonds. During 2010, the documents governing MARAD's guarantee commitments were amended to address certain changes arising from the redomestication and to include Ensco plc as an additional guarantor of the debt obligations of Ensco Delaware and its subsidiaries. Upon consummation of the Pride acquisition, we assumed $151.5 million of MARAD bonds issued to provide long-term financing for ENSCO 6003 and ENSCO 6004. The bonds are guaranteed by MARAD and will be repaid in semiannual principal installments ending in 2016. Interest on the bonds is payable semiannually at a weighted average fixed rate of 4.33%.
Commercial Paper We participate in a commercial paper program with four commercial paper dealers pursuant to which we may issue, on a private placement basis, unsecured commercial paper notes. During 2014, we increased the size of our program to permit the issuance of commercial paper notes in an aggregate principal amount not to exceed $2.25 billion at any time outstanding. Amounts issued under the commercial paper program are supported by the available and unused committed capacity under our credit facility. As a result, amounts issued under the commercial paper program are limited by the amount of our available and unused committed capacity under our credit facility. The proceeds of such financings may be used for capital expenditures and other general corporate purposes. The commercial paper bears interest at rates that vary based on market conditions and the ratings assigned by credit rating agencies at the time of issuance. The weighted-average interest rate on our commercial paper borrowings was 0.26% and 0.35% during 2014 and 2013, respectively. Commercial paper maturities will vary but may not exceed 364 days from the date of issue. The commercial paper is not redeemable or subject to voluntary prepayment by us prior to maturity. We had no amounts outstanding under our commercial paper program as of December 31, 2014 and 2013.
Revolving Credit Facility On September 30, 2014, we entered into an amendment to the Fourth Amended and Restated Credit Agreement (the "Five-Year Credit Facility"), among Ensco, Citibank, N.A., as Administrative Agent, DNB Bank ASA, as Syndication Agent, and a syndicate of banks. This amendment extended the Five-Year Credit Facility maturity date from May 7, 2018 to September 30, 2019 and increased the total commitment of the lenders from $2.0 billion to $2.25 billion. As amended, the Five-Year Credit Facility provides for a $2.25 billion senior unsecured revolving credit facility to be used for general corporate purposes.
54
Advances under the Five-Year Credit Facility bear interest at Base Rate or LIBOR plus an applicable margin rate (currently 0.125% per annum for Base Rate advances and 1.125% per annum for LIBOR advances) depending on our credit rating. Amounts repaid may be re-borrowed during the term of the Five-Year Credit Facility. We are required to pay a quarterly commitment fee (currently 0.125% per annum) on the undrawn portion of the $2.25 billion commitment which is also based on our credit rating. In addition to other customary restrictive covenants, the Five-Year Credit Facility requires us to maintain a total debt to total capitalization ratio of less than or equal to 50%. We have the right, subject to receipt of commitments from new or existing lenders, to increase the commitments under the Five-Year Credit Facility to an aggregate amount of up to $2.75 billion. We had no amounts outstanding under the Five-Year Credit Facility as of December 31, 2014 and 2013.
Maturities The aggregate maturities of our debt, excluding net unamortized premiums of $247.9 million, as of December 31, 2014 were as follows (in millions):
2015 $ 34.82016 1,019.72017 4.52018 4.52019 504.5Thereafter 4,104.5Total $ 5,672.5 Interest expense totaled $161.4 million, $158.8 million and $123.6 million for the years ended December 31, 2014, 2013 and 2012, respectively, which was net of interest amounts capitalized of $78.2 million, $67.7 million and $105.8 million in connection with our newbuild rig construction and other capital projects. 5. DERIVATIVE INSTRUMENTS We use derivatives to reduce our exposure to various market risks, primarily foreign currency exchange rate risk. We maintain a foreign currency exchange rate risk management strategy that utilizes derivatives to reduce our exposure to unanticipated fluctuations in earnings and cash flows caused by changes in foreign currency exchange rates. We mitigate our credit risk relating to the counterparties of our derivatives by transacting with multiple, high-quality financial institutions, thereby limiting exposure to individual counterparties, and by entering into International Swaps and Derivatives Association, Inc. (“ISDA”) Master Agreements, which include provisions for a legally enforceable master netting agreement, with almost all of our derivative counterparties. See "Note 14 - Supplemental Financial Information" for additional information on the mitigation of credit risk relating to counterparties of our derivatives. We do not enter into derivatives for trading or other speculative purposes. All derivatives were recorded on our consolidated balance sheets at fair value. Derivatives subject to legally enforceable master netting agreements were not offset on our consolidated balance sheets. Accounting for the gains and losses resulting from changes in the fair value of derivatives depends on the use of the derivative and whether it qualifies for hedge accounting. See "Note 1 - Description of the Business and Summary of Significant Accounting Policies" for additional information on our accounting policy for derivatives and "Note 2 - Fair Value Measurements" for additional information on the fair value measurement of our derivatives.

55
As of December 31, 2014 and 2013, our consolidated balance sheets included net foreign currency derivative liabilities of $26.3 million and net assets of $1.8 million, respectively. All of our derivatives mature during the next 18 months. Derivatives recorded at fair value on our consolidated balance sheets as of December 31, 2014 and 2013 consisted of the following (in millions):
Derivative Assets Derivative Liabilities 2014 2013 2014 2013 Derivatives Designated as Hedging Instruments Foreign currency forward contracts - current(1) $ .4 $ 9.1 $ 17.2 $ 9.8Foreign currency forward contracts - non-current(2) .1 1.2 2.9 .6
.5 10.3 20.1 10.4
Derivatives not Designated as Hedging Instruments Foreign currency forward contracts - current(1) .2 2.5 6.9 .6 .2 2.5 6.9 .6Total $ .7 $ 12.8 $ 27.0 $ 11.0
(1) Derivative assets and liabilities that have maturity dates equal to or less than 12 months from the respective
balance sheet dates were included in other current assets and accrued liabilities and other, respectively, on our consolidated balance sheets.
(2) Derivative assets and liabilities that have maturity dates greater than 12 months from the respective balance sheet dates were included in other assets, net, and other liabilities, respectively, on our consolidated balance sheets.
We utilize cash flow hedges to hedge forecasted foreign currency denominated transactions, primarily to reduce our exposure to foreign currency exchange rate risk associated with contract drilling expenses and capital expenditures denominated in various currencies. As of December 31, 2014, we had cash flow hedges outstanding to exchange an aggregate $373.1 million for various foreign currencies, including $194.3 million for British pounds, $81.2 million for Brazilian reais, $35.5 million for Euros, $28.5 million for Singapore dollars, $20.1 million for Australian dollars and $13.5 million for other currencies. Gains and losses, net of tax, on derivatives designated as cash flow hedges included in our consolidated statements of operations and comprehensive income for each of the years in the three-year period ended December 31, 2014 were as follows (in millions):
(Loss) Gain Recognized in Other Comprehensive
Income ("OCI") on Derivatives
(Effective Portion)
(Loss) Gain Reclassified from
AOCI into Income (Effective Portion)(1)
Loss Recognized in Income on
Derivatives (Ineffective Portion and Amount
Excluded from Effectiveness Testing)(2)
2014 2013 2012 2014 2013 2012 2014 2013 2012 Interest rate lock contracts(3) $ — $ — $ — $ (.4) $ (.4) $ (.5) $ — $ — $ —Foreign currency forward contracts(4) (11.7) (5.8) 8.7 1.3 (1.6) .5
(.7) (.3) (.3)
Total $ (11.7) $ (5.8) $ 8.7 $ .9 $ (2.0) $ — $ (.7) $ (.3) $ (.3)
(1) Changes in the fair value of cash flow hedges are recorded in AOCI. Amounts recorded in AOCI associated with cash flow hedges are subsequently reclassified into contract drilling, depreciation or interest expense as earnings are affected by the underlying hedged forecasted transaction.

56
(2) Gains and losses recognized in income for ineffectiveness and amounts excluded from effectiveness testing were included in other, net, in our consolidated statements of operations.
(3) Losses on interest rate lock derivatives reclassified from AOCI into income (effective portion) were included in
interest expense, net in our consolidated statements of operations.
(4) During the year ended December 31, 2014, $400,000 of gains were reclassified from AOCI into contract
drilling expense and $900,000 of gains were reclassified from AOCI into depreciation expense in our consolidated statement of operations. During the year ended December 31, 2013, $2.5 million of losses were reclassified from AOCI into contract drilling expense and $900,000 of gains were reclassified from AOCI into depreciation expense in our consolidated statement of operations.
We have net assets and liabilities denominated in numerous foreign currencies and use various methods to manage our exposure to foreign currency exchange rate risk. We predominantly structure our drilling contracts in U.S. dollars, which significantly reduces the portion of our cash flows and assets denominated in foreign currencies. We occasionally enter into derivatives that hedge the fair value of recognized foreign currency denominated assets or liabilities but do not designate such derivatives as hedging instruments. In these situations, a natural hedging relationship generally exists whereby changes in the fair value of the derivatives offset changes in the fair value of the underlying hedged items. As of December 31, 2014, we held derivatives not designated as hedging instruments to exchange an aggregate $207.5 million for various foreign currencies, including $98.9 million for Euros, $36.1 million for British pounds, $31.1 million for Swiss francs, $10.3 million for Indonesian Rupiah, $8.6 million for Brazilian reais and $22.5 million for other currencies. Net losses of $24.8 million and net gains of $3.6 million and $1.5 million associated with our derivatives not designated as hedging instruments were included in other, net, in our consolidated statements of operations for the years ended December 31, 2014, 2013 and 2012, respectively. As of December 31, 2014, the estimated amount of net losses associated with derivatives, net of tax, that will be reclassified to earnings during the next 12 months was as follows (in millions):
Net unrealized losses to be reclassified to contract drilling expense $ (9.4)Net realized gains to be reclassified to depreciation expense .9Net realized losses to be reclassified to interest expense (.4)Net losses to be reclassified to earnings $ (8.9)

57
6. SHAREHOLDERS' EQUITY Activity in our various shareholders' equity accounts for each of the years in the three-year period ended December 31, 2014 was as follows (in millions):
Shares
Par Value
AdditionalPaid-in Capital
Retained Earnings
AOCI
Treasury Shares
NoncontrollingInterest
BALANCE, December 31, 2011 235.9 $ 23.7 $ 5,253.0 $ 5,613.1 $ 8.6 $ (19.1) $ 5.2Net income — — — 1,169.7 — — 7.0Dividends paid — — — (348.1) — — —Distributions to noncontrolling interests — — — — —
—
(6.5)
Shares issued under share-based compensation plans, net 1.8 .2 35.3 — —
(.1) —
Equity issuance costs — — 66.7 — — — —Tax deficiency from share-based
compensation — — (1.0) — — —
—
Repurchase of shares — — — — — (11.8) —Share-based compensation cost — — 44.7 — — — —Net other comprehensive income — — — — 11.5 — —
BALANCE, December 31, 2012 237.7 23.9 5,398.7 6,434.7 20.1 (31.0) 5.7Net income — — — 1,418.2 — — 9.7Dividends paid — — — (525.6) — — —Distributions to noncontrolling
interests — — — — — —
(8.1)
Shares issued in connection with share-based compensation plans, net 1.9 .2 21.8 — —
(.1) —
Tax benefit from share-based compensation — — .1 — —
—
—
Repurchase of shares — — — — — (14.1) —Share-based compensation cost — — 46.6 — — — —Net other comprehensive loss — — — — (1.9) — —
BALANCE, December 31, 2013 239.6 24.1 5,467.2 7,327.3 18.2 (45.2) 7.3Net (loss) income — — — (3,902.6) — — 14.1Dividends paid — — — (704.3) — — —Distributions to noncontrolling
interests — — — — — —
(13.5)
Shares issued in connection with share-based compensation plans, net 1.1 .1 .4 — —
(.1) —
Tax benefit from share-based compensation — — 1.2 — —
—
—
Repurchase of shares — — — — — (13.7) —Share-based compensation cost — — 48.7 — — — —Net other comprehensive loss — — — — (6.3) — —
BALANCE, December 31, 2014 240.7 $ 24.2 $ 5,517.5 $ 2,720.4 $ 11.9 $ (59.0) $ 7.9
During 2013, our shareholders approved a new share repurchase program. Subject to certain provisions under English law, including the requirement of Ensco plc to have sufficient distributable reserves, we may purchase up to a maximum of $2.0 billion in the aggregate under the program, but in no case more than 35.0 million shares. The program terminates during 2018. As of December 31, 2014, there had been no share repurchases under this program.
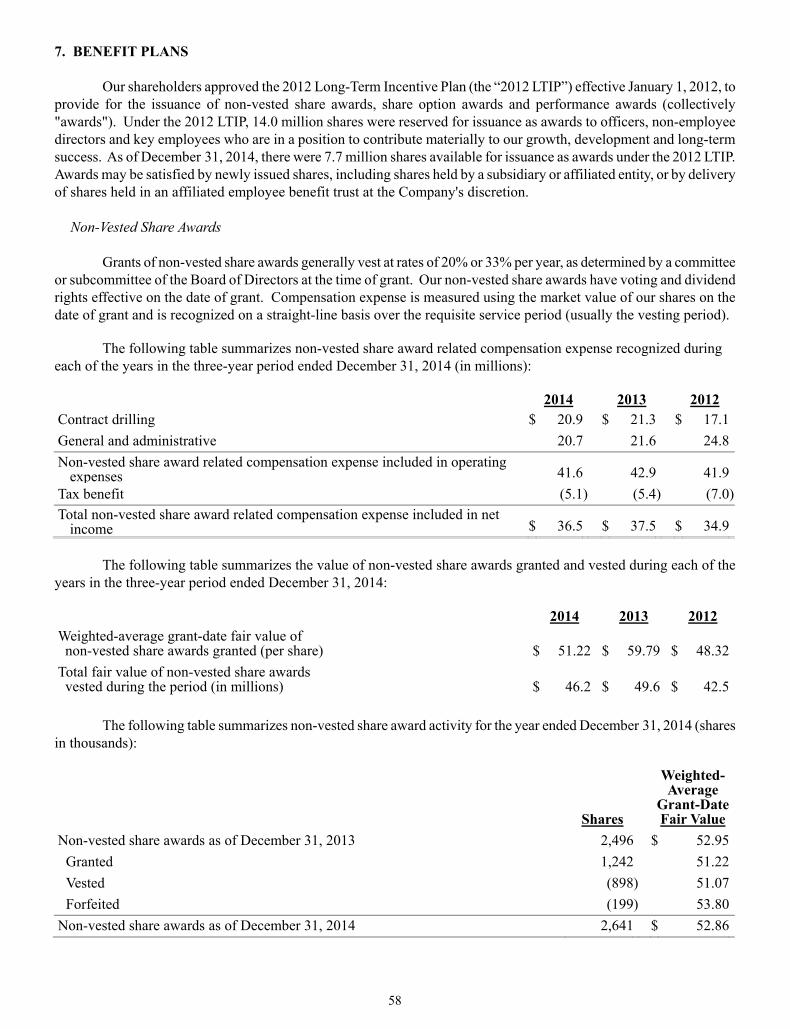
58
7. BENEFIT PLANS Our shareholders approved the 2012 Long-Term Incentive Plan (the “2012 LTIP”) effective January 1, 2012, to provide for the issuance of non-vested share awards, share option awards and performance awards (collectively "awards"). Under the 2012 LTIP, 14.0 million shares were reserved for issuance as awards to officers, non-employee directors and key employees who are in a position to contribute materially to our growth, development and long-term success. As of December 31, 2014, there were 7.7 million shares available for issuance as awards under the 2012 LTIP. Awards may be satisfied by newly issued shares, including shares held by a subsidiary or affiliated entity, or by delivery of shares held in an affiliated employee benefit trust at the Company's discretion.
Non-Vested Share Awards Grants of non-vested share awards generally vest at rates of 20% or 33% per year, as determined by a committee or subcommittee of the Board of Directors at the time of grant. Our non-vested share awards have voting and dividend rights effective on the date of grant. Compensation expense is measured using the market value of our shares on the date of grant and is recognized on a straight-line basis over the requisite service period (usually the vesting period). The following table summarizes non-vested share award related compensation expense recognized during each of the years in the three-year period ended December 31, 2014 (in millions):
2014 2013 2012 Contract drilling $ 20.9 $ 21.3 $ 17.1General and administrative 20.7 21.6 24.8Non-vested share award related compensation expense included in operating
expenses 41.6 42.9 41.9
Tax benefit (5.1) (5.4) (7.0)Total non-vested share award related compensation expense included in net
income $ 36.5 $ 37.5 $ 34.9
The following table summarizes the value of non-vested share awards granted and vested during each of the years in the three-year period ended December 31, 2014:
2014 2013 2012 Weighted-average grant-date fair value of non-vested share awards granted (per share) $ 51.22
$ 59.79 $ 48.32
Total fair value of non-vested share awards vested during the period (in millions) $ 46.2
$ 49.6 $ 42.5
The following table summarizes non-vested share award activity for the year ended December 31, 2014 (shares in thousands):
Shares
Weighted-Average
Grant-DateFair Value
Non-vested share awards as of December 31, 2013 2,496 $ 52.95Granted 1,242 51.22Vested (898) 51.07Forfeited (199) 53.80
Non-vested share awards as of December 31, 2014 2,641 $ 52.86

59
As of December 31, 2014, there was $100.7 million of total unrecognized compensation cost related to non-vested share awards, which is expected to be recognized over a weighted-average period of 2.1 years.
Share Option Awards Share option awards ("options") granted to officers and employees generally become exercisable in 25% increments over a four-year period or 33% increments over a three-year period and, to the extent not exercised, expire on the seventh anniversary of the date of grant. Options granted to non-employee directors are immediately exercisable and, to the extent not exercised, expire on the seventh anniversary of the date of grant. The exercise price of options granted under the 2012 LTIP equals the market value of the underlying shares on the date of grant. As of December 31, 2014, options granted to purchase 472,000 shares with a weighted average exercise price of $41.09 were outstanding under the 2012 LTIP and predecessor or acquired plans. No options have been granted since 2011, and there were no unrecognized compensation costs related to options as of December 31, 2014.
Performance Awards Under the 2012 LTIP, performance awards may be issued to our senior executive officers. Performance awards granted prior to 2013 are payable in Ensco shares, cash or a combination thereof upon attainment of specified performance goals based on relative total shareholder return ("TSR") and absolute and relative return on capital employed ("ROCE"). Performance awards granted during 2013 and 2014 are payable in Ensco shares upon attainment of specified performance goals based on relative TSR and relative ROCE. The performance goals are determined by a committee or subcommittee of the Board of Directors. Performance awards generally vest at the end of a three-year measurement period based on attainment of performance goals. Our performance awards granted prior to 2013 are classified as liability awards with compensation expense measured based on the estimated probability of attainment of the specified performance goals and recognized on a straight-line basis over the requisite service period. The estimated probable outcome of attainment of the specified performance goals is based on historical experience, and any subsequent changes in this estimate are recognized as a cumulative adjustment to compensation cost in the period in which the change in estimate occurs. Our performance awards granted during 2013 and 2014 are classified as equity awards with compensation expense recognized on a straight-line basis over the requisite service period. The estimated probable outcome of attainment of the specified performance goals is based on historical experience, and any subsequent changes in this estimate for the relative ROCE performance goal are recognized as a cumulative adjustment to compensation cost in the period in which the change in estimate occurs. The aggregate grant-date fair value of performance awards granted during 2014, 2013 and 2012 totaled $7.4 million, $8.2 million and $7.2 million, respectively. The aggregate fair value of performance awards vested during 2014, 2013 and 2012 totaled $6.9 million, $7.4 million and $5.3 million, respectively, all of which was paid in cash. During the years ended December 31, 2014, 2013 and 2012, we recognized $3.4 million, $6.6 million and $9.7 million of compensation expense for performance awards, respectively, which was included in general and administrative expense in our consolidated statements of operations. As of December 31, 2014, there was $5.0 million of total unrecognized compensation cost related to unvested performance awards, which is expected to be recognized over a weighted-average period of 1.9 years.

60
Savings Plans We have profit sharing plans (the "Ensco Savings Plan," the "Ensco Multinational Savings Plan" and the "Ensco Limited Retirement Plan"), which cover eligible employees, as defined within each plan. The Ensco Savings Plan includes a 401(k) savings plan feature which allows eligible employees to make tax deferred contributions to the plan. The Ensco Limited Retirement Plan also allows eligible employees to make tax deferred contributions to the plan. Contributions made to the Ensco Multinational Savings Plan may or may not qualify for tax deferral based on each plan participant's local tax requirements. We generally make matching cash contributions to the plans. We match 100% of the amount contributed by the employee up to a maximum of 5% of eligible salary. Matching contributions totaled $20.7 million, $21.1 million and $16.5 million for the years ended December 31, 2014, 2013 and 2012, respectively. Profit sharing contributions made into the plans require approval of the Board of Directors and are generally paid in cash. We recorded profit sharing contribution provisions of $30.7 million, $55.3 million and $45.1 million for the years ended December 31, 2014, 2013 and 2012, respectively. Matching contributions and profit sharing contributions become vested in 33% increments upon completion of each initial year of service with all contributions becoming fully vested subsequent to achievement of three or more years of service. We have 1.0 million shares reserved for issuance as matching contributions under the Ensco Savings Plan. 8. GOODWILL AND OTHER INTANGIBLE ASSETS AND LIABILITIES
Goodwill The carrying amount of goodwill as of December 31, 2014 is detailed below by reporting unit (in millions):
December 31, 2014 December 31, 2013
Gross Carrying Amount
Accumulated Impairment
Losses
Net Carrying Amount
Gross Carrying Amount
Accumulated Impairment
Losses
Net Carrying Amount
Floaters Balance, beginning of period $ 3,081.4
$ — $ 3,081.4 $ 3,081.4 $ — $ 3,081.4
Loss on impairment — (2,997.9) (2,997.9) — — —Balance, end of period $ 3,081.4 $ (2,997.9) $ 83.5 $ 3,081.4 $ — $ 3,081.4
Jackups Balance, beginning of period $ 192.6
$ — $ 192.6 $ 192.6 $ — $ 192.6
Loss on impairment — — — — — —Balance, end of period $ 192.6 $ — $ 192.6 $ 192.6 $ — $ 192.6
Impairment of Goodwill
Our business consists of three operating segments: (1) Floaters, which includes our drillships and semisubmersible rigs, (2) Jackups and (3) Other, which consists of management services on rigs owned by third-parties. Our two reportable segments, Floaters and Jackups, provide one service, contract drilling.
We test goodwill for impairment on an annual basis or when events or changes in circumstances indicate that a potential impairment exists. During the second quarter, demand for floaters deteriorated as a result of a continued reduction in capital spending by operators in addition to announced delays in operators’ drilling programs. The reduction in demand, combined with increasing supply from newbuild floater deliveries, led to a very competitive

61
market. In general, contracting activity for floaters declined significantly and day rates and utilization came under pressure, especially for older, less capable floaters.
Management considered the adverse change in the floater business climate, the commitment to a plan to sell five floaters in May 2014, and the impairment charge on the "held for sale" floaters during the second quarter and concluded that a triggering event had occurred. We performed an interim goodwill impairment test to evaluate the recoverability of the Floaters reporting unit goodwill balance of $3.1 billion as of May 31, 2014. Based on the valuation performed, the Floaters reporting unit estimated fair value exceeded the carrying value by approximately 7%; therefore, we concluded that the goodwill balance was not impaired.
As part of our annual goodwill impairment test as of December 31, 2014, we considered the significant decline in commodity prices during the fourth quarter of 2014. Specifically, Brent crude oil prices declined from approximately $95 per barrel at September 30, 2014 to near $55 per barrel at December 31, 2014. These declines resulted in further reductions in capital spending by operators, including the cancellation or deferral of planned drilling programs. We expect that this reduction in demand will cause further deterioration in day rates and utilization and that current market dynamics will create a challenging contracting environment into 2016.
Our stock price also declined significantly during the latter half of 2014, reaching a five-year low of $25.88 on December 16th. Our stock price traded between $25.88 and $41.99 during the fourth quarter of 2014 and averaged $35.23 during this period.
Management considered the adverse changes in the current floater business climate, the sustained decline in stock price and the impairment charge on older, less capable floaters during the fourth quarter and concluded it was more-likely-than-not that the fair value of the Floater reporting unit was less than its carrying amount. As a result, we estimated the fair value of the reporting unit using a blended income and market approach. Based on the valuation performed as of December 31, 2014, the reporting unit estimated fair value was less than the carrying value; therefore, we concluded that the Floater goodwill balance was impaired. We compared the estimated fair value of the reporting unit to the fair value of all assets and liabilities of the reporting unit to calculate the implied fair value of goodwill. As a result, we recorded a non-cash loss on impairment totaling $3.0 billion which was included in loss on impairment in our consolidated statement of operations for the year ended December 31, 2014.
The income approach was based on a discounted cash flow model, which utilized present values of cash flows to estimate fair value. The future cash flows were projected based on our estimates of future day rates, utilization, operating costs, capital requirements, growth rates and terminal values. Forecasted day rates and utilization take into account current market conditions and our anticipated business outlook, both of which have been impacted by the adverse changes in the floater business environment during 2014. The day rates reflected contracted rates during the respective contracted periods and management's estimate of market day rates in uncontracted periods. The forecasted market day rates were held constant in the near-term but were forecasted to grow in the longer-term and terminal period.
Operating costs were forecasted using a combination of our historical average operating costs and expected future costs, adjusted for an estimated inflation factor. Capital requirements in the discounted cash flow model were based on management's estimates of future capital costs, taking into consideration our historical trends. The estimated capital requirements included cash outflows for new rig construction, rig enhancements and minor upgrades and improvements.
A terminal period was used to reflect our estimate of stable, perpetual growth. The terminal period reflects a terminal growth rate of 3.0%, which includes an estimated inflation factor. The future cash flows were discounted using a market-participant risk-adjusted weighted average cost of capital ("WACC") of 11.0%. These assumptions were derived from unobservable inputs and reflect management's judgments and assumptions.
The market approach was based upon the application of price-to-earnings multiples to management's estimates of future earnings adjusted for a control premium. The price-to-earnings multiples used in the market valuation ranged from 6.0x to 6.8x and were based on market participant multiples. Management's earnings estimates were derived from unobservable inputs that require significant estimates, judgments and assumptions as described in the income approach.

62
The estimated fair value of the Floaters reporting unit determined under the income approach was consistent with the estimated fair value determined under the market approach. For purposes of the goodwill impairment test, we calculated the Floaters reporting unit estimated fair value as the average of the values calculated under the income approach and the market approach.
We evaluated the estimated fair value of our reporting units compared to our market capitalization as of December 31, 2014. To perform this assessment, we used a market approach to estimate the fair value of the Jackups reporting unit. The aggregate fair values of our reporting units exceeded our market capitalization, and we believe the resulting implied control premium was reasonable based on recent market transactions within our industry or other relevant benchmark data.
We performed a qualitative assessment for our Jackup reporting unit as of December 31, 2014. Goodwill impairment tests performed during prior years indicated that the fair value of the Jackup reporting unit significantly exceeded its carrying amount. Despite the adverse changes in the offshore drilling climate, we concluded that the fair value remains substantially in excess of the carrying value of the reporting unit, as evidenced by the estimated fair value of the Jackup reporting unit calculated for the purpose of reconciling the fair value of our reporting units to our market capitalization. Therefore, we concluded that it remains more-likely-than-not that the Jackup reporting unit was not impaired.
The estimates used to determine the fair value of the Floaters reporting unit reflect management's best estimates, and we believe they are reasonable. Future declines in the Floaters reporting unit's operating performance or our anticipated business outlook may reduce the estimated fair value of our Floaters reporting unit and result in additional impairments. Factors that could have a negative impact on the fair value of the Floaters reporting unit include, but are not limited to:
• decreases in estimated market day rates and utilization due to greater-than-expected market pressures, downtime and other risks associated with offshore rig operations;
• sustained declines in our stock price;
• decreases in revenue due to our inability to attract and retain skilled personnel;
• changes in worldwide rig supply and demand, competition or technology, including changes as a result of newbuild rig deliveries;
• changes in future levels of drilling activity and expenditures, whether as a result of global capital markets and liquidity, prices of oil and natural gas or otherwise, which may cause us to idle or stack additional rigs;
• possible cancellation or suspension of drilling contracts as a result of mechanical difficulties, performance or other reasons;
• delays in contract commencement dates;
• the outcome of litigation, legal proceedings, investigations or other claims or contract disputes resulting in significant cash outflows;
• governmental, regulatory, legislative and permitting requirements affecting drilling operations, including limitations on drilling locations (such as the Gulf of Mexico during hurricane season);
• increases in the market-participant risk-adjusted WACC;
• declines in anticipated growth rates.
Adverse changes in one or more of these factors could result in additional goodwill impairments in future periods.

63
Drilling Contract Intangibles
In connection with the Pride acquisition, we recorded intangible assets and liabilities representing the estimated fair values of the acquired company's firm drilling contracts in place at the date of acquisition with favorable or unfavorable contract terms as compared to then-current market day rates for comparable drilling rigs.
The gross carrying amounts of our drilling contract intangibles, which we consider to be definite-lived intangibles assets and intangible liabilities, and accumulated amortization as of December 31, 2014 and 2013 were as follows (in millions):
December 31, 2014 December 31, 2013
Gross Carrying Amount
Accumulated Amortization
Net Carrying Amount
Gross Carrying Amount
Accumulated Amortization
Net Carrying Amount
Drilling contract intangible assets Balance, beginning of period $ 209.0
$ (130.6) $ 78.4 $ 209.0 $ (88.3) $ 120.7
Amortization — (32.7) (32.7) — (42.3) (42.3)Balance, end of period $ 209.0 $ (163.3) $ 45.7 $ 209.0 $ (130.6) $ 78.4
Drilling contract intangible liabilities Balance, beginning of period $ 278.0
$ (208.9) $ 69.1 $ 278.0 $ (160.0) $ 118.0
Amortization — (28.4) (28.4) — (48.9) (48.9)Balance, end of period $ 278.0 $ (237.3) $ 40.7 $ 278.0 $ (208.9) $ 69.1
The various factors considered in the determination of the fair values of our drilling contract intangibles were (1) the contracted day rate for each contract, (2) the remaining term of each contract, (3) the rig class and (4) the market conditions for each respective rig class at the date of acquisition. The intangible assets and liabilities were calculated based on the present value of the difference in cash inflows over the remaining contract term as compared to a hypothetical contract with the same remaining term at an estimated then-current market day rate using a risk-adjusted discount rate and an estimated effective income tax rate. We amortize the drilling contract intangibles to operating revenues over the respective remaining drilling contract terms on a straight-line basis. The estimated net (reduction) increase to future operating revenues related to the amortization of these intangible assets and liabilities as of December 31, 2014, is as follows (in millions):
2015 $ (4.5)2016 (.8)2017 .3Total $ (5.0) 9. INCOME TAXES We generated loss of $460.3 million, income of $173.4 million and $101.1 million from continuing operations before income taxes in the U.S. and loss of $2.1 billion, income of $1.5 billion and $1.2 billion from continuing operations before income taxes in non-U.S. countries for the years ended December 31, 2014, 2013 and 2012, respectively.
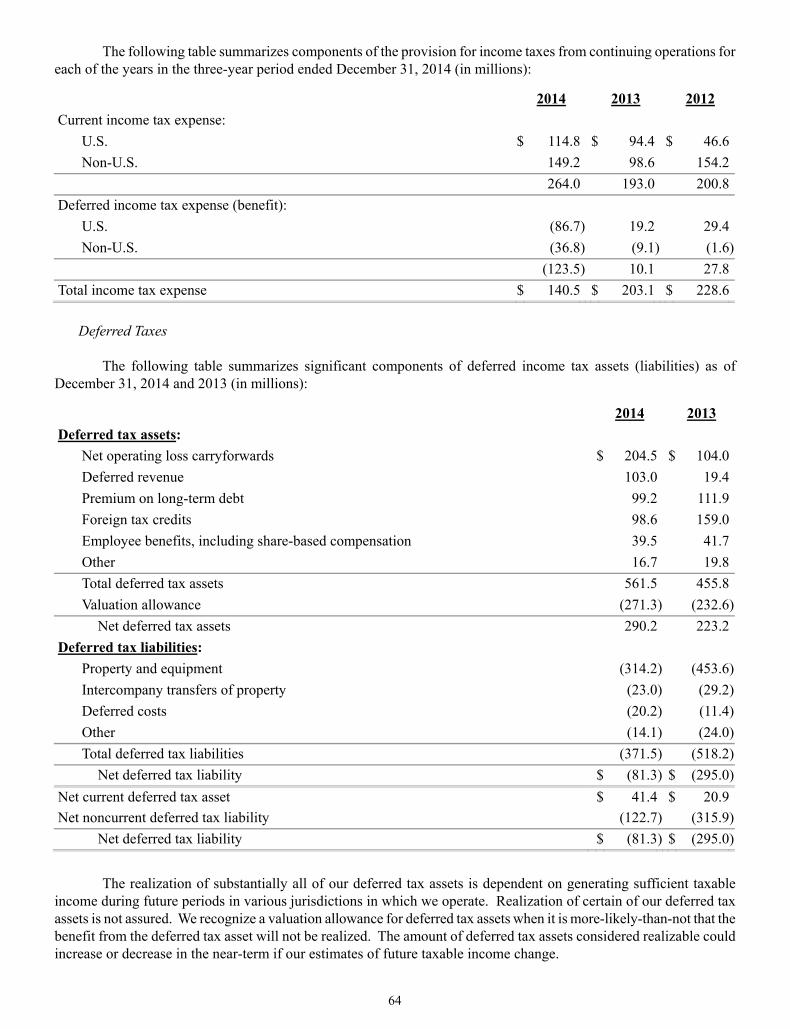
64
The following table summarizes components of the provision for income taxes from continuing operations for each of the years in the three-year period ended December 31, 2014 (in millions):
2014 2013 2012 Current income tax expense:
U.S. $ 114.8 $ 94.4 $ 46.6Non-U.S. 149.2 98.6 154.2
264.0 193.0 200.8Deferred income tax expense (benefit):
U.S. (86.7) 19.2 29.4Non-U.S. (36.8) (9.1) (1.6)
(123.5) 10.1 27.8Total income tax expense $ 140.5 $ 203.1 $ 228.6
Deferred Taxes The following table summarizes significant components of deferred income tax assets (liabilities) as of December 31, 2014 and 2013 (in millions):
2014 2013 Deferred tax assets:
Net operating loss carryforwards $ 204.5 $ 104.0Deferred revenue 103.0 19.4Premium on long-term debt 99.2 111.9Foreign tax credits 98.6 159.0Employee benefits, including share-based compensation 39.5 41.7Other 16.7 19.8Total deferred tax assets 561.5 455.8Valuation allowance (271.3) (232.6)
Net deferred tax assets 290.2 223.2Deferred tax liabilities:
Property and equipment (314.2) (453.6)Intercompany transfers of property (23.0) (29.2)Deferred costs (20.2) (11.4)Other (14.1) (24.0)Total deferred tax liabilities (371.5) (518.2)
Net deferred tax liability $ (81.3) $ (295.0)Net current deferred tax asset $ 41.4 $ 20.9Net noncurrent deferred tax liability (122.7) (315.9)
Net deferred tax liability $ (81.3) $ (295.0)
The realization of substantially all of our deferred tax assets is dependent on generating sufficient taxable income during future periods in various jurisdictions in which we operate. Realization of certain of our deferred tax assets is not assured. We recognize a valuation allowance for deferred tax assets when it is more-likely-than-not that the benefit from the deferred tax asset will not be realized. The amount of deferred tax assets considered realizable could increase or decrease in the near-term if our estimates of future taxable income change.
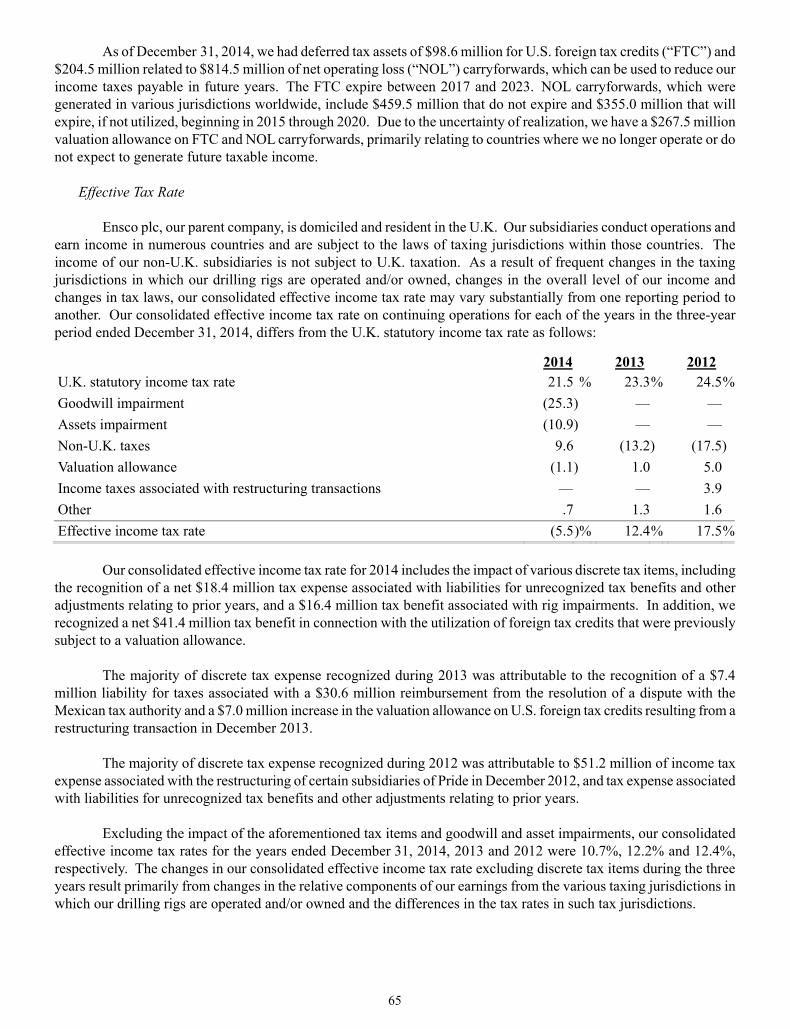
65
As of December 31, 2014, we had deferred tax assets of $98.6 million for U.S. foreign tax credits (“FTC”) and $204.5 million related to $814.5 million of net operating loss (“NOL”) carryforwards, which can be used to reduce our income taxes payable in future years. The FTC expire between 2017 and 2023. NOL carryforwards, which were generated in various jurisdictions worldwide, include $459.5 million that do not expire and $355.0 million that will expire, if not utilized, beginning in 2015 through 2020. Due to the uncertainty of realization, we have a $267.5 million valuation allowance on FTC and NOL carryforwards, primarily relating to countries where we no longer operate or do not expect to generate future taxable income.
Effective Tax Rate
Ensco plc, our parent company, is domiciled and resident in the U.K. Our subsidiaries conduct operations and earn income in numerous countries and are subject to the laws of taxing jurisdictions within those countries. The income of our non-U.K. subsidiaries is not subject to U.K. taxation. As a result of frequent changes in the taxing jurisdictions in which our drilling rigs are operated and/or owned, changes in the overall level of our income and changes in tax laws, our consolidated effective income tax rate may vary substantially from one reporting period to another. Our consolidated effective income tax rate on continuing operations for each of the years in the three-year period ended December 31, 2014, differs from the U.K. statutory income tax rate as follows:
2014 2013 2012 U.K. statutory income tax rate 21.5 % 23.3% 24.5%Goodwill impairment (25.3) — —Assets impairment (10.9) — —Non-U.K. taxes 9.6 (13.2) (17.5) Valuation allowance (1.1) 1.0 5.0Income taxes associated with restructuring transactions — — 3.9Other .7 1.3 1.6Effective income tax rate (5.5)% 12.4% 17.5%
Our consolidated effective income tax rate for 2014 includes the impact of various discrete tax items, including
the recognition of a net $18.4 million tax expense associated with liabilities for unrecognized tax benefits and other adjustments relating to prior years, and a $16.4 million tax benefit associated with rig impairments. In addition, we recognized a net $41.4 million tax benefit in connection with the utilization of foreign tax credits that were previously subject to a valuation allowance.
The majority of discrete tax expense recognized during 2013 was attributable to the recognition of a $7.4
million liability for taxes associated with a $30.6 million reimbursement from the resolution of a dispute with the Mexican tax authority and a $7.0 million increase in the valuation allowance on U.S. foreign tax credits resulting from a restructuring transaction in December 2013.
The majority of discrete tax expense recognized during 2012 was attributable to $51.2 million of income tax
expense associated with the restructuring of certain subsidiaries of Pride in December 2012, and tax expense associated with liabilities for unrecognized tax benefits and other adjustments relating to prior years.
Excluding the impact of the aforementioned tax items and goodwill and asset impairments, our consolidated
effective income tax rates for the years ended December 31, 2014, 2013 and 2012 were 10.7%, 12.2% and 12.4%, respectively. The changes in our consolidated effective income tax rate excluding discrete tax items during the three years result primarily from changes in the relative components of our earnings from the various taxing jurisdictions in which our drilling rigs are operated and/or owned and the differences in the tax rates in such tax jurisdictions.
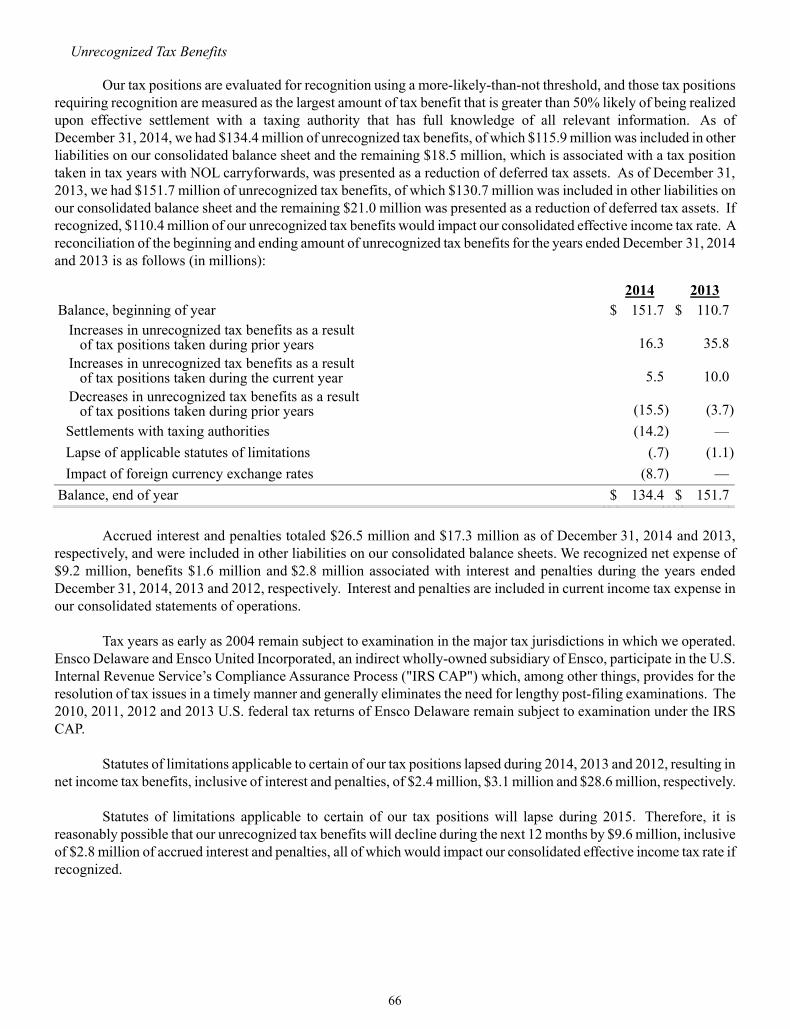
66
Unrecognized Tax Benefits Our tax positions are evaluated for recognition using a more-likely-than-not threshold, and those tax positions requiring recognition are measured as the largest amount of tax benefit that is greater than 50% likely of being realized upon effective settlement with a taxing authority that has full knowledge of all relevant information. As of December 31, 2014, we had $134.4 million of unrecognized tax benefits, of which $115.9 million was included in other liabilities on our consolidated balance sheet and the remaining $18.5 million, which is associated with a tax position taken in tax years with NOL carryforwards, was presented as a reduction of deferred tax assets. As of December 31, 2013, we had $151.7 million of unrecognized tax benefits, of which $130.7 million was included in other liabilities on our consolidated balance sheet and the remaining $21.0 million was presented as a reduction of deferred tax assets. If recognized, $110.4 million of our unrecognized tax benefits would impact our consolidated effective income tax rate. A reconciliation of the beginning and ending amount of unrecognized tax benefits for the years ended December 31, 2014 and 2013 is as follows (in millions):
2014 2013 Balance, beginning of year $ 151.7 $ 110.7 Increases in unrecognized tax benefits as a result of tax positions taken during prior years 16.3 35.8 Increases in unrecognized tax benefits as a result of tax positions taken during the current year 5.5 10.0 Decreases in unrecognized tax benefits as a result of tax positions taken during prior years (15.5) (3.7)
Settlements with taxing authorities (14.2) —Lapse of applicable statutes of limitations (.7) (1.1)Impact of foreign currency exchange rates (8.7) —
Balance, end of year $ 134.4 $ 151.7 Accrued interest and penalties totaled $26.5 million and $17.3 million as of December 31, 2014 and 2013, respectively, and were included in other liabilities on our consolidated balance sheets. We recognized net expense of $9.2 million, benefits $1.6 million and $2.8 million associated with interest and penalties during the years ended December 31, 2014, 2013 and 2012, respectively. Interest and penalties are included in current income tax expense in our consolidated statements of operations. Tax years as early as 2004 remain subject to examination in the major tax jurisdictions in which we operated. Ensco Delaware and Ensco United Incorporated, an indirect wholly-owned subsidiary of Ensco, participate in the U.S. Internal Revenue Service’s Compliance Assurance Process ("IRS CAP") which, among other things, provides for the resolution of tax issues in a timely manner and generally eliminates the need for lengthy post-filing examinations. The 2010, 2011, 2012 and 2013 U.S. federal tax returns of Ensco Delaware remain subject to examination under the IRS CAP. Statutes of limitations applicable to certain of our tax positions lapsed during 2014, 2013 and 2012, resulting in net income tax benefits, inclusive of interest and penalties, of $2.4 million, $3.1 million and $28.6 million, respectively. Statutes of limitations applicable to certain of our tax positions will lapse during 2015. Therefore, it is reasonably possible that our unrecognized tax benefits will decline during the next 12 months by $9.6 million, inclusive of $2.8 million of accrued interest and penalties, all of which would impact our consolidated effective income tax rate if recognized.

67
Intercompany Transfer of Drilling Rigs During the three-year period ended December 31, 2014, we transferred ownership of certain drilling rigs among our subsidiaries, including three jackup rigs during 2014, two semisubmersible rigs during 2013 and one jackup rig during 2012. There was no income tax liability associated with the intercompany transfers of drilling rigs during 2014 and 2013. A $1.7 million income tax liability resulted from the gain on the intercompany transfer of the jackup rig in 2012. The related income tax expense was deferred and is being amortized on a straight-line basis over the 15-year remaining useful life of the rig. There were no temporary differences associated with any of the intercompany transfers of drilling rigs during the three-year period ended December 31, 2014. As of December 31, 2014 and 2013, the unamortized balance associated with deferred charges for income taxes incurred in connection with intercompany transfers of drilling rigs totaled $39.7 million and $50.2 million, respectively, and was included in other assets, net, on our consolidated balance sheets. Current income tax expense for the years ended December 31, 2014, 2013 and 2012 included $2.6 million, $4.1 million and $9.1 million, respectively, of amortization of income taxes incurred in connection with intercompany transfers of drilling rigs. As of December 31, 2014 and 2013, the unamortized balance associated with the deferred tax liability for reversing temporary differences of transferred drilling rigs totaled $23.0 million and $29.2 million, respectively, and was included in deferred income taxes on our consolidated balance sheets. Deferred income tax benefit for the year ended December 31, 2014 and deferred income tax expense for the years ended December 31, 2013 and 2012 included benefits of $4.8 million, $1.9 million and $3.4 million, respectively, of amortization of deferred reversing temporary differences associated with intercompany transfers of drilling rigs.
Undistributed Earnings Dividend income received by Ensco plc from its subsidiaries is exempt from U.K. taxation. We do not provide deferred taxes on undistributed earnings of certain subsidiaries because our policy and intention is to reinvest such earnings indefinitely. Each of the subsidiaries for which we maintain such policy has significant net assets, liquidity, contract backlog and/or other financial resources available to meet operational and capital investment requirements and otherwise allow us to continue to maintain our policy of reinvesting the undistributed earnings indefinitely. In December 2012, a U.S. subsidiary received $530.0 million in earnings distributions from two non-U.S. subsidiaries. There was no net U.S. tax liability on the earnings repatriation, as we utilized net operating loss carryforwards to offset the previously untaxed portion of the earnings distribution. The earnings distribution was made in consideration of unique circumstances, and our U.S. subsidiaries continue to have significant net assets, liquidity, contract backlog and other financial resources available to meet operational and capital investment requirements. Accordingly, this distribution did not change, and we continue to maintain, our policy and intention to reinvest the undistributed earnings of the two aforementioned subsidiaries indefinitely. As of December 31, 2014 and 2013, the aggregate undistributed earnings of the subsidiaries for which we maintain a policy and intention to reinvest earnings indefinitely totaled $2.3 billion and $2.1 billion, respectively. Should we make a distribution from these subsidiaries in the form of dividends or otherwise, we would be subject to additional income taxes. The unrecognized deferred tax liability related to these undistributed earnings was not practicable to estimate as of December 31, 2014.
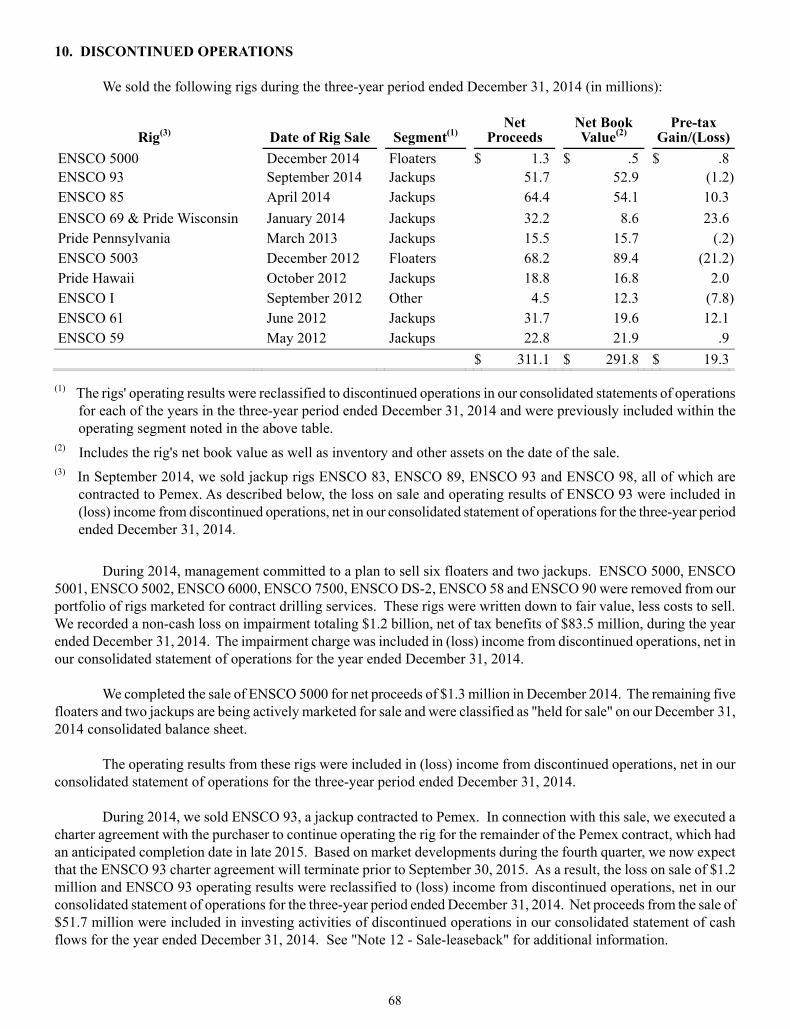
68
10. DISCONTINUED OPERATIONS We sold the following rigs during the three-year period ended December 31, 2014 (in millions):
Rig(3) Date of Rig Sale Segment(1) Net
Proceeds Net Book Value(2)
Pre-tax Gain/(Loss)
ENSCO 5000 December 2014 Floaters $ 1.3 $ .5 $ .8ENSCO 93 September 2014 Jackups 51.7 52.9 (1.2)ENSCO 85 April 2014 Jackups 64.4 54.1 10.3ENSCO 69 & Pride Wisconsin January 2014 Jackups 32.2 8.6 23.6Pride Pennsylvania March 2013 Jackups 15.5 15.7 (.2)ENSCO 5003 December 2012 Floaters 68.2 89.4 (21.2)Pride Hawaii October 2012 Jackups 18.8 16.8 2.0ENSCO I September 2012 Other 4.5 12.3 (7.8)ENSCO 61 June 2012 Jackups 31.7 19.6 12.1ENSCO 59 May 2012 Jackups 22.8 21.9 .9 $ 311.1 $ 291.8 $ 19.3
(1) The rigs' operating results were reclassified to discontinued operations in our consolidated statements of operations for each of the years in the three-year period ended December 31, 2014 and were previously included within the operating segment noted in the above table.
(2) Includes the rig's net book value as well as inventory and other assets on the date of the sale.
(3) In September 2014, we sold jackup rigs ENSCO 83, ENSCO 89, ENSCO 93 and ENSCO 98, all of which are contracted to Pemex. As described below, the loss on sale and operating results of ENSCO 93 were included in (loss) income from discontinued operations, net in our consolidated statement of operations for the three-year period ended December 31, 2014.
During 2014, management committed to a plan to sell six floaters and two jackups. ENSCO 5000, ENSCO 5001, ENSCO 5002, ENSCO 6000, ENSCO 7500, ENSCO DS-2, ENSCO 58 and ENSCO 90 were removed from our portfolio of rigs marketed for contract drilling services. These rigs were written down to fair value, less costs to sell. We recorded a non-cash loss on impairment totaling $1.2 billion, net of tax benefits of $83.5 million, during the year ended December 31, 2014. The impairment charge was included in (loss) income from discontinued operations, net in our consolidated statement of operations for the year ended December 31, 2014. We completed the sale of ENSCO 5000 for net proceeds of $1.3 million in December 2014. The remaining five floaters and two jackups are being actively marketed for sale and were classified as "held for sale" on our December 31, 2014 consolidated balance sheet. The operating results from these rigs were included in (loss) income from discontinued operations, net in our consolidated statement of operations for the three-year period ended December 31, 2014. During 2014, we sold ENSCO 93, a jackup contracted to Pemex. In connection with this sale, we executed a charter agreement with the purchaser to continue operating the rig for the remainder of the Pemex contract, which had an anticipated completion date in late 2015. Based on market developments during the fourth quarter, we now expect that the ENSCO 93 charter agreement will terminate prior to September 30, 2015. As a result, the loss on sale of $1.2 million and ENSCO 93 operating results were reclassified to (loss) income from discontinued operations, net in our consolidated statement of operations for the three-year period ended December 31, 2014. Net proceeds from the sale of $51.7 million were included in investing activities of discontinued operations in our consolidated statement of cash flows for the year ended December 31, 2014. See "Note 12 - Sale-leaseback" for additional information.

69
During 2014, we sold ENSCO 85 for net proceeds of $64.4 million and ENSCO 69 and Pride Wisconsin for net proceeds of $32.2 million. The operating results of these rigs were included in (loss) income from discontinued operations, net in our consolidated statement of operations for the three-year period ended December 31, 2014. The net proceeds from the sale for ENSCO 69 and Pride Wisconsin were received in December 2013 and included in investing activities of discontinued operations in our consolidated statement of cash flows for the year ended December 31, 2013. During 2012, we classified jackup rig Pride Pennsylvania as held for sale, and the rig was written down to fair value less estimated cost to sell. We recognized a $2.5 million loss for assets classified as held for sale during the year ended December 31, 2012. The following table summarizes (loss) income from discontinued operations for each of the years in the three-year period ended December 31, 2014 (in millions):
2014 2013 2012 Revenues $ 325.0 $ 596.4 $ 668.6Operating expenses 372.0 577.6 544.3Operating (loss) income (47.0) 18.8 124.3Other income — .3 1.3Income tax expense (30.7) (20.2) (8.5)Loss on impairment, net (1,158.8) — —Gain (loss) on disposal of discontinued operations, net 37.3 (1.1) (16.5)(Loss) income from discontinued operations $ (1,199.2) $ (2.2) $ 100.6
Debt and interest expense are not allocated to our discontinued operations. During 2008, ENSCO 74 was lost as a result of Hurricane Ike in the U.S. Gulf of Mexico. The owner of a pipeline filed claims alleging that ENSCO 74 caused the pipeline to rupture during Hurricane Ike. We incurred $3.6 million in professional fees in connection with this matter, which we applied against our $10.0 million per occurrence deductible under our liability insurance policy. In February 2014, we reached an agreement with the owner of the pipeline to settle the claims for $9.6 million. Accordingly, we recorded a $6.4 million charge for our remaining obligation under our liability insurance policy in loss from discontinued operations in our consolidated statement of operations for the year ended December 31, 2013. The remaining $3.2 million was settled by our underwriters. See "Note 11 - Commitments and Contingencies" for additional information on the ENSCO 74 loss. 11. COMMITMENTS AND CONTINGENCIES
Leases We are obligated under leases for certain of our offices and equipment. Rental expense relating to operating leases was $54.4 million, $49.1 million and $46.9 million during the years ended December 31, 2014, 2013 and 2012, respectively. Future minimum rental payments under our noncancellable operating lease obligations are as follows: $77.3 million during 2015; $31.8 million during 2016; $16.2 million during 2017; $10.6 million during 2018; $10.2 million during 2019 and $55.0 million thereafter.

70
Capital Commitments The following table summarizes the cumulative amount of contractual payments made as of December 31, 2014 for our rigs under construction and estimated timing of our remaining contractual payments (in millions):
Cumulative
Paid(1) 2015 2016 2017 Total(2) ENSCO DS-8 161.4 384.4 — — 545.8ENSCO DS-9 157.4 375.0 — — 532.4ENSCO DS-10 206.0 310.3 — — 516.3ENSCO 110 41.0 166.2 — — 207.2ENSCO 123 53.5 — 217.0 — 270.5ENSCO 140 78.4 78.9 39.2 — 196.5ENSCO 141 39.2 38.7 117.6 — 195.5 $ 736.9 $ 1,353.5 $ 373.8 $ — $ 2,464.2
(1) Cumulative paid represents the aggregate amount of contractual payments made from commencement of the construction agreement through December 31, 2014.
(2) Total commitments are based on fixed-price shipyard construction contracts, exclusive of costs associated with
commissioning, systems integration testing, project management and capitalized interest. Future contractual payments for rig enhancement projects, which are not reflected in the table above, are $42.8 million. We currently estimate these payments will be made during 2015. The timing of these expenditures may vary based on the completion of various construction milestones, which are, to a large extent, beyond our control.
ENSCO 29 Wreck Removal During 2005, a portion of the ENSCO 29 platform drilling rig was lost over the side of a customer's platform as
a result of Hurricane Katrina. In June 2014, we received a letter from an operator demanding that Ensco retrieve the derrick and drawworks from the seabed.
Our property insurance policies include coverage for the ENSCO 29 wreckage and debris removal costs up to
$3.8 million. We also maintain liability insurance policies that provide coverage under certain circumstances for wreckage and debris removal costs in excess of the $3.8 million coverage provided under the property insurance policies. We believe that it is not probable a liability exists with respect to this matter, and no liability has been recorded on our consolidated balance sheet as of December 31, 2014. While we cannot reasonably estimate a range of possible loss at this time, it is possible that removal costs may be in excess of our insurance coverage. Although we do not expect costs associated with the ENSCO 29 wreck removal to have a material adverse effect upon our financial position, operating results or cash flows, there can be no assurances as to the ultimate outcome.
ENSCO 74 Loss
During 2008, ENSCO 74 was lost as a result of Hurricane Ike in the U.S. Gulf of Mexico. The sunken rig hull of ENSCO 74 was located approximately 95 miles from the original drilling location when it was struck by an oil tanker during 2009. Wreck removal operations on the sunken rig hull of ENSCO 74 were completed during 2010. We filed a petition for exoneration or limitation of liability under U.S. admiralty and maritime law during 2009. A number of claimants presented claims in the exoneration/limitation proceedings. We have liability insurance policies

71
that provide coverage for such claims as well as removal of wreckage and debris in excess of the property insurance policy sublimit, subject to a $10.0 million per occurrence deductible for third-party claims and an annual aggregate limit of $490.0 million. The owner of a pipeline filed claims alleging that ENSCO 74 caused the pipeline to rupture during Hurricane Ike and sought damages for the cost of repairs and business interruption in an amount in excess of $26.0 million. During 2014, we reached an agreement with the owner of the pipeline to settle the claims for $9.6 million. Prior to the settlement we incurred legal fees of $3.6 million for this matter. During 2014, we paid the remaining $6.4 million of our deductible under our liability insurance policy, which was included in (loss) income from discontinued operations, net in our consolidated statement of operations for the year ended December 31, 2013. The remaining $3.2 million was paid by our underwriters under the terms of the related insurance policies. The owner of the oil tanker that struck the hull of ENSCO 74 filed claims seeking monetary damages currently in excess of $5.0 million for losses incurred when the tanker struck the sunken hull of ENSCO 74. This matter went to trial in June 2014, and the Company won a directed verdict on all claims. The plaintiff has the right to appeal the decision. We believe that it is not probable that a liability exists with respect to these claims. We believe all liabilities associated with the ENSCO 74 loss during Hurricane Ike resulted from a single occurrence under the terms of the applicable insurance policies. However, legal counsel for certain liability underwriters have asserted that the liability claims arise from separate occurrences. In the event of multiple occurrences, the self-insured retention is $15.0 million for two occurrences and $1.0 million for each occurrence thereafter. Although we do not expect final disposition of the claims associated with the ENSCO 74 loss to have a material adverse effect upon our financial position, operating results or cash flows, there can be no assurances as to the ultimate outcome.
Asbestos Litigation We and certain subsidiaries have been named as defendants, along with numerous third-party companies as co-defendants, in multi-party lawsuits filed in Illinois, Mississippi, Texas, Louisiana and the UK by approximately 125 plaintiffs. The lawsuits seek an unspecified amount of monetary damages on behalf of individuals alleging personal injury or death, primarily under the Jones Act, purportedly resulting from exposure to asbestos on drilling rigs and associated facilities during the 1960s through the 1980s. During 2013, we reached an agreement in principle with 58 of the plaintiffs to settle lawsuits filed in Mississippi for a nominal amount. A special master reviewed all 58 cases and made an allocation of settlement funds among the parties. The District Court Judge reviewed the allocations and accepted the special master’s recommendations and approved the settlements. The settlement documents and final documentation for the individual plaintiffs are being processed.
We intend to vigorously defend against the remaining claims and have filed responsive pleadings preserving all defenses and challenges to jurisdiction and venue. However, discovery is still ongoing and, therefore, available information regarding the nature of all pending claims is limited. At present, we cannot reasonably determine how many of the claimants may have valid claims under the Jones Act or estimate a range of potential liability exposure, if any. In addition to the pending cases in Illinois, Mississippi, Texas, Louisiana and the UK, we have other asbestos or lung injury claims pending against us in litigation in other jurisdictions. Although we do not expect final disposition of these asbestos or lung injury lawsuits to have a material adverse effect upon our financial position, operating results or cash flows, there can be no assurances as to the ultimate outcome of the lawsuits.

72
Other Matters
In addition to the foregoing, we are named defendants or parties in certain other lawsuits, claims or proceedings incidental to our business and are involved from time to time as parties to governmental investigations or proceedings, including matters related to taxation, arising in the ordinary course of business. Although the outcome of such lawsuits or other proceedings cannot be predicted with certainty and the amount of any liability that could arise with respect to such lawsuits or other proceedings cannot be predicted accurately, we do not expect these matters to have a material adverse effect on our financial position, operating results or cash flows.
In the ordinary course of business with customers and others, we have entered into letters of credit to guarantee our performance as it relates to our drilling contracts, contract bidding, customs duties, tax appeals and other obligations in various jurisdictions. Letters of credit outstanding as of December 31, 2014 totaled $263.9 million and are issued under facilities provided by various banks and other financial institutions. Obligations under these letters of credit are not normally called, as we typically comply with the underlying performance requirement. As of December 31, 2014, we had not been required to make collateral deposits with respect to these agreements.
12. SALE-LEASEBACK
In September 2014, we sold jackup rigs ENSCO 83, ENSCO 89, ENSCO 93 and ENSCO 98, all of which were contracted to Pemex. We received proceeds of $211.8 million and incurred commissions and other incremental, direct costs of $5.3 million. The carrying value of these rigs was $169.6 million.
In connection with this sale, we executed charter agreements with the purchaser to continue operating the rigs for the remainder of the Pemex contracts, which have anticipated completion dates in either late 2015 or 2016. We accounted for the transaction as a sale-leaseback, whereby we will retain a significant portion of the remaining use of the rigs as a result of the charter agreements.
We recorded an aggregate gain on sale of $7.5 million at the time of disposal, which represented the portion of the gain that exceeded the present value of payments due under the charter agreements, and was included in contract drilling expense in our consolidated statement of operations for the year ended December 31, 2014. The remaining $29.4 million gain was deferred and amortized to contract drilling expense within the Jackup segment over the remaining charter term of each rig. Of the $29.4 million deferred gain, $7.0 million was recognized in contract drilling expense in our consolidated statement of operations for the year ended December 31, 2014 and $22.4 million was included in accrued liabilities and other on our consolidated balance sheet as of December 31, 2014.
Due to our charter agreements with the purchaser, we expect to have significant continuing involvement and cash flows related to ENSCO 83, ENSCO 89 and ENSCO 98; therefore, the operating results for these rigs were included in income from continuing operations within the Jackup segment for periods prior to the date of sale (September 30, 2014). Operating results for periods beginning after September 30, 2014 were included in income from continuing operations within the Other segment. The proceeds from the sale of these rigs were included in investing activities of continuing operations in our consolidated statement of cash flows for the year ended December 31, 2014.
At the time of sale, we expected to also have significant continuing involvement and cash flows related to ENSCO 93; therefore, the operating results for the rig were included in income from continuing operations within the Jackup segment at September 30, 2014. Based on market developments during the fourth quarter, we now expect that the ENSCO 93 charter agreement will terminate prior to September 30, 2015. As a result, the loss on sale of $1.2 million and ENSCO 93 operating results were reclassified to (loss) income from discontinued operations, net in our consolidated statements of operations for the three-year period December 31, 2014. The proceeds from the sale were included in investing activities of discontinued operations in our consolidated statement of cash flows for the year ended December 31, 2014. See "Note 10 - Discontinued Operations" for additional information.

73
13. SEGMENT INFORMATION Our business consists of three operating segments: (1) Floaters, which includes our drillships and semisubmersible rigs, (2) Jackups and (3) Other, which consists of management services on rigs owned by third-parties. Our two reportable segments, Floaters and Jackups, provide one service, contract drilling. Segment information for each of the years in the three-year period ended December 31, 2014 is presented below (in millions). General and administrative expense and depreciation expense incurred by our corporate office are not allocated to our operating segments for purposes of measuring segment operating income and were included in "Reconciling Items." We measure segment assets as property and equipment. Prior year information has been reclassified to conform to the current year presentation. Year Ended December 31, 2014
Floaters Jackups Other
Operating Segments
Total Reconciling
Items Consolidated
Total Revenues $ 2,697.6 $ 1,774.6 $ 92.3 $ 4,564.5 $ — $ 4,564.5Operating expenses Contract drilling (exclusive of depreciation) 1,201.2
807.4 68.3 2,076.9 —
2,076.9
Loss on impairment 3,982.3 236.4 — 4,218.7 — 4,218.7 Depreciation 358.1 171.2 — 529.3 8.6 537.9 General and administrative — — — — 131.9 131.9Operating (loss) income $ (2,844.0) $ 559.6 $ 24.0 $ (2,260.4) $ (140.5) $ (2,400.9)Property and equipment, net $ 9,462.3 $ 2,995.3 $ — $ 12,457.6 $ 77.2 $ 12,534.8Capital expenditures $ 856.2 $ 667.7 $ — $ 1,523.9 $ 44.9 $ 1,568.8
Year Ended December 31, 2013
Floaters Jackups Other
Operating Segments
Total Reconciling
Items Consolidated
Total Revenues $ 2,659.6 $ 1,588.7 $ 75.1 $ 4,323.4 $ — $ 4,323.4Operating expenses Contract drilling (exclusive of depreciation) 1,126.0
762.6 58.5 1,947.1 —
1,947.1
Depreciation 342.2 147.5 — 489.7 6.5 496.2 General and administrative — — — — 146.8 146.8Operating income (loss) $ 1,191.4 $ 678.6 $ 16.6 $ 1,886.6 $ (153.3) $ 1,733.3Property and equipment, net $ 11,303.4 $ 2,961.6 $ — $ 14,265.0 $ 46.0 $ 14,311.0Capital expenditures $ 1,028.6 $ 708.3 $ — $ 1,736.9 $ 26.6 $ 1,763.5

74
Year Ended December 31, 2012
Floaters Jackups Other
Operating Segments
Total Reconciling
Items Consolidated
Total Revenues $ 2,149.1 $ 1,406.9 $ 82.8 $ 3,638.8 $ — $ 3,638.8Operating expenses Contract drilling (exclusive of depreciation) 894.5
687.2 61.1 1,642.8 —
1,642.8
Depreciation 283.3 151.6 — 434.9 8.9 443.8 General and administrative — — — — 148.9 148.9Operating income (loss) $ 971.3 $ 568.1 $ 21.7 $ 1,561.1 $ (157.8) $ 1,403.3Property and equipment, net $ 10,727.6 $ 2,389.8 $ — $ 13,117.4 $ 28.2 $ 13,145.6Capital expenditures $ 1,519.4 $ 191.1 $ — $ 1,710.5 $ 2.7 $ 1,713.2
Information about Geographic Areas
As of December 31, 2014, our Floaters segment consisted of seven drillships, 13 dynamically positioned semisubmersible rigs and five moored semisubmersible rigs deployed in various locations throughout North and South America, Middle East and Africa, Asia Pacific, Europe and the Mediterranean and Brazil. Additionally, our Floaters segment included three ultra-deepwater drillships under construction in South Korea. Our Jackups segment consisted of 42 jackup rigs, of which 38 were deployed in various locations throughout North and South America, Middle East and Africa, Asia Pacific and Europe and the Mediterranean and four of which were under construction in Singapore and the United Arab Emirates. As of December 31, 2014, the geographic distribution of our drilling rigs by operating segment was as follows:
Floaters(1) Jackups(1) Total(2)
North & South America (excluding Brazil) 9 8 17 Middle East & Africa 4 11 15 Europe & the Mediterranean 4 11 15 Asia & Pacific Rim 4 8 12 Asia & Pacific Rim (under construction) 3 2 5 Brazil 4 — 4 Middle East & Africa (under construction) — 2 2 Total 28 42 70
(1) The five floaters and two jackups classified as "held for sale" as of December 31, 2014 are included in the table above.
(2) We provide management services on six rigs owned by third-parties not included in the table above.
For purposes of our geographic disclosure, we attribute revenues to the geographic location where such revenues are earned and assets to the geographic location of the drilling rig as of the end of the applicable year. For new construction projects, assets are attributed to the location of future operation if known or to the location of construction if the ultimate location of operation is undetermined.

75
Information by country for those countries that account for more than 10% of total revenues or 10% of our long-lived assets was as follows (in millions):
Revenues Long-lived Assets 2014 2013 2012 2014 2013 2012 United States $ 1,712.4 $ 1,687.2 $ 1,265.5 $ 5,240.4 $ 4,617.8 $ 4,525.9Angola 607.9 365.9 190.0 1,913.5 2,543.7 2,147.2Brazil 459.1 683.7 776.3 1,459.0 2,447.5 2,911.3Other countries 1,785.1 1,586.6 1,407.0 3,921.9 4,702.0 3,561.2
Total $ 4,564.5 $ 4,323.4 $ 3,638.8 $ 12,534.8 $ 14,311.0 $ 13,145.6 14. SUPPLEMENTAL FINANCIAL INFORMATION
Consolidated Balance Sheet Information Accounts receivable, net, as of December 31, 2014 and 2013 consisted of the following (in millions):
2014 2013 Trade $ 878.8 $ 869.8Other 15.9 14.3 894.7 884.1Allowance for doubtful accounts (11.4) (28.4) $ 883.3 $ 855.7 Other current assets as of December 31, 2014 and 2013 consisted of the following (in millions):
2014 2013 Inventory 240.3 256.4Assets held for sale 152.4 8.6Prepaid taxes 90.6 88.1Deferred costs 61.9 47.4Deferred tax assets 43.8 23.1Prepaid expenses 33.8 18.5Derivative assets .6 11.6Other 6.0 10.2 $ 629.4 $ 463.9 Assets held for sale primarily consists of drilling rigs and equipment. See "Note 3 - Property and Equipment" for additional information on the assets classified as "held for sale" on our balance sheet as of December 31, 2014.
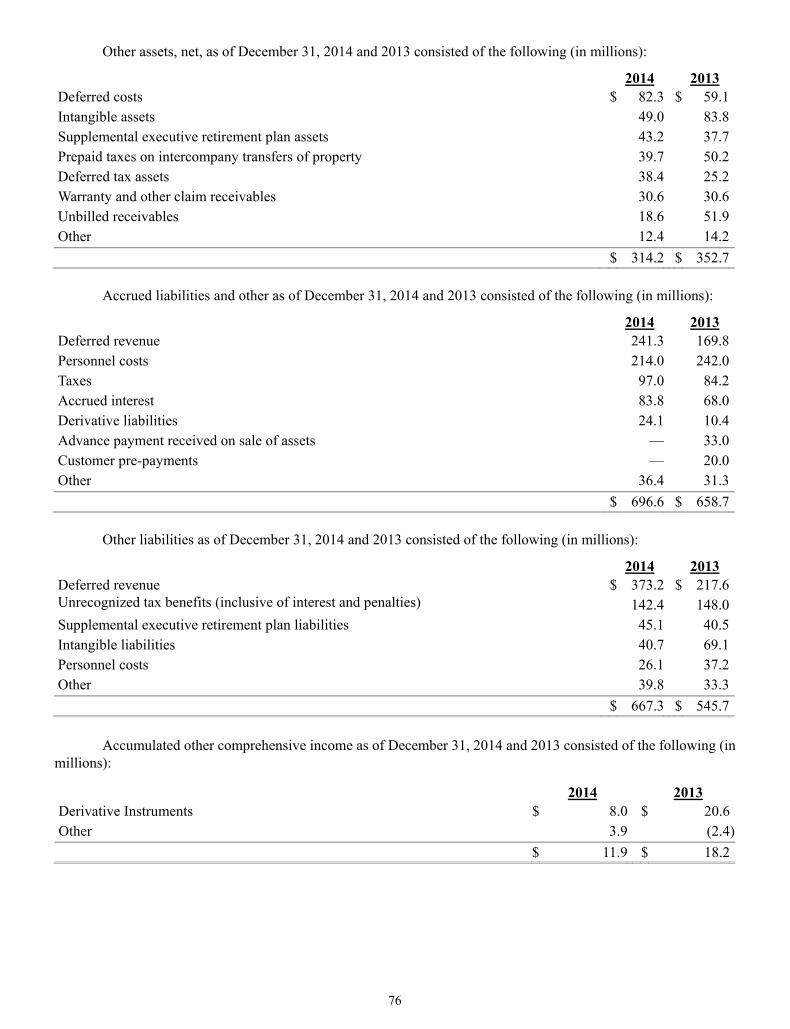
76
Other assets, net, as of December 31, 2014 and 2013 consisted of the following (in millions):
2014 2013 Deferred costs $ 82.3 $ 59.1Intangible assets 49.0 83.8Supplemental executive retirement plan assets 43.2 37.7Prepaid taxes on intercompany transfers of property 39.7 50.2Deferred tax assets 38.4 25.2Warranty and other claim receivables 30.6 30.6Unbilled receivables 18.6 51.9Other 12.4 14.2 $ 314.2 $ 352.7
Accrued liabilities and other as of December 31, 2014 and 2013 consisted of the following (in millions):
2014 2013 Deferred revenue 241.3 169.8Personnel costs 214.0 242.0Taxes 97.0 84.2Accrued interest 83.8 68.0Derivative liabilities 24.1 10.4Advance payment received on sale of assets — 33.0Customer pre-payments — 20.0Other 36.4 31.3 $ 696.6 $ 658.7
Other liabilities as of December 31, 2014 and 2013 consisted of the following (in millions):
2014 2013 Deferred revenue $ 373.2 $ 217.6Unrecognized tax benefits (inclusive of interest and penalties) 142.4 148.0Supplemental executive retirement plan liabilities 45.1 40.5Intangible liabilities 40.7 69.1Personnel costs 26.1 37.2Other 39.8 33.3 $ 667.3 $ 545.7 Accumulated other comprehensive income as of December 31, 2014 and 2013 consisted of the following (in millions):
2014 2013 Derivative Instruments $ 8.0 $ 20.6Other 3.9 (2.4) $ 11.9 $ 18.2

77
Consolidated Statement of Operations Information Repair and maintenance expense related to continuing operations for each of the years in the three-year period ended December 31, 2014 was as follows (in millions):
2014 2013 2012 Repair and maintenance expense $ 357.2 $ 287.8 $ 276.3
Consolidated Statement of Cash Flows Information
Net cash provided by operating activities of continuing operations attributable to the net change in operating assets and liabilities for each of the years in the three-year period ended December 31, 2014 was as follows (in millions):
2014 2013 2012 Increase (decrease) in liabilities 208.2 (10.3) 312.3(Increase) decrease in other assets (76.4) (94.1) 67.8(Increase) decrease in accounts receivable (38.5) (46.7) 59.1 $ 93.3 $ (151.1) $ 439.2
Cash paid for interest and income taxes for each of the years in the three-year period ended December 31, 2014 was as follows (in millions):
2014 2013 2012 Interest, net of amounts capitalized $ 170.0 $ 182.2 $ 150.7Income taxes 218.2 195.4 77.9
Capitalized interest totaled $78.2 million, $67.7 million and $105.8 million during the years ended December 31, 2014, 2013 and 2012, respectively. Capital expenditure accruals totaling $137.2 million, $111.8 million and $110.7 million for the years ended December 31, 2014, 2013 and 2012, respectively, were excluded from investing activities in our consolidated statements of cash flows. Amortization of intangibles and other, net, included amortization of intangible assets and liabilities related to the estimated fair values of acquired Company firm drilling contracts in place at the Pride acquisition date, debt premiums related to the fair value adjustment of acquired Company debt instruments, deferred charges for income taxes incurred on intercompany transfers of drilling rigs and certain other deferred costs.
Concentration of Risk We are exposed to credit risk relating to our receivables from customers, our cash and cash equivalents and investments and our use of derivatives in connection with the management of foreign currency exchange rate risk. We mitigate our credit risk relating to receivables from customers, which consist primarily of major international, government-owned and independent oil and gas companies, by performing ongoing credit evaluations. We also maintain reserves for potential credit losses, which generally have been within management's expectations. During 2014, we insured certain receivables deemed to have a higher credit risk. We mitigate our credit risk relating to cash and investments by focusing on diversification and quality of instruments. Cash equivalents and short-term investments consist of a portfolio of high-grade instruments. Custody of cash and cash equivalents and short-term investments is maintained at several well-capitalized financial institutions, and we monitor the financial condition of those financial institutions. We mitigate our credit risk relating to counterparties of our derivatives through a variety of techniques, including transacting with multiple, high-quality financial institutions, thereby limiting our exposure to individual counterparties and by entering into ISDA Master Agreements, which include provisions for a legally enforceable master

78
netting agreement, with almost all derivative counterparties. The terms of the ISDA agreements may also include credit support requirements, cross default provisions, termination events, or set-off provisions. Legally enforceable master netting agreements reduce credit risk by providing protection in bankruptcy in certain circumstances and generally permitting the closeout and netting of transactions with the same counterparty upon the occurrence of certain events. During 2014, BP accounted for $723.9 million, or 16%, of our consolidated revenues, 80% of which were attributable to our Floaters segment. During 2013, Petrobras accounted for $604.8 million, or 14%, of consolidated revenues, all of which were provided by our Floaters segment, and BP accounted for $444.9 million, or 10%, of consolidated revenues, 84% of which were attributable to our Floaters segment. During 2012, Petrobras accounted for $771.9 million, or 21%, of our consolidated revenues, all of which were attributable to our Floaters segment. During 2014, revenues provided by our drilling operations in the U.S. Gulf of Mexico totaled $1.7 billion, or 38%, of our consolidated revenues, of which 79% were provided by our Floaters segment. Revenues provided by our drilling operations in Angola and Brazil during the year ended December 31, 2014 totaled $607.9 million and $459.1 million, or 13% and 10%, of our consolidated revenues, all of which were provided by our Floaters segment. During 2013, revenues provided by our drilling operations in the U.S. Gulf of Mexico totaled $1.7 billion, or 39%, of our consolidated revenues, of which 77% were provided by our Floaters segment. Revenues provided by our drilling operations in Brazil during the year ended December 31, 2013 totaled $683.7 million, or 16%, of our consolidated revenue, all of which were provided by our Floaters segment. During 2012, revenues provided by our drilling operations in the U.S. Gulf of Mexico totaled $1.3 billion, or 35%, of our consolidated revenues, of which 75% were provided by our Floaters segment. Revenues provided by our drilling operations in Brazil during the year ended December 31, 2012 totaled $776.3 million, or 21%, of our consolidated revenues, all of which were provided by our Floaters segment. 15. GUARANTEE OF REGISTERED SECURITIES In connection with the Pride acquisition, Ensco plc and Pride entered into a supplemental indenture to the indenture dated as of July 1, 2004 between Pride and the Bank of New York Mellon, as indenture trustee, providing for, among other matters, the full and unconditional guarantee by Ensco plc of Pride’s 8.5% senior notes due 2019, 6.875% senior notes due 2020 and 7.875% senior notes due 2040, which had an aggregate outstanding principal balance of $1.7 billion as of December 31, 2014. The Ensco plc guarantee provides for the unconditional and irrevocable guarantee of the prompt payment, when due, of any amount owed to the holders of the notes. Ensco plc is also a full and unconditional guarantor of the 7.2% Debentures due 2027 issued by Ensco Delaware in November 1997, which had an aggregate outstanding principal balance of $150.0 million as of December 31, 2014. All guarantees are unsecured obligations of Ensco plc ranking equal in right of payment with all of its existing and future unsecured and unsubordinated indebtedness. The following tables present our condensed consolidating statements of operations for each of the years in the three-year period ended December 31, 2014; our condensed consolidating statements of comprehensive (loss) income for each of the years in the three-year period ended December 31, 2014; our condensed consolidating balance sheets as of December 31, 2014 and 2013; and our condensed consolidating statements of cash flows for each of the years in the three-year period ended December 31, 2014, in accordance with Rule 3-10 of Regulation S-X.
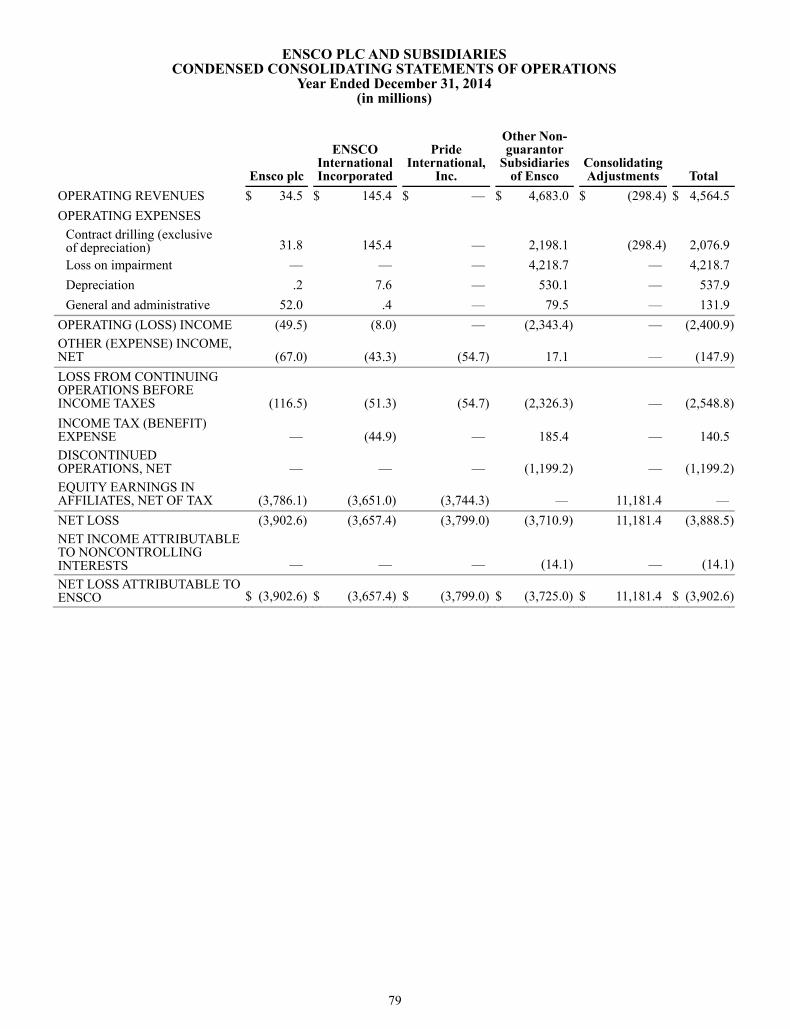
79
ENSCO PLC AND SUBSIDIARIES CONDENSED CONSOLIDATING STATEMENTS OF OPERATIONS
Year Ended December 31, 2014 (in millions)
Ensco plc
ENSCO International Incorporated
Pride International,
Inc.
Other Non-guarantor
Subsidiaries of Ensco
Consolidating Adjustments Total
OPERATING REVENUES $ 34.5 $ 145.4 $ — $ 4,683.0 $ (298.4) $ 4,564.5OPERATING EXPENSES
Contract drilling (exclusive of depreciation) 31.8
145.4 — 2,198.1
(298.4) 2,076.9
Loss on impairment — — — 4,218.7 — 4,218.7Depreciation .2 7.6 — 530.1 — 537.9General and administrative 52.0 .4 — 79.5 — 131.9
OPERATING (LOSS) INCOME (49.5) (8.0) — (2,343.4) — (2,400.9)OTHER (EXPENSE) INCOME, NET (67.0) (43.3) (54.7) 17.1
— (147.9)
LOSS FROM CONTINUING OPERATIONS BEFORE INCOME TAXES (116.5) (51.3) (54.7) (2,326.3) — (2,548.8)INCOME TAX (BENEFIT) EXPENSE —
(44.9) — 185.4
— 140.5
DISCONTINUED OPERATIONS, NET —
— — (1,199.2) — (1,199.2)
EQUITY EARNINGS IN AFFILIATES, NET OF TAX (3,786.1) (3,651.0) (3,744.3) —
11,181.4 —
NET LOSS (3,902.6) (3,657.4) (3,799.0) (3,710.9) 11,181.4 (3,888.5)NET INCOME ATTRIBUTABLE TO NONCONTROLLING INTERESTS —
— — (14.1) — (14.1)NET LOSS ATTRIBUTABLE TO ENSCO $ (3,902.6) $ (3,657.4) $ (3,799.0) $ (3,725.0) $ 11,181.4 $ (3,902.6)

80
ENSCO PLC AND SUBSIDIARIES CONDENSED CONSOLIDATING STATEMENTS OF OPERATIONS
Year Ended December 31, 2013 (in millions)
Ensco
plc
ENSCO International Incorporated
Pride International,
Inc.
Other Non-guarantor
Subsidiaries of Ensco
Consolidating Adjustments Total
OPERATING REVENUES $ 35.0 $ 149.4 $ — $ 4,446.4
$ (307.4) $ 4,323.4
OPERATING EXPENSES Contract drilling (exclusive of depreciation) 27.5
149.4 — 2,077.6
(307.4) 1,947.1
Depreciation .3 4.0 — 491.9 — 496.2General and administrative 63.5 .5 — 82.8 — 146.8
OPERATING (LOSS) INCOME (56.3) (4.5) — 1,794.1 — 1,733.3OTHER (EXPENSE) INCOME, NET (65.6) (9.4) (27.9) 2.8
— (100.1)
(LOSS) INCOME FROM CONTINUING OPERATIONS BEFORE INCOME TAXES (121.9) (13.9) (27.9) 1,796.9
— 1,633.2INCOME TAX EXPENSE — 92.5 — 110.6 — 203.1DISCONTINUED OPERATIONS, NET —
— — (2.2) — (2.2)
EQUITY EARNINGS IN AFFILIATES, NET OF TAX 1,540.1
366.2 111.6 —
(2,017.9) —
NET INCOME 1,418.2 259.8 83.7 1,684.1 (2,017.9) 1,427.9NET INCOME ATTRIBUTABLE TO NONCONTROLLING INTERESTS —
— — (9.7) — (9.7)
NET INCOME ATTRIBUTABLE TO ENSCO $ 1,418.2
$ 259.8 $ 83.7 $ 1,674.4
$ (2,017.9) $ 1,418.2

81
ENSCO PLC AND SUBSIDIARIES CONDENSED CONSOLIDATING STATEMENTS OF OPERATIONS
Year Ended December 31, 2012 (in millions)
Ensco
plc
ENSCO International Incorporated
Pride International,
Inc.
Other Non-guarantor
Subsidiaries of Ensco
Consolidating Adjustments Total
OPERATING REVENUES $ 44.0 $ 147.6 $ — $ 3,767.3
$ (320.1) $ 3,638.8
OPERATING EXPENSES Contract drilling (exclusive of depreciation) 51.2
147.6 — 1,764.1
(320.1) 1,642.8
Depreciation .4 3.5 — 439.9 — 443.8General and administrative 63.8 .4 — 84.7 — 148.9
OPERATING (LOSS) INCOME (71.4) (3.9) — 1,478.6 — 1,403.3OTHER (EXPENSE) INCOME, NET (41.8) (7.0) (50.0) .2
— (98.6)
(LOSS) INCOME BEFORE INCOME TAXES (113.2) (10.9) (50.0) 1,478.8
— 1,304.7
INCOME TAX EXPENSE — 68.8 — 159.8 — 228.6DISCONTINUED OPERATIONS, NET —
— — 100.6
100.6
EQUITY EARNINGS IN AFFILIATES, NET OF TAX 1,282.9
335.9 239.2 —
(1,858.0) —
NET INCOME 1,169.7 256.2 189.2 1,419.6 (1,858.0) 1,176.7NET INCOME ATTRIBUTABLE TO NONCONTROLLING INTERESTS —
— — (7.0) — (7.0)
NET INCOME ATTRIBUTABLE TO ENSCO $ 1,169.7
$ 256.2 $ 189.2 $ 1,412.6
$ (1,858.0) $ 1,169.7

82
ENSCO PLC AND SUBSIDIARIES CONDENSED CONSOLIDATING STATEMENTS OF COMPREHENSIVE (LOSS) INCOME
Year Ended December 31, 2014 (in millions)
Ensco
plc
ENSCO International Incorporated
Pride International,
Inc.
Other Non-Guarantor
Subsidiaries of Ensco
Consolidating Adjustments Total
NET LOSS $ (3,902.6 ) $ (3,657.4) $ (3,799.0) $ (3,710.9) $ 11,181.4 $ (3,888.5)
OTHER COMPREHENSIVE (LOSS) INCOME, NET
Net change in fair value of derivatives —
(11.7) — —
— (11.7)
Reclassification of net gains on derivative instruments from other comprehensive income into net income —
(.9) — —
— (.9)Other — — — 6.3 — 6.3
NET OTHER COMPREHENSIVE (LOSS) INCOME —
(12.6) — 6.3
— (6.3)
COMPREHENSIVE LOSS (3,902.6) (3,670.0) (3,799.0) (3,704.6) 11,181.4 (3,894.8)COMPREHENSIVE INCOME
ATTRIBUTABLE TO NONCONTROLLING INTERESTS —
— — (14.1) — (14.1)COMPREHENSIVE LOSS
ATTRIBUTABLE TO ENSCO $ (3,902.6 ) $ (3,670.0) $ (3,799.0) $ (3,718.7) $ 11,181.4 $ (3,908.9)

83
ENSCO PLC AND SUBSIDIARIES CONDENSED CONSOLIDATING STATEMENTS OF COMPREHENSIVE (LOSS) INCOME
Year Ended December 31, 2013 (in millions)
Ensco
plc
ENSCO International Incorporated
Pride International,
Inc.
Other Non-Guarantor
Subsidiaries of Ensco
Consolidating Adjustments Total
NET INCOME $ 1,418.2 $ 259.8 $ 83.7 $ 1,684.1 $ (2,017.9) $ 1,427.9
OTHER COMPREHENSIVE (LOSS) INCOME, NET
Net change in fair value of derivatives —
(5.8) — —
— (5.8)
Reclassification of net losses on derivative instruments from other comprehensive income into net income —
2.0 — —
— 2.0Other — — — 1.9 — 1.9
NET OTHER COMPREHENSIVE (LOSS) INCOME —
(3.8) — 1.9
— (1.9)
COMPREHENSIVE INCOME 1,418.2 256.0 83.7 1,686.0 (2,017.9) 1,426.0COMPREHENSIVE INCOME
ATTRIBUTABLE TO NONCONTROLLING INTERESTS —
— — (9.7) — (9.7)COMPREHENSIVE INCOME
ATTRIBUTABLE TO ENSCO $ 1,418.2 $ 256.0 $ 83.7 $ 1,676.3
$ (2,017.9) $ 1,416.3

84
ENSCO PLC AND SUBSIDIARIES CONDENSED CONSOLIDATING STATEMENTS OF COMPREHENSIVE (LOSS) INCOME
Year Ended December 31, 2012 (in millions)
Ensco
plc
ENSCO International Incorporated
Pride International,
Inc.
Other Non-Guarantor
Subsidiaries of Ensco
Consolidating Adjustments Total
NET INCOME $ 1,169.7 $ 256.2 $ 189.2 $ 1,419.6 $ (1,858.0) $ 1,176.7OTHER COMPREHENSIVE
INCOME (LOSS), NET Net change in fair value of
derivatives — 6.3 — 2.4
— 8.7
Reclassification of net losses (gains) on derivative instruments from other comprehensive income into net income —
.2 — (.2) — —Other — — — 2.8 — 2.8
NET OTHER COMPREHENSIVE INCOME —
6.5 — 5.0
— 11.5
COMPREHENSIVE INCOME 1,169.7 262.7 189.2 1,424.6 (1,858.0) 1,188.2
COMPREHENSIVE INCOME ATTRIBUTABLE TO NONCONTROLLING INTERESTS —
— — (7.0) — (7.0)COMPREHENSIVE INCOME
ATTRIBUTABLE TO ENSCO $ 1,169.7 $ 262.7 $ 189.2 $ 1,417.6
$ (1,858.0) $ 1,181.2

85
ENSCO PLC AND SUBSIDIARIES CONDENSED CONSOLIDATING BALANCE SHEETS
December 31, 2014 (in millions)
Ensco plc
ENSCO International Incorporated
Pride International,
Inc.
Other Non-
guarantor Subsidiaries
of Ensco Consolidating Adjustments
Total
ASSETS CURRENT ASSETS Cash and cash equivalents $ 287.4 $ — $ 90.8 $ 286.6 $ — $ 664.8Short-term investments 712.0 — — 45.3 — 757.3Accounts receivable, net — — — 883.3 — 883.3
Accounts receivable from affiliates 34.5
210.4 — 134.6
(379.5) —
Other 4.1 86.9 — 538.4 — 629.4 Total current assets 1,038.0 297.3 90.8 1,888.2 (379.5) 2,934.8
PROPERTY AND EQUIPMENT, AT COST 2.1
71.5 — 14,901.9
— 14,975.5
Less accumulated depreciation 1.7 34.1 — 2,404.9 — 2,440.7Property and equipment, net .4 37.4 — 12,497.0 — 12,534.8
GOODWILL — — — 276.1 — 276.1DUE FROM AFFILIATES 2,873.2 4,748.2 1,835.0 6,308.8 (15,765.2) —
INVESTMENTS IN AFFILIATES 9,084.8
1,233.5 461.6 —
(10,779.9) —
OTHER ASSETS, NET 17.0 47.4 — 249.8 — 314.2
$ 13,013.4 $ 6,363.8 $ 2,387.4 $ 21,219.9
$ (26,924.6) $ 16,059.9
LIABILITIES AND SHAREHOLDERS' EQUITY CURRENT LIABILITIES
Accounts payable and accrued liabilities $ 47.8
$ 42.8 $ 34.3 $ 944.9
$ — $ 1,069.8
Accounts payable to affiliates 23.5 158.3 — 197.7 (379.5) —
Current maturities of long-term debt —
— — 34.8
— 34.8
Total current liabilities 71.3 201.1 34.3 1,177.4 (379.5) 1,104.6DUE TO AFFILIATES 994.8 3,817.4 1,547.7 9,405.3 (15,765.2) —LONG-TERM DEBT 3,724.4 149.2 1,973.2 38.8 — 5,885.6DEFERRED INCOME TAXES — 176.8 — 2.7 — 179.5OTHER LIABILITIES — 6.1 7.0 654.2 — 667.3
ENSCO SHAREHOLDERS' EQUITY (DEFICIT) 8,222.9
2,013.2 (1,174.8) 9,933.6
(10,779.9) 8,215.0
NONCONTROLLING INTERESTS —
— — 7.9
— 7.9
Total equity 8,222.9 2,013.2 (1,174.8) 9,941.5 (10,779.9) 8,222.9
$ 13,013.4 $ 6,363.8 $ 2,387.4 $ 21,219.9
$ (26,924.6) $ 16,059.9
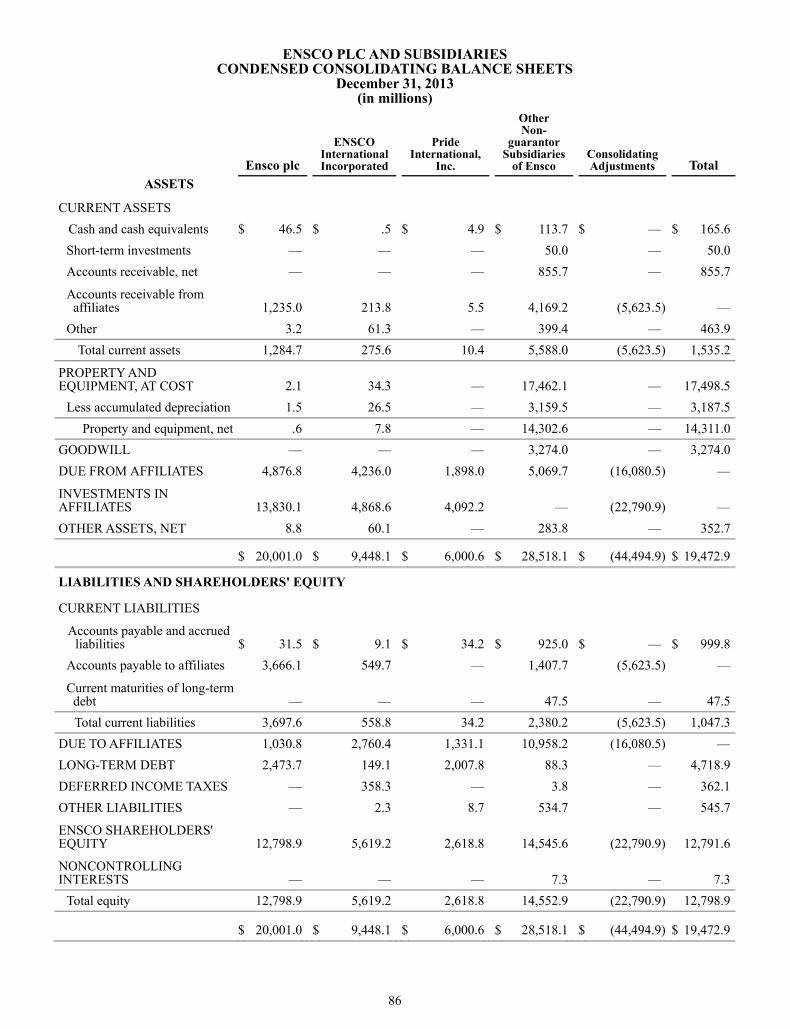
86
ENSCO PLC AND SUBSIDIARIES CONDENSED CONSOLIDATING BALANCE SHEETS
December 31, 2013 (in millions)
Ensco plc
ENSCO International Incorporated
Pride International,
Inc.
Other Non-
guarantor Subsidiaries
of Ensco Consolidating Adjustments Total
ASSETS CURRENT ASSETS Cash and cash equivalents $ 46.5 $ .5 $ 4.9 $ 113.7 $ — $ 165.6
Short-term investments — — — 50.0 — 50.0Accounts receivable, net — — — 855.7 — 855.7
Accounts receivable from affiliates 1,235.0
213.8 5.5 4,169.2
(5,623.5) —
Other 3.2 61.3 — 399.4 — 463.9 Total current assets 1,284.7 275.6 10.4 5,588.0 (5,623.5) 1,535.2
PROPERTY AND EQUIPMENT, AT COST 2.1
34.3 — 17,462.1
— 17,498.5
Less accumulated depreciation 1.5 26.5 — 3,159.5 — 3,187.5Property and equipment, net .6 7.8 — 14,302.6 — 14,311.0
GOODWILL — — — 3,274.0 — 3,274.0DUE FROM AFFILIATES 4,876.8 4,236.0 1,898.0 5,069.7 (16,080.5) —
INVESTMENTS IN AFFILIATES 13,830.1
4,868.6 4,092.2 —
(22,790.9) —
OTHER ASSETS, NET 8.8 60.1 — 283.8 — 352.7
$ 20,001.0 $ 9,448.1 $ 6,000.6 $ 28,518.1
$ (44,494.9) $ 19,472.9
LIABILITIES AND SHAREHOLDERS' EQUITY CURRENT LIABILITIES
Accounts payable and accrued liabilities $ 31.5
$ 9.1 $ 34.2 $ 925.0
$ — $ 999.8
Accounts payable to affiliates 3,666.1 549.7 — 1,407.7 (5,623.5) —
Current maturities of long-term debt —
— — 47.5
— 47.5
Total current liabilities 3,697.6 558.8 34.2 2,380.2 (5,623.5) 1,047.3DUE TO AFFILIATES 1,030.8 2,760.4 1,331.1 10,958.2 (16,080.5) —LONG-TERM DEBT 2,473.7 149.1 2,007.8 88.3 — 4,718.9DEFERRED INCOME TAXES — 358.3 — 3.8 — 362.1OTHER LIABILITIES — 2.3 8.7 534.7 — 545.7
ENSCO SHAREHOLDERS' EQUITY 12,798.9
5,619.2 2,618.8 14,545.6
(22,790.9) 12,791.6
NONCONTROLLING INTERESTS —
— — 7.3
— 7.3
Total equity 12,798.9 5,619.2 2,618.8 14,552.9 (22,790.9) 12,798.9
$ 20,001.0 $ 9,448.1 $ 6,000.6 $ 28,518.1
$ (44,494.9) $ 19,472.9
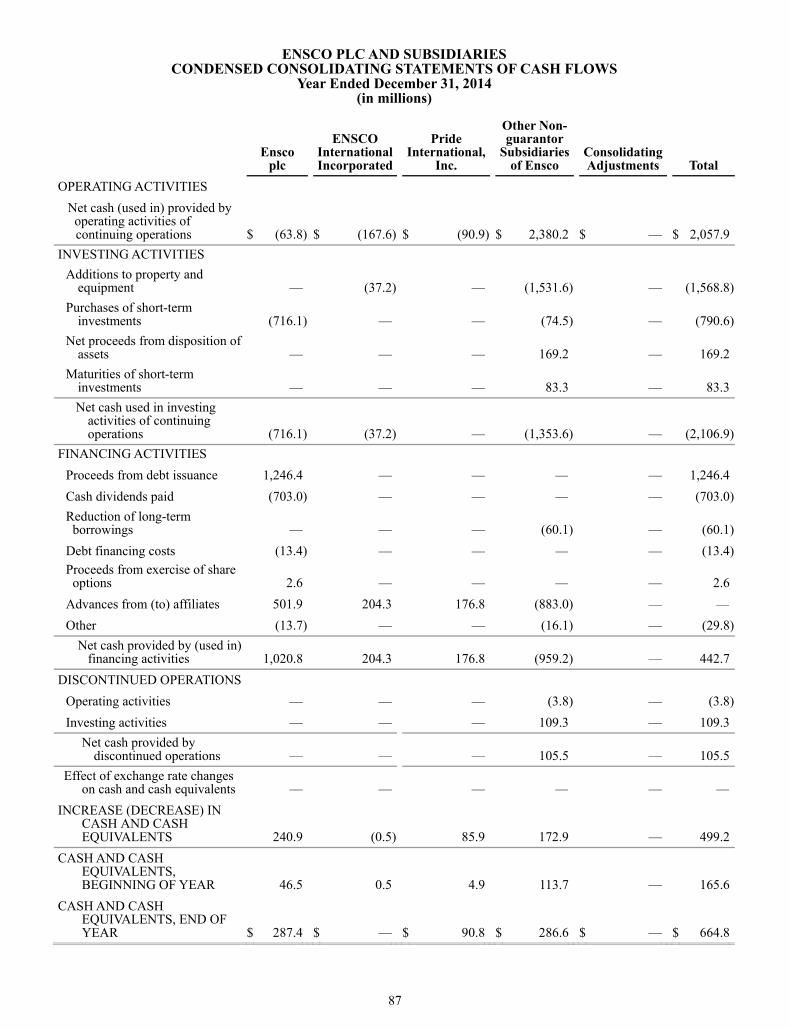
87
ENSCO PLC AND SUBSIDIARIES CONDENSED CONSOLIDATING STATEMENTS OF CASH FLOWS
Year Ended December 31, 2014 (in millions)
Ensco
plc
ENSCO International Incorporated
Pride International,
Inc.
Other Non-guarantor
Subsidiaries of Ensco
Consolidating Adjustments Total
OPERATING ACTIVITIES
Net cash (used in) provided by operating activities of
continuing operations $ (63.8) $ (167.6) $ (90.9) $ 2,380.2
$ — $ 2,057.9INVESTING ACTIVITIES
Additions to property and equipment —
(37.2) — (1,531.6) — (1,568.8)
Purchases of short-term investments (716.1) — — (74.5) — (790.6)
Net proceeds from disposition of assets —
— — 169.2
— 169.2
Maturities of short-term investments —
— — 83.3
— 83.3
Net cash used in investing activities of continuing operations (716.1) (37.2) — (1,353.6) — (2,106.9)
FINANCING ACTIVITIES Proceeds from debt issuance 1,246.4 — — — — 1,246.4Cash dividends paid (703.0) — — — — (703.0)Reduction of long-term borrowings —
— — (60.1) — (60.1)
Debt financing costs (13.4) — — — — (13.4)Proceeds from exercise of share options 2.6
— — —
— 2.6
Advances from (to) affiliates 501.9 204.3 176.8 (883.0) — —Other (13.7) — — (16.1) — (29.8)
Net cash provided by (used in) financing activities 1,020.8
204.3 176.8 (959.2) — 442.7
DISCONTINUED OPERATIONS Operating activities — — — (3.8) — (3.8)Investing activities — — — 109.3 — 109.3
Net cash provided by discontinued operations —
— — 105.5
— 105.5
Effect of exchange rate changes on cash and cash equivalents —
— — —
— —
INCREASE (DECREASE) IN CASH AND CASH EQUIVALENTS 240.9
(0.5) 85.9 172.9
— 499.2CASH AND CASH
EQUIVALENTS, BEGINNING OF YEAR 46.5
0.5 4.9 113.7
— 165.6CASH AND CASH
EQUIVALENTS, END OF YEAR $ 287.4
$ — $ 90.8 $ 286.6
$ — $ 664.8

88
ENSCO PLC AND SUBSIDIARIES CONDENSED CONSOLIDATING STATEMENTS OF CASH FLOWS
Year Ended December 31, 2013 (in millions)
Ensco
plc
ENSCO International Incorporated
Pride International,
Inc.
Other Non-guarantor
Subsidiaries of Ensco
Consolidating Adjustments Total
OPERATING ACTIVITIES Net cash (used in) provided by operating activities of
continuing operations $ (114.8) $ (128.7) $ (62.9) $ 2,117.6
$ — $ 1,811.2INVESTING ACTIVITIES
Additions to property and equipment —
— — (1,763.5) — (1,763.5)
Purchases of short-term investments —
— — (50.0) — (50.0)
Maturities of short-term investments —
— — 50.0
— 50.0
Net proceeds from disposition of assets —
(4.1) — 10.1
— 6.0
Net cash used in investing activities of continuing operations —
(4.1) — (1,753.4) — (1,757.5)FINANCING ACTIVITIES
Cash dividends paid (525.6) — — — — (525.6)Reduction of long-term borrowings —
— — (47.5) — (47.5)
Proceeds from exercise of share options 22.3
— — —
— 22.3
Debt financing costs — (4.6) — — — (4.6)Advances from (to) affiliates 407.2 136.2 (17.2) (526.2) — —Other (14.4) — — (7.3) — (21.7)
Net cash (used in) provided by financing activities (110.5) 131.6 (17.2) (581.0) — (577.1)DISCONTINUED OPERATIONS
Operating activities — — — 169.3 — 169.3Investing activities — — — 32.8 — 32.8
Net cash provided by discontinued operations —
— — 202.1
— 202.1
Effect of exchange rate changes on cash and cash equivalents —
— — (.2) — (.2)
DECREASE IN CASH AND CASH EQUIVALENTS (225.3) (1.2) (80.1) (14.9) — (321.5)
CASH AND CASH EQUIVALENTS, BEGINNING OF YEAR 271.8
1.7 85.0 128.6
— 487.1CASH AND CASH
EQUIVALENTS, END OF YEAR $ 46.5
$ .5 $ 4.9 $ 113.7
$ — $ 165.6

89
ENSCO PLC AND SUBSIDIARIES CONDENSED CONSOLIDATING STATEMENTS OF CASH FLOWS
Year Ended December 31, 2012 (in millions)
Ensco
plc
ENSCO International Incorporated
Pride International,
Inc.
Other Non-guarantor
Subsidiaries of Ensco
Consolidating Adjustments Total
OPERATING ACTIVITIES Net cash (used in) provided by operating activities of
continuing operations $ (71.6) $ (38.2) $ (21.6) $ 2,086.0
$ — $ 1,954.6INVESTING ACTIVITIES
Additions to property and equipment —
— — (1,713.2) — (1,713.2)
Purchases of short-term investments —
— — (90.0) — (90.0)
Maturities of short-term investments —
— — 44.5
— 44.5
Net proceeds from disposition of assets (.3) .4 — 3.1
— 3.2
Net cash (used in) provided by investing activities of continuing operations (.3) .4 — (1,755.6) — (1,755.5)
FINANCING ACTIVITIES Cash dividends paid (348.1) — — — — (348.1)Commercial paper borrowings, net (125.0) — — —
— (125.0)
Equity issuance cost 66.7 — — — — 66.7Reduction of long-term
borrowings — — — (47.5) — (47.5)
Proceeds from exercise of share options 23.9
11.9 — —
— 35.8
Advances from (to) affiliates 501.2 27.6 84.0 (612.8) — —Other (11.6) — — (5.8) — (17.4)
Net cash provided by (used in) financing activities 107.1
39.5 84.0 (666.1) — (435.5)
DISCONTINUED OPERATIONS Operating activities — — — 232.5 — 232.5Investing activities — — — 58.3 — 58.3
Net cash provided by discontinued operations —
— — 290.8
— 290.8
Effect of exchange rate changes on cash and cash equivalents —
— — 2.0
— 2.0
INCREASE (DECREASE) IN CASH AND CASH EQUIVALENTS 35.2
1.7 62.4 (42.9) — 56.4CASH AND CASH
EQUIVALENTS, BEGINNING OF YEAR 236.6
— 22.6 171.5
— 430.7CASH AND CASH
EQUIVALENTS, END OF YEAR $ 271.8
$ 1.7 $ 85.0 $ 128.6
$ — $ 487.1
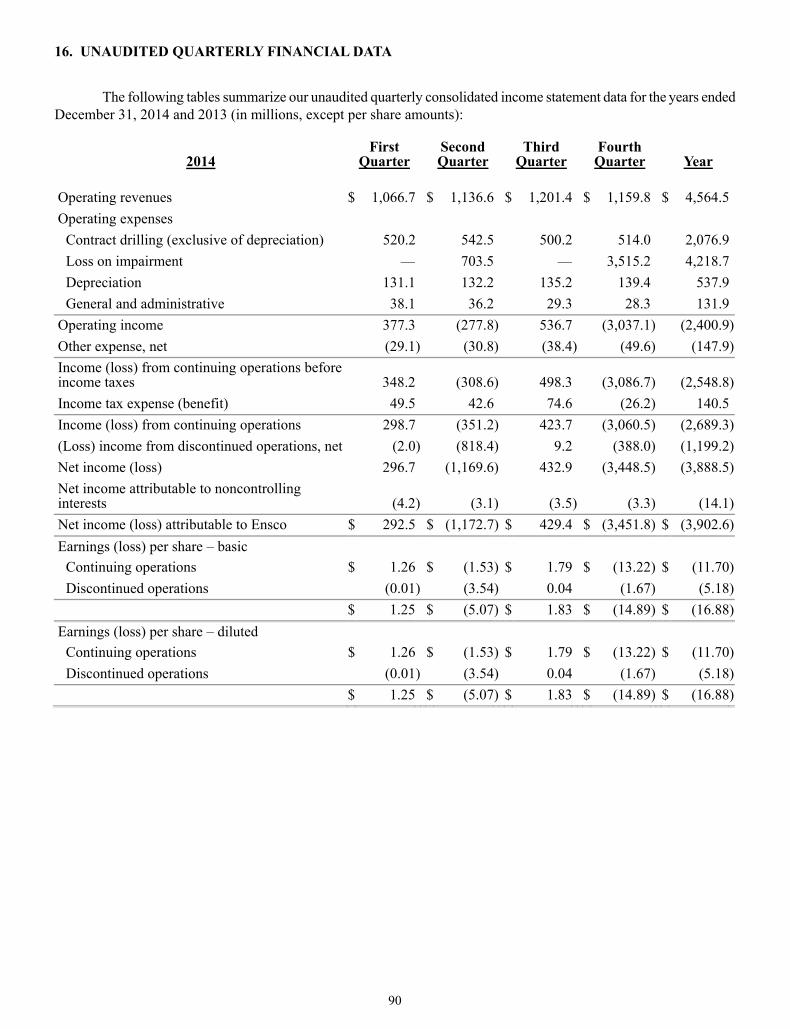
90
16. UNAUDITED QUARTERLY FINANCIAL DATA
The following tables summarize our unaudited quarterly consolidated income statement data for the years ended December 31, 2014 and 2013 (in millions, except per share amounts):
2014 First
Quarter
Second Quarter
Third Quarter
Fourth Quarter
Year
Operating revenues $ 1,066.7 $ 1,136.6 $ 1,201.4 $ 1,159.8 $ 4,564.5Operating expenses
Contract drilling (exclusive of depreciation) 520.2 542.5 500.2 514.0 2,076.9Loss on impairment — 703.5 — 3,515.2 4,218.7Depreciation 131.1 132.2 135.2 139.4 537.9General and administrative 38.1 36.2 29.3 28.3 131.9
Operating income 377.3 (277.8) 536.7 (3,037.1) (2,400.9)Other expense, net (29.1) (30.8) (38.4) (49.6) (147.9)Income (loss) from continuing operations before income taxes 348.2 (308.6) 498.3
(3,086.7) (2,548.8)
Income tax expense (benefit) 49.5 42.6 74.6 (26.2) 140.5Income (loss) from continuing operations 298.7 (351.2) 423.7 (3,060.5) (2,689.3)(Loss) income from discontinued operations, net (2.0) (818.4) 9.2 (388.0) (1,199.2)Net income (loss) 296.7 (1,169.6) 432.9 (3,448.5) (3,888.5)Net income attributable to noncontrolling interests (4.2) (3.1) (3.5) (3.3) (14.1)Net income (loss) attributable to Ensco $ 292.5 $ (1,172.7) $ 429.4 $ (3,451.8) $ (3,902.6)Earnings (loss) per share – basic
Continuing operations $ 1.26 $ (1.53) $ 1.79 $ (13.22) $ (11.70)Discontinued operations (0.01) (3.54) 0.04 (1.67) (5.18)
$ 1.25 $ (5.07) $ 1.83 $ (14.89) $ (16.88)Earnings (loss) per share – diluted
Continuing operations $ 1.26 $ (1.53) $ 1.79 $ (13.22) $ (11.70)Discontinued operations (0.01) (3.54) 0.04 (1.67) (5.18)
$ 1.25 $ (5.07) $ 1.83 $ (14.89) $ (16.88)
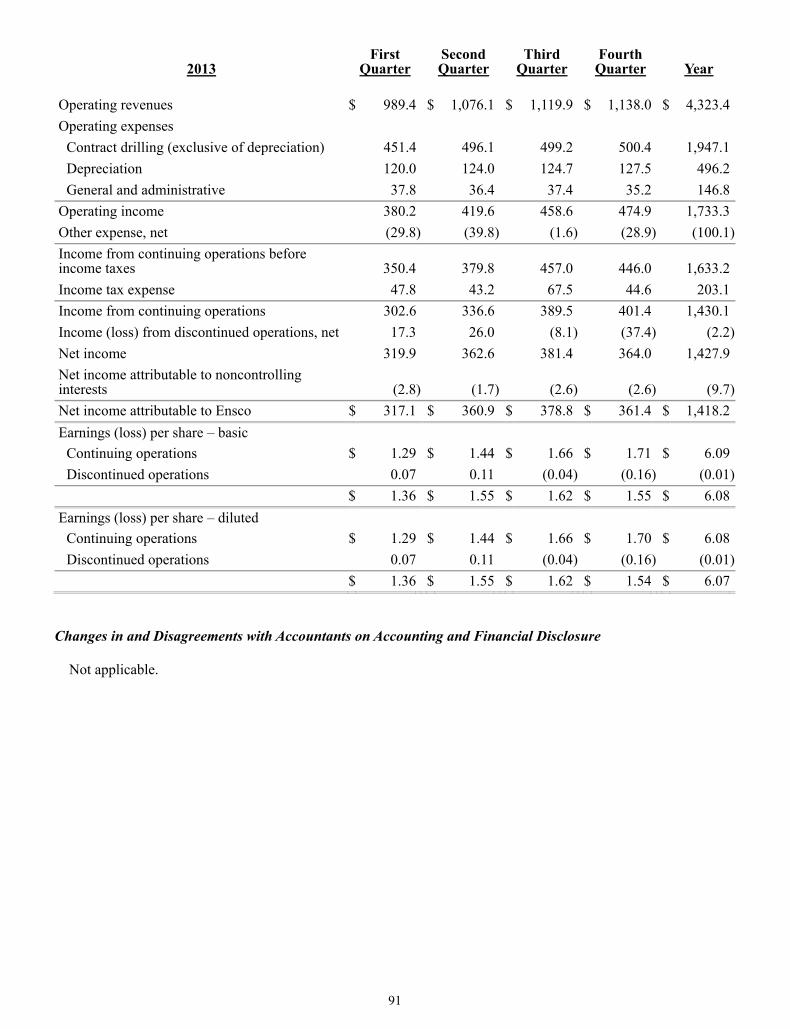
91
2013 First
Quarter
Second Quarter
Third Quarter
Fourth Quarter
Year
Operating revenues $ 989.4 $ 1,076.1 $ 1,119.9 $ 1,138.0 $ 4,323.4Operating expenses
Contract drilling (exclusive of depreciation) 451.4 496.1 499.2 500.4 1,947.1Depreciation 120.0 124.0 124.7 127.5 496.2General and administrative 37.8 36.4 37.4 35.2 146.8
Operating income 380.2 419.6 458.6 474.9 1,733.3Other expense, net (29.8) (39.8) (1.6) (28.9) (100.1)Income from continuing operations before income taxes 350.4 379.8 457.0
446.0 1,633.2
Income tax expense 47.8 43.2 67.5 44.6 203.1Income from continuing operations 302.6 336.6 389.5 401.4 1,430.1Income (loss) from discontinued operations, net 17.3 26.0 (8.1) (37.4) (2.2)Net income 319.9 362.6 381.4 364.0 1,427.9Net income attributable to noncontrolling interests (2.8) (1.7) (2.6) (2.6) (9.7)Net income attributable to Ensco $ 317.1 $ 360.9 $ 378.8 $ 361.4 $ 1,418.2Earnings (loss) per share – basic
Continuing operations $ 1.29 $ 1.44 $ 1.66 $ 1.71 $ 6.09Discontinued operations 0.07 0.11 (0.04) (0.16) (0.01)
$ 1.36 $ 1.55 $ 1.62 $ 1.55 $ 6.08Earnings (loss) per share – diluted
Continuing operations $ 1.29 $ 1.44 $ 1.66 $ 1.70 $ 6.08Discontinued operations 0.07 0.11 (0.04) (0.16) (0.01)
$ 1.36 $ 1.55 $ 1.62 $ 1.54 $ 6.07 Changes in and Disagreements with Accountants on Accounting and Financial Disclosure Not applicable.

DANIEL W. RABUN Chairman, Former President and Chief Executive Officer Ensco plc (Retired)
J. RODERICK CLARK (3)
Former President and Chief Operating OfficerBaker Hughes Incorporated (Retired)
ROXANNE J. DECYK (3)
Former Executive Vice President of Global Government Relations Royal Dutch Shell plc (Retired)
MARY E. FRANCIS CBE (1)
Former Senior Civil Servant in British Treasury and Prime Minister’s Office (Retired)
C. CHRISTOPHER GAUT (3)
Chairman and Chief Executive OfficerForum Energy Technologies, Inc.
BOARD OF DIRECTORS
CORPORATE OFFICERS
GERALD W. HADDOCK (1) (2)
President and FounderHaddock Enterprises, LLC
FRANCIS S. KALMAN (1)
Former Executive Vice PresidentMcDermott International, Inc. (Retired)
KEITH O. RATTIE (1)
Former Chairman, President and Chief Executive OfficerQuestar Corporation (Retired)
PAUL E. ROWSEY, III (2) (4)
Chief Executive OfficerCompatriot Capital, Inc.
CARL TROWELL Chief Executive Officer and PresidentEnsco plc
(1) Audit Committee (2) Nominating and Governance Committee (3) Compensation Committee (4) Lead Director
CARL TROWELL Chief Executive Officer and President J. MARK BURNSExecutive Vice President and Chief Operating Officer P. CAREY LOWE Executive Vice President
JAMES W. SWENT IIIExecutive Vice President and Chief Financial Officer STEVEN J. BRADYSenior Vice President – Eastern Hemisphere
DAVID HENSELSenior Vice President – Marketing JOHN S. KNOWLTONSenior Vice President – Technical
GILLES LUCA Senior Vice President – Western Hemisphere DAVID A. ARMOUR Vice President – Tax
JON BAKSHTVice President – Finance
MICHAEL B. HOWEVice President – Strategy
BRADY K. LONGVice President – General Counsel and Secretary
DOUGLAS J. MANKO Vice President – Treasurer
SACHIN MEHRAVice President – Asset Management
TOM W. MORIN Vice President – Capital Projects
SEAN P. O’NEILLVice President – Investor Relations and Communications
RICHARD ROPERVice President – Engineering
MARIA C. SILVA Vice President – Human Resources
PAUL WILDBERGERVice President – Safety, Health & Environment
ROBERT W. EDWARDS, IIIController
KWESI A. BAIDEN Chief Compliance Officer
ELIZABETH A. COOK Chief Counsel – Corporate and Secretary

Ensco plc6 Chesterfield GardensLondon W1J 5BQ www.enscoplc.com
Registered in England No. 7023598