2014 report for on location production in LA
30
Contact: Philip Sokoloski Danielle Walker VP, Integrated Communications Communications Coordinator (213) 977-8630 (213) 977-8635 [email protected] [email protected] FOR IMMEDIATE RELEASE On-Location Filming in Los Angeles Increases 9.6 Percent in 2014 L.A. Film Office Introduces New Method for Tracking Local Film Production LOS ANGELES – January 13, 2015 – FilmL.A., the not-for-profit film office serving the Greater Los Angeles region, today announced the release of a new report from its research division. “On-Location Filming in Los Angeles: 2010-2014,” is the first report from FilmL.A. to feature a Shoot Day (SD)* based system for film production tracking and measurement. The report reveals a 9.6 percent increase in area filming for 2014, as measured in total annual Shoot Days. Similar to past reports, FilmL.A.’s latest study includes an examination of five-year filming trends across nine distinct project categories, including Feature, Television and Commercial production. The report also includes a discussion of FilmL.A.’s two distinct production tracking methods – Permitted Production Days (PPD) and Shoot Days (SD) - - and explains how they differ. The report is the last planned update from FilmL.A. that will reference PPD data. “Over the past six months, FilmL.A. has devoted considerable resources to build a new system for film production tracking,” noted FilmL.A. President Paul Audley. “The new system – which we built in consultation with our board’s research advisory group – will make it easier to compare data from FilmL.A. and other jurisdictions.” Some of the report’s main findings include: On-location Feature Film production slipped 3.2 percent for 2014, after that category experienced a disappointing 28 percent drop in the fourth quarter alone. On-location Television production increased 12.2 percent for 2014, boosted by increases in Television Drama and Television Reality production.
-
Upload
leimomi-coloretti -
Category
Data & Analytics
-
view
664 -
download
1
Transcript of 2014 report for on location production in LA
Contact: Philip Sokoloski Danielle Walker
VP, Integrated Communications Communications Coordinator (213) 977-8630 (213) 977-8635 [email protected] [email protected]
FOR IMMEDIATE RELEASE
On-Location Filming in Los Angeles Increases 9.6 Percent in 2014
L.A. Film Office Introduces New Method for Tracking Local Film Production
LOS ANGELES – January 13, 2015 – FilmL.A., the not-for-profit film office serving the Greater Los Angeles region, today announced the release of a new report from its research division. “On-Location Filming in Los Angeles: 2010-2014,” is the first report from FilmL.A. to feature a Shoot Day (SD)* based system for film production tracking and measurement. The report reveals a 9.6 percent increase in area filming for 2014, as measured in total annual Shoot Days. Similar to past reports, FilmL.A.’s latest study includes an examination of five-year filming trends across nine distinct project categories, including Feature, Television and Commercial production. The report also includes a discussion of FilmL.A.’s two distinct production tracking methods – Permitted Production Days (PPD) and Shoot Days (SD) -- and explains how they differ. The report is the last planned update from FilmL.A. that will reference PPD data. “Over the past six months, FilmL.A. has devoted considerable resources to build a new system for film production tracking,” noted FilmL.A. President Paul Audley. “The new system – which we built in consultation with our board’s research advisory group – will make it easier to compare data from FilmL.A. and other jurisdictions.” Some of the report’s main findings include:
On-location Feature Film production slipped 3.2 percent for 2014, after that category experienced a disappointing 28 percent drop in the fourth quarter alone.
On-location Television production increased 12.2 percent for 2014, boosted by
increases in Television Drama and Television Reality production.

Commercial production increased 9.0 percent for 2014. Projects classified as internet commercials are powering much of the category’s growth.
FilmL.A. updates its on-location production reports on a quarterly basis, and issues television pilot and feature film production reports annually. Also underway at FilmL.A. Research is an investigation into local soundstage-based production. "This is big news for our city given the critical role the entertainment industry plays in creating tens of thousands of good middle class jobs and showing the world what it means to be an Angeleno,” said Los Angeles Mayor Eric Garcetti. “Our work to make L.A. more film-friendly is already paying off, and we're excited to see even bigger numbers when the new film tax credit we got passed goes into effect." About FilmL.A. FilmL.A. is Los Angeles’ regional film office, serving the City and County of Los Angeles and an ever-increasing roster of local municipalities. Providing streamlined permit processing, comprehensive community relations, marketing services, film policy analysis and more to these jurisdictions, FilmL.A. works to attract and retain film production in Greater Los Angeles. Learn more about FilmL.A. at www.filmla.com. * FilmL.A.’s on-location production figures are based on days of permitted filming within the jurisdictions served by FilmL.A. FilmL.A. data does not include production that occurs on certified sound stages or on-location in jurisdictions not served by FilmL.A. Overall figures include production of feature films, television programs, commercials, documentaries, industrial videos, infomercials, music videos, still photography, student films and miscellaneous production. One Shoot Day (SD) is defined as a single crew’s permission to film using a single government film permit at one or more locations during any given 24-hour period. Please note that this unit of measure is separate and distinct from the Permitted Production Day (PPD), which FilmL.A. also uses to measure on-location production. For a detailed explanation of the difference between these two systems of measurement, please see page 2 in the attached report.
MORE – REPORT FOLLOWS

Filming On-Location in Los Angeles
2010-2014
6255 W. Sunset Blvd, 12th Floor ● Hollywood, CA 90028 ● 213.977.8600 ● www.filmla.com

About this Report
This report is the product of independent research conducted by FilmL.A, Inc. FilmL.A. is Los Angeles’ regional film office, serving the City and County of Los Angeles and an ever‐increasing roster of local municipalities. Providing streamlined permit processing, comprehensive community relations, marketing services, film policy analysis and more to these jurisdictions, FilmL.A. works to attract and retain film production in Greater Los Angeles. Integral to FilmL.A.’s work is ongoing research into the benefits that local filming brings to the Los Angeles region. To that end, the company maintains an internal research division ‐‐ FilmL.A. Research ‐‐ devoted to the production, collection and dissemination of information regarding the U.S. film production economy and global production trends. This report aggregates 5 years of film permit‐derived data to present a recent overview of on‐location film production in Greater Los Angeles. The report is divided into topic sections addressing the most seriously‐studied production genres in individual detail. On behalf of everyone at FilmL.A. and those who depend on local entertainment production for their livelihoods, we thank you for your interest in this report. If you have any questions about the content herein, the authors welcome your inquiries.
FilmL.A. Research 6255 W. Sunset Blvd., 12th Floor
Hollywood, CA 90028 www.filmla.com
Questions? Contact Us!
Adrian McDonald, Research Analyst
213.977.8636 [email protected]

1
TABLE OF CONTENTS
Production Tracking Methodology 2
Film Production Trends by Category
Feature Films 5
Television Shows (Aggregate) 7
Commercials 9
Other 11
Film Production Trends by Subcategory
Television Drama 13
Television Sitcom 15
Television Reality 17
Television Pilot 19
Web‐Based TV 21
Overall Film Production Trends 23
Data Tables, Shoot Day (SD) Format 24
Data Tables, Permitted Production Day (PPD) Format 26

2
Production Tracking Methodology
Starting January, 2015, FilmL.A. will maintain two separate systems for on‐location film production
measurement. Each system relies on a unique unit of measure, and it is important to understand the
difference between these measures if one hopes to draw any conclusions from FilmL.A. data.
In a notable break with past practice, FilmL.A. now references as its preferred unit of measure and
comparison the “Shoot Day” (SD) instead of the Permitted Production Day (PPD).
The main reason for this change is to ensure that filming within and outside of FilmL.A.'s service area
can be more easily and fairly compared. In 2014, FilmL.A. looked at other film offices, particularly within
California, and determined that the Shoot Day (SD) is a more commonly used measure of local
production than the Permitted Production Day (PPD). The two terms are not equivalent.
Measurement Methods Compared
The difference between FilmL.A.’s two production tracking methods is best illustrated by example. Let’s
start by examining any given 7‐day week of the 365‐day calendar year:
Sunday
Monday Tuesday Wednesday Thursday Friday Saturday
Then let us consult FilmL.A.’s Online Permit System (OPS), and discover which of these days included
one or more government permissions to film on‐location, which in this hypothetical week, number five:
Sunday Filming
Monday NO Filming
Tuesday Filming
WednesdayFilming
ThursdayFilming
Friday Filming
SaturdayNO Filming
If we were to simply count all calendar days on which filming occurred, this week would yield five total
filming days. Applying the same method to an entire year could yield any number between 0 and 365.

3
But this approach isn’t very useful. Each day, dozens of filmmakers are working simultaneously on‐
location in Los Angeles area communities. Furthermore, they do so using government permits valid for
filming at up to 10 different defined locations, for up to two weeks at each!
As a result, if we want to know how much filming takes place locally, we must look at how much filming
is happening during each of these five calendar days. Each of FilmL.A.’s tracking systems offers a
different way to accomplish this.
Measurement Method 1: Permitted Production Days (PPD)
A Permitted Production Day (PPD) is defined as one crew’s permission to film at a single defined
location during all or part of any given 24‐hour period. This measure is best used to quantify days of
impact from filming on area communities. Determining PPD involves looking at all calendar days in
which filming occurs, and summing the number of unique locations filmmakers were permitted to use
on each day. Here is what that looks like for our sample week:
Sunday Filming 5 Locations
Monday NO Filming
Tuesday Filming 3 Locations
WednesdayFilming 5 Locations
ThursdayFilming 1 Location
Friday Filming 1 Location
SaturdayNO Filming
In our sample week, the sum of all locations in use is 15. In other words, a pool of local filmmakers had
permission to visit 15 different locations during full or partial calendar days during the week. This yields
a total of 15 Permitted Production Days (PPD) for the period.
Measurement Method 2: Shoot Days (SD)
A Shoot Day (SD) is defined as one crew’s permission to film at one or more defined locations during all
or part of any given 24‐hour period. This measure is used to quantify how many days of work film crews
perform during a given time period. Determining SD involves looking at all calendar days during which
filming occurs, and summing the number of unique permits simultaneously active for filming on each
day. Here is what that looks like for our sample week:
Sunday Filming 3 Permits
Monday NO Filming
Tuesday Filming 3 Permits
WednesdayFilming 2 Permits
ThursdayFilming 1 Permit
Friday Filming 1 Permit
SaturdayNO Filming
4
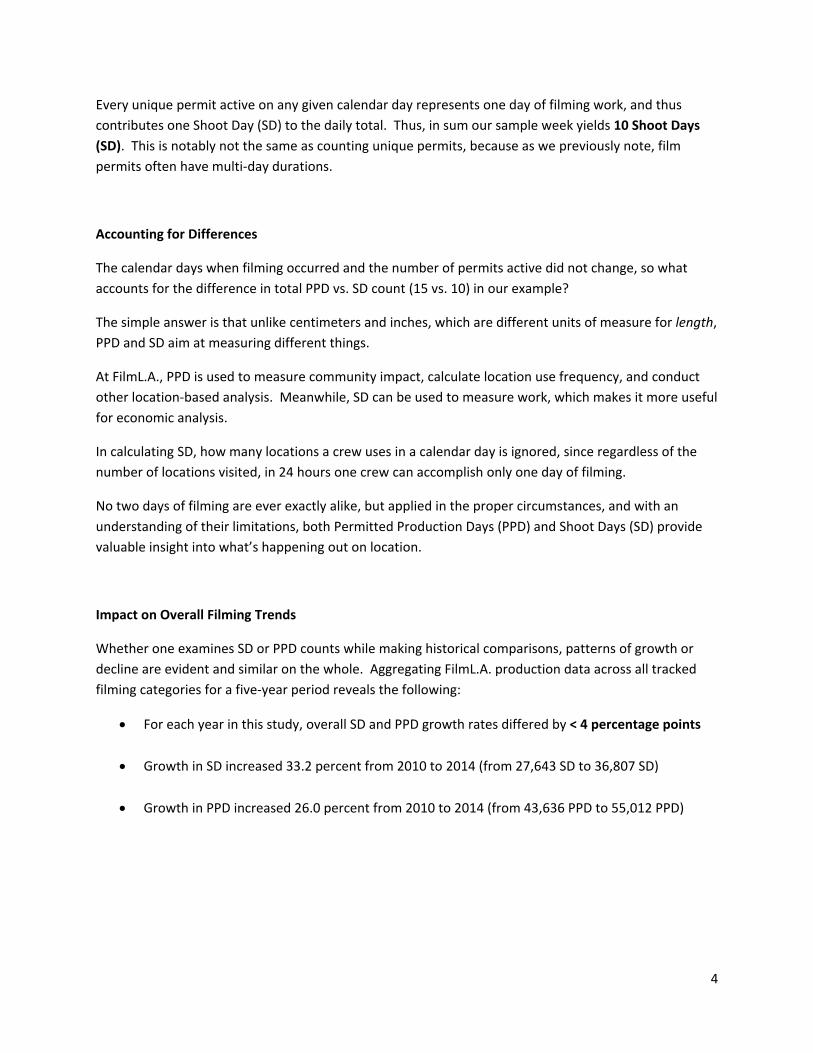
Every unique permit active on any given calendar day represents one day of filming work, and thus
contributes one Shoot Day (SD) to the daily total. Thus, in sum our sample week yields 10 Shoot Days
(SD). This is notably not the same as counting unique permits, because as we previously note, film
permits often have multi‐day durations.
Accounting for Differences
The calendar days when filming occurred and the number of permits active did not change, so what
accounts for the difference in total PPD vs. SD count (15 vs. 10) in our example?
The simple answer is that unlike centimeters and inches, which are different units of measure for length,
PPD and SD aim at measuring different things.
At FilmL.A., PPD is used to measure community impact, calculate location use frequency, and conduct
other location‐based analysis. Meanwhile, SD can be used to measure work, which makes it more useful
for economic analysis.
In calculating SD, how many locations a crew uses in a calendar day is ignored, since regardless of the
number of locations visited, in 24 hours one crew can accomplish only one day of filming.
No two days of filming are ever exactly alike, but applied in the proper circumstances, and with an
understanding of their limitations, both Permitted Production Days (PPD) and Shoot Days (SD) provide
valuable insight into what’s happening out on location.
Impact on Overall Filming Trends
Whether one examines SD or PPD counts while making historical comparisons, patterns of growth or
decline are evident and similar on the whole. Aggregating FilmL.A. production data across all tracked
filming categories for a five‐year period reveals the following:
For each year in this study, overall SD and PPD growth rates differed by < 4 percentage points
Growth in SD increased 33.2 percent from 2010 to 2014 (from 27,643 SD to 36,807 SD)
Growth in PPD increased 26.0 percent from 2010 to 2014 (from 43,636 PPD to 55,012 PPD)

5
Film Production Trends by Genre: Feature Films
Category Description: This production category includes all feature film projects, regardless of project
budget or project duration, that filmed on‐location using a FilmL.A. coordinated permit. The category
contains both studio and independent projects. It does not include student films.
Recent Developments:
FilmL.A. researchers conclude that in 2014, L.A. area on‐location Feature production decreased
3.2 percent compared to the previous year (4,535 vs. 4,687), as measured in total Shoot Days
(SD).
For 2014, on‐location Feature production was up 6.9 percent compared to the category’s five‐
year rolling average.
36674074 4251
4687 4535
5378
56825892
6996
6457
2010 2011 2012 2013 2014
Los Angeles Area On‐Location Film ProductionFeatures Category
Shoot Days PPD

6
Category Context:
Local on‐location Feature production peaked in 1996, just as the first film incentive programs
were pioneered in Canada. FilmL.A.’s last analysis of runaway production trends (see “2013
Feature Film Production Report,” from FilmL.A. Research) indicated that in the years since then,
local Feature film production has fallen by roughly fifty percent.
L.A.’s steep decline in Feature production is primarily due to the loss of film projects to out of
state competition. More than 30 U.S. states and 30 countries now have programs in place to
lure Feature projects away from California.
The 2009 introduction of the California Film & Television Tax Credit has also helped bolster local
Feature production levels. Were it not for the program’s existence, 2010 would have surpassed
2009 as the category’s worst year on record.
In 2014, some examples of Feature film productions that received the California Film &
Television Tax Credit included American Sniper, Nightcrawler, The Purge: Anarchy, The Gambler
and Jersey Boys.
SECTION END

7
Film Production Trends by Genre: Television Shows (Aggregate)
Category Description: This production category includes all television projects, whether intended for
distribution via network, cable or internet channels, that filmed on‐location using a FilmL.A. coordinated
permit. The Television category aggregates the main TV subcategories of TV Drama, TV Sitcom, TV
Reality, TV Pilot, and Web‐Based TV, as well as lesser‐studied television types.
Recent Developments:
FilmL.A. researchers conclude that in 2014, L.A. area on‐location Television production
increased 12.2 percent compared to the previous year (14,349 vs. 12,787), as measured in total
Shoot Days (SD).
11091 11329 1157012787
14349
17833 17349 16762
18686
20609
2010 2011 2012 2013 2014
Los Angeles Area On‐Location Film ProductionTelevision Category
Shoot Days PPD

8
For 2014, on‐location Television production was up 17.4 percent compared to the category’s
five‐year rolling average.
Category Context:
For many years Television production was a growth industry in Los Angeles. Even as Feature
films were being lured away by film incentive programs, growth in the local Television market
continued to provide jobs for Los Angeles talent and crews.
From 1993‐2007, growth in local Television production followed an increase in the number of
new cable channels and service providers. Additionally, a surge in popularity for Reality
Television, and the introduction of original content on premium and basic cable channels,
created demand for new product that benefitted the Los Angeles Television production
economy.
The 2009 introduction of the California Film & Television Tax Credit has helped prop up sagging
local TV Drama production.
In 2014, incentivized dramas shooting in California due to the state’s tax credit now represent
27 percent of all dramas (network & cable) shooting in the state. Four years ago, just four
percent of dramas were incentivized.
For cable dramas specifically, it’s important to note that of the 26 series shooting in California in
2014, 50 percent (13 shows) received the California Film & Television Tax Credit (see “The
Decline of Dramatic Television Series Production in California, 2014” from FilmL.A. Research).
In 2014, examples of TV Drama projects that received the California Film & Television Tax Credit
included Justified, Pretty Little Liars, Teen Wolf, Major Crimes and Murder in the First.
SECTION END

9
Film Production Trends by Genre: Commercials
Category Description: This production category includes all projects created for the promotion of a
product, service or cause, that filmed on‐location using a FilmL.A. coordinated permit. The category
contains standard commercials produced under contract with an advertising agency, as well as “spec”
commercials, public service announcements (PSAs) and commercials for web display.
Recent Developments:
FilmL.A. researchers conclude that in 2014, L.A. area on‐location Commercial production
increased 9.0 percent compared to the previous year (5,192 vs. 4,765), as measured in total
Shoot Days (SD).
35524043
4701 47655192
6778
7079
80788514
9143
2010 2011 2012 2013 2014
Los Angeles Area On‐Location Film ProductionCommercials Category
Shoot Days PPD

10
For 2014, on‐location Commercial production was up 16.7 percent compared to the category’s
five‐year rolling average.
Category Context:
Commercials are generally seen as an economic bellwether. Commercial production fell in the
wake of the Great Recession, although Commercial production began to increase in 2010,
slightly ahead of the U.S. economic recovery.
Over the past few years, FilmL.A. has observed substantial growth in the production of
commercials for web‐based distribution. From 2010 to 2014, local production of internet‐based
commercials increased 336 percent, rising from 177 annual Shoot Days (2010) to 771 (2014).
This reflects a profound change in the commercial production market. Increased broadband
connectivity, coupled with the proliferation of smartphones, tablets and other media
consumption devices, has created promising new opportunities for online advertising.
SECTION END

11
Film Production Trends by Genre: Other / Miscellaneous
Category Description: This is a catch‐all category for all of the lesser‐studied forms of on‐location
production in Los Angeles. Production in this category includes, but is not limited to: still photography,
student films, music videos, adult films and industrial videos. This category also includes projects
described to FilmL.A. as “miscellaneous” by their creators.
Recent Developments:
FilmL.A. researchers conclude that in 2014, L.A. area on‐location production in the “Other”
category increased 12.1 percent compared to the previous year (12,731 vs. 11,354), as
measured in total Shoot Days (SD).
For 2014, on‐location Other production was up 19.1 percent compared to the category’s five‐
year rolling average.
933310363 9646
1135412731
13657
15374 15522
17474
18803
2010 2011 2012 2013 2014
Los Angeles Area On‐Location Film ProductionOthers Category
Shoot Days PPD
12
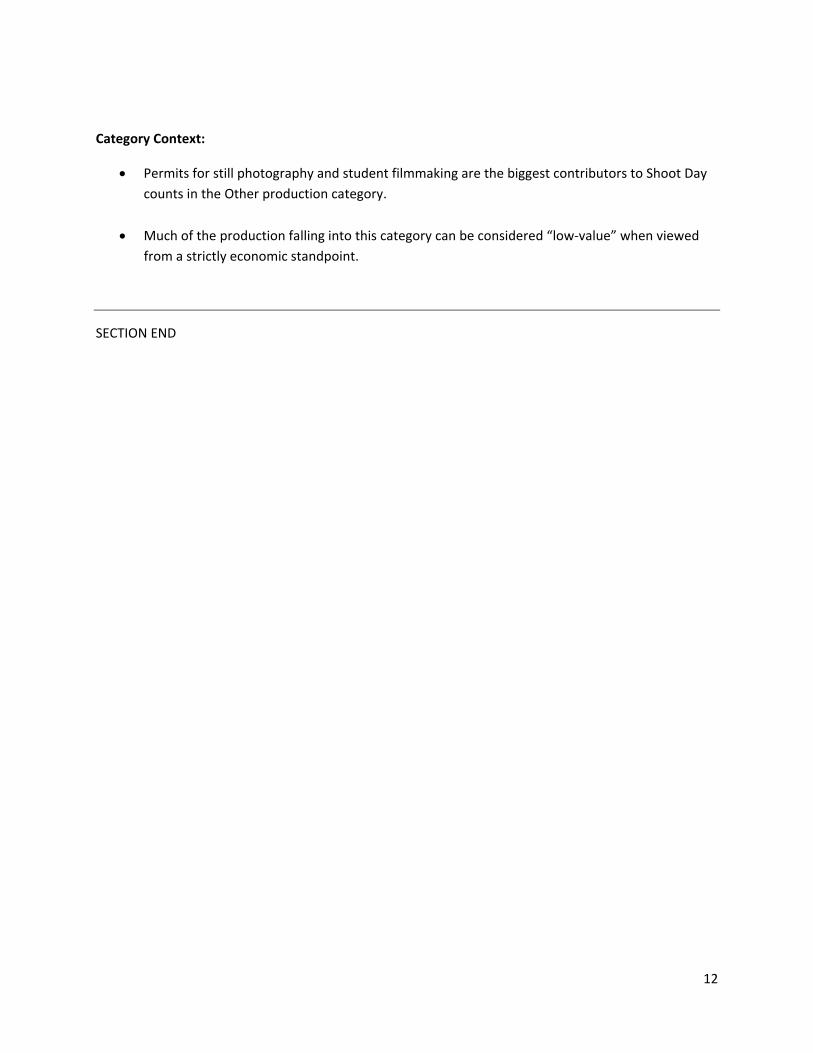
Category Context:
Permits for still photography and student filmmaking are the biggest contributors to Shoot Day
counts in the Other production category.
Much of the production falling into this category can be considered “low‐value” when viewed
from a strictly economic standpoint.
SECTION END

13
Film Production Trends by Subgenre: TV Dramas
Category Description: This is a subcategory of the Television production category. This subcategory
includes all scripted television projects of one hour in duration, intended for distribution via broadcast
and cable networks and filmed on‐location using a FilmL.A. coordinated permit. The category does not
include TV Pilot projects, nor Web‐Based TV projects, which are tracked separately.
Recent Developments:
FilmL.A. researchers conclude that in 2014, L.A. area on‐location Television Drama production
increased 28.6 percent compared to the previous year (3,666 vs. 2,851), as measured in total
Shoot Days (SD).
3070 29602453
2851
3666
4992
4417
3533
4166
5349
2010 2011 2012 2013 2014
Los Angeles Area On‐Location Film ProductionTV Drama Category
Shoot Days PPD
14
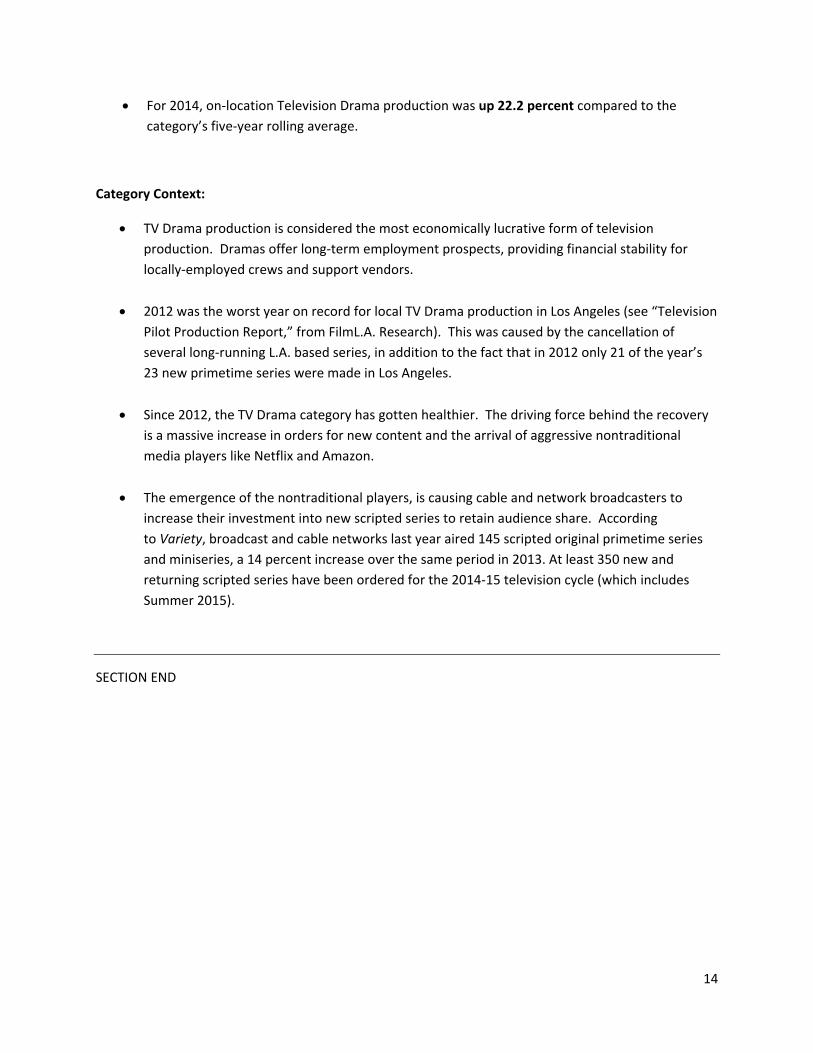
For 2014, on‐location Television Drama production was up 22.2 percent compared to the
category’s five‐year rolling average.
Category Context:
TV Drama production is considered the most economically lucrative form of television
production. Dramas offer long‐term employment prospects, providing financial stability for
locally‐employed crews and support vendors.
2012 was the worst year on record for local TV Drama production in Los Angeles (see “Television
Pilot Production Report,” from FilmL.A. Research). This was caused by the cancellation of
several long‐running L.A. based series, in addition to the fact that in 2012 only 21 of the year’s
23 new primetime series were made in Los Angeles.
Since 2012, the TV Drama category has gotten healthier. The driving force behind the recovery
is a massive increase in orders for new content and the arrival of aggressive nontraditional
media players like Netflix and Amazon.
The emergence of the nontraditional players, is causing cable and network broadcasters to
increase their investment into new scripted series to retain audience share. According
to Variety, broadcast and cable networks last year aired 145 scripted original primetime series
and miniseries, a 14 percent increase over the same period in 2013. At least 350 new and
returning scripted series have been ordered for the 2014‐15 television cycle (which includes
Summer 2015).
SECTION END

15
Film Production Trends by Subgenre: TV Sitcoms
Category Description: This is a subcategory of the Television production category. This subcategory
includes all scripted television projects of one half‐hour in duration, intended for distribution via
broadcast and cable networks and filmed on‐location using a FilmL.A. coordinated permit. It does not
include TV Pilot projects, nor Web‐Based TV projects, which are tracked separately.
TV Sitcoms come in two forms – single‐camera and multi‐camera shows. Of these, only single camera
shows spend any significant amount of time shooting on location, so the reliability of this data is limited.
Recent Developments:
FilmL.A. researchers conclude that in 2014, L.A. area on‐location Television Sitcom production
decreased 26.7 percent compared to the previous year (1,131 vs. 1,544), as measured in total
Shoot Days (SD).
990 921
1516 1544
1131
1535
1339
20482229
1602
2010 2011 2012 2013 2014
Los Angeles Area On‐Location Film ProductionTV Sitcom Category
Shoot Days PPD

16
For 2014, on‐location Television Sitcom production was down 7.3 percent compared to the
category’s five‐year rolling average.
Category Context:
TV Sitcom production is considered the second most economically lucrative form of television
production.
Because stage‐bound TV Sitcom production is not represented in this data, FilmL.A. cautions
against reading too much into this category’s apparent upswings and downswings.
The number and kind of TV Sitcoms in production in Los Angeles varies, depending on: network
production schedules, production location decisions, and cyclical viewer preference for single
camera vs. multi‐camera shows.
SECTION END

17
Film Production Trends by Subgenre: TV Reality
Category Description: This is a subcategory of the Television production category. This subcategory
includes a diverse array of unscripted television projects filmed on‐location using a FilmL.A. coordinated
permit. This subcategory does not include TV Pilot projects, nor Web‐Based TV projects, which are
tracked separately.
Recent Developments:
FilmL.A. researchers conclude that in 2014, L.A. area on‐location Television Reality production
increased 14.7 percent compared to the previous year (5,532 vs. 4,825), as measured in total
Shoot Days (SD).
4760 49604561
4825
5532
7341 7210
63586630
7781
2010 2011 2012 2013 2014
Los Angeles Area On‐Location Film ProductionTV Reality Category
Shoot Days PPD

18
For 2014, on‐location Television Sitcom production was up 12.3 percent compared to the
category’s five‐year rolling average.
Category Context:
TV Reality production surged in Los Angeles beginning in 2002. It is now the biggest contributor
to local on‐location Television production, accounting for four out of every ten Television Shoot
Days.
Generally speaking, Reality Television projects typically have smaller economic footprints than
Television Dramas or Television Sitcoms. Crews and cast are usually small and comparatively
less time is spent setting up for and filming each Reality Television episode.
SECTION END

19
Film Production Trends by Subgenre: TV Pilots
Category Description: This is a subcategory of the Television production category. This subcategory
includes all original scripted television pilots and shorter‐length presentations, of any duration, intended
to air on a broadcast network, cable network, or online and filmed on‐location using a FilmL.A.
coordinated permit.
Recent Developments:
FilmL.A. researchers conclude that in 2014, L.A. area on‐location Television Pilot production
increased 15.4 percent compared to the previous year (741 vs. 642), as measured in total Shoot
Days (SD).
542 506 536
642
741
733 778795
1066
1072
2010 2011 2012 2013 2014
Los Angeles Area On‐Location Film ProductionTV Pilot Category
Shoot Days PPD

20
For 2014, on‐location Television Pilot production was up 24.9 percent compared to the
category’s five‐year rolling average.
Category Context:
For the past ten years, FilmL.A. has published comprehensive Television Pilot Production
Reports. These reports offer a robust look at local TV Pilot production in Los Angeles and
competing jurisdictions, and are essential reading for anyone interested in this topic.
The desire for original programming on many cable networks and online streaming services like
Netflix and Amazon caused a record 203 pilots to be produced in the 2013/2014 pilot
development cycle.
SECTION END

21
Film Production Trends by Subgenre: Web‐Based TV
Category Description: This is a subcategory of the Television production category. This subcategory
includes all scripted and non‐scripted content of any duration intended for distribution via the internet
and filmed on‐location using a FilmL.A. coordinated permit. Episodic and non‐episodic projects are
included without differentiation.
Recent Developments:
FilmL.A. researchers conclude that in 2014, L.A. area on‐location Web‐Based Television
production decreased 7.3 percent compared to the previous year (1,129 vs. 1,218), as measured
in total Shoot Days (SD).
510641
1234 12181129
732
1116
16331749
1643
2010 2011 2012 2013 2014
Los Angeles Area On‐Location Film ProductionWeb TV Category
Shoot Days PPD

22
For 2014, on‐location Web‐Based Television production was up 19.3 percent compared to the
category’s five‐year rolling average.
Category Context:
Web‐Based TV is FilmL.A.’s newest tracking category. The category was created in anticipation
of an increase in Web‐Based TV production in Los Angeles. Since its introduction, the category
has exploded. From 2010‐2014, production in this category increased 121 percent.
Because of the category’s rapid growth, Web‐Based TV now surpasses TV Pilots and TV Sitcoms
as a contributor to local Shoot Day counts.
FilmL.A. officials believe local Web‐Based TV totals are understated. Many new media
entrepreneurs are unfamiliar with local rules regarding commercial filming and the need to
secure film permits. As these projects are brought into compliance, local Web‐Based TV
production should increase.
SECTION END

23
Overall L.A. Film Production Trends
In one sense, aggregating film production data across all filming categories presents a distorted view of
filming in Los Angeles. When analyzing FilmL.A. data, it is important to note that no two days of filming
are alike! The economic and neighborhood impact between two Shoot Days (SD) can be profound, even
within a single filming category. To aggregate data is to ignore these important differences.
Nonetheless, it is interesting to know how many Shoot Days the Greater Los Angeles Region hosts on an
annual basis. Below is the result over the last five years:
Recent Developments:
FilmL.A. researchers conclude that in 2014, overall L.A. area on‐location production increased
9.6 percent compared to the previous year (36,807 vs. 33,593), as measured in total Shoot Days
(SD). That’s an increase of 16.5 percent for the region over the 5‐year rolling average.
27643 29809 3016833593
36807
4364645484 46254
51670
55012
2010 2011 2012 2013 2014
Los Angeles Area On‐Location Film ProductionTotal Category
Shoot Days PPD

Features TV Dramas
Period 2010 2011 2012 2013 2014 Period 2010 2011 2012 2013 2014
Q1 672 633 739 780 1,094 Q1 791 813 707 832 816
Q2 936 1,027 1,195 1,180 1,188 Q2 461 656 397 537 894
Q3 1,001 1,559 1,235 1,387 1,288 Q3 918 797 630 721 958
Q4 1,058 855 1,082 1,340 965 Q4 900 694 719 761 998
TOTAL 3,667 4,074 4,251 4,687 4,535 TOTAL 3,070 2,960 2,453 2,851 3,666
Television TV Sitcoms
Period 2010 2011 2012 2013 2014 Period 2010 2011 2012 2013 2014
Q1 2,986 2,942 2,965 3,315 3,257 Q1 172 235 355 391 357
Q2 2,537 2,738 2,294 2,993 3,922 Q2 203 120 207 242 260
Q3 2,595 2,824 3,029 2,963 3,860 Q3 253 284 477 377 278
Q4 2,973 2,825 3,282 3,516 3,310 Q4 362 282 477 534 236
TOTAL 11,091 11,329 11,570 12,787 14,349 TOTAL 990 921 1,516 1,544 1,131
Commercials TV Pilots
Period 2010 2011 2012 2013 2014 Period 2010 2011 2012 2013 2014
Q1 1,010 1,195 1,401 1,294 1,351 Q1 214 249 245 284 319
Q2 770 851 1,076 1,091 1,346 Q2 116 131 145 206 196
Q3 854 973 960 1,157 1,151 Q3 117 63 40 70 95
Q4 918 1,024 1,264 1,223 1,344 Q4 95 63 106 82 131
TOTAL 3,552 4,043 4,701 4,765 5,192 TOTAL 542 506 536 642 741
Other TV Reality
Period 2010 2011 2012 2013 2014 Period 2010 2011 2012 2013 2014
Q1 2,204 2,698 1,968 2,715 3,280 Q1 1,356 1,237 1,132 1101 1039
Q2 2,636 2,671 2,635 2,749 3,118 Q2 1,297 1,276 1,032 1178 1646
Q3 1,953 2,146 2,201 2,589 2,863 Q3 972 1,287 1,167 1096 1578
Q4 2,540 2,848 2,842 3,301 3,470 Q4 1,135 1,160 1,230 1450 1269
TOTAL 9,333 10,363 9,646 11,354 12,731 TOTAL 4,760 4,960 4,561 4,825 5,532
Web-Based TV
Period 2010 2011 2012 2013 2014
Q1 138 117 255 328 230
Q2 168 179 220 383 326
Q3 101 103 348 247 301
Q4 103 242 411 260 272
TOTAL 510 641 1,234 1,218 1,129
Annual Shoot Days (SD)Major Television Subcategories
Annual Shoot Days (SD)
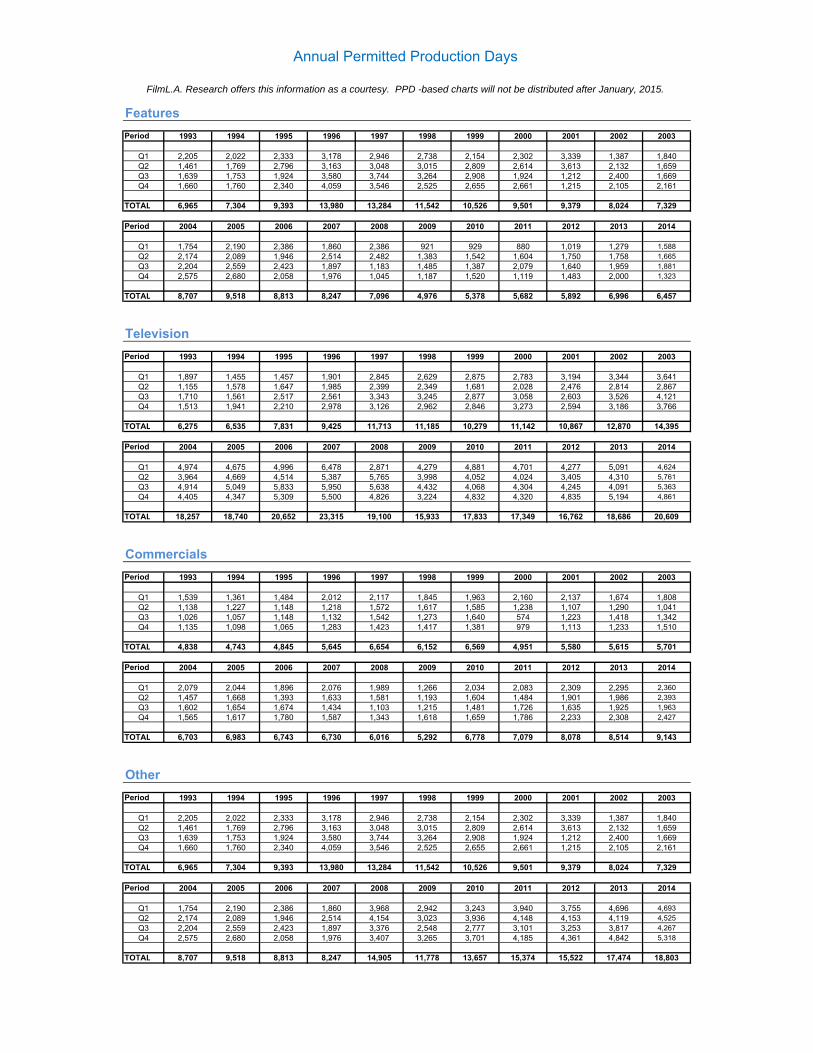
Features
Period 1993 1994 1995 1996 1997 1998 1999 2000 2001 2002 2003
Q1 2,205 2,022 2,333 3,178 2,946 2,738 2,154 2,302 3,339 1,387 1,840Q2 1,461 1,769 2,796 3,163 3,048 3,015 2,809 2,614 3,613 2,132 1,659Q3 1,639 1,753 1,924 3,580 3,744 3,264 2,908 1,924 1,212 2,400 1,669Q4 1,660 1,760 2,340 4,059 3,546 2,525 2,655 2,661 1,215 2,105 2,161
TOTAL 6,965 7,304 9,393 13,980 13,284 11,542 10,526 9,501 9,379 8,024 7,329
Period 2004 2005 2006 2007 2008 2009 2010 2011 2012 2013 2014
Q1 1,754 2,190 2,386 1,860 2,386 921 929 880 1,019 1,279 1,588Q2 2,174 2,089 1,946 2,514 2,482 1,383 1,542 1,604 1,750 1,758 1,665Q3 2,204 2,559 2,423 1,897 1,183 1,485 1,387 2,079 1,640 1,959 1,881Q4 2,575 2,680 2,058 1,976 1,045 1,187 1,520 1,119 1,483 2,000 1,323
TOTAL 8,707 9,518 8,813 8,247 7,096 4,976 5,378 5,682 5,892 6,996 6,457
Television
Period 1993 1994 1995 1996 1997 1998 1999 2000 2001 2002 2003
Q1 1,897 1,455 1,457 1,901 2,845 2,629 2,875 2,783 3,194 3,344 3,641Q2 1,155 1,578 1,647 1,985 2,399 2,349 1,681 2,028 2,476 2,814 2,867Q3 1,710 1,561 2,517 2,561 3,343 3,245 2,877 3,058 2,603 3,526 4,121Q4 1,513 1,941 2,210 2,978 3,126 2,962 2,846 3,273 2,594 3,186 3,766
TOTAL 6,275 6,535 7,831 9,425 11,713 11,185 10,279 11,142 10,867 12,870 14,395
Period 2004 2005 2006 2007 2008 2009 2010 2011 2012 2013 2014
Q1 4,974 4,675 4,996 6,478 2,871 4,279 4,881 4,701 4,277 5,091 4,624Q2 3,964 4,669 4,514 5,387 5,765 3,998 4,052 4,024 3,405 4,310 5,761Q3 4,914 5,049 5,833 5,950 5,638 4,432 4,068 4,304 4,245 4,091 5,363Q4 4,405 4,347 5,309 5,500 4,826 3,224 4,832 4,320 4,835 5,194 4,861
TOTAL 18,257 18,740 20,652 23,315 19,100 15,933 17,833 17,349 16,762 18,686 20,609
Commercials
Period 1993 1994 1995 1996 1997 1998 1999 2000 2001 2002 2003
Q1 1,539 1,361 1,484 2,012 2,117 1,845 1,963 2,160 2,137 1,674 1,808Q2 1,138 1,227 1,148 1,218 1,572 1,617 1,585 1,238 1,107 1,290 1,041Q3 1,026 1,057 1,148 1,132 1,542 1,273 1,640 574 1,223 1,418 1,342Q4 1,135 1,098 1,065 1,283 1,423 1,417 1,381 979 1,113 1,233 1,510
TOTAL 4,838 4,743 4,845 5,645 6,654 6,152 6,569 4,951 5,580 5,615 5,701
Period 2004 2005 2006 2007 2008 2009 2010 2011 2012 2013 2014
Q1 2,079 2,044 1,896 2,076 1,989 1,266 2,034 2,083 2,309 2,295 2,360Q2 1,457 1,668 1,393 1,633 1,581 1,193 1,604 1,484 1,901 1,986 2,393Q3 1,602 1,654 1,674 1,434 1,103 1,215 1,481 1,726 1,635 1,925 1,963Q4 1,565 1,617 1,780 1,587 1,343 1,618 1,659 1,786 2,233 2,308 2,427
TOTAL 6,703 6,983 6,743 6,730 6,016 5,292 6,778 7,079 8,078 8,514 9,143
Other
Period 1993 1994 1995 1996 1997 1998 1999 2000 2001 2002 2003
Q1 2,205 2,022 2,333 3,178 2,946 2,738 2,154 2,302 3,339 1,387 1,840Q2 1,461 1,769 2,796 3,163 3,048 3,015 2,809 2,614 3,613 2,132 1,659Q3 1,639 1,753 1,924 3,580 3,744 3,264 2,908 1,924 1,212 2,400 1,669Q4 1,660 1,760 2,340 4,059 3,546 2,525 2,655 2,661 1,215 2,105 2,161
TOTAL 6,965 7,304 9,393 13,980 13,284 11,542 10,526 9,501 9,379 8,024 7,329
Period 2004 2005 2006 2007 2008 2009 2010 2011 2012 2013 2014
Q1 1,754 2,190 2,386 1,860 3,968 2,942 3,243 3,940 3,755 4,696 4,693Q2 2,174 2,089 1,946 2,514 4,154 3,023 3,936 4,148 4,153 4,119 4,525Q3 2,204 2,559 2,423 1,897 3,376 2,548 2,777 3,101 3,253 3,817 4,267Q4 2,575 2,680 2,058 1,976 3,407 3,265 3,701 4,185 4,361 4,842 5,318
TOTAL 8,707 9,518 8,813 8,247 14,905 11,778 13,657 15,374 15,522 17,474 18,803
Annual Permitted Production Days
FilmL.A. Research offers this information as a courtesy. PPD -based charts will not be distributed after January, 2015.
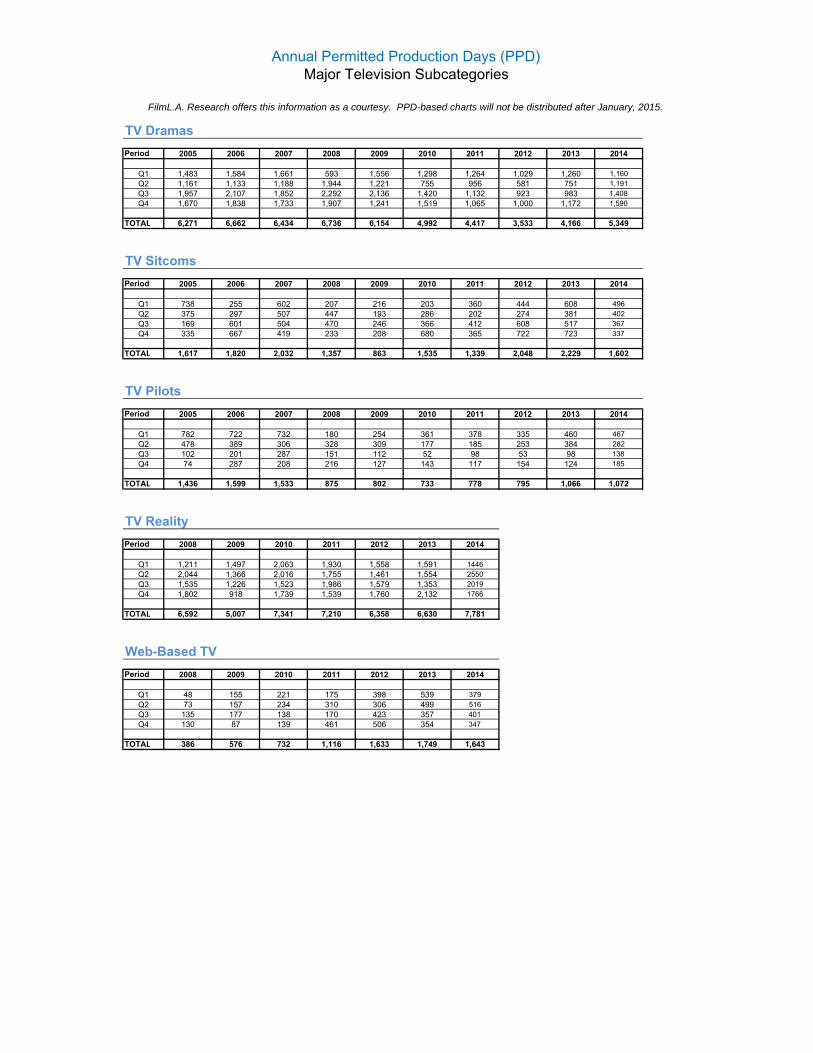
TV Dramas
Period 2005 2006 2007 2008 2009 2010 2011 2012 2013 2014
Q1 1,483 1,584 1,661 593 1,556 1,298 1,264 1,029 1,260 1,160Q2 1,161 1,133 1,188 1,944 1,221 755 956 581 751 1,191Q3 1,957 2,107 1,852 2,292 2,136 1,420 1,132 923 983 1,408Q4 1,670 1,838 1,733 1,907 1,241 1,519 1,065 1,000 1,172 1,590
TOTAL 6,271 6,662 6,434 6,736 6,154 4,992 4,417 3,533 4,166 5,349
TV Sitcoms
Period 2005 2006 2007 2008 2009 2010 2011 2012 2013 2014
Q1 738 255 602 207 216 203 360 444 608 496Q2 375 297 507 447 193 286 202 274 381 402Q3 169 601 504 470 246 366 412 608 517 367Q4 335 667 419 233 208 680 365 722 723 337
TOTAL 1,617 1,820 2,032 1,357 863 1,535 1,339 2,048 2,229 1,602
TV Pilots
Period 2005 2006 2007 2008 2009 2010 2011 2012 2013 2014
Q1 782 722 732 180 254 361 378 335 460 467Q2 478 389 306 328 309 177 185 253 384 282Q3 102 201 287 151 112 52 98 53 98 138Q4 74 287 208 216 127 143 117 154 124 185
TOTAL 1,436 1,599 1,533 875 802 733 778 795 1,066 1,072
TV Reality
Period 2008 2009 2010 2011 2012 2013 2014
Q1 1,211 1,497 2,063 1,930 1,558 1,591 1446Q2 2,044 1,366 2,016 1,755 1,461 1,554 2550Q3 1,535 1,226 1,523 1,986 1,579 1,353 2019Q4 1,802 918 1,739 1,539 1,760 2,132 1766
TOTAL 6,592 5,007 7,341 7,210 6,358 6,630 7,781
Web-Based TV
Period 2008 2009 2010 2011 2012 2013 2014
Q1 48 155 221 175 398 539 379Q2 73 157 234 310 306 499 516Q3 135 177 138 170 423 357 401Q4 130 87 139 461 506 354 347
TOTAL 386 576 732 1,116 1,633 1,749 1,643
Annual Permitted Production Days (PPD)Major Television Subcategories
FilmL.A. Research offers this information as a courtesy. PPD-based charts will not be distributed after January, 2015.